Seasonal and Intraseasonal Variability of Mesoscale Convective Systems over the South Asian Monsoon Region KATRINA S. VIRTS a Department of Atmospheric Sciences, University of Washington, Seattle, Washington ROBERT A. HOUZE JR. Department of Atmospheric Sciences, University of Washington, Seattle, and Pacific Northwest National Laboratory, Richland, Washington (Manuscript received 13 January 2016, in final form 1 June 2016) ABSTRACT Seasonal and intraseasonal differences in mesoscale convective systems (MCSs) over South Asia are examined using A-Train satellites, a ground-based lightning network, and reanalysis fields. Premonsoon (April–May) MCSs occur primarily over Bangladesh and the eastern Bay of Bengal. During the monsoon (June–September), small MCSs occur over the Meghalaya Plateau and northeast Himalayan notch, while large and connected MCSs are most widespread over the Bay of Bengal. Monsoon MCSs produce less lightning and exhibit more extensive stratiform and anvil reflectivity structures in CloudSat observations than do premonsoon MCSs. During the monsoon, Bay of Bengal and Meghalaya Plateau MCSs vary with the 30–60-day northward- propagating intraseasonal oscillation, while northeast Himalayan notch MCSs are associated with weak large- scale anomalies but locally enhanced CAPE. During intraseasonal active periods, a zone of enhanced large and connected MCSs, precipitation, and lightning extends from the northeastern Arabian Sea southeastward over India and the Bay of Bengal, flanked by suppressed anomalies. Spatial variability is observed within this en- hancement zone: lightning is most enhanced where MCSs are less enhanced, and vice versa. Reanalysis composites indicate that Bay of Bengal MCSs are associated with monsoon depressions, which are frequent during active monsoon periods, while Meghalaya Plateau MCSs are most frequent at the end of break periods, as anomalous southwesterly winds strengthen moist advection toward the terrain. Over both regions, MCSs exhibit more ex- tensive stratiform and anvil regions and less lightning when the large-scale environment is moister, and vice versa. 1. Introduction The annual cycle over southern Asia (Fig. 1) is dominated by seasonally varying monsoon circula- tions (Webster et al. 1998). The summer monsoon [June–September (JJAS); hereinafter, the monsoon] is associated with a low-level trough over northern India and a northward shift of the tropical convergence zone in this sector (Fig. 2b; Webster et al. 1977). Southwest- erly winds advect moisture from the Indian Ocean over the landmass, producing frequent rainfall over much of South Asia. Precipitation maxima are observed at or just upstream of where the low-level moist flow encounters steep terrain (Fig. 2b; the seasonal cycle is discussed in more detail in section 3). Earlier observations, including those during the Monsoon Experiment (MONEX; 1978/79) indicated that monsoon precipitation is not primarily associated with isolated deep convective towers but rather with mesoscale rain areas with embedded deep convection (Ramage 1971; Houze and Churchill 1987), categorized as mesoscale convective systems (MCSs; Houze 2014, chapter 9). Recent work has examined the geographic distribution of various types of precipitating systems Supplemental information related to this paper is available at the Journals Online website: http://dx.doi.org/10.1175/JAS-D-16-0022.s1. a Current affiliation: NASA Marshall Space Flight Center, Huntsville, Alabama. Corresponding author address: Dr. Katrina Virts, NASA Mar- shall Space Flight Center, ZP-11, 320 Sparkman Dr., Huntsville, AL 35805. E-mail: [email protected] Denotes Open Access content. DECEMBER 2016 VIRTS AND HOUZE 4753 DOI: 10.1175/JAS-D-16-0022.1 Ó 2016 American Meteorological Society

Welcome message from author
This document is posted to help you gain knowledge. Please leave a comment to let me know what you think about it! Share it to your friends and learn new things together.
Transcript

Seasonal and Intraseasonal Variability of Mesoscale Convective Systemsover the South Asian Monsoon Region
KATRINA S. VIRTSa
Department of Atmospheric Sciences, University of Washington, Seattle, Washington
ROBERT A. HOUZE JR.
Department of Atmospheric Sciences, University of Washington, Seattle, and Pacific Northwest National
Laboratory, Richland, Washington
(Manuscript received 13 January 2016, in final form 1 June 2016)
ABSTRACT
Seasonal and intraseasonal differences inmesoscale convective systems (MCSs) over SouthAsia are examined
using A-Train satellites, a ground-based lightning network, and reanalysis fields. Premonsoon (April–May)
MCSs occur primarily over Bangladesh and the eastern Bay of Bengal. During the monsoon (June–September),
smallMCSs occur over theMeghalaya Plateau and northeastHimalayan notch, while large and connectedMCSs
are most widespread over the Bay of Bengal. MonsoonMCSs produce less lightning and exhibit more extensive
stratiform and anvil reflectivity structures in CloudSat observations than do premonsoon MCSs.
During the monsoon, Bay of Bengal and Meghalaya Plateau MCSs vary with the 30–60-day northward-
propagating intraseasonal oscillation, while northeast Himalayan notch MCSs are associated with weak large-
scale anomalies but locally enhanced CAPE. During intraseasonal active periods, a zone of enhanced large and
connected MCSs, precipitation, and lightning extends from the northeastern Arabian Sea southeastward over
India and the Bay of Bengal, flanked by suppressed anomalies. Spatial variability is observed within this en-
hancement zone: lightning ismost enhancedwhereMCSs are less enhanced, and vice versa.Reanalysis composites
indicate that Bay of Bengal MCSs are associated with monsoon depressions, which are frequent during active
monsoon periods, while Meghalaya Plateau MCSs are most frequent at the end of break periods, as anomalous
southwesterly winds strengthen moist advection toward the terrain. Over both regions, MCSs exhibit more ex-
tensive stratiform and anvil regions and less lightning when the large-scale environment is moister, and vice versa.
1. Introduction
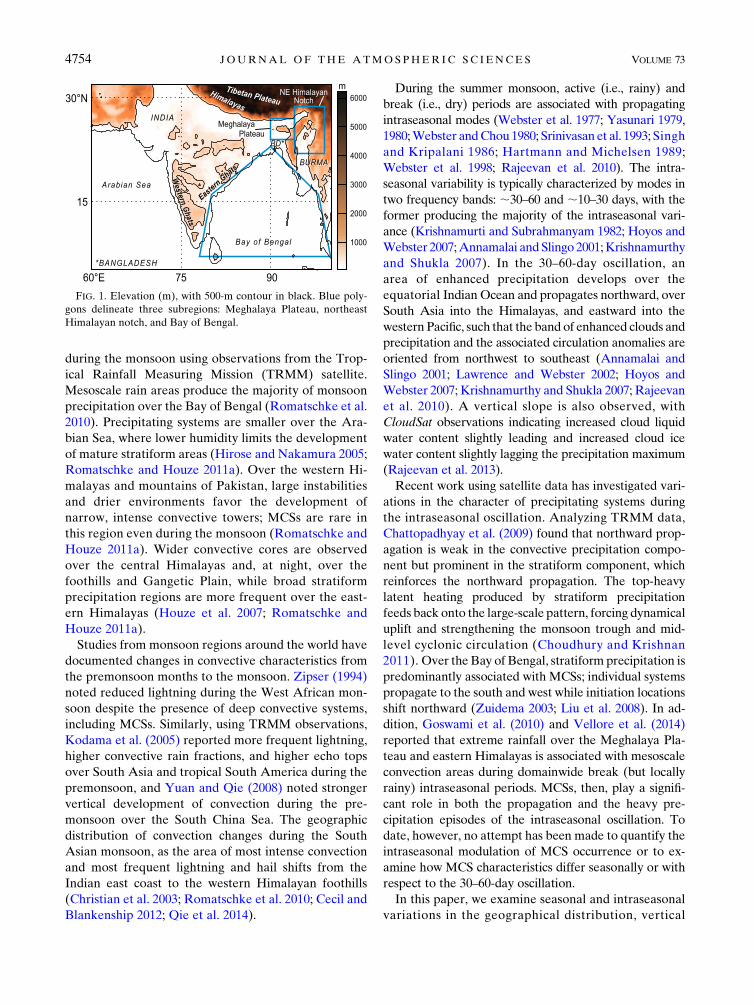
The annual cycle over southern Asia (Fig. 1) is
dominated by seasonally varying monsoon circula-
tions (Webster et al. 1998). The summer monsoon
[June–September (JJAS); hereinafter, the monsoon]
is associated with a low-level trough over northern India
and a northward shift of the tropical convergence zone
in this sector (Fig. 2b; Webster et al. 1977). Southwest-
erly winds advect moisture from the Indian Ocean over
the landmass, producing frequent rainfall over much of
SouthAsia. Precipitationmaxima are observed at or just
upstream of where the low-level moist flow encounters
steep terrain (Fig. 2b; the seasonal cycle is discussed in
more detail in section 3).
Earlier observations, including those during the
Monsoon Experiment (MONEX; 1978/79) indicated
that monsoon precipitation is not primarily associated
with isolated deep convective towers but rather with
mesoscale rain areas with embedded deep convection
(Ramage 1971; Houze and Churchill 1987), categorized
as mesoscale convective systems (MCSs; Houze 2014,
chapter 9). Recent work has examined the geographic
distribution of various types of precipitating systems
Supplemental information related to this paper is available at the
Journals Online website: http://dx.doi.org/10.1175/JAS-D-16-0022.s1.a Current affiliation: NASA Marshall Space Flight Center,
Huntsville, Alabama.
Corresponding author address: Dr. Katrina Virts, NASA Mar-
shall Space Flight Center, ZP-11, 320 Sparkman Dr., Huntsville,
AL 35805.
E-mail: [email protected]
Denotes Open Access content.
DECEMBER 2016 V IRT S AND HOUZE 4753
DOI: 10.1175/JAS-D-16-0022.1
� 2016 American Meteorological Society
during the monsoon using observations from the Trop-
ical Rainfall Measuring Mission (TRMM) satellite.
Mesoscale rain areas produce the majority of monsoon
precipitation over the Bay of Bengal (Romatschke et al.
2010). Precipitating systems are smaller over the Ara-
bian Sea, where lower humidity limits the development
of mature stratiform areas (Hirose and Nakamura 2005;
Romatschke and Houze 2011a). Over the western Hi-
malayas and mountains of Pakistan, large instabilities
and drier environments favor the development of
narrow, intense convective towers; MCSs are rare in
this region even during the monsoon (Romatschke and
Houze 2011a). Wider convective cores are observed
over the central Himalayas and, at night, over the
foothills and Gangetic Plain, while broad stratiform
precipitation regions are more frequent over the east-
ern Himalayas (Houze et al. 2007; Romatschke and
Houze 2011a).
Studies from monsoon regions around the world have
documented changes in convective characteristics from
the premonsoon months to the monsoon. Zipser (1994)
noted reduced lightning during the West African mon-
soon despite the presence of deep convective systems,
including MCSs. Similarly, using TRMM observations,
Kodama et al. (2005) reported more frequent lightning,
higher convective rain fractions, and higher echo tops
over South Asia and tropical South America during the
premonsoon, and Yuan and Qie (2008) noted stronger
vertical development of convection during the pre-
monsoon over the South China Sea. The geographic
distribution of convection changes during the South
Asian monsoon, as the area of most intense convection
and most frequent lightning and hail shifts from the
Indian east coast to the western Himalayan foothills
(Christian et al. 2003; Romatschke et al. 2010; Cecil and
Blankenship 2012; Qie et al. 2014).
During the summer monsoon, active (i.e., rainy) and
break (i.e., dry) periods are associated with propagating
intraseasonal modes (Webster et al. 1977; Yasunari 1979,
1980;Webster andChou 1980; Srinivasan et al. 1993; Singh
and Kripalani 1986; Hartmann and Michelsen 1989;
Webster et al. 1998; Rajeevan et al. 2010). The intra-
seasonal variability is typically characterized by modes in
two frequency bands: ;30–60 and ;10–30 days, with the
former producing the majority of the intraseasonal vari-
ance (Krishnamurti and Subrahmanyam 1982; Hoyos and
Webster 2007;Annamalai andSlingo 2001;Krishnamurthy
and Shukla 2007). In the 30–60-day oscillation, an
area of enhanced precipitation develops over the
equatorial Indian Ocean and propagates northward, over
South Asia into the Himalayas, and eastward into the
western Pacific, such that the band of enhanced clouds and
precipitation and the associated circulation anomalies are
oriented from northwest to southeast (Annamalai and
Slingo 2001; Lawrence and Webster 2002; Hoyos and
Webster 2007; Krishnamurthy and Shukla 2007; Rajeevan
et al. 2010). A vertical slope is also observed, with
CloudSat observations indicating increased cloud liquid
water content slightly leading and increased cloud ice
water content slightly lagging the precipitation maximum
(Rajeevan et al. 2013).
Recent work using satellite data has investigated vari-
ations in the character of precipitating systems during
the intraseasonal oscillation. Analyzing TRMM data,
Chattopadhyay et al. (2009) found that northward prop-
agation is weak in the convective precipitation compo-
nent but prominent in the stratiform component, which
reinforces the northward propagation. The top-heavy
latent heating produced by stratiform precipitation
feeds back onto the large-scale pattern, forcing dynamical
uplift and strengthening the monsoon trough and mid-
level cyclonic circulation (Choudhury and Krishnan
2011). Over the Bay of Bengal, stratiform precipitation is
predominantly associated with MCSs; individual systems
propagate to the south and west while initiation locations
shift northward (Zuidema 2003; Liu et al. 2008). In ad-
dition, Goswami et al. (2010) and Vellore et al. (2014)
reported that extreme rainfall over the Meghalaya Pla-
teau and eastern Himalayas is associated with mesoscale
convection areas during domainwide break (but locally
rainy) intraseasonal periods. MCSs, then, play a signifi-
cant role in both the propagation and the heavy pre-
cipitation episodes of the intraseasonal oscillation. To
date, however, no attempt has been made to quantify the
intraseasonal modulation of MCS occurrence or to ex-
amine how MCS characteristics differ seasonally or with
respect to the 30–60-day oscillation.
In this paper, we examine seasonal and intraseasonal
variations in the geographical distribution, vertical
FIG. 1. Elevation (m), with 500-m contour in black. Blue poly-
gons delineate three subregions: Meghalaya Plateau, northeast
Himalayan notch, and Bay of Bengal.
4754 JOURNAL OF THE ATMOSPHER IC SC IENCES VOLUME 73

structure, and lightning production of South Asian
MCSs, focusing on subregions of frequent MCS occur-
rence. Our analysis is based on a database of MCSs
identified by Yuan and Houze (2010, hereafter YH10)
in observations from NASA’s A-Train constellation
(L’Ecuyer and Jiang 2010). CloudSat, also in the
A-Train, carries a Cloud Profiling Radar (CPR) that
enables investigation ofMCS reflectivity structures. The
A-Train does not carry a lightning sensor, so lightning
observations are supplied by a ground-based network.
2. Data
a. MCS identification protocol
YH10 developed a technique, summarized in Table 1,
for identifying MCSs using observations from two in-
struments on theAqua satellite. MCS high-cloud shields
are identified from Moderate Resolution Imaging
Spectroradiometer (MODIS) 10.8-mm brightness tem-
peratures (Tb11), and precipitating areas are located
using the Advanced Microwave Scanning Radiometer
for Earth Observing System (AMSR-E) AE_Rain
product (Kummerow et al. 2001; Wilheit et al. 2003).
Two categories of MCSs are identified:
d Separated MCSs (SMCSs), in which the precipitating
area contains at most two dominant raining cores of
any MCS. Most MCSs fall into this category, which is
further subdivided into small SMCSs [the smallest
25%, with high-cloud system (HCS; see Table 1) area
less than 11 000 km2] and large SMCSs (the largest
25%, with HCS area greater than 41 000 km2).d ConnectedMCSs (CMCSs), in which the precipitating
area contains the dominant raining cores of three or
more MCSs. While A-Train satellites provide snap-
shots and cannot track feature development, we
expect that CMCSs form through the continued
FIG. 2. Seasonal-mean (top) ERA-Interim 925-hPa winds (vectors) and geopotential height (contours; m), (middle) TRMM pre-
cipitation (mmday21), and (bottom) WWLLN lightning frequency (strokes per square kilometer per year), averaged over
(a) premonsoon (AM), (b) monsoon (JJAS), and (c) postmonsoon months (ON). Black contours indicate the 500-m elevation.
DECEMBER 2016 V IRT S AND HOUZE 4755

upscale growth and merging of long-lived MCSs
(Williams and Houze 1987; Mapes and Houze 1993).
MCSs identified using this criteria account for 57% of
tropical precipitation (YH10). In this study, we analyze
MCSs identified from April to November over South
Asia (Fig. 1) using data from 2007 to 2010 (J. Yuan 2013,
unpublished data).
A-Train satellites operate in sun-synchronous orbit with
equatorial crossings at 0130 and 1330 LT. Analysis of di-
urnal variability using TRMM indicates that, over the
Meghalaya Plateau and eastern Himalayas, large pre-
cipitating systems occur most frequently during early
morning (0300–0500 LT), as nocturnal downslope winds
convergewith the large-scalemonsoon flow, and decline to
an evening minimum (2000–2200 LT). Over the Bay of
Bengal, broad stratiform regions have amiddaymaximum
(0900–1500 LT) and evening minimum (2000–2300 LT;
Romatschke et al. 2010; Romatschke and Houze 2011a).
Thus, for each region, one A-Train overpass is at or just
prior to the time of peakMCS occurrence, while the other
overpass is more likely to sample systems later in their life
cycle. Examination of day versus night differences inMCS
characteristics is beyond the scope of this paper.
b. CloudSat reflectivity
CloudSat’s CPR measures radar reflectivity factor at
94GHz (Stephens et al. 2002;Marchand et al. 2008). The
backscatter profiles have a vertical resolution of 240m
and are available every 2.5 km along track. Portions of
each profile sampling a cloud are identified by screen-
ing for level-2B geometric profile (2B-GEOPROF;
CloudSat 2007) cloud-mask values of 20 or above
(Marchand et al. 2008).
Yuan et al. (2011, hereafter YHH11) identified
CloudSat profiles that sampled some portion of anMCS.
They then focused on anvil clouds, which they defined as
having cloud base above 3km and top above 10km. Our
approach follows Virts and Houze (2015b): we present
statistics for both the precipitating and anvil regions of
MCSs, where anvils are identified as in YHH11 and the
precipitating category includes all CloudSat profiles
sampling the nonanvil region of the MCS.
Vertical reflectivity structures can be represented as
two-dimensional histograms of reflectivity as a function
of altitude, known as contoured frequency by altitude
diagrams (CFADs; Yuter and Houze 1998). Cetrone
and Houze (2009), YHH11, and Virts and Houze
(2015b) demonstrated the use of CFADs of CloudSat
observations of MCSs to infer cloud microphysical
processes. Radar reflectivity can be enhanced by in-
creased number, size, or density of particles in the radar
beam. Evidence from aircraft sampling of ice particles
and calculation of reflectivity at both 35 and 94GHz by
YHH11 indicates that number concentration is not the
most likely reason for differences in CloudSat re-
flectivity observations in the upper levels of MCSs;
rather, it is most likely the size of the particles. Strong
updrafts prevent larger ice particles from falling out and
generate supercooled water for the formation of denser
graupel particles; thus, a heterogeneous reflectivity
distribution including high concentrations of large
reflectivities in the middle and upper troposphere
indicates the CFAD was generated from CloudSat ob-
servations of precipitating systems with a convective
nature. In contrast, weaker updrafts that prevail in MCS
stratiform regions maintain a more homogeneous par-
ticle size distribution consisting of small ice particles that
remain suspended aloft while denser particles fall out.
As a result, CFADs for precipitating clouds with a
stratiform character exhibit a pronounced slope, with
strong modal values tending toward lower values with
TABLE 1. Methodology used by YH10 to identify cloud and precipitation features and MCSs, based on MODIS Tb11 and AMSR-E
AE_Rain data. The cloud-top minimum temperature (Tb11RC1min) is defined as the mean Tb11 of the coldest decile of the largest
raining core (RC1). Adapted from YHH11 and Virts and Houze (2015b).
Feature Definition
High-cloud complex (HCC) Region of MODIS Tb11 contained within a single 260-K isotherm
High-cloud system (HCS) Portion of HCC associated with a particular minimum value of Tb11Precipitation feature (PF) Region of AMSR-E AE_Rain parameter surrounded by 1mmh21 contour
Raining core (RC) Portion of any PF overlapping and/or located within an HCS
Heavy rain area (HRA) Portion of PF with rain rate greater than 6mmh21
Mesoscale convective
system (MCS)
Any HCS whose largest RC satisfies the following criteria
1) Exceeds 2000 km2 in total area
2) Accounts for more than 70% of the total area with rain rate greater than 1mmh21 inside the HCS
3) Minimum cloud-top temperature above the RC (indicated by Tb11RC1min) is less than 220K
4) More than 10% of RC is occupied by HRAs
Separated MCS (SMCS) The largest RC of the MCS is part of a PF that contains less than three dominant RCs of any MCS
Connected MCS (CMCS) The largest RC of the MCS is part of a PF that contains dominant RCs of at least three MCSs
4756 JOURNAL OF THE ATMOSPHER IC SC IENCES VOLUME 73

height in the upper troposphere. In this paper, we use the
existence of a strong mode at low reflectivity sloping to
lower values with height to indicate the presence of strat-
iform precipitation and the existence of a heterogeneous
CFAD at upper levels to indicate precipitation of a more
convective nature. Vertical velocities in anvils are weaker
still, allowing ice particles to drift downward (Houze 2014,
chapter 6). We therefore interpret large reflectivities in
anvils to indicate that the anvils are connected to active
deep convective updrafts, and large particles injected into
the anvils have not yet had time to fall out.
c. WWLLN lightning
Vigorous updrafts are needed to produce the rates of
charge separation required for lightning (Zipser and
Lutz 1994); thus, lightning is an independent indicator of
convective intensity. The World Wide Lightning Loca-
tion Network (WWLLN) monitors very-low-frequency
(VLF) lightning sferics, locating lightning to within
;5 km and ,10ms (Abarca et al. 2010). WWLLN’s
global detection efficiency during the period of this
study is estimated to be ;10% of cloud-to-ground
lightning with current stronger than 635kA (Rodger
et al. 2009; Abarca et al. 2010; Rudlosky and Shea 2013).
MCS lightning production is calculated as follows: for
each MCS, a 0.258 3 0.258 grid is defined with the center
of the largest raining core of the MCS at (08, 08) relativelatitude and longitude, and grid boxes containing some
portion of theMCS cloud shield are identified.WWLLN
lightning observations (R. Holzworth 2013, unpublished
data) from a 1-h window centered on the MODIS
overpass are assigned to the relative latitude–longitude
grid based on their location relative to the MCS. The
total number of lightning strokes during the 1-h obser-
vation window in grid boxes affected by the MCS is
termed the MCS lightning production.
Independent lightning production values were calcu-
lated for MCS-like precipitation features observed by
TRMM and selected using the criteria of Virts and
Houze (2015a, their section 2d). Seasonal and intra-
seasonal variations in the TRMM-based statistics (not
shown) are qualitatively consistent with those presented
in this paper.
d. ERA-Interim
Atmospheric conditions are represented by fields
from the European Centre for Medium-RangeWeather
Forecasts (ECMWF) interim reanalysis (ERA-Interim;
ECMWF 2009; Dee et al. 2011), with the 6-hourly fields
(3-hourly for CAPE) averaged to create daily values at
each grid point. The results in this paper are based on
1.58 or, when indicated, 0.1258 resolution. Anomalies are
calculated with reference to the JJAS mean.
e. BSISO index
The boreal summer intraseasonal oscillation (BSISO)
indices developed by Lee et al. (2013a,b) represent the
strength and evolution of the 30–60- and 10–30-day
modes. The indices are based on multivariate empiri-
cal orthogonal function (EOF) analysis of daily anom-
alies of OLR and 850-hPa zonal winds over the South
and Southeast Asian monsoon regions. The first two
EOFs, the principal component (PC) time series of
which are collectively designated BSISO1, represent
northward propagation from the equatorial Indian
Ocean to southern Asia at 30–60-day time scales. The
third and fourth PCs (designated BSISO2) are associ-
ated with northward propagation at 10–30-day time
scales and exhibit peak variability around the time of
monsoon onset. For this study, eight phases of BSISO1
and BSISO2 are defined as in Lee et al. (2013a), and
each day during JJAS is assigned to whichever phase of
each index it projected onto most strongly. Days on
which the magnitude of the BSISO index was less than
one standard deviation from zero (about 15% of all
JJAS days) are discarded.
Similar results to those presented in this paper are
obtained with alternate indices of the 30–60-day vari-
ability, such as the BSISO index of Kikuchi et al. (2012)
or the monsoon intraseasonal oscillation (MISO) index
of Shukla (2014). We chose the Lee et al. (2013a) index
because it also tracks a component of 10–30-day
variability.
3. Seasonal variability of atmospheric conditions
In this study, we focus on three seasons: the summer
monsoon (JJAS) and the shoulder seasons, the pre-
monsoon [April and May (AM)] and postmonsoon
[October and November (ON)]. Strong daytime heating
of land during the premonsoon creates conditionally
unstable conditions favorable for intense convection
(Romatschke and Houze 2011b). Vigorous diurnally
driven convection produces lightning maxima along the
southwest coast of India and the west coast of Burma as
well as over the Meghalaya Plateau and the Himalayas
(Fig. 2). Precipitation maxima are similarly distributed
but less prominent than the lightning.
During the monsoon, a low pressure trough extends
from northwest to southeast over northern India, while
weak ridging is observed along the west coast (Fig. 2b).
The associated westerly winds over the eastern Arabian
Sea and southwesterly winds over the Bay of Bengal
advect moist air over South Asia, producing frequent
and sometimes heavy precipitation. While precipitation
is concentrated over and upstream of the mountains
DECEMBER 2016 V IRT S AND HOUZE 4757

(Grossman and Durran 1984; Houze et al. 2007), mon-
soon lightning exhibits amarkedly different distribution,
with maxima over eastern India and extending along the
Himalayas. Upper-tropospheric winds are easterly such
that monsoon convection experiences strong shear
(Johnson and Houze 1987).
The transition between the summer and winter mon-
soons can be seen in the October–November means
(Fig. 2c). Southwesterly flow gives way to weak north-
easterlies. Without the moist advection by monsoon
winds, precipitation over South Asia decreases except
over extreme southern India. As in the premonsoon,
postmonsoon lightning is most frequent along the west
coasts of southern India, Sri Lanka, and Burma.
4. Seasonal variability of MCSs
a. Variability of MCS distribution
Premonsoon small SMCSs are scattered over the
eastern terrain (Fig. 3a). Large SMCSs occur frequently
over the Meghalaya Plateau but rarely elsewhere over
land. Both large and connectedMCSs are observed over
the Bay of Bengal, particularly the southeastern coastal
waters. MCSs of all types are observed over the near-
equatorial Indian Ocean.
MCSs are most frequent during the monsoon
(Fig. 3b). Hotspots of small SMCSs are observed along
the Himalayas and eastern terrain, particularly over the
northeastern notch, while large SMCSs are more evenly
distributed along the Himalayas and the Indian west
and east coasts. Large SMCSs are ubiquitous over most
of the Bay of Bengal. The merging of these large sys-
tems into CMCSs is most frequent over the northern
and eastern bay and seems to be enhanced by proximity
to the mountainous Burma coast. Close inspection re-
veals that the occurrence of large SMCSs extends over
the near-coastal land regions of Bangladesh and
Burma, while CMCSs occur discernably upstream of
land. There is a secondary maximum in large and con-
nected MCS occurrence over the eastern Arabian Sea,
upstream of the Western Ghats, again indicating that
FIG. 3. Seasonal-mean density of (top) small SMCSs, (middle) large SMCSs, and (bottom) CMCSs during (a) AM, (b) JJAS, and
(c) ON, expressed as number of systems per 0.58 3 0.58 grid box per month (note that the color scales differ). Black contours indicate the
500-m elevation.
4758 JOURNAL OF THE ATMOSPHER IC SC IENCES VOLUME 73

their occurrence is enhanced upstream of mountains.
Romatschke et al. (2010) also noted more broad strat-
iform regions over the Bay of Bengal compared to the
Arabian Sea and hypothesized that lower humidity
over the Arabian Sea limited the formation of mature
stratiform areas.
The retreat of the monsoon is associated with de-
creased MCS occurrence over most of the domain
(Fig. 3c). PostmonsoonMCSs are located primarily over
the southeastern Arabian Sea and outlining the Bay of
Bengal, with some large systems extending into southern
India and southern Bangladesh.
Spatial patterns of precipitation and large and con-
nected MCSs are similar for each season, although pre-
cipitation maxima aremore closely tied to coastlines and
topography than the MCSs (Figs. 2, 3; Biasutti et al.
2012). Romatschke et al. (2010) suggested that large
MCSs are the primary precipitation producers during the
FIG. 4. CFADs of CloudSat reflectivities in the precipitating portions of (top) small SMCSs, (middle) large SMCSs, and (bottom)
CMCSs over the Bay of Bengal during (a) AM, (b) JJAS, and (c) ON. Each CFAD is normalized such that its maximum value is 1.
(d) Difference between CFADs for JJAS and AM, with blue shading indicating where reflectivity values are proportionately more likely
to be observed during AM. Sample size is indicated in the upper-right corner of (a)–(c).
DECEMBER 2016 V IRT S AND HOUZE 4759

monsoon. Here, we further suggest that while MCSs
occur less frequently during the shoulder seasons, they
are still major producers of precipitation. Premonsoon
lightning and large MCSs both have maxima offshore of
southern India and Sri Lanka, over the eastern Bay of
Bengal, and over the Meghalaya Plateau. Their distri-
butions exhibit weaker parallels during the postmonsoon
and are generally dissimilar during the monsoon, sug-
gesting that MCS lightning contributions are most sig-
nificant during the premonsoon.
b. Variability of MCS characteristics
Cetrone and Houze (2009) and YHH11 presented
CFADs for the anvils of MCSs over the Bay of Bengal
and the Indian Ocean sector, respectively, emphasizing
variations in the reflectivity distributions as a function of
anvil thickness and distance from the MCS center.
Subsequently, Virts and Houze (2015b) investigated
vertical structures of both the precipitating and anvil
regions of all tropical MCSs, stratified by MCS type.
Here, we narrow our focus to MCSs over three regions:
the Bay of Bengal, the Meghalaya Plateau, and the
northeast Himalayan notch (Fig. 1).
1) BAY OF BENGAL
Seasonal CFADs for the precipitating portions of Bay
of Bengal MCSs are shown in Fig. 4. The smaller sample
size leads to noisier distributions than in Virts and
Houze (2015b), but the basic characteristics can still be
seen. Below the melting layer (indicated by the vertical
discontinuity around 5km), reflectivities decrease as the
signal is attenuated by precipitation. Above the melt-
ing layer, the reflectivity distribution in small SMCSs
exhibits a convective character, indicated (section 2b) by
heterogeneity in the CFAD, including large reflectivities
in themid- and upper troposphere. In contrast, large and
connected MCSs exhibit a more stratiform character,
with reflectivity distributions sloping toward lower
values with height in the upper troposphere.
Premonsoon large and connected Bay of Bengal
MCSs are more convective than monsoon MCSs, in-
dicated by the high reflectivities extending to ;13km
compared to ;10km during the monsoon (Fig. 4);
monsoon MCSs exhibit a stronger stratiform character.
This contrast is confirmed in the difference plots
(Fig. 4d), which show that high reflectivities aloft are
FIG. 5. As in Fig. 4, but for the anvil portions of (top) large SMCSs and (bottom) CMCSs.
4760 JOURNAL OF THE ATMOSPHER IC SC IENCES VOLUME 73

more prevalent in premonsoon MCSs, consistent with
previous observations of changes in the characteristics
of precipitating systems from the premonsoon to mon-
soon (see section 1). Note that this contrast is observed
for eachMCS type; that is, even the largest MCSs have a
greater convective character during the premonsoon.
Similarly, higher reflectivities are observed in the anvils
of large and connected premonsoon Bay of BengalMCSs
(Fig. 5). Monsoon MCS anvils have generally lower re-
flectivities, consistent with the development of extensive,
mature anvils with weak ascent. Anvils during the mon-
soon are generally thicker than in the shoulder seasons.
Postmonsoon Bay of Bengal MCSs exhibit reflectivity
distributions between those of the premonsoon and
monsoon MCSs, appearing somewhat more convective
than monsoon MCSs but not as convective as the pre-
monsoon MCSs (Figs. 4, 5).
Independent confirmation of seasonal differences in
updraft intensity in MCSs is provided by the lightning
production (Fig. 6). For each MCS type, lightning pro-
duction decreases significantly from the premonsoon to
monsoon. This behavior is particularly apparent in large
and connected MCSs, in which lightning production
decreases by a factor of ;3–4 during the monsoon,
slightly larger than the decrease of a factor of ;2 re-
ported by Yuan and Qie (2008), based on TRMM ob-
servations of MCSs over the South China Sea. For each
MCS type, lightning production remains low during the
postmonsoon and is not statistically different from that
during the monsoon.
2) MEGHALAYA PLATEAU
Compared to the Bay of Bengal, there are fewer
MCSs over the Meghalaya Plateau, particularly during
the postmonsoon (Fig. 3). Thus, we focus on pre-
monsoon and monsoon MCSs and do not stratify the
statistics by MCS type.
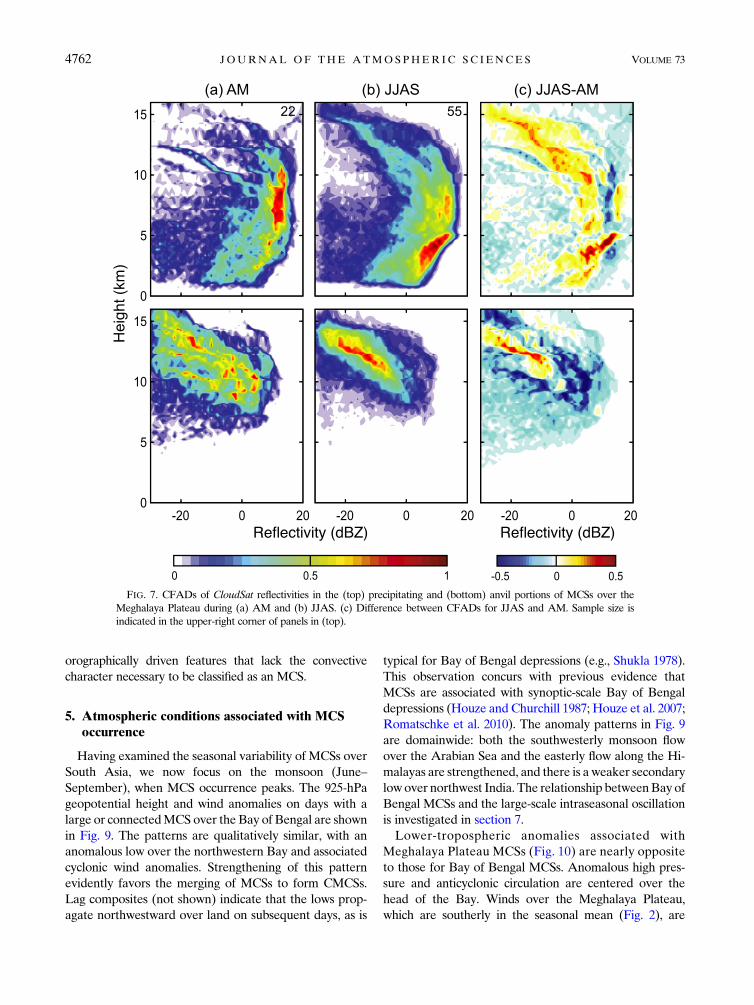
Premonsoon Meghalaya Plateau MCSs exhibit a
strongly convective nature, with peak reflectivities above
10dBZ in the midtroposphere (Fig. 7). The lack of a no-
ticeable modal decrease in reflectivity with height in the
upper troposphere in the precipitating region and the noisy
appearance of the anvil CFAD indicate that the MCSs
have not developed mature stratiform or anvil regions.
Monsoon MCSs over the Meghalaya Plateau exhibit
markedly different characteristics. Their precipitating re-
gions are generally taller than those in premonsoonMCSs;
however, peak reflectivities are concentrated below the
08C level, suggesting both the maritime tropical origin of
the airmass (Houze et al. 2007) and orographic enhance-
ment (see section 7). As over the Bay of Bengal, monsoon
MCSs over the Meghalaya Plateau exhibit more mature
stratiform reflectivity structures than those during the
premonsoon. The narrow reflectivity distribution in their
anvils indicates the development of more uniform, weaker
ascent. In agreement with these observations, MCS light-
ning production in this region decreases by almost a factor
of 2 during the monsoon (not shown).
3) NORTHEAST HIMALAYAN NOTCH
Few MCSs are observed over the northeast Himalayan
notch during the shoulder seasons (Fig. 3). Monsoon
MCSs in this region are generally shorter lived than those
over the Meghalaya Plateau and Bay of Bengal, and their
reflectivity structures, while robust, do not exhibit the
pronounced stratiform signature observed in the other
regions (Fig. 8). The broad distribution of the anvil re-
flectivities in northeast Himalayan notch MCSs indicates
that size sorting and aggregation processes are not as de-
veloped in these systems, and there is a greater concen-
tration of larger reflectivities (.0dBZ) than in other
regions or seasons. These results indicate that monsoon
MCSs in this region are predominantly small (Fig. 3) and
convective, with some large ice particles detrained into
their anvils. MCS lightning production in this region is low
and not significantly distinct in any season (not shown).
The absence of a local maximum over this region in the
seasonal lightning climatology (Fig. 2b) suggests that up-
drafts in theseMCSs are typically not vigorous enough for
significant electrification. TRMM observations indicate a
local maximum in broad stratiform precipitation features
over the eastern Himalayas during the premonsoon and
monsoon (Houze et al. 2007; Romatschke and Houze
2011a,b); our results suggest that these are predominantly
FIG. 6. WWLLN lightning counts (strokes per hour) within the
radius of the high-cloud shields of (a) small SMCSs, (b) large
SMCSs, and (c) CMCSs over the Bay of Bengal as a function of
season. Error bars represent the 95% confidence interval. Note
that the ordinate scales vary by MCS type.
DECEMBER 2016 V IRT S AND HOUZE 4761
orographically driven features that lack the convective
character necessary to be classified as an MCS.
5. Atmospheric conditions associated with MCSoccurrence
Having examined the seasonal variability of MCSs over
South Asia, we now focus on the monsoon (June–
September), when MCS occurrence peaks. The 925-hPa
geopotential height and wind anomalies on days with a
large or connectedMCS over theBay of Bengal are shown
in Fig. 9. The patterns are qualitatively similar, with an
anomalous low over the northwestern Bay and associated
cyclonic wind anomalies. Strengthening of this pattern
evidently favors the merging of MCSs to form CMCSs.
Lag composites (not shown) indicate that the lows prop-
agate northwestward over land on subsequent days, as is
typical for Bay of Bengal depressions (e.g., Shukla 1978).
This observation concurs with previous evidence that
MCSs are associated with synoptic-scale Bay of Bengal
depressions (Houze and Churchill 1987; Houze et al. 2007;
Romatschke et al. 2010). The anomaly patterns in Fig. 9
are domainwide: both the southwesterly monsoon flow
over the Arabian Sea and the easterly flow along the Hi-
malayas are strengthened, and there is a weaker secondary
lowover northwest India. The relationship betweenBay of
Bengal MCSs and the large-scale intraseasonal oscillation
is investigated in section 7.
Lower-tropospheric anomalies associated with
Meghalaya Plateau MCSs (Fig. 10) are nearly opposite
to those for Bay of Bengal MCSs. Anomalous high pres-
sure and anticyclonic circulation are centered over the
head of the Bay. Winds over the Meghalaya Plateau,
which are southerly in the seasonal mean (Fig. 2), are
FIG. 7. CFADs of CloudSat reflectivities in the (top) precipitating and (bottom) anvil portions of MCSs over the
Meghalaya Plateau during (a) AM and (b) JJAS. (c) Difference between CFADs for JJAS and AM. Sample size is
indicated in the upper-right corner of panels in (top).
4762 JOURNAL OF THE ATMOSPHER IC SC IENCES VOLUME 73

strengthened and have a stronger southwesterly compo-
nent onMCSdays, increasing the flowofmoisture from the
Bay of Bengal and the Bangladesh wetlands (Medina et al.
2010). Previous studies have also noted that anomalously
southwesterly winds favor heavy precipitation events over
the plateau (Romatschke and Houze 2011a; Sato 2013).
In contrast to the other two subregions, the large-scale
anomaly pattern on days with northeast Himalayan notch
MCSs is nondescript, with weak easterly anomalies to the
southwest (Fig. 11). Zooming in at 0.1258 resolution, a
FIG. 8. CFADs of CloudSat reflectivities in the (top) pre-
cipitating and (bottom) anvil portions of MCSs over the northeast
Himalayan notch during JJAS. Sample size is indicated in the
upper-right corner of (top).
FIG. 9. Anomalies of ERA-Interim 925-hPa wind (vectors) and
geopotential height [contours; contour interval (CI) 5 2m] for
days when a (a) large SMCS or (b) CMCS was observed over the
Bay of Bengal (black pentagon) during JJAS. Black contours in-
dicate the 500-m elevation.
FIG. 10. Anomalies of ERA-Interim 850-hPa wind (vectors) and
geopotential height (contours; CI 5 2m) for days when an MCS
was observed over theMeghalaya Plateau (black rectangle) during
JJAS. Black contours indicate the 500-m elevation.
DECEMBER 2016 V IRT S AND HOUZE 4763

mesoscale low and associated cyclonic wind anomalies can
be seen over the IrriwaddyValley. The low is slightly south
of the small SMCS hotspot (Fig. 3b), which is collocated
with maximum anomalous CAPE (Fig. 11c). We conclude
that the mean JJAS pattern, in which moist air from the
Bay of Bengal is advected up the valley toward the
mountains, combined with locally enhanced CAPE, favors
MCS occurrence in this region.
6. The 30–60-day variability of atmosphericconditions
Lower-tropospheric anomalies during eight phases of
the BSISO1 index (i.e., the 30–60-day mode) are shown
in Fig. 12. During phases 1 and 2, an anomalous high and
associated anticyclonic circulation are centered over the
northern Bay of Bengal and stretch northwestward
across India. Lower heights at the southern edge of the
domain intensify and propagate northward during pha-
ses 3–5, occupying most of the domain. The associated
wind shift amplifies the monsoon southwesterlies over
theArabian Sea and southeasterlies over theHimalayan
foothills (Fig. 2). Over much of the Bay of Bengal, winds
are anomalously westerly during phases 5 and 6, as the
low peaks in intensity at the head of the Bay. The low
extends along the Himalayas during phases 7 and 8, and
an anomalous high shifts northward from the equator to
the Indian west coast.
FIG. 11. (a) Anomalies of ERA-Interim 850-hPa wind (vectors) and geopotential height
(contours; CI5 2m) for days when anMCS was observed over the northeast Himalayan notch
(black rectangle) during JJAS. (b) As in (a), but CI 5 0.4m. (c) As in (a), but for CAPE
anomalies. Black contours indicate the 500-m elevation.
4764 JOURNAL OF THE ATMOSPHER IC SC IENCES VOLUME 73

FIG. 12. Anomalies of ERA-Interim 925-hPa wind (vectors) and geopotential height (contours; CI 5 2m) during
eight BSISO1 phases during JJAS. Black contours indicate the 500-m elevation.
DECEMBER 2016 V IRT S AND HOUZE 4765
As discussed in section 1, monsoon intraseasonal vari-
ability is often described as producing active and break
periods. Here, we designate BSISO1 phases 4–7 as the
active period, with anomalous low pressure over the In-
dian subcontinent and general strengthening of the mon-
soon circulation, and phases 8 and 1–3 as the break period.
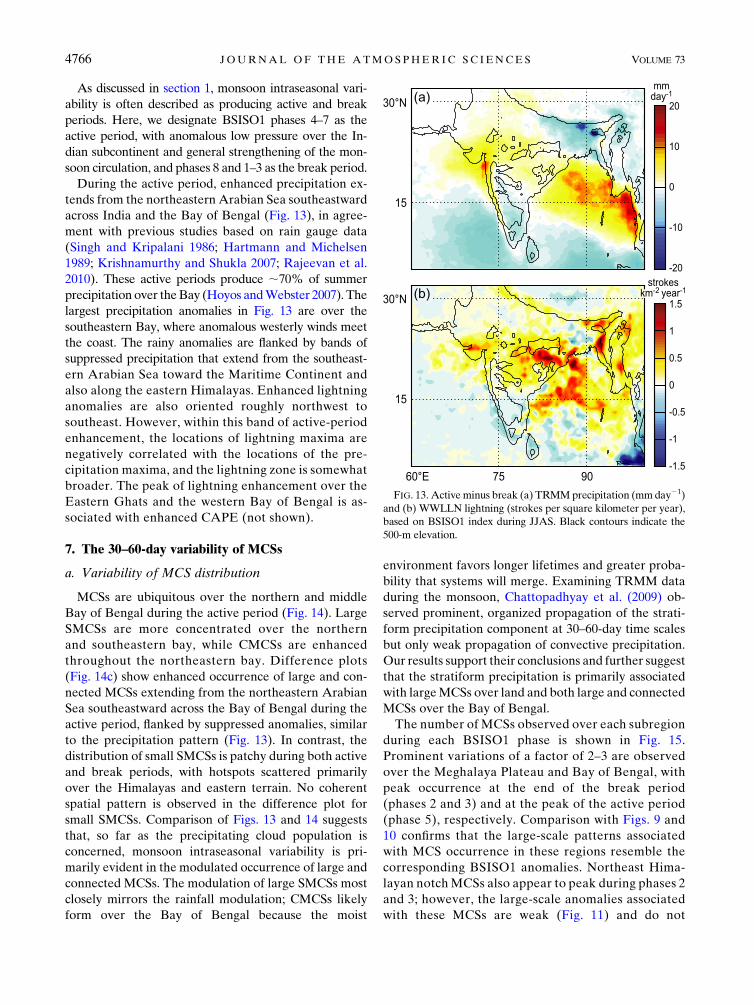
During the active period, enhanced precipitation ex-
tends from the northeastern Arabian Sea southeastward
across India and the Bay of Bengal (Fig. 13), in agree-
ment with previous studies based on rain gauge data
(Singh and Kripalani 1986; Hartmann and Michelsen
1989; Krishnamurthy and Shukla 2007; Rajeevan et al.
2010). These active periods produce ;70% of summer
precipitation over theBay (Hoyos andWebster 2007). The
largest precipitation anomalies in Fig. 13 are over the
southeastern Bay, where anomalous westerly winds meet
the coast. The rainy anomalies are flanked by bands of
suppressed precipitation that extend from the southeast-
ern Arabian Sea toward the Maritime Continent and
also along the eastern Himalayas. Enhanced lightning
anomalies are also oriented roughly northwest to
southeast. However, within this band of active-period
enhancement, the locations of lightning maxima are
negatively correlated with the locations of the pre-
cipitation maxima, and the lightning zone is somewhat
broader. The peak of lightning enhancement over the
Eastern Ghats and the western Bay of Bengal is as-
sociated with enhanced CAPE (not shown).
7. The 30–60-day variability of MCSs
a. Variability of MCS distribution
MCSs are ubiquitous over the northern and middle
Bay of Bengal during the active period (Fig. 14). Large
SMCSs are more concentrated over the northern
and southeastern bay, while CMCSs are enhanced
throughout the northeastern bay. Difference plots
(Fig. 14c) show enhanced occurrence of large and con-
nected MCSs extending from the northeastern Arabian
Sea southeastward across the Bay of Bengal during the
active period, flanked by suppressed anomalies, similar
to the precipitation pattern (Fig. 13). In contrast, the
distribution of small SMCSs is patchy during both active
and break periods, with hotspots scattered primarily
over the Himalayas and eastern terrain. No coherent
spatial pattern is observed in the difference plot for
small SMCSs. Comparison of Figs. 13 and 14 suggests
that, so far as the precipitating cloud population is
concerned, monsoon intraseasonal variability is pri-
marily evident in the modulated occurrence of large and
connected MCSs. The modulation of large SMCSs most
closely mirrors the rainfall modulation; CMCSs likely
form over the Bay of Bengal because the moist
environment favors longer lifetimes and greater proba-
bility that systems will merge. Examining TRMM data
during the monsoon, Chattopadhyay et al. (2009) ob-
served prominent, organized propagation of the strati-
form precipitation component at 30–60-day time scales
but only weak propagation of convective precipitation.
Our results support their conclusions and further suggest
that the stratiform precipitation is primarily associated
with largeMCSs over land and both large and connected
MCSs over the Bay of Bengal.
The number of MCSs observed over each subregion
during each BSISO1 phase is shown in Fig. 15.
Prominent variations of a factor of 2–3 are observed
over the Meghalaya Plateau and Bay of Bengal, with
peak occurrence at the end of the break period
(phases 2 and 3) and at the peak of the active period
(phase 5), respectively. Comparison with Figs. 9 and
10 confirms that the large-scale patterns associated
with MCS occurrence in these regions resemble the
corresponding BSISO1 anomalies. Northeast Hima-
layan notchMCSs also appear to peak during phases 2
and 3; however, the large-scale anomalies associated
with these MCSs are weak (Fig. 11) and do not
FIG. 13. Active minus break (a) TRMMprecipitation (mmday21)
and (b) WWLLN lightning (strokes per square kilometer per year),
based on BSISO1 index during JJAS. Black contours indicate the
500-m elevation.
4766 JOURNAL OF THE ATMOSPHER IC SC IENCES VOLUME 73

resemble the BSISO1 pattern. For this reason, we do
not further investigate BSISO1 modulation of northeast
Himalayan notch MCSs.
b. Variability of MCS characteristics
In the remainder of this section, we examine howMCS
characteristics vary during the 30–60-day oscillation. For
each reference box, the regional-mean TRMM 3B42 rain
rate is calculated for each BSISO1 phase. The four suc-
cessive phases containing the peak precipitation are des-
ignated as the local ‘‘rainy’’ period and the remaining four
phases as the ‘‘dry’’ period. Note that the local rainy pe-
riod over the Bay of Bengal matches the active monsoon
period (phases 4–7), while the local rainy period over the
FIG. 14. Density of (top) small SMCSs, (middle) large SMCSs, and (bottom)CMCSs, expressed as number of systems per 0.58 3 0.58 gridbox (note that the color scales differ) for (a) active and (b) break BSISO1 periods during JJAS and (c) the difference between (a) and (b).
Black contours indicate the 500-m elevation.
FIG. 15. Number of MCSs observed over each region during each BSISO1 phase during JJAS.
DECEMBER 2016 V IRT S AND HOUZE 4767

Meghalaya Plateau occurs in break conditions (phases 8,
1–3), in association with the southwesterly flow around
the high (Fig. 12).
1) BAY OF BENGAL
Reflectivity structures for MCSs during the local
rainy and dry periods are shown in Figs. 16 and 17.
The intraseasonal differences are more subtle than the
seasonal differences (Figs. 4, 5). Difference CFADs in-
dicate slightly higher midtropospheric reflectivities in
the precipitating regions of rainy period MCSs, while
in the upper troposphere, higher reflectivities suggest
deeper updrafts and increased lofting of larger ice par-
ticles in dry-period MCSs. These contrasts are also ob-
served in the anvil CFADs, particularly in CMCSs.
Lightning production of Bay of Bengal MCSs de-
creases during phase 2 and remains lower through the
rainy period before increasing at the beginning of the
dry period (Fig. 18b). Increased lightning during the dry
period is consistent with the stronger updrafts suggested
by the reflectivity structures. Note, however, that just as
the intraseasonal contrasts inMCS reflectivity structures
are not as pronounced as those between premonsoon
and monsoon MCSs, intraseasonal variations in MCS
lightning, while statistically significant, are not as robust
as the seasonal differences (Fig. 6).
At first glance, the results in Fig. 18b appear contra-
dictory to observations of overall increased lightning
over the Bay of Bengal during the active period (Fig. 13).
Decreased lightning production in individual MCSs is
partially offset by the sharp increase in MCS occurrence
during the active period. In addition, lightning frequency
increases most over the western Bay, where there are
comparatively fewer MCSs (Fig. 14). This suggests that
FIG. 16. CFADs of CloudSat reflectivities in the precipitating portions of (top) large SMCSs and (bottom) CMCSs
over the Bay of Bengal during locally (a) rainy and (b) dry BSISO1 periods during JJAS. (c) Difference between
locally rainy and dry CFADs, with blue shading indicating where reflectivity values are proportionatelymore likely to
be observed during the dry period. Sample size is indicated in the upper-right corner of each panel.
4768 JOURNAL OF THE ATMOSPHER IC SC IENCES VOLUME 73
isolated convection may be responsible for the increased
lightning.
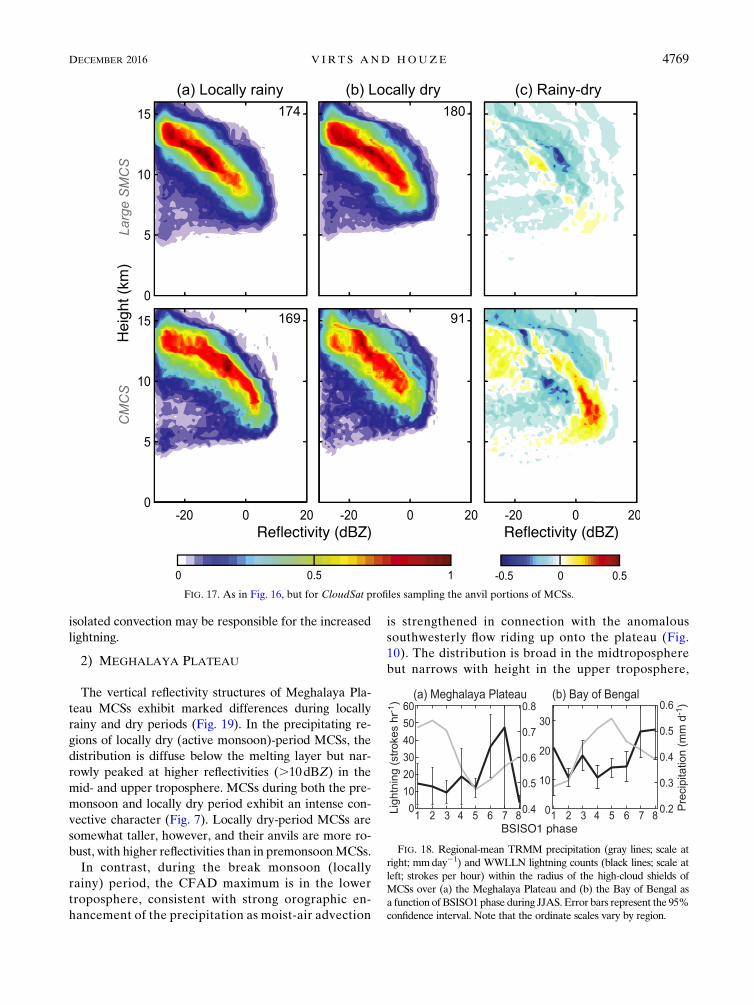
2) MEGHALAYA PLATEAU
The vertical reflectivity structures of Meghalaya Pla-
teau MCSs exhibit marked differences during locally
rainy and dry periods (Fig. 19). In the precipitating re-
gions of locally dry (active monsoon)-period MCSs, the
distribution is diffuse below the melting layer but nar-
rowly peaked at higher reflectivities (.10dBZ) in the
mid- and upper troposphere. MCSs during both the pre-
monsoon and locally dry period exhibit an intense con-
vective character (Fig. 7). Locally dry-period MCSs are
somewhat taller, however, and their anvils are more ro-
bust, with higher reflectivities than in premonsoonMCSs.
In contrast, during the break monsoon (locally
rainy) period, the CFAD maximum is in the lower
troposphere, consistent with strong orographic en-
hancement of the precipitation as moist-air advection
is strengthened in connection with the anomalous
southwesterly flow riding up onto the plateau (Fig.
10). The distribution is broad in the midtroposphere
but narrows with height in the upper troposphere,
FIG. 17. As in Fig. 16, but for CloudSat profiles sampling the anvil portions of MCSs.
FIG. 18. Regional-mean TRMM precipitation (gray lines; scale at
right; mmday21) and WWLLN lightning counts (black lines; scale at
left; strokes per hour) within the radius of the high-cloud shields of
MCSs over (a) the Meghalaya Plateau and (b) the Bay of Bengal as
a function ofBSISO1phase during JJAS.Error bars represent the 95%
confidence interval. Note that the ordinate scales vary by region.
DECEMBER 2016 V IRT S AND HOUZE 4769

indicating the presence of more mature stratiform
rain areas. These contrasts are highlighted in the
difference plot in Fig. 19c, where the sign switches
around 5 km.
Lightning production in Meghalaya Plateau MCSs
varies intraseasonally (Fig. 18a), increasing by about a
factor of 4 at the end of the locally rainy period. This result
is only marginally statistically significant, perhaps because
of the small sample size (note the large error bars).
8. Conclusions
Characteristics of MCSs over the South Asian mon-
soon region vary by geographic location, by season, and
intraseasonally during the monsoon. Small SMCSs are
concentrated over the Himalayas and the complex east-
ern terrain. Large and connected MCSs occur most
frequently over the Bay of Bengal, and analysis of
CloudSat radar reflectivity vertical structures shows that
they are less convective than land MCSs and develop
more mature stratiform precipitation areas (Figs. 4, 7, 8),
consistent with the broad land–ocean contrasts in MCS
anvil characteristics observed by YHH11.
a. Seasonal variation of MCS structure
Isolated convection dominates over much of the
South Asian landmass during the premonsoon, in
part because dry environments limit the development
of large stratiform areas (Romatschke et al. 2010;
Romatschke and Houze 2011b). Moist advection to-
ward the Meghalaya Plateau (Fig. 2a) permits some
convection to organize into MCSs with an intense
convective character, with updrafts lofting large grau-
pel and ice particles into the upper portions of the
FIG. 19. CFADs of CloudSat reflectivities in (top) precipitating and (bottom) anvil portions of MCSs over the
Meghalaya Plateau during the locally (a) rainy and (b) dry BSISO1 periods during JJAS. (c) Difference between
locally rainy and dry CFADs. Sample size is indicated in the upper-right corner of each panel in (top).
4770 JOURNAL OF THE ATMOSPHER IC SC IENCES VOLUME 73

systems, producing frequent lightning and only small
anvils (Fig. 7). Bay of Bengal MCSs are also more
convective during the premonsoon (Figs. 4 and 5).
Premonsoon MCS lightning production is significantly
greater than during the monsoon; this contrast is most
significant in large and connected MCSs (Fig. 6).
During themonsoon,MCSs are themajor precipitation
producers, especially over the Bay of Bengal, central and
eastern Himalayas, and Meghalaya Plateau. A weaker
maximum in MCS occurrence is located over the eastern
Arabian Sea, upstream of the Western Ghats. The ver-
tical reflectivity structures of monsoon MCSs over the
Bay of Bengal andMeghalaya Plateau are consistent with
mesoscale ascent in mature stratiform precipitation areas
and further size sorting in their anvils, indicated by a
strong decrease of reflectivity with height in the upper
troposphere (Figs. 4, 5, 7). Consistent with past studies,
reanalysis composites show that Bay of Bengal MCSs are
strongly associated with Bay of Bengal depressions
(Fig. 9). Meghalaya Plateau MCSs are much different,
exhibiting strong orographic enhancement and occurring
on days when anomalous southwesterly winds strengthen
the moist air advection from the Bay of Bengal up the
slopes of the plateau (Fig. 10).
During the postmonsoon, the tropical convergence
zone moves southward, and winds over South Asia begin
to shift to the northeasterlies of the winter monsoon
(Fig. 2c). Postmonsoon MCSs are primarily observed
over the Bay of Bengal and the near-equatorial belt and
rarely attain large size over land (Fig. 3). The reflectivity
structures of these MCSs are more convective than those
of the monsoon but more stratiform than those of the
premonsoon (Figs. 4, 5), and their lightning production
remains lower than in premonsoon MCSs (Fig. 6).
Overall, our results indicate a fundamental regime change
from premonsoon to monsoon, while the postmonsoon
appears to be a waning of the monsoon.
Northeast Himalayan notch MCSs exhibit markedly
different characteristics than those over the neighboring
Meghalaya Plateau. MCS formation during the mon-
soon is favored on days with locally enhanced CAPE,
when the large-scale pattern resembles the seasonal
mean (Fig. 11). The broad stratiform areas observed in
this region in previous studies (Romatschke et al.
2010) evidently do not match the MCS criteria, and
those features identified as MCSs are generally small
and convective (Figs. 3, 8). Further investigation is
needed into the characteristics and formation mech-
anisms of precipitating features in this region.
b. Intraseasonal variations in MCS structure
A northward-propagating intraseasonal (30–60 day)
mode modulates the monsoon circulation. No clear
modulation of small SMCS occurrence is observed in
connection with this intraseasonal mode; however,
large and connected MCSs and their characteristics
do vary in relation to the 30–60-day mode. During the
active period, the southwesterlies over the Arabian
Sea are strengthened, and low pressure over the
northern Bay of Bengal is associated with anomalously
strong westerly flow over the bay and easterlies along
the Himalayas (Fig. 12). Enhanced precipitation,
lightning, and large and connected MCS occurrence
extends from the northeastern Arabian Sea southeast-
ward across the Bay of Bengal, flanked by anomalies of
opposite sign (Figs. 13, 14). However, within this zone of
enhancement, lightning, MCS, and rainfall maxima are
not collocated. Large SMCS occurrence mirrors pre-
cipitation occurrence over both land and ocean, but
CMCS anomalies are mainly over the Bay of Bengal. In
addition, lightning (interpreted here as a proxy for the
degree of convective nature of the precipitating systems)
is anticorrelated with large MCS and rainfall occurrence.
That is, in the active monsoon zone, both lightning and
MCS occurrence are enhanced but not in the same
locations.
The characteristics of large and connected MCSs are
also modulated by the 30–60-day oscillation, and the
form of the modulation varies strongly by region. Over
the Bay of Bengal, the locally rainiest period coincides
with the domainwide active period. MCSs over the
bay during this period exhibit slightly more strati-
form reflectivity structures and decreased lightning
production (Figs. 16–18). Over the Meghalaya Plateau,
however, the locally rainiest period and peak MCS
occurrence are during the domainwide break period,
and the locally driest period coincides with the large-
scale active period. The reason for this apparent in-
congruity is that the high pressure anomaly during the
large-scale break period strengthens southwesterly flow
up the slope of the plateau, leading to orographic
lifting and convective triggering (Fig. 10). The
strong orographic enhancement in the JJAS-mean
CFADs for this region (Fig. 7) is observed only in
MCSs during the locally rainy (large-scale break)
period. CFADs for Meghalaya Plateau MCSs during
the locally dry period indicate the presence of large
ice and graupel particles in the upper troposphere in
the precipitating region, also being incorporated
into the anvils (Fig. 19), consistent with a sharp in-
crease in lightning production (Fig. 18).
c. Dry versus moist large-scale environments
Some parallels are observed between MCSs occurring
in premonsoon versus monsoon and locally dry versus
rainy periods during the monsoon. For example, the
DECEMBER 2016 V IRT S AND HOUZE 4771

strongly convective characteristics of Meghalaya Plateau
MCSs during the active monsoon (locally dry) period are
quite similar to the premonsoon MCSs (Figs. 7, 19).
Lightning production during that period, while uncertain
because of small sample size, may be even larger than
during the premonsoon (Fig. 18).Over theBay of Bengal,
contrasts in MCS structure between locally rainy and dry
periods are similar to those between the monsoon and
premonsoon, but muted (cf. Figs. 4d, 5d and 16c, 17c).
d. Comparison to MJO MCSs
Parallels are also observed between variations inMCS
characteristics during BSISO1 and the Madden–Julian
oscillation (MJO; Zhang 2005), which also varies at
30–60-day time scales but is prominent in the equatorial
belt during boreal winter. MCS behavior during the
MJO was examined by Virts and Houze (2015a). The
active periods of both oscillations are associated with
increased occurrence of large and connected MCSs and
with decreased MCS lightning production. Virts and
Houze (2015a) also noted larger convective rain frac-
tions in MCS-like features observed by TRMM during
the MJO break period, consistent with our observation
of more convective CFADs during the BSISO1 break
period. These parallels in the monsoon and MJO con-
texts illustrate the fundamental control of convective
and mesoscale behavior by the large-scale environment.
e. The 10–30-day variability
As discussed in section 1, previous studies have re-
ported 10–30-day variability during the monsoon.
Preliminary examination indicates that MCS occur-
rence and characteristics do not vary significantly
with the northward-propagating 10–30-day mode, as
represented by BSISO2 (see the online supplement
to this paper). A westward-propagating 10–30-day
oscillation has also been documented during the
summer monsoon, originating in the tropical west-
ern Pacific and associated with Rossby wave prop-
agation (Annamalai and Slingo 2001). This mode is
prominent during midsummer (Annamalai and Slingo
2001) and is primarily contained in the 25–80-day band
(Hoyos andWebster 2007). Sato (2013) and Hatsuzuka
et al. (2014) linked the 10–30-day oscillation with
heavy precipitation events over Bangladesh and the
Meghalaya Plateau; they also noted the mesoscale
organization of the convection. Thus, investigation
of MCS variability with the westward-propagating
10–30-day oscillation is warranted.
Acknowledgments. The authors thank Beth Tully for
her expert processing of the graphics and three reviewers
for their helpful comments. This work was supported by
the National Aeronautics and Space Administration
(Grant NNX13AQ37G), and the U.S. Department of
Energy Biological and Environmental Research Atmo-
spheric System Research (Grant DE-SC008452) and the
Regional andGlobal ClimateModeling programs. PNNL
is operated for DOE by Battelle Memorial Institute un-
der Contract DE-AC05-76RLO1830. Lightning location
data were provided by WWLLN (http://wwlln.net),
a collaboration of over 50 universities and institutions.
ERA-Interim data are available from the European
Centre for Medium-Range Weather Forecasts and
CloudSat data from the CloudSat Data Processing Cen-
ter, as described in the reference list.
REFERENCES
Abarca, S. F., K. L. Corbosiero, and T. J. Galarneau Jr., 2010: An
evaluation of the Worldwide Lightning Location Network
(WWLLN) using the National Lightning Detection Network
(NLDN) as ground truth. J. Geophys. Res., 115, D18206,
doi:10.1029/2009JD013411.
Annamalai, H., and J. M. Slingo, 2001: Active/break cycles: Di-
agnosis of the intraseasonal variability of the Asian summer
monsoon.ClimateDyn., 18, 85–102, doi:10.1007/s003820100161.
Biasutti, M., S. E. Yuter, C. D. Burleyson, and A. H. Sobel, 2012:
Very high resolution rainfall patterns measured by TRMM
precipitation radar: Seasonal and diurnal cycles.ClimateDyn.,
39, 239–258, doi:10.1007/s00382-011-1146-6.Cecil, D. J., and C. B. Blankenship, 2012: Toward a global clima-
tology of severe hailstorms as estimated by satellite passive
microwave imagers. J. Climate, 25, 687–703, doi:10.1175/
JCLI-D-11-00130.1.
Cetrone, J., and R. A. Houze Jr., 2009: Anvil clouds of tropical
mesoscale convective systems in monsoon regions. Quart.
J. Roy. Meteor. Soc., 135, 305–317, doi:10.1002/qj.389.
Chattopadhyay, R., B. N. Goswami, A. K. Sahai, and K. Fraedrich,
2009: Role of stratiform rainfall in modifying the northward
propagation of monsoon intraseasonal oscillation. J. Geophys.
Res., 114, D19114, doi:10.1029/2009JD011869.
Choudhury, A. D., and R. Krishnan, 2011: Dynamical response of
the South Asian monsoon trough to latent heating from
stratiform and convective precipitation. J. Atmos. Sci., 68,
1347–1363, doi:10.1175/2011JAS3705.1.
Christian, H. J., and Coauthors, 2003: Global frequency and dis-
tribution of lightning as observed from space by the Optical
Transient Detector. J. Geophys. Res., 108, 4005, doi:10.1029/
2002JD002347.
CloudSat, 2007: 2B-GEOPROF P_R04. CloudSat Data Processing
Center. Subset used: 2007–10, accessed 25 October 2014.
[Available online at http://www.cloudsat.cira.colostate.edu/
data-products/level-2b/2b-geoprof?term=42.]
Dee, D. P., and Coauthors, 2011: The ERA-Interim reanalysis:
Configuration and performance of the data assimilation system.
Quart. J. Roy. Meteor. Soc., 137, 553–597, doi:10.1002/qj.828.
ECMWF, 2009: ERA-Interim project. European Centre for
Medium-Range Weather Forecasts. Daily archive, accessed 6
November 2013. [Available online at http://apps.ecmwf.int/
datasets/data/interim-full-daily/levtype=pl/.]
Goswami, B. B., P. Mukhopadhyay, R. Mahanta, and B. N.
Goswami, 2010: Multiscale interaction with topography and
4772 JOURNAL OF THE ATMOSPHER IC SC IENCES VOLUME 73

extreme rainfall events in the northeast Indian region.
J. Geophys. Res., 115, D12114, doi:10.1029/2009JD012275.
Grossman,R. L., andD.R.Durran, 1984: Interaction of low-level flow
with theWesternGhatMountains and offshore convection in the
summer monsoon. Mon. Wea. Rev., 112, 652–672, doi:10.1175/
1520-0493(1984)112,0652:IOLLFW.2.0.CO;2.
Hartmann, D. L., and M. L. Michelsen, 1989: Intraseasonal peri-
odicities in Indian rainfall. J. Atmos. Sci., 46, 2838–2862,
doi:10.1175/1520-0469(1989)046,2838:IPIIR.2.0.CO;2.
Hatsuzuka, D., T. Yasunari, and H. Fujinami, 2014: Characteristics
of low pressure systems associated with intraseasonal oscilla-
tion of rainfall over Bangladesh during boreal summer. Mon.
Wea. Rev., 142, 4758–4774, doi:10.1175/MWR-D-13-00307.1.
Hirose, M., and K. Nakamura, 2005: Spatial and diurnal vari-
ation of precipitation systems over Asia observed by the
TRMM Precipitation Radar. J. Geophys. Res., 110,
D05106, doi:10.1029/2004JD004815.
Houze, R. A., Jr., 2014: Cloud Dynamics. 2nd ed. Elsevier, 432 pp.
——, and D. D. Churchill, 1987: Mesoscale organization and
cloud microphysics in a Bay of Bengal depression. J. Atmos.
Sci., 44, 1845–1867, doi:10.1175/1520-0469(1987)044,1845:
MOACMI.2.0.CO;2.
——, D. C. Wilton, and B. F. Smull, 2007: Monsoon convection
in the Himalayan region as seen by the TRMM Precipita-
tion Radar. Quart. J. Roy. Meteor. Soc., 133, 1389–1411,
doi:10.1002/qj.106.
Hoyos, C. D., and P. J. Webster, 2007: The role of intraseasonal
variability in the nature of Asian monsoon precipitation.
J. Climate, 20, 4402–4424, doi:10.1175/JCLI4252.1.
Johnson, R. H., and R. A. Houze Jr., 1987: Precipitating cloud
systems of the Asian monsoon. Monsoon Meteorology, Ox-
fordMonogr. Geol. Geophys., No. 7, Oxford University Press,
297–353.
Kikuchi, K., B. Wang, and Y. Kajikawa, 2012: Bimodal represen-
tation of the tropical intraseasonal oscillation. Climate Dyn.,
38, 1989–2000, doi:10.1007/s00382-011-1159-1.
Kodama, Y.-M., A. Ohta, M. Katsumata, S. Mori, S. Satoh, and
H. Ueda, 2005: Seasonal transition of predominant pre-
cipitation type and lightning activity over tropical monsoon
areas derived from TRMM observations.Geophys. Res. Lett.,
32, L14710, doi:10.1029/2005GL022986.
Krishnamurthy, V., and J. Shukla, 2007: Intraseasonal and sea-
sonally persisting patterns of Indian monsoon rainfall.
J. Climate, 20, 3–20, doi:10.1175/JCLI3981.1.Krishnamurti, T. N., and D. Subrahmanyam, 1982: The 30–50 day
mode at 850mb duringMONEX. J. Atmos. Sci., 39, 2088–2095,
doi:10.1175/1520-0469(1982)039,2088:TDMAMD.2.0.CO;2.
Kummerow, C., and Coauthors, 2001: The evolution of the
Goddard profiling algorithm (GPROF) for rainfall esti-
mation from passive microwave sensors. J. Appl. Meteor.,
40, 1801–1820, doi:10.1175/1520-0450(2001)040,1801:
TEOTGP.2.0.CO;2.
Lawrence, D. M., and P. J. Webster, 2002: The boreal summer
intraseasonal oscillation: Relationship between north-
ward and eastward movement of convection. J. Atmos.
Sci., 59, 1593–1606, doi:10.1175/1520-0469(2002)059,1593:
TBSIOR.2.0.CO;2.
L’Ecuyer, T. S., and J. H. Jiang, 2010: Touring the atmosphere
aboard the A-Train. Phys. Today, 63, 36–41, doi:10.1063/
1.3463626.
Lee, J.-Y., B. Wang, M. C. Wheeler, X. Fu, D. E. Waliser, and I.-S.
Kang, 2013a: Real-time multivariate indices for the boreal
summer intraseasonal oscillation over the Asian summer
monsoon region. Climate Dyn., 40, 493–509, doi:10.1007/
s00382-012-1544-4.
——, ——, ——, ——, ——, and ——, 2013b: Boreal summer
intraseasonal oscillation index. Accessed 15 August 2014.
[Available online at http://iprc.soest.hawaii.edu/users/jylee/
bsiso/.]
Liu, C., M. W. Moncrieff, and J. D. Tuttle, 2008: A note on prop-
agating rainfall episodes over theBay of Bengal.Quart. J. Roy.
Meteor. Soc., 134, 787–792, doi:10.1002/qj.246.
Mapes, B. E., and R. A. Houze Jr., 1993: Cloud clusters and
superclusters over the oceanic warm pool. Mon. Wea. Rev.,
121, 1398–1415, doi:10.1175/1520-0493(1993)121,1398:
CCASOT.2.0.CO;2.
Marchand, R., G. G. Mace, T. Ackerman, and G. Stephens, 2008:
Hydrometeor detection using CloudSat—An Earth-orbiting
94-GHz cloud radar. J. Atmos. Oceanic Technol., 25, 519–533,
doi:10.1175/2007JTECHA1006.1.
Medina, S., R. A. Houze Jr., A. Kumar, and D. Niyogi, 2010:
Summer monsoon convection in the Himalayan region: Ter-
rain and land cover effects. Quart. J. Roy. Meteor. Soc., 136,
593–616, doi:10.1002/qj.601.
Qie, X., X. Wu, T. Yuan, J. Bian, and D. Lu, 2014: Comprehensive
pattern of deep convective systems over the Tibetan Plateau–
South Asian monsoon region based on TRMM data.
J. Climate, 27, 6612–6626, doi:10.1175/JCLI-D-14-00076.1.
Rajeevan,M., S. Gadgil, and J. Bhate, 2010:Active and break spells
of the Indian summer monsoon. J. Earth Syst. Sci., 119, 229–
247, doi:10.1007/s12040-010-0019-4.
——, P. Rohini, K. Niranjan Kumar, J. Srinivasan, and C. K.
Unnikrishnan, 2013: A study of vertical cloud structure of the
Indian summer monsoon using CloudSat data. Climate Dyn.,
40, 637–650, doi:10.1007/s00382-012-1374-4.
Ramage, C. S., 1971: Monsoon Meteorology. International Geo-
physics Series, Vol. 15, Academic Press, 296 pp.
Rodger, C. J., J. B. Brundell, R. H. Holzworth, E. H. Lay, N. B.
Crosby, T.-Y. Huang, and M. J. Rycroft, 2009: Growing de-
tection efficiency of the World Wide Lightning Location Net-
work. AIP Conf. Proc., 1118, 15–20, doi:10.1063/1.3137706.
Romatschke, U., and R. A. Houze Jr., 2011a: Characteristics of
precipitating convective systems in the South Asian monsoon.
J. Hydrometeor., 12, 3–26, doi:10.1175/2010JHM1289.1.
——, and ——, 2011b: Characteristics of precipitating convec-
tive systems in the premonsoon season of South Asia.
J. Hydrometeor., 12, 157–180, doi:10.1175/2010JHM1311.1.
——, S.Medina, andR.A.Houze Jr., 2010: Regional, seasonal, and
diurnal variations of extreme convection in the South Asian
region. J. Climate, 23, 419–439, doi:10.1175/2009JCLI3140.1.
Rudlosky, S. D., and D. T. Shea, 2013: Evaluating WWLLN per-
formance relative to TRMM/LIS. Geophys. Res. Lett., 40,
2344–2348, doi:10.1002/grl.50428.
Sato, T., 2013: Mechanism of orographic precipitation around the
Meghalaya Plateau associated with intraseasonal oscillation
and the diurnal cycle. Mon. Wea. Rev., 141, 2451–2466,
doi:10.1175/MWR-D-12-00321.1.
Shukla, J., 1978: CISK-barotropic-baroclinic instability and the
growth of monsoon depressions. J. Atmos. Sci., 35, 495–508,
doi:10.1175/1520-0469(1978)035,0495:CBBIAT.2.0.CO;2.
Shukla, R. P., 2014: The dominant intraseasonal mode of intra-
seasonal South Asian summer monsoon. J. Geophys. Res.
Atmos., 119, 635–651, doi:10.1002/2013JD020335.
Singh, S. V., and R. H. Kripalani, 1986: Application of extended
empirical orthogonal function analysis to interrelationships
and sequential evolution of monsoon fields. Mon. Wea.
DECEMBER 2016 V IRT S AND HOUZE 4773

Rev., 114, 1603–1610, doi:10.1175/1520-0493(1986)114,1603:
AOEEOF.2.0.CO;2.
Srinivasan, J., S. Gadgil, and P. J. Webster, 1993: Meridional
propagation of large-scale monsoon convective zones.Meteor.
Atmos. Phys., 52, 15–35, doi:10.1007/BF01025750.
Stephens, G. L., and Coauthors, 2002: The CloudSat mission and
the A-train: A new dimension of space-based observations of
clouds and precipitation. Bull. Amer. Meteor. Soc., 83, 1771–1790, doi:10.1175/BAMS-83-12-1771.
Vellore, R. K., R. Krishnan, J. Pendharkar, A. D. Choudhury, and
T. P. Sabin, 2014: On the anomalous precipitation enhance-
ment over the Himalayan foothills during monsoon breaks.
Climate Dyn., 43, 2009–2031, doi:10.1007/s00382-013-2024-1.
Virts, K. S., and R. A. Houze Jr., 2015a: Variation of lightning and
convective rain fraction in mesoscale convective systems of the
MJO. J.Atmos. Sci., 72, 1932–1944, doi:10.1175/JAS-D-14-0201.1.
——, and ——, 2015b: Clouds and water vapor in the tropical tro-
popause transition layer over mesoscale convective systems.
J. Atmos. Sci., 72, 4739–4753, doi:10.1175/JAS-D-15-0122.1.
Webster, P. J., and L. C. Chou, 1980: Low-frequency transitions
of a simple monsoon system. J. Atmos. Sci., 37, 368–382,
doi:10.1175/1520-0469(1980)037,0368:LFTOAS.2.0.CO;2.
——, L. Chou, and K. M. Lau, 1977: Mechanisms effecting the
state, evolution and transition of the planetary scale monsoon.
Pure Appl. Geophys. (PAGEOPH), 115, 1463–1492, doi:10.1007/
BF00874419.
——, V. O. Magaña, T. N. Palmer, J. Shukla, R. A. Tomas,
M. Yanai, and T. Yasunari, 1998: Monsoons: Processes, pre-
dictability, and the prospects for prediction. J. Geophys. Res.,
103, 14 451–14 510, doi:10.1029/97JC02719.Wilheit, T., C. D. Kummerow, and R. Ferraro, 2003: Rainfall al-
gorithms for AMSR-E. IEEETrans. Geosci. Remote Sens., 41,
204–214, doi:10.1109/TGRS.2002.808312.
Williams, M., and R. A. Houze Jr., 1987: Satellite-observed char-
acteristics of winter monsoon cloud clusters. Mon. Wea.
Rev., 115, 505–519, doi:10.1175/1520-0493(1987)115,0505:
SOCOWM.2.0.CO;2.
Yasunari, T., 1979: Cloudiness fluctuations associated with the
Northern Hemisphere summer monsoon. J. Meteor. Soc.
Japan, 57, 227–242.
——, 1980: A quasi-stationary appearance of 30–40 day period in
the cloudiness fluctuations during the summer monsoon over
India. J. Meteor. Soc. Japan, 58, 225–229.Yuan, J., andR. A.Houze Jr., 2010: Global variability of mesoscale
convective system anvil structure from A-Train satellite data.
J. Climate, 23, 5864–5888, doi:10.1175/2010JCLI3671.1.
——, ——, and A. J. Heymsfield, 2011: Vertical structures of anvil
clouds of tropical mesoscale convective systems observed
by CloudSat. J. Atmos. Sci., 68, 1653–1674, doi:10.1175/
2011JAS3687.1.
Yuan, T., and X. Qie, 2008: Study on lightning and precipitation
characteristics before and after the onset of the South China
Sea summer monsoon. J. Geophys. Res., 113, D14101,
doi:10.1029/2007JD009382.
Yuter, S. E., and R. A. Houze Jr., 1998: The natural variability
of precipitating clouds over the western Pacific warm
pool. Quart. J. Roy. Meteor. Soc., 124, 53–99, doi:10.1002/
qj.49712454504.
Zhang, C., 2005: Madden-Julian Oscillation. Rev. of Geophys., 43,
RG2003, doi:10.1029/2004RG000158.
Zipser, E. J., 1994: Deep cumulonimbus cloud systems in the tropics
with and without lightning. Mon. Wea. Rev., 122, 1837–1851,
doi:10.1175/1520-0493(1994)122,1837:DCCSIT.2.0.CO;2.
——, and K. R. Lutz, 1994: The vertical profile of radar reflectivity of
convective cells: A strong indicator of storm intensity and light-
ning probability? Mon. Wea. Rev., 122, 1751–1759, doi:10.1175/
1520-0493(1994)122,1751:TVPORR.2.0.CO;2.
Zuidema, P., 2003: Convective clouds over the Bay of Bengal. Mon.
Wea. Rev., 131, 780–798, doi:10.1175/1520-0493(2003)131,0780:
CCOTBO.2.0.CO;2.
4774 JOURNAL OF THE ATMOSPHER IC SC IENCES VOLUME 73
Related Documents