39 YEARS 2007 Annual Report

Welcome message from author
This document is posted to help you gain knowledge. Please leave a comment to let me know what you think about it! Share it to your friends and learn new things together.
Transcript

3 9 Y E A R S
2 0 0 7 A n n u a l R e p o r tS
EA
RD
EL
INV
ES
TM
EN
T C
OR
PO
RA
TIO
N L
IMIT
ED
AN
NU
AL
RE
PO
RT
20
07
SEARDEL INVESTMENT CORPORATION LIMITED39TH ANNUAL REPORT
Seardel Report 2007 Cover 9/17/07 10:23 PM Page 1

People and property are the most important assets of the
group and the preservation and security of all are essential for
our continued growth and survival.
It is the personal responsibility of each individual, whatever
their position, to identify themselves with the group’s declared
priority of safety of life and preservation of group assets and
earnings, to recognise risks, real or anticipated, and to take
immediate action to reduce or eliminate them.
It is the responsibility of the divisional managing directors to
ensure that employee awareness programmes have been
introduced and are constantly reinforced.
The participation of all personnel is essential, and all soundly
conceived actions to achieve these objectives have the full
support of the group’s management.
• Most effective use of resources allocated to risk
management
• Manage predictable losses
• Self-insure to maximum capability consistent
with financial and shareholders’ interests
• Effective risk control programmes with continued
executive commitment
• Use of secure insurance markets to insure only
against catastrophes
Design and artwork by Creative Mix, Cape Town.Printed by Creda Communications.
Seardel Group Risk ManagementPhilosophy
Group RiskManagementStrategy
Contents 1 Financial Calendar and Administration
2 Chief Executive Officer’s Message
and Mission Statement
3 Financial Highlights
4 Corporate Structure
5 Report by the Chairman and
the Chief Executive Officer
9 Corporate History and Directors
11 Textile Division
14 Apparel and Household Textile Division
15 Office Automation and Consumer
Electronics Division
16 Toy Division
16 Nonwoven and Quilted Products
(Industrial) Division
17 Property, Travel and Export Divisions
18 Human Resources
21 Corporate Governance Report
22 Salient Financial Features
24 Seven Year Review
26 Segmental Report
27 Cash Value Added Statement
28 Employment Equity Progress Report
28 Annual Financial Statements Index
57 Analysis of Shareholders
58 Operating Divisions, Management and Locations
60 Notice of Annual General Meeting
Registration number 1968/011249/06The company's shares are listed under the Consumer Goods - Personal and Household Goods Sector of the JSE Limited.Seardel; Seardel-N; SER: ZAE000029815, SRN: ZAE000030144
Seardel Report 2007 Cover 9/17/07 10:23 PM Page 2

ANNUAL GENERAL MEETING
23 October 2007 at 10:00 at the company’s registered office.
DIVIDEND
Dividend of 12 cents per share proposed.
Last day to trade cum. dividend Friday 9 November 2007.
Ex dividend trades from Monday 12 November 2007.
Record date: Friday 16 November 2007.
Payment date: Monday 19 November 2007.
Share certificates may not be dematerialised or
rematerialised between Monday 12 November 2007 and
Friday 16 November 2007, both days inclusive.
REPORTS 2008
Interim for six months ending 31 December 2007 published
March 2008.
Annual for year ending 30 June 2008 published
September 2008.
ADMINISTRATION
REGISTERED OFFICE
2nd Floor, Seardel House, Alphen Park, Constantia Main Road,
Constantia 7806, Cape Town.
Registration number: 1968/011249/06
Postal address: Private Bag X8, Constantia 7848
Telephone: +27-21-7943600
Telefax: +27-21-7942009
E-mail: [email protected]
Internet: http://www.seardel.co.za
TRANSFER SECRETARIES
Computershare Investor Services 2004 (Pty) Limited
70 Marshall Street
Johannesburg 2001
P O Box 61051 Marshalltown 2107
Telephone: +27-11-3705000
AUDITORS
KPMG Inc.
ATTORNEYS
Edward Nathan Sonnenbergs
SECRETARY AND REGISTERED ADDRESS
L A Clohessy
2nd Floor, Seardel House, Alphen Park,
Constantia Main Road, Constantia 7806, Cape Town.
Seardel Group Financial Calendar
1
Seardel Report 2007 9/18/07 9:52 AM Page 1
Chief ExecutiveOfficer’s Message
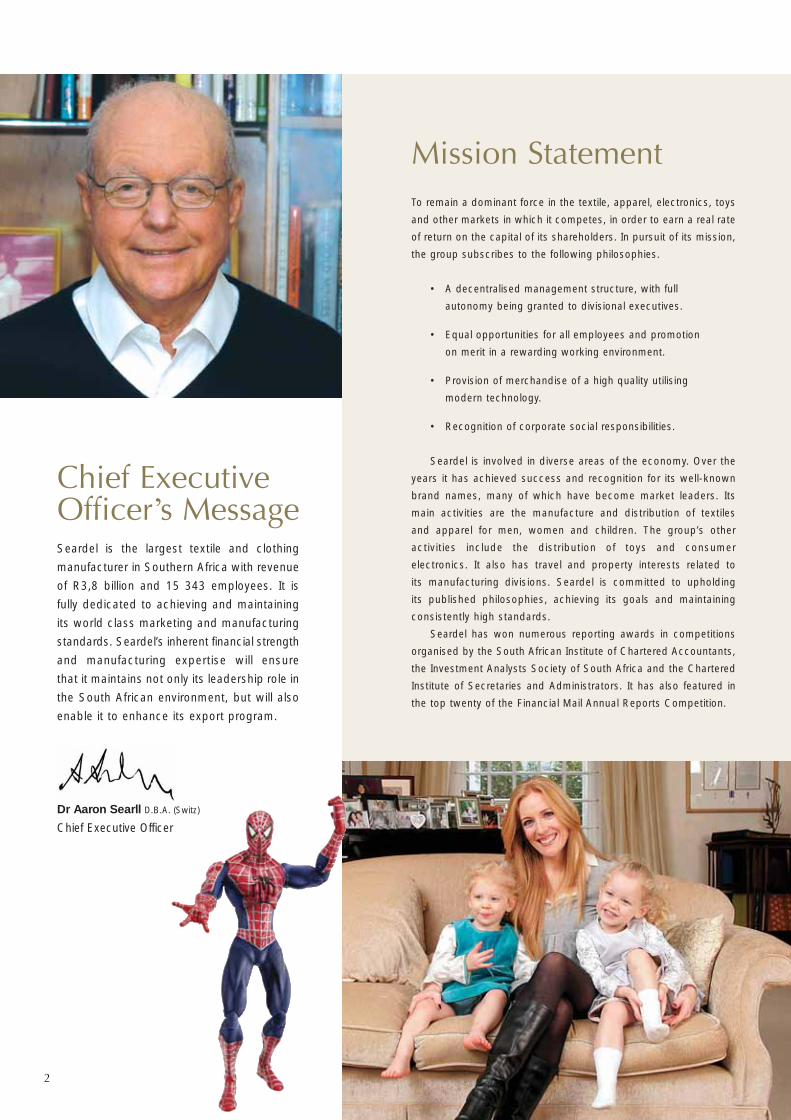
Mission StatementTo remain a dominant force in the textile, apparel, electronics, toys
and other markets in which it competes, in order to earn a real rate
of return on the capital of its shareholders. In pursuit of its mission,
the group subscribes to the following philosophies.
• A decentralised management structure, with full
autonomy being granted to divisional executives.
• Equal opportunities for all employees and promotion
on merit in a rewarding working environment.
• Provision of merchandise of a high quality utilising
modern technology.
• Recognition of corporate social responsibilities.
Seardel is involved in diverse areas of the economy. Over the
years it has achieved success and recognition for its well-known
brand names, many of which have become market leaders. Its
main activities are the manufacture and distribution of textiles
and apparel for men, women and children. The group’s other
activities include the distribution of toys and consumer
electronics. It also has travel and property interests related to
its manufacturing divisions. Seardel is committed to upholding
its published philosophies, achieving its goals and maintaining
consistently high standards.
Seardel has won numerous reporting awards in competitions
organised by the South African Institute of Chartered Accountants,
the Investment Analysts Society of South Africa and the Chartered
Institute of Secretaries and Administrators. It has also featured in
the top twenty of the Financial Mail Annual Reports Competition.
Seardel is the largest textile and clothing
manufacturer in Southern Africa with revenue
of R3,8 billion and 15 343 employees. It is
fully dedicated to achieving and maintaining
its world class marketing and manufacturing
standards. Seardel’s inherent financial strength
and manufacturing expertise will ensure
that it maintains not only its leadership role in
the South African environment, but will also
enable it to enhance its export program.
Dr Aaron Searll D.B.A. (Switz)
Chief Executive Officer
2
Seardel Report 2007 9/18/07 9:52 AM Page 2

Rand thousands, unless otherwise indicated
2007 2006 % Change
Revenue 3 793 357 3 583 702 +5,9
Profit before taxation 51 617 105 258 –51,0
Capital and reserves 1 541 093 1 373 205 +12,2
Total tangible assets (excluding cash) 2 853 994 2 473 202 +15,4
Return on total tangible assets 3,8% 6,1% –
Return on shareholders’ interest 3,3% 6,2% –
Ratio of borrowings to capital and reserves 31% 22% –
In cents, where applicable 2007 2006 % Change
Headline earnings 22,7 73,0 –68,9
Earnings 55,8 81,2 –31,3
Proposed dividend 12,0 27,0 –55,5
Proposed dividend cover on headline earnings 1,9 2,7 –29,6
Operating cash flow (150) 134 –211,9
Tangible net asset value 1 703 1 502 +13,4
Market price – 30 JuneOrdinary 750 700N Ordinary 750 670
Price range – HighOrdinary 810 700N Ordinary 825 700
Price range – LowOrdinary 651 365N Ordinary 600 350
Detailed analysis and explanations of the highlights are to be found in the chairman’s/CEO’s report on page 5 and the review of financial operations,objectives and strategies on page 30.
Financial Highlights YEAR ENDED 30 JUNE
Statistics Per Share YEAR ENDED 30 JUNE
REVENUE (rand millions) TOTAL TANGIBLE ASSETS (rand millions)
3
Seardel Report 2007 9/18/07 9:52 AM Page 3

Corporate StructureThe following, reflecting Seardel’s trading entities at 30 June 2007, are 100% owned unless otherwise stated.
DIVISIONS
Bibette
Bonwit
Brits Nonwoven
Cape UnderwearManufacturers
Charmfit
Creative Fashions
Cygnet Manufacturing Co
Dermar Design Centre
Desirée Quilted Products
• Frame Textile Group
Monviso Knitwear
Prestige ClothingManufacturers
• Seardel Group Properties
Seardel ManagementServices
South African Clothing (Durban ClothingManufacturers)
South African Clothing (Menswear)
Straton Clothing
SEARDEL INVESTMENT CORPORATION LIMITED (SEARDEL)
SEARDEL GROUP
TRADING (PTY) LTD
HARVEN
MANUFACTURING
CO (PVT)
LTD – 50%
BRITS AUTOMOTIVE
SYSTEMS (PTY)
LTD – 51%
PRIMA TOY AND LEISURE
TRADING (PTY) LTD
FRAME
INDUSTRIALS
(PTY) LTD
OCEANAIR
TRAVEL (PTY)
LTD – 55%
DIVISIONS
Sharp Electronics
Scripto
SEARTEC TRADING (PTY) LTD
74,9%
NYENYE CLOTHINGMANUFACTURERS
(PTY) LTD
The management teams and geographicallocation of these divisions can be found onpages 58 and 59. Details relating to productsand activities can be found on pages 11 to 20.
• Denotes property-owning.
A detailed list of properties is available fromthe company secretary and will be posted on request to any member of the public.
VAL HAU ET CIE
(PTY) LTD
4
Seardel Report 2007 9/18/07 9:52 AM Page 4

GROUP REVENUE, CAPITAL AND EARNINGS
The financial statements are presented in accordance with International
Financial Reporting Standards (IFRS) and in the manner required by the
Companies Act of South Africa.
Whilst the balance sheet has strengthened, profit is substantially
lower. Revenue increased marginally by 5,9% to R3,8 billion. Market
share and profit were negatively impacted by the substantial quantities
of apparel and textile imports. For the period January 2007 to May
2007, imports amounted to R5 billion, an increase of 16% over the
comparative period last year.
Net finance expenses increased by R10,5 million to R57 million, an
increase of 22,6%. This increase is the product of higher interest rates
and lower profit.
Profit before taxation amounted to R51,6 million (2006: R105,3
million), a decrease of 51%. Profit for the year attributable to
shareholders, after providing for taxation and minority interests,
amounted to R50,8 million (2006: R85,5 million), a reduction of 40,6%.
Divisions that rely on imports, namely Prima Toy & Leisure Trading and
Sharp Electronics, performed well. The benefit of the group’s
diversification strategy is evident.
The weighted average number of shares in issue during the year
amounted to 91 million (2006: 105,2 million).
Based on this number, earnings per share amounted to 55,8 cents
(2006: 81,2 cents), a reduction of 31%. Similarly, headline earnings per
share are 22,7 cents (2006: 73 cents), a decrease of 69%. The reason
for this differential is partly attributable to the goodwill realised from the
sale of the Triumph distribution, sales and marketing business.
During the year a further 528,494 ordinary shares were repurchased
and cancelled, reducing the number of shares in issue at 30 June 2007 to
92 million. A further 1,48 million shares, comprising 171,827 ordinary
shares and 1,31 million N ordinary shares were acquired during the year by
a subsidiary and are being held as treasury shares pending cancellation.
Group equity increased to R1,54 billion (2006: R1,37 billion).
Total tangible assets, excluding cash, amount to R2,9 billion
(2006: R2,5 billion). The return thereon is still well below our targeted level.
Tangible net asset value per share increased to 1 703 cents
(2006: 1 502 cents). Interest bearing borrowings increased to
R471,4 million (2006: R296,6 million) due to the increase in working
capital levels. It is anticipated that this level will reduce over the
forthcoming financial year. The borrowings to equity ratio has therefore
increased to 30,6% (2006: 21,6%).
Total employees are now 15 343 (2006: 15 170).
DIVIDEND POLICY
The group’s dividend policy reduces to 2 times cover based on headline
earnings. The board has therefore proposed the payment of a dividend
of 12 cents per share in respect of the year under review, which
proposal will require approval at the annual general meeting, to be held
during October 2007.
SOUTH AFRICAN SOCIO-ECONOMIC SCENARIO
China Voluntary Restraint Agreement
Regrettably, a range of problems and unintended consequences have
emerged from the introduction of the quota dispensation
implemented in January 2007. Whilst it must be reiterated that we
remain in favour of quantitative controls as a mechanism for
addressing disruptive surges of imports, the following areas of
concern require immediate attention.
It is becoming increasingly clear that the imposition of quotas on
fabrics was a mistake. More specifically, by introducing quotas on
fabrics required to manufacture locally produced apparel items,
whilst these same garments are not covered by quota, has created an
incentive to import ready-made garments rather than to import the
fabric and manufacture locally.
Furthermore, new sources of supply, other than China, have
emerged as a further area of concern. In percentage terms the fastest
growing sources for imports of apparel into South Africa during the first
four months of 2007 are Malaysia (560%), Sri Lanka (395%),
Myanmar/Burma (341%), Vietnam (340%) and Cambodia (335%).
An analysis of the average declared values from some of the new
5
We have pleasure in submitting our report to
shareholders on the results and activities of your group
for the year ended 30 June 2007. Group activities
comprise textile and nonwoven textile manufacturing
(industrial products), apparel manufacturing, office
automation and consumer electronics distribution, toy
distribution, travel and property investments.
Included in this report is a chart that details revenue, total
assets and the return on assets, per business segment.
Report by the Chairmanand the Chief ExecutiveOfficer
Seardel Report 2007 9/18/07 9:52 AM Page 5

emerging exporters of apparel to South Africa reflect the following:
average declared value from China was R37,02 whilst the value from
Cambodia was R34,15, from Pakistan R32,18 and from Indonesia
R31,70. These statistics may lead to further price suppression within
our domestic supply base.
The procedures applicable for companies seeking additional quota
are proving problematic. The length of time taken to complete all the
formalities has in many instances severely prejudiced the ability of our
manufacturing divisions to service the needs of their customers. This
matter is being addressed by the Quota Monitoring Committee within
the Department of Trade & Industry.
Customised Sector Programme (CSP)
Having encountered many delays and setbacks, the CSP was finally
ratified by all stakeholders, with qualified support from retail, at a recent
meeting with the Minister and Director-General of Trade & Industry. At
a subsequent cabinet meeting the CSP for the textile and clothing
value chain was approved, together with a ministerial recommendation
for funding from the Treasury. The implementation of the Key Action
Programs contained in the report is a matter of the highest priority over
the next six to twelve month period.
Interim Development Programme (DCCS Extension)
Confirmation was received from the clothing sector desk at the
Department of Trade & Industry that the current Duty Credit Certificate
Scheme (DCCS) will be extended for a period of two years, effective from
1 April 2007. A concept document, detailing the proposals of employer
constituency on a replacement program for the DCCS has been
completed and submitted to the Department of Trade & Industry. A
successor to the DCCS will have to be compliant with the regulatory
regime applicable to all member countries of the World Trade Organisation.
Apparel Performance Improvement Projects
Two performance improvement projects involving a number of our
divisions are under way in both the Western Cape and KwaZulu-Natal.
These initiatives are jointly run and supported by management and
organised labour as well as government departments at provincial level.
The focus is on improving the overall performance of participating
firms by training interventions, coaching and the introduction of
international best practice in manufacturing, human resource
management and related areas of the supply chain.
Clothing and textile clusters involving manufacturers and retailers in
the Western Cape and KwaZulu-Natal currently operate in parallel with
the performance improvement initiatives. These employer-based and
driven clusters are focused on benchmarking, value chain alignment
and best practice information dissemination.
Joint Memorandum of Understanding (MOU) with Organised
Labour
In an historical breakthrough, senior management from our Cape based
divisions were instrumental in signing a formal MOU between the trade
union and the Cape Clothing Association (CCA).
The MOU commits management, union officials, employees and
shop stewards to establish factory based project committees with the
overall purpose of reaching consensus on a range of interventions to
reach an industry-wide absenteeism average of a maximum of 5% by
the end of November 2007.
This is an encouraging development which bodes well for
the future and the ability of the industry to meet the challenges
of international competitiveness. This partnership with labour for
improving company-based performance is a goal for which we have
consistently strived for. This objective enjoys the unqualified support of
all our apparel divisions.
Broad Based Black Economic Empowerment (BBBEE)
Our divisions are engaged in an ongoing process of assessments,
audits and reporting activities in co-operation with our main retail
customers. Although there is no clothing and textile sector charter, a
pro-active approach to this important subject has been adopted. The
Department of Trade & Industry’s generic score card for Broad Based
Black Economic Empowerment (BBBEE) is being utilised as a reference
point. We are committed to co-operating with government and other
stakeholders to fulfil our obligations in meeting this important challenge.
The South African Clothing and Textiles Workers Union (SACTWU)
presently holds 19,2% of the total issued share capital. Management
continue to engage constructively with our suppliers and customers to
achieve ongoing improvement across the full spectrum of performance
areas in relation to empowerment.
During the year under review Seartec Trading (Pty) Limited (Sharp
Electronics) has become BBBEE compliant.
STRUCTURE OF THE GROUP
The group’s structure and trading divisions are listed elsewhere in this
document. The majority of the textile and clothing divisions are located
in KwaZulu-Natal and the Western Cape. Prima Toys and Sharp
Electronics are located in Gauteng and the Western Cape, and Harven
Manufacturing Company is based in Bulawayo, Zimbabwe.
ASSET PROTECTION PROGRAMME
The group complies with all the provisions of the Occupational Health &
Safety Act (OHSACT). In terms of group policy, the insured value
of the group’s assets is constantly revised in order to ensure that they
are fully protected against loss. Land and buildings have been revalued
in line with the group’s accounting policy that all properties are revalued
to comply with IFRS by an independent valuer. The group’s insurance
brokers professionally monitor the group’s self-insurance and risk
management programme. All major catastrophic risks are re-insured.
The group’s risk management philosophy and risk management
strategy appear on the inside back cover of this report.
KEY SUCCESS FACTORS
The key factors which have contributed to the success of the group
are its personnel and management, combined with excellent product
ranges, emphasis on consumer service, quality and innovative
6
Report by the Chairman andthe Chief Executive Officer
Seardel Report 2007 9/18/07 9:52 AM Page 6

merchandise and customer relationships of long standing. Employees
are encouraged to increase their skills levels by attending courses at
technikons and universities, for which bursaries are available, and are
helped to realise their full potential in a challenging and invigorating work
environment. Management and staff are fully committed to the group’s
stated objectives, good corporate governance, its risk management
philosophy and its mission statement, all of which are contained in
published documents.
HUMAN RESOURCES AND EMPOWERMENT
It has always been group policy to be an equal opportunity employer.
Promotion and succession planning are therefore on merit at all levels
of activity. Skills transfer and empowerment are being addressed within
this framework. A detailed report on this important aspect of group
activity appears under its own heading in this document.
ENVIRONMENTAL ISSUES, TECHNOLOGY, RESEARCH AND
DEVELOPMENT
Our textile divisions are ISO 9001/2000 accredited and some have
attained ISO14000. This process continues. We hope to achieve this
level in all divisions during the 2008 financial year. We continue with our
initiative together with the University of KwaZulu-Natal to meet the
concept of cleaner textile production and waste minimisation. This
accreditation is now an integral part of our management culture.
It is our inherent passion and respect for the environment, as well
as the health of all people within our factories and their surrounding
areas, which motivates us to find new ways of reducing energy usage,
while producing less waste. This leads to cost savings and an ever
improving environment.
In order to maintain its leadership role in the areas in which it
operates, the group has maintained its level of investment in the latest
technology and new equipment. Seardel constantly strives to ensure
that its products are environmentally friendly and non-toxic, and
continues to ensure that it has the manufacturing capacity and
technological expertise to meet customer demands.
All new equipment is designed to exceed international
environmental impact parameters. Existing plant and equipment is
constantly upgraded. The group’s long-term planning and investment
program ensures that it has access to the cutting edge of technology
and that it is able to manufacture products that are not harmful to the
environment.
Our commitment to improve the environment is evidenced by our
donations policy, which provides funds to organisations such as the
Fairest Cape Association, the Endangered Wildlife Trust and the World
Wildlife Foundation, amongst others.
Our continuous efforts towards improving our environmental
conditions, as well as our progress on the recycling of renewable and
non-renewable resources, earned us a bronze medal for the KwaZulu-
Natal region, as well as the gold medal for innovation. Furthermore we
are proud to have achieved a reduction in the emission of CO2 and
other gases and energy inputs, resulting in CO2 emission reduction by
16 000 tons, H20 by 21 000 kl, SO2 by 147 tons and coal by 8 000
tons during the year.
While our initiatives show commitment to responsible corporate
environmental management, they will also result in stabilising our
energy costs.
PROSPECTS FOR THE 2008 FINANCIAL YEAR
We will focus on the achievement of the following strategic
objectives:
• Increasing market share for our product ranges;
• Improving profit margins by focusing on quality and niche offerings;
• Reducing debt and improving returns on assets and equity
through realisations of surplus property assets and the
rationalisation of poor performing profit centres and divisions.
Revenue for the first two months of the 2008 financial year
amounts to R653 million, an increase of 6,7% compared with last year.
The year ahead is again expected to be a challenging one, however
we are pleased to announce that the group has been appointed as
the exclusive manufacturing and distribution entity in respect of
specific branded apparel products for the FIFA 2010 World Cup. This
agreement runs through to the end of 2010.
7
Seardel Report 2007 9/18/07 9:52 AM Page 7

ACKNOWLEDGMENTSWe would like to express our appreciation and thanks to ourcolleagues on the board, executives, managing directors, theirmanagement teams and all employees for their efforts, loyalty, co-operation and support during the past year. These are bothrecognised and appreciated.
Our thanks to our customers and suppliers for their support, ourbankers for their co-operation, assistance and service and ourauditors, legal advisors and consultants for conscientiously carryingout their duties.
NEIL LAZARUS AARON SEARLL(Chairman) (Chief Executive Officer)Cape Town25 September 2007
8
Report by the Chairman andthe Chief Executive Officer
REVENUE, TOTAL TANGIBLE ASSETS (excluding cash) AND RETURN ON TOTAL TANGIBLE ASSETS
Segment Revenue Total tangible assets Return on total tangible assets
2007 2006 2007 2006 2007 2006Rm % Rm % Rm % Rm % % %
Textiles 1 453 38 1 384 39 1 370 48 1 240 50 3 5
Apparel andhousehold textiles 1 749 46 1 651 46 1 087 38 850 35 3 5
Office automation andconsumer electronics 208 6 213 6 157 6 168 7 12 14
Toys 220 6 177 5 119 4 86 3 24 24
Industrial products 163 4 159 4 121 4 129 5 (3) 6
R3 793 100 R3 584 100 R2 854 100 R2 473 100 4 6
2005 R3 745 R2 435 5
2004 R3 794 R2 328 8
2003 R4 031 R2 433 7
Seardel Report 2007 9/18/07 9:53 AM Page 8
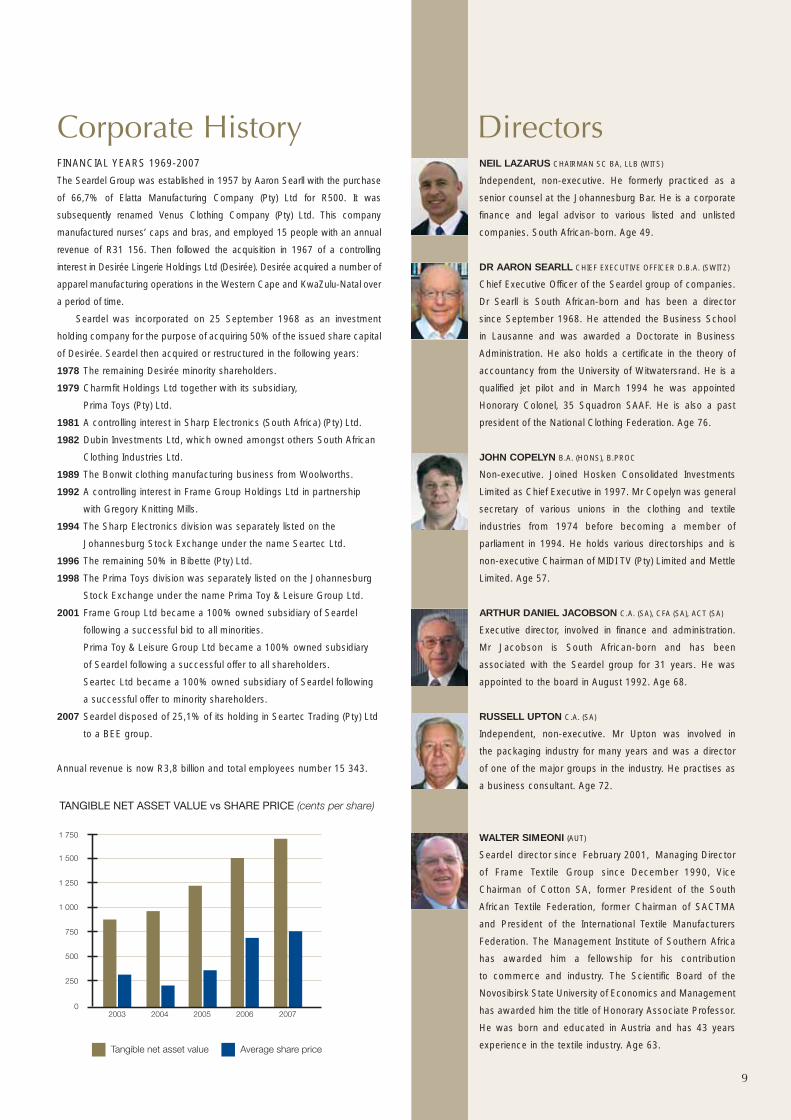
NEIL LAZARUS CHAIRMAN SC BA, LLB (WITS)
Independent, non-executive. He formerly practiced as a
senior counsel at the Johannesburg Bar. He is a corporate
finance and legal advisor to various listed and unlisted
companies. South African-born. Age 49.
DR AARON SEARLL CHIEF EXECUTIVE OFFICER D.B.A. (SWITZ)
Chief Executive Officer of the Seardel group of companies.
Dr Searll is South African-born and has been a director
since September 1968. He attended the Business School
in Lausanne and was awarded a Doctorate in Business
Administration. He also holds a certificate in the theory of
accountancy from the University of Witwatersrand. He is a
qualified jet pilot and in March 1994 he was appointed
Honorary Colonel, 35 Squadron SAAF. He is also a past
president of the National Clothing Federation. Age 76.
JOHN COPELYN B.A. (HONS), B.PROC
Non-executive. Joined Hosken Consolidated Investments
Limited as Chief Executive in 1997. Mr Copelyn was general
secretary of various unions in the clothing and textile
industries from 1974 before becoming a member of
parliament in 1994. He holds various directorships and is
non-executive Chairman of MIDI TV (Pty) Limited and Mettle
Limited. Age 57.
ARTHUR DANIEL JACOBSON C.A. (SA), CFA (SA), ACT (SA)
Executive director, involved in finance and administration.
Mr Jacobson is South African-born and has been
associated with the Seardel group for 31 years. He was
appointed to the board in August 1992. Age 68.
RUSSELL UPTON C.A. (SA)
Independent, non-executive. Mr Upton was involved in
the packaging industry for many years and was a director
of one of the major groups in the industry. He practises as
a business consultant. Age 72.
WALTER SIMEONI (AUT)
Seardel director since February 2001, Managing Director
of Frame Textile Group since December 1990, Vice
Chairman of Cotton SA, former President of the South
African Textile Federation, former Chairman of SACTMA
and President of the International Textile Manufacturers
Federation. The Management Institute of Southern Africa
has awarded him a fellowship for his contribution
to commerce and industry. The Scientific Board of the
Novosibirsk State University of Economics and Management
has awarded him the title of Honorary Associate Professor.
He was born and educated in Austria and has 43 years
experience in the textile industry. Age 63.
DirectorsFINANCIAL YEARS 1969-2007
The Seardel Group was established in 1957 by Aaron Searll with the purchase
of 66,7% of Elatta Manufacturing Company (Pty) Ltd for R500. It was
subsequently renamed Venus Clothing Company (Pty) Ltd. This company
manufactured nurses’ caps and bras, and employed 15 people with an annual
revenue of R31 156. Then followed the acquisition in 1967 of a controlling
interest in Desirée Lingerie Holdings Ltd (Desirée). Desirée acquired a number of
apparel manufacturing operations in the Western Cape and KwaZulu-Natal over
a period of time.
Seardel was incorporated on 25 September 1968 as an investment
holding company for the purpose of acquiring 50% of the issued share capital
of Desirée. Seardel then acquired or restructured in the following years:
1978 The remaining Desirée minority shareholders.
1979 Charmfit Holdings Ltd together with its subsidiary,
Prima Toys (Pty) Ltd.
1981 A controlling interest in Sharp Electronics (South Africa) (Pty) Ltd.
1982 Dubin Investments Ltd, which owned amongst others South African
Clothing Industries Ltd.
1989 The Bonwit clothing manufacturing business from Woolworths.
1992 A controlling interest in Frame Group Holdings Ltd in partnership
with Gregory Knitting Mills.
1994 The Sharp Electronics division was separately listed on the
Johannesburg Stock Exchange under the name Seartec Ltd.
1996 The remaining 50% in Bibette (Pty) Ltd.
1998 The Prima Toys division was separately listed on the Johannesburg
Stock Exchange under the name Prima Toy & Leisure Group Ltd.
2001 Frame Group Ltd became a 100% owned subsidiary of Seardel
following a successful bid to all minorities.
Prima Toy & Leisure Group Ltd became a 100% owned subsidiary
of Seardel following a successful offer to all shareholders.
Seartec Ltd became a 100% owned subsidiary of Seardel following
a successful offer to minority shareholders.
2007 Seardel disposed of 25,1% of its holding in Seartec Trading (Pty) Ltd
to a BEE group.
Annual revenue is now R3,8 billion and total employees number 15 343.
Corporate History
9
Seardel Report 2007 9/18/07 9:53 AM Page 9

10
Seardel Report 2007 9/18/07 9:53 AM Page 10

Textile DivisionCONTRIBUTION TO: REVENUE 38% (2006: 39%)
PROFIT FROM OPERATIONS 31% (2006: 39%)
A Searll (Chairman), W Simeoni (Managing director).
Textile manufacturers distributing under various brand names, the
main ones being: Budget Blanket, Colours to Dye For, Cotton Co,
Desert Song, Double Life, Fibreline, Fine Weave, Fabella Fabrics,
Gold Reef, Hextex, Hexwoven, Horrockses, Masters, Masters
Exclusive, Merino Master Pieces, Parker Wool, Rainbow Babies,
Romatuft and Thermocoustex.
OVERVIEW BY WALTER SIMEONI, MANAGING DIRECTOR
THE DIVISION
Frame Textile Group, one of the largest textile manufacturers in Sub-
Saharan Africa, produces a wide spectrum of textile products using
a multitude of different technology applications. The product range
includes yarns made from wool and cotton, as well as blends thereof
in a wide range of counts. The fabric forming divisions use circular
knitting, weaving and nonwoven technologies to produce substrates,
which cater for the apparel, denim, workwear, industrial, medical,
household and technical textile markets, both locally and internationally.
A chemical division produces precursor materials for the adhesive,
paint, water treatment and textile industries.
RESULTS
The year under review was marked by unpredictable dynamics which in
many cases, in spite of extraordinary steps already taken in the previous
year to manage change more adequately, resulted in a disappointing
financial performance.
Major contributors were the continuous rise of imports and the lack
of achieving required price points, which are determined by Chinese
products, as well as massive increases in raw material costs.
The value of textile imports for the period January 2007 to May
2007 compared to the same period of the previous year grew by 30%,
with imports of garments for the same period being a staggering 150
million units, of which 79% or 119 million units originated from China in
spite of the introduction of quotas as from 1st January 2007. While
volumes tell one story, it is the continuation of low prices for these
imported products, which at times are lower than the international
cost of yarn required to produce such garments and/or textile
products. This clearly points to uneven playing fields, even under
World Trade Organisation rules. Different cost support systems vary
strongly between one country and another. These distortions create
challenges which we will counteract with our strategy to supply our
customers with a total value package, consisting of cost-effective
solutions for the local and SADC garment industry, if compared to the
total value of imported merchandise.
Such solutions consist of delivering high quality products at all
times; giving customers instant recourse to any queries; giving
customers peace of mind that only European Union accredited input
materials are used, which are safe, and that our division, which is
ISO 14000 and ISO 9001 accredited, conforms to the highest
environmental and employment standards while developing speciality
products together with our customers. We also provide our customers
with the ability to communicate instantly within the same time periods
and give them access to credit without the need for the costly banking
facilities required for the establishment of a letter of credit.
While we were able to increase revenue by 4,6%, operating income
reduced by 41%. Prudent cash management and higher interest rates
resulted in an increase in net finance income, which resulted in an
improvement of 67% in net income before tax.
The main reason for the reduction in operating income was our
inability to recover raw material price increases, which on a year by year
basis skyrocketed with increases in cotton lint of 47%, polyester 27%,
acrylic 55%, viscose 45%, wool 59%, dyes and chemicals by 21%, to
mention just the major ones. We raised the likelihood of this scenario in
last year’s report, a prediction which unfortunately became reality much
quicker and more aggressively than anticipated.
The inability to pass on these raw material price increases to our
yarn and fabric customers resulted in losses which suppressed the
otherwise satisfactory performance of other divisions.
“When you put a limit on what you will do,you put a limit on what you can do.”
- Charles Schwab.
Going forward in the new financial year, the pressure will continue,
but two options for radical strategic intervention will address the issue.
These interventions are expected to improve our operating income,
cash flow and RONA considerably, but in both cases the desired result
will only materialise over the next twelve months, starting in 2008.
Return on gross assets and capital employed are not at the target
levels. The balance sheet, however, remains strong, showing both a
healthy operating cash flow, as well as a commendable cash balance.
Capital expenditure at R34,5 million was spent wisely on plant,
which once installed will assist in improving conversion costs as well as
being designed to recycle and minimise expensive raw material waste.
Over the last few years we have reported that the implementation
of the Customised Sector Program (CSP) will be imminent, but we
regret to report that although a meeting with the Minister of Trade and
Industry in July 2007 confirmed that the CSP will finally come into being,
it remains to be seen whether we will be lucky this time.
HUMAN RESOURCES
The need for productivity improvements, activated by strong
competition from imported goods, necessitated a further manpower
reduction of 5,3%, from 3 590 to 3 400 employees.
When compared to the previous year, the group’s absenteeism
decreased marginally from 3,14% to 3,09%, while the average monthly
labour turnover increased from 0,82% to 0,97%.
Man hours lost during the year, at 10 475 hours, decreased by 33%
compared to the previous year. 85% of these man hour losses occurred
at the Worsted division in the Western Cape.
Refer to the Human Resources report on page 18.
11
Seardel Report 2007 9/18/07 9:53 AM Page 11

Textile Division
“It is not good to know more, unless we do more with what we already know.”
- R K Bergethon
TRAINING
We continue to progress with our objective of providing our employees
with superior knowledge, through the previously stated special
association with one of Europe’s leading Textile Technical Universities as
well as a link up to Europe’s leading Textile Research Institute.
A close relationship with Europe’s foremost Natural Fibres Research
Institute for renewable sources is yielding promising results in the
development of new products.
All these initiatives, together with the provision of 5 635 training
activities, the majority executed by our in-house training college
during the year under review, which include Textile N-Study Courses,
Textile Apprenticeships, Engineering Apprenticeships, Technikon Textile
Students and SADFA Courses, as well as external and special courses
overseas which have and will continue to ensure that our employees are
not starved of knowledge.
The group is a keen participant in the textile industry’s learnership
program and has since its inception registered 520 learners, of which
389 have been certified, 42 are now ready for certification and 86 are
still in training.
EXPORTS
At R106 million or 6,8% of the group’s turnover, direct and indirect
exports were only 1,3% higher than in the previous year due to the
continuous strength of our currency and the Chinese syndrome
experienced in all countries into which we export our products.
IMPORTS
As stated at the outset, imports continued to rise, thereby creating
challenges, which are being addressed.
ENVIRONMENT
Both ISO 9001/2000, as well as ISO 14001 are now well entrenched in
the majority of our plants. It is our inherent passion and respect for the
environment, as well as the health of all people within our factories and
their surrounding areas, which stimulates us to find new ways of
reducing energy usage, while producing less waste. All of this leads to
cost savings and an ever improving environment.
FUTURE TRADING
Our strategic intervention, which follows a two prong strategy,
consisting of realigning employment structures and costs, as well as
embarking on some major capital investment programs, will only start
showing effect in the second half of the 2007/2008 financial year, with
full benefits becoming visible by the end of 2008.
In the meantime additional productivity improvements have been
implemented across all business units.
While many retailers and garment manufacturers complain
bitterly about the negative impact the China quota has on them, the
fact remains that there are too many entities in South Africa who are
still involved in corrupt and illegal activities by clearing their goods
under wrong tariff headings, misusing rebate facilities, under-
invoicing and arranging round tripping, all of these designed to
defraud SARS. If all those who are involved in these criminal
activities would themselves become honest participants in the
economy, then Customs’ job would become easier, and government
would be able to interfere less, while those who are honest would
see the benefit.
The fact remains that Chinese imports combined for textiles and
clothing for the period January to May 2007 remained virtually at
the same level than in the previous year, reducing only slightly from
R2,24 billion by 3,6% if compared to the same period of the previous
year. While total imports for this period increased from R4,3 billion by
16% to R5,0 billion, with textile imports increasing from R2,1 billion in
the previous year by 10%.
The above data clearly illustrates that no party really suffered arising
out of the China quota concept. However, it is a reality that prices from
other Eastern countries are between 10% and 15% more expensive,
being more attuned to the real world of global dynamics. In South Africa
we must realise that even stricter measures/quotas have been
implemented in the USA, EU, Brazil and Turkey, to mention just a few.
In all these countries the local textile industry is also not able to produce
everything, so it is important to note that the government’s intervention
is not extraordinary. In terms of quality, South Africa gets full marks for
those products which are produced locally.
While our budget for the new financial year shows a much better
financial performance, its realisation will depend on the level of success
we achieve with the implementation of our new strategy.
APPRECIATION
Management has to be thanked for their perseverance in pursuing and
seeking new avenues in spite of challenges which, at times, looked
impossible to overcome. It is our culture of believing that there is an
answer to every negative occurrence which forms the backbone of
this division.
I would also like to thank the Chairman and the group’s Chief
Executive Officer, as well as the executive team, for their support and
belief that the job, no matter how challenging, can be done. To all
our staff and colleagues in whatever positions, as well as those
working at the coal face, I say thank you for your understanding that
times are tough.
To our suppliers and service providers, thank you for your continued
support and commitment to our partnership and your contribution
towards the sustainability of our competitiveness.
To our Trade Unions, thank you for understanding the challenges
and for having a realistic view of the industry’s concerns.
To our customers, thank you for your loyalty, cooperative spirit and
understanding that having a textile and garment industry at your
doorstep is an asset not many countries have at their disposal.
12
Seardel Report 2007 9/18/07 9:53 AM Page 12

I sincerely hope that our mature textile value chain will never face the
regret of having only realised the value of our industry after the entity
ceases to exist. In South Africa there is more than sufficient space for
a fair portion of imports to live next to the local supplier base.
“An optimist may see a light where there is none, but why must the
pessimist always run to blow it out.”- Michel De Saint-Pierre
13
Seardel Report 2007 9/18/07 9:53 AM Page 13

CONTRIBUTION TO REVENUE 46% (2006: 46%)
PROFIT FROM OPERATIONS 29% (2006: 27%)
This division consists of the following manufacturing units:
Bibette; Bonwit; Cape Underwear Manufacturers (incorporating
Straton Clothing, Creative Fashions and Val Hau et Cie (Pty) Limited);
Charmfit; Cygnet Manufacturing Company; Dermar Design Centre;
Monviso Knitwear; Little Number; Prestige Clothing Manufacturers;
South African Clothing Industries (incorporating Cambridge Shirts,
Durban Clothing Manufacturers and Zenith Clothing); Speedo SA.
Chief executives and divisional directors of the above divisions
are detailed on pages 58 and 59, together with their brand and
trade names.
Due to the huge quantities of imports from the Far East, the clothing
divisions of the group encountered extremely tough and difficult
trading conditions, with margins under severe pressure. In order to
retain market share and protect niche markets, the divisions have
concentrated on quick turnarounds, short production runs, design
inputs and tightening up on delivery times. The group provides
customers with a service that we believe cannot be obtained from
Far Eastern suppliers.
Factory efficiencies have been maintained at high levels and every
effort has been made to contain working capital increases. Several
entities have increased the importation of core garments from low
cost manufacturing areas, provided that these do not conflict with
in-house production.
Once again, innovative fabrics, style development and quality
control were enhanced in order to main the group’s customer base.
The household textile division has maintained its market share.
The group has the capacity and the personnel to improve
its results going forward and in order to do so it will continue to invest
in technology to maintain its competitive edge. Manufacturing plants
have been consolidated and relocated, where necessary.
Notwithstanding all of the above, all divisions reported that retailers
were comparing price levels with those of Far Eastern suppliers.
Please refer to the Human Resources section of this document for
an in-depth analysis of the group’s management equity plans and
structured training programs. We believe that by increasing awareness
amongst staff, improving their skills and the service that we offer to local
retailers, we will counter to some extent the constant flood of cheap
products being sourced off-shore.
The group has been appointed the official licensed manufacturer
and distributor for specific apparel products for the FIFA 2010
World Cup.
Management wishes to express its thanks to all levels of employees
for their dedication and commitment to our group throughout the year.
Their efforts are much appreciated.
Apparel and Household Textile Division
14
Seardel Report 2007 9/18/07 9:53 AM Page 14

Sharp Electronics and Scripto – Divisions of Seartec
Trading (Pty) Ltd (74,9% held)
CONTRIBUTIONS TO: REVENUE 6% (2006: 6%)
PROFIT FROM OPERATIONS 17% (2006: 15%)
CHIEF EXECUTIVES: DR G C DE BRUIN
(EXECUTIVE DEPUTY CHAIRMAN),
MR T J S ATKINSON (MANAGING DIRECTOR).
Brand names and products: Sharp, Scripto, Musashi,
Inoxcrom, Rotomac, Zebra.
Sharp Products: Coin and note counting machines, digital
photocopiers and related accessories, electronic cash
registers and ‘point of sale’ systems, electronic calculators,
electronic organisers, fax machines, microwave ovens, solar
(photovoltaic) panels.
Scripto Products: Inoxcrom, Rotomac and Zebra writing
instruments; rulers, clutch pencils and erasers; Back-To-
School multipacks; various other stationery products.
The division’s revenue and operating profit were lower than
the previous year due mainly to reduced sales and margins in
respect of microwave ovens and fax machines. The ranges of
these products will be reduced to those models which provide
an acceptable return. Sharp calculators are the premium brand
in the country, and Seartec was awarded the accolade of
having sold more scientific calculators in Southern Africa than
any other distributor world-wide, and showed good growth.
Margins, however, have been under slight pressure. The range
of colour-enabled copiers was launched early in the year but
has not yet achieved a large enough impact, although the
business is growing.
Sharp has released a number of new printer-based
networking products which should enable us to improve market
share. Among these products is a copier which can exceed
100 copies per minute. The Sharp division has not been able to
compete in this sector before, and we have great expectations.
The Scripto writing instruments division, whose major line is
Sharp calculators, performed well in spite of turnover being the
same as the previous year. Expense management was reflected
in excellent contribution growth.
The working capital management continues to be good, with
stock and debtors well controlled. Cash flow was satisfactory.
At the date of this report the company had received the first
substantial order for solar panels from one of the largest installers in
the country. This bodes well for the future of this product group, as
Sharp is the world’s largest manufacturer of premium quality solar
panels and has also been in the industry for more than 40 years.
This division entered into a BEE transaction, effective from
26 January 2007, whereby 25,1% of the business was acquired
by the Thesele Group. By so doing, the company achieved a
Category 5 BEE status and BEE Procurement Level of 80%. The
effects of this transaction will be felt in the new financial year.
Office Automationand ConsumerElectronics Division
15
Sello Moloko (Executive Chairman: Thesele Group) and Chris de Bruin (Deputy Chairman: Seartec)
Solar panel:ND-80E2EA
Solar panel:NU-S5E3E
Solar panel:NE152AR
Seardel Report 2007 9/18/07 9:53 AM Page 15

Toy DivisionPRIMA TOY AND LEISURE TRADING (PTY) LIMITED
CONTRIBUTION TO: REVENUE 6% (2006: 5%)
PROFIT FROM OPERATIONS 26% (2006: 14%)
Chief executives: S H Diamond (Chairman),
J Diamond (Managing director).
The company is involved in the manufacture and distribution of a wide
range of toys, games and stationery to retail chains and allied outlets
nationally. Prima acts as the exclusive distributor for most of the leading
international manufacturers, as well as licensee for a variety of
international and local brands and characters.
The major products supplied by Prima include: action toys, activity
games, back to school stationery, balloons, balls, beach toys, books,
character figurines, children's computers, colour and activity books, die
cast cars, dolls, DVD Games, educational toys, electronic games and
toys, gifting stationery, gifts, marbles, paper, partyware, plastic sports
equipment, plastic toys, plush characters and teddies, puzzles, reading
books, ride-ons, robotics, soft toys, and SOHO stationery.
The leading brands and characters distributed by the company
include: Baby Amore, Baby Annabel, Baby Born, Barbie, Barney,
B-Loony, Brainy Baby, Bratz, Butterfly, Cabbage Patch Kids, Cluedo,
Cranium Games, Disney, Empire Books, Fur Real, Furby, Gotcha, Guess
Who, Island Style, Jenga, Juke Box Trivia, Life's a Beach, Littlest Pet
Shop, Majorette, Marvel Heroes, Mastermind, Mega Bloks, Monopoly,
Monster in my Pocket, Mouse Trap, My Little Pony, Paperchase, Pirates
of the Carribean, Playdoh, Pooh, Power Rangers, Puppy in my Pocket,
Risk, Robosapien, Rummikub, Shrek, Spider-Man, Teenage Mutant
Ninja Turtles, Tonka, Transformers, Trivial Pursuit, Twister, WWE.
Prima has established itself as the leading distributor of toys and
games in South Africa in terms of overall market share as well as
in the number of international toy brands entrusted to the company.
Notwithstanding this position, Prima is constantly on the lookout for
new and exciting products and characters to enhance its already
extensive range.
Prima has enjoyed an excellent year of trading. Management
remains committed to maximising all opportunities available and
working closely with its customers to the mutual benefit of all parties.
We record, with much pride, that Prima celebrates its 40th
anniversary this year.
CONTRIBUTION TO: REVENUE 4% (2006: 4%)
PROFIT FROM OPERATIONS -3% (2006: 5%)
Chief executives: Dr G C De Bruin (Chairman); C K Capstick-Dale
and E Haller (respective managing directors of Brits Nonwoven
and Desirée Quilted Products).
Manufacturers, retailing under brand names: Blossom Fill,
Britbond, Britfill, Cloud Nine, Contour Comfort, Contour Fill,
Diweld, Durafil, Fibreform, Fibreskin, Firesista, Homecreations By
Desirée, Isotherm, Loomtex, Polyair, Royal Contour, Royal
Plumage, Summer Cotton, Thermostar, Ultrabond.
BRITS NONWOVEN
Despite increasing sales by 5,4%, the division posted disappointing
results and continues to be adversely affected by very strong
competitor activity coupled with an over-supply situation in Gauteng.
This scenario precludes price increases. Management has carried out
an in-depth analysis of the division and a proposed restructure has
been discussed and approved in principle. This will be implemented
during the course of the 2008 financial year and will hopefully
produce substantially improved returns. In the interim corrective
measures have been instituted where required, which will add to the
projected turnaround.
Brits Automotive Systems also encountered difficult markets, but
the customer base has accepted price increases, which should result
in a positive turnaround in the forthcoming year.
DESIREE QUILTED PRODUCTS
This division posted a significantly reduced trading result due to the
inability to pass on to its customers the higher raw material costs
resulting from higher oil and polyester prices, a weaker currency and
insufficient import quota.
Desiree Quilted Products is lauded by its retail customers as
an excellent supply base. It manufactures product ranges comprising
duvets, quilts, pillows and other bedroom accessories of an
exceptionally high quality.
The division exhibits outstanding asset management and factory
efficiencies and, with a very committed management and workforce,
expects an improved trading year despite competitive forces.
Nonwoven and Quilted Products (Industrial) Division
16
Seardel Report 2007 9/18/07 9:53 AM Page 16

PROPERTY DIVISION
Chief executive: A Keller (Managing director).
The book value of group properties amounts to approximately
R515,2 million and the insured replacement thereof amounts to
R2,0 billion. The group’s operating divisions are housed mainly in its
own properties. A structured maintenance program is in place, with
the emphasis on good housekeeping, and training therefore includes
fire prevention, security and safety. These procedures are monitored
by the group’s insurers and are fully endorsed by senior management.
The group’s properties were revalued by an independent valuer in
June 2007.
A detailed list of the group’s property portfolio is available from the
group secretary should any shareholder or member of the public require it.
TRAVEL DIVISION
Chief executive: B Kolb (Managing director).
Travel Agencies: Operating in the Cape, KwaZulu-Natal and
Gauteng.
The past twelve months’ results have been the best achieved by the
Oceanair Travel group. Profit before tax increased by 45% when
compared with the previous year. This was due largely to an overall
increase in revenue earned in the Johannesburg branch. Most of the
group’s revenue is now earned from fees charged to clients and from
override commission earned from suppliers. The Johannesburg branch
met their targets throughout the year and in all four quarters earned
substantial overrides.
Expenses increased by 15%, which was predominantly influenced
by the need to increase consultant salaries in line with market trends.
Because of the pressure under which consultants work, and the
penalties that are invoked by airlines for errors they incur, there was
a sharp decrease in the availability of experienced travel consultants.
This of course led to an increased demand for those consultants with
experience. Oceanair has addressed this issue by further implementing
across the board training in both travel-related and auxiliary subjects.
During the year, the group was appointed as travel management
coordinators for a large medical aid scheme; this is a substantial
account, and was obtained after fierce rivalry with the larger
multinationals. This good news however must be tempered with the
potential loss of one of our largest accounts.
Last year we reported on the changes in our revenue stream.
We can now report that clients have accepted these changes and are
becoming accustomed to pay for our services. This has the added
benefit that our staff does not get involved with clients from whom we
do not earn revenue. It has also forced us to reduce the offer of a
debtors account, and convert clients on to a credit card payment
mechanism. This has resulted in an extremely positive cash flow.
Oceanair Travel contracted Empowerdex to perform an independent
black broad based economic empowerment scenario simulation. Based
on their current BBBEE the company is seen as a level 6 contributor with
a 60% procurement recognition level as per the codes of good practice.
Currently Oceanair Travel is committed to put into place various changes
in their shareholding, which should increase their status to that of a level
4 contributor with a 100% procurement recognition level.
We continue to be acutely aware that the internet is both a tool
as well as a competitor. We are currently upgrading our website
and introducing an enhanced booking tool to counter the increase in
direct internet bookings.
Property, Travel and Export Divisions
17
EXPORTS
The wide range of products manufactured by Seardel’s factories enables
it to provide a broad base from which international customers can source
their requirements. The group’s main trading partners are compatible
in terms of time frames, language, business ethics, practices and
communication systems. High quality and delivery standards, short runs,
flexibility and quick response times have been improved in order to
counter the threat of Far Eastern suppliers. Combined with product
innovation, design input, modern production facilities and commitment
to excellence, the above compatibilities have always enabled Seardel
to compete in international markets. In recent times, however, the
strength of the Rand has inhibited export growth and development,
resulting in a reduction in volumes.
Seardel’s apparel divisions have no difficulty in complying with the
WRAP programme (Worldwide Responsible Apparel Production) of the
American Apparel and Footwear Association.
Once again, local retailers used the Rand’s strength to import
products direct. Exports of apparel and textiles decreased marginally
to R166 million, constituting 4,3% of group revenue, compared to 4,9%
last year. Direct textile exports increased by 43,2% to R66,2 million.
The group’s long-term objective with regard to exports remains at
25% of production.
Seardel Report 2007 9/18/07 9:53 AM Page 17
SOCIAL RESPONSIBILITIES
The group continues to make contributions to charitable, religious,
environmental protection and social organisations, specifically in the
areas in which it operates. Financial bequests were allocated to
approximately 100 applicants across the entire spectrum during the
year under review. The major recipients are too numerous to list, but
stakeholders who require a schedule thereof are requested to
communicate with the company secretary, who will provide the
information. The environmental impact of the group’s products is fully
dealt with in the report by the Chairman and CEO.
The Frame group, despite difficult trading conditions in the industry,
continues to contribute to and support charitable, religious,
environmental protection and social organisations in the areas in which
we operate. A total of 69 needy organisations were supported by the
Frame group during the financial year. The Frame group’s social
responsibility program includes the involvement of management and
staff in the respective divisions actively participating in their adopted
charities. Their involvement includes giving of their own time to provide
services and support to their adopted charities. We are proud in the
knowledge that the Frame group social responsibility program has
made a difference in the lives of those who are less fortunate.
Seardel employs 15,343 people. Of these 1,260 are placed in
managerial and administrative positions, 945 in promotion and sales,
and the balance in production. The group is an equal opportunity
employer. It subscribes fully to its published mission statement, a copy
of which appears in the front of this document. Disabled persons are
offered employment wherever possible. Seardel contributes significantly
to medical aid schemes, housing loan schemes, personal insurance plans
and retirement benefit funds, with bursary facilities available to employees
wishing to further their education at Technikon or university level. The
group prides itself on being pro-active in instituting innovative personnel
practices. Please also refer to the Directors’ Report and the cash value
added statements for the analysis of the total remuneration bill.
Conformance with all legislated requirements, such as the Basic
Conditions of Employment Act, the Skills Development Act, the Labour
Relations Act and the Employment Equity Act, is practised and driven
by the chief executive officers of each division, always mindful that
allocation of responsibilities must be competency based while taking
care of succession planning.
FRAME TEXTILE GROUP
Manpower
The continued efforts to increase productivity, development of skills,
automation and implementation of capital projects have resulted in a
further reduction in employment numbers during the financial year.
Employment numbers reduced by 5,3% from 3 590 to 3 400 during the
reporting period. The ongoing need to improve productivity is driven by
increased challenges and competition from imported goods.
While absenteeism and labour turnover in the Group are within
industry norms, we have recorded an increase in the average monthly
labour turnover from 0.82% in the previous financial year to 0.97% in
the reporting financial year.
The increase in labour turnover has, in the main, been ascribed to
external factors and has affected the group’s Western Cape divisions.
The labour turnover in the KwaZulu-based divisions has remained
constant when compared with the previous years. Absenteeism in the
group reduced marginally from 3,14% in the previous financial year to
3,09% in the reporting financial year.
The Employment Equity Act has been implemented and
representative Employment Equity Committees operate within the
group. Each committee is responsible for drawing up their Employment
Equity plans and numeric targets for their committees. Progress in
terms of the plans is monitored by the respective committees, under the
guidance of the group employment equity manager. Statutory returns
have been submitted timeously to the Department of Labour since the
inception of the act in 2000. All queries have been handled, and there
are no outstanding queries from the Department of Labour in respect of
our Group Employment Equity Returns.
42% of our employees are female and 92% of our employees are
black as defined in the Employment Equity Act. White males constitute
5,7% of the group’s employees. 23% of our managers are black.
The Broad Based Black Economic Empowerment (BBBEE) Codes
of Good Practice were gazetted in February 2007. A committee has
been established to implement the Codes of Good Practice throughout
the group. The committee is in the process of finalising the BBBEE
scorecard for the group.
Industrial relations
The group has once again enjoyed a year of minimal disruptions related
to industrial relations issues. 10 475 man hours were lost during the
year which is a decrease of 33% when compared with the previous
year. The man hours lost during the year constitute 0,1% of the total
available man hours worked in the Group.
Annual wage negotiations in the different divisions of the group
were held in a responsible manner this year. With the exception of the
knitting and chemical divisions, negotiations were settled timeously and
without disputes being declared.
Negotiations in all divisions have been settled and we were not
affected by any industrial or strike action related to wages this year.
With the exception of the knitting division, all other textile divisions’
Human Resources
18
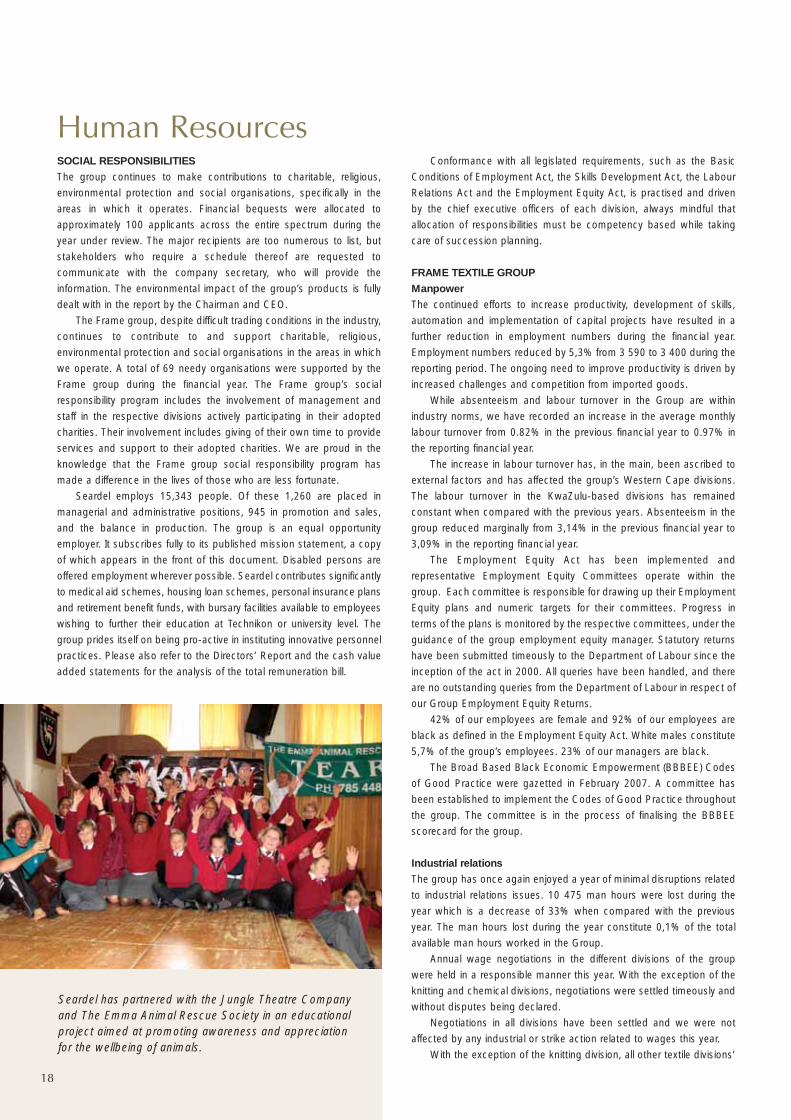
Seardel has partnered with the Jungle Theatre Companyand The Emma Animal Rescue Society in an educationalproject aimed at promoting awareness and appreciationfor the wellbeing of animals.
Seardel Report 2007 9/18/07 9:53 AM Page 18

negotiations are held in the respective sub-sectors of the National
Textile Bargaining Council. These agreements are extended to non-
parties. The gazetting, in February 2007, of the National Textile
Bargaining Council Main Agreement and Annexures provides for the
legal extension and enforcement of these agreements to non-parties.
The Southern African Clothing and Textile Workers Union (SACTWU)
is the recognised and representative trade union within the Frame Textile
Group. Membership of SACTWU has remained constant during the
year and the group’s relationship with SACTWU continues to be sound.
The efforts made by SACTWU to protect the textile industry
are recognised and appreciated by the Frame group and employers in
the Textile Industry.
Training and development
During the 2007 financial year, the Frame group continued to invest
in the development of its people, with a wide range of skills
programs being offered both internally and externally. A number
of employees were involved in specialised development, with
37 being enrolled for studies through Technisa, 8 being registered on
textile/engineering apprenticeships, 10 undertaking Textile Technologist
studies at the technikons and 9 being registered on SADFA courses. Of
particular interest this year has been the focus on developing high level
technologist skills via a six week program run by the Technical University
of Liberec in the Czech Republic. The first group of four employees
went on the dry process course in September 2006 while the second
group of five employees went on the wet process course in January
2007. All did extremely well, and obtained certificates after passing the
program’s examinations. A number of Frame’s managers went on a
Mandarin course where they were exposed to the intricacies of the
Chinese language. Production management has also been important,
with an increasing number of employees being registered on long
courses through the Universities of Technology. In addition, a significant
number of people have been supported on tertiary education programs
ranging from MBLs to degrees and short, work-focused courses.
To date the group has registered over 520 individuals on the textile
learnership program, of which 250 were previously unemployed. 389
have completed their learnerships and have received their National
Certificates in General Textiles. The key benefit of the program for the
group is that we are able to continually upgrade our workforce by
training and developing a significant number of young people with
matriculation mathematics and science who will eventually provide a
pool from which future supervisors and managers will be selected.
A number of learners have already progressed to both the Textile
Technology program and into apprenticeships.
In total, 6 250 training incidents took place in the group this year. In
addition to the above, these have been focused on statutory training,
operator training and, significantly, on all aspects of environmentally
friendly manufacturing. The HIV/Aids awareness programs have also
been important too as the group strives to play its part in combating the
pandemic. Underpinning the whole training process has been our
ongoing development of a wide range of specialist technical manuals.
During the period a number of accreditations took place.
• The CTFL Sectoral Education and Training Authority (SETA)
accredited Frame New Germany, Texfin and Frame Manchester.
• Merseta audited the accreditation of both Frame New Germany and
Texfin to enable us to continue training engineering apprentices.
• The Transport SETA (TETA) accredited Frame New Germany to
continue conducting lifting equipment training.
• A number of training staff completed their SAQA related programs
and registered as assessors and/or moderators with the CTFL
SETA, the Merseta, the TETA and the ETDP SETA.
Finally, the group continues to provide major input to the Clothing,
Textile, Footwear and Leather SETA, at both national and regional
levels. Frame thanks the SETA, which has provided our group with a
number of discretionary funded bursaries for Learnerships,
Production Management, Supervisor Development, Moderators and
Textile Technology.
Risk management
The Frame Textile Group continues to be committed to the health and
safety of its employees and assets. The concept of continual improvement
is applied and the risk management program strives to commit themselves
to this concept. The program provides for safety, health, environment, fire
defense, security and, a recent addition, engineering safety.
The New Germany and Mobeni sites have retained their ISO 14001
certification with no major findings recorded against either site. External
audits by Factory & Industrial, which have been ongoing over the past
four years, were completed in the first half of this year and all sites are
between 98,21% and 99,73% compliant. A Safety Action Survey
System has been implemented throughout the group in order to audit
and improve health and safety related issues. The Safety Action Survey
System is a risk rated system, according to the HSEC consequence
severity table. These internal surveys are conducted in each division.
Internal audits performed by the Group Risk Management
Department are done on the basis of laying the foundations of the
ISO 18000 concepts. These audits look at matters of policy and
procedure, appointments, training, health and safety representatives,
risk committees, workplace environment and facilities, incident
investigations, hazardous work, electrical and mechanical
safeguarding, legal inspections, hazardous chemicals, personal
protective equipment management, contractor management and
COID management. Within these audits the clinics are also audited
along with canteens and their management.
In compliance with relevant legislation, health audits have also been
initiated, which includes the direct involvement of the clinic staff in the risk
management program. Management of the Group’s major hazardous
installations is also in hand, with all recommendations being enforced.
A close working relationship has also been established between
Group Risk Management and the respective divisions with major
emphasis on engineering related matters. Increased emphasis on risk
management and the involvement of all employees in the management
of risk in their areas has resulted in continual improvement in risk
management program within the group.
CLOTHING DIVISIONS
In the year under review the core strategy of the group’s clothing
divisions has remained the reduction of unit labour costs to enable
effective competition with both foreign and domestic manufacturers.
Specifically directed interventions to achieve improved labour
productivity have therefore taken place both at sector and enterprise
level. In the latter case, although overall total employment has remained
relatively constant, it has necessitated significant organisational
restructuring including the relocation of production facilities.
19
Seardel Report 2007 9/18/07 9:53 AM Page 19

Industrial relations
At sector level the National Bargaining Council for the Clothing
Manufacturing Industry (NBC) provides the regulatory framework for the
achievement of the group’s core strategy. Unfortunately it continues to
be unable to provide the necessary labour market interventions,
specifically the adoption of a coherent labour cost structure, which
reflects the highly competitive nature of clothing manufacturing. This
failure is compounded by widespread non-compliance with NBC
minimum wages and other conditions of employment. Although the
NBC actively seeks to address this unfair competition the group’s
divisions remain prejudiced by the fact that approximately more than
half the sector’s employers still pay below the minimum wage.
The annual increase to total labour cost negotiated at the NBC of
5,5% in the metro areas and 8% in the non-metro areas is therefore
difficult to justify unless linked to clear productivity improvement
initiatives. In the case of non-metro, labour costs have now increased
since the formation of the NBC by over 50% in what is an increasingly
price driven market.
Overall the industrial relations climate within the group’s clothing
divisions remains positive. In the year under review the group enjoyed
relative labour peace with a 15% reduction in lost time work stoppages
compared to the previous year. Inevitably, however, with the extensive
relocation and re-organisation of the group’s production facilities there
has at least in the short-term been some effect on employee morale.
Training and development
The skills development of employees at all levels remains key to the
achievement of the group's core strategy. In pursuance of this strategy
divisional executives actively participate in the SETA and in the
formulation of the SETA’s rolling three year Sectoral Skills Plan to which
Divisional Works Place Skills Plans are aligned. Divisional Works Place
Skills Plans are also integrated into Employment Equity Programs and,
in the case of the group’s exporting divisions, the training requirement
of the Textile and Clothing Interim Development Programme (TCIDP).
Training interventions undertaken have focused primarily at
supervisory and operator level and are directed towards supervisory
development, multi-skilling and Adult Basic Education (ABET).
Employment equity
The group’s clothing divisions remain committed to taking affirmative
steps to ensure the provision of equal opportunities for all employees
at all levels.
Structured Equal Opportunity Programs (EOPs) are implemented
in each division specifically to advance those employees from
disadvantaged educational environments or backgrounds. Bridging and
management development programs are provided as well as financial
assistance for part-time study at University, Technikon or private college
through correspondence or day release.
Each division has a five year rolling Employment Equity Plan which
is reviewed annually and reported upon to the Department of Labour. In
the year under review divisions were assessed by the Department of
Labour and their progress was ranked as most satisfactory. These
plans detail workforce profile by occupational category by designated
group movement within the workforce of designated groups together
with the training received by them as well as progress towards
achievement of numerical goals by occupational category.
It is gratifying that across divisions over 50% of employees at
management level are from designated groups as defined in the
Employment Equity Act and across all occupation levels the figure
is over 90%.
In the absence of an industry charter, the clothing divisions continue
to use the Department of Trade and Industry (DTI) balanced scorecard
as a template to measure compliance with the DTI’s Broad Based Black
Economic Empowerment (BBBEE) guidelines. It is likely with impending
legislative changes that these self audits will be replaced by external
audits. Currently, divisional performance is ranked as satisfactory and
a plan is being finalised to achieve a certain level of BBBEE compliance
by 2012.
Risk management
The group’s clothing divisions are committed to the promotion of
health and safety of employees and the protection of assets. A risk
management program covering fire, security, health and safety is in
place in all divisions. Over the last three years annual external audits
on all aspects of risk management have indicated an improvement
from just under 75% to approximately 94%. It is anticipated that this
improvement will be maintained.
The year ahead
The focus in the year ahead will remain firmly on the need to be
globally competitive. It is therefore imperative that at sectoral level
the NBC provides an appropriate regulatory framework to enable the
achievement of this objective. Continuing production relocation and
rationalisation can be foreseen if this proves not to be the case.
Human Resources
20
Seardel Report 2007 9/18/07 9:53 AM Page 20

The directors and senior management endorse the Code of Corporate
Practices and Conduct contained in the King Reports on corporate
governance. By supporting the code, the directors have recognised the
need to conduct the group’s affairs with integrity and in accordance with
generally accepted corporate practices.
The directors acknowledge and accept full responsibility for the
financial information contained in this annual report. They have made
the necessary appointments to ensure that the group’s operations
conform to its published mission statement and to the
implementation of all its internal control procedures. They subscribe
to the philosophy of transparent, fair, reliable and easily
understandable reporting to stakeholders. This objective has already
been achieved, as is evidenced by the numerous awards that the
group has received from independent and prestigious bodies for its
financial reporting.
Please refer to the management report on page 29.
The board of Seardel consists of six directors, details of whom
appear on page 9 of this report. Three are non-executive, namely
Mr N N Lazarus, Mr R Upton and Mr J Copelyn. Mr Lazarus and
Mr Upton are also independent. This allows for an independent and
objective analysis of major issues.
Based on the detailed information made available to the directors,
they are firmly of the opinion that the group is, and will continue to be,
a going concern for the foreseeable future.
The remuneration committee, which comprises Mr N N Lazarus
(Chairman), Dr A Searll and Mr J Copelyn, approves the remuneration
and terms of employment of all directors and senior management.
There are no long-term appointments of directors, all of whom are
subject to re-election every three years. Directors’ emoluments and
share options are to be found in the relevant note to the financial
statements on page 53 and their detailed shareholdings are reflected in
the Directors’ Report on page 35.
The directors, as guardians of the group’s assets, have a duty to
ensure their proper use and protection. To this end, they have
instituted risk management and self-insurance procedures within
professionally produced and acceptable parameters, which have, to
a large extent, smoothed the volatile nature of the short-term
insurance market. The inherent strength of the group has enabled it
to adopt a sophisticated, well-managed self-insurance scheme,
which has resulted in substantial savings in premiums over the past
few years.
The group’s insurance broker, Heritage Insurance Brokers (Pty)
Limited, professionally monitors its self-insurance and risk management
program. All major risks are reinsured, and emphasis on good
housekeeping principles and compliance with the provisions of the
Occupational Health and Safety Act ensures the keenest possible
insurance rates. There are stringent levels to the exposures created
by the scheme, and catastrophe risks are always reinsured. The insured
value of the group’s assets is constantly reassessed to ensure that they
are fully protected against loss.
The periodic review of the group’s accounting procedures, controls
and all matters relating thereto is one of the functions of the
audit committee.
The audit committee consists of Mr R Upton (Chairman) and
Mr N N Lazarus. The audit committee sets the principles surrounding
the use of the external auditors for non-audit services. The group’s
internal audit division is used for the textile division. The clothing,
consumer electronics and toy divisions internal audit has been
outsourced to KPMG Risk Advisory Services.
The group has always been an equal opportunity employer,
with promotion on merit. The issue of affirmative action is therefore
encompassed within this philosophy.
.
Corporate Governance Report
21
Seardel Report 2007 9/18/07 9:53 AM Page 21

Business segment 2007 2006 2005 2004 2003 2002
Textiles 48 50 53 58 58 59
Apparel and household textiles 38 35 34 30 30 30
Office automation and consumer electronics 6 7 6 6 6 6
Toys 4 3 3 3 3 2
Industrial products 4 5 4 3 3 3
100 100 100 100 100 100
HEADLINE EARNINGS AND PROPOSED DIVIDENDS (cents per share)
Salient Financial Features
Textiles 48%
Apparel and household textiles 38%
Office automationand consumer electronics 6%
Toys 4%
Industrial products 4%
PROFIT MARGINS (% of revenue)REVENUE (rand millions)
EMPLOYMENT OF TANGIBLE ASSETS - EXCLUDING CASH
EMPLOYMENT OF TANGIBLE ASSETS %
22
Seardel Report 2007 9/18/07 9:53 AM Page 22
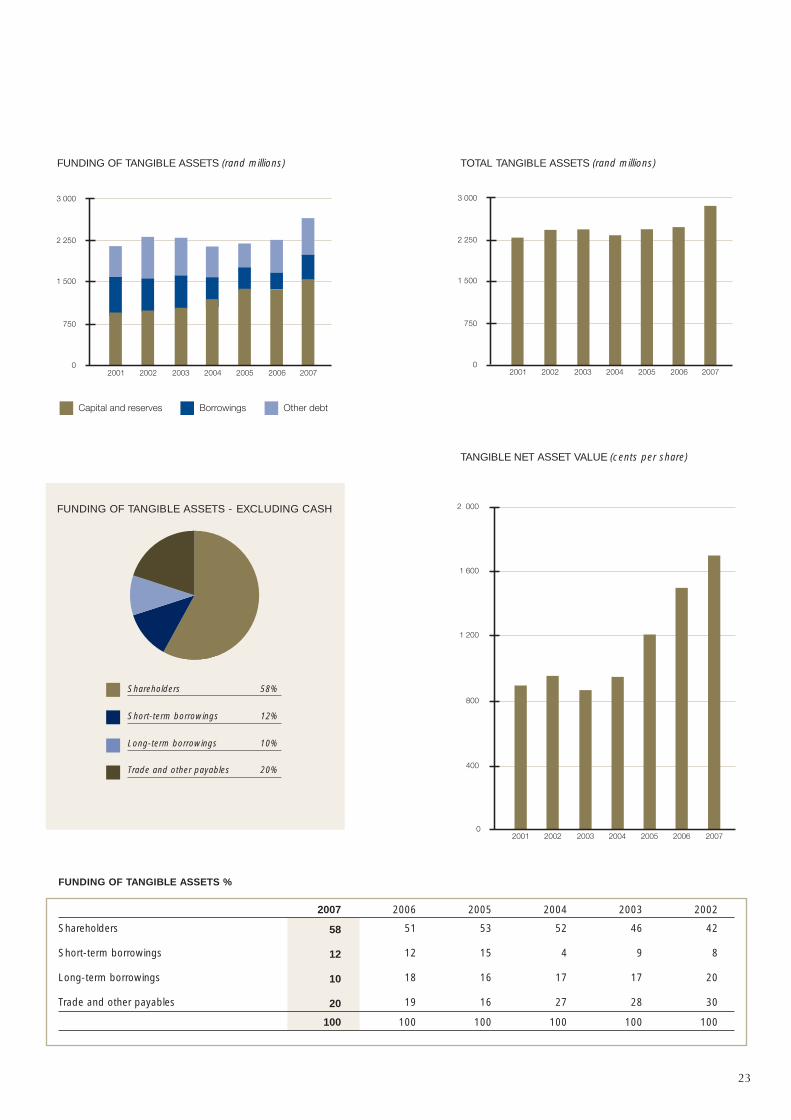
Shareholders 58%
Short-term borrowings 12%
Long-term borrowings 10%
Trade and other payables 20%
FUNDING OF TANGIBLE ASSETS - EXCLUDING CASH
2007 2006 2005 2004 2003 2002
Shareholders 58 51 53 52 46 42
Short-term borrowings 12 12 15 4 9 8
Long-term borrowings 10 18 16 17 17 20
Trade and other payables 20 19 16 27 28 30
100 100 100 100 100 100
TOTAL TANGIBLE ASSETS (rand millions)FUNDING OF TANGIBLE ASSETS (rand millions)
FUNDING OF TANGIBLE ASSETS %
23
TANGIBLE NET ASSET VALUE (cents per share)
Seardel Report 2007 9/18/07 9:53 AM Page 23

(RAND THOUSANDS)
OPERATIONS
Revenue
Operating profit before finance costsNet finance costsShare of losses from joint venture
Profit before taxationTaxation
Profit for the yearProfit attributable to shareholders
CASH FLOW (RAND THOUSANDS)
Net cash flowCash generated from operations – nominalCash (utilised) retained before expansion of operationsNet cash (outflow) inflow from investing activitiesOperating cash flow per share (cents)
FINANCIAL POSITION (RAND THOUSANDS)
Capital and reserves (including negative goodwill)Net borrowingsOther debt (excluding deferred liabilities)Working capitalTotal assets (excluding cash)
RATIOS
ProfitabilityOperating profit as percentage of revenueProfit for the year as percentage of revenueReturn on total assetsReturn on investmentsReturn on shareholders’ interest
LeverageRatio of borrowings to capital and reservesRatio of debt to capital and reserves
LiquidityCurrent ratioSolvency ratioFinance charges cover
ProductivityTotal assets turnNumber of employeesRevenue per employee (Rand)Operating profit per employee (Rand)Assets per employee (Rand)Cash value added factor
SHARE STATISTICS (Refer to page 57 for analysis of shareholders)
Weighted average number of shares issued (000)Headline earnings per share (cents)Earnings per share (cents)Proposed dividendHeadline earnings yield at 30 JuneDividend yield at 30 JuneProposed dividend coverNet asset value per share (cents) – excluding intangible assetsTotal number of shares traded (000)Total value of shares traded (R000)Total number of share transactionsPercentage of issued shares tradedMarket price (cents)– highest – ordinary
– highest – N ordinary– lowest – ordinary– lowest – N ordinary– year end – ordinary– year end – N ordinary
DEFINITIONSThe following definitions have been used in computing the ratios and statistics set out in the seven year reviewopposite, and also in the review of objective and strategieson page 30.
NET CASH FLOWIncome before taxation plus depreciation, less the cashelements of taxation and dividend.
RETURN ON TOTAL TANGIBLE ASSETSThe percentage of the aggregate of operating profit andattributable earnings of associated entities and jointventures, to total tangible assets (excluding cash).
RETURN ON SHAREHOLDERS’ INTERESTThe percentage of earnings attributable to shareholders(before amortisation of negative goodwill), to capital andreserves (including negative goodwill).
RATIO OF BORROWINGS TO CAPITAL ANDRESERVESThe total of interest-bearing liabilities to capital and reserves.
RATIO OF DEBT TO CAPITAL AND RESERVESThe ratio of total liabilities net of cash resources, excludingdeferred liabilities, to capital and reserves.
CURRENT RATIOThe ratio of current assets to current liabilities.
SOLVENCY RATIOThe percentage of net cash flow to total liabilities, excludingdeferred liabilities.
FINANCE CHARGES COVERThe number of times that net finance charges are coveredby operating income.
CASH VALUE ADDED FACTORThe percentage of value added to cost of materials andservices purchased.
DIVIDEND COVERHeadline earnings per share divided by the distribution/dividend declared.
HEADLINE EARNINGS PER SHAREHeadline earnings attributable to shareholders divided bythe weighted average number of shares in issue.
NET ASSET VALUE PER SHAREShareholders’ interest, excluding intangible assets, dividedby the net number of shares in issue.
CAG %This is the compounded annual growth rate for the six yearperiod 2001-2007.
PRIOR YEAR FIGURES No IFRS or prior year adjustments have been made in the2001-2004 years.
Seven Year ReviewYEAR ENDED 30 JUNE
24
Seardel Report 2007 9/18/07 9:53 AM Page 24

CAG% 2007 2006 2005 2004 2003 2002 2001
6,8% 3 793 357 3 583 702 3 745 145 3 793 586 4 031 047 3 564 173 2 550 245
(1,5%) 111 668 152 276 129 210 214 811 209 925 254 084 121 953(3,4%) 57 078 46 572 56 030 83 033 97 141 111 908 70 269
2 973 446 – – – – –
(3,0%) 51 617 105 258 73 180 131 778 112 784 142 176 61 954855 18 841 23 10 045 21 380 24 020 9 890
50 762 86 417 73 157 121 733 91 404 118 156 52 06450 770 85 471 73 255 121 733 91 404 118 156 52 018
98 201 159 902 98 899 218 076 208 639 208 703 85 730 (161 019) 128 246 102 863 243 284 300 579 325 460 160 973 (165 648) 132 806 68 107 153 245 10 941 71 050 76 338
(4 629) 4 560 (34 756) (78 830) (109 627) (90 652) (424 944)(150) 134 99 195 111 156 73
8,2% 1 541 093 1 373 205 1 394 782 1 217 068 1 111 713 1 023 075 959 136 (4,5%) 471 391 296 571 319 368 341 118 493 668 548 748 619 798 0,2% 625 349 588 023 500 047 627 305 689 555 730 547 617 6294,4% 887 150 817 179 850 251 916 568 788 989 734 793 684 9583,8% 2 853 994 2 473 202 2 435 313 2 328 400 2 433 207 2 424 820 2 284 908
2,9% 4,2% 3,5% 4,7% 4,3% 6,1% 4,1%1,3% 2,4% 2,0% 3,2% 2,3% 3,3% 2,0%3,8% 6,1% 5,3% 7,7% 7,2% 9,0% 5,0%1,8% 3,5% 3,0% 3,7% 2,3% 3,5% 1,0%3,3% 6,2% 5,2% 7,4% 5,1% 8,1% 3,6%
31% 22% 23% 28% 44% 53% 65%71% 64% 58% 80% 106% 125% 129%
1,9 2,0 2,2 2,2 1,9 1,8 1,87,9% 15,1% 7,2% 19,1% 16,2% 15,1% 6,2%2,0 3,3 2,3 2,6 2,2 2,3 1,7
1,3 1,4 1,5 1,6 1,7 1,5 1,1(2,3%) 15 343 15 170 15 280 16 925 17 192 16 317 17 6429,4% 247 237 236 236 245 101 224 141 234 472 218 433 144 5552,8% 7 278 10 038 8 456 12 692 12 211 13 418 6 1746,2% 186 013 163 032 159 379 137 572 141 531 148 878 129 515
55% 69% 65% 62% 50% 63% 82%
91 015 105 224 122 362 128 215 114 795 107 134 107 13422,7 73,0 58,6 66,0 71,8 75,9 33,955,8 81,2 58,3 94,9 79,6 110,3 48,6
17,8% 12,0 27,0 11,0 14,0 14,0 15,0 4,53,0% 10,6% 16,4% 30,7% 21,5% 32,3% 17,9%1,6% 4,0% 3,0% 6,5% 4,4% 6,4% 2,2%1,9 2,7 5,3 4,7 5,1 5,1 7,5
11,3% 1 703 1 502 1 212 949 866 955 8957 136 36 715 31 137 11 309 13 028 45 022 18 449
49 384 173 247 86 883 27 448 42 466 95 368 29 571565 1 222 1 382 590 500 578 8907,8 39,3 25,4 8,8 11,3 42,0 17,0
810 700 430 335 420 270 259825 700 425 330 415 280 200651 365 205 185 200 192 132600 350 181 200 215 167 122750 700 360 215 330 220 229750 670 370 215 314 240 200
operationsvities
odwill)
ysis of shareholders)
(000)
g intangible assets
25
Seardel Report 2007 9/18/07 9:53 AM Page 25

Segmental Report AUDITED
26
Rand thousands 2007
OfficeApparel and automationhousehold & consumer Industrial
BUSINESS SEGMENTS Textiles textiles electronics Toys products Total Segment revenueExternal sales 1 517 200 1 749 105 208 726 219 749 162 952 3 857 732 Inter-segment sales (these transactions are at arms length) (64 375) – – – – (64 375)
1 452 825 1 749 105 208 726 219 749 162 952 3 793 357
Segment resultsOperating profit 34 406 33 134 18 782 29 025 (3 679) 111 668
Segment assets 1 369 470 1 090 673 157 122 119 217 121 427 2 857 909 Property, plant and equipment 703 290 335 755 5 553 2 668 24 312 1 071 578 Intangible assets – 3 915 – – – 3 915 Interest in equity accounted joint venture – – – – 16 473 16 473 Investments – 2 352 – – – 2 352 Long-term receivables – 633 41 843 – 13 028 55 504 Inventory 320 687 338 199 54 462 42 146 32 625 788 119 Trade and other receivables 318 750 409 819 55 264 74 403 34 989 893 225 Assets held for disposal 26 743 – – – – 26 743
Segment liabilities 286 626 293 174 36 561 46 750 23 056 686 167 Deferred liabilities 70 400 – – – – 70 400 Trade and other payables - including provisions 216 226 293 174 36 561 46 750 23 056 615 767
Depreciation 42 944 22 358 2 673 695 3 334 72 004 Impairments 7 272 81 – – – 7 353 Capital expenditure 34 546 31 061 1 133 658 3 202 70 600
GEOGRAPHICAL SEGMENTS BASEDON LOCATION OF CUSTOMERSRevenue form external customersSouth Africa 1 386 614 1 649 026 208 726 218 519 161 688 3 624 573 Direct exports 66 211 100 079 – 1 230 1 264 168 784
R1 452 825 R1 749 105 R208 726 R219 749 R162 952 R3 793 357
2006
BUSINESS SEGMENTSSegment revenueExternal sales 1 450 291 1 651 356 212 598 177 533 158 698 3 650 476 Inter-segment sales (these transactions are at arms length) (66 774) – – – – (66 774)
1 383 517 1 651 356 212 598 177 533 158 698 3 583 702
Segment resultsOperating profit 58 658 41 560 23 505 20 857 7 696 152 276
Segment assets 1 240 343 849 839 167 403 86 327 129 290 2 473 202 Property, plant and equipment 650 477 260 288 7 309 2 759 24 911 945 744 Interest in equity accounted joint venture – – – – 10 896 10 896 Investments – 1 801 – – – 1 801 Long-term receivables – 10 008 46 498 – 957 57 463 Inventory 280 867 340 920 52 730 32 558 20 953 728 028 Trade and other receivables 281 258 236 822 60 866 51 010 71 573 701 529 Assets held for disposal 27 741 – – – – 27 741
Segment liabilities 273 157 272 614 46 598 32 716 25 508 650 593 Deferred liabilities 67 754 – 320 – – 68 074 Trade and other payables - including provisions 205 403 272 614 46 278 32 716 25 508 582 519
Depreciation 42 611 21 491 2 534 537 4 304 71 477Impairments – 542 – – – 542 Reversal of impairments 6 190 – – – – 6 190 Capital expenditure 29 494 24 080 1 571 537 34 077 89 759
GEOGRAPHICAL SEGMENTS BASEDON LOCATION OF CUSTOMERSRevenue form external customersSouth Africa 1 337 265 1 523 305 212 598 177 533 158 698 3 409 399 Direct exports 46 252 128 051 – – – 174 303
R1 383 517 R1 651 356 R212 598 R177 533 R158 698 R3 583 702
Seardel Report 2007 9/18/07 9:53 AM Page 26
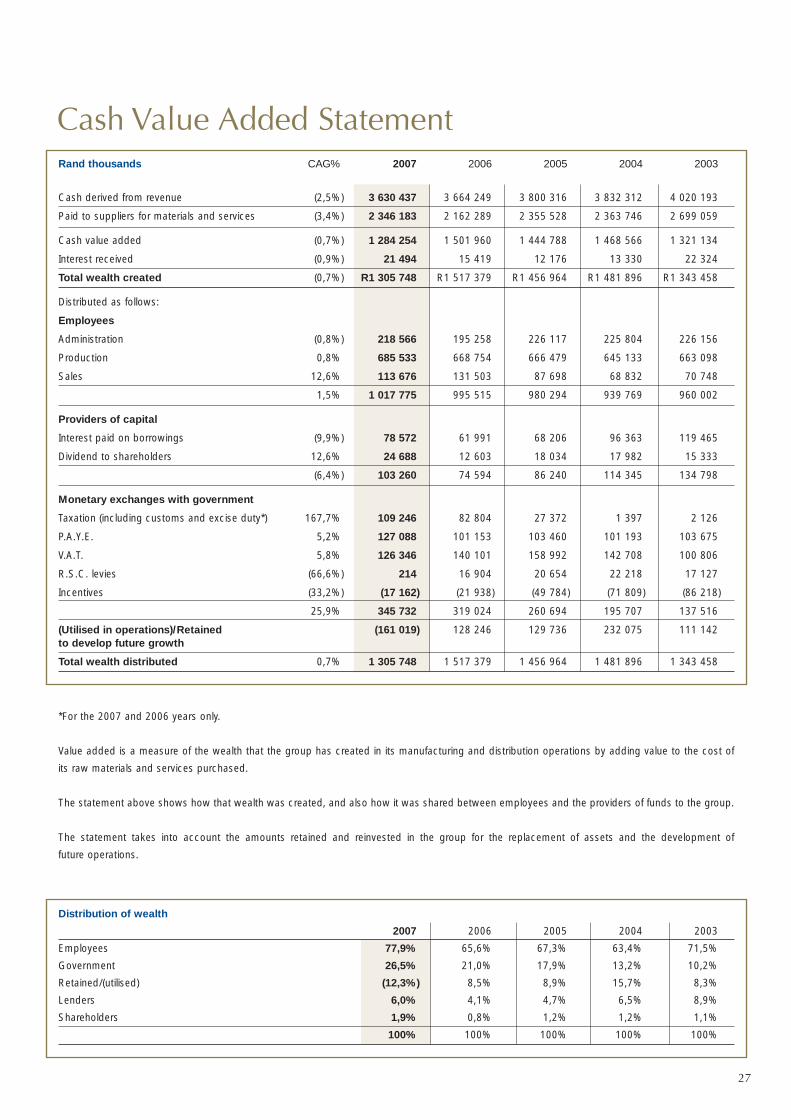
Rand thousands CAG% 2007 2006 2005 2004 2003
Cash derived from revenue (2,5%) 3 630 437 3 664 249 3 800 316 3 832 312 4 020 193
Paid to suppliers for materials and services (3,4%) 2 346 183 2 162 289 2 355 528 2 363 746 2 699 059
Cash value added (0,7%) 1 284 254 1 501 960 1 444 788 1 468 566 1 321 134
Interest received (0,9%) 21 494 15 419 12 176 13 330 22 324
Total wealth created (0,7%) R1 305 748 R1 517 379 R1 456 964 R1 481 896 R1 343 458
Distributed as follows:
Employees
Administration (0,8%) 218 566 195 258 226 117 225 804 226 156
Production 0,8% 685 533 668 754 666 479 645 133 663 098
Sales 12,6% 113 676 131 503 87 698 68 832 70 748
1,5% 1 017 775 995 515 980 294 939 769 960 002
Providers of capital
Interest paid on borrowings (9,9%) 78 572 61 991 68 206 96 363 119 465
Dividend to shareholders 12,6% 24 688 12 603 18 034 17 982 15 333
(6,4%) 103 260 74 594 86 240 114 345 134 798
Monetary exchanges with government
Taxation (including customs and excise duty*) 167,7% 109 246 82 804 27 372 1 397 2 126
P.A.Y.E. 5,2% 127 088 101 153 103 460 101 193 103 675
V.A.T. 5,8% 126 346 140 101 158 992 142 708 100 806
R.S.C. levies (66,6%) 214 16 904 20 654 22 218 17 127
Incentives (33,2%) (17 162) (21 938) (49 784) (71 809) (86 218)
25,9% 345 732 319 024 260 694 195 707 137 516
(Utilised in operations)/Retained (161 019) 128 246 129 736 232 075 111 142 to develop future growth
Total wealth distributed 0,7% 1 305 748 1 517 379 1 456 964 1 481 896 1 343 458
*For the 2007 and 2006 years only.
Value added is a measure of the wealth that the group has created in its manufacturing and distribution operations by adding value to the cost of
its raw materials and services purchased.
The statement above shows how that wealth was created, and also how it was shared between employees and the providers of funds to the group.
The statement takes into account the amounts retained and reinvested in the group for the replacement of assets and the development of
future operations.
Cash Value Added Statement
Distribution of wealth
2007 2006 2005 2004 2003
Employees 77,9% 65,6% 67,3% 63,4% 71,5%
Government 26,5% 21,0% 17,9% 13,2% 10,2%
Retained/(utilised) (12,3%) 8,5% 8,9% 15,7% 8,3%
Lenders 6,0% 4,1% 4,7% 6,5% 8,9%
Shareholders 1,9% 0,8% 1,2% 1,2% 1,1%
100% 100% 100% 100% 100%
27
Seardel Report 2007 9/18/07 9:53 AM Page 27

Annual FinancialStatements29 Directors’ responsibility statement and
management and secretary’s report
30 Review of financial operations,
objectives and strategies
32 Independent auditors’ report
33 Directors’ report
36 Income statements
37 Balance sheets
38 Statements of changes in equity
39 Cash flow statements
40 Notes to the financial statements
56 Interest in subsidiary companies
Employment Equity ReportDesignated Non-Designated TOTAL
Male Female White ForeignMale National
Occupational Levels A C I A C I W W Male FemaleTop management 4 3 3 – 3 – 22 64 6 1 106Senior management 1 35 23 1 21 9 38 46 3 – 177Professionally qualified, experienced specialists and mid-management 9 34 28 7 85 13 52 73 15 4 320Skilled technical and academicallyqualified workers, junior management,supervisors, foremen, and superintendents 184 302 282 156 941 183 186 161 19 7 2 421Semi-skilled and discretionarydecision making 1 083 616 202 1 708 4 055 408 71 78 182 541 8 944Unskilled and defined decision making 556 247 28 687 719 22 19 4 20 44 2 346TOTAL PERMANENT 1 837 1 237 566 2 559 5 824 635 388 426 245 597 14 314 Non-permanent employees 18 31 16 639 148 168 7 2 – – 1 029GRAND TOTAL 1 855 1 268 582 3 198 5 972 803 395 428 245 597 15 343
28
Seardel Report 2007 9/18/07 9:53 AM Page 28

The directors are responsible for the preparation and fair
presentation of the group annual financial statements and annual
financial statements of Seardel Investment Corporation Limited,
comprising the balance sheets at 30 June 2007, the income
statements, the statements of changes in equity, cash flow
statements for the year then ended, and the notes to the financial
statements, which include a summary of significant accounting
policies and other explanatory notes, and the directors’ report, in
accordance with International Financial Reporting Standards and
in the manner required by the Companies Act of South Africa.
The directors’ responsibility includes: designing, implementing
and maintaining internal control relevant to the preparation and fair
presentation of these financial statements that are free from
material misstatement, whether due to fraud or error; selecting and
applying appropriate accounting policies; and making accounting
estimates that are reasonable in the circumstances.
The directors’ responsibility also includes maintaining
adequate accounting records and an effective system of risk
management as well as the preparation of the supplementary
schedules included in these financial statements.
The directors have made an assessment of the group and
company’s ability to continue as a going concern and there is no
reason to believe the businesses will not be going concerns in the
year ahead.
The auditor is responsible for reporting on whether the group
annual financial statements and the company’s annual financial
statements are fairly presented in accordance with the applicable
financial reporting framework.
Approval of group annual financial statements and annual
financial statements
The group annual financial statements and annual financial
statements of Seardel Investment Corporation Limited, as
identified in the first paragraph, were approved by the board of
directors on 25 September 2007 and signed on its behalf by:
A Searll A D Jacobson
CHIEF EXECUTIVE OFFICER FINANCIAL DIRECTOR
Shareholders who find the cost of selling their shares exceeds the
market value of their shares may wish to consider donating them
to charity. An independent non-profit organisation called STRATE
Charity Shares has been established to administer this process.
SARS has advised that the value of any shares donated may be
deducted from taxable income, as the scheme is registered under
section 18A of the Income Tax Act. For further details, queries
and/or donations contact the STRATE Share Care toll free help line
on 0800 202 363 or e-mail [email protected].
Directors’ResponsibilityStatement
STRATE CharityShares
Management andSecretary’s ReportThe directors of Seardel Investment Corporation Limited
accept full responsibility for the information, financial
statements and related schedules contained in this annual
report to shareholders. They have appointed management
who are responsible for the implementation and monitoring of
all internal control procedures, which are designed to provide
reasonable assurance as to the integrity and reliability of the
financial statements, and for consolidation of the group’s
results. Management is acutely aware that the presentation
of the annual report should allow financiers, shareholders
and prospective shareholders the opportunity to evaluate the
group. In order to be able to achieve this accounting
philosophy, all the relevant information should be available
and presented in such a manner as to make it easily
understandable, comprehensive where necessary, consistent
with past years, pertinent and timeous. Management has the
responsibility to ensure that all employees operate in
conformity with the group’s mission statement and the laws
and customs applicable to the business environment in which
the group operates, and subscribes to the corporate
governance guidelines as set out in the King Reports (refer to
the corporate governance report on page 21). The group
financial statements comply with International Financial
Reporting Standards (IFRS) for the 2007 financial year.
Management has retained the services of specialised
consultants, when deemed necessary, to assist in various
group projects and provide valued input to the decision
making process.
SECRETARY’S REPORTTo the members of Seardel Investment Corporation Limited.
In accordance with the provisions of the Companies Act,
1973 (“the Act”), I certify that, in respect of the year ended
30 June 2007, the Company has lodged with the Companies
and Intellectual Property Registration Office all returns
prescribed by the Act and that all such returns are true, correct
and up to date.
L A Clohessy
COMPANY SECRETARY
Cape Town
25 September 2007
29
Seardel Report 2007 9/18/07 9:53 AM Page 29

SUMMARY
Revenue increased by 5,9% to R3,8 billion.
Operating profit decreased by 27% to R111,6 million (2006: R152,3
million). Profit before taxation decreased by 51% to R51,6 million
(2006: R105,2 million).
Finance costs increased by R10,5 million to R57 million from
R46,5 million last year. This resulted from the increase in interest
bearing debt and the higher interest rate environment experienced
during the financial year. The group has acquired derivative
products to lesson the impact of future rate increases.
Attributable earnings to shareholders amounted to R50,8
million, a decrease of 40,6% from last year's level of R85,5 million.
The group maintained its market share, albeit at lower margins and
concentrated on its niche market expertise. However, working capital
increases resulted in an increase in the level of borrowings. This area will
be the subject of intense management action to rectify the position.
Restructuring of management units continued during the year under
review in order to improve productivity.
Going forward, the budget for 2007/2008 reflects an improvement
in results and every effort will be made to achieve same. The group has
been appointed the official manufacturer and distributor of specific
apparel product lines for the FIFA 2010 World Cup.
The total number of shares in issue at financial year end was 92
million. The weighted average number of shares in issue during the
year under review is 91 million (2006: 105,2 million).
Group equity is R1 541 million (2006: R1 373 million). During the
year under review the group repurchased and cancelled 528,494
ordinary shares; it also repurchased, through the open market, 171,827
ordinary shares and 1,309,975 N ordinary shares, which are held as
treasury shares.
Tangible net asset value per share increased to 1 703 cents
(2006: 1 502 cents). The value of brand names, trademarks and
other intangible assets, other than quota acquired, owned by
the group is substantial but is not reflected in the balance
sheet. No provision for depreciation of these assets has
therefore been provided.
CORPORATE LONG-TERM FINANCIAL STRATEGIES
For commentary on trading conditions and the South African socio-
economic scenario, as well as exports, please refer to the report of the
Chairman and Chief Executive Officer on page 5.
Investment in technology and upgrading of equipment has been
maintained at all levels in order to ensure the group’s market leader
status. Committed management and staff are fully aware that
acceptable returns need to be achieved for the group’s shareholders,
financiers and employees. Key financial ratios are monitored and targets
are constantly being re-assessed.
Funding and working capital requirements for financial 2008 are
not expected to exceed those for the year under review in real
terms, and every effort will be made to reduce these levels.
Revenue is expected to increase by approximately 9,4%. The
necessity of producing positive cash flows and maintaining
stringent asset management procedures are requirements of all
operating divisions within the group. It is the intention to ensure
that finance charges cover is increased to and maintained at 3
times. It has always been group policy to cover currency risks, and
exposure in this area is carefully monitored, notwithstanding the
effects of the new accounting requirements. The capital
reinvestment program is estimated to approximate R24 million next
year. This will be financed from internal reserves and external
funding if necessary.
GENERAL
The segmental report on page 26 details the various divisions’
performances with comparisons to the previous year. Commentary on
the results of the various divisions by directors and senior management
can be found in the relevant sections of this document.
The group’s 50% interest in Harven Manufacturing Company (Pvt)
Limited in Zimbabwe has, as in the past, not been accounted for. The
unfortunate events in Zimbabwe have resulted in a massive reduction
in the value of that country’s currency. Consolidation of the company
has therefore become meaningless due to the fact that the results
would be immaterial, and no dividend has been declared in the
current year.
With the strong balance sheet, the board has proposed that
the dividend cover be reduced to 1,9 times, and that a dividend of 12
cents be paid.
Seardel remains fully committed to training and human resources
development. This vital aspect of group activities is elaborated upon on
page 18 in this document.
In the light of the prevailing economic climate, financial targets
are constantly reviewed. Established guidelines and policies will be
strictly adhered to and, with the co-operation of all concerned, these
financial targets will be achieved, no matter how challenging they
might be.
RETURN ON TOTAL TANGIBLE ASSETS EXCLUDING CASH
Target 10% – The objective for return on total tangible assets
comprises two elements:
1. Operating margin
(operating profit divided by revenue) 5,0%
2. Tangible asset turn
(revenue divided by total tangible assets excluding cash) 2,0
The return on tangible assets is obtained by multiplying the
operating margin by the asset turn.
Actual 3,9% - Operating margin of 3,0% was a decrease on
the previous year’s level of 4,2%. Asset turn is 1,3. The return
therefore is lower than last year and continues to be below the
objective. The deterioration in the ratio reflects the difficult
trading environment, and with margins under pressure
improvements will rely on greater utilisation of assets and an
expanding economy.
Review of Financial Operations,Objectives and Strategies FOR YEAR ENDED 30 JUNE 2007
30
Seardel Report 2007 9/18/07 9:53 AM Page 30

RETURN ON INVESTMENT
Target 7,5% – This ratio is derived in a similar manner to the return on
total tangible assets and comprises the product of:
1. Net margin (income after taxation divided by revenue) 3,75%
2. Tangible asset turn (revenue divided by total tangible
assets excluding cash) 2,0
Income after taxation takes into account a projected effective
income tax rate of 29%.
Actual 1,8% – A decrease on last year and below the target. Continued
pressure on margins impacts this ratio. Please also refer to the
commentary above.
RETURN ON SHAREHOLDERS’ INTEREST
Target 12,5% – This return is the ratio of income attributable to
shareholders, expressed as a percentage of shareholders’ interest.
Actual 3,3% – The ratio decreased from last year and remains well
below the target.
BORROWINGS TO CAPITAL AND RESERVES
Target 25% – This ratio comprises interest-bearing debt to group equity.
Actual 30,6% – The ratio has increased to this level, due to increased
working capital requirements. Borrowings are expected to decline during
the 2007/2008 financial year in line with past practice.
The maturity profile of borrowings can be found in note 37 to the
financial statements. The interest rate structure is to be found in note 17.
Foreign borrowings, mainly in US Dollars, are covered by forward
exchange contracts.
DEBT TO CAPITAL AND RESERVES
Target 70% – This ratio comprises total debt (net of cash resources) to
group equity.
Actual 71% – This ratio is above last year's level, due to the reasons
detailed above, and is slightly above the target.
DIVIDEND COVER
Target 2 times – This target is based on headline earnings and has
been reduced in line with the enhanced value of the balance sheet.
Actual 1,9 times – The cover is in line with the target and is deemed to
be prudent for the reasons stated previously.
31
Seardel Report 2007 9/18/07 9:53 AM Page 31
To the Members of Seardel Investment Corporation Limited.
Report on the Financial Statements
We have audited the group annual financial statements and the annual
financial statements of Seardel Investment Corporation Limited,
which comprise the balance sheets at 30 June 2007, and the income
statements, the statements of changes in equity and cash flow
statements for the year ended, and the notes to the financial
statements, which include a summary of significant accounting policies
and other explanatory notes, and the directors’ report as set out on
pages 33 to 56. We have also audited the segmental report for the year
ended 30 June 2007, set out on page 26.
Directors’ Responsibility for the Financial Statements
The company’s directors are responsible for the preparation and
fair presentation of these financial statements in accordance with
International Financial Reporting Standards and in the manner required
by the Companies Act of South Africa. This responsibility includes:
designing, implementing and maintaining internal control relevant to the
preparation and fair presentation of financial statements that are free
from material misstatement, whether due to fraud or error; selecting and
applying appropriate accounting policies; and making accounting
estimates that are reasonable in the circumstances.
Auditor’s Responsibility
Our responsibility is to express an opinion on these financial statements
based on our audit. We conducted our audit in accordance with
International Standards on Auditing. Those standards require that we
comply with ethical requirements and plan and perform the audit to
obtain reasonable assurance whether the financial statements are free
from material misstatement.
An audit involves performing procedures to obtain audit evidence
about the amounts and disclosures in the financial statements. The
procedures selected depend on the auditor’s judgement, including
the assessment of the risks of material misstatement of the financial
statements, whether due to fraud or error. In making those risk
assessments, the auditor considers internal control relevant to the
entity’s preparation and fair presentation of the financial statements in
order to design audit procedures that are appropriate in the
circumstances, but not for the purpose of expressing an opinion on
the effectiveness of the entity’s internal control. An audit also includes
evaluating the appropriateness of accounting policies used and the
reasonableness of accounting estimates made by management, as well
as evaluating the overall presentation of the financial statements.
We believe that the audit evidence we have obtained is sufficient
and appropriate to provide a basis for our audit opinion.
Opinion
In our opinion, these financial statements present fairly, in all material
respects, the consolidated and separate financial position of Seardel
Investment Corporation Limited at 30 June 2007, and its consolidated
and separate financial performance and consolidated and separate
cash flows for the year then ended in accordance with International
Financial Reporting Standards, and in the manner required by the
Companies Act of South Africa.
Other Matters
The supplementary schedule set out on page 57 does not form part
of the annual financial statements and is presented as additional
information. We have not audited this schedule and accordingly we do
not express an opinion on this schedule.
KPMG Inc.
Registered Auditor
Per Gary Thompson
Chartered Accountant (SA)
Registered Auditor
Director
25 September 2007
KPMG Inc
MSC House
1 Mediterranean Street
Foreshore
Cape Town
8001
Independent Auditors’ Report
32
Seardel Report 2007 9/18/07 9:53 AM Page 32
Directors’ Report YEAR ENDED 30 JUNE 2007
NATURE OF BUSINESS
The company is an investment holding company, having interests
in subsidiary companies whose activities are divided into several
main areas of operation: textile manufacturing, apparel manufacturing,
nonwoven textile (industrial products) manufacturing, office automation
and consumer electronics distribution, toy distribution, travel and
property investments.
REVIEW OF GROUP PERFORMANCE
The results for the year and the group’s financial position are fully
disclosed in the statements accompanying this report. A detailed review
of the group’s performance by the Chairman and the Chief Executive
Officer appears on pages 5 to 8 of this document.
The group's financial results comply with IFRS, which was first
adopted for the year ended 30 June 2006.
Revenue increased marginally by 5,9% to R3,8 billion and
the group realised income before taxation of R51,6 million (2006:
R105,3 million), a decrease of 51%.
Attributable earnings decreased to R50,8 million from R85,5 million
last year, an decrease of 40,6%. The weighted average number of
shares in issue during the year amounted to 91 million (2006:
105,2 million). Earnings per share (EPS) amounted to 55,8 cents
compared to 81,2 cents last year, a decrease of 31%. Similarly, headline
earnings per share are 22,7 cents compared to 73,0 cents last year,
a decrease of 69%.
A detailed segmental analysis is presented on page 26.
The group continues with its long-term strategic plan of
restructuring clothing and textile divisions where necessary in order to
ensure optimum production at its various plants.
SIGNIFICANT CONTRACTS
The group has entered into a manufacturing and distribution agreement
with FIFA approved licensee Global Brands (Football) Pte Ltd in respect
of being the accredited manufacturer and distributor for specific apparel
products associated with the 2010 World Cup. No other significant
contracts have been entered into either verbally or in writing by Seardel
or any of its subsidiaries, being contracts entered into otherwise than in
the ordinary course of business.
BBBEE COMPLIANCE
During the year under review Seartec Trading (Pty) Limited (Sharp
Electronics) has become BBBEE compliant.
SHARE CAPITAL
There has been no change to the authorised share capital of the
company. The number of shares in issue, after the deduction of treasury
shares, has reduced to 90,3 million as at 30 June 2007 (2006:
91,4 million). During the year under review 528,5 thousand ordinary
shares were repurchased and cancelled. A further 1,31 million N
ordinary shares and 171 827 ordinary shares were repurchased and
held as treasury shares. This had the effect of reducing the ordinary
shares in issue to 22,9 million and the N ordinary shares in issue to 67,4
million. Actual shares in issue, not taking treasury shares into account,
are 23 million and 69 million respectively, a total of 92 million.
DIVIDEND
The board has proposed the payment of 12 cents per share on
92 million shares (2006: 27 cents on 92,6 million shares), to be
confirmed at the annual general meeting of shareholders. The board
has determined that there will be one distribution per annum.
Refer to the financial calendar on page 1 for the relevant dates relating
to the above.
SUBSIDIARY COMPANIES
The names of and certain financial information relating to your
company’s subsidiaries are set out on page 56.
EARNINGS OF SUBSIDIARIES
The interest of the company in the aggregate income and losses of
subsidiaries after taxation is as follows:
2007 2006Restated
R000 R000
INCOME 642 957* 81 346
LOSSES 13 070 197 038
*Includes inter company dividends
GOING CONCERN
These annual financial statements have been prepared on a going
concern basis.
The board has performed a formal review of the group’s ability to
continue trading as a going concern in the foreseeable future and,
based on this review, considers that the presentation of the financial
statements on this basis is appropriate.
There are no pending or threatened legal or arbitration proceedings
which have had or are likely to have a material effect on the financial
position of the company or the group. See also disclosure under the
contingencies note on page 55.
DIRECTORS AND SECRETARY
The directors as at the date of this report, together with the name,
business and postal address of the company secretary, are set out on
pages 9 and 1 respectively. The secretary, L A Clohessy, has certified
that the company has lodged with the Companies and Intellectual
Property Registration Office (CIPRO) all such returns required by a
public company in terms of the Companies Act, and that all such
returns are true, correct and up to date.
In terms of the company’s articles of association, Dr Aaron Searll
and Mr Arthur Daniel Jacobson retire at the forthcoming annual general
meeting and, being eligible, offer themselves for re-election.
There are no service agreements with any of the directors of
Seardel at the date hereof which impose any abnormal notice periods
on the company.
The board consists currently of three non-executive directors, two
of whom are independent, and three executive directors. Advocate Neil
Lazarus is the independent, non-executive chairman.
33
Seardel Report 2007 9/18/07 9:53 AM Page 33

Directors’ Report YEAR ENDED 30 JUNE 2007
EMPLOYEE BENEFITS
Benefits available to the group’s employees include housing assistance,
canteen and recreational facilities and subsidised medical aid schemes.
Besides these benefits, comprehensive retirement, disability and death
benefits are available to members, their spouses and children by way of
pension and provident funds.
Seardel sponsors a number of pension and provident funds. Some
of these funds are privately administered, and established for the
sole purpose of providing benefits to Seardel’s employees. These funds
are governed by the Pension Funds Act and are managed by Boards
of Trustees, 50% of whom are elected by fund members. Some
employees choose to participate in various trade union and collective
bargaining council funds, established for wider groups. The group also
sponsors these schemes.
The two largest funds providing specifically for Seardel employees
are the Seardel Group Retirement Fund with 1 687 members and the
Frame Group Provident Fund with 1 793 members.
The total membership of the in-house funds amounted to 4,429 at
the company’s financial year-end. Total assets in these funds amounted
to in excess of R1,3 billion. The company made annual contributions to
these arrangements totalling R61,9 million during the year under review.
The industry-wide and trade union retirement arrangements to
which employees may alternatively belong are constituted under the
Labour Relations Act.
The in-house funds offer a range of benefits that are comparable to
other industry offerings. The in-house funds are all Defined Contribution
Funds (DCF), with the exception of one fund which has no active
members and will shortly be de-registered. This is similar to the general
industry, where DCF are the most common. Under DCF, the benefits are
determined by the accumulation of the employer and the employee
contributions, after allowing for costs, together with investment returns.
Under such funds, the employer’s commitment is limited to the fixed
contribution rate agreed in the rules.
Each of these funds has its own Board of Trustees, with both
employer and employee representation. The funds within the group are
quite different, each tailored to the requirements of their own
membership. The funds in the group are fairly progressive - certain of the
funds offer flexible investment options and flexible risk benefit options.
The group has always considered its employees to be its main
asset and has committed itself to ensuring that it provides benefit
schemes that are current and innovative. The ongoing quest for the
highest standards of benefit schemes plays a major role in maintaining
the group's managerial structure and attracting new talent whilst
enhancing the welfare of all its employees.
THE SEARDEL INVESTMENT CORPORATION LIMITED
EMPLOYEE INCENTIVE SCHEME 2001
The scheme was registered on 10 December 2001. On that date the
Trust granted options on 6,296,000 Seardel N ordinary shares at R1.80
per share to the holders of share options in Frame Textile Corporation
Limited (“Frame”) in consideration for those holders agreeing to the
cancellation of options that they held in Frame. Of the total amount,
80,800 options have been forfeited in terms of the rules. The remaining
options, amounting to 6,215,200 N ordinary shares, were exercised in
terms of the rules of the scheme. Of the above amount, 5,932,800 N
ordinary shares have, in terms of the rules, been delivered by 30 June
2007 and the financial consideration has been paid into the Trust.
Options in respect of 282,400 N ordinary shares remain outstanding.
The scheme presently holds this number of N ordinary shares in order
to meet its obligations in this respect.
CORPORATE GOVERNANCE
The directors endorse the Code of Corporate Practice and Conduct
contained in the King Reports on Corporate Governance. By
supporting the Code the directors have recognised the need to conduct
the group’s operations with integrity and in accordance with generally
accepted corporate practices. For further information refer to the
Corporate Governance report on page 21 of this document.
34
Seardel Report 2007 9/18/07 9:53 AM Page 34

SHAREHOLDER SPREAD IN TERMS OF LISTING REQUIREMENTS
2007 2006
Number of % Number of % Number of % Number of %
Shareholders Shares Shareholders Shares
Ordinary shares
Non-public 8 0,9 18 391 054 79,7 7 0,8 18 644 346 78,9
- Directors & Associates 6 0,7 14 823 624 64,2 5 0,6 14 720 249 62,3
- Other 2 0,2 3 567 430 15,5 2 0,2 3 924 097 16,6
Public 841 99,1 4 693 573 20,3 876 99,2 4 968 775 21,1
849 100 23 084 627 100 883 100 23 613 121 100
N Ordinary shares
Non-public 9 0,9 42 971 989 62,3 8 0,8 42 784 276 61,3
- Directors & Associates 6 0,6 12 174 328 17,6 4 0,4 12 173 613 17,4
- Other 3 0,3 30 797 661 44,7 4 0,4 30 610 663 43,9
Public 972 99,1 25 994 022 37,7 1 031 99,2 26 978 912 38,7
981 100 68 966 011 100 1 039 100 69 763 188 100
SHAREHOLDERS’ INTEREST IN SHARES
The following are shareholders, other than directors, who own more than 5% of the company’s issued share capital per class of share:
2007 2006Ordinary % N Ordinary % Ordinary % N Ordinary %
Allan & Gill Gray Charitable Trust 1 678 879 7,3 – – 1 678 879 7,1 – –Liberty Life Association of Africa Ltd 3 395 603 14,7 11 545 966 16,7 3 395 603 14,4 11 514 966 16,5S.A. Clothing & Textile Workers Union – – 17 659 320 25,6 – – 17 659 320 25,3
Executives and staff members of the group, other than directors, held 208 773 ordinary and 370 155 N ordinary shares at year end. Please refer to page 57 for further analysis. Shareholders and members of the public are advised that the register of interest of directors, executives, senior managementand other shareholders in the shares of the company is available upon request from the company secretary.
TRAINING
Seardel has a labour-intensive profile and recognises the need for
improvement in communication skills and productivity across the entire
spectrum of industrial relations. Extensive in-house training programs
for all levels of employees are implemented and maintained on an
ongoing basis, including seminars aimed at upgrading the skills of
middle and senior management. The importance that the group places
on this aspect of its operations is emphasised in the more detailed
report on Human Resources appearing on page 18 of this document.
DIRECTORS’ INTEREST IN SHARES
At the year end the directors (including their family interests) were directly or indirectly interested in the company’s issued shares as follows:
2007 2006Ordinary N Ordinary Ordinary N Ordinary
Direct 30 701 0,1% – 0,0% 30 701 0,1% – –Indirect 14 587 366 63,2% 12 107 066 17,6% 14 587 366 61,8% 12 107 066 17,4%There have been no material changes to date of this report.
Details of directors’ beneficial direct and indirect interest in the ordinary and N ordinary shares are as follows:
2007 2006Ordinary N Ordinary Ordinary N Ordinary
A Searll 14 513 649 11 885 606 14 513 649 11 885 606A D Jacobson 74 418 221 460 74 418 221 460W Simeoni 30 000 – 30 000 –
35
Seardel Report 2007 9/18/07 9:54 AM Page 35

Income Statements FOR YEAR ENDED 30 JUNE
Group Company
Rand thousands Notes 2007 2006 Restated 2007 2006
Revenue 3 793 357 3 583 702 101 344 248 940
Cost of revenue (3 009 541) (2 703 840) – –
Gross profit 783 816 879 862 101 344 248 940
Other income 133 203 127 012 – –
Other operating income 101 661 127 012 – –
Disposal of portion of division 3 31 542 – – –
Distribution costs (349 642) (420 986) – –
Administrative and other expenses (455 709) (433 612) (915) –
Operating profit before finance costs 2 111 668 152 276 100 429 248 940
Finance income 21 494 15 419 – –
Finance expenses (78 572) (61 991) – –
Share of losses from joint venture (2 973) (446) – –
Profit before taxation 51 617 105 258 100 429 248 940
Taxation 4 (855) (18 841) – –
Profit for the year 50 762 86 417 100 429 248 940
Attributable to:
Shareholders 50 770 85 471 100 429 248 940
Minority interest (8) 946 – –
Profit for the year 50 762 86 417 100 429 248 940
Basic earnings per share – cents 5 55,78 81,23
Diluted earnings per share – cents 5 55,65 80,63
36
Seardel Report 2007 9/18/07 9:54 AM Page 36

Balance Sheets AT 30 JUNE
Group Company
Rand thousands Notes 2007 2006 Restated 2007 2006
ASSETS
Non-current assets 1 261 451 1 115 621 490 264 418 960
Property, plant and equipment 6 1 071 578 945 744 – –
Intangible assets 7 3 915 – – –
Interest in subsidiary companies 8 – – 470 371 407 569
Interest in joint ventures 9 16 473 10 896 19 892 11 342
Investments 10 2 352 1 801 1 49
Long-term receivables 11 55 504 57 463 – –
Deferred taxation 12 111 629 99 717 – –
Current assets 1 861 565 1 639 044 – –
Inventories 13 788 119 728 028 – –
Trade and other receivables 14 893 225 701 529 – –
Non-current assets held for sale 15 26 743 27 741 – –
Cash and cash equivalents 28 153 478 181 746 – –
TOTAL ASSETS R3 123 016 R2 754 665 R490 264 R418 960
EQUITY AND LIABILITIES
Total equity 1 547 899 1 377 229 487 515 416 210
Share capital and share premium 16.1 6 130 6 262 6 130 6 262
Treasury shares 16.2 (13 042) (4 740) – –
Reserves 1 548 005 1 371 683 481 385 409 948
Total equity attributable to equity holders 1 541 093 1 373 205 487 515 416 210
Minority interest 6 806 4 024 – –
Non-current liabilities 600 702 555 571 – –
Interest-bearing liabilities 17 275 383 238 662 – –
Deferred liabilities 18 70 400 68 074 – –
Deferred taxation 12 254 499 243 022 – –
Operating lease accruals 19 420 5 813 – –
Current liabilities 974 415 821 865 2 749 2 750
Interest-bearing liabilities 17 307 129 217 496 – –
Trade and other payables 19 528 841 497 355 – –
Provisions 20 86 506 79 351 – –
Bank overdrafts 28 42 357 22 159 2 733 2 733
Taxation payable 9 566 5 487 – –
Dividend to shareholders 16 17 16 17
TOTAL EQUITY AND LIABILITIES R3 123 016 R2 754 665 R490 264 R418 960
Net asset value (excluding intangible assets) R1 537 178 R1 373 205
Net asset value per share after treasury shares - cents 1 703 1 502
37
Seardel Report 2007 9/18/07 9:54 AM Page 37
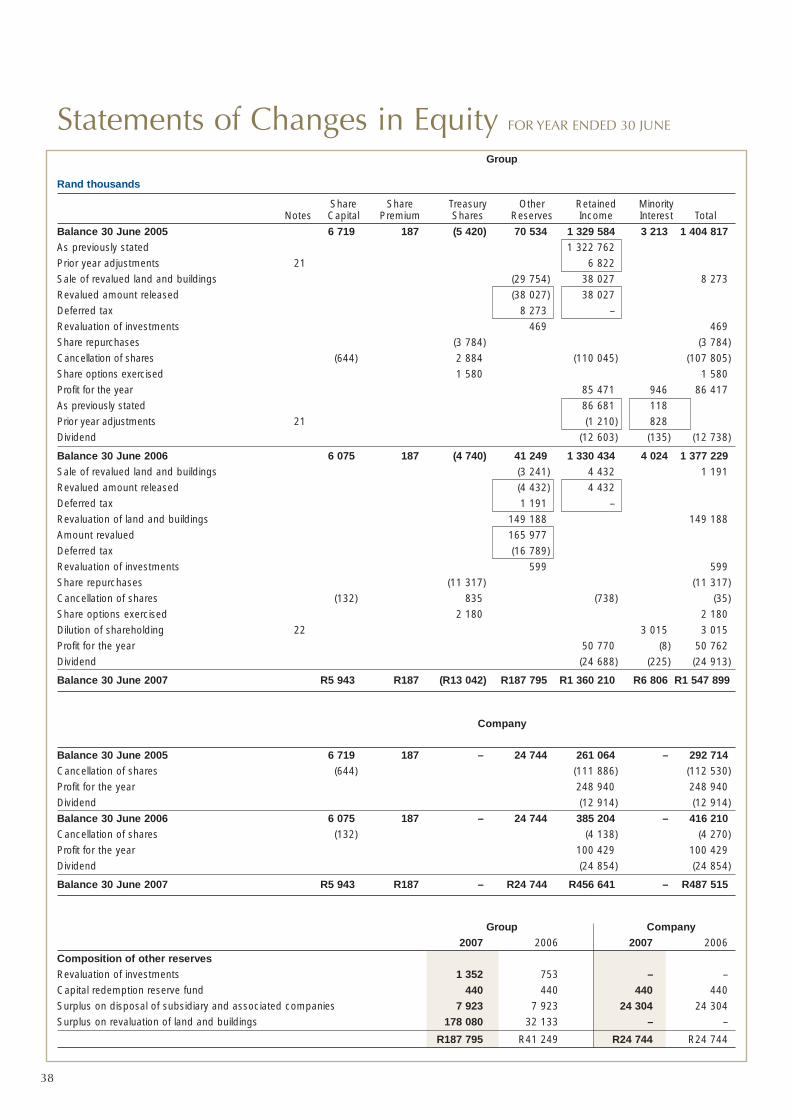
Statements of Changes in Equity FOR YEAR ENDED 30 JUNE
Group
Rand thousands
Share Share Treasury Other Retained MinorityNotes Capital Premium Shares Reserves Income Interest Total
Balance 30 June 2005 6 719 187 (5 420) 70 534 1 329 584 3 213 1 404 817 As previously stated 1 322 762
Prior year adjustments 21 6 822
Sale of revalued land and buildings (29 754) 38 027 8 273
Revalued amount released (38 027) 38 027
Deferred tax 8 273 –
Revaluation of investments 469 469
Share repurchases (3 784) (3 784)
Cancellation of shares (644) 2 884 (110 045) (107 805)
Share options exercised 1 580 1 580
Profit for the year 85 471 946 86 417
As previously stated 86 681 118
Prior year adjustments 21 (1 210) 828
Dividend (12 603) (135) (12 738)
Balance 30 June 2006 6 075 187 (4 740) 41 249 1 330 434 4 024 1 377 229 Sale of revalued land and buildings (3 241) 4 432 1 191
Revalued amount released (4 432) 4 432
Deferred tax 1 191 –
Revaluation of land and buildings 149 188 149 188
Amount revalued 165 977
Deferred tax (16 789)
Revaluation of investments 599 599
Share repurchases (11 317) (11 317)
Cancellation of shares (132) 835 (738) (35)
Share options exercised 2 180 2 180
Dilution of shareholding 22 3 015 3 015
Profit for the year 50 770 (8) 50 762
Dividend (24 688) (225) (24 913)
Balance 30 June 2007 R5 943 R187 (R13 042) R187 795 R1 360 210 R6 806 R1 547 899
Company
Balance 30 June 2005 6 719 187 – 24 744 261 064 – 292 714 Cancellation of shares (644) (111 886) (112 530)
Profit for the year 248 940 248 940
Dividend (12 914) (12 914)
Balance 30 June 2006 6 075 187 – 24 744 385 204 – 416 210 Cancellation of shares (132) (4 138) (4 270)
Profit for the year 100 429 100 429
Dividend (24 854) (24 854)
Balance 30 June 2007 R5 943 R187 – R24 744 R456 641 – R487 515
Group Company2007 2006 2007 2006
Composition of other reservesRevaluation of investments 1 352 753 – –
Capital redemption reserve fund 440 440 440 440
Surplus on disposal of subsidiary and associated companies 7 923 7 923 24 304 24 304
Surplus on revaluation of land and buildings 178 080 32 133 – –
R187 795 R41 249 R24 744 R24 744
38
Seardel Report 2007 9/18/07 9:54 AM Page 38

Cash Flow Statements FOR YEAR ENDED 30 JUNE
Group Company
Rand thousands Notes 2007 2006 Restated 2007 2006
Net cash flow from operating activities (161 019) 128 246 75 370 233 646
Cash generated from operations 23 163 997 200 271 100 225 248 843
Working capital changes 24 (228 571) (4 772) – (2 277)
Finance income 21 494 15 419 – –
Finance expenses (78 572) (61 991) – –
Taxation paid 25 (10 833) (4 535) – –
Dividend paid 26 (24 914) (12 744) (24 855) (12 920)
Contributions for post employment medical benefits 29 (3 620) (3 402) – –
Net cash flow from investing activities (4 629) 4 560 (71 100) (120 097)
Additions of property, plant and equipment (70 509) (63 800) – –
Proceeds on disposal of property, plant and equipment 27 73 933 89 915 – –
Decrease/(increase) in long-term receivables 1 959 (10 310) – 452
Investment income 147 97 118 97
Proceeds on disposal of investments 134 – 134 –
Acquisition of/increase in joint venture 9 (8 550) (11 342) (8 550) (11 342)
Acquisition of interest in subsidiary/division 30 (6 695) – – –
Change in minority holding 22 4 952 – – –
Increase in loans in subsidiary companies – – (62 802) (109 304)
Net cash flow from financing activities 117 182 (158 703) (4 270) (112 530)
Increase in long-term borrowings 36 721 43 715 – –
Increase/(decrease) in short-term borrowings 89 633 (92 409) – –
Proceeds on share options exercised 2 180 1 580 – –
Share repurchases (11 317) (3 784) – –
Cancellation of shares (35) (107 805) (4 270) (112 530)
Net (decrease)/increase in cash and cash equivalents (48 466) (25 897) – 1 019
Cash and cash equivalents at beginning of year 159 587 185 484 (2 733) (3 752)
Cash and cash equivalents at end of year 28 R111 121 R159 587 (R2 733) (R2 733)
39
Seardel Report 2007 9/18/07 9:54 AM Page 39

Notes to the Financial Statements FOR YEAR ENDED 30 JUNE 2007
1. ACCOUNTING POLICIESSeardel Investment Corporation Ltd (the company) is a companydomiciled in South Africa. The consolidated financial statements of thecompany for the year ended 30 June 2007 comprise the company, itssubsidiaries and interest in jointly controlled entities (together referredto as the group).
The financial statements were authorised for issue by the directorson 25 September 2007.
STATEMENT OF COMPLIANCEThe consolidated financial statements have been prepared inaccordance with International Financial Reporting Standards (IFRS)and its interpretations adopted by the International AccountingStandards Board (IASB), as well as the South African Companies Act.
BASIS OF PREPARATIONThe financial statements are presented in South African Rand, which isthe company’s functional currency, rounded to the nearest thousand.They have been prepared on the going concern and historical costbases under IFRS, except for those assets and liabilities which arestated at fair value as disclosed in the notes to the financial statements.
The preparation of financial statements in conformity with IFRSrequires management to make judgements, estimates andassumptions that affect the application of policies and reportedamounts of assets and liabilities, income and expenses. The estimatesand associated assumptions are based on historical experience andvarious other factors that are believed to be reasonable under thecircumstances, the results of which form the basis of makingjudgements about carrying values of assets and liabilities that are notreadily apparent from other sources. Actual results may differ fromthese estimates.
The assumptions and estimates are reviewed on an ongoing basis.Revisions to accounting estimates are recognised in the period inwhich the estimate is revised if the revision affects only that period, orin the period of the revision and future periods if the revision affectsboth current and future periods.
In particular, information about significant areas of estimation,uncertainty and critical judgements are described in the following notes:
– Revaluations (refer: note 6)– Utilisation of tax losses (refer: note 12)– Measurement of post-employment medical benefits (refer: note 29)– Valuation of intangible asset (refer: note 7)– Provisions (refer: note 20)– Contingencies (refer: note 38)– Impairment of property, plant and equipment (refer: note 6)– Assessment of useful lives and residual values (refer: note 6)The accounting policies have been applied consistently by the
group entities and to all periods prescribed in these consolidatedfinancial statements.
BASIS OF CONSOLIDATIONSubsidiariesThe group financial statements include the financial statements of thecompany and its subsidiaries. Subsidiaries are entities controlled bythe company. Control exists when the company has the power, directlyor indirectly, to govern the financial and operating policies of an entityso as to obtain benefits from its activities. In assessing control,potential voting rights that presently are exercisable or convertible aretaken into account. The financial statements of subsidiaries areincluded in the consolidated financial statements from the date thatcontrol commences until the date that control ceases.
The group has elected to recognise dilution in shareholding gainsand losses and gains and losses on change of shareholdings directlyin profit and loss.
The Seardel Investment Corporation Limited Employee IncentiveScheme 2001 has a 28th February year end. Its results are adjustedaccordingly.
In view of the uncertainty relating to the group’s investment in itsZimbabwean subsidiary, the directors maintain their decision not toconsolidate its results or financial position, which are not material togroup results. Income is accounted for on a cash dividend receivedbasis and the investment in the subsidiary has been written down to anominal value.
Joint ventures are accounted for using the equity method. Theconsolidated financial statements include the group’s share of theincome and expenses of equity accounted investees, from the datethat significant influence of joint control commences until the date thatsignificant influence or joint control ceases. When the group’s share oflosses exceeds its interest in an equity accounted investee, thecarrying amount of that interest (including any long-term investments)is reduced to nil and the recognition of further losses is discontinuedexcept to the extent that the group has an obligation or has madepayments on behalf of the investee.
Transactions eliminated on consolidationIntra-group balances and any unrealised gains and losses or incomeand expenses arising from intra-group transactions, are eliminated inpreparing the consolidated financial statements. Unrealised losses areeliminated in the same way as unrealised gains, but only to the extentthat there is no evidence of impairment.Goodwill and negative goodwillAll business combinations are accounted for by applying thepurchase method. Goodwill represents amounts arising onacquisition of subsidiaries and joint ventures, and is the differencebetween the cost of the acquisition and the fair value of theidentifiable assets, liabilities and contingent liabilities acquired.
Goodwill is stated at cost less any accumulated impairment losses. Goodwill is allocated to cash-generating units and is no longeramortised but is tested annually for impairment (see accounting policyon impairment below).
Negative goodwill arising on an acquisition is recognised directly inthe income statement.
PROPERTY, PLANT AND EQUIPMENTOwned assetsLand is not depreciated while buildings are depreciated over theirestimated useful lives. Land and buildings are revalued toapproximate fair value.
Other items of property, plant and equipment are stated athistorical cost less accumulated depreciation and accumulatedimpairment losses. The cost of replacing part of an item of property,plant and equipment is recognised in the carrying amount of the itemif it is probable that the future economic benefit embodied within thepart will flow to the group and its cost can be measured reliably.
Where an item of property, plant and equipment is comprised ofmajor components with different useful lives, the components areaccounted for as separate items of property, plant and equipment.For plant and equipment, depreciation is provided on a straight linebasis over the estimated useful lives of the assets. The grouprecognises in the carrying amount of an item of property, plant andequipment the cost of replacing part of such an item when that costis incurred if it is probable that the future economic benefits embodiedwith the item will flow to the group and the cost of the item can bemeasured reliably. All other costs are recognised in the incomestatement as an expense is incurred.
Estimates of useful lives, residual values and methods ofdepreciation are reviewed annually. Any changes are accounted forprospectively as a change in accounting estimate. If the expectedresidual value of an asset is equal to or greater than its carrying value,depreciation on that asset is ceased. Depreciation is resumed whenthe expected residual value falls below the asset’s carrying value.
NON-CURRENT ASSETS HELD FOR SALE Non-current assets are classified as held for sale when their carryingamounts will be recovered principally through sale and aremeasured at the lower of carrying amount and fair value less coststo sell. Comparatives are not restated when an asset is classified asheld for sale.
IMPAIRMENTThe carrying amount of the group’s assets, other than inventories anddeferred tax assets are reviewed at each balance sheet date todetermine whether there is any indication of impairment. If suchindication exists, the asset’s recoverable amount is estimated.
For goodwill, assets that have an indefinite useful life and intangibleassets that are not yet available for use, the recoverable amount isestimated at each balance sheet date.
An impairment loss is recognised whenever the carrying amount ofan asset or its cash generating unit exceeds its recoverable amount.Impairment losses are recognised in the income statement.
Impairment losses recognised in respect of cash-generating unitsare allocated first to reduce the carrying amount of any goodwillallocated to cash-generating units and then, to reduce the carryingamount of the other asset in the unit on a pro rata basis.
The recoverable amount of the group’s investment in held-to-maturity securities and receivables carried at amortised cost iscalculated as the present value of estimated future cash flows,discounted at the original effective interest rate.
The recoverable amount of other assets is the greater of their netselling price and value in use. In assessing value in use, the estimatedfuture cash flows are discounted to their present value using a pre-taxdiscount rate that reflects current market assessments of the time valueof money and the risks specific to the asset. For an asset that does notgenerate largely independent cash flows, the recoverable amount isdetermined for the cash-generating unit to which the asset belongs.
An impairment loss in respect of a held-to-maturity security or
40
Seardel Report 2007 9/18/07 9:54 AM Page 40

receivable carried at amortised cost is reversed if the subsequentincrease in recoverable amount can be related objectively to an eventoccurring after the impairment loss was recognised.
An impairment loss in respect of goodwill and available-for-saleassets is not reversed.
When a decline in the fair value of an available-for-sale asset hasbeen recognised directly in equity and there is objective evidence thatthe asset is impaired, the cumulative loss that has been recogniseddirectly in equity is charged to the income statement. The amount ofthe cumulative loss that is recognised in the income statement is thedifference between the acquisition cost and the current fair value, lessany impairment loss previously recognised in the income statement.
In respect of other assets, an impairment loss is not reversed if there hasbeen a change in the estimates used to determine the recoverable amount.
An impairment loss is reversed only to the extent that the asset’scarrying amount does not exceed the carrying amount that wouldhave been determined, net of depreciation or amortisation, if noimpairment loss had been recognised.
INCOME TAXIncome tax on the profit or loss for the year comprises current anddeferred tax. Income tax is recognised in the income statement exceptto the extent that it relates to items recognised directly in equity, inwhich case it is recognised in equity.
Current tax is the expected tax payable on the taxable income forthe year, using tax rates enacted at the balance sheet date, and anyadjustment to tax payable in respect of previous years.
Deferred tax is provided using the balance sheet liability method,providing for temporary differences between the carrying amounts ofassets and liabilities for financial reporting purposes and the amountsused for taxation purposes. The following temporary differences arenot provided for: goodwill not deductible for tax purposes, the initialrecognition of assets or liabilities that affect neither accounting nortaxable profit, and differences relating to investments in subsidiaries tothe extent that they will probably not reverse in the foreseeable future.The amount of deferred tax provided is based on the expected mannerof realisation or settlement of the carrying amount of assets andliabilities, using tax rates enacted or substantively enacted at thebalance sheet date.
A deferred tax asset is recognised only to the extent that it isprobable that future taxable profits will be available against which theassociated unused tax losses and deductible temporary differencescan be utilised. Deferred tax assets are reduced to the extent that it isno longer probable that the related tax benefit will be realised.
Secondary tax on companies (STC) paid on net dividends paid isrecognised as a tax charge in the year it is incurred. STC is providedfor at a rate of 12,5% on the amount by which dividends declared bythe company exceed dividends received. STC is recognised as part ofthe current tax charge in the income statement when the relateddividend is declared. Deferred tax on unutilised STC credits isrecognised to the extent that STC payable on future dividendpayments is likely to be available for set-off.
INVENTORYRaw materials and consumables, work-in-progress and finishedgoods are stated at the lower of cost and net realisable value. Netrealisable value is the estimated selling price in the ordinary course ofbusiness, less the estimated costs of completion and selling expenses.Cost is determined on the first-in, first-out principle and includes directmaterial costs together with appropriate allocations of labour andoverheads based on normal operating capacity.
PROVISIONSProvisions are recognised when the group has a present legal orconstructive obligation as a result of past events, for which it isprobable that an outflow of economic benefits will occur, and where areliable estimate can be made of the amount of the obligation. Wherethe effect of discounting is material, provisions are discounted. The discount rate used is a pre-tax rate that reflects current marketassessments of the time value of money and, where appropriate, therisks specific to the liability. Provisions are reviewed at each balancesheet date and adjusted to reflect the current or best estimate.
FINANCIAL INSTRUMENTSMeasurementFinancial instruments are initially measured at cost, which includestransaction costs. Subsequent to initial recognition these instrumentsare measured as follows:InvestmentsListed investments classified as available-for-sale financial assets arecarried at market value, which is calculated by reference to stockexchange quoted selling prices at the close of business at the balancesheet date. Unlisted investments are shown at fair value, unless their
fair value cannot be reliably determined, in which case they are shownat cost less accumulated impairment losses. Gains and losses arerecognised directly in equity in a revaluation reserve except forimpairment losses, which are expensed in the income statement.
Investments that meet the criteria for classification as held-tomaturity financial assets are carried at amortised cost.
In the company financial statements investments/investments insubsidiaries are carried at cost less impairment.Trade, long term and other receivablesTrade and other receivables originated by the group are stated at amortisedcost less impairment losses (see accounting policy on impairment).Trade and other payablesTrade and other payables are stated at amortised cost.Cash and cash equivalentsCash and cash equivalents comprises cash balances and call depositsand are measured at fair value.Finance income and costFinance income and costs comprise interest payable on borrowings,interest received on funds invested, dividend income, foreignexchange gains and losses and gains and losses on hedginginstruments that are recognised in the income statement.
Interest income is recognised in the income statement as it accrues,using the effective interest method. Dividend income is recognised inthe income statement on the date the entity’s right to receive paymentsis established. The interest expense component of finance leasepayments is recognised in the income statement using the effectiveinterest rate method.Financial liabilitiesNon-derivative financial liabilities are recognised at amortised cost,comprising original debt less principal payments and amortisations.Derivative instrumentsDerivative instruments are measured at fair value.Hedging InstrumentsGains and losses from measuring the hedging instruments relating to a fair value hedge at fair value are recognised immediately in net profit or loss.
Gains and losses from remeasuring the hedging instruments relatingto a cash flow hedge to fair value are initially recognised directly inequity. If the hedged firm commitment or forecast transaction results inthe recognition of an asset or a liability, the cumulative amountrecognised in equity up to the transaction date is adjusted against theinitial measurement of the asset or liability. Where the hedginginstrument or hedge relationship is terminated but the hedgedtransaction is still expected to occur, the cumulative unrealised gain orloss at that point remains in equity and is recognised in accordancewith the above policy when the transaction occurs. If the hedgedtransaction is no longer expected to occur, the cumulative unrealisedgain or loss is recognised in the income statement immediately.OffsetIn the instance that the group has a legal right to apply an amount duefrom a third party against the amount due to a creditor, provided thatthere is an agreement among the three parties that clearly establishesthe contractual right to set-off, and the group intends either to settleon a net basis, or to realise the asset and settle the liabilitysimultaneously, the related amounts are offset and the net amountsreported in the balance sheet.
REVENUEGroup revenue comprises, in the main, net invoiced sales excludingvalue added tax, operating and finance lease income and is stated netof transactions with group companies. Company revenue comprisesdividends received.Revenue recognitionTurnover is recognised when the significant risks and rewards ofownership have been transferred to the buyer.
Interest income is accrued on a time basis, by reference to theprincipal amounts outstanding and the interest rate applicable.
Dividend income from investments is recognised when the right toreceive payment is established.
Dividend income from Harven Manufacturing Company (Pvt) Limitedis accounted for only when received, due to the difficulties in remittingdividends from Zimbabwe.
EARNINGS PER SHAREBasic earnings per share is based on earnings attributable toshareholders and is calculated on the weighted average number ofshares in issue during the financial year. Headline earnings per share isbased on profit attributable to shareholders, excluding any non-trading, capital items and the tax effect thereon, and is calculated asabove. Diluted earnings per share is determined by adjusting the profitor loss attributable to ordinary shareholders and the weighted averagenumber of ordinary shares outstanding for the effects of all dilutivepotential ordinary shares.
41
Seardel Report 2007 9/18/07 9:54 AM Page 41
FOREIGN CURRENCY TRANSACTIONSTransactions in foreign currencies are translated at the foreign exchangerate ruling at the transaction date. Monetary assets and liabilitiesdenominated in foreign currencies are translated into South AfricanRand at rates of exchange ruling at the balance sheet date. Translationgains and losses, whether realised or unrealised, are taken to income.
LEASESFinance leasesLeases that transfer substantially all the risks and rewards ofownership of the underlying asset to the group are classified as financeleases. Assets acquired in terms of finance leases are capitalised at thelower of fair value and the present value of the minimum leasepayments at inception of the lease, and depreciated over theestimated useful life of the asset. The capital element of futureobligations under the leases is included as a liability in the balancesheet. Lease payments are allocated using the effective interest ratemethod to determine the lease finance cost, which is charged againstincome over the lease period, and the capital repayment, whichreduces the liability to the lessor.Operating leasesLeases where the lessor retains the risks and rewards of ownership ofthe underlying asset are classified as operating leases. Paymentsmade under operating leases are charged against income on a straightline basis over the period of the lease.
EMPLOYEE BENEFITSShort-term employee benefitsThe cost of all short-term employee benefits is recognised during theperiod in which the employee renders the related service. Theprovisions for employee entitlements to wages, salaries, annual andsick leave represent the amount that the group has a presentobligation to pay as a result of employees’ services provided to thebalance sheet date. The provisions have been calculated atundiscounted amounts based on current wage and salary rates.Retirement fundThe group contributes to several defined contribution plans.Contributions to defined contribution funds are charged againstincome as incurred.Medical aidWhere the group has an obligation to provide post retirement medicalaid benefits to employees, the group recognises the costs of thesebenefits in the year in which the employees render the service.
Actuarial gains or losses in respect of the defined benefit medicalplan are recognised as income or expense in the year which they arise.
Past service costs are recognised as an expense on a straight linebasis over the average period until the benefits become vested. To theextent that the benefits are already vested, past service costs arerecognised immediately.
Equity compensation benefitsThe group grants share options to certain employees under anemployee share plan. Other than costs incurred in administering theschemes, which are expensed as incurred, the scheme does not resultin an expense to the group.
DIVIDENDS TO SHAREHOLDERSDividends and related STC charges are accounted for in the period inwhich the dividends are declared.
TREASURY SHARESShares in the company held by group entities are classified as treasuryshares. These shares are treated as a deduction from the weightedaverage number of shares and the cost price of the shares is deductedfrom equity in the statement of changes in equity. Dividends receivedon treasury shares are eliminated on consolidation.
INTEREST-BEARING BORROWINGSInterest-bearing borrowings are recognised initially at fair value lessattributable transaction costs. Subsequent to initial recognition,interest-bearing borrowings are stated at amortised cost with anydifference between cost and redemption value being recognised in theincome statement over the period of the borrowings on an effectiveinterest basis.
SEGMENTAL REPORTINGThe group’s main activities are the manufacture of textiles and men’s,women’s and children’s apparel. Its other activities are comprised ofthe distribution of toys and consumer electronics. It also has travel andproperty investment interests related to its manufacturing divisions. Ona primary basis the group is organised into five major operatingdivisions:
• Textiles and household textiles, comprising the manufacture ofwoven and knitted fabrics;
• Apparel, comprising the manufacture of clothing and householdtextiles;
• Office automation and consumer electronics, comprising thedistribution of office automation products and consumerelectronic products;
• Toys, comprising the distribution of toys;• Industrial products.
Geographical markets are reported on a secondary basis. Segmentresults include revenue and expenses directly attributable to asegment, and head office expenses that can be allocated on areasonable basis to a segment. Segment assets comprise thoseoperating assets that are directly attributable to the segment or can beallocated to the segment on a reasonable basis. Segment liabilitiescomprise those operating liabilities that are directly attributable to thesegment on a reasonable basis. Segment assets and liabilities do notinclude income tax items. Capital expenditure represents the totalcosts incurred during the year to acquire segment assets that areexpected to be used during more than one period, i.e. property, plantand equipment.
The segmental report has been presented on page 26.
INTANGIBLESIntangible assetsIntangible assets that are acquired by the group, which have finiteuseful lives, are measured at cost less accumulated amortisation andaccumulated impairment losses.AmortisationAmortisation is recognised in profit or loss on a straight-line basis overthe estimated useful lives of intangible assets, from the date that theyare available for use.
NEW STANDARDS AND INTERPRETATIONS NOT YET ADOPTEDA number of new standards, amendments to standards andinterpretations are not yet effective for the year ended 30 June 2007,and have not been applied in preparing these consolidated financialstatements:
IFRS 7 Financial Instruments: Disclosures, and amendments to IAS 1: Presentation of Financial Statements (Capital Disclosures) – Effective for periods beginning 1 January 2007
These standards and amendments to standards will requireextensive disclosures concerning the significance of financialinstruments for the group’s financial position and performance, aswell as qualitative and quantitative disclosures on the nature andextent of risk.
IFRIC 10 Interim Financial Reporting and Impairment – Effective forperiods ended 31 October 2007 onwards. This standard will preventthe reversal of an impairment loss recognised in a previous interimperiod in respect of goodwill, an investment in an equity instrument ora financial asset carried at cost.
These statements will be applied in the 2008 financial year.
IFRS 8 (AC 145) – Segmental Reporting IFRS 8 (AC 145) will be adopted for the first time for the financialreporting period ending 30 June 2010.
In terms of this IFRS, segment reporting will be based on theinformation that management uses internally for evaluating segmentperformance and when deciding how to allocate resources tooperating segments. Such information may be different from what isused to prepare the income statement and balance sheet.
The operating segments of the group are the same as the currentbusiness segments based on IAS 14 (AC 115).
The accounting policies of these operating segments are thesame as those described in the summary of significant accountingpolicies except that pension expense for each operating segment isrecognised and measured on the basis of cash payments to thedefined pension plan.
This difference relating to pensions will be recorded in thereconciliation between the information in the operating segments andthe IFRS income statement and balance sheet of the group for theyear ended 30 June 2010.
CIRCULAR 8/2007 – Headline EarningsThe aim of the revised circular is to render Headline Earnings more consistent across all companies. The effective date for theapplication is for financial periods (interim or annual) ending on or after31 August 2007.
The circular focuses on re-measurements – whether realised orunrealised – as opposed to all capital items, providing a moreconsistent mechanism for determining headline earnings in theIFRS context.
Notes to the Financial Statements FOR YEAR ENDED 30 JUNE 2007
42
Seardel Report 2007 9/18/07 9:54 AM Page 42
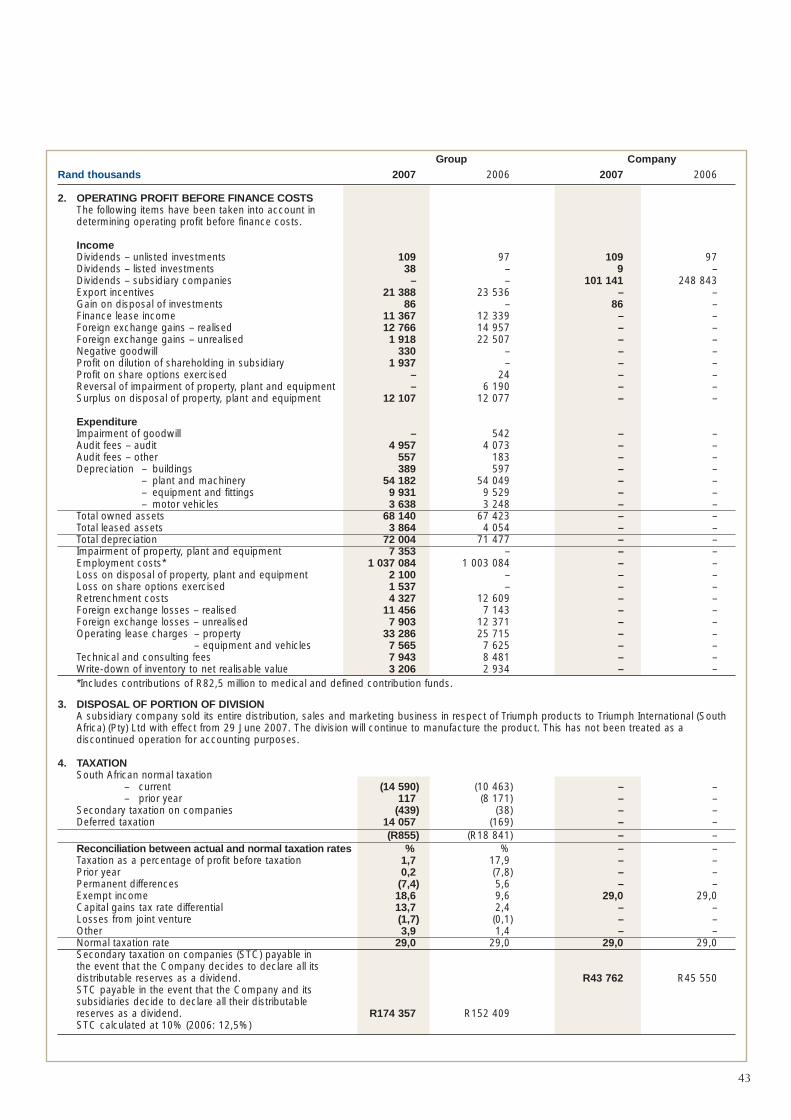
Group CompanyRand thousands 2007 2006 2007 2006
2. OPERATING PROFIT BEFORE FINANCE COSTSThe following items have been taken into account in determining operating profit before finance costs.
IncomeDividends – unlisted investments 109 97 109 97Dividends – listed investments 38 – 9 – Dividends – subsidiary companies – – 101 141 248 843 Export incentives 21 388 23 536 – –Gain on disposal of investments 86 – 86 –Finance lease income 11 367 12 339 – –Foreign exchange gains – realised 12 766 14 957 – –Foreign exchange gains – unrealised 1 918 22 507 – –Negative goodwill 330 – – –Profit on dilution of shareholding in subsidiary 1 937 – – –Profit on share options exercised – 24 – –Reversal of impairment of property, plant and equipment – 6 190 – – Surplus on disposal of property, plant and equipment 12 107 12 077 – –
ExpenditureImpairment of goodwill – 542 – –Audit fees – audit 4 957 4 073 – –Audit fees – other 557 183 – –Depreciation – buildings 389 597 – –
– plant and machinery 54 182 54 049 – –– equipment and fittings 9 931 9 529 – –– motor vehicles 3 638 3 248 – –
Total owned assets 68 140 67 423 – –Total leased assets 3 864 4 054 – –Total depreciation 72 004 71 477 – –Impairment of property, plant and equipment 7 353 – – –Employment costs* 1 037 084 1 003 084 – –Loss on disposal of property, plant and equipment 2 100 – – –Loss on share options exercised 1 537 – – –Retrenchment costs 4 327 12 609 – –Foreign exchange losses – realised 11 456 7 143 – –Foreign exchange losses – unrealised 7 903 12 371 – –Operating lease charges – property 33 286 25 715 – –
– equipment and vehicles 7 565 7 625 – –Technical and consulting fees 7 943 8 481 – –Write-down of inventory to net realisable value 3 206 2 934 – –*Includes contributions of R82,5 million to medical and defined contribution funds.
3. DISPOSAL OF PORTION OF DIVISIONA subsidiary company sold its entire distribution, sales and marketing business in respect of Triumph products to Triumph International (SouthAfrica) (Pty) Ltd with effect from 29 June 2007. The division will continue to manufacture the product. This has not been treated as adiscontinued operation for accounting purposes.
4. TAXATIONSouth African normal taxation
– current (14 590) (10 463) – –– prior year 117 (8 171) – –
Secondary taxation on companies (439) (38) – –Deferred taxation 14 057 (169) – –
(R855) (R18 841) – –Reconciliation between actual and normal taxation rates % % – –Taxation as a percentage of profit before taxation 1,7 17,9 – –Prior year 0,2 (7,8) – –Permanent differences (7,4) 5,6 – –Exempt income 18,6 9,6 29,0 29,0Capital gains tax rate differential 13,7 2,4 – –Losses from joint venture (1,7) (0,1) – –Other 3,9 1,4 – –Normal taxation rate 29,0 29,0 29,0 29,0Secondary taxation on companies (STC) payable in the event that the Company decides to declare all its distributable reserves as a dividend. R43 762 R45 550STC payable in the event that the Company and its subsidiaries decide to declare all their distributable reserves as a dividend. R174 357 R152 409STC calculated at 10% (2006: 12,5%)
43
Seardel Report 2007 9/18/07 9:54 AM Page 43

5. EARNINGS PER SHARE
2007
Profit Number of shares Per share
R000’s 000’s cents
Net number of shares in issue 90 286
Number of shares in issue - 30 June 2007 92 050
Number of treasury shares in issue - 30 June 2007 (1 764)
Weighted average number of shares 91 015
Diluted weighted average number of shares 91 229
Weighted average number of shares 91 015
Share options granted, not yet exercised 214
Basic earnings
Profit attributable to shareholders 50 770 91 015 55,8
Diluted earnings
Profit attributable to shareholders 50 770 91 229 55,7
Headline earnings
Reconciliation between earnings and headline earnings
Profit attributable to shareholders 50 770
Negative goodwill (330)
Impairment of property, plant and equipment 7 353
Surplus on disposal of portion of division (31 542)
Insurance claim (153)
Surplus on disposal of investments (86)
Surplus on disposal of property, plant and equipment (12 107)
Profit on dilution of shareholding in minority (1 937)
Loss on disposal of property, plant and equipment 2 100
Loss on share options exercised 1 537
Tax effect of adjustments 5 095
Headline earnings R20 700 91 015 22,7
Diluted headline earnings R20 700 91 229 22,7
2006
Net number of shares in issue 91 412
Number of shares in issue - 30 June 2006 92 579
Number of treasury shares in issue - 30 June 2006 (1 167)
Weighted average number of shares 105 224
Diluted weighted average number of shares 105 997
Weighted average number of shares 105 224
Share options granted, not yet exercised 773
Basic earnings
Profit attributable to shareholders 85 471 105 224 81,2
Diluted earnings
Profit attributable to shareholders 85 471 105 997 80,6
Headline earnings
Reconciliation between earnings and headline earnings
Profit attributable to shareholders 85 471
Impairment of goodwill 542
Insurance claim – loss of profits (34)
Reversal of impairment of property, plant and equipment (6 190)
Surplus on disposal of property, plant and equipment (12 077)
Profit on share options exercised (24)
Tax effect of adjustments 9 155
Headline earnings R76 843 105 224 73,0
Diluted headline earnings R76 843 105 997 72,5
Notes to the Financial Statements FOR YEAR ENDED 30 JUNE 2007
44
Seardel Report 2007 9/18/07 9:54 AM Page 44
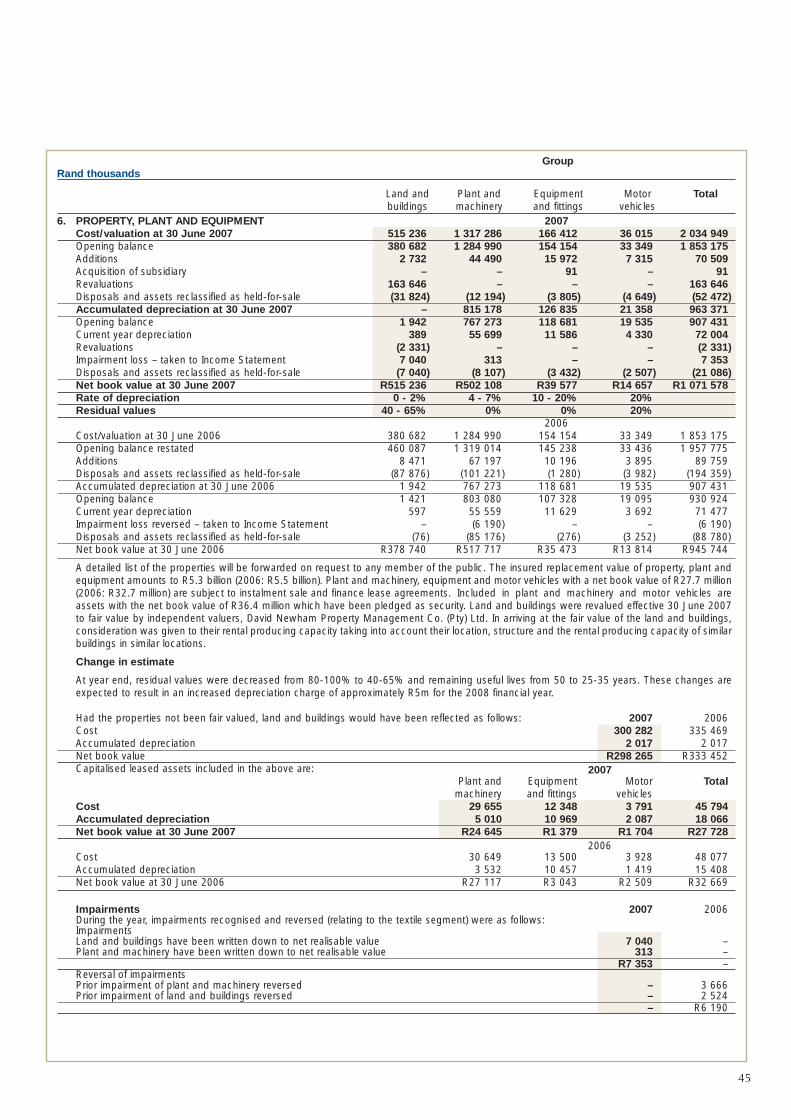
45
GroupRand thousands
Land and Plant and Equipment Motor Totalbuildings machinery and fittings vehicles
6. PROPERTY, PLANT AND EQUIPMENT 2007Cost/valuation at 30 June 2007 515 236 1 317 286 166 412 36 015 2 034 949 Opening balance 380 682 1 284 990 154 154 33 349 1 853 175 Additions 2 732 44 490 15 972 7 315 70 509 Acquisition of subsidiary – – 91 – 91 Revaluations 163 646 – – – 163 646 Disposals and assets reclassified as held-for-sale (31 824) (12 194) (3 805) (4 649) (52 472)Accumulated depreciation at 30 June 2007 – 815 178 126 835 21 358 963 371 Opening balance 1 942 767 273 118 681 19 535 907 431 Current year depreciation 389 55 699 11 586 4 330 72 004 Revaluations (2 331) – – – (2 331) Impairment loss – taken to Income Statement 7 040 313 – – 7 353 Disposals and assets reclassified as held-for-sale (7 040) (8 107) (3 432) (2 507) (21 086)Net book value at 30 June 2007 R515 236 R502 108 R39 577 R14 657 R1 071 578 Rate of depreciation 0 - 2% 4 - 7% 10 - 20% 20%Residual values 40 - 65% 0% 0% 20%
2006Cost/valuation at 30 June 2006 380 682 1 284 990 154 154 33 349 1 853 175 Opening balance restated 460 087 1 319 014 145 238 33 436 1 957 775 Additions 8 471 67 197 10 196 3 895 89 759 Disposals and assets reclassified as held-for-sale (87 876) (101 221) (1 280) (3 982) (194 359)Accumulated depreciation at 30 June 2006 1 942 767 273 118 681 19 535 907 431 Opening balance 1 421 803 080 107 328 19 095 930 924 Current year depreciation 597 55 559 11 629 3 692 71 477 Impairment loss reversed – taken to Income Statement – (6 190) – – (6 190)Disposals and assets reclassified as held-for-sale (76) (85 176) (276) (3 252) (88 780)Net book value at 30 June 2006 R378 740 R517 717 R35 473 R13 814 R945 744
A detailed list of the properties will be forwarded on request to any member of the public. The insured replacement value of property, plant andequipment amounts to R5.3 billion (2006: R5.5 billion). Plant and machinery, equipment and motor vehicles with a net book value of R27.7 million(2006: R32.7 million) are subject to instalment sale and finance lease agreements. Included in plant and machinery and motor vehicles areassets with the net book value of R36.4 million which have been pledged as security. Land and buildings were revalued effective 30 June 2007to fair value by independent valuers, David Newham Property Management Co. (Pty) Ltd. In arriving at the fair value of the land and buildings,consideration was given to their rental producing capacity taking into account their location, structure and the rental producing capacity of similarbuildings in similar locations.
Change in estimate
At year end, residual values were decreased from 80-100% to 40-65% and remaining useful lives from 50 to 25-35 years. These changes areexpected to result in an increased depreciation charge of approximately R5m for the 2008 financial year.
Had the properties not been fair valued, land and buildings would have been reflected as follows: 2007 2006Cost 300 282 335 469Accumulated depreciation 2 017 2 017 Net book value R298 265 R333 452Capitalised leased assets included in the above are: 2007
Plant and Equipment Motor Total machinery and fittings vehicles
Cost 29 655 12 348 3 791 45 794 Accumulated depreciation 5 010 10 969 2 087 18 066 Net book value at 30 June 2007 R24 645 R1 379 R1 704 R27 728
2006Cost 30 649 13 500 3 928 48 077 Accumulated depreciation 3 532 10 457 1 419 15 408 Net book value at 30 June 2006 R27 117 R3 043 R2 509 R32 669
Impairments 2007 2006During the year, impairments recognised and reversed (relating to the textile segment) were as follows:ImpairmentsLand and buildings have been written down to net realisable value 7 040 –Plant and machinery have been written down to net realisable value 313 –
R7 353 – Reversal of impairmentsPrior impairment of plant and machinery reversed – 3 666Prior impairment of land and buildings reversed – 2 524
– R6 190
Seardel Report 2007 9/18/07 9:54 AM Page 45

Notes to the Financial Statements FOR YEAR ENDED 30 JUNE 2007
46
Rand thousands Group
7. INTANGIBLE ASSETSThe acquisition of Val Hau et Cie (Pty) Ltd (refer note 30) resulted in the group acquiring a quota allowing for the import of limited quantities ofcertain clothing lines. The fair value of the quota has been determined as the difference between the cost of manufacturing the goods locallyand utilising the quota to import equivalent product. As the benefits of the quota are utilised, the intangible asset is reduced in value byamortising it through the cost of revenue line in the income statement.
2007 2006Balance at beginning of year – – Acquisition through business combination 4 037 – Amortisation for the year (122) – Balance at end of year R3 915 –
R461 784 of the quota will expire on 31 December 2007 and the remaining R3 453 408, relating to the calendar year 2008, will expire on 31 December 2008. It is envisioned that the quota will be fully utilised.
8. INTEREST IN SUBSIDIARY COMPANIES CompanyShares at cost, less amounts written off 509 448 506 737 Net loans from subsidiary companies (39 077) (99 168)
R470 371 R407 569
9. INTEREST IN EQUITY ACCOUNTED JOINT VENTURE Group Company
Loan to joint venture 2007 2006 2007 2006 Opening balance 11 342 _ 11 342 – Advances during the year 8 550 11 342 8 550 11 342Closing balance R19 892 R11 342 R19 892 R11 342
Share of losses in joint ventureOpening balance (446) – – –Share of losses for the year (2 973) (446) – – Closing balance (R3 419) (R446) – – Total investment in joint venture R16 473 R10 896 R19 892 R11 342
EQUITY ACCOUNTED INVESTEEThe group's share of losses in its equity accounted investee, Sustainable Fibre Solutions (Pty) Ltd, for the year was R2 973 thousand (2006: R 446 thousand).
Summary financial information for the equity accounted investee, not adjusted for the percentage ownership held by the group:
Voting rights 50% 50%Ownership 33% 33% Current assets 17 674 13 665 Non-current assets 78 580 27 214 Total assets R96 254 R40 879 Current liabilities 22 550 12 930 Non-current liabilities 23 787 – Total liabilities R46 337 R12 930 Revenues 18 – Expenses (9 028) (1 350) Loss (R9 010) (R1 350)
10. INVESTMENTS Stanlib Wealthbuilder - (unlisted) 15 515 units (2006:15 515) 2 351 1 752 – –KAP International Holdings Limited (listed) – 48 – 48Business Partners Limited (unlisted) 1 1 1 1
R2 352 R1 801 R1 R49Investments are classified as available for sale and are reconciled as follows:Opening balance 1 801 1 332 49 49Disposals (48) – (48) –Revaluations 599 469 – –Closing balance R2 352 R1 801 R1 R49
Seardel Report 2007 9/18/07 9:54 AM Page 46

Rand thousands Group2007 2006
11. LONG-TERM RECEIVABLESNet investment in finance leases 41 843 46 498 Other receivables 13 661 10 965
R55 504 R57 463
Net investment in finance leases is reconciled with the gross investment 2007in leases as follows: Gross Unearned Net
investment in finance investmentleases income in leases
Lease payments receivable– Not later than 1 year 33 417 7 685 *25 732 – Later than 1 year not later than 5 years 49 549 7 706 41 843
R82 966 R15 391 R67 575
Lease payments receivable 2006– Not later than 1 year 37 683 10 190 *27 493 – Later than 1 year not later than 5 years 57 231 10 733 46 498
R94 914 R20 923 R73 991 *Included in trade and other receivables
12. DEFERRED TAXATION 2007 2006Balance at beginning of year (143 305) (151 409)– Asset 99 717 14 159– Liability (243 022) (165 568)
Current movements recognised in the income statement 14 057 (169)– Capital allowances 16 271 7 129– Provision for post employment medical benefits 760 1 365– Tax losses created in the year 2 828 8 354– Intangible assets 35 –– Shares and investments (197) –– STC 364 –– Other (11 182) –– Working capital differences 5 178 (17 017)
Acquisition of subsidiary 1 976 –– Assessed loss 3 146 –– Intangible asset (1 170) –
Current movements recognised in equity (15 598) 8 273– Revaluation reserve (15 598) 8 273
Balance at end of year (142 870) (143 305)– Asset 111 629 99 717– Liability (254 499) (243 022)Deferred tax assets and liabilities are attributable to the following:– Provision for post employment medical benefits 20 416 19 656– Working capital allowances 25 712 20 534– Tax losses 65 501 59 527Deferred tax assets 111 629 99 717– Capital allowances (180 452) (196 723)– Intangible asset (1 135) –– Revaluation reserve (62 483) (46 885)– Working capital allowances (7 589) 3 593– Shares and investments (1 686) (1 489)– STC (1 154) (1 518)Deferred tax liabilities (254 499) (243 022) Total deferred tax at end of year (R142 870) (R143 305) The computed tax losses are in respect of Seardel Group Trading (Pty) Ltd, Brits Automotive Systems (Pty)Ltd, Val Hau et Cie (Pty) Ltd and Frame Industrials (Pty) Ltd. The directors have considered the futureprofitability of these three operating entities and on the basis that they are projected to produce taxable incomein the foreseeable future, these deferred tax assets are considered fully recoverable.
13. INVENTORIESRaw materials and consumables 304 958 263 698 Work-in-progress 173 436 160 600 Finished goods 309 725 303 730
R788 119 R728 028 Inventories stated at net realisable value R218 094 R113 991Carrying amount of inventory pledged as security for liabilities R12 593 –
14. TRADE AND OTHER RECEIVABLESTrade receivables 770 618 607 698Other receivables 117 412 65 003Unrealised gains on foreign exchange contracts 98 21 600Prepayments 5 097 7 228
R893 225 R701 529
47
Seardel Report 2007 9/18/07 9:54 AM Page 47

Notes to the Financial Statements FOR YEAR ENDED 30 JUNE 2007
48
Rand thousands Group2007 2006
15. NON-CURRENT ASSETS HELD FOR SALEFollowing the commitment of management to dispose of certain properties as well as plant and machinery, these assets have been reflectedas non current assets held for sale. An impairment loss of R7 million on land and buildings to the lower of its carrying amount and its fairvalue less costs to sell has been recognised.The categories of property, plant and equipment where these assets were previously disclosed are as follows:Land and buildings 26 377 27 330 Plant and machinery 366 411
R26 743 R27 741
16.1 SHARE CAPITAL AND SHARE PREMIUM Group and Company(a) Authorised
35 000 000 (2006: 35 000 000) ordinary shares of 25 cents each 8 750 8 750Each ordinary share has the right to 100 votes at general meetings
200 000 000 (2006: 200 000 000) N ordinary shares of 0.25 cents each 500 500Each N ordinary share has the right to 1 vote at general meetings
(b) Issued23 084 627 (2006: 23 613 121) ordinary shares of 25 cents each 5 771 5 903Balance at beginning of year – 23 613 121 (2006: 25 962 843) 5 903 6 491Cancelled during year – 528 494 (2006: 2 349 722) (132) (588)68 966 011 (2006: 68 966 011) N ordinary shares of 0.25 cents each 172 172 Balance at beginning of year – 68 966 011 (2006: 91 434 281) 172 228Cancelled during year – 0 (2006: 22 468 270) – (56)
5 943 6 075Share premiumBalance at beginning of year 187 187Balance at end of year 187 187
R6 130 R6 262The unissued shares are under the control of the directors until the next annual general meeting.Share incentive schemeOn 10 December 2001, the Seardel Investment Corporation Limited Employee Incentive Scheme 2001 granted options on 6 296 000 Seardel Nordinary shares at R1,80 per share to the holders of share options in Frame Textile Corporation Limited, in consideration for those holdersagreeing to the cancellation of options that they held in Frame Textile Corporation Limited. If employees terminate their employment before thedelivery date, these shares are forfeited. The options are exercisable at the employees’ discretion.
Balance, options granted not yet exercised, at beginning of year 639 1 531 Options delivered (357) (892)Balance, options granted not yet exercised, at end of year 282 639
NumberExercise price of shares
Options exercised during year R1,80 357Options outstanding at 30 June 2007 – 282Available for delivery at 30 June 2007 R1,80 282
Group
16.2 TREASURY SHARES Number of shares Seardel Investment Corporation Limited shares are held by: R000’s 000’s
2007 2006 2007 2006a) Seardel Investment Corporation Limited Employee Incentive Scheme 2001Ordinary sharesBalance at beginning of year 835 835 528 528Shares disposed of (835) – (528) –Balance at end of year – 835 – 528 N ordinary sharesBalance at beginning of year 3 905 1 701 639 960Share repurchases – 3 784 – 571 Share options exercised (2 180) (1 580) (357) (892)Balance at end of year 1 725 3 905 282 639 Total at end of year 1 725 R4 740 282 1 167b) Seardel Group Trading (Pty) LimitedOrdinary sharesBalance at beginning of year – 1 767 – 528Share repurchases 1 287 3 709 172 841Shares disposed of – (5 476) – (1 369) Balance at end of year 1 287 – 172 – N ordinary sharesBalance at beginning of year – 1 117 – 346Share repurchases 10 030 94 065 1 310 21 325Shares disposed of – (95 182) – (21 671) Balance at end of year 10 030 – 1 310 – Total at end of year 11 317 – 1 482 – Grand total at end of year R13 042 R4 740 1 764 1 167
Seardel Report 2007 9/18/07 9:54 AM Page 48
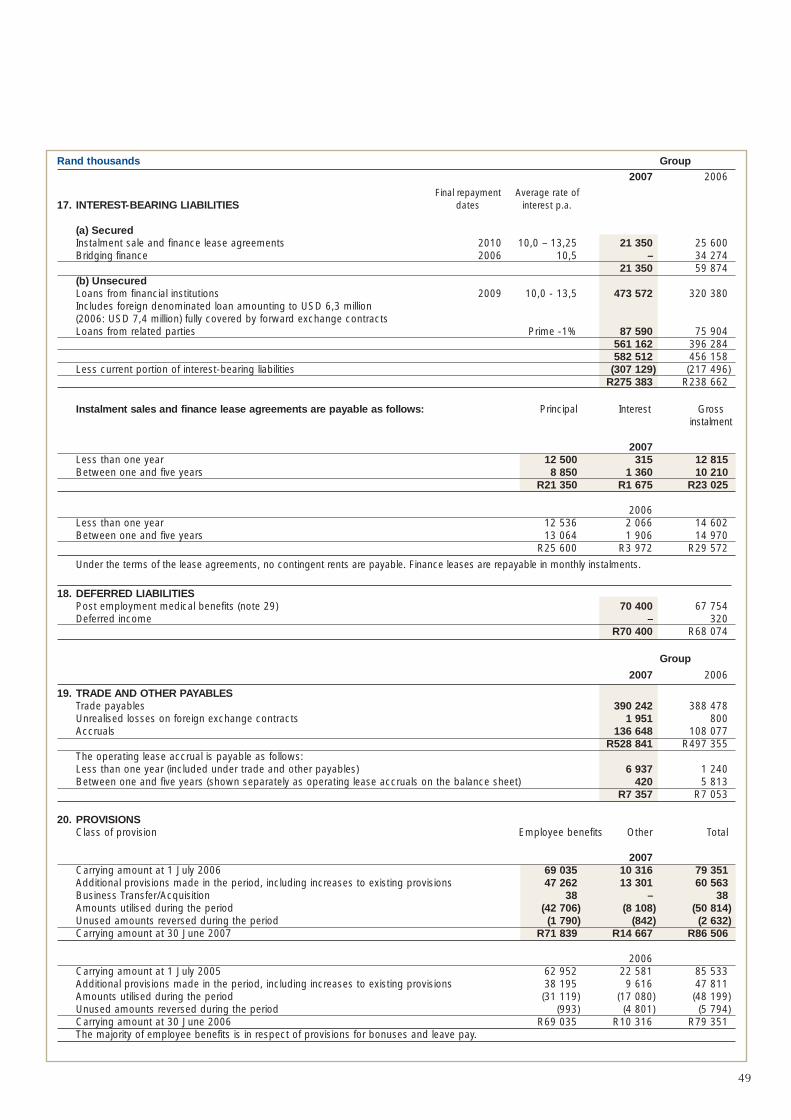
Rand thousands Group2007 2006
Final repayment Average rate of 17. INTEREST-BEARING LIABILITIES dates interest p.a.
(a) SecuredInstalment sale and finance lease agreements 2010 10,0 – 13,25 21 350 25 600 Bridging finance 2006 10,5 – 34 274
21 350 59 874 (b) UnsecuredLoans from financial institutions 2009 10,0 - 13,5 473 572 320 380 Includes foreign denominated loan amounting to USD 6,3 million (2006: USD 7,4 million) fully covered by forward exchange contractsLoans from related parties Prime -1% 87 590 75 904
561 162 396 284582 512 456 158
Less current portion of interest-bearing liabilities (307 129) (217 496)R275 383 R238 662
Instalment sales and finance lease agreements are payable as follows: Principal Interest Grossinstalment
2007Less than one year 12 500 315 12 815 Between one and five years 8 850 1 360 10 210
R21 350 R1 675 R23 025
2006Less than one year 12 536 2 066 14 602 Between one and five years 13 064 1 906 14 970
R25 600 R3 972 R29 572
Under the terms of the lease agreements, no contingent rents are payable. Finance leases are repayable in monthly instalments.
18. DEFERRED LIABILITIESPost employment medical benefits (note 29) 70 400 67 754 Deferred income – 320
R70 400 R68 074
Group
2007 2006
19. TRADE AND OTHER PAYABLESTrade payables 390 242 388 478 Unrealised losses on foreign exchange contracts 1 951 800 Accruals 136 648 108 077
R528 841 R497 355The operating lease accrual is payable as follows:Less than one year (included under trade and other payables) 6 937 1 240 Between one and five years (shown separately as operating lease accruals on the balance sheet) 420 5 813
R7 357 R7 053
20. PROVISIONSClass of provision Employee benefits Other Total
2007Carrying amount at 1 July 2006 69 035 10 316 79 351 Additional provisions made in the period, including increases to existing provisions 47 262 13 301 60 563 Business Transfer/Acquisition 38 – 38 Amounts utilised during the period (42 706) (8 108) (50 814) Unused amounts reversed during the period (1 790) (842) (2 632)Carrying amount at 30 June 2007 R71 839 R14 667 R86 506
2006Carrying amount at 1 July 2005 62 952 22 581 85 533 Additional provisions made in the period, including increases to existing provisions 38 195 9 616 47 811 Amounts utilised during the period (31 119) (17 080) (48 199) Unused amounts reversed during the period (993) (4 801) (5 794) Carrying amount at 30 June 2006 R69 035 R10 316 R79 351The majority of employee benefits is in respect of provisions for bonuses and leave pay.
49
Seardel Report 2007 9/18/07 9:54 AM Page 49

Notes to the Financial Statements FOR YEAR ENDED 30 JUNE 2007
50
Rand thousands Group
21. PRIOR YEAR ADJUSTMENTS2006 as Prior year Restated
previously adjustmentIncome Statement stated impactRevenue 3 686 322 (102 620) 3 583 702 Cost of sales (2 806 496) 102 656 (2 703 840)Gross profit 879 826 36 879 862 Other operating income 128 823 (1 811) 127 012 Distribution costs (421 112) 126 (420 986) Administrative and other expenses (434 844) 1 232 (433 612) Operating profit before finance costs 152 693 (417) 152 276 Finance income 15 463 (44) 15 419 Finance expenses (61 991) – (61 991) Share of losses from joint venture – (446) (446) Profit before taxation 106 165 (907) 105 258 Taxation (19 366) 525 (18 841) Profit for the year 86 799 (382) 86 417
Balance SheetNon-current assets 1 029 537 86 084 1 115 621Property, plant and equipment 971 703 (25 959) 945 744 Interest in joint venture – 10 896 10 896Investments 1 801 – 1 801 Long-term receivables 49 153 8 310 57 463 Deferred taxation 6 880 92 837 99 717 Current assets 1 650 455 (11 411) 1 639 044Inventories 736 921 (8 893) 728 028 Trade and other receivables 703 923 (2 394) 701 529Non-current assets held for sale 27 741 – 27 741 Cash and cash equivalents 181 870 (124) 181 746 TOTAL ASSETS R2 679 992 R74 673 R2 754 665
Total equity 1 370 789 6 440 1 377 229Share capital and share premium 6 262 – 6 262 Treasury shares (4 740) – (4 740)Reserves 1 366 071 5 612 1 371 683 Total equity attributable to equity holders 1 367 593 5 612 1 373 205 Minority interest 3 196 828 4 024 Non-current liabilities 484 809 70 762 555 571Interest-bearing liabilities 256 619 (17 957) 238 662 Deferred liabilities 68 074 – 68 074Deferred taxation 154 303 88 719 243 022 Operating lease accrual 5 813 – 5 813 Current liabilities 824 394 (2 529) 821 865Interest-bearing liabilities 217 496 – 217 496 Trade and other payables 497 355 – 497 355Provisions 79 351 – 79 351 Bank overdrafts 22 159 – 22 159 Taxation payable 8 016 (2 529) 5 487 Dividend to shareholders 17 – 17 TOTAL EQUITY AND LIABILITIES R2 679 992 R74 673 R2 754 665
Over accrual of Duty Credit CertificatesAn over accrual of Duty Credit Certificates in the prior year reduced the prior year’s results by R1 605 thousand (R1 140 thousand after tax).IFRS adjustmentA miscalculation of an IFRS item reduced the prior year’s results by R207 thousand (R147 thousand after tax).Reclassification of investment in joint ventureIn the prior year a minority equity holding in Sustainable Fibre Solutions (Pty) Ltd was consolidated on the basis of management control. Upon closer scrutinyit has become clear that the nature of this control was incorrectly interpreted and the investment should be accounted for as a joint venture. Summary financialinformation for this venture is shown in note 9, Equity accounted investee. The results of this venture and allocation of minority interest have been excluded fromthe comparative figures and replaced with an equity accounted adjustment. In addition a third party did not take up their allotment of shares and the currentshareholders proportionate interest in the joint venture was amended accordingly. This served to increase prior results by R77 thousand and also increased theamount due to minorities by R828 thousand.Reversal of provision for doubtful debtsA subsidiary company reversed a provision of R700 000 for doubtful debts. This reversal had no impact on the prior year profits.Alignment of liability to the South African Revenue ServicesFollowing the receipt of a tax assessment, a subsidiary company aligned their accounting records with said assessment. This alignment had no effect onprofits in the prior year. The alignment resulted in a decrease in taxation payable of R2 528 450.Adjustment to deferred taxA subsidiary company had made payment of certain taxes in advance of these taxes becoming due. The same obligation had been provided for as deferredtax and this has now been corrected. The correction did not require any adjustment to prior year profits and decreased the deferred tax liability by R 3 593 199.Restatement of turnoverPreviously certain intra group sales transactions had not been eliminated on consolidation. This has now been corrected. In addition, certain trade discountsand volume rebates were not set off against turnover. To comply with Circular 06/09 these have now been offset. The net effect of these adjustments was toreduce turnover in the prior year by R103 million. This was a reallocation and had no impact on the prior year profit.Reclassification of deferred taxIn the prior year the deferred tax asset and liability balances were allocated according to the net underlying asset or liability at a legal entity level. This hasbeen restated to show the assets and liabilities according to their type.
Seardel Report 2007 9/18/07 9:54 AM Page 50
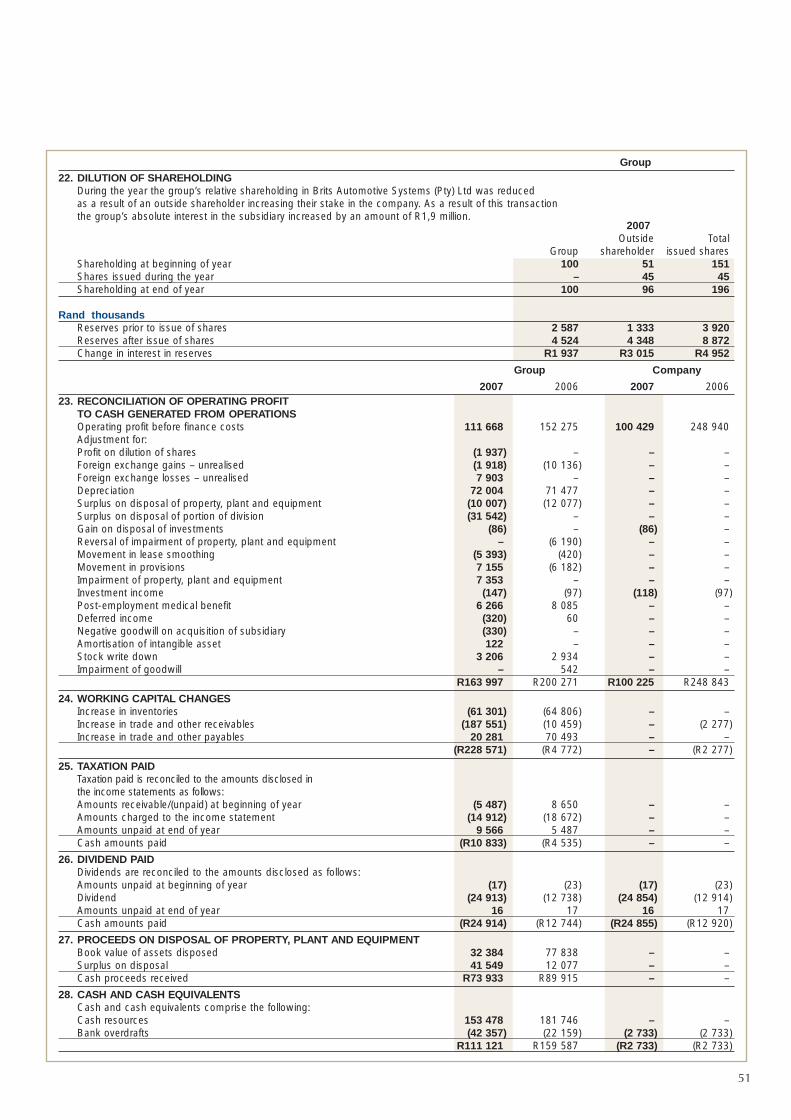
51
Group22. DILUTION OF SHAREHOLDING
During the year the group’s relative shareholding in Brits Automotive Systems (Pty) Ltd was reducedas a result of an outside shareholder increasing their stake in the company. As a result of this transaction the group’s absolute interest in the subsidiary increased by an amount of R1,9 million.
2007Outside Total
Group shareholder issued sharesShareholding at beginning of year 100 51 151Shares issued during the year – 45 45Shareholding at end of year 100 96 196
Rand thousandsReserves prior to issue of shares 2 587 1 333 3 920Reserves after issue of shares 4 524 4 348 8 872Change in interest in reserves R1 937 R3 015 R4 952
Group Company
2007 2006 2007 200623. RECONCILIATION OF OPERATING PROFIT
TO CASH GENERATED FROM OPERATIONSOperating profit before finance costs 111 668 152 275 100 429 248 940 Adjustment for:Profit on dilution of shares (1 937) – – –Foreign exchange gains – unrealised (1 918) (10 136) – –Foreign exchange losses – unrealised 7 903 – – –Depreciation 72 004 71 477 – –Surplus on disposal of property, plant and equipment (10 007) (12 077) – –Surplus on disposal of portion of division (31 542) – – –Gain on disposal of investments (86) – (86) –Reversal of impairment of property, plant and equipment – (6 190) – –Movement in lease smoothing (5 393) (420) – –Movement in provisions 7 155 (6 182) – –Impairment of property, plant and equipment 7 353 – – –Investment income (147) (97) (118) (97)Post-employment medical benefit 6 266 8 085 – –Deferred income (320) 60 – –Negative goodwill on acquisition of subsidiary (330) – – –Amortisation of intangible asset 122 – – –Stock write down 3 206 2 934 – –Impairment of goodwill – 542 – –
R163 997 R200 271 R100 225 R248 843
24. WORKING CAPITAL CHANGESIncrease in inventories (61 301) (64 806) – –Increase in trade and other receivables (187 551) (10 459) – (2 277) Increase in trade and other payables 20 281 70 493 – –
(R228 571) (R4 772) – (R2 277)
25. TAXATION PAIDTaxation paid is reconciled to the amounts disclosed in the income statements as follows:Amounts receivable/(unpaid) at beginning of year (5 487) 8 650 – –Amounts charged to the income statement (14 912) (18 672) – –Amounts unpaid at end of year 9 566 5 487 – –Cash amounts paid (R10 833) (R4 535) – –
26. DIVIDEND PAIDDividends are reconciled to the amounts disclosed as follows:Amounts unpaid at beginning of year (17) (23) (17) (23)Dividend (24 913) (12 738) (24 854) (12 914)Amounts unpaid at end of year 16 17 16 17 Cash amounts paid (R24 914) (R12 744) (R24 855) (R12 920)
27. PROCEEDS ON DISPOSAL OF PROPERTY, PLANT AND EQUIPMENTBook value of assets disposed 32 384 77 838 – –Surplus on disposal 41 549 12 077 – –Cash proceeds received R73 933 R89 915 – –
28. CASH AND CASH EQUIVALENTSCash and cash equivalents comprise the following:Cash resources 153 478 181 746 – –Bank overdrafts (42 357) (22 159) (2 733) (2 733)
R111 121 R159 587 (R2 733) (R2 733)
Seardel Report 2007 9/18/07 9:54 AM Page 51

Notes to the Financial Statements FOR YEAR ENDED 30 JUNE 2007
52
Rand thousands Group
29. POST-EMPLOYMENT MEDICAL BENEFITS 2007 2006Amounts recognised in the income statement:Current service cost 1 320 1 408 Interest on the obligation 4 946 4 413 Net actuarial losses recognised – 2 264Total included in staff costs R6 266 R8 085 Movements in the net liability recognised in the balance sheet are as follows: Net liability at beginning of year 67 754 63 071Net expense in the income statement 6 266 8 085Contributions (3 620) (3 402)Net liability in balance sheet R70 400 R67 754The principal actuarial assumptions at the balance sheet date:Discount rate 7,5% 7,5%Medical inflation 6,0% 6,0%
30. ACQUISITION OF SUBSIDIARYWith effect from 25 April 2007, the group acquired the entire share capital of Val Hau et Cie (Pty) Ltd.From this date until the year end, profits after tax of R 509 874 were earned and have been included in the consolidated results. Had the acquisition occurred at the beginning of the financial year, losses after tax of R4 268 204 would have been recognised.
2007The fair value of assets and liabilities acquired were as follows: Recognised
Pre-acquisition Fair value value oncarrying values adjustments acquisition
Property, plant and equipment 91 – 91Inventory 1 996 – 1 996Trade and other receivables 2 088 – 2 088Prepayments 139 – 139Deferred taxation 3 146 – 3 146 Trade and other payables (3 264) – (3 264) Provisions (38) – (38) Overdraft (59) – (59)Intangible assets – 4 037 4 037 Deferred taxation – intangible assets – (1 170) (1 170)Net identifiable assets and liabilities 4 099 2 867 6 966 Negative goodwill (330)Total purchase consideration 6 636 Add overdraft acquired 59 Cash flow on acquisition of subsidiary R6 695
31. LEASES 2007 2006
Non-cancellable operating lease rentals are payable as follows: Nominal Amount
Less than one year 32 601 28 471Between one and five years 72 786 70 078More than five years 7 743 6 333
R113 130 R104 882Non-cancellable operating lease rentals are receivable as follows:Less than one year 766 572Between one and five years – 349
R766 R921
32. BORROWING FACILITIESAvailable facility 916 224 953 330 Net utilised (471 391) (314 464)Unutilised balance R444 833 R638 866
Seardel Report 2007 9/18/07 11:40 AM Page 52

Rand thousands Group33. DIRECTORS’ EMOLUMENTS
2007Paid by a subsidiary company Retirement & Share options Directors OtherName Salary Bonus medical contributions delivered fees benefits Total
Executive DirectorsA. Searll (Chief Executive Officer) 2 189 1 806 46 – 89 405 4 535A. D. Jacobson 1 065 528 198 – 60 97 1 948W. Simeoni 1 847 349 257 1 221 60 196 3 930
5 101 2 683 501 1 221 209 698 R10 413
Non Executive DirectorsN. Lazarus (Chairman) – – – – 392 – 392J. Copelyn – – – – 60 – 60R. Upton – – – – 228 – 228
680 R680R11 093
For the interest of directors in the company’s share capital please refer to the Directors’ Report. Directors’ interest in contracts is disclosed in note 36. Shareoptions: Mr W. Simeoni has a remaining option for 100 000 (2006: 300 000) N ordinary shares at R1,80. This option has been exercised in terms of the rulesof the scheme, but no delivery has taken place.
2006Paid by a subsidiary company Retirement & Share options Directors OtherName Salary Bonus medical contributions delivered fees benefits Total
Executive DirectorsA. Searll (Chief Executive Officer) 2 022 2 962 158 – 82 403 5 627A. D. Jacobson 926 774 162 – 55 53 1 970W. Simeoni 1 735 240 241 – 55 147 2 418
4 683 3 976 561 – 192 603 R10 015
Non Executive DirectorsN. Lazarus (Chairman) – – – – 376 – 376K. A. Blumberg – – 17 – – – 17J. Copelyn – – – – 55 – 55R. Upton – – – – 55 46 101
– – 17 – 486 46 R549R10 564
34. FOREIGN CURRENCY COMMITMENTS
Currency Uncovered Covered Total2007
Foreign currency monetary items are as follows:Foreign receivables AUD 324 – 324
EUR 15 434 908 16 342 GBP 21 808 7 797 29 605 USD 8 843 3 526 12 369
R46 409 R12 231 R58 640 Foreign payables CHF 440 – 440
EUR 13 247 – 13 247GBP 9 757 – 9 757 SGD 237 – 237 USD 38 446 53 533 91 979 YEN 172 – 172
R62 299 R53 533 R115 832 2006
Foreign currency monetary items are as follows:Foreign receivables USD 548 9 756 10 304
GBP 18 423 12 110 30 533 EUR 2 472 11 512 13 984 AUD 177 457 634
R21 620 R33 835 R55 455 Foreign payables USD 61 602 95 584 157 186
GBP 10 021 3 306 13 327 EUR 14 228 8 109 22 337 SEK 59 – 59 SGD – 105 105 CHF 488 – 488
R86 398 R107 104 R193 502
35. COMMITMENTS 2007 2006
Contracted for 22 041 41 389Authorised but not contracted for 1 984 593
R24 025 R41 982
It is envisaged that this capital expenditure, relating to the acquisition of plant and equipment, will be incurred in the forthcoming financial yearand will be funded from internal cash resources and, if deemed necessary, external resources.
53
Seardel Report 2007 9/18/07 9:54 AM Page 53

Notes to the Financial Statements FOR YEAR ENDED 30 JUNE 2007
36. RELATED PARTIES
Transactions between group companies: During the year, in the ordinary course of business, certain companies within the group entered intotransactions. These intra-group transactions have been eliminated on consolidation.
Acquisition of shares: A subsidiary company acquired 171,8 thousand ordinary shares and 1,31 million ‘N’ ordinary shares from the market fora total consideration of R10 million.
Seardel Investment Corporation Limited acquired 528,5 thousand shares from a related party for a total consideration of R4,2 million.
Transactions with entities controlled by directors: Subsidiary companies within the group have entered into property lease transactions atmarket related rentals with Dr A Searll or entities controlled by him or in which he has part ownership. The monetary value of these transactionsis R8 151 090 for the year ended 30 June 2007 (2006: R7 809 547).
A subsidiary company has a loan owing to Grawood Investments (Proprietary) Limited, a company of which Dr A Searll is the sole shareholder.This loan bears interest at a rate of prime minus 1%. The monetary value of the loan at 30 June 2007 is R87 590 000 (2006: R75 090 000) andthe related interest for the year ended 30 June 2007 is R9 713 032 (2006: R7 837 785).
The company engages the services of Searay BD100 Charters, a partnership in which Dr A Searll has a 30% interest. The related expense isR498 167 (2006: R512 778).
The group engages the services of Crystal River Consultants, an entity owned by a family member of Dr A Searll. The related expense is R906 822 (2006: R950 000).
Mr J Copelyn is a non-executive director of Mettle Limited. Group companies have entered into financial transactions with the Mettle Group as setout in note 37 below.
Remuneration key management personnel: Key management personnel are directors and those executives having authority and responsibilityfor planning, directing and controlling the activities of the group. The remuneration paid by the group to its key management personnel amountedto R28,7 million (2006: R26,4 million).
Shares held by directors and their related entities: The percentage of shares held by directors of the company and their related entities atthe balance sheet date are disclosed in the directors’ report on page 33.
Related parties: All subsidiaries qualify as related parties. All subsidiaries are listed on page 56.
37. FINANCIAL INSTRUMENTSForeign currency management: Operating subsidiaries undertake transactions denominated in foreign currencies and hence exposures to exchange rate fluctuations arise. Material exchange rate exposure on imported raw materials, trade debtors/creditors, foreign currency assets and liabilities and capital equipment is hedged through the use of forward exchange contracts. Trade exports are hedged using forwardexchange contracts and customer foreign currency accounts. Forward exchange contracts are not used for speculative purposes. At 30 June 2007,the following forward exchange contracts had been entered into:
Currency Foreign Amount 000’s Average Rate Rand Amount 000’s2007
Imports British Pound 397 14,1 5 610 US Dollar 36 353 7,3 264 080 Euro 548 9,7 5 302
Exports British Pound 43 14,6 627 Euro 496 9,8 4 841
2006
Imports British Pound 457 13,3 6 098 US Dollar 31 192 6,3 197 639 Euro 379 8,1 3 084
Exports British Pound 1 553 12,9 20 084 US Dollar 205 6,5 1 341 Australian Dollar 28 4,9 138 Euro 2 523 8,3 20 910
Interest rate management: The group is exposed to interest rate risk as it borrows and places funds on the money market. This risk ismanaged by maintaining an appropriate mix of fixed and daily call placements with reputable financial institutions.
Credit risk management: Financial assets, which potentially subject the group to concentrations of credit risk, consist principally of cash andcash equivalents, investments and receivables. A significant amount of the Group’s trade debt is in respect of sales to subsidiaries of the majorlisted clothing retailers in particular Woolworths Holdings Limited and Edcon Limited. The risk on cash and cash equivalents is managed throughdealing with established financial institutions with high credit standing.
Receivables are presented net of impairment provisions. The risk arising on trade receivables is managed through a stringent group policy onthe granting of credit limits, continual review and monitoring of these limits and insurance of trade receivables through an independent party. Collateral and other forms of tangible securities are obtained in respect of other receivables.
The company is jointly and severally liable in respect of third party liabilities incurred by subsidiary companies.
Cash flow and funding risk management: This risk is managed through cash flow forecasts and ensures that adequate borrowing facilitiesare maintained.
In terms of the articles of association, the group’s borrowing powers are unlimited. Refer to note 32 for borrowing facilities.
54
Seardel Report 2007 9/18/07 9:54 AM Page 54

Maturity profile of financial instruments: Maturity profile of financial assets and liabilities at 30 June 2007 is summarised as follows:
Rand Thousands0 – 12 months 1 – 3 years 3 – 5 years Over 5 years Total
2007AssetsInvestments – – 2 352 16 473 18 825 Long term receivables – 55 504 – – 55 504 Trade and other receivables 893 225 – – – 893 225 Cash and cash equivalents 153 478 – – – 153 478 Total financial assets 1 046 703 55 504 2 352 16 473 1 121 032 LiabilitiesInterest-bearing borrowings 307 129 275 383 – – 582 512 Trade and other payables 528 841 – – – 528 841 Operating lease accruals – 420 – – 420 Provisions 86 506 – – – 86 506 Dividends 16 – – – 16Bank overdrafts 42 357 – – – 42 357 Taxation payable 9 566 – – – 9 566 Deferred liabilities – – – 70 400 70 400 Total financial liabilities 974 415 275 803 – 70 400 1 320 618 Net financial (liabilities)/assets R72 288 (R220 299) R2 352 (R53 927) (R199 586)
2006AssetsInvestments – – 1 801 10 896 12 697 Long term receivables – 57 463 – – 57 463 Trade and other receivables 701 529 – – – 701 529 Cash and cash equivalents 181 746 – – – 181 746 Total financial assets 883 275 57 463 1 801 10 896 953 435 LiabilitiesInterest-bearing borrowings 217 496 238 662 – – 456 158 Trade and other payables 497 355 – – – 497 355Operating lease accruals – 5 813 – – 5 813Provisions 79 351 – – – 79 351Dividends 17 – – – 17Bank overdrafts 22 159 – – – 22 159 Taxation payable 5 487 – – – 5 487 Deferred liabilities – – – 68 074 68 074Total financial liabilities 821 865 244 475 – 68 074 1 134 414 Net financial (liabilities)/assets R61 410 (R187 012) R1 801 (R57 178) (R180 979)Fair value of financial instruments: The fair value of financial assets and liabilities approximate their carrying values as disclosed in the balance sheet.Unrecognised financial liability: In terms of the group’s policy on financial investments, the group has not recognised the following financial liability: Seardel Group Trading (Pty) Limited has entered into a loan arrangement with Mettle Financial Trading (Pty) Ltd, a financecompany in terms of which it borrowed R100 million. The loan is repayable on 31 October 2007 and interest is payable at 16,5% per annum.Unrecognised financial asset: In terms of the group’s policy on financial investments, the group has not recognised the following asset:Seardel Number 17 (Pty) Ltd purchased a R100 million preference share investment which carries a 14,04% dividend coupon rate and isredeemable on 31 October 2007. For security of the preference share investment, Mettle Financial Trading (Pty) Ltd has pledged its loanreceivable from Seardel Group Trading (Pty) Ltd in the event of default in terms of the preference share arrangement. For security of SeardelGroup Trading (Pty) Ltd’s loan, Seardel Number 17 (Pty) Ltd has pledged its preference share investment to Mettle Financial Trading (Pty) Ltd inthe event of default in terms of the loan arrangement.
38. CONTINGENCIES
There are uncertainties regarding the probability of outflows of resources and the quantum of possible obligations with regard to the “improper use” of surplus funds in terms of amendments to the Pension Funds Act No 24 of 1956. Based on legal advice taken, the directorsdo not believe that such outflows are likely to materialise.
A subsidiary company has a contingent liability in the amount of R3m relating to the payment of back pay following the dismissal of certainemployees. This matter is subject to an appeal to be heard in the Labour Appeal Court. Based on legal advice taken the directors do not considerthat this liability is likely to materialise. There is also a further contingent liability of approximately R800 000 relating to retrenchment claims.
55
Seardel Report 2007 9/18/07 9:54 AM Page 55

Interest in Subsidiary Companies AT 30 JUNE
Name of subsidiary companies
(Incorporated in the Republic of South Africa unless otherwise stated)
Issued capital % Interest Shares at book value
2007 2006 2007 2006 2007 2006Direct holdings R R % % R R
Bibette (Pty) Ltd* 70 000 70 000 100 100 14 011 701 14 011 701
Brits Automotive Systems (Pty) Ltd 196 151 51 66 – –
Creative Fashions (Pty) Ltd 40 40 100 100 40 3 927 000
Consolidated Textiles (Pty) Ltd* 120 000 120 000 100 100 238 248 672 238 248 672
Frame Fibres (Pty) Ltd 600 000 600 000 100 100 – –
Harven Manufacturing Co. (Pvt) Ltd - Zimbabwe 405 001 405 001 50 50 – –
Man About Town (Menswear) Ltd - UK 1 764 1 764 100 100 1 764 1 764
Nyenye Clothing Manufacturers (Pty) Ltd - Lesotho 1 000 – 100 – 1 000 –
Oceanair Travel (Pty) Ltd 2 600 2 600 55 55 13 805 13 805
Prima Toy and Leisure Group (Pty) Ltd 823 290 823 290 100 100 34 636 997 34 636 997
SA Industrial Supplies Ltd - UK* 100 100 100 100 – –
South African Clothing Industries (Pty) Ltd* 637 865 637 865 100 100 – –
Seardel Group Trading (Pty) Ltd 2 500 000 2 500 000 100 100 7 546 905 7 546 905
Seardel Number 15 (Pty) Ltd* – 8 000 – 100 – –
Seardel Number 16 (Pty) Ltd* 180 895 180 895 100 100 15 231 860 15 231 860
Seardel Number 17 (Pty) Ltd 100 100 100 100 – –
Seartec (Pty) Ltd 669 106 669 106 100 100 85 358 581 85 358 581
Seartec Trading (Pty) Ltd 1 000 – 74,9 – 749 –
Val Hau et Cie (Pty) Ltd 10 000 – 100 – 6 635 818 –
Ordinary shares at book value 401 687 892 398 977 285
Preference shares at book value 107 760 000 107 760 000
Shares at book value R509 447 892 R506 737 285
Amounts owing (to)/by subsidiary companies (R39 076 530) (R99 168 131)
Seardel Group Trading (Pty) Ltd 57 065 275 (103 376 073)
Seartec Industries (Pty) Ltd (127 995 190) –
Seardel Number 17 (Pty) Ltd 69 891 454 47 850 452
Bibette (Pty) Ltd (24 653 728) (24 653 728)
Other (13 384 341) (18 988 782)
These loans are interest free and there are no fixed terms for repayment
*Dormant
56
Seardel Report 2007 9/18/07 9:54 AM Page 56

2007 2006
Banks, investment, finance and nominee companies and trusts 49% 47%
Directors and staff 20% 20%
Individuals 13% 14%
Insurance companies and pension funds 18% 19%
2007 2006
Banks, investment, finance and nominee companies and trusts 12% 11%
Directors and staff 65% 65%
Individuals 8% 8%
Insurance companies and pension funds 15% 16%
The JSE Limited Information – 30 June 2007 2006
Total transactions Ordinary 139 216
N Ordinary 426 1 006
Total number of shares traded (000) Ordinary 1 773 2 648
N Ordinary 5 363 34 067
Total value of shares traded (R000) Ordinary 9 493 12 458
N Ordinary 39 891 160 789
Weighted average number of shares in issue (000) Ordinary 23 044 24 161
N Ordinary 67 971 81 063
% of shares traded to weighted average number of issued shares Ordinary 8 11
N Ordinary 8 42
Seardel Number % of totalN ordinary shares of shareholders shareholders Number of shares % of total shares
2007 2006 2007 2006 2007 2006 2007 2006
1 – 1 000 352 362 36 35 129 978 133 953 – –
1 001 – 5 000 327 346 33 33 848 488 917 805 1 1
5 001 – 50 000 223 251 23 24 3 693 538 4 280 432 6 6
50 001 – 100 000 36 37 4 4 2 673 757 2 835 766 4 4
Over – 100 001 43 43 4 4 61 620 250 61 595 232 89 89
981 1 039 100 100 68 966 011 69 763 188 100 100
Analysis of ShareholdersSeardel Number % of total
ordinary shares of shareholders shareholders Number of shares % of total shares
2007 2006 2007 2006 2007 2006 2007 2006
1 – 1 000 605 633 72 72 143 932 153 060 1 1
1 001 – 5 000 147 152 17 17 381 132 383 262 1 1
5 001 – 50 000 78 79 9 9 1 097 667 1 161 741 5 5
50 001 – 100 000 9 9 1 1 724 901 724 901 3 3
Over – 100 001 10 10 1 1 20 736 995 21 190 157 90 90
849 883 100 100 23 084 627 23 613 121 100 100
57
Seardel Report 2007 9/18/07 9:54 AM Page 57

Operating DivisionsMANAGEMENT AND LOCATIONS
(ALL 100% OWNED UNLESS OTHERWISE STATED)
The divisional directors and senior management of the
various operating divisions have autonomy in respect of
their operations and vast experience accumulated over a
long period in the markets in which they are involved.
Seardel Group Trading (Pty) Ltd
A Searll, G C de Bruin, A D Jacobson.
2nd Floor, Seardel House, Alphen Park,
Constantia Main Road, Constantia, Cape Town.
MANAGEMENT DIVISIONS
Seardel Management Services
A Searll, A D Jacobson.
2nd Floor, Seardel House, Alphen Park,
Constantia Main Road, Constantia, Cape Town.
South African Clothing Industries
M D Davidson (Chairman), B Smart (Managing), A Dubin,
L Gordon, D R Kalyan, K G Robson, R Sivpersad.
195 Leicester Road, Mobeni, Durban.
OFFICE AUTOMATION AND CONSUMER ELECTRONICS DIVISION
Seartec Trading (Pty) Ltd (74,9% owned)
Sharp Electronics and Scripto
A Searll (Chairman), G C de Bruin (Deputy chairman),
T J S Atkinson (Managing director), A Charalambous,
T P Leeuw, (L D Katz. alternate), S M Moloko.
C L‘E Angus (Scripto managing executive).
Sharp Centre, 10 Berg Street, Jeppestown, Johannesburg.
Head Office and branch: Sharp House,
cnr Browning Street and Main Road,
Observatory, Cape Town.
Other main branches at: 16 Pineside Road, New Germany.
21 Lombard Street, Hilton, Bloemfontein.
Sharp Centre, 9th Avenue, Walmer, Port Elizabeth.
Branches also at: East London, Kimberley, Klerksdorp,
Nelspruit, Pretoria, Vereeniging, Welkom.
TRAVEL AND EXPORT DIVISIONS
Oceanair Travel (Pty) Ltd (55% owned)
B A Kolb (Managing), R Berkowitz, A D Jacobson,
G N Jones, R Rutter.
9 Wellington Road, Parktown, Johannesburg.
1st Floor, Strathmore Park, 305 Musgrave Road,
Durban, KZN.
7th Floor, Broadway Centre, cnr Adderley Street and
Hertzog Boulevard, Foreshore, Cape Town.
Man About Town (Menswear) Ltd
M Levene, H Levene.
10 Thames Street, Middlesex TW1 65QP
LINGERIE AND FOUNDATION GARMENTS DIVISIONS
Charmfit
R L Richter (Managing), C Cole, I Harrison, P M Morgan,
S Hopwood, B Reid, I Taverner.
1 Moorsom Avenue, Epping Industria 2, Cape Town.
Cape Underwear Manufacturers
C Beekman (Managing), P Abrahamson,
W Bebb, F Stokell.
Losack Avenue, Epping Industria 2, Cape Town.
Creative Fashions
C Beekman (Chairman), S Margolit (Managing), W Bebb,
W Vorster, J Vorster, L Blomerus.
Losack Avenue, Epping Industria 2, Cape Town.
Straton Clothing
C Beekman (Chairman), P Abrahamson (Managing), M Papadakis.
Losack Avenue, Epping Industria 2, Cape Town.
Val Hau et Cie (Pty) Ltd
C Beekman (Managing), W Bebb.
Losack Avenue, Epping Industria 2, Cape Town.
Harven Manufacturing Co (Pvt) Ltd (50% owned)
W P Keates (Managing), A Searll.
Wakefield Road, Belmont, Bulawayo, Zimbabwe.
Prestige Clothing Manufacturers
B Smart (Chairman), L Gordon (Managing),
A B Berchowitz, T E Besson, D B Englund, J Havemann,
A Kleynhans, A Narainsamy, A J van Dyk, E C van Eck, R Varaden.
195 Leicester Road, Mobeni, Durban.
21 Blue Street, Pieters Industrial Estate, Ladysmith, KZN.
SPORTSWEAR AND PLAYWEAR DIVISIONS
Cygnet Manufacturing Co
J A Broadhurst (Managing), T Mennell, A E Millward.
Bofors Circle, Epping Industria 2, Cape Town.
Dermar Designs
B Smart (Managing), A J M Doyle, J Havemann,
B von Alten Reuss.
195 Leicester Road, Mobeni, Durban.
21 Blue Street, Pieters Industrial Estate, Ladysmith, KZN.
4th Floor, Sharp House, Main Road, Observatory, Cape Town.
58
Seardel Report 2007 9/18/07 9:54 AM Page 58
SPORTSWEAR AND PLAYWEAR DIVISIONS (CONTINUED)
Little Number
B Smart (Chairman), L Gordon (Managing),
L E Holmes, A Kleynhans, L A Smithard.
195 Leicester Road, Mobeni, Durban.
21 Blue Street, Pieters Industrial Estate, Ladysmith, KZN.
FASHION DIVISIONS
Bibette
K Winer (Chairman and Joint Managing), E Wiswedel (Joint Managing),
S Schneider, R Stellenboom, D Tuckett.
Induland Crescent, Nerissa Estate, Lansdowne, Cape Town.
Bonwit
C G de Bruin (Chairman), J Cozzi (Managing),
T R Gartner, S Semaar, K R Tacon.
Mymoena Crescent, Athlone Industria 2, Cape Town.
KNITTING, QUILTING AND TEXTILE DIVISIONS
Brits Nonwoven, Brits Automotive Systems (Pty) Ltd (51% owned)
and Sustainable Fibre Solutions (Pty) Ltd (33% owned)
G C de Bruin (Chairman),
C K Capstick-Dale (Managing), M Luchtenstein,
M Pardoe, J Pretorius, L Woolley.
Head Office: 10th Floor Reserve Bank Building, cnr Hout & St George’s
Streets, Cape Town.
Factory: John van Niekerk Street, Atlantis Industria, Cape Town.
Warehouses: 69 Pomona Road, Pomona, Kempton Park, Gauteng.
41 Suffert Street, Pinetown, KZN.
Frame Textile Group
A Searll (Chairman), W Simeoni (Managing),
R Upton (Non-executive), R J Whiteford.
124 Escom Road, New Germany, KZN.
Desirée Quilted Products
G C de Bruin (Chairman), E Haller (Managing),
A A Fish.
Christopher Starke Street, Atlantis Industria, Cape Town.
Monviso Knitwear
I Stein (Managing), G C de Bruin, J Baard,
R Greenblo, C F Greiner, A D Jacobson, M Medell.
Nourse Avenue, Epping Industria 2, Cape Town.
LADIES OUTERWEAR DIVISIONS
South African Clothing Ladieswear
B Smart (Chairman), L Gordon (Managing), F Kent, C Tozer.
29 Grimsby Road, Mobeni, Durban.
MEN’S OUTERWEAR DIVISIONS
South African Clothing Menswear
Incorporating Cambridge Shirts, Durban Clothing
Manufacturers and Zenith Clothing
B Smart (Chairman), J N Londal (Joint managing),
L K Sivpersad (Joint managing), R L Bird, S R D Bodley,
A M Esterhuizen, B W Meyer, R Ritson, H B Strous,
P D Swemmer, R White.
29 Grimsby Road, Mobeni, Durban.
TOY DIVISION
Prima Toy and Leisure Trading (Pty) Ltd
S H Diamond (Chairman), J Diamond (Managing),
W Ambrosini, I N Morris, F Nussbaum.
5 Hawkins Avenue, Epping Industria 1, Cape Town.
14 Barney Road, Benrose, Johannesburg.
4/F Genop House, 15 Hulbert Street,
New Centre, Johannesburg.
PROPERTY DIVISION
Seardel Group Properties
A Keller (Managing), A D Jacobson.
2nd Floor, Seardel House, Alphen Park,
Constantia Main Road, Constantia, Cape Town.
A detailed list of properties is available from the company
secretary and will be posted on request to any member of the public.
59
Seardel Report 2007 9/18/07 9:54 AM Page 59
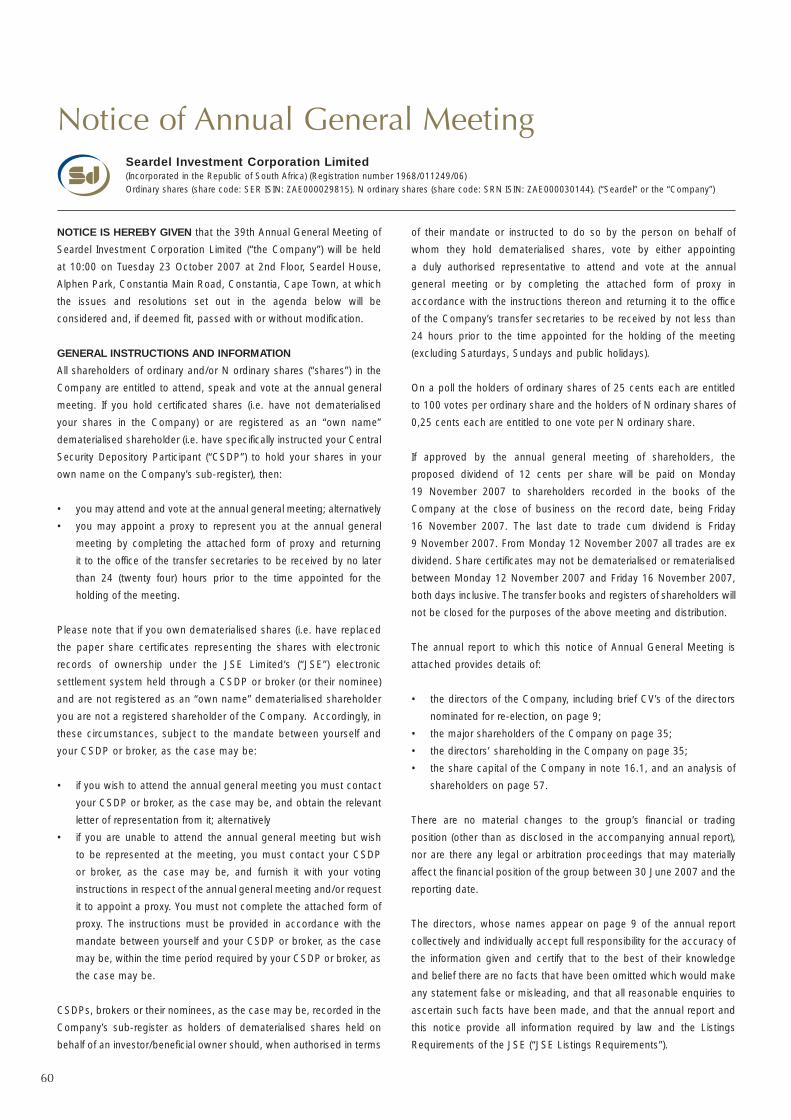
NOTICE IS HEREBY GIVEN that the 39th Annual General Meeting of
Seardel Investment Corporation Limited (“the Company”) will be held
at 10:00 on Tuesday 23 October 2007 at 2nd Floor, Seardel House,
Alphen Park, Constantia Main Road, Constantia, Cape Town, at which
the issues and resolutions set out in the agenda below will be
considered and, if deemed fit, passed with or without modification.
GENERAL INSTRUCTIONS AND INFORMATION
All shareholders of ordinary and/or N ordinary shares (“shares”) in the
Company are entitled to attend, speak and vote at the annual general
meeting. If you hold certificated shares (i.e. have not dematerialised
your shares in the Company) or are registered as an “own name”
dematerialised shareholder (i.e. have specifically instructed your Central
Security Depository Participant (“CSDP”) to hold your shares in your
own name on the Company’s sub-register), then:
• you may attend and vote at the annual general meeting; alternatively
• you may appoint a proxy to represent you at the annual general
meeting by completing the attached form of proxy and returning
it to the office of the transfer secretaries to be received by no later
than 24 (twenty four) hours prior to the time appointed for the
holding of the meeting.
Please note that if you own dematerialised shares (i.e. have replaced
the paper share certificates representing the shares with electronic
records of ownership under the JSE Limited’s (“JSE”) electronic
settlement system held through a CSDP or broker (or their nominee)
and are not registered as an “own name” dematerialised shareholder
you are not a registered shareholder of the Company. Accordingly, in
these circumstances, subject to the mandate between yourself and
your CSDP or broker, as the case may be:
• if you wish to attend the annual general meeting you must contact
your CSDP or broker, as the case may be, and obtain the relevant
letter of representation from it; alternatively
• if you are unable to attend the annual general meeting but wish
to be represented at the meeting, you must contact your CSDP
or broker, as the case may be, and furnish it with your voting
instructions in respect of the annual general meeting and/or request
it to appoint a proxy. You must not complete the attached form of
proxy. The instructions must be provided in accordance with the
mandate between yourself and your CSDP or broker, as the case
may be, within the time period required by your CSDP or broker, as
the case may be.
CSDPs, brokers or their nominees, as the case may be, recorded in the
Company’s sub-register as holders of dematerialised shares held on
behalf of an investor/beneficial owner should, when authorised in terms
of their mandate or instructed to do so by the person on behalf of
whom they hold dematerialised shares, vote by either appointing
a duly authorised representative to attend and vote at the annual
general meeting or by completing the attached form of proxy in
accordance with the instructions thereon and returning it to the office
of the Company’s transfer secretaries to be received by not less than
24 hours prior to the time appointed for the holding of the meeting
(excluding Saturdays, Sundays and public holidays).
On a poll the holders of ordinary shares of 25 cents each are entitled
to 100 votes per ordinary share and the holders of N ordinary shares of
0,25 cents each are entitled to one vote per N ordinary share.
If approved by the annual general meeting of shareholders, the
proposed dividend of 12 cents per share will be paid on Monday
19 November 2007 to shareholders recorded in the books of the
Company at the close of business on the record date, being Friday
16 November 2007. The last date to trade cum dividend is Friday
9 November 2007. From Monday 12 November 2007 all trades are ex
dividend. Share certificates may not be dematerialised or rematerialised
between Monday 12 November 2007 and Friday 16 November 2007,
both days inclusive. The transfer books and registers of shareholders will
not be closed for the purposes of the above meeting and distribution.
The annual report to which this notice of Annual General Meeting is
attached provides details of:
• the directors of the Company, including brief CV’s of the directors
nominated for re-election, on page 9;
• the major shareholders of the Company on page 35;
• the directors’ shareholding in the Company on page 35;
• the share capital of the Company in note 16.1, and an analysis of
shareholders on page 57.
There are no material changes to the group’s financial or trading
position (other than as disclosed in the accompanying annual report),
nor are there any legal or arbitration proceedings that may materially
affect the financial position of the group between 30 June 2007 and the
reporting date.
The directors, whose names appear on page 9 of the annual report
collectively and individually accept full responsibility for the accuracy of
the information given and certify that to the best of their knowledge
and belief there are no facts that have been omitted which would make
any statement false or misleading, and that all reasonable enquiries to
ascertain such facts have been made, and that the annual report and
this notice provide all information required by law and the Listings
Requirements of the JSE (“JSE Listings Requirements”).
Notice of Annual General MeetingSeardel Investment Corporation Limited(Incorporated in the Republic of South Africa) (Registration number 1968/011249/06)Ordinary shares (share code: SER ISIN: ZAE000029815). N ordinary shares (share code: SRN ISIN: ZAE000030144). (“Seardel” or the “Company”)
60
Seardel Report 2007 9/18/07 9:54 AM Page 60
Agenda1. To confirm the minutes of the shareholders’ meeting held on
24 October 2006.
2. To receive and adopt the financial statements – Ordinary
Resolution No. 1
“Resolved that the annual financial statements and group annual
financial statements for the year ended 30 June 2007 as tabled at the
meeting are hereby adopted.”
3. General Authority to Repurchase Company Shares – Special
Resolution No. 1
“Resolved that, the Company hereby approves, as a general approval
contemplated in sections 85 and 89 of the Companies Act, No. 61 of
1973, as amended, (“the Act”), the acquisition by the Company or any
of its subsidiaries from time to time of the issued shares of the
Company, upon such terms and conditions and in such amounts as the
directors of the Company may from time to time determine, but subject
to the provisions of the Act and the JSE Listings Requirements as
presently constituted and which may be amended from time to time,
and provided that:
• acquisitions by the Company and its subsidiaries of shares in the
capital of the Company may not, in the aggregate, exceed in any one
financial year 20% (twenty percent) (or 10% (ten percent) where
such acquisitions relate to the acquisition by a subsidiary) of the
Company's issued share capital of the class of the repurchased
shares from the date of the grant of this general authority;
• any such acquisition of shares shall be effected through the order
book operated by the JSE trading system and done without any
prior understanding or arrangement between the Company and the
counter party (reported trades are prohibited);
• the Company (or any subsidiary) is authorised to do so in terms of its
articles of association;
• this general authority shall only be valid until the Company’s next
annual general meeting, provided that it shall not extend beyond 15
(fifteen) months from the date of passing of this special resolution;
• in determining the price at which the Company’s shares are acquired
by the Company or its subsidiaries in terms of this general authority,
the maximum premium at which such shares may be acquired may
not be greater than 10% (ten percent) above the weighted average of
the market price at which such shares are traded on the JSE for the
5 (five) business days immediately preceding the date the repurchase
transaction is effected;
• at any point in time, the Company may only appoint one agent to
effect any repurchase(s) on the Company’s behalf;
• the Company will only undertake a repurchase if, after such
repurchase, it still complies with paragraphs 3.37 to 3.41 of the JSE
Listings Requirements concerning shareholder spread requirements;
• repurchases may not take place during a prohibited period in
compliance with paragraph 3.67 of the JSE Listings Requirements;
• in the case of a derivative (as contemplated in the JSE Listings
Requirements) the price of the derivative shall be subject to the limits
set out in section 5.84(a) of the JSE Listings Requirements;
• a paid press announcement will be published as soon as the
Company and/or its subsidiaries has/have acquired shares
constituting, on a cumulative basis, 3% (three percent) of the number
of shares of the class of shares repurchased in issue at the time of
granting of this general authority, and each time the Company
acquires a further 3% (three percent) of such shares thereafter, which
announcement shall contain full details of such acquisitions;
STATEMENT BY THE BOARD OF DIRECTORS OF THE COMPANY
Pursuant to and in terms of the JSE Listings Requirements, the Board
of Directors of the Company hereby state that:
a) it is their intention to utilise the general authority to acquire shares
in the Company if at some future date the cash resources of the
Company are in excess of its requirements or there are other good
grounds for doing so. In this regard the directors will take account
of, inter alia, an appropriate capitalisation structure for the Company,
the long-term cash needs of the Company, and the interests of
the Company;
b) in determining the method by which the Company intends to acquire
its shares, the maximum number of shares to be acquired and
the date on which such acquisition will take place, the directors of
the Company will only make the acquisition if at the time of the
acquisition they are of the opinion that:
- the Company and its subsidiaries would, after the repurchase, be
able to pay their debts as they become due in the ordinary course
of business for the next 12 (twelve) months after the date of this
notice of the annual general meeting;
- the consolidated assets of the Company and its subsidiaries, fairly
valued in accordance with South African Statements of Generally
Accepted Accounting Practice and recognised and measured in
accordance with the accounting policies used in the latest audited
financial statements, would, after the repurchase, be in excess of
the consolidated liabilities of the Company and its subsidiaries for
the next 12 (twelve) months after the date of this notice of the
annual general meeting;
- the issued share capital and reserves of the Company and its
subsidiaries would, after the repurchase, be adequate for the
ordinary business purposes of the Company or any acquiring
subsidiary for the next 12 (twelve) months after the date of
approval of this notice of the annual general meeting; and
61
Seardel Report 2007 9/18/07 9:54 AM Page 61

- the working capital available to the Company and its subsidiaries
would, after the repurchase, be adequate for ordinary business
purposes for the next 12 (twelve) months after the date of approval
of this notice of the annual general meeting;
c) they will not make any repurchase until such time as the Company’s
sponsors have provided the JSE with a letter in relation to the
working capital statement set out above (as required in terms of the
JSE Listings Requirements);
REASON AND EFFECT OF SPECIAL RESOLUTION No. 1
The reason for special resolution number 1 is to grant the Company a
general authority in terms of the Act for the acquisition by the Company,
or any of its subsidiaries, of shares issued by the Company, which
authority shall be valid until the earlier of the next annual general
meeting of the Company or the variation or revocation of such general
authority by special resolution by any subsequent general meeting of
the Company, provided that the general authority shall not extend
beyond 15 (fifteen) months from the date of this annual general meeting.
The passing and registration of this special resolution will have the effect
of authorising the Company or any of its subsidiaries to acquire shares
issued by the Company.
4. General Authority over Unissued Shares – Ordinary Resolution No. 2
“Resolved that all the unissued authorised shares in the Company, be
and are hereby placed under the control of the directors, subject to the
provisions of the Companies Act, No. 61 of 1973, as amended, and the
JSE Listings Requirements , until the next annual general meeting.”
5. Appointment of Directors - Ordinary Resolution No. 3
Messrs Aaron Searll and Arthur Jacobson retire in accordance with the
Company’s Articles of Association but, being eligible, offer themselves
for re-election. For CV details, see page 9. Accordingly, to consider and
if deemed fit, to re-elect these directors by way of passing the separate
ordinary resolutions set out below.
5.1 The appointment of Dr Aaron Searll – Ordinary Resolution No. 3.1
“Resolved that Dr Aaron Searll is hereby elected as a director of the
Company.”
5.2 The appointment of Mr Arthur Jacobson – Ordinary Resolution No. 3.2
“Resolved that Mr Arthur Jacobson is hereby elected as a director of
the Company.”
6. To confirm the fees paid to the directors - Ordinary Resolution No. 4
“Resolved that the directors’ fees paid to the directors of the Company
for the year ended 30 June 2007, as set out in the annual financial
statements accompanying the notice of annual general meeting, are
hereby confirmed.”
7. Declaration of Dividend - Ordinary Resolution No. 5
“Resolved that a dividend of 12 cents per share as proposed by
the directors, to be paid on Monday 19 November 2007 to shareholders
recorded in the register of the Company at the close of business on the
record date, being Friday 16 November 2007, is hereby declared.”
8. Re-appointment of Auditors - Ordinary Resolution No. 6
“Resolved that KPMG Inc are hereby re-appointed as the auditors to
the Company.”
9. Authorisation of Directors - Ordinary Resolution No. 7
“Resolved that each and every director of the Company be and is
hereby authorised to do all such things and sign all such documents as
may be necessary or incidental to the implementation of the resolutions
passed at this general meeting.”
10. To transact such other business which may be transacted at an
annual general meeting.
By order of the board
L A Clohessy
GROUP SECRETARY
Cape Town, 25 September 2007
Agenda
62
Seardel Report 2007 9/18/07 9:54 AM Page 62

Seardel Investment Corporation Limited.(Incorporated in the Republic of South Africa) (Registration number 1968/011249/06)Ordinary shares (Share code: SER ISIN: ZAE000029815)N ordinary shares (Share code: SRN ISIN: ZAE000030144)(“Seardel” or the “Company”)
For use at the annual general meeting of shareholders of the Company to be held at 2nd Floor, Seardel House, Alphen Park, Constantia Main Road, Constantia,Cape Town on Tuesday 23 October 2007 at 10:00.
Not to be used by beneficial owners of shares who have dematerialised their shares (“dematerialised shares”) through a Central Securities Depository Participant(“CSDP”) or broker, as the case may be, unless you are recorded on the sub-register as “own name” dematerialised shareholders (“own name dematerialisedshareholders”). Generally, you will not be an own-name dematerialised shareholder unless you have specifically requested the CSDP to record you as the holderof the shares in your own name in the Company’s sub-register.
Only for use by certificated, own name dematerialised shareholders and CSDPs or brokers (or their nominees) registered in the Company’s sub-register as theholder of dematerialised ordinary shares.
Each shareholder entitled to attend and vote at the meeting is entitled to appoint one or more proxies (none of whom need be a shareholder of theCompany) to attend, speak and vote in place of that member at the annual general meeting.
Refer to notes on reverse side hereof.
To be returned to: The Transfer Secretaries Computershare Investor Services 2004 (Pty) Limited70 Marshall Street Johannesburg 2001PO Box 61051 Marshalltown 2107
as soon as possible, to be received no later than 24 hours before the meeting.
I/We (Full names)
of (Address)
Telephone: Work ( ) Telephone: Home ( )
being a member(s) of the Company, holding ordinary shares and N ordinary shares in the Company
hereby appoint (refer note 1):
or failing him/her
or failing him/her
or failing him/her
or failing him/her the chairperson of the annual general meeting as my/our proxy to act for me/us on my/our behalf at the aforementioned annual generalmeeting of shareholders of the Company and at any adjournment thereof in accordance with the following instructions:
Votes
FOR AGAINST ABSTAIN
Ordinary Resolution no. 1: Adoption of financial statements.
Special Resolution no. 1: General authority to repurchase company shares.
Ordinary Resolution no. 2: General authority over unissued shares.
Ordinary Resolution no. 3.1: Re-election of director: Dr Aaron Searll
Ordinary Resolution no. 3.2: Re-election of director: Mr Arthur Jacobson
Ordinary Resolution no. 4: Confirmation of directors’ fees.
Ordinary Resolution no. 5: Declaration of dividend.
Ordinary Resolution no. 6: Re-appointment of the auditors.
Ordinary Resolution no. 7: General authorisation to the directors to implement resolutions passed.
Insert an “X” in the relevant spaces above according to how you wish all your votes to be cast. If you wish to cast less than all the votes in respect of the sharesheld by you, insert the number of votes in respect of which you desire to vote (100 votes per ordinary share and one vote per N ordinary share) (see note 2).Unless otherwise instructed above my/our proxy can vote as he/she deems fit.
Signed at on this day of 2007
Signature Assisted by (where applicable) Signature
Name of signatory Name of assistant
Capacity Capacity
(Authority of signatory to be attached if applicable - see note 6)
Form of Proxy
63
Seardel Report 2007 9/18/07 9:54 AM Page 63
NOTES:
1. A certificated or own name dematerialised shareholder or
nominee of a CSDP or broker registered in the Company’s
sub-register may insert the name of a proxy or the names of
two alternative proxies of the shareholder’s choice in the
space/s provided, with or without deleting “the chairperson of
the annual general meeting”, but any such deletion must be
initialled by the shareholder. The person whose name stands
first on the proxy form and who is present at the annual general
meeting will be entitled to act as proxy to the exclusion of those
whose names follow thereafter. If no proxy is inserted in the
spaces provided, then the chairperson shall be deemed to be
appointed as the proxy to vote or abstain as the chairperson
deems fit.
2. A shareholder’s instructions to the proxy must be indicated
in the appropriate box provided. If there is no clear indication
as to the voting instructions to the proxy, the proxy will be
deemed to be authorised to vote or to abstain from voting at
the annual general meeting as he/she deems fit in respect of
all the shareholder’s votes exercisable thereat. A shareholder or
his/her proxy is not obliged to use all the votes exercisable by
the shareholder, but the total of the votes cast or abstained
may not exceed the total of the votes exercisable by the
shareholder.
3. Proxy forms must be lodged with the Company’s transfer
secretaries at The Transfer Secretaries Seardel Investment
Corporation Limited, Computershare Investor Services
2004 (Pty) Limited, 70 Marshall Street, Johannesburg, 2001 or
posted to Computershare Investor Services 2004 (Pty) Limited,
PO Box 61051, Marshalltown, 2107. Forms of proxy must be
received or lodged by no later than 24 hours before the annual
general meeting, excluding Saturdays, Sundays and public
holidays (i.e. 10:00 on Monday 22 October 2007).
4. The completion and lodging of this proxy form will not preclude
the relevant shareholder from attending the annual general
meeting and speaking and voting in person thereat to the
exclusion of any proxy appointed in terms thereof.
5. Where there are joint holders of shares, the vote of the senior joint
holder who tenders a vote, as determined by the order in which
the names stand in the register of members, will be accepted.
6. Documentary evidence establishing the authority of a person
signing this proxy form in a representative capacity must be
attached to this proxy form unless previously recorded by the
Company’s transfer secretaries or waived by the chairperson of
the annual general meeting.
7. Any alteration or correction made to this proxy form must
be initialled by the signatory/ies but may not be accepted by
the chairperson.
8. A minor must be assisted by his/her parent or guardian unless
the relevant documents establishing his/her legal capacity are
produced or have been registered by the Company’s transfer
secretaries.
9. The chairperson of the general meeting may, in his/her
discretion, accept or reject any form of proxy which is
completed, other than in accordance with these notes.
10. If required, additional forms of proxy are available from the
Company’s transfer secretaries.
11. If you are the owner of dematerialised shares held through
a CSDP or broker and are not an own name dematerialised
shareholder, you are not a shareholder of the Company,
accordingly do NOT fill in this proxy form, subject to the
mandate between yourself and your CSDP or broker:
• if you wish to attend the annual general meeting you
must contact your CSDP or broker, as the case may be,
and obtain the relevant letter of representation from it;
alternatively.
• if you are unable to attend the annual general meeting
but wish to be represented at the meeting, you must
contact your CSDP or broker, as the case may be, and
furnish it with your voting instructions in respect of the
annual general meeting in accordance with the mandate
between yourself and the CSDP or broker, as the case
may be. You must not complete the attached form of
proxy. The instructions must be provided within the time
period required by your CSDP or broker, as the case
may be.
CSDPs, brokers or their nominees, recorded in the Company’s
sub-register as holders of dematerialised shares held on
behalf of an investor/beneficial owner should, when authorised
in terms of their mandate or instructed to do so by the person
on behalf of whom they hold the dematerialised shares, vote by
either appointing a duly authorised representative to attend
and vote at the annual general meeting or by completing the
attached form of proxy in accordance with the instructions
thereon and returning it to the Company’s transfer secretaries,
to be received by not less than 24 hours prior to the time
appointed for the holding of the meeting.
Form of Proxy
64
Seardel Report 2007 9/18/07 9:54 AM Page 64

People and property are the most important assets of the
group and the preservation and security of all are essential for
our continued growth and survival.
It is the personal responsibility of each individual, whatever
their position, to identify themselves with the group’s declared
priority of safety of life and preservation of group assets and
earnings, to recognise risks, real or anticipated, and to take
immediate action to reduce or eliminate them.
It is the responsibility of the divisional managing directors to
ensure that employee awareness programmes have been
introduced and are constantly reinforced.
The participation of all personnel is essential, and all soundly
conceived actions to achieve these objectives have the full
support of the group’s management.
• Most effective use of resources allocated to risk
management
• Manage predictable losses
• Self-insure to maximum capability consistent
with financial and shareholders’ interests
• Effective risk control programmes with continued
executive commitment
• Use of secure insurance markets to insure only
against catastrophes
Design and artwork by Creative Mix, Cape Town.Printed by Creda Communications.
Seardel Group Risk ManagementPhilosophy
Group RiskManagementStrategy
Contents 1 Financial Calendar and Administration
2 Chief Executive Officer’s Message
and Mission Statement
3 Financial Highlights
4 Corporate Structure
5 Report by the Chairman and
the Chief Executive Officer
9 Corporate History and Directors
11 Textile Division
14 Apparel and Household Textile Division
15 Office Automation and Consumer
Electronics Division
16 Toy Division
16 Nonwoven and Quilted Products
(Industrial) Division
17 Property, Travel and Export Divisions
18 Human Resources
21 Corporate Governance Report
22 Salient Financial Features
24 Seven Year Review
26 Segmental Report
27 Cash Value Added Statement
28 Employment Equity Progress Report
28 Annual Financial Statements Index
57 Analysis of Shareholders
58 Operating Divisions, Management and Locations
60 Notice of Annual General Meeting
Registration number 1968/011249/06The company's shares are listed under the Consumer Goods - Personal and Household Goods Sector of the JSE Limited.Seardel; Seardel-N; SER: ZAE000029815, SRN: ZAE000030144
Seardel Report 2007 Cover 9/17/07 10:23 PM Page 2

3 9 Y E A R S
2 0 0 7 A n n u a l R e p o r t
SE
AR
DE
L IN
VE
ST
ME
NT
CO
RP
OR
AT
ION
LIM
ITE
DA
NN
UA
L R
EP
OR
T 2
00
7
SEARDEL INVESTMENT CORPORATION LIMITED39TH ANNUAL REPORT
Seardel Report 2007 Cover 9/17/07 10:23 PM Page 1
Related Documents