Searching for circulation patterns affecting North Europe annual temperature Vladimir N. Kryjov Hydrometeorological Research Centre of the Russian Federation, Moscow, Russia Received 6 May 2003; revised 6 November 2003; accepted 24 November 2003 Abstract Statistical analysis of Northern Europe annual temperature against monthly pressure fields reveals that the circulation modes resembling North Atlantic/Arctic Oscillation significantly contribute to annual temperature only in January and February. In November, significant contribution is associated with the Labrador – Scandinavia teleconnection pattern. The January – February and November circulation modes are significantly (negatively) correlated with each other. q 2003 Royal Meterological Society. Published by Elsevier Ltd. All rights reserved. Keywords: Northern Europe; Annual temperature; Circulation; Teleconnections; Correlation; Regression; Field significance test 1. Introduction Change in annual mean surface air temperature (SAT) is one of the most-used indicators of climate change on both global and regional scales (IPCC, 2001). Recognition of circulation patterns substantially affecting Northern Europe annual SAT is the main objective of the study. Relationships between annual mean SAT and various indices of circulation, averaged over a year, are weak and rather unstable. However, a strong dependency of Northern Europe wintertime SAT upon intensity of warm Atlantic air advection, usually represented by indices of the North Atlantic (NAO) or Arctic oscillation (AO), has been extensively recorded (Hurrell, 1995; Thompson and Wallace, 1998, 2000; Slonosky and Yiou, 2002). Definition of winter season duration varies in these papers (2–5 months), with maximum 1530-261X/$ - see front matter q 2003 Royal Meterological Society. Published by Elsevier Ltd. All rights reserved. doi:10.1016/j.atmoscilet.2003.11.003 Atmospheric Science Letters 5 (2004) 23–34 www.elsevier.com/locate/issn/1530261X E-mail address: [email protected], [email protected] (V.N. Kryjov).

Welcome message from author
This document is posted to help you gain knowledge. Please leave a comment to let me know what you think about it! Share it to your friends and learn new things together.
Transcript

Searching for circulation patterns affecting
North Europe annual temperature
Vladimir N. Kryjov
Hydrometeorological Research Centre of the Russian Federation, Moscow, Russia
Received 6 May 2003; revised 6 November 2003; accepted 24 November 2003
Abstract
Statistical analysis of Northern Europe annual temperature against monthly pressure fields reveals
that the circulation modes resembling North Atlantic/Arctic Oscillation significantly contribute to
annual temperature only in January and February. In November, significant contribution is
associated with the Labrador–Scandinavia teleconnection pattern. The January–February and
November circulation modes are significantly (negatively) correlated with each other.
q 2003 Royal Meterological Society. Published by Elsevier Ltd. All rights reserved.
Keywords: Northern Europe; Annual temperature; Circulation; Teleconnections; Correlation; Regression; Field
significance test
1. Introduction
Change in annual mean surface air temperature (SAT) is one of the most-used
indicators of climate change on both global and regional scales (IPCC, 2001). Recognition
of circulation patterns substantially affecting Northern Europe annual SAT is the main
objective of the study.
Relationships between annual mean SAT and various indices of circulation, averaged
over a year, are weak and rather unstable. However, a strong dependency of Northern
Europe wintertime SAT upon intensity of warm Atlantic air advection, usually represented
by indices of the North Atlantic (NAO) or Arctic oscillation (AO), has been extensively
recorded (Hurrell, 1995; Thompson and Wallace, 1998, 2000; Slonosky and Yiou, 2002).
Definition of winter season duration varies in these papers (2–5 months), with maximum
1530-261X/$ - see front matter q 2003 Royal Meterological Society. Published by Elsevier Ltd. All rights
reserved.
doi:10.1016/j.atmoscilet.2003.11.003
Atmospheric Science Letters 5 (2004) 23–34
www.elsevier.com/locate/issn/1530261X
E-mail address: [email protected], [email protected] (V.N. Kryjov).

duration being defined as spanning November–March. Values of year-to-year variance in
monthly SAT for these 5 winter months are comparable, whereas they are several times
larger than for summer months. Thus, it may be expected that calendar year annual SAT is
related to January, February, March, November, and December circulation patterns
resembling the NAO and AO.
Also, for the Arctic basin, Rigor et al. (2002) have shown persistence of the wintertime
AO impact on SAT through most of the subsequent year. Similar results have been
reported for the Barents and Kara Sea coastal stations (Kryjov, 2002, 2003).
Lag correlations obtained in these studies reflect persistence in the sea surface
properties, such as temperature and ice concentration and extent. In continental Northern
Europe, springtime snow extent also depends on the AO index during previous winter
(Bamzai, 2003), suggesting existence of lag correlations between wintertime circulation
and springtime SAT.
Thus, on the basis of the cited results, we may expect certain statistically significant
relationships between annual SAT and the NAO/AO-like circulation patterns in January,
February, March, November, and December. We may also expect enlarged contribution of
circulation in January, February, and March due to its influence on the springtime snow
extent and, hence, springtime SAT.
The purpose of this study is to check the above assumption, to obtain quantitative
estimates of relationships between annual SAT and monthly circulation patterns, and thus,
to find out which monthly circulation modes significantly contribute to the observed
variations in annual SAT.
The problem, as considered in this study, is inverse to the problems, solved in the above
sited papers. Rather than estimating relationships between predefined monthly and seasonal
circulation indices (CI) and concurrent/subsequent SAT, even annual SAT (Kryjov, 2003),
in this study we search for any monthly circulation patterns significantly related to annual
SAT. The idea of the performed approach is based on the assumption that when relationships
between annual SAT and monthly/seasonal circulation modes are analysed, annual SAT
acts as a filter passing only those circulation modes, which are coherent with high variance
modes of temperature variability. An advantage of this approach resides in possibility to
capture modes of temperature variability not confined to a certain month/season but shared
and even migrating. Nevertheless, we support this method by traditional analysis of
simultaneous/lag correlations between monthly and seasonal values.
A solution of the methodologically similar problem was presented by van Loon and
Rogers (1978). Searching for circulation modes related to the seesaw in temperatures
between Greenland and Scandinavia, the authors found the NAO-like circulation mode
over the Atlantic as well as the associated variations in precipitation, sea ice distribution,
and a number of other climatic variables over the Northern Hemisphere (Rogers and van
Loon, 1979).
2. Data
The study has been performed on the basis of P.D. Jones’ 58lat £ 58lon gridbox
temperature anomalies (Jones, 1994) and gridded on 58lat £ 108lon mesh sea level
V.N. Kryjov / Atmospheric Science Letters 5 (2004) 23–3424

pressures (Jones, 1987) from 1940 to 2000 (Fig. 1). These updated data are available from
the website of the Climatic Research Unit, University of East Anglia (CRU UEA).
Some temperature gridboxes over Russia have randomly distributed gaps in
monthly data, with number of missed monthly temperatures being not more than 8 per
732 monthly values. We filled in those gaps interpolating from at least two
surrounding gridboxes. To avoid influence of the coastal stations, analysed in previous
papers (Kryjov, 2002, 2003), gridboxes based on Kanin-Nos and Narian-Mar station
data were excluded from the analysis.
The field of annual SAT over Northern Europe is rather homogeneous. Correlations
between all gridbox time series are positive and for most of the pairs of series are
well above the 95% confidence limit. Only the correlations between series of Northern
Scandinavia and south-eastern part of the domain are below that threshold. Therefore,
to represent interannual variability of Northern Europe annual SAT, we took time
series of annual SAT averaged over the domain. Prior to the area averaging, we
normalised and weighted all gridbox series by cosine of latitude.
We also used the Baltic Sea surface temperature (SST), the NAO and AO indices
as well as a set of the Northern Hemisphere Teleconnection Indices (NHTI),
monitored at the Climate Prediction Center of the National Centers for Environmental
Prediction (CPC NCEP).
To represent the Baltic SST we used four gridbox SST series (Fig. 1) of
A. Kaplan’s extended SST (Kaplan et al., 1998), posted on the website of Lamont-
Doherty Earth Observatory, Columbia University (LDEO CU).
Following Jones et al. (1997), we calculated the NAO index as a normalised
difference between Gibraltar and Iceland normalised SLP series, available on the
website of the CRU UEA.
The Arctic Oscillation (Thompson and Wallace, 1998; Thompson and Wallace,
2000) monthly indices were taken from the Annular Modes website.
The set of the NHTI (Barnston and Livezey, 1987) from 1950 to 2003 is posted on the
website of CPC NCEP.
Fig. 1. Gridded data used in the study. (1) SLP (the whole coloured area): 258N–758N, 608W–708E; 125
gridpoints; Jones (1987), CRU UEA. (2) SAT (yellow and blue): 508N–708N, 108E–608E; 34 gridboxes; Jones
(1994), CRU UEA. (3) Baltic Sea surface temperature (blue): 4 gridboxes; Kaplan et al. (1998); LDEO CU.
V.N. Kryjov / Atmospheric Science Letters 5 (2004) 23–34 25

3. Methods
We extensively applied the techniques of linear analysis in the study. In all
correlation/regression analyses, we used series with removed linear trends. The
significance level was assessed on the basis of Student’s t-statistic, accounting for
autocorrelation. Linear dependencies were considered stationary if the difference between
maximum and minimum correlation coefficients, obtained on 29 yr running samples of
61 yr series, was not significant at the 5% level in the test of the difference in means on the
basis of Student’s t-statistic, applied to Fisher transformed correlation coefficients (Yule
and Kendall, 1960).
Each correlation map between annual SAT and monthly SLP anomaly field consists of
125 local correlation coefficients. Therefore, we applied a field significance test (Livezey
and Chen, 1983) to check if significant local correlations may have been obtained by
chance. We set the 1% significance level for rejection of the local and global null-
hypotheses. So, if the SLP anomalies were not spatially correlated, occurrence of at least
five significant local correlations would have been sufficient to reject the global null-
hypothesis, which follows from calculation on the basis of cumulative Binomial
probability distribution function. However, monthly SLP anomaly fields are strongly
spatially correlated, therefore the significance of correlation maps was assessed using a
Monte Carlo approach. We calculated a number of significant local correlations m in each
monthly correlation map. Then we replaced the annual SAT time series with Gaussian
‘white noise’ time series, computed a correlation map between that white noise series and
monthly SLP anomaly field, and calculated the number of significant local correlations
m* : We repeated that procedure 500 times and assessed significance level p (%) as 1/5 of
the number of trials resulted in m* $ m:
For the months that feature significant correlation maps (m . 4 and p , 1%), we
constructed circulation patterns by regressing SLP anomalies upon the normalised annual
SAT and CI by projecting, using a Least-Squares regression, non-detrended SLP
anomalies weighted by cosine of latitude onto monthly correlation patterns. Following this
approach, each value of the monthly CI is equal to the spatial regression coefficient
between the corresponding monthly SLP anomaly field and the correlation pattern. Then
the index time series were normalised. The same technique was applied by Thompson et al.
(2000) for calculation of the proxy indices of the AO.
4. Results and discussion
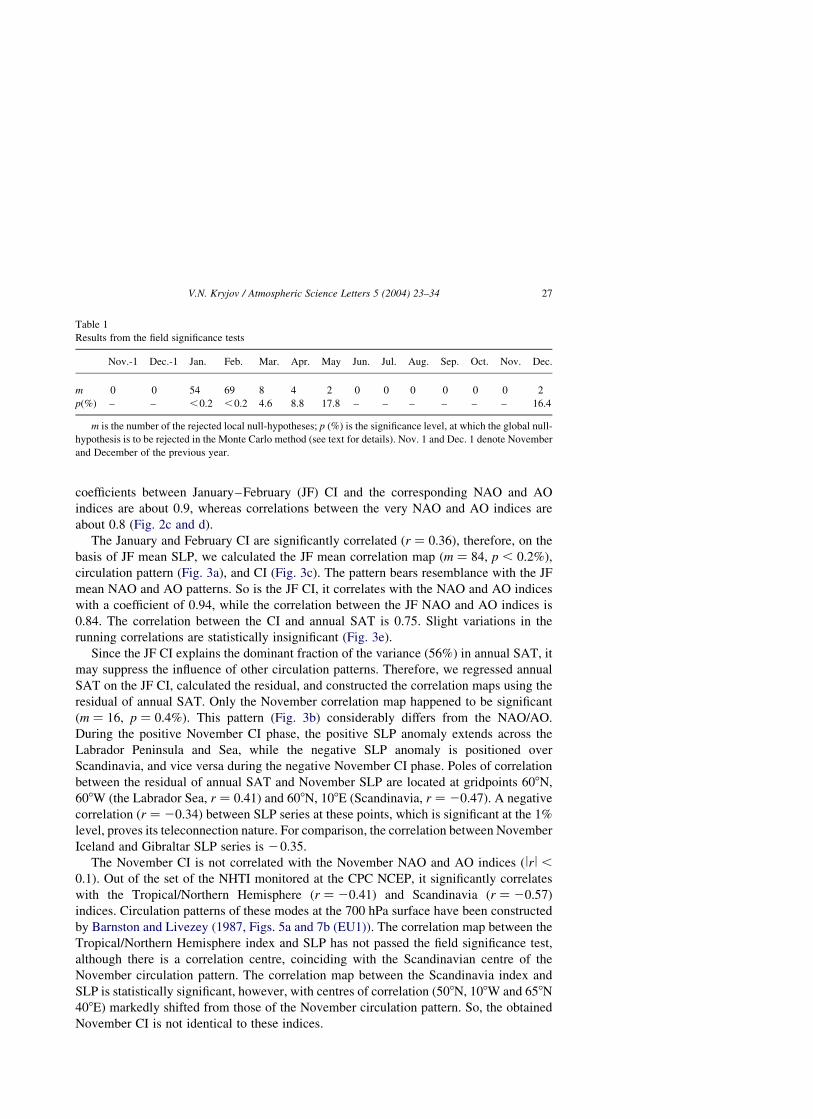
The results from the field significance tests are shown in Table 1. Surprisingly, only
January and February correlation maps appear significant. The numbers of significant local
correlations in the March, November, and December maps are insufficient to treat them as
not occasional. When the significance level was set at 5%, the results were similar.
The January and February circulation patterns (Fig. 2a and b) resemble the NAO and
AO (in the Atlantic–European sector) patterns. The main feature of these patterns is the
south–north dipole of the SLP anomaly, whose polarity and magnitude characterise
advection of the warm Atlantic air into continental Northern Europe. Correlation
V.N. Kryjov / Atmospheric Science Letters 5 (2004) 23–3426
coefficients between January–February (JF) CI and the corresponding NAO and AO
indices are about 0.9, whereas correlations between the very NAO and AO indices are
about 0.8 (Fig. 2c and d).
The January and February CI are significantly correlated ðr ¼ 0:36Þ; therefore, on the
basis of JF mean SLP, we calculated the JF mean correlation map (m ¼ 84; p , 0:2%),
circulation pattern (Fig. 3a), and CI (Fig. 3c). The pattern bears resemblance with the JF
mean NAO and AO patterns. So is the JF CI, it correlates with the NAO and AO indices
with a coefficient of 0.94, while the correlation between the JF NAO and AO indices is
0.84. The correlation between the CI and annual SAT is 0.75. Slight variations in the
running correlations are statistically insignificant (Fig. 3e).
Since the JF CI explains the dominant fraction of the variance (56%) in annual SAT, it
may suppress the influence of other circulation patterns. Therefore, we regressed annual
SAT on the JF CI, calculated the residual, and constructed the correlation maps using the
residual of annual SAT. Only the November correlation map happened to be significant
(m ¼ 16; p ¼ 0:4%). This pattern (Fig. 3b) considerably differs from the NAO/AO.
During the positive November CI phase, the positive SLP anomaly extends across the
Labrador Peninsula and Sea, while the negative SLP anomaly is positioned over
Scandinavia, and vice versa during the negative November CI phase. Poles of correlation
between the residual of annual SAT and November SLP are located at gridpoints 608N,
608W (the Labrador Sea, r ¼ 0:41) and 608N, 108E (Scandinavia, r ¼ 20:47). A negative
correlation ðr ¼ 20:34Þ between SLP series at these points, which is significant at the 1%
level, proves its teleconnection nature. For comparison, the correlation between November
Iceland and Gibraltar SLP series is 20.35.
The November CI is not correlated with the November NAO and AO indices ðlrl ,0:1Þ: Out of the set of the NHTI monitored at the CPC NCEP, it significantly correlates
with the Tropical/Northern Hemisphere ðr ¼ 20:41Þ and Scandinavia ðr ¼ 20:57Þ
indices. Circulation patterns of these modes at the 700 hPa surface have been constructed
by Barnston and Livezey (1987, Figs. 5a and 7b (EU1)). The correlation map between the
Tropical/Northern Hemisphere index and SLP has not passed the field significance test,
although there is a correlation centre, coinciding with the Scandinavian centre of the
November circulation pattern. The correlation map between the Scandinavia index and
SLP is statistically significant, however, with centres of correlation (508N, 108W and 658N
408E) markedly shifted from those of the November circulation pattern. So, the obtained
November CI is not identical to these indices.
Table 1
Results from the field significance tests
Nov.-1 Dec.-1 Jan. Feb. Mar. Apr. May Jun. Jul. Aug. Sep. Oct. Nov. Dec.
m 0 0 54 69 8 4 2 0 0 0 0 0 0 2
pð%Þ – – ,0.2 ,0.2 4.6 8.8 17.8 – – – – – – 16.4
m is the number of the rejected local null-hypotheses; p (%) is the significance level, at which the global null-
hypothesis is to be rejected in the Monte Carlo method (see text for details). Nov. 1 and Dec. 1 denote November
and December of the previous year.
V.N. Kryjov / Atmospheric Science Letters 5 (2004) 23–34 27
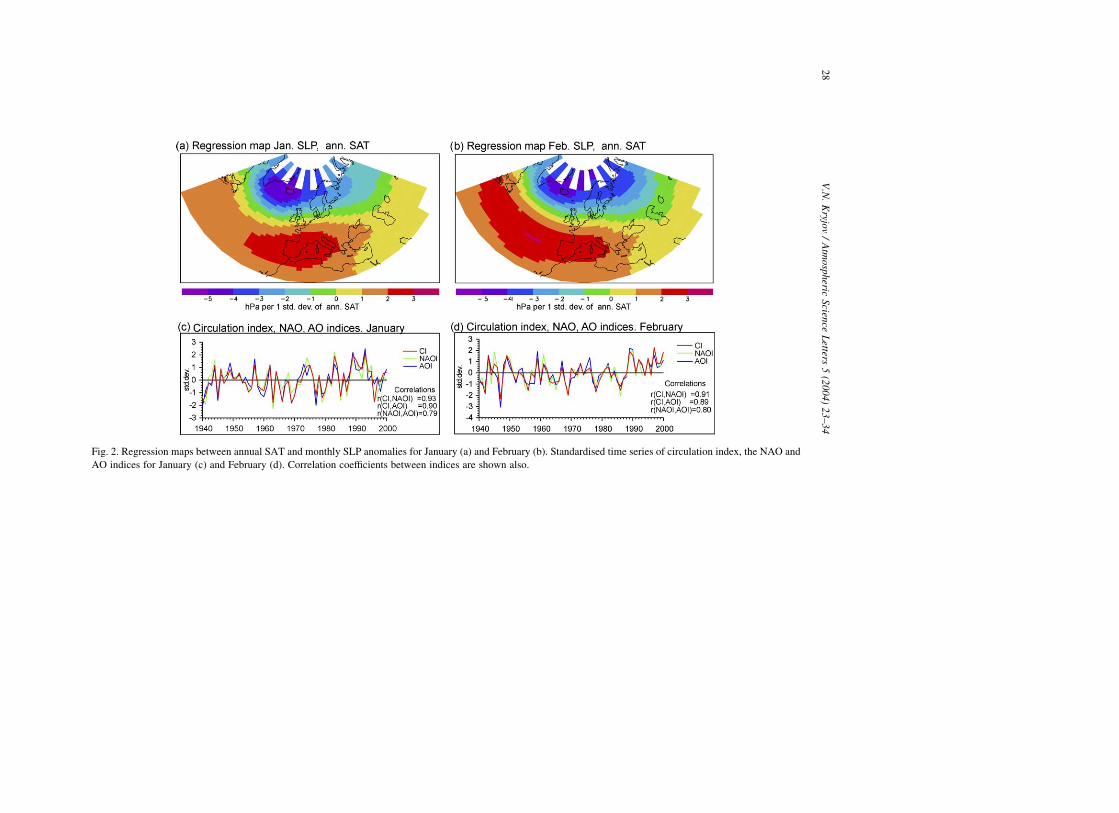
Fig. 2. Regression maps between annual SAT and monthly SLP anomalies for January (a) and February (b). Standardised time series of circulation index, the NAO and
AO indices for January (c) and February (d). Correlation coefficients between indices are shown also.
V.N
.K
ryjov
/A
tmo
spheric
Scien
ceL
etters5
(20
04
)2
3–
34
28

Fig. 3. Regression maps between annual SAT and January–February mean SLP anomalies (a), residual of annual SAT and November SLP anomalies (b). Standardised
detrended time series of annual SAT and circulation index based on January–February mean SLP anomalies (c), residual of annual SAT and November Circulation index
(d). Running correlations calculated over 29 yr. windows (plotted in central year of 29 yr. periods) between annual SAT and JF mean Circulation index (e), residual of
annual SAT and November Circulation Index ðf Þ:
V.N
.K
ryjov
/A
tmo
sph
ericS
cience
Letters
5(2
00
4)
23
–3
42
9
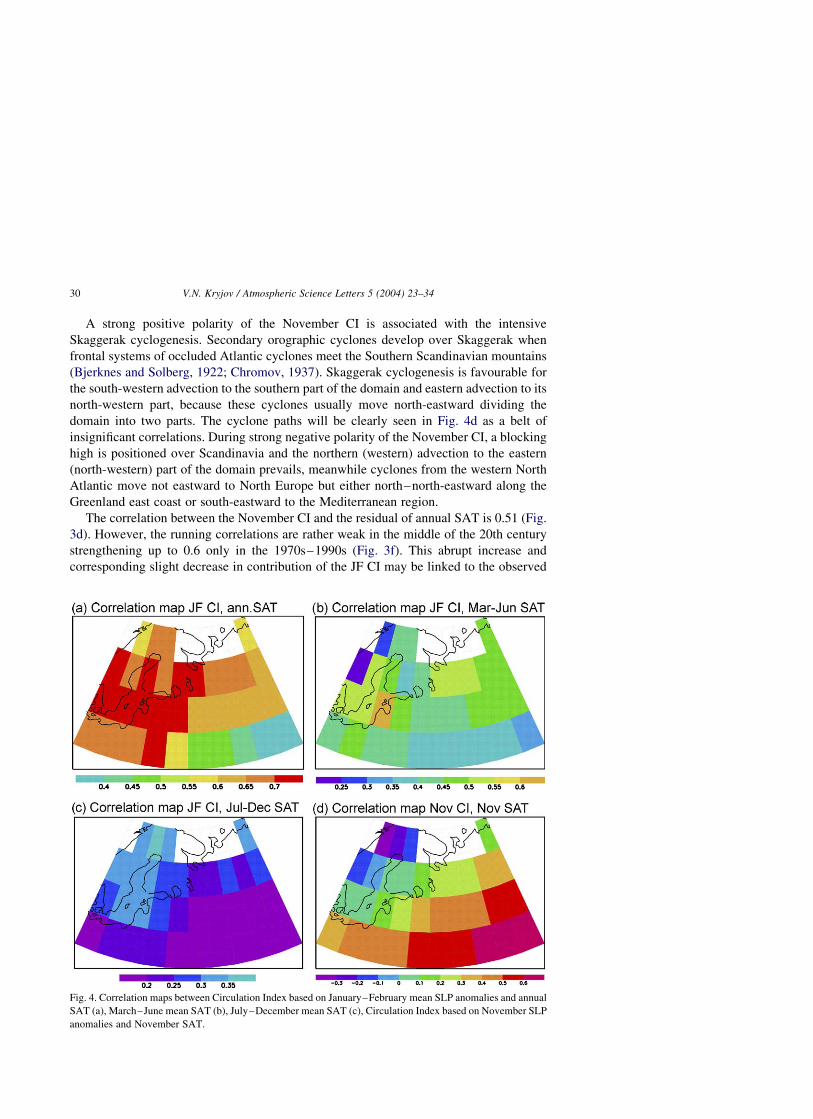
A strong positive polarity of the November CI is associated with the intensive
Skaggerak cyclogenesis. Secondary orographic cyclones develop over Skaggerak when
frontal systems of occluded Atlantic cyclones meet the Southern Scandinavian mountains
(Bjerknes and Solberg, 1922; Chromov, 1937). Skaggerak cyclogenesis is favourable for
the south-western advection to the southern part of the domain and eastern advection to its
north-western part, because these cyclones usually move north-eastward dividing the
domain into two parts. The cyclone paths will be clearly seen in Fig. 4d as a belt of
insignificant correlations. During strong negative polarity of the November CI, a blocking
high is positioned over Scandinavia and the northern (western) advection to the eastern
(north-western) part of the domain prevails, meanwhile cyclones from the western North
Atlantic move not eastward to North Europe but either north–north-eastward along the
Greenland east coast or south-eastward to the Mediterranean region.
The correlation between the November CI and the residual of annual SAT is 0.51 (Fig.
3d). However, the running correlations are rather weak in the middle of the 20th century
strengthening up to 0.6 only in the 1970s–1990s (Fig. 3f). This abrupt increase and
corresponding slight decrease in contribution of the JF CI may be linked to the observed
Fig. 4. Correlation maps between Circulation Index based on January–February mean SLP anomalies and annual
SAT (a), March–June mean SAT (b), July–December mean SAT (c), Circulation Index based on November SLP
anomalies and November SAT.
V.N. Kryjov / Atmospheric Science Letters 5 (2004) 23–3430

strengthening of the wintertime zonal circulation and the associated changes in the surface
properties and SAT spatial distribution. Similar causes have been suggested to explain
slight weakening of the simultaneous correlation between JF zonal circulation and SAT by
Slonosky and Yiou (2002). Yet it might result from the complex interplay between a large
number of circulation types, particularly intensity and position of the Siberian high.
However, properties of the Siberian high are also related to the strength of the zonal
circulation (Gong and Ho, 2002).
Another new finding resides in the significant negative correlation ðr ¼ 20:33Þ
between the JF and November CIs. We suppose that this 9 month lag correlation might be
accounted for by variations in the summer–autumn sea ice extent and concentration in the
Arctic, related to the wintertime NAO/AO (Deser et al., 2000; Rigor et al., 2002).
Associated variations in the spatial distribution and intensity of the fluxes of sensible and
latent heat as well as heat released during the intensive freeze-up in autumn-early
(following) winter have to lead to variations in the middle troposphere circulation. The
November CI reflects the surface signature of these variations. This hypothesis implies the
locking of the Labrador–Scandinavia teleconnection pattern to the timing of the intensive
freeze-up in the Arctic, and indeed, it is prominent only in November, which supports the
hypothesis.
This negative correlation between the JF and November CIs is consistent with the slight
strengthening (weakening) of the running correlations between the JF CI and annual SAT
in the middle (last decades) of the twentieth century, which is likely to be caused by the
decrease (increase) of the November CI contribution. Assuming that the November and JF
CIs supplement each other, we have regressed annual SAT on both indices, that reveals
69% of explained variance in annual SAT, steady dependency, no autocorrelation in
residuals, with both regression coefficients being significant at the 0.1% level.
Correlation maps, shown in Fig. 4a–d, illustrate spatial and seasonal peculiarities of the
relationships between the CI and SAT. All four maps have passed the field significance test
at the 5% level.
Correlations between annual SAT and the JF CI (Fig. 4a) are significant at the 1% level
over the whole domain. In the Baltic Sea region and West Russia, the JF CI explains above
50% of variance in annual SAT. All lag correlations between March–June mean SAT and
the JF CI (Fig. 4b) are significant at the 5% level except for West Scandinavia. July–
December mean SAT significantly (5% level) correlates with the JF CI only in the Baltic
Sea region and in the vicinity of the Barents Sea (Fig. 4c), whereas correlations are
insignificant over the south-eastern part of the domain. The difference between spring and
summer–autumn spatial distributions of significant correlations supports the hypothesis
that snow plays the main role in the persistence of the JF circulation influence on
springtime SAT. For the Barents Sea coastal stations, Kryjov (2003) has hypothesised that
wintertime circulation influences autumn SAT via SST and the timing of sea ice freeze-up
onset. For the Baltic Sea region, the explanation is likely to be similar, with correlations
between the JF CI and July–December mean SST achieving 0.31 for the Bothnic Gulf and
0.41 for the central Baltic Sea.
Variations in the November CI mainly influence concurrent November SAT in the
south-eastern part of the domain (Fig. 4d). It is worth noting that consistently with the
negative correlation between the JF and November CIs, the Eastern Europe November
V.N. Kryjov / Atmospheric Science Letters 5 (2004) 23–34 31
SAT anomaly tends to be negative in the 1970s–1990s, in contrast with the winter, spring,
and annual SAT anomalies. One more peculiarity shown in Fig. 4d should be pointed out.
Consistently with the SLP (and circulation) anomaly map shown in Fig. 3b, the November
CI correlates with SAT over the south-eastern part of the domain positively, whereas it
correlates with SAT over North-Western Scandinavia negatively.
To complete the study, it is useful to touch upon a question not considered in the study
but related to it. We have focused our study on Northern Europe where only the eastern
pole of the November pattern is active. However, the area of the strongest impact of the
dipole structure is located between its poles, i.e. in the central North Atlantic. The positive
phase of the transatlantic zonal teleconnection is associated with the anomalous northern
surface advection, whereas the anomalous southern surface advection occurs during the
negative phase. These variations in the direction of the prevailed surface winds
considerably affect the ocean surface layer properties. Although this circulation pattern
is prominent only in November, the wide experience in the empirical seasonal weather
forecasts accumulated in Russia (Drogaytsev, 1959; Aristov et al., 1972; Girs, 1974;
Dzerdzeevsky, 1975) shows that circulation anomalies of the late autumn–early winter,
forming the long term SST anomalies in the North Atlantic, determine evolution of
atmospheric circulation in the following seasons and affect the weather conditions not only
in the following winter but in the following spring and summer as well.
5. Conclusions
The study of annual SAT has yielded a number of new estimates and findings. Some of
them, such as dependency of annual SAT upon the wintertime NAO/AO-like circulation
modes, as well as significant lagged correlations between these modes and spring SAT in
continental regions due to snow-albedo positive feedbacks, have been expected and new
estimates have proven these expectations correct. Also, we have had to expect persistence
of the wintertime NAO/AO-like circulation influence on SAT through most of the
subsequent year in the Baltic Sea region.
What has not been expected resides in the limitation to two months of the ‘wintertime’
period associated with the NAO/AO significant contribution to annual SAT. A new result
is associated with the recognition of the November circulation pattern, which turns out to
be different from the NAO/AO, as well as with the significant correlation between the JF
NAO/AO-like and November circulation modes.
The NAO/AO-like circulation patterns significantly contribute to annual SAT only in
January and February. The JF mean NAO/AO-like circulation mode dominates Northern
Europe mean annual SAT accounting for 56% of its variance. No significant relationships
between annual SAT and the NAO/AO-like circulation modes have been found for March,
November, and December. It should be emphasised that the JF NAO/AO-like circulation
mode is not the only monthly/seasonal NAO/AO-like circulation mode that affects
concurrent/subsequent Northern Europe SAT, but it is the only NAO/AO-like circulation
mode that significantly contribute to annual SAT, the most-used indicator of climate
change.
V.N. Kryjov / Atmospheric Science Letters 5 (2004) 23–3432

It is the Labrador–Scandinavia teleconnection pattern rather than the NAO/AO-like
pattern that significantly contributes to annual SAT in November. This pattern explains
observed East Europe November cooling against the background of overall regional
warming in the late twentieth century. It is prominent only in the late autumn–early winter
and we hypothesise that it is an atmospheric response to variations in the spatial
distribution and intensity of the heat fluxes during the freeze-up in the Arctic.
The most interesting and perspective result from the study relates to the significant
(negative) correlation between the indices of the JF NAO/AO-like pattern and the
November Labrador–Scandinavia pattern. Significant correlation between these indices
suggests that polarity of the wintertime (January–February) NAO/AO defines to some
degree the sign of the SLP anomaly over Scandinavia in November, which in turn affects
not only East Europe SAT but a large number of geophysical variables, in particular, a
distribution of precipitation across Europe.
To our best knowledge, all listed results are new and have not been published yet.
Acknowledgements
In this study we used the data from the website of the Climatic Research Unit,
University of East Anglia (www.cru.uea.ac.uk), the Annular Modes Website (www.
horizon.atmos.colostate.edu/ao), the website of the Lamont-Doherty Earth Observatory of
Columbia University (www.ingrid.ldeo.columbia.edu), the website of the Climate
Prediction Center of the National Centers for Environmental Prediction (www.cpc.ncep.
noaa.gov). I am very grateful to all those who have made available these climate data
through the Internet. I thank Dr Roman Vilfand for useful discussions and comments.
Special thanks to the referees, who suggested a refocus of the study from the use of
predefined indices to a search of new circulation modes.
References
Aristov, N.A., Bagrov, N.A., Vasyukov, K.A., Gromova, G.G., Zverev, N.I., Katz, A.L., Pagava, S.T. (Eds.),
1972. Gidebook on the monthly weather forecasts, Gidrometeoizdat, Leningrad, pp. 366, in Russian.
Bamzai, A.S., 2003. Relationship between snow cover variability and Arctic oscillation index on a hierarchy of
time scales. Int. J. Climatol. 23, 131–142.
Barnston, A.G., Livezey, R.E., 1987. Classification, seasonality and persistence of low-frequency atmospheric
circulation patterns. Mon. Wea. Rev. 115, 1083–1126.
Bjerknes, J., Solberg, H., 1922. Life cycle of cyclones and polar front theory of atmospheric circulation. Geof.
Publ. 3 (1) Oslo.
Chromov, S.P., 1937. An Introduction to Synoptic Analysis. Gidrometeoizdat, Moscow, pp. 510, in Russian.
Deser, C., Walsh, J.E., Timlin, M.S., 2000. Arctic sea ice variability in the context of recent atmospheric
circulation trends. J. Climate 13, 617–633.
Drogaytsev, D.A., 1959. Long Term Hydrometeorological Forecasts on the Basis of Temperature Oscillations.
Gidrometeoizdat, Leningrad, 92 p. (in Russian).
Dzerdzeevsky, B.L., 1975. General Circulation of the Atmosphere and Climate. Nauka, Moscow, 288 p. (in
Russian).
V.N. Kryjov / Atmospheric Science Letters 5 (2004) 23–34 33

Girs, A.A., 1974. Macrocirculation Method of the Long Term Meteorological Forecasts. Gidrometeoizdat,
Leningrad, 488 p. (in Russian).
Gong, D.-Y., Ho, C.-H., 2002. The Siberian high and climate change over middle to high latitude Asia. Theor.
Appl. Climatol. 72, 1–9.
Hurrell, J.W., 1995. Decadal trends in the North Atlantic oscillation: regional temperatures and precipitation.
Science 269, 676–679.
IPCC, 2001. Third Assessment Report, Climate Change 2001: The Scientific Basis, Cambridge University Press,
Cambridge, 881 p..
Jones, P.D., 1987. The early twentieth century Arctic High—fact or fiction? Clim. Dyn. 1, 63–75.
Jones, P.D., 1994. Hemispheric surface air temperature variations: a reanalysis and an update to 1993. J. Clim. 7,
1794–1802.
Jones, P.D., Jonsson, T., Wheeler, D., 1997. Extension to the North Atlantic oscillation using early instrumental
pressure observations from Gibraltar and southwest Iceland. Int. J. Climatol. 17, 1433–1450.
Kaplan, A., Cane, M., Kushnir, Y., Clement, A., Blumenthal, M., Rajagopalan, B., 1998. Analyses of global sea
surface temperature 1856-1991. J. Geophys. Res. 103, 18567–18589.
Kryjov, V.N., 2002. The influence of the winter Arctic oscillation on the Northern Russia spring temperature. Int.
J. Climatol. 22, 779–785.
Kryjov, V.N., 2003. Relationships between Northern Russia monthly, seasonal, and annual air temperatures and
winter zonal circulation indices. Meteorol. Hydrol. (2), 15–28.in Russian; English version is available on the
Annular Modes web site:.
Livezey, R.E., Chen, W.Y., 1983. Statistical field significance and its determination by Monte Carlo technique.
Mon. Wea. Rev. 111, 46–58.
van Loon, H., Rogers, J.C., 1978. The seesaw in winter temperatures between Greenland and Northern Europe.
Part I: general description. Mon. Wea. Rev. 106, 296–310.
Rigor, I.G., Wallace, J.M., Colony, R.L., 2002. Response of sea ice to the Arctic Oscillation. J. Clim. 15,
2648–2663.
Rogers, J.C., van Loon, H., 1979. The seesaw in winter temperatures between Greenland and Northern Europe.
Part II: some oceanic and atmospheric effects in middle and high latitudes. Mon. Wea. Rev. 107, 509–519.
Slonosky, V.C., Yiou, P., 2002. Does the NAO index represent zonal flow? The influence of the NAO on North
Atlantic surface temperature. Clim. Dyn. 19, 17–33.
Thompson, D.W.J., Wallace, J.M., 1998. The Arctic oscillation signature in wintertime geopotential height and
temperature fields. Geophys. Res. Lett. 25, 1297–1300.
Thompson, D.W.J., Wallace, J.M., 2000. Annular modes in the extratropical circulation. Part I: month to month
variability. J. Clim. 13, 1000–1016.
Thompson, D.W.J., Wallace, J.M., Hegerl, G.C., 2000. Annular modes in the extratropical circulation. Part II:
Trends. J. Clim. 13, 1018–1036.
Yule, G.U., Kendall, M.G., 1960. Theory Statistics. Gosstatizdat, Moscow, 780 p. (in Russia).
V.N. Kryjov / Atmospheric Science Letters 5 (2004) 23–3434
Related Documents