Search Rank Fraud and Malware Detection in Google Play Mahmudur Rahman, Mizanur Rahman, Bogdan Carbunar, Duen Horng Chau Abstract—Fraudulent behaviors in Google Play, the most popular Android app market, fuel search rank abuse and malware proliferation. To identifymalware, previous work has focused on app executable and permission analysis. In this paper, we introduce FairPlay, a novel system that discovers and leverages traces left behind by fraudsters, to detect both malware and apps subjected to search rank fraud. FairPlay correlates review activities and uniquely combines detected review relations with linguistic and behavioral signals gleaned from Google Play app data (87K apps, 2.9M reviews, and 2.4M reviewers, collected over half a year), in order to identify suspicious apps. FairPlay achieves over 95% accuracy in classifying gold standard datasets of malware, fraudulent and legitimate apps. We show that 75% of the identified malware apps engage in search rank fraud. FairPlay discovers hundreds of fraudulent apps that currently evade Google Bouncer’s detection technology. FairPlay also helped the discovery of more than 1,000 reviews, reported for 193 apps, that reveal a new type of “coercive” review campaign: users are harassed into writing positive reviews, and install and review other apps. Index Terms—Android market, search rank fraud, malware detection ✦ 1 I NTRODUCTION The commercial success of Android app markets such as Google Play [1] and the incentive model they offer to popular apps, make them appealing targets for fraudu- lent and malicious behaviors. Some fraudulent developers deceptively boost the search rank and popularity of their apps (e.g., through fake reviews and bogus installation counts) [2], while malicious developers use app markets as a launch pad for their malware [3]–[6]. The motivation for such behaviors is impact: app popularity surges translate into financial benefits and expedited malware proliferation. Fraudulent developers frequently exploit crowdsourcing sites (e.g., Freelancer [7], Fiverr [8], BestAppPromotion [9]) to hire teams of willing workers to commit fraud collec- tively, emulating realistic, spontaneous activities from unre- lated people (i.e., “crowdturfing” [10]), see Figure 1 for an example. We call this behavior “search rank fraud”. In addition, the efforts of Android markets to identify and remove malware are not always successful. For in- stance, Google Play uses the Bouncer system [11] to remove malware. However, out of the 7, 756 Google Play apps we analyzed using VirusTotal [12], 12%(948) were flagged by at least one anti-virus tool and 2%(150) were identified as malware by at least 10 tools (see Figure 6). Previous mobile malware detection work has focused on dynamic analysis of app executables [13]–[15] as well as static analysis of code and permissions [16]–[18]. However, recent Android malware analysis revealed that malware evolves quickly to bypass anti-virus tools [19]. In this paper, we seek to identify both malware and search rank fraud subjects in Google Play. This combination • Mahmudur Rahman is with IBM. • Mizanur Rahman and Bogdan Carbunar are with FIU. Email: {mrahm031, carbunar}@cs.fiu.edu • Duen Horng Chau is with Georgia Tech. Email: [email protected] • A preliminary version of this article has appeared in SDM 2016. Fig. 1: An “install job” posting from Freelancer [7], asking for 2000 installs within 3 days (in orange), in an organized way that includes expertise verifications and provides se- crecy assurances (in blue). Text enlarged for easier reading. is not arbitrary: we posit that malicious developers resort to search rank fraud to boost the impact of their malware. Unlike existing solutions, we build this work on the observation that fraudulent and malicious behaviors leave behind telltale signs on app markets. We uncover these nefarious acts by picking out such trails. For instance, the high cost of setting up valid Google Play accounts forces fraudsters to reuse their accounts across review writing jobs, making them likely to review more apps in common than regular users. Resource constraints can compel fraudsters to post reviews within short time intervals. Legitimate users affected by malware may report unpleasant experiences in their reviews. Increases in the number of requested permissions from one version to the next, which we will call “permission ramps”, may indicate benign to malware (Jekyll-Hyde) transitions. Digital Object Identifier no. 10.1109/TKDE.2017.2667658 1041-4347 ß 2017 IEEE. Personal use is permitted, but republication/redistribution requires IEEE permission. See http://www.ieee.org/publications_standards/publications/rights/index.html for more information.

Welcome message from author
This document is posted to help you gain knowledge. Please leave a comment to let me know what you think about it! Share it to your friends and learn new things together.
Transcript

Search Rank Fraud and Malware Detection inGoogle Play
Mahmudur Rahman, Mizanur Rahman, Bogdan Carbunar, Duen Horng Chau
Abstract—Fraudulent behaviors in Google Play, the most popular Android app market, fuel search rank abuse and malwareproliferation. To identify malware, previous work has focused on app executable and permission analysis. In this paper, we introduceFairPlay, a novel system that discovers and leverages traces left behind by fraudsters, to detect both malware and apps subjected tosearch rank fraud. FairPlay correlates review activities and uniquely combines detected review relations with linguistic and behavioralsignals gleaned from Google Play app data (87K apps, 2.9M reviews, and 2.4M reviewers, collected over half a year), in order toidentify suspicious apps. FairPlay achieves over 95% accuracy in classifying gold standard datasets of malware, fraudulent andlegitimate apps. We show that 75% of the identified malware apps engage in search rank fraud. FairPlay discovers hundreds offraudulent apps that currently evade Google Bouncer’s detection technology. FairPlay also helped the discovery of more than 1,000reviews, reported for 193 apps, that reveal a new type of “coercive” review campaign: users are harassed into writing positive reviews,and install and review other apps.
Index Terms—Android market, search rank fraud, malware detection
✦
1 INTRODUCTION
The commercial success of Android app markets suchas Google Play [1] and the incentive model they offer topopular apps, make them appealing targets for fraudu-lent and malicious behaviors. Some fraudulent developersdeceptively boost the search rank and popularity of theirapps (e.g., through fake reviews and bogus installationcounts) [2], while malicious developers use app markets asa launch pad for their malware [3]–[6]. The motivation forsuch behaviors is impact: app popularity surges translateinto financial benefits and expedited malware proliferation.
Fraudulent developers frequently exploit crowdsourcingsites (e.g., Freelancer [7], Fiverr [8], BestAppPromotion [9])to hire teams of willing workers to commit fraud collec-tively, emulating realistic, spontaneous activities from unre-lated people (i.e., “crowdturfing” [10]), see Figure 1 for anexample. We call this behavior “search rank fraud”.
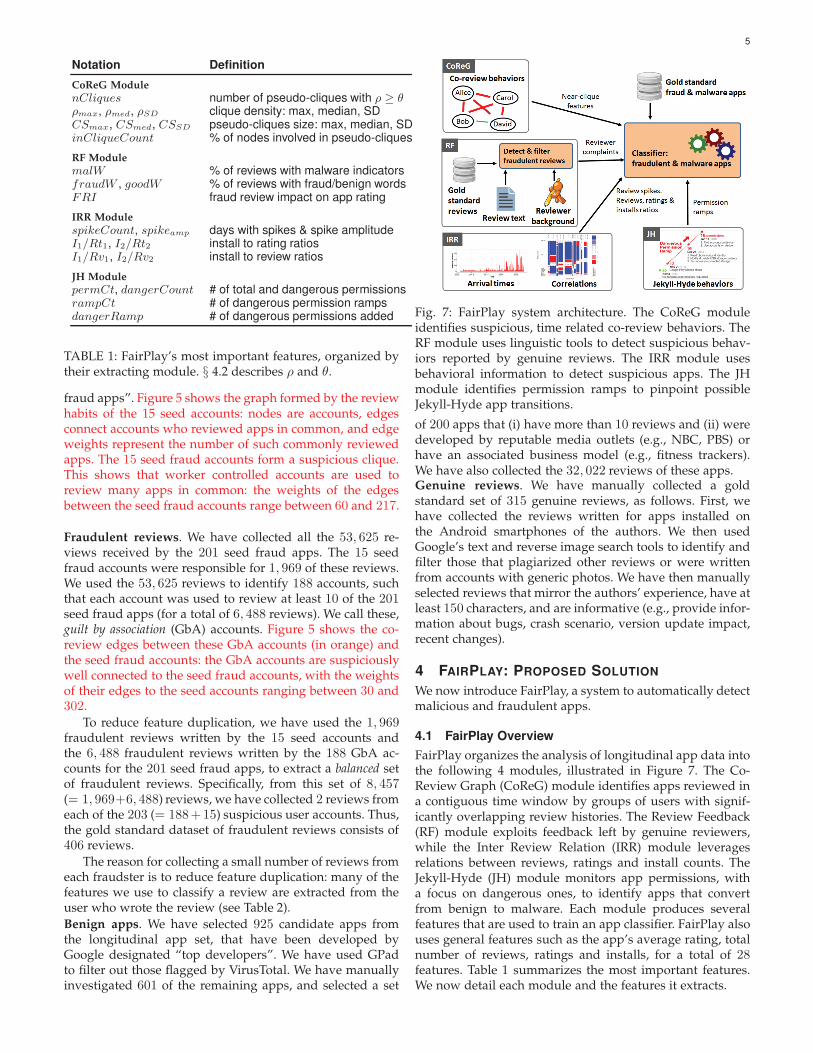
In addition, the efforts of Android markets to identifyand remove malware are not always successful. For in-stance, Google Play uses the Bouncer system [11] to removemalware. However, out of the 7, 756 Google Play apps weanalyzed using VirusTotal [12], 12% (948) were flagged byat least one anti-virus tool and 2% (150) were identified asmalware by at least 10 tools (see Figure 6).
Previous mobile malware detection work has focusedon dynamic analysis of app executables [13]–[15] as well asstatic analysis of code and permissions [16]–[18]. However,recent Android malware analysis revealed that malwareevolves quickly to bypass anti-virus tools [19].
In this paper, we seek to identify both malware andsearch rank fraud subjects in Google Play. This combination
• Mahmudur Rahman is with IBM.• Mizanur Rahman and Bogdan Carbunar are with FIU. Email:
{mrahm031, carbunar}@cs.fiu.edu• Duen Horng Chau is with Georgia Tech. Email: [email protected]• A preliminary version of this article has appeared in SDM 2016.
Fig. 1: An “install job” posting from Freelancer [7], askingfor 2000 installs within 3 days (in orange), in an organizedway that includes expertise verifications and provides se-crecy assurances (in blue). Text enlarged for easier reading.
is not arbitrary: we posit that malicious developers resort tosearch rank fraud to boost the impact of their malware.
Unlike existing solutions, we build this work on theobservation that fraudulent and malicious behaviors leavebehind telltale signs on app markets. We uncover thesenefarious acts by picking out such trails. For instance, thehigh cost of setting up valid Google Play accounts forcesfraudsters to reuse their accounts across review writing jobs,making them likely to review more apps in common thanregular users. Resource constraints can compel fraudsters topost reviews within short time intervals. Legitimate usersaffected by malware may report unpleasant experiencesin their reviews. Increases in the number of requestedpermissions from one version to the next, which we willcall “permission ramps”, may indicate benign to malware(Jekyll-Hyde) transitions.
Digital Object Identifier no. 10.1109/TKDE.2017.2667658
1041-4347� 2017 IEEE. Personal use is permitted, but republication/redistribution requires IEEE permission.See http://www.ieee.org/publications_standards/publications/rights/index.html for more information.

2
1.1 Contributions
We propose FairPlay, a system that leverages the aboveobservations to efficiently detect Google Play fraud andmalware (see Figure 7). Our major contributions are:A fraud and malware detection approach. To detect fraudand malware, we propose and generate 28 relational, behav-ioral and linguistic features, that we use to train supervisedlearning algorithms [§ 4]:
• We formulate the notion of co-review graphs to modelreviewing relations between users. We develop PCF, anefficient algorithm to identify temporally constrained,co-review pseudo-cliques — formed by reviewers withsubstantially overlapping co-reviewing activities acrossshort time windows.
• We use temporal dimensions of review post times toidentify suspicious review spikes received by apps; weshow that to compensate for a negative review, for anapp that has rating R, a fraudster needs to post atleast R−1
5−Rpositive reviews. We also identify apps with
“unbalanced” review, rating and install counts, as wellas apps with permission request ramps.
• We use linguistic and behavioral information to (i)detect genuine reviews from which we then (ii) extractuser-identified fraud and malware indicators.
Tools to collect and process Google Play data. We havedeveloped GPCrawler, a tool to automatically collect datapublished by Google Play for apps, users and reviews, aswell as GPad, a tool to download apks of free apps and scanthem for malware using VirusTotal.Novel longitudinal and gold standard datasets. We con-tributed a longitudinal dataset of 87, 223 freshly postedGoogle Play apps (along with their 2.9M reviews, from2.3M reviewers) collected between October 2014 and May2015. We have leveraged search rank fraud expert contactsin Freelancer [7], anti-virus tools and manual verificationsto collect gold standard datasets of hundreds of fraudulent,malware and benign apps [§ 3]. We have published thesedatasets on the project website [20].
1.2 Results
FairPlay has high accuracy and real-world impact:High Accuracy. FairPlay achieves over 97% accuracy inclassifying fraudulent and benign apps, and over 95% accu-racy in classifying malware and benign apps. FairPlay sig-nificantly outperforms the malware indicators of Sarma etal. [16]. Furthermore, we show that malware often engagesin search rank fraud as well: When trained on fraudulentand benign apps, FairPlay flagged as fraudulent more than75% of the gold standard malware apps [§ 5.3].Real-world Impact: Uncover Fraud & Attacks. FairPlaydiscovers hundreds of fraudulent apps. We show that theseapps are indeed suspicious: the reviewers of 93.3% of themform at least 1 pseudo-clique, 55% of these apps have atleast 33% of their reviewers involved in a pseudo-clique,and the reviews of around 75% of these apps contain atleast 20 words indicative of fraud.
FairPlay also enabled us to discover a novel, coercive re-view campaign attack type, where app users are harassed intowriting a positive review for the app, and install and reviewother apps.We have discovered 1, 024 coerced reviews, fromusers complaining about 193 such apps [§ 5.4 & § 5.5].
Fig. 2: Google Play components and relations. Google Play’sfunctionality centers on apps, shown as red disks. Develop-ers, shown as orange disks upload apps. A developer mayupload multiple apps. Users, shown as blue squares, caninstall and review apps. A user can only review an app thathe previously installed.
2 BACKGROUND, RELATED WORK,AND OUR DIFFERENCES
Systemmodel. We focus on the Android appmarket ecosys-tem of Google Play. The participants, consisting of usersand developers, have Google accounts. Developers createand upload apps, that consist of executables (i.e., “apks”),a set of required permissions, and a description. The appmarket publishes this information, along with the app’s re-ceived reviews, ratings, aggregate rating (over both reviewsand ratings), install count range (predefined buckets, e.g.,50-100, 100-500), size, version number, price, time of lastupdate, and a list of “similar” apps. Each review consistsof a star rating ranging between 1-5 stars, and some text.The text is optional and consists of a title and a description.Google Play limits the number of reviews displayed for anapp to 4, 000. Figure 2 illustrates the participants in GooglePlay and their relations.Adversarial model. We consider not only malicious devel-opers, who upload malware, but also rational fraudulentdevelopers. Fraudulent developers attempt to tamper withthe search rank of their apps, e.g., by recruiting fraudexperts in crowdsourcing sites to write reviews, post ratings,and create bogus installs. While Google keeps secret thecriteria used to rank apps, the reviews, ratings and installcounts are known to play a fundamental part (see e.g., [21]).
To review or rate an app, a user needs to have a Googleaccount, register a mobile device with that account, andinstall the app on the device. This process complicates thejob of fraudsters, who are thus more likely to reuse accountsacross jobs. The reason for search rank fraud attacks isimpact. Apps that rank higher in search results, tend toreceive more installs. This is beneficial both for fraudulentdevelopers, who increase their revenue, and malicious de-velopers, who increase the impact of their malware.
2.1 Android Malware Detection
Zhou and Jiang [19] collected and characterized 1, 200 An-droid malware samples, and reported the ability of malwareto quickly evolve and bypass the detection mechanisms ofanti-virus tools.
Burguera et al. [13] used crowdsourcing to collect sys-tem call traces from real users, then used a “partitional”clustering algorithm to classify benign and malicious apps.
3
Shabtai et al. [14] extracted features from monitored apps(e.g., CPU consumption, packets sent, running processes)and usedmachine learning to identify malicious apps. Graceet al. [15] used static analysis to efficiently identify high andmedium risk apps.
Previouswork has also used app permissions to pinpointmalware [16]–[18]. Sarma et al. [16] use risk signals extractedfrom app permissions, e.g., rare critical permissions (RCP)and rare pairs of critical permissions (RPCP), to train SVMand inform users of the risks vs. benefits tradeoffs of apps.In § 5.3 we show that FairPlay significantly improves on theperformance achieved by Sarma et al. [16].
Peng et al. [17] propose a score to measure the riskof apps, based on probabilistic generative models such asNaive Bayes. Yerima et al. [18] also use features extractedfrom app permissions, API calls and commands extractedfrom the app executables.
Sahs and Khan [22] used features extracted from apppermissions and control flow graphs to train an SVM classi-fier on 2000 benign and less than 100 malicious apps. Sanz etal. [23] rely strictly on permissions as sources of features forseveral machine learning tools. They use a dataset of around300 legitimate and 300 malware apps.
Google has deployed Bouncer, a framework that moni-tors published apps to detect and remove malware. Ober-heide and Miller [11] have analyzed and revealed detailsof Bouncer (e.g., based in QEMU, using both static anddynamic analysis). Bouncer is not sufficient - our resultsshow that 948 apps out of 7,756 apps that we downloadedfrom Google Play are detected as suspicious by at least1 anti-virus tool. In addition, FairPlay detected suspiciousbehavior for apps that were not removed by Bouncer duringa more than 6 months long interval.
Instead of analyzing app executables, FairPlay employsa relational, linguistic and behavioral approach based onlongitudinal app data. FairPlay’s use of app permissionsdiffers from existing work through its focus on the temporaldimension, e.g., changes in the number of requested permis-sions, in particular the “dangerous” ones. We observe thatFairPlay identifies and exploits a new relationship betweenmalware and search rank fraud.
2.2 Graph Based Opinion Spam Detection
Graph based approaches have been proposed to tackle opin-ion spam [24], [25]. Ye and Akoglu [24] quantify the chanceof a product to be a spam campaign target, then clusterspammers on a 2-hop subgraph induced by the productswith the highest chance values. Akoglu et al. [25] framefraud detection as a signed network classification problemand classify users and products, that form a bipartite net-work, using a propagation-based algorithm.
FairPlay’s relational approach differs as it identifies appsreviewed in a contiguous time interval, by groups of userswith a history of reviewing apps in common. FairPlaycombines the results of this approach with behavioral andlinguistic clues, extracted from longitudinal app data, todetect both search rank fraud and malware apps. We em-phasize that search rank fraud goes beyond opinion spam,as it implies fabricating not only reviews, but also user appinstall events and ratings.
3 THE DATA
We have collected longitudinal data from 87K+ newly re-leased apps over more than 6 months, and identified goldstandard data. In the following, we briefly describe the toolswe developed, then detail the data collection effort and theresulting datasets.Data collection tools. We have developed the Google PlayCrawler (GPCrawler) tool, to automatically collect data pub-lished by Google Play for apps, users and reviews. GooglePlay prevents scripts from scrolling down a user page. Thus,to collect the ids of more than 20 apps reviewed by a user. Toovercome this limitation, we developed a Python script anda Firefox add-on. Given a user id, the script opens the userpage in Firefox. When the script loads the page, the add-on becomes active. The add-on interacts with Google Playpages using content scripts (Browser specific componentsthat let us access the browsers native API) and port objectsfor message communication. The add-on displays a “scrolldown” button that enables the script to scroll down to thebottom of the page. The script then uses a DOMParser toextract the content displayed in various formats by GooglePlay. It then sends this content over IPC to the add-on. Theadd-on stores it, using Mozilla XPCOM components, in asand-boxed environment of local storage in a temporary file.The script then extracts the list of apps rated or reviewed bythe user.
We have also developed the Google Play App Downloader(GPad), a Java tool to automatically download apks offree apps on a PC, using the open-source Android MarketAPI [26]. GPad takes as input a list of free app ids, a Gmailaccount and password, and a GSF id. GPad creates a newmarket session for the “androidsecure” service and logs in.GPad sets parameters for the session context (e.g., mobiledevice Android SDK version, mobile operator, country),then issues a GetAssetRequest for each app identifier in theinput list. GPad introduces a 10s delay between requests.The result contains the url for the app; GPad uses thisurl to retrieve and store the app’s binary stream into alocal file. After collecting the binaries of the apps on thelist, GPad scans each app apk using VirusTotal [12], anonline malware detector provider, to find out the numberof anti-malware tools (out of 57: AVG, McAfee, Symantec,Kaspersky, Malwarebytes, F-Secure, etc.) that identify theapk as suspicious.We used 4 servers (PowerEdge R620, IntelXeon E-26XX v2 CPUs) to collect our datasets, which wedescribe next.
3.1 Longitudinal App Data
In order to detect suspicious changes that occur early inthe lifetime of apps, we used the “New Releases” link toidentify apps with a short history on Google Play. Ourinterest in newly released apps stems from our analysisof search rank fraud jobs posted on crowdsourcing sites,that revealed that app developers often recruit fraudstersearly after uploading their apps on Google Play. Their intentis likely to create the illusion of an up-and-coming app,that may then snowball with interest from real users. Bymonitoring new apps, we aim to capture in real-time themoments when such search rank fraud campaigns begin.
4
0
1000
2000
3000
4000
5000
Per
sona
lizat
ion
Spo
rts
Bus
ines
s E
duca
tion
Too
ls
Pro
duct
ivity
H
ealth
& F
itnes
s T
rave
l & L
ocal
N
ews
& M
agaz
ines
L
ifest
yle
Boo
ks &
Ref
eren
ce
Com
mun
icat
ion
Fin
ance
A
rcad
e S
ocia
l E
nter
tain
men
t M
usic
& A
udio
P
uzzl
e P
hoto
grap
hy
Cas
ual
Med
ia &
Vid
eo
Act
ion
Adv
entu
re
Edu
catio
nal
Rac
ing
Sim
ulat
ion
Fam
ily
Triv
ia
Sho
ppin
g M
edic
al
Cas
ino
Tra
nspo
rtat
ion
Str
ateg
y B
oard
C
ard
Rol
e P
layi
ng
Wor
d C
omic
s L
ibra
ries
& D
emo
Wea
ther
M
usic
App types
Num
ber
of a
pps
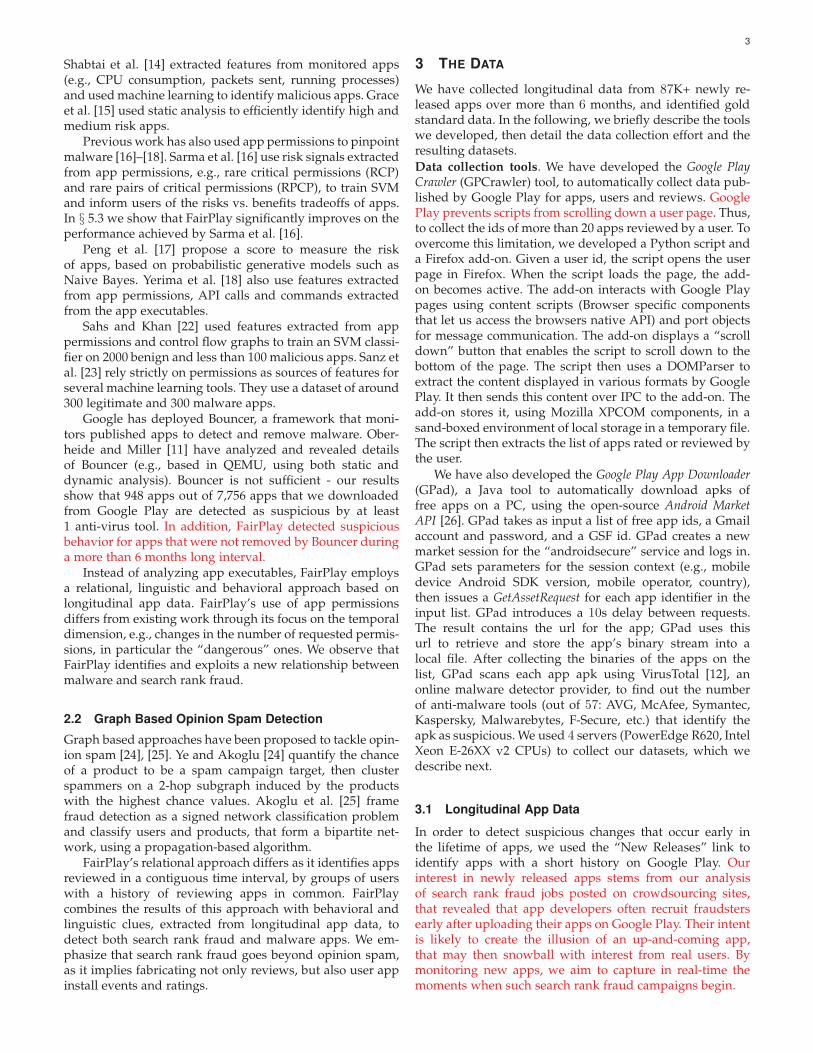
Fig. 3: Distribution of app types for the 87, 223 fresh app set.With the slight exception of “Personalization” and “Sports”type spikes, we have achieved an almost uniform distribu-tion across all app types, as desirable.
8184
95 588 1151
4570
11304
24317
19949
17065
0
5000
10000
15000
20000
25000
0−1 1−1.5 1.5−2 2−2.5 2.5−3 3−3.5 3.5−4 4−4.5 4.5−5Average rating of apps
Num
ber o
f app
s
Fig. 4: Average rating distribution for the 87, 223 fresh appset. Most apps have more than 3.5 stars, few have between1 and 2.5 stars, but more than 8, 000 apps have less than 1.
We approximate the first upload date of an app usingthe day of its first review. We have started collecting newreleases in July 2014 and by October 2014 we had a set of87, 223 apps, whose first upload time was under 40 daysprior to our first collection time, when they had at most 100reviews.
Figure 3 shows the distribution of the fresh app cate-gories. We have collected app from each category supportedby Google Play, with at least 500 apps per category (Music& Audio) and more than 4, 500 for the most popular cat-egory (Personalization). Figure 4 shows the average ratingdistribution of the fresh apps. Most apps have at least a 3.5rating aggregate rating, with few apps between 1 and 2.5stars. However, we observe a spike at more than 8, 000 appswith less than 1 star.
We have collected longitudinal data from these 87, 223apps between October 24, 2014 andMay 5, 2015. Specifically,for each app we captured “snapshots” of its Google Playmetadata, twice a week. An app snapshot consists of valuesfor all its time varying variables, e.g., the reviews, the ratingand install counts, and the set of requested permissions (see§ 2 for the complete list). For each of the 2, 850, 705 reviewswe have collected from the 87, 223 apps, we recorded thereviewer’s name and id (2, 380, 708 unique ids), date ofreview, review title, text, and rating.
This app monitoring process enables us to extract asuite of unique features, that include review, install andpermission changes. In particular, we note that this ap-
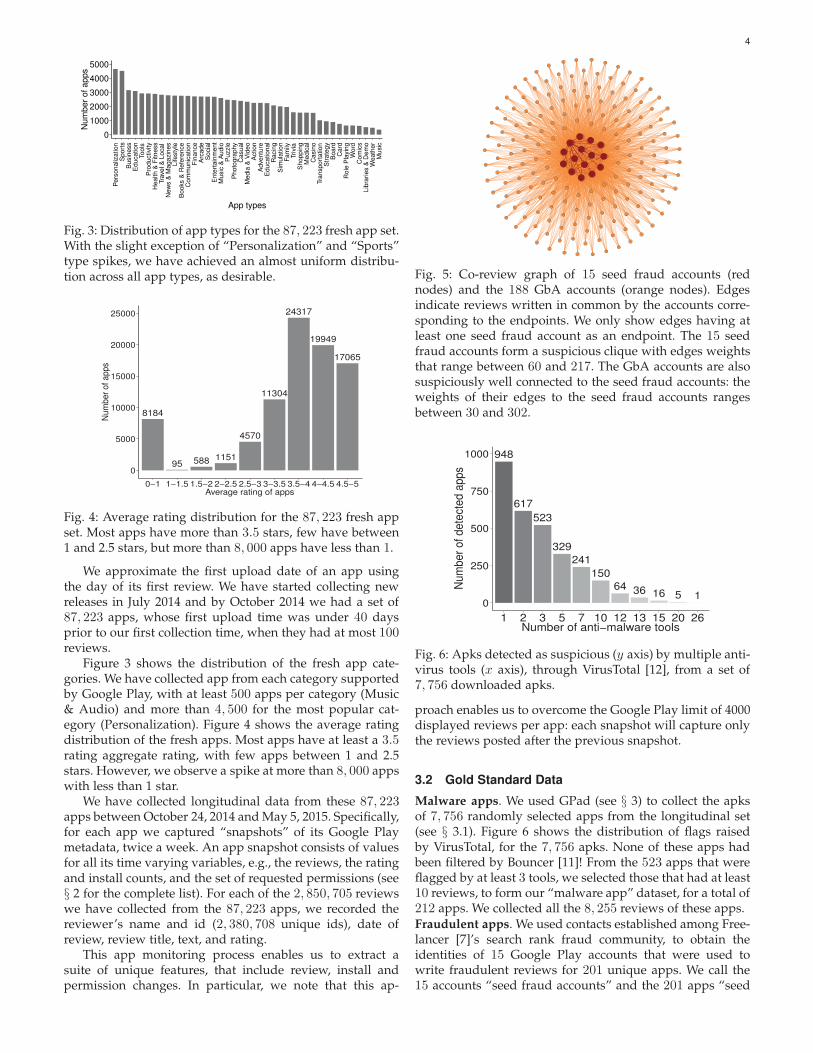
Fig. 5: Co-review graph of 15 seed fraud accounts (rednodes) and the 188 GbA accounts (orange nodes). Edgesindicate reviews written in common by the accounts corre-sponding to the endpoints. We only show edges having atleast one seed fraud account as an endpoint. The 15 seedfraud accounts form a suspicious clique with edges weightsthat range between 60 and 217. The GbA accounts are alsosuspiciously well connected to the seed fraud accounts: theweights of their edges to the seed fraud accounts rangesbetween 30 and 302.
948
617523
329241
15064 36 16 5 1
0
250
500
750
1000
1 2 3 5 7 10 12 13 15 20 26Number of anti−malware tools
Num
ber o
f det
ecte
d ap
ps
Fig. 6: Apks detected as suspicious (y axis) by multiple anti-virus tools (x axis), through VirusTotal [12], from a set of7, 756 downloaded apks.
proach enables us to overcome the Google Play limit of 4000displayed reviews per app: each snapshot will capture onlythe reviews posted after the previous snapshot.
3.2 Gold Standard Data
Malware apps. We used GPad (see § 3) to collect the apksof 7, 756 randomly selected apps from the longitudinal set(see § 3.1). Figure 6 shows the distribution of flags raisedby VirusTotal, for the 7, 756 apks. None of these apps hadbeen filtered by Bouncer [11]! From the 523 apps that wereflagged by at least 3 tools, we selected those that had at least10 reviews, to form our “malware app” dataset, for a total of212 apps. We collected all the 8, 255 reviews of these apps.Fraudulent apps. We used contacts established among Free-lancer [7]’s search rank fraud community, to obtain theidentities of 15 Google Play accounts that were used towrite fraudulent reviews for 201 unique apps. We call the15 accounts “seed fraud accounts” and the 201 apps “seed
5
Notation Definition
CoReG ModulenCliques number of pseudo-cliques with ρ ≥ θρmax, ρmed, ρSD clique density: max, median, SDCSmax, CSmed, CSSD pseudo-cliques size: max, median, SDinCliqueCount % of nodes involved in pseudo-cliques
RF ModulemalW % of reviews with malware indicatorsfraudW , goodW % of reviews with fraud/benign wordsFRI fraud review impact on app rating
IRR ModulespikeCount, spikeamp days with spikes & spike amplitudeI1/Rt1, I2/Rt2 install to rating ratiosI1/Rv1, I2/Rv2 install to review ratios
JH ModulepermCt, dangerCount # of total and dangerous permissionsrampCt # of dangerous permission rampsdangerRamp # of dangerous permissions added
TABLE 1: FairPlay’s most important features, organized bytheir extracting module. § 4.2 describes ρ and θ.
fraud apps”. Figure 5 shows the graph formed by the reviewhabits of the 15 seed accounts: nodes are accounts, edgesconnect accounts who reviewed apps in common, and edgeweights represent the number of such commonly reviewedapps. The 15 seed fraud accounts form a suspicious clique.This shows that worker controlled accounts are used toreview many apps in common: the weights of the edgesbetween the seed fraud accounts range between 60 and 217.
Fraudulent reviews. We have collected all the 53, 625 re-views received by the 201 seed fraud apps. The 15 seedfraud accounts were responsible for 1, 969 of these reviews.We used the 53, 625 reviews to identify 188 accounts, suchthat each account was used to review at least 10 of the 201seed fraud apps (for a total of 6, 488 reviews). We call these,guilt by association (GbA) accounts. Figure 5 shows the co-review edges between these GbA accounts (in orange) andthe seed fraud accounts: the GbA accounts are suspiciouslywell connected to the seed fraud accounts, with the weightsof their edges to the seed accounts ranging between 30 and302.
To reduce feature duplication, we have used the 1, 969fraudulent reviews written by the 15 seed accounts andthe 6, 488 fraudulent reviews written by the 188 GbA ac-counts for the 201 seed fraud apps, to extract a balanced setof fraudulent reviews. Specifically, from this set of 8, 457(= 1, 969+6, 488) reviews, we have collected 2 reviews fromeach of the 203 (= 188+15) suspicious user accounts. Thus,the gold standard dataset of fraudulent reviews consists of406 reviews.
The reason for collecting a small number of reviews fromeach fraudster is to reduce feature duplication: many of thefeatures we use to classify a review are extracted from theuser who wrote the review (see Table 2).Benign apps. We have selected 925 candidate apps fromthe longitudinal app set, that have been developed byGoogle designated “top developers”. We have used GPadto filter out those flagged by VirusTotal. We have manuallyinvestigated 601 of the remaining apps, and selected a set
Fig. 7: FairPlay system architecture. The CoReG moduleidentifies suspicious, time related co-review behaviors. TheRF module uses linguistic tools to detect suspicious behav-iors reported by genuine reviews. The IRR module usesbehavioral information to detect suspicious apps. The JHmodule identifies permission ramps to pinpoint possibleJekyll-Hyde app transitions.
of 200 apps that (i) have more than 10 reviews and (ii) weredeveloped by reputable media outlets (e.g., NBC, PBS) orhave an associated business model (e.g., fitness trackers).We have also collected the 32, 022 reviews of these apps.Genuine reviews. We have manually collected a goldstandard set of 315 genuine reviews, as follows. First, wehave collected the reviews written for apps installed onthe Android smartphones of the authors. We then usedGoogle’s text and reverse image search tools to identify andfilter those that plagiarized other reviews or were writtenfrom accounts with generic photos. We have then manuallyselected reviews that mirror the authors’ experience, have atleast 150 characters, and are informative (e.g., provide infor-mation about bugs, crash scenario, version update impact,recent changes).
4 FAIRPLAY: PROPOSED SOLUTION
We now introduce FairPlay, a system to automatically detectmalicious and fraudulent apps.
4.1 FairPlay Overview
FairPlay organizes the analysis of longitudinal app data intothe following 4 modules, illustrated in Figure 7. The Co-Review Graph (CoReG) module identifies apps reviewed ina contiguous time window by groups of users with signif-icantly overlapping review histories. The Review Feedback(RF) module exploits feedback left by genuine reviewers,while the Inter Review Relation (IRR) module leveragesrelations between reviews, ratings and install counts. TheJekyll-Hyde (JH) module monitors app permissions, witha focus on dangerous ones, to identify apps that convertfrom benign to malware. Each module produces severalfeatures that are used to train an app classifier. FairPlay alsouses general features such as the app’s average rating, totalnumber of reviews, ratings and installs, for a total of 28features. Table 1 summarizes the most important features.We now detail each module and the features it extracts.
6
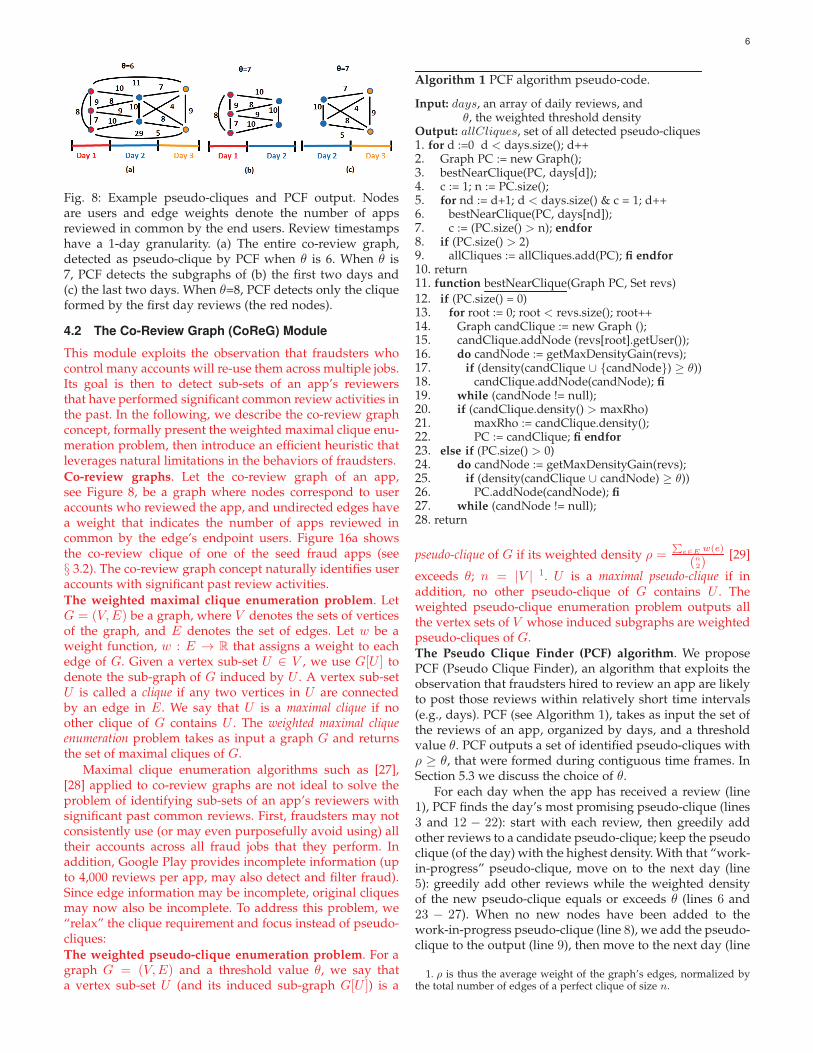
Fig. 8: Example pseudo-cliques and PCF output. Nodesare users and edge weights denote the number of appsreviewed in common by the end users. Review timestampshave a 1-day granularity. (a) The entire co-review graph,detected as pseudo-clique by PCF when θ is 6. When θ is7, PCF detects the subgraphs of (b) the first two days and(c) the last two days. When θ=8, PCF detects only the cliqueformed by the first day reviews (the red nodes).
4.2 The Co-Review Graph (CoReG) Module
This module exploits the observation that fraudsters whocontrol many accounts will re-use them across multiple jobs.Its goal is then to detect sub-sets of an app’s reviewersthat have performed significant common review activities inthe past. In the following, we describe the co-review graphconcept, formally present the weighted maximal clique enu-meration problem, then introduce an efficient heuristic thatleverages natural limitations in the behaviors of fraudsters.Co-review graphs. Let the co-review graph of an app,see Figure 8, be a graph where nodes correspond to useraccounts who reviewed the app, and undirected edges havea weight that indicates the number of apps reviewed incommon by the edge’s endpoint users. Figure 16a showsthe co-review clique of one of the seed fraud apps (see§ 3.2). The co-review graph concept naturally identifies useraccounts with significant past review activities.The weighted maximal clique enumeration problem. LetG = (V,E) be a graph, where V denotes the sets of verticesof the graph, and E denotes the set of edges. Let w be aweight function, w : E → R that assigns a weight to eachedge of G. Given a vertex sub-set U ∈ V , we use G[U ] todenote the sub-graph of G induced by U . A vertex sub-setU is called a clique if any two vertices in U are connectedby an edge in E. We say that U is a maximal clique if noother clique of G contains U . The weighted maximal cliqueenumeration problem takes as input a graph G and returnsthe set of maximal cliques of G.
Maximal clique enumeration algorithms such as [27],[28] applied to co-review graphs are not ideal to solve theproblem of identifying sub-sets of an app’s reviewers withsignificant past common reviews. First, fraudsters may notconsistently use (or may even purposefully avoid using) alltheir accounts across all fraud jobs that they perform. Inaddition, Google Play provides incomplete information (upto 4,000 reviews per app, may also detect and filter fraud).Since edge information may be incomplete, original cliquesmay now also be incomplete. To address this problem, we“relax” the clique requirement and focus instead of pseudo-cliques:The weighted pseudo-clique enumeration problem. For agraph G = (V,E) and a threshold value θ, we say thata vertex sub-set U (and its induced sub-graph G[U ]) is a
Algorithm 1 PCF algorithm pseudo-code.
Input: days, an array of daily reviews, andθ, the weighted threshold density
Output: allCliques, set of all detected pseudo-cliques1. for d :=0 d < days.size(); d++2. Graph PC := new Graph();3. bestNearClique(PC, days[d]);4. c := 1; n := PC.size();5. for nd := d+1; d < days.size() & c = 1; d++6. bestNearClique(PC, days[nd]);7. c := (PC.size() > n); endfor8. if (PC.size() > 2)9. allCliques := allCliques.add(PC); fi endfor10. return11. function bestNearClique(Graph PC, Set revs)12. if (PC.size() = 0)13. for root := 0; root < revs.size(); root++14. Graph candClique := new Graph ();15. candClique.addNode (revs[root].getUser());16. do candNode := getMaxDensityGain(revs);17. if (density(candClique ∪ {candNode}) ≥ θ))18. candClique.addNode(candNode); fi19. while (candNode != null);20. if (candClique.density() > maxRho)21. maxRho := candClique.density();22. PC := candClique; fi endfor23. else if (PC.size() > 0)24. do candNode := getMaxDensityGain(revs);25. if (density(candClique ∪ candNode) ≥ θ))26. PC.addNode(candNode); fi27. while (candNode != null);28. return
pseudo-clique of G if its weighted density ρ =∑
e∈Ew(e)
(n2)
[29]
exceeds θ; n = |V | 1. U is a maximal pseudo-clique if inaddition, no other pseudo-clique of G contains U . Theweighted pseudo-clique enumeration problem outputs allthe vertex sets of V whose induced subgraphs are weightedpseudo-cliques of G.The Pseudo Clique Finder (PCF) algorithm. We proposePCF (Pseudo Clique Finder), an algorithm that exploits theobservation that fraudsters hired to review an app are likelyto post those reviews within relatively short time intervals(e.g., days). PCF (see Algorithm 1), takes as input the set ofthe reviews of an app, organized by days, and a thresholdvalue θ. PCF outputs a set of identified pseudo-cliques withρ ≥ θ, that were formed during contiguous time frames. InSection 5.3 we discuss the choice of θ.
For each day when the app has received a review (line1), PCF finds the day’s most promising pseudo-clique (lines3 and 12 − 22): start with each review, then greedily addother reviews to a candidate pseudo-clique; keep the pseudoclique (of the day) with the highest density. With that “work-in-progress” pseudo-clique, move on to the next day (line5): greedily add other reviews while the weighted densityof the new pseudo-clique equals or exceeds θ (lines 6 and23 − 27). When no new nodes have been added to thework-in-progress pseudo-clique (line 8), we add the pseudo-clique to the output (line 9), then move to the next day (line
1. ρ is thus the average weight of the graph’s edges, normalized bythe total number of edges of a perfect clique of size n.

7
Notation Definition
ρR The rating of RL(R) The length of Rpos(R) Percentage of positive statements in Rneg(R) Percentage of negative statements in R
nr(U) The number of reviews written by Uπ(ρR) Percentile of ρR among all reviews of UExpU(A) The expertise of U for app ABU (A) The bias of U for APaid(U) The money spent by U to buy appsRated(U) Number of apps rated by UplusOne(U) Number of apps +1’d by Un.flwrs(U) Number of followers of U in Google+
TABLE 2: Features used to classify review R written by userU for app A.
1). The greedy choice (getMaxDensityGain, not depictedin Algorithm 1) picks the review not yet in the work-in-progress pseudo-clique, whose writer has written the mostapps in common with reviewers already in the pseudo-clique. Figure 8 illustrates the output of PCF for several θvalues.
If d is the number of days over which A has receivedreviews and r is the maximum number of reviews receivedin a day, PCF’s complexity is O(dr2(r + d)).
We note that if multiple fraudsters target an app in thesame day, PCF may detect only the most densely connectedpseudo-clique, corresponding to the most prolific fraudster,and miss the lesser dense ones.CoReG features. CoReG extracts the following featuresfrom the output of PCF (see Table 1) (i) the number of cliqueswhose density equals or exceeds θ, (ii) the maximum, me-dian and standard deviation of the densities of identifiedpseudo-cliques, (iii) the maximum, median and standarddeviation of the node count of identified pseudo-cliques,normalized by n (the app’s review count), and (iv) the totalnumber of nodes of the co-review graph that belong to atleast one pseudo-clique, normalized by n.
4.3 Reviewer Feedback (RF) Module
Reviews written by genuine users of malware and fraudu-lent apps may describe negative experiences. The RF mod-ule exploits this observation through a two step approach:(i) detect and filter out fraudulent reviews, then (ii) identifymalware and fraud indicative feedback from the remainingreviews.Step RF.1: Fraudulent review filter. We posit that certainfeatures can accurately pinpoint genuine and fake reviews.We propose several such features, see Table 2 for a summary,defined for a review R written by user U for an app A.• Reviewer based features. The expertise of U for appA, definedas the number of reviewsU wrote for apps that are “similar”toA, as listed by Google Play (see § 2). The bias of U towardsA: the number of reviews written by U for other appsdeveloped byA’s developer. In addition, we extract the totalmoney paid by U on apps it has reviewed, the number ofapps that U has liked, and the number of Google+ followersof U .• Text based features. We used the NLTK library [30] and theNaive Bayes classifier, trained on two datasets: (i) 1, 041
0
25
50
75
2013 2013 2014 2014 2015Time
Po
siti
ve r
evie
ws
Daily Yoga− Fitness On−the−Go
0
15
30
45
60
2013 2014 2014 2014 2014 2015 2015Time
Po
siti
ve r
evie
ws
RealCalc Scientific Calculator
Fig. 9: Timelines of positive reviews for 2 apps from thefraudulent app dataset. The first app has multiple spikeswhile the second one has only one significant spike.
sentences extracted from randomly selected 350 positiveand 410 negative Google Play reviews, and (ii) 10, 663sentences extracted from 700 positive and 700 negativeIMDB movie reviews [31]. 10-fold cross validation of theNaive Bayes classifier over these datasets reveals a falsenegative rate of 16.1%and a false positive rate of 19.65%, foran overall accuracy of 81.74%. We ran a binomial test [32]for a given accuracy of p=0.817 over N=1,041 cases usingthe binomial distribution binomial(p,N) to assess the 95%confidence interval for our result. The deviation of thebinomial distribution is 0.011. Thus, we are 95% confidentthat the true performance of the classifier is in the interval(79.55, 83.85).
We used the trained Naive Bayes classifier to determinethe statements of R that encode positive and negativesentiments. We then extracted the following features: (i)the percentage of statements in R that encode positive andnegative sentiments respectively, and (ii) the rating ofR andits percentile among the reviews written by U .
In Section 5 we evaluate the review classification ac-curacy of several supervised learning algorithms trainedon these features and on the gold standard datasets offraudulent and genuine reviews introduced in Section 3.2.Step RF.2: Reviewer feedback extraction. We conjecturethat (i) since no app is perfect, a “balanced” review thatcontains both app positive and negative sentiments is morelikely to be genuine, and (ii) there should exist a relationbetween the review’s dominating sentiment and its rating.Thus, after filtering out fraudulent reviews, we extractfeedback from the remaining reviews. For this, we haveused NLTK to extract 5, 106 verbs, 7, 260 nouns and 13, 128adjectives from the 97, 071 reviews we collected from the613 gold standard apps (see § 3.2). We removed non asciicharacters and stop words, then applied lemmatizationand discarded words that appear at most once. We haveattempted to use stemming, extracting the roots of words,however, it performed poorly. This is due to the fact thatreviews often contain (i) shorthands, e.g., “ads”, “seeya”,“gotcha”, “inapp”, (ii) misspelled words, e.g., “pathytic”,“folish”, “gredy”, “dispear” and even (iii) emphasized mis-spellings, e.g., “hackkked”, “spammmerrr”, “spooooky”.
8
Sta
ndar
dize
dR
esid
uals
:
<−
4−
4:−
2−
2:0
0:2
2:4
>4 1
− 5
10
− 5
0
100
− 5
00
100
K −
500
K
10K
− 5
0K
10M
− 5
0M
1K
− 5
K
1M
− 5
M
5 −
10
50
− 1
00
500
− 1
K
500
K −
1M
50K
− 1
00K
5
0M −
100
M
5K
− 1
0K
5M
− 1
0M
0.5M~1M
1~5
10~50100~500100K~0.5M10K~50K1K~5K1M+5~1050~100500~1K50K~100K5K~10K
Install count
Rat
ing
coun
t
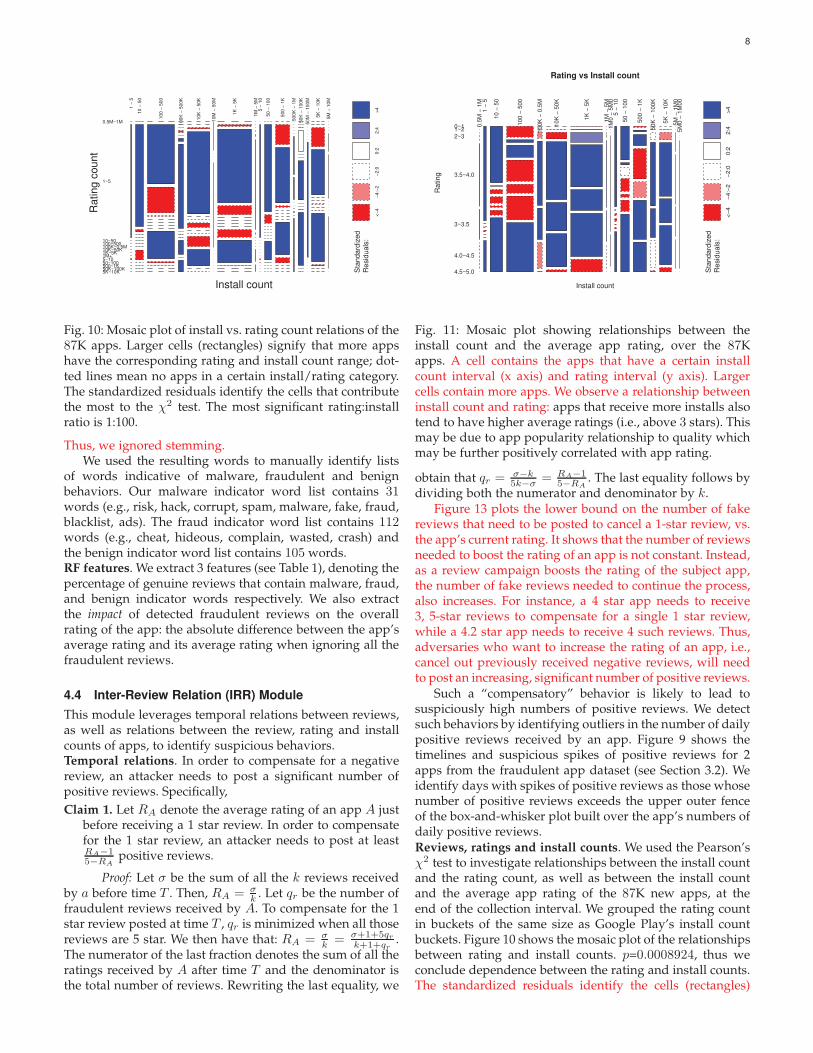
Fig. 10: Mosaic plot of install vs. rating count relations of the87K apps. Larger cells (rectangles) signify that more appshave the corresponding rating and install count range; dot-ted lines mean no apps in a certain install/rating category.The standardized residuals identify the cells that contributethe most to the χ2 test. The most significant rating:installratio is 1:100.
Thus, we ignored stemming.We used the resulting words to manually identify lists
of words indicative of malware, fraudulent and benignbehaviors. Our malware indicator word list contains 31words (e.g., risk, hack, corrupt, spam, malware, fake, fraud,blacklist, ads). The fraud indicator word list contains 112words (e.g., cheat, hideous, complain, wasted, crash) andthe benign indicator word list contains 105 words.RF features. We extract 3 features (see Table 1), denoting thepercentage of genuine reviews that contain malware, fraud,and benign indicator words respectively. We also extractthe impact of detected fraudulent reviews on the overallrating of the app: the absolute difference between the app’saverage rating and its average rating when ignoring all thefraudulent reviews.
4.4 Inter-Review Relation (IRR) Module
This module leverages temporal relations between reviews,as well as relations between the review, rating and installcounts of apps, to identify suspicious behaviors.Temporal relations. In order to compensate for a negativereview, an attacker needs to post a significant number ofpositive reviews. Specifically,Claim 1. Let RA denote the average rating of an app A just
before receiving a 1 star review. In order to compensatefor the 1 star review, an attacker needs to post at leastRA−15−RA
positive reviews.
Proof: Let σ be the sum of all the k reviews receivedby a before time T . Then, RA = σ
k. Let qr be the number of
fraudulent reviews received by A. To compensate for the 1star review posted at time T , qr is minimized when all thosereviews are 5 star. We then have that: RA = σ
k= σ+1+5qr
k+1+qr.
The numerator of the last fraction denotes the sum of all theratings received by A after time T and the denominator isthe total number of reviews. Rewriting the last equality, we
Sta
ndar
dize
dR
esid
uals
:
<−
4−
4:−
2−
2:0
0:2
2:4
>4
Rating vs Install count
Install count
Rat
ing
0.5
M −
1M
1
− 5
10
− 5
0
100
− 5
00
100
K −
0.5
M
10K
− 5
0K
1K
− 5
K
1M
− 5
M
1M
0 −
5M
0
5 −
10
50
− 1
00
500
− 1
K
50K
− 1
00K
5K
− 1
0K
5M
− 1
M0
5
M0
− 1
M00
0~11~22~3
3.5~4.0
3~3.5
4.0~4.5
4.5~5.0
Fig. 11: Mosaic plot showing relationships between theinstall count and the average app rating, over the 87Kapps. A cell contains the apps that have a certain installcount interval (x axis) and rating interval (y axis). Largercells contain more apps. We observe a relationship betweeninstall count and rating: apps that receive more installs alsotend to have higher average ratings (i.e., above 3 stars). Thismay be due to app popularity relationship to quality whichmay be further positively correlated with app rating.
obtain that qr = σ−k5k−σ
= RA−15−RA
. The last equality follows bydividing both the numerator and denominator by k.
Figure 13 plots the lower bound on the number of fakereviews that need to be posted to cancel a 1-star review, vs.the app’s current rating. It shows that the number of reviewsneeded to boost the rating of an app is not constant. Instead,as a review campaign boosts the rating of the subject app,the number of fake reviews needed to continue the process,also increases. For instance, a 4 star app needs to receive3, 5-star reviews to compensate for a single 1 star review,while a 4.2 star app needs to receive 4 such reviews. Thus,adversaries who want to increase the rating of an app, i.e.,cancel out previously received negative reviews, will needto post an increasing, significant number of positive reviews.
Such a “compensatory” behavior is likely to lead tosuspiciously high numbers of positive reviews. We detectsuch behaviors by identifying outliers in the number of dailypositive reviews received by an app. Figure 9 shows thetimelines and suspicious spikes of positive reviews for 2apps from the fraudulent app dataset (see Section 3.2). Weidentify days with spikes of positive reviews as those whosenumber of positive reviews exceeds the upper outer fenceof the box-and-whisker plot built over the app’s numbers ofdaily positive reviews.Reviews, ratings and install counts. We used the Pearson’sχ2 test to investigate relationships between the install countand the rating count, as well as between the install countand the average app rating of the 87K new apps, at theend of the collection interval. We grouped the rating countin buckets of the same size as Google Play’s install countbuckets. Figure 10 shows the mosaic plot of the relationshipsbetween rating and install counts. p=0.0008924, thus weconclude dependence between the rating and install counts.The standardized residuals identify the cells (rectangles)
9
15
0 0
64
34
6472
113
75
3847
39
814
82 3 1 1 1 2
0
25
50
75
100
125
0 1−5 6−10 11−1516−2021−2526−30Permission count
Num
ber
of a
pps
LegitimateMalwareFake
(a)
46
14
40
138
162
115
16
32 28
0 2 3 0 1 10
50
100
150
0 1−5 6−10 11−15 16−20Dangerous permission count
Num
ber
of a
pps
LegitimateMalwareFake
(b) (c)
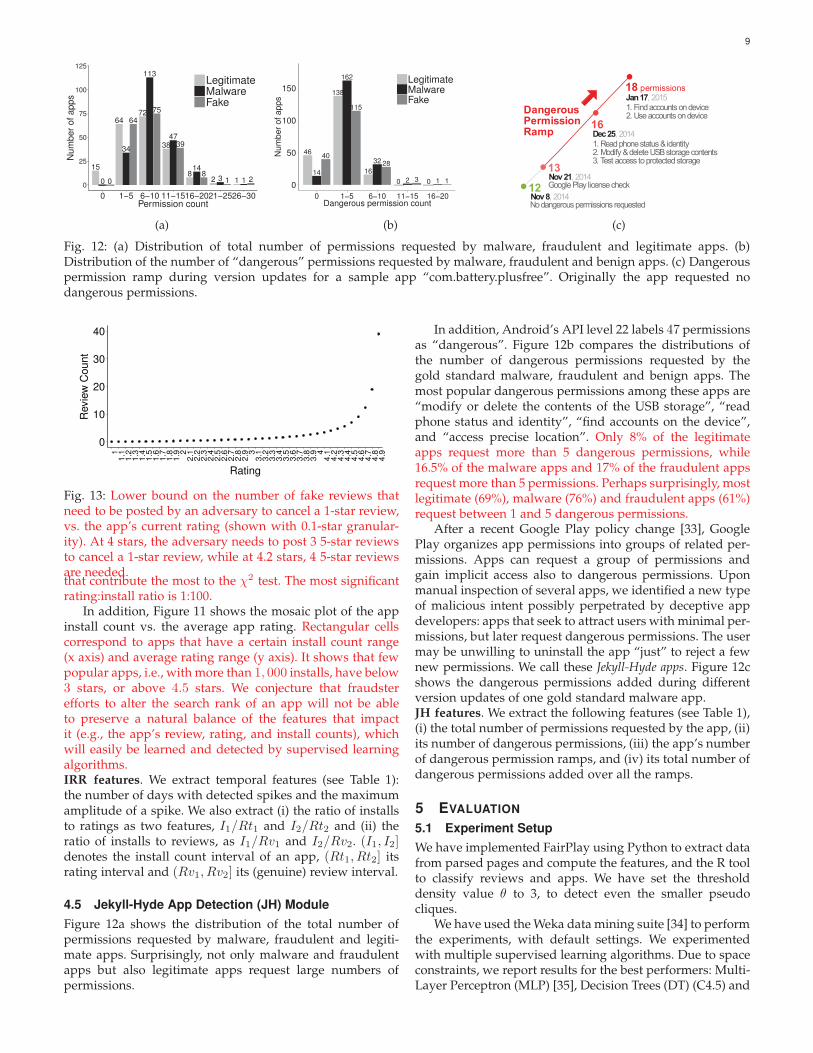
Fig. 12: (a) Distribution of total number of permissions requested by malware, fraudulent and legitimate apps. (b)Distribution of the number of “dangerous” permissions requested by malware, fraudulent and benign apps. (c) Dangerouspermission ramp during version updates for a sample app “com.battery.plusfree”. Originally the app requested nodangerous permissions.
0
10
20
30
40
11.
11.
21.
31.
41.
51.
61.
71.
81.
9 22.
12.
22.
32.
42.
52.
62.
72.
82.
9 33.
13.
23.
33.
43.
53.
63.
73.
83.
9 44.
14.
24.
34.
44.
54.
64.
74.
84.
9
Rating
Rev
iew
Cou
nt
Fig. 13: Lower bound on the number of fake reviews thatneed to be posted by an adversary to cancel a 1-star review,vs. the app’s current rating (shown with 0.1-star granular-ity). At 4 stars, the adversary needs to post 3 5-star reviewsto cancel a 1-star review, while at 4.2 stars, 4 5-star reviewsare needed.that contribute the most to the χ2 test. The most significantrating:install ratio is 1:100.
In addition, Figure 11 shows the mosaic plot of the appinstall count vs. the average app rating. Rectangular cellscorrespond to apps that have a certain install count range(x axis) and average rating range (y axis). It shows that fewpopular apps, i.e., with more than 1, 000 installs, have below3 stars, or above 4.5 stars. We conjecture that fraudsterefforts to alter the search rank of an app will not be ableto preserve a natural balance of the features that impactit (e.g., the app’s review, rating, and install counts), whichwill easily be learned and detected by supervised learningalgorithms.IRR features. We extract temporal features (see Table 1):the number of days with detected spikes and the maximumamplitude of a spike. We also extract (i) the ratio of installsto ratings as two features, I1/Rt1 and I2/Rt2 and (ii) theratio of installs to reviews, as I1/Rv1 and I2/Rv2. (I1, I2]denotes the install count interval of an app, (Rt1, Rt2] itsrating interval and (Rv1, Rv2] its (genuine) review interval.
4.5 Jekyll-Hyde App Detection (JH) Module
Figure 12a shows the distribution of the total number ofpermissions requested by malware, fraudulent and legiti-mate apps. Surprisingly, not only malware and fraudulentapps but also legitimate apps request large numbers ofpermissions.
In addition, Android’s API level 22 labels 47 permissionsas “dangerous”. Figure 12b compares the distributions ofthe number of dangerous permissions requested by thegold standard malware, fraudulent and benign apps. Themost popular dangerous permissions among these apps are“modify or delete the contents of the USB storage”, “readphone status and identity”, “find accounts on the device”,and “access precise location”. Only 8% of the legitimateapps request more than 5 dangerous permissions, while16.5% of the malware apps and 17% of the fraudulent appsrequest more than 5 permissions. Perhaps surprisingly, mostlegitimate (69%), malware (76%) and fraudulent apps (61%)request between 1 and 5 dangerous permissions.
After a recent Google Play policy change [33], GooglePlay organizes app permissions into groups of related per-missions. Apps can request a group of permissions andgain implicit access also to dangerous permissions. Uponmanual inspection of several apps, we identified a new typeof malicious intent possibly perpetrated by deceptive appdevelopers: apps that seek to attract users with minimal per-missions, but later request dangerous permissions. The usermay be unwilling to uninstall the app “just” to reject a fewnew permissions. We call these Jekyll-Hyde apps. Figure 12cshows the dangerous permissions added during differentversion updates of one gold standard malware app.JH features. We extract the following features (see Table 1),(i) the total number of permissions requested by the app, (ii)its number of dangerous permissions, (iii) the app’s numberof dangerous permission ramps, and (iv) its total number ofdangerous permissions added over all the ramps.
5 EVALUATION
5.1 Experiment Setup
We have implemented FairPlay using Python to extract datafrom parsed pages and compute the features, and the R toolto classify reviews and apps. We have set the thresholddensity value θ to 3, to detect even the smaller pseudocliques.
We have used theWeka data mining suite [34] to performthe experiments, with default settings. We experimentedwith multiple supervised learning algorithms. Due to spaceconstraints, we report results for the best performers: Multi-Layer Perceptron (MLP) [35], Decision Trees (DT) (C4.5) and
10
Strategy FPR% FNR% Accuracy%
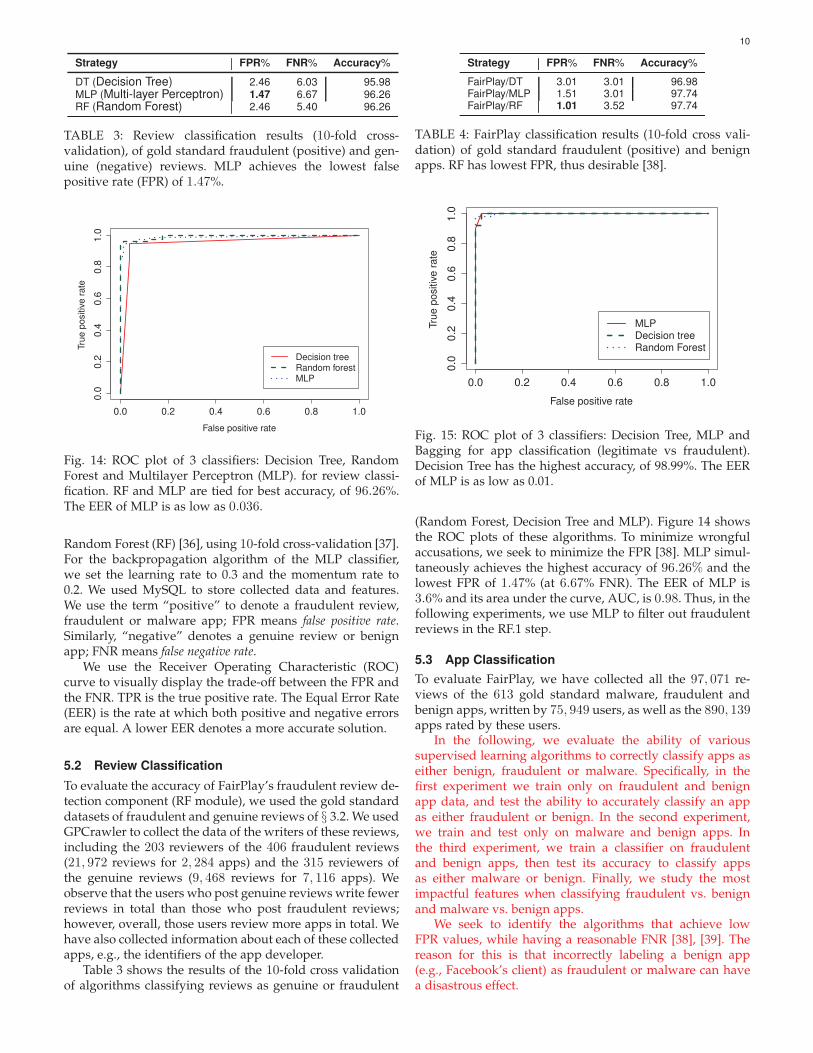
DT (Decision Tree) 2.46 6.03 95.98MLP (Multi-layer Perceptron) 1.47 6.67 96.26RF (Random Forest) 2.46 5.40 96.26
TABLE 3: Review classification results (10-fold cross-validation), of gold standard fraudulent (positive) and gen-uine (negative) reviews. MLP achieves the lowest falsepositive rate (FPR) of 1.47%.
False positive rate
True
pos
itive
rat
e
0.0 0.2 0.4 0.6 0.8 1.0
0.0
0.2
0.4
0.6
0.8
1.0
Decision treeRandom forestMLP
Fig. 14: ROC plot of 3 classifiers: Decision Tree, RandomForest and Multilayer Perceptron (MLP). for review classi-fication. RF and MLP are tied for best accuracy, of 96.26%.The EER of MLP is as low as 0.036.
Random Forest (RF) [36], using 10-fold cross-validation [37].For the backpropagation algorithm of the MLP classifier,we set the learning rate to 0.3 and the momentum rate to0.2. We used MySQL to store collected data and features.We use the term “positive” to denote a fraudulent review,fraudulent or malware app; FPR means false positive rate.Similarly, “negative” denotes a genuine review or benignapp; FNR means false negative rate.
We use the Receiver Operating Characteristic (ROC)curve to visually display the trade-off between the FPR andthe FNR. TPR is the true positive rate. The Equal Error Rate(EER) is the rate at which both positive and negative errorsare equal. A lower EER denotes a more accurate solution.
5.2 Review Classification
To evaluate the accuracy of FairPlay’s fraudulent review de-tection component (RF module), we used the gold standarddatasets of fraudulent and genuine reviews of § 3.2. We usedGPCrawler to collect the data of the writers of these reviews,including the 203 reviewers of the 406 fraudulent reviews(21, 972 reviews for 2, 284 apps) and the 315 reviewers ofthe genuine reviews (9, 468 reviews for 7, 116 apps). Weobserve that the users who post genuine reviews write fewerreviews in total than those who post fraudulent reviews;however, overall, those users review more apps in total. Wehave also collected information about each of these collectedapps, e.g., the identifiers of the app developer.
Table 3 shows the results of the 10-fold cross validationof algorithms classifying reviews as genuine or fraudulent
Strategy FPR% FNR% Accuracy%
FairPlay/DT 3.01 3.01 96.98FairPlay/MLP 1.51 3.01 97.74FairPlay/RF 1.01 3.52 97.74
TABLE 4: FairPlay classification results (10-fold cross vali-dation) of gold standard fraudulent (positive) and benignapps. RF has lowest FPR, thus desirable [38].
False positive rate
True
pos
itive
rat
e
0.0 0.2 0.4 0.6 0.8 1.0
0.0
0.2
0.4
0.6
0.8
1.0
MLPDecision treeRandom Forest
Fig. 15: ROC plot of 3 classifiers: Decision Tree, MLP andBagging for app classification (legitimate vs fraudulent).Decision Tree has the highest accuracy, of 98.99%. The EERof MLP is as low as 0.01.
(Random Forest, Decision Tree and MLP). Figure 14 showsthe ROC plots of these algorithms. To minimize wrongfulaccusations, we seek to minimize the FPR [38]. MLP simul-taneously achieves the highest accuracy of 96.26% and thelowest FPR of 1.47% (at 6.67% FNR). The EER of MLP is3.6% and its area under the curve, AUC, is 0.98. Thus, in thefollowing experiments, we use MLP to filter out fraudulentreviews in the RF.1 step.
5.3 App Classification
To evaluate FairPlay, we have collected all the 97, 071 re-views of the 613 gold standard malware, fraudulent andbenign apps, written by 75, 949 users, as well as the 890, 139apps rated by these users.
In the following, we evaluate the ability of varioussupervised learning algorithms to correctly classify apps aseither benign, fraudulent or malware. Specifically, in thefirst experiment we train only on fraudulent and benignapp data, and test the ability to accurately classify an appas either fraudulent or benign. In the second experiment,we train and test only on malware and benign apps. Inthe third experiment, we train a classifier on fraudulentand benign apps, then test its accuracy to classify appsas either malware or benign. Finally, we study the mostimpactful features when classifying fraudulent vs. benignand malware vs. benign apps.
We seek to identify the algorithms that achieve lowFPR values, while having a reasonable FNR [38], [39]. Thereason for this is that incorrectly labeling a benign app(e.g., Facebook’s client) as fraudulent or malware can havea disastrous effect.
11
(a)
0
1
2
3
4
5
6
7
8
9
10
>20
11-20
0 20 40 60
No. ofpseudocliques
with >3
No. of Apps
(b)
Belong to largest cliqueBelong to any pseudo clique
0-10
11-20
21-30
31-40
41-50
51-60
61-70
71-80
81-90
91-100
0 20 40 60 80
No. ofApps
% of app reviewers (nodes)
(c)
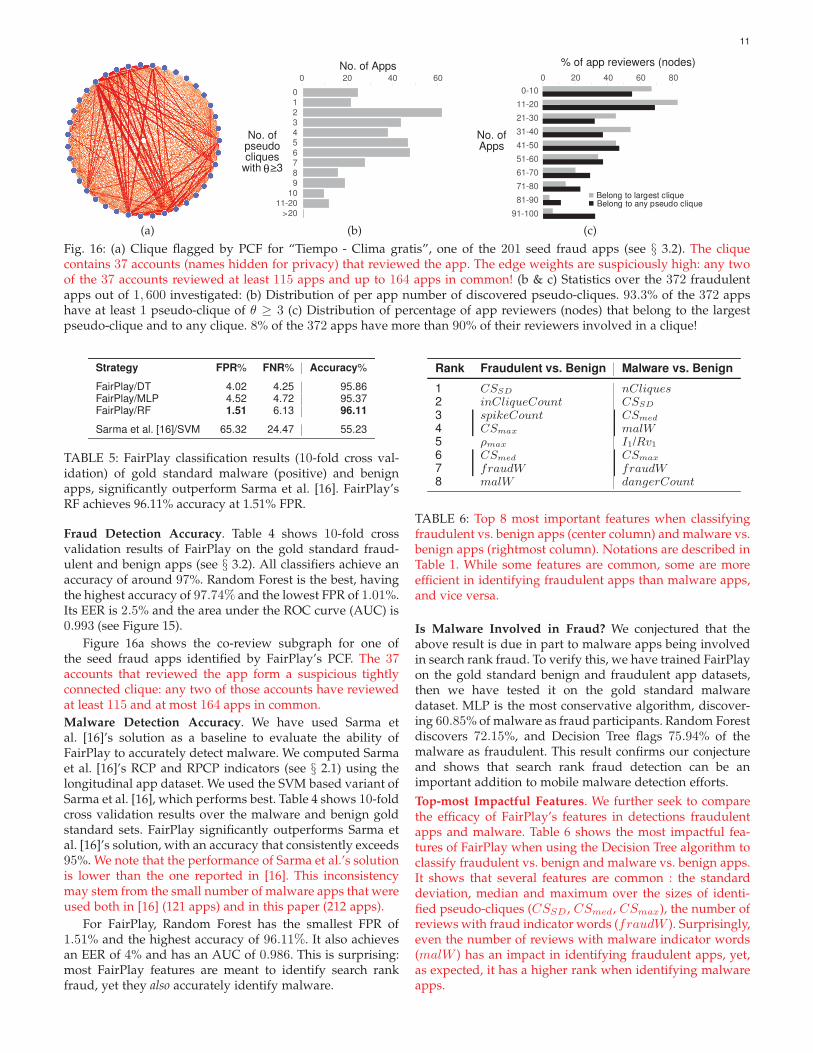
Fig. 16: (a) Clique flagged by PCF for “Tiempo - Clima gratis”, one of the 201 seed fraud apps (see § 3.2). The cliquecontains 37 accounts (names hidden for privacy) that reviewed the app. The edge weights are suspiciously high: any twoof the 37 accounts reviewed at least 115 apps and up to 164 apps in common! (b & c) Statistics over the 372 fraudulentapps out of 1, 600 investigated: (b) Distribution of per app number of discovered pseudo-cliques. 93.3% of the 372 appshave at least 1 pseudo-clique of θ ≥ 3 (c) Distribution of percentage of app reviewers (nodes) that belong to the largestpseudo-clique and to any clique. 8% of the 372 apps have more than 90% of their reviewers involved in a clique!
Strategy FPR% FNR% Accuracy%
FairPlay/DT 4.02 4.25 95.86FairPlay/MLP 4.52 4.72 95.37FairPlay/RF 1.51 6.13 96.11
Sarma et al. [16]/SVM 65.32 24.47 55.23
TABLE 5: FairPlay classification results (10-fold cross val-idation) of gold standard malware (positive) and benignapps, significantly outperform Sarma et al. [16]. FairPlay’sRF achieves 96.11% accuracy at 1.51% FPR.
Fraud Detection Accuracy. Table 4 shows 10-fold crossvalidation results of FairPlay on the gold standard fraud-ulent and benign apps (see § 3.2). All classifiers achieve anaccuracy of around 97%. Random Forest is the best, havingthe highest accuracy of 97.74% and the lowest FPR of 1.01%.Its EER is 2.5% and the area under the ROC curve (AUC) is0.993 (see Figure 15).
Figure 16a shows the co-review subgraph for one ofthe seed fraud apps identified by FairPlay’s PCF. The 37accounts that reviewed the app form a suspicious tightlyconnected clique: any two of those accounts have reviewedat least 115 and at most 164 apps in common.Malware Detection Accuracy. We have used Sarma etal. [16]’s solution as a baseline to evaluate the ability ofFairPlay to accurately detect malware. We computed Sarmaet al. [16]’s RCP and RPCP indicators (see § 2.1) using thelongitudinal app dataset. We used the SVM based variant ofSarma et al. [16], which performs best. Table 4 shows 10-foldcross validation results over the malware and benign goldstandard sets. FairPlay significantly outperforms Sarma etal. [16]’s solution, with an accuracy that consistently exceeds95%. We note that the performance of Sarma et al.’s solutionis lower than the one reported in [16]. This inconsistencymay stem from the small number of malware apps that wereused both in [16] (121 apps) and in this paper (212 apps).
For FairPlay, Random Forest has the smallest FPR of1.51% and the highest accuracy of 96.11%. It also achievesan EER of 4% and has an AUC of 0.986. This is surprising:most FairPlay features are meant to identify search rankfraud, yet they also accurately identify malware.
Rank Fraudulent vs. Benign Malware vs. Benign
1 CSSD nCliques2 inCliqueCount CSSD
3 spikeCount CSmed
4 CSmax malW5 ρmax I1/Rv16 CSmed CSmax
7 fraudW fraudW8 malW dangerCount
TABLE 6: Top 8 most important features when classifyingfraudulent vs. benign apps (center column) and malware vs.benign apps (rightmost column). Notations are described inTable 1. While some features are common, some are moreefficient in identifying fraudulent apps than malware apps,and vice versa.
Is Malware Involved in Fraud? We conjectured that theabove result is due in part to malware apps being involvedin search rank fraud. To verify this, we have trained FairPlayon the gold standard benign and fraudulent app datasets,then we have tested it on the gold standard malwaredataset. MLP is the most conservative algorithm, discover-ing 60.85%of malware as fraud participants. Random Forestdiscovers 72.15%, and Decision Tree flags 75.94% of themalware as fraudulent. This result confirms our conjectureand shows that search rank fraud detection can be animportant addition to mobile malware detection efforts.Top-most Impactful Features. We further seek to comparethe efficacy of FairPlay’s features in detections fraudulentapps and malware. Table 6 shows the most impactful fea-tures of FairPlay when using the Decision Tree algorithm toclassify fraudulent vs. benign and malware vs. benign apps.It shows that several features are common : the standarddeviation, median and maximum over the sizes of identi-fied pseudo-cliques (CSSD , CSmed, CSmax), the number ofreviews with fraud indicator words (fraudW ). Surprisingly,even the number of reviews with malware indicator words(malW ) has an impact in identifying fraudulent apps, yet,as expected, it has a higher rank when identifying malwareapps.
12
0
100
200
300
400
500
0 250 500 750 1000# of nodes
# of
nod
es in
max
cliq
ue
(a)
0
50
100
150
200
250
0 250 500 750 1000# of nodes
Den
sity
of m
ax c
lique
(b)
0
100
200
300
400
500
0 50 100 150 200# of nodes
# of
nod
es in
max
cliq
ue
(c)
0
50
100
150
200
250
0 50 100 150 200# of nodes
Den
sity
of m
ax c
lique
(d)
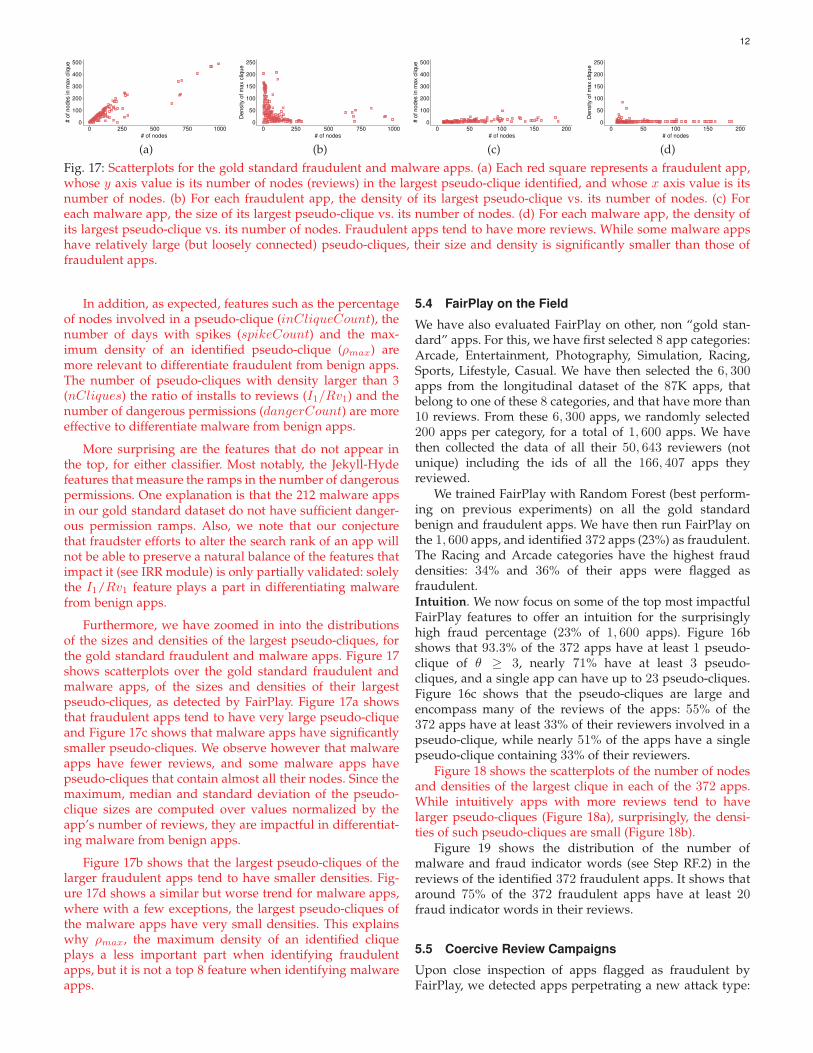
Fig. 17: Scatterplots for the gold standard fraudulent and malware apps. (a) Each red square represents a fraudulent app,whose y axis value is its number of nodes (reviews) in the largest pseudo-clique identified, and whose x axis value is itsnumber of nodes. (b) For each fraudulent app, the density of its largest pseudo-clique vs. its number of nodes. (c) Foreach malware app, the size of its largest pseudo-clique vs. its number of nodes. (d) For each malware app, the density ofits largest pseudo-clique vs. its number of nodes. Fraudulent apps tend to have more reviews. While some malware appshave relatively large (but loosely connected) pseudo-cliques, their size and density is significantly smaller than those offraudulent apps.
In addition, as expected, features such as the percentageof nodes involved in a pseudo-clique (inCliqueCount), thenumber of days with spikes (spikeCount) and the max-imum density of an identified pseudo-clique (ρmax) aremore relevant to differentiate fraudulent from benign apps.The number of pseudo-cliques with density larger than 3(nCliques) the ratio of installs to reviews (I1/Rv1) and thenumber of dangerous permissions (dangerCount) are moreeffective to differentiate malware from benign apps.
More surprising are the features that do not appear inthe top, for either classifier. Most notably, the Jekyll-Hydefeatures that measure the ramps in the number of dangerouspermissions. One explanation is that the 212 malware appsin our gold standard dataset do not have sufficient danger-ous permission ramps. Also, we note that our conjecturethat fraudster efforts to alter the search rank of an app willnot be able to preserve a natural balance of the features thatimpact it (see IRR module) is only partially validated: solelythe I1/Rv1 feature plays a part in differentiating malwarefrom benign apps.
Furthermore, we have zoomed in into the distributionsof the sizes and densities of the largest pseudo-cliques, forthe gold standard fraudulent and malware apps. Figure 17shows scatterplots over the gold standard fraudulent andmalware apps, of the sizes and densities of their largestpseudo-cliques, as detected by FairPlay. Figure 17a showsthat fraudulent apps tend to have very large pseudo-cliqueand Figure 17c shows that malware apps have significantlysmaller pseudo-cliques. We observe however that malwareapps have fewer reviews, and some malware apps havepseudo-cliques that contain almost all their nodes. Since themaximum, median and standard deviation of the pseudo-clique sizes are computed over values normalized by theapp’s number of reviews, they are impactful in differentiat-ing malware from benign apps.
Figure 17b shows that the largest pseudo-cliques of thelarger fraudulent apps tend to have smaller densities. Fig-ure 17d shows a similar but worse trend for malware apps,where with a few exceptions, the largest pseudo-cliques ofthe malware apps have very small densities. This explainswhy ρmax, the maximum density of an identified cliqueplays a less important part when identifying fraudulentapps, but it is not a top 8 feature when identifying malwareapps.
5.4 FairPlay on the Field
We have also evaluated FairPlay on other, non “gold stan-dard” apps. For this, we have first selected 8 app categories:Arcade, Entertainment, Photography, Simulation, Racing,Sports, Lifestyle, Casual. We have then selected the 6, 300apps from the longitudinal dataset of the 87K apps, thatbelong to one of these 8 categories, and that have more than10 reviews. From these 6, 300 apps, we randomly selected200 apps per category, for a total of 1, 600 apps. We havethen collected the data of all their 50, 643 reviewers (notunique) including the ids of all the 166, 407 apps theyreviewed.
We trained FairPlay with Random Forest (best perform-ing on previous experiments) on all the gold standardbenign and fraudulent apps. We have then run FairPlay onthe 1, 600 apps, and identified 372 apps (23%) as fraudulent.The Racing and Arcade categories have the highest frauddensities: 34% and 36% of their apps were flagged asfraudulent.Intuition. We now focus on some of the top most impactfulFairPlay features to offer an intuition for the surprisinglyhigh fraud percentage (23% of 1, 600 apps). Figure 16bshows that 93.3% of the 372 apps have at least 1 pseudo-clique of θ ≥ 3, nearly 71% have at least 3 pseudo-cliques, and a single app can have up to 23 pseudo-cliques.Figure 16c shows that the pseudo-cliques are large andencompass many of the reviews of the apps: 55% of the372 apps have at least 33% of their reviewers involved in apseudo-clique, while nearly 51% of the apps have a singlepseudo-clique containing 33% of their reviewers.
Figure 18 shows the scatterplots of the number of nodesand densities of the largest clique in each of the 372 apps.While intuitively apps with more reviews tend to havelarger pseudo-cliques (Figure 18a), surprisingly, the densi-ties of such pseudo-cliques are small (Figure 18b).
Figure 19 shows the distribution of the number ofmalware and fraud indicator words (see Step RF.2) in thereviews of the identified 372 fraudulent apps. It shows thataround 75% of the 372 fraudulent apps have at least 20fraud indicator words in their reviews.
5.5 Coercive Review Campaigns
Upon close inspection of apps flagged as fraudulent byFairPlay, we detected apps perpetrating a new attack type:

13
0
100
200
300
400
500
0 500 1000 1500 2000# of nodes
# of
nod
es in
max
cliq
ue
(a)
0
50
100
150
200
250
0 500 1000 1500 2000# of nodes
Den
sity
of m
ax c
lique
(b)
Fig. 18: Scatterplots of the 372 fraudulent apps out of 1, 600 investigated, showing, for each app, (a) the number of nodes(reviews) in the largest clique identified vs. the app’s number of nodes (b) the density of the largest clique vs. the app’snumber of nodes. While apps with more nodes also tend to have larger cliques, those cliques tend to have lower densities.
96
5259 63
28
16 19 20
8 7 30
25
50
75
100
0−20 21−40 41−60 61−80 81−100 101−120 121−140 141−160 161−180 181−200 >200Number of strong signals
Num
ber
of a
pps
Fig. 19: Distribution of the number of malware and fraudindicator words (see Step RF.2) in the reviews of the 372identified fraudulent apps (out of 1, 600 apps). Around 75%of these apps have at least 20 fraud indicator words in theirreviews.
0
20
40
60
0 20 40 60 80Number of coercive reviews
Num
ber
of a
pps
Fig. 20: Distribution of the number of coerced reviewsreceived by the 193 coercive apps we uncovered. 5 appshave each receivedmore than 40 reviews indicative of ratingcoercion, with one app having close to 80 such reviews!
harass the user to either (i) write a positive review for theapp, or (ii) install and write a positive review for otherapps (often of the same developer). We call these behaviorscoercive review campaigns and the resulting reviews, as coercedreviews. Example coerced reviews include, “I only rated itbecause i didn’t want it to pop up while i am playing”, or“Could not even play one level before i had to rate it [...]they actually are telling me to rate the app 5 stars”.
In order to find evidence of systematic coercive reviewcampaigns, we have parsed the 2.9 million reviews of our
dataset to identify those whose text contains one of the rootwords [“make”, “ask”, “force”] and “rate”. Upon manualinspection of the results, we have found 1, 024 coercedreviews. The reviews reveal that apps involved in coercivereview campaigns either have bugs (e.g., they ask the user torate 5 stars even after the user has rated them), or reward theuser by removing ads, providing more features, unlockingthe next game level, boosting the user’s game level orawarding game points.
The 1, 024 coerced reviews were posted for 193 apps.Figure 20 shows the distribution of the number of coercedreviews per app. While most of the 193 apps have receivedless than 20 coerced reviews, 5 apps have each receivedmore than 40 such reviews.
We have observed several duplicates among the coercedreviews. We identify two possible explanations. First, as wepreviously mentioned, some apps do not keep track of theuser having reviewed them, thus repeatedly coerce subse-quent reviews from the same user. A second explanationis that seemingly coerced reviews, can also be posted aspart of a negative search rank fraud campaign. However,both scenarios describe apps likely to have been subjectedto fraudulent behaviors.
6 CONCLUSIONS
We have introduced FairPlay, a system to detect both fraud-ulent and malware Google Play apps. Our experiments ona newly contributed longitudinal app dataset, have shownthat a high percentage of malware is involved in search rankfraud; both are accurately identified by FairPlay. In addition,we showed FairPlay’s ability to discover hundreds of appsthat evade Google Play’s detection technology, including anew type of coercive fraud attack.
7 ACKNOWLEDGMENTS
This research was supported in part by NSF grants 1527153,1526254, and 1450619, and ARO W911NF-13-1-0142.
REFERENCES
[1] Google Play. https://play.google.com/.[2] Ezra Siegel. Fake Reviews in Google Play and Apple App Store.
Appentive, 2014.

14
[3] Zach Miners. Report: Malware-infected Android apps spike in theGoogle Play store. PCWorld, 2014.
[4] Stephanie Mlot. Top Android App a Scam, Pulled From GooglePlay. PCMag, 2014.
[5] Daniel Roberts. How to spot fake apps on the Google Play store.Fortune, 2015.
[6] Andy Greenberg. Malware Apps Spoof Android Market To InfectPhones. Forbes Security, 2014.
[7] Freelancer. http://www.freelancer.com.[8] Fiverr. https://www.fiverr.com/.[9] BestAppPromotion. www.bestreviewapp.com/.[10] Gang Wang, Christo Wilson, Xiaohan Zhao, Yibo Zhu, Manish
Mohanlal, Haitao Zheng, and Ben Y. Zhao. Serf and Turf: Crowd-turfing for Fun and Profit. In Proceedings of ACM WWW. ACM,2012.
[11] Jon Oberheide and Charlie Miller. Dissecting the AndroidBouncer. SummerCon2012, New York, 2012.
[12] VirusTotal - Free Online Virus, Malware and URL Scanner. https://www.virustotal.com/, Last accessed on May 2015.
[13] Iker Burguera, Urko Zurutuza, and Simin Nadjm-Tehrani. Crow-droid: Behavior-Based Malware Detection System for Android. InProceedings of ACM SPSM, pages 15–26. ACM, 2011.
[14] Asaf Shabtai, Uri Kanonov, Yuval Elovici, Chanan Glezer, and YaelWeiss. Andromaly: a Behavioral Malware Detection Frameworkfor Android Devices. Intelligent Information Systems, 38(1):161–190,2012.
[15] Michael Grace, Yajin Zhou, Qiang Zhang, Shihong Zou, and Xux-ian Jiang. Riskranker: Scalable and Accurate Zero-day AndroidMalware Detection. In Proceedings of ACM MobiSys, 2012.
[16] Bhaskar Pratim Sarma, Ninghui Li, Chris Gates, Rahul Potharaju,Cristina Nita-Rotaru, and Ian Molloy. Android Permissions: aPerspective Combining Risks and Benefits. In Proceedings of ACMSACMAT, 2012.
[17] Hao Peng, Chris Gates, Bhaskar Sarma, Ninghui Li, Yuan Qi,Rahul Potharaju, Cristina Nita-Rotaru, and Ian Molloy. UsingProbabilistic Generative Models for Ranking Risks of AndroidApps. In Proceedings of ACM CCS, 2012.
[18] S.Y. Yerima, S. Sezer, and I. Muttik. Android Malware DetectionUsing Parallel Machine Learning Classifiers. In Proceedings ofNGMAST, Sept 2014.
[19] Yajin Zhou and Xuxian Jiang. Dissecting Android Malware:Characterization and Evolution. In Proceedings of the IEEE S&P,pages 95–109. IEEE, 2012.
[20] Fraud Detection in Social Networks. https://users.cs.fiu.edu/∼carbunar/caspr.lab/socialfraud.html.
[21] Google I/O 2013 - Getting Discovered on Google Play. www.youtube.com/watch?v=5Od2SuL2igA, 2013.
[22] Justin Sahs and Latifur Khan. A Machine Learning Approach toAndroid Malware Detection. In Proceedings of EISIC, 2012.
[23] Borja Sanz, Igor Santos, Carlos Laorden, Xabier Ugarte-Pedrero,Pablo Garcia Bringas, and Gonzalo Alvarez. Puma: Permissionusage to detect malware in android. In International Joint ConferenceCISIS12-ICEUTE´ 12-SOCO´ 12 Special Sessions, pages 289–298.Springer, 2013.
[24] Junting Ye and Leman Akoglu. Discovering opinion spammergroups by network footprints. In Machine Learning and KnowledgeDiscovery in Databases, pages 267–282. Springer, 2015.
[25] Leman Akoglu, Rishi Chandy, and Christos Faloutsos. OpinionFraud Detection in Online Reviews by Network Effects. In Pro-ceedings of ICWSM, 2013.
[26] Android Market API. https://code.google.com/p/android-market-api/, 2011.
[27] Etsuji Tomita, Akira Tanaka, and Haruhisa Takahashi. The worst-case time complexity for generating all maximal cliques and com-putational experiments. Theor. Comput. Sci., 363(1):28–42, October2006.
[28] Kazuhisa Makino and Takeaki Uno. New algorithms for enumer-ating all maximal cliques. 3111:260–272, 2004.
[29] Takeaki Uno. An efficient algorithm for enumerating pseudocliques. In Proceedings of ISAAC, 2007.
[30] Steven Bird, Ewan Klein, and Edward Loper. Natural LanguageProcessing with Python. O’Reilly, 2009.
[31] Bo Pang, Lillian Lee, and Shivakumar Vaithyanathan. ThumbsUp? Sentiment Classification Using Machine Learning Techniques.In Proceedings of EMNLP, 2002.
[32] John H. McDonald. Handbook of Biological Statistics. Sparky HousePublishing, second edition, 2009.
[33] New Google Play Store greatly simplifies per-missions. http://www.androidcentral.com/new-google-play-store-4820-greatly-simplifies-permissions,2014.
[34] Weka. http://www.cs.waikato.ac.nz/ml/weka/.[35] S. I. Gallant. Perceptron-based learning algorithms. Trans. Neur.
Netw., 1(2):179–191, June 1990.[36] Leo Breiman. Random Forests. Machine Learning, 45:5–32, 2001.[37] Ron Kohavi. A Study of Cross-Validation and Bootstrap for
Accuracy Estimation and Model Selection. In Proceedings of IJCAI,1995.
[38] D. H. Chau, C. Nachenberg, J. Wilhelm, A. Wright, and C. Falout-sos. Polonium: Tera-scale graph mining and inference for malwaredetection. In Proceedings of the SIAM SDM, 2011.
[39] Acar Tamersoy, Kevin Roundy, and Duen Horng Chau. Guilt byassociation: Large scale malware detection by mining file-relationgraphs. In Proceedings of the 20th ACM SIGKDD InternationalConference on Knowledge Discovery and Data Mining, KDD ’14, pages1524–1533, New York, NY, USA, 2014. ACM.
Mahmudur Rahman received his Ph.D. in Computer Science fromFlorida International University. He is now a security architect in theWatson Security team at IBM. His current work focuses on the designof business-driven cognitive solutions that meet security requirementsrelated to function, protection, assurance, risk management and com-pliance. His research interests include security and privacy with appli-cations in online and geosocial networks, wireless networks, distributedcomputing systems, and mobile applications.
Mizanur Rahman is a Ph.D. candidate at Florida International Univer-sity. He has previously held various positions in KAZ Software, iAp-pDragon and Prolog Inc. His research interest include internet dataprivacy, fraud detection in social network and user experience analysis.
Bogdan Carbunar is an assistant professor in SCIS at FIU. Previously,he held various researcher positions within the Applied Research Centerat Motorola. His research interests include distributed systems, securityand applied cryptography. He holds a Ph.D. in Computer Science fromPurdue University.
Duen Horng (Polo) Chau is an Assistant Professor at Georgia TechsSchool of Computational Science and Engineering, and an AssociateDirector of the MS Analytics program. Polo holds a Ph.D. in MachineLearning and a Masters in human-computer interaction (HCI). His PhDthesis won Carnegie Mellons Computer Science Dissertation Award,Honorable Mention. Polo received faculty awards from Google, Yahoo,and LexisNexis. He also received the Raytheon Faculty Fellowship,Edenfield Faculty Fellowship, Outstanding Junior Faculty Award. Heis the only two-time Symantec fellow and an award-winning designer.Polos research group created novel detection technologies for malware(patented with Symantec, protects 120M+ people), auction fraud (WSJ,CNN, MSN), comment spam (patented & deployed with Yahoo), fakereviews (SDM14 Best Student Paper), insider trading, and unauthorizedmobile device access (Wired, Engadget).
Related Documents


