arXiv:0805.3298v1 [astro-ph] 21 May 2008 Draft version February 18, 2013 Preprint typeset using L A T E X style emulateapj v. 08/22/09 SEARCH FOR BLUE COMPACT DWARF GALAXIES DURING QUIESCENCE J. S´ anchez Almeida 1 , C. Mu˜ noz-Tu˜ n´ on 1 , R. Amor´ ın 1 , J. A. Aguerri 1 , R. S´ anchez-Janssen 1 , and G. Tenorio-Tagle 2 Draft version February 18, 2013 ABSTRACT Blue Compact Dwarf (BCD) galaxies are metal poor systems going through a major starburst that cannot last for long. We have identified galaxies which may be BCDs during quiescence (QBCD), i.e., before the characteristic starburst sets in or when it has faded away. These QBCD galaxies are assumed to be like the BCD host galaxies. The SDSS/DR6 database provides ∼21500 QBCD candidates. We also select from SDSS/DR6 a complete sample of BCD galaxies to serve as reference. The properties of these two galaxy sets have been computed and compared. The QBCD candidates are thirty times more abundant than the BCDs, with their luminosity functions being very similar except for the scaling factor, and the expected luminosity dimming associated with the end of the starburst. QBCDs are redder than BCDs, and they have larger H ii region based oxygen abundance. QBCDs also have lower surface brightness. The BCD candidates turn out to be the QBCD candidates with the largest specific star formation rate (actually, with the largest H α equivalent width). One out of each three dwarf galaxies in the local universe may be a QBCD. The properties of the selected BCDs and QBCDs are consistent with a single sequence in galactic evolution, with the quiescent phase lasting thirty times longer than the starburst phase. The resulting time-averaged star formation rate is low enough to allow this cadence of BCD – QBCD phases during the Hubble time. Subject headings: Galaxies: starburst – Galaxies: evolution – Galaxies: dwarf – Galaxies: luminosity function – Galaxies: abundances 1. INTRODUCTION Blue Compact Dwarf (BCD) galaxies 3 are metal poor systems undergoing vigorous star formation (e.g., Thuan 1991; Gil de Paz et al. 2003). With record-breaking low metallicities among galaxies (e.g., Kunth & ¨ Ostlin 2000), their observed colors and spectra indicate essentially newborn starbursts, with mean ages of a few My (e.g., Mas-Hesse & Kunth 1999; Thuan 1991). This combi- nation of factors (chemically unevolved systems, with oversized starbursts that cannot last for long) lead to conjecturing that they are pristine galaxies undergoing star formation for the very first time (Sargent & Searle 1970). This original view has now been reformulated so that BCD galaxies are chemically primitive objects which we come across during short intense bursts. The starburst phases are interleaved by long periods of quies- cence (Searle et al. 1973). The change is based on several observational evidences. Most BCDs galaxies are known to have a red low surface brightness component (e.g., Caon et al. 2005, and references therein), which should exist before the starburst, and which should survive the BCD phase. We are also allowed to resolve some indi- vidual stars in the nearest BCD galaxies, and the pres- ence of RGB stars indicates an underlying stellar popu- lation much older than the lifetime of a starburst (e.g., Aloisi et al. 2007; Corbin et al. 2007). Even if they are not pristine, BCDs are galaxies with Electronic address: [email protected], [email protected], [email protected], [email protected], [email protected], [email protected] 1 Instituto de Astrof´ ısica de Canarias, E-38205 La Laguna, Tenerife, Spain 2 Instituto Nacional de Astrof´ ısica ´ Optica y Electr´ onica, AP 51, 72000 Puebla, Mexico 3 Also referred to as H ii galaxies or blue amorphous galaxies; see, e.g., Kunth & ¨ Ostlin (2000), § 4.4. the lowest metallicities and may therefore be showing first stages in star formation from primordial gas. It is not yet clear which objects eventually change to glow as BCD galaxies (i.e., which galaxies are BCDs dur- ing quiescence). Identifying them seems to be a nec- essary first step to answer the question of why a galaxy experiences a BCD phase. What is the nature of the host galaxy in which a BCD starburst takes place? Is it a normal dwarf galaxy? What is triggering the starburst? What is left after the starburst? Evolu- tionary connections between dwarf elliptical galaxies, dwarf irregular galaxies, low surface brightness galax- ies, and BCDs have been both proposed and criticized in the literature (e.g., Searle & Sargent 1972; Silk et al. 1987; Davies & Phillipps 1988; Papaderos et al. 1996a; Telles & Terlevich 1997; Gil de Paz & Madore 2005). Here we take a new approach to investigate the linage of the BCDs. Rather than directly comparing the prop- erties of the BCDs (or their host galaxies) with proper- ties of known galaxy types, we attempt a blind search for galaxies that look like precursors or left-overs of the BCD phase, paying minor attention to the galaxy class. We have tried to find field galaxies with the properties of the BCD host, but without the BCD starburst. Isolated galaxies are preferred to minimize the role of mergers and harassment on the galactic properties and evolution. These galaxies will be denoted in the paper as Quies- cent BCD galaxies or QBCD. If there are enough such galaxies, the BCD may be just a particularly conspicu- ous phase in the life of otherwise mean dwarf galaxies. If there are no such galaxies, we should conclude that the BCD phase ends up with the host, which is physically unlikely. Aiming at shedding light on the BCD evolu- tion, we have tried to answer two specific questions: (1) are there galaxies like the BCD hosts without the con-

Welcome message from author
This document is posted to help you gain knowledge. Please leave a comment to let me know what you think about it! Share it to your friends and learn new things together.
Transcript

arX
iv:0
805.
3298
v1 [
astr
o-ph
] 2
1 M
ay 2
008
Draft version February 18, 2013Preprint typeset using LATEX style emulateapj v. 08/22/09
SEARCH FOR BLUE COMPACT DWARF GALAXIES DURING QUIESCENCE
J. Sanchez Almeida1, C. Munoz-Tunon1, R. Amorın1, J. A. Aguerri1,R. Sanchez-Janssen1, and G. Tenorio-Tagle2
Draft version February 18, 2013
ABSTRACT
Blue Compact Dwarf (BCD) galaxies are metal poor systems going through a major starburst thatcannot last for long. We have identified galaxies which may be BCDs during quiescence (QBCD),i.e., before the characteristic starburst sets in or when it has faded away. These QBCD galaxiesare assumed to be like the BCD host galaxies. The SDSS/DR6 database provides ∼21500 QBCDcandidates. We also select from SDSS/DR6 a complete sample of BCD galaxies to serve as reference.The properties of these two galaxy sets have been computed and compared. The QBCD candidatesare thirty times more abundant than the BCDs, with their luminosity functions being very similarexcept for the scaling factor, and the expected luminosity dimming associated with the end of thestarburst. QBCDs are redder than BCDs, and they have larger H ii region based oxygen abundance.QBCDs also have lower surface brightness. The BCD candidates turn out to be the QBCD candidateswith the largest specific star formation rate (actually, with the largest Hα equivalent width). Oneout of each three dwarf galaxies in the local universe may be a QBCD. The properties of the selectedBCDs and QBCDs are consistent with a single sequence in galactic evolution, with the quiescent phaselasting thirty times longer than the starburst phase. The resulting time-averaged star formation rateis low enough to allow this cadence of BCD – QBCD phases during the Hubble time.Subject headings: Galaxies: starburst – Galaxies: evolution – Galaxies: dwarf – Galaxies: luminosity
function – Galaxies: abundances
1. INTRODUCTION
Blue Compact Dwarf (BCD) galaxies3 are metal poorsystems undergoing vigorous star formation (e.g., Thuan1991; Gil de Paz et al. 2003). With record-breaking low
metallicities among galaxies (e.g., Kunth & Ostlin 2000),their observed colors and spectra indicate essentiallynewborn starbursts, with mean ages of a few My (e.g.,Mas-Hesse & Kunth 1999; Thuan 1991). This combi-nation of factors (chemically unevolved systems, withoversized starbursts that cannot last for long) lead toconjecturing that they are pristine galaxies undergoingstar formation for the very first time (Sargent & Searle1970). This original view has now been reformulatedso that BCD galaxies are chemically primitive objectswhich we come across during short intense bursts. Thestarburst phases are interleaved by long periods of quies-cence (Searle et al. 1973). The change is based on severalobservational evidences. Most BCDs galaxies are knownto have a red low surface brightness component (e.g.,Caon et al. 2005, and references therein), which shouldexist before the starburst, and which should survive theBCD phase. We are also allowed to resolve some indi-vidual stars in the nearest BCD galaxies, and the pres-ence of RGB stars indicates an underlying stellar popu-lation much older than the lifetime of a starburst (e.g.,Aloisi et al. 2007; Corbin et al. 2007).
Even if they are not pristine, BCDs are galaxies with
Electronic address: [email protected], [email protected], [email protected], [email protected], [email protected], [email protected] Instituto de Astrofısica de Canarias, E-38205 La Laguna,
Tenerife, Spain2 Instituto Nacional de Astrofısica Optica y Electronica, AP 51,
72000 Puebla, Mexico3 Also referred to as H ii galaxies or blue amorphous galaxies;
see, e.g., Kunth & Ostlin (2000), § 4.4.
the lowest metallicities and may therefore be showingfirst stages in star formation from primordial gas. It isnot yet clear which objects eventually change to glowas BCD galaxies (i.e., which galaxies are BCDs dur-ing quiescence). Identifying them seems to be a nec-essary first step to answer the question of why a galaxyexperiences a BCD phase. What is the nature of thehost galaxy in which a BCD starburst takes place?Is it a normal dwarf galaxy? What is triggering thestarburst? What is left after the starburst? Evolu-tionary connections between dwarf elliptical galaxies,dwarf irregular galaxies, low surface brightness galax-ies, and BCDs have been both proposed and criticizedin the literature (e.g., Searle & Sargent 1972; Silk et al.1987; Davies & Phillipps 1988; Papaderos et al. 1996a;Telles & Terlevich 1997; Gil de Paz & Madore 2005).Here we take a new approach to investigate the linageof the BCDs. Rather than directly comparing the prop-erties of the BCDs (or their host galaxies) with proper-ties of known galaxy types, we attempt a blind searchfor galaxies that look like precursors or left-overs of theBCD phase, paying minor attention to the galaxy class.We have tried to find field galaxies with the properties ofthe BCD host, but without the BCD starburst. Isolatedgalaxies are preferred to minimize the role of mergersand harassment on the galactic properties and evolution.These galaxies will be denoted in the paper as Quies-cent BCD galaxies or QBCD. If there are enough suchgalaxies, the BCD may be just a particularly conspicu-ous phase in the life of otherwise mean dwarf galaxies. Ifthere are no such galaxies, we should conclude that theBCD phase ends up with the host, which is physicallyunlikely. Aiming at shedding light on the BCD evolu-tion, we have tried to answer two specific questions: (1)are there galaxies like the BCD hosts without the con-
2 Sanchez Almeida et al.
spicuous starburst observed in BCDs? (2) If the answerwere yes (as it turns out to be), what are the physicalproperties of these (putative) BCD galaxies during qui-escence?
The different sections of this paper describe individ-ual steps carried out to answer the two questions posedabove. The search for QBCD galaxies like the BCDhost galaxies is described in § 2.1. Luminosities, sur-face brightnesses, and colors characteristic of BCD hostgalaxies are taken from Amorın et al. (2007, 2008). Wesearch the SDSS/DR6 database for candidates, which isideal for the kind of exploratory statistical study we aimat. The sample of QBCD galaxies has to be interpretedin terms of a sample of BCD galaxies. In order to min-imize systematic errors, the control sample of BCDs isalso derived from SDSS/DR6 using the same techniquesemployed for QBCD selection (§ 2.2). We compare theLuminosity Functions (LFs) of the two samples in § 3,which requires computing how the BCD galaxy luminos-ity changes to become a QBCD galaxy when the star-burst fades away (§3.1). Since the SDSS catalog is mag-nitude limited, the properties that we derive are biasedtowards the brightest galaxies (Malmquist bias). Thiseffect is corrected to derive the intrinsic properties ofthe two sets (§ 4). The implications of our findings arediscussed in § 5 and § 6. We have developed our ownsoftware to compute LFs. For the sake of clarity andfuture reference, details are given in App. A. A Hubbleconstant H0 = 70 km s−1 Mpc−1 is used throughout thepaper.
2. DATA SETS
The search has been carried out using the SloanDigital Sky Survey (SDSS) dataset, which isboth convenient and powerful. We use the latestdata release, DR6, whose spectroscopic view cov-ers 7425 deg2 and contains ∼ 7.9 × 10⁵ galaxies(Adelman-McCarthy & the SDSS collaboration 2007).The main characteristics of the SDSS are described inthe extensive paper by Stoughton et al. (2002), but theyare also gathered in the comprehensive searchable SDSSwebsite4. We access the database through the so-calledCasJob entry, which allows direct and flexible SQLsearches, such as those needed to select only isolatedgalaxies. Absolute magnitudes are computed fromrelative magnitudes and redshifts. All magnitudes havebeen corrected for galactic extinction (Schlegel et al.1998). No K−correction has been applied since weare dealing with nearby galaxies with redshifts < 0.05,and so, with Hubble flow induced bandshifts muchsmaller than the relative bandwidth of the color filters(Fukugita et al. 1996). In a consistency test using SDSSspectra representative of QBCDs and BCDs, we haveestimated that the K−corrections are smaller than 0.01magnitudes (QBCDs) and 0.1 magnitudes (BCDs).
2.1. Selection of galaxies like the hosts of BCDs
The properties of the QBCD galaxies have beentaken from the sample of 28 BCD galaxies inCairos et al. (2001), whose hosts have been character-ized by Amorın et al. (2007, 2008). They represent a
4 http://www.sdss.org/dr6
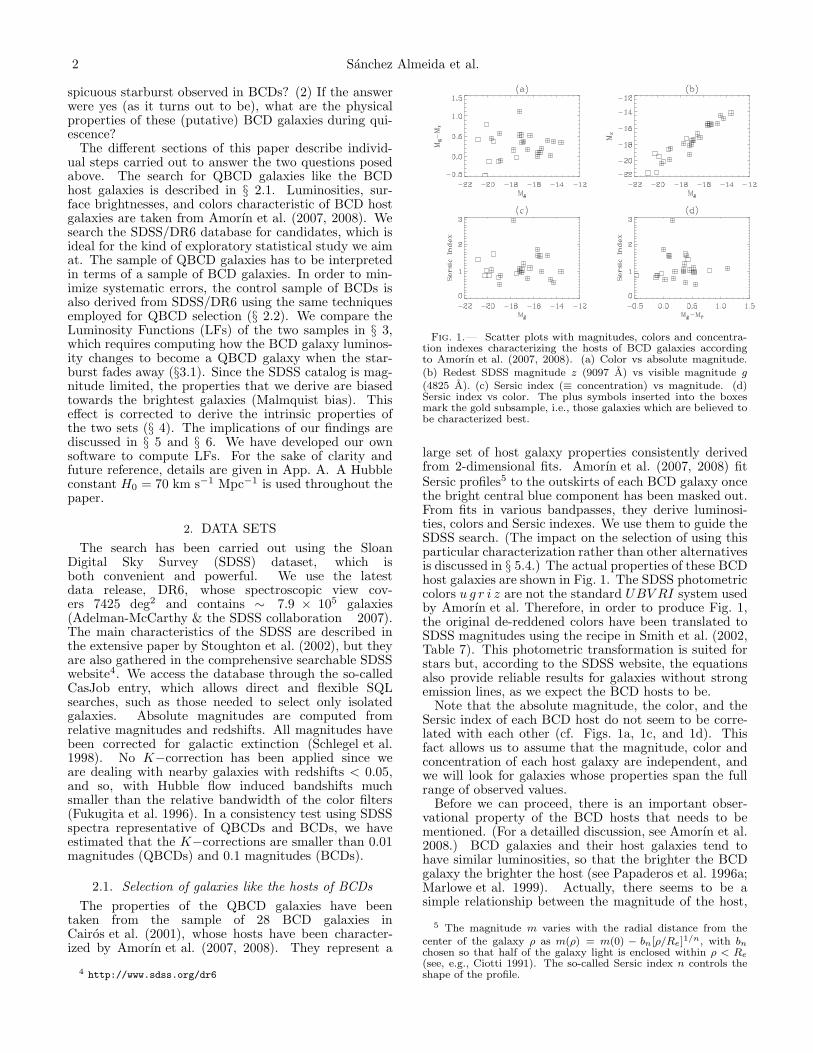
Fig. 1.— Scatter plots with magnitudes, colors and concentra-tion indexes characterizing the hosts of BCD galaxies accordingto Amorın et al. (2007, 2008). (a) Color vs absolute magnitude.(b) Redest SDSS magnitude z (9097 A) vs visible magnitude g(4825 A). (c) Sersic index (≡ concentration) vs magnitude. (d)Sersic index vs color. The plus symbols inserted into the boxesmark the gold subsample, i.e., those galaxies which are believed tobe characterized best.
large set of host galaxy properties consistently derivedfrom 2-dimensional fits. Amorın et al. (2007, 2008) fitSersic profiles5 to the outskirts of each BCD galaxy oncethe bright central blue component has been masked out.From fits in various bandpasses, they derive luminosi-ties, colors and Sersic indexes. We use them to guide theSDSS search. (The impact on the selection of using thisparticular characterization rather than other alternativesis discussed in § 5.4.) The actual properties of these BCDhost galaxies are shown in Fig. 1. The SDSS photometriccolors u g r i z are not the standard UBV RI system usedby Amorın et al. Therefore, in order to produce Fig. 1,the original de-reddened colors have been translated toSDSS magnitudes using the recipe in Smith et al. (2002,Table 7). This photometric transformation is suited forstars but, according to the SDSS website, the equationsalso provide reliable results for galaxies without strongemission lines, as we expect the BCD hosts to be.
Note that the absolute magnitude, the color, and theSersic index of each BCD host do not seem to be corre-lated with each other (cf. Figs. 1a, 1c, and 1d). Thisfact allows us to assume that the magnitude, color andconcentration of each host galaxy are independent, andwe will look for galaxies whose properties span the fullrange of observed values.
Before we can proceed, there is an important obser-vational property of the BCD hosts that needs to bementioned. (For a detailled discussion, see Amorın et al.2008.) BCD galaxies and their host galaxies tend tohave similar luminosities, so that the brighter the BCDgalaxy the brighter the host (see Papaderos et al. 1996a;Marlowe et al. 1999). Actually, there seems to be asimple relationship between the magnitude of the host,
5 The magnitude m varies with the radial distance from thecenter of the galaxy ρ as m(ρ) = m(0) − bn[ρ/Re]1/n, with bnchosen so that half of the galaxy light is enclosed within ρ < Re(see, e.g., Ciotti 1991). The so-called Sersic index n controls theshape of the profile.

BCD galaxies during quiescence 3
Fig. 2.— Absolute magnitude of the low surface brightness hostof the BCD vs magnitude of the BCD, including the host. Eachsymbol corresponds to a Johnson’s bandpass as labeled in the inset.There is a tight correlation between the magnitude of the BCD andthe magnitude of the host galaxy. A linear least squares fit basedon B magnitudes yields a slope of 0.991 ± 0.054, and an offset of0.61 ± 0.11 (the dashed line). Within error bars, the results areidentical when using the full data set for fitting (the dotted line),indicating a relationship independent of the color. The gold setdefined by Amorın et al. (2008) also yields the same result (notshown).
TABLE 1Criteria used to select BCD host-like galaxies (i.e.,
QBCDs) from the SDSS/RD6 database.
# Criterion Implementation
(1) Colors −0.5 ≤ Mg − Mr ≤ 1.1 mag(2) Concentration indexes 1.8 < R90/R50 < 3.1(3) Magnitudes −18.5 < Mg < −13.5 mag(4) Be isolated no bright galaxy within 10 R50
a
(5) Get rid of proper motion redshift > 0.003induced redshifts
a Bright means brighter than 3 magnitudes fainter than the selectedgalaxy.
Mhost, and the magnitude of the BCD galaxy, MBCD,
Mhost ≃ 0.5 + MBCD. (1)
Figure 2 presents the scatter plot between the ob-served magnitude of the BCDs analyzed by Amorın et al.(2008), and the magnitude of their host galaxy. Thereis a linear relationship between the two observed mag-nitudes as parameterized by equation (1) – the slope isvery close to one, and the scatter remains rather small(less than 0.5 mag). The relationship is independent ofthe color and, therefore, it will remain like equation (1)for the SDSS photometric system.
Table 1 lists the actual constraints employed in ourSDSS/DR6 search for QBCD galaxies like the BCD hostgalaxies. The range of colors,
− 0.5 ≤ Mg − Mr ≤ 1.1, (2)
has been taken directly from Fig. 1a. The range of ab-solute magnitudes,
− 18.5 ≤ Mg ≤ −13.5, (3)
requires a more elaborated explanation. The upperbound corresponds to the magnitude of the faintest BCDhost (Fig. 1a). The lower limit, however, is inheritedfrom the lower limit of the BCD galaxies selected in § 2.2.This is a control set used for reference and, according toarguments to be given in § 2.2, SDSS BCD galaxy can-didates are chosen to be fainter than Mg ≃ −19. There-fore, for consistency with equation (1), we impose thelower limit given in equation (3). There is an additionaldetail concerning the magnitudes in use. Amorın et al.(2007, 2008) integrate the Sersic profile to infinity to es-timate magnitudes, whereas the SDSS catalog providesPetrosian magnitudes, where the galactic light is inte-grated only up to a certain distance from the galacticcenter (see Stoughton et al. 2002). Graham et al. (2005)show how the difference between the Petrosian magni-tude and the total magnitude differs by less than 0.2 mag-nitudes for Sersic indexes n < 4. The hosts have Sersicindexes smaller than this limit (Fig. 1c) and, therefore,we neglect the difference.
The brightness profile of the BCD host is parameter-ized in Amorın et al. (2007, 2008) by means of the Sersicindex n. According to Fig. 1c,
0.5 < n < 2.9. (4)
This constraint is translated into a limit on the so-calledconcentration index R90/R50, which can be readily ob-tained from the SDSS catalog since it provides the radiicontaining 50% of Petrosian flux, R50, and 90% of thePetrosian flux, R90. According to Graham et al. (2005,Table 1), the limits given in equation (4) imply,
1.8 < R90/R50 < 3.1, (5)
which is the constraint used in our search (Table 1, 2ndrow). This constraint has been applied both to g and tor magnitudes.
As explained in the introduction, we seek isolatedgalaxies to minimize the effect of mergers and harass-ment on the galaxy properties. The criterion for findingisolated galaxies is inspired by the work of Allam et al.(2005). We stipulate that the selected galaxies have nobright companion within 10 R50. (Note that R50 is ap-proximately the effective radius, i.e., the radius contain-ing half of the galaxy luminous flux.) Companions areneglected if they are at least three magnitudes fainterthan the candidate. These two constraints are set in thecolor filter g (see Table 1, 4th row).
Since absolute magnitudes are computed from red-shifts, we ask the redshifts to be large enough to minimizethe proper-motion induced Doppler shifts. The thresh-old redshift corresponds to a distance of 13 Mpc and avelocity of 900 km s−1 (see Table 1, 5th row).
Applying the criteria in Table 1 to the SDSS/DR6, oneretrieves 21493 galaxies. Their mean redshift is 0.030,with a standard deviation of 0.014. The galaxies are illus-trated in Fig. 3, top row, where we include color images offour randomly chosen QBCD candidates. Figure 4 showsvarious histograms corresponding to the observed proper-ties of this set of galaxies (the solid lines). Means, stan-dard deviations and modes corresponding to these his-tograms are listed in Table 2. The determination of theconcentration indexes of small galaxies may be problem-atical. They are based on determining galaxy sizes and,

4 Sanchez Almeida et al.
Fig. 3.— Set of randomly chosen images of QBCD candidates (top) and BCD candidates (bottom). We are using the color look-uptable of SDSS. Each galaxy includes a horizontal scale corresponding to 5′′. The crosses centered in the galaxies point out north, south,east and west directions.
therefore, they are affected by seeing (see Blanton et al.2003a). We select a subset among the QBCD candidatesto test whether the main properties of the candidates de-pend on the spatial resolution. To be on the safe side,we consider candidates having R50 > 4′′, i.e., larger thanthe typical SDSS seeing (. 1.5′′). The correspondinghistograms are also shown in Fig. 4 (the dashed lines),with the means, standard deviations and modes includedin Table 2. Except for the surface brightness, there areno systematic differences between the full set and thesubset of large QBCD galaxies. Moreover, the decreaseof surface brightness for large galaxies has nothing todo with poor seeing. It is a bias imposed by our lowerlimit in absolute magnitude (Table 1, 3rd row). Unlessthe large galaxies are also low surface brightness, theyare much too bright to satisfy our selection criterion. Inshort, poor seeing does not seem to bias our selection inany obvious way.
2.2. Selection of BCD galaxies
The galaxies in § 2.1 are selected to be quiescent BCDs.It is clear that this conjecture and the galaxy propertiesmust be examined in terms of the properties of the BCDgalaxies. This is particularly true to answer the first ba-sic question of whether the number density of QBCD can-didates suffices to account for the existing BCDs. Num-ber densities are best characterized as LFs but, to thebest of our knowledge, there is no BCD LF in the litera-ture. Moreover, even if such a LF existed, it would havebeen produced with a number of (unknown) biases dif-ferent from those involved in our SDSS selection. There-fore, we found it necessary to extract from SDSS a setof BCD galaxies, that is to say, to construct a referenceBCD sample with the biases and problems of the QBCDgalaxies we want to compare to. This section describessuch selection of BCD candidates.
The general criteria have been taken form Malmberg
(2005), but they are implemented according toGil de Paz et al. (2003). A BCD galaxy should havethe following properties, (1) be blue enough, which con-strains the colors, (2) be compact, which limits the sur-face brightness, (3) be dwarf, which sets a lower limitto the magnitude, (4) have a large star formation rate(SFR), which implies having enough H ii regions and,therefore, enough Hα emission, (5) be metal poor, and(6) not to be confused with AGNs. These general criteriahave been specified as detailled in Table 3. The numer-ical values corresponding to constraints (1), (2) and (3)have been taken from Gil de Paz et al. (2003), who pointout three photometric criteria for a galaxy to be a BCD,
〈µB〉 − 〈µR〉 ≤ 1 mag arcsec−2,
〈µB〉 < 22 mag arcsec−2, (6)
MK > −21mag.
Using the transformation between Johnson’s and SDSSphotometric systems in Smith et al. (2002), plus equa-tion (1) in Gil de Paz et al. (2003), these three condi-tions become the constraints (1), (2) and (3) in Table 3.The mean surface brightness 〈µ〉 has been computed asthe magnitude of the average luminosity within R50, i.e.,〈µ〉 = 2.5 log(2π) + m + 5 log R50, with m the appar-ent magnitude (see, e.g., Blanton et al. 2001, § 2.3). Thetransformation between photometric systems is suited forstars, rather than for galaxies with emission lines like theBCDs. However, the approximation suffices because theactual limits in equation (6) are estimative, and the effectof including lines modifies the BCD magnitudes by 0.1mag or less. This effect has been estimated using SDSSspectra representative of BCD galaxies.
The actual implementation of criteria (4) and (5) aremere educated guesses that try not to be too restrictive.For example, we consider metallicities smaller than 1/3

BCD galaxies during quiescence 5
Fig. 4.— Histograms of the observed magnitudes and colors corresponding to our selection of QBCD galaxies (the solid lines), and BCDcandidates (the dotted lines). We also consider a sub-set of QBCD galaxies with large apparent size (R50 > 4′′). Their properties areshown using dashed lines. The labels in the ordinate axes specify the parameter that is represented – from top to bottom and left to right,absolute z magnitude Mz , absolute g magnitude Mg, surface brightness color 〈µg〉 − 〈µr〉, surface brightness 〈µg〉, oxygen-to-hydrogenabundance in the usual scale 12 + log(O/H), and Hα equivalent width. The histogram of metallicities also includes the solar value for
reference (12 + log[O/H]⊙ ≃ 8.91; Kunth & Ostlin 2000).
TABLE 2Statistical properties of various galaxy sets.
Galaxy Mz Mg 〈µg〉 − 〈µr〉 〈µg〉 12+log(O/H) Hα EWa
Set [mag arcsec−2] [mag arcsec−2] [A]
avb±stdc mdd av±std md av±std md av±std md av±std md av±std md
Observed QBCD -18.5±1.1 -18.8 -17.6±0.8 -18.3 0.50±0.24 0.46 21.8±0.88 22.0 8.61±0.30 8.60 28.1±49.2 1.9Large QBCD -18.0±1.3 -18.6 -17.3±1.0 -18.1 0.47±0.16 0.46 22.7±0.67 22.9 8.61±0.26 8.60 19.9±35.5 9.9
Observed BCD -17.9±1.1 -18.3 -17.5±1.1 -19.0 0.04±0.23 0.15 20.8±0.54 21.0 8.24±0.16 8.35 172.±174. 58.Restored QBCD -16.2±1.6 -14.9 -15.5±1.4 -14.2 0.37±0.23 0.38 22.2±0.95 22.6 8.43±0.31 8.40 33.1±50.4 1.9Restored BCD -16.2±1.5 -16.3 -15.8±1.4 -15.1 0.04±0.22 0.15 21.0±0.59 21.7 8.12±0.20 8.14 121.± 64. 58.
aHα equivalent width
bAverage
cStandard deviation
dMode

6 Sanchez Almeida et al.
TABLE 3Criteria used to select BCD galaxies from the SDSS/DR6 database.
# Criterion Implementation
(1) Be blue enough 〈µg〉 − 〈µr〉 ≤ 0.43 mag arcsec−2
(2) Be compact 〈µg〉 < 21.83 − 0.47(〈µg〉 − 〈µr〉) mag arcsec−2
(3) Be dwarf Mg > −19.12 + 1.72(Mg − Mr) mag(4) Having large SFR Hα Equivalent Width > 50 A(5) Be metal poor 12 + log(O/H) < 8.43 (≡ 1/3 ⊙)(6) Not to be confused with AGNs neglect AGN contamination(7) Be isolated no bright galaxy within 10 R50
a
(8) Get rid of proper motion redshifts > 0.003induced redshift
aBright means brighter than 3 magnitudes fainter than the selected galaxy.
the solar value (Table 3, item 5), when Kunth & Ostlin(2000) bound the BCDs metallicities between 1/10 and1/50. The (oxygen) metallicity of the galaxies (O/H) hasbeen estimated using the so-called N2 method, based onthe equivalent widths of the emission lines [NII]λ6583and Hα,
12 + log(O/H) = 9.12 + 0.73 N2, (7)
with
N2 = log[NII]λ6583
Hα
;
see Shi et al. (2005) and references therein. Note thatthis metallicity characterizes the properties of the H iiregions excited by the starburst, which represents only avery small fraction of the galactic gas (see § 5). Keepingthe appropriate caveats in mind, the N2 method sufficesfor the elementary estimate we are interested in.
Active Galactic Nuclei (AGNs) can be misidentified asstar-forming galaxies since they are high surface bright-ness blue galaxies with emission lines. AGNs introducespurious BCD candidates. In practice, however, this con-tamination is negligible, and we do not decontaminatefor the presence of AGNs (item 6 in Table 3). Our ap-proach can be justified using the criterion to be an AGNby Kauffmann et al. (2003). An emission line galaxy isan AGN if
log[OIII]λ5007
Hβ
> 1.3+0.61/(
log[NII]λ6583
Hα
−0.05)
.
(8)We selected all SDSS BCD candidates chosen accord-ing to Gil de Paz et al. (2003) criteria (items 1, 2 and3 in Table 3), and having the spectral line informa-tion required to apply the test (the lines [OIII]λ5007,[NII]λ6583, Hα, and Hβ). Figure 5 shows the scatterplot of the two indexes involved in equation (8). Pointsabove the solid line are AGNs according to the criterionin equation (8). There are very few AGNs and, what iseven more important, most of them stay to the right ofthe vertical dashed line, i.e.,
N2 = log[NII]λ6583
Hα
> −0.95, (9)
which corresponds to the constraint on the N2 index im-posed when the O/H abundance estimate is based onthe N2 index, and the O/H is constrained as we do (item5 in Table 3). Our BCD candidates are to the left of
Fig. 5.— Diagnostic plot used to identify AGNs contaminatingthe BCD sample. The points above the thick solid line correspondto AGNs candidates. The vertical dashed line separates the low Oabundance region (to the left) and the high O region (to the right).We only use low O candidates, where the AGN contamination isminimum. The two indexes are defined in the main text.
this line and therefore the low O/H abundance constraintautomatically removes most of the AGN contamination,which explains our approach. In order to quantify theresidual contamination, let us mention that only 0.4% ofthe low O/H abundance BCD candidates in Fig. 5 arealso AGN candidates.
We select isolated BCD candidates (criterion 7 in Ta-ble 3) because of consistency with the criteria used tosearch for BCD host galaxy candidates. As in the caseof QBCDs, we stipulate that the galaxies have no brightcompanion within 10 R50, where R50 is the radius in-cluding 50% of the Petrosian flux. The companions arenot bright enough to perturb the galaxy if they are threemagnitudes fainter than the galaxy.
Applying the criteria in Table 3 to the SDSS/DR6, onegets 1609 BCD galaxies. The dotted lines in Fig. 4 repre-sent the distribution of physical properties of this set ofcandidates. Means, standard deviations, and modes arealso included in Table 2. Four randomly chosen BCDcandidates are shown in Fig. 3, bottom. The main red-shift of the BCD candidates is 0.032, with a standarddeviation of 0.019.
After carrying out the selection described above, wefigured out that most of the BCD sample is also part ofthe QBCD sample: 1198 galaxies are shared by the twosets. They represent 74.5% of the BCDs and 5.6% ofthe QBCDs. The typical properties of the sets are verydifferent (Table 2 and Fig. 4), however there is overlap-ping between the two populations. Roughly speaking,the BCD sample represents the fraction QBCD galaxieshaving the largest Hα equivalent width (see Fig. 4, bot-tom right, where the dotted line and the solid line agreefor Hα EW & 100 A). Since the Hα luminosity is a proxyfor star formation (e.g. Kennicutt 1998), the BCD sampleseems to be the QBCDs having the largest specific StarFormation Rate (SFR), i.e., the largest SFR per unit ofluminosity. The overlapping is consistent with the twogalaxy sets being part of a single continuous sequence,the most active QBCD galaxies still being identified asBCD galaxies.

BCD galaxies during quiescence 7
3. LUMINOSITY FUNCTIONS
The LF, Φ(M), is defined as the number of galax-ies with absolute magnitude M per unit volume andunit magnitude. We will use it to quantify the num-ber of QBCD candidates per BCD galaxy existing in thenearby universe. LFs are computed using a maximumlikelyhood procedure similar to the methods describedin the literature (e.g., Efstathiou et al. 1988; Lin et al.1996; Takeuchi et al. 2000; Blanton et al. 2001). We de-veloped and tested our own code for training purposes,and its characteristics and similitude with existing meth-ods are described in App. A. Cubic splines are used toparameterize the LF shape, and the best fit is retrievedmaximizing the likelyhood in equation (A9), a task re-alized with the usual Powell algorithm (e.g. Press et al.1988). Errors bars are assigned by bootstrapping.
When the procedure is applied to the QBCD galaxiesdescribed in § 2.1, one finds the LF represented in Fig. 6a(the solid line). This LF is similar to that obtained withthe 1/Vmax method working on the same data sets (seeApp. A). The formal errors deduced from bootstrappingare very small (the shaded area around the solid line inFig. 6a). We use 50 bootstrap re-samples, but the errorestimate is not very sensitive to this parameter. The LFis mostly sensitive to the apparent magnitude limit ofthe QBCD galaxy set. We are using a single apparentmagnitude limit for the full dataset, and changing thislimit modifies the overall normalization – given a numberof observed galaxies, the deeper the magnitude limit thelower the inferred number density of galaxies. We takefor the limit,
g < 18.3. (10)
This selection is consistent with the magnitudelimit of the main SDSS galaxy sample (r < 17.8,Adelman-McCarthy & the SDSS collaboration 2007),keeping in mind that the QBCD galaxies are somewhatred with g − r ≃ 0.5 (see Table 2 and Fig. 4). However,we obtain the limit in equation (10) from the scatter plotof the QBCD galaxy absolute magnitude vs the redshiftshown in Fig. 6c. By trial and error, we modify the curverepresenting the boundary to be expected if the wholesample were limited with a single apparent magnitude.The best match is shown as the solid line in Fig. 6c and,except for the range of large luminosities, the data set fitsin well the expected behavior. Galaxies whose apparentmagnitudes exceed the threshold in equation (10) are notused to compute the LF – a histogram of the observedapparent magnitudes is shown in Fig. 6b (the solid line).The normalization of the LF depends on the fraction ofsky covered by survey, which we take to be the coverageof the SDSS/DR6 spectroscopic catalog (7425 deg2;Adelman-McCarthy & the SDSS collaboration 2007).
Figure 6a also shows the LF corresponding to the BCDgalaxies selected in § 2.2 (the dashed line). The numberdensity of BCD candidates (n0 BCD ≃ 9.2 10−4 Mpc−3) ismuch smaller than the number density of QBCD galaxies(n0 QBCD ≃ 2.5 10−2 Mpc−3), giving,
n0 QBCD
n0 BCD≃ 27. (11)
In this case the limit magnitude of the sample has beenset to g < 18.5, which we determine with the same pro-cedure used for the QBCD galaxies. The need for a
different apparent magnitude limit can be inferred fromthe histograms in Fig. 6b. Note how the histogram forBCD galaxies (the dashed line) does not drop off for largemagnitudes as abruptly as the histogram for the QBCDgalaxies (the solid line).
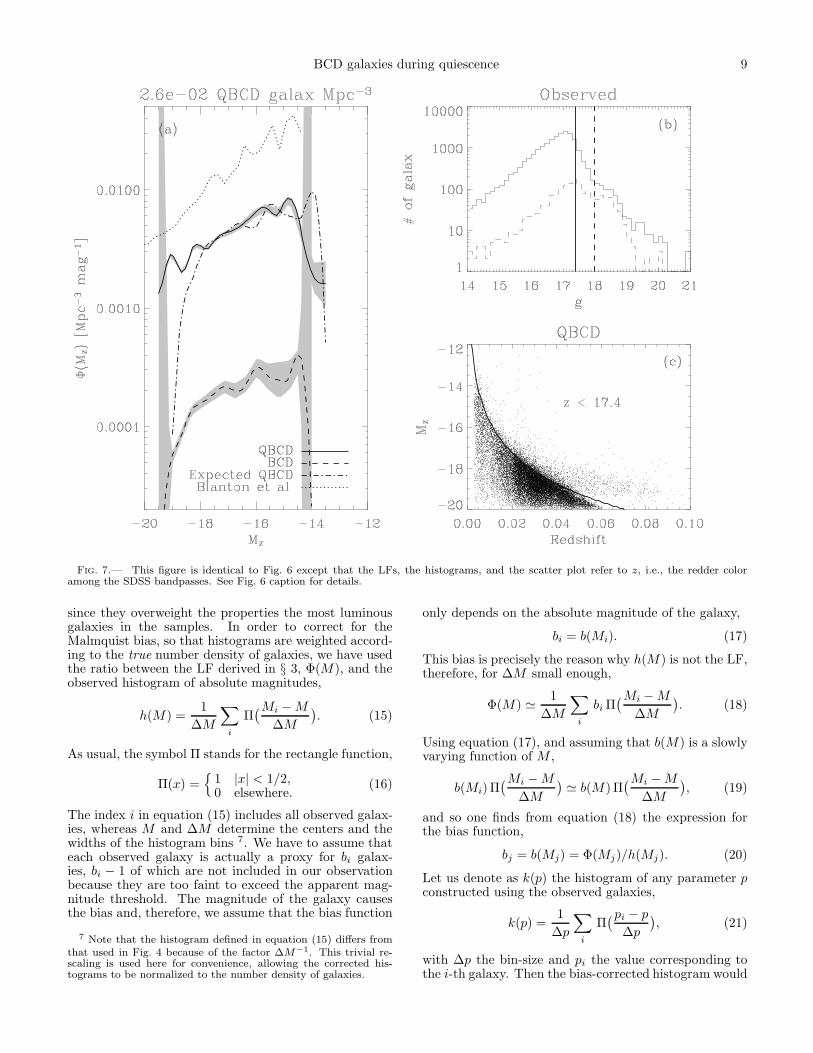
The calculus of LFs has been repeated using z magni-tudes, i.e., the redder SDSS color filter at 9097 A. Thisbandpass is less sensitive to (blue) starbursts, enhancingthe contribution of old stellar populations. The resultsare represented in Fig. 7. They are similar to those ob-tained from g, except that the LFs are shifted by onemagnitude. The ratio between the number of QBCDgalaxies and BCD galaxies remains as in equation (11) –24 in this particular case.
Figures 6a and 7a include the LFs for extremely lowluminosity galaxies worked out by Blanton et al. (2005)(the dotted lines). We used them as a reference, sincethey include all low redshift galaxies in the SDSS spec-troscopic catalog and, therefore, they provide LFs for thelocal universe affected by the same kind of bias as ourgalaxy selection. Using these LFs as reference, we findthe QBCD galaxies to be rather numerous. One out ofeach three dwarf galaxies is a QBCD candidates (cf. thesolid lines and the dotted lines in Figs. 6a and 7a). Sim-ilarly, one out of each ninety dwarf galaxies is a BCDcandidate6 (cf. the dashed lines and the dotted lines inFigs 6a and 7a).
Our LFs are not corrected for the incompleteness ofthe SDSS catalog at low surface brightness. Accordingto the detailled simulation carried out by Blanton et al.(2005, Fig. 3), the incompleteness is not significant forgalaxies with 〈µg〉 < 23.5. Most of our QBCD candi-dates are within this bound (Fig. 4, bottom left), and itdoes not affect the BCD selection at all (Table 3). TheQBCD LF would be affected at its faint end, but evenat Mg ∼ −14 the expected correction is not larger thana factor of two (Blanton et al. 2005, Fig. 6). This un-certainty does not modify the conclusions of the paper,which are mostly qualitative. However, the number ofQBCD galaxies worked out in the paper may be under-estimated by a factor of order one.
3.1. From LF of BCDs to LF of BCD hosts
The question arises as to whether the LFs for QBCDgalaxies and BCD candidates are consistent. They seemto be, according to the following heuristic procedure toestimate the LF for the hosts of the BCDs. Given a LFof BCDs, ΦBCD, one can work out the LF to be expectedonce the starburst dies out, ΦQBCD. By switching thestar formation on and off, BCD galaxies turn into QBCDgalaxies, and vice versa. These two evolutionary phaseshave different timescales; τBCD for the BCD phase, andτQBCD for the QBCD phase. In a stationary state thenumber of galaxies turning from BCD to QBCD must bebalanced by the galaxies going from QBCD to BCD,
ΦQBCD(M)∆M
τQBCD≃ ΦBCD(M ′)
∆M ′
τBCD, (12)
where BCD galaxies with magnitude in the intervalM ′ ± ∆M ′/2 become QBCD galaxies with magnitudes
6 In a reply to J. Young, Thuan (1991) estimates the same ratiousing very different arguments.

8 Sanchez Almeida et al.
Fig. 6.— (a) g color LFs of the QBCD galaxy sample (the solid line), and the BCD galaxy sample (the dashed line). The shaded areashows our statistical error estimate. The dotted-dashed line represents the LF to be expected when the starburst of the BCD galaxies fadesaway revealing the underlying host galaxies. The dotted line corresponds to the LF of low luminosity galaxies by Blanton et al. (2005),and it is shown here for reference. (b) Observed apparent magnitudes g, with the vertical lines corresponding to the magnitude limitsused to derive the LFs. As the inset in (a) indicates, the solid line and the dashed line represent the QBCD sample and the BCD sample,respectively. (c) Scatter plot of the absolute magnitude of the QBCD galaxies vs the redshift. The solid line shows the boundary to beexpected if the sample were limited in magnitude with g < 18.3.
M±∆M/2. Combining equation (12) with the empiricalrelation between the magnitudes of the host galaxy andthe BCD (equation [1]), one has the recipe to infer theLF of the host galaxies to be expected from the LF ofthe BCD galaxies,
ΦQBCD(M) ≃τQBCD
τBCDΦBCD(M − 0.5). (13)
The scaling factor τQBCD/τBCD is just the ratio betweenthe number densities of BCDs, n0 BCD, and QBCDs,n0 QBCD,
τQBCD
τBCD≃
n0 QBCD
n0 BCD, (14)
since ΦQBCD and ΦBCD are normalized to n0 QBCD andn0 BCD, respectively.
Using equations (13) and (14), we evolve the LF ofBCD galaxies in Figs. 6a and 7a to obtain the LFs oftheir host galaxies. They are included in the same fig-ures as the dotted-dashed lines. The scaling (14) hasbeen taken as the ratio between the number densitiesof QBCD galaxies and BCD galaxies (i.e., the ratio inequation [11] for the g filter, and the corresponding fig-
ure for the z filter). The similarities between the evolvedLF (the dotted-dashed lines) and the LF computed fromthe QBCD data sets (the solid lines) are quite strik-ing. We interpret this agreement as an indication of self-consistency between the two sets of galaxies chosen in§ 2. BCD galaxies and QBCD galaxies can be differentphases in the life of a dwarf galaxy, with the lifetime inthe BCD phase some thirty times shorter than the life-time in the QBCD phase (equations [11] and [14]).
The BCD starbursts are very young since they stillconserve massive stars (see § 1). If τBCD ≃ 10 My thenequations (14) and (11) imply τQBCD ≃ 0.27 Gy. Con-sequently, each QBCD galaxy may undergo as many as30-40 star formation episodes during the timespan wherestars can be formed in dwarf galaxies (&10 Gy; e.g.,
Kunth & Ostlin 2000). This issue is discused in § 5.
4. PROPERTIES OF QBCD GALAXIES AND BCDGALAXIES
The histograms of galaxy properties discussed in § 2,and shown in Fig. 4, describe the properties of the ob-served galaxies. These histograms are strongly biased
BCD galaxies during quiescence 9
Fig. 7.— This figure is identical to Fig. 6 except that the LFs, the histograms, and the scatter plot refer to z, i.e., the redder coloramong the SDSS bandpasses. See Fig. 6 caption for details.
since they overweight the properties the most luminousgalaxies in the samples. In order to correct for theMalmquist bias, so that histograms are weighted accord-ing to the true number density of galaxies, we have usedthe ratio between the LF derived in § 3, Φ(M), and theobserved histogram of absolute magnitudes,
h(M) =1
∆M
∑
i
Π(Mi − M
∆M
)
. (15)
As usual, the symbol Π stands for the rectangle function,
Π(x) ={
1 |x| < 1/2,0 elsewhere.
(16)
The index i in equation (15) includes all observed galax-ies, whereas M and ∆M determine the centers and thewidths of the histogram bins 7. We have to assume thateach observed galaxy is actually a proxy for bi galax-ies, bi − 1 of which are not included in our observationbecause they are too faint to exceed the apparent mag-nitude threshold. The magnitude of the galaxy causesthe bias and, therefore, we assume that the bias function
7 Note that the histogram defined in equation (15) differs fromthat used in Fig. 4 because of the factor ∆M−1. This trivial re-scaling is used here for convenience, allowing the corrected his-tograms to be normalized to the number density of galaxies.
only depends on the absolute magnitude of the galaxy,
bi = b(Mi). (17)
This bias is precisely the reason why h(M) is not the LF,therefore, for ∆M small enough,
Φ(M) ≃1
∆M
∑
i
bi Π(Mi − M
∆M
)
. (18)
Using equation (17), and assuming that b(M) is a slowlyvarying function of M ,
b(Mi)Π(Mi − M
∆M
)
≃ b(M)Π(Mi − M
∆M
)
, (19)
and so one finds from equation (18) the expression forthe bias function,
bj = b(Mj) = Φ(Mj)/h(Mj). (20)
Let us denote as k(p) the histogram of any parameter pconstructed using the observed galaxies,
k(p) =1
∆p
∑
i
Π(pi − p
∆p
)
, (21)
with ∆p the bin-size and pi the value corresponding tothe i-th galaxy. Then the bias-corrected histogram would

10 Sanchez Almeida et al.
be,
k∗(p) =1
∆p
∑
i
bi Π(pi − p
∆p
)
. (22)
This definition guarantees that the corrected histogramof observed absolute magnitudes is the luminosity func-tion (cf. equations [18] and [22] with p = M) and, there-fore, it is not difficult to show that all corrected his-tograms have the same normalization as the LF, i.e.,
∫ ∞
−∞
k∗(p) dp = n0, (23)
n0 being the number density of galaxies (see App. A).We have applied equations (20) and (22) to restore the
histograms in Fig. 4. The result is shown in Fig. 8. Themeans, standard deviations and modes of the new his-tograms are also included in Table 2. As expected, themean absolute magnitudes of the restored histograms aremuch fainter than the observed ones. However, in addi-tion to this effect, the corrected histograms hint at in-trinsic metallicities significantly lower than the observedones both for BCD and QBCD galaxies. The correctedQBCD galaxy colors are bluer than the colors of the ob-served set. These changes can be pin down to the correla-tions between luminosity, color, and metallicity existingin the original data set. Figure 9 shows how the QBCDgalaxies tend to be less metallic as they become fainter,and a similar, but less marked trend, is also present inBCD galaxies. Such a relationship between metallic-ity and mass in dwarf galaxies (and so, between metal-licity and luminosity) was given by Pagel & Edmunds
(1981), and later on by many others (see Kunth & Ostlin2000). Figure 9 includes the linear relationship found bySkillman et al. (1989) for nearby dwarf irregular galax-ies. Curiously enough, the slope is almost the same as wefind for QBCD galaxies. There is also a relationship be-tween color and luminosity, so that fainter QBCD galax-ies seem to be bluer; see Fig. 10. Figures 9 and10 actually reveal an underlying relationship betweencolor and metallicity. It has been brough up in Fig. 11,showing how the redder the galaxy the larger the oxygenabundance. The relationship is more clear in the case ofthe QBCD galaxies (the square symbols), but it is alsopresent among the redder BCD galaxies (the asterisks for〈µg〉 − 〈µr〉 > −0.4). The relationships for QBCDs andBCDs meet at 〈µg〉 − 〈µr〉 ≃ −0.1, although they havedifferent slopes.
The number of known BCD galaxies with metallicitiesless than 1/20 the solar value is rather small (a dozen
or so, according to Kunth & Ostlin 2000). Surprisinglyenough, the list of 1609 BCD candidates we work outcontains only three candidates below this metallicity. Weinterpret this result as a support of the metallicity esti-mate carried out in the paper, but it also reinforces theexistence of a minimum H ii region based metallicity (see
Kunth & Ostlin 2000, and references therein).The range of selected QBCD colors is rather broad and,
therefore, our list of QBCD candidates seems to includeall the range from early-type galaxies to late-type galax-ies. This fact can be appreciated in Fig. 12a, which con-tains a color-color scatter plot. Our galaxies follow thesequence used in galaxy classification, with the reddestextreme corresponding to elliptical galaxies (early types),
and the bluest extreme to irregular galaxies (late types)– compare Fig. 12a with, e.g., Fig. 2 in Bershady et al.(2000). One can distinguish two clusters or concentra-tions in Fig. 12a (the dashed line arbitrarily separatesthe two sub-sets). The existence of these two clusters orclasses was to be expected, since they correspond to thebimodal distribution of colors found in the large sam-ples of galaxies (e.g., Balogh et al. 2004; Blanton et al.2005). Hints of these two modes are also found as twosmall peaks in the histogram of surface brightness colorshown in Fig. 4 (top right, the solid line, with the twopeaks at 〈µg〉 − 〈µr〉 ≃ 0.4 and 0.7). Note how the BCDcandidates occupy the bluest extreme of the color-colorplot; cf. Figs. 12a and 12b.
Most of the QBCD candidates show Hα in emission,meaning that even if the star-formation is reduced withrespect to the BCD candidates, it is not absent. Onlysome 3200 QBCD galaxies out of the 21493 candidatesshow Hα in absorption. They have (negative) equiva-lent widths of a few A and, therefore, these objects areincluded in the bin of zero equivalent width in Fig. 4,bottom right. Using the Hα flux as a proxy for star for-mation (Kennicutt 1998), our QBCD candidates turn outto be one order of magnitude less active in forming starsthan the BCDs. This estimate is worked out in § 5.1,equations (28) and (29).
5. DISCUSION
So far we have described our search avoiding interpret-ing the results. This section, however, is fully devoted tointerpretation and so, admittedly speculative. We willdiscuss how the results in previous sections are consis-tent with the BCD candidates and the QBCD candidatesbeing two different phases in the same sequence of galac-tic evolution. Using as a working hypothesis that BCDschange into QBCDs, and vice versa, we examine obvi-ous flaws and constraints. Showing the consistency of anhypothesis does not prove it to be correct – other alter-natives cannot be discarded. It just shows the workinghypothesis to be viable. Three main results point out inthis direction. First, we choose the QBCDs so that theircolors, concentration indexes and luminosities are equalto those of the galaxies underlying the BCDs. Second,the LF of QBCDs is conformable to the LF of BCDs(§ 3). Third, the BCD galaxies turn out to be QBCDgalaxies with the largest (specific) star formation rates(§ 2.2).
Matching LFs forces the QBCD phase to last some30 times longer than the BCD phase (§ 3.1). Since theBCD starbursts are so short-lived, there should be manyepisodes of BCD phase during a galaxy lifetime. As-suming a single 10 My long starburst per BCD phase,there should be one of such BCD phases each 0.3 Gy.Longer BCD phases are in principle possible by concate-nation of starbursts, but population synthesis modelingof BCD spectra does not favor extended periods of star-formation (e.g., Mas-Hesse & Kunth 1999). If BCDs aretransformed into QBCDs and vice versa, each QBCD hasexperienced several BCD phases because the other alter-native does not seem to be consistent with the results ofthe search. Let us examine this alternative possibility,namely, that the BCD phase represents the only episodeof intense star formation during the galaxy lifetime. Sta-

BCD galaxies during quiescence 11
Fig. 8.— Histograms of magnitudes and colors for QBCDs (the solid lines) and BCDs (the dotted lines) once the Malmquist biashas been compensated for. The unrestored versions of these histograms are shown in Fig. 4. The labels in the ordinate axes describethe parameter that is represented. The histograms are normalized to the number density of galaxies. The dashed line in the plot ofmetallicities (12 + log[O/H]) reproduces Fig. 3 in Kunth & Ostlin (2000), which corresponds to the abundances of 425 H ii galaxiescataloged by Terlevich et al. (1991). Refer to Fig. 4 for further details.
Fig. 9.— Metallicity vs absolute Mg magnitude. The symbolsstand for the mean values considering all the galaxies with similarMg, whereas the error bars represent the standard deviation of themean values. Both QBCD galaxies (the square symbols) and BCDgalaxies (the asterisks) follow a trend so that the fainter the galaxythe more metal poor. The solid line is shown for reference and itcorresponds to the law for nearby dwarf irregular galaxies foundby Skillman et al. (1989).
Fig. 10.— 〈µg〉 − 〈µr〉 color vs absolute Mg magnitude. Thesymbols stand for the mean values considering all the galaxies withsimilar Mg, whereas the error bars represent the standard deviationto be expected for these mean values. The QBCD galaxies are blueras they become fainter (the square symbols). The same trend isnot so obvious for the BCD galaxies (the asterisks).

12 Sanchez Almeida et al.
Fig. 11.— Metallicity vs color. There is a clear trend, whichbecomes steeper and sharper in the case of the QBCD galaxies(the square symbols). The solar metallicity has been marked forreference. Each symbol represents the average metallicity (12 +log[O/H]) considering all the galaxies with the same color. Theerror bars correspond to the standard deviation to be expected forthese averages.
Fig. 12.— (a) u−g vs g−r scatter plot for the QBCD candidates.The colors in the sequence span from those of early-type galaxies,to those of late-type galaxies. There seem to be two clusters in thedistribution of points, which we have artificially separated by thedashed line. (b) Same as (a) but showing the BCD candidates.
tistically, all QBCD galaxies that we detect today havesufferred a BCD episode during the last 270 My (equa-tions [11] and [14], with τBCD =10 My). If this is theonly such episode per galaxy, there should be no BCDsamong galaxies observed at lookback times larger than270 My, or at redshifts > 0.02 (= 270 My/H0). How-ever, a large fraction of the sample of BCDs selected in§ 2.2 has redshifts larger than this limit. We are forcedto conclude that the same host galaxy undergoes severalBCD phases.
Although the recursive BCD phase scenario explainsa number of important observables, other properties ofQBCDs and BCDs do not seem fit in the picture so well.The purpose of the rest of the section is to discuss (andhopefully clarify) some of the most obvious difficultiesposed by the scenario.
5.1. H i consumption timescale
One may think that the repeated starbursting of adwarf galaxy quickly exhausts the gas reservoir, therebymaking the whole picture inconsistent. However, the lowsurface brightness galaxies like the QBCDs are gas-rich(Staveley-Smith et al. 1992; Kunth & Ostlin 2000), withfuel to power the star formation during several Hubbletimes. This claim can be supported by working out theH i consumption timescale, τH I, which is defined as thetime required to transform into stars the neutral hydro-gen of the galaxy, MH I, i.e.,
τH I = MH I/SFR, (24)
with SFR the star formation rate. On the one hand,dwarf low surface brightness galaxies have about one so-lar mass of H i per solar luminosity (Staveley-Smith et al.1992), explicitly,
log(MH I/M⊙) = −0.4 (Mg − Mg ⊙), (25)
M⊙ being one solar mass, and Mg ⊙ the solar absoluteluminosity in the g filter. On the other hand, the SFRscales with the Hα luminosity (e.g., Kennicutt 1998), i.e.,with the product of the Hα equivalent width times thegalaxy luminosity. Since the observed BCD Hα equiv-alent width is uncorrelated with the galaxy luminosity,the BCD SFR scales with the luminosity, that is to say,
log(SFRBCD/SFR′
BCD) = −0.4(Mg − M ′
g), (26)
where SFR′BCD stands for the SFR of a BCD galaxy of
magnitude M ′g. In our two-phase scenario, the galaxy has
short periods of star formation lasting τBCD, interleavedwith long periods of quiescence lasting τQBCD (§ 3.1).Consequently, the effective time-average SFR is,
SFR ≃τBCD SFRBCD + τQBCD SFRQBCD
τBCD + τQBCD(27)
≃ SFRBCD(τBCD
τQBCD+ ǫ),
with
ǫ =SFRQBCD
SFRBCD. (28)
As judged from the ratio of Hα equivalent widths in Ta-ble 2, and the difference of luminosity between BCDs andQBCDs (equation [1]), the SFR during the BCD phaseis some ten times larger than during the QBCD phase,i.e.,
ǫ−1 ≃ 10. (29)
By combining equations (24), (25), (26) and (27), onefinds the consumption timescale to be independent ofthe galaxy luminosity,
log τH I ≃ −0.4(M ′
g−Mg ⊙)−log[SFR′
BCD
M⊙
( τBCD
τQBCD+ǫ
)
]
.
(30)Although BCD star formation bursts are intense for adwarf galaxy, the SFRs of BCDs are rather modest, i.e.,less than 1M⊙y−1, and typically one order of magnitudesmaller (e.g. Sage et al. 1992; Mas-Hesse & Kunth 1999).Taking SFR′
BCD < 1M⊙y−1 for the brightest galaxies of
BCD galaxies during quiescence 13
our sample, M ′g ≃ −19, and using the ratio of timescales
between the phases as provided by equations (11) and(14), equations (29) and (30) yield,
τH I & 30 Gy. (31)
Consequently, the hydrogen existing in QBCD galaxiesallows the sequence BCD-QBCD to last for a few Hubbletimes (≡ 1/H0 =14 Gy).
A final comment is in order. The scenario of a recur-sive starbursting is not in conflict with the commonlyaccepted view of a SFR decreasing during the last 10 Gy(Madau et al. 1996; Lilly et al. 1996). This drop refersto massive galaxies. However, the kind of dwarf galax-ies in our QBCD sample, with stellar masses less than1010 M⊙, has maintained a SFR either stationary orslightly increasing with time (see Heavens et al. 2004,Fig. 1).
5.2. Metallicities
The metallicities of our QBCD galaxies are system-atically larger than the metallicities of the BCD galax-ies. This result seems to be in conflict with the recursiveBCD phase scenario, since the BCD starburst starts offwith a metallicity lower than the metallicity of its hostgalaxy (see Table2). Although this disagreement mayindicate a real flaw in the overall picture, one can alsothink of various ways to circumvent the apparent incon-sistency. For example, the BCD episodes may involvefresh low metallicity gas accreted by the host galaxyduring the periods of quiescence. Note that the BCDepisodes are very conspicuous from the point of view ofthe luminosity, but they involve moderate masses, whichhardly exceed 106 M⊙ (e.g. Mas-Hesse & Kunth 1999).A sustained infall such as those postulated in the lit-erature to solve various problems in galaxy evolution(∼ 1M⊙ pc−2 Gy−1; see Dalcanton 2007, and refer-ences therein) provides 106 M⊙ in only 50 My, even fora small 2.5 kpc galaxy. Masses of 106 M⊙ are also typi-cal of the high velocity clouds hounding our galaxy (e.g.,Wakker et al. 2007). If these gas reservoirs are commonin QBCDs, they may develop major star formation eventswhen merging with the galaxy.
The fresh gas glowing during the BCD phase doesnot necessarily have to come from outside. Metal-poorgas may exist in place in the galaxy (§ 5.1). Thenthe oxygen metallicity assigned here to QBCD galax-ies may not reflect the metallicity of this gas, but themetallicity of a few metal-polluted H ii regions remain-ing from the last starburst. It is relatively easy to en-rich with metals the small fraction of galactic gas un-dergoing starbursts. For example, the metallicity of apure gas cloud increases from the level observed in BCDs(12 + log(O/H) ≃ 8.24; Table 2) to the level in QBCDs(≃ 8.61), if 60% of the original mass is transformed intostarts.8 The metal-polluted gas produces emission linesduring the extended recombination phase of the H ii re-gion (e.g., Beltrametti et al. 1982), and it may also giverise to a secondary generation of stars. The light fromthese aging H ii regions renders high metallicity mea-surements. Eventually, the star-processed gas mingles
8 This estimate assumes the closed box evolution of a purelygaseous cloud (e.g. Tinsley 1980) with the standard oxygen yield(∼0.003; see, e.g., Pilyugin et al. 2004).
with the metal-poor gas of the galaxy, but this mixingleaves the original metallicity almost unchanged9. Wenote that this explanation may be in conflict with the IRexcess detected in the halos of Blue Compact Galaxiesby Bergvall & Ostlin (2002). These halos can be identi-fied with the BCD host galaxies and, therefore, with theQBCDs. The colors cannot be explained with a normalmetal-poor stellar population like the Milky Way halo,but an excess of low-mass stars with significant metallic-ity is required (see Zackrisson et al. 2006). The natureof the disagreement requires further investigation, and itmay be due to the fact that these Blue Compact Galaxieswith IR excesses are not dwarfs according to the criteriaused in our work.
There is yet another possibility to reconcile the metal-licities of the two galaxy types. Only those QBCD candi-dates with metallicity similar to that of the BCD galax-ies would be part of the BCD – QBCD sequence. TheQBCDs with metallicity like the BCDs represent 20%of the sample (see Fig. 4) and, therefore, the timescaleof quiescence must be shortened by a factor of five tocomply with equation (14). The same happens with theH i consumption timescale worked out in equation (31).These QBCD galaxies may keep their low metallicity lev-els because the metals are expelled by galactic winds(Heckman 2002; Tenorio-Tagle et al. 2003; see, how-ever, Silich & Tenonio-Tagle 2001; Legrand et al. 2001),because they are recycled into new stellar generationswithin superstar clusters, without significant mixing withthe galactic gas (Tenorio-Tagle et al. 2005), or simply be-cause of the dilution with pristine gas described above.
5.3. Starburst triggering
We select isolated QBCD galaxies, therefore, the star-burst triggering mechanism to turn them into BCDscannot be galaxy-galaxy interactions, mergers or harass-ment. How, then, are the BCD bursts triggered? Sev-eral possibilities are available. If the fresh gas falls on theQBCD galaxy over extended periods of time, intense starformation cannot be triggered until the gas density ex-ceeds the required threshold (the so-called Schmidt law;Schmidt 1959). Waiting for enough gas to accumulatecould explain periods of latency. If the gas falls in duringshort episodes (like the collision with a large gas cloud),the hitting of the gas itself may induce star formation.Then the QBCD timescale would be given by the char-acteristic time between cloud collisions. If rather thancoming from outside, the fresh gas is part of the galaxy,internal galactic structures like bars may periodically ex-cite star formation. In the case of a gas-rich galaxy thetriggering may also be due to perturbations of the galac-tic material by dark matter clumps. These elusive struc-tures are predicted in lots by the cold dark matter sim-ulations of galaxy formation (e.g., Diemand et al. 2007),and they are expected to disturb the quiet evolution ofgalactic disks (e.g., Kazantzidis et al. 2007).
5.4. QBCD characterization criteria
The criteria used to characterize QBCDs come fromthe BCD host galaxies analyzed by Amorın et al. (2007,
9 If 1% of gas with QBCD metallicity is mixed up with 99% ofgas with BCD metallicity, then the resulting change of metallicityis only ∆[12 + log(O/H)] ≃ 0.006, i.e., insignificant.

14 Sanchez Almeida et al.
2008), but we may have used different criteria taken fromother works. The question arises as to whether the selec-tion of candidates critically depends on this assumption.
The BCD host galaxy properties are used to con-strain colors and Sersic indexes (see § 2.1 and Table 2).The lower limit luminosity, also taken from the BCDhost galaxies, turns out to be unimportant since thesmall number low luminosity objects prevents any se-rious influence of this criterion on the selection (seeFig. 4). The range of visible g − r colors that we useagrees with the colors that different studies have as-signed to the hosts of BCDs (e.g., Papaderos et al. 1996b;Gil de Paz & Madore 2005), even in those cases wherea significant infra-red excess has been detected (e.g.,
Bergvall & Ostlin 2002). In this sense the color crite-rion does not seem to be questionable and, therefore,any work would have rendered similar QBCD candidates.The selection of Sersic indexes is more influential. Stud-ies like Bergvall & Ostlin (2002) or Gil de Paz & Madore(2005) find indexes as large as n =10–20, whereas we taken < 3 (Table 2). However, there are two good reasons toprefer low−n values. First and most important, the ob-served dwarf galaxies present low−n values (e.g., Fig. 11in Caon et al. 2005; Graham & Guzman 2003), and ifwe search for galaxies that may be Blue-Compact-Dwarfgalaxies during quiescence, they must be dwarfs too (seeequation [1].) Second, the large n values are obtainedfrom 1D fits to azimuthally averaged luminosity profiles,and the n thus obtained depends critically on the rangeof radii used to characterize the galactic outskirts (e.g.,Cairos et al. 2003; Gil de Paz & Madore 2005). The 2Dfits providing low indexes are fairly more robust and,therefore, to be preferred (see Amorın et al. 2007).
6. CONCLUSIONS
The starburst characteristic of BCD galaxies does notlast for long. Once this episode is over, the BCD galaxiesshould dim their surface brightness to become quiescentBCD galaxies (or QBCD galaxies). Although QBCDgalaxies are to be expected, they have not been iden-tified yet (see § 1). The present work describes an ef-fort to find them among the galaxies in the SDSS/DR6database. The properties of the QBCDs have been takenfrom the sample of BCD host galaxies characterized byAmorın et al. (2007, 2008) (§ 2.1). We find 21493 QBCDcandidates, therefore, QBCDs seem to be fairly commonin the local universe. In order to have a proper refer-ence to compare with, a complete sample of BCD galax-ies was selected too. It comprises 1609 BCD candidates(§ 2.2). Since the two samples were selected from thesame database using analogous criteria, the comparisonbetween the two sets is relatively free from the bias thatour selection may have.
We compute Luminosity Functions (LFs) for the twosamples (§ 3). In addition, we estimate their main prop-erties before and after correcting for Malmquist bias.These properties can be summarized as follows,
• There are around 30 QBCD candidates per BCDcandidate. We infer this ratio by comparison of theLFs for QBCDs and BCDs. The two LFs are verysimilar, except for the global scaling factor, and theexpected 0.5 magnitude dimming (§ 3.1).
• The surface brightness of the QBCDs is typicallyone magnitude fainter than the surface brightnessof BCDs (Table 2).
• QBCD candidates are, on average, 0.4 magnitudesredder than the BCD (Table 2; 〈µg〉 − 〈µr〉).
• QBCD candidates have an H ii region based oxygenmetallicity 0.4 dex higher than the BCD candidates(Table 2).
• The QBCD metallicity increases with the luminos-ity, following the well known trend for dwarf galax-ies.
• The QBCD metallicity also increases with thecolor, so that the redder the galaxy the larger themeasured metallicity.
• 75 % of the BCD candidates are also part of theQBCD sample (§ 2.2). Roughly speaking, the BCDsample represents the fraction QBCD galaxies hav-ing the largest specific SFR (SFR per unit of lumi-nosity).
• There are around three dwarf galaxies per QBCDcandidate (§ 3), which renders one BCD galaxy ev-ery ninety dwarf galaxies.
The overlap between BCD galaxies and QBCD galax-ies is consistent with the two sets forming a single con-tinuous sequence, with the most active QBCD galaxiesbeing BCD galaxies. The agreemet between their LFshapes, and the ratio of number their densities, supportthe commonly accepted view that BCD galaxies undergoshort bursts of star formation separated by long quies-cent epochs. However, the fact that the QBCD metallic-ity is higher than the BCD metallicity poses a problem tosuch an episodic starbursting scenario, which we try tocircumvent with various plausible explanations in § 5.2.
The repeated starbursting scenario predicts a numberof independent observables whose testing is importantbut goes beyond the scope of the paper. They representa natural extension of the present work. In order to il-lustrate the possibilities, we will outline two examples.QBCDs must have a stellar population corresponding toshort star formation episodes in between quiescent gaps.In principle, one can distinguish between a (low level of)continuous star formation and a more violent episodicstar formation with a period of 0.3 Gy. Leonardi & Rose(1996) put forward a spectroscopic index to detect post-starburst galaxies. The technique is well suited for de-termining the time elapsed from the last (young) star-burst, and it has been calibrated by Leonardi & Worthey(2000). Depending on the noise level, one can apply themethod to selected QBCD SDSS spectra, or to averagesof similar QBCD spectra. Another testable prediction ofthe scenario has to do with the metallicity inferred fromemission lines in QBCD galaxies (§ 5.2). It should over-estimates the true galaxy metallicity and, in particular,the metallicity of the stellar content. Studies of stellarmetallicity can be carried out using integrated galaxyspectra, provided that they have enough signal-to-noiseratio and spectral resolution to show absorption lines(e.g. Terlevich et al. 1990; Worthey et al. 1994). These

BCD galaxies during quiescence 15
two testable predictions provide a flavor for other teststo come.
Thanks are due to R. Dıaz Campos for training withthe SQL queries, to J. Betancort for clarifying discus-sions on the LF normalization, and to A. Vazdekis forpointing out the work by Leonardi & Rose (1996). Theauthors are particularly indebted to A. Dıaz, M. Mas-Hesse, R. Terlevich, P. Papaderos, and J. Vılchez forstimulating discusions during the meetings of the estalli-dos collaboration. This work has been partly funded bythe Spanish Ministerio de Educacion y Ciencia, proyectAYA 2007 67965. We thank the referee for helping usto clarify some of the arguments in the paper. Fundingfor the SDSS and SDSS-II has been provided by the Al-fred P. Sloan Foundation, the Participating Institutions,the National Science Foundation, the U.S. Departmentof Energy, the National Aeronautics and Space Adminis-tration, the Japanese Monbukagakusho, the Max PlanckSociety, and the Higher Education Funding Council for
England. T he SDSS Web Site is http://www.sdss.org/.The SDSS is managed by the Astrophysical ResearchConsortium for the Participating Institutions. The Par-ticipating Institutions are the American Museum of Nat-ural History, Astrophysical Institute Potsdam, Univer-sity of Basel, University of Cambridge, Case WesternReserve University, University of Chicago, Drexel Uni-versity, Fermilab, the Institute for Advanced Study, theJapan Participation Group, Johns Hopkins University,the Joint Institute for Nuclear Astrophysics, the KavliInstitute for Particle Astrophysics and Cosmology, theKorean Scientist Group, the Chinese Academy of Sci-ences (LAMOST), Los Alamos National Laboratory, theMax-Planck-Institute for Astronomy (MPIA), the Max-Planck-Institute for Astrophysics (MPA), New MexicoState University, Ohio State University, University ofPittsburgh, University of Portsmouth, Princeton Uni-versity, the United States Naval Observatory, and theUniversity of Washington.
APPENDIX
LUMINOSITY FUNCTION ESTIMATE
The LF, Φ(M), is defined as the number of galaxies with absolute magnitude M per unit of magnitude and unit ofvolume. We use it to describe the local universe and, therefore, Φ(M) is not expected to change with the position inspace. The number of galaxies per unit volume, n0, is just,
n0 =
∫ Mu
Ml
Φ(M) dM, (A1)
where only absolute magnitudes in between the limits Ml ≤ M ≤ Mu are considered. Using the definition of LF, onecan easily write down the number of galaxies to be expected in an apparent magnitude limitted catalog, namely,
N =
∫ Mu
Ml
Φ(M)Vmax(M) dM. (A2)
As usual, the symbol Vmax(M) stands for the volume of universe covered by the catalog where galaxies of absolutemagnitude M have apparent magnitudes smaller than the catalog threshold (e.g., Takeuchi et al. 2000).
Maximum likelyhood estimates of LFs are favored in the current literature (e.g., Lin et al. 1996; Blanton et al. 2001).They were pioneered by Efstathiou et al. (1988) and, among the quoted advantages, they present a number of desirableasymptotic error properties10. Note, however, that these methods are not unbiased (the expected value of the estimateis not necessarily the parameters to be estimated). The method is based on the following principle; given the redshiftζ of an observed galaxy, the probability that it has an absolute magnitude M is,
P (M | ζ) = Φ(M)/
∫ Mmax(ζ)
Mmin(ζ)
Φ(M ′) dM ′, (A3)
where the normalization gives all the galaxies that we are allowed to observe at ζ. Since our catalog is limited inapparent magnitude mmax,
m ≤ mmax, (A4)
only galaxies bright enough would be observable at this redshift. Considering the definition of distance modulus,
DM(ζ) = m − M, (A5)
then,M ≤ Mmax(ζ) = mmax − DM(ζ). (A6)
Similarly, the sample would have a minimum apparent magnitude mmin (e.g., given by the brightest galaxy in thesample), which sets the minimum magnitude to be observed,
M ≥ Mmin(ζ) = mmin − DM(ζ). (A7)
10 They are consistent, i.e., they tend to the parameter to be estimated when the sample increases, and the distribution becomes anormal of minimum variance for large samples (see, e.g., Martin 1971, § 7.2 ).

16 Sanchez Almeida et al.
Assuming that the probability of observing each galaxy is independent from the rest of galaxies, the likelyhood functionL is just the product of the probability of observing each galaxy,
L = Πj P (Mj | ζj), (A8)
where the index j spans from 1 to N . The maximum likelyhood estimate maximizes L, which is equivalent tomaximizing its logarithm,
logL =∑
j
log Φ(Mj) −∑
j
log[
∫ Mmax(ζj)
Mmin(ζj)
Φ(M ′) dM ′
]
. (A9)
The next step consist in parameterizing the LF in terms of a number K of free parameters Xi,
Φ(M) = φ(M, Xi), (A10)
with i = 1, . . . K. Various representations φ(M, Xi) can be found in the literature, e.g., a stepwise function(Efstathiou et al. 1988), a Schechter function (Lin et al. 1996), a collection of Gaussians (Blanton et al. 2003b). Wechoose yet another representation, namely, natural cubic splines. The reasons are (1) the LF is simple and fast tocompute, (2) the integral of the LF is also fast to compute since it follow directly from the spline interpolation, and(3) it automatically provides a smooth Φ(M). Speed is always an appealing feature since the maximization of logL iscarried out iteratively, and requires many evaluations of the LF.
The normalization of the LF is not constrained by the likelyhood function, which is independent of a global scalingfactor (equation [A9]). Another complementary method is required to estimate the number density of galaxies n0.Such method is often the minimum variance estimate by Davis & Huchra (1982). We use a simple version of suchestimate, where all the galaxies in the sample are equally weighted, thus avoiding assuming a particular covariance ofthe galaxy catalog. It corresponds to the so-called n3 in the original paper by Davis & Huchra (1982), and it has beenused elsewhere (e.g., Bolzonella et al. 2002). The expression can be derived by combining equations (A1) and (A2),which yield,
n0 = N/
∫ Mu
Ml
ϕ(M)Vmax(M) dM. (A11)
All items in the right-hand-side of the previous expression are known; the normalized LF ϕ(M),
ϕ(M) = Φ(M)/
∫ Mu
Ml
Φ(M ′) dM ′, (A12)
is provided by the maximum likelyhood procedure, whereas Vmax(M) follows from the magnitude limit and the solidangle of the catalog (e.g., Takeuchi et al. 2000).
The actual maximization of the likelyhood in equation (A9) is carried out using the standard Powell method(Press et al. 1988). Error bars are assigned by bootstrapping (e.g., Moore et al. 2003; Blanton et al. 2003b), whereone constructs bootstrap re-samples by choosing at random galaxies from the original data set. Then the applicationof the LF retrieval procedure to all bootstrap re-samples yields a set of LFs with the spread of values to be expectedfrom the true error distribution (Moore et al. 2003). We use the standard deviation of such bootstrap distribution asour error bars.
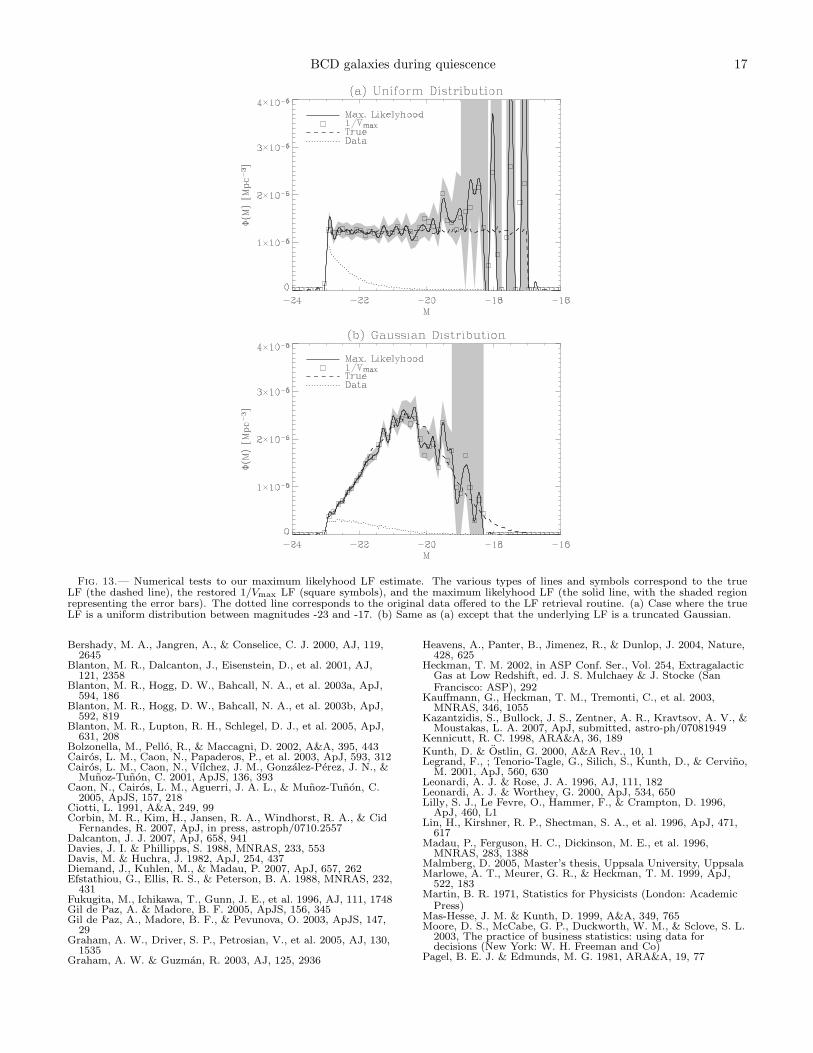
Numerical tests have been carried out to check the procedure. We choose a large number of galaxies (105–106) withrandom absolute magnitude according to Gaussian or uniform distributions. These galaxies are randomly uniformlyspread in space within a sphere of radius ζ = 0.35. Apparent magnitudes are computed using these redshifts, andgalaxies fainter than the assumed catalog cutoff are drooped from the sample (we take mmax = 17.7). This biasedsample is then used to fed the procedure. Two examples of true and restored LFs are given in Fig. 13. The solidlines correspond to our maximum likelyhood estimate, whereas the dashed lines show the true histogram derived fromthe synthetic data before the apparent magnitude threshold is introduced. The two of them agree within error bars,which are given as shaded areas. Moreover, the maximun likelyhood estimates also agree with the 1/Vmax estimatesincluded in the same plot (see, e.g., Takeuchi et al. 2000 for a description of traditional 1/Vmax method by Schmidt1968). The agreement is not specific of these particular realizations but is a general property, and it seems to holdboth independently of the original distribution, and the number of galaxies in the sample. In order to illustrate themagnitude of the correction carried out by the LF retrieval routine, Fig. 13 also includes the distributions of magnitudesof the some 104 galaxies given to the program (the dotted lines).
REFERENCES
Adelman-McCarthy, J. K. & the SDSS collaboration. 2007, AJ,astro-ph/07073413v2
Allam, S. S., Tucker, D. L., Lee, B. C., & Smith, J. A. 2005, AJ,129, 2062
Aloisi, A., Clementini, G., Tosi, M., et al. 2007, ApJ, 667, L151Amorın, R. O., Aguerri, J. A. L., Munoz-Tunon, C., & Cairos,
L. M. 2008, A&A, submitted
Amorın, R. O., Munoz-Tunon, C., Aguerri, J. A. L., Cairos,L. M., & Caon, N. 2007, A&A, 467, 541
Balogh, M. L., Baldry, I. K., Nichol, R., et al. 2004, ApJ, 615,L101
Beltrametti, M., Tenorio-Tagle, G., & Yorke, H. W. 1982, A&A,112, 1
Bergvall, N. & Ostlin, G. 2002, A&A, 390, 891
BCD galaxies during quiescence 17
Fig. 13.— Numerical tests to our maximum likelyhood LF estimate. The various types of lines and symbols correspond to the trueLF (the dashed line), the restored 1/Vmax LF (square symbols), and the maximum likelyhood LF (the solid line, with the shaded regionrepresenting the error bars). The dotted line corresponds to the original data offered to the LF retrieval routine. (a) Case where the trueLF is a uniform distribution between magnitudes -23 and -17. (b) Same as (a) except that the underlying LF is a truncated Gaussian.
Bershady, M. A., Jangren, A., & Conselice, C. J. 2000, AJ, 119,2645
Blanton, M. R., Dalcanton, J., Eisenstein, D., et al. 2001, AJ,121, 2358
Blanton, M. R., Hogg, D. W., Bahcall, N. A., et al. 2003a, ApJ,594, 186
Blanton, M. R., Hogg, D. W., Bahcall, N. A., et al. 2003b, ApJ,592, 819
Blanton, M. R., Lupton, R. H., Schlegel, D. J., et al. 2005, ApJ,631, 208
Bolzonella, M., Pello, R., & Maccagni, D. 2002, A&A, 395, 443Cairos, L. M., Caon, N., Papaderos, P., et al. 2003, ApJ, 593, 312Cairos, L. M., Caon, N., Vılchez, J. M., Gonzalez-Perez, J. N., &
Munoz-Tunon, C. 2001, ApJS, 136, 393Caon, N., Cairos, L. M., Aguerri, J. A. L., & Munoz-Tunon, C.
2005, ApJS, 157, 218Ciotti, L. 1991, A&A, 249, 99Corbin, M. R., Kim, H., Jansen, R. A., Windhorst, R. A., & Cid
Fernandes, R. 2007, ApJ, in press, astroph/0710.2557Dalcanton, J. J. 2007, ApJ, 658, 941Davies, J. I. & Phillipps, S. 1988, MNRAS, 233, 553Davis, M. & Huchra, J. 1982, ApJ, 254, 437Diemand, J., Kuhlen, M., & Madau, P. 2007, ApJ, 657, 262Efstathiou, G., Ellis, R. S., & Peterson, B. A. 1988, MNRAS, 232,
431Fukugita, M., Ichikawa, T., Gunn, J. E., et al. 1996, AJ, 111, 1748Gil de Paz, A. & Madore, B. F. 2005, ApJS, 156, 345Gil de Paz, A., Madore, B. F., & Pevunova, O. 2003, ApJS, 147,
29Graham, A. W., Driver, S. P., Petrosian, V., et al. 2005, AJ, 130,
1535Graham, A. W. & Guzman, R. 2003, AJ, 125, 2936
Heavens, A., Panter, B., Jimenez, R., & Dunlop, J. 2004, Nature,428, 625
Heckman, T. M. 2002, in ASP Conf. Ser., Vol. 254, ExtragalacticGas at Low Redshift, ed. J. S. Mulchaey & J. Stocke (SanFrancisco: ASP), 292
Kauffmann, G., Heckman, T. M., Tremonti, C., et al. 2003,MNRAS, 346, 1055
Kazantzidis, S., Bullock, J. S., Zentner, A. R., Kravtsov, A. V., &Moustakas, L. A. 2007, ApJ, submitted, astro-ph/07081949
Kennicutt, R. C. 1998, ARA&A, 36, 189Kunth, D. & Ostlin, G. 2000, A&A Rev., 10, 1Legrand, F., ; Tenorio-Tagle, G., Silich, S., Kunth, D., & Cervino,
M. 2001, ApJ, 560, 630Leonardi, A. J. & Rose, J. A. 1996, AJ, 111, 182Leonardi, A. J. & Worthey, G. 2000, ApJ, 534, 650Lilly, S. J., Le Fevre, O., Hammer, F., & Crampton, D. 1996,
ApJ, 460, L1Lin, H., Kirshner, R. P., Shectman, S. A., et al. 1996, ApJ, 471,
617Madau, P., Ferguson, H. C., Dickinson, M. E., et al. 1996,
MNRAS, 283, 1388Malmberg, D. 2005, Master’s thesis, Uppsala University, UppsalaMarlowe, A. T., Meurer, G. R., & Heckman, T. M. 1999, ApJ,
522, 183Martin, B. R. 1971, Statistics for Physicists (London: Academic
Press)Mas-Hesse, J. M. & Kunth, D. 1999, A&A, 349, 765Moore, D. S., McCabe, G. P., Duckworth, W. M., & Sclove, S. L.
2003, The practice of business statistics: using data fordecisions (New York: W. H. Freeman and Co)
Pagel, B. E. J. & Edmunds, M. G. 1981, ARA&A, 19, 77

18 Sanchez Almeida et al.
Papaderos, P., Loose, H.-H., Fricke, K. J., & Thuan, T. X. 1996a,A&A, 314, 59
Papaderos, P., Loose, H.-H., Thuan, T. X., & Fricke, K. J. 1996b,A&AS, 120, 207
Pilyugin, L. S., Vılchez, J. M., & Contini, T. 2004, A&A, 425, 849Press, W. H., Flannery, B. P., Teukolsky, S. A., & Vetterling,
W. T. 1988, Numerical Recipes (Cambridge: CambridgeUniversity Press)
Sage, L. J., Salzer, J. J., Loose, H.-H., & Henkel, C. 1992, A&A,265, 19
Sargent, W. L. W. & Searle, L. 1970, ApJ, 162, L155Schlegel, D. J., Finkbeiner, D. P., & Davis, M. 1998, ApJ, 500,
525Schmidt, M. 1959, ApJ, 129, 243Schmidt, M. 1968, ApJ, 151, 393Searle, L. & Sargent, W. L. W. 1972, ApJ, 173, 25Searle, L., Sargent, W. L. W., & Bagnuolo, W. G. 1973, ApJ,
179, 427Shi, F., Kong, X., Li, C., & Cheng, F. Z. 2005, A&A, 437, 849Silich, S. & Tenonio-Tagle, G. 2001, ApJ, 552, 91Silk, J., Wyse, R. F. G., & Shields, G. A. 1987, ApJ, 322, L59Skillman, E. D., Kennicutt, R. C., & Hodge, P. W. 1989, ApJ,
347, 875Smith, J. A., Tucker, D. L., Kent, S., et al. 2002, AJ, 123, 2121Staveley-Smith, L., Davies, R. D., & Kinnan, T. D. 1992,
MNRAS, 258, 334
Stoughton, C., Lupton, R. H., Bernardi, M., et al. 2002, AJ, 123,485
Takeuchi, T. T., Yoshikawa, K., & Ishii, T. T. 2000, ApJS, 129, 1Telles, E. & Terlevich, R. 1997, MNRAS, 286, 183Tenorio-Tagle, G., Silich, S., & Munoz-Tunon, C. 2003, ApJ, 597,
279Tenorio-Tagle, G., Silich, S., Rodrıguez-Gonzalez, A., &
Munoz-Tunon, C. 2005, ApJ, 628, L13Terlevich, E., Diaz, A. I., & Terlevich, R. 1990, MNRAS, 242, 271Terlevich, R., Melnick, J., Masegosa, J., Moles, M., & Copetti,
M. V. F. 1991, A&AS, 91, 285Thuan, T. X. 1991, in Massive Stars in Starbursts, ed.
C. Leitherer, N. Walborn, T. Heckman, & C. Norman(Cambridge: Cambridge University Press), 183
Tinsley, B. M. 1980, Fundam. Cosmic Phys., 5, 287Wakker, B. P., York, D. G., Howk, J. C., et al. 2007, ApJ, 670,
L113Worthey, G., Faber, S. M., Gonzalez, J. J., & Burstein, D. 1994,
ApJS, 94, 687Zackrisson, E., Bergvall, N., Ostlin, G., Micheva, G., & Leksell,
M. 2006, ApJ, 650, 812
Related Documents