SEARCH FOR AND STUDY OF SAND BLOWS AT DISTANT SITES RESULTING FROM PREHISTORIC AND HISTORIC NEW MADRID EARTHQUAKES: Collaborative Research, M. Tuttle & Associates and Central Region Hazards Team, U.S. Geological Survey Final Technical Report Research supported by the U.S. Geological Survey (USGS), Department of the Interior, under USGS award 1434-02HQGR0097 Martitia P. Tuttle M. Tuttle & Associates 128 Tibbetts Lane Georgetown, ME 04548 Tel: 207-371-2007 E-mail: [email protected] URL: http://www.mptuttle.com Project Period: 4/1/2002-6/30/2005 Program Element II: Research on Earthquake Occurrence and Effects Program Element I: Products for Earthquake Loss Reduction Key Words: Paleoseismology, Paleoliquefaction, Age Dating, Quaternary Fault Behavior The views and conclusions contained in this document are those of the authors and should not be interpreted as necessarily representing the official policies, either expressed or implied, of the U.S. Government.

Welcome message from author
This document is posted to help you gain knowledge. Please leave a comment to let me know what you think about it! Share it to your friends and learn new things together.
Transcript

SEARCH FOR AND STUDY OF SAND BLOWS AT DISTANT SITES RESULTING
FROM PREHISTORIC AND HISTORIC NEW MADRID EARTHQUAKES: Collaborative Research, M. Tuttle & Associates and
Central Region Hazards Team, U.S. Geological Survey
Final Technical Report
Research supported by the U.S. Geological Survey (USGS), Department of the Interior, under USGS award 1434-02HQGR0097
Martitia P. Tuttle M. Tuttle & Associates
128 Tibbetts Lane Georgetown, ME 04548
Tel: 207-371-2007 E-mail: [email protected] URL: http://www.mptuttle.com
Project Period: 4/1/2002-6/30/2005
Program Element II: Research on Earthquake Occurrence and Effects Program Element I: Products for Earthquake Loss Reduction
Key Words: Paleoseismology, Paleoliquefaction, Age Dating, Quaternary Fault Behavior The views and conclusions contained in this document are those of the authors and should not be
interpreted as necessarily representing the official policies, either expressed or implied, of the U.S. Government.

1
SEARCH FOR AND STUDY OF SAND BLOWS AT DISTANT SITES RESULTING FROM PREHISTORIC AND HISTORIC NEW MADRID EARTHQUAKES:
Collaborative Research, M. Tuttle & Associates and Central Region Hazards Team,
U.S. Geological Survey
Martitia P. Tuttle M. Tuttle & Associates
128 Tibbetts Lane Georgetown, ME 04548
Tel: 207-371-2007 E-mail: [email protected]
Abstract Earthquake-induced liquefaction features, including 34 sand blows, were discovered, documented, and measured at 100 new sites along the Castor River in southeastern Missouri, the Little River in northeastern Arkansas, Mayfield Creek in western Kentucky, and the Hatchie, Loosahatchie, and Wolf Rivers in western Tennessee. The weathering characteristics of the liquefaction features as well as radiocarbon and optically stimulated luminescence dating were used to interpret the ages of most of the liquefaction features. An especially significant findings is a weathered 5.5 kyr old sand blow northwest of Marked Tree, Arkansas that probably formed during a M >7 earthquake centered in the Marianna area. It suggests that a record of paleoearthquakes is available in the Late Wisconsin deposits of the western portion of the St. Francis Basin that would help to shed light on the long-term behavior of the NMSZ and other earthquake sources in the region. Many of the other documented liquefaction features also are thought to be prehistoric in age. Additional effort to constrain the age estimates of the features may help to reduce uncertainties related to recurrence times of New Madrid earthquakes and to identify earthquake sources outside the NMSZ. Our findings enlarge the liquefaction fields for the A.D. 1811-1812 and A.D. 1450 New Madrid earthquakes. Compound sand blows, composed of 2 to 4 depositional units, on the Hatchie and Little Rivers formed during the A.D. 1811-1812 and 1450, and possibly earlier New Madrid earthquake sequences, will help to further define liquefaction fields and thus the source areas and magnitudes of earthquakes within each sequence. Evaluation of scenario earthquakes suggests that liquefaction features along the Black, Cache, Current, and White Rivers in the Western Lowlands, the Cross County Ditch in the St. Francis Basin, and the Hatchie River in western Tennessee could be explained by earthquakes similar in locations and magnitudes (M >7) to the 1811-1812 New Madrid mainshocks. Introduction Paleoseismological studies have begun to decipher the Holocene earthquake history of the New Madrid seismic zone (NMSZ) and have changed the perception of the hazard it poses. 1811-1812-type earthquake sequences, or New Madrid events, in A.D. 900 + 100 yr and A.D. 1450 + 150 yr and possibly in 2350 + 200 yr B.C., were recognized largely through the study of earthquake-induced liquefaction features across the New Madrid region (Figure 1; e.g., Tuttle et al., 2002, and 2005). From these paleoseismic data, a mean recurrence time of 500 years was

2
Figure 1. Map of NMSZ showing ages and sizes of earthquake-induced liquefaction features, including sand blows and sand dikes, that were found during this and previous studies in greater New Madrid region (modified from Tuttle et al., 2005).

3
estimated for New Madrid events. Although it is based on only two earthquake cycles, the 500-year recurrence time has changed assessments of the regional earthquake hazard and has been incorporated into the National Probabilistic Seismic Hazard Map (Frankel et al, 2002; Petersen et al., 2008). Recently, large New Madrid-size sand blows have been found near Marianna, Arkansas, and the southern end of the Reelfoot Rift, where few modern or historic earthquakes have been centered (Figure 1; Al-Shukri et al., 2006; Tuttle et al., 2006). The sand blows are Middle Holocene in age and are thought to be result of very large (M > 7) earthquakes centered in the Marianna area. This discovery suggests that seismicity migrates along the Reelfoot Rift, and therefore, that currently aseismic portions of the rift may produce large damaging earthquakes in the future. A more accurate, more complete, and longer history of paleoearthquakes in northeastern Arkansas, southeastern Missouri, and western Kentucky and Tennessee would help to reduce the uncertainty in the mean recurrence time of New Madrid events and to improve the understanding of the long-term behavior of the New Madrid fault zone and other faults in the Reelfoot Rift system. This study builds on previous findings and aims to reduce uncertainties regarding locations, magnitudes, and recurrence times of very large New Madrid earthquakes. The specific goals of this study are (1) to find, measure, date, and correlate sand blows beyond their currently known distributions, (2) to identify distal sites of liquefaction related to major New Madrid earthquakes, (3) to employ liquefaction potential analysis to help constrain locations and magnitudes of New Madrid earthquakes, and (4) to determine if mapped faults outside the currently active NMSZ have generated large earthquakes during the Holocene and Late Wisconsin. To accomplish these goals, we conducted reconnaissance for and study of earthquake-induced liquefaction features along the Castor River in southeastern Missouri, the Little River in northeastern Arkansas, Mayfield Creek in western Kentucky, and the Hatchie, Loosahatchie, and Wolf Rivers in western Tennessee. We also compiled geotechnical data for fluvial deposits along the Black, Cache, Current, Hatchie, and White Rivers and Cross County Ditch and evaluated scenario earthquakes using liquefaction potential analysis. This research was conducted in collaboration with Eugene Schweig of the U.S. Geological Survey. D. Bellan, S. Kroupa, L. Mayrose, N. McCallister, C. Prentice, and H. Schroeder assisted with reconnaissance, K. Dyer-Williams compiled and analyzed geotechnical data, and K. Tucker updated the regional map of liquefaction sites. Beta Analytic, Inc. performed radiocarbon dating and S. Mahan of the U.S. Geological Survey conducted OSL dating for this project. Reconnaissance for Earthquake-Induced Liquefaction Features During this project, we searched for earthquake-induced liquefaction features along 50 km of the Castor River in southeastern Missouri, 17 km of the Little River in northeastern Arkansas, 8 km of Mayfield Creek in western Kentucky, as well as 46 km of the Hatchie River, 5 km of the Loosahatchie River, and 18 km of the Wolf River in western Tennessee. We found and documented earthquake-induced liquefaction features, including 34 sand blows, at more than 100 sites and collected organic and sediment samples for dating purposes (Figure 1 and Table 1).

4
Radiocarbon and optically stimulated luminescence (OSL) dating was carried out on selected samples from some of the liquefaction sites (Tables 2 and 3). The results of dating were used to estimate the ages of the liquefaction features. Castor River We surveyed three sections of the Castor River, a 34-km section in the vicinity of Zalma and Greenbrier, a 2-km section near Sturdivant, and a 13-km section near Aquilla. Near Zalma, the Castor River cuts through the southeastern edge of the Ozark Plateau. At Greenbrier, the river discharges into the Advance Lowlands of the Mississippi River Valley (Saucier, 1994). Along the Zalma-Greenbrier section of the river, there are many excellent exposures of what appears to be Holocene fluvial deposits. The river section near Sturdivant was ponded due to diversion of stream flow along the Castor River Diversion Channel. Thus, the cutbanks were low and exposure poor. The section of the river near Aquilla cuts through Crowleys Ridge. Here, there are many good exposures of Holocene fluvial deposits. About 3 km downstream from Aquilla, however, the cutbanks are protected with riprap and exposure becomes poor. Along the Zalma-Greenbrier section of the Castor River, we documented sand dikes and a possible sand blow at three sites (Figure 1 and Table 1). Sand dikes ranged up to 80 cm wide and a possible sand blow was 20 cm thick. Some of the features are loose and unweathered and therefore are interpreted to be historic in age. They probably formed during the 1811-1812 New Madrid earthquakes. Other features are iron-stained and cemented and therefore are interpreted to be prehistoric in age. This applies to the sand dike and possible sand blow at site 4 (Table 1). Radiocarbon dating of charred material collected from the deposit cut by the dike and below the possible sand blow indicates that these features formed during the past 3 kyr. Near Aquilla, we found three sand dikes at site 1 (Table 1). The dikes range up to 4 cm wide. Two of the dikes are deeply bioturbated suggesting that they are also prehistoric in age. Currently, many of the age estimates of the liquefaction features along the Castor River are poorly constrained. Site investigations are needed to collect and date additional samples in order to better constrain the ages of the liquefaction features. Hatchie River We have surveyed 46 km of the Hatchie River downstream from the Rt. 54 crossing east of Covington (Figure 1). To date, we have not yet found the eastern limit of earthquake-induced liquefaction along the Hatchie River. There are many excellent exposures along the river that has not been channelized unlike many of the rivers in the region. Mostly Holocene deposits are exposed along the western portion of the river; whereas, Holocene and Late Wisconsin deposits are exposed along the eastern portion of the river. Along the Hatchie River, we documented liquefaction features, including 24 sand blows, at 71 sites (Table 1). The sand blows range up to 65 cm thick and the sand dikes range up to 95 cm wide. In general, sand blow thickness and sand dike width decrease with distance from the NMSZ (Figure 1). There are at least two generations of liquefaction features along the Hatchie River. The age of many of the features are poorly constrained but most features can be separated into historic and prehistoric categories on the basis of weathering characteristics, including
5
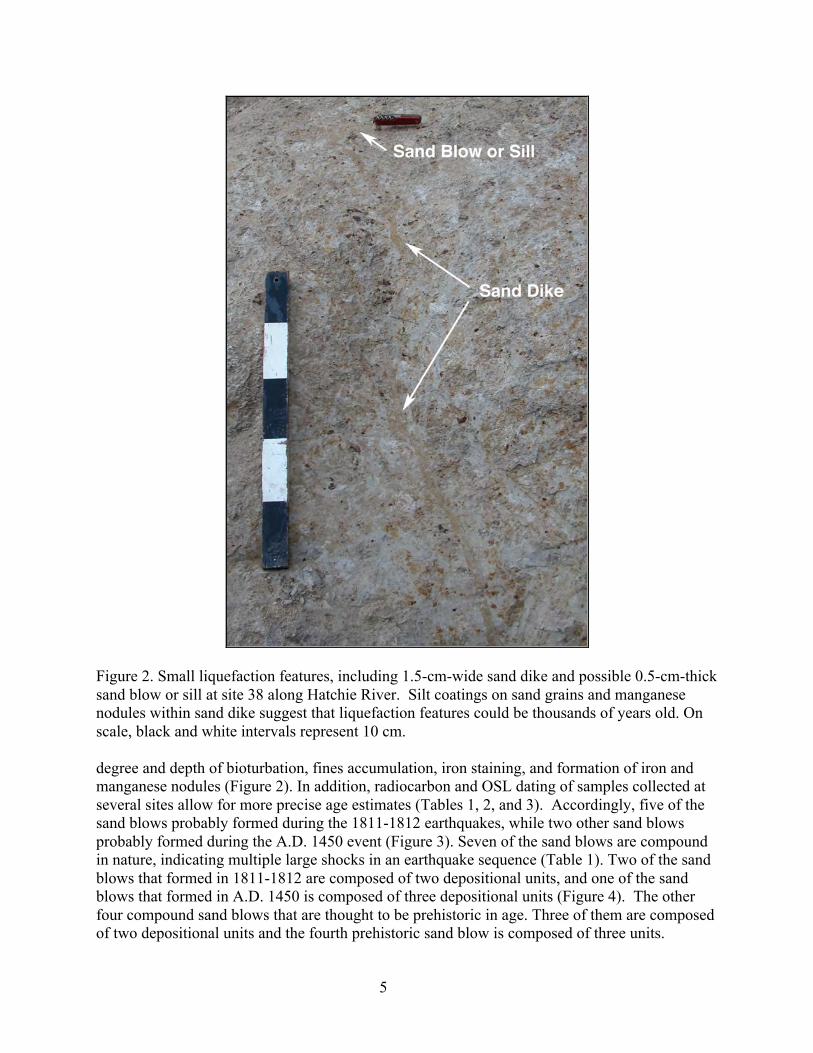
Figure 2. Small liquefaction features, including 1.5-cm-wide sand dike and possible 0.5-cm-thick sand blow or sill at site 38 along Hatchie River. Silt coatings on sand grains and manganese nodules within sand dike suggest that liquefaction features could be thousands of years old. On scale, black and white intervals represent 10 cm.
degree and depth of bioturbation, fines accumulation, iron staining, and formation of iron and manganese nodules (Figure 2). In addition, radiocarbon and OSL dating of samples collected at several sites allow for more precise age estimates (Tables 1, 2, and 3). Accordingly, five of the sand blows probably formed during the 1811-1812 earthquakes, while two other sand blows probably formed during the A.D. 1450 event (Figure 3). Seven of the sand blows are compound in nature, indicating multiple large shocks in an earthquake sequence (Table 1). Two of the sand blows that formed in 1811-1812 are composed of two depositional units, and one of the sand blows that formed in A.D. 1450 is composed of three depositional units (Figure 4). The other four compound sand blows that are thought to be prehistoric in age. Three of them are composed of two depositional units and the fourth prehistoric sand blow is composed of three units.

6
Figure 3. Mottled and iron-stained sand blow and feeder dike at site 105 along Hatchie River probably formed during A.D. 1450 event. OSL dating of sample of contact between sand blow and buried soil or event horizon provides close maximum age constraint of 532 ± 14.9 yr B.P.
As mentioned above, many of the liquefaction features along the Hatchie River are thought to be prehistoric in age. Weathering characteristics of some of these features suggest that they could be thousands of years old. With additional work at selected sites, it may be possible to better constrain the age estimates of older liquefaction features and to determine if they formed during other New Madrid paleoearthquakes (e.g., A.D. 900 and 2350 B.C.) or during paleoearthquakes outside the New Madrid seismic zone. Little River We surveyed a total of 17 km of drainage ditches (#3, #81, and the relief ditch) that follow the Right-Hand Chute of the Little River downstream from Big Lake (Figure 1). The Little River and now the drainage ditches flow along the escarpment of Late Wisconsin braided-stream deposits (Saucier, 1994). The ditches provide almost continuous exposure of Holocene and Late Wisconsin fluvial deposits. Along the Little River ditches, we documented liquefaction features, including 8 sand blows, at 11 sites (Table 1). Sand dikes range up to 184 cm wide and the sand blows range up to 130 cm thick. The liquefaction features in this area are fairly large but not as large as those in the Blytheville-Caruthersville area (Figure 1). There are at least two generations of liquefaction features along the Little River including those that formed in A.D. 1811-1812 and A.D. 1450.

7
Figure 4. Iron-stained compound sand blow at site 31 along Hatchie River probably formed during A.D. 1450 earthquake sequence. Sand blow is 65-cm-thick and composed of three major sedimentary units thought to have formed during three large earthquakes in sequence. Upper 8 cm of sand blow is especially iron-stained and bioturbated and overlain by mottled silt suggesting it is prehistoric in age. Radiocarbon dating of charred material collected 7 cm below sand blow provides close maximum age constraint of A.D. 1280-1410 or 670-540 yr B.P. Load casts and sand diapirs (one of which extends into overlying mottled silt) within sand blow indicate that sand blow deposit reliquefied during later earthquake, probably in A.D. 1811-1812. Two, possibly three, of the eight sand blows probably formed during the 1811-1812 earthquakes, two other sand blows probably formed during the A.D. 1450 event, and yet another sand blow formed sometime between A.D. 800 and 1650 (Table 1). Three of the sand blows are compound in nature. The compound sand blow that formed in A.D. 1811-1812 is composed of 2 depositional units and the one that probably formed in A.D. 1450 is composed of 4 depositional units. The third compound sand blow is prehistoric in age and is composed of 3 depositional units. Our findings along the Little River help to fill the spatial gap in the regional distribution of historic and prehistoric liquefaction features and are consistent with previous findings in northeastern Arkansas and southeastern Missouri (e.g., Tuttle et al., 2002 and 2005; Wolf et al., 2006).

8
Promised Land The Promised Land site is located about 20 km northwest of Marked Tree, Arkansas (Figure 1). At this site, we found a weathered sand blow and related feeder dike exposed in a drainage ditch (Figure 1).
Figure 5. Weathered sand blow and feeder dike at Promised Land site northwest of Marked Tree probably formed during 5.5 kyr event thought to have been centered near Marianna, Arkansas. Radiocarbon dating of sample collected from buried soil provides close maximum age constraint of 5580 yr B.P. The sand blow is 25 cm thick and 70 m long. A 10-cm wide feeder dike was clearly exposed. A second much wider dike was mostly covered by thick vegetation in the ditch. A thick sand loam has developed in the top of the sand blow, but the soil has been disturbed by agricultural practises. Radiocarbon dating of charred material collected from the buried soil within 1.5 cm of the base of the sand blow yielded a 2-sigma calibrated date of 5580-5440 and 5420-5320 yr B.P. (Table 1). The date provides close maximum age constraint for the sand blow and suggests that it formed about 5.45 +/- 0.13 ka. This is older than previously recognized New Madrid

9
paleoearthquakes but is similar in age to the very large (2.45 m thick, 70 m wide, and 230 m long) Daytona Beach sand blow found in the Marianna area (Tuttle et al., 2006). The smaller Promised Land sand blow is probably a more distant feature that formed during the M >7 Marianna earthquake. Additional searches for Early to Middle Holocene sand blows is warranted in this portion of the St. Francis Basin that is underlain by Late Wisconsin valley train deposits (Saucier, 1994). Loosahatchie River We surveyed only 5 km of the Loosahatchie River downriver from the Rt. 388 bridge crossing (Figure 1). Exposure was excellent in river bends. At one site, we found somewhat weathered sand dikes and sills that might be prehistoric in age (Table 3). Unfortunately, we found no organic samples for radiocarbon dating. Additional work is warranted along the Loosahatchie River in order to date liquefaction features and to determine if they are due to earthquakes centered in the NMSZ, near Marianna, Arkansas, or to local earthquakes. Mayfield Creek We surveyed 8 km of Mayfield Creek downriver from the Rt. 121 bridge crossing. Even though we spent only one day on Mayfield Creek, we found two new liquefaction sites (Figure 1). Sand dikes at these sites are very weathered and are probably prehistoric in age. Radiocarbon dating of host deposits at one of the sites suggests that the sand dikes formed in the past 6 kyr (Table 2). Additional work is warranted along Mayfield Creek and in western Kentucky where few paleoseismic studies have been conducted. Wolf River During a previous study by Broughton et al. (2001), liquefaction features had been found along the Wolf River downstream of Collierville. We resurveyed two sections of the river in order to revisit liquefaction sites to collect samples for dating and to look for and document additional liquefaction features that had been exposed since the previous study. The two river sections we resurveyed included 8 km between S. Houston Levee Road and Germantown Parkway and 10 km between Covington Pike and N. McLean Blvd. Unfortunately, exposure was very poor along both sections at the time of our survey. This was probably due to unusually dry weather and no flooding during the previous 6 months that permitted vegetation to cover most of the river banks. One of the previously identified liquefaction sites near the Germantown Parkway was exposed at the time of our survey but the liquefaction features had been removed by cutbank erosion immediately downstream from the bridge. Given the location of the liquefaction features far from the NMSZ and in the vicinity of Memphis, it would be worthwhile to attempt again to relocate the liquefaction sites and collect samples for dating when exposure has been improved by flooding and erosion.

10
Table 1. Results of reconnaissance and age estimates of liquefaction features. Site Location and Number
Longitude Degrees
W
Latitude Degrees N
Thickness of Sand Blows (cm)
Width of Sand Dikes (cm)
Strike and Dip of Sand Dikes
Preliminary Age Estimate of
Features Black River 300 91.00151 36.18703 cracks 301 90.99377 36.20803 Geologic context Castor River 1 89.89629 36.94807 4
2 1
N37°E, vertical N2°E, 10°NW N17°E, 76°SE
Probably prehistoric
2 90.11963 37.16592 9 N13°E, 86°SE Probably historic and prehistoric
3 90.11545 37.16446 80 4
N3°W, 50°SW N17°E, vertical
Probably prehistoric
4 90.17201 37.15759 20, possible 5 N68°W, 85°NE Prehistoric; < 3 ka Cross-County Ditch
1 90.65009 35.36017 10 8
N71°E, 89°NW N62°E, 85°NW
Probably historic
2 90.65232 35.35180 6 3 1
N65°W, 86°NE Probably prehistoric
3 90.65417 35.34446 Geologic context 4 90.67910 35.26814 covered 2
1 1
N67°W, 82°NE Probably historic
Current River
8 90.77130 36.38452 12 4 1
N59°E, 87°NW N89°W, 84°SW
Poorly constrained
9 90.76189 36.40024 slump cracks 10 90.76366 36.40434 Geologic context 11 90.75991 36.40683 2.5
2.5 N13°E, 80°SE N10°E, 85°SE
Probably prehistoric
12 90.76813 36.41293 2 0.8
N17°W, 86°NE N50°W, 87°NE
Probably prehistoric
13 90.76350 36.41822 3 2 0.2
N41°E, 83°NW N85°E, 78°SE N79°W, 83°SW
Probably historic
14 90.75857 36.42184 2.5 N45°E, 87°SE Poorly constrained 15 90.78394 36.49895 possible silt
blow 3 1.5
N45°E, vertical N51°W, 75°NE
Prehistoric; < 5.3 ka
16 90.79211 36.49479 Geologic context Hatchie River
1 89.6150 35.6393 2 N77°E, vertical Poorly constrained 2 89.6138 35.6389 10 11 N88°W, 87°SW Probably prehistoric 3 89.6138 35.6402 14 - 2 units 11, 1.5, 1 N73°W, vertical AD 1811-1812 4 89.6215 35.6444 10, 6 N2°E, 88°W Poorly constrained 5 89.6312 35.6429 5, 2 N6°W, 88°NE
N9°W, 66°SW Prehistoric

11
Table 1 Cont’d. Results of reconnaissance and age estimates of liquefaction features. Site Location and Number
Longitude Degrees
W
Latitude Degrees N
Thickness of Sand Blows (cm)
Width of Sand Dikes (cm)
Strike and Dip of Sand Dikes
Preliminary Age Estimate of
Features Hatchie River
6 89.6415 35.6434 15, 4 N47°E, 76°SE N36°E, 85°SE
Poorly constrained
7 89.6515 35.6462 3, 3, 1.5 N18°E, 85°SE N81°E, 87°SE
Poorly constrained; 2 generations
8 89.6616 35.6295 Geologic context 9 89.6674 35.6335 7 18 N43°W, vertical Poorly constrained 10 89.6667 35.6314 18 96 Prehistoric 11 89.6753 35.6351 14 - 2 units 14 N41°W, vertical Prehistoric 12 89.6787 35.6337 12 4, 1.2, 0.5 N14°W, 67°NE Probably prehistoric 13 89.6796 35.6337 4, 3, 3 N21°W, vertical
N13°E, 69°NW Poorly constrained
14 89.6818 35.6360 10.5 N44°E, vertical Poorly constrained 15 89.6856 35.6365 19 - 3 units 75, 14, 6, 2.5 N24°E, 67°NW
N18°W, 83°NE Probably prehistoric
16 89.6950 35.6436 Geologic context 17 89.7092 35.6385 10 N64°E, 85°NW Probably historic 18 89.7060 35.6375 21 - 2 units 8 N64°E, 85°NW 1811-1812 20 89.8251 35.6045 18 - 1 unit 20 N28°E, 80°NW Prehistoric 21 89.8258 35.6088 12, 6, 4, 3, 2 N13°W, vertical
N59°E, 77°SE Poorly constrained
22 89.8269 35.6118 7 10, 10 N24°E, vertical N74°E, vertical
Poorly constrained
23 89.8236 35.6130 4 N26°W, vertical Poorly constrained 24 89.8238 35.6126 15, 4.5, 2.5, 2,
1.5, 1 Poorly constrained
25 89.82757 35.6021 15 10
N71°W, vertical Poorly constrained
26 89.8295 35.6026 3 N6°W, vertical Poorly constrained 27 89.8347 35.6021 10 17 N56°E, 84°NW Probably prehistoric 28 89.8340 35.6020 7 35 N12°E, 87°SE Prehistoric 29 89.8378 35.6006 11 32 N32°W, 81°NE Poorly constrained 30 89.8376 35.6033 42
24, 9, 8, 6, 3 N37°W, 87°SW Probably prehistoric
31 89.8383 35.6006 65 - 3 units 12 2.5, 2, 2, 1.2
N14°E, vertical
AD 1450
32 89.8395 35.6045 Geologic context 33 89.8430 35.6032 80
5 2.5
N39°E, 82°SE N10°E, vertical N46°E, 85°NW
Probably AD 1811-1812
34 89.60301 35.6239 4 3
N28°W, 80°SW N57°W, 84°SW
Historic
35 89.5754 35.6153 22 5
N82°E, 88°NW N74°E, 68°NW
Poorly constrained
36 89.5760 35.6168 6 1 N88°W, 76°SW AD 1811-1812 37 89.4950 35.5767 16 11 N88°W, 67°SW AD 1811-1812 38 89.5290 35.5985 0.5, possible 1.5 N54°E, vertical Prehistoric

12
Table 1 Cont’d. Results of reconnaissance and age estimates of liquefaction features. Site Location and Number
Longitude Degrees
W
Latitude Degrees N
Thickness of Sand Blows (cm)
Width of Sand Dikes (cm)
Strike and Dip of Sand Dikes
Preliminary Age Estimate of
Features Hatchie River
39 89.5336 35.6028 5 N32°W, 88°NE Historic
40 89.5363 35.6029 9.5 1
N48°W, 86°SW N3°W, 85°NE
AD 1811-1812
41 89.5428 35.6032 3 N67°E, 81°NW Poorly constrained 44 89.4831 35.5655 15 12
9 N21°W, 82°SW N43°W, 78°SW
AD 1811-1812
45 89.4828 35.5649 Covered 3 2
N10°E, 72°NW Historic
100
89.8259 35.6049 2 N20°W, 89°SW Probably prehistoric
101 89.8239 35.6122 17.5 – 2 units 30 10 6 5
N45°W, 86°NE N11°W, 75°NE N32°E, 56°NW N22°E, 84°SE
Probably prehistoric
102 89.8219 35.6167 2.5 N70°E, 89°NW Probably historic 103 89.8194 35.6163 1.5 N20°E, 77°SE Probably prehistoric 104 89.8089 35.6201 6
1 N84°W, 86°SW N40°W, 89°SW
Probably prehistoric
105 89.8033 35.6235 8 23 N60°E, 90° AD 1450 106 89.8060 35.6239 10
10 N15°W, 86°SW N10°W, 82°NE
Probably prehistoric
107 89.8072 35.6242 5 4 3
N24°E, 80°NW N15°E, 70°NW
1811-1812
108 89.8033 35.6281 10 95 N55°E, 86°NW Probably prehistoric 109 89.8029 35.6285 15 14 N34°E, 84°NW Probably prehistoric 110 89.7891 35.6347 5 N54°E, 88°SE Probably prehistoric 111 89.7679 35.6400 2 N50°E, 83°SE Probably prehistoric 112 89.8386 35.6043 4
4 1
N5°W, 87°SW N2°W, 90° N81°E, 83°N
Probably historic
113 89.8460 35.6040 7.5 7.5
N85°W, 85°NE N50°E, 78°NW
Probably prehistoric
114 89.7797 35.6349 7 N2°E, 84°SE Probably historic 115 89.7666 35.6408 11 N68°W, 88°SW Probably prehistoric 116 89.7600 35.6419 20 – 2 units 12
4 3
N36°E, 90° N, 83°W N15°E, 84°SE
Probably prehistoric
200 89.7094 35.6403 2 Not measured Poorly constrained 201 89.7123 35.6409 1.5 N25°W, 48°SW Probably prehistoric 202 89.7185 35.6387 3
2.5 1.5
N60°E, 90° N73°E, 85°SE N62°E, 70°NW
Probably prehistoric; two
generations

13
Table 1 Cont’d. Results of reconnaissance and age estimates of liquefaction features. Site Location and Number
Longitude Degrees
W
Latitude Degrees N
Thickness of Sand Blows (cm)
Width of Sand Dikes (cm)
Strike and Dip of Sand Dikes
Preliminary Age Estimate of
Features Hatchie River
203 89.7331 35.6476 1.5 N85°W, 90° Poorly constrained 204 89.7353 35.6454 16 N55°E, 80°NW Probably historic 205 89.7427 35.6462 2 N20°E, 88°NW Probably prehistoric 206 89.7525 35.6473 8 N85°W, 88°N Probably historic 207 89.8443 35.5991 21
14 N74°E, 82°NW N40°E, 86°NW
Probably historic
208 89.8427 35.5974 15 52 3 2
N25°E, 78°SE
Probably prehistoric
Little River 6 90.12933 35.84353 42 10 N87°E, 84°NW Poorly constrained
(prehistoric) 7 90.13745 35.83794 Covered 50 N77°E, 88°NW 1811-1812 8 90.13936 35.83952 34 50
5 2 1.5
N55°W, vertical N6°E, 82°NW N79°W, 81°NE N72°E, 76°NW
1811-1812
9 90.13371 35.82483 11 44 N18°W, 76°NE AD 1450 10 90.13480 35.83595 184 N58°W, vertical AD 1811-1812 11 90.1428 35.8146 70 4
2 N65°E, 82°NW N45°E, 77°NW
AD 800-1650
12 90.1499 35.7960 110 7 4
N5°E, 90° Probably historic
13 90.1566 35.7918 130 – 2 units 12 4 3
N40°E, 90° AD 1811-1812
14 90.1842 35.7714 80 70 5 4
N12°E, 87°NW
Probably prehistoric And historic
15 90.1637 35.7809 120 – 4 units 45 12 2.5
N36°E, 85°NW N60°W, 43°SW N52°E, 85°NW
Probably AD 1450
16 90.1691 35.7778 80 – 3 units 60 N16°W, 90° Probably prehistoric Loosahatchie River
6 90.0340 35.2493 5 Not measured Probably prehistoric Mayfield Creek
1 89.0169 36.9248 5 N60°E, 85°SE Probably prehistoric 2 89.0305 36.9271 2 N46°E, 85°NW Probably prehistoric Promised Land
1 90.5982 35.6570 25 10 N15°W, 86°NE 5.45 +/- 0.13 ka Wolf River 12 89.9858 35.1918 10 Not measured Poorly constrained

14
Table 2. Results of radiocarbon dating.
Sample # Lab #
13C/12C Ratio
Radiocarbon Age
Yr B.P.1
Calibrated Radiocarbon Age
Yr B.P.2
Calibrated Calendar Date
A.D./B.C.2
Sample Description
Castor River Cst4-C2 -27.0 2830 ± 40 3050-2850 1100-900 BC Charred material 10 cm
below possible sand blow Current River CR15-C3 -27.7 4530 ± 40 5310-5040 3360-3090 BC Charred material from
deposit cut by dikes Hatchie River HR3-C1 Beta-152015
-26.2 90 ± 40 270-180 150-10
0-0
AD 1680-1770 AD 1800-1940 AD 1950-1960
Charred material 7 cm above sand blow
HR10-C1 Beta-152016
-27.7 270 ± 70 490-260 220-140
30-0
AD 1460-1690 AD 1730-1810 AD 1920-1950
Charred material 5 cm above sand blow
HR10-C3 Beta-275671
-24.4 2470 ± 40 2730-2360 780-410 BC Charred material 5 cm above sand blow
HR10-C4 Beta-152017
-24.6 6730 ± 80 7700-7450 5740-5500 BC Charred material 2.5 cm below sand blow
HR10-W1 Beta-275672
-27.4 152.8 ± 0.6 pMC
Modern Modern Wood from buried soil; 7.5 cm below sand blow
HR28-C5 Beta-189964
-25.2 180 ± 40 300-240 230-70
40-0
AD 1650-1710 AD 1730-1810 AD 1920-1950
Charred material 2 cm above sand blow
HR31-C102 Beta-214186
-26.1 640 ± 40 670-540 AD 1280-1410 Charred material 7 cm below sand blow
HR33-C2 Beta-190508
-27.6 340 ± 40 500-300 AD 1450-1650 Organic material 15 cm below dike tip
HR36-C1 Beta-189966
-26.4 150 ± 40 290-0 AD 1660-1950 Charred sample 5 cm below sand blow
HR37-C1 Beta-189967
-27.3 210 ± 40 310-260 220-140
30-0
AD 1640-1690 AD 1730-1810 AD 1920-1950
Charred sample just above sand blow
HR40-C3 Beta-277831
-23.2 1320 ± 40 1300-1180
AD 650-770 Charred material 3 cm below dike tip
HR44-C3 Beta-189968
-25.8 170 ± 40 300-60 40-0
AD 1650-1890 AD 1910-1950
Charred material 2.5 cm below sand blow
HR105-C6 Beta-214189
-26.9 1890 ± 60 1690-1700 10 BC-AD 250 Charred material from host below sand blow
HR105-C8 Beta-214190
-26.8 3340 ± 40 3670-3470 1720-1520 BC Charred material from root cast; 18 cm below sand blow
1 Conventional radiocarbon ages in years B.P. or before present (1950) determined by Beta Analytic, Inc. Errors represent 1 standard deviation statistics or 68% probability. 2 Calibrated age ranges as determined by Beta Analytic, Inc., using the Pretoria procedure (Talma and Vogel, 1993; Vogel et al., 1993). Ranges represent 2 standard deviation statistics or 95% probability.

15
Table 2 Cont’d. Results of radiocarbon dating.
Sample # Lab #
13C/12C Ratio
Radiocarbon Age
Yr B.P.1
Calibrated Radiocarbon Age
Yr B.P.2
Calibrated Calendar Date
A.D./B.C.2
Sample Description
Little River LR3-C2 Beta-275676
-27.6 171.7 ± 0.7 pMC
Modern Modern Charred material, angular, from soil developed in sand blow
LR3-W1 Beta-275677
-25.6 107.4 ± 0.4 pMC
Modern Modern Wood from buried soil below sand blow
LR9-C11 Beta-190510
-26.2 230 ± 40 420-400 320-270 210-140
20-0
AD 1530-1550 AD 1630-1680 AD 1740-1810 AD 1930-1950
Charred material from soil developed in sand blow
LR10-C4 Beta-190512
-24.5 1290 ± 40 1290-1160 AD 660-790 Charred material from silty clay; 5 cm above sand blow
LR10-C2 Beta-190511
-25.3 1270 ± 40 1280-1080 AD 670-870 Charred material from host; 25 cm below sand blow
LR11-C2 Beta-198024
-22.2 1400 ± 40 1350-1270 AD 600-680 Organic sediment from Native American midden; 1 cm below sand blow
LR13-C1 Beta-198026
-25.8 170 ± 40 300-60 40-0
AD 1650-1890 AD 1910-1950
Charred material in soil developed in sand blow
LR15a-C1 Beta-198027
-26.5 970 ± 40 950-780 AD 1000-1170 Charred material from buried soil with Mississippian artifacts; 10 cm below sand blow
LR16-C1 Beta-198028
-27.1 160 ± 40 290-0 AD 1660-1950 Charred material 2 cm above sand blow
Mayfield Creek
MFC1-C2 Beta-275679
-29.0 4980 ± 40 5880-5820 5760-5610
3930-3870 BC 3810-3660 BC
Charcoal, angular, from host; 3 cm above dike tip
MFC1-C3 Beta-277832
-28.2 5640 ± 40 6490-6320 4540-4360 BC Charred material from host; 50 cm below dike tip
Promised Land
PL1-C1+C2 -26.6 4720 ± 40 5580-5440 5420-5320
3630-3490 BC 3470-3370 BC
Charred material from buried soil; 1.5 cm below sand blow
1 Conventional radiocarbon ages in years B.P. or before present (1950) determined by Beta Analytic, Inc. Errors represent 1 standard deviation statistics or 68% probability. 2 Calibrated age ranges as determined by Beta Analytic, Inc., using the Pretoria procedure (Talma and Vogel, 1993; Vogel et al., 1993). Ranges represent 2 standard deviation statistics or 95% probability.

16
Table 3. Results of optically stimulated luminescence dating.
Sample # Cosmic Dose Rate (Gy/ka)1
Total Dose Rate (Gy/ka)2
Equivalent Dose (Gy)3
Age (Yr)4
Sample Description
HR31-1
0.17 ± 0.02
1.81 ± 0.02
0.29 ± 0.01
159 ± 5.45 Upper contact of sand blow
HR31-2
0.17 ± 0.02
0.74 ± 0.01
1.05 ± 0.05
1425 ± 68.5 Lower contact of sand blow
HR105-1
0.17 ± 0.02
2.27 ± 0.02
0.38 ± 0.01
165 ± 5.23 Upper contact of sand blow
HR105-2
0.17 ± 0.02
2.05 ± 0.02
1.09 ± 0.03
532 ± 14.9 Lower contact of sand blow
Evaluation of Scenario Earthquakes We acquired borehole logs from the Arkansas, Missouri, and Tennessee Departments of Transportation for bridge crossings of the Black, Cache, Current, Hatchie, and White Rivers, and Cross County Ditch in the areas where we had found liquefaction features (Figure 1). We reviewed the logs, selected representative sandy layers that occur below the water table, and compiled data for liquefaction potential analysis (Appendix: Tables A-1 to A-8). Using these data and the revised simplified procedure of Seed and Idriss (1982) and Youd and Idriss (1997), we evaluated whether or not several scenario earthquakes would be likely to induce liquefaction in fluvial sediments along the rivers and ditches and compared these results to field observations (Tables 4 and 5; Appendix: Tables A-1 to A-8). It would be preferable to use geotechnical data collected at liquefaction sites along these rivers, but these data are not currently available. Similarities in the size and distribution of historic and prehistoric liquefaction features across the New Madrid region suggest that prehistoric earthquakes were similar to the three largest earthquakes in the 1811-1812 New Madrid sequence (Tuttle et al., 2002). Therefore, the scenario earthquakes we evaluated include the December 16, 1811, January 23, 1812, and February 7, 1812 mainshocks. For these earthquakes, we used the estimated magnitudes from three different studies (M 8.1, 7.8, and 8.0 from Johnston, 1996; M 7.2, 7.0, and 7.4 from Hough et al., 2000; and M 7.6, 7.5, and 7.8 from Bakun and Hopper, 2004). The December 16, January 23, and February 7 earthquakes are thought to have been centered near Blytheville, Arkansas, New Madrid, Missouri, and Caruthersville, Missouri, respectively (Figure 1; Johnston and Schweig, 1996). Distances were measured between inferred epicenters of the historic earthquakes and the bridge crossings. In addition, we evaluated smaller magnitude earthquakes, such as the January 5, 1843 shock (M 6.3-6.5) thought to be centered near Marked Tree, Arkansas, and also local earthquakes in close proximity to the liquefaction sites. For the local events, we assume a distance of 10 km and evaluate several magnitudes (e.g., M 5.25, 5.5, and 6.0). Peak ground accelerations for the earthquakes were derived from ground-motion relations developed for the central United States (Toro et al., 1997). 1 Cosmic doses and attenuation with depth calculated using the methods of Prescott and Hutton (1994). 2 Total dose rate is measured from 20-25% water content. 3 Reported to one sigma, fit to an exponential plus linear regression, and calculated as a weighted mean. 4 Analysis performed on fine sand grain (150-125 micron size).

17
Western Lowlands and St. Francis Basin Results of the liquefaction potential analysis suggest that the December 16, 1811 earthquake, if it were of M 7.2, would induce liquefaction in the Western Lowlands along the Cache and Current Rivers and possibly along the Black River at Jacksonport, Arkansas, but not along the Black River at Elgin Ferry, the White River, or along Cross County Ditch in the St. Francis Basin (Table 4; Appendix). If the December 16 earthquake were of M 8.1, it probably would induce liquefaction along all of the rivers studied. The analysis also suggests that the January 23, 1812 earthquake, if it were of M 7.0, probably would not induce liquefaction along any of the rivers (Table 4). Neither of the last two scenarios would account for field observations of liquefaction features. The February 7, 1812 event, if it were of M 7.5, would induce liquefaction along the Cache and Current Rivers, possibly along the White River, but probably not along the Black River or Cross County Ditch (Table 4). Except for Cross County Ditch where liquefaction features have been found, the results for the M 7.2 December 16 and M 7.5 February 7 events closely matches field observations. An earthquake like the January 5, 1843 earthquake, if it were of M 6.5, could produce liquefaction along Cross County Ditch (Table 4). Table 4. Summary of field observations and results of liquefaction potential analysis for sites in the Western Lowlands and St. Francis Basin.
Field Observations
December 16, 1811
January 23, 1812
February 7, 1812
January 5, 1843 Borehole Location
(River/Town) M 7.2 M 8.1 M 7.0 M 7.5 M 6.3 M 6.5
Black River/ Elgin
N N L N N NA NA
Black River/ Jacksonport
N M L N N NA NA
Cache River/ Light
L L L N L NA NA
Cross County Ditch/ Birdseye
L N L N N N L
Current River/ Reyno
L L L N L NA NA
White River/ Jacksonport
N N L N M NA NA
L-Liquefaction; M-Marginal liquefaction; N-No liquefaction; NA-analysis not performed. Liquefaction analysis performed for sites in the Western Lowlands and in the St. Francis Basin suggests that the field observations in these areas could be explained by earthquakes similar to the December 16, 1811, February 7, 1812, and January 5, 1843 earthquakes, if they were of M 7.2, 7.5, and 6.5, respectively. We have not yet evaluated if the field observations could be explained by earthquakes like the December 16 and February 7 mainshocks alone if they were of M 7.6 and 7.8, respectively.

18
Hatchie River We also evaluated whether or not several scenario earthquakes would be likely to induce liquefaction in fluvial sediments along the Hatchie River where we found both historic and prehistoric liquefaction features. The analysis was performed using borehole data from the Route 51 bridge crossing of the Hatchie River north of Covington. The liquefaction analysis suggests that the December 16, 1811 earthquake, if it were of M 7.2, would induce liquefaction in about half of the layers of sediment we considered (Table 5; Appendix). If the earthquake were of M 7.6, however, almost all the layers would liquefy. Therefore, the December 16th mainshock is much more likely to have produced liquefaction features in the area if it were on the order of M 7.6. The analysis also suggests that the January 23, 1812 mainshock, whether of M 7.0, 7.5, or 7.8, was located too far away to induce liquefaction along the Hatchie River (Table 5). The February 7, 1812 earthquake probably would not have induced liquefaction unless it were on the order of M 7.8. In addition, the analysis suggests that a hypothetical local earthquake would have to be at least M 5.5 to induce liquefaction at the Route 51 bridge crossing of the Hatchie River (Table 5). Table 5. Summary of field observations and results of liquefaction potential analysis for Hatchie River in western Tennessee.
Field Observations
December 16, 1811
January 23, 1812
February 7, 1812
Hypothetical Local Event
Borehole Location
(River/Town) M 7.2 M 7.6 M 7.0, 7.5, 7.8 M 7.8 M 5.5
Hatchie River/ N. Covington
L L/N L N L L
L-Liquefaction; M-Marginal liquefaction; N-No liquefaction.. Liquefaction analysis performed for the Route 51 bridge crossing of the Hatchie River suggests that field observations could be explained by earthquakes similar to the December 16, 1811 and February 7, 1812, mainshocks if they were of M 7.6 and 7.8, respectively. The analysis also suggests that earthquakes similar to the January 23, 1812 mainshock would have been located too far away to induce liquefaction in this area, even if it were of M 7.8. A compound sand blow thought to have formed during the 1811-1812 earthquake sequence occurs at site 3 located less than 1 km from the Route 51 bridge crossing. The compound sand blow is composed of two sedimentary units suggesting that it formed as the result of liquefaction induced by two large earthquakes in a sequence. This is consistent with liquefaction potential analysis that predicts the formation of the compound sand blow during the December 16 and February 7 earthquakes if they were on the order of M 7.6 and 7.8, respectively. Another 1811-1812 sand blow at site 18, downstream from site 3, is also composed of two sedimentary units. Conclusions During the course of this study, earthquake-induced liquefaction features were discovered, documented, measured, and their ages estimated with varying degrees of uncertainty along the Castor River in southeastern Missouri, the Little River in northeastern Arkansas, Mayfield Creek in western Kentucky, and the Hatchie, Loosahatchie, and Wolf Rivers in western Tennessee.

19
The search for liquefaction features involved reconnaissance along 144 km of river length and resulted in the discovery of liquefaction features, including 34 sand blows, at more than 100 new sites. Although the limit of liquefaction has not yet been delineated, the liquefaction features we found along the Castor and Hatchie Rivers and Mayfield Creek enlarge the liquefaction fields for the A.D. 1811-1812 and A.D. 1450 New Madrid earthquakes. Many of the liquefaction features are thought to be prehistoric in age and warrant additional study to better constrain their age estimates. By doing so, it may be possible to extend the chronology of New Madrid earthquakes farther back in time and to develop earthquake chronologies for sources outside the NMSZ such as the Marianna source in east-central Arkansas and the Eastern Reelfoot Rift Margin fault in western Tennessee. Compound sand blows on the Hatchie and Little Rivers, including up to 4 depositional units, formed during the A.D. 1811-1812 and 1450, and possibly earlier New Madrid earthquake sequences. The locations, ages, and number of depositional units of these compound sand blows will help to further define liquefaction fields and thus the source areas and magnitudes of earthquakes within each sequence. Liquefaction potential analysis was conducted for sites along the Black, Cache, Current, and White Rivers in the Western Lowlands, the Cross County Ditch in the St. Francis Basin, and the Hatchie River in western Tennessee. Although the analysis was performed for a limited area, results suggest that liquefaction features along these rivers can be explained by earthquakes similar in locations and magnitudes (M >7) to the 1811-1812 New Madrid mainshocks. The weathered ~5.5 ka sand blow at the Promised Land site northwest of Marked Tree, Arkansas is a significant discovery and probably formed during a M >7 earthquake centered near Marianna, Arkansas about 80 km to the south. It suggests that the liquefaction field produced by the 5.5 kyr B.P. Marianna earthquake is quite large which it should be if it were produced by a very large earthquake. It also suggests that a record of paleoearthquakes is available in the Late Wisconsin deposits of the western portion of the St. Francis Basin and could shed light on the long-term behavior of the NMSZ and other earthquake sources in the region. In the future, we hope to improve age estimates of liquefaction features particularly at sites outside the NMSZ proper, to evaluate additional earthquake scenarios incorporating new attenuation relations in our liquefaction potential analysis, and to use the results to better constrain locations and magnitudes of earthquakes generated by the NMSZ and sources outside the NMSZ. References Cited Al-Shukri, H., Mahdi, H. and Tuttle, M., 2006, Three-dimensional imaging of earthquake-
induced liquefaction features with ground penetrating radar near Marianna, Arkansas, Seismological Research Letters, v. 77, p. 505-513.

20
Bakun, W. H., and Hooper, M. G., 2004, Magnitudes and locations of the 1811-1812 New Madrid, Missouri, and Charleston, South Carolina, Earthquakes, Bulletin of the Seismological Society of America, v. 94, n. 1, p. 64-75.
Broughton, A., Van Arsdale, R., and Broughton, J., 2001, Liquefaction susceptibility mapping in the City of Memphis and Shelby County, Tennessee, Engineering Geology, v. 62, p. 207-222.
Frankel, A. D., Petersen, M. D., Mueller, C. S., Haller, K. M., Wheeler, R. L., Leyendecker, E. V., Wesson, R. L., Harmsen, S. C., Cramer, C. H., Perkins, D. M., and Rukstales, K. S., 2002, Documentation for the 2002 update of the National Seismic Hazard Maps, U.S. Geological Survey Open-File Report 02-420, 33 p.
Hough, S. E., J. G. Armbruster, L. Seeber, and J. F. Hough, 2000, On the modified Mercalli intensities and magnitudes of the 1811-1812 New Madrid, Journal of Geophysical Research, v. 105, p. 23,839-23,864.
Johnston, A. C., 1996, Seismic moment assessment of stable continental earthquakes, Part III: 1811-1812 New Madrid, 1886 Charleston and 1755 Lisbon, Geophysical Journal International, v. 126, p. 314-344.
Johnston, A.C., and Schweig, E.S., 1996, The enigma of the New Madrid earthquakes of 1811-1812, Annual Review of Earth and Planetary Sciences, v. 24, p. 339-384.
Obermeier, S. F., 1989, The New Madrid Earthquakes: An engineering-geologic interpretation of relict liquefaction features, US Geological Survey, Professional Paper 1336-B, 114 p.
Petersen, M. D., Frankel, Harmsen, S. C., A. D., Mueller, C. S., Haller, K. M., Wheeler, R. L., Wesson, Zeng, Y., Boyd, O. S., Perkins, D. M., Luco, N., Field, E. H., Wills, C. J., and Rukstales, K. S., 2008, Documentation for the 2008 update of the United States National Seismic Hazard Maps, U.S. Geological Survey Open-File Report 2008-112B, 59 p.
Prescott, J. R., and Hutton, J. T., 1994, Cosmic ray contribution to dose rates for luminescence and ERS dating: large depth and long-term time variations, Radiation measurements v. 23, p. 497-500.
Saucier, R. T., 1994, Geomorphology and Quaternary geologic history of the lower Mississippi, U.S. Army Corps of Engineers Waterways Experiment Station, v. I and II, 364 p. and 28 plates.
Seed, H. B., and Idriss, I. M., 1982, Ground motions and soil liquefaction during earthquakes, Earthquake Engineering Research Institute, Berkley, 134 p.
Talma, A. S., Vogel, J. C., 1993, A simplified approach to calibrating C14 dates, Radiocarbon v. 35, p. 317-322.
Toro, G. R., Abrahamson, N. A., and Schneider, J. F., 1997, Model of strong ground motions from earthquakes in central and eastern North America: Best estimates and uncertainties. Seismological Research Letters, v. 68 n. 1, p. 41-57.
Tuttle (see below). Vogel, J. C., Fuls, A., Visser, E., Becker, B., 1993, Pretoria calibration curve for short-lived
samples, Radiocarbon v. 33, p. 73-86. Wolf, L. W., Tuttle, M. P., Browning, S., and Park, S., 2006, Geophysical surveys of earthquake-
induced liquefaction deposits in the New Madrid seismic zone, Geophysics, v. 71, n. 6, p. B223-230.
Youd, T. L., and Idriss, I.M. (eds.), 1997, Evaluation of liquefaction resistence of soils, National Center for Earthquake Engineering and Research, Technical Report NCEER-97-0022, 40 p.

21
Bibliography of Related Publications Al-Shukri, H., Mahdi, H. and Tuttle, M., 2006, Three-dimensional imaging of earthquake-
induced liquefaction features with ground penetrating radar near Marianna, Arkansas, Seismological Research Letters, v. 77, p. 505-513.
Atwater, B.F., Tuttle, M.P., Schweig, E., Rubin, C.M., Yamaguchi, D.K., and Hemphill-Haley, E., 2003, Earthquake history from paleoseismology, in Gillespie A., Atwater B.F., eds., The Quaternary of the United States, International Union of Quaternary Scientists (INQUA) review volume, Elsevier, p. 331-350.
Tuttle, M. P., 1999, Late Holocene earthquakes and their implications for earthquake potential of the New Madrid seismic zone, central United States, Ph.D. dissertation, University of Maryland, 250 p.
Tuttle, M. P., 2001, The use of liquefaction features in paleoseismology: Lessons learned in the New Madrid seismic zone, central United States, Journal of Seismology, v. 5, p. 361-380.
Tuttle, M. P., 2005, New Madrid in motion, Nature, v. 435, p. 1037-1039. Tuttle, M. P., Schweig, E. S., Sims, J. D., Lafferty, R. H., Wolf, L. W., and Haynes, M. L., 2002,
The earthquake potential of the New Madrid seismic zone, Bulletin of the Seismological Society of America, v. 92, n. 6, p. 2080-2089.
Tuttle, M. P., Schweig, E., III, Campbell, J., Thomas, P. M., Sims, J. D., and Lafferty, R. H., III, 2005, Evidence for New Madrid earthquakes in A.D. 300 and 2350 B.C., Seismological Research Letters, v. 76, n. 4, p. 489-501.
Tuttle, M. P., Al-Shukri, H, and Mahdi, H., 2006, Very large earthquakes centered southwest of the New Madrid seismic zone 5,000-7,000 years ago, Seismological Research Letters, v. 77, n. 6, p. 664-678.
Tuttle, M. P., Lafferty, R. H., Cande, R. F., and Sierzchula, M. C., 2010, Impact of earthquake-induced liquefaction and related ground failure on a Mississippian archeological site in the New Madrid seismic zone, central USA, submitted to paleoseismology-archeoseismology issue of Quaternary International, 25 p.
Wolf, L. W., Tuttle, M. P., Browning, S., and Park, S., 2006, Geophysical surveys of earthquake-induced liquefaction deposits in the New Madrid seismic zone, Geophysics, v. 71, n. 6, p. B223-230.
Contact Information and Data Availability Dr. Martitia P. Tuttle, Telephone: 207-371-2007, Email: [email protected].

22
Appendix
Evaluation of Scenario Earthquakes Using Liquefaction Potential Analysis

Tabl
e A-1
a. R
esul
ts o
f liq
uefa
ctio
n po
tent
ial a
naly
sis f
or D
ecem
ber
16, 1
811
eart
hqua
ke o
f M 7
.2.
Site
/M
agni
tude
am
axD
epth
toD
escr
iptio
n of
Blo
w
Cyc
licR
esul
ts1
Bor
ehol
e@
Dis
tanc
eSu
scep
tible
Susc
eptib
le S
edim
ent
Cou
ntSt
ress
(km
)Se
dim
ent (
ft)
N1(
60)
Rat
ioB
lack
Riv
er @
7.2@
118
0.07
020
Wet
, med
ium
den
se, g
ray
sand
130.
042
NEl
gin
Ferr
y/1
7.2@
118
0.07
025
Wet
, med
ium
den
se, g
ray
sand
110.
044
N/6
7.2@
118
0.07
010
Wet
, loo
se b
row
n fin
e sa
nd8
0.04
2N
7.2@
118
0.07
015
Wet
, med
ium
den
se, g
ray
and
brow
n si
lty sa
nd7
0.04
8N
7.2@
118
0.07
020
Wet
, med
ium
den
se, g
ray
and
brow
n si
lty sa
nd
100.
051
Nw
ith sc
atte
red
orga
nic
mat
ter
7.2@
118
0.07
025
Wet
, med
ium
den
se, g
ray
and
brow
n si
lty sa
nd
90.
053
Nw
ith sc
atte
red
orga
nic
mat
ter
7.2@
118
0.07
050
Wet
, med
ium
den
se, g
ray
sand
and
gra
vel
90.
047
Nw
ith o
rgan
ic m
ater
ial
/77.
2@11
80.
070
10W
et, m
ediu
m d
ense
, gra
y si
lty sa
nd a
nd g
rave
l 3
0.04
2N
with
som
e or
gani
c m
ater
ial (
woo
d)7.
2@11
80.
070
15W
et, m
ediu
m d
ense
, gra
y si
lty sa
nd a
nd g
rave
l 5
0.04
8N
with
som
e or
gani
c m
ater
ial (
woo
d)7.
2@11
80.
070
20W
et, m
ediu
m d
ense
, gra
y si
lty sa
nd a
nd g
rave
l 13
0.05
1N
with
som
e or
gani
c m
ater
ial (
woo
d)7.
2@11
80.
070
30W
et, m
ediu
m d
ense
, gra
y si
lty sa
nd a
nd g
rave
l12
0.05
3N
7.2@
118
0.07
040
Wet
, med
ium
den
se, g
ray
silty
sand
and
gra
vel
140.
051
Nw
ith o
rgan
ic m
ater
ial
/97.
2@11
80.
070
15W
et, l
oose
, gra
y si
lty sa
nd4
0.04
8N
7.2@
118
0.07
025
Wet
, loo
se, g
ray
and
brow
n sa
nd si
lty sa
nd5
0.05
3N
7.2@
118
0.07
035
Wet
, med
ium
den
se, g
ray
sand
and
gra
vel
110.
052
N7.
2@11
80.
070
45W
et, m
ediu
m d
ense
, gra
y sa
nd a
nd g
rave
l9
0.04
9N
Bla
ck R
iver
7.
2@12
00.
070
15W
et lo
ose,
bro
wn
silty
sand
50.
071
NJa
ckso
npor
t@SH
697.
2@12
00.
070
20W
et, l
oose
, bro
wn
silty
sand
30.
070
L/1

Tabl
e A-1
a. C
on't
Site
/M
agni
tude
am
axD
epth
toD
escr
iptio
n of
Blo
w
Cyc
licR
esul
ts1
Bor
ehol
e@
Dis
tanc
eSu
scep
tible
Susc
eptib
le S
edim
ent
Cou
ntSt
ress
(km
)Se
dim
ent (
ft)
N1(
60)
Rat
ioB
lack
Riv
er7.
2@12
00.
070
25W
et, l
oose
, bro
wn
silty
sand
100.
068
NJa
ckso
npor
t@SH
697.
2@12
00.
070
30W
et, m
ediu
m d
ense
, gra
y sa
nd a
nd g
rave
l14
0.06
6N
7.2@
120
0.07
035
Wet
, med
ium
den
se, g
ray
sand
and
gra
vel
100.
063
N7.
2@12
00.
070
45W
et, m
ediu
m d
ense
, gra
y sa
nd13
0.05
7N
/47.
2@12
00.
070
30W
et, l
oose
, gra
y sa
nd w
ith so
me
orga
nic
mat
ter
60.
066
N7.
2@12
00.
070
40W
et, m
ediu
m d
ense
, gra
y sa
nd
60.
060
N/5
7.2@
120
0.07
015
Wet
, loo
se, b
row
n si
lty sa
nd8
0.07
1N
7.2@
120
0.07
020
Wet
, loo
se, b
row
n si
lty sa
nd10
0.07
0N
7.2@
120
0.07
030
Wet
, med
ium
den
se, g
ray
sand
130.
066
N7.
2@12
00.
070
40W
et, m
ediu
m d
ense
, gra
y sa
nd a
nd g
rave
l13
0.06
0N
/67.
2@12
00.
070
18W
et, v
ery
loos
e, g
ray
sand
20.
071
L7.
2@12
00.
070
25W
et, m
ediu
m d
ense
, gra
y sa
nd4
0.06
8M
/NC
ache
Riv
er @
7.2@
750.
130
15W
et, v
ery
loos
e, g
ray
sand
30.
075
LU
S 41
2/1
7.2@
750.
130
20W
et, m
ediu
m d
ense
, gra
y sa
nd w
ith tr
aces
of p
ea g
rave
l8
0.08
2N
7.2@
750.
130
25W
et, m
ediu
m d
ense
, gra
y sa
nd9
0.08
5N
7.2@
750.
130
30W
et, m
ediu
m d
ense
, gra
y sa
nd13
0.08
7N
7.2@
750.
130
35W
et, m
ediu
m d
ense
, gra
y sa
nd8
0.08
7N
7.2@
750.
130
40W
et, m
ediu
m d
ense
, gra
y sa
nd14
0.08
5N
7.2@
750.
130
45W
et, m
ediu
m d
ense
, gra
y sa
nd w
ith tr
aces
of c
lay
and
grav
el7
0.08
3N
/27.
2@75
0.13
015
Wet
, loo
se, g
ray
sand
50.
092
L7.
2@75
0.13
020
Wet
, loo
se, g
ray
sand
120.
097
N7.
2@75
0.13
025
Wet
, med
ium
den
se, g
ray
sand
170.
099
N7.
2@75
0.13
030
Wet
, med
ium
den
se, g
ray
sand
with
som
e gr
avel
80.
099
L7.
2@75
0.13
035
Wet
, med
ium
den
se, g
ray
sand
with
trac
es o
f gra
vel
120.
097
N7.
2@75
0.13
040
Wet
, loo
se, g
ray
sand
and
gra
vel
60.
095
L

Tabl
eA-1
a. C
on't
Site
/M
agni
tude
am
axD
epth
toD
escr
iptio
n of
Blo
w
Cyc
licR
esul
ts1
Bor
ehol
e@
Dis
tanc
eSu
scep
tible
Susc
eptib
le S
edim
ent
Cou
ntSt
ress
(km
)Se
dim
ent (
ft)
N1(
60)
Rat
ioC
ache
Riv
er7.
2@75
0.13
045
Wet
, med
ium
den
se, g
ray
sand
with
trac
es o
f gra
vel
100.
092
N/3
7.2@
750.
130
15W
et, l
oose
, gra
y sa
nd w
ith so
me
orga
nic
mat
ter
80.
098
N7.
2@75
0.13
020
Wet
, ver
y lo
ose,
gra
y sa
nd w
ith tr
aces
of c
lay
30.
102
Lan
d or
gani
c m
atte
r7.
2@75
0.13
025
Wet
, med
ium
den
se, g
ray
sand
with
trac
es o
f lig
nite
100.
104
N7.
2@75
0.13
030
Wet
, med
ium
den
se, g
ray
sand
with
trac
es o
f lig
nite
50.
103
L7.
2@75
0.13
035
Wet
, loo
se, g
ray
sand
with
trac
es o
f cla
y8
0.10
1M
/N7.
2@75
0.13
040
Wet
, med
ium
den
se, g
ray
sand
with
cla
y se
ams
90.
098
N7.
2@75
0.13
045
Wet
, med
ium
den
se, g
ray
sand
with
trac
es o
f lig
nite
and
gra
vel
100.
094
N/4
7.2@
750.
130
19W
et, l
oose
, bro
wn
sand
40.
095
L7.
2@75
0.13
015
Wet
med
ium
den
se, g
ray
sand
150.
090
N7.
2@75
0.13
020
Wet
, med
ium
den
se, g
ray
sand
with
trac
es o
f gra
vel
120.
095
N7.
2@75
0.13
025
Wet
, loo
se, g
ray
sand
with
trac
es o
f lig
nite
70.
098
L7.
2@75
0.13
030
Wet
, med
ium
den
se, g
ray
sand
with
trac
es o
f pea
14
0.09
8N
grav
el a
nd li
gnite
7.2@
750.
130
35W
et, l
oose
to m
ediu
m d
ense
, san
d w
ith so
me
ligni
te4
0.09
6L
7.2@
750.
130
45W
et, l
oose
, gra
y sa
nd w
ith tr
aces
of l
igni
te6
0.09
1L
Cro
ss C
ount
ry7.
2@93
0.10
015
Fine
, bro
wn
sand
, wet
170.
066
ND
itch
@ S
H 4
27.
2@93
0.10
020
Fine
, gra
y sa
nd15
0.07
1N
/522
27.
2@93
0.10
025
Fine
, gra
y, w
ater
bea
ring
sand
, med
ium
com
pact
ion
190.
073
N/5
223-
17.
2@93
0.10
015
Fine
, gra
y sa
nd, w
et15
0.56
0N
7.2@
930.
100
20Fi
ne, g
ray,
wat
er b
earin
g sa
nd, m
ediu
m c
ompa
ctio
n15
0.06
3N
/522
3-4
7.2@
930.
100
26Fi
ne, g
ray
sand
, wet
90.
052
N7.
2@93
0.10
030
Fine
, gra
y, w
ater
bea
ring
sand
, med
ium
com
pact
ion
70.
054
NC
urre
nt R
iver
@7.
2@80
0.12
225
Wet
, med
ium
den
se, g
ray
sand
150.
097
NSH
328
/17.
2@80
0.12
230
Wet
, med
ium
den
se, g
ray
sand
110.
097
N

Tabl
e A-1
a. C
on't
Site
/M
agni
tude
am
axD
epth
toD
escr
iptio
n of
Blo
w
Cyc
licR
esul
ts1
Bor
ehol
e@
Dis
tanc
eSu
scep
tible
Susc
eptib
le S
edim
ent
Cou
ntSt
ress
(km
)Se
dim
ent (
ft)
N1(
60)
Rat
ioC
urre
nt R
iver
@7.
2@80
0.12
235
Wet
, med
ium
den
se, g
ray
grav
elly
sand
with
org
anic
mat
ter
120.
095
NSH
328
/17.
2@80
0.12
245
Wet
, med
ium
den
se, g
ray
grav
elly
sand
with
org
anic
mat
ter
110.
089
N/2
7.2@
800.
122
15W
et, l
oose
, bro
wn
fine
sand
90.
098
N7.
2@80
0.12
220
Wet
, med
ium
den
se, b
row
n sa
nd12
0.10
2N
7.2@
800.
122
25W
et, m
ediu
m d
ense
, bro
wn
sand
180.
102
N7.
2@80
0.12
230
Wet
, med
ium
den
se, b
row
n to
gra
y sa
nd w
ith o
rgan
ic m
atte
r13
0.10
1N
7.2@
800.
122
35W
et, m
ediu
m d
ense
, bro
wn
to g
ray
sand
with
org
anic
mat
ter
90.
098
N7.
2@80
0.12
245
Wet
, med
ium
den
se, g
ray
sand
and
gra
vel
100.
091
N/3
7.2@
800.
122
10W
et, l
oose
, gra
y fin
e sa
nd7
0.97
0L
7.2@
800.
122
20W
et, l
oose
, gra
y fin
e sa
nd9
0.10
7M
/N7.
2@80
0.12
225
Wet
, med
ium
den
se, g
ray
sand
130.
107
N7.
2@80
0.12
230
Wet
, med
ium
den
se, g
ray
sand
100.
105
N7.
2@80
0.12
235
Wet
, med
ium
den
se, b
row
n an
d gr
ay g
rave
lly sa
nd11
0.10
2N
/47.
2@80
0.12
210
Wet
, loo
se, b
row
n sa
nd10
0.09
7N
7.2@
800.
122
20W
et, l
oose
, bro
wn
sand
70.
107
L7.
2@80
0.12
225
Wet
, med
ium
den
se, b
row
n an
d gr
ay sa
nd9
0.10
7N
7.2@
800.
122
30W
et, m
ediu
m d
ense
, bro
wn
and
gray
gra
velly
sand
160.
105
Nw
ith o
rgan
ic m
atte
r7.
2@80
0.12
235
Wet
, med
ium
den
se, b
row
n an
d gr
ay g
rave
ly sa
nd11
0.10
2N
with
org
anic
mat
ter
7.2@
800.
122
45W
et, m
ediu
m d
ense
, bro
wn
and
gray
sand
and
gra
vel
100.
094
N/8
7.2@
800.
122
15W
et, m
ediu
m d
ense
, gra
y sa
nd
80.
090
N7.
2@80
0.12
220
Wet
, med
ium
den
se, g
ray
sand
8
0.06
1N
/10
7.2@
800.
122
15W
et, m
ediu
m d
ense
to lo
ose,
bro
wn
fine
sand
70.
105
L7.
2@80
0.12
220
Wet
, med
ium
den
se to
loos
e, b
row
n fin
e sa
nd8
0.10
7L
7.2@
800.
122
25W
et, m
ediu
m d
ense
, gra
y gr
avel
ly sa
nd16
0.10
7N

Tabl
e A-1
a. C
on't
Site
/M
agni
tude
am
axD
epth
toD
escr
iptio
n of
Blo
w
Cyc
licR
esul
ts1
Bor
ehol
e@
Dis
tanc
eSu
scep
tible
Susc
eptib
le S
edim
ent
Cou
ntSt
ress
(km
)Se
dim
ent (
ft)
N1(
60)
Rat
ioC
urre
nt R
iver
@7.
2@80
0.12
235
Wet
, med
ium
den
se, g
ray
grav
elly
sand
130.
102
NSH
328
/10
7.2@
800.
122
40W
et, m
ediu
m d
ense
, gra
y gr
avel
ly sa
nd13
0.09
8N
7.2@
800.
122
45W
et, m
ediu
m d
ense
, gra
y gr
avel
ly sa
nd13
0.09
4N
Whi
te R
iver
@7.
2@12
00.
070
35W
et, m
ediu
m d
ense
, gra
y fin
e sa
nd4
0.05
7N
SH 6
7/1
7.2@
120
0.07
040
Wet
, med
ium
den
se, f
ine
sand
90.
055
N7.
2@12
00.
070
50W
et, m
ediu
m d
ense
, bro
wn
sand
and
gra
vel
70.
050
N/4
7.2@
120
0.07
010
Wet
, loo
se, b
row
n si
lty sa
nd7
0.05
2N
7.2@
120
0.07
025
Wet
, loo
se, b
row
n cl
ayey
sand
30.
059
M/N
L- li
quef
actio
nM
- mar
gina
l liq
uefa
ctio
nN
- liq
uefa
ctio
n no
t lik
ely

Tabl
e A-1
b. R
esul
ts o
f liq
uefa
ctio
n po
tent
ial a
naly
sis f
or D
ecem
ber
16, 1
811
eart
hqua
ke o
f M 8
.1.
Site
/M
agni
tude
am
axD
epth
toD
escr
iptio
n of
Blo
w
Cyc
licR
esul
ts1
Bor
ehol
e@
Dis
tanc
eSu
scep
tible
Susc
eptib
le S
edim
ent
Cou
ntSt
ress
(km
)Se
dim
ent (
ft)
N1(
60)
Rat
ioB
lack
Riv
er @
8.1@
118
0.14
420
Wet
, med
ium
den
se, g
ray
sand
130.
086
NEl
gin
Ferr
y/1
8.1@
118
0.14
425
Wet
, med
ium
den
se, g
ray
sand
110.
090
N/6
8.1@
118
0.14
410
Wet
, loo
se b
row
n fin
e sa
nd8
0.08
6L
8.1@
118
0.14
415
Wet
, med
ium
den
se, g
ray
and
brow
n si
lty sa
nd7
0.09
9L
8.1@
118
0.14
420
Wet
, med
ium
den
se, g
ray
and
brow
n si
lty sa
nd
100.
105
Lw
ith sc
atte
red
orga
nic
mat
ter
8.1@
118
0.14
425
Wet
, med
ium
den
se, g
ray
and
brow
n si
lty sa
nd
90.
108
Lw
ith sc
atte
red
orga
nic
mat
ter
8.1@
118
0.14
450
Wet
, med
ium
den
se, g
ray
sand
and
gra
vel
90.
096
Lw
ith o
rgan
ic m
ater
ial
/78.
1@11
80.
144
10W
et, m
ediu
m d
ense
, gra
y si
lty sa
nd a
nd g
rave
l 3
0.08
6L
with
som
e or
gani
c m
ater
ial (
woo
d)8.
1@11
80.
144
15W
et, m
ediu
m d
ense
, gra
y si
lty sa
nd a
nd g
rave
l 5
0.09
9L
with
som
e or
gani
c m
ater
ial (
woo
d)8.
1@11
80.
144
20W
et, m
ediu
m d
ense
, gra
y si
lty sa
nd a
nd g
rave
l 13
0.10
5N
with
som
e or
gani
c m
ater
ial (
woo
d)8.
1@11
80.
144
30W
et, m
ediu
m d
ense
, gra
y si
lty sa
nd a
nd g
rave
l12
0.10
8L
8.1@
118
0.14
440
Wet
, med
ium
den
se, g
ray
silty
sand
and
gra
vel
140.
104
Nw
ith o
rgan
ic m
ater
ial
/98.
1@11
80.
144
15W
et, l
oose
, gra
y si
lty sa
nd4
0.09
9L
8.1@
118
0.14
425
Wet
, loo
se, g
ray
and
brow
n sa
nd si
lty sa
nd5
0.10
8L
8.1@
118
0.14
435
Wet
, med
ium
den
se, g
ray
sand
and
gra
vel
110.
106
L8.
1@11
80.
144
45W
et, m
ediu
m d
ense
, gra
y sa
nd a
nd g
rave
l9
0.10
0L
Bla
ck R
iver
8.
1@12
00.
140
15W
et lo
ose,
bro
wn
silty
sand
50.
142
LJa
ckso
npor
t@SH
698.
1@12
00.
140
20W
et, l
oose
, bro
wn
silty
sand
30.
140
L/1

Tabl
e A-1
b. C
on't
Site
/M
agni
tude
am
axD
epth
toD
escr
iptio
n of
Blo
w
Cyc
licR
esul
ts1
Bor
ehol
e@
Dis
tanc
eSu
scep
tible
Susc
eptib
le S
edim
ent
Cou
ntSt
ress
(km
)Se
dim
ent (
ft)
N1(
60)
Rat
ioB
lack
Riv
er8.
1@12
00.
140
25W
et, l
oose
, bro
wn
silty
sand
100.
136
LJa
ckso
npor
t@SH
698.
1@12
00.
140
30W
et, m
ediu
m d
ense
, gra
y sa
nd a
nd g
rave
l14
0.13
2L
8.1@
120
0.14
035
Wet
, med
ium
den
se, g
ray
sand
and
gra
vel
100.
126
L8.
1@12
00.
140
45W
et, m
ediu
m d
ense
, gra
y sa
nd13
0.11
4L
/48.
1@12
00.
140
30W
et, l
oose
, gra
y sa
nd w
ith so
me
orga
nic
mat
ter
60.
132
L8.
1@12
00.
140
40W
et, m
ediu
m d
ense
, gra
y sa
nd
60.
120
L/5
8.1@
120
0.14
015
Wet
, loo
se, b
row
n si
lty sa
nd8
0.14
2L
8.1@
120
0.14
020
Wet
, loo
se, b
row
n si
lty sa
nd10
0.14
0L
8.1@
120
0.14
030
Wet
, med
ium
den
se, g
ray
sand
130.
132
L8.
1@12
00.
140
40W
et, m
ediu
m d
ense
, gra
y sa
nd a
nd g
rave
l13
0.12
0L
/68.
1@12
00.
140
18W
et, v
ery
loos
e, g
ray
sand
20.
141
L8.
1@12
00.
140
25W
et, m
ediu
m d
ense
, gra
y sa
nd4
0.13
6L
Cac
he R
iver
@8.
1@75
0.27
815
Wet
, ver
y lo
ose,
gra
y sa
nd3
0.16
0L
US
412/
18.
1@75
0.27
820
Wet
, med
ium
den
se, g
ray
sand
with
trac
es o
f pea
gra
vel
80.
175
L8.
1@75
0.27
825
Wet
, med
ium
den
se, g
ray
sand
90.
183
L8.
1@75
0.27
830
Wet
, med
ium
den
se, g
ray
sand
130.
186
L8.
1@75
0.27
835
Wet
, med
ium
den
se, g
ray
sand
80.
185
L8.
1@75
0.27
840
Wet
, med
ium
den
se, g
ray
sand
140.
182
L8.
1@75
0.27
845
Wet
, med
ium
den
se, g
ray
sand
with
trac
es o
f cla
y an
d gr
avel
70.
178
L/2
8.1@
750.
278
15W
et, l
oose
, gra
y sa
nd5
0.19
6L
8.1@
750.
278
20W
et, l
oose
, gra
y sa
nd12
0.20
7L
8.1@
750.
278
25W
et, m
ediu
m d
ense
, gra
y sa
nd17
0.21
2L
8.1@
750.
278
30W
et, m
ediu
m d
ense
, gra
y sa
nd w
ith so
me
grav
el8
0.21
1L
8.1@
750.
278
35W
et, m
ediu
m d
ense
, gra
y sa
nd w
ith tr
aces
of g
rave
l12
0.20
8L
8.1@
750.
278
40W
et, l
oose
, gra
y sa
nd a
nd g
rave
l6
0.20
3L

Tabl
e A-1
b. C
on't
Site
/M
agni
tude
am
axD
epth
toD
escr
iptio
n of
Blo
w
Cyc
licR
esul
ts1
Bor
ehol
e@
Dis
tanc
eSu
scep
tible
Susc
eptib
le S
edim
ent
Cou
ntSt
ress
(km
)Se
dim
ent (
ft)
N1(
60)
Rat
ioC
ache
Riv
er8.
1@75
0.27
845
Wet
, med
ium
den
se, g
ray
sand
with
trac
es o
f gra
vel
100.
196
L/3
8.1@
750.
278
15W
et, l
oose
, gra
y sa
nd w
ith so
me
orga
nic
mat
ter
80.
209
L8.
1@75
0.27
820
Wet
, ver
y lo
ose,
gra
y sa
nd w
ith tr
aces
of c
lay
30.
219
Lan
d or
gani
c m
atte
r8.
1@75
0.27
825
Wet
, med
ium
den
se, g
ray
sand
with
trac
es o
f lig
nite
100.
221
L8.
1@75
0.27
830
Wet
, med
ium
den
se, g
ray
sand
with
trac
es o
f lig
nite
50.
220
L8.
1@75
0.27
835
Wet
, loo
se, g
ray
sand
with
trac
es o
f cla
y8
0.21
5L
8.1@
750.
278
40W
et, m
ediu
m d
ense
, gra
y sa
nd w
ith c
lay
seam
s9
0.20
9L
8.1@
750.
278
45W
et, m
ediu
m d
ense
, gra
y sa
nd w
ith tr
aces
of l
igni
te a
nd g
rave
l10
0.20
1L
/48.
1@75
0.27
819
Wet
, loo
se, b
row
n sa
nd4
0.20
2L
8.1@
750.
278
15W
et m
ediu
m d
ense
, gra
y sa
nd15
0.19
2L
8.1@
750.
278
20W
et, m
ediu
m d
ense
, gra
y sa
nd w
ith tr
aces
of g
rave
l12
0.20
4L
8.1@
750.
278
25W
et, l
oose
, gra
y sa
nd w
ith tr
aces
of l
igni
te7
0.20
9L
8.1@
750.
278
30W
et, m
ediu
m d
ense
, gra
y sa
nd w
ith tr
aces
of p
ea
140.
209
Lgr
avel
and
lign
ite8.
1@75
0.27
835
Wet
, loo
se to
med
ium
den
se, s
and
with
som
e lig
nite
40.
206
L8.
1@75
0.27
845
Wet
, loo
se, g
ray
sand
with
trac
es o
f lig
nite
60.
194
LC
ross
Cou
ntry
8.1@
930.
204
15Fi
ne, b
row
n sa
nd, w
et17
0.13
6M
/ND
itch
@ S
H 4
28.
1@93
0.20
420
Fine
, gra
y sa
nd15
0.14
5L
/522
28.
1@93
0.20
425
Fine
, gra
y, w
ater
bea
ring
sand
, med
ium
com
pact
ion
190.
149
N/5
223-
18.
1@93
0.20
415
Fine
, gra
y sa
nd, w
et15
0.11
8N
8.1@
930.
204
20Fi
ne, g
ray,
wat
er b
earin
g sa
nd, m
ediu
m c
ompa
ctio
n15
0.12
9M
/N/5
223-
48.
1@93
0.20
426
Fine
, gra
y sa
nd, w
et9
0.10
6L
8.1@
930.
204
30Fi
ne, g
ray,
wat
er b
earin
g sa
nd, m
ediu
m c
ompa
ctio
n7
0.11
0L
Cur
rent
Riv
er @
8.1@
800.
254
25W
et, m
ediu
m d
ense
, gra
y sa
nd15
0.20
2L
SH 3
28/1

Tabl
e A-1
b. C
on't
Site
/M
agni
tude
am
axD
epth
toD
escr
iptio
n of
Blo
w
Cyc
licR
esul
ts1
Bor
ehol
e@
Dis
tanc
eSu
scep
tible
Susc
eptib
le S
edim
ent
Cou
ntSt
ress
(km
)Se
dim
ent (
ft)
N1(
60)
Rat
ioC
urre
nt R
iver
@8.
1@80
0.25
430
Wet
, med
ium
den
se, g
ray
sand
110.
201
LSH
328
/18.
1@80
0.25
435
Wet
, med
ium
den
se, g
ray
grav
elly
sand
with
org
anic
mat
ter
120.
197
L8.
1@80
0.25
445
Wet
, med
ium
den
se, g
ray
grav
elly
sand
with
org
anic
mat
ter
110.
184
L/2
8.1@
800.
254
15W
et, l
oose
, bro
wn
fine
sand
90.
204
L8.
1@80
0.25
420
Wet
, med
ium
den
se, b
row
n sa
nd12
0.21
1L
8.1@
800.
254
25W
et, m
ediu
m d
ense
, bro
wn
sand
180.
212
L8.
1@80
0.25
430
Wet
, med
ium
den
se, b
row
n to
gra
y sa
nd w
ith o
rgan
ic m
atte
r13
0.20
9L
8.1@
800.
254
35W
et, m
ediu
m d
ense
, bro
wn
to g
ray
sand
with
org
anic
mat
ter
90.
204
L8.
1@80
0.25
445
Wet
, med
ium
den
se, g
ray
sand
and
gra
vel
100.
189
L/3
8.1@
800.
254
10W
et, l
oose
, gra
y fin
e sa
nd7
0.20
2L
8.1@
800.
254
20W
et, l
oose
, gra
y fin
e sa
nd9
0.22
3L
8.1@
800.
254
25W
et, m
ediu
m d
ense
, gra
y sa
nd13
0.22
1L
8.1@
800.
254
30W
et, m
ediu
m d
ense
, gra
y sa
nd10
0.21
7L
8.1@
800.
254
35W
et, m
ediu
m d
ense
, bro
wn
and
gray
gra
velly
sand
110.
211
L/4
8.1@
800.
254
10W
et, l
oose
, bro
wn
sand
100.
202
L8.
1@80
0.25
420
Wet
, loo
se, b
row
n sa
nd7
0.22
3L
8.1@
800.
254
25W
et, m
ediu
m d
ense
, bro
wn
and
gray
sand
90.
221
L8.
1@80
0.25
430
Wet
, med
ium
den
se, b
row
n an
d gr
ay g
rave
lly sa
nd16
0.21
7L
with
org
anic
mat
ter
8.1@
800.
254
35W
et, m
ediu
m d
ense
, bro
wn
and
gray
gra
vely
sand
110.
211
Lw
ith o
rgan
ic m
atte
r8.
1@80
0.25
445
Wet
, med
ium
den
se, b
row
n an
d gr
ay sa
nd a
nd g
rave
l10
0.19
4L
/88.
1@80
0.25
415
Wet
, med
ium
den
se, g
ray
sand
8
0.17
5L
8.1@
800.
254
20W
et, m
ediu
m d
ense
, gra
y sa
nd
80.
186
L/1
08.
1@80
0.25
415
Wet
, med
ium
den
se to
loos
e, b
row
n fin
e sa
nd7
0.21
8L

Tabl
e A-1
b. C
on't
Site
/M
agni
tude
am
axD
epth
toD
escr
iptio
n of
Blo
w
Cyc
licR
esul
ts1
Bor
ehol
e@
Dis
tanc
eSu
scep
tible
Susc
eptib
le S
edim
ent
Cou
ntSt
ress
(km
)Se
dim
ent (
ft)
N1(
60)
Rat
ioC
urre
nt R
iver
@8.
1@80
0.25
420
Wet
, med
ium
den
se to
loos
e, b
row
n fin
e sa
nd8
0.22
3L
SH 3
28/1
08.
1@80
0.25
425
Wet
, med
ium
den
se, g
ray
grav
elly
sand
160.
221
L8.
1@80
0.25
435
Wet
, med
ium
den
se, g
ray
grav
elly
sand
130.
211
L8.
1@80
0.25
440
Wet
, med
ium
den
se, g
ray
grav
elly
sand
130.
203
L8.
1@80
0.25
445
Wet
, med
ium
den
se, g
ray
grav
elly
sand
130.
194
LW
hite
Riv
er @
8.1@
120
0.14
035
Wet
, med
ium
den
se, g
ray
fine
sand
40.
114
LSH
67/
18.
1@12
00.
140
40W
et, m
ediu
m d
ense
, fin
e sa
nd9
0.11
0L
8.1@
120
0.14
050
Wet
, med
ium
den
se, b
row
n sa
nd a
nd g
rave
l7
0.10
0L
/48.
1@12
00.
140
10W
et, l
oose
, bro
wn
silty
sand
70.
105
L8.
1@12
00.
140
25W
et, l
oose
, bro
wn
clay
ey sa
nd3
0.11
9L
L- li
quef
actio
nM
- mar
gina
l liq
uefa
ctio
nN
- liq
uefa
ctio
n no
t lik
ely

Tabl
e A-2
. Res
ults
of l
ique
fact
ion
pote
ntia
l ana
lysi
s for
Jan
uary
23,
181
2 ea
rthq
uake
.Si
te/
Mag
nitu
de
amax
Dep
th to
Des
crip
tion
ofB
low
C
yclic
Res
ults
1
Bor
ehol
e@
Dis
tanc
eSu
scep
tible
Susc
eptib
le S
edim
ent
Cou
ntSt
ress
(km
)Se
dim
ent (
ft)
N1(
60)
Rat
ioB
lack
Riv
er @
7.0
@ 1
730.
030
20W
et, m
ediu
m d
ense
, gra
y sa
nd13
0.01
8N
Elgi
n Fe
rry
/17.
0 @
173
0.03
025
Wet
, med
ium
den
se, g
ray
sand
110.
019
N/6
7.0
@ 1
730.
030
10W
et, l
oose
bro
wn
fine
sand
80.
018
N7.
0 @
173
0.03
015
Wet
, med
ium
den
se, g
ray
and
brow
n si
lty sa
nd7
0.02
1N
7.0
@ 1
730.
030
20W
et, m
ediu
m d
ense
, gra
y an
d br
own
silty
sand
10
0.02
2N
with
scat
tere
d or
gani
c m
atte
r7.
0@17
30.
030
25W
et, m
ediu
m d
ense
, gra
y an
d br
own
silty
sand
9
0.02
3N
with
scat
tere
d or
gani
c m
atte
r7.
0@17
30.
030
50W
et, m
ediu
m d
ense
, gra
y sa
nd a
nd g
rave
l 9
0.02
0N
with
org
anic
mat
eria
l/7
7.0@
173
0.03
010
Wet
, med
ium
den
se, g
ray
silty
sand
and
gra
vel
30.
018
Nw
ith so
me
orga
nic
mat
eria
l (w
ood)
7.0@
173
0.03
015
Wet
, med
ium
den
se, g
ray
silty
sand
and
gra
vel
50.
021
Nw
ith so
me
orga
nic
mat
eria
l (w
ood)
7.0@
173
0.03
020
Wet
, med
ium
den
se, g
ray
silty
sand
and
gra
vel
130.
022
Nw
ith so
me
orga
nic
mat
eria
l (w
ood)
7.0@
173
0.03
030
Wet
, med
ium
den
se, g
ray
silty
sand
and
gra
vel
120.
023
N7.
0@17
30.
030
40W
et, m
ediu
m d
ense
, gra
y si
lty sa
nd a
nd g
rave
l14
0.02
2N
with
org
anic
mat
eria
l/9
7.0
@ 1
730.
030
15W
et, l
oose
, gra
y si
lty sa
nd4
0.02
1N
7.0
@ 1
730.
030
25W
et, l
oose
, gra
y an
d br
own
sand
silty
sand
50.
023
N7.
0 @
173
0.03
035
Wet
, med
ium
den
se, g
ray
sand
and
gra
vel
110.
022
N7.
0 @
173
0.03
045
Wet
, med
ium
den
se, g
ray
sand
and
gra
vel
90.
021
NB
lack
Riv
er
7.0
@ 1
780.
030
15W
et lo
ose,
bro
wn
silty
sand
50.
030
NJa
ckso
npor
t@SH
697.
0 @
178
0.03
020
Wet
, loo
se, b
row
n si
lty sa
nd3
0.03
0N
/1
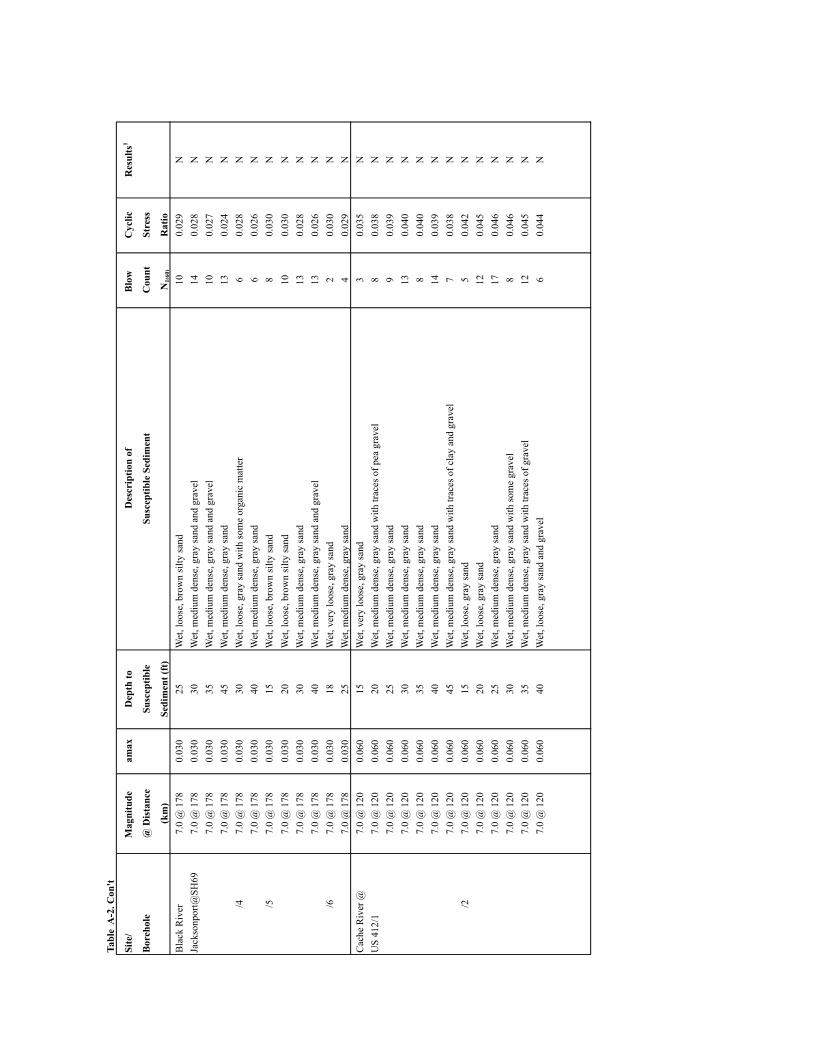
Tabl
e A
-2. C
on't
Site
/M
agni
tude
am
axD
epth
toD
escr
iptio
n of
Blo
w
Cyc
licR
esul
ts1
Bor
ehol
e@
Dis
tanc
eSu
scep
tible
Susc
eptib
le S
edim
ent
Cou
ntSt
ress
(km
)Se
dim
ent (
ft)
N1(
60)
Rat
ioB
lack
Riv
er7.
0 @
178
0.03
025
Wet
, loo
se, b
row
n si
lty sa
nd10
0.02
9N
Jack
sonp
ort@
SH69
7.0
@ 1
780.
030
30W
et, m
ediu
m d
ense
, gra
y sa
nd a
nd g
rave
l14
0.02
8N
7.0
@ 1
780.
030
35W
et, m
ediu
m d
ense
, gra
y sa
nd a
nd g
rave
l10
0.02
7N
7.0
@ 1
780.
030
45W
et, m
ediu
m d
ense
, gra
y sa
nd13
0.02
4N
/47.
0 @
178
0.03
030
Wet
, loo
se, g
ray
sand
with
som
e or
gani
c m
atte
r6
0.02
8N
7.0
@ 1
780.
030
40W
et, m
ediu
m d
ense
, gra
y sa
nd
60.
026
N/5
7.0
@ 1
780.
030
15W
et, l
oose
, bro
wn
silty
sand
80.
030
N7.
0 @
178
0.03
020
Wet
, loo
se, b
row
n si
lty sa
nd10
0.03
0N
7.0
@ 1
780.
030
30W
et, m
ediu
m d
ense
, gra
y sa
nd13
0.02
8N
7.0
@ 1
780.
030
40W
et, m
ediu
m d
ense
, gra
y sa
nd a
nd g
rave
l13
0.02
6N
/67.
0 @
178
0.03
018
Wet
, ver
y lo
ose,
gra
y sa
nd2
0.03
0N
7.0
@ 1
780.
030
25W
et, m
ediu
m d
ense
, gra
y sa
nd4
0.02
9N
Cac
he R
iver
@7.
0 @
120
0.06
015
Wet
, ver
y lo
ose,
gra
y sa
nd3
0.03
5N
US
412/
17.
0 @
120
0.06
020
Wet
, med
ium
den
se, g
ray
sand
with
trac
es o
f pea
gra
vel
80.
038
N7.
0 @
120
0.06
025
Wet
, med
ium
den
se, g
ray
sand
90.
039
N7.
0 @
120
0.06
030
Wet
, med
ium
den
se, g
ray
sand
130.
040
N7.
0 @
120
0.06
035
Wet
, med
ium
den
se, g
ray
sand
80.
040
N7.
0 @
120
0.06
040
Wet
, med
ium
den
se, g
ray
sand
140.
039
N7.
0 @
120
0.06
045
Wet
, med
ium
den
se, g
ray
sand
with
trac
es o
f cla
y an
d gr
avel
70.
038
N/2
7.0
@ 1
200.
060
15W
et, l
oose
, gra
y sa
nd5
0.04
2N
7.0
@ 1
200.
060
20W
et, l
oose
, gra
y sa
nd12
0.04
5N
7.0
@ 1
200.
060
25W
et, m
ediu
m d
ense
, gra
y sa
nd17
0.04
6N
7.0
@ 1
200.
060
30W
et, m
ediu
m d
ense
, gra
y sa
nd w
ith so
me
grav
el8
0.04
6N
7.0
@ 1
200.
060
35W
et, m
ediu
m d
ense
, gra
y sa
nd w
ith tr
aces
of g
rave
l12
0.04
5N
7.0
@ 1
200.
060
40W
et, l
oose
, gra
y sa
nd a
nd g
rave
l6
0.04
4N

Tabl
e A-2
. Con
't
Site
/M
agni
tude
am
axD
epth
toD
escr
iptio
n of
Blo
w
Cyc
licR
esul
ts1
Bor
ehol
e@
Dis
tanc
eSu
scep
tible
Susc
eptib
le S
edim
ent
Cou
ntSt
ress
(km
)Se
dim
ent (
ft)
N1(
60)
Rat
ioC
ache
Riv
er7.
0 @
120
0.06
045
Wet
, med
ium
den
se, g
ray
sand
with
trac
es o
f gra
vel
100.
042
N/3
7.0
@ 1
200.
060
15W
et, l
oose
, gra
y sa
nd w
ith so
me
orga
nic
mat
ter
80.
045
N7.
0 @
120
0.06
020
Wet
, ver
y lo
ose,
gra
y sa
nd w
ith tr
aces
of c
lay
30.
047
Nan
d or
gani
c m
atte
r7.
0 @
120
0.06
025
Wet
, med
ium
den
se, g
ray
sand
with
trac
es o
f lig
nite
100.
048
N7.
0 @
120
0.06
030
Wet
, med
ium
den
se, g
ray
sand
with
trac
es o
f lig
nite
50.
047
N7.
0 @
120
0.06
035
Wet
, loo
se, g
ray
sand
with
trac
es o
f cla
y8
0.04
6N
7.0
@ 1
200.
060
40W
et, m
ediu
m d
ense
, gra
y sa
nd w
ith c
lay
seam
s9
0.04
5N
7.0
@ 1
200.
060
45W
et, m
ediu
m d
ense
, gra
y sa
nd w
ith tr
aces
of l
igni
te a
nd g
rave
l10
0.04
3N
/47.
0 @
120
0.06
019
Wet
, loo
se, b
row
n sa
nd4
0.04
47.
0 @
120
0.06
015
Wet
med
ium
den
se, g
ray
sand
150.
041
N7.
0 @
120
0.06
020
Wet
, med
ium
den
se, g
ray
sand
with
trac
es o
f gra
vel
120.
044
N7.
0 @
120
0.06
025
Wet
, loo
se, g
ray
sand
with
trac
es o
f lig
nite
70.
045
N7.
0 @
120
0.06
030
Wet
, med
ium
den
se, g
ray
sand
with
trac
es o
f pea
14
0.04
5N
grav
el a
nd li
gnite
7.0
@ 1
200.
060
35W
et, l
oose
to m
ediu
m d
ense
, san
d w
ith so
me
ligni
te4
0.04
4N
7.0
@ 1
200.
060
45W
et, l
oose
, gra
y sa
nd w
ith tr
aces
of l
igni
te6
0.04
2N
Cro
ss C
ount
ry7.
0 @
158
0.04
015
Fine
, bro
wn
sand
, wet
170.
027
ND
itch
@ S
H/4
27.
0 @
158
0.04
020
Fine
, gra
y sa
nd15
0.02
8N
/522
27.
0 @
158
0.04
025
Fine
, gra
y, w
ater
bea
ring
sand
, med
ium
com
pact
ion
190.
029
N/5
223-
17.
0 @
158
0.04
015
Fine
, gra
y sa
nd, w
et15
0.02
3N
7.0
@ 1
580.
040
20Fi
ne, g
ray,
wat
er b
earin
g sa
nd, m
ediu
m c
ompa
ctio
n15
0.02
5N
/522
3-4
7.0
@ 1
580.
040
26Fi
ne, g
ray
sand
, wet
90.
036
N7.
0 @
158
0.04
030
Fine
, gra
y, w
ater
bea
ring
sand
, med
ium
com
pact
ion
70.
038
N/5
222
7.5@
158
0.05
615
Fine
, bro
wn
sand
, wet
170.
037
N

Tabl
e A-2
. Con
't
Site
/M
agni
tude
am
axD
epth
toD
escr
iptio
n of
Blo
w
Cyc
licR
esul
ts1
Bor
ehol
e@
Dis
tanc
eSu
scep
tible
Susc
eptib
le S
edim
ent
Cou
ntSt
ress
(km
)Se
dim
ent (
ft)
N1(
60)
Rat
ioC
ross
Cou
ntry
7.5@
158
0.05
620
Fine
, gra
y sa
nd15
0.04
0N
Ditc
h/ /
5222
7.5@
158
0.05
625
Fine
, gra
y, w
ater
bea
ring
sand
, med
ium
com
pact
ion
190.
041
N/5
223-
17.
5@15
80.
056
15Fi
ne, g
ray
sand
, wet
150.
032
N7.
5@15
80.
056
20Fi
ne, g
ray,
wat
er b
earin
g sa
nd, m
ediu
m c
ompa
ctio
n15
0.03
5N
/522
3-4
7.5@
158
0.05
626
Fine
, gra
y sa
nd, w
et9
0.02
9N
7.5@
158
0.05
630
Fine
, gra
y, w
ater
bea
ring
sand
, med
ium
com
pact
ion
70.
030
N/5
222
7.8@
158
0.08
415
Fine
, bro
wn
sand
, wet
170.
048
N7.
8@15
80.
084
20Fi
ne, g
ray
sand
150.
051
N7.
8@15
80.
084
25Fi
ne, g
ray,
wat
er b
earin
g sa
nd, m
ediu
m c
ompa
ctio
n19
0.05
2N
/522
3-1
7.8@
158
0.08
415
Fine
, gra
y sa
nd, w
et15
0.04
1N
7.8@
158
0.08
420
Fine
, gra
y, w
ater
bea
ring
sand
, med
ium
com
pact
ion
150.
045
N/5
223-
47.
8@15
80.
084
26Fi
ne, g
ray
sand
, wet
90.
037
N7.
8@15
80.
084
30Fi
ne, g
ray,
wat
er b
earin
g sa
nd, m
ediu
m c
ompa
ctio
n7
0.03
8N
Cur
rent
Riv
er @
M7.
0@10
50.
070
25W
et, m
ediu
m d
ense
, gra
y sa
nd15
0.05
6N
SH 3
28/1
M7.
0@10
50.
070
30W
et, m
ediu
m d
ense
, gra
y sa
nd11
0.05
5N
M7.
0@10
50.
070
35W
et, m
ediu
m d
ense
, gra
y gr
avel
ly sa
nd w
ith o
rgan
ic m
atte
r12
0.05
4N
M7.
0@10
50.
070
45W
et, m
ediu
m d
ense
, gra
y gr
avel
ly sa
nd w
ith o
rgan
ic m
atte
r11
0.05
1N
/2M
7.0@
105
0.07
015
Wet
, loo
se, b
row
n fin
e sa
nd9
0.05
6N
M7.
0@10
50.
070
20W
et, m
ediu
m d
ense
, bro
wn
sand
120.
058
NM
7.0@
105
0.07
025
Wet
, med
ium
den
se, b
row
n sa
nd18
0.05
9N
M7.
0@10
50.
070
30W
et, m
ediu
m d
ense
, bro
wn
to g
ray
sand
with
org
anic
mat
ter
130.
058
NM
7.0@
105
0.07
035
Wet
, med
ium
den
se, b
row
n to
gra
y sa
nd w
ith o
rgan
ic m
atte
r9
0.05
6N
M7.
0@10
50.
070
45W
et, m
ediu
m d
ense
, gra
y sa
nd a
nd g
rave
l10
0.05
2N
/3M
7.0@
105
0.07
010
Wet
, loo
se, g
ray
fine
sand
70.
056
NM
7.0@
105
0.07
020
Wet
, loo
se, g
ray
fine
sand
90.
062
NM
7.0@
105
0.07
025
Wet
, med
ium
den
se, g
ray
sand
130.
061
N

Tabl
e A-2
. Con
't
Site
/M
agni
tude
am
axD
epth
toD
escr
iptio
n of
Blo
w
Cyc
licR
esul
ts1
Bor
ehol
e@
Dis
tanc
eSu
scep
tible
Susc
eptib
le S
edim
ent
Cou
ntSt
ress
(km
)Se
dim
ent (
ft)
N1(
60)
Rat
ioC
urre
nt R
iver
@M
7.0@
105
0.07
030
Wet
, med
ium
den
se, g
ray
sand
100.
060
NSH
328
/3M
7.0@
105
0.07
035
Wet
, med
ium
den
se, b
row
n an
d gr
ay g
rave
lly sa
nd11
0.05
8N
/4M
7.0@
105
0.07
010
Wet
, loo
se, b
row
n sa
nd10
0.05
6N
M7.
0@10
50.
070
20W
et, l
oose
, bro
wn
sand
70.
062
NM
7.0@
105
0.07
025
Wet
, med
ium
den
se, b
row
n an
d gr
ay sa
nd9
0.06
1N
M7.
0@10
50.
070
30W
et, m
ediu
m d
ense
, bro
wn
and
gray
gra
velly
sand
160.
060
Nw
ith o
rgan
ic m
atte
rM
7.0@
105
0.07
035
Wet
, med
ium
den
se, b
row
n an
d gr
ay g
rave
ly sa
nd11
0.05
8N
with
org
anic
mat
ter
M7.
0@10
50.
070
45W
et, m
ediu
m d
ense
, bro
wn
and
gray
sand
and
gra
vel
100.
054
N/8
M7.
0@10
50.
070
15W
et, m
ediu
m d
ense
, gra
y sa
nd
80.
048
NM
7.0@
105
0.07
020
Wet
, med
ium
den
se, g
ray
sand
8
0.05
1N
/10
M7.
0@10
50.
070
15W
et, m
ediu
m d
ense
to lo
ose,
bro
wn
fine
sand
70.
060
NM
7.0@
105
0.07
020
Wet
, med
ium
den
se to
loos
e, b
row
n fin
e sa
nd8
0.06
1N
M7.
0@10
50.
070
25W
et, m
ediu
m d
ense
, gra
y gr
avel
ly sa
nd16
0.06
1N
M7.
0@10
50.
070
35W
et, m
ediu
m d
ense
, gra
y gr
avel
ly sa
nd13
0.05
8N
M7.
0@10
50.
070
40W
et, m
ediu
m d
ense
, gra
y gr
avel
ly sa
nd13
0.05
6N
M7.
0@10
50.
070
45W
et, m
ediu
m d
ense
, gra
y gr
avel
ly sa
nd13
0.05
4N
Whi
te R
iver
@M
7.0@
178
0.03
035
Wet
, med
ium
den
se, g
ray
fine
sand
40.
024
NSH
67/
1M
7.0@
178
0.03
040
Wet
, med
ium
den
se, f
ine
sand
90.
024
NM
7.0@
178
0.03
050
Wet
, med
ium
den
se, b
row
n sa
nd a
nd g
rave
l7
0.02
2N
/4M
7.0@
178
0.03
010
Wet
, loo
se, b
row
n si
lty sa
nd7
0.02
3N
M7.
0@17
80.
030
25W
et, l
oose
, bro
wn
clay
ey sa
nd3
0.02
5N
1 L - l
ique
fact
ion;
M
- mar
gina
l liq
uefa
ctio
n;N
- liq
uefa
ctio
n no
t lik
ely

Tabl
e A-3
. Res
ults
of l
ique
fact
ion
pote
ntia
l ana
lysi
s for
Feb
ruar
y 7,
181
2 ea
rthq
uake
.Si
te/
Mag
nitu
de
amax
Dep
th to
Des
crip
tion
ofB
low
C
yclic
Res
ults
1
Bor
ehol
e@
Dis
tanc
eSu
scep
tible
Susc
eptib
le S
edim
ent
Cou
ntSt
ress
(km
)Se
dim
ent (
ft)
N1(
60)
Rat
ioB
lack
Riv
er @
7.5@
160
0.05
020
Wet
, med
ium
den
se, g
ray
sand
130.
030
NEl
gin
Ferr
y/1
7.5@
160
0.05
025
Wet
, med
ium
den
se, g
ray
sand
110.
031
N/6
7.5@
160
0.05
010
Wet
, loo
se b
row
n fin
e sa
nd8
0.03
0N
7.5@
160
0.05
015
Wet
, med
ium
den
se, g
ray
and
brow
n si
lty sa
nd7
0.03
5N
7.5@
160
0.05
020
Wet
, med
ium
den
se, g
ray
and
brow
n si
lty sa
nd
100.
037
Nw
ith sc
atte
red
orga
nic
mat
ter
7.5@
160
0.05
025
Wet
, med
ium
den
se, g
ray
and
brow
n si
lty sa
nd
90.
038
Nw
ith sc
atte
red
orga
nic
mat
ter
7.5@
160
0.05
050
Wet
, med
ium
den
se, g
ray
sand
and
gra
vel
90.
033
Nw
ith o
rgan
ic m
ater
ial
/77.
5@16
00.
050
10W
et, m
ediu
m d
ense
, gra
y si
lty sa
nd a
nd g
rave
l 3
0.03
0N
with
som
e or
gani
c m
ater
ial (
woo
d)7.
5@16
00.
050
15W
et, m
ediu
m d
ense
, gra
y si
lty sa
nd a
nd g
rave
l 5
0.03
5N
with
som
e or
gani
c m
ater
ial (
woo
d)7.
5@16
00.
050
20W
et, m
ediu
m d
ense
, gra
y si
lty sa
nd a
nd g
rave
l 13
0.03
7N
with
som
e or
gani
c m
ater
ial (
woo
d)7.
5@16
00.
050
30W
et, m
ediu
m d
ense
, gra
y si
lty sa
nd a
nd g
rave
l12
0.03
8N
7.5@
160
0.05
040
Wet
, med
ium
den
se, g
ray
silty
sand
and
gra
vel
140.
036
Nw
ith o
rgan
ic m
ater
ial
/97.
5@16
00.
050
15W
et, l
oose
, gra
y si
lty sa
nd4
0.03
5N
7.5@
160
0.05
025
Wet
, loo
se, g
ray
and
brow
n sa
nd si
lty sa
nd5
0.03
8N
7.5@
160
0.05
035
Wet
, med
ium
den
se, g
ray
sand
and
gra
vel
110.
037
N7.
5@16
00.
050
45W
et, m
ediu
m d
ense
, gra
y sa
nd a
nd g
rave
l9
0.03
5N
Bla
ck R
iver
7.
5@16
30.
040
15W
et lo
ose,
bro
wn
silty
sand
50.
041
NJa
ckso
npor
t@SH
697.
5@16
30.
040
20W
et, l
oose
, bro
wn
silty
sand
30.
040
N/1

Tabl
e A-3
. Con
't
Site
/M
agni
tude
am
axD
epth
toD
escr
iptio
n of
Blo
w
Cyc
licR
esul
ts1
Bor
ehol
e@
Dis
tanc
eSu
scep
tible
Susc
eptib
le S
edim
ent
Cou
ntSt
ress
(km
)Se
dim
ent (
ft)
N1(
60)
Rat
ioB
lack
Riv
er7.
5@16
30.
040
25W
et, l
oose
, bro
wn
silty
sand
100.
039
NJa
ckso
npor
t@SH
697.
5@16
30.
040
30W
et, m
ediu
m d
ense
, gra
y sa
nd a
nd g
rave
l14
0.03
8N
7.5@
163
0.04
035
Wet
, med
ium
den
se, g
ray
sand
and
gra
vel
100.
036
N7.
5@16
30.
040
45W
et, m
ediu
m d
ense
, gra
y sa
nd13
0.03
3N
/47.
5@16
30.
040
30W
et, l
oose
, gra
y sa
nd w
ith so
me
orga
nic
mat
ter
60.
038
N7.
5@16
30.
040
40W
et, m
ediu
m d
ense
, gra
y sa
nd
60.
034
N/5
7.5@
163
0.04
015
Wet
, loo
se, b
row
n si
lty sa
nd8
0.04
1N
7.5@
163
0.04
020
Wet
, loo
se, b
row
n si
lty sa
nd10
0.04
0N
7.5@
163
0.04
030
Wet
, med
ium
den
se, g
ray
sand
130.
038
N7.
5@16
30.
040
40W
et, m
ediu
m d
ense
, gra
y sa
nd a
nd g
rave
l13
0.03
4N
/67.
5@16
30.
040
18W
et, v
ery
loos
e, g
ray
sand
20.
040
N7.
5@16
30.
040
25W
et, m
ediu
m d
ense
, gra
y sa
nd4
0.03
9N
Cac
he R
iver
@7.
5@11
00.
100
15W
et, v
ery
loos
e, g
ray
sand
30.
058
LU
S 41
2/1
7.5@
110
0.10
020
Wet
, med
ium
den
se, g
ray
sand
with
trac
es o
f pea
gra
vel
80.
063
N7.
5@11
00.
100
25W
et, m
ediu
m d
ense
, gra
y sa
nd9
0.06
6N
7.5@
110
0.10
030
Wet
, med
ium
den
se, g
ray
sand
130.
067
N7.
5@11
00.
100
35W
et, m
ediu
m d
ense
, gra
y sa
nd8
0.06
7N
7.5@
110
0.10
040
Wet
, med
ium
den
se, g
ray
sand
140.
066
N7.
5@11
00.
100
45W
et, m
ediu
m d
ense
, gra
y sa
nd w
ith tr
aces
of c
lay
and
grav
el7
0.06
4N
/27.
5@11
00.
100
15W
et, l
oose
, gra
y sa
nd5
0.07
0L
7.5@
110
0.10
020
Wet
, loo
se, g
ray
sand
120.
075
N7.
5@11
00.
100
25W
et, m
ediu
m d
ense
, gra
y sa
nd17
0.07
6N
7.5@
110
0.10
030
Wet
, med
ium
den
se, g
ray
sand
with
som
e gr
avel
80.
076
N7.
5@11
00.
100
35W
et, m
ediu
m d
ense
, gra
y sa
nd w
ith tr
aces
of g
rave
l12
0.07
5N
7.5@
110
0.10
040
Wet
, loo
se, g
ray
sand
and
gra
vel
60.
073
N

Tabl
e A-3
. Con
't
Site
/M
agni
tude
am
axD
epth
toD
escr
iptio
n of
Blo
w
Cyc
licR
esul
ts1
Bor
ehol
e@
Dis
tanc
eSu
scep
tible
Susc
eptib
le S
edim
ent
Cou
ntSt
ress
(km
)Se
dim
ent (
ft)
N1(
60)
Rat
ioC
ache
Riv
er7.
5@11
00.
100
45W
et, m
ediu
m d
ense
, gra
y sa
nd w
ith tr
aces
of g
rave
l10
0.07
0N
/37.
5@11
00.
100
15W
et, l
oose
, gra
y sa
nd w
ith so
me
orga
nic
mat
ter
80.
075
N7.
5@11
00.
100
20W
et, v
ery
loos
e, g
ray
sand
with
trac
es o
f cla
y3
0.07
9L
and
orga
nic
mat
ter
7.5@
110
0.10
025
Wet
, med
ium
den
se, g
ray
sand
with
trac
es o
f lig
nite
100.
080
N7.
5@11
00.
100
30W
et, m
ediu
m d
ense
, gra
y sa
nd w
ith tr
aces
of l
igni
te5
0.07
9L
7.5@
110
0.10
035
Wet
, loo
se, g
ray
sand
with
trac
es o
f cla
y8
0.07
7N
7.5@
110
0.10
040
Wet
, med
ium
den
se, g
ray
sand
with
cla
y se
ams
90.
075
N7.
5@11
00.
100
45W
et, m
ediu
m d
ense
, gra
y sa
nd w
ith tr
aces
of l
igni
te a
nd g
rave
l10
0.07
2N
/47.
5@11
00.
100
19W
et, l
oose
, bro
wn
sand
40.
073
L7.
5@11
00.
100
15W
et m
ediu
m d
ense
, gra
y sa
nd15
0.06
9N
7.5@
110
0.10
020
Wet
, med
ium
den
se, g
ray
sand
with
trac
es o
f gra
vel
120.
073
N7.
5@11
00.
100
25W
et, l
oose
, gra
y sa
nd w
ith tr
aces
of l
igni
te7
0.07
5N
7.5@
110
0.10
030
Wet
, med
ium
den
se, g
ray
sand
with
trac
es o
f pea
14
0.07
5N
grav
el a
nd li
gnite
7.5@
110
0.10
035
Wet
, loo
se to
med
ium
den
se, s
and
with
som
e lig
nite
40.
074
L7.
5@11
00.
100
45W
et, l
oose
, gra
y sa
nd w
ith tr
aces
of l
igni
te6
0.07
0M
/NC
ross
Cou
ntry
7.5@
138
0.07
015
Fine
, bro
wn
sand
, wet
170.
046
ND
itch
@ S
H 4
27.
5@13
80.
070
20Fi
ne, g
ray
sand
150.
050
N/5
222
7.5@
138
0.07
025
Fine
, gra
y, w
ater
bea
ring
sand
, med
ium
com
pact
ion
190.
051
N/5
223-
17.
5@13
80.
070
15Fi
ne, g
ray
sand
, wet
150.
040
N7.
5@13
80.
070
20Fi
ne, g
ray,
wat
er b
earin
g sa
nd, m
ediu
m c
ompa
ctio
n15
0.04
4N
/522
3-4
7.5@
138
0.07
026
Fine
, gra
y sa
nd, w
et9
0.05
2N
7.5@
138
0.07
030
Fine
, gra
y, w
ater
bea
ring
sand
, med
ium
com
pact
ion
70.
054
N/5
222
8.0@
138
0.08
415
Fine
, bro
wn
sand
, wet
170.
069
N8.
0@13
80.
084
20Fi
ne, g
ray
sand
150.
074
N

Tabl
e A-3
. Con
't
Site
/M
agni
tude
am
axD
epth
toD
escr
iptio
n of
Blo
w
Cyc
licR
esul
ts1
Bor
ehol
e@
Dis
tanc
eSu
scep
tible
Susc
eptib
le S
edim
ent
Cou
ntSt
ress
(km
)Se
dim
ent (
ft)
N1(
60)
Rat
io/5
222
8.0@
138
0.08
425
Fine
, gra
y, w
ater
bea
ring
sand
, med
ium
com
pact
ion
190.
076
N/5
223-
18.
0@13
80.
084
15Fi
ne, g
ray
sand
, wet
150.
060
N8.
0@13
80.
084
20Fi
ne, g
ray,
wat
er b
earin
g sa
nd, m
ediu
m c
ompa
ctio
n15
0.06
6N
/522
3-4
8.0@
138
0.08
426
Fine
, gra
y sa
nd, w
et9
0.05
4N
8.0@
138
0.08
430
Fine
, gra
y, w
ater
bea
ring
sand
, med
ium
com
pact
ion
70.
056
NC
urre
nt R
iver
@7.
5@10
30.
089
25W
et, m
ediu
m d
ense
, gra
y sa
nd15
0.07
1N
SH 3
28/1
7.5@
103
0.08
930
Wet
, med
ium
den
se, g
ray
sand
110.
070
N7.
5@10
30.
089
35W
et, m
ediu
m d
ense
, gra
y gr
avel
ly sa
nd w
ith o
rgan
ic m
atte
r12
0.06
9N
7.5@
103
0.08
945
Wet
, med
ium
den
se, g
ray
grav
elly
sand
with
org
anic
mat
ter
110.
064
N/2
7.5@
103
0.08
915
Wet
, loo
se, b
row
n fin
e sa
nd9
0.07
1N
7.5@
103
0.08
920
Wet
, med
ium
den
se, b
row
n sa
nd12
0.07
4N
7.5@
103
0.08
925
Wet
, med
ium
den
se, b
row
n sa
nd18
0.07
4N
7.5@
103
0.08
930
Wet
, med
ium
den
se, b
row
n to
gra
y sa
nd w
ith o
rgan
ic m
atte
r13
0.07
3N
7.5@
103
0.08
935
Wet
, med
ium
den
se, b
row
n to
gra
y sa
nd w
ith o
rgan
ic m
atte
r9
0.07
1N
7.5@
103
0.08
945
Wet
, med
ium
den
se, g
ray
sand
and
gra
vel
100.
066
N/3
7.5@
103
0.08
910
Wet
, loo
se, g
ray
fine
sand
70.
070
L7.
5@10
30.
089
20W
et, l
oose
, gra
y fin
e sa
nd9
0.07
8L
7.5@
103
0.08
925
Wet
, med
ium
den
se, g
ray
sand
130.
077
N7.
5@10
30.
089
30W
et, m
ediu
m d
ense
, gra
y sa
nd10
0.07
6N
7.5@
103
0.08
935
Wet
, med
ium
den
se, b
row
n an
d gr
ay g
rave
lly sa
nd11
0.07
4N
/47.
5@10
30.
089
10W
et, l
oose
, bro
wn
sand
100.
070
L7.
5@10
30.
089
20W
et, l
oose
, bro
wn
sand
70.
078
L7.
5@10
30.
089
25W
et, m
ediu
m d
ense
, bro
wn
and
gray
sand
90.
077
N7.
5@10
30.
089
30W
et, m
ediu
m d
ense
, bro
wn
and
gray
gra
velly
sand
160.
076
Nw
ith o
rgan
ic m
atte
r

Tabl
e A-3
. Con
't
Site
/M
agni
tude
am
axD
epth
toD
escr
iptio
n of
Blo
w
Cyc
licR
esul
ts1
Bor
ehol
e@
Dis
tanc
eSu
scep
tible
Susc
eptib
le S
edim
ent
Cou
ntSt
ress
(km
)Se
dim
ent (
ft)
N1(
60)
Rat
ioC
urre
nt R
iver
@7.
5@10
30.
089
35W
et, m
ediu
m d
ense
, bro
wn
and
gray
gra
vely
sand
110.
074
NSH
328
/4w
ith o
rgan
ic m
atte
r7.
5@10
30.
089
45W
et, m
ediu
m d
ense
, bro
wn
and
gray
sand
and
gra
vel
100.
068
N/8
7.5@
103
0.08
915
Wet
, med
ium
den
se, g
ray
sand
8
0.06
1N
7.5@
103
0.08
920
Wet
, med
ium
den
se, g
ray
sand
8
0.06
5N
/10
7.5@
103
0.08
915
Wet
, med
ium
den
se to
loos
e, b
row
n fin
e sa
nd7
0.07
6L
7.5@
103
0.08
920
Wet
, med
ium
den
se to
loos
e, b
row
n fin
e sa
nd8
0.07
8L
7.5@
103
0.08
925
Wet
, med
ium
den
se, g
ray
grav
elly
sand
160.
077
N7.
5@10
30.
089
35W
et, m
ediu
m d
ense
, gra
y gr
avel
ly sa
nd13
0.07
4N
7.5@
103
0.08
940
Wet
, med
ium
den
se, g
ray
grav
elly
sand
130.
071
N7.
5@10
30.
089
45W
et, m
ediu
m d
ense
, gra
y gr
avel
ly sa
nd13
0.06
8N
Whi
te R
iver
@7.
5@16
30.
070
35W
et, m
ediu
m d
ense
, gra
y fin
e sa
nd4
0.05
7M
/NSH
67/
17.
5@16
30.
070
40W
et, m
ediu
m d
ense
, fin
e sa
nd9
0.05
5N
7.5@
163
0.07
050
Wet
, med
ium
den
se, b
row
n sa
nd a
nd g
rave
l7
0.05
0N
/47.
5@16
30.
070
10W
et, l
oose
, bro
wn
silty
sand
70.
053
N7.
5@16
30.
070
25W
et, l
oose
, bro
wn
clay
ey sa
nd3
0.05
9L
1 L - l
ique
fact
ion
M- m
argi
al li
quef
actio
nN
- liq
uefa
ctio
n no
t lik
ely

Tabl
e A-4
. Res
ults
of l
ique
fact
ion
pote
ntia
l ana
lysi
s for
Jan
uary
5, 1
843
eart
hqua
ke.
Site
/M
agni
tude
am
axD
epth
toD
escr
iptio
n of
Blo
w
Cyc
licR
esul
ts1
Bor
ehol
e@
Dis
tanc
eSu
scep
tible
Susc
eptib
le S
edim
ent
Cou
ntSt
ress
(km
)Se
dim
ent (
ft)
N1(
60)
Rat
ioC
ross
Cou
ntry
6.3@
300.
216
15Fi
ne, b
row
n sa
nd, w
et17
0.14
4N
Ditc
h @
SH
42
6.3@
300.
216
20Fi
ne, g
ray
sand
150.
154
N/5
222-
16.
3@30
0.21
625
Fine
, gra
y, w
ater
bea
ring
sand
, med
ium
com
pact
ion
190.
158
N/5
223-
16.
3@30
0.21
615
Fine
, gra
y sa
nd, w
et15
0.12
5N
6.3@
300.
216
20Fi
ne, g
ray,
wat
er b
earin
g sa
nd, m
ediu
m c
ompa
ctio
n15
0.13
6N
/522
3-4
6.3@
300.
216
26Fi
ne, g
ray
sand
, wet
90.
113
N6.
3@30
0.21
630
Fine
, gra
y, w
ater
bea
ring
sand
, med
ium
com
pact
ion
70.
116
NC
ross
Cou
ntry
6.5@
300.
254
15Fi
ne, b
row
n sa
nd, w
et17
0.16
9N
Ditc
h @
SH
42
6.5@
300.
254
20Fi
ne, g
ray
sand
150.
181
N/5
222-
16.
5@30
0.25
425
Fine
, gra
y, w
ater
bea
ring
sand
, med
ium
com
pact
ion
190.
186
N/5
2223
-16.
5@30
0.25
415
Fine
, gra
y sa
nd, w
et15
0.14
6N
6.5@
300.
254
20Fi
ne, g
ray,
wat
er b
earin
g sa
nd, m
ediu
m c
ompa
ctio
n15
0.16
0N
/522
3-4
6.5@
300.
254
26Fi
ne, g
ray
sand
, wet
90.
132
M/N
6.5@
300.
254
30Fi
ne, g
ray,
wat
er b
earin
g sa
nd, m
ediu
m c
ompa
ctio
n7
0.13
7L
1 L - l
ique
fact
ion;
M
- mar
gina
l liq
uefa
ctio
n;N
- liq
uefa
ctio
n no
t lik
ely

Tabl
e A-5
. Res
ults
of l
ique
fact
ion
pote
ntia
l ana
lysi
s for
Dec
embe
r 16
, 181
1 ea
rthq
uake
(M 7
.2, 7
.6, 8
.1).
Site
/M
agni
tude
am
axD
epth
toD
escr
iptio
n of
Blo
w
Cyc
licR
esul
ts1
Bor
ehol
e@
Dis
tanc
eSu
scep
tible
Susc
eptib
le S
edim
ent
Cou
ntSt
ress
(km
)Se
dim
ent (
ft)
N1(
60)
Rat
ioH
atch
ie
7.2@
550.
241
20gr
ay, m
ediu
m sa
nd20
0.26
6L
Rt 5
17.
2@55
0.24
119
fine
gray
sand
170.
268
L7.
2@55
0.24
129
fine
gray
sand
200.
244
L7.
2@55
0.24
114
fine
gray
sand
230.
280
N7.
2@55
0.24
124
med
ium
gra
y sa
nd18
0.25
6L
7.2@
550.
241
14fin
e br
own
and
gray
sand
230.
280
N7.
2@55
0.24
124
med
ium
gra
y sa
nd27
0.25
6N
7.2@
550.
241
19fin
e gr
ay sa
nd25
0.26
8N
7.2@
550.
241
29co
arse
gra
y sa
nd18
0.24
4L
Hat
chie
7.
6@55
0.27
720
gray
, med
ium
sand
200.
305
LR
t 51
7.6@
550.
277
19fin
e gr
ay sa
nd17
0.30
7L
7.6@
550.
277
29fin
e gr
ay sa
nd20
0.28
0L
7.6@
550.
277
14fin
e gr
ay sa
nd23
0.32
1L
7.6@
550.
277
24m
ediu
m g
ray
sand
180.
294
L7.
6@55
0.27
714
fine
brow
n an
d gr
ay sa
nd23
0.32
1L
7.6@
550.
277
24m
ediu
m g
ray
sand
270.
294
N7.
6@55
0.27
719
fine
gray
sand
250.
307
L7.
6@55
0.27
729
coar
se g
ray
sand
180.
280
L
Hat
chie
8.
1@55
0.31
120
gray
, med
ium
sand
200.
342
LR
t 51
8.1@
550.
311
19fin
e gr
ay sa
nd17
0.34
5L
8.1@
550.
311
29fin
e gr
ay sa
nd20
0.31
4L
8.1@
550.
311
14fin
e gr
ay sa
nd23
0.36
1L
8.1@
550.
311
24m
ediu
m g
ray
sand
180.
330
L8.
1@55
0.31
114
fine
brow
n an
d gr
ay sa
nd23
0.36
1L
8.1@
550.
311
24m
ediu
m g
ray
sand
270.
330
L8.
1@55
0.31
119
fine
gray
sand
250.
345
L8.
1@55
0.31
129
coar
se g
ray
sand
180.
314
L
1 L =
lique
fact
ion
likel
y;
N =
liqu
efac
tion
not l
ikel
y.

Tabl
e A-6
. Res
ults
of l
ique
fact
ion
pote
ntia
l ana
lysi
s for
Jan
urar
y 23
, 181
2 ea
rthq
uake
(M 7
.0, 7
.5, 7
.8).
Site
/M
agni
tude
am
axD
epth
toD
escr
iptio
n of
Blo
w
Cyc
licR
esul
ts1
Bor
ehol
e@
Dis
tanc
eSu
scep
tible
Susc
eptib
le S
edim
ent
Cou
ntSt
ress
(km
)Se
dim
ent (
ft)
N1(
60)
Rat
ioH
atch
ie
7.0@
100
0.10
620
gray
, med
ium
sand
200.
117
NR
t 51
7.0@
100
0.10
619
fine
gray
sand
170.
118
N7.
0@10
00.
106
29fin
e gr
ay sa
nd20
0.10
7N
7.0@
100
0.10
614
fine
gray
sand
230.
123
N7.
0@10
00.
106
24m
ediu
m g
ray
sand
180.
113
N7.
0@10
00.
106
14fin
e br
own
and
gray
sand
230.
123
N7.
0@10
00.
106
24m
ediu
m g
ray
sand
270.
113
N7.
0@10
00.
106
19fin
e gr
ay sa
nd25
0.11
8N
7.0@
100
0.10
629
coar
se g
ray
sand
180.
107
N
Hat
chie
7.
5@10
00.
128
20gr
ay, m
ediu
m sa
nd20
0.14
1N
Rt 5
17.
5@10
00.
128
19fin
e gr
ay sa
nd17
0.14
3N
7.5@
100
0.12
829
fine
gray
sand
200.
130
N7.
5@10
00.
128
14fin
e gr
ay sa
nd23
0.14
9N
7.5@
100
0.12
824
med
ium
gra
y sa
nd18
0.13
6N
7.5@
100
0.12
814
fine
brow
n an
d gr
ay sa
nd23
0.14
9N
7.5@
100
0.12
824
med
ium
gra
y sa
nd27
0.13
6N
7.5@
100
0.12
819
fine
gray
sand
250.
143
N7.
5@10
00.
128
29co
arse
gra
y sa
nd18
0.13
0N
Hat
chie
7.
8@10
00.
140
20gr
ay, m
ediu
m sa
nd20
0.15
4N
Rt 5
17.
8@10
00.
140
19fin
e gr
ay sa
nd17
0.15
5N
7.8@
100
0.14
029
fine
gray
sand
200.
141
N7.
8@10
00.
140
14fin
e gr
ay sa
nd23
0.16
2N
7.8@
100
0.14
024
med
ium
gra
y sa
nd18
0.14
8N
7.8@
100
0.14
014
fine
brow
n an
d gr
ay sa
nd23
0.16
2N
7.8@
100
0.14
024
med
ium
gra
y sa
nd27
0.14
8N
7.8@
100
0.14
019
fine
gray
sand
250.
155
N7.
8@10
00.
140
29co
arse
gra
y sa
nd18
0.14
1N
1 L =
lique
fact
ion
likel
y;
N =
liqu
efac
tion
not l
ikel
y.
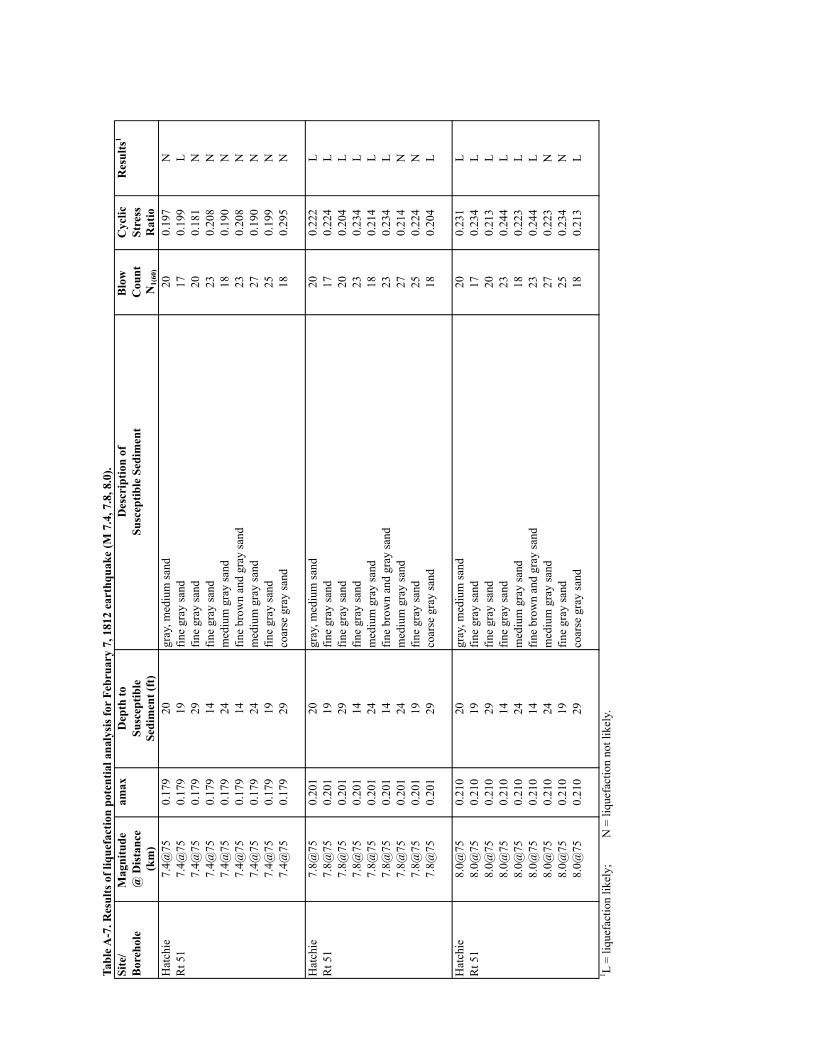
Tabl
e A-7
. Res
ults
of l
ique
fact
ion
pote
ntia
l ana
lysi
s for
Feb
ruar
y 7,
181
2 ea
rthq
uake
(M 7
.4, 7
.8, 8
.0).
Site
/M
agni
tude
am
axD
epth
toD
escr
iptio
n of
Blo
w
Cyc
licR
esul
ts1
Bor
ehol
e@
Dis
tanc
eSu
scep
tible
Susc
eptib
le S
edim
ent
Cou
ntSt
ress
(km
)Se
dim
ent (
ft)
N1(
60)
Rat
ioH
atch
ie
7.4@
750.
179
20gr
ay, m
ediu
m sa
nd20
0.19
7N
Rt 5
17.
4@75
0.17
919
fine
gray
sand
170.
199
L7.
4@75
0.17
929
fine
gray
sand
200.
181
N7.
4@75
0.17
914
fine
gray
sand
230.
208
N7.
4@75
0.17
924
med
ium
gra
y sa
nd18
0.19
0N
7.4@
750.
179
14fin
e br
own
and
gray
sand
230.
208
N7.
4@75
0.17
924
med
ium
gra
y sa
nd27
0.19
0N
7.4@
750.
179
19fin
e gr
ay sa
nd25
0.19
9N
7.4@
750.
179
29co
arse
gra
y sa
nd18
0.29
5N
Hat
chie
7.
8@75
0.20
120
gray
, med
ium
sand
200.
222
LR
t 51
7.8@
750.
201
19fin
e gr
ay sa
nd17
0.22
4L
7.8@
750.
201
29fin
e gr
ay sa
nd20
0.20
4L
7.8@
750.
201
14fin
e gr
ay sa
nd23
0.23
4L
7.8@
750.
201
24m
ediu
m g
ray
sand
180.
214
L7.
8@75
0.20
114
fine
brow
n an
d gr
ay sa
nd23
0.23
4L
7.8@
750.
201
24m
ediu
m g
ray
sand
270.
214
N7.
8@75
0.20
119
fine
gray
sand
250.
224
N7.
8@75
0.20
129
coar
se g
ray
sand
180.
204
L
Hat
chie
8.
0@75
0.21
020
gray
, med
ium
sand
200.
231
LR
t 51
8.0@
750.
210
19fin
e gr
ay sa
nd17
0.23
4L
8.0@
750.
210
29fin
e gr
ay sa
nd20
0.21
3L
8.0@
750.
210
14fin
e gr
ay sa
nd23
0.24
4L
8.0@
750.
210
24m
ediu
m g
ray
sand
180.
223
L8.
0@75
0.21
014
fine
brow
n an
d gr
ay sa
nd23
0.24
4L
8.0@
750.
210
24m
ediu
m g
ray
sand
270.
223
N8.
0@75
0.21
019
fine
gray
sand
250.
234
N8.
0@75
0.21
029
coar
se g
ray
sand
180.
213
L
1 L =
lique
fact
ion
likel
y;
N =
liqu
efac
tion
not l
ikel
y.

Tabl
e A-8
. Res
ults
of l
ique
fact
ion
pote
ntia
l ana
lysi
s for
hyp
othe
tical
loca
l ear
thqu
ake
(M 6
.0, 5
.5, 5
.25)
. Si
te/
Mag
nitu
de
amax
Dep
th to
Des
crip
tion
ofB
low
C
yclic
Res
ults
1
Bor
ehol
e@
Dis
tanc
eSu
scep
tible
Susc
eptib
le S
edim
ent
Cou
ntSt
ress
(km
)Se
dim
ent (
ft)
N1(
60)
Rat
ioH
atch
ie
6@10
0.80
020
gray
, med
ium
sand
200.
881
LR
t 51
6@10
0.80
019
fine
gray
sand
170.
889
L6@
100.
800
29fin
e gr
ay sa
nd20
0.81
0L
6@10
0.80
014
fine
gray
sand
230.
929
L6@
100.
800
24m
ediu
m g
ray
sand
180.
849
L6@
100.
800
14fin
e br
own
and
gray
sand
230.
929
L6@
100.
800
24m
ediu
m g
ray
sand
270.
849
L6@
100.
800
19fin
e gr
ay sa
nd25
0.88
9L
6@10
0.80
029
coar
se g
ray
sand
180.
810
L
Hat
chie
5.
5@10
0.55
120
gray
, med
ium
sand
200.
606
LR
t 51
5.5@
100.
551
19fin
e gr
ay sa
nd17
0.61
2L
5.5@
100.
551
29fin
e gr
ay sa
nd20
0.55
7L
5.5@
100.
551
14fin
e gr
ay sa
nd23
0.63
9L
5.5@
100.
551
24m
ediu
m g
ray
sand
180.
585
L5.
5@10
0.55
114
fine
brow
n an
d gr
ay sa
nd23
0.63
9L
5.5@
100.
551
24m
ediu
m g
ray
sand
270.
585
N5.
5@10
0.55
119
fine
gray
sand
250.
612
N5.
5@10
0.55
129
coar
se g
ray
sand
180.
557
L
Hat
chie
5.
25@
100.
446
20gr
ay, m
ediu
m sa
nd20
0.49
2N
Rt 5
15.
25@
100.
446
19fin
e gr
ay sa
nd17
0.49
6L
5.25
@10
0.44
629
fine
gray
sand
200.
452
N5.
25@
100.
446
14fin
e gr
ay sa
nd23
0.51
8N
5.25
@10
0.44
624
med
ium
gra
y sa
nd18
0.47
4L
5.25
@10
0.44
614
fine
brow
n an
d gr
ay sa
nd23
0.51
8N
5.25
@10
0.44
624
med
ium
gra
y sa
nd27
0.47
4N
5.25
@10
0.44
619
fine
gray
sand
250.
496
N5.
25@
100.
446
29co
arse
gra
y sa
nd18
0.45
2N
1 L =
lique
fact
ion
likel
y;
N =
liqu
efac
tion
not l
ikel
y.
Related Documents


