Sea Level and Its Rising Warren Wiscombe, NASA Goddard with assistance from Benjamin Chao, NASA Goddard and Bruce Douglas, International Hurricane Center & Florida International University, Miami

Sea Level and Its Rising Warren Wiscombe, NASA Goddard with assistance from Benjamin Chao, NASA Goddard and Bruce Douglas, International Hurricane Center.
Jan 02, 2016
Welcome message from author
This document is posted to help you gain knowledge. Please leave a comment to let me know what you think about it! Share it to your friends and learn new things together.
Transcript

Sea Level and Its Rising
Warren Wiscombe, NASA Goddard
with assistance fromBenjamin Chao, NASA Goddard
and Bruce Douglas, International Hurricane
Center &Florida International University, Miami

Apr 2005 Meto 401 2
Underwater stalactites are one of many kinds of evidence for big sea level changes over 1000s of years

Apr 2005 Meto 401 3
What has happened since end of last ice age?
Since 20K yr ago, sea level has risen over 120 m!

Apr 2005 Meto 401 4
Ice Sheet Coverage, Last Glacial Maximum
from Peltier (2000)
21,000 yrs ago

Apr 2005 Meto 401 5
Ice Sheet Coverage Today

Apr 2005 Meto 401 6
Estimates of global sea level change (m) over past 140,000 years show N. America is
biggest player

Apr 2005 Meto 401 7
interactive QT/VR movie

Apr 2005 Meto 401 8
Sea level rise has been much milder in the past few thousand years
Last 6000 yr: variations over a few hundred yr less than 0.3-0.5 m (most of ice has melted by this time)
1900s: 1-2 mm/yr (larger than in 1800s but no acceleration of rate)
2000: 2 mm/yr
But … best estimate is ~1 mm/yr
(hence the 2002 Physics Today article “The Puzzle of Sea Level Rise”)

Apr 2005 Meto 401 9
Movie: Sea Level Rise
Emphasizes Maldive Islands (S. of India) but most atoll-based islands face the same fate
Male, Maldives

Apr 2005 Meto 401 10
Tuvalu is also sinking

Apr 2005 Meto 401 11
Primary Impacts Of Sea Level Rise
• Increased flooding and storm damage
• Inundation of low-lying areas
• Higher water tables
• Salt intrusion into aquifers and surface waters
• Erosion of beaches and coastlines

Apr 2005 Meto 401 12
People huddle near the water...
• Two-thirds of the world's population lives within 500 km of a coastline.
• 80% of the world's population lives below 500 m elevation.
• This places an overwhelming majority of people at risk when sea levels rise.

Apr 2005 Meto 401 13
Last 300 yr (IPCC examples)

Apr 2005 Meto 401 14
Sea level is rising most
places, but not everywhere

Apr 2005 Meto 401 15
1900-1980 Sea Level averaged over 84 stations
Apr 2005 Meto 401 16
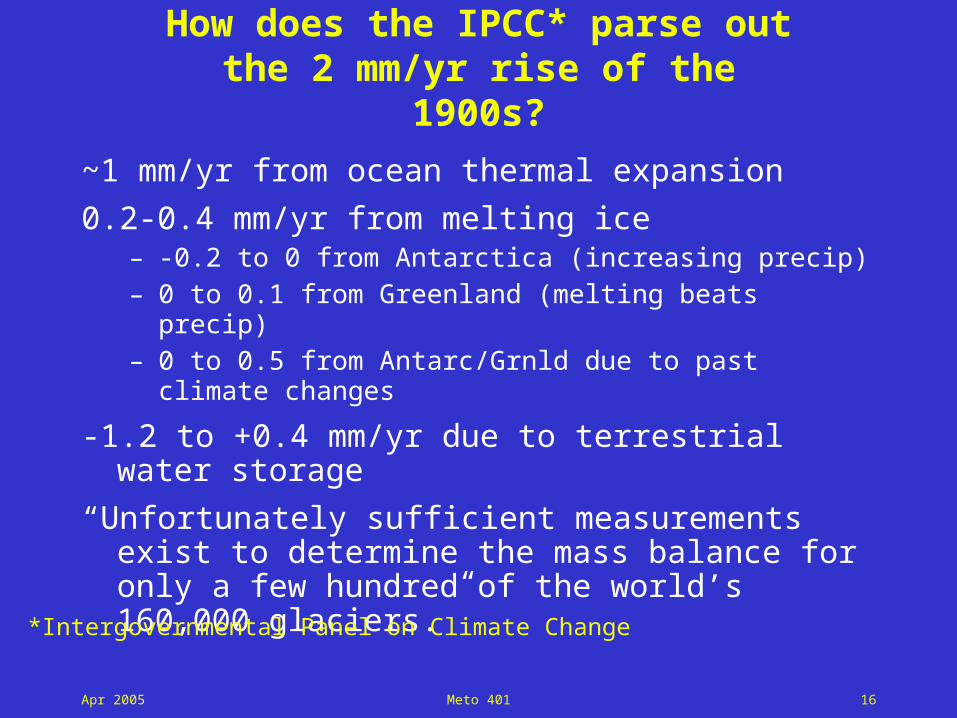
How does the IPCC* parse out the 2 mm/yr rise of the 1900s?
~1 mm/yr from ocean thermal expansion
0.2-0.4 mm/yr from melting ice– -0.2 to 0 from Antarctica (increasing precip)– 0 to 0.1 from Greenland (melting beats precip)– 0 to 0.5 from Antarc/Grnld due to past climate
changes
-1.2 to +0.4 mm/yr due to terrestrial water storage
“Unfortunately sufficient measurements exist to determine the mass balance for only a few hundred of the world’s 160,000 glaciers.”
*Intergovernmental Panel on Climate Change

Apr 2005 Meto 401 17
What does the IPCC project for the future?
Warming of ocean will continue even if greenhouse gases are stabilized; after 500 yr, this “steric” sea level rise still only half its ultimate value
Projections:1990-2100: 0.1 to 0.8 m risenext 500-1000 yr: 1-4 m rise for 4xCO2
W. Antarctic ice sheet in no immediate danger but if temperature rises enough to uncork its outflow glaciers, collapse could be more rapid
E. Antarctic ice sheet never melts in any scenario
Greenland or Antarctic melting would take milennia!

Apr 2005 Meto 401 18
Examples of sea level rises of 15 & 25 feet

Apr 2005 Meto 401 19
Climate modeling results from NCAR predict “committed sea level rise”
• Even if no more greenhouse gases were added to the atmosphere, globally averaged surface air temperatures would rise about 0.5C and global sea levels would rise another 11 cm from thermal expansion alone by 2100.
• “… we are committed to a significant amount of global warming and sea level rise because of the greenhouse gases we have already put into the atmosphere…”
• The projected sea level rise is twice the 5-cm rise that occurred during the latter half of the 20th century.
• These numbers do not take into account fresh water from melting ice sheets and glaciers, which could at least double the sea level rise caused by thermal expansion alone.

Apr 2005 Meto 401 20
Aerial photographs, Blackwater Wildlife Refuge, MD Eastern
Shore.
Note progressive drowning & loss of coastal marshes due to a higher than normal rate of sea level rise.

Apr 2005 Meto 401 21
In 1900, 15 families lived on the Poplar islands in Chesapeake Bay. Will be gone in a few years.
FDR and Truman were visitors in its days as a hunting club.
Apr 2005 Meto 401 22
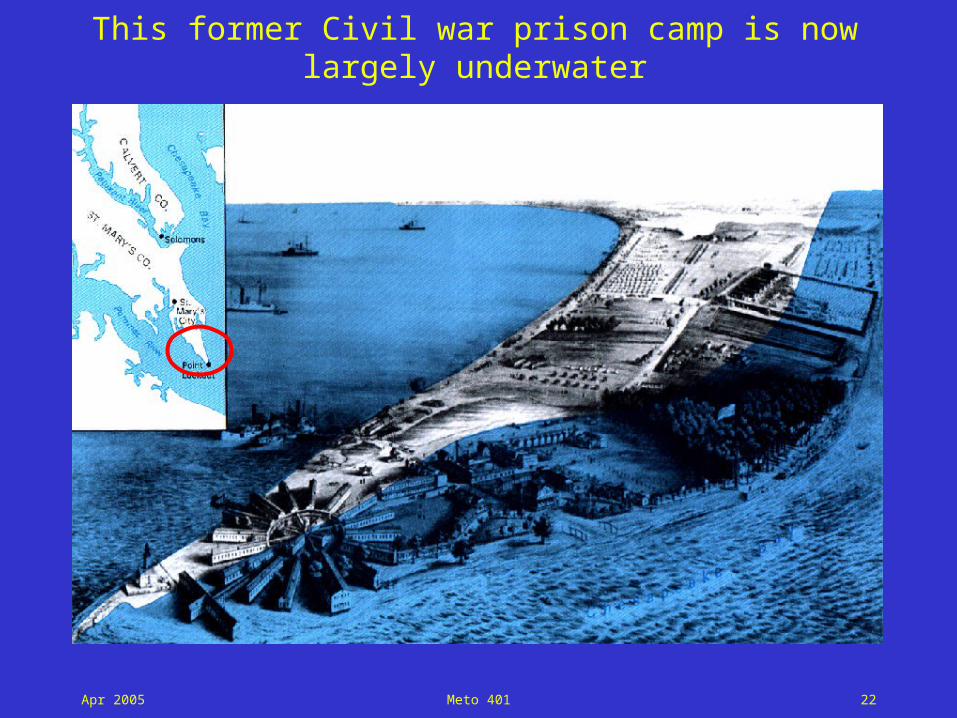
This former Civil war prison camp is now largely underwater

Apr 2005 Meto 401 23
Bruce Douglas, sea level expert
“The rate of sea level rise in the mid-Atlantic states is 3.5–4 mm/yr (about 2x the global average) because of post glacial rebound.
So if we want to see what a doubled rate of sea level rise would do to beaches and wetlands elsewhere..., we have only to look at the mid-Atlantic.
Louisiana is seeing rates of relative sea level rise as high as 10 mm/yr, and loses wetlands and beach at the rate of tens of acres/day.”

Apr 2005 Meto 401 24
Glacial Rebound is a local see-saw effect that can cause sea level to rise or fall
Maryland
Apr 2005 Meto 401 25
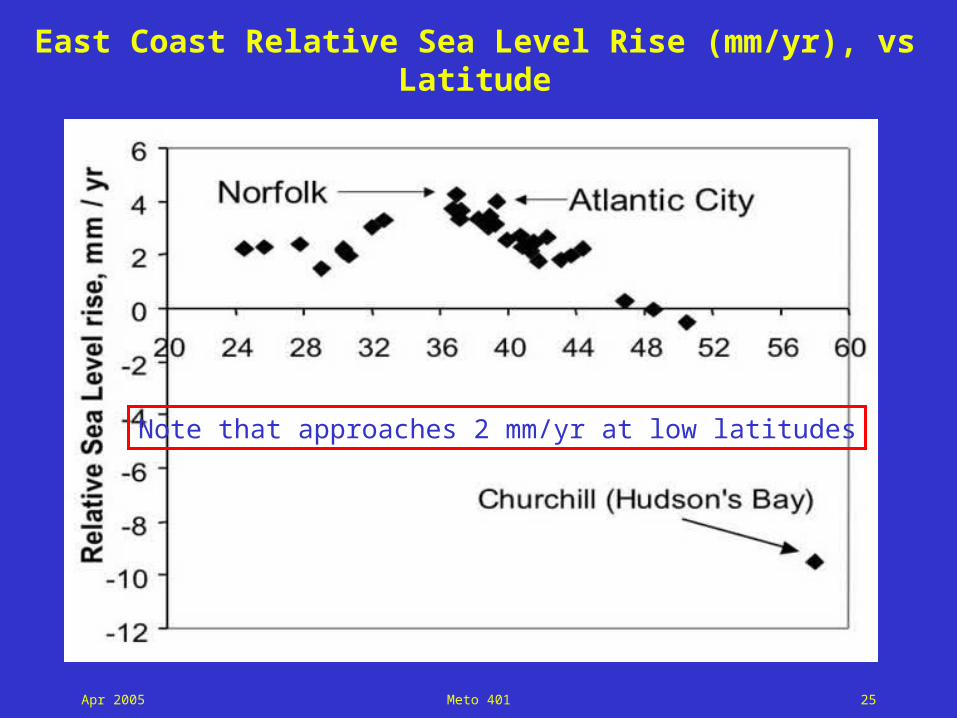
East Coast Relative Sea Level Rise (mm/yr), vs Latitude
Note that approaches 2 mm/yr at low latitudes

Apr 2005 Meto 401 26
Causes of sea level change?

Apr 2005 Meto 401 27
from IPCC Report

Apr 2005 Meto 401 28
Cause 1: Volume Change at Constant Mass
• “steric” (thermal + salinity)
• Local atmosphere-ocean thermal interactions make maps non-uniform
– El Nino, North Atlantic Oscillation, & other vacillations alter the pattern greatly
• Deep currents and thermohaline (vertical pump) circulations move heat around in 3D

Apr 2005 Meto 401 29
Summary: IPCC “Indicators of Warming”

Apr 2005 Meto 401 30
Temperature Change, last 1000 yr(the Mann “Hockey Stick” curve)

Apr 2005 Meto 401 31
The Surface Warming Evidence – IPCC
In some places there is a cooling! Why might this be?
Apr 2005 Meto 401 32
Show movie SST2001
SST (Sea Surface Temperature) varies a lot! Helps make sea level vary a lot from place to place, and makes regional predictions of sea level change difficult.

Apr 2005 Meto 401 33
Ocean heat
content is rising
change in global ocean heat content from the 1950s to the 1990s is equivalent to a net downwards surface heat flux of 0.3 W/m2 over the whole period
top 300 m of ocean

Apr 2005 Meto 401 34
Thermal-Expansion Sea Level Trends, 1955-96
From Cabanes, et al., 2001
upper 3000 m

Apr 2005 Meto 401 35
Cause 2: Mass Change
• Imbalance of precip (P) and evaporation (E) over ocean (P–E not zero)
• Land Hydrology — changes in– ice sheets, glaciers, permafrost– human-built reservoirs!– lakes, inland seas, wetlands, rivers– soil moisture, surface snow– groundwater
Hard to distinguish Cause 1 from Cause 2

Apr 2005 Meto 401 36
Greenland is thinning near the coast, thickening on the ice sheet
more or less what models would predict.
Apr 2005 Meto 401 37
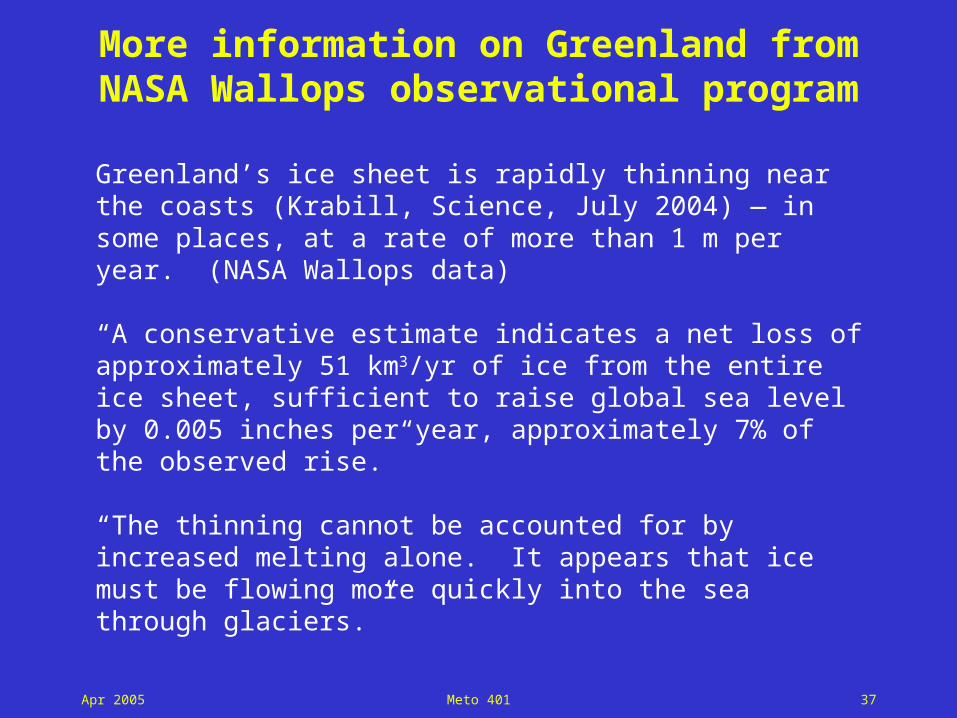
More information on Greenland from NASA Wallops observational program
Greenland’s ice sheet is rapidly thinning near the coasts (Krabill, Science, July 2004) — in some places, at a rate of more than 1 m per year. (NASA Wallops data)
“A conservative estimate indicates a net loss of approximately 51 km3/yr of ice from the entire ice sheet, sufficient to raise global sea level by 0.005 inches per year, approximately 7% of the observed rise.”
“The thinning cannot be accounted for by increased melting alone. It appears that ice must be flowing more quickly into the sea through glaciers.”

Apr 2005 Meto 401 38
East Coast Inundation if Greenland Melts
Red: land submergence for an estimated 5-m sea-level rise (equivalent to melting all Greenland ice).
It would take 1000 yr for Greenland to melt in place! Fast outflow glaciers could speed the process.
Apr 2005 Meto 401 39
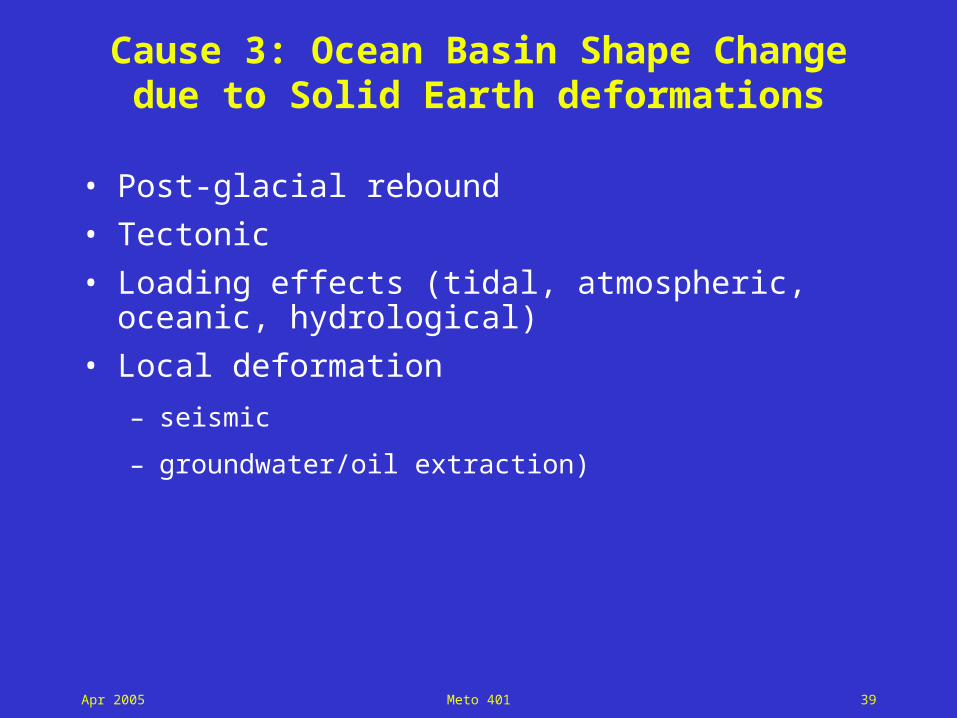
Cause 3: Ocean Basin Shape Change due to Solid Earth deformations
• Post-glacial rebound
• Tectonic
• Loading effects (tidal, atmospheric, oceanic, hydrological)
• Local deformation
– seismic
– groundwater/oil extraction)

Apr 2005 Meto 401 40
Cause 4: Dynamic Changes
• Waves
• Tides
• Currents:– Wind-driven, – Pressure-driven, – Density-driven (thermohaline)
• Geoid change-induced
• of peripheral concern for long time and/or space averages

Apr 2005 Meto 401 41
Dynamic changes overwhelm the small changes in sea level we are seeking to measure

Apr 2005 Meto 401 42
IPCC Ranges of Uncertainty in Factors Contributing to Sea Level Rise, 1910–90

Apr 2005 Meto 401 43
Why the change in rate?
Sea Level at Amsterdam
Holland is highly motivated to measure sea level accurately since it’s partly
below sea level !

Apr 2005 Meto 401 44
Relative Sea Level Rise (mm), New York
Apr 2005 Meto 401 45
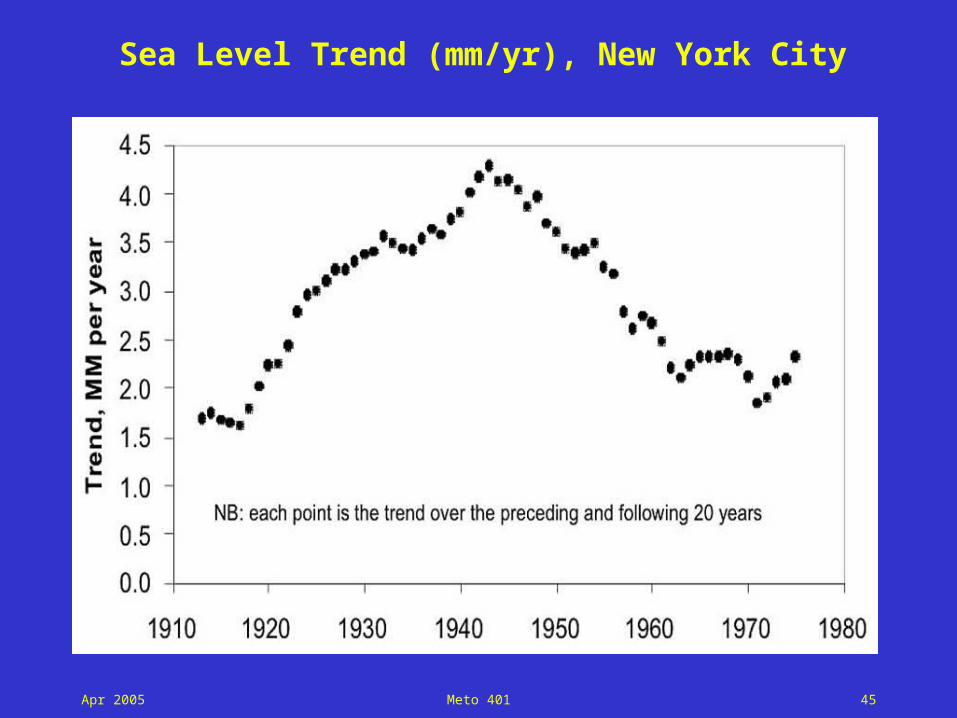
Sea Level Trend (mm/yr), New York City

Apr 2005 Meto 401 46
Annual Relative Sea Levels, Bermuda
Cabanes et al., 2001
fit to red points under-estimates longer-term trend by a factor > 2!

Apr 2005 Meto 401 47
Sea Level Trend (mm/yr) vs. Record Length
b in (SeaLev = a + bt + ct2)

Apr 2005 Meto 401 48
Acceleration of Sea Level Rise
c in (SeaLev = a + bt + ct2)
all atmos-ocean climate models show an acceleration in 1960-90 compared to whole century

Apr 2005 Meto 401 49
What kinds of observations are/will be used?
• Direct -- “geodetic”– Tide gauges/GPS (long history)– Radar altimetry (TOPEX & Jason satellites)– Laser altimetry (IceSAT satellite)– Time-variable gravity (GRACE satellite)– SAR/InSAR (Synthetic Aperture Radar; new)– GPS buoys (experimental)– GPS bistatic reflection (experimental)
• Sea surface temperature
• XBTs (eXpendable BathyThermographs) — dropped from ships; ocean temperature & salinity profiles

Apr 2005 Meto 401 50
Sea Level from Space

Apr 2005 Meto 401 51
Here’s what one swath of Jason altimeter data looks like
Apr 2005 Meto 401 52
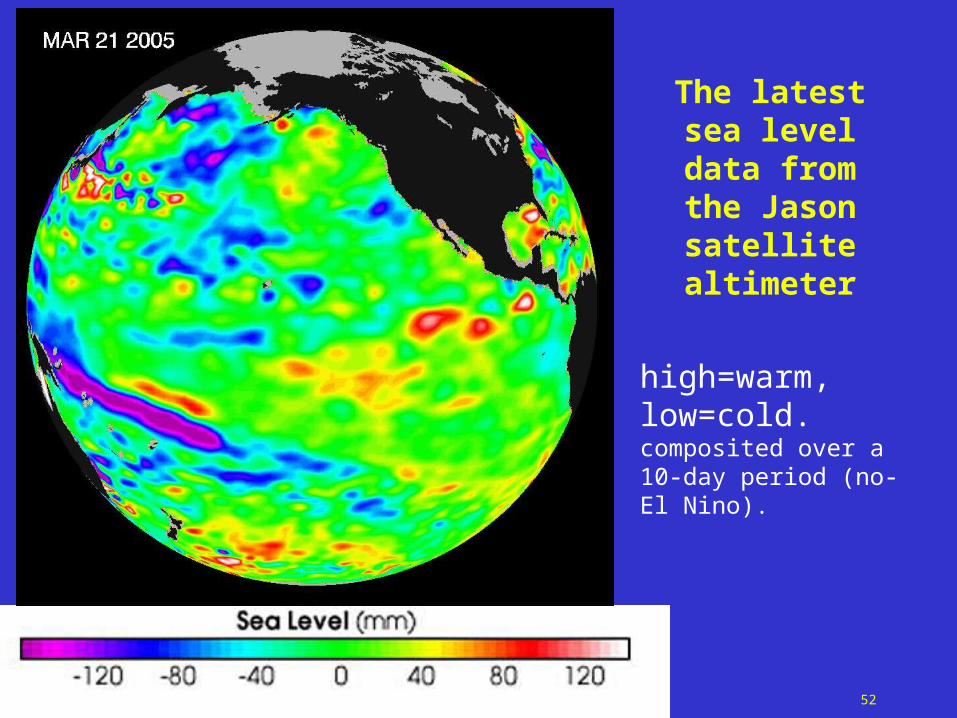
The latest sea level data from the Jason satellite altimeter
high=warm,low=cold.composited over a 10-day period (no-El Nino).

Apr 2005 Meto 401 53
Ocean dynamic topography is caused by winds and temperature

Apr 2005 Meto 401 54
Show movie OceanTopoAndDynam
Apr 2005 Meto 401 55
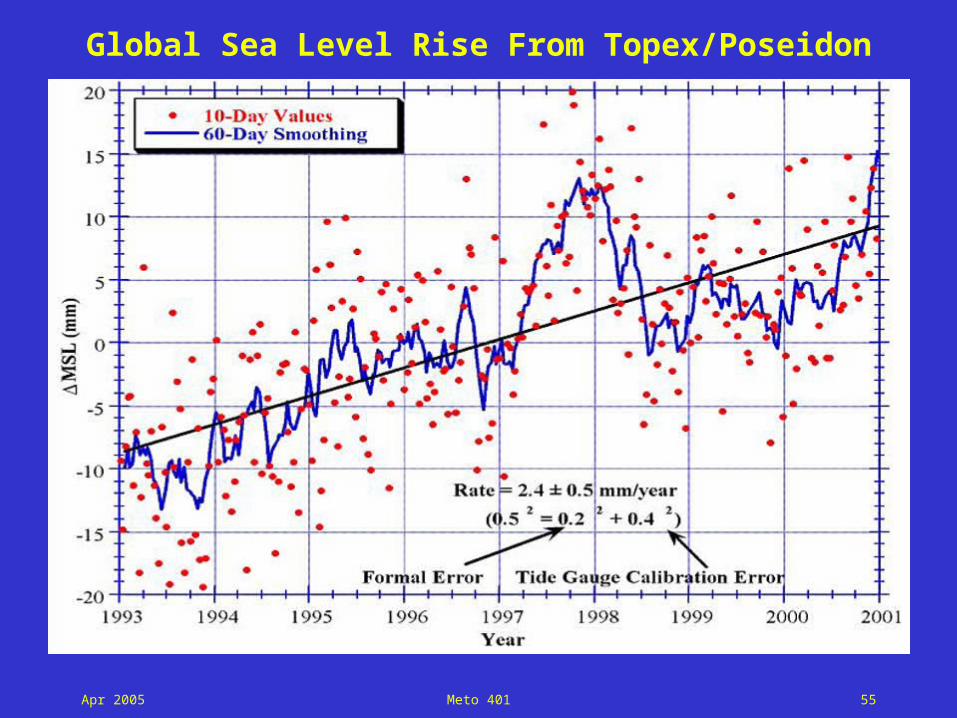
Global Sea Level Rise From Topex/Poseidon

Apr 2005 Meto 401 56
New satellite measurements would add ancillary information to the sea
level problem
• Mixed layer depth (no ideas yet)
• Ocean salinity (long wavelength radar)
• Soil moisture, snow depth (also long wavelength radar)
• (all very difficult observations by remote sensing)

Apr 2005 Meto 401 57
What’s Happening to Coastlines and Beaches?
Apr 2005 Meto 401 58
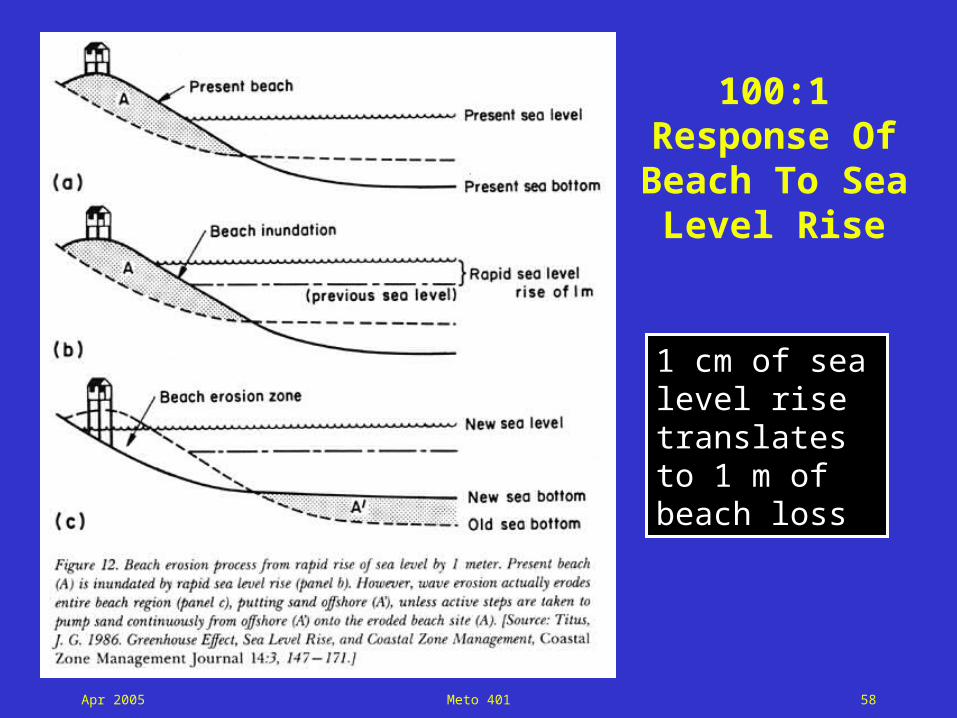
100:1 Response Of
Beach To Sea Level
Rise
1 cm of sea level rise translates to 1 m of beach loss

Apr 2005 Meto 401 59
Erosion Rate vs Sea Level Rise Rate

Apr 2005 Meto 401 60
From Galgano (1998)
State-by-state Summary Of Shoreline Behavior

Apr 2005 Meto 401 61
Future Sea Level Rise and Erosion
• Global sea level rose at ~ 2 mm/yr in 20th century,
• ...but perhaps 1 mm/yr equivalent has been stored in reservoirs, hiding a...
• 50% increase in rise rate since WWII.
• Ergo...global sea level rise and erosion rates could go up 3 or 4 times in the 21st century!

Apr 2005 Meto 401 62
Sea Level Monitoring Issues
• Has the rate of sea level rise increased in recent decades?
• How can the mass balance of the great polar ice masses be measured?
• Can we develop an erosion monitoring program to detect an increase?

Apr 2005 Meto 401 63
Backup

Apr 2005 Meto 401 64
Southern Oscillation Index, 1935–2000
Note the change of state after 1980.
Related Documents


