Sea Empress Cost-Benefit Project Final Report Research and Development Technical Report P119 ENVIRONMENT AGENCY

Welcome message from author
This document is posted to help you gain knowledge. Please leave a comment to let me know what you think about it! Share it to your friends and learn new things together.
Transcript
Sea Empress Cost-Benefit Project Final Report
Research and Development Technical Report
P119
ENVIRONMENT AGENCY

All pulps used in production of this paper is sourced from sustainable managed forests and are elemental chlorine free and wood free
Sea Empress Cost-Benefit Project
Technical Report P119
L Y Moore, A J Footitt; L M Reynolds, M G Postle;:P J Flyod, T Fenn S Virani
Research Contractor:.. Risk & Policy Analyts Ltd.:.
Further copies of this report are available from: Environment Agency R&D Dissemination Centre, c/o WRc, Frankland Road, Swindon, Wilts SN5 8YF WC tel: 01793-865000 fax: 01793-514562 e-mail: [email protected]

Environment Agency Rio House Waterside Drive Aztec West Bristol
BS32 4UD Tel: 01454.624400 Fax: 0 1454 624409 ‘.
IC Code: BDOQ
0 Environment Agency 1998
All rights reserved. No partof this document may be produced, stored in a retrieval system, or transmitted;. in any form or :by any means, electronic,. mechanical, photocopying, recording or otherwise without prior.permission of the Environment Agency,
The .views expressed in this document are not necessarily those of the:Environment Agency. Its officers, servant or agents- accept no liability whatsoever for any loss or damage arising from the interpretation or use of the information, or reliance upon views contained herein.
Dissemination status:. Internal: Released to Regions External: Released to the Public Domain
Statement of use This Technical Report fully describes a study with.the aim of developing monetary estimates of the economic impacts. arising from the Sea Empress oil spill- and clean-up, and identifying cost-effective risk.mitigation.measqres to prevent future spills. It will -be of interest to Water Quality staff -likely to be affected by .such. incidents when they arise, and- will also be of interest to organisations and- individuals outside the Agency who have an interest in ,XJK coastal waters.
Research Contractor ’ R&D Project PZ-100 was carried.out by:
Risk & Policy Analysts Ltd Farthing Green House 1 Beccles Road - Lodden Norfolk N-R14 6LT Tel: 01508.528465 Fax: 01508 520758
Environment Agency?s Project Manager The Agencyls Project Manager for R&D Project P2-loo-was:
Dr. Melanie Barton, Welsh Region
Additional Copies Further copies of this document may be obtained internally from Regional R&D Management Support Officers and externally from WRc plc (Tel: 01793 511711 .Fax: 01793 514562).
R&D Technical Report P 1-l 9
FOREWORD
The Sea Empress incident resulted in the release of 72 000 tonnes of crude oil, the pollution of.. around 200 kilometres of coastline -and’ the implementation~~ of a ban on. commercial and recreational fishing in the affected area. This, in.turn, led to costs to: the tourism.industry;. recreational activities; commercialfkheries; the environment; and human health. :
This report, commissioned by the Environment Agency, provides an estimate of the monetary value of the financial and economic impacts of.the Sea Empress oil spill and- describes the : approaches used to value. these impacts. It also quantifies the likelihood of a similar incident. : occurring in the future in UK waters. Financial costs of the incident are estimated to be between $60 million and&l 14 million, .withthe majority of these (249 million to &58 million) arising from the clean-up and salvage operations and fi-om the lost cargo and the repair of the Sea.Empress.. Economic costs range between &75 million and &106 million, with a value of between &23 million and.&35 million estimated for environmental impacts.
ACKNOWLEDGEMENTS
We, the authors, would like to thank SEEEC for allowing us previews of its Final Report and other documents. We would also like to thank the many other individuals and organisations that provided information for this study.
R&D Technical Report P119 : i

R&D Technical Report P119
CONTENTS
FOREWORD ACKNOWLEDGEMENTS GLOSSARY OF ECONOMIC TERMS EXECUTIVESUMMARY KEYWORDS
1. INTRODUCTION 1.1 Background to the Study 1.2 The Study Objectives and Approach .. 1.3 The Cost-Benefit Analysis Approach 1.4 The Risk:Assessment Approach 1.5 Structure of the Report
2. TEIE,OIL SPILL ANI) AFFECTED AREA 2.1 The Grounding of the Sea Empress and Subsequent Oil Spill ‘. 2.2 Brief Summary of Response and Fate of Oil 2.3 Overview of Impacts
3. 3.1 3.2 3.3 3.4
CLEAN-UP ANDSALVAGE COSTS The Nature of Clean-up and Salvage Costs Compensation under the International-Oil Pollution Compensation Fund Other Costs Total Costs for Clean-up and Salvage
4. 4.1 4.2 4.3 4.4 4.5
TOURISM Pembrokeshire and Tourism The Impacts of the Sea Empress Oil S$l Compensation under the 1971 Fund : Other Cost Estimates Summary of Costs to .Tourism
5. 5.1 5.2 5.3 5.4
RECREATION Recreational Activities in Pembrokeshire Impacts of the Sea Empress Incident on Recreational Activities Valuation of Impacts Summary of Costs to Recreational Activity-.
6. 6.1 6.2 6.3 6.4 6.5 6.6
COMMERCIAL FISHEXIES The Nature of Commercial Fisheries Overview of Impacts Claims to the 1971 Fund: Data from the South Wales Sea Fisheries Committee The Valuation of Costs Arising.tiom the.Sea Empress Oil Spill : Summary of Costs to Commercial Fisheries
Page
i i . . .
vm xi
xx
l-l l-l 1-2 l-6 l-6
2-l 2-l 2-2
3-1 3-2 3-4 . 3-7
4&l 4-6 4-9
4-12 4-13
5-l 5-10 5-13 5-19
6-l 6-2. 6-4 6-6
6-10 . . 6-13 :
R&D Technical Report .P119 : . . . Ill ”
CONTENTS (cont.)
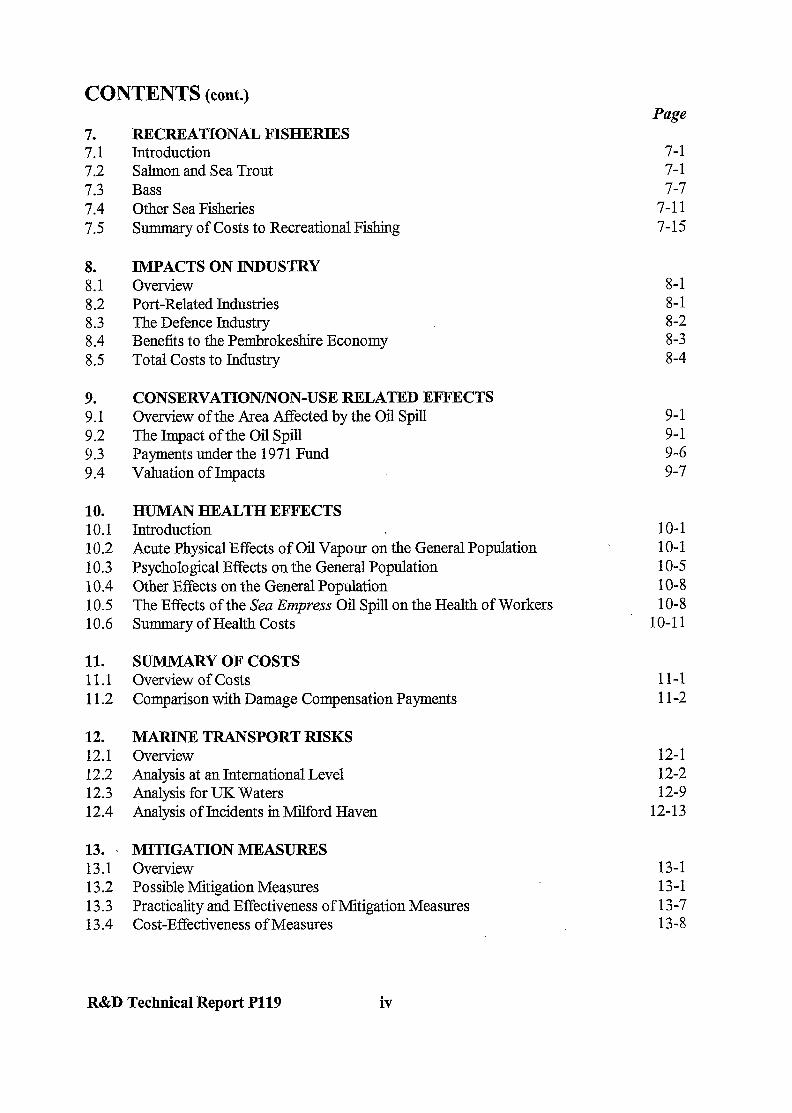
7. 7.1 7.2 7.3 7.4 7.5
RECREATIONAL FISHERIES Introduction Salmon and Sea Trout Bass Other Sea Fisheries Summary of Costs to Recreational Fishing
8. 8.1 8.2 8.3 8.4 8.5
IMPACTS ON INDUSTRY Overview Port-Related Industries The Defence Industry Benefits to the Pembrokeshire Economy Total Costs to Industry
9. CONSERVATION/NON-USE RELATED EFFECTS 9.1 Overview of the Area Affected by the Oil Spill 9.2 The Impact of the Oil Spill 9.3 Payments under the 1971 Fund 9.4 Valuation of Impacts
10. 10.1 10.2 10.3 10.4 10.5 10.6
HUMAN HEALTH EFFECTS Introduction Acute Physical Effects of Oil Vapour on the General Population Psychological Effects on the General Population Other Effects on the General Population The Effects of the Sea Empress Oil Spill on the Health of Workers Summary of Health Costs
11. SUMMARY OF COSTS 11.1 Overview of Costs 11.2 Comparison with Damage Compensation Payments
12. 12.1 12.2 12.3 12.4
MARINE TRANSPORT RISKS Overview Analysis at an International Level Analysis for UK Waters Analysis of Incidents in Milford Haven
13. 13.1 13.2 13.3 13.4
MITIGATION iMEASURES Overview Possible Mitigation Measures Practicality and Effectiveness of Mitigation Measures Cost-Effectiveness of Measures
Page
7-l 7-l 7-7
7-11 7-15
8-l 8-l 8-2 8-3 8-4
9-l 9-l 9-6 9-7
10-l 10-l 10-5 10-8 10-8
10-11
11-1 11-2
12-1 12-2 12-9
12-13
13-1 13-1 13-7 13-8
R&D Technical Report Pll9 iv
CONTENTS (cont.). Page
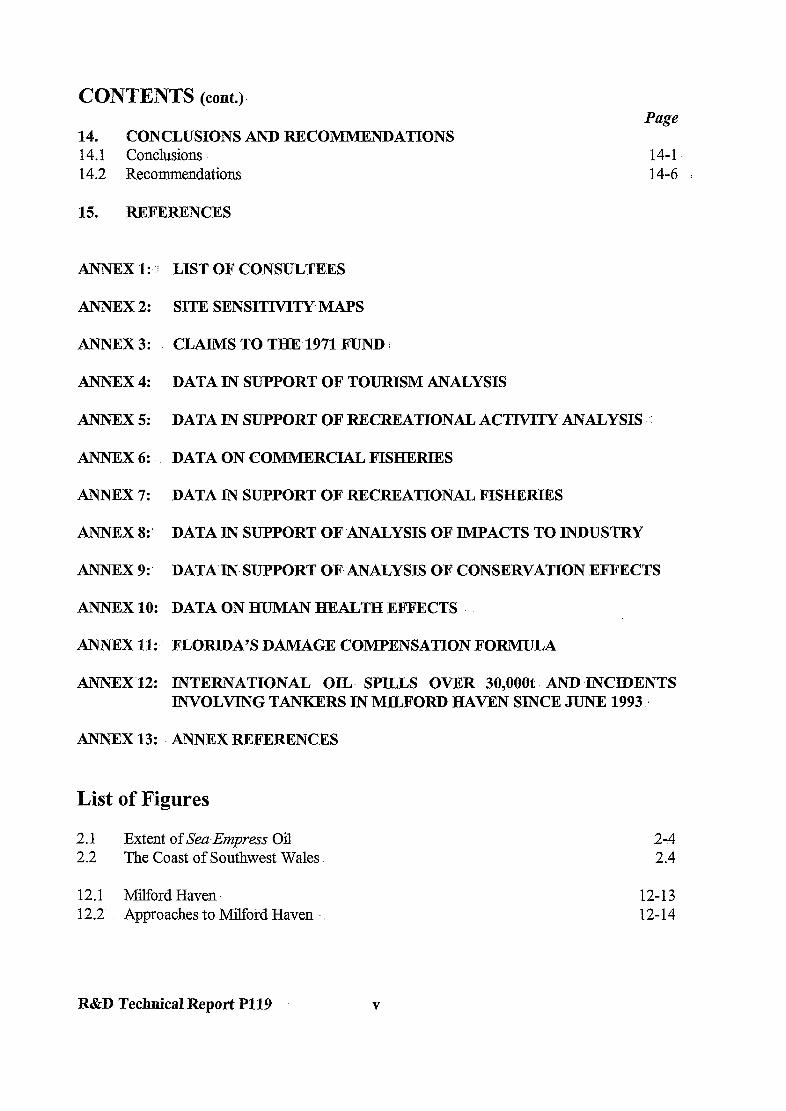
14. CONCLUSIONS AND RECOMMENDATIONS 14.1 Conclusions 14.2 Recommendations
14-1 14-6
15. REFERENCES
ANNEX 1: ‘i
ANNEX 2:
ANNEx3:
ANNEx4:
ANNEX 5:
ANNEX 6:
ANNEX 7:
ANNEX 8:'
ANNEX 9:.
ANNEX 10:
LIST OF CONSULTEES
SITE SENSITIVITY MAPS.
CLAIMS TO THE 1971 FUND
DATA IN SUPPORT OF TOURISM ANALYSIS
DATA IN SUPPORT OF RECREATIONAL ACTlVlTY~ ANALYSIS ‘.
DATA ON COMMERCIAL FISHERIES
DATA IN SUPPORT OF RECREATIONAL FISHERIES
DATA IN SUPPORT OF ANALYSIS OF IMPACTS TO INDUSTRY
DATA‘INSUPPORT OF’ANALYSIS OF CONSERVATION EFFECTS
DATA ON HUMAN HEALTH EFFECTS
ANNEX 11:. FLORIDA’S DAMAGE.COMPENSATION FORMULA
ANNEX.12: INTERNATIONAL OIL SPILLS OVER 30,00Ot,. AND.INCIDENTS INVOLVING TANKERS IN MILFORD HAVEN SINCE JUNE 1993 :
ANNEX 13: ANNEX REFERENCES
List of Figures
2.1 Extent of Sea Emprexs Oil 2-4 2.2 The Coast of Southwest Wales. 2.4
12.1 Milford Haven 12-13 12.2. Approaches to Milford Haven 12-14
R&D Technical Report Pl19
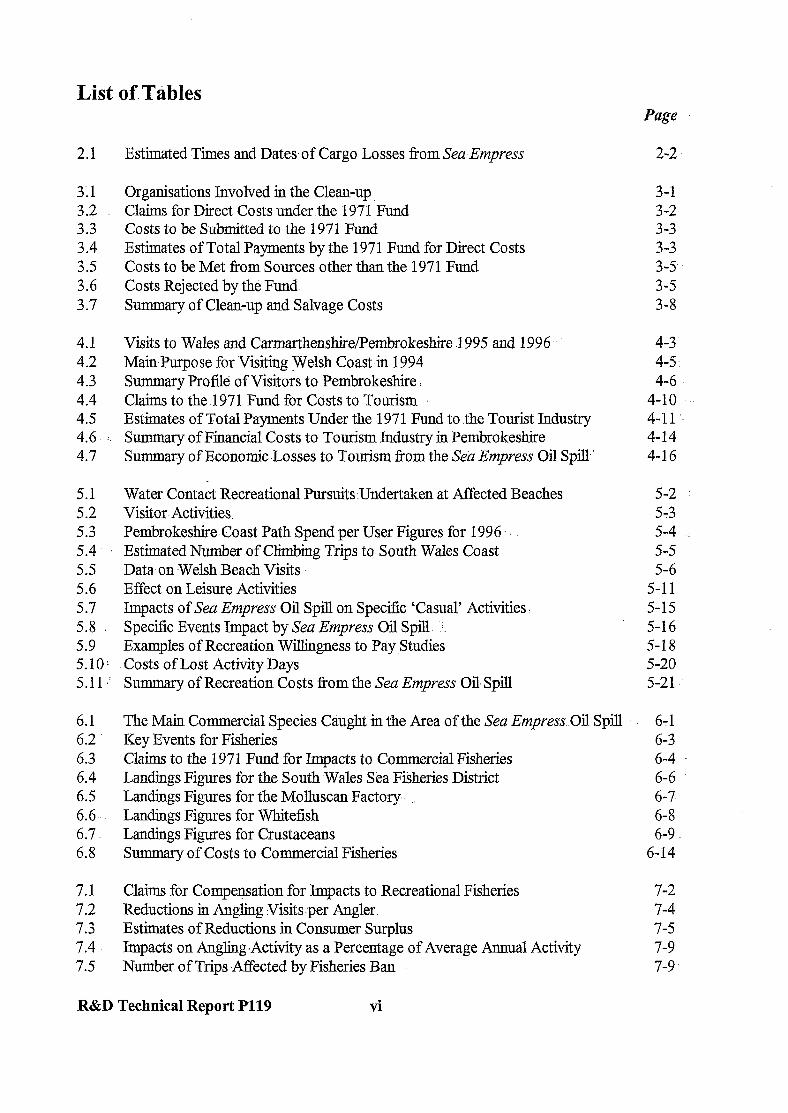
List of. Tables
2.1 Estimated Times and Datesof Cargo Losses horn Sea Empress 2-2
3.1 Organisations Involved in the Clean-up. 3-l 3.2 Claims for Direct Costs under the 1971 Fund 3-2 3.3 Costs to be Submitted to the 1971 Fund 3-3 3.4 Estimates of Total Payments by the 1971 Fund for Direct Costs 3-3 3.5 Costs to be Met from Sources other than the 1971 Fund 3-5 3.6 Costs Rejected by the Fund 3-5 3.7 Summary of Clean-up and-Salvage Costs 3-8
4.1 Visits to Wales and Carmarthen&ire/Pembrokeshire l995 and 1996 4-3 4.2 MainPurpose for Visiting Welsh Coast in 1994 4-5. 4.3 Summary Profile of Visitors to Pembrokeshire 4-6 4.4 Claims to the 1971 Fund for Costs to Tourism 4-10 .’ 4.5 Estimates of Total Payments Under the 1971 Fund to the Tourist Industry 4-11’. 4.6 Summary of Financial Costs to Tourism Industry in Pembrokeshire 4-14. 4.7 Summary of Economic-Losses to Tourism from the Sea Empress Oil Spill.’ 4-16
5.1 Water Contact Recreational Pursuits Undertaken at Affected Beaches 5-2 5.2 Visitor Activities. 5t3 5.3 Pembrokeshire-Coast Path Spend per User Figures for 1996 5-4. 5.4 Estimated Number of Climbing Trips to South- Wales Coast 5-5 5.5 Data on Welsh Beach Visits 5-6 5.6 Effect on Leisure Activities 5-11 5.7 Impacts of Sea Empress Oil Spill on Specific ‘Casual’ Activities ! 5-15 5.8 Specific Events Impact by Sea Empress Oil Spill :: 5-16 5.9 Examples of Recreation Willingness to Pay Studies 5-18 5.10 : Costs of Lost Activity Days 5-20 5.11.. Summary of Recreation Costs from the Sea Empress Oil Spill 5-21.
6.1 6.2 6.3 6.4 6.5 6.6 6.7. 6.8.
The Main Commercial Species Caught in the Area of the Sea Empress. Oil Spill Key Events for Fisheries Claims to the 1971 Fund for Impacts to Commercial Fisheries Landings Figures for the South-Wales Sea Fisheries District Landings Figures for the Molluscan Factory _. Landings Figures for Whitefish Landings Figures for Crustaceans Summary of Costs to Commercial Fisheries
7.1 Claims for Compensation-for Impacts to Recreational Fisheries 7-2 7.2 Reductions in Angling Visits -per Angler 7-4 7.3 Estimates of Reductions in Consumer Surplus 7-5 7.4 Impacts on Angling~Activity as a Percentage of Average Annual Activity 7-9 7.5 Number of Trips AfXected by Fisheries Ban -’ 7-9
R&D Technical Report Pl19 vi
Page
6-l 6-3 6-4 6-6 6-7 6-8 6-9
6-14
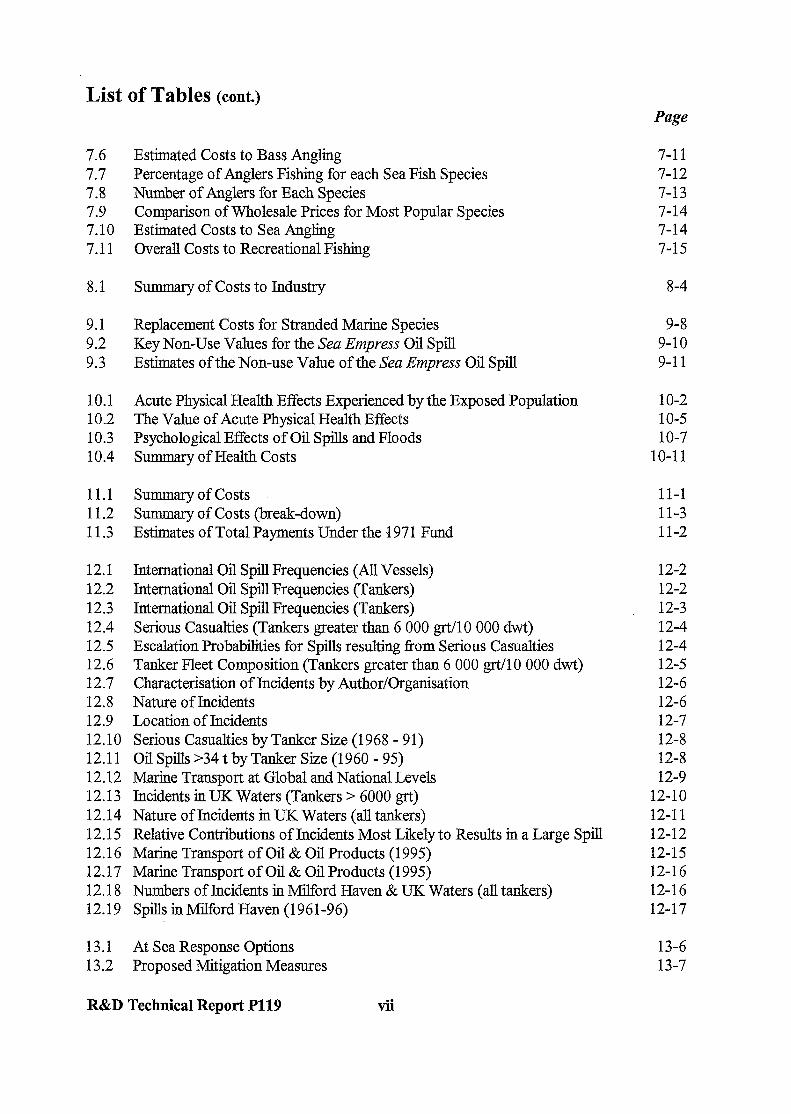
List of Tables (cont.) Page
7.6 Estimated Costs to Bass Angling 7-l 1 7.7 Percentage of Anglers Fishing for each Sea Fish Species 7-12 7.8 Number of Anglers for Each Species 7-13 7.9 Comparison of Wholesale Prices for Most Popular Species 7-14 7.10 Estimated Costs to Sea Angling 7-14 7.11 OveraJl Costs to Recreational Fishing 7-15
8.1 Summary of Costs to Industry 8-4
9.1 Replacement Costs for Stranded Marine Species 9-8 9.2 Key Non-Use Values for the Sea Empress Oil Spill 9-10 9.3 Estimates of the Non-use Value of the Sea Empm.ss Oil Spill 9-l 1
10.1 Acute Physical Health Effects Experienced by the Exposed Population 1 o-2 10.2 The Value of Acute Physical Health Effects 10-5 10.3 Psychological Effects of Oil Spills and Floods 10-7 10.4 Summary of Health Costs 10-l 1
11.1 summary of costs 11-l 11.2 Summary of Costs (break-down) 11-3 11.3 Estimates of Total Payments Under the 1971 Fund 11-2
12.1 12.2 12.3 12.4 12.5 12.6 12.7 12.8 12.9 12.10 12.11 12.12 12.13 12.14 12.15 12.16 12.17 12.18 12.19
International Oil Spill Frequencies (All Vessels) International Oil Spill Frequencies (Tankers) International Oil Spill Frequencies (Tankers) Serious Casualties (Tankers greater than 6 000 grt/lO 000 dwt) Escalation Probabilities for Spills resulting from Serious Casualties Tanker Fleet Composition (Tankers greater than 6 000 grt/lO 000 dwt) Characterisation of Incidents by Author/Organisation Nature of Incidents Location of Incidents Serious Casualties by Tanker Size (1968 - 91) Oil Spills ~34 t by Tanker Size (1960 - 95) Marine Transport at Global and National Levels Incidents in UK Waters (Tankers > 6000 grt) Nature of Incidents in UK Waters (all tankers) Relative Contributions of Incidents Most Likely to Results in a Large Spill Marine Transport of Oil & Oil Products (1995) Marine Transport of Oil & Oil Products (1995) Numbers of Incidents in Milford Haven & UK Waters (all tankers) Spills mMilford Haven (1961-96)
12-2 12-2 12-3 12-4 12-4 12-5 12-6 12-6 12-7 12-8 12-8 12-9
12-10 12-11 12-12 12-15 12-16 12-16 12-17
13.1 At Sea Response Options 13-6 13.2 Proposed Mitigation Measures 13-7
R&D Technical Report Pl19 vii

GLOSSARY OF ECONOMIC TERMS
Capitalised value: the sum of the discounted values of a future stream of costs or receipts - a once off value (as for property)
Catastrophic event: that which has a sudden, dramatic and, -widespread .impact upon the environment :
Complementary goods: those which are purchased along with another good (for example petrol with a car)
Consumer surplus: the difference between the -amount. paid for a good or service and the maximum amount that an individual would be willing to pay
Contingent valuation method. (CVMJ: ‘a social survey technique used to derive values -for environmental change by estimating people’s willingness to pay (or to accept compensation) .for. a specified effect
Cost-benefit. analysis (CBA): a form of economic analysis in which zests and benefits are converted into money values :for comparison
Demand function: an algebraic, expression of the demand schedule with values expressed for all .. factors affecting demand
Demand schedule:.a table showing the level of demand for a good at various.prices
Discounting: converts future zests and benefits into comparable units (present value). ::The discount rate is set by the:Treasury at 6%
Dose-response technique: determines the: economic. value . . of changes in, say, pollutant ‘. concentrations by estimating the market value of the resulting changes in output
Economic analysis: aimed at evaluating all of the effects of a policy or project and valuing them. in national-resource terms. Takes place in a with and without fi-amework
Economic rent: a payment in excess of what is necessary to keep to.its present employment
Existence-:values: values- which result from an individual’s- altruistic desire to .ensure that an environmental asset is preserved and continues to exist into the future (a non-use value)
Externalities: goods which remain unpriced and-thus are external to the’market (i.e. free goods such as those relating to-the environment, with an example being pollution)
Financial analysis: aimed at determinin g the.cash flow implications of a policy or a project to the commissioning organisation and ensuring that these are sustainable in ‘that sufficient funds are generated to meet outflows
R&D Technical Report Pll9 . . . vlll,

Hedonic pricing method @PM): an implicit price for an environmental attribute is estimated from consideration of the real markets in which the attribute is effectively traded (e.g. water quality improvements and property values)
Implicit price: the opportunity cost of the use of resources that a producer already owns
lIntrinsic/inherent values: related to existence values and are those which are said to reside in non- human biota and which are not related to any form of human satisfaction
Irreversible effects: e.g. the loss of a unique natural feature, an ecosystem or species and very long-term changes to the natural environment
Market price approach: in a perfectly competitive market the market pr$ce of a good provides an appropriate estimate of its economic value. In markets which are not perfectly competitive, economic value is calculated by removal of subsidies or other price distortions
Neo-classical economics: an economic theory which uses the general approach methods and techniques of the original nineteenth century economists
Net present value (NET): the present value (i.e. in year 0) of the difference between the discounted stream of benefits and the discounted stream of costs
Non-use value: values which are not related to direct or indirect use of the environment (option, ’ existence and bequest values)
Opportunity cost: the value of a resource in its next best alternative use
Option value: value to a consumer of retaining the option to consume a good
Protest votes: the responses ofthose who refuse to take part in a contingent valuation survey (e.g. those who refuse to value the environment because it is priceless)
Replacement costs approach: impacts on environmental assets are measured in terms of the cost of replacing or recreating that asset
Residual value: the remaining value of an asset at the end of the analysis
Resource costs/values: cost of marketed goods or services (adjusted to economic prices) used as inputs to, or consumed as a consequence of an action
Scarce resources: resources available are insufficient to satisfy wants
Sensitivity analysis: key assumptions and values are varied so as to determine their effect on the choice of best option
Social benefit: the sum of the gains or benefits from an activity
R&D Technical Report P119 ix
Social cost: the sum:of money:which is just.enough when:paid,as compensationto restore all losses to their utility level
Sustainable development: some acceptable measure of national well being (e.g. gross national product or some other agreed measure of welfare) which is.at least-constant and preferably rising over time.
Total economic value (TIN): the sum of use values (direct and indirect) plus non-use values (option, bequest and.existence)
Transfer payment: a payment .for .which no good -or service is obtained.in return; .e.g.- a tax or subsidy.
Travel cost method (TCM): the benefits arising form the recreational use of a site are estimated interms of the costs incurred in travel to the site
Uncertainty: stems. from a lack of information, scientific knowledge or ignorance. and is characteristic of all predictive assessments
Use vahie:,a value related to the actual direct or indirect use of the environment (e.g. recreational values)
Utility: the satisfaction an individual receives fromthe use, access to or existence of a good.
Willingness to accept (WTA): (also willingness to sell) the amount an individual will take in lieu of being able to partake in an activity for.a given length of time (usually. a year, or season) B
Willingness to pay (WTP): the valuation placed by an individual on a good or service interms of money
With and without framework: economic analysis considers the costs and benefits both with and. without a proposed option The without option is sometimes known as the do- nothing option
R&D Technical Report Pll9 X
EXECUTIVE SUMMARY
INTRODUCTION
On 15 February 1996; the Sea Empress ran aground on its approach to the Port ofMilford Haven, resulting in the loss of72 000 tonnes (t) of crude oil which subsequently impacted 200 kilometres of the South.Wales coastline. The area affected was of considerable conservation importance, being associated witha large number of designated sites including two NationalNature Reserves and a Marine Nature Reserve. Much of the affected coastline lies within the Pembrokeshire Coast National Park which was designated largely for its coastal Iandscape.
The majority of the oiled area was clean by May 1996, the operation involving at its peak over 1000 workers. The bulk of the o&for example that,at high priority sites, was removed by the end .. of February and early March. However;.partly as a result of storms, some cleaned. areas .were subsequently re-oiled. Some oiled areas have been left to clean themselves naturally, while other cleaned areas continued to contain patches of deep sub-surface oil residues over one year after the incident.
Some local industries were particularly affected by the spill. For example, the area has a thriving tourist industry which is closely linked to the coastal environment and its excellentwatersports opportunities. The number of tourists visiting the area was lower than predicted from recent .. trends and limited access to beaches owing to the oil and clean-up operations affected both local and visitor recreational activities. The local economy also has an historical reliance on harvests from commercial fisheries. Following the spill, Fisheries Exclusion Orders caused the’cessation : of all commercial and recreational fishing activity in a designated area a&in all associated rivers and. streams. Having been removed in nine stages, parts of the ban were stillin place until September 1997. In addition to these costs, health effects were reported by the clean-up workers as well as the general Population;..
In early 1997; the Environment Agency (EA) commissioned Risk & Policy Analysts Limited to develop monetary estimates of the economic impacts of the Sea Empress oil spill and clean-up, and to quantify the risks associated with the movement of oil in UK waters.: The,results of this work are to be used in identifying cost-effective risk mitigation measures to prevent future spills.
Key sources of data were the International Oil Pollution-Compensation (IOPC) Fund,: the! Sea Empress Environmental -Evaluation Committee (SEEEC) Final. Report and -the reports., of ’ individual SEEEC projects. These were augmented-by wider literature review and consultation. Whilst several factors acted as major barriers to rapid and efficient data gathering; it has still been possible to place a monetary value on many of the impacts arising corn the Sea Empress incident : and to quantify risks associated with the seabome transport of oil in UK-waters.
For economic impacts, the.valuation approach was that of social cost-benefit analysis (CBA) which& described below. For the risks associated with the movement of oil, data on the number and-nature of vessels, their cargoes, operational characteristics of the port, etc. were combined- with the numbers of past incidents and accidents to derive ‘expected’ incident and accident rates. Thus it was possibleto establish whether actual accident rates for UK waters differ. signiiidantly ,j from the expected;
R&D Technical Report Pll9 “::I xi
COST-BENEFIT ANALYSIS
CBA is based on the principles of neo-classical welfare economics which is concerned with the allocation of scarce resources. It provides a rational and systematic framework for evaluating actions by expressing all potential impacts in a directly comparable unit of measurement, that of money. Thus, all costs and benefits are treated in the same manner, ensuring that environmental and social effects are given equal consideration to private sector gains and losses. CBA therefore extends beyond financial analysis, by analysing the implications of an action from a social perspective. As an economic analysis of costs and benefits, CBA differs f?om the tinancial analysis in three main respects: (1) it places a monetary value on impacts which normally fall outside the marketplace such as environmental costs and benefits - for example, conservation effects; (2) it is concerned with changes in profit and not changes in income - for example, commercial fisheries; and (3) it estimates net national losses by taking into account the potential shift of activities elsewhere - for example, tourism
Of relevance to this study is the concept of ‘total economic value’ (TEV) of an environmental asset. This is the sum of ‘use’ values and ‘non-use’ values. The former are benefits gained from actual use of the environment (for example, angling) and comprise two components: the cost of undertaking an activity; and the additional willingness to pay for that activity (deemed ‘consumer surplus’). Non-use values comprise option values, bequest values and existence values. The fist of these relates to the ability to use an environmental asset in the future, the second to the ability to bequeath an asset to future generations, and the third to an altruistic desire to preserve an asset and ensure its continued existence.
A range of valuation techniques has been developed for valuing environmental effects (although it may not always be possible or appropriate to convert all effects into money values): Many of these derive an individual’s willingness to pay for an environmental benefit as revealed in the marketplace, through individuals’ actions, or as directly expressed through surveys. For some affected sectors, a benefit transfer approach has been adopted in valuing non-market goods. Benefit transfer involves taking a value or benefit estimate developed for a previous project or policy decision and transferring it to another. Thus, some impacts of the Sea Empress oil spill have been valued using estimates derived through previous surveys of ‘willingness to pay’ to avoid similar impacts. (All valuations are given in 1996 prices).
CLEAN-UP AND SALVAGE COSTS
The Sea Empress incident imposed costs on those involved in the clean-up and salvage operations. For example, clean-up costs were incurred by the Marine Pollution Control Unit (MPCU) which was responsible for marine clean-up and Pembrokeshire Country Council (PCC) who undertook land-based clean-up.
Under the 1969 Convention on Civil Liability for Oil Pollution Damage and the 1971 Convention on the Establishment of an International Fund for Compensation for Oil Pollution Damage, the costs incurred as a result of spills of persistent oils can be recovered 4%om the Ship Insurers (Skuld Club) and the IOPC Fund (although specific criteria must be met in order for payment to be agreed). Data available at the time of the analysis indicated that claims totalling nearly &9 million had been made for costs associated with clean-up and property damage, with &3.6 million
R&D Technical Report Pll9 xii
approved for payment.. (Data gathering for the study ceased at the.end of November 1997. The most recent IOPCFund data provided at this.time were dated l:* October 1997). These data do not include the costs incurred by some organisations which had not claimed at thistimej for example MPCUincurred costs of just under &12 million. : In addition, the then Department of Transport may have incurred costs associated with monitoring salvage operations. Estimates of total-payments under the Fund range from &22 million to $30 million. ..’
It would be.inappropriate to take paymentsunder.the 1971 Fund as a measure of the financial costs of the incident because: (1) TFund criteria only address. some of the costs arising.fi-om oil spills; (2) some organisations may be unable to substantiate claims .(and thus-will not receive compensation); .and (3) not all those eligible will claimtiom the Fund.. For the first of these, ,the fact.that loss or damage would not have occurred had the oil spillnot happened is not sufficient. to claim compensation Y a reasonable degree ofproximity must also to demonstrated. In addition, the 1971 Fund is not responsible-for compensating for the repair of the Sea Empress (circa-g21 million) nor for loss of cargo (circa &5 million) which are covered byseparate insurance.
Overall, direct costs are estimated at between g49 million and &58 million, taking account of other costs such as those related to research commissioned as a result :of the oil spill.
TOURISM
Pembrokeshire is a popular destination for Welsh, other UK and overseas visitors. Its tourism industry employs between 15 000 and 20 000 people and has a revenue of around &200 million per annum. To estimate the costs to tourism fi-oyn the Sea Empress oil spill,.payments under the. 1971 Fund were used as a first source of data. .However, consultation indicated that 70% of tourism businesses that experienced a financial impact may not have claimed due to: (1) the’ complexity of the claims procedure; (2) the requirement to provide records of peflormance and income,over time; or (3) the requirement to.provide written evidence of lost bookings owing directly to.the spill.’ Owing to thelnature of the tourism industry, many,smaller, less organised operators would not collate this information
Several studies have attempted to value.the tourism impacts from the 5’ea~Empres.s oil-spill and clean-up. The Wales Tourist Board (WTB) analysed these studies to establish the level and nature of identified impacts. They. concluded -that “no consistent or. measurable trends. in tourism performance emerge for Pembrokeshire overall in 1996”. Despite the year’s overall performance remaining relatively..unchanged, there- were specific, -significant impacts to’ some individual operators including- one company specialising in water-based activities.which lost half of.its- turnover for ‘1996 and one quarter of that for 1997: A number of actions was also taken to minimise impacts to the region including a reassurance campaign co-ordinated by Tourism South and West Wales.
Four estimates of costs to the tourism industry were provided f?om.various sources: (1) estimates of total payments under the 1971 Fund indicate costs of between &4 million and &18 million, assuming that payments are onlyhalfof costs incurred; (2) WTB estimate that.lost bookings may be equivalent to between &1;3million and &5 million;(3) a 7% decrease in hotel bed-nights sold during 1996 compared with- 1995 may be-equivalent to between &20 million and g27 million; and .. (4) the Pembrokeshire Tourism Federation has suggested that lost revenue across tourism. in
R&D Technical Report P119 . . . .: xul,
Pembrokeshire between 1995 and 1996 may be between &12 million and &46 million. The mid point of this range (i.e. &18/&20 million) is taken as the value of financial impacts.
Financial costs cannot be assumed to represent economic costs because of a potential shift in activities to elsewhere (e.g. ifa holidaymaker chosenot to visit Pembrokeshire but somewhere else in Wales, there may be no net impacts to the Welsh economy). Based on the assumptions concerning the percentage of financial costs which represent profit and the alternative holiday destinations chosen by those visitors lost from Pembrokeshire and Wales, it is estimated that for &an&l losses of &20 million economic costs would be El.3 million for Wales and SO.13 million for the UK.
RECREATION
There is a relationship between impacts on tourism and recreation; however, the costs associated with each are quite different. Costs to tourism relate mainly to the impact of the oil spill on the overall performance of tourism in 1996. Recreational costs, on the other hand, relate to lost activity days owing to the spill, or changes in the quality of activity undertaken. For example, less bathing occurred during the summer of 1996 in response to the oil spill
Other activities which appear to have been affected by the spill and clean-up include canoeing, sand/land yachting and paracarting, surfing and windsurfing. Access to popular coastal sites was affected immediately following the spill and during the clean-up. Impacts to other activities were minimised due to the timing of the spill. Longer-term impacts were experienced, however, by more formal events, such as the Celtic Watersports Festival. This did not take place until August and yet stiered reduced attendance as a result of perceived impacts.
Estimating lost access to the 64 beaches affected by the oil spill and clean-up involved scoring and ranking beaches according to key features (i.e. access, facilities and quality of bathing waters) and then attributing visit numbers to them (using some visitor data combined with information on the spread of beach visits throughout the year). Using this approach, it appears that 450 000 general beach visits may have been lost directly following the spill (based on an assumption that access was not possible fromFebruary 15 until March 10, with visit rates then at halftheir normal number until the end of March). The economics literature suggests that lost visits to UK beaches have a value of between &l .OO and &5.20 per visitor day, leading to costs of between CO.45 million and 52.3 million.
Overall, recreational impacts are estimated at between around &l million and 52.8 million, with go.5 million associated with reduced participation in swimming (for 100 000 lost visits valued at a consumer surplus of &5 per visit); however, data did not permit the valuation of impacts to surfing and windsurfing.
COMMERCIAL FISHERIES
The fishing industry in South West Wales employs approximately 1000 fishermen and there are over 300 licensed fishing vessels. It is estimated that for every job at sea, there are between 3 and 5 shore-based jobs. The main markets are for commercial fish, lobster, brown crab and spider
R&D Technical Report Pl19 xiv
crab, whelks and cockles, which are supplied to Spain, Brittany, Portugal, Japan, Korea and local markets.
Immediately following the oil spill,local fishermen agreed a voluntary fishing ban and the fishery was later closed by the Ministry of Agriculture, Fisheries and -Food (MAFF). GI’he fisheries exclusion zone (FEZ) impacted both:.commercial inshore and -offshore fisheries,. as well as recreational-angling. Once the FEZ was lifted for a given species and area, there was the potential for residual impacts associated with reductions-in harvesting rates arising from reductions in fish numbers or impacts on spawning for example. In addition, there -was the possibility that the incident may have reduced- the market for fish from -the oiled area; Despite- the’potential for effects, SEEEC studies have not identified any long termnegative impacts resulting from the spill. Indeed, there are reports that the Sea Empress spill has indirectly improvedsome aspects of the fishery, for example the ban on fishing has allowed populationsof some species to recover.
At the time of the study, data.indicated.approval for payments of &6.8 million by the .1971 Fund;- with &5.5 million of this associated with normal fishing activity within the FEZ. Data from the South Wales Sea Fisheries Committee (SWSFC) indicates that the landed.value of the catch from its District in 1996 was &5:6 million, which is similar to previous years. The fact that payments under the 1971 Fund equal the value of the catch from the SWSFC District (which.encompasses the FEZ) indicates that; unlike other sectors; payments under the Fund provide a fair.estimate of financial costs to fishermen. Indeed, payments under the Fund are surprisingly~high; r
Despitethe above, the factthat compensation claims are rigorously audited by the Fund indicates that payments-do reflect the lower bou.nd.of losses incurred by fishermen. As such, payments under the-1971 Fund of &6.8 million are taken as-the lower bound estimate ofthe financial costs to commercial fisheries arising from the Sea Empress oil spill. Upper. bound costs are estimated ..: at &lo million which includesMAFF’s costs in operating the FEZ. Most-of these costs are financial, with economic costs valued at between SO.67 million and &l million (assuming that 10% of lost income is profit).
RECREATIONAL FISHERIES
In addition to the above restriction, a ban was also placed on fishing for migratory salmon and sea trout in all rivers and streams discharging into the affected area due to risks associated with the consumption of fish which may have passed through contaminated water during migration This affected thestart of the fishing seasonuntil 21 May 1996 (i.e. for about 22% of the,season). .:. Claims-to the 1971 Fund have been made by those owning or leasing fishing rights in the rivers affected by the fishing ban. Known direct costs to angling.clubs and riparian owners amount to:; EO.13 million,.although a further nine clubs may also be putting in claimsfor loss of income, ”
Migratory salmon and sea trout anglers were also impacted, incurring consumer surplus losses associated with reductions in angling visits.. Information provided by five of the 21 ‘angling. clubs affected by the ban indicates that between 1995 and 1996; club membership reduced by around 7%. If these five clubs are representative of all those. affected, total club membership -will also have reduced to the same degree. It also appears .that there was a 21% reduction in visit rate across all types of anglers,with the largest reduction experienced by occasional anglers.. The- reduction in the number of angling visits is estimated to lie between 2 1.700 and-36 900 and, using
R&D Technical Report I?119 xv
a benefit transfer approach with a value per visit of &26, there may be a corresponding change in consumer surplus of between SO.56 million and go.95 million.
There was also a reduction in the numbers of sea- and coastal-based angling visits for species such as bass, cod, whiting and mackerel. The number of lost visits was estimated fiomnational data on participation rates combined with an estimate of the percentage of trips lost as a result of the ban, taking into account the availability of alternative sites. The associated costs were valued using consumer surplus estimates for bass, which were adjusted for other species using wholesale fish prices (i.e. it was assumed that consumer surplus varies in direct proportion to the wholesale price of fish). Surveys ofbass anglers indicate a wide variationinthe consumer surplus associated with a years angling ($88 to &2140 per annum), valuing the impacts of the Sea Empress incident to this group at between go.07 million and El.7 million.
The overall costs to all recreational anglers appears to be between about &0.76 million and E2.7 million.
INDUSTRY
Traditionally, the key components of the Pembrokeshire economy have been agriculture, tourism the oil industry (and related businesses), the defence industry and, to some extent, fisheries. However, the importance of agriculture is in decline, following a general decline in this sector coupled with other factors such as the BSE crisis. In addition, the military has scaled down its activities in the area considerably. As a result, other industries, particularly tourism and the oil industry, are increasing in importance. With respect to the latter, of the original four refineries based at Milford Haven, one closed in the 1980s and one other announced its closure last year.
It is understood that the refineries suffered some disruption to oil deliveries and the export of oil products as a result of the spill. Imports of fuel to Pembroke Power Station may also have been similarly impacted, and as the power stationwas on-line during some ofthe incident, cooling water flows were interrupted. It has been suggested that the Sea Empress incident was a key factor in National Power’s decision to drop its plans for burning orimulsion at the power station, and that this impact should be valued in monetary terms. This has not been possible due to a number of factors including: (1) the difliculties in obtaining a true estimate ofthe importance of the incident; (2) an inability to quantify the likelihood that the scheme would have been given the go-ahead had the oil spill not occurred; and (3) the need to estimate the change in risks arising fi-om the sea transport of the orimulsion fuel.
The military facility at Pendine supports a rocket test track and a firing range and the former is operated as a business. It is reported that some business was lost as a result of the clean-up. Total costs are estimated to be between SO.01 3 million and SO.021 million and were not reclaimed from the 1971 Fund. Costs to the order of go.004 million were also incurred by the Castlemartin Range. These costs were limited as the spill occurred during that part of the year when the Range training facility is not in operation. At any other time ofthe year costs associated with lost training may have been up to go.001 million per day.
R&D Technical Report P119 xvi
While there were some costs to industry in Pembrokeshire, the economy:of the county also: benefited from the oil clean-up... For example,, the clean-up operations provided temporary employment for some individuals.
CONSERVATION EFFECTS
The affected coastline is of outstanding~ beauty and scientific. interest, and most lies within Pembrokeshire Coast National Park; the only nationalpark in Britain primarily designated for its. coastal and estuarine landscapes. The main area impacted by the spill contains 35 Sites of Special Scientific Interest and two National Nature Reserves. In addition, part of the.area forms one of the UK’s three Marine Nature Reserves and.much of the coastline has been defined as Heritage Coast. Parts ofthe area are further designated bythe-European Commission as Special Protection Areas under the EC Birds Directive. and there are also plans for three Special Areas -of Conservation under the Habitats and Species Directive (1992).
In the weeks following-the spill, large numbers of dead or moribund marine animals were washed- up on beaches. Longer-term impacts on the offshore marine community appears to be minimal, apart for a reduction in small crustacean species, such as amphipods, in some locations.
One heavily affected rocky shoreline species was the limpet and it is .expected that- in the worst affected areas populations could take between ten and 15 years to recover. There were also some large scale mortalities of barnacles, but these effects were short-lived and ,by October 1996 .’ barnacle densities were similar to-those before the spill.. In addition, l37 of the rare population of 150 cushion starfish (Asterinaphylactica) were lost and recovery has been slow and uncertain. These impacts aside, there does not appear to be any serious or long-term damage to lower shore or rockpool communities.
The oil spill also resulted in some impacts to sediment shores which are particularly important as fish nurseries and are feeding areas for migrant birds. The greatest decrease was .of small crustaceansY. especially amphipods, with molluscs also being impacted to some extent. With respect to maritime vegetation,:while some was impacted by the oil, most effects have been short- lived. The saltmarsh in MiKord Haven waterway was directly impacted by the oil spill and studies have been initiated to map long-term effects.
There was no impact on mammals as a result of the Sea Empress incident, however large numbers of birds were oiled. The worst hit species was the common scoter which made .up two thirds of the birds recorded. Most of the rest were auks, mainly guillemots, which together, with common scoters and razorbills made’up over 90% of recorded casualties,. These birds are vulnerable to oiling as they spend much-time on the.surface of the water and dive to feed. In contrast, many gulls and herring gulls survived oiling and a number. of important species appear to have avoided any significant impact.: In particular, puffins, Manx shear-waters and stormpetrels were away from _. the region at the time of the spill, and the oil did not reach the important .gannet population at Grassholm Island.
Applying the replacement costs approach.to observed strandings of marine animals generates a value of the order of go.05 million. This involved quantifying the numbers of individuals stranded for each affected species (from mainly qualitative reports) and combining this with a price per
R&D Technical Report P119 xvii ‘-,
individual -fkom a biological supply company. If estimates of amphipod losses are taken into account, then costs would be of the order of millions of pounds. For this value to be considered sound in theoretical terms there has to be an indication that society would be willing to pay such replacement costs. In the case of amphipods, evidence suggests that losses will be relatively short- lived, with some populations already at pre-spill levels. Whether a valuation ofmillions ofpounds would be accepted for the temporary loss of these crustaceans is debatable.
Non-use values were applied to give a monetary valuation of the environmental impacts of the oil spill. Three values were considered appropriate for application to the Sea Empress: (1) willingness to pay (WTP) values of &O. 14 per household per beach for protecting 23 EC designated beaches from pollution giving a valuation of 230 million per event for all households in the Welsh Water region; (2) WTP values of &166 per household per spill for avoiding a moderate oil spill giving a valuation of &23 million per event for all households in Dyfed; and (3) WTP values of &32 per household for avoiding an Exxon Valdez type oil spill giving a valuation of &35 million per event for all households in the Welsh Water region.
HUMAN HEALTH
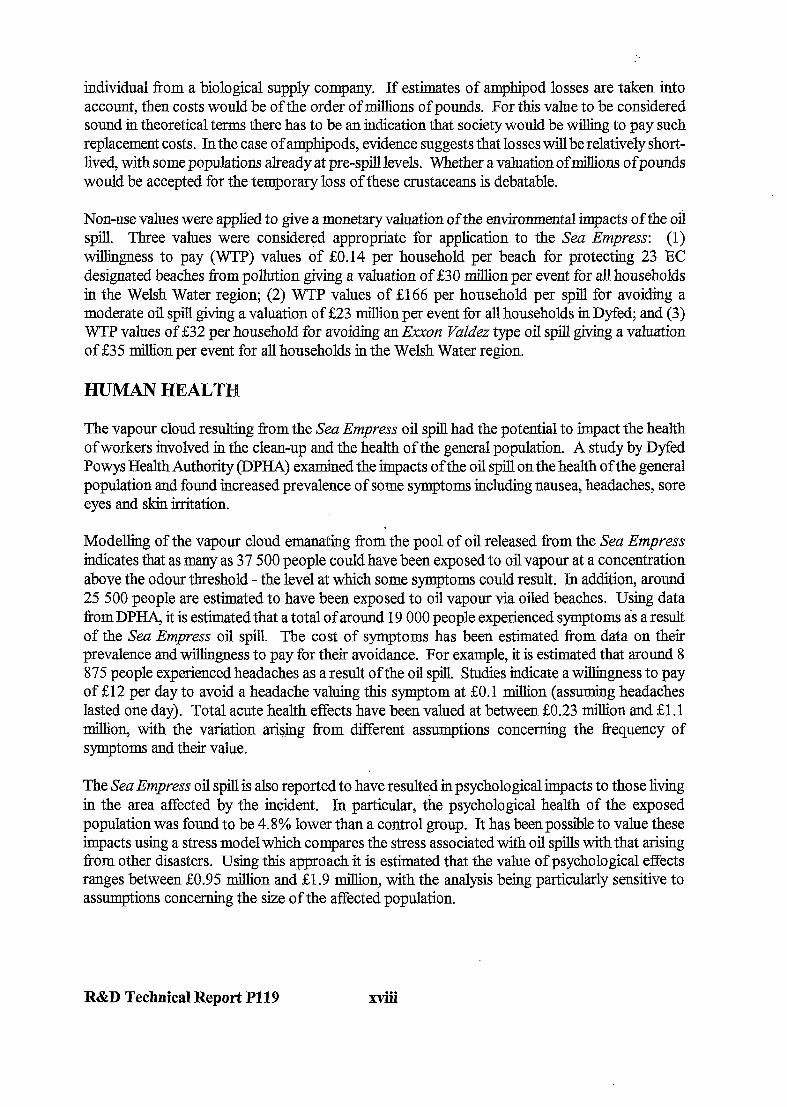
The vapour cloud resulting from the Sea Empress oil spill had the potential to impact the health of workers involved in the clean-up and the health of the general population. A study by Dyfed Powys Health Authority (DPHA) examined the impacts of the oil spill on the health of the general population and found increased prevalence of some symptoms including nausea, headaches, sore eyes and skin irritation.
Modelling of the vapour cloud emanating from the pool of oil released from the Sea Empress indicates that as many as 37 500 people could have been exposed to oil vapour at a concentration above the odour threshold - the level at which some symptoms could result. In addition, around 25 500 people are estimated to have been exposed to oil vapour via oiled beaches. Using data from DPHA, it is estimated that a total of around 19 000 people experienced symptoms as a result of the Sea Empress oil spill. The cost of symptoms has been estimated from data on their prevalence and willingness to pay for their avoidance. For example, it is estimated that around 8 875 people experienced headaches as a result of the oil spill Studies indicate a willingness to pay of &12 per day to avoid a headache valuing this symptom at SO. 1 million (assuming headaches lasted one day). Total acute health effects have been valued at between go.23 million and &l .l million, with the variation aris.mg from different assumptions concerning the frequency of symptoms and their value.
The Sea Empress oil spill is also reported to have resulted in psychological impacts to those living in the area affected by the incident. In particular, the psychological health of the exposed population was found to be 4.8% lower than a control group. It has been possible to value these impacts using a stress model which compares the stress associated with oil spills with that arising from other disasters. Using this approach it is estimated that the value of psychological effects ranges between go.95 million and El.9 million, with the analysis being particularly sensitive to assumptions concerning the size of the affected population.
R&D Technical Report P119
SUMMARY OF COSTS
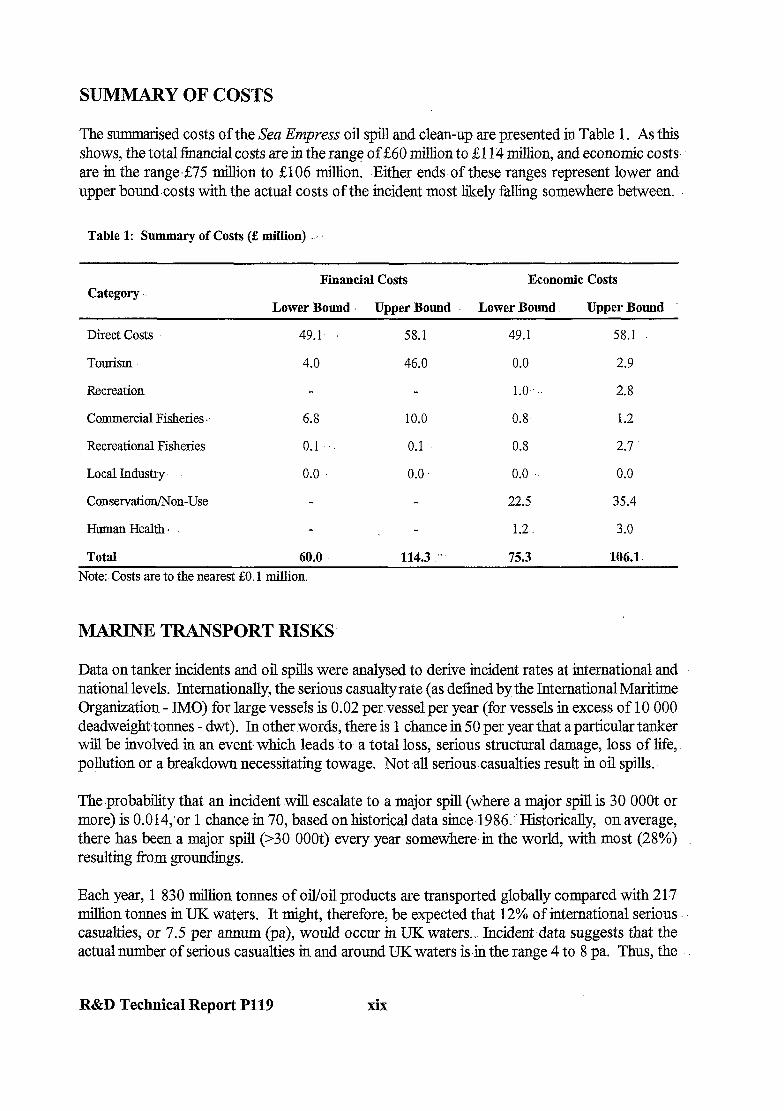
The summarised costs of the Sea Empress oil spill and clean-up are presented in Table 1. As this shows, the total financial costs are in the range of 260 million to $114 million, and economic costs, are in the range,&75 million to 2106 million. .Either ends of these ranges represent lower and upper bound costs with the actual costs of the incident most likely falling somewhere between.
Table 1: Summary of Costs (E miMion) ..:
Category Financial Costs Economic Costs
Lower Bound Upper Bound Lower Bound Upper Bound
Direct Costs
Tour&n
Recreation.
Commercial Fisheries .’
Recreational Fisheries
Local Industry
Conservation/Non-Use
Human Health 1
Total
49.1 ’ 58;l 49.1
4.0 46.0 0.0
1.0.. ..
6.8 10.0 0.8
0.1 0.1 0.8
0.0 0.0 0.0 ..
22.5
1.2.
60.0 114.3 75.3
58.1
2.9
2.8
1.2
2.7
0.0
35.4
3.0
106.1.
Note: Costs are to the nearest &O. 1 million.
MARINE TRANSPORT RISKS
Data on tanker incidents and oil spills were analysed to derive incident rates at international and national levels. Internationally, the serious casualtyrate (as defined bythe InternationalMaritime Organization - lM0) for large vessels is 0.02 per vessel per year (for vessels in excess of 10 000 deadweighttonnes - dwt). In other words, there is 1 chance in 50 per year that a particular tanker will be involved in an event, which leads to, a total loss, serious structural damage, loss of life,. pollution or a breakdown necessitating towage. Not ,aIl serious -casualties result in oil spills..
The.probability that an incident will escalate to a major spill (where a major spill is 30 OOOt or more) is 0.014,‘or 1 chance in 70, based on historical data since.1986: Historically, on average, there has been a major spill (~30 OOOt) every year somewhere,in the world, with most (28%) resulting from groundings.
Each year, 1 830 million tonnes of oil/oil products are transported globally compared with 217 million tonnes in UK waters. It might, therefore, be expected that 12% of international serious casualties; or 7.5 per annum (pa), would occur in UK waters., Incident data suggests that the actual number of serious casualties in and around UK waters is-in the range 4 to 8 pa. Thus, the
R&D Technical Report P119 xix
general level of tanker safety in UK waters is not significantly better or worse than that experienced internationally. With a best estimate of six serious casualties per year and the escalation probability given above, a major spill (>30 OOOt) would be expected in UK waters once every 12 years. This is entirely consistent with the incidents involving the Torrey Canyon (1967), the Braer (1993) and the Sea Empress (1996).
CONCLUSIONS
Based onhistorical data relating to oil tanker incidents and disasters, the Sea Empress oil spill was to be expected. Another major oil spill (>30 OOOt) would be expected in UK waters within the next 12 years. The economic impact of the incident was minimised owing to the time of year when it occurred, for example tourist, fishing and defence training activities were not at peak levels. Even so, the oil spill and clean-up resulted in financial costs of between &60 million to &114 million, and economic costs of between &75 million to $106 million.
RECOMMENDATIONS
Given that there is a significant risk of another major oil spill in Milford Haven, it is recommended that priority be given to implementing a range of risk reduction measures. The numbers of future shipping incidents and oil spills should continue to be monitored (and analysed) to determine the effectiveness of the adopted risk reduction strategy.
At a national level, it is recommended that much greater emphasis is placed on using the information on shipping incidents in UK waters (routinely gathered by MAD3 and others) to reduce marine transport risks.
KEY WORDS:
clean-up cost benefit analysis fisheries human health industrial marine pollution oil spillage recreation risk analysis tourism
R&D Technical Report P119 xx
1. INTRODUCTION
1.1::’ Background to the Study
On. 15 February 1996, the SeaEmpress ran aground-approaching. the Port of Milford Haven:. In the following days, attempts were made to refloat the vessel during which a total of 72 000 tonnes of oil were spilt. This followed only three years after the Braer incident in 1993, (an oil release of 83 000 tonnes) and the Tirrey Conyon incident in 1967 (119 000 tonnes of oil spilt). These spills identify the UK with three of the.world’s top twenty oil spills.
As a result of the Sea Empress oil spill, 200 kilometres of the South Wales coastline were oiled. The area affected is important environmentally, being associated with a large number of designated sites including two National Nature Reserves and a Marine Nature Reserve. It is also home to the : Pembrokeshire Coast National Park which is the only such. park designated for its coastal features and one of the attractions drawing large numbers of tourists to Pembrokeshire each year. The. area also supports locally significant- commercial and recreational fisheries and-related businesses. . .
As may,be expected, the Sen Etipress oil spill did have an impact on the ecology and economy of the. area. In orderto estimate the scale of the former, the Government set up the Sea Empress Environmental Evaluzition Committee (SEEEC) which commissioned-over 80 scientific studies for this purpose..
This report presents the results of a cost-benefit analysis of the incident and is separate from the work commissioned by SEEEC. The study was commissioned by the Environment Agency, with the aim of developing monetary estimates of the economic-impacts arising from the spill and of identifying cost-effective risk mitigation measures to prevent future spills:.
1.2 TheStudy Objectives and Approach
The objectives of this study were to:
. define the impacts of the disaster from evidence produced by SEEEC projects;
. cost the impact of the Sea Empress oil disaster on the local economy; . cost the environmental and -recreational impacts of the Sea Empress oil disaster; . analyse the risks of oil transport for the local economy and the environment; and . recommend the most cost-effective option .for preventing a similar’ future .disaster
occurring in UK waters.
The approach to the study was based-on both a literature review and consultation with relevant parties. One of the key sources of literature was the SEEEC Final Report and the reports of individual SEEEC projects; .However, while the SEEEC studies provide‘ comprehensive coverage of environmental impacts, some socio-economic effects such as those on tourism and recreation are not considered to the same degree, with others such as human health not being considered at all. As a result; it was necessary to look for data further afield. In:some instances, this involved
R&D Technical Report P119 l-l
a review of relevant literature, but in the main additional data were gathered through an extensive consultation exercise. A list of all those contacted is given in Annex 1.
While it has been possible to gather sufhcient data to undertake the assessment, the data collection process was frustrated by a number of factors. In particular, the Environment Agency’s investigation into the causes of the incident and the subsequent announcement of its intention to prosecute two of the associated parties was a major barrier to rapid and efficient data gathering. This led to delays and constraints on those who could be contacted. While these were necessary to maintaining the propriety of the investigation, they clearly had an impact on the timing and completeness of data collection.
While both the economic and risk assessment components of the project were affected by the above, data collection for the risk assessment suffered the most, owing to a ban on consultation with all consultees until five months into the project. Data gathering was then confounded by other difbcuhies including legal problems associated with the provision of data by the Department of the Environment, Transport and the Regions and an initial inability to retrieve information from the database operated by the Marine Accident Investigation Branch. The delays in consultation left insufficient time to stagger the consultation exercise concerning the costs of risk mitigation measures and thus did not allow for a phased approach towards focussed data gathering. In addition, some basic data were not supplied in time for inclusion in the report, including up-to-date information from the International Oil Pollution Compensation Fund and information on fisheries impacts from the Sea Empress Fisheries Claimants Group. (In this regard, it should be noted that data gathering ceased at the end of November 1997.)
Despite these problems, it has still been possible to place a monetary value on many of the impacts arising from the Sea Empress incident and to quantify associated risks.
1.3 The Cost-Benefit Analysis Approach
1.3.1 Economic versus Financial Analysis
Social cost-benefit analysis (CBA) provides the camework for the analytical approach towards assessing the monetary value of the impacts of the Sea Empress spill and towards identifying the most cost-effective risk mitigation option. CBA is based on the principles of neo-classical welfare economics which is concerned with the allocation of scarce resources. It provides a systematic means of evaluating the impacts of a particular course of action by expressing all of the potential impacts in a directly comparable unit of measurement, that of money. By so doing, all costs and benefits are treated in the same manner in the analysis. This approach helps ensure that environmental and social effects are given equal consideration to private sector gains and losses.
As the aim of a social CBA is to analyse the implications of an action from a social perspective, it extends beyond financial analysis, which examines only private costs and benefits. The main differences between the two types of analysis are that:
. financial analysis is aimed at determinin g only the cash flow or profit and loss implications of a policy or a project; while
R&D Technical Report P119 l-2
. economic analysis is aimed at assessing all of the effects of a policy or project and valuing them in national resource terms.
Withma CBq’all-costs and benefits are valued at their ‘opportunity cost! to the nation. This means that transfer payments, such as taxes and subsidies,-are removed from estimated costs or benefits, since these represent neither a gain nor a loss to.the nation as a whole.
More significant, however, is the manner. in which a CBA treats impacts on private ‘sector operators. A financial analysis involves estimating the change in revenues to an operator associated with a. given action,. taking into account increases in costs or losses of income. In contrast, a CBA looks at the changes in ‘economic.rent’ or the opportunity costs to the nation as a whole. In this context, economic rent can be defined. as returns to an activity, or profits (frequently adjusted forsome level of ‘normal’ returns). :For some private sector operations, a loss of productivity is not considered an economic loss to the nation as it is assumed that another j5-m will increase production to meet demand,.
For an-analysis such as this, however, -it is important to consider not just .the economic costs and benefits, but also the financial implications of the Seti Empress incident Financial considerations are obviously important given the impact which the-incident had on certain sectors of the local, : j and potentially regional, economy’.
1.3.2 Valuation of Environmental Costs and Benefits,
A fi~ll socialCBA includes consideration of all .‘extemal’ effects in orderto estimate the total social costs or benefits (in addition to financial costs and benefits). External costs and benefits (or externalities) include those corresponding to the range of environmental and human health impacts which occur when the actions of one party cause a loss in the .well-being: (or satisfaction) of another party, and that loss remains uncompensated.. Externalities occur because the functions and services provided by the natural environment arenot traded in the marketplace. As a result, 1. the value of effects-on the environment and health are not automatically.reflected in market prices and have to be assessed in some other way.
One of the key requirements in CBA, therefore, is the valuation of environmental and other social costs and benefits in monetary terms. A range of economic .valuation. techniques has been developed to assist in the valuation process (although it may not always be possible or appropriate to convert all environmental effects into money values). These techniques attempt to derive an individual’s willingness to pay for an environmental benefit (or willingness to be compensated for an environmental loss) as revealed in the marketplace, through individuals’ actions, or as directly expressed through surveys..
There are four- main groups of methods which can be used -to derive monetary values for environmental and human health impacts. For those categories where the benefits relate to non- market effects (e.g. recreation, amenity and conservation benefits), techniques-such as the travel cost method, hedonic pricing and the contingent valuation method are used most frequently to
1 It should be noted that the IOPC Fund uses the term Ceconomic’ in a different way from that used in this report. -Indeed, ‘economic’ costs as defined by the Fund equate to financial costs in this report.
R&D Technical Report P119 : 1-3
develop estimates of economic gain (or loss). The principles underlying these techniques and the analytical procedures involved in their application can briefly be summarised as follows:
. Market price/effect on production approach: for goods sold in a perfectly competitive market, price provides an estimate of economic value. In other markets (e.g. where subsidies are in effect) prices are corrected to reflect opportunity costs (while uncorrected prices reflect financial values).
One technique in this category is the dose-response technique, which determines the economic value of changes in pollutant concentrations by estimating the market value of the resulting changes in output. For example, changes in fisheries yield are linked to changes in water quality. The replacement costs approach measures impacts on environmental assets in terms of the costs of restoring or recreating the asset.
l Travel Cost Method (TCiW): This approach is based on the concept that people spend time and money travelling to a recreational site and that these expenditures, or costs, can be treated as revealing the demand for the site. Surveys of site visitors are undertaken to determine visit rates, where these are a function of travel expenditure, income, any entry fees, environmental characteristics and the availability of substitute sites.
. Hedonic Pricing Method @PM): The hedonic pricing method is based on the concept that the price paid for a complementary good (e.g. a residential property) reflects the buyer’s willingness to pay for a particular environmental attribute (e.g. adjoining a high quality river). Application requires the use of regression analysis to determine the relationship between the market price of the ‘property and its attributes, where some relate to environmental characteristics. From this, the implicit price (as part of the overall property price) for a given environmental characteristic is derived.
l Contingent Valuation Method (CVM): This method relies on the creation of an hypothetical or experimental market for an environmental good or for a reduced risk of a specified health effect. Individuals are surveyed to determine their willingness to pay (WTP) (or willingness to accept (WTA) compensation) for a specified change in the quality or quantity of the environmental good/health effect. The mean willingness to pay value across all bids (including valid zero bids) is then used to provide an indication of the economic value of the specified change.
The applicability of the above techniques will vary across the different environmental or health impacts of concern. The travel cost method is only applicable to the valuation of recreation related benefits, while the dose-response and hedonic pricing techniques require that a well- functioning market for the good of concern or a complementary good exists. In general, the applicability of the techniques is limited by whether the impacts relate to direct use of the environment or to concerns more associated with conservation and preservation. These two aspects together comprise the total economic vahe of an environmental asset.
The total economic vahe (TEV) of an environmental asset is the sum of what are referred to as use values (direct and indirect) plus Iron-use vahes (option, bequest, and existence). Use vahes are those associated with the benefits gained from actual use (or ‘consumption’) of the
R&D Technical Report P119 l-4
environment.and may include private sector uses (industry, agriculture, etc.>, recreation benefits (from fishing, hiking, bird watch-&photography; etc.), education and scientific benefits, and general amenity benefits.
N&-ase values (also known in literature aspassive-use values) are of three different types: options .; values, bequest values and existence-values. Option values relate to the desire of an individual to maintain the ability to use the environment-at some time in the future (for example,the desire to be able to go sea angling in the future). They reflect an individual’s willingness to pay to secure the future of a good and thus express the potential benefits of that good. A related form of value is that attached to preservation or conservation of the environment so that future generations may also have the option of using thatasset; this is referred to as bequest vaher
Existence values are defined as those values which result from an individual’s altruistic desire to preserve an environmental asset and ensure its continued existence into the future. These values are not associated-with actual or potential use, but solely with the knowledge that the asset is being conserved or preserved (withthe continued existence of whales being a good example).
1.3.3 Benefit .Transfe?. Within a CBA
In deriving economic estimates of the costs and benefits associated with an incidentsuch as the.: Sea Empress, there are two approaches which could be adopted. The first is to commission site and problem specific assessments by directly applying the valuation techniques set out above, while thesecond is to adopt a beneJit transfer approach. The direct application of the different valuationtechniques would involve commissioning specialists studies, which can be costly in both financial and resource terms. Such studies could not be undertaken within the time and budget allowed for this study.,.
In contrast, a benefit transfer approach can be used to derive order of magnitude estimates of likely costs and benefits. This ty!pe of approach reduces the need for field research and simplifies the analysis, and. it -is this approach .which forms the basis for a range. of current CBA methodologies such as that set out in the .Foundation for- Water Research Manual on Assessing the,Benefits,ofSa~rface Water Quality hprovenzents (RVR, 1996).
Benefit transfer. can be defined as the process of taking a value or benefit, estimate developed for : a previous project or policy decision and transferring it to another. In-other words, estimates based on the use of the above valuation techniques, such as the value of a recreational user-day, for one specific site and environmental quality change are assumed to provide a reasonable approximation .of .the value attached to another site -given a similar type of. environmental. improvement. :
There are three different approaches which might be adopted in benefit transfer:
. the transference of mean unit values;
. the transference of adjusted unit values; and
. the transference of a demand function. :
R&D Technical Report P119 : l-5
Although the latter two approaches are preferred to the first approach, the pool of UK valuation studies available for benefit transfer is relatively small for any given effect, as is the pool of relevant studies carried out in the US and elsewhere. This impacts on the degree of reliability which can be attached to benefit transfer based results at the present time (particularly, as there has been very little work carried out to date on the transferability of results from one country [and therefore culture] to another). However, if the aim is to develop relative order of magnitude indicators of costs and benefits, then the transfer of mean values provides a mechanism for achieving this within an analysis such as this.
1.4 The Risk Assessment Approach
Risk assessment involves the systematic study of potential incidents including an analysis of their causes, likelihood of occurrence and associated consequences. At a broad level, by combining data on the numbers and nature of vessels, their cargoes, operational characteristics of the port, etc. with the numbers of incidents, it is possible to derive ‘baseline’ incident rates.
Every year, over 1.5 billion tonnes of oil (crude oil and oil products) are moved by vessels ranging in size from small barges to super-tankers. Every year (on average), there is a major spill comparable to that from the Sea Empress. In addition to such major spills, there are many more smaller spills and other incidents involving the marine transport of oil.
The purpose of the risk assessment component ofthis study is to review available data on reported spills and incidents at international, national and local levels in order to determine, inter alia:
l the likelihood of incidents similar to that of the Sea Empress; . the most likely causes of spills and other incidents; . whether the historical record for Milford Haven is significantly tierent than that for the
UK national waters; and l whether the historical record for the UKnational waters is significantly different than that
for marine transport of oil elsewhere.
Given the results of the analysis, a range of potential risk mitigation measures has been identified.
The Sea Empress disaster has been subject to a formaI investigation (MA& 1997b) resulting in a number of recommendations covering such topics .as improving the standards of piloting, reviewing emergency plans and procedures and urging the International Maritime Organisation to review regulations for tanker design. Whilst some of these recommendations are referred to, it is not the intention to review the practicality and cost-effectiveness of each of these recommendations in detail, rather, the intention is to ‘stand back’ from the Sea Empress disaster and consider some of the more general issues relating to the likely success of different options.
1.5 Stiucture of the Report
Section 2 provides an overview of the Sea Empress oil spill, the area affected by it and associated impacts. The valuation of the consequences associated with the oil spill are presented in Sections
R&D Technical Report P119 1-6
3 to -10, which respectively cover costs arising from clean-up and salvage operations, tourism, recreation, commercial fisheries, recreational fisheries, local industry, conservation and human health.-. <These values are brought together in Section 11.
Section 12 sets out the risks associated with the transport ofoilto and fYomMiEord,Haven, while. Section 13 .covers ‘possible risk mitigation measures. Conclusions and recommendations are. presented in Section 14.
Supporting information for each of the Sections 1 through to 12 is presented in the correspond@ Annex (for example, supporting data on tourism (Section 4) are presented in Annex 4).
R&D Technical Report P119 l-7

R&D Technical Report P119 1-8
2. THE OIL SPILL AND AFFECTED AREA
2.1 The Grounding of the&a Empress and Subsequent Oil Spill .-I:
At 2007 hours on 15 February 1996, the 147 000 dead weighttonnes (dwt) tanker Sea Empress grounded on the western edge of the Mid Channel Rocks on its approach to Milford. Haven2. After this initial grounding and despite.& fact that the main engine had beenput astern a&both anchors dropped, the vessel’s momentum continued to carry it such that it came to rest aground some 900 m northwest of the initial grounding position. The vessel was subsequently refloated and, despite,plans to tow the casualty into deeper water, Sea Empress was held in positiorrfor lightering. aIn the face ofworsening weather conditions, a decision was made to turn S&a Empress to face an incoming gale. This operation was completed on 1-7 February but;withtugs. and main engines unable to hold her position,,the casualty grounded off St Ann’s Head at about 1805 hours.: Sea Empress was evacuated in the early hours. of 18 February due to concerns over structural failwe. At about 0800 hours she drifted free of her. grounded position. There were a number of subsequent groundings as tugs-tried to maintain her position within ‘the pool’- until the casualty was finally refloated on the evening of 21 February and taken to a berth on the north side of the Haven.
Sea Empress was loaded with a cargo of 130 018 tonnes (t) of Forties light crude oil blend. The initial grounding caused the rupture of the starboard. side cargo and segregated ballast tanks, causing the release of around,2 000 t,of oi13. The estimated timing .-and sizes of subsequent releases are provided in Table 2.1.
2.2 Brief Summary of Response and Fate of Oil
Conditions were very favourable for the primary response to the spill - the application .of dispersants to assist the dispersion and dilution of oil into the water column. It has been estimated that between 43% and 57% of the spill was dispersed at,sea, by,both chemical and-natural means4. The ultimate fate of this oil is-unknown but-it is probable that a proportion will still be attached. to bottom sediments in the affected area (the remaining being carried away by currents). ,Between 1% and 2% of the spill was recovered at sea using mechanical recovery, with a significant. proportion targeted near sensitive areas.
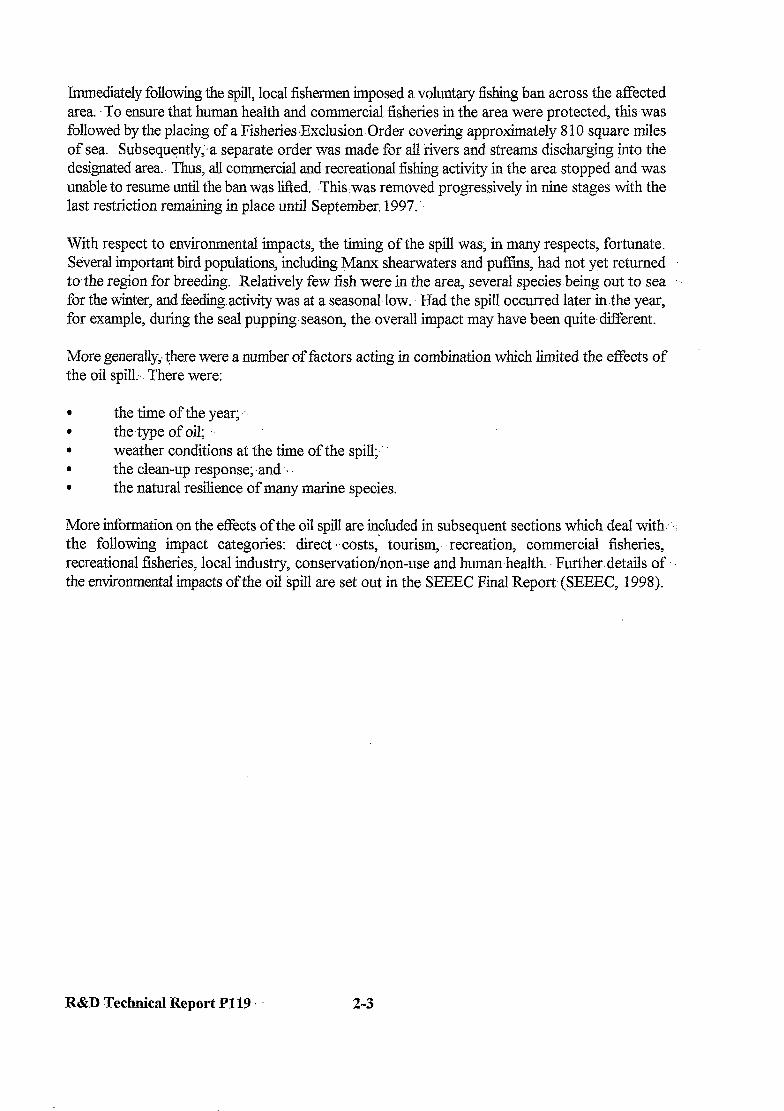
In all, around 200 kilometres. of coastlinewas affected by oil coming ashore (see Figure 2.1); A number of tar balls washed up on shores both north of St Ann’s Head and on the south coast of Ireland. . . It is estimated that between 1.5% and 3;5% of the spill was’ recovered from the shoreline with between 4% and 8% still remaining on it. Between 35% and 45% of the spill 1 evaporated.
2 This sub-section is based on the findings of the official MAJB Inquiry into de incident (MAIB, 1997b);
3 It should be noted that de IMaster reported an initial cargo loss of around 5 000 t. The figure of 2 000 t reflects the estimates of the Marine Pollution Control Unit (MFCU) fkom.its surveys.
4 Formation on the fate of oil is taken-fkom the SEEEC Report Draft 4 (SEEEC, 1997).
R&D Technical Report P119 2-l
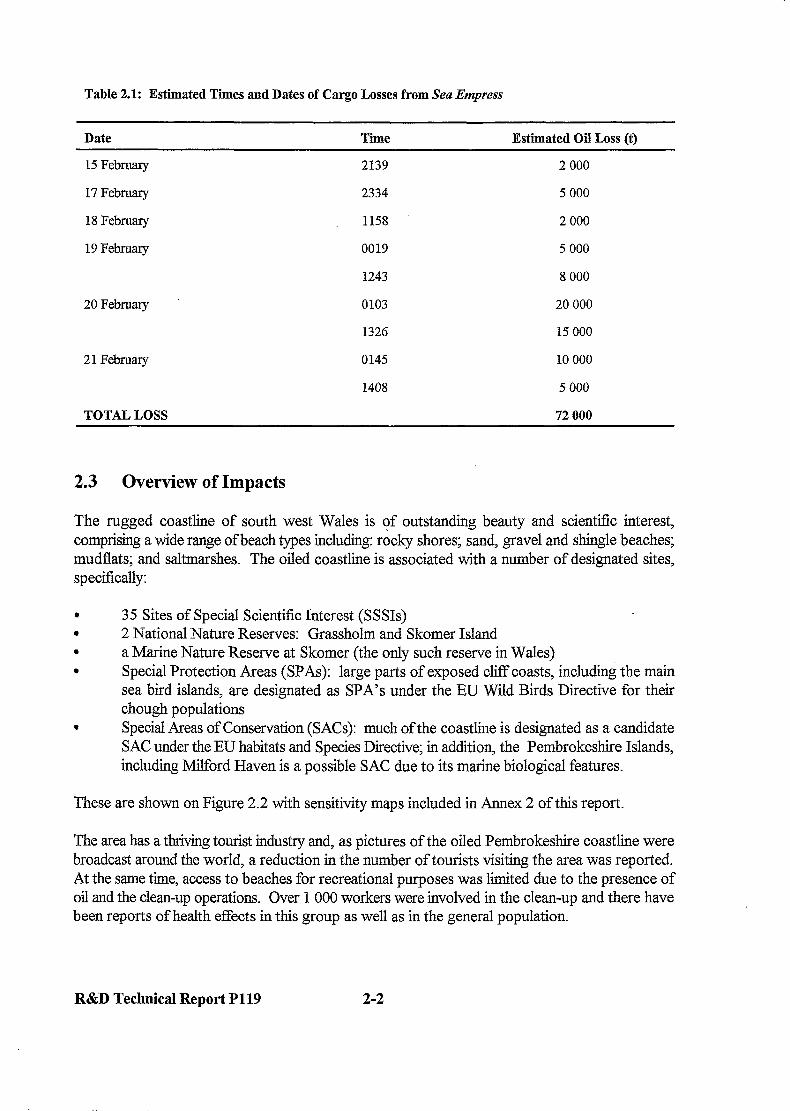
Table 2.1: Estimated Times and Dates of Cargo Losses from Sea Empress
Date Time Estimated Oil Loss (t)
15 February 2139
17 February 2334
18 February 1158
19 February 0019
1243
20 February 0103
1326
21 February 0145
1408
TOTAL LOSS
2 000
5 000
2 000
5 000
8 000
20 000
15 000
10 000
5 000
72 000
2.3 Overview of Impacts
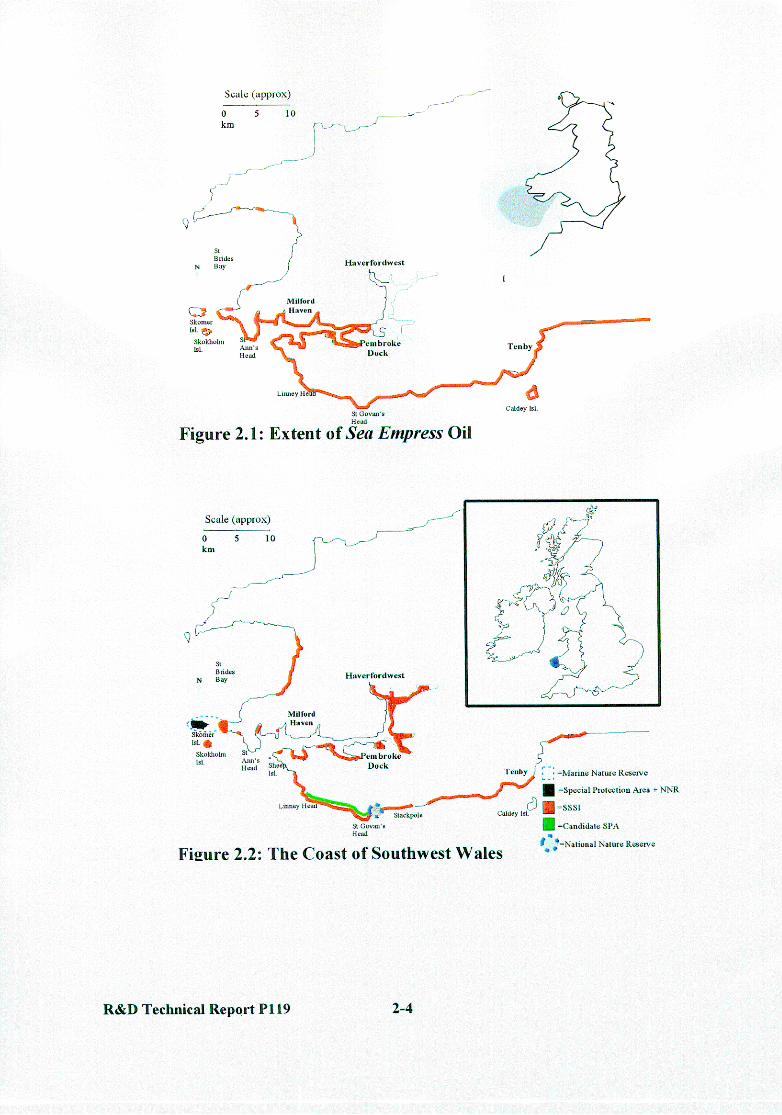
The rugged coastline of south west Wales is of outstanding beauty and scientific interest, comprising a wide range of beach types including: rocky shores; sand, gravel and shingle beaches; mudflats; and saltmarshes. The oiled coastline is associated with a number of designated sites, specifically:
. 35 Sites of Special Scientific Interest (SSSIs)
. 2 National Nature Reserves: Grassholm and Skomer Island
. a Marine Nature Reserve at Skomer (the only such reserve in Wales)
. Special Protection Areas (SPAS): large parts of exposed cliff coasts, including the main sea bird islands, are designated as SPA’s under the EU Wild Birds Directive for their though populations
. Special Areas of Conservation (SACS): much of the coastline is designated as a candidate SAC under the EU habitats and Species Directive; in addition, the Pembrokeshire Islands, including Milford Haven is a possible SAC due to its marine biological features.
These are shown on Figure 2.2 with sensitivity maps included in Annex 2 of this report.
The area has a thriving tourist industry and, as pictures of the oiled Pembrokeshire coastline were broadcast around the world, a reduction in the number of tourists visiting the area was reported. At the same time, access to beaches for recreational purposes was limited due to the presence of oil and the clean-up operations. Over 1 000 workers were involved in the clean-up and there have been reports of health effects in this group as well as in the general population.
R&D Technical Report P119 2-2
Immediately following the spill, local fishermen imposed a voluntary fishing ban across the affected area. To ensure that human health and commercial fisheries in the area were protected, this was followed by the placing of a Fisheries Exclusion. Order covering approximately 8 10 square miles of sea. Subsequently;.a separate order was made for all rivers and streams discharging into the designated area. Thus, all commercial and recreational fishing activity in the area stopped and was unable to resume until the ban was lifted. -This ,was removed progressively in nine stages with the last restriction remaining in place until September. 1997.
With respect to environmental impacts, the timing of the spill was, in many respects, fortunate. Several important bird populations, including Manx shearwaters and puffins, had not yet returned tothe region for breeding. Relatively few fish were in the area, several species being out to sea for the winter, and feeding activity was at a seasonal low. Had the spill occurred later in the-year, for example, during the seal pupping season, the overall impact may have been quite,different.
More generally, there were a number of factors acting in combination which limited the effects of the oil spill: There were:
. the time of the year; ..
. the type of oil; ‘,
. weather conditions at the time of the spill;-‘. . the clean-up response;and . the natural resilience of many marine species.
More information on the effects of the oil spill are included in subsequent sections which deal with:. .I the following impact categories: direct o-costs,’ tourism,~ recreation, commercial fisheries, recreational fisheries, local industry, conservation/non-use and human health. Further. details of the environmental impacts of the oil spill are set out in the SEEEC Final Report (SEEEC, 1998).
R&D Technical Report Pll9 : 2-3
3. CLEAN-UPAND SALVAGE COSTS
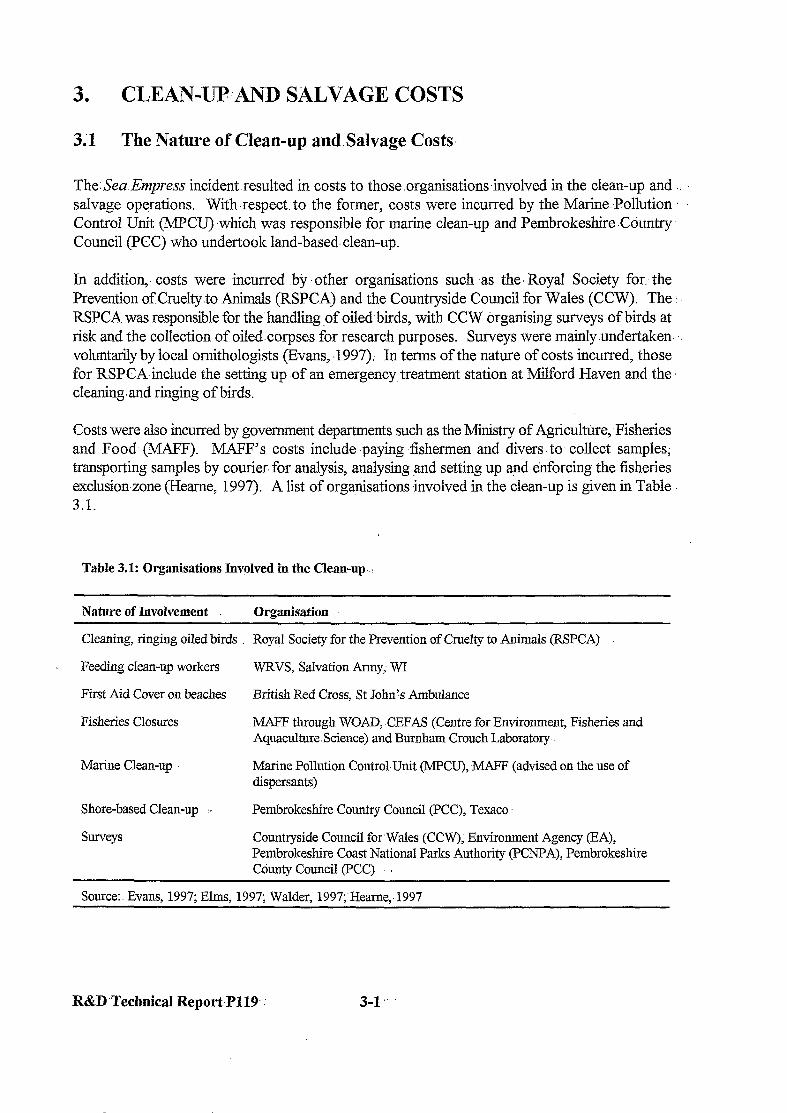
3.1 The Natu re of Clean-up andSalvage Costs
The&a Eqmss incident-resulted in costs to those.organisationsinvolved in the clean-up and . .. salvage operations. With respect. to the former, costs were incurred by the Marine Pollution Control Unit (MPCU) -which was responsible for marine clean-up and Pembrokeshire Country Council (PCC) who undertook land-based clean-up.
In addition, costs were incurred by. other organisations such .as the Royal Society for the Prevention of Crueltyto Animals (RSPCA) and the Countryside Council for Wales (CCW). The RSPCA was responsible for the handling .of oiled birds, with CCW organising surveys of birds at risk and the collection of oiled-corpses for research purposes. Surveys were mainly undertaken- . . voluntarily by local ornithologists (Evans, 1997). In terms of the nature of costs incurred, those for RSPCA include the setting up of an emergency treatment station at Milford Haven and the cleaning.and ringing of birds.
Costs were also incurred by government departments such as the Ministry of Agriculture, Fisheries and Food (MAFF). IMAFF’s costs include ,paying fishermen and divers to collect samples; transporting samples by courier. for analysis, analysing and setting up and enforcing the fisheries exclusion zone (Hearne, 1997). A list of organisations &volved in the clean-up is given in Table 3.1.
Table 3.1: Organisations Invplved in the Clean-up...
Nature of Involvement Organisation
Cleaning, ringing oiled birds Royal Society for the Prevention of Cruelty to Animals (RSPCA)
Feeding clean-up workers WRVS, salvation Army; wl
First Aid Cover on beaches British Red Cross, St John% Ambulance
Fisheries Closures IMAFF through WOAD, CEFAS (Centre for Environment, Fisheries and Aquaculture. Science) and Burnham Crouch Laboratory
Marine Clean-up Marine Pollution Control Unit (MPCU), MAFF (advised on the use of dispersants)
Shore-based Clean-up . Pembrokeshire Country Council (PCC), Texaco
Surveys Countryside Council forWales (CCW), Environment Agency (EA), Pembrokeshire Coast National Parks Authority (PCNPA), Pembrokeshire Cdlmty Council (PCC) *
Source: Evans, 1997; Elms, 1997; Walder, 1997; Heame, 1997
R&D’Technical Repol*,P119-. 3-l “’
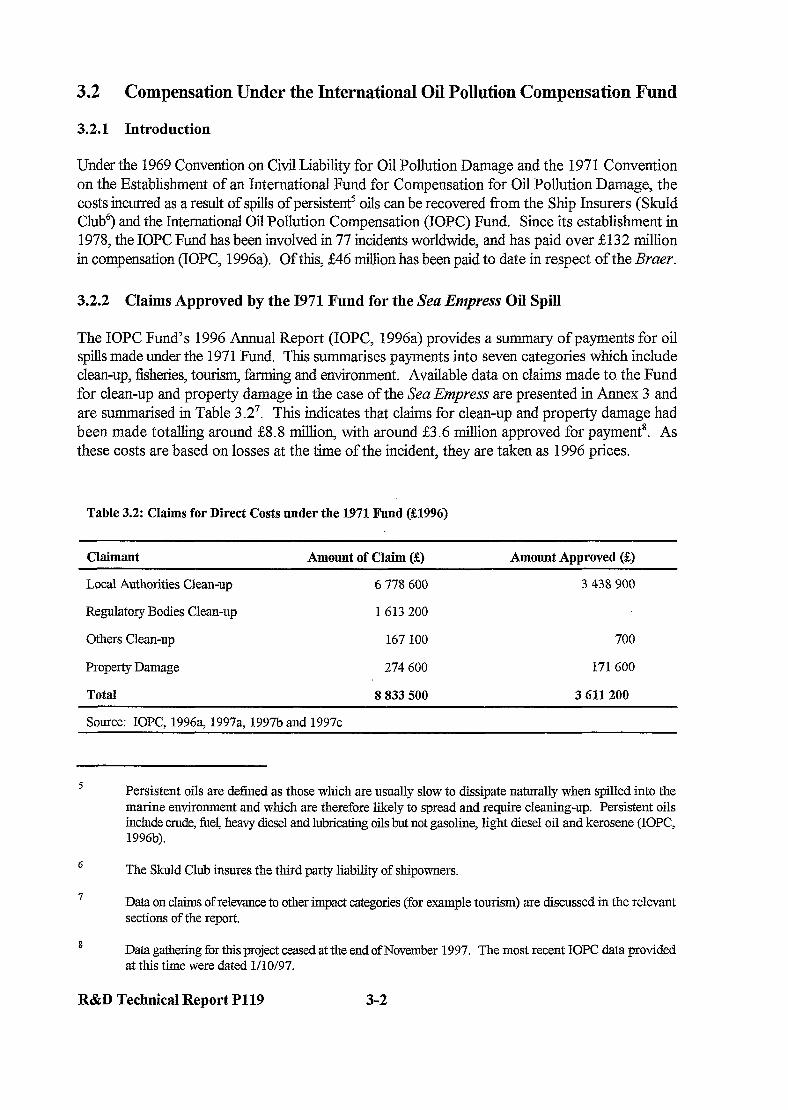
3.2 Compensation Under the International Oil Pollution Compensation Fund
3.2.1 Introduction
Under the 1969 Convention on Civil Liability for Oil Pollution Damage and the 197 1 Convention on the Establishment of an International Fund for Compensation for Oil Pollution Damage, the costs incurred as a result of spills of persistent5 oils can be recovered from the Ship Insurers (Skuld Club6) and the International Oil Pollution Compensation (IOPC) Fund. Since its establishment in 1978, the IOPC Fund has been involved in 77 incidents worldwide, and has paid over 2132 million in compensation (IOPC, 1996a). Of this, 246 million has been paid to date in respect of the Braer.
3.2.2 Claims Approved by the I971 Fund for the Sea Empress Oil Spill
The IOPC Fund’s 1996 Annual Report (IOPC, 1996a) provides a summary of payments for oil spills made under the 1971 Fund. This summarises payments into seven categories which include clean-up, fisheries, tourism, farming and environment. Available data on claims made to. the Fund for clean-up and property damage in the case of the Sea Empress are presented in Annex 3 and are summarised in Table 3.27. This indicates that claims for clean-up and property damage had been made totalling around 28.8 million, with around 53.6 million approved for payment8. As these costs are based on losses at the time of the incident, they are taken as 1996 prices.
Table 3.2: Claims for Direct Costs under the 1971 Fund @X996)
Claimant Amount of Claim (2) Amount Approved (2)
Local Authorities Clean-up 6 778 600 3 438 900
Regulatory Bodies Clean-up 1 613 200
Others Clean-up 167 100 700
Property Damage 274 600 171600
Total 8 833 500 3 611200
Source: IOPC. 1996a. 1997a. 1997b and 1997c
Persistent oils are defined as those which are usually slow to dissipate naturally when spilled into the marine environment and which are therefore likely to spread and require cleaning-up. Persistent oils include crude, fuel, heavy diesel and lubricating oils but not gasoline, light diesel oil and kerosene (IOPC, 1996b).
6 The Skuld Club insures the third party liability of shipowners.
7 Data on claims of relevance to other impact categories (for example tourism) are discussed in the relevant sections of the report.
8 Data gathering for this project ceased at the end of November 1997. The most recent IOPC data provided at this time were dated l/10/97.
R&D Technical Report P119 3-2
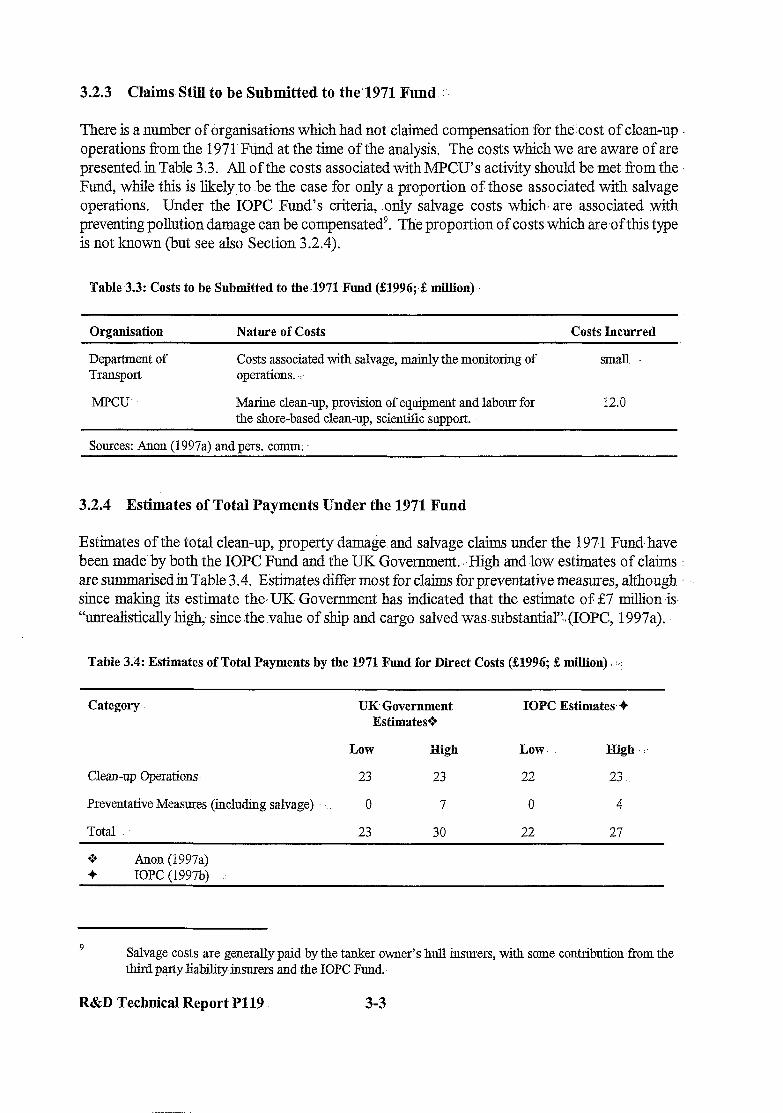
32.3 Claims Still to be Submitted to the’1971 Fund .’
There is a number of organisations which had not claimed compensation for thekost of clean-up operations from the 1971 Fund at the time of the analysis. The costs which we are aware of are presented in Table 3.3. Allof the costs associated with h!lPCU?s activity should be met from the Fund, while this is likely to be the case for only a proportion of those associated with salvage operations. Under the IOPC Fund’s criteria, .only salvage costs which, ‘are associated with preventing pollution damage can be compensated?. The proportion of costs which are of this type is not known (but see also Section 3.2.4).
Table.3.3: Costs to be Submitted to the.1971 Fund (U996;4 million)
Organisation Nature of Costs Costs Incurred
Department of Transport.
MPCU
Costs associated with salvage, mainly de monitotig of operations. . . .
Maxine clean-up, provision of equipment and labour for the shore-based clean-up, scientilic support.
small
12.0
Sources: Anon (1997a) and pers. comm.
3.2.4 Estimates of Total Payments Under the 1971 Fund
Estimates of the total clean-up, property damage and salvage claims under. the 1971 Fund, have been made by both the IOPC Fund and the UK Government...,High and low estimates of claims are summarised in Table 3.4. Estimates differ most for claims for preventative measures, although since making its estimate the,UK Government has indicated that the estimate of 57 million.is- ‘unrealistically high; since .the.value of ship and cargo salved wassubstantial’~.(IOPC, 1997a).
Table 3.4: Estimates of Total Payments by the 1971 Fund for Direct Costs (Sl996; S million) : :,:
Category 5% Government Estimates+
IOPC Estimates+
Low High Low. High :
Clean-up Operations. 23 23 22 23
Preventative IMeaswes (including salvage) 0 7 0 4
Total 23 30 22 27
Anon (1997a) IOPC (199%)
9 Salvage costs are generally paid by the tanker owner’s hull insurers, with some contribution from de third p+ty liability insurers and the IOPC Fund
R&D Technical Report P119. 3-3
3.3 Other Costs
3.3.1 Introduction
Payments approved under the 1971 Fund could be used as a measure of the financial costs associated with the Sea Enzpress oil spill. However, these payments are likely to be less than the actual financial costs for the following reasons:
. the size of compensation payments is determined using IOPC Fund criteria which exclude some costs from consideration;
. the Fund requires that losses are proven. Those organisations unable to provide the necessary evidence to substantiate claims are unable to claim compensation; and
. not all ofthose eligible to claim costs will have claimed fi-om the Fund. Some may claim in the future with others choosing not to submit claims.
In addition, there is an upper limit of &5 1 million on compensation payments. In a number of recent cases, including the Braer, the aggregate amount of the claims has greatly exceeded the maximum amount payable (Welsh AEairs Committee, 1996). Had the spill occurred after 30 May 1996, then the upper limit would be 2114 million (as a result of changes introduced in the 1992 Protocols to the Conventions).
3.3.2 Claims Rejected Under Fund Criteria I
The IOPC Fund will only pay compensation for the following categories of losseslo:
. clean-up operations and property damage: including clean-up operations on shore and at sea, some salvage measures, other preventative measures, disposal of collected material, the cleaning of oiled property and studies aimed at quantifying damages for the purpose of claiming compensation from the Fund;
. consequential loss and pure economic loss: the former relates to loss of earnings resulting from oil contamination of property, while the latter relates to loss of earnings by other mean?. Claims for pure economic loss are not admissible for the sole reason that the loss or damage would not have occurred had the oil spill not happened. Instead a reasonable degree of proximity needs to be demonstrated; and
10 Compensation is also payable for environmental damages which are discussed in Section 9.
11 An example of consequential loss would be a fisherman’s loss of income as a result of his nets becoming contaminated with oil, while a fisherman prevented from fishing as a result of oil on the area of sea where he normally fishes would be an example of pure economic loss. In this regard, it should be noted that the IOPC Fund uses the term ‘economic’ in a Merent way from this report. Indeed, ‘economic’ costs as defined by the Fund equate to financial costs in this report.
R&D Technical Report P119 3-4
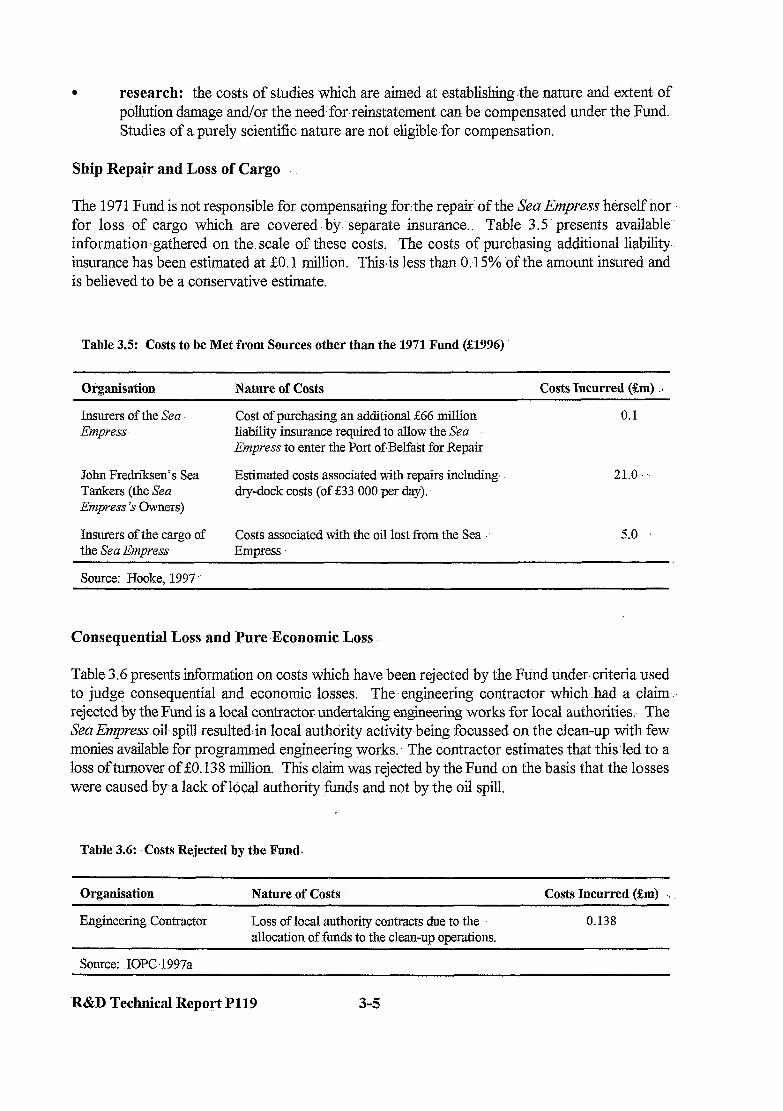
. research: the costs of studies which are aimed at establishing the nature and extent of pollution damage and/or the need,for-reinstatement can be compensated under the Fund. Studies of a purely scientific nature are not eligible.for compensation.
Ship Repair and Loss of Cargo
The 1971 Fund is not responsible for compensating for. the repair:of the Sen Empress herself nor for loss of cargo which are covered by: separate insurance.. Table 3.5 ..presents available. information-gathered on the. scale of these costs. The costs of purchasing additional liability-. insurance has been estimated at SO. 1 million. Thisis less than 0.15% of the amount insured and is believed to be a conservative estimate.
Table 3.5: Costs to be Met from Sources other than the 1971 Fund (g1996)
Organisation Nature of Costs Costs Incurred (%m) .%
Insurers of the Sea Empress.
Cost of purchasing an additional 566 rnihion liability insurance required to allow the Sea Empress to enter the Port of-Belfast for Repair
0.1
Jolm Fredriksen’s Sea Tankers (the Sea Empress ‘s Owners)
Estimated costs associated with repairs including~ dry-dock costs (of &33 000 per day):
21.0.
Insurers of the cargo of Costs associated with the oil lost from the Sea the Sea Empress Empress
5.0
Source: Hooke, 1997.
Consequential Loss and Pure-Economic Loss
Table 3.6 presents information on costs which have been rejected by the Fund under criteria used to judge consequential and economic losses. The- engineering contractor which- had a claim rejected by the Fund is a local contractor undertaking engineering works for local authorities. The Sea Enzpress oil spill resulted:in local authority activity being focussed on the clean-up with few monies available for programmed engineering works.. The contractor estimates that this-led to a loss of turnover of SO.138 million. This claim was rejected by the Fund on the basis that the losses were caused by-a lack of local authority funds and not by the oil spill.
Table 3.6: Costs Rejected by the Fund.
Organisation. Nature of Costs Costs Incurred ($Zm) .r :
Engineering Contractor
Source: IOPC-1997a
Loss of local authority contracts due to the allocation of funds to the clean-up operations.
0.138
R&D Technical Report P119 3-5
Even where the oil spill is considered to be the cause of pure economic loss, compensation from the 1971 Fund will only be forthcoming where a reasonable degree of proximity can be demonstrated, taking into account:
. the geographic proximity between the activity and the contamination;
I the degree to which the claimant was economically dependent on the affected resource;
l the extent to which a claimant had alternative sources of supply or business opportunities; and
l the extent to which the claimant’s business formed an integral part of the economic activity within the area affected by the spill (IOPC, 1996b).
Claims rejected by the Fund on the basis of an inability to meet the proximity criterion alone should be included in this cost-benefit analysis. Unfortunately, the number and size of such claims is not known although such claims are most likely to be associated with impact categories other than clean-up and salvage costs. In addition, many businesses not meeting the proximity criterion will not have bothered to claim compensation in the first place.
Research
The Sea Empress oil spill has resulted in the commissioning of a large number-of research studies. Many of these have been commissioned by the Sea Empxss Environmental Evaluation Committee (SEEEC), with others being undertaken by regulators (e.g. the Environment Agency - EA), Government (e.g. the Welsh Office) and conservation organisations (e.g. the Wildlife Trust West Wales - WTWW).
SEEEC’s total budget was around $2 million and it was only able to commission some of the research which was suggested as being of value following the oil spill. Of those studies which were not taken up by SEEEC, those which were considered to be of particular importance were commissioned by others. For example, the WTWW commissioned a report on the effects of the oil spill on crustaceans.
As indicated above, only some studies qualify for compensation under IOPC Fund criteria. As a result, no claim was made to the Fund for the cost of SEEEC studies and of those claims which were made for the costs of research, some were rejected. For example, most of the Joint Nature Conservation Committee’s (JNCC’s) claim was rejected by the Fund on the basis that the studies were of a ‘cpurely scientific character” (IOPC, 1997a).
3.3.3 The Need to Substantiate Claims
To receive compensation from the 1971 Fund for costs incurred, claims must be substantiated and verified. This can be a lengthy process and it is possible to claim back from the Fund some of the costs associated with the verification process itself For example, to verify its claim for costs, PCC has been asked to identify all Sea Empress phone-calls fi-om its phone bill and to indicate on which beach meals provided for the clean-up workers were eaten. The associated costs include the four
R&D Technical Report P119 3-6
members of staff employed Ill-time:pulling together-PCC’s claim and the timespent by-other council officers to assist with this process. While the costs off&-time staffcan be claimed from . . the 1971 Fund, the principle has not been established as to whether other officer’s costs can be claimed for. These additional costs could be significant for individual organisations, for example,- PCC.reports that 20% of its-chief accountant’s time is spent on the Sea Emptyss @ers. comm.).
3.3.4. Those Not Claiming from the Fund ~1
While the government has claimed compensationfor the costs incurred as a result of clean-up and monitoring, it cannot claim compensation for the ‘fixed’ costs of the Welsh Office (WO) ‘or the Department of the Environment,Transport and the Regions;- For example, the WO had a number of people working .on the incident almost full time for..the first few weeks after the spill and was still incurring some costs at the end of 1997.
In..addition, some solicitors ~,have been unable to claim for the time spent. giving. advice to claimants. For.example; one solicitor reported giving hundreds of hours of free advice, for which he had not been paid a penny (pers. comm.). While compensation can,be claimed for lega fees which are,‘worthwhile’, it is IOPC’s view that legal advice is often not needed,in order to make a claim. Such fees are, therefore, often not compensatable. The result.is that claimants are unwilling to pay for professional advice as this would need to be paid for out of any compensation.
3.4 Total Costs for..Clean-up and Salvage
A summary of the direct costs of the Sen Empress incident are presented in Table 3.7 overleaf. In the absence ofadditional information, assumptions have been used to,generate the upper bound values.
R&D Technical Report-P119 3-7
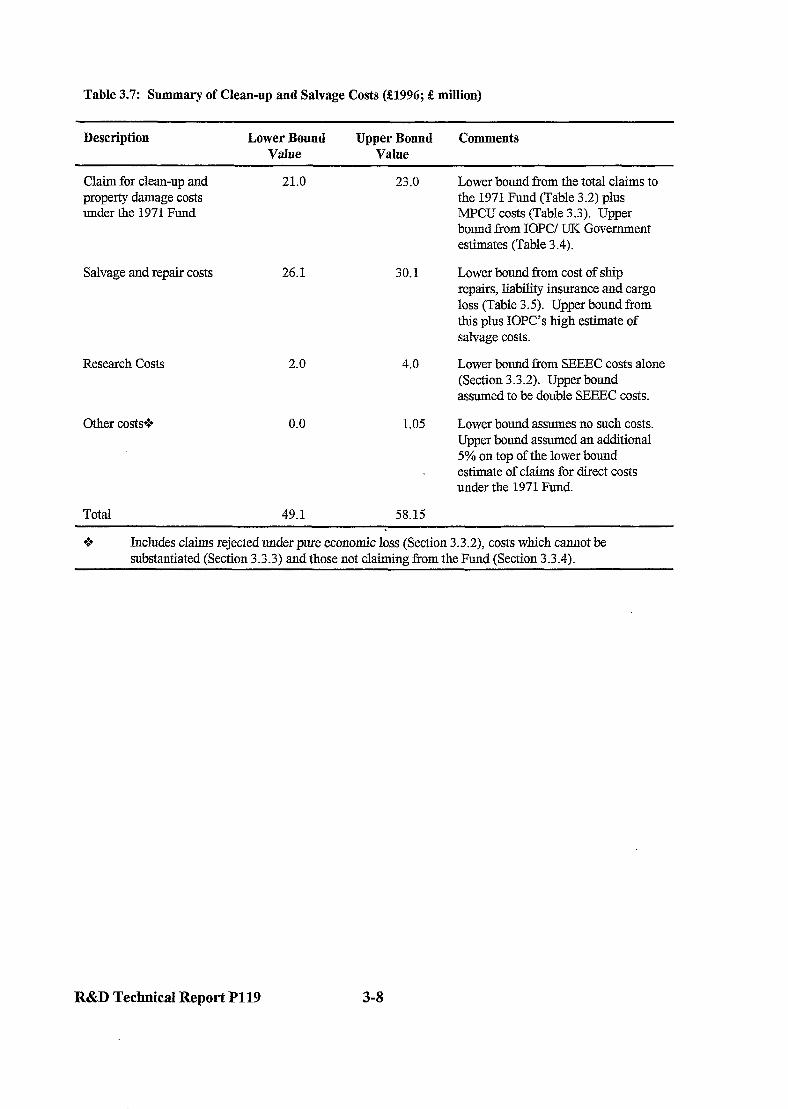
Table 3.7: Summary of Clean-up and Salvage Costs (S1996; S million)
Description Lower Bound Upper Bound Value Value
Comments
Claim for clean-up and property damage costs under the 1971 Fund
21.0 23.0
Salvage and repair costs 26.1 30.1
Research Costs
Other costs+.
2.0
0.0
4.0
1.05
Lower bound from the total claims to the 1971 Fund (Table 3.2) plus MPCU costs (Table 3.3). Upper bound from IOPC/ UK Government estimates (Table 3.4).
Lower bound from cost of ship repairs, liability insurance and cargo loss (Table 3.5). Upper bound from this plus IOPC’s high estimate of salvage costs.
Lower bound from SEEEC costs alone (Section 3.3.2). Upper bound assumed to be double SEEEC costs.
Lower bound assumes no such costs. Upper bound assumed an additional 5% on top of the lower bound estimate of claims for direct costs under the 1971 Fund.
Total 49.1 58.15
+> Includes claims rejected under pure economic loss (Section 3.3.2), costs which cannot be substantiated (Section 3.3.3) and those not claiming from the Fund (Section 3.3.4).
R&D Technical Report P119 3-8
4. TOURISM
4.1 Pembrokeshire and Tourism S
4.1.1 .-,..The Tourism Product
Pembrokeshire’s tourism product-is not singr&r,.but means different-things to different people.. The nature of Pembrokeshire’s attractions are such that:
. somevisitors are drawn to its peace and tranquillity, its rugged coast, natural beauty and wildlife;
. some.are drawn to the quality andnumber of its-heritage sites;-
. some are drawn to its:watersports, adventure parks and activity centres; while 0 others are drawn to its busy holiday resorts.
It may simply be the choice and variety of holiday activities that make Pembrokeshire such a popular destination for both day-trippers and holiday makers alike.
This section .considers the impacts to the tourism industry in terms of service providers, for example hire companies, hoteliers and restauranteurs:. It would be more usual for financial impacts to all activities relating to the provision of recreational pursuits (such as windsurf hire): to be- : considered under- the ‘recreation’.-heading (i.e. under Section 5 which follows). However, the detail provided in the about claims to the 1971 Fund has not enabled the grouping of financial and economic impacts by specific tourism service provider: As such, the financial and economic impacts to those providing. recreational activities cannot be separated ‘from other tourism . compensatory claims. Therefore, this section deals: with -all tourism financial impacts, while .. Section 5 deals with economic impacts relating to lost recreational opportunities.
The Landscape.
Pembrokeshire is surrounded .by the.Atlantic on three sides, and the coast is characterised by’ rugged rocky clif& sheltered sandy coves as well as wide and, in some places, exposed beaches. In contrast, estuaries and the inlarid landscape are wooded and secluded (for example the Cleddau estuary and-the Gwaun,Valley), while the gently rolling.Preseli Hills are more open
Pembrokeshire is the only National Park in Britain designated for its coastal landscape and many stretches-of the coastline are also. Sites of Special Scientific.Interest (SSSIs; 65 in total) and. National Nature Reserves (NNRs;.four. in total). In addition, Pembrokeshire.has been awarded four Special Protection Areas, as well- as. two coastal and two inland Special Areas for Conservation, which are internationally designated.
The uniqueness of Pembrokeshire landscape is matched by its resident and migratory wildlife,- which not only take refuge on the mainland-but also take advantage of Pembrokeshire’s islands. Skomer and Skolkholm Islands- are internationally renowned nature reserves, the, seabed surrounding.the former being one of only three Marine Reserves in Britain.
R&D Technical Report P119. 4-l I
In addition to the natural attractions in the area, Pembrokeshire has a rich human heritage including neolithic burial chambers, earthworks, Iron Age forts, Viking remains, Norman castles, Medieval churches and much more. In addition, the area’s relationship with the Atlantic over the centuries has provided it with a strong sense of maritime history.
Visitor Attractions
Pembrokeshire has a wealth of day-visitor attractions providing entertainment of every kind, such as activity and adventure centres, aquariums and sea-life centres, castles, country parks, craft centres, galleries, museums, organised outings (for example walks, boat trips and excursions) special breed and traditional farms and wildlife centres12. In addition to these are organised events throughout the main tourist season such as arts festivals, family fim days, fireworks displays, re- enactments, competitions and carnivals. There are also a number of regional, national and international sports competitions which draw large numbers of visitors into the area for several days at a time.
Longer-term holidays are also available, centred around sports activities such as learning to sail or ‘adventure’ holidays for both adults and children to experience or improve abseiling, climbing, diving, fishing, golfing, horse riding, watersports, etc. Pembrokeshire has a range of these types of activity breaks aimed specifically at schools, in addition to field study centres such as the one at Dale.
Accommodation
Pembrokeshire’s accommodation varies, from luxury hotels and country lodges to smaller sea front hotels, bed and breakfast facilities, self catering chalets, holiday parks, caravans, youth hostels and camping. In turn, these range from rural to resort sites.
Tenby, for example, is a famous UK seaside resort and accommodation here is dominated by holiday parks, some of which have self-contained activities such as golf, indoor and outdoor pools, as well as bowling and other entertainments. Similarly, Saundersfoot and Narberth have self- catering leisure parks. That said, all of these resorts also have a wealth of luxurious large guest houses and more secluded inns. Away from these resorts are more rural farm accommodation, quiet campsites, country house hotels and youth hostels accessed mainly along the Pembrokeshire Coast Path. Picturesque fishing villages and market towns offer the full range of accommodation throughout the county.
4.1.2 The Volume, Value and Nature of Visits
Volume of Visits
Visits to CarmarthenshireLPembrokeshire and Wales from the International Passenger Survey are set out in Table 4.1 for 1995 and 1996. As can be seen, it appears that in 1995 and 1996 there
12 For the more ‘high profile’ or ‘stylised’ visitor attractions, such as themed adventure parks, the adult entry fee seems to be around S.50. For more ‘natura1’ attractions such as Castles and wildlife centres, the entry fee for adults seems to be betxzen 52.00 and $3.00.
R&D Technical Report P119 4-2
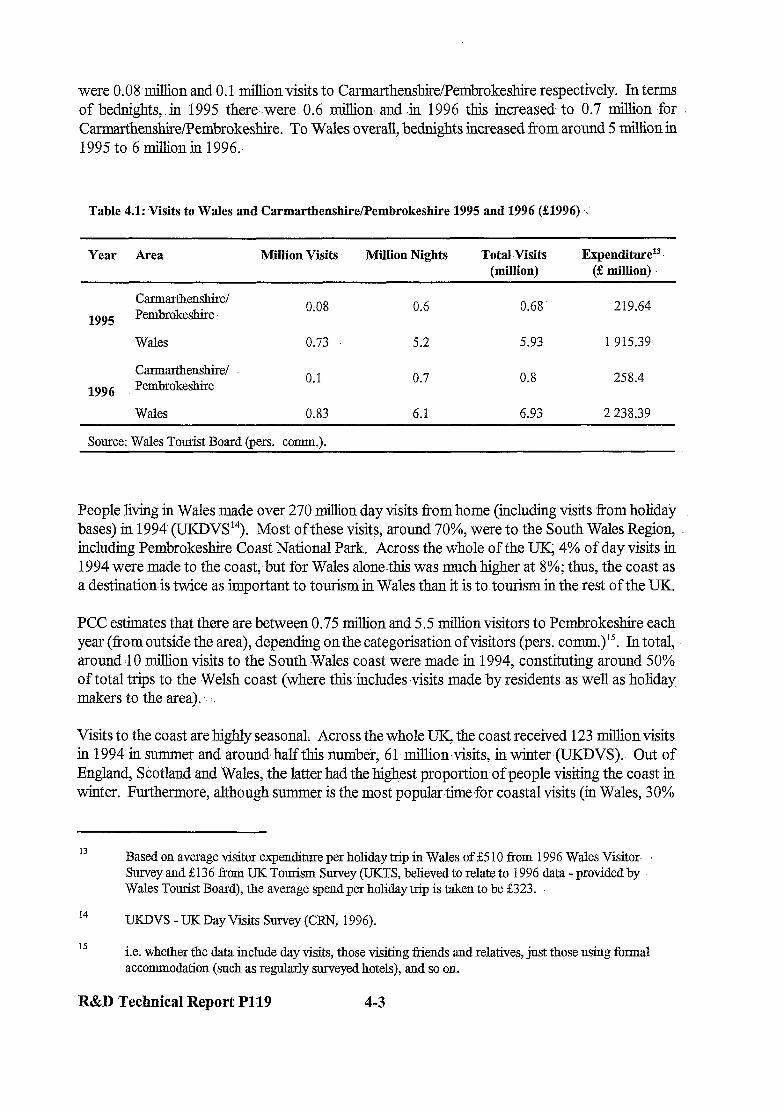
were 0.08 million and 0.1 million visits to Carmarthenshire/Pembrokeshire respectively. In terms of bednights, in 1995 there- were. 0.6 millionand .in 1996 this increased, to 0.7 million for CarmarthenshireiPembrokeshire. To Wales overall, bednights increased from around 5 million in 1995 to 6 million in 1996..
Table 4.1:Visits to Wales and Carmarthen&h-e/Pembrokeshire 1995 and 1996 (81996) ‘..
Year Area Million Visits Million Nights Total.Visits Expenditure13 (million) (a million)
Carmtienshire/
1995 Pembrokeshire. 0.08 0.6 0.68 219.64
Wales 0.73 5.2 5.93 1 915.39
Carmarthenshire/ 1996 Pembrokeshire
0.1 0.7 0.8 258.4
Wales 0.83 6.1 6.93 2 238.39
Source: Wales Tomist Board (pen. comm.).
People living in Wales made over 270 million day visits from home (including visits from holiday bases) in 1994 (UKDVS’“). Most ofthese visits, around 70%, were to the South Wales Region, including.Pembrokeshire Coast National Park. Across the whole of the UK; ‘4% of day visits in 1994 were made to the coast, but for Wales alone-this was muchhigher at 8%; thus, the coast as a destination is twice as important to tourism in Wales than it is to tourism in the rest of the UK.
PCC estimates that there are between 0.75 million and 5.5 million visitors to Pembrokeshire each year (from outside the area), depending on the categorisation of visitors (pers. c~mm;)‘~. In total, around .lO million visits to the South Wales coast were made in 1994, constituting around 50% of total trips to the Welsh coast (where thisincludes-visits made by residents as well as holiday makers to the area). . .
Visits to the coast are highly seasonal. Across the whole UK; the coast received 123 million&its in 1994.m summer and around~halfthis number, 61.million.visits, in winter (UKDVS). Out of England, Scotland and Wales;.the latter had the highest proportion of people visiting the coast in winter. Furthermore, although summer is the most popular time,for coastal visits (in Wales, 30%
13
14
Based on average visitor expenditure per holiday trip in Wales of &5 10 from 1996 Wales Visitor- Survey and 2136 from UK Tourism Survey (UKTS, believed to relate to 1996 data - provided by Wales Tourist Board), the average spend per holiday trip is taken to be 2323.
UKDVS - UK Day Visits Sm-vey (CRN, 1996).
15 i.e. whether the data include day visits, those visiting friends and relatives, just those using formal accommodation (such as regularly surveyed hotels), and so on.
R&D Technical Report P119 4-3
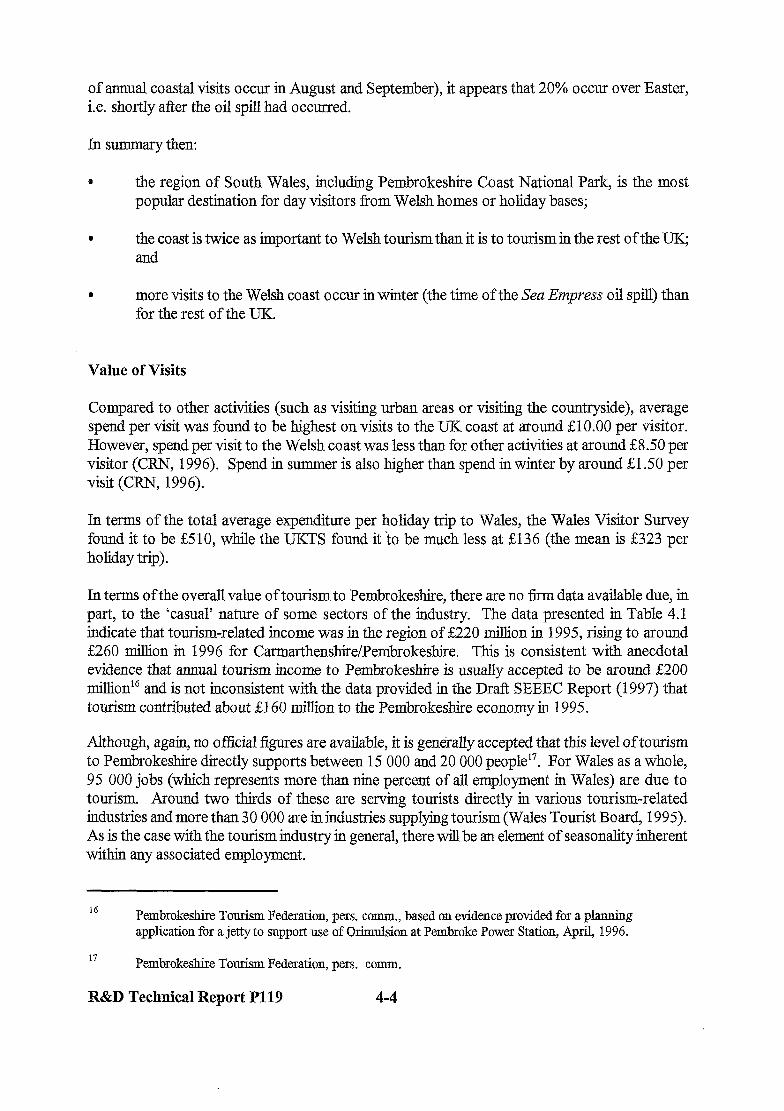
of annual coastal visits occur in August and September), it appears that 20% occur over Easter, i.e. shortly after the oil spill had occurred.
In summary then:
. the region of South Wales, including Pembrokeshire Coast National Park, is the most popular destination for day visitors f?om Welsh homes or holiday bases;
‘ the coast is twice as important to Welsh tourism than it is to tourism in the rest of the UIXJ and
. more visits to the Welsh coast occur irwinter (the time of the Sea Empress oil spill) than for the rest of the UK.
Value of Visits
Compared to other activities (such as visiting urban areas or visiting the countryside), average spend per visit was found to be highest on visits to the UK coast at around &lo.00 per visitor. However, spend per visit to the Welsh coast was less than for other activities at around g8.50 per visitor (CRN, 1996). Spend in summer is also higher than spend in winter by around El.50 per visit (CR& 1996).
In terms of the total average expenditure per holiday trip to Wales, the Wales Visitor Survey found it to be &5 10, while the UKTS found it to be much less at &136 (the mean is &323 per holiday trip).
In terms of the overall value of tourism to Pembrokeshire, there are no &m data available due, in part, to the ‘casual’ nature of some sectors of the industry. The data presented in Table 4.1 indicate that tourism-related income was in the region of 2220 million in 1995, rising to around &260 million in 1996 for Carmarthen&ire/Pembrokeshire. This is consistent with anecdotal evidence that annual tourism income to Pembrokeshire is usually accepted to be around 2200 million’6 and is not inconsistent with the data provided in the Draft SEEEC Report (1997) that tourism contributed about &160 million to the Pembrokeshire economy in 1995.
Although, again, no official figures are available, it is generally accepted that this level of tourism to Pembrokeshire directly supports between 15 000 and 20 000 people17. For Wales as a whole, 95 000 jobs (which represents more than nine percent of all employment in Wales) are due to tourism. Around two thirds of these are serving tourists directly in various tourism-related industries and more than 30 000 are in industries supplying tourism (Wales Tourist Board, 1995). As is the case with the tourism industry in general, there will be an element of seasonahty inherent within any associated employment.
16 Pembrokeshire Tourism Federation, pers. comm., based on evidence provided for a planning application for a jetty to support use of Orimulsion at Pembroke Power Station, April, 1996.
17 Pembrokeshire Tourism Federation, pers. comm.
R&D Technical Report P119 4-4
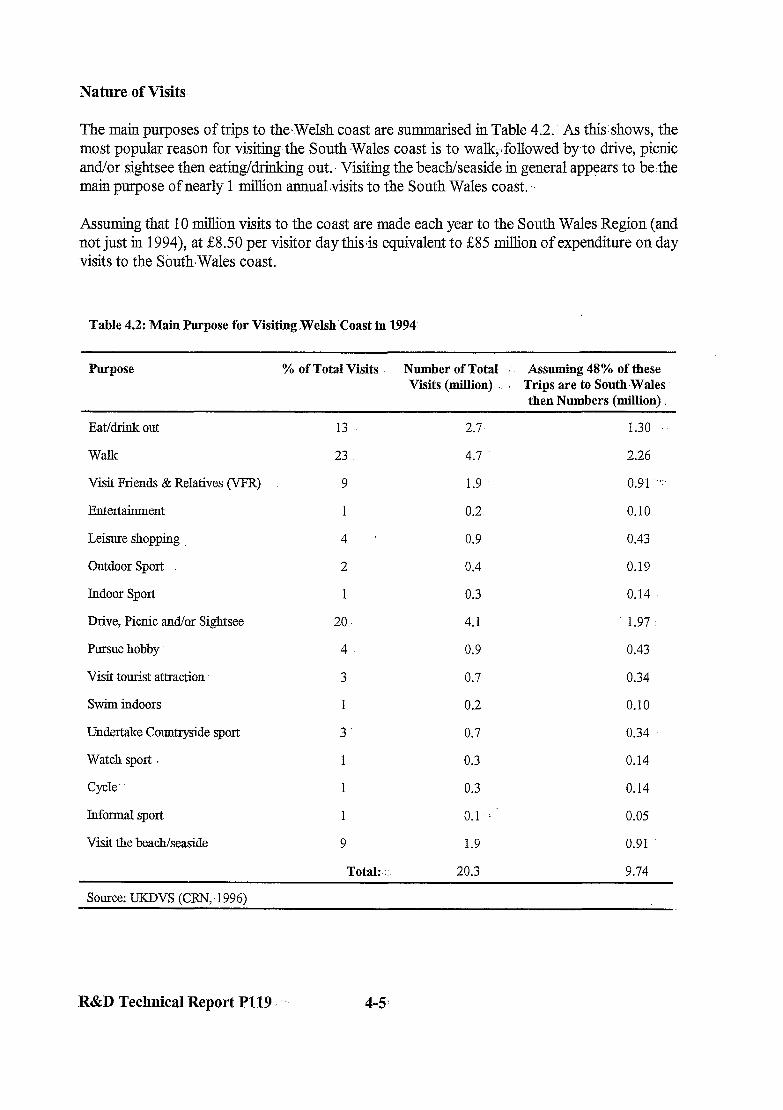
Nature. of Visits
The main purposes of trips to the.Welsh coast are summarised in Table 4.2. As this shows, the most popular reason for visiting the South .Wales coast is to walk;;followed by to drive, picnic and/or sightsee then eating/drinking out.. Visiting the beach/seaside in general appears to be.the main purpose of nearly 1 million annual.visits to the South Wales coast. :.
Assuming that 10 million visits to the coast are made each year to the South Wales Region (and not just in 1994), at E8.50 per visitor day thisis equivalent to &85 million of expenditure on day visits to the South.Wales coast.
Table 4.2: Main Purpose for Visiting ,Welsh.Coast in 1994
Purpose % of Total Visits Number of Total Assuming 48% of these Visits (million) , TriDs are to South Wales
then Numbers (million)
Eat/d.ri~& out
Walk
Visit Friends & Relatives (VFR)
Entertainment
Leisure shopping
Outdoor Sport
Indoor Sport
Drive, Picnic and/or Sightsee
Pursue hobby
Visit tourist attraction
Swim indoors
Undertake Countryside sport
Watch sport
Cycle
Informal sport
Visit the beach/seaside
13
23
9.
1
4 L
2
1
20
4
3
1
3
I
1
9
Total: :.
2.7 1.30
4.7 2.26
1.9 0.91 ‘:
0.2 0.10
0.9 0.43
0.4 0.19
0.3 0.14
4.1 1.97
0.9 0.43
0.7 0.34
0.2 0.10
0.7 0.34
0.3 0.14
0.3 0.14
0.1 .I 0.05
1.9 0.91
20.3 9.74
Source: UKDVS (CRN- 1996)
R&D Technical Report Pl19 4-5,
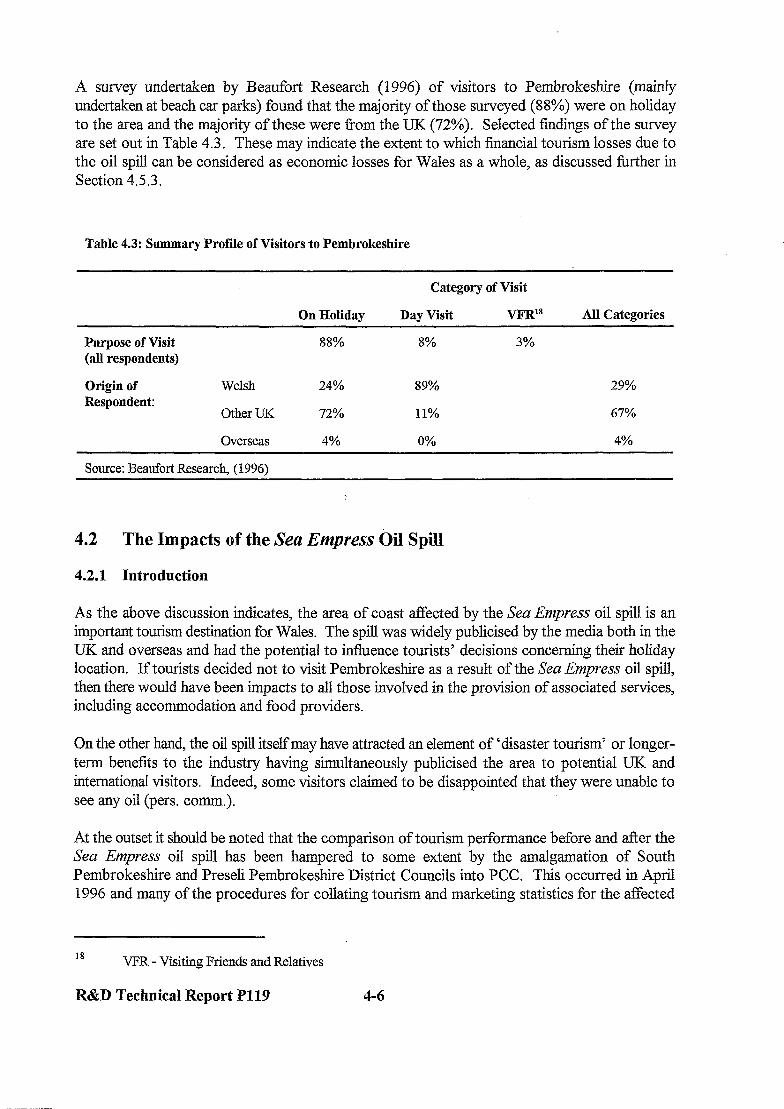
A survey undertaken by Beaufort Research (1996) of visitors to Pembrokeshire (mainly undertaken at beach car parks) found that the majority of those surveyed (88%) were on holiday to the area and the majority of these were from the UK (72%). Selected findings of the survey are set out in Table 4.3. These may indicate the extent to which financial tourism losses due to the oil spill can be considered as economic losses for Wales as a whole, as discussed further in Section 4.5.3.
Table 4.3: Summary Profile of Visitors to Pembrokeshire
Category of Visit
On Holiday Day Visit VFR18 All Categories
Purpose of Visit (all respondents)
origin of Respondent:
Welsh
Other UK
88% 8% 3%
24% 89% 29%
72% 11% 67%
Overseas 4% 0% 4%
Source: Beaufort Research (19961
4.2 The Impacts of the Sea Empress 63 Spill
4.2.1 Introduction
As the above discussion indicates, the area of coast affected by the Sea Empress oil spill is an important tourism destination for Wales. The spill was widely publicised by the media both in the UK and overseas and had the potential to influence tourists’ decisions concerning their holiday location. If tourists decided not to visit Pembrokeshire as a result of the Sea Empress oil spill, then there would have been impacts to all those involved in the provision of associated services, including accommodation and food providers.
On the other hand, the oil spill itselfmay have attracted an element of ‘disaster tourism’ or longer- term benefits to the industry having simultaneously publicised the area to potential UK and international visitors. Indeed, some visitors claimed to be disappointed that they were unable to see any oil (pers. comm.).
At the outset it should be noted that the comparison of tourism performance before and after the Sea Empress oil spill has been hampered to some extent by the amalgamation of South Pembrokeshire and Preseli Pembrokeshire District Councils into PCC. This occurred in April 1996 and many of the procedures for collating tourism and marketing statistics for the affected
18 VFR - Visiting Friends and Relatives
R&D Technical Report P119 4-6

area were not carried across into the new Council. In addition, some methods of data, analysis (for example those relating to Tourist Information Centres) were overhauled. Many individuals with. expert knowledge of tourism and recreation in the affected area have changed posts and associated data sources have not always-been immediately available.-Consultation suggests that some of these procedures will be re-instigated indue course but the continuity of data collection and analysis has been lost -for the critical period covering the spill (pers. c~mm.)~‘.
Data were sought fi-om a variety of sources including tourism associations. The general response was that the information required to verify impacts was simply not collected by the vast majority of tourism operators. Thus, estimates of the costs stemming from the Sea Empress oil spill have been derived from available surveys, anecdotal evidence and expert knowledge.
4.2.2 Summary of Nature of Impacts
The Sea Empress oil spill occurred in.February during the period of peak booking-for summer holidays, especially. for tourists planning to undertake self-catering- visits over the summer. Anecdotal evidence has suggested that up to two thirds of annual tourism income.reIates to. bookings taken before and during this time (pers. comm.). The impacts on different service providers varied according to their relationship with the sea and the coast. As such, it appears that. companies offering watersports and tioastal activities suffered the greatest impacts. For. a number I of these, bookings stopped for a period of about six weeks immediately tier the spill. After this time,-interest increased slowly but only recovered later. in the year through extensive positive advertising campaigns on behalf of the region as a whole; as well as through individual company efforts. Some with expert knowledge of the local tourism industry have suggested that recovery was only due to the growir@K trend of taking later domestic second holidays in mid summer, for which bookings are made later in the year (pers. comm.).
The only identifiable impact to Pembrokeshire’s tourism in 1996 was a reduction in bednights of around 7% (see Annex 4 for a more detailed discussion). Following detailed analysis of various. surveys, the Wales Tourist Board (WTB)-have concluded that no consistent-or measurable trends i in tourism performance emerge for Pembrokeshire overall in 199620. Thus, overall, it appearsthat the Sea Empress oil spill has had no long-term impacts on tourism.to Pembrokeshire: However,- within this overall trend are hidden. some significant .long- and. short-term losses as impacts on performance will not have been uniform across the tourism industry. For. example, it has been suggested that individual businesses with seaside locations and without,the means to undertake any re-marketing activities experienced up-to 30% reductions in business (pers. comm.).
While some businesses experienced losses, others gained visitors as patterns of activity shifted in. response to the oil spill. For example,- some of the attractions close to the.affected beaches in Tenby and Manorbier experienced reductions in visitor numbers in excess of 10%; while some. inland attractions experienced increases of a similarscale:- The WTB?s annual survey of visitors
19 This has meant an increased reliance on Iess robust data.
20 This is despite a diverse range. of data being available for analysis.
R&D Technical Report P119 4-7
to tourist attractions in Wales found an overall 3% rise in attendances (WTB: Survey of Visitors to Attractions, in WTB, 1997a).
One of the most significantly impacted businesses appears to be West Wales Wind, Surfing and Sailing whose position on St Ann’s Head has meant thatthey were very badly positioned with respect to the extent of oiling. The company had to close for three months in 1996 as contact watersports were banned and courses were immediately cancelled. Their turnover for 1996 reduced by half and the spill has reduced bookings for 1997 by between 25% and 30%, equivalent to losses of ;EO. 1 million for each year. These losses mainly relate to: cancellation of a six month long residential watersports instructor course; cancellations of family holidays; and cancellations of beginner courses, participants of which tend to return for more advanced courses the following year. In addition, the company was in the process of expanding at the time of the spill and they estimate that it will take around three more years to regain the level of growth they were experiencing prior to the spill (pers. comm.). This company has claimed compensation from the 1971 Fund, which is discussed in Section 4.3.
The ability of operators to undertake positive advertising immediately following the incident may have limited adverse impacts to their business (pers. comm.). For example, immediately tier the spill, the phones at a central booking agent for watersports centres in Pembrokeshire stopped ringing. Considerable amounts of money (230 000) were spent immediately to recover the reputation of watersports in the a.rea21. As a consequence, the overall petiormance in 1996 was 2% to 3% up on that for 1995, and this trend has continued into 1997 where they have experienced increases of around 8% on 1996 performance (pers. comm.). Some of this growth may be related to the positive advertising undertaken following the oil spill and so the company may be experiencing long-term benefits from the’spill.
In general, it is expected that those operators able to invest in marketing following the oil spill would have been medium to large sized, owing to their size of turnover and so accessibility to fimds for immediate marketing activities. Thus, longer-term negative impacts may be centred around smaller businesses who may also be those unable to provide evidence of their financial losses in order to qualify for compensation from the 1971 Fund.
There have been suggestions that those operators in South-West Wales to have under-performed in 1996 have continued to under-perform on into the first half of 1997 (pers. comm.). Other consultees have suggested that, despite the immediate negative impact, the oil spill has ‘put Pembrokeshire on the map’ both in the UJX and internationally and so bookings have recovered well.
4.2.3 Actions to Minimise Impacts
Actions were taken by a number of organisations including PCC and the WTB with the aim of minimising the impacts of the Sea Empress oil spill on tourism. These actions took the form of a reassurance campaign coordinated by Tourism South and West Wales (Beaufort Research,
21 The waterwrts company claimed compensation from the 1971 Fund and payments relating to this are included in Section 4.3. It is unknown whether the company additionally claimed for promotional expenditure an& if so, whether the Fund compensated for this.
R&D Technical Report P119 4-8
1996). The WTB concentrated on the ‘pan-Wales’ level of tourism on the assumption that visitors fi-om overseas would associate the disaster with Wales as a whole (Fielding,z 1997). The actions of the Tourism and Leisure Services Department of PCC focussed on Pembrokeshire alone and’! included (Fielding, 1997):
. encouraging positive editorials in the national and English-regional-press;
. some ‘advertorial? - upbeat copy supported by advertising;
. a competition which attracted over 1,000 entries; and . . l interviews with travel writers and foreign journalists.
Actions were also taken to-ensure that visitors had access to accurate and-up-to-date information in response to visitors’ questions and concerns-
Tourism South and-West Wales has submitted a claim to the 1971 Fund for .marketing and IOPC Fund liaison activities in response to the Sea Empress oil spill of around $0.07 million against a programme totalling $0.1 million (which-includes a SO.04 million. grant from.WTE3).
PCC have estimated that marketing actions undertaken by them may-have resulted in additional costs over and above the norm for that time of year at around &0.028. However, it is commented that these were very difficult to pinpoint (pers. comm.).
Details of actual payments from the 1971 Fund-have not been provided.
4.3 Compensation Under the 1971 .F&d
4.3.1 Claims Approved. by,tbe 1971 Fund for- the Sea Empress Oil Spill :
AvailableIdata on claims made to the Fund by businesses in the tourism sector following the Sea Empress oil spill are presented in Table 4.4**: This indicates that 398 claimshave been made by operators in the tourist industry, with the majority of claims being from small operators providing bed and breakfast or self-catering .accommodation-(IOPC, 1997b). To date, claims totalling around 21.2 million have been approved for payment.. . .
Despite the IOPC Fund stating that the -majority ,of,claims have been from small operators, consultation with organisations co-ordinating tourism: claims :to the Fund have indicated that claimants are larger, more organised companies. Indeed,- several consultees have commented that smaller operators will not have recorded the type of data required in order to qualify ,for compensation under the Fund. I
22 All of this information is taken from IOPC literature although the Consultants have also held discussions with IOPC. ..
R&D Technical Report P119 4-9
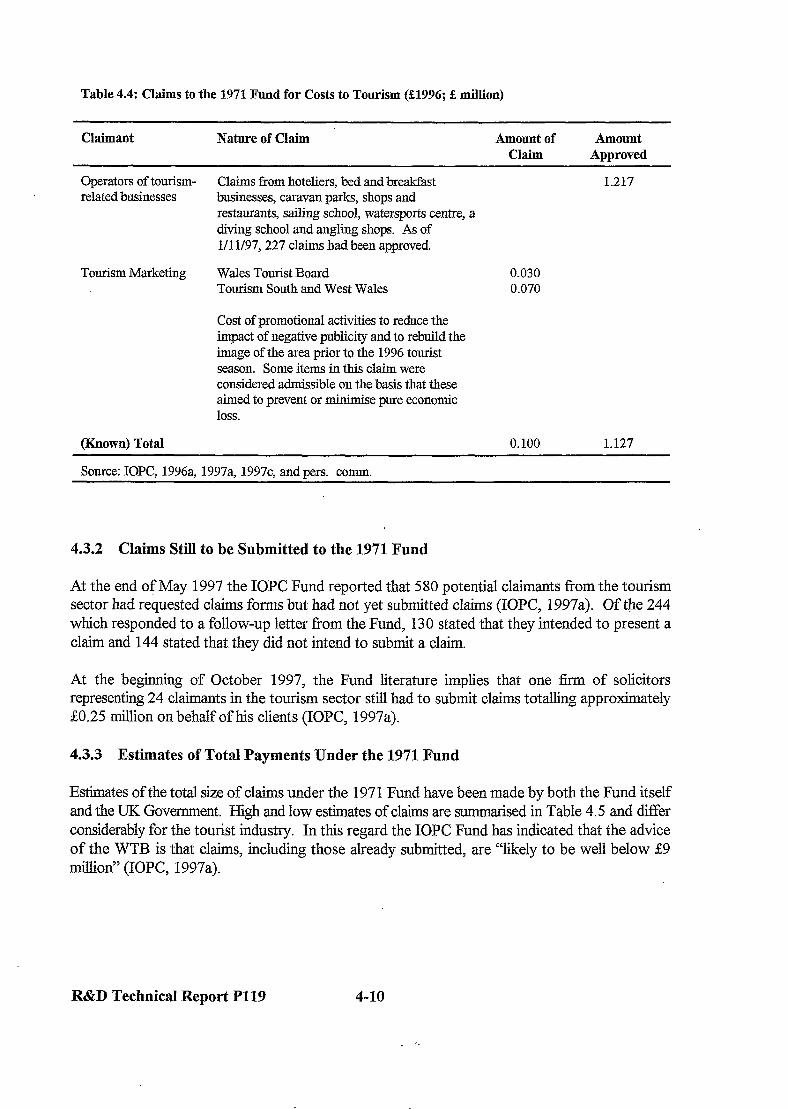
Table 4.4: Claims to the 1971 Fund for Costs to Tourism (33996; S million)
Claimant Nature of Claim Amount of Amount Claim Approved
operators of toulisnl- related businesses
Tourism Marketing
(Known) Total 0.100 1.127
0.030 0.070
Claims from hoteliers, bed and breakfast businesses, caravan parks, shops and restaurants, sailing school, watersports centre, a diving school and angling shops. As of l/l l/97,227 claims had been approved
1.217
Wales Tourist Board Tourism South and West Wales
Cost of promotional activities to reduce the impact of negative publicity and to rebuild the image of the area prior to the 1996 tourist season. Some items in this claim were considered admissible on the basis that these aimed to prevent or minimise pure economic loss.
Source: IOPC, 1996a, 1997a, 1997c, and pers. comm.
4.3.2 Claims Still to be Submitted to the 1971 Fund
At the end of May 1997 the IOPC Fund reported that 580 potential claimants from the tourism sector had requested claims forms but had not yet submitted claims (IOPC, 1997a). Of the 244 which responded to a follow-up letter from the Fund, 130 stated that they intended to present a claim and 144 stated that. they did not intend to submit a claim.
At the beginning of October 1997, the Fund literature implies that one firm of solicitors representing 24 claimants in the tourism sector still had to submit claims totalling approximately SO.25 million on behalf of his clients (IOPC, 1997a).
4.3.3 Estimates of Total Payments Under the 1971 Fund
Estimates of the total size of claims under the 1971 Fund have been made by both the Fund itself and the UK Government. High and low estimates of claims are summarised in Table 4.5 and differ considerably for the tourist industry. In this regard the IOPC Fund has indicated that the advice of the WTB is that claims, including those already submitted, are “likely to be well below &9 million” (IOPC, 1997a).
R&D Technical Report P119 4-10
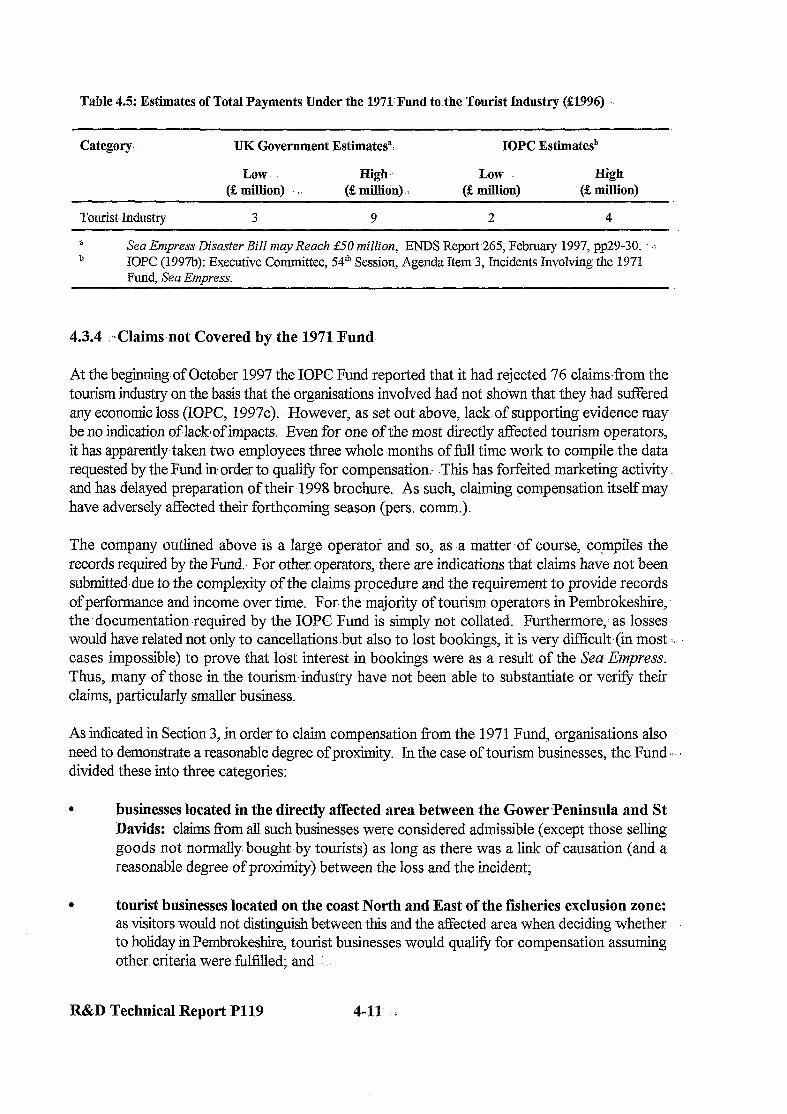
Table 4.5: Estimates of Total Payments Under the 1971’Fund to.the Tourist Industry (S1996)
Category TJK Government Estimates”! IOPC Estimatesb
Low- High Low High (2 million) (S million) (& million) (S million)
Tourist Industry 3 9 2 4
a Sea Empress Diiaster Bill may Reach 250 million, ENDS Report265, February 1997, pp29-30. .: b IOPC (1997b): Executive Committee, 5@’ Session, Agenda Item 3, Incidents Involving the 1971
Fund, Sea Empress.
4.3.4 .,Claims,not Covered by the 1971 Fund
At the beginning,of October 1997 the IOPC Fund reported that it had rejected 76 claimsfiom the tourism industry on the basis that the organisations involved had not shown that they had suffered any economic loss (IOPC, 1997c). However, as set out above, lack. of supporting evidence may be no indication oflackrof impacts. Even for one of the most directly affected tourism operators, it has apparently.taken two employees three whole months of fill time work to compile .the data requested by the Fund in order to qualify for compensation.. .This has forfeited marketing activity. and has delayed preparation of their 1998 brochure. As such, claiming compensation itself may have adversely tiected their forthcoming season (pers. comm.).
The company outlined above is a large operator and -so, as a matter .of course, compiles the records required by the Fund. For other operators,:there are indications that claims have not been submitted,due to the complexity of the claims procedure and the requirement to provide records of petiormance and income,over time. For the-majority of tourism operators in Pembrokeshire,- the .documentation required by the IOPC Fund is simply not collated. Furthermore, as .losses would have related not only to cancellations but also to lost bookings, it is very difficult-(in most . . cases impossible) to prove that lost interest in bookings were as a result of the Sea Empress. Thus, many of those in the tourism industry have not- been able to substantiate or verify their claims, particularly smaller business.
As indicated in Section 3, in order to- claim compensation from the 197 1 Fund, organisations also need to demonstrate a reasonable degree of proximity. In the case of tourism businesses, the Fund ‘5. . divided these into three categories:
. businesses located in the directly affected area between the Gower ‘Peninsula and St Davids: claims f?om all such businesses were considered admissible (except those selling goo.ds not normally bought-by tourists) as long as there was a link of causation (and a reasonable degree of proximity) between the loss and the incident;
. tourist businesses located on the.coast North and Easkof the fisheries exclusion zone: as visitors would not distinguish between-this and the tiected area when deciding-whether to holiday in Pembrokeshire, tourist businesses would qualify for compensation assuming other. criteria were. fXfYled; and
R&D Technical Report P119 4-11 i
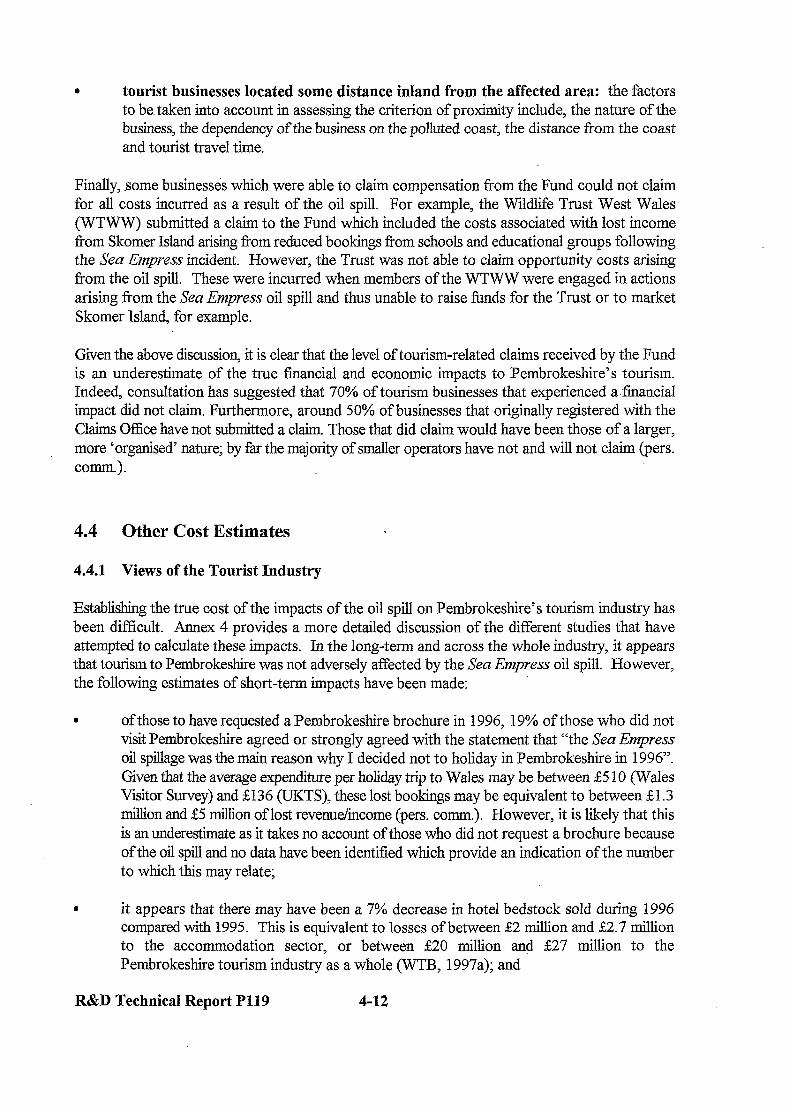
l tourist businesses located some distance inland from the affected area: the factors to be. taken into account in assessing the criterion of proximity include, the nature of the business, the dependency of the business on the polluted coast, the distance from the coast and tourist travel time.
Finally, some businesses which were able-to claim compensation fi-om the Fund could not claim for all costs incurred as a result of the oil spill. For example, the Wildlife Trust West Wales (WTWW) submitted a claim to the Fund which included the costs associated with lost income fi-om Skomer Island arising fi-om reduced bookings from schools and educational groups following the Sea Empress incident. However, the Trust was not able to claim opportunity costs arising from the oil spill. These were incurred when members of the WTWW were engaged in actions arising from the Sea Empress oil spill and thus unable to raise funds for the Trust or to market Skomer Island, for example.
Given the above discussion, it is clear that the level of tourism-related claims received by the Fund is an underestimate of the true financial and economic impacts to Pembrokeshire’s tourism. Indeed, consultation has suggested that 70% of tourism businesses that experienced a.fina.ncial impact did not claim. Furthermore, around 50% of businesses that originally registered with the Claims Office have not submitted a claim. Those that did claim would have been those of a larger, more ‘organised’ nature; by far the majority of smaller operators have not and will not claim (pers. comm.).
4.4 Other Cost Estimates
4.4.1 Views of the Tourist Industry
Establishing the true cost of the impacts of the oil spill on Pembrokeshire’s tourism industry has been difficult. Annex 4 provides a more detailed discussion of the different studies that have attempted to calculate these impacts. In the long-term and across the whole industry, it appears that tourism to Pembrokeshire was not adversely affected by the Sea Enzpress oil spill. However, the following estimates of short-term impacts have been made:
of those to have requested a Pembrokeshire brochure in 1996, 19% of those who did not visit Pembrokeshire agreed or strongly agreed with the statement that “the Sea Empress oil spillage was the main reason why I decided not to holiday in Pembrokeshire in 1996”. Given that the average expenditure per holiday trip to Wales may be between 25 10 (Wales Visitor Survey) and 2136 (UKTS), these lost bookings may be equivalent to between &1.3 million and &5 million of lost revenue/income (pers. comm.). However, it is likely that this is an underestimate as it takes no account of those who did not request a brochure because of the oil spill and no data have beerridentified which provide an indication of the number to which this may relate;
l it appears that there may have been a 7% decrease in hotel bedstock sold during 1996 compared with 1995. This is equivalent to losses of between &2 million and 22.7 million to the accommodation sector, or between 220 million and 227 million to the Pembrokeshire tourism industry as a whole (WTB, 1997a); and
R&D Technical Report P119 4-12

. the Pembrokeshire .Tourism Federation has suggested that the general decline in tourism business across Pembrokeshire between l-995 and 1996 is considered to be around 6%. Given the fact that tourism to Wales as a whole increased by 17% over,the same period (WTJ3, 1997a), the decline in Pembrokeshire’s tourism.may have been as high as 23%. Given this and the lack of any-firm and reliable actual data, the Pembrokeshire .Tourism Federation consider that this reflects a general impact to Pembrokeshire tourism equivalent to lost income of &46. million (given that .the total annual income due to tourism is generally accepted to be around 2200 million; [pers. comm.]).
4.5 Summary of Costs to Tourism
4.5.1 Using IOPC Fund Data
As set out above, 226 operators-have claimed compensation from the -1971 Fund. It has been suggested-that misnumber may represent only.-30% of operators which experienced negative. financial impacts from the Sea Empress oil spill (although they are likely to -be the larger. operators) and that’ 70% of operators have not and will not claim. Thisimplies that perhaps 530 businesses may have been adversely affected by the Sea Empress oil spill and yet did not claim. -’ compensation from the 1971 Fund for a number of reasons.
It’has been suggested that the non-claiming businesses may have been smaller, and so it can be assumed that their individual losses may also have been smaller than for those operators claiming from the Fund. It could, therefore, be expected that the amount claimed by the larger operators represents about 50% of overall losses totourism operators owing to the Sea Empress oil spill. .. Given these factors, it is assumed here-that the. total costs incurred by the non-claiming (and probably smaller) operators are equal to the estimated total payments-expected by the IOPC Fund for those operators claiming reimbursement (as set out in Table 4.5):,In other words, the amount expected to. be claimed by tourism operators tiom.the 1971 Fund-is expected to represent 50% of overall losses to tourism operators owing to the Sea Empress oil spiu, and so the true costs may be twice those expected to be claimed fromthe Fund (set out in Table 4.5). Thus, the total costs may be in the region of:
. based on UK Government-estimates: Low of &6 million; High of El 8 million;
. based on IOPC Fund estimates: Low of &4 million; and High of &8 million;
As data have yet to be received on the amounts. claimed versus the amounts approved for compensation by the Fund, these calculations are based on amounts expected to be approved (see Table 4.5), and so represent lower bound estimates.
R&D Technical Report P119 4-13
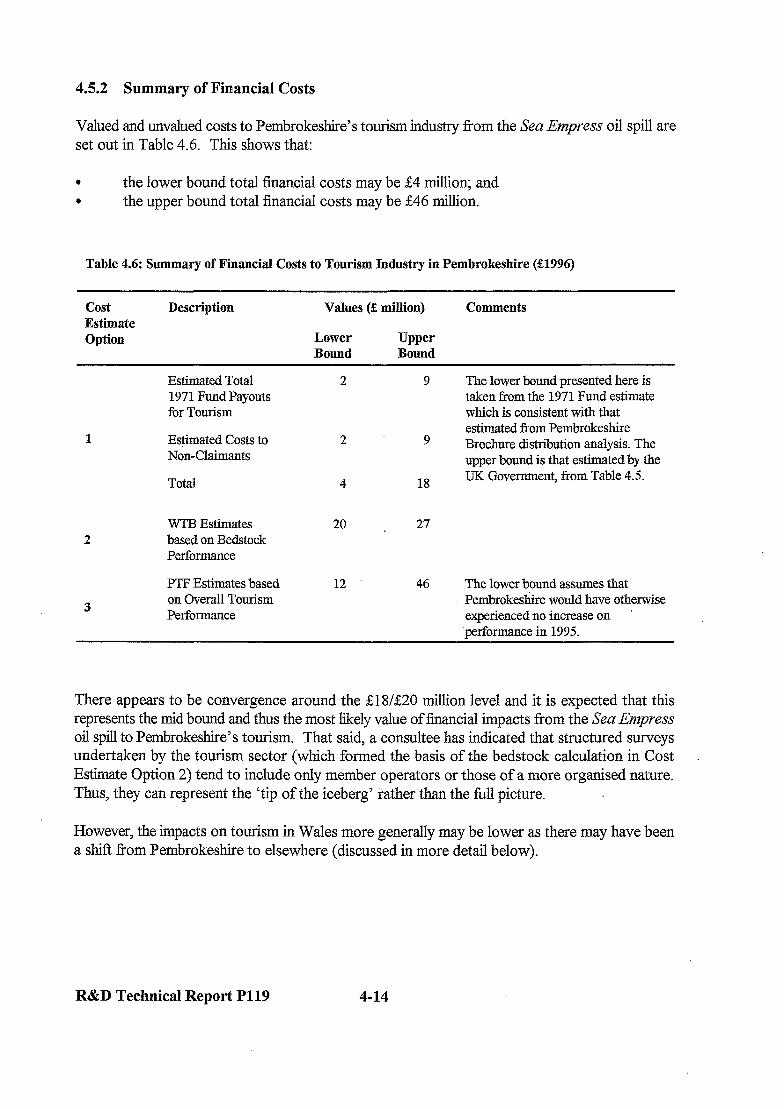
4.5.2 Summary of Financial Costs
Valued and unvalued costs to Pembrokeshire’s tourism industry from the Sea Empress oil spill are set out in Table 4.6. This shows that:
. the lower bound total financial costs may be ;E4 million; and
. the upper bound total financial costs may be 246 million.
Table 4.6: Summary of Financial Costs to Tourism Zudustry in Pembrokeshire (221996)
cost Estimate Option
Description Values (5 million)
Lower Upper Bound Bound
Comments
Estimated Total 1971 Fund Payouts for Tourism
Estimated Costs to Non-Claimants
Total
2 WTB Estimates based on Bedstock Performance
3
PTF Estimates based on Overall Tourism Performance
9 The lower bound presented here is taken from the 1971 Fund estimate which is consistent with that estimated from Pembrokeshire
9 Brochure distribution analysis. The upper bound is that estimated by the
4 18 UK Government, from Table 4.5.
20 L 27
12 46 The lower bound assumes that Pembrokeshire would have otherwise experienced no increase on ~jmformance in 1995.
There appears to be convergence around the &18/&20 million level and it is expected that this represents the mid bound and thus the most likely value of financial impacts from the Sea Empress oil spill to Pembrokeshire’s tourism. That said, a consultee has indicated that structured surveys undertaken by the tourism sector (which formed the basis of the bedstock calculation in Cost Estimate Option 2) tend to include only member operators or those of a more organised nature. Thus, they can represent the ‘tip of the iceberg’ jiather than the full picture.
However, the impacts on tourism in Wales more generally may be lower as there may have been a shift from Pembrokeshire to elsewhere (discussed in more detail below).
R&D Technical Report P119 4-14
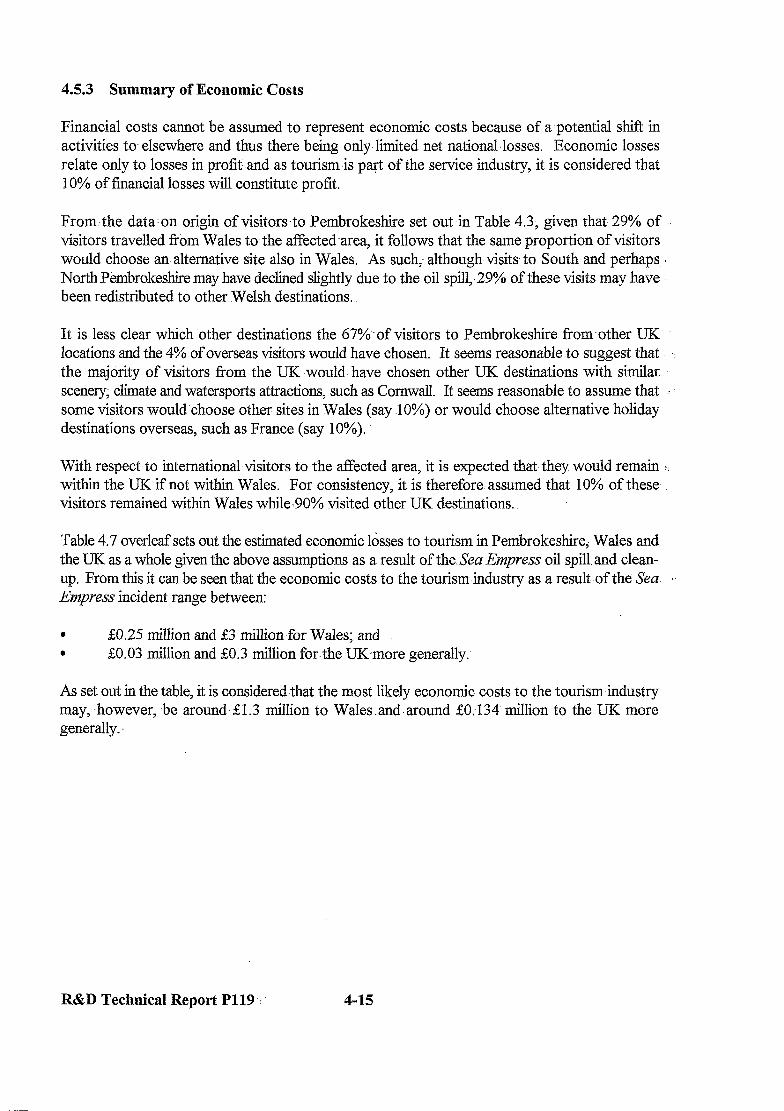
4.5.3 Summary of Economic Costs
Financial costs cannot be assumed- to represent economic costs because of a-potential shit? in activities to- elsewhere and thus there being only limited net national.losses. Economic losses relate only to losses in profit- and as tourism is part of the service industry, it is considered that 10% of financial losses will constitute profit.
From.the datazon origin of visitors-to Pembrokeshire set out in Table 4.3, given that 29% of visitors travelled from Wales to-the affected-area, it follows that the same proportion of visitors would choose an alternative site also in Wales. As such- although visits to South and perhaps.. North Pembrokeshire may have declined slightly due to the oil spill,,29% of these visits may have been redistributed to other Welsh destinations.
It is less clear which other destinations the 67%.of visitors to Pembrokeshire from-other UK locations and the 4% of overseas visitors would have chosen. It seems reasonable to suggest that the majority of visitors from the UK would- have chosen other UK destinations with ~similar scenery; climate and watersports attractions, such as Cornwall. It seems reasonable to assume that : some visitors would choose other sites in Wales (say lo%) or would choose alternative holiday destinations overseas, such as France (say 10%).
With respect to international visitors to the affected area, it is expected that they would remain :: within the UK.if not within Wales. For consistency, it is therefore: assumed that 10% :of these. visitors remained within Wales while:90% visited other UK destinations.
Table 4.7 overleafsets out the estimated economic losses to tourism in Pembrokeshire, Wales and the UK as a whole given the above assumptions as a result of the.Sea ,?Zmpres,s oil spill. and clean- up. From this it can be seen that the economic costs to the tourism.industry as a result, of the Sea. i Empress incident range between:
. SO.25 million and ~$3 million for Wales; and . SO.03 million and go.3 million for the UK,more generally.
As set out in the table, it is considered.that the most likely economic costs to the tourism-industry may, however, be around.&1.3 million to Wales.and.around &0.134 million to the UK more generally.
R&D Technical Report P119 : 4-15
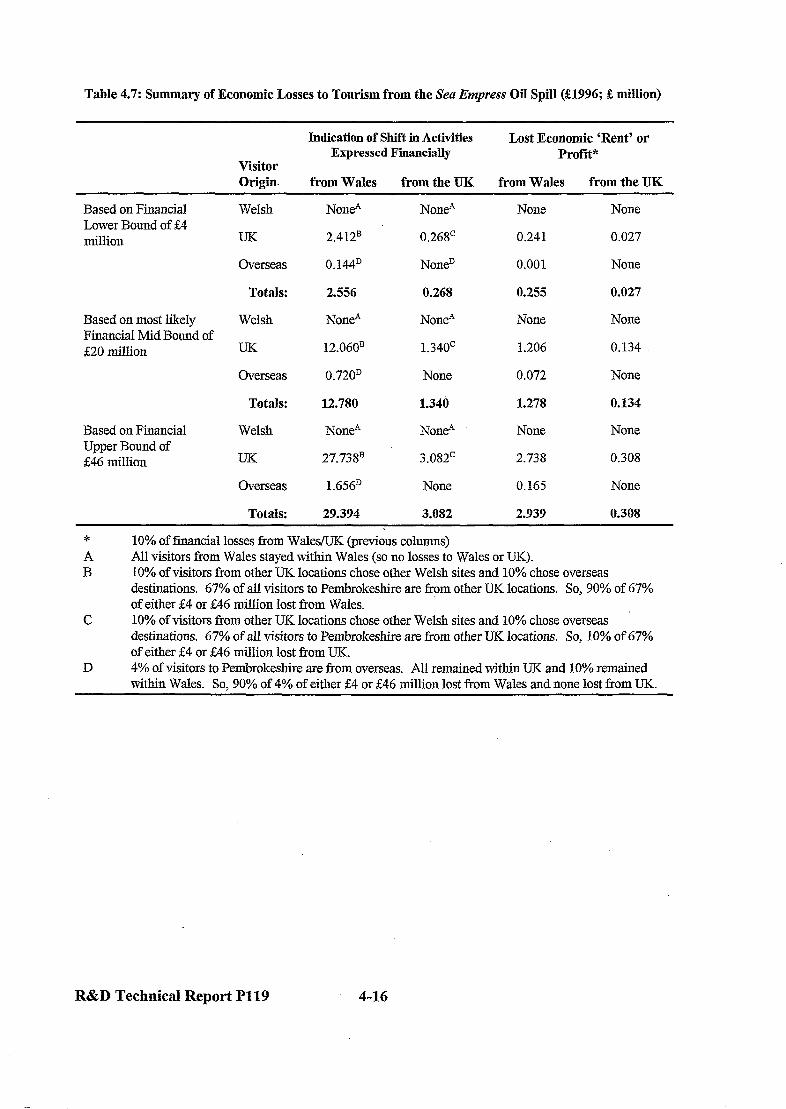
Table 4.7: Summary of Economic Losses to Tourism from the Sea Empress Oil Spill (21996; % million)
Visitor Origin.
Indication of Shift in Activities Lost Economic ‘Rent’ or Expressed Financially Profit”
from Wales from the UK from Wales from the UK
Based on Financial Lower Bound of &I million
Based on most likely Financial Mid Bound of 520 million
Based on Financial Upper Bound of 546 million
9 10% of &axial losses from Wales/UK (previous columns) A All visitors from Wales stayed within Wales (so no losses to Wales or UK). B 10% of visitors from other UK locations chose other Welsh sites and 10% chose overseas
destinations. 67% of all visitors to Pembrokeshire are from other UK locations. So, 90% of 67% of either 54 or 546 million lost from Wales.
C 10% of visitors from other UK locations chose other Welsh sites and 10% chose overseas destinations. 67% of all visitors to Pembrokeshire are from other UK locations. So, 10% of 67% of either &4 or 546 million lost from UK.
D 4% of visitors to Pembrokeshire are from overseas. All remained within UK and 10% remained within Wales. So, 90% of 4% of either &4 or 546 million lost from Wales and none lost from TJK.
Welsh
UK
Overseas
Totals:
Welsh
UK
Overseas
Totals:
Welsh
TJK
Overseas
Totals:
NOB?4
2.412B
0.144D
2.556
None-’
12.060’
0.720D
12.780
None*
27.7BB
1.656D
29.394
None-’ None
0.268’ 0.241
NoneD 0.001
0.268 0.255
None-’ None
1.340c 1.206
None 0.072
1.340 1.278
None+’ None
3.082’ 2.738
None 0.165
3.082 2.939
None
0.027
None
0.027
None
0.134
None
0.134
None
0.308
None
0.308
R&D Technical Report P119 4-16
5. RECREATION
5.1 Recreational Activiti& in Pembrokeshire
5.1.1 .. .Types and Locations of Potentially Affected Activities
As outlined in Section 4, around 10 million annual-visits may be made to the-South.Wales coast and these trips are dominated by walking, followed by sightseeing. and eating/drinking out. Visiting,the beach/seaside ingeneral appears to be the main purpose .of nearly 1 million annual visits to the South Wales coast. Not all coastal activities would have been affected by the Sen Empress oil spill. Table 5.1 sets out the water contact pursuits undertaken at or from each tiected beach. Annex 5 contains,a map marked with the key sites and activities. Table A5.1 in Annex 5 sets out the recreational characteristics of each amenity beach to have been affected by-:.- the oil spill..
In addition to those activities highlighted in Table 5; 1, general beach visits including sunbathing : and picnicking can occur at any beach, as can swimming and bathing. In terms of non-immersible pursuits,- walking is popular all along the South Pembrokeshire coast .and the Coast Path runs across some beaches.- The other popular.non-immersible coastal activity,undertaken in South : Pembrokeshire is rock climbing. All of these activities are discussed below.
While there is a relationship between tourism and recreation, the costs associated with each due to the oil spill and clean-up are quite different. As set out in the previous section, most tourist.. destinations were largely clean by the time the ,1996 tourism season began. ‘As such,. bathing seems to have been the only activity that would have been.undertaken by tourists during the summer appear which was tiected. In contrast, recreational losses relate to the lost activity that- would have otherwise taken place during the time of the oil spill and clean-up. It .appearsthat, on the whole, the majority of participants in these recreational activities would have been locals and 5:. not ‘tourists’. Thus, lost-recreational activity.does not convert into economiclosses to the region or to Wales apart from where attendance at national or international events was affected.
Lost recreational activity does not result in financial losses, unless some,form of expenditure is involved with undertaking the activity (such as hiring a surf board or dinghy). All financial losses relating to reduced recreational activity are considered in Section 4 as they contribute to the value of the local and regional tourism industry.. This section deals entirely with economic losses, or rather the value of lost enjoyment that would have been gained from participating- in foregone recreational activities, owing to the Sea Empress oil spill and clean-up.
5.1.2 Description of Non-Immersible .Activities
Data for visitor activities at coastal locations.,in Pembrokeshire -are presented in Table 5.2 (Beaufort Research, 1996): The sampling sites used in the associated survey were classified.into three broad categories; corresponding to high, medium and low.visitor use. The sampling sites were car parks often associated with beaches and the data necessary ,for classification were provided by the Pembrokeshire Coast National Park Authority (PCNPA). .This explains the divergence between Table 5;2 and Table 4.2 in Section 4, the former relating to tourism activities undertaken when in Wales, rather than tourism activities undertaken from.beach car parks.
R&D Technical Report P119 : 5-l
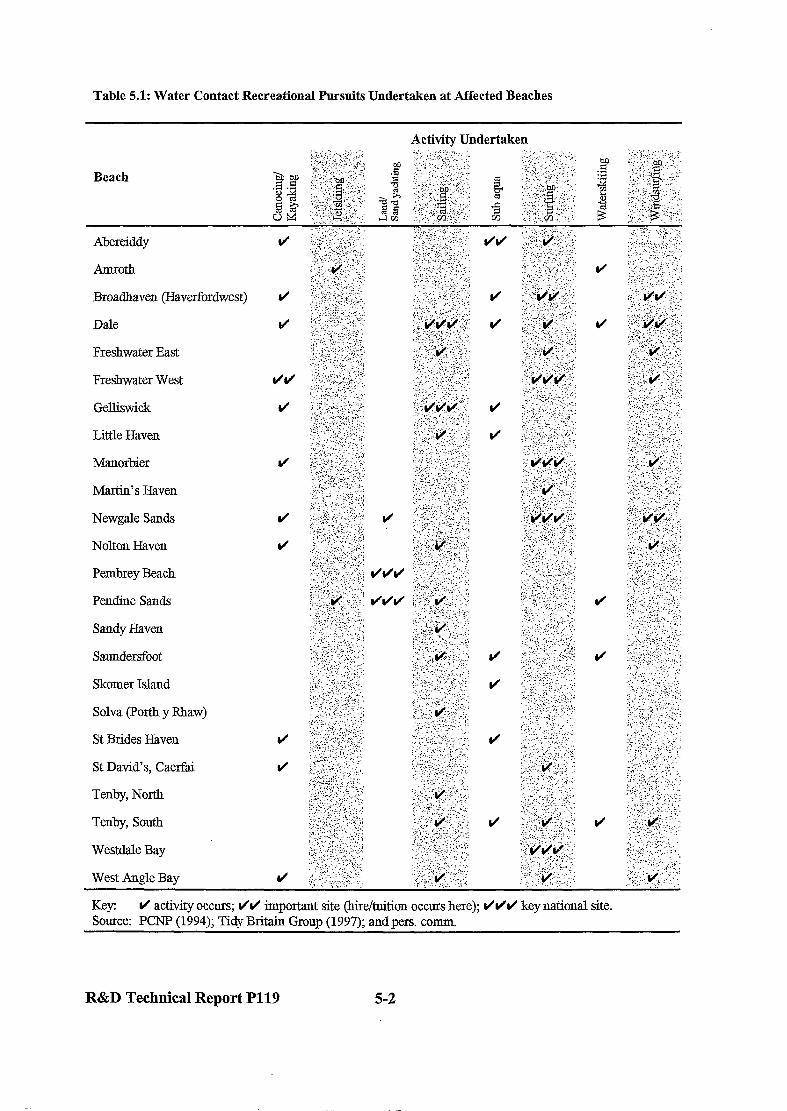
Table 5.1: Water Contact Recreational Pursuits Undertaken at Affected Beaches
Aberciddy
Amrod
Broadhaven (Haverfordwest)
Dale
Freshwater East
Freshwater West
Gelliswick
Little Haven
Manorbier
Martin’s Haven
Newgale Sands
Nolton Haven
Pembrey Beach
Pendine Sands
Sandy Haven
Saundersfoot
Skomer Island
Solva (Perth y Rhaw)
St Brides Haveu
St David’s, Caetiti
Tenby, North
Tenby, South
Westdale Bay
West Angle Bay
Activity Undertaken
Key: I/ activity occurs; ti/(/ important site (hire/tuition occurs here); r/l/l/ key national site. Source: PCNP (1994); Tidy Britain Group (1997); and pers. comm.
R&D Technical Report P119 5-2
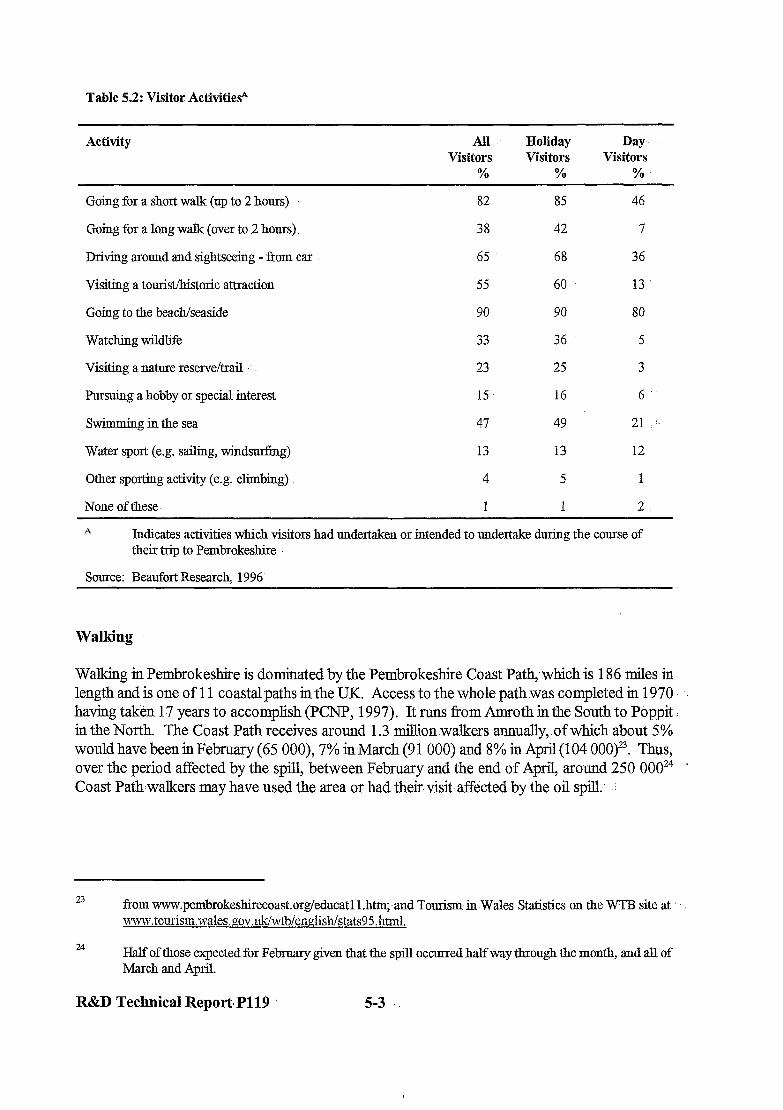
Table’ 5.2: Visitor ActivitiesA
Activity All .- Holiday Day Visitors Visitors Visitors
% % %
Going for a short walk (up to 2 hours) . .
Going for a long walk (over to 2 hours)
Driving around and sightseeing - Tom car
Visiting a touristIhi.storic attraction
Going to the beach/seaside
Watching wildlife
Visiting a nature reserve/trail ,‘-.
Pursuing a hobby or special interest
Swimming in the sea
Water sport (e.g. sailing, win-g)
Other sporting activity (e.g. climbing)
None of these
82 85 46
38 42 7
65 68 36
55 60 13.
90 90 80
33 36 5
23 25 3
15. 16 6.
47 49 21 .’
13 13 12
4 5 1
1 1 2
A Zndicates activities which visitors had undertaken or intended to undertake during the course of their trip to Pembrokeshire
Source: Beaufort Research, 1996
Walking
Walking in Pembrokeshire is dominated by the Pembrokeshire Coast Path;which is 186 miles in length and is one of 11 coastal paths in the UK. Access to the whole path was completed in 1970 having taken 17 years to accomplish (PCNP, 1997). It runs ti-om Amroth in the South to Poppit in the North. The Coast Pat&receives around 1.3 million-walkers annually, .of which about 5% would have been in February (65 000), 7% inMarch (9 1 000) and 8% in April (104 OOO)23. Thus, over the period affected by the spill, between February and the end of April, around 250 OOOz4 Coast Path,walkers may have used the area or had their.visit affected by the oil spill: .-
23 from www.pembrokeshirecoast.org/educatll.htmland Tourismin Wales Statistics on the WTB site at ~~tr7~~v.tourism.~~7ales. ~o~r.1~~~~~bienglishlstats95 .html.
24 Half of those expected for February given that the spill occurred half way through the month, and all of March and April.
R&D Technical ReportPll9 5-3
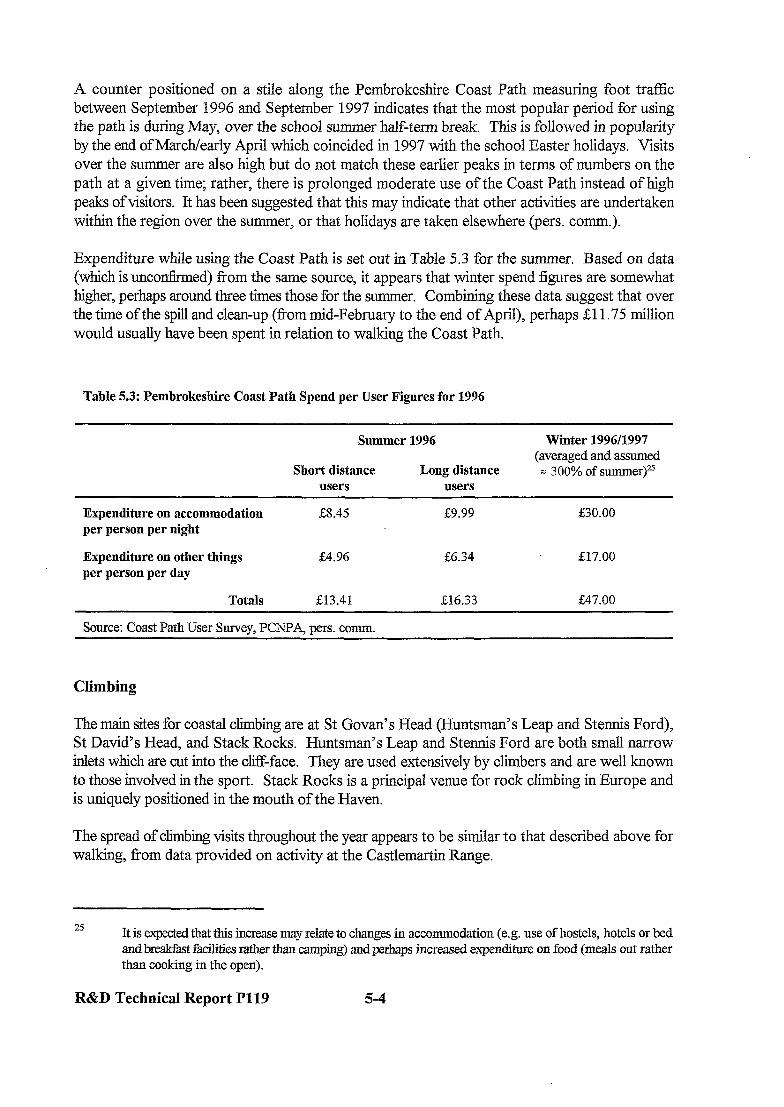
A counter positioned on a stile along the Pembrokeshire Coast Path measuring foot tra.fFic between September 1996 and September 1997 indicates that the most popular period for using the path is during May, over the school summer half-term break. This is followed in popularity by the end of March/early April which coincided in 1997 with the school Easter holidays. Visits over the summer are also high but do not match these earlier peaks in terms of numbers on the path at a given time; rather, there is prolonged moderate use of the Coast Path instead of high peaks of visitors. It has been suggested that this may indicate that other activities are undertaken within the region over the summer, or that holidays are taken elsewhere (pers. comm.).
Expenditure while using the Coast Path is set out in Table 5.3 for the summer. Based on data (which is unconfirmed) from the same source, it appears that winter spend figures are somewhat higher, perhaps around three times those for the summer. Combining these data suggest that over the time of the spill and clean-up (from mid-February to the end of April), perhaps 211.75 million would usually have been spent in relation to walking the Coast Path.
Table 5.3: Pembrokeshire Coast Path Spend per User Figures for 1996
Summer 1996
Short distance Long distance users users
Winter 199611997 (averaged and assumed = 300% of summer)25
Expenditure on accommodation per person per night
Expenditure on other things per person per day
Totals
&8.45 59.99 &30.00
cE4.96 &6.34 297.00
513.41 g16.33 g47.00
Source: Coast Path User Survey, PCNPA pers. comm.
Climbing
The main sites for coastal climbing are at St Govan’s Head @Iuntsman’s Leap and Stennis Ford), St David’s Head, and Stack Rocks. Huntsman’s Leap and Stennis Ford are both small narrow inlets which are cut into the cliff-face. They are used extensively by climbers and are well known to those involved in the sport. Stack Rocks is a principal venue for rock climbing in Europe and is uniquely positioned in the mouth of the Haven.
The spread of climbing visits throughout the year appears to be similar to that described above for walking, from data provided on activity at the Castlemartin Range.
25 It is e?rpected that this increase may relate to changes in accommodation (e.g. use of hostels, hotels or bed and break&t facilities rather than camping> and perhaps increased e.xpenditure on food (meals out rather than cooking in the open).
R&D Technical Report P119 5-4
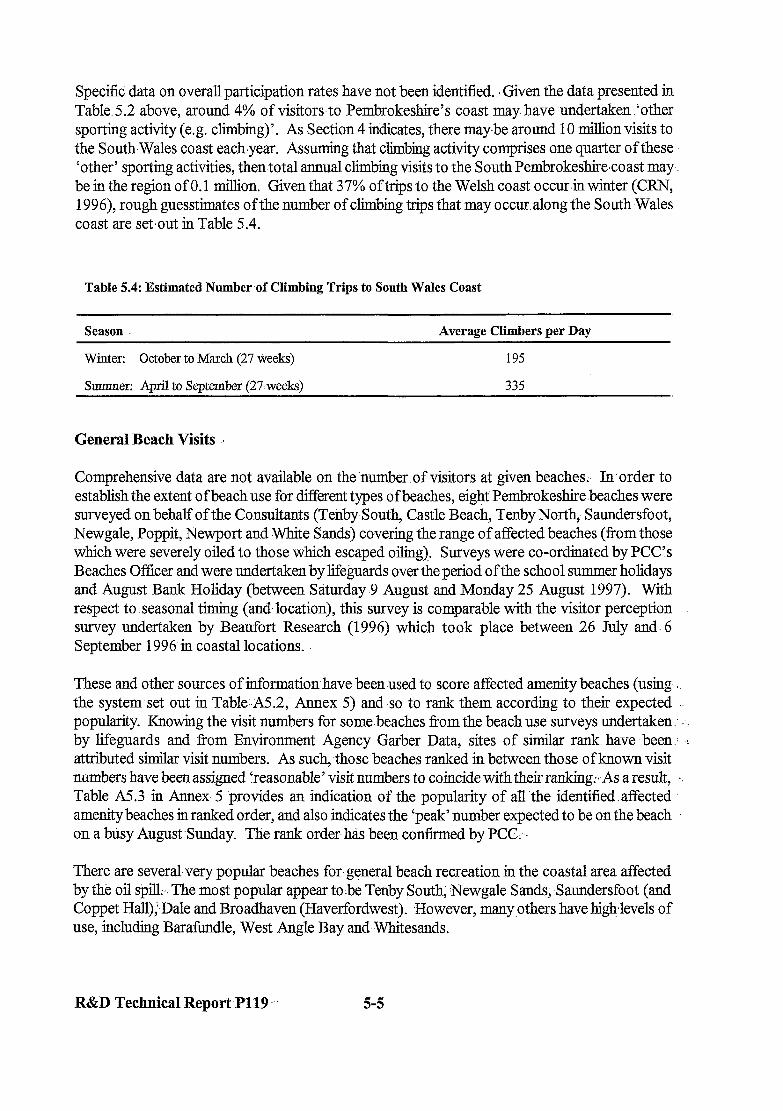
Specific data on overall participation rates have not been identified. I Given the data presented in Table.5.2 above, around 4% of visitorsto Pembrokeshire’s coast may have undertaken ‘other sporting activity (e.g..climbing)‘. As Section 4 indicates, there maybe around 10 million visits to the South-Wales coast each.year. Assuming that climbing activity comprises one quarter ofthese ‘other’ sporting activities, then total annual climbing visits to the South Pembrokeshire,coast may.. be in the region of 0.1 million. Given that 37% of trips to the Welsh coast occur.in winter (CRN, 1996), rough guesstimates of the number of climbing trips that may occur. along the South Wales coast are set,out in Table 5.4.
Table 5.4: Estimated Number of Climbing Trips to South Wales Coast
Season Average Climbers per Day
winter: October to March (27 Weeks)
Summer: Amil to Smtember LDweeksl
195
335
General Beach Visits
Comprehensive data are not available on the.number of visitors at given beaches In-order to establish the extent of beach use for different types of beaches, eight Pembrokeshire .beaches were surveyed on behalf of the Consultants (Tenby South, Castle Beach, Tenby North, Saundersfoot, Newgale, Poppit, Newport and White Sands) covering the range of affected beaches (from those which were severely oiled to those which escaped oiling). Surveys were co-ordinated by PCC’s Beaches Officer and were undertaken by lifeguards over the period of the school summer holidays and August Bank Holiday (between Saturday-9 August and LMonday 25 August 1997); With respect to seasonal timing (and-location), this survey is comparable with the visitor perception survey undertaken by Beaufort Research (1996) which took place between 26 July and. 6 September 1996 in coastal locations.
These and other sources of information have been used to score affected amenity beaches (using . the system set out in Table ~45.2, Annex 5) and.so to rank them according to their expected .- popularity. Knowing the visit numbers-for some.beaches from the beach use surveys undertaken.- . by lifeguards and from Environment Agency Garber Data, sites of similar rank have been : : attributed similar visit numbers. As such, those beaches ranked in between those of known visit numbers have been assigned Treasonable’ visit numbers to coincide with theirranking:~ As a result, . . Table A5.3 in Annex. 5 provides an indication of the popularity of all ‘the identified .affected amenity beaches in ranked order, and also indicates the ‘peak’ number expected to be on the beach on a busy August Sunday. The rank order has been confirmed by PCC:.
There are severaLvery popular beaches for,general beach recreation in the coastal area affected by the oil spilh The most popular appear to-be Tenby South; :Newgale Sands, Saundersfoot (and Coppet Hall);,Dale and Broadhaven (Haverfordwest). .However, manyothers have highlevels of use, including Barafimdle, West Angle Bay and-Whitesands.
R&D Technical Report P119 5-5
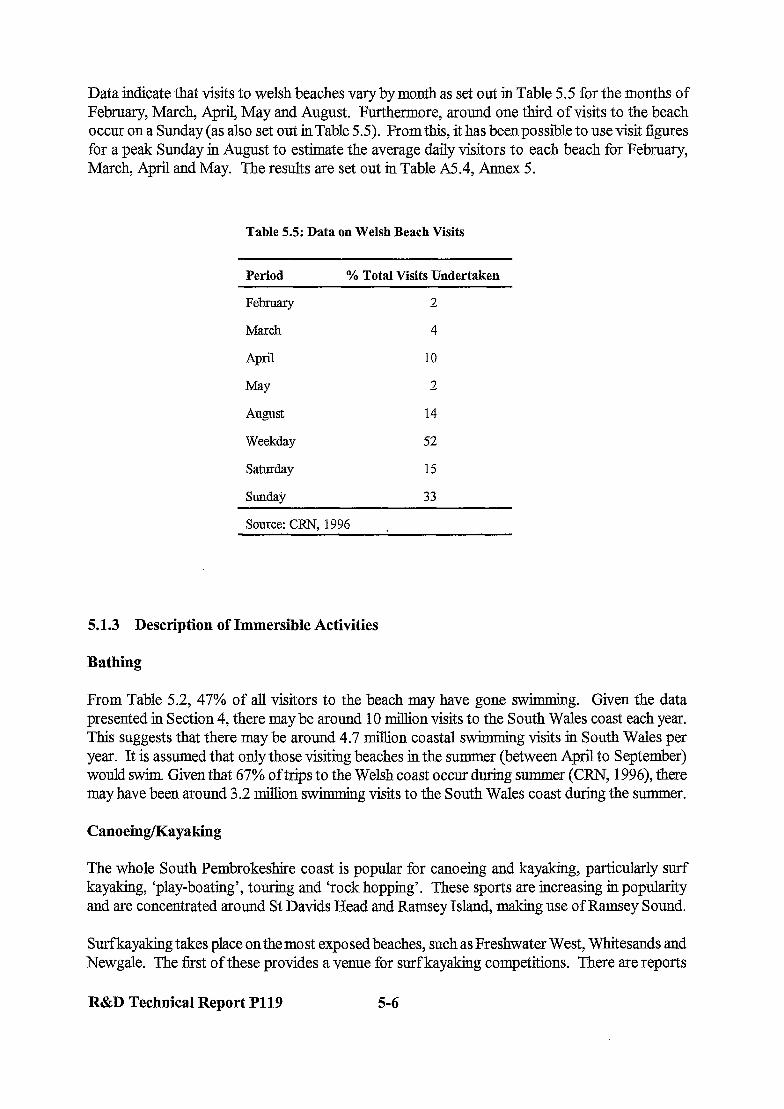
Data indicate that visits to welsh beaches vary by month as set out in Table 5.5 for the months of February, March, April, May and August. Furthermore, around one third of visits to the beach occur on a Sunday (as also set out in Table 5.5). From this, it has been possible to use visit figures for a peak Sunday in August to estimate the average daily visitors to each beach for February, March, April and May. The results are set out in Table A5.4, Annex 5.
Table 5.5: Data on Welsh Beach Visits
Period % Total Visits Undertaken
February 2
March 4
April 10
WY 2
August 14
Weekday 52
Saturday 15
suuday
Source: CRN, 1996
33
51.3 Description of Immersible Activities
Bathing
From Table 5.2, 47% of all visitors to the beach may have gone swimming. Given the data presented in Section 4, there may be around 10 million visits to the South Wales coast each year. This suggests that there may be around 4.7 million coastal swimming visits in South Wales per year. It is assumed that only those visiting beaches in the summer (between April to September) would swim Given that 67% of trips to the Welsh coast occur during summer (CRN, 1996), there may have been around 3.2 million swimming visits to the South Wales coast during the summer.
Canoeing/Kayaking
The whole South Pembrokeshire coast is popular for canoeing and kayaking, particularly surf kayaking, ‘play-boating’, touring and ‘rock hopping’. These sports are increasing in popularity and are concentrated around St Davids Head and Ramsey Island, making use of Ramsey Sound.
Surfkayaking takes place onthemost exposed beaches, such as Freshwater West, Whitesands and Newgale. The first of these provides a venue for surf kayaking competitions. There are reports
R&D Technical Report P119 5-6
that the Pembrokeshire coast is one of the finest sea kayaking venues in Britain. The area of white water in.Rarnsey Sound and-around the Bitches has become internationally known for ‘play- boating’ .and white water kayaking.
In addition to surf kayaking, the Daugleddau Estuary .and Milford Haven Waterway offers superb sheltered touring water for. open Canadian canoes. As well- as other -canoeing events, Pembrokeshire Coast National Park Authority. organises around ten canoeing events throughout I the year.
Specific participation data are not available-for canoeing trips around-the Pembrokeshire coast. However, from national sources it appears that 1% of UK holiday makers will undertake canoeing. (Leisure Consultants, 1989). Based on data from Section 4 (Table 4. l), this suggests that between- 1000 and 8 000 annual canoeing trips may occur in Pembrokeshire, perhaps.the former-relating : more realistically to sea canoeing alone.
The season for. surf kayaking and .fplay-boating’ tends to.peak when the inland white waters are becoming less challenging; i.e. between May and June. .The Whitsun half term holidays is a “big week”. More dedicated locals, however, canoe all year round. Before April; weekend, activity usually occurs.
Access to,canoe at sea is free. For organised tours on rivers, an average charge may be around. :. &5 for a member for a weekend,.or &lo-for a non-member. However, this may vary considerably. For example a recent Your’ on the River Dee cost participants &4 per day for both members and non-members alike; To launch onto a lakeusually cpsts in the region of 22.50. Charges to access whitewater sites may be in the region of &5 (pers. con-m.):
Jetskiing .’
It is understood that there-is some activity in the area-which takes place in specificzoned areas; however, more data have not been provided.
Land/Sand.Yachting
South Pembrokeshire is an important area for sand/land yachting in Wales. Some activity occurs at Newgale Sands, but Pembray Beach and Pendine Sands are the’most popular sites in the area as they extend for some miles and receive good winds. Despite the area being nationally important for the sport, participation is very low compared to other activities.
Unlike most.water contact sports, the’season for sand/land yachting runs from the equinox at the end of September through until the equinox in Spring, around Easter. The Summer, although warmer, has lighter. winds-and brings more people onto~the beaches which interferes with the sport. The winter brings westerly storm winds and miles of empty beaches. Keen sand/land yachters tend to move around the,world to catch the best winds for the time of year.
Local activity takes place most. weekends and falls into two categories: ‘conventional’ land yachting and .‘paracarting’ (which relies on kite traction rather than a sail, sometimes called ‘kite
R&D .Technical Report P119-- 5-7
buggying’). There are two ‘conventional’ land yachters who use Pendine Sands almost every weekend throughout the season.
There is one ‘paracarter’ for whom kite traction is his livelihood. As such, customers interested in new kites come from around the world to test them on Pembrey Beach or to be trained, for example teams learning the technique for use on polar expeditions. He and his employees would undertake the sport more frequently than at weekends during the season if ammunition testing did not take place on Pendine Sands and Pembrey Beach.
Sand/land yachters and paracarters travel several miles along beaches and so it is unusual for independent activity to occur; groups tend to comprise between two and ten people.
To undertake sand/land yachting costs around 520 in the UK for a day’s activity (normally lasting about three hours; pers. comm.).
Sailing and Boating Activity
Sailing is a very popular activity in South Pembrokeshire, particularly in the open coastal waters, around the islands and in the Haven Waterway. The area attracts many holiday makers for whom sailing activities provide a focus for their visit. National and international sailing events often occur in the area. Four sailing schools in the area have been identified: West Wales Wind, Surfing and Sailing (Dale); St Davids Adventure Days; Dale Sailing; Haven Multihulls; and Cleddau Classic Cruising (Llangwn Ferry).
In the Haven itself there were 1 500 moorings and berths in 1993 (more recent data have not been provided). The sailing season starts around the last week of March or the first week of April. Before this time the weather is usually too cold and few, if any, events are organised.
Specific participation data for South Pembrokeshire sailing activity are unavailable. According to national data, 2% of UK holiday makers will undertake sailing (Leisure Consultants, 1989). Based on the data presented in Section 4 (Table 4. l), this suggests that between 2 000 and 16 000 annual sailing trips occur in the affected area.
Pleasure boat trips are also popular from Tenby, Saundersfoot, Martins Haven, St Justinians and Whitesands, with the islands being the main focus of interest. Permission is required from Dyfed Wildlife Trust to land visitors on Skomer, Skolkhohn and Grassholm Islands as numbers are restricted for conservation reasons (pers. comm.). According to national data, 22% of UK holiday makers will undertake commercial boat trips and cruises (Leisure Consultants, 1989). Based on the data presented in Section 4 (Table 4.1), this suggests that between 22 000 and 128 000 commercial boat trip may occur annually in the affected area. However, consultation with local commercial boat companies indicates that the upper bound may be closer to 60 000 (pers. comm.).
Consultation has confirmed that the most popular times of year for undertaking pleasure boat trips coincide with the most popular times of year for tourism in the area. The season begins at Easter and peaks during the summer period, continuing until the end of October (pers. comm.). ’
R&D Technical Report P119 5-8
Sub Aqua
Diving activities~occurall around the Pembrokeshire coast. The Blue Lagoon, an old slate mine, is so popular that those exploring the site are referred to as “the:Blue Lagooners”. The bottom .- has not yet been reached due to itscdepth.
The West Wales Diving Centre in Haverfordwest forms a focal point for local sub aqua activity. The Centre can cater for 18 divers staying on site, or 600 divers using 67 RIBS and 20 inflatables. To give an indication of participation in the activity; all of these were used on one August bank. holiday.
Martins Haven, Broadhaven, Dale, .Gelliswick Little .Haven, .Saundersfoot,- Skomer Island, St. Brides haven, Whitesands and Tenby are all popular 1aunch:sites for dive boats.
Sllrlklg
Surfing is a major activity in South Pembrokeshire. As Pembrokeshire is surrounded on three sides by the Atlantic, the resulting exposed beaches and high winds provide high ener,oy seas and perfect surfing conditions. The most famous surfing beach in the area is Freshwater West which ‘. is described as “one of the main surhng beaches in the UK” (MPCU;~.l996). Manorbier, Newgale .. Sands; Whitesands Bay and Westdale Bay are also-important surfing sites in the area. Board hire is available at several locations, such as Dale.
Storm winds, such as those that occur early in the:year are:very popular for surfing as they produce good surf waves. Participation data have not been provided.
Waterskiing.
Waterskiing is a high contact sport;‘as such, those participating in the activity spend a lot of time totally immersed in the water. Therefore, the majority of waterskiing activity takes place during the warmer months of the.year, between April and September. ..Although the season can stretch into .March and October, skiing- before May is usually too cold.
Milford Haven Marina is considered by some-to be one of the best waterskiing venues available to the sport.,. The Haven Marina has been the venue for the National Ski Race since 1990 and this has usually taken place in early May,to kick-off the season. Competitors from the States.and .., Australia sometimes compete and the-event usually attracts around: 500 people26. Next year will : be the first year for the event to occur later, in July, due to tides.
There are two ski clubs in the Haven. Lawrenny and Burton are recognised waterskiing.sites, while other locations are reserved for non-motorized activities.
26 In terms of competitors, the event usually attracts around 50 skiers and for each of these there are two .. crew in the boat, resulting in around 150 competitors in all.
R&D Technical Report P119: 5-9
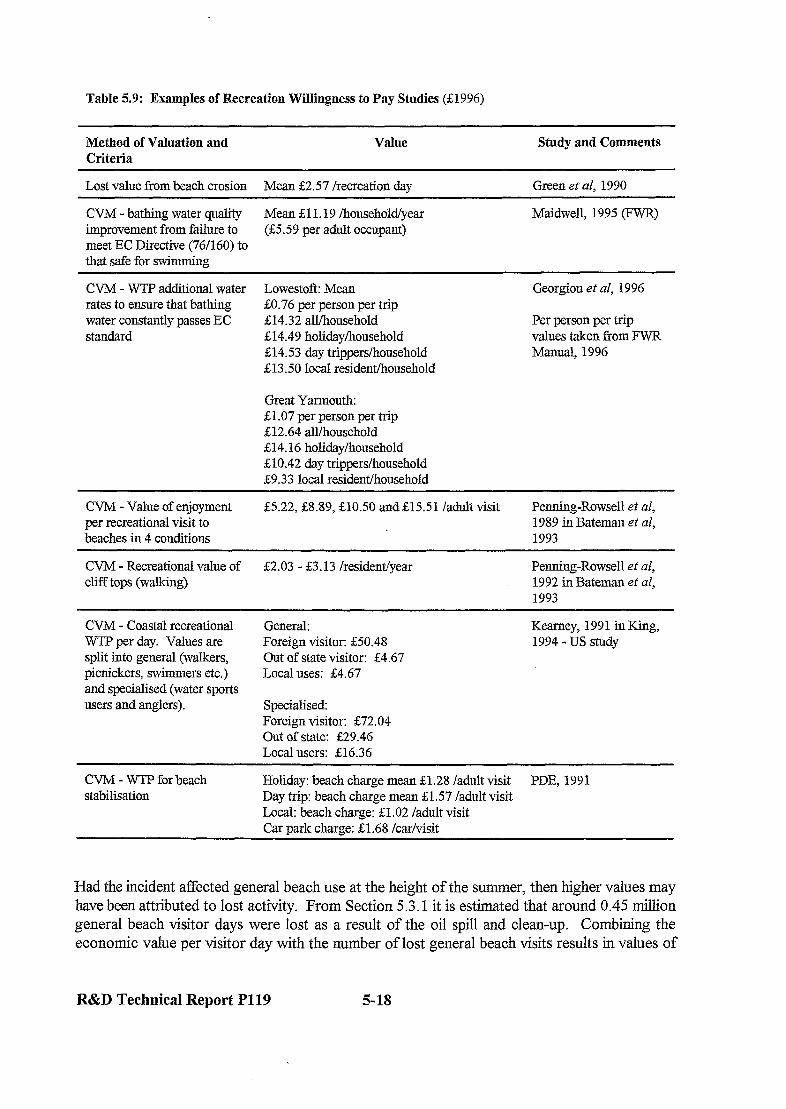
Table 5.9: Examples of Recreation Willingness to Pay Studies (&1996)
Method of Valuation and Criteria
Value Study and Comments
Lost value from beach erosion Mean 52.57 /recreation day Green et al, 1990
CVM - bathing water quality Mean E 11.19 /household/year Maidwell, 1995 (FWR) improvement from failure to (55.59 per adult occupant) meet EC Directive (76/160) to that safe for swimming
CVM - WTP additional water Lowestoft: Mean Georgiou et al, 1996 rates to ensure that bathing 50.76 per person per trip water constantly passes EC 514.32 all/household Per person per trip standard g14.49 holiday/household values taken from FWR
g14.53 day trippers/household Manual, 1996 513.50 local resident/household
Great Yarmouth: 51.07 per person per trip S2.64 all/household g14.16 holiday/household &lo.42 day trippers/household 59.33 local residentChousehold
CVM - Value of enjoyment per recreational visit to beaches in 4 conditions
55.22, S.89, SlO.50 and S15.51 /adult visit Penning-Rowsell et al, 1989 in Bateman et al, 1993
CVM - Recreational value of &2.03 - 53.13 /resident/year Penning-Rowsell et al, cliff tops (walking) 1992 in Bateman et al,
1993
CVM - Coastal recreational WIT per day. Values are split into general (walkers, picnickers, swimmers etc.) and specialised (water sports users and anglers).
General: Foreign visitor: 250.48 Out of state visitor: E4.67 Local uses: S4.67
Specialised: Foreign visitor: 572.04 Out of state: g29.46 Local users: 516.36
Kearney, 1991 inKing, 1994 -us study
CVM - WTP for beach stabilisation
Holiday: beach charge mean &1.28 /adult visit PDE, 1991 Day trip: beach charge mean Z1.57 /adult visit Local: beach charge: 51.02 /adult visit Car park charge: &1.68 /car/visit
Had the incident affected general beach use at the height of the summer, then higher values may have been attributed to lost activity. From Section 53.1 it is estimated that around 0.45 million general beach visitor days were lost as a result of the oil spill and clean-up. Combining the economic value per visitor day with the number of lost general beach visits results in values of
R&D Technical Report Pl19 5-18
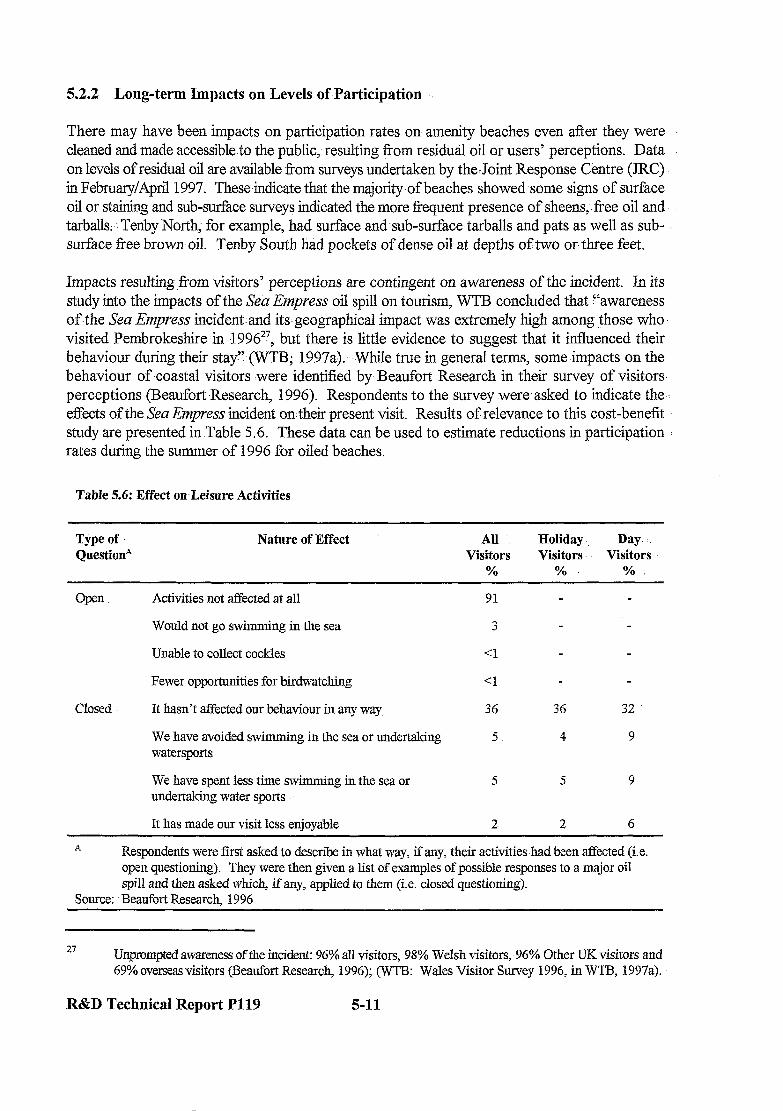
5.2.2 Long-term Impacts on Levels-of-Participation . .
There may have been impacts on-participation rates on- amenity beaches even after they were cleaned and made accessible to the public, resulting.from residual oil or users’ perceptions. Data on levels of residual oil are available from surveys undertaken by the! Joint Response Centre (JRC) in February/April 1997. These-indicate that the majority ,of beaches showed-some signs of surface oil or staining and sub-surface surveys indicated the more frequent presence of sheens, free oil and. tarballs Tenby North, for example, had surface and-sub-surface tarballs and pats as well as sub- surface free brown oil. Tenby South had pockets of dense oil at depths oftwo or three feet.
Impacts resulting .f?om visitors’ .perceptions are contingent on awareness of the incident. In its study into the impacts of the Sen Empress oil spill on tourism, WTB concluded.that cLawareness of-the Sea Empress incidentand its-geographical impact was extremely high among those who. visited Pembrokeshire-in 1996”, but there is little evidence to suggest that it influenced their behaviour during their stay” (WTB; 1997a).- While true in general terms, some impacts on the behaviour ofcoastal visitors were identified by Beaufort Research in their survey of visitors: perceptions (Beaufort ,Research, 1996). Respondents to the survey were-asked to indicate the : effects of the Sea Empress incident ontheir present visit. -Results of relevance to this cost-benefit study are presented in .Table 5.6. These data can be used to estimate reductions in participation 7 rates during the summer of 1996 for oiled beaches.
Table 5.6: Effect on-Leisure Activities
TIype of Question-’
Nature of Effect All Visitors
%
Holiday Day. Visitors Visitors
% %
Activities-not affected at all
Would not go swimming in the sea
Unable to collect cockles
Closed
Fewer opportunities for birdwatching
It hasn’t affected our behaviour in any way
We have avoided swimming in the sea or undertaking watersports
We have spent less time swimming in the sea or undertaking water sports
5 5 9
It has made our visit less enjoyable 2 2 6
91
3
-4
<l -
36 36 32
5 4 9
A Respondents were first asked to describe in what way, if any, their activities.had been affected (i.e. open questioning). They were then given a list of examples of possible responses to a major oil spill and then asked which if any, applied to them (i.e. closed questioning)..
Source: Beaufort Research, 1996
27 Unprompted awareness of the incident: 96% all visitors, 98% Welsh visitors, 96% Other UK visitors and 69% overseas visitors (Beaufort Research, 1996); (WTB: Wales Visitor Survey 1996, in WTB, 1997a).
R&D Technical Report P119 5-11
While the data in Table 5.6 indicate the changes in activity undertaken by visitors to the affected coast, it has also been suggested that long-term impacts may also have been felt by beaches outside the oiled area. This appears to be linked to perceptions of the extent of coast which was oiled. In general terms, research indicates that there is a high correlation between respondents’ perceptions of which parts of the coast had been affected and the reality of what actually happened. However, a reasonable proportion of the general public were misinformed about the extent of oiling; while 40% of coastal visitors thought that some of the Pembrokeshire coast had been affected by the oil spill, 37% thought that most had been affected and 10% that the whole coast was oiled (Beaufort Research, 1996).
5.2.3 Impacts on Enjoyment
Visitors to Pembrokeshire beaches following the main clean-up may have had their enjoyment reduced as a result of the Sen Empress oil spill (either due to residual oil or their perceptions). There is evidence of this impact in studies of the incident. In a survey of visitor perceptions, it was found that 11% of visitors to the Pembrokeshire coast believed that public enjoyment of the area had been affected a lot, 47% only a little and 39% not at all (Beaufort Research, 1996). A survey of visitors to Wales as a whole found that 72% thought that the incident had tiected public enjoyment a little or a lot (WTB: Wales Visitor Survey 1996, in WTB, 1997a). However, there have been other comments that the popular areas have never been so clean, and in fact appear cleaner than most other UK beaches (pers. comm.).
In a study on the health effects of the Sea Empress oil spill (Lyons et al, 1996 - see Section lo), questions were also asked concerning the impact of the spill on “enjoyment of the local surroundings”. The survey found that 74% of the exposed population (i.e. those living in coastal areas oiled by the spill) felt that their value of enjoyment of the local surroundings had been affected as a result of the oil spill, compared with 19% of the control group. When questioned about the future, 62% of the exposed population felt that enjoyment of the local surroundings would be worse as a result of the incident, compared with 28% of the control group.
5.2.4 Actions Taken to Limit Recreational Impacts
Within Pembrokeshire, actions were taken to ensure that Tourist Lnformation Centres (TICS) were able to provide accurate and up-to-date information in response to visitors’ questions and concerns. The TICS were provided with daily bulletins from the JRC, bathing water quality information from the Environmental Health Department of PCC (supplied to the local authority by the Environment Agency) and a statement on safety and hydrocarbon levels. This was supplemented by a telephone ‘Hotline’ established by the Regional Tourism Company, signage at beaches advising of the current conditions and by a touring exhibition provided by the PCNPA (Fielding, 1997). The costs of these actions are included in Section 4 where available.
R&D Technical Report P119 5-12
5.3 Valuation of Impacts
53.1 Participation Rates
Overview
Valuation of impacts on recreational activities requires itiormation on participation rates for each . . of the affected activities to which economic values on a per visit basis can then be assigned. This:: section- brings together:data from a wide range of sources, including zonsultation with many affected sports organisations. Overall, data are not available on the number of participants. engaged in each recreational pursuit during the time of the spill:: Information presented, therefore, is sometimes general in nature.
Non-Immersible Activities
Walking the Coast Path may not have been significantly affected by the oil spill as almost all of the length will have still been accessible. However, the number of walkers expected to be using the path between the spill and the 10 March (the most affected period) would usually have been around. 0.078 ‘million28. From this time until. the -end of March (assumed to have had 50% reduction in beach access), the path would have usually expected a further 0.045. million visitors.
Data have been provided. by the PCNPA on-the number of walkers and climbers present .at Castlemartin Range for the periods April to August, 1992 to 1997. Additional data have been provided for the month of-March in 1996 and 1997:. Although-these do not provide,visit numbers for the time of the oil spill,and clean-up, they can be-used to establish-overall trends .by comparing..-. year w&year.
When analysed, it appears that the average presence of walkers did not. decrease following the: spill, but actually may have increased by around 20% for 1996 and 1997 when compared with the : average number of walkers in previous years, irrespective of the additional data for March in 1996 and 1-997. As the months over which data are available alter at.the same time as the apparent . . increase in walkers, it may be that the survey technique was also altered around this time,which may explain the,different results (although similar trends are not noticeable for climbing, using.a similar data set).
E however, the number of walkers has generally increased since the oil spill by the 20% suggested by the data, then there may be an additional 0.3 million visits29 to Pembrokeshire Coast Path each year for 1996 and 1997. Ifthis is a continuing trend, it may result in increased expenditure in the region of S7.8 million per a.nnum3~. Whether thisis as a result of the Sen Etipress oil spill can be neither confirmed nor dismissed.
28 % of February’s 0.065 mSLion.visitors plus ‘Yz of March’s 0.091 million visitors.
29 20% of 1.3 million Coast Path users.
30 ((&13.41+ g16.33 + &47.00)/3) x 0.3 million additional visitors per year.
R&D Technical Repo,rt P119 5-13
For climbing, the data show quite a different picture. The lowest year for annual participation in climbing at Castlemartin Range appears to have been 1993, with 1995 being the peak year since 1992. The levels of participation fell in 1996 and 1997 to numbers similar to those for 1992 and 1993. Thus, 1994 and 1995 may have been peak years for the sport, or perhaps competitions were taking place at this site. The spread of participation changed in 1997, with a higher presence throughout the period, rather than the more usual peak around Easter and trough around June. Whether these trends are repeated at the other climbing sites in South Pembrokeshire is not yet know-n. Again, there is no means of linking these trends with the occurrence of the oil spill, despite potential loss of access to climbing sites.
With respect to the general usage of beaches during the spill and clean-up, the incident appears to have resulted in lost beach access totalling around 0.45 million visitor days across all of the affected beaches with some (even if very low) amenity value (and taking the very general assumptions about periods of lost access)31. As outlined above, these results stem from a ranking process whereby beach count data were used to ‘pin’ visitor numbers to beaches of particular rank order. The supporting data for this process is provided in Annex 5 (Tables A5.1 to A5.4).
Immersion Activities
The discussion provided in Section 5.1.2 indicates that there are usually around 3.2 million swimming visits to the South Wales coast during the summer. However, the data provided in Table 5.6 suggest that between 3% and 4% of usual swimming activity may not have occurred in the holiday season of 1996 due to concerns over bathing water quality. Thus, around 0.1 million swimming visits may have been lost owing to the oil spil13’.
Table 5.7 indicates the number of ‘casual’ people-activity-days lost for each identified water contact activity where data have been identified (with a more detailed version provided in Table A5.5, Annex 5). Due to the time over which the oil spill restricted access to the coast and surrounding waters, the peak season for most sports activities had not begun. In most cases, local participants were aware of the extent of the oiling and clean-up and so impacts were short-term.
Longer-term impacts were experienced by some sports, such as sailing, where competitions suffered from reduced attendance as visitors into the area perceived that oil would still have affected activities, even in August. Table 5.8 on page 16 sets out the more organised events that were affected, where data have been provided (Table A5.5 in Annex 5 also sets out more details of these events). There is a general feeling that impacts on the activities were largely due to the negative media coverage at the time of the spill which was not balanced out by positive coverage of the area once it was clean again (pers. comm.). The impacts on each sport are discussed below, relating to both casual participation and also more organised events.
31 It should be noted that these are separate from tourism related bookings (discussed in Section 4), referring instead to lo.st recreational activity at the time of the spill, which is expected to comprise mainly local use general use of beaches.
32 This number of vkitors still used the beaches during the summer period, but their activity altered. As such, it is assumed here that these visitors lost enjoyment from their beach visit as a result of the Sea Empress oil spill. These are not, therefore, lost visits to the affected area.
R&D Technical Report P119 5-14
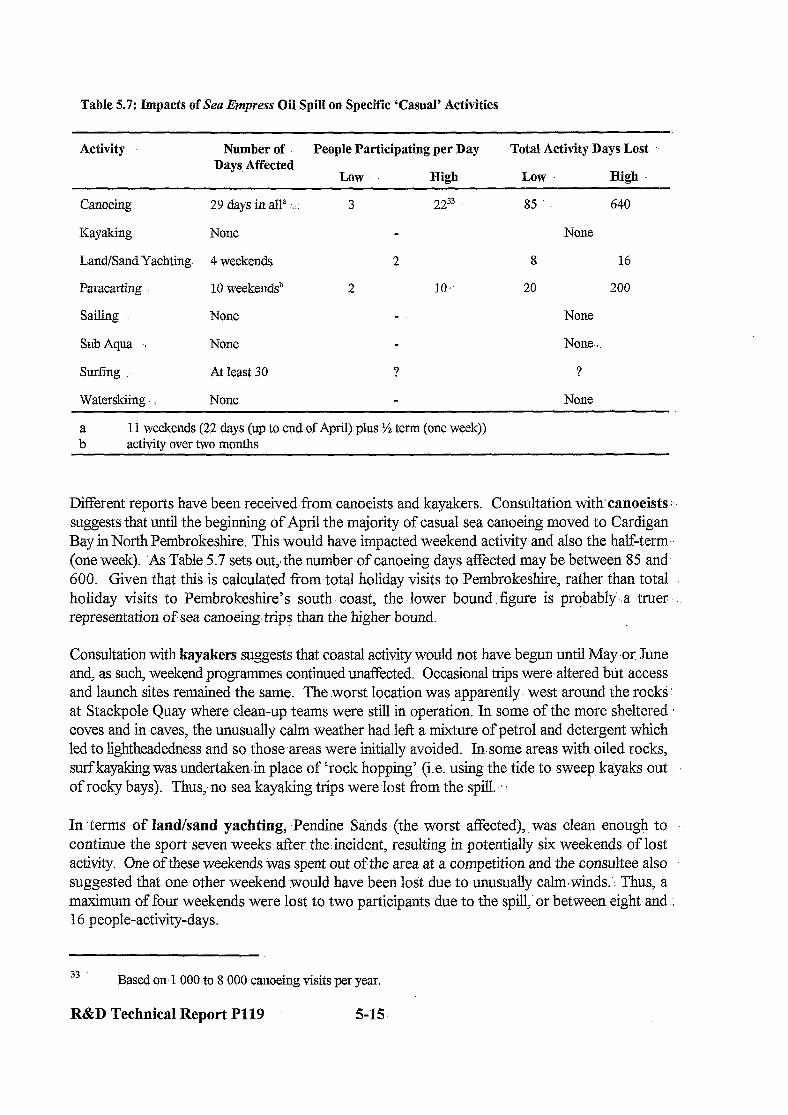
Table 5.7: Impacts of Sea Emprqss Oil Spill on Specific ‘Casual’ Activities
Activity Number of People Participating per Day Total Activity Days Lost ” Days Affected
Low Hieh Low. High
Canoeing 29 days in all” . . . . 3 2233
Kayaking None
Land/Sand Yachting. 4 weekends 2
Paracarting 10 weekendsb 2 10 *’
Sailing None -
Sub Aqua . . None
Surfing ‘. At least 30 ?
Waterskiing None -
b” 11 weekends (22 days (up to end of April) plus % term (one week)) activity over two months
85 640
None
8 16
20 200
None
None-.
?
None
DiEerent reports have been received-from canoeists and kayakers. Consultation with canoeists ;.: suggests that until the beginning of April the majority of casual sea canoeing moved to Cardigan Bay in North Pembrokeshire. This would have impacted weekend activity and also the half-term (one week). As Table 5.7 sets out,, the number of canoeing days affected may be between 85 and 600. Given that this is calculated fi-om total holiday visits to Pembrokeshire, rather than total holiday visits to Pembrokeshire’s south- coast, the lower bound .figure is probably’..a truer representation of sea canoeing trips than the higher bound.
Consultation with kayakers suggests that coastal activity would not have begun until May ,or June and, as such, weekend programmes continued utiected. Occasional trips were.altered but access and launch sites remained the same. The .worst location was apparently. west around the rocks at Stackpole Quay where clean-up teams were still in operation. In some of the more sheltered ‘. coves and in caves, the unusually calm weather had left a mixture of petrol and detergent which led to lightheadedness and so those areas were initially avoided. Insome areas with oiled rocks, surfkayaking was undertaken-in place of ‘rock hopping’ (i.e. using the tide to sweep kayaks out. of rocky bays). Thus,-no sea kayaking trips were lost from the spill. ,I
In terms of land/sand yachting, -Pendine Sands (the worst af%ected), was clean enough to continue the sport seven weeks after. the:incident, resulting in potentially six weekends of lost activity. One of these weekends was spent out of the area at a competition and the consultee also suggested that one other weekend would have been lost due to unusually calm*winds.‘; Thus, a maximum of four weekends were lost to two participants due to the spill, or between eight and 16 people-activity-days.
33 Based on 1000 to 8 000 canoeing visits per year.
R&D Technical Report P119 5-15:
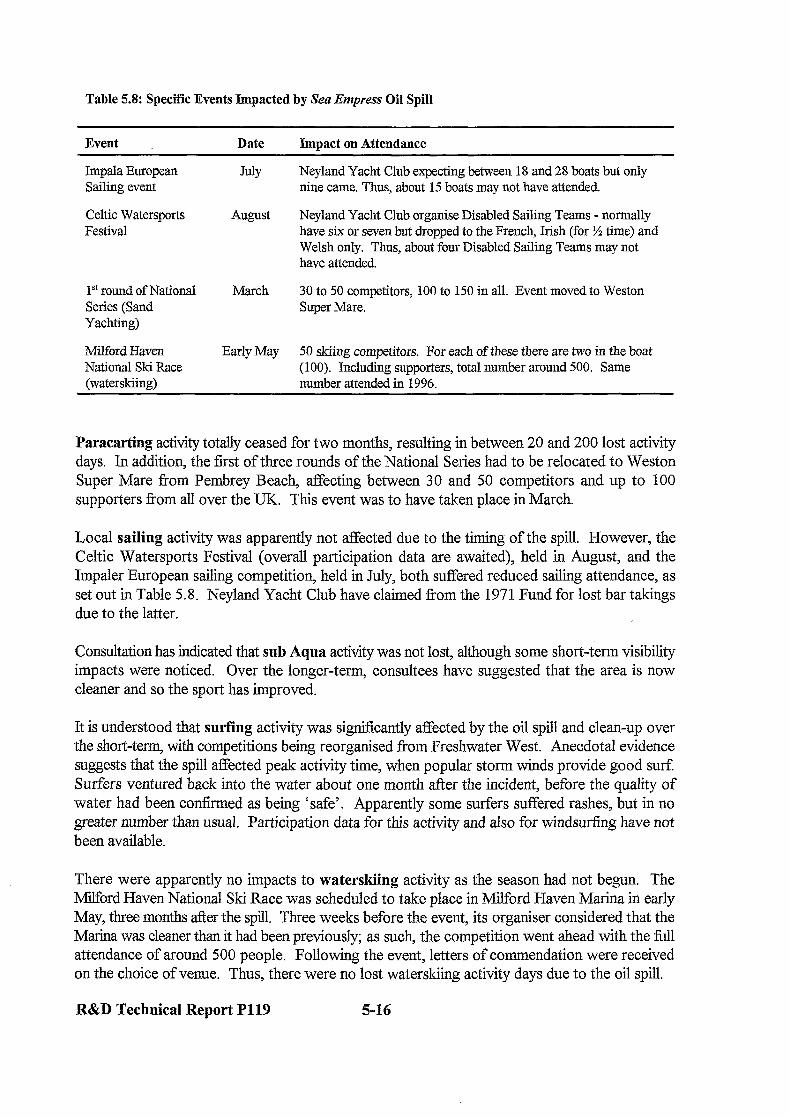
Table 5.8: Specific Events Impacted by Sea Empress Oil Spill
Event Date Impact on Attendance
Impala European Sailing event
Celtic Watersports Festival
lst round of National Series (Sand Yachting)
March 30 to 50 competitors, 100 to 150 in all. Event moved to Weston Super IMare.
Milford Haven Early May 50 skiing competitors. For each of these there are two in the boat National Ski Race (100). Including supporters, total number around 500. Same (waterskiing) number attended in 1996.
JOY Neyland Yacht Club expecting between 18 and 28 boats but only nine came. Thus, about 15 boats may not have attended
August Neyland Yacht Club organise Disabled Sailing Teams - normally have six or seven but dropped to the French, Irish (for % time) and Welsh only. Thus, about four Disabled Sailing Teams may not have attended
Paracarting activity totally ceased for two months, resulting in between 20 and 200 lost activity days. In addition, the first of three rounds of the National Series had to be relocated to Weston Super Mare from Pembrey Beach, affecting between 30 and 50 competitors and up to 100 supporters from all over the UK. This event was to have taken place in March.
Local sailing activity was apparently not affected due to the timing of the spill. However, the Celtic Watersports Festival (overall participation data are awaited), held in August, and the Impaler European sailing competition, held in July, both suffered reduced sailing attendance, as set out in Table 5.8. Neyland Yacht Club have claimed from the 1971 Fund for lost bar takings due to the latter.
Consultation has indicated that sub Aqua activity was not lost, although some short-term visibility impacts were noticed. Over the longer-term consultees have suggested that the area is now cleaner and so the sport has improved.
It is understood that surfing activity was significantly affected by the oil spill and clean-up over the short-term with competitions being reorganised from Freshwater West. Anecdotal evidence suggests that the spill affected peak activity time, when popular storm winds provide good surf Surfers ventured back into the water about one month after the incident, before the quality of water had been confirmed as being ‘safe’. Apparently some surfers suffered rashes, but in no greater number than usual. Participation data for this activity and also for windsurfing have not been available.
There were apparently no impacts to waterskiing activity as the season had not begun. The M%ord Haven National Ski Race was scheduled to take place in 1Milford Haven Marina in early May, three months after the spill. Three weeks before the event, its organiser considered that the Marina was cleaner than it had been previously; as such, the competition went ahead with the full attendance of around 500 people. Following the event, letters of commendation were received on the choice of venue. Thus, there were no lost waterskiing activity days due to the oil spill.
R&D Technical Report P119 5-16
5.3.2 Economic ,Values forRecreational Activities
General Beach Use.and Bathing
To determine an economic value for the benefits (or d&-benefits) ,accrued by visitors when they use (or cease to use) coastal-recreation sites, an appropriate willingness to pay figure is required.’ These are available for general beach use ti-om,previous studies and examples are given in Table: : 5.9 overleaf. The frill results of the literature review with respect to economic values of beach use are presented in Table ‘X5.6 of Annex 5.
From thistable, it can be seen that values differ dramatically and-measure a number of different environmental changes including the ‘value of enjoyment’, improvements in bathing water quality or a day of coastal recreation. Thus, care has been taken in selecting appropriate values for changes in recreational activity due to the Sea Empress oil spill and the:following factors were considered:..
. given that the presence of oil is one of the criteria determining compliance with.the EC- Bathing Water Directive, the use of a value relating to water quality improvements to meet the requirements ,of this :Directive may -be the most appropriate for those avoiding. &g;:.
. data on the factors affecting the public’s enjoyment of a beach indicate that .the presence of oil is of similar importance to the presence of sewage contamination, with scores of 9.2 and 9.8 respectively, out of a maximumof ten (reported in Bent & Thomas, -1996);
. similarly, research into users’ priorities at Gower beaches in Pembrokeshire found that the most highly prioritised beach attributesin order of importance were absence of sewage, debris, oil and litter, followed by clean bathing water (ibid);
. 98% of people surveyed about perceptionsof water quality considered that oily smells were indicative of poorwater quality (ibid); and
. loss of access to beaches occurred during February and March and so WTP to access the beaches are expected to,be lower than for the summer, holiday season.
As the incident occurred in February and affected mainly local general beach use, it was decided that the following values should be attributed to lost activity resulting- from the Sea Empress oil spill and clean-up:
l Lower bound:- &l..OO per visitor day; and . Upper bound: &5.20 per visitor day’:.
34
35
Based onPDE localbeach charge value of&O.88 k-1991, in 1996 prices.
Based on Penning-Rowsell, 1989 (in Bateman et aZ, 1993) lower figure of 23.86, in 1996 prices.
R&D Technical Report P119 ..i 5-17,

Table 5.9: Examples of Recreation Willingness to Pay Studies (&1996)
Method of Valuation and Criteria
Value Study and Comments
Lost value from beach erosion Mean 52.57 /recreation day Green et al, 1990
CVM - bathing water quality Mean E 11.19 /household/year Maidwell, 1995 (FWR) improvement from failure to (55.59 per adult occupant) meet EC Directive (76/160) to that safe for swimming
CVM - WTP additional water Lowestoft: Mean Georgiou et al, 1996 rates to ensure that bathing 50.76 per person per trip water constantly passes EC 514.32 all/household Per person per trip standard g14.49 holiday/household values taken from FWR
g14.53 day trippers/household Manual, 1996 513.50 local resident/household
Great Yarmouth: 51.07 per person per trip S2.64 all/household g14.16 holiday/household &lo.42 day trippers/household 59.33 local residentChousehold
CVM - Value of enjoyment per recreational visit to beaches in 4 conditions
55.22, S.89, SlO.50 and S15.51 /adult visit Penning-Rowsell et al, 1989 in Bateman et al, 1993
CVM - Recreational value of &2.03 - 53.13 /resident/year Penning-Rowsell et al, cliff tops (walking) 1992 in Bateman et al,
1993
CVM - Coastal recreational WIT per day. Values are split into general (walkers, picnickers, swimmers etc.) and specialised (water sports users and anglers).
General: Foreign visitor: 250.48 Out of state visitor: E4.67 Local uses: S4.67
Specialised: Foreign visitor: 572.04 Out of state: g29.46 Local users: 516.36
Kearney, 1991 inKing, 1994 -us study
CVM - WTP for beach stabilisation
Holiday: beach charge mean &1.28 /adult visit PDE, 1991 Day trip: beach charge mean Z1.57 /adult visit Local: beach charge: 51.02 /adult visit Car park charge: &1.68 /car/visit
Had the incident affected general beach use at the height of the summer, then higher values may have been attributed to lost activity. From Section 53.1 it is estimated that around 0.45 million general beach visitor days were lost as a result of the oil spill and clean-up. Combining the economic value per visitor day with the number of lost general beach visits results in values of
R&D Technical Report Pl19 5-18

between around SO.45 million and 22.3 millior?; which-represents,the value of lost general beach I activity owing to.the Sea Empress oil spill and clean-up.
There may also have been lost beach activity later on in the year owing to public perceptions of beach cleanliness (as discussed in Section 5.2.2). However, consultation suggests that general beach use in the summer- of 1996 was not significantly affected.
For reduced bathing activity: it was considered that the values relating to bathing.water quality improvements.were most representative. Considering the values presented m-Table 5.9, it was decided that a value of around &5 per:visit (gl997) would be appropriate here.. As such, the 0.1 million swimmi ng visits that did not occur between April and September 1996.due to concerns over the quality of bathing water.following the oil spill can be valued at around &0.5 inillion.
Specific Recreational Activities
The:review of economics literature did not identify any WTP values .relating to specific sea or coastal recreational pursuits,. such as canoeing or sailing.. Therefore, it has been necessary to. derive consumer surplus values&om data provided on average costs of a day’s activity.for each I affected pursuit;- These are set out in Table-5.10 overleaf, which also brings together information : on thenumber of lost activity days (from-Table 5.7) and summarises the lost consumer surplus relating to the Sea Enzpyess oil spill and clean-up, by activity.
5.4. Summary of Costs to Recreational Activity
Valued and-unvalued impacts from the Sea Etip~ess oil spill and clean-up to recreational activities in South Pembrokeshire are summarised in Table 5.11. As this shows, the .overall recreational impacts may be between around &l million and &3 million. This is expected to represent a lower.- bound given that it has not been possible to value.lost surfing/windsurfing .activity and reduced attendance at watersports competitions.
It is important to note that the overall impacts on recreational activity-were minimised by:
. the time of year the spill occurred; and ..
. the speed with which important amenity beaches were cleaned.: :’
Visits to the Welsh coast in July, August and September represent 40% oftotal annual visits, whereas visits during February, March and April represent only 16%. : Given this, had the spill occurred in July,.for example, it could be assumed that recreational impacts would have been two and a half times as great, equivalent-to between 22.5 and &7.5 million.
36 or 52.475~million
R&D Technical Report P119 5-19
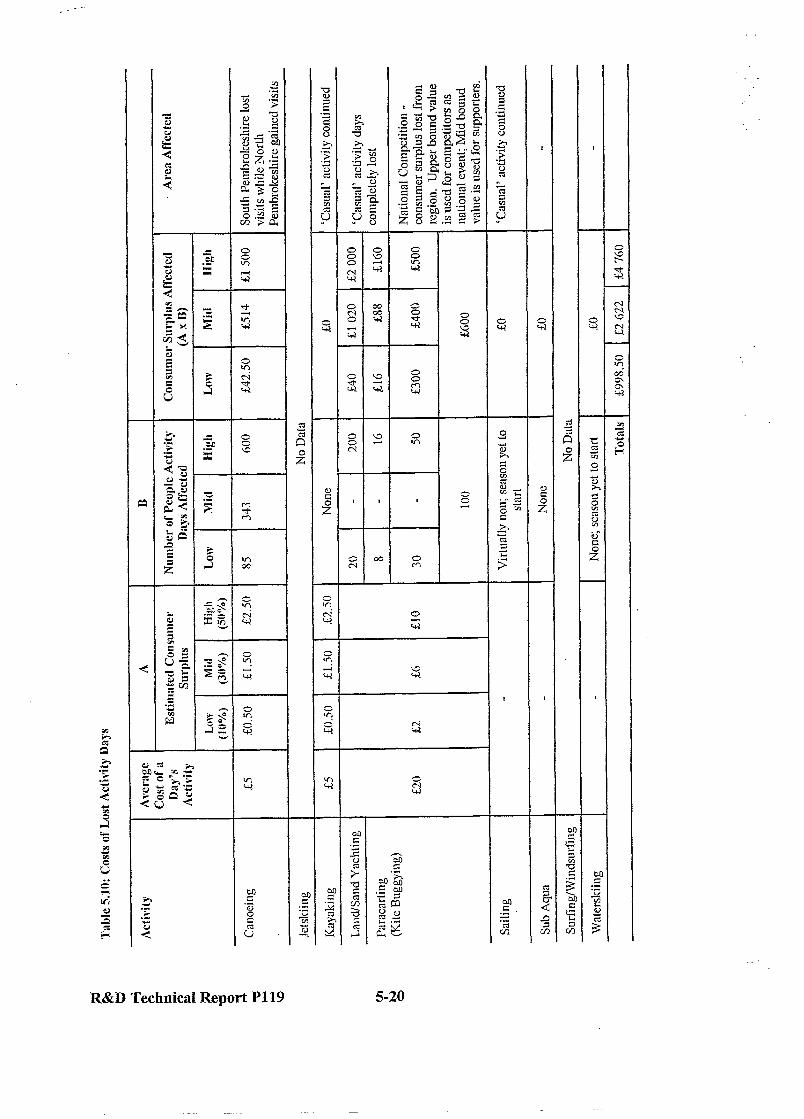
c z ‘4
C .s
C
3 w
t .- E
-
c:
-
-e
-
Z E 3
r)
t
!
P 1 i -. 3 .
R&D Technical Report P119 5-20
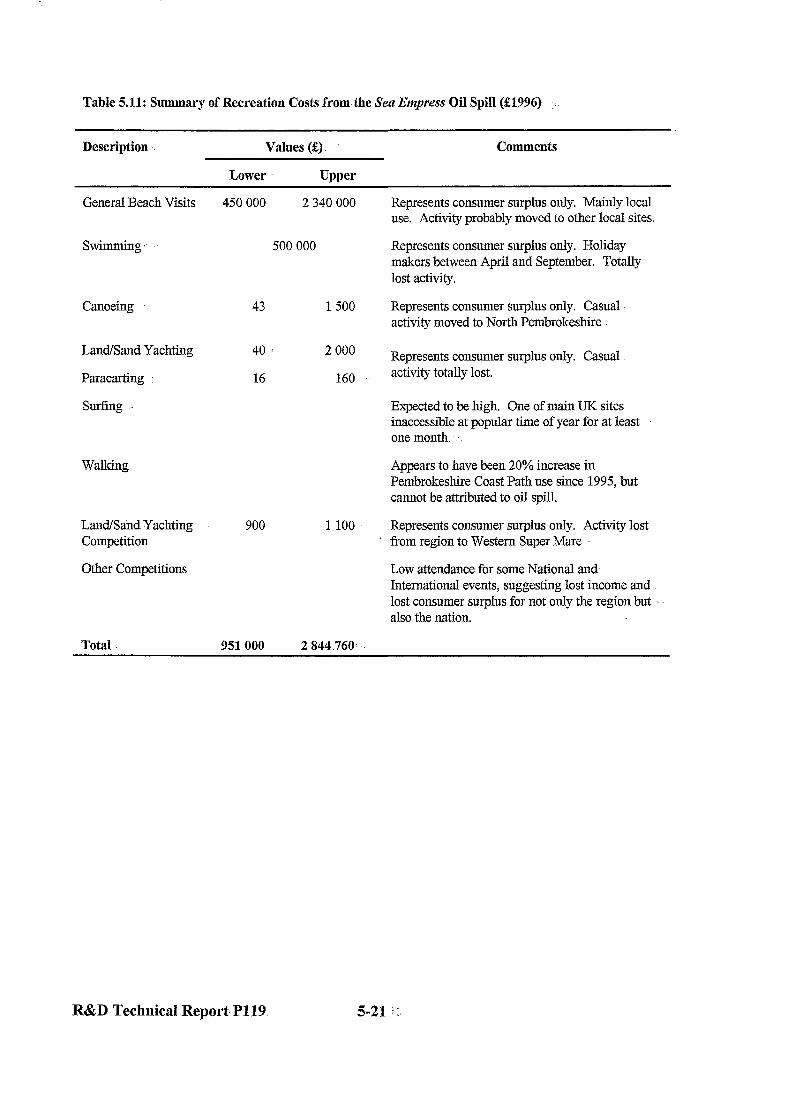
Table 5.11: Summary of Recreation Costs from the Sea Enqmss Oil Spill ($3996) :.
Description Values (Q
Lower Upper
Comments
General Beach Visits
swimming ‘.
Canoeing
Land/Sand Yachting
Paracarting :
surfing
walking
Land/Sand Yachting Competition
Other Competitions
450 000 2340000
500 000
43 1500
40 : 2000
16 160
900 1 100
Total 951000 2 844.760:
Represents consumer surplus only. Mainly local use. Activity probably moved to other local sites.
Represents consumer surplus only. Holiday makers between April and September. Totally lost activity.
Represents consumer surplus only. Casual activity moved to North Pembrokeshire
Represents consumer surplus only. Casual activity totally lost.
Expected to be high. One of main UK sites inaccessible at popular time of year for at least one month. .I
Appears to have been 20% increase in Pembrokeshire Coast Path use since 1995, but cannot be attributed to oil spill.
Represents consumer surplus only. Activity lost . from region to Western Super Mare
Low attendance for some National and International events, suggesting lost income and lost consumer surplus for not only the region but also the nation.
R&D Technical Report.Pl19 5-21 .i :

R&D Technical Report lP119 5-22
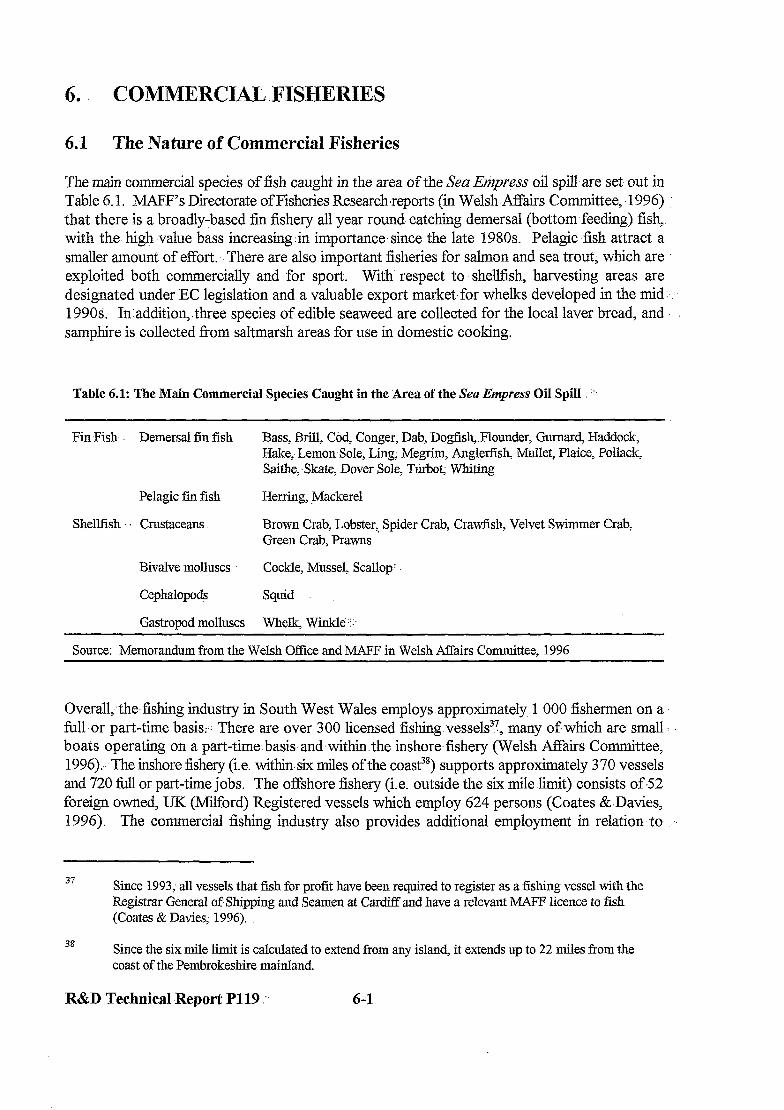
6. .: COMMERCIAL .FISHERIES
6.1 The Nature of Commercial Fisheries
The main commercial species of fish caught in the area of the S’en Etipress oil spill are set -out in Table 6.1. MAFF’s Directorate of Fisheries Research reports (in Welsh Affairs Committee, -1996) that there is a broadly-based fin fishery all year round catching demersal (bottom-feeding) fish, with the. high value bass increasingzin importance- since the late 1980s. Pelagic fish attract a smaller amount of effort. .There are also important fisheries for salmon and sea trout; which are exploited both commercially and for sport. With respect to’ shellfish, harvesting areas are designated under EC legislation and a valuable export market,for whelks developed in the mid ... 1990s. In:addition,.three species of edible seaweed are collected for the local laver bread, and samphire is collected from saltmarsh areas for use in domestic cooking.
Table 6.1: The Main Commercial Species Caught in the lirea of the Sea Empress Oil SpilI : ‘!
Fin,Fish. Demersal ti fish Bass, Brill, Cod, Conger, Dab, Dogfish, Flounder, Guman& Haddock, Hake,. Lemon Sole, Ling, Megrim, Angl@sh, Mullet, Plaice, Pollack, Saithe, -Skate,-Dover Sole, Ttiboc Whiting
Pelagic fin fish Herring, Mackerel
Shellfish Crustaceans Brown Crab, Lobster:, Spider Crab, Crawf?sh, Velvet Swimmer Crab; Green Crab, Prawns
Bivalve molluscs Cockle, Mussel, Scallop :
Cephalopo& Squid
Gastropod molluscs Whelk, Winkle,::
Source: Memorandum from the Welsh Office and MAFF in Welsh Affairs Committee. 1996
Overall, the fishing industry in South West Wales employs .approximately 1 000 fishermen on a full-or part-time basis: There are over 300 -licensed fishing vessels3?, many of which are small : boats operating on a part-time basis andwithin the inshore-fishery (Welsh Affairs Committee, 1996): The inshore fishery (i.e. within six miles of the coast?8) supports approximately 370 vessels and 720 full or part-time jobs, The offshore fishery (i.e. outside the six mile limit) consists of 852 foreign owned, UK (JGilford) Registered vessels which employ 624 persons (Coates &Davies, 1996). The commercial fishing industry also provides additional employment in relation- to
37 Since 1993; all vessels that fish for profit have been required to register as a fishing vessel with the Registrar General of,Shipping and Seamen at CardiEand have a relevant MAF’F licence to fish (Coates & Davies; 1996).
38 Since the six mile limit is calculated to extend from any island, it extends up to 22 miles from the coast of the Pembrokeshire mainland.
R&D Technical Report P119 :’ 6~1
wholesaling, processing and distribution. It is estimated that for every job at sea, there are between three and five shore-based jobs3’. Further jobs are involved in support of sport and hobby fishing, for example in operating angling charter vessels (Welsh A&.irs Committee, 1996). The main market for commercial fish landed at Milford Haven is Spain (70%) and Brittany. The majority of lobster, brown crab and spider crab are sent alive and unprocessed to Spain and Portugal. Whelks are processed locally and frozen to supply Japan and Korea. Cockles are still sold locally, but the majority are processed in the UK and bottled/canned in Holland for European markets including the UK.
The South Wales Sea Fisheries Committee (SWSFC) is the statutory body responsible for the regulation, management and conservation of fish and shellfish stocks between Cardigan and Cardiffto six miles offshore. It reports that (see Coates & Davies, 1996), landings of shellfish and (some) fin fish species taken from the south Wales coastline in 1995 were at an all time high. The first sale value of species landed amounted to &5.58 million, the majority of this arising from bass, rays, dogfish, flat&h, lobsters, crab, cockles and whelks. The processed value of fish is reported to be between two and four times first sale value, and retail values up to six times this much. The weather, more than any other naturally occurring event, determines the quantity of fish and shellfish harvested, particularly by small inshore based vessels.
6.2 Overview of Impacts
Immediately following the oil spill, local fishermen agreed a voluntary fishing ban in the area of the spill (which was in place by 20 February). Concurrently, MAFF observed and modelled the spill and took and analysed samples of fish to evaluate the possible effects of the spill on human health via the aquatic food chain. Traces of hydrocarbons were found and on the basis of this contamination the fishery was closed using the emergency powers in the Food and Environmental Protection Act (FEPA) 1985. The ‘Designated Area’ covered approximately 8 10 square miles and a chronolo,T of the closures is presented in Table 6.2 (based on Hearne, 1997).
The fisheries exclusion zone (FEZ) is reported to be ‘very similar’ to the commercial fishermen’s voluntary ban. It impacted both commercial inshore and offshore fisheries, as well as recreational angling. As can be seen from Table 6.2, restrictions have been progressively lifted to reflect the findings of the sampling programme. One of the requirements for lifting the ban on a given species has been that taste tests reveal no taint (Hearne, 1997).
In general terms, fin fish and crustaceans suffered only slight contamination considering the quantity of oil spilled. This was probably due to the spring of 1996 being colder than usual, so feeding activity may have been reduced around the time that the oil was released.
39 M.MF etirnates between three and four (in Welsh Affairs Committee, 1996) and SWSFC between four and five (Coates & Davies, 1996).
R&D Technical Report P119 6-2
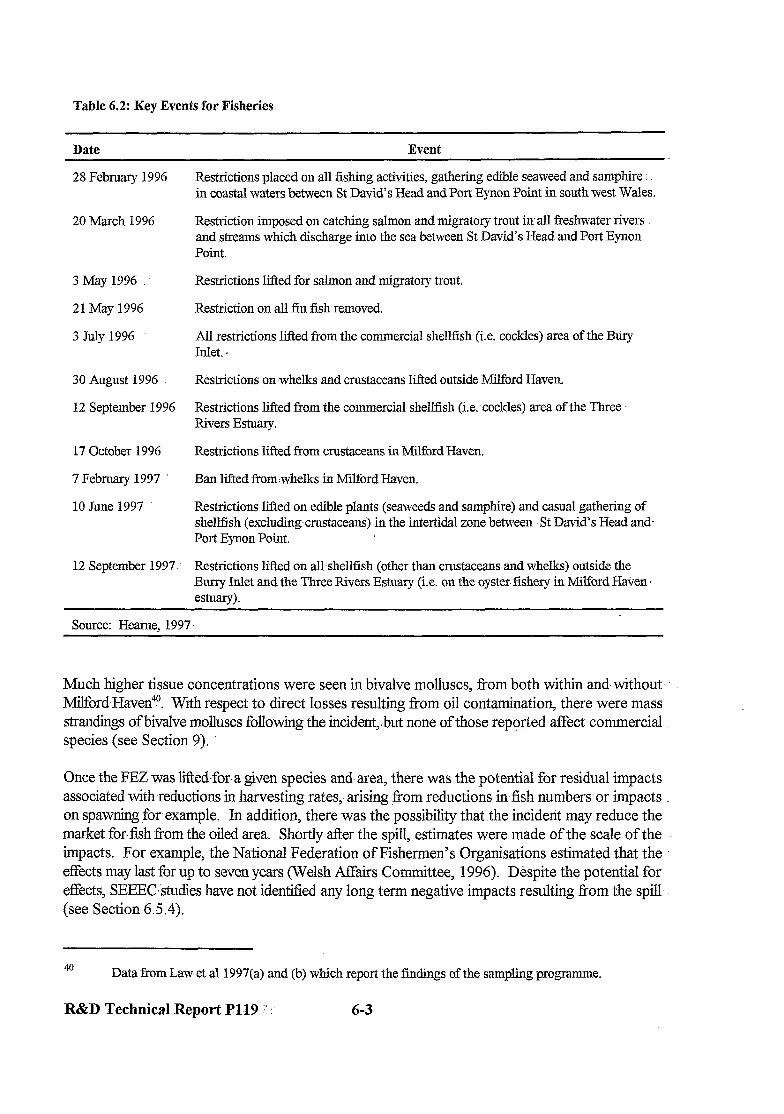
Table 6.2: Key Events for Fisheries :
Date Event
28 February 1996
20 March 1996
3 May 1996
21 May 1996
3 July 1996
30 August 1996
12 September.1996
17 October 1996
7 February 1997
10 June 1997
12 September 1997
Restrictions placed on all fishing activities, gathering edible seaweed and samphire in coastal waters between St David’s Head and Port Eynon Point in south west Wales.
Restriction imposed on catching salmon and migratory trout in all freshwater rivers and streams which discharge into the sea between St David’s Head and Port Eynon Point.
Restrictions lifted for salmon and migratory trout.
Restriction on all Iin fish removed.
All restrictions lifted from the commercial shellfish (i.e. cockles) area of the Bury Inlet.
Restrictions on-whelks and crustaceans lifted outside Milford Haven.
Restrictions lifted from the commercial shellfish (i.e. cockles) area of the Three Rivers Estuary.
Restrictions lifted from crustaceans in Milford Haven.
Ban lifted from.whelks in Milford Haven.
Restrictions lifted on edible plants (seaweeds and samphire) and casual gathering of shellfish (excludingcrustaceans) in the intertidal zone between St David’s Head and- Port Eynon Point.
Restrictions lifted on allshellfish (other than crustaceans and whelks) outside the Burry Inlet and the Three Rivers Estuary (i.e. on the oyster fishery in Milford Haven e estuary).
Source: Hearne$ 1997
Much higher tissue concentrations were seen in bivalve molluscs, fi-om both within and, without- ~Mlford~Haven~. With respect to direct losses resulting from oil contamination, there were mass strandings of bivalve molluscs following the incident,. but none of those reported affect commercial species (see Section 9).
Once the FEZwas lifted-for. a given species and. area, there was the potential for residual impacts associated with reductions in harvesting rates,- arising ,tiom reductions in fish numbers-or impacts on spawning for example. In addition, there was the possibility that the incident may reduce the market for.fish from the oiled area. Shortly after the spill, estimates were made of the scale of the impacts. For example, the National Federation of Fishermen’s Organisations estimated that the effects may last for up to seven years (Welsh Affairs Committee, 1996). Despite the potential for effects, SEEEC,studies have not identied any-long term negative impacts resulting from the spill (see Section 6.,5.4).
40 Data from Law et al 1997(a) and (b) which report the findings of the sampling prograrmne.
R&D Technical Report Pl19 ’ : 6-3
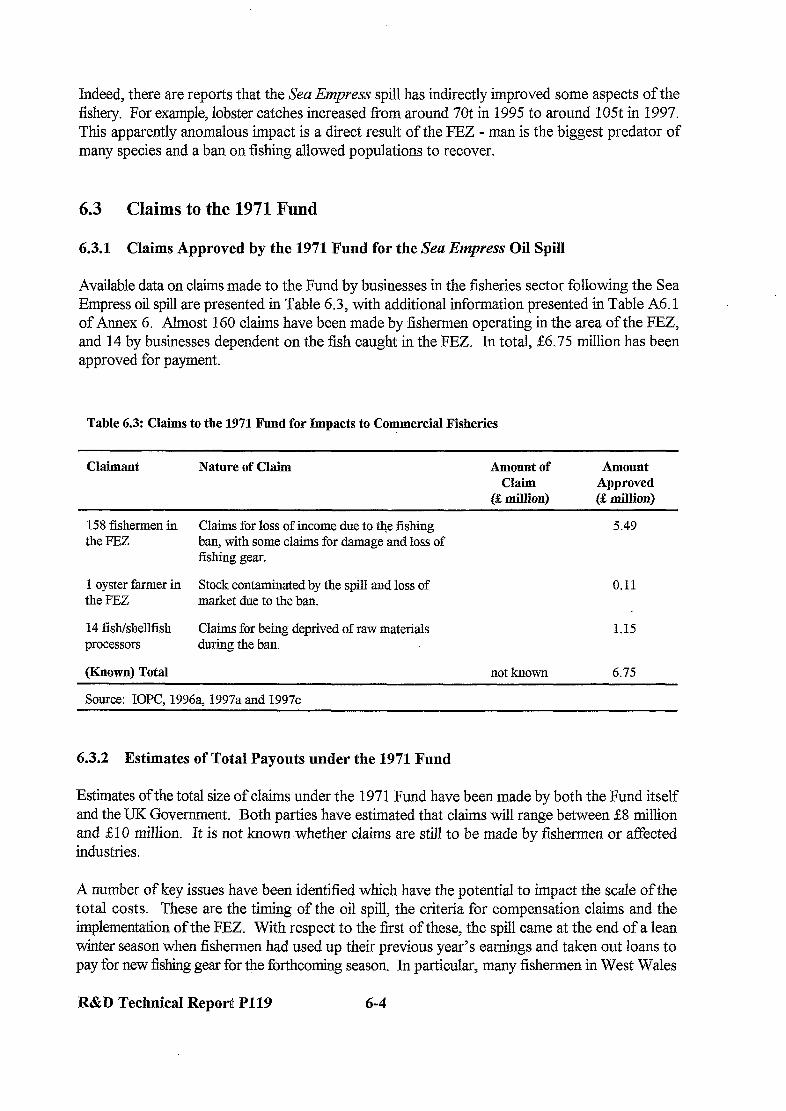
Indeed, there are reports that the Sea Empress spill has indirectly improved some aspects of the fishery. For example, lobster catches increased from around 70t in 1995 to around 10% in 1997. This apparently anomalous impact is a direct result of the FEZ - man is the biggest predator of many species and a ban on fishing allowed populations to recover.
6.3 Claims to the 1971 Fund
6.3.1 Claim Approved by the 1971 Fund for the Sea Empress Oil Spill
Available data on claims made to the Fund by businesses in the fisheries sector following the Sea Empress oil spill are presented in Table 6.3, with additional information presented in Table A6.1 of Annex 6. Almost 160 claims have been made by fishermen operating in the area of the FEZ, and 14 by businesses dependent on the fish caught in the FEZ. In total, $6.75 million has been approved for payment.
Table 6.3: Claims to the 1971 Fund for Impacts to Commercial Fisheries
Claimant Nature of Claim Amount of Claim
(2 million)
Amount Approved (2 million)
158 fishermen in Claims for loss of income due to @e fishing 5.49 the FEZ ban, with some claims for damage and loss of
fishing gear.
1 oyster farmer in Stock contaminated by the spill and loss of 0.11 the FEZ market due to the ban.
14 fish/shellfish processors
(Known) Total
Claims for being deprived of raw materials during the ban.
1.15
not known 6.75
Source: IOPC, 1996a, 1997a and 1997c
6.3.2 Estimates of Total Payouts under the 1971 Fund
Estimates of the total size of claims under the 1971 Fund have been made by both the Fund itself and the UK Government. Both parties have estimated that claims will range between 28 million and & 10 million. It is not known -whether claims are still to be made by fishermen or tiected industries.
A number of key issues have been identified which have the potential to impact the scale of the total costs. These are the timing of the oil spill, the criteria for compensation claims and the implementation of the FEZ. With respect to the first of these, the spill came at the end of a lean winter season when fishermen had used up their previous year’s earnings and taken out loans to pay for new fishing gear for the forthcoming season. In particular, many fishermen in West Wales
R&D Technical Report P119 6-4
had invested heavily in new equipment in order to move to the burgeoning .whelk industry (Welsh Affairs Committee, 1996).
It has also been argued,that the FEZ could have been implemented differently to reduce the costs to fishermen. For example (ibid):.
. some areas within the FEZ remained unaffected:for some time during the ban (e.g. it was ‘several weeks’ before.cockle beds in Penclawdd became tiected),.and-
. market confidence could have been better restored had fishing been banned in a larger area and reduced on the basis of sampling evidence. However, this was not possible under the terms of FEPA 1985.
We approached the Sea Empress Fisheries Claimants Association (SEFCA) for information on. past and future claims, but no information was forthcoming. We were also hoping that the SEFCA would be able to comment on claims not covered by the Fund (see below) and the-impact of the IOPC Fund -procedures on the actions of fishermen. For example,. one of the criteria for compensation claims is-the requirement to mitigate loss.. It is reported that this criterion resulted in (Welsh Affairs Committee, 1996 and pers. comm.>:
l a fish processor being advised to sack his staff;
. a requirement for fishermen outside the FEZ to continue to fish (and thus pay for bait, tieI and their crew) even though there was no market-for their catch; and
. a fish wholesaler/processor taking shellfishcaught outside the FEZ to sell in Spain: on the understanding -that this .was necessary under. the Fund’s requirement to mitigate,losses. However, there was no market for these shellf%h and the company.was later informed that these actions were inadmissible for claims.
6.3.3 Claims notCovered by the 1971 Fund
At the end of May 1997, the IOPC Fund reported that it had rejected claims totalling 27 million- ” from the fishing industry (IOPC; 1997a). Full details of these rejected claims are not known but it is reported that (IOPC; 1996 and pers. comm.):
. some claims for lost fishing gear have been rejected on the basis that the gear was not in the.water at the time of the spill or was outside the affected area;
. a claim from.a fish processor- based in Cornwall has been rejected on the basis of the proximity criterion; and
. a claim from. a local haulier transporting whelks. from Saundersfoot to the.processing factory has also been rejected as being too remote. The haulier claimed that the.fishing. ban caused a major loss of business and it is reported that this haulier has now gone out of business.
R&D Technical Report P119 1 6-5
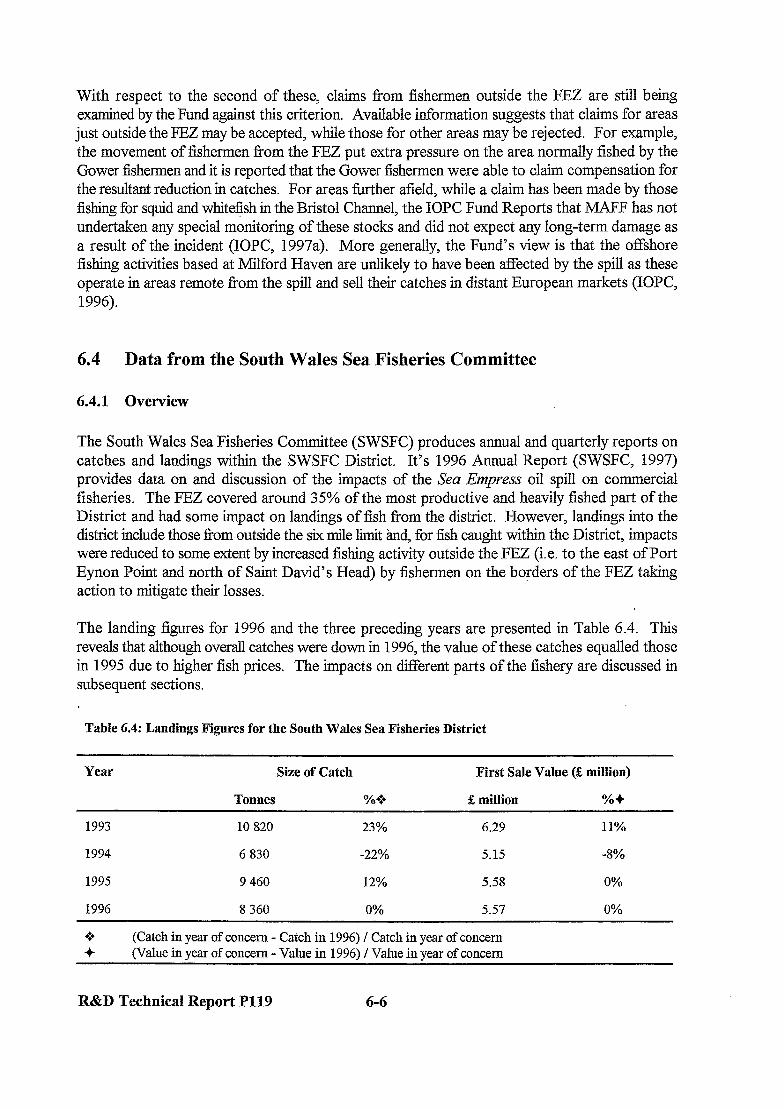
With respect to the second of these, claims from fishermen outside the FEZ are still being examined by the Fund against this criterion. Available information suggests that claims for areas just outside the FEZ may be accepted, while those for other areas may be rejected. For example, the movement of fishermen from the FEZ put extra pressure on the area normally fished by the Gower fishermen and it is reported that the Gower fishermen were able to claim compensation for the resultant reduction in catches. For areas further afield, while a claim has been made by those fishing for squid and white&h in the Bristol Channel, the IOPC Fund Reports that MAFF has not undertaken any special monitoring of these stocks and did not expect any long-term damage as a result of the incident (IOPC, 1997a). More generally, the Fund’s view is that the offshore fishing activities based at Milford Haven are unlikely to have been affected by the spill as these operate in areas remote from the spill and sell their catches in distant European markets (IOPC, 1996).
6.4 Data from the South Wales Sea Fisheries Committee
6.41 Overview
The South Wales Sea Fisheries Committee (SWSFC) produces annual and quarterly reports on catches and landings within the SWSFC District. It’s 1996 Annual Report (SWSFC, 1997) provides data on and discussion of the impacts of the Sea Empress oil spill on commercial fisheries. The FEZ covered around 35% of the most productive and heavily fished part of the District and had some impact on landings of fish from the district. However, landings into the district include those from outside the six mile limit and, for fish caught within the District, impacts were reduced to some extent by increased fishing activity outside the FEZ (i.e. to the east of Port Eynon Point and north of Saint David’s Head) by fishermen on the borders of the FEZ taking action to mitigate their losses.
The landing figures for 1996 and the three preceding years are presented in Table 6.4. This reveals that although overall catches were down in 1996, the value of these catches equalled those in 1995 due to higher fish prices. The impacts on different parts of the fishery are discussed in subsequent sections.
Table 6.4: Landings Figures for the South Wales Sea Fisheries District
Year Size of Catch First Sale Value (2 million)
Tonnes %+3 2 million *X3+
1993 10 820 23% 6.29 11%
1994 6 830 -22% 5.15 -8%
1995 9 460 12% 5.58 0%
1996 8 360 0% 5.57 0%
: ;I
(Catch in year of concern - Catch in 1996) / Catch in year of concern (Value in year of concern - Value in 1996) / Value in year of concern
R&D Technical Report P119 6-6
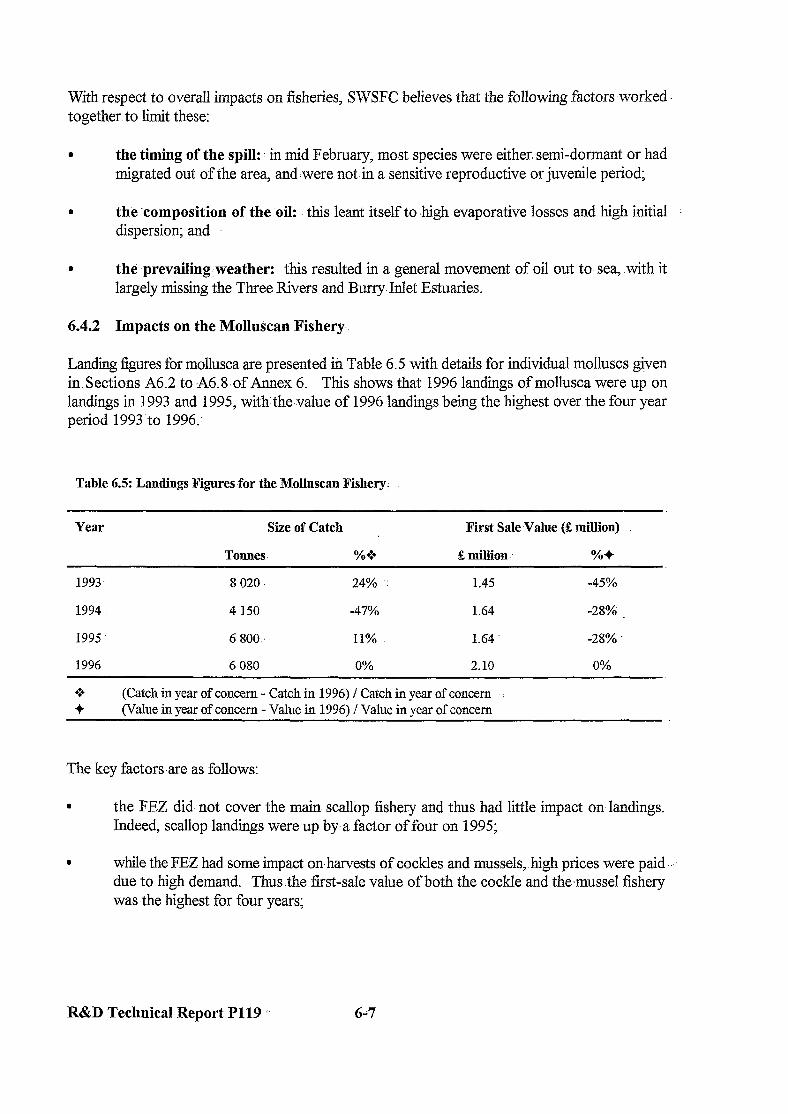
With respect to overall impacts on fisheries, SWSFC believes that the following factors -worked. together to limit these:
. the timing of the spill: in mid February, most species were either- semi-dormant or had migrated out of the area, and:were not in a sensitive reproductive or juvenile period;
. the ‘composition of the oil: this leant itself to high evaporative losses and high initial : dispersion; and
l the prevailingzweather: this resulted in a general movement of oil out to, sea., with it largely missing the Three Rivers and Bun-y. Inlet Estuaries.
6.4.2 Impacts on the Molluscan Fishery.
Landing figures for mollusca are presented in Table 6.5 with details for individual molluscs given in Sections A62 to .A6.8.of Annex 6. This shows that 1996 landings of mollusca were up on landings in 1993 and.1995 withzthe-value of 1996 landings being the highest over the four year period 1993 to 1996:
Table 6.5: Landings Figures for the Molluscan Fishery,.
Year Size of Catch First Sale,Value (2 million)
TOMS %+3 & million %+
1993 8 020 24% 1.45 -45%
1994 4 150 -47% 1.64 -28%
1995. 6 800: 11% 1.64 -28%
1996 6 080 0% 2.10 0%
+ (Catch in year of concern - Catch in 1996) / Catch in year of concern + Value in vear of concern - Value in 19961 I Value in vear of concern
The key factors-are as follows:
. the FEZ did. not cover the main scallop fishery and thus had little impact on- landings. Indeed, scallop landings were up by-a factor of four on 1995;
l while the FEZ had some impact on, harvests of cockles and musselshigh prices were paid ..‘. due to high demand. Thusthe first-sale value of both the cockle and the.mussel fishery was the highest for four years;
R&D Technical Report P119 !’ 6-7
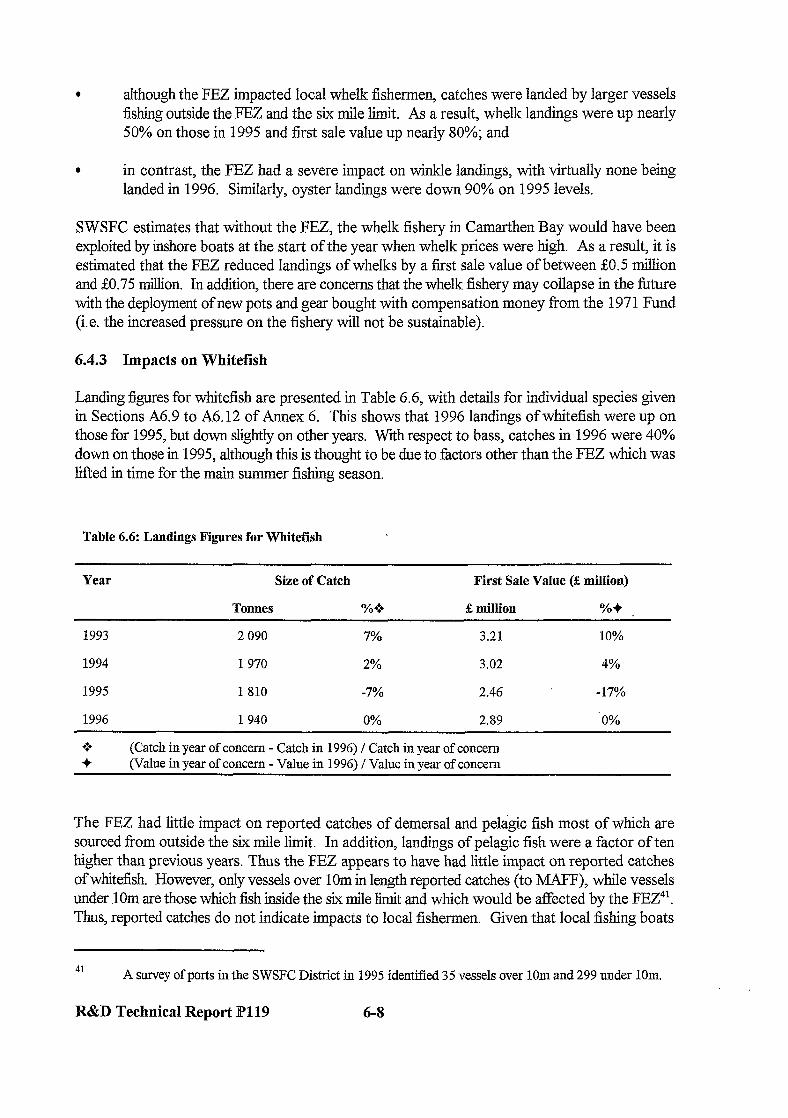
. although the FEZ impacted local whelk fishermen, catches were landed by larger vessels fishing outside the FEZ and the six mile limit. As a result, whelk landings were up nearly 50% on those in 1995 and first sale value up nearly 80%; and
. in contrast, the FEZ had a severe impact on winkle landings, with virtually none being landed in 1996. Similarly, oyster landings were down 90% on 1995 levels.
SWSFC estimates that without the FEZ, the whelk fishery in Camarthen Bay would have been exploited by inshore boats at the start of the year when whelk prices were high. As a result, it is estimated that the FEZ reduced landings of whelks by a first sale value of between go.5 million and SO.75 million. In addition, there are concerns that the whelk fishery may collapse in the future with the deployment of new pots and gear bought with compensation money from the 197 1 Fund (i.e. the increased pressure on the fishery will not be sustainable).
6.4.3 Impacts on Whitefish
Landmg figures for whitefish are presented in Table 6.6, with details for individual species given in Sections A6.9 to A6.12 of Annex 6. This shows that 1996 landings ofwhitefish were up on those for 1995, but down slightly on other years. With respect to bass, catches in 1996 were 40% down on those in 1995, although this is thought to be due to factors other than the FEZ which was lifted in time for the main summer fishing season.
Table 6.6: Landings Figures for Whitefish
Year Size of Catch First Sale Value (& million)
Tonnes %+3 d5 million %+
1993 2 090 7% 3.21 10%
1994 1970 2% 3.02 4%
1995 1 810 -7% 2.46 -17%
1996 1 940 0% 2.89 .O%
(Catch in year of concern - Catch in 1996) / Catch in year of concern (Value in vear of concern - Value in 1996) I Value in vear of concern
The FEZ had little impact on reported catches of demersal and pelagic fish most of which are sourced from outside the six mile limit. In addition, landings of pelagic fish were a factor of ten higher than previous years. Thus the FEZ appears to have had little impact on reported catches of whitefish. However, only vessels over 10m in length reported catches (to IMAFF), while vessels under .lOm are those which fish inside the six mile limit and which would be affected by the FEZ41. Thus, reported catches do not indicate impacts to local fishermen. Given that local fishing boats
41 A survey of ports in the SWSFC District in 1995 identified 35 vessels over 10m and 299 under 10m.
R&D Technical Report P119 6-8

(i.e. those < 1Om) outnumber other fishing boats (i.e.. those > 1Om) by a factor,of 8.5, these impacts could have been signifiCa.nt.
6.4.4 Impacts on Crustaceans
Landing figures for: crustaceans are presented in !Table 6.7 overleaf with details for .individual species given in Sections A6.13 to A6.17.. of Annex 6. This. shows that 1996 landings: of crustaceans were over 50% down on previous years. However, 1996 data.w-ere also compiled on a different basis from those in previous years’2. Other key factors are:.-
* mainly as a result of the FEZ, days at sea reduced by 54% and.the number of pot hauls by 59% from 1995;
l shellfishing continued outside the affected area, indeed, fishing effort,increased outside the FEZ. -However, markets for all Welsh fish were reduced;-and,
. the ban came just as fishermen were preparing to relay pots following the winter break and it was lifted close to-the end of the season for some species. Due to the autumn ga,les, some fishermen chose not to deploy gear that year.
Table 6.7: Landings,Figures for Crustaceans
Year. ’ Size of Catch First Sale Value (2 million)
Tonnes %*3 -% million %+
1993 710 52% 1.60 64%
1994. 710 52% 1.28 55%
1995 840 60% 1.48 61%
1996:. 340 0% 0.58 0%
l a (Catch in year of concern - Catch in 1996) / Catch in year of concern + (Value in year of concern - Value in 1996) / Value in year of concern
SWSFC ‘estimates that the overall’ value of the crustacean fishery is around. one third of that expected. In other words, the operation of the FEZ reduced landings of crustaceans by a first sale value of &1.15 million in 1996.
42 In previous years; data collected under the SWSFC permit scheme have been compared with data provided by merchants. Merchant data were not available in 1996. Thus, landings of lobsters, velvets, green crab, prawns and spider crabs @ay be underestimated and landings of edible crab and cra\&sh may be overestimated
R&D Technical Report .P119 .: 6-9
With respect to, the longer-term, there are concerns that the new equipment bought with compensation payments from the 1971 Fund may increase pressure on the fishery. In addition, it is not known what effect the oil and detergents may have had on spawning or juveniles.
6.5 The Valuation of Costs Arising from the Sea Empress Oil Spill
6.5.1 The Nature of Costs
The above discussion has indicated that the impacts associated with the Sea Empress oil spill can be divided into the following costs:
. direct costs to fishermen associated with loss of equipment;
. the costs associated with the operation of the Fisheries Exclusion Zone; l the costs arising fi-om long-term changes in harvest rates; and . those arising from reductions in markets.
There may also have been direct losses of fish and shellfish resulting from oil contamination. However, as indicated in Section 2, most impacts are associated with communities which are not commercially exploited. The main exception to this is impacts on an oyster farmer who was forced to destroy all stock which was in the water at the time of the Sea Empress incident (IOPC, 1997c). These costs are included in the those associated with reductions in markets as data fi-om the IOPC Fund do not allow the two types of costs to be separated.
6.5.2 Costs Associated with Loss of Equipment
Costs of &40 400 have been approved for payment to fishermen who lost fishing gear as a result of the oil spilY3.
6.5.3 Costs Associated with the Fisheries Exclusion Zone
The Nature of Costs
While a FEZ is in operation for a given fishery type or area, there are direct costs to fishermen associated with lost income and the payment of unused licence fees, etc. These costs can be valued using the above data from the IOPC Fund and the SWSFC.
In addition, there will be costs to MAFF associated with the operation of the FEZ. For example, the number of surveillance flights over the area was increased and protection vessels regularly visited the area (Welsh Affairs Committee, 1996). Information on the costs associated with the operation of the FEZ were requested from MAFF but were not made available, thus these costs remain unvalued in the assessment.
43 Payments have also been made for damage to nets and loss of pots but these cannot be separated out from payments for losses due to the operation of the FEZ.
R&D Technical Report P119 6-10
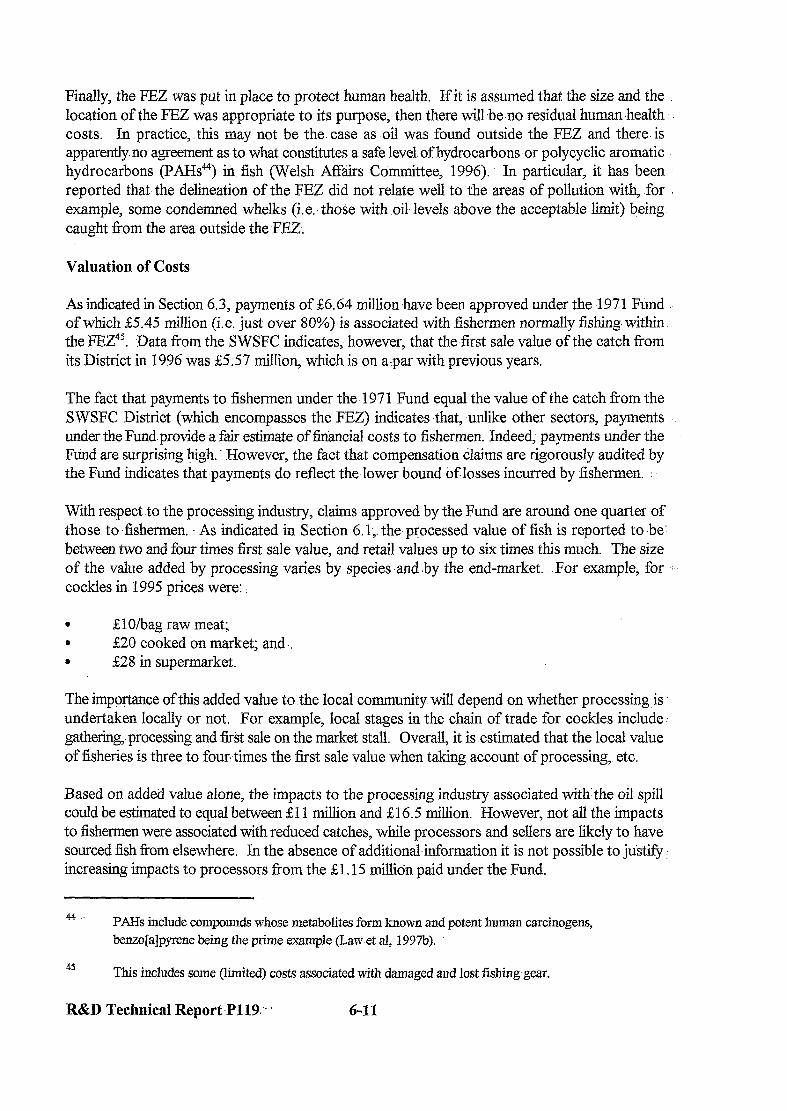
Finally, the FEZ was put in place to protect human health. Ifit is assumed that the size and the location of the FEZ was appropriate to its purpose, then there will~beno residual human,health costs. In practice,. this may not be the. case as -oil was found outside the FEZ and there. is apparently. no agreement as to what constitutes a safe level of hydrocarbons or polycyclic aromatic hydrocarbons (PAHs~) in fish (Welsh Affairs Committee, 1996). In particular, it has been reported that the delineation of the FEZ did not relate well to the areas of pollution with, .for example, some condemned whelks (i.e.. those with .oil- levels above the acceptable limit) being caught from the area outside the FEZ;
Valuation of Costs
As indicated in Section 6.3, payments of &6.64 million have been approved under the 1971 Ftind . . of which 25.45 million (i.e. just over 80%) is associated with fishermen normally fishing within the FEZe5. Data from-the SWSFC indicates; however, that the-first sale value of the catch from its District in 1996 was-&5;57 million, which is on a,par with previous years.
The fact that payments to fishermen under the.1971 Fund equal the value of the catch from the SWSFC District (which encompasses the FEZ) indicates .that, ,unlike other sectors, payments under the Fund.provide a fair estimate of tiancial costs to fishermen. Indeed; payments under the Fund are surprising high.. However, the fact that compensation Claims are rigorously audited by the Fund indicates that payments do reflect the lower bound of losses incurred by fishermen.
With respect to the processing industry, claims approved by the Fund are around one quarter of those to .fishermen. As indicated in Section 6. l,, the-processed value of fish is reported to -be: between two and four times f?rst sale value, and retail values up to six times this much. The size of the value added by processing varies by species and .by the-end-market.. .For example, for ... cockles in. 1995 prices were:
. &lo/bag raw meat;
. 220 cooked on market; and . .
. &28 in supermarket.
The importance of this added value to the local community will depend on whether processing is undertaken locally or not. For example, local stages in the chain of trade for cockles include. gathering, processing and first sale on the market stall. Overall, it is:estimated that the local value of fisheries is three to four times the first sale value when taking account of processing,. etc.
Based on added value alone, the impacts to the processing industry associated withythe oil spill could be estimated to equal between &l 1 million and $16.5 million. However, not all the impacts to fishermen were associated with reduced catches, while processors and sellers are likely to have sourced fish from elsewhere. In the absence of additional information it is not possible to justify j increasing impacts to processors from the &I. 15 million paid under the Fund.
44 PAHs include compounds whose metabolites form known and potent human carcinogens, benzo[a]pyrene being the prime example (Law.et al, 199%).
45 This includes some (limited) costs associated with damaged and lost fishing:gear.
R&D Technical Report .Pl19. 6-11
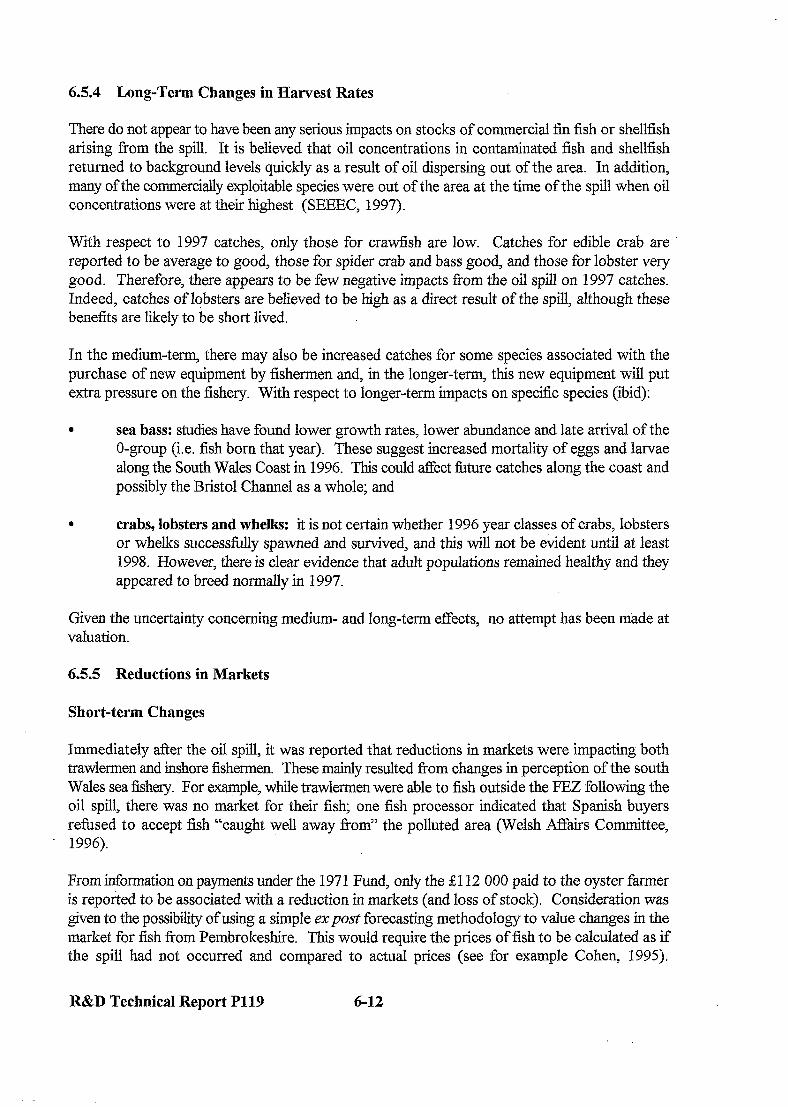
6.5.4 Long-Term Changes in Harvest Rates
There do not appear to have been any serious impacts on stocks of commercial fin fish or shellfish arising from the spill. It is believed that oil concentrations in contaminated fish and shellfish returned to background levels quickly as a result of oil dispersing out of the area. In addition, many of the commercially exploitable species were out of the area at the time of the spill when oil concentrations were at their highest (SEEEC, 1997).
With respect to 1997 catches, only those for crawfish are low. Catches for edible crab are reported to be average to good, those for spider crab and bass good, and those for lobster very good. Therefore, there appears to be few negative impacts from the oil spill on 1997 catches. Indeed, catches of lobsters are believed to be high as a direct result of the spill, although these benefits are likely to be short lived.
In the medium-term, there may also be increased catches for some species associated with the purchase of new equipment by fishermen and, in the longer-term, this new equipment will put extra pressure on the fishery. With respect to longer-term impacts on specific species (ibid):
. sea bass: studies have found lower growth rates, lower abundance and late arrival of the O-group (i.e. fish born that year). These suggest increased mortality of eggs and larvae along the South Wales Coast in 1996. This could affect future catches along the coast and possibly the Bristol Channel as a whole; and
. crabs, lobsters and whelks: it is not certain whether 1996 year classes of crabs, lobsters or whelks successfully spawned and survived, and this will not be evident until at least 1998. However, there is clear evidence that adult populations remained healthy and they appeared to breed normally in 1997.
Given the uncertainty concerning medium- and long-term effects, no attempt has been mtide at valuation.
6.5.5 Reductions in Markets
Short-term Changes
Immediately after the oil spill, it was reported that reductions in markets were impacting both trawlermen and inshore fishermen. These mainly resulted fi-om changes in perception of the south Wales sea fishery. For example, while trawlermen were able to fish outside the FEZ following the oil spill, there was no market for their fish; one fish processor indicated that Spanish buyers refused to accept fish “caught well away from” the polluted area (Welsh Affairs Committee, 1996).
From tiormation on payments under the 197 1 Fund, only the 2112 000 paid to the oyster farmer is reported to be associated with a reduction in markets (and loss of stock). Consideration was given to the possibility of using a simple expust forecasting methodology to value changes in the market for fish from Pembrokeshire. This would require the prices of fish to be calculated as if the spill had not occurred and compared to actual prices (see for example Cohen, 1995).
R&D Technical Report P119 6-12

However, examination of the prices paid for fish and shellfish in period 1993 to. 1996 (see Figures A6.1 to A6.3 in Annex 6) reveals no clear trends on which to base such estimates.. In addition, for some species prices were up on previous-years.. For example, for cockles prices were up due to shortages in Europe. For.whelks, increased prices resulted from an increased demand from Korea.
The Longer-term
In the longer-term, it appears that markets for south Wales-fish.have not been lost as a result of the oil spill.. In the main, this is believed to be due to the FEZ being put in place early enough to :. ensure confidence in the safety .of the supply.-. However, it ,may be the case thatindividual ... fishermen have lost part of their market as demand was filled from fish caught elsew-here.
6.6 Summary of Costs to Commercial .Fisheries
6.6.1 Financial Costs
Financial costs to commercial fisheries are. set out in Table 6.8. In the absence of additional information, it is assumed that:
l around 25% of costs arising from the loss of fishing gear were uncompensated by the Fund. Thus, upper bound costs are taken to equal 250 000;
l similarly, around 25% of costs associated with reductions in markets were unco*mpensated by the 1971 Fund. Thus upper bound costs are taken to equal-&140 000;
. the upper bound for all costs to,fishermen is taken,to be the upper limit of the estimates made by the Government and the IOPC Fund (i.e. 210 million); and
. thus, the upper bound estimate of costs to fishermen associated with operation of the FEZ : is g9.81 million’6 (with the lower bound being the total payments to fishermen47).
Long term changes in harvest rates are unvalued in the assessment.
Financial costs are estimated to lie between 26.75 million and 210 million. In the- absence of additional information, it is estimated that actual costs could be around &8.4 million:b .This is the- mid point between the lower and upper,bound:costs and also represents an across the board. increase of 25% on lower bound costs.
46 i.e.E10000000 ;&50000~&140 000
47 Minusthe&112000paidtotheoysterfarmer.
R&D Technical Report P119 6-13
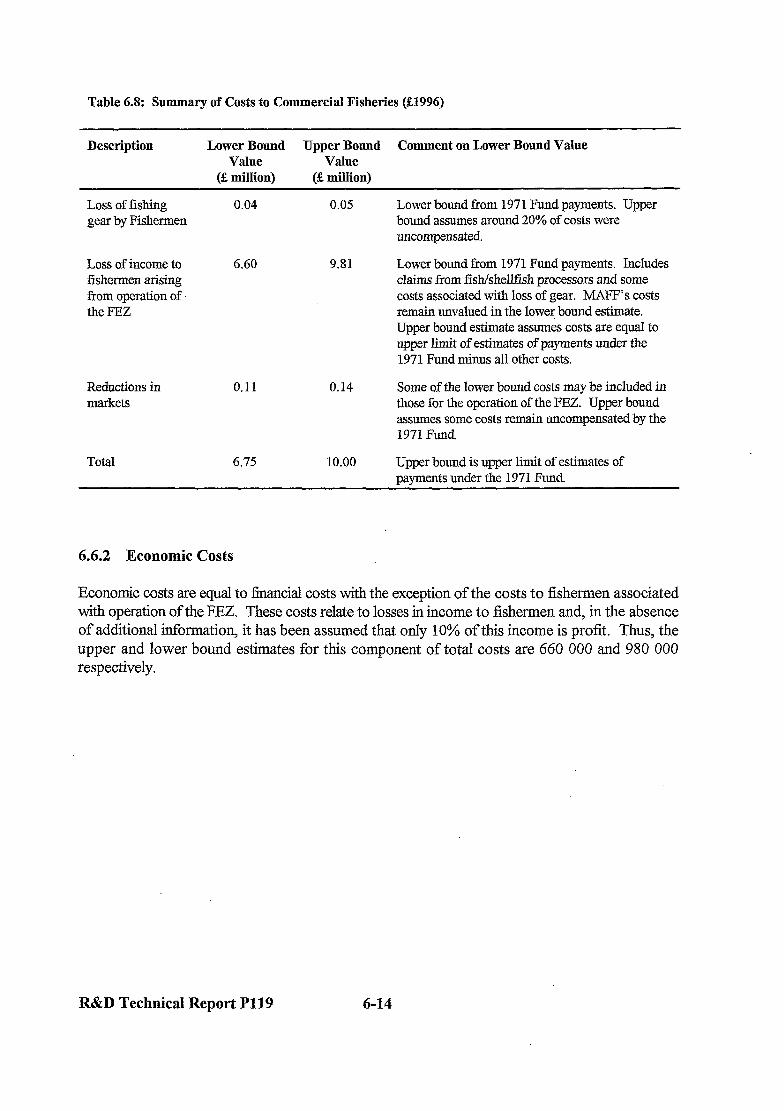
Table 6.8: Summary of Costs to Commercial Fisheries (S1996)
Description Lower Bound Upper Bound Comment on Lower Bound Value Value Value
(2 million) (~2 million)
Loss of fishing gear by Fishermen
0.04 0.05 Lower bound from 1971 Fund payments. Upper bound assumes around 20% of costs were uncompensated
Loss of income to fishermen arising from operation of. the FEZ
6.60 9.81 Lower bound from 1971 Fund payments. Includes claims from fish/shellfish processors and some costs associated with loss of gear. MAFF’s costs remain unvalued in the lower bound estimate. Upper bound estimate assumes costs are equal to upper limit of estimates of payments under the 1971 Fund minus all other costs.
Reductions in markets
0.11 0.14 Some of the lower bound costs may be included in those for the operation of the FEZ. Upper bound assumes some costs remain uncompensated by the 1971 Fund
Total 6.75 10.00 Upper bound is upper limit of estimates of payments under the 1971 Fund
6.6.2 Economic Costs
Economic costs are equal to financial costs with the exception of the costs to fishermen associated with operation of the FEZ. These costs relate to losses in income to fishermen and, in the absence of additional information, it has been assumed that only 10% of this income is profit. Thus, the upper and lower bound estimates for this component of total costs are 660 000 and 980 000 respectively.
R&D Technical Report PI19 6-14
7. RECREATIONAL FISHERIES
7.1 Introduction ..
The- rivers and coastal waters of South West Wales provide recreational fishing- for both freshwater. and sea-based anglers. Came anglers are attracted to rivers such as the Twyi, Taf, and Eastern and WesternCleddaus by the opportunities presented for salmon,and sea trout fishing; whilevthe Pembrokeshire coastline-is a prized location for bass and other sea-based species.
As indicated in Section 6,.in order to protect the commercial fishery and human health, MAFF placed a ban on all fishing activity in a designated area between Port.Enyon Point and St. David’s Head on 28 February 1996. Recognising that there could be a risk associated with, the consumption.of fish which may have passed through-contaminated water during migration, a ban was also placed on fishing for salmon and sea trout in all rivers and streams.discharging into,the affected area. The ban was put in place on ,19 March -1996, the day before the fishing season started, and was lifled on 3 May 1996. Restrictions on fin-fish (e.g. bass, cod, etc.) were removed on 21 May.1996.
This section considers the impact .of the Sea Empress oil spill on recreational angling for salmon and sea trout, bass and other. species of sea fish.
7.2 Salmon and Sea Trout
7.2.1 Overview of Impacts
The main impact ofthe.Sea Empress oil spill on the recreational fishery for salmon and sea trout-- was associated with operation of the fisheries.exclusion zone.. This resulted in losses to the owners and leasers of fishing~rights on theah!ected rivers and losses in consumer surplus to game anglers; There were no direct losses of fish as a result of the spill, however, there are concerns that the oil spill may have caused some long-term changes in harvest rates for sea trout.-
7.2.2 Claims to the.1971 Fund
Claims to the 1971 .Fund have been made by those owning or leasing fishing rights in the rivers affected-by the fishing ban. ,.The claims are based on losses incurred during the ban (i.e. for about 22% of the fishing season) and are reported in Table 7.1. These costs include:
. the costs to angling clubs associated with renting a fishery and paying insurance premiums i over the period of the ban;
. the costs to angling clubs ~ associated with- reductions in ,membership- as a result of the! incident; and.
l the costs to anglers of ‘lost? subscriptions paid for the.period of the fisheries ban.
R&D Technical Report P119 7-l
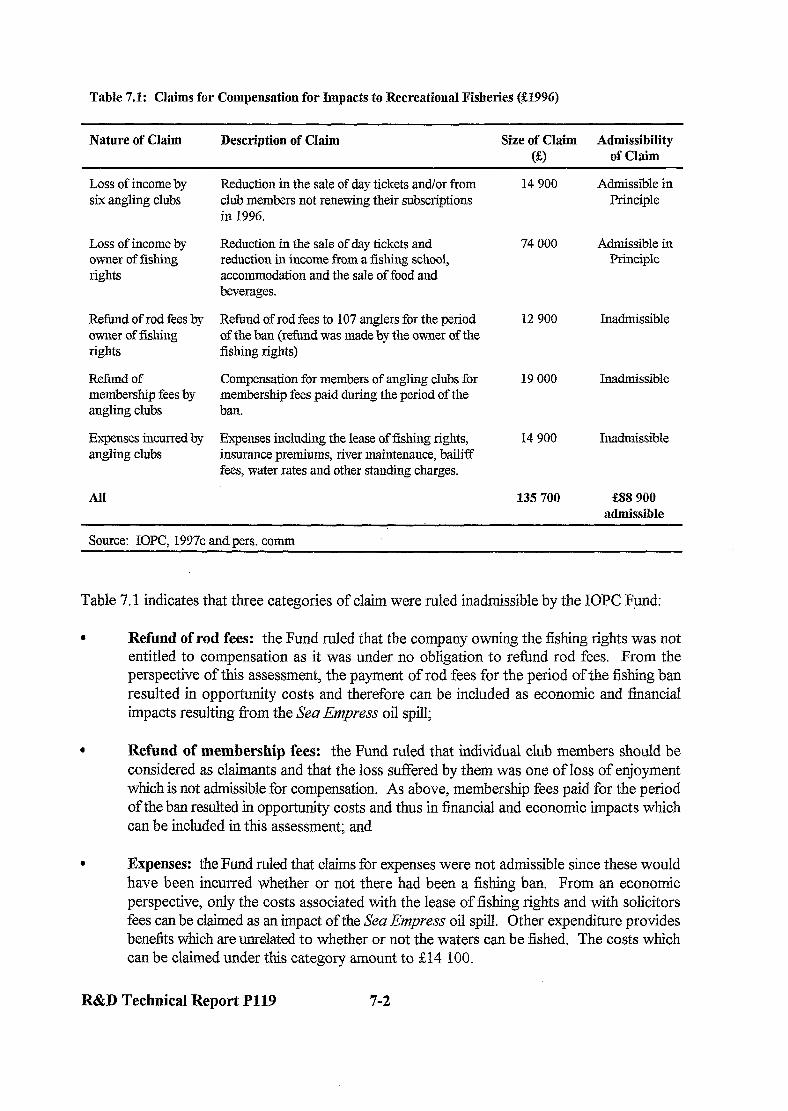
Table 7.1: Claims for Compensation for Impacts to Recreational Fisheries (21996)
Nature of Claim Description of Claim Size of Claim Admissibility (9 of Claim
Loss of income by six angling clubs
Reduction in the sale of day tickets and/or from club members not renewing their subscriptions in 1996.
Loss of income by owner of fishing rights
Reduction in the sale of day tickets and reduction in income from a fishing school, accommodation and the sale of food and beverages.
Refund of rod fees by Refund of rod fees to 107 anglers for the period owner of fishing of the ban (refund was made by the owner of the rights fishing rigl1ts)
Refund of membership fees by angling clubs
Expenses incurred by angling clubs
Compensation for members of angling clubs for membership fees paid during the period of the ban.
Expenses including the lease of fishing rights, insurance premiums, river maintenance, bailiff fees, water rates and other standing charges.
All
14 900 Admissible in Principle
74 000 Admissible in Principle
12 900 Inadmissible
19 000 Inadmissible
14 900 Inadmissible
135 700 33s 900 admissible
Source: IOPC, 1997~ andpers. comm
Table 7.1 indicates that three categories of claim were ruled inadmissible by the IOPC Fund:
. Refund of rod fees: the Fund ruled that the company owning the fishing rights was not entitled to compensation as it was under no obligation to refimd rod fees. From the perspective of this assessment, the payment of rod fees for the period of the fishing ban resulted in opportunity costs and therefore can be included as economic and financial impacts resulting fi-om the Sea Empress oil spill;
. Refund of membership fees: the Fund ruled that individual club members should be considered as claimants and that the loss stiered by them was one of loss of enjoyment which is not admissible for compensation. As above, membership fees paid for the period of the ban resulted in opportunity costs and thus in financial and economic impacts which can be included in this assessment; and
. Expenses: the Fund ruled that claims for expenses were not admissible since these would have been incurred whether or not there had been a fishing ban. From an economic perspective, only the costs associated with the lease of fishing rights and with solicitors fees can be claimed as an impact of the Sea Empress oil spill. Other expenditure provides benefits which are unrelated to whether or not the waters can be fished. The costs which can be claimed under this category amount to 214 100.
R&D Technical Report P119 7-2
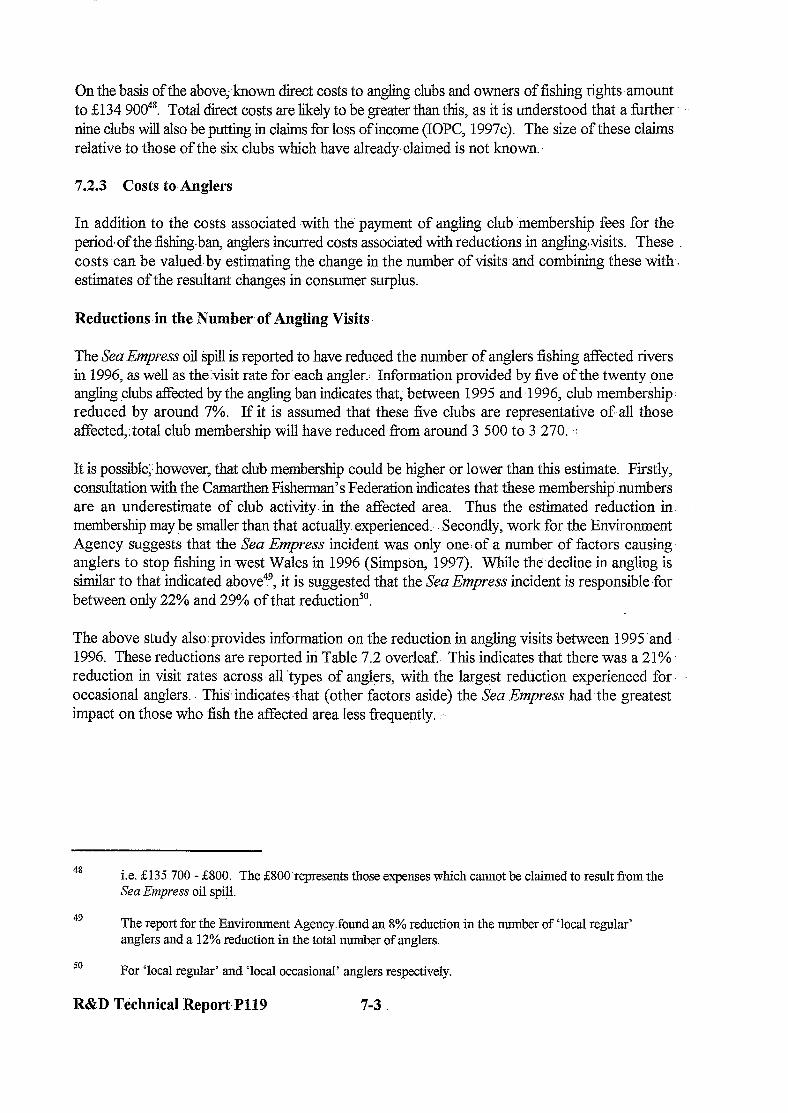
On the basis of the above; known direct costs to angling clubs and owners of fishing rights amount to &134 90048. Total direct costs are likely to be greater than this, as it is understood that a further nine clubs will also be putting in claims for loss of income (IOPC, 1997c). The size of these claims relative to those of the six clubs which have already claimed is not known..
7.2.3. Costs to Anglers
In addition to the costs associated with the payment of angling club membership fees for the period,of the fishing-ban anglers incurred costs associated with reductions in anglinglvisits. These costscan be valued-by estimating the change in the number of visits and combining these with-. estimates of the resultant changes in consumer surplus.
Reductions in the Number of Angling Visits
The Sea Empress oil spill is reported to have reduced the number of anglers fishing affected rivers in 1996, as well as thelvisit rate for each angler.: Information provided by five of the twenty pne angling clubs tiected by the angling ban indicates that, between 1995 and ~1996, club membership. reduced by around 7%. If it is assumed that these five clubs are representative of all those affected,:total club membership will have reduced-from around 3 500 to 3 270. .:
It is possible;.however, that club membership could be higher or lower than this estimate. Firstly, consultation with the Camarthen Fisherman’s Federation indicates that these membership numbers are an underestimate of club activity. in the affected area. Thus the estimated reduction in membership may be smaller than that actually. experienced. Secondly, work for the Environment Agency suggests that the Sea Empress incident was only one: of a number of factors causing- anglers to stop fishing in west Wales in 1996 (Simpson, 1997). While the,declinein angling is similar to that indicated above4’, it is suggested that the Sea Empress incident is responsible -for between only 22% and 29% of that reduction5’.
The above study also.provides information on the reduction in angling visits between 1995 .and 1996. These reductions are reported in Table 7.2 overleaf This indicates that there was a 21%. reduction in visit rates across--all .types of anglers, with the largest reduction experienced for occasional anglers. This,indicates.that- (other factors aside) the sea Empress had-the greatest impact on those who fish the affected area less frequently.
48 i.e. 5135 700 - 5800. The &800represents those expenses which caimot be claimed to result from the Sea Empress oil spill.
49 The report for the Environment Agency.found an 8% reduction in the number of ‘local regular’ anglers and a 12% reduction in the total number of anglers.
50 For ‘local regular’ and ‘local occasional’ anglers respectively.
R&D Technical ReportP119 7-3
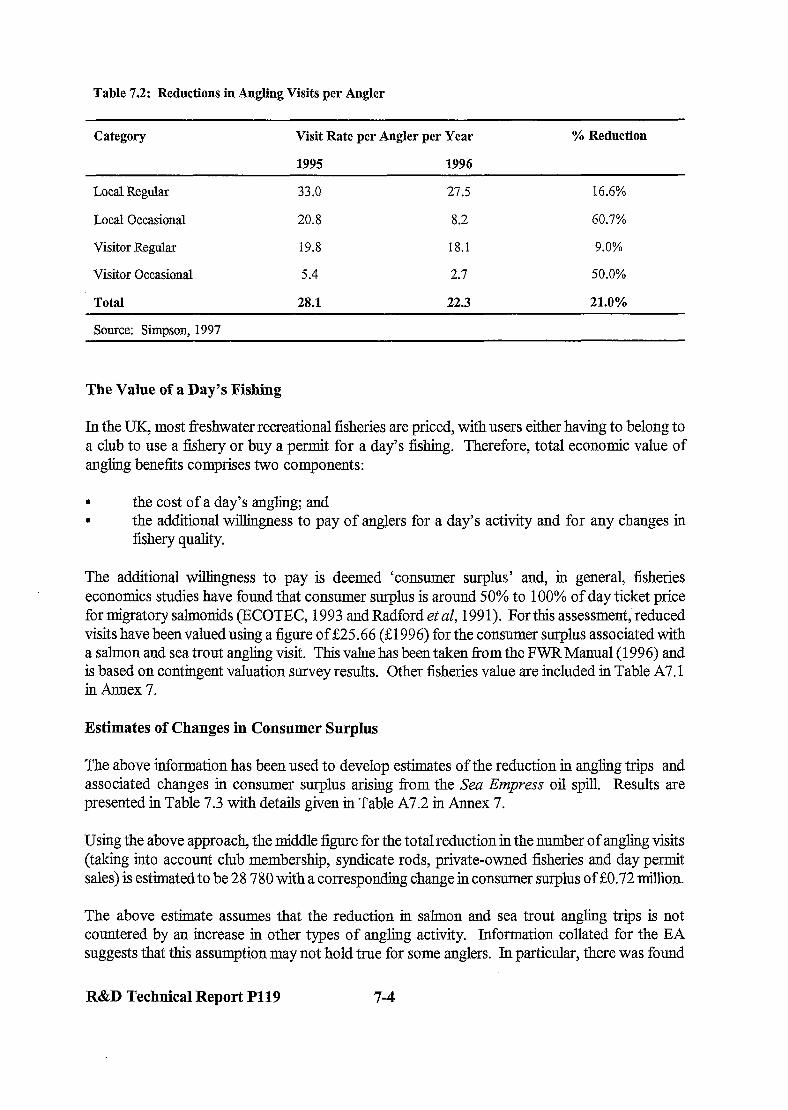
Table 7.2: Reductions in Angling Visits per Angler
Category Visit Rate per Angler per Year
1995 1996
% Reduction
Local Regular 33.0 27.5 16.6%
Local Occasional 20.8 8.2 60.7%
visitor Regular 19.8 18.1 9.0%
Visitor Occasional 5.4 2.7 50.0%
Total 28.1 22.3 21.0%
Source: Simusoa 1997
The Value of a Day’s Fishing
In the UK, most freshwater recreational fisheries are priced, with users either having to belong to a club to use a fishery or buy a permit for a day’s fishing. Therefore, total economic value of angling benefits comprises two components:
. the cost of a day’s angling; and
. the additional willingness to pay of anglers for a day’s activity and for any changes in fishery quality.
The additional willingness to pay is deemed ‘consumer surplus’ and, in general, fisheries economics studies have found that consumer surplus is around 50% to 100% of day ticket price for migratory sahnonids (ECOTEC, 1993 and Radford et al, 199 1). For this assessment,’ reduced visits have been valued using a figure of E25.66 ($1996) for the consumer surplus associated with a salmon and sea trout angling visit. This value has been taken from the FWR Manual (1996) and is based on contingent valuation survey results. Other fisheries value are included in Table A7.1 in Annex 7.
Estimates of Changes in Consumer Surplus
The above information has been used to develop estimates of the reduction in angling trips and associated changes in consumer surplus arising from the Sea Empress oil spill. Results are presented in Table 7.3 with details given in Table A7.2 in Annex 7.
Using the above approach, the middle figure for the total reduction in the number of angling visits (taking into account club membership, syndicate rods, private-owned fisheries and day permit sales) is estimated to be 28 780 with a corresponding change in consumer surplus of SO.72 million.
The above estimate assumes that the reduction in salmon and sea trout angling trips is not countered by an increase in other types of angling activity. Information collated for the EA suggests that this assumption may not hold true for some anglers. In particular, there was found
R&D Technical Report Pl19 7-4
Table 7.3: Estimates of Reductions in Cotisumer Surplus (&1996)
Factor Lower Bound Middle Estimate .’ Upper Bound .:
Total Angling Population in 19956
3980 3980 .. 4940
Reduction in Angling 50 275 375 Population in 1996
Visit Rate. 1995 Q 33.0 33.0 33.0
Visit Rate 1996 #. 27.5 27.5 27.5
Lost Angling Days in 1996+
21725 28780 36900
Value per Angler per Trip &I 996)
S25.66 $25.66 225.66
Reduction in Consumer. Surpllus ($1996)
SO.56 million SO.72 million &0.95miUion :
l Z+ The angling population consists of angling club members, syndicate members aud,private fishery owners.
Q Visit rates for 1995 and 1996 are those for the ‘local regular’ anglers -from de Environment Agency study (Simpson, 1997):. This provides a lower estimate of days lost that for a. ‘local. occasional’ angler - see Table 7.2. Rates for visiting anglers are thought inappropriate for use with de angling population under consideration here.
+ Lost angling days takes into account increases in sales of day permits in 1996. It is assumed that, day,. permit sales are bought by visiting anglers and, in 1996, by ex-club members.
Source: Table A7.2 in Annex 7
to be an increase in the number of trout and coarse fishing licences sold to ‘local regular’ salmon A and sea trout anglers in 1996 @om2% of anglers to 13% of anglers”). However, the significance of this factor to overall estimates of consumer surplus are small. For example, ifit is assumed that all of the- 11% of game anglers able to fish for trout and/or coarse fish gave up game fishing ” completely in preference for coarse fish, then the resultant change-in consumer surplus would-be valued at 244 6005!, or just over 6% of the middle estimate. If these anglers undertook trout
51 However, there was no increase in the numbers of other licences (i.e. non-salmon and sea trout licences) sold to other.classes of anglers (i.e. to anglers other than ‘local regular? salmon and sea trout anglers).
3 165 trips to coarse ftsheries (i.e. 11% of 28 780) valued at 211.58 per trip (FWR+ 1996) gives E44 600.
R&D Technical Report-P119 7-5

fishing (and not coarse fishing), then the resultant change in consumer surplus would be smaller sti.v3.
7.2.4 Changes in Harvest Rates
It has been suggested that the Sea Empress oil spill may have resulted in reductions in catches for some recreational fisheries. In particular, some have expressed concerns that sea trout populations may have been ‘seriously’ affected by the oil spill.
Figures A7.1 to A7.5 in Annex 7 present catch data for the following rivers affected by the oil spill: Tywi, Gwili and Cothi; Taf; East and West Cleddau; Gwendraeths; and Loughour. In all cases, 1996 catchlevels were lower than the ten year average (for 1986 to 1995). However, 1996 catch levels were also higher than those in 1995 for:
. salmon catches on the Tywi, Gwili and Cothi (marginally higher);
. sea trout catch on the Gwendreaths (there being no salmon on these rivers) and;
. catches of both species on the Taf and Loughour .
Examination of catch alone does not take into account any change in angling effort resulting from the spill. To allow a real comparison of 1996 catch data with that for previous years, the Environment Agency has compared ‘catch per unit effort’ (CPUE) data on two rivers, the Tywi and the Teifi (a river not affected by the ban). It appears that rod catches of salmon have not been affected by the oil spill, with the mean monthly CPUE on the Tywi being the highest of any year between 1990 and 1996. This is not the case forseatrout, however, with CPUE data for the Tywi showing “markedly” low catches. This trend was particularly evident in May, June and July, after which catches improved and were within the variation for previous years. To assess whether this pattern is also true of other rivers - as is suggested anecdotally - further research is being undertaken (Environment Agency, 1997a).
with respect to the longer-term, the question remains as to whether possible exposure to oil has affected the ability of salmon and sea trout to breed successfully (SEEEC, 1997). To assist in this regard, the Environment Agency is also undertaking a study of juvenile salmonids to assess whether populations of salmon and sea trout have declined as a result of a possible reduction in the number of adult spawners in 1996/l 997. Preliminary results indicate (Environment Agency, 1997b):
. salmon fry densities showed a moderate increase or remained similar on the Eastern Cleddau, Western Cleddau and Tafcompared with historical data, with a more substantial increase on the Tywi;
. similar increases were also found on the same rivers for sea trout fiy densities; and
. sea trout par-r were more abundant than salmon parr, however, both showed a general decline of 50% to 60% from the historical mean.
53 3 165 trips to trout fisheries valued at g18.70 per tip (FWR, 1996) gives S22 000.
R&D Technical Report P119 7-6
7.3 Bass
7.3.1 Over&% of the Bass Fishery
Fishing. for bass is a highly valued activity, possibly considered by anglers to. be .of greater importance than salmon fishing. The coast ofPembrokeshireis a prized location for bass fishing, due- in part-to the nature of the, coastline and~nursery areas (for example,- in the Burry Inlet). Excellent fishing locations,. from both beaches and rocks, can be-found all around the coast, inc1uding.popula.r areas such as Pembroke Docks, Freshwater West and Broad Haven. Table A7.3, in Annex 7, lists the most popular fishing.locations, together.with species.which can be caught and details of major-fishing events.
Numbers of anglers involved in bass fishing also appear to be increasing. The number of bass anglers is estimated to have increased by 20% between 1987 and 1992 despite an overall decrease by 32% in the number of sea anglers (Dunn et al, 1995): Bass has also become the most popular species fished for during the summer, and third most popular overall (behind. cod and mackerel - Pickett et al, 1995).
The introduction of the fishing ban on 28 February 1996 had the effect of prohibiting all fishing in the designated area, including pleasure angling horn the shoreline. This resulted in a complete cessation of angling activity from Swansea to St Davids Head, affecting around 30 angling locations and associated anglers. When the ban was lifted on 21 May.1996, angling activity-had been affected for 84 days.
Several shore anglers were seen, by Fishery Officer patrols, during the first few days after the ban and were reported to be unaware that the fishing ban extended to shore angling. Similarly, when the ban was lifted there was little activity returning to beaches between Laugharne and Milford Haven, with members of the public still requesting if the ban would be lifted on 26 May. Shore. anglers began to.return to Pendine and Saundersfoot around the 27 May..
It is reported that impacts to sea anglers were mostly associated with activity in the Haven, with the.majority ofkeen anglers seeking alternative angling sites @uticuIarly Fishguard) as a result of the fishing ban- .-Thus, although tishing activity continued for some anglers, there were additional-costs associated with increased travel.
Impacts on charter boats reached further than the exclusion zone, with boats from Swansea and Penarth also reporting reduced bookings and cancellations which were directly attributed to the oil spill, and in spite of the quality of the fishing. In:February, for. example, Tboats from Penarth were havi&‘exceptional catches” of over50 fish per day (Coates, 1996’0).
With respect to the.longer-term, there is some evidence to suggest that the oil spill resulted in increased mortality of bass eggs and larvae. This has the potential to result in reduced catches for about five years after the incident (once bass reach five years old they may migrate off shore or larger distances) within a radius- of 50. miles (the approximate distance bass migrate before reaching five years of age).
R&D Technical Report P119 7-7

7.3.2 Claims from the 1971 Fund
Charter boat operators have reported that the Sea Empress incident resulted in a loss ofbookings throughout the whole of 1996, and not just for the duration of the fishing ban. This is because February and March is the peak booking time for charter boat trips, with anglers choosing to make trips elsewhere for fear that the fishing ban may last some time.
Operators were able to claim compensation from the 1971 Fund for reductions in bookings arising from the Sea Empress oil spill. However, it is reported that claims were only accepted for bookings which were cancelled in writing, giving the Sea Empress as the cause, with records of usage over the past five years not being accepted as indicating reductions in income for 1996. It has been estimated that, in general, operators were compensated for around two thirds of losses, with the remainder relating to anticipated bookings.
Data from the IOPC Fund does not specifically identify claims I?om charter boat operators which are assumed to be included in claims Tom the ‘tourism’ industry.
7.3.3 Impacts to Bass Anglers
The ban on bass fishing resulted in a cessation of angling activity in the affected area and an increase in the number of trips to locations outside the fisheries exclusion zone. Thus, to estimate the costs to bass angling resulting from the oil spill it is necessary to consider:
. the change in angling activity in the area affected by the ban;
. alternative sites to which activity could move; and l the change in consumer surplus arising from the ban.
The Change in Angling Activity in the Area Affected by the Ban
In 1995, there were 361 000 bass anglers in England and Wales ofwhich 4.5%, i.e. around 16 250 were based in Dyfed (Dunn et al, 1995).
The ban on bass .&king existed for 84 days of the year Erom February to May and Table 7.4 presents information on the percentage of angling activity affected by the ban over this period. Given that the main bass angling season runs corn May to September, the effects of the ban on angling activity were minimised to some degree.
In total, 9.8% of charter boat trips, 20.4% of private boat trips and 15.9% of shore trips are estimated to have been affected by the fisheries ban. Data fi-om the National Survey of Bass Angling (Dunn et al, 1995) indicates that:
. all bass anglers fish f?om the shore, and make an average of 44 trips per year;
. 56.5% of bass anglers make five trips per year on a charter boat; and
. 67.6% of bass anglers make 16 private boat trips per year.
R&D Technical Report P119 7-8
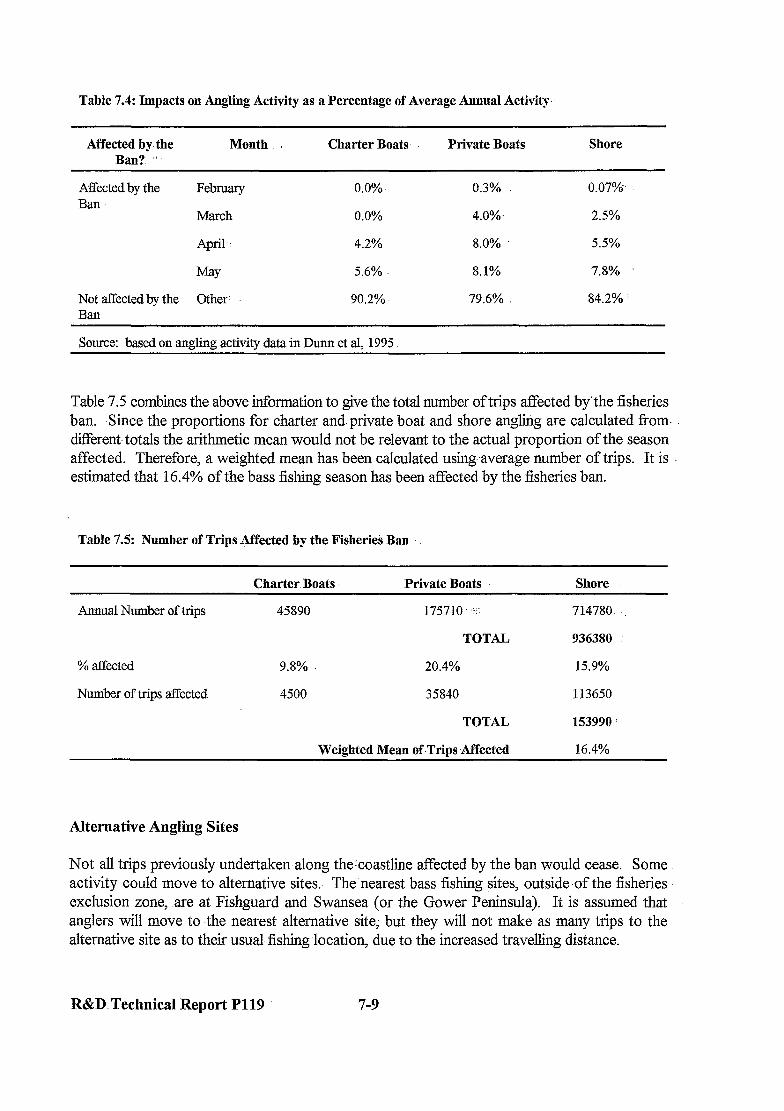
Table 7.4: Impacts on Angling Activity as a Percentage of Average Annual Activity.,
Affected by the Ban? .‘.
Month . Charter Boats Private Boats Shore
Affected by the Ba.Il
February
March
0.0% 0.3% 0.07%.
0.0% 4.0%. 2.5%
April :
May
Not affectedby the other Ban
4.2% 8.0% 5.5%
5.6% 8.1% 7.8%
90.2%. 79.6% 84.2%
Source: based on angling activity data in Dunn et al, 1995
Table 7.5 combines the above information to give the total number of trips affected by’the fisheries ban. Since the proportions for charter and.private boat and shore angling are calculated from. diEerent.totals the arithmetic mean would not be relevant to the actual proportion of the season affected. Therefore, a weighted mean has been calculated using.average number of trips. It is estimated that 16.4% of the bass fishing season has been affected by the fisheries ban.
Table 7.5: Number of Trips Affected by the FisherieS Ban
Charter.Boats Private Boats Shore
Annual Number of trips
% affected
Number of trips affected
45890 175710 ,:.: 714780 ._
TOTAL 936380
9.8% 20.4% 15.9%
4500 35840 113650
TOTAL 153990
Weighted Mean of ,Trips Affected 16.4%
Alternative Angling Sites
Not all trips previously undertaken along the:coastline affected by the ban would cease. Some activity could move to alternative sites. The nearest bass fishing sites, outside.of the fisheries exclusion zone, are at Fishguard and Swansea (or the Gower Peninsula). It is assumed that anglers will move to the nearest alternative site; but they will not make as many trips to the alternative site as to their usual fishing-location, due to the increased travelling distance.
R&D Technical Report P119 7-9
The reduction in bass angling trips for any given angler has been estimated as follows:
. percentage of trips falling within the duration of the ban: 16.4%;
l nearest bass angling site (within the area of the ban): for example for an angler from Pembroke, this is Angle Bay, at a distance of eight miles;
l nearest alternative site outside the area of the ban: for the Pembroke-based angler this is Fishguard at a distance of 25 miles;
. the proportion of trips to the alternative site: it is assumed that trips to the alternative site will be reduced in direct proportion to the increased distance travelled. Thus for the Pembroke-based angler, trips to the alternative site will be only 32% (i.e. eight divided by 25) of those to the nearest site;
the proportion of lost trips: for the Pembroke angler, the fishing ban results in 68% fewer trips during the ban; and
the reduction in trips arising from the fishing ban: this is the percentage of trips falling within the duration of the ban multiplied by the percentage of lost trips. This is 11% (i.e. 16.4% multiplied by 68%) for the angler from Pembroke.
A full listing of estimates for anglers based in each of the Dyfed wards affected by the fisheries ban is given in Table A7.4 in Annex 7.
Change in Consumer Surplus
Valuation of the consumer surplus associated with bass angling has been undertaken by Dunn et al (1995) who developed estimates of both willingness to accept (i.e. the amount an angler would accept to compensate him or her for the loss of their right to go bass angling for a year) and willingness to pay (i.e. the amount that an angler would pay for bass angling). Theoretically, both measures should give the same value, but due to the nature of ‘selling’ and ‘buying’, willingness to sell is invariably higher than willingness to pay. Two estimates were made:
. a random sample of on-site shore anglers in 1993 elicited a willingness to accept of around &900 and a willingness to pay of 288 (values given in S1996); and
b a re-survey of contacts from a previous survey in 1987 gave willingness to accept and willingness to pay values of around $2 140 and &610 (in S1996), respectively.
It is argued that the higher values given by the re-survey of 1987 contacts reflects their longer involvement in bass angling, hence their higher valuation (Dunn et al, 1995).
Valuation of the Fishing Ban for Bass Anglers
Table 7.6 presents estimates of the change in consumer surplus for bass anglers arising from the. fishing ban. The overall costs are estimated to range between 258 000 and S1.4 million across the
R&D Technical Report P119 7-10
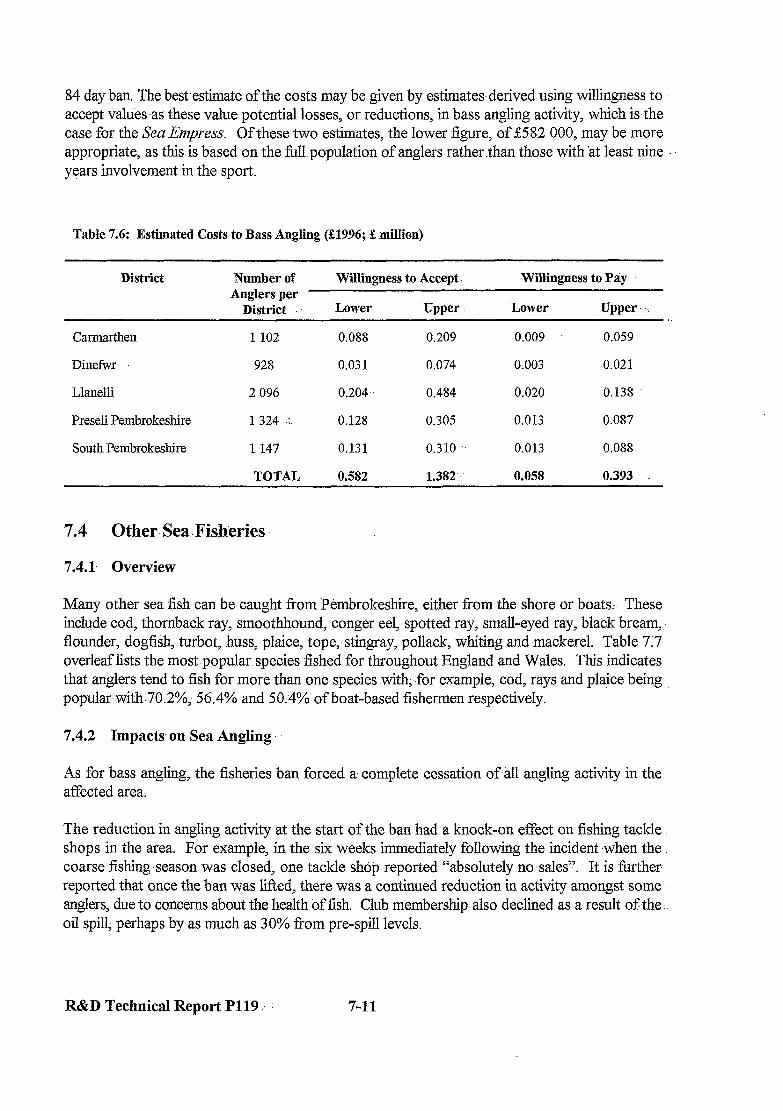
84 day ban. The best-estimate of the costs may be given by estimates, derived using willingness to accept values,as these value potential losses, or reductions, in bass angling activity, which isthe case for the Sea Empress. Of these two estimates, the lower figure, of &5X2 000, may be more appropriate, as this is based on the full population of anglers rather .than those with ‘at least nine years involvement in the sport.
Table 7.6: Estimated Costs to Bass Angling (#X996; ;E million)
District Number of Anglers per
District
Willingness to Accept. Willingness to Pay
Lower Upper Lower Upper. .:
Carmarthen 1 102 0.088 0.209
Dinefwr 928 0.03 1 0.074
Llanelli 2 096 0.204.. 0.484
Preseli Pembrokeshire 1 324 .:. 0.128 0.305
South Pembrokeshire 1 147 0.131 0.310
TOTAL 0.582 1.382’
0.009 0.059
0.003 0.021
0.020 0.138
0.013 0.087
0.013 0.088
0.058 0.393
7.4 Other Sea .Fisheries
7.4.1. Overview
Many other sea fish can be caught from Pembrokeshire, either from the shore or boats,. These include cod, thornback ray, smoothhound, conger eel, spotted ray, small-eyed ray, black bream, flounder, dogfish, turbot, .huss, plaice, tope, stingray, pollack, whiting and -mackerel. Table 7:7 overleaf lists the most popular species fished for throughout England and Wales. This indicates that anglers tend to fish for more than one species with, -for example, cod, rays and plaice being popular.with170.2%; 56.4% and 50:4% of boat-based fishermen respectively.
7.4.2 Impacts, on Sea Angling
As for bass angling, the fisheries ban forced a complete cessation of all angling activity in the affected area.
The reduction in angling activity at the start of the ban had a knock-on effect on fishing tackle shops in the area. For example, in the-six w-eeks immediately following the incident ,when the coarse fishing,season was closed, one tackle shop reported “‘absolutely no-sales”. It is further reported that once the ban was lifted, there was a continued reduction in activity amongst some anglers, due to concerns about the health of fish. Club membership also declined as a result of the . . oil spill, perhaps by as much as 30% from pre-spill levels.
R&D Technical Report P119 3. 7-11
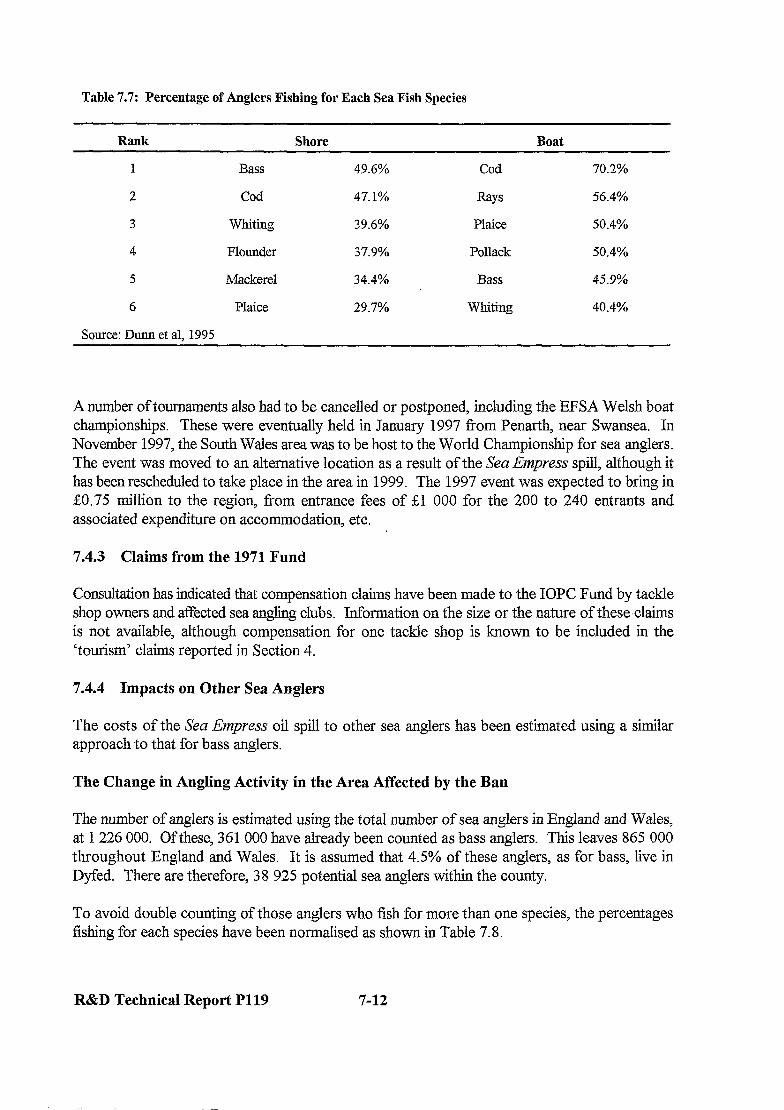
Table 7.7: Percentage of Anglers Fishing for Each Sea Fish Species
Rank Shore Boat
1 BaSS 49.6% Cod 70.2%
2 Cod 47.1% &YS 56.4%
3 whiting 39.6% Plaice 50.4%
4 Flounder 37.9% Pollack 50.4%
5 Mackerel 34.4% Bass 45.9%
6 Plaice 29.7% whiting 40.4%
Source: Dunn et al, 1995
A number of tournaments also had to be cancelled or postponed, including the EFSA Welsh boat championships. These were eventually held in January 1997 from Penarth, near Swansea. In November 1997, the South Wales area was to be host to the World Championship for sea anglers. The event was moved to an alternative location as a result of the Sea Empress spill, although it has been rescheduled to take place in the area in 1999. The 1997 event was expected to bring in 20.75 million to the region, from entrance fees of &l 000 for the 200 to 240 entrants and associated expenditure on accommodation, etc.
7.4.3 Claims from the 1971 Fund
Consultation has indicated that compensation claims have been made to the IOPC Fund by tackle shop owners and tiected sea angling clubs. Information on the size or the nature of these-claims is not available, although compensation for one tackle shop is known to be included in the ‘tourism’ claims reported in Section 4.
7.4.4 Impacts on Other Sea Anglers
The costs of the Sea Empress oil spill to other sea anglers has been estimated using a similar approach to that for bass anglers.
The Change in Angling Activity in the Area Affected by the Ban
The number of anglers is estimated using the total number of sea anglers in England and Wales, at 1226 000. Ofthese, 361 000 have already been counted as bass anglers. This leaves 865 000 throughout England and Wales. It is assumed that 4.5% of these anglers, as for bass, live in Dyfed. There are therefore, 38 925 potential sea anglers within the county.
To avoid double counting of those anglers who fish for more than one species, the percentages fishing for each species have been normalised as shown in Table 7.8.
R&D Technical Report P119 7-12
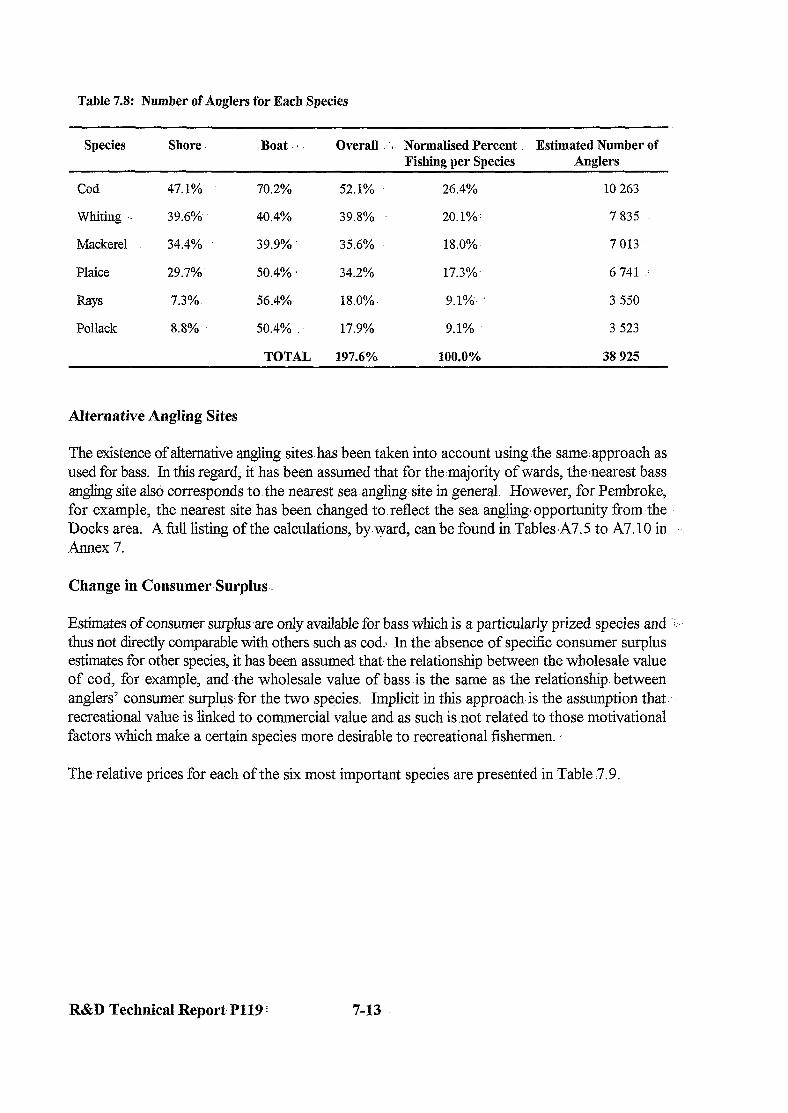
Table 7.8: Number of Anglers for Each Species
Species Shore
Cod 47.1%
Whitirtg -. 39.6%
Mackerel 34.4%
Plaice 29.7%
Rays 7.3%.
Pollack 8.8%-
Boat L Overall (. Normalised Percent .. Estimated Number of Fishing per Species Anglers
70.2% 52.1% 26.4% 10 263
40.4% 39.8% 20.1%.. 7835
39.9% 35.6% 18.0% 7 013
50.4% 34.2% 17.3% 6741
56.4% 18.0%. 9.1%. 3 550
50.4% 17.9% 9.1% 3 523
TOTAL 197.6% 100.0% 38 925
Alternative Angling Sites
The existence of alternative angling sites. has been taken into account using the same.approach as used for bass. In this regard; it has been assumed that for the majority of wards, thenearest bass angling site also corresponds to the nearest sea angling,site in general. However, for Pembroke, for example, the nearest site has been changed to reflect the sea angling~opportunity fromthe Docks area. A full listing of the calculations, by-ward, can be found in Tables A7.5 to A7.10 in -. Annex 7.
Change in Consumer-Surplus
Estimates of consumer surplus ‘are only available for bass which is a particularly prized species and. I. thus not directly comparable with others such as cod., In the-absence of specific consumer surplus estimates for other species, it has been assumed that- the relationship between the wholesale value of cod, for example, and the w-holesale value of bass is the same as the relationship. between anglers’ consumer surplusfor the two species. Implicit in this approach-is the assumption that recreational value is linked to commercial value and as such isnot related to those motivational factors which make a certain species more desirable to recreational fishermen.
Therelative prices for each of the six most important species are presented in.Table !7.9.
R&D Technical Report P119 f 7-13
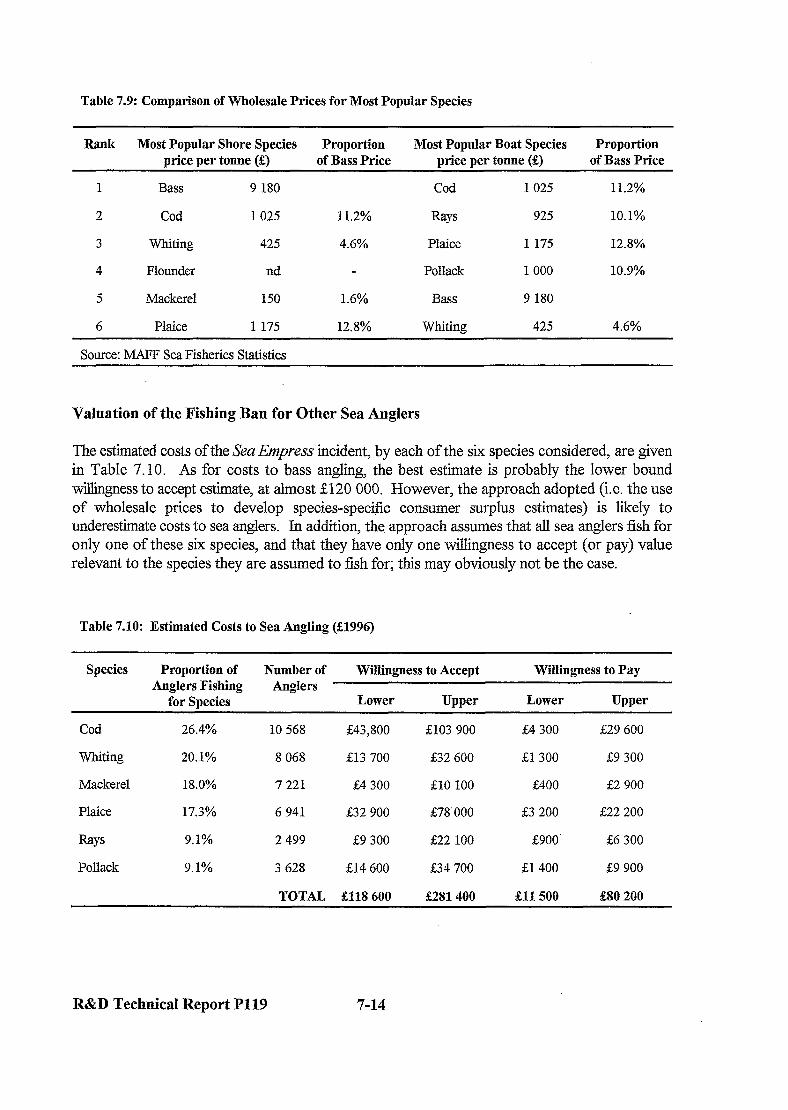
Table 7.9: Comparison of Wholesale Prices for Most Popular Species
Rank Most Popular Shore Species Proportion Most Popular Boat Species Proportion price per tonne (&) of Bass Price price per tonne (2) of Bass Price
1 Bass 9 180 Cod 1025 11.2%
2 Cod 1025 11.2% Rays 925 10.1%
3 whiting 425 4.6% Plaice 1 175 12.8%
4 Flounder nd Pollack 1000 10.9%
5 Mackerel 150 1.6% Bass 9 180
6 Plaice 1 175 12.8% whiting 425 4.6%
Source: MAFF Sea Fisheries Statistics
VaIuation of the Fishing Ban for Other Sea Anglers
The estimated costs of the Sea Enpress incident, by each of the six species considered, are given in Table 7.10. As for costs to bass angling, the best estimate is probably the lower bound willingness to accept estimate, at almost 2120 000. However, the approach adopted (i.e. the use of wholesale prices to develop species-specific consumer surplus estimates) is likely to underestimate costs to sea anglers. In addition, the approach assumes that all sea anglers fish for only one of these six species, and that they have only one willingness to accept (or pay) value relevant to the species they are assumed to fish for; this may obviously not be the case.
Table 7.10: Estimated Costs to Sea Angling (33996)
Species
Cod
whiting
Proportion of Number of Willingness to Accept Willingness to Pay Anglers Fishing Anglers
for Species Lower Upper Lower Upper
26.4% 10 568 &43,800 &103 900 &4 300 529 600
20.1% 8 068 &13 700 &32 600 51300 &9 300
Mackerel 18.0% 7221 &4 300 &lo 100 &400 &2 900
Plaice 17.3% 6 941 &32 900 678’ 000 &3 200 222 200
Rap 9.1% 2 499 259 300 &22 100 &900’ &6 300
Pollack 9.1% 3 628 &14 600 &34 700 &1400 &9 900
TOTAL 8118 600 Yx2281400 331500 980 200
R&D Technical Report P119 7-14
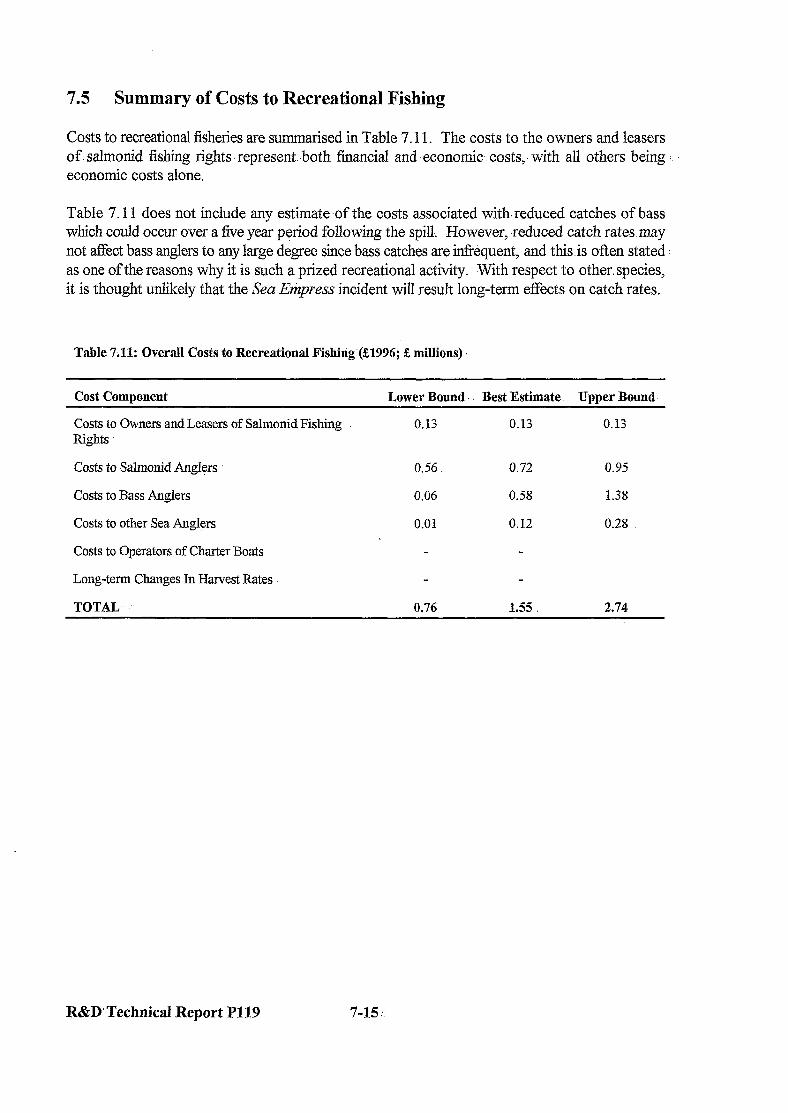
7.5 Summary of Costs to Recreational Fishing
Costs to recreational fisheries are summarised in Table-7.1 1. The costs to the owners and leasers of. salmonid fishing rights’ represent. both financial and economic costs,. with all others being economic costs alone.
Table 7.1 I does not include any estimate of the costs associated with.reduced catches of bass which could occur over a five year period following the spill, However, reduced catch rates may not affect bass anglers to any large degree since bass catches are infrequent, and this is often stated. as one of the reasons why it is such a prized recreational activity. With respect to other. species, it is thought unlikely that the Sea Etipress incident will result long-term effects on catch rates.
Table 7.11: Overall Costs to Recreational Fishtig (g1996; 3Z millions)
Cost Component Lower Bound.. Best Estimate. Upper Bound--
Costs to Owners and Leasers of Salmonid Fishing 0.13 0.13 0.13 Rights
Costs to Salmonid Anglers 0.56 0.72 0.95
Costs to Bass Anglers 0.06 0.58 1.38
Costs to other Sea AngIers 0.01 0.12 0.28
Costs to Operators of Charter Boats
Long-term Changes In Harvest Rates
TOTAL 0.76 1.55 2.74
R&D~Technical Report Pl19 7-15:

R&D Technical Report P119 7-16

8. IiW?‘ACTS:ON INDUSTRY
8.1 Overview
Traditionally, the key components of the Pembrokeshire.economy have been agriculture, tourism, the oil .industry (and related businesses), the, defence industry. and, to some extent, fisheries. However, the importance of agriculture is in decline, following a general decline in ,this sector coupled with other factors such as the.BSE Crisis. In addition, the military has scaled down its activities in the area considerably.. As a result, other- industries, particularly tourism and the oil- ! industry are increasing in importance. With respect to the latter, of the original four refineries based at Milford Haven;one closed in the 1980’s and one other,announced its closure in 1997.
The impacts of the Sen Empress oil spill on tourism and associated industries, including marinas, has.been considered in.Section 4. Other industries to have experienced a negative impact as a result of the spill are:
. the three oil refineries;
. the ferry from Pembroke Dock to-Ireland;
. the.defence industry at Pendine and Castlemartin; and.
. Pembroke.Power Station. ..
In contrast, those parts of the Pembrokeshire economy.involved with.the clean-up of o&benefited from the spill.
8.2 Port-Related ‘Industries
One of the main industry. sectors potentially‘affected by the Sea Empress oil spill was the oil industry itself There are three refineries at Milford Haven, all of which will have suffered some disruption to the delivery of oil and the export of oil products. Similarly, the movement of ferries between Pembroke Dock and Ireland- will have been affected to some extent5” as will the : movement of other-vessels.
Immediately after the incident, it is reported that.sand dredging activities -from Pembroke Dock ceased, resulting in a reduction of on-shore stocks. In addition, the fuel bunkering service was curtailed while the fuel supplyvessels were deproyed for use by the Marine Pollution Control Unit 1.. (Bryan et al, 1996).
In general terms, the effetis of the Sea Empress incident-will depend on the nature of restrictions placed on the movement of vesselsin and out of the affected area and.the number of expected movements In this regard, average movements to and from the Port of Milford Haven are:.
The ferry company has been contacted for details of impacts, but has not provided data.
R&D Technical Report P119 8-l
l 14.2 per day for tankers; . 3.8 per day for ro-ro ferries; and . 0.2 per day for dry cargo.
It is not known to what degree movements of vessels to and from Milford Haven were impacted during the time between the initial grounding of the Sea Empress on 15 February and its eventual arrival at the oil company jetty on 21 February55. However, by 22 February, vessel movements had resumed as there was a ‘hazardous incident’ between a tanker and a ferry in the waterway.
Pembroke Power Station also had the potential to be impacted by any restrictions on movements of vessels in the vicinity of the grounded tanker and associated oil spill as it produces electricity by burning oil which is imported by ship. However, the power station is rarely fired up; being used mainly to satisfy peak demand for electricity. It is reported that the power station was on-line for part of the time during the incident and that cooling water flows were interrupted to some extent.
At the time of the Sea Empress, National Power had plans to convert the power station to orimulsion, a bitumen emulsion (i.e. a suspension of bitumen in water). Since then, these plans have been withdrawn. Some have contended that the Sea Empress incident was a key factor is this decision and that this impact should be valued in monetary terms. This has not been possible due to a number of factors including:
. the di&xlties in obtaining a true estimate of the importance of the incident;
. an inability to quantify the likelihood that the scheme would have been given the go-ahead had the oil spill not occurred; and
. the need to estimate the change in risks arising from the sea transport of orimulsion.
8.3 The Defence Industry
8.3.1 Pendine
The military facility at Pendine supports a rocket test track and a firing range. The former is operated as a business and is used to test both military and commercial products. Consultation has indicated that personnel from the Pendine facility were involved in the clean-up of oiled beaches and that some business was lost as a result of the Sea Empress incident. These costs were associated with:
. “frantic” activity involving around five to ten people, for a period of two weeks. On the basis of a 40 hour per week and at an average stafY cost of &2O/hour, these can be valued at between $8 000 to &16 000. In addition, there were other costs associated with the use of transport and equipment such as land-rovers, trailers, etc.; and
55 Milford Haven Port Authority indicated that it was unwilling to speak to the Consultants until after its prosecution by the Environment Agency.
R&D Technical Report P119 8-2
. Pendine agreed to stop firing at certain specified times to allow the clean-up of beaches to proceed. To some extent these costs were recouped, with concentrated efforts being made to recover lost ground through working overtime;etc. In total, the,costs associated with lost-business can probably be valued at around &5 000 for the two week period of the clean-up.
Thus, total costs to the test track facility at Pendine are estimated to be between around-&13 000 and &21 000: These were not reclaimed from the 1971 Fund.
8.3.2 Castlemartin
The: military training facility at Castlemartin was also impacted, to some extent,: by the Sen Enzpress oil spill. Overall, the involvement of the Castlemartin Range and thus the associated costs were not great, partly because most of the clean-up was-undertaken by local workers and not by range personnel.. However:,
. some of the range personnel-did help with oiled birds; l the range loaned vehicles, tractors, JCBs, stores, tables and tents ,for. the clean-up; . firing was stopped to allow aircraft to fly- over to observe the spill; i, ‘ the agencies involved in the clean-up were given access to the range; and l the range was prepared to accommodate the villagers of Angle, should there be fears of
an explosion aboard ship and,thus a need to. evacuate.
Some costs were claimed (indirectly) fiom,the 1971 Fund., In particular, the costs associated with the loan of a JCB and the provision of meals for clean-up workers were claimed from the JRC, who in turn claimed these from the 197-l Fund. .Thus;- this component of costs is already included. in the direct -cost estimates provided in Section 3.
There were also costs associated with stti time, which- take.the form of opportunity co&s. In particular, it is estimated that 200 Ehours were spent- by the Commandant- of the range and his colleagues associated with briefings, booking people out.onto the range, time spent in meetings of the Range Recording Advisory Group, etc. At an average staff cost of &20/hour,.these costs can be valued at around &4 000:
Had the spill occurred at any other time of the year, then the costs to the Castlemartin Range would ,have been higher. In particular, firing takes place on the range for 44 weeks, but not in January or February. The range costs are around 210 000 per day. Had it been necessary to stop firing, .it is anticipated that owing to time-constraints, .training opportunities would have been lost (as it may not be possible to reschedule training).
8.4 Benefits to the Pembrokeshire .Economy.
While there were some -costs to industry.in Pembrokeshire, the economy of the county also benefited from-the oil clean-up, In particular, local people were employed as workers and local businesses benefited from the money.spent by media and those involved in scientific research, for example.
R&D Technical Report P119 .’ 8-3
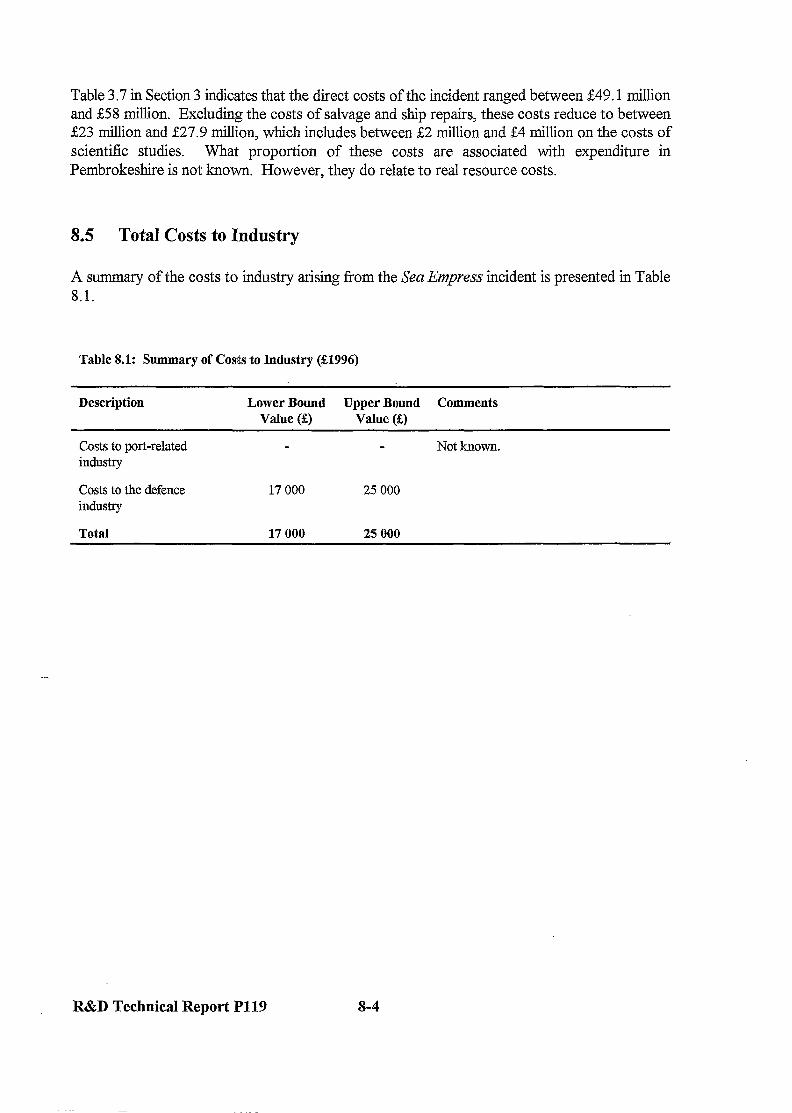
Table 3.7 in Section 3 indicates that the direct costs of the incident ranged between &49.1 million and 258 million. Excluding the costs of salvage and ship repairs, these costs reduce to between 223 million and Z27.9 million, which includes between &2 million and 24 million on the costs of scientific studies. What proportion of these costs are associated with expenditure in Pembrokeshire is not known. However, they do relate to real resource costs.
8.5 Total Costs to Industry
A summary of the costs to industry arising from the Sea Empress incident is presented in Table 8.1.
Table 8.1: Summary of Costs to Industry (33996)
Description Lower Bound Upper Bound Comments Value (2) Value (0
Costs to port-related industry
Costs to the defence industry
Not known.
17 000 25 000
Total 17 000 25 000
R&D Technical Report P119 8-4
9. CONSERVATION/NON4JSE RELATED EFFECTS
9.1 Overview of the Area Affected by the Oil Spill
The length of coastline tiected by the Sea Empress oil spill is of outstanding beauty,a.nd scientific .. interest. Most of the-coastline is within Pembrokeshire Coast National Park, the or&national park in Britain. primarily designated for its coastal and estuarine landscapes56. The main area impacted by the spill,contains- 35 Sites of-SpecialScientific Interest (SSSIs) and two National Nature Reserves at-Stackpole and Skomer which are exceptional examples of wildlife habitats and geological features. In addition, the area around Skomer forms one of the UK’s three Marine Nature Reserves and much of the.coastline has been defined as Heritage Coast.
Parts of the area are further- designated as,Specia.l Protection Areas (SPAS) under the-EC Birds Directive and are thus key habitats for-migratory birds or those which are rare or vulnerable. There are also plans for three Special Areas of Conservation (SACS) under the Habitats and Species Directive 1992.
9.2 The-Impact of the Oil Spill
9.2.1 Marine Impacts.
Immediately after the spill, eight sites in and arotmd Milford Haven waterway were examined. to : assess impacts on benthic?7 animals. Effects were “surprisingly?%nited; with the main species impacted being narcotised anemones and slow moving shrimps in the muddy sand off Dale Fort. However, in the‘weeks following the spill, large numbers of dead or moribund:marine-animals were:washed up on beaches. Most of these animals were.bivalve-molluscs and.other sediment dwelling species and it is.believed that most strandings resulted from the spill. There was a wide, range of species associated with these strandings including cockles, spiny cockles, heart.urchins, common starfish, masked crabs, banded wedge shells; rayed trough shells;’ egg-shell razors, razorshells and Venus shells- A list of strandings by. species, location and date is given in Table A9.1 inAnnex9.
Over the longer-term, the effects on the offshore marine community appears to be minimal, apart for a reduction in small crustacean species such as amphipods in some locations58. For example, a November 1996 survey of ten sites around Skomer Marine Nature Reserve found ,benthic fauna to be “markedly” less diverse and abundantin 1996 compared .with. 1993, with there being a notable ‘absence of small .crustaceans. Similarly in June -1997, a survey of sites around the -.
56 The text for Section 9.1 is based on the description of the affected area given in the SEEEC Draft Report (SEEEC, 1997); Similarly,,all impacts set out in Section 9.2 are those reported in this SEEEC document.
57 Those living in or on the sea bed.
58 Impacts on commercially exploited species are not included in this statement - see Section 6.
R&D. Technical Report Pl19 :. 9-1

entrance to Milford Haven waterway found very few small crustaceans such as amphipods and isopods - although these species w-ere found at other sites, sometimes in abundance. The absence of these crustaceans in the Haven was thought to be significant as these are a favoured food species for many animals such as fish and larger crustaceans. However, it is thought that these effects are limited to within the Haven, as surveys of seabed microfauna in coastal waters between St Brides Bay and Rhosilli Bay found no such effects on amphipod fauna. In addition, the effect is expected to be of relatively short duration as amphipods, despite not having a planktonic stage, will eventually spread from unaffected areas.
9.2.2 Impacts to Rocky Shores
Rocky shores dominate much of the coastline of Pembrokeshire and the Milford Haven w-aterway. A large number of species live in these areas, including familiar animals such as limpets and barnacles, large brown seaweeds and a host of smaller animals and plants. Some of the species affected by the spill are nationally rare or scarce and of conservation importance.
Limpets and Other Grazers
One heavily affected species was the limpet which is particularly sensitive to the narcotising effects of f?esh oil. For example, there was over 90% limpet mortality in some parts of West Angle Bay, significant reductions in limpet densities around the entrance to Milford Haven and losses at many other sites between West Angle Bay and Saundersfoot. Other herbivorous gastropods were also acutely afl?ected including topshells and periwinkles, which were found at some heavily oiled sites.
The reduced grazing by limpets and other snails allowed algae to grow unchecked, with a resultant ‘green flush’ over large areas of lower and mid-shore rock surfaces. In some areas the green algae competed for space with lower shore communities of red algae and also stopped barnacle larvae from settling on the rocks. In contrast, reduced limpet grazing at West Angle Bay resulted in greater survival of brown f&oid algae sporelings, so much so that by May 1996 there was an extensive and unusually dense cover of one form of this fucoid. (Thus green and brown algae benefited from the spill. In contrast, at Manorbier and Skomer, populations of red algae were bleached following contact with oil. However, by August 1996, most populations were pink and healthy and showed little, if any, evidence of damage.)
With respect to the recovery of limpet populations, experience Corn other oil spills indicates that there would be a rapid recruitment and growth of limpets for a period of three to five years after the oil spill. This would be followed by a crash in populations which outgrew- the available food, and then a period of smaller fluctuations until the balance of grazers and algae was restored. This could take between ten to fifteen years at West Angle Bay, with other less affected areas recovering much more quickly.
Barnacles
There were also large scale mortalities of barnacles around Dale and in a few locations around .Tenby, Saundersfoot and Pendine. The mortality varied between sites and was caused by the toxicity of the oil, large scale physical smothering, or a combination of both. However, in most areas the majority of barnacles appeared to survive, with only small patches smothered by thick
R&D Technical Report P119 9-2
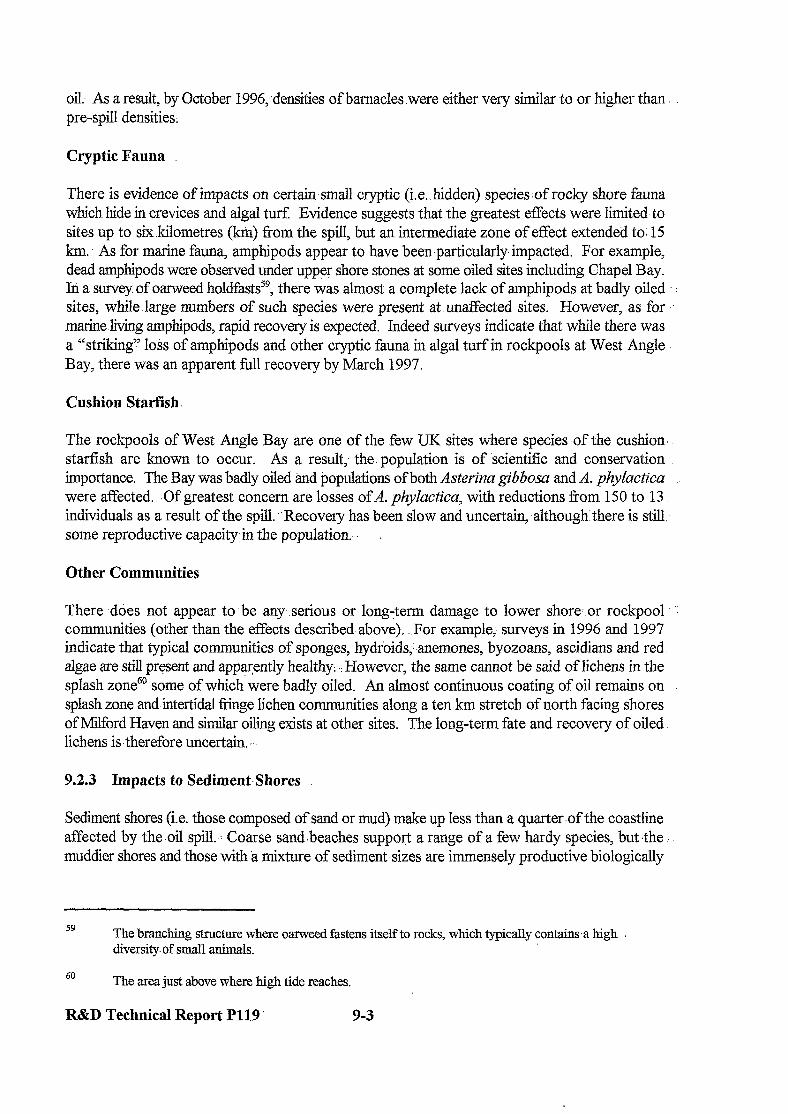
oil. As a result, by October 1996;,densities of barnacles .were either. very similar to or higher than pre-spill densities.
Cryptic Fauna
There is evidence of impacts on certain small cryptic (i.e.. hidden) species.of rocky shore fauna which hide in crevices and algal turf Evidence suggests that the greatest effects were limited to sites up to six kilometres (km) from the spill, but an intermediate zone of effect extended to. 15 km. As for marine fauna, amphipods appear to have been-particularly impacted. For example, dead amphipods were observed under upper shore stones at some oiled sites including Chapel Bay. In a survey of oar-weed holdfasts5g, there was almost a complete lack of amphipods at badly oiled : sites, while large numbers of such species were present at .unaffected sites. However, as for .. marine living amphipods, rapid recovery is expected. Indeed surveys indicate that while there was a “striking” loss of amphipods and other cryptic fauna in algal turf in rockpools at West Angle Bay, there was an apparent full recovery by March 1997.
Cushion Starfish.
The rockpools of West Angle Bay are one of the few UK sites where species -of the cushion: starfish are known to occur. As a result,- the. population is of scientific and conservation importance. The Bay was badly oiled and populations of both Asterina gibbosa and A. phylactica were affected.. .Of greatest concern are losses ofA. phylactica, with reductions from 150 to 13 individuals as a result of the spill.. Recovery has been slow and uncertain, -although: there is still, some reproductive capacityin the population. I
Other Communities
There -does not appear to. be any serious or 1ong:ter-m damage to lower shore or rockpool .. communities (other than the effects described above). For example, surveys in 1996 and 1997 indicate that typical communities of sponges, -hydroids;.anemones, byozoans, ascidians and red. algae are still present and apparently healthy:,,, However, the same cannot be said of lichens in the splash zone6’ some of which were badly oiled. An almost continuous coating of oil remains on splash zone and intertidal &inge lichen communities along a ten km stretch of north facing shores of Milford Haven and similar oiling exists at other sites. The long-term fate and recovery of oiled. lichens istherefore uncertain. .‘.
9.2.3 Impacts to Sediment.Shores
Sediment shores (i.e. those composed of sand or mud) make up less than a quarter .of the coastline affected by the oil spill. : Coarse sand .beaches support a range of a few hardy species, but the muddier shores and those with a mixture of sediment sizes are immensely productive biologically
59 The branching structure where oarweed fastens itself to rocks, which tJipically contains a high . diversity of small animals.
60 The area just above where high tide reaches.
R&D Technical Report P119 9-3

and form an important part of the marine ecosystem. These are particularly important as fish nurseries and feeding areas for migrant birds.
Within these areas, there appear to be no short to medium-term effects in meiofauna6r, however, there remains the possibility of long-term effects in harpacticoid copepods. The abundance and distribution of many species of macrofauna6” was found to have changed since surveys in 1994, but not all of this reduction is thought to result fi-om the Sea E~~RXS oil spill. Again, the greatest decrease was of small crustaceans, especially amphipods, with molluscs also being impacted to some extent.
9.2.4 Impacts to Maritime Vegetation
Various maritime vegetation types came into contact with oil or were affected by the clean-up operations. Plant communities potentially at risk include those associated with sea-cliffs, saltmarshes and calcareous dunes.
It appears that while some maritime vegetation was impacted by the oil, effects have been short- lived. For example, isolated specimens of common plants such as thrift and red fescue growing on low sea-cliffs within Milford Haven waterway were killed by fuel oil, but many severely impacted common plants had regrown from their roots by Autumn 1996. Populations of the nationally scarce narrow-leaved eelgrass were also contaminated with oil, but by 1997 appeared to be healthy and little changed ii-om pre-spill levels. This was believed to be due to the timing of the spill - which occurred before the main period of growth had commenced - and possibly a reduction in grazing pressure.
Of all maritime vegetation types, the saltmarsh in Milford Haven waterway was most directly impacted by the oil spill and studies have been initiated to map long-term effects.
9.2.5 Mammals
Although there was no evidence of any immediate impact on mammals resulting from the oil spill, a number of species were considered to be potentially at risk. However, there appears to have been no impact on these species:
. Seals: around 4% of the UK Atlantic grey seal population lives around the west coast of Wales. There is no convincing evidence to suggest that the spill had any short- to medium-term impact of any consequence on this population. However, had the spill occurred during the pupping season (i.e. in the autumn), some seal pups could have been killed or otherwise adversely affected;
61 Animals less than 0.5 millimetres.
62 Animals greater than 0.5 millimetres.
R&D Technical Report P119 9-4

. Cetaceans: Of the five most frequently recorded species around ther coast, harbour I. porpoises and bottlenose dolphins wereassessed as being the most at risk because of their permanent residence in--the. area. There .appears to be .no evidence of-an impact on :. cetaceans as result of the oil spill, but-longer-term observations are desirable to confirm this conclusion;
. Otters: Otters are widespread throughout Pembrokeshire and records suggest that they now visit estuaries and the coast more frequently. However, during the.oil spill there was no evidence of coastal. activity or of any .adverse effect of the spill; and
. Greater horseshoe bats: -,.(&eater -horseshoe bats are. now only,found in south-west England and three nursery roosts in west and south-Wales. There were concerns that the 10% .to 25% of the Pembrokeshire population, which hibernate .in sea caves on the Castlemartincoast could have been tiected by oil vapour. However, exposure of the bats was found to be minimal and no. adverse detrimental.effects were observed..
9.2.6 Impacts on .Birds
The south-west Wales coast, islands . and inshore waters are. of outstanding ‘international importance for their breeding seabirds, wintering sea-duck and wintering waterfowl. The region supports about half a million breeding’seabirds;including half of the UK population of Manx shear-waters, the .third.largest population of gannets in the world,. and more than.40 000 auks (guillemotsj razorbills and puffins). Many areas have been designated as SPAS or SSSIs ‘for .: populations of international -or national importance respectively, and two further SPAS are designated for their though populations.. During .winter more than 40 000 waterfowl visit the. region, including 30% to 40% ‘of the UK’s common scoter wintering population. Small numbers of three species of diver also regularly winter offshore.
The Sea Enpress spill resulted in the oiling of large numbers of birds fi0rn.a wide range of species. The first -were reported on 17 February and by 1 June 1996 nearly 7 000 birds from some 36 species had been collected dead or alive. .Around 85% of birds recorded came ashore between 24 February and 4 March 1996. The worst bit species was the common scoter which made up two thirds of the birds recorded; Most of the rest were auks, mainly guillemots, which together with common scoters and razorbills made up over 90% of recorded casualties. As only a small proportion of oiled birds reach the shore, the total number of birdskilled will be substantially higher than the recorded totals?. To get-a better idea of the total k&a number of oiled corpses were neck-tagged and returned-to the sea. 238 corpses were released inearly March, but only 12 were eventually recovered - all in South East Ireland. On the basis of this corpse-drift experiment, it could be estimated that the total number of oiled birds.was 47 60064. However, this may be an under- or over-estimate of the actual total as winds and currents at the time of the experiment were likely to have differed from those during the spill.
63 Except, perhaps, for-scoters in Camarthen Bay which, due to their location and prevailing winds, were more likely to have washed ashore when oiled.
64 (7 000 birds - 4 600 scoters (see preceding footnote)) * 238 corpses released / 1.2 corpses recovered
R&D Technical Report P119 9-5 . .
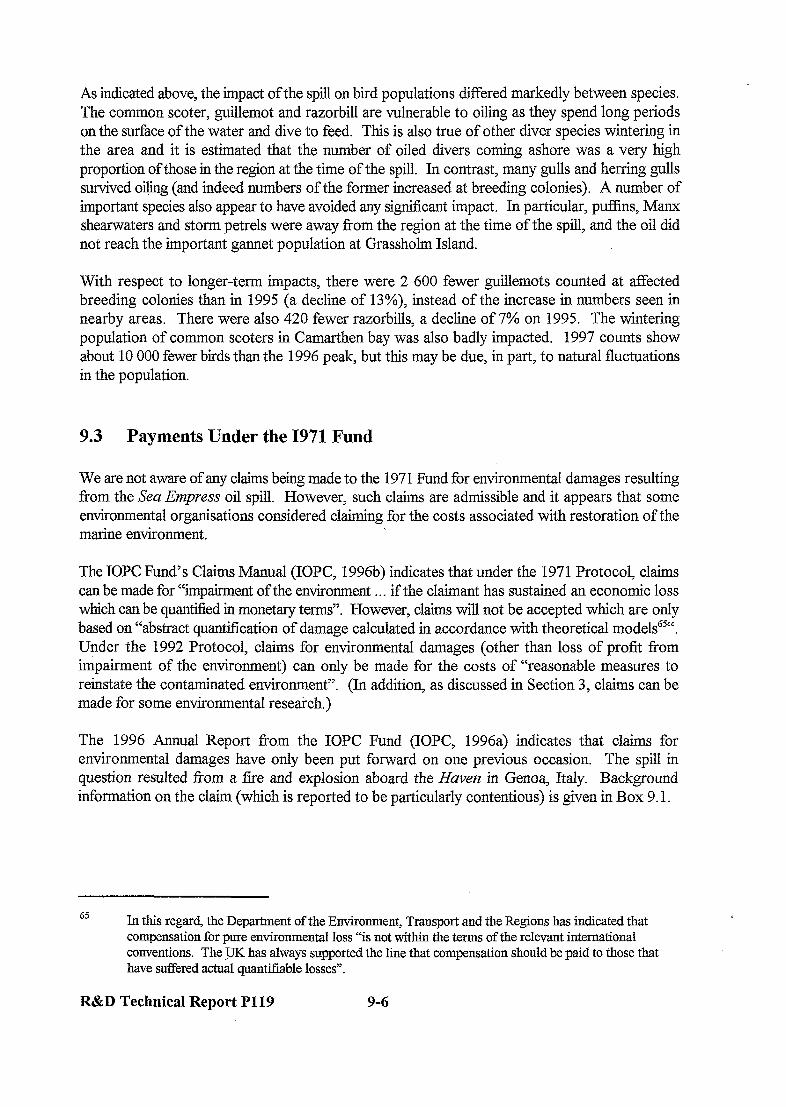
As indicated above, the impact of the spill on bird populations differed markedly between species. The common scoter, guillemot and razorbill are vulnerable to oiling as they spend long periods on the surface of the water and dive to feed. This is also true of other diver species wintering in the area and it is estimated that the number of oiled divers coming ashore was a very high proportion of those in the region at the time of the spill. In contrast, many gulls and herring gulls survived oiling (and indeed numbers of the former increased at breeding colonies). A number of important species also appear to have avoided any significant impact. In particular, puffins, Manx shearwaters and storm petrels were away from the region at the time of the spill, and the oil did not reach the important gannet population at Grasshohn Island.
With respect to longer-term impacts, there were 2 600 fewer guillemots counted at affected breeding colonies than in 1995 (a decline of 13%), instead of the increase in numbers seen in nearby areas. There were also 420 fewer razorbills, a decline of 7% on 1995. The wintering population of common scoters in Camarthen bay was also badly impacted. 1997 counts show about 10 000 fewer birds than the 1996 pee but this may be due, in part, to natural fluctuations in the population.
9.3 Payments Under the 1971 Fund
We are not aware of any claims being made to the 1971 Fund for environmental damages resulting from the Sea Empress oil spill. However, such claims are admissible and it appears that some environmental organisations considered claiming for the costs associated with restoration of the marine environment.
The IOPC Fund’s Claims Manual (IOPC, 1996b) indicates that under the 1971 Protocol, claims can be made for “impairment of the environment . _ _ if the claimant has sustained an economic loss which can be quantified in monetary terms”. However, claims will not be accepted which are only based on “abstract quantification of damage calculated in accordance with theoretical models”5“. Under the 1992 Protocol, claims for environmental darnages (other than loss of profit from impairment of the environment) can only be made for the costs of “reasonable measures to reinstate the contaminated environment”. (In addition, as discussed in Section 3, claims can be made for some environmental research.)
The 1996 Annual Report from the IOPC Fund (IOPC, 1996a) indicates that claims for environmental damages have only been put forward on one previous occasion. The spill in question resulted from a fire and explosion aboard the iZzve?z in Genoa, Italy. Background information on the claim (which is reported to be particularly contentious) is given in Box 9.1.
65 In this regard, the Department of the Environment, Transport and the Regions has indicated that compensation for pure environmental loss “is not within the terms of the relevant international conventions. The _JJK has always supported the line that compensation should be paid to those that have suffered actual quantifiable losses”.
R&D Technical Report P119 9-6
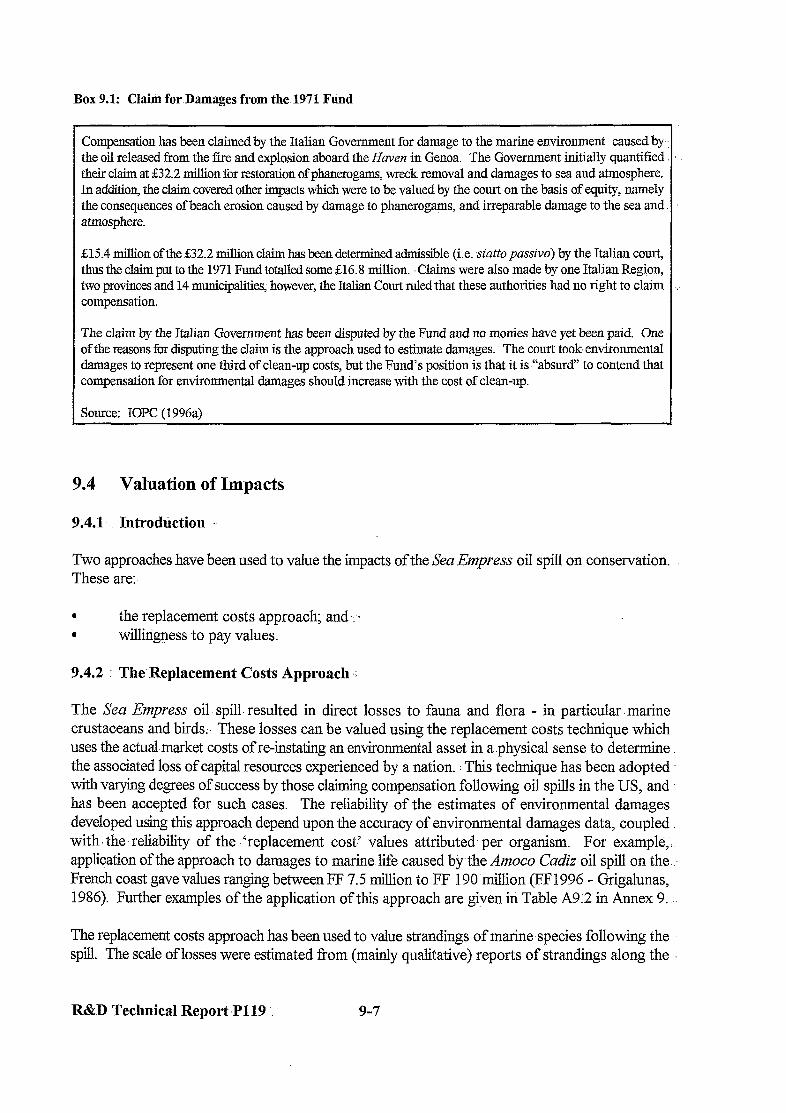
Box 9.1: Claim-for.Damages from the 1971 Fund
Compensation has been claimed by the Italian Government for damage to the marine environment caused by- the oil released from the fire and explosion aboard the Haven in Genoa. The Government initially quantified their claim at g32.2 million for restoration of phanerogams, wreck removal and damages to sea and atmosphere. In addition, the claim covered other impacts which were to be valued by the court on the basis of equity, namely the consequences of beach erosion caused by damage to phanerogas, and irreparable damage to the sea and atmosphere.
515.4 million of the ~532.2 million claim has been determined admissible (i.e. statto passive) by the Italian court, thus the claim put to the 1971 Fund totalled some ~516.8 million. Claims were also made by one Italian Region, two provinces and 14 municipalities; however, the Italian Court ruled that these authorities had no right to claim compensation.
The claim by the Italian Government has been disputed by the Fund and no monies have yet been paid. One of the reasons for disputing the claim is the approach used to estimate damages. The court took environmental damages to represent one third of clean-up costs, but the Fund’s position is that it is “absurd” to contend that compensation for environmental damages should increase with the cost of clean-up.
Source: IOPC (1996a)
9.4 Valuation of Impacts
9.4.1. Introdliction ..
Two approaches have been used to vaIue the impacts of the Seer Empress oil spill on conservation. These are:
. the replacement costs approach; and-.
. williligness to pay values.
9.4.2 : The Replacement Costs Approach ‘i
The Sea Empress oil. spill resulted in direct losses to fauna and flora - in particular. marine crustaceans and birds: These losses can be valued using the replacement-costs technique which uses the actual market costs of re-instating an environmental asset in a.physical sense to determine th& associated loss of capital resources experienced by a nation. : This technique has been adopted with varying degrees of success by those claiming compensation following oil spills-in the US, and has been accepted for such cases. The reliability of the estimates of environmental damages developed using this approach depend upon the accuracy of environmental damages data, coupled with. the. reliability of the ‘replacement cost.’ values attributed. per organism. For example;. application of the approach to damages to mar&life caused bythe Amoco Cadiz oil spill on the..- French coast gave values ranging between FF 7.5 million to FF 190 million (EF1996 - Grigalunas, 1986). Further examples of the application of this approach are given in Table A92 in Annex 9. :
The replacement costs approach has been used to value strandings of marine species following the spill. The scale of losses were estimated from (mainly. qualitative) reports of strandings along the
R&D Technical Report iP119 9-7
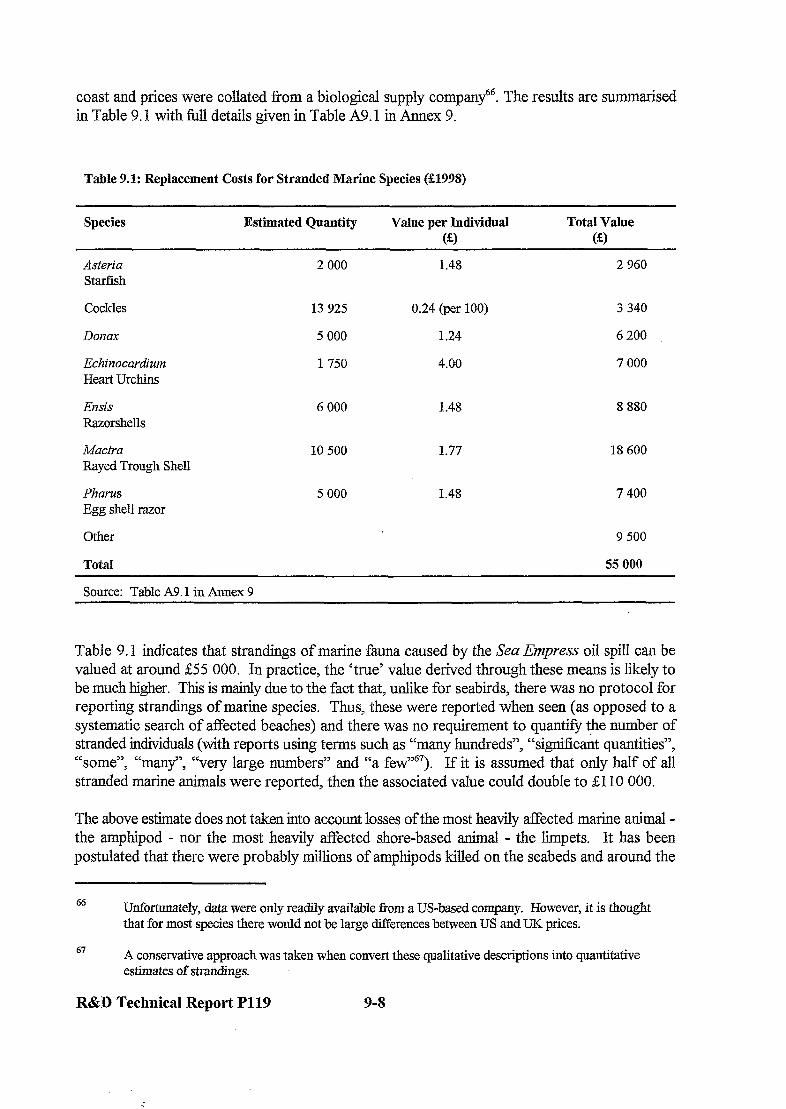
coast and prices were collated Corn a biological supply compa.ny66. The results are summarised in Table 9.1 with full details given in Table A9.1 in Annex 9.
Table 9.1: Replacement Costs for Stranded Marine Species (21998)
Species Estimated Quantity Value per Individual @a
Total Value 63
Asteria Starfish
Cockles
Donax
Echinocardium Heart Urchins
Ensis Razorshells
Macira Rayed Trough Shell
Pharus Egg shell razor
Other
Total
2000 1.48 2960
13 925 0.24 (per 100) 3 340
5000 1.24 6200
1750 4.00 7000
6000 1.48 8 880
10 500 1.77 18 600
5 000 1.48 7400
9 500
55000
Source: Table A9.1 in Annex 9
Table 9.1 indicates that strandings of marine fauna caused by the Sea Enzpress oil spill can be valued at around &55 000. In practice, the ‘true’ value derived through these means is likely to be much higher. This is mainly due to the fact that, unlike for seabirds, there was no protocol for reporting strandings of marine species. Thus, these were reported when seen (as opposed to a systematic search of affected beaches) and there was no requirement to quantfi the number of stranded individuals (with reports using terms such as “many hundreds”, “signif&& quantities”, “some”, “many, Cc very large numbers” and “a few”67). If it is assumed that only half of all stranded marine animals were reported, then the associated value could double to &I 10 000.
The above estimate does not taken into account losses of the most heavily affected marine animal - the amphipod - nor the most heavily affected shore-based animal - the limpets. It has been postulated that there were probably millions of amphipods killed on the seabeds and around the
66 Unfortunately, data were only readily available from a US-based company. However, it is thought that for most species there would not be large differences between US and UK prices.
67 A conservative approach was taken when convert these qualitative descriptions into quantitative estimates of strandings.
R&D Technical Report P119 9-s
coastline, these being too small to strand. Losses of limpets were also high and approached 90% in some areas of West Angle Bay. The price of a selection of amphipods available from a biological supply company range between 21.24 and 21.78 per individual-and the price of a limpet is U.48.
Ifit is the case that millions of amphipods were lost, then using the replacement costs approach, the economic value of these losses would also be of the order of millions of pounds. : With respect to limpets, although the scale of losses has not been quantified;. the -loss of tens of thousand :. : individuals would similarly be valued at tens of thousands of pounds.
In considering these values, it should be noted that replacement would not need to’ actually take place for.this approach to be justified. For these values -to be considered sound in theoretical terms, however, -there has to be ‘an indication that society would be willing .to pay such Y replacement costs. ~IIn the case of amphipods, evidence suggests that losses will.be relatively short- .. lived, with some populations already at pre-spill levels: Whether a valuation of millions of pounds would be-accepted for the.temporary loss of these crustaceans is therefore debatable.
9.3.3 Willingness to Pay
The total economic value of an environmental asset is the sum of use values plus non-use values. The former are those associated with actual use of the environment and these have been used in monetising impacts to recreational- anglers, bathers, surfers, etc: Non-use values are of three different types:
. option values relate to the desire to maintain-the ability to use the environment at some time in the future. They reflect an individual’s willingness to pay to -secure,the future of. a good and thus express the potential benefits of that good;-
. bequest values are,attached to preservation or conservation of the environment so that &&n-e generations may also. have the option of use; and
l existence values are those values which result fi-om an individual’s altruistic desire that an environmental asset be preserved and continue to exist into the.fkture. These values are not associated with actual or potential use, but solely with the knowledge that the asset is being preserved.
Table 9.2 presents some relevant non-use values derived from willingness-to-pay (i.e. contingent valuation) surveys, and -the results of the full literature review. are presented in Table -A9.2 of Annex 9. Two of these values were-developed by water companies and relate to the willingness of the public to pay for protection of EC designated bathing waters from sewage pollution. The value developed by Welsh Water indicates a value of&O. 14 per EC designated beach,per annum. As discussed in. Section .5, for the aesthetic ivalue of a natural resource, respondents to questionnaires have found the presence,of oil to be the most damagmg; followed closely by the presence of sewage. There is therefore some relevance of these values to preventing oil spill related damages, although. the context of these problems is different. In particular, it must be noted that the Welsh Water values relate to a continuous pollution problem as opposed to a catastrophic event.
R&D Technical Report P119 I’. 9-9
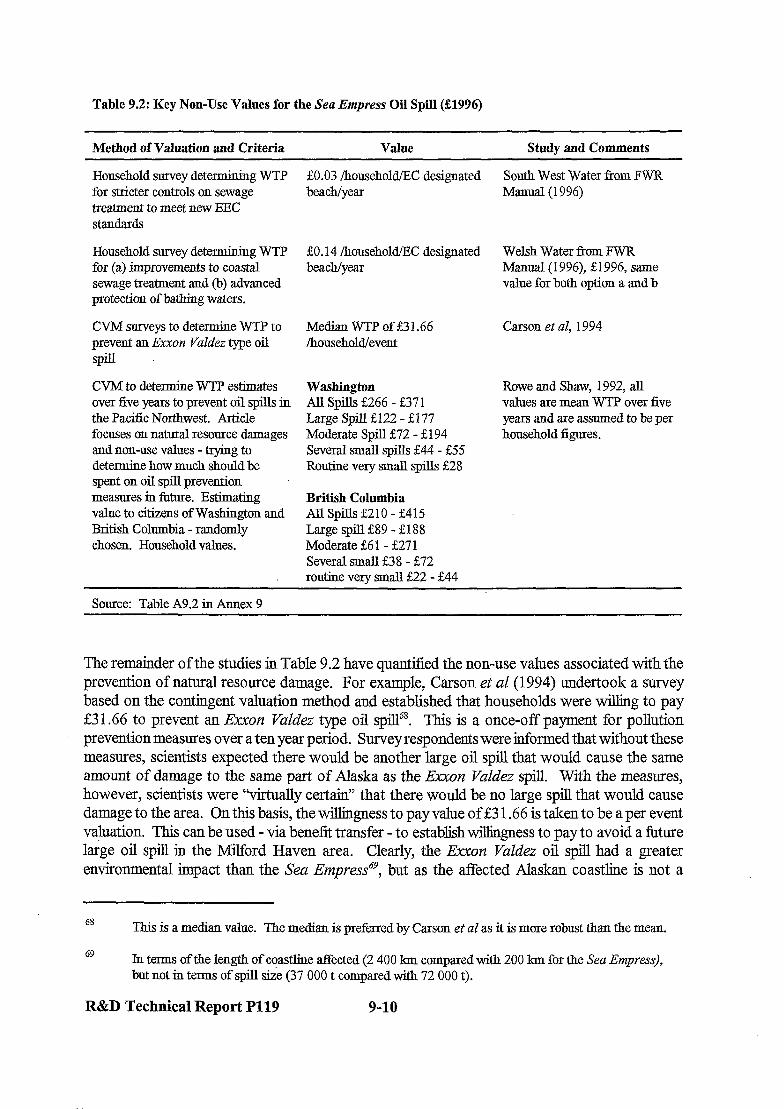
Table 9.2: Key Non-Use Values for the Sea Empress Oil Spill (33996)
Method of Valuation and Criteria Value Studs and Comments
Household survey determining WTP for stricter controls on sewage treatment to meet new EEC standards
Household survey determining WTP for (a) improvements to coastal sewage treatment and (b) advanced protection of bathing waters.
CVM surveys to determine WTP to prevent an Exxon YaZdez type oil spill
CVM to determine WTP estimates over five years to prevent oil spills in the Pacific Northwest. Article focuses on natural resource damages and non-use values - trying to determine how much should be spent on oil spill prevention measures in future. Estimating value to citizens of Washington and British Columbia - randomly chosen. Household values.
SO.03 /household/EC designated South West Water from FWR beach/year Manual (1996)
50.14 /household/EC designated beach/year
Median WTP of 231.66 /household/event
Washington All Spills &266 - &37 1 Large Spill &122 - &I 77 Moderate Spill &72 - &194 Several small spills 544 - &55 Routine very small spills 228
British Columbia All Spills 2210 - S415 Large spill &89 - &X 88 Moderate $6 1 - &27 1 Several small 238 - f72 routine very small &22 - &44
Welsh Water from FWR Manual (1996), &1996, same value for both option a and b
Carson et al, 1994
Rowe and Shaw, 1992, all values are mean WTP over five years and are assumed to be per household figures.
Source: Table A9.2 in Annex 9
The remainder of the studies in Table 9.2 have quantified the non-use values associated with the prevention of natural resource damage. For example, Carson et al (1994) undertook a survey based on the contingent valuation method and established that households were willing to pay &3 1.66 to prevent an Exlcon Valdez type oil spiP. This is a once-off payment for pollution prevention measures over a ten year period. Survey respondents were informed that without these measures, scientists expected there would be another large oil spill that would cause the same amount of damage to the same part of Alaska as the Emon Valdez spill. With the measures, however, scientists were “virtually certain’ that there would be no large spill that would cause damage to the area. On this basis, the willingness to pay value of &3 1.66 is taken to be a per event valuation. This can be used - via benefit transfer - to establish willingness to pay to avoid a future large oil spill in the Milford Haven area. Clearly, the Exxon Valdez oil spill had a greater environmental impact than the Sea Empress6p, but as the affected Alaskan coastline is not a
65
69
This is a median value. The median is preferred by Carson et al as it is more robust than the mean.
In terms of de length of coastline afkted (2 400 km compared with 200 km for de Sea Empress), bat not in terms of spill s&e (37 000 t compared with 72 000 t).
R&D Technical Report P119 9-10

common recreation site, the WTP value is unusually specific in its representation of a non-use value for avoiding large oil spills.
Another similar study found the citizens of Washington and,British.Columbia willing to pay up to ~2415 per household over a five year period to avoid naturalresource damages from all future oil spills(Rowe and Shaw, 1992). For specific spills, the.values range from &22 .for a very small ‘, routine spill, to &188 for a large spill. In this regard, the Sea Enzpress oil, spill is taken to be most closely related to a ‘moderate impact’ spill which would occur once every five years an kill 40 000 .I seabirds and, kill or injure- a few mammals,
Given the above value estimates, non-use .values :wh.ich may be associated with preventing an oil spill such- as the Sea Empress have been estimated. . ..The .transfer values’ assumed and the associated results are set out in Table 9.3. The populations selected for analysis were those most appropriate to the nature of the WTP estimates, and the resultant estimates of non-use value are presented as per. event values. It can be seen that the&gures range from a-lower bound of-222.5 million to an upper bound of 235.4 million. The lowerbound figure represents the WTP of the population in Dyfed to prevent a moderate impact spill, while the upper bound value represents the.WTP of the Welsh population to prevent an Exxon Valdez typespill along the Welsh coast.
Table 9.3: Estimates of the Non-Use Value of the Sea Empress Oil Spill ($1996) :
Approach Population Vdue+ Total Value..
Description Size Units & !Z million
WTP to protect EC. designated beaches
WTP to avoid a . . moderate sized spill
WTP to avoid an Exxon Valdez type oil spill
Households 1 119 000 &/household 0.14 30.2 in Welsh /EC designated
Water Region beach/year
Households 135 677 &/household :: 166 22.5 in Dyfed 15 years
Households 1 ,119 000 &/household 3X.66 35.4 in Great /event Britain I
l a WTP to protect EC designated beaches: 23 EC designated beaches were impacted in the affected area. A per annum value was estimated and discounted over the event frequency (i.e. 12 years); WTP to avoid a moderate oil spill: the value is the average of the range.given in Table 9.2; ,WTP to avoid an Exxon Valdez type oil spill: the value of 53 1.66 is a once off payment over 12 years.
R&D Technical Report P119 9-l-l

R&D Technical Report P119 9-12
10. HUMAN HEALTH EFFECTS
10.1 Introduction ..
The vapour cloud resulting from the Sea Empress oil spill had the,potential to impact the health of workers involved in the clean-up and the general health of the local population.. ,Evidence from the. spills. arising fi-om the ~Exxon ,YaZdez. and .the. Braer has indicated that, for the general population, both acute and chronic physical and psychological effects could be of concern. With respect to the clean-up workers, exposure to vapour would result in similar concerns but exposure. would, have been limited through the use of personal protective equipment.
10.2 Acute .Physical Effects of-Oil Vapour on the‘Genera1 Population
102.1 The Nature of the Effects
The.Sea Empress
The acute physical effects of the oil spill on the health of the local population have been examined in a study for Dyfed Powys Health Authority @PHA);which is reported in Lyons et al (1996). The study compared the health of exposed populations (in Milford Haven, Pembroke,Dock, Tenby and Saundersfoot) with those of a control group (from Aberaeron and Fishguard) over the period 16 February to 16 -March- 1996 (i.e: the month following the grounding of the-Sea Empress).
The study showed an increase of acute physical symptoms in the exposed population following- the oil spill, including nausea., sore throat and skin rash. The range of symptoms are set out ,in Table 10.1 overleaf,- which also-provides data on their prevalence in terms of an odds ratio. -An odds ratio is a measure of how common an event is in one-group compared with another. Thus, Table 10.1 reveals that while 112% of the control population experienced a headache during the period of the study, almost four times7’ as many (or 47%) of the exposed population experienced : a headache during this time.-
Comparison with Other Studies ..
There have been criticisms of the above study, with some contending that the study is-flawed with. respect to the survey instrument, approach and timing.~. For example, the-eight week delay between the spill and the survey is reported to have reduced the robustness of the survey (pers. comm.). It is therefore useful to compare the findings of the Sea Empress study with those for other oil spills.
The short-term effects ofthe Braer oil spill have been examined by a study which questioned the . . exposed population about their health’after the spill In the five months after the.spill, the exposed population experienced an increased rate of some symptoms when compared with the control .. group including weakness, eyesight problems, and.breathlessness (Campbell et al, 1994).
70 Using Odds Ratio .A from Table 10.1:
R&D,Technical Report P119 10-l .’ /
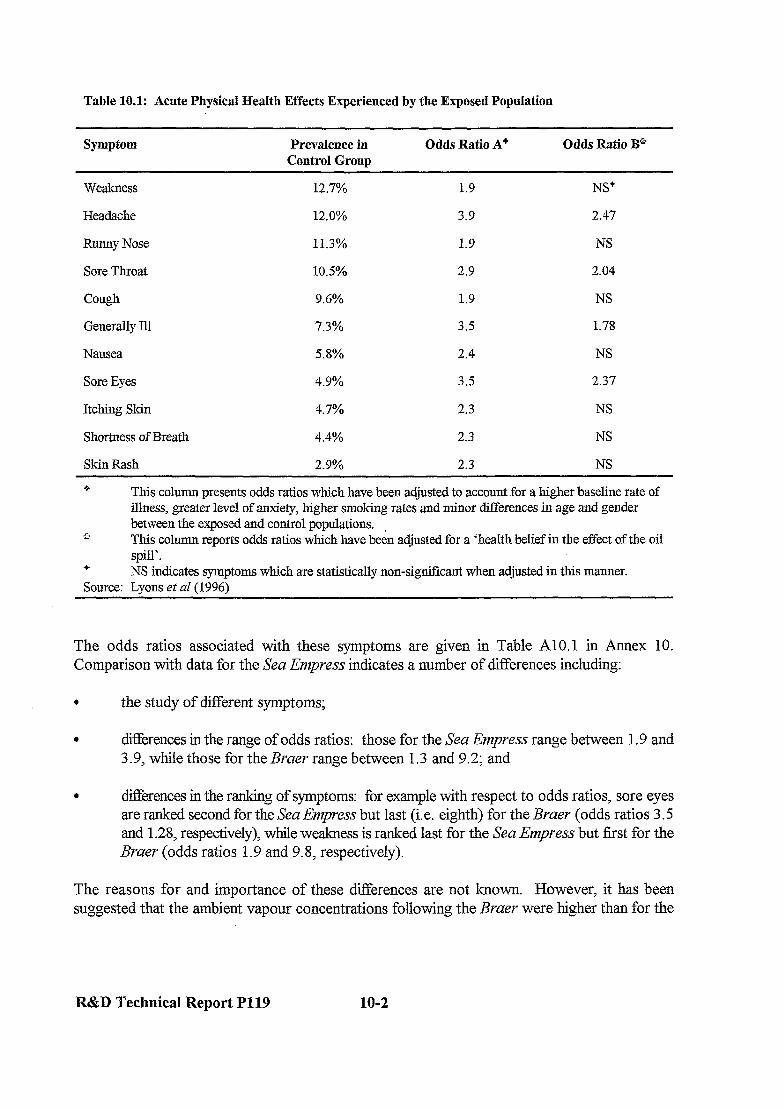
Table 10.1: Acute Physical Health Effects Experienced by the Exposed Population
Symptom Prevalence in Control Group
Odds Ratio A* Odds Ratio B*
Weakness
Headache
Runny Nose
Sore Throat
cough
Generally Ill
Nausea
Sore Eyes
Itching Skin
Shortness of Breath
Skin Rash
12.7%
12.0%
11.3%
10.5%
9.6%
7.3%
5.8%
4.9%
4.7%
4.4%
2.9%
1.9
3.9
1.9
2.9
1.9
3.5
2.4
3.5
2.3
2.3
2.3
NS+
2.47
NS
2.04
NS
1.78
NS
2.37
NS
NS
NS
* This column presents odds ratios which have been adjusted to account for a higher baseline rate of illness, greater level of anxiety, higher smoking rates and minor differences in age and gender between the exposed and control populations.
B This cohnnn reports odds ratios which have been adjusted for a ‘health belief in the effect of the oil spill’.
+ NS indicates symptoms which are statistically non-significant when adjusted in this manner. Source: Lyons ef al (1996)
The odds ratios associated with these symptoms are given in Table A10.1 in Annex 10. Comparison with data for the Sea Empress indicates a number of differences including:
l the study of different symptoms;
. diE&-ences in the range of odds ratios: those for the Sea Empress range between 1.9 and 3.9, while those for the Braer range between 1.3 and 9.2; and
. difl’erences in the ranking of symptoms: for example with respect to odds ratios, sore eyes are ranked second for the Sea Empress but last (i.e. eighth) for the Braer (odds ratios 3.5 and 1.28, respectively), while weakness is ranked last for the Sea Empress but first for the Braer (odds ratios 1.9 and 9.8, respectively).
The reasons for and importance of these differences are not known. However, it has been suggested that the ambient vapour concentrations following the Bruer were higher than for the
R&D Technical Report P119 10-2
Sea Empress. This is due to the severe weather conditions in the Shetlands which resulted in 40% of the oil being lost as a volatile fi-action71 (pers. comm.).
However, the DPHA study does present two sets of odds ratios (A and B), with the:second set being adjusted to takeinto account a “health belief in the effects of the oil spill’? This second set of odds ratios will be used to develop a lower bound, estimate of the health effects of the oil spill,’ and thus to account for criticisms of the DPHA study.
lOi2.2 The Approach to Vtiluation
To value the acute physical impacts of the Sea Empress oil spill on the generalpopulation, data are required on:
. the size of the exposed population; l the duration of each illness;. . estimates of w-illingness to pay (WTP) to avoid illness; . working days lost through illness; and 1.1. . health care costs.
10.2.3 The Size of the -Exposed Population ,:
Exposure.Via. Oiled Beaches
The authors of the,DPHA report have indicated that theexposed population can be considered i c to equal those living on the coastline affected by.the oil spill (from Wooltack Point ,in the west to .. the Three Rivers Estuary in the east); extending as far as one kilometre from the shore.,. Using this assumption and 1991 census data for-the area+ the exposed population has been estimated to be. 25 500. This is one of the figures used to calculate the human health costs associated with the Sea Eqress incident.
Exposure Via Vapour Cloud
A different exposed population has been estimated based on the concentration of certain volatile organic compounds (VOCs) resulting directly from- the pool. of oi17* released from the Sea Empress. The Environment Agency commissioned a-study to determine the concentration of five VOCs over the period from 15 to 22 February .1996 .(Carruthers and Ellis, 1997). It has been suggested that for-two of these VOCs, ethyl benzene and xylene, some symptoms can be expected to have resulted wherever the odour threshold for these compounds was reached (see Table’ A10.2 for details of odour thresholds and associated text). The land area over which odour threshold concentrations-w-ere detected reached as far as 13. and 17 kilometres inland (generally north and. .: northeast of the city of Milford Haven) for ethyl benzene and xylene, respectively. Given that the. larger xylene cloud completely overlapped the ethyl benzene cloud; the exposed population using
71 In the seven days after the Braer, the release of volatile organic compounds (VOCs) was equivalent to 1% of the total annual release of VOCs in the UK.
72 Data on vapour concentrations resulting from oil on the beaches was not available.
R&D Technical Report P119 10-3
this approach was based on the extent of the xylene cloud and has been estimated (again using 1991 census data) to be 37 500. This figure was also used to calculate the human health costs associated with the Sea Empress incident.
It is important to note, however, that exposure to VOCs is expected to result in some, but not all, of the symptoms reported in the DPHA study. For example, it is expected that headaches may result, but probably not itchy skin. It was therefore assumed that exposure to the vapour clouds resulted in only two of the symptoms identified in the DPHA study, namely headaches and nausea.
10.2.4 The Duration of Illnesses
Information on the actual duration of illnesses were collated as part of the DPHA study; however, these data are reported to be limited (pers. comm.). In the absence of these data, the Consultants approached the Department of Health for average duration figures. However, none were available. In the absence of information in the average duration of symptoms, to be conservative, it will be assumed that each symptom lasted only one day.
10.2.5 Valuation Data
‘Willingness to Pay’ Values
Data on WTP to avoid morbidity effects of the type experienced following the Sea Empress oil spill are reported in Table A10.3 of Annex 10. This presents a range of values which were derived from selected studies to indicate willingness to pay for reductions in air pollution. The values vary according to the type of symptom and, in most cases, duration of illness. As can be seen in this table, for some symptoms (e.g. headache), more than one value is given. To be conservative, values used in this analysis are the lowest values for a symptom lasting one day. For those symptoms identified in the DPHA report for which no WTP values were available (i.e. weakness, generally ill, itching skin and skin rash), the lowest value for a symptom lasting one day f&6) was applied.
It should be noted that the studies which generated these WTP values were conducted in the US, and there are problems associated with transferring these values from the US to the UK. For example, exchange rates do not always reflect purchasing power; thus, a similar study conducted in the UK may lead to significantly different values. However, in the absence of similar data generated in the UK, these values have been applied here.
Working Days Lost and Health Care Costs
In terms of the costs associated with working days lost and the provision of healthcare, the DPHA study collated information on the type of medical help sought for each of the above symptoms. However, these data have not been analysed and are not available for use in this study. In the absence of such data, the Department of Health was approached but could not assist either.
Without these data, it is not possible to estimate the costs associated with working days lost and the provision of healthcare. However, given the fairly minor nature of these symptoms, the number of days taken off work and the number of visits to the doctor should have been minimal.
.
R&D Technical Report P119 10-4
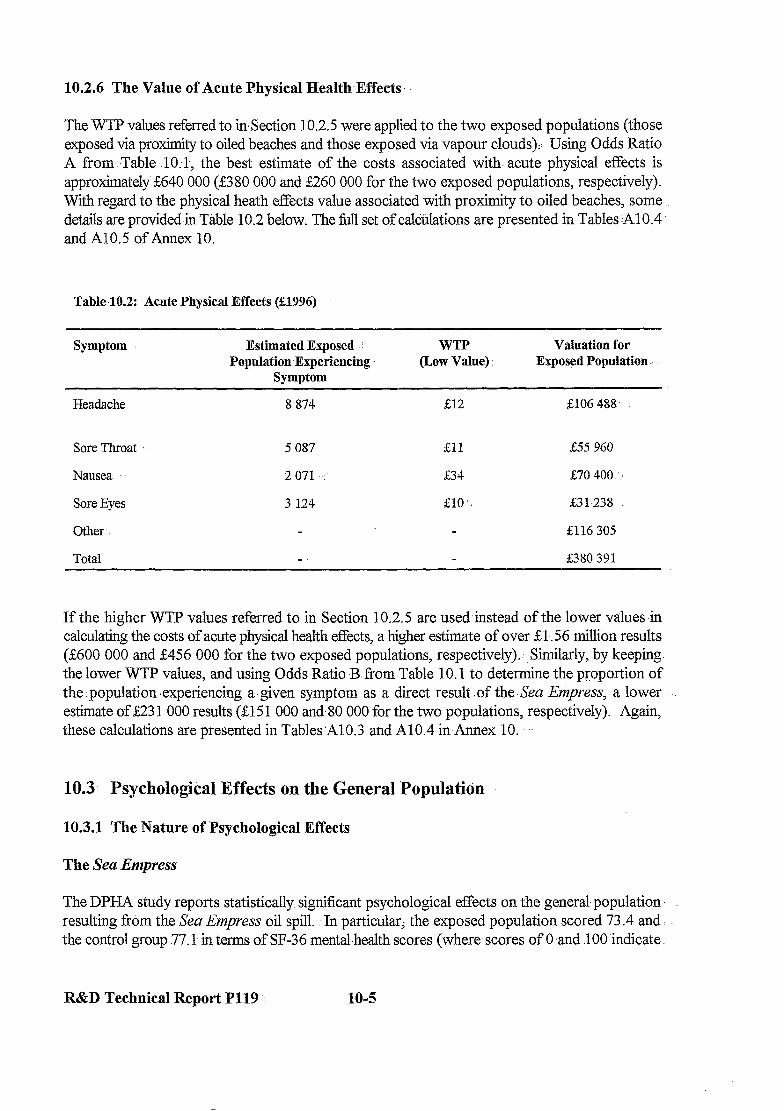
10.2.6 The Value of Acute Physical Health-Effects
The WTP values referred to in,Section 10.2.5 were applied to the two exposed populations (those exposed via proximity to oiled beaches and those exposed via vapour clouds):: Using Odds Ratio A from Table .lO. 1, the best estimate of the costs associated with- acute -physical effects is approximately”&640 000 (&380 000 and &260 000 for the two exposed populations, respectively). With regard to the physical heath effects value associated with proximity to oiled beaches, some details are provided-in Table 10.2 below. The full set of caltiulations are presented in Tables jAl0.4 and A10.5 of Annex 10.
Table.102 Acute Physical Effects (#3996)
Symptom Estimated Exposed :I Population Experiencing
Symptom
WTP Valuation for (Low Value). Exposed Population
Headache 8 874 212 ~5106 4%
Sore Throat 5 087 &I1 255 960
Nausea 2 071.’ &34 &70 400.
Sore Eyes 3 124 &lo., &31-238
Other-. 5116 305
Total _ 5380 391
If the higher WTP values referred to in Section 10.2.5 are used-instead of the lower values in calculating the costs of acute physical health effects, a higher estimate of over &l .56 million results (2600 000 and &456 000 for the two exposed populations, respectively). ~Similarly, .by keeping. the lower WTP values, and using Odds Ratio .B.from Table 10.1 to determine the proportion of the.population .experiencing a’given-symptom as a direct result .of the-Sea Enipress, a lower estimate of &23 1 000 results (215 1 000 and.80 000 for the two populations, respectively). Again, these calculations are presented in Tables’A10.3 and A10.4 in Annex 10. ..
10.3 Psychological Effects on the General Populatidn
10.3.1 The Nature of Psychdogical Effects
The Sea Empress
The DPHA study reports statistically. significant psychological effects on the general population. resulting from the Sea Empress oil spill:. In particular, the exposed population scored 73.4 and. the control group .77.1 in terms of SF-36 mental.health scores (where scores of 0 and 100 ‘indicate
R&D Technical Report P119 : 10-5

poor and good mental health respectively). In other words, the psychological health of the exposed population was 4.8% lower than that of the control group.
Comparison with Other Studies
Studies of other oil spills have also identified psychological effects. For example:
. Braer: of those exposed to the Braer oil spill, 24% scored above the level at which a subject could be considered a cccase” compared with 3% of controls (Campbell et al, 1994); and
. Ewwn Valdez: comparison of exposed and control populations indicates odds ratios of 2.0 for post-spill post-traumatic stress disorder (PTSD) and generalised anxiety disorder (GAD) and an odds ratio of 1.8 for depression following the spill” (Palinkas et al, 1993a).
Unfortunately, these studies do not use the same units of measure as that for the Sea Empress, thus results are not directly comparable. All that can be said is that effects such as these have been found for oil spills other than the Sea Empress.
10.3.2 The Approach to Valuation
Stress induced by a disastrous occurrence (flood, fire, etc.) can be related to health damaging effects such as reduced immune system response and increased susceptibility to certain illnesses. A stress model has been developed to assign a monetary value to the stress resulting from the Sea Empress incident. The starting point for this model is the Social Readjustment Scale (Allee et aZ, 1980). This defines stressful events in relation to other stressful events, with the mean value of 100 being the maximum level of stress (defined as ‘death of a spouse’), decreasing to events such as divorce (mean value of 73), personal injury or illness (mean value of 53) and change in living conditions (mean value of 25).
The Social Readjustment Scale was applied in a subsequent study (Floyd et al, 1997) to determine the relative stress associated with flooding. Flooding was considered to have a relative impact on an individual’s life similar to a ‘change in living conditions’, and was thus given the same mean value of 25. It is believed that an event such as an oil spill would rank similarly on this scale.
Department of Transport figures (DOT, 1996) suggest a casualty value of &7 170 for a minor injury, where this value reflects the human costs associated with a casualty, such as lost output, pain, grief and suffering, medical costs, and emergency services. Of this, DOT figures indicate that roughly 75% of the value relates to the human costs associated with pain, grief and suffering. No further breakdown is provided on what proportion of human costs could be attributed to a willingness to pay to avoid pain versus grief versus suffering, however. Given that pain, grief and suffering can give rise to stress, it is believed reasonable to assume that around 20% of willingness
73 Certain social and cuh.ral factors were found to influence the prevalence of these disorders. Factors tested were ethnic origin (i.e. Alaskan Natives or non-Natives), gender and age. Only in those over 44 were no significant associations found between eLxposure and any of the disorders.
R&D Technical Report P119 10-6
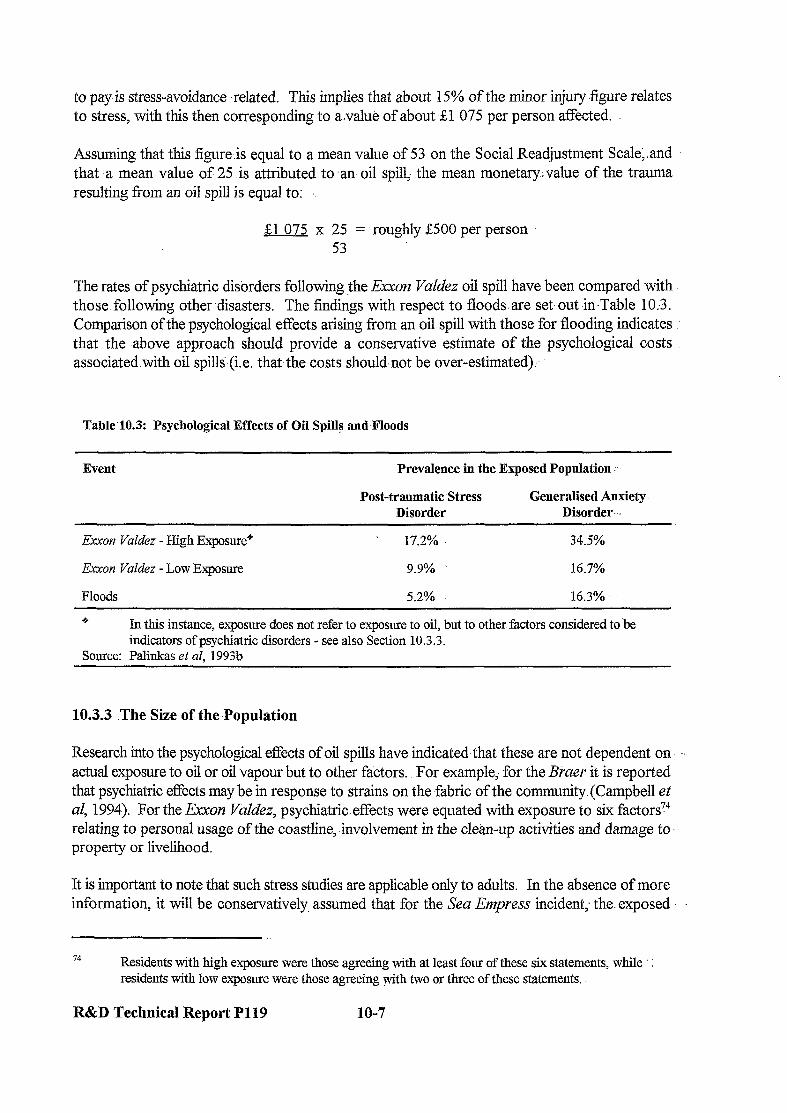
to pay is stress-avoidance ,related. This implies that about 15% of the minor injury figure relates to stress, with this then corresponding to a,value of about &l 075 per person affected.
Assuming that this figureis equal to a mean value of 53 on the Social Readjustment Scale,.and that a mean, value of 25 .is attributed to ‘an oil spill, the mean monetary.value of the trauma resulting from an oil spill is equal to:
&l 075 x 25 = roughly &500 per person 53
The rates of psychiatric disorders following the Exxon Valdez oil spill have been compared with those.following other-disasters. The findings with respect to floods.are set- out in.Table 10,3. Comparison of the psychological effects arising from an oil spill with those for flooding indicates that the .above approach should provide a conservative estimate of the psychological costs associated.with oil spills (i.e. that the costs should.not be over-estimated);
Table 10.3: Psychological Effects of Oil Spills and Floods
Event Prevalence .in the Exposed Population
Post-traumaticStress Generalised Anxiety Disorder Disorder-..
l!tkcon VaZdez - High Exposure* 17.2% 34.5%
IIikxon Valdez - Low Exposure 9.9% 16.7%
Floods 5.2% 16.3%
9 In this instance, exposure does not refer to exposure to oil, but to other. factors considered to.& indicators of pvchiatric disorders - see also Section 10.3.3.
Source: Palinkas et al, 1993b
10.3.3 The Size of the.Population
Research into the psychological effects of oil spills have indicated.that these are not dependent on. .. actual exposure to oil or oil vapour-but to other factors.. For example, for the Braer it is reported that psychiatric effects.may be in response to strains on the,fabric of the community (Campbell et al, 1994). For the Exxon VaZdez, psychiatric. effects were equated with exposure to six factorsT4 relating to personal usage of the coastline, .involvement in the clean-up activities and damage to. property or livelihood.
It is important to note that such stress studies are applicable only to adults. In the absence of more information, it will be conservatively. assumed that for the Sea Empress incident,. the..exposed
74 Residents with high exposure were those agreeing with at least four of these six statements, while residents with low exposure \vere those agreeing yith two or three of these statements.
R&D Technical Report P119 10-7
population for psychological effects is 10% of adults living in the wards along the oiled coastline. This has been estimated to equal 3 800 adults.
10.3.4 The Value of Psychological Health Effects
Given that the exposed population is assumed to be 3 800 adults and that the costs associated with stress-related psychological effects is estimated at &500 per person, the total economic value of these effects is estimated at:
3 800 people x &500 = &1.9 million
A lower bound for the costs of psychological effects can be estimated by applying halfthe mean value from the Social Readjustment Scale, which suggests that the stress related to an oil spill is significantly less than that related to a change in living conditions (with this potentially reflecting differences in the length of time which an individual might be affected). Applying a mean value of 12.5 to the calculation presented above gives a ‘per person’ value of E250, which over the affected adult population of 3 800 yields a lower bound estimate of go.95 million.
10.4 Other Effects on the General Population
To prevent injury arising from a feared gas explosion on board the Sea Empress, the local lighthouse and surrounding cottages were evacuated (Hooke, 1996). Fortunately, no gas explosion occurred. However, had one occurred, the costs associated with it would have increased costs of the incident.
With respect to the medium term, a study of the Braer oil spill found that five months afier the spill, the health of the exposed and control populations was similar, though probable upper respiratory infection was detected (Campbell et al, 1994). This implies that any medium-term health impacts arising t?om the Sea Empress incident are likely to be minor.
There has been a follow-up to the DPHA study to identify chronic physical and psychological symptoms resulting from the Sea Empress oil spill. However, the results were not available within the time-frame of this analysis. Without additional information, it is not possible to draw’any conclusion concerning the longer term chronic effects of the oil spill.
10.5 The Effects of the Sea Empress Oil Spill on the Health of Workers
10.51 The Clean-Up dperation
At its peak, over 1 100 workers, including contractors, council workers and volunteers, were involved in the on-shore clean-up of oil spilt from the Sea Empress. Risks associated with the clean-up included those associated with contact with oil, inhalation of oil vapour and the use of dispersants. With respect to the last of these, “excessive exposure” can cause irritation to the eyes, skin, nose and throat (IMPCU, 1996).
R&D Technical Report Pl19 10-a
The worker safety aspects of the clean-up operation -were reviewed by the .Health & Safety Executive (HSE) in March 1996;: An HSE nurse from the Employment Medical Advisory Service (EMAS) visited the area site on 1/3/97.and reported on the findings of this visit in a letter to Pembrokeshire-County Council dated 12/3/97. The letter indicated that a COSHH (Control,of Substances Hazardousto Health) assessment.was needed and that few health precautions were being taken., the main problems being skin contamination.and. ingestion (pers. comm.). For example, some sites had no washing, facilities, the gloves in use werenot suitable for oil, overalls were contaminated and there was little first aid provision. HSE also set out a five-point- plan for action which-included the following requirements:
0 the provision of instructional -information for all workers on risk and safety; . the use of neoprene or other suitable gloves; l the provision of overalls suitable for intended use; . the provision of suitable: welfare facilities, such as washing .facilities; and I the provision of first aid facilities.
The above indicates that improvements could.have been made to health:and safety provisions for’ clean-up workers: at least at the start of the clean-up operation [and this is a view which is -shared : by a study on the effectiveness of .the clean-up .operations (Maritech, 1997)]. However,. the, situation improved at the beginning of April when Pembrokeshire County Council (the new unitary authority) appointed a consultant to undertake risk assessments of the clean-up operations (pers. comm.). After this time,.there was a “noticeable improvement in the frequency and quality of risk. assessments” (Maritech, 1997).
More generally, it appears that while the health and safety aspects of the clean-up were well managed at the very start of the incident, the expansion of the clean-up to many beaches resulted in a detilinein standards.. For example; it is reported that (pers. comm.):
. health: and safety provisions were good initially, especially where controlled by-the oil refineries, and particularly Texaco. Workers were protected, the clean-up was well managed and oil vapours were monitored;
. as the clean-up operations expanded and on site-control moved out ofthe hands of the oil refineries, health and safety standards began to decline; and
. as contractors took over the clean-up; : standards declined further. in’ some. areas. For. example, w-ashing facilities were not available at every beach, thus it was difficult to ensure that adequate-hygiene procedures were followed.
It is also reported that -workers were not using their .personal protective equipment (PPE) correctly. For example, gloves-were in pockets and masks were not worn, or, if they were, visors were not- down.
The deficiencies in the management of health. and safety issues- have been t%lly recognised by Government (Mar&tech;- 1997): The experience gained as a result of the Sea Empmss clean-up led to the Marine.Pollution.Control Unit (MPCU) issuing a drawl Scientific, Technical and Operational
R&D Technical Report P119 .’ 10-g.
Advice Note l/97 (i.e. a STOp Notice) on Health and Safety During Shoreline Clean-Up Following an Oil Spill.
10.5.2 Reported Effects
The Nature of Effects
Around 100 workers were included in the DPHA survey of the general public although these data have not been analysed. Further efforts have been made by DPHA to research health effects on workers. However, not enough workers came forward to provide a sufficient sample and the study was not undertaken.
With respect to the nature of effects, there is anecdotal evidence of both physical and psychological impacts to workers involved in the clean-up. For example (Gates, 1996):
. there were reports of both skin and respiratory symptoms including the development of asthma; and
. the stress ofthe incident is reported to have contributed to the suicide of an oil company manager involved in the clean-up (although it is thought that this individual was involved in organising part of the clean-up and was not in physical contact with the spill).
In addition, consultation has indicated symptoms such as headaches, skin irritation and rashes amongst workers.
The Cause of Effects
The question has been raised as to whether the presence of oil caused the above impacts, or whether other factors were important. Concentrations of VOCs on the beaches were monitored by Texaco at the start of the clean-up. Samples taken over 500 minutes at Kilpaison beach on 24 February 1996 indicated (pers. comm.):
l benzene levels of 0.1 mg/m3 compared an occupational exposure limit (OEL) of 16 mg/m”; and
. toluene levels 0.1 mg/m3 compared with an OEL of 192 mg/m3.
Concentrations were thus well below the OELs and, for benzene, well below the odour threshold (the odour threshold for toluene is not known). Concentrations of ethyl benzene and xylene on this date are not known; however, if these were at a similar level to the two assessed VOCs, then odour thresholds would have been exceeded. This may have been the case as “the smell of oil” was reported to be an issue associated with the clean-up in some instances.
Some contest that the presence of oil was not the problem with illness being due more to a “hygiene breakdown” (i.e. unnecessary exposure), and perhaps to dispersants (pers. comm.). In addition, in cleaning the beaches of oil, some -workers were exposed to other hazardous substances. For example, cleaning at Scotch Bay (a small rocky bay to the east of the entrance
R&D Technical Report P119 10-10
to Milford Haven docks) was stoped after workers reported ill health and blue asbestos was found in rubbish at- the head of the:beach (MECU, 1996):
10.5.3 Valuing Effects
In-the- absence of data on the nature and number of symptoms experienced by the clean-up workers, it is not possible to value these effects using WTP values: Neither are data available on working days lost or health care costs, With-respect to the former, the information available from one organisation which supplied workers for the clean-up indicates that there was no ,long-term sickness as a result of the Sea Empress incident. In addition, although there was some short-term illness amongst workers, there was a tendency not to report this or take sick leave due to an : unwillingness to miss out-on the opportunity of overtime work.
10.6 Summary of Health Costs
Valued and unvalued health costs are set out in.Table 10.4.
Table 10.4: Summary of Health Costs (33996; $millions)
Description Low Middle High Comment on Unvalued Costs
Acute impacts to the General population
Psychological Effects to the General Population
Chronic Effects to the General. Population . .
0.23 0.64 1.06
0.95 1.9 1.9
Impacts to Workers
Likely to be minor
Costs limited due to de limited number of workers involved (i.e. 1 000 workers)
Total 1.18 2.54 2.96
R&D Technical Report P119 -. 10-11

R&D Technical Report P119 10-12
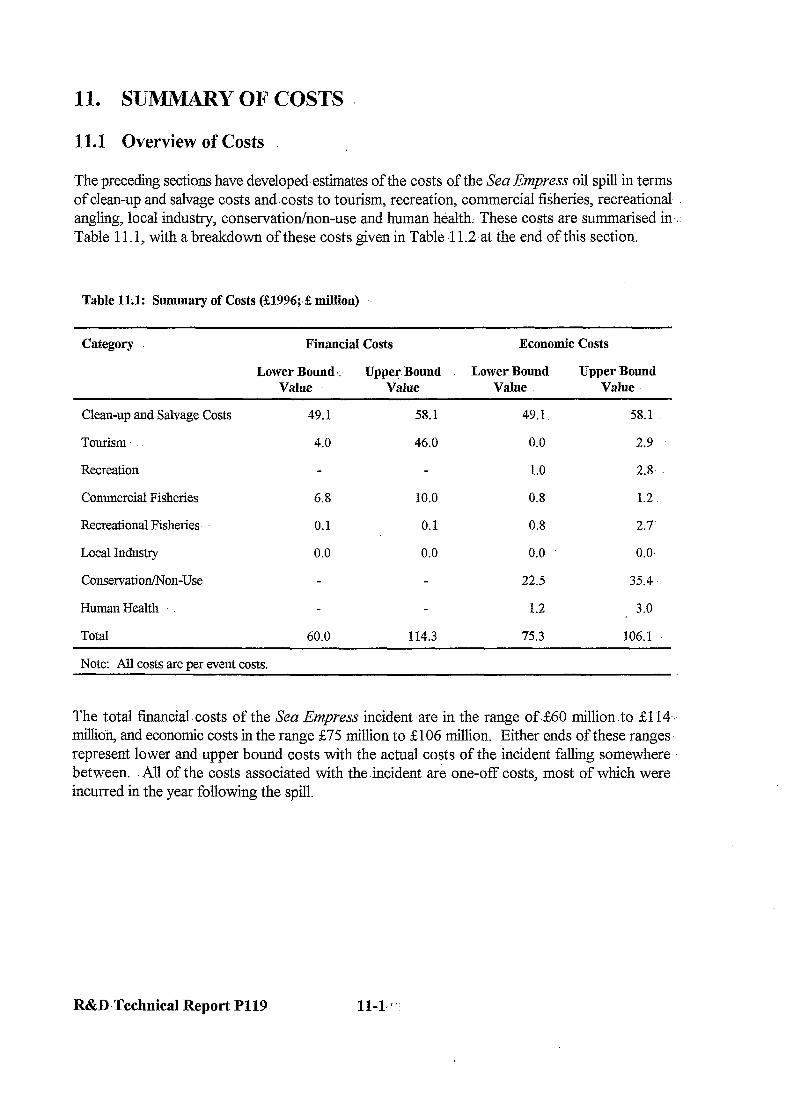
11. SUMMARY OF COSTS
11.1 Overview of Costs .
The preceding sections have developed-estimates of the costs of the Sea-Empress oil spill in terms of clean-up and salvage costs and costs to tourism, recreation, commercial fisheries, recreational angling, local industry, conservation/non-use and human health. -These costs are summarised in,. Table 11.1, with a breakdown of these costs given in ,Table 11.2 at the end of this section.
Table 11.1: Summary of Costs (33996;.% million)
Category Fiuancial Costs Economic Costs
Lower Bound ,_ Upper Bound Lower Bound Upper Bound Value Value Value Value
Clean-up and Salvage Costs
Tourism’
Recreation
Commercial Fisheries
Recreational Fisheries
Local Industry
Conservation/Non-Use
Human Health
TotaI
Note: All costs are per event costs.
49.1 58.1
4.0 46.0
6.8
0.1
10.0
0.1
0.0 0.0
60.0 114.3
49.1 58.1
0.0 2.9
1.0 2.8
0.8 1.2.
0.8 2.7.
0.0 0.0,
22.5 35.4
1.2 3.0
75.3 106.1
The total -financial.costs of the Sen Empress incident -are in the range of.&60 million.to 2114:: million, and-economic costs in the range $75 million to HO6 million. Either ends of these ranges represent lower and-upper bound costs with the actual costs of the incident falling somewhere between. All of the costs associated with the .incident are one-off costs, most of which were. incurred in the year following the spill.
R&D-Technical Report P119 11-l. r ‘:
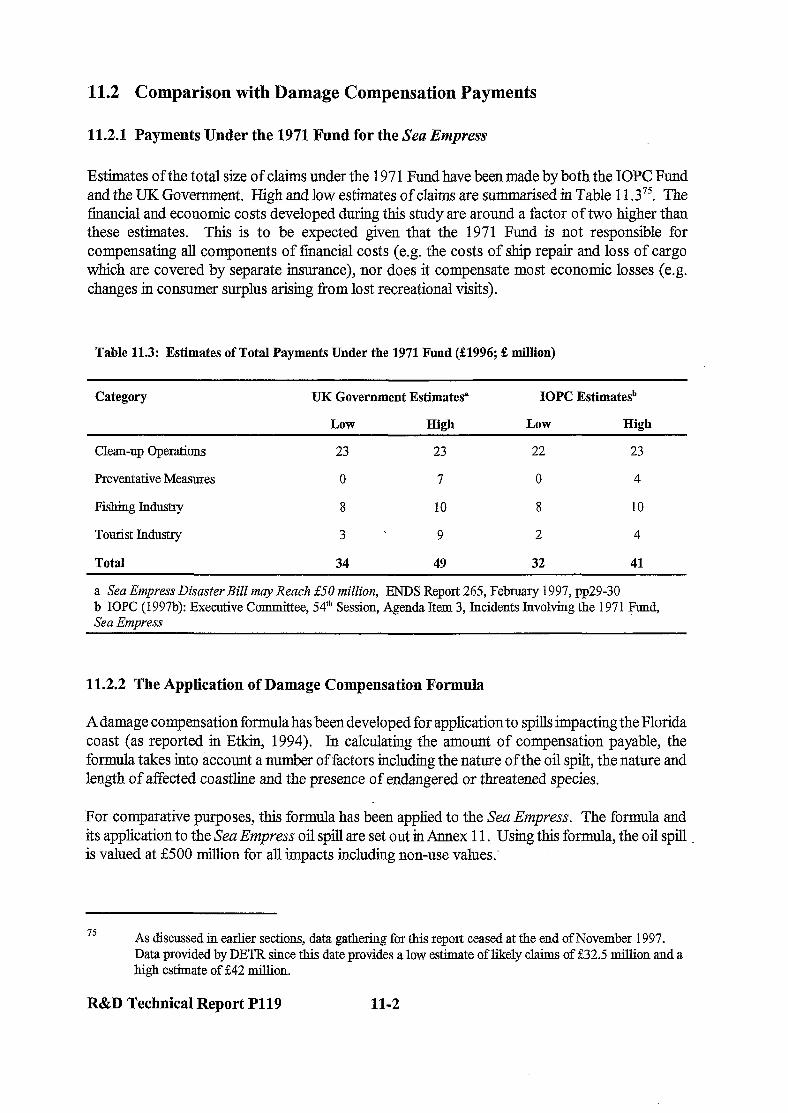
11.2 Comparison with Damage Compensation Payments
11.2.1 Payments Under the 1971 Fund for the Sen Empress
Estimates of the total size of claims under the 1971 Fund have been made by both the IOPC Fund and the UK Government. High and low estimates of claims are s ummarisedmTable 11.37j. The financial and economic costs developed during this study are around a factor of two higher than these estimates. This is to be expected given that the 1971 Fund is not responsible for compensating all components of financial costs (e.g. the costs of ship repair and loss of cargo which are covered by separate insurance), nor does it compensate most economic losses (e.g. changes in consumer surplus arising f?om lost recreational visits).
Table 11.3: Estimates of Total Payments Under the 1971 Fund (S1996; ds million)
Category UK Government Estimates” IOPC Estimate?
Low High Low High
Clean-up Operations 23 23 22 23
Preventative Measures 0 7 0 4
Fishing Industry 8 10 8 10
Tourist Industry 3 I 9 2 4
Total 34 49 32 41
a Sea Empress D&aster Bill may Reach f50 million, ENDS Report 265, February 1997, pp29-30 b IOPC (1997b): Executive Committee, 54ti Session, Agenda Item 3, Incidents Involving the 1971 Fund, Sea Emnress
11.2.2 The Application of Damage Compensation Formula
A damage compensation formula has been developed for application to spills impacting the Florida coast (as reported in Etkin, 1994). In calculating the amount of compensation payable, the formula takes into account a number of factors including the nature of the oil spilt, the nature and length of affected coastline and the presence of endangered or threatened species.
For comparative purposes, this formula has been applied to the Sea Empress. The formula and its application to the Sea Empress oil spill are set out in Annex 11. Using this formula, the oil spill is valued at &500 million for all impacts including non-use values.’
15 As discussed in earlier sections, data gathering for this report ceased at the end of November 1997. Data provided by DETR since this date provides a low estimate of likely claims of 232.5 million and a high estimate of $42 miilion.
R&D Technical Report Pl19 11-2
Annex 5 Contents:
Figure A5.1 Popular Sites-for Special Recreational-Interests
Table A5.1 Summary of Recreational Characteristics of Pembrokeshire’s Affected Beaches Table A5 2 Criteria for Ranking Beaches Table A5.3 Popularity of Affected Beaches Table A5.4 Number of Visits Affected-by the Oil Spill; by Month Table A5.5. Impacts of Oil Spill on Specifid Coastal Recreational-Activities Table ,A5 :6 General Recreation Use Values
R&D Technical Report P119 AS-3

Tablti 11.2: Su~nn~nrg of Costs (&lW6; & million)
Category Description Financhl Costs Economic Costs Comment
LOWl Upper Lolvel upp Boulltl Bountl Bound Boantl
Commercial Fishcrics
Loss 0Tfishing gear by Fislm~uen
Loss of income lo fisl~ermeii arising from opcralion of the FEZ
0.04 0.05
G.60 9.81.
Reductions in 111ar1cels
0.11 0.14
Recreational Fislierics
costs lo the Owners
and Leasers or Salmonid Fishing Righls
Costs to Sahonid Anglers
0.13
-
‘0.13
costs to Bass Anglers
Costs to other Sea Anglers
Oilier costs
-
0.04 0.05
0.66 0.98
0.11 0.14
0.13 0.13
Lower bomnd from 1971 Fund payments. Upper bound assumes around 20% of costs wcrc ut~coqcnsalcd.
Lower bound from 1971 Fund payments. Includes claims front :fisl~/sl~ellfisl~ processors and some costs associated with loss of gear. MAFP’s costs remain unvalued in the lower bound estimate. Upper bound estimate assumes costs are equal to upper limil of estimates of payments under the 1971 Fund nlinus all other costs.
Some of the lower bound costs may be included in those for the operation of the FEZ. Upper bound assullies some costs remain uncompensated by the 1971 Fund.
Lower bound costs are claims to the 1971 Fund for loss of income, refund of rod and menibership and exl~c~mx
0.56 0.95
0.06 1.38
0.01 0.28
Estimate of change in consumer surplus.
Estimate of change in consumer surplus.
Eslimate of change in consunler surplus.
Costs to operators of charter boats and costs associated with long-tern1 reductions in harvest rates remain unvalued.
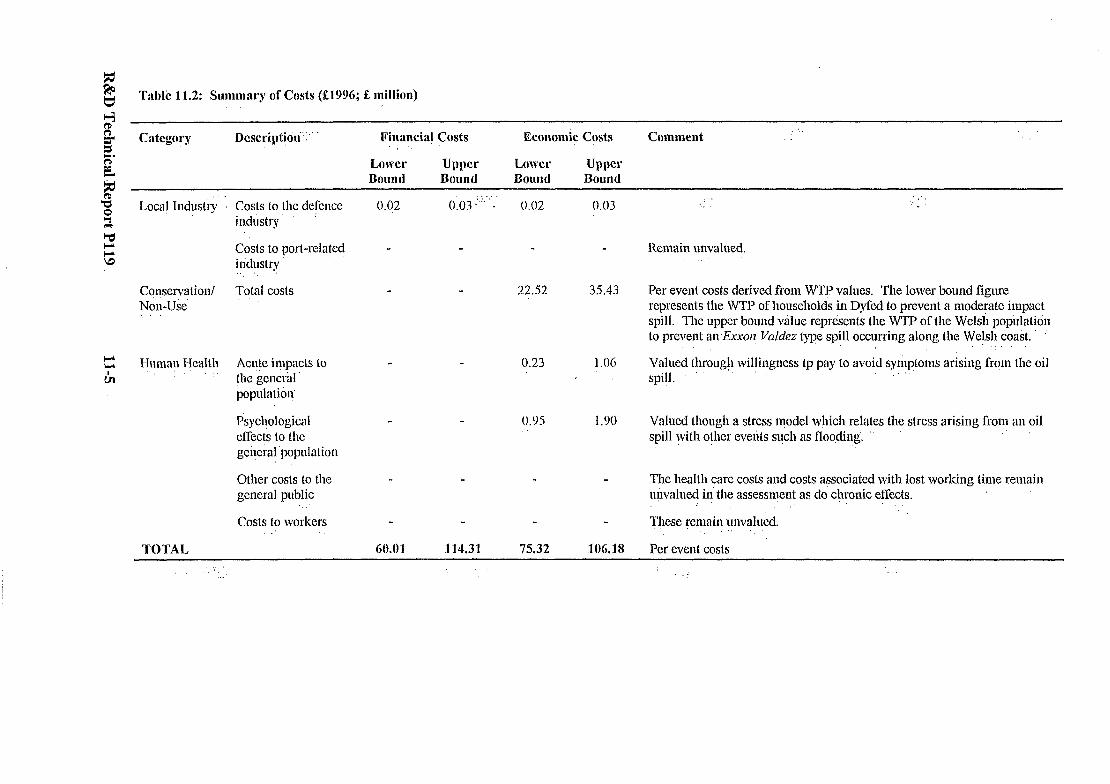
TaMi: 11.2: S~~ni~narg of Costs ($Il!M; & million)
Category Dcscriptiti~i’~” Pii~ancial Costs Economic Cgts Conwent
Lower Upp L,ower Upper Bollntl Bountl Bountl Bouncl
Costs to port-related industry ‘, :.
Cogxmalion/ Total costs Non-Use
22.52 35.43
Human Health Ac~!te ilj~pacls to ,. 0.23 1 .M ,‘,
111e ge11cral
population’
Psycl~ological 0.95 1.90 cffecls lo lhc
gei~cral’populalion
0111er costs to the
general public ‘,
Costs to workers .’
-
: ; .
‘, ; _
Per event costs derived from WTP values. The lower bound figure represents the WTP of households in Dyfed to prevent a moderate impact spill. The upper bound vhe reprkents the WTP of the Welsh populatidn to prevent an ECXOI~ Yultfez type spill occurring along the Welsh do&t. ’ ;,.,
Valued lhroug!l willingmss lp pay lo avoid syml~lon~s arising from the oil spill. .’
Valued though a slrcss n!odel which relates lhe stress arising from an oil spill with other evelits SL@I as ~oqding.
:
The health care costs altd costs associated with lost working time remain unvalued in the assessment as do chronic effects. .’ ..’
TOTAL, 60.01 114.31 75.32 SfMi.18 Per event cosls

R&D Technical Report P119 11-6
12. MARINE TRANSPORT RISKS
12.1 Overview
Every year, over 1.5 billion tonnes of oil (crude oil and oil products) is moved by vessels ranging in size from small barges to supertankers:
Every year (on average), there is a major spill comparable to that from the Sea Empress. Clearly, such spi& are associated with the movement of oil by large tankers ofwhich there are about 3000 in operation. In addition, there are many more smaller. spills and other incidents ~mvolving the,: marine transport of oil.
Data on spills and -incidents are gathered by various bodies at international, national and local levels. As a broad generalisation, the larger. the sp$ or incident, the more -likely it is to be reported.
The :purpose of this analysis is to review available data on reported spills and incidents in at international, national and local levels in order to determine, inter a&a:
. the likelihood of incidents similar~to that of the Sea Empress;
. the most likely causes of spillsand other incidents;
. whether the historical record for Milford Haven is significantly different than that for the UK national waters; and
. whether the historical record for the UK’national waters is significantly dif%erent than that. for marine transport of oil elsewhere.
Given the results of the analysis, a range of potential risk mitigation measures has been identified which are considered further in Section.1 3.
At the outset, it is important to stress that the analysis has been-severely hampered by a lack of available data.at national and local levels. .In particular:
. no information has been provided by the Milford Haven Port Authority -.which is perhaps not surprising given that the Authority is to be prosecuted by the Agency;
. at a national level, although summary statistics are published annually; detailed analysis of shipping movements in UK waters by Statistics Division, DETR (at.the request of the Consultants) has not been made available for .“legal reasons”; and
. similarly, although some summary data were-provided, details of tanker casualties in UK : waters were not provided until-January1 998 by the Marine Accident Investigation Branch. due to “problems with the data-base”.
Clearly, this lack of input ti-om those parties responsible for the collection and analysis of data on marine transport inUKwaters led to considerable difficulties in generating a robust analysis within the time-f?ame of the study.
R&D Technical Report P119 12-l. .:’
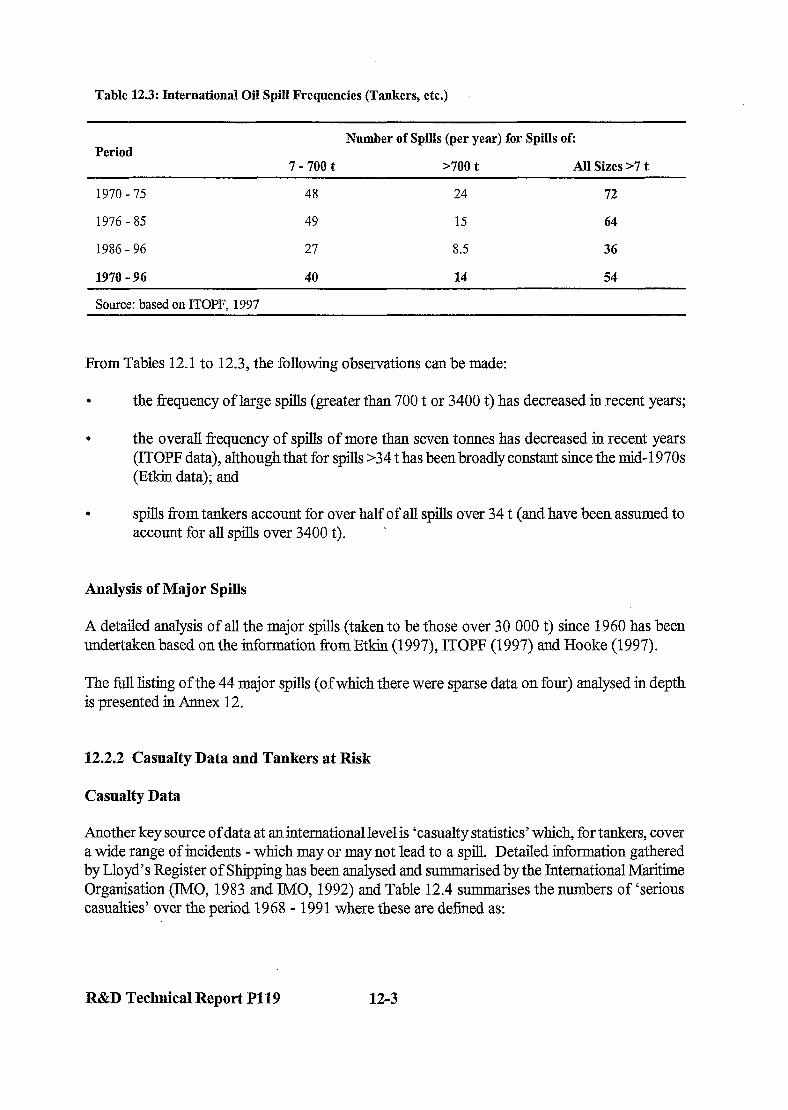
Table 12.3: International Oil Spill Frequencies (Tankers, etc.)
Period Number of Spills (per year) for Spills of:
7 - 700 t >700 t All Sizes >7 t
1970 -75 48 24 72
1976 - 85 49 1.5 64
1986 - 96 27 8.5 36
1970 - 96 40 14 54
Source: based on ITOPF. 1997
From Tables 12.1 to 12.3, the following observations can be made:
. the frequency of large spills (greater than 700 t or 3400 t) has decreased in recent years;
. the overall frequency of spills of more than seven tonnes has decreased in recent years (ITOPF data), although that for spills >34 t has been broadly constant since the mid-l 970s (Et&n data); and
. spills from tankers account for over half of all spills over 34 t (and have been assumed to account for all spills over 3400 t). ’
Analysis of Major Spills
A detailed analysis of all the major spills (taken to be those over 30 000 t) since 1960 has been undertaken based on the tiormation fromEtkin (1997), ITOPF (1997) and Hooke (1997).
The full listing of the 44 major spills (of which,there were sparse data on four) analysed in depth is presented in Annex 12.
12.2.2 Casualty Data and Tankers at Risk
Casualty Data
Another key source of data at an international level is ‘casualty statistics’ which, for tankers, cover a wide range of incidents - which may or may not lead to a spill. Detailed information gathered by Lloyd’s Register of Shipping has been analysed and summaris ed by the International Maritime Organisation (IMO, 1983 and IMO, 1992) and Table 12.4 summarises the numbers of ‘serious casualties’ over the period 1968 - 1991 where these are defined as:
R&D Technical Report P119 12-3
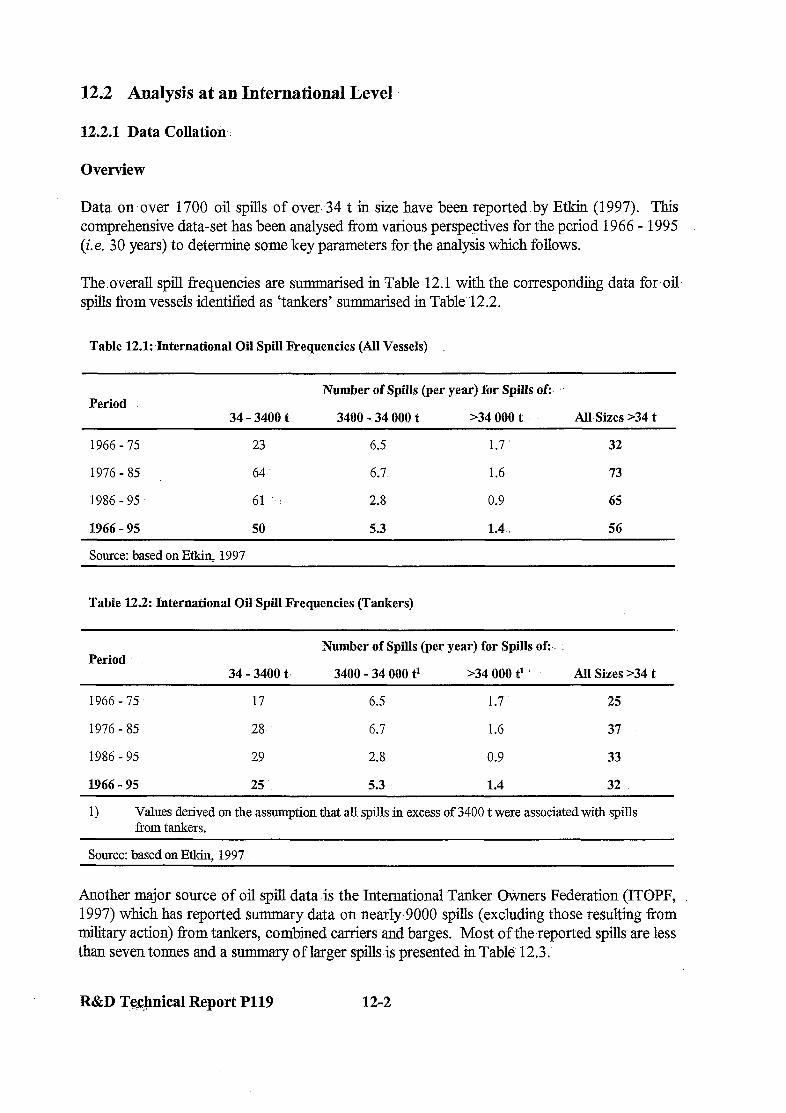
12.2 Analysis at an International Level
12.2.1 Data Collatioir
Overview
Data on over 1700 oil spills of over 34 t in size have been reported by Etkin (1997). This comprehensive data-set has been analysed from various perspectives for the period 1966 - 1995 (i.e. 30 years) to determine some key parameters for:the analysis which follows.
The:overall spill frequencies are summarised in Table 12.1 with the corresponding data-for,oil spills from vessels identified as ‘tankers’ summarised in Table. 12.2.
Table 12.1:.International Oil Spill Frequencies (All Vessels)
Period 34 - 3400 t
Number of Spills (per year) for Spills of:. .
3400 - 34 000 t >34 000 t All-Sizes >34 t
1966-75 23 6.5 1.7 32
1976-85 64.. 6.7 1.6 73
1986 - 95 61 : 2.8 0.9 65
1966 - 95 50 53 1.4 , 56
Source: based on E&in. 1997
Table 12.2: hternational Oil Spill Frequencies (Taukers)
Period 34 - 3400 t,
Number of Spills (per year) for Spills of: :
3400 - 34 000 tl >34 000 P All Sizes >34 t
1966 - 75 17 6.5 1.7 25
1976 - 85 28 6.7 1.6 37
1986 - 95 29 2.8 0.9 33
1966 - 95 25 5.3 1.4 32
1) Values derived on the assumption that all spills iu excess of 3400 t were associated with spills from tankers.
Source: based on E&in. 1997
Another major source of oil spill data is the International Tanker Owners Federation (ITOPF, 1997) which has reported:summary data on nearly-9000 spills (excluding those resulting from military action) from tankers, combined carriers and barges. Most of the-reported spills are less than seven tonnes and a summary of larger spillsis presented in Table 12.3.
R&D T#nical Report P119 12-2
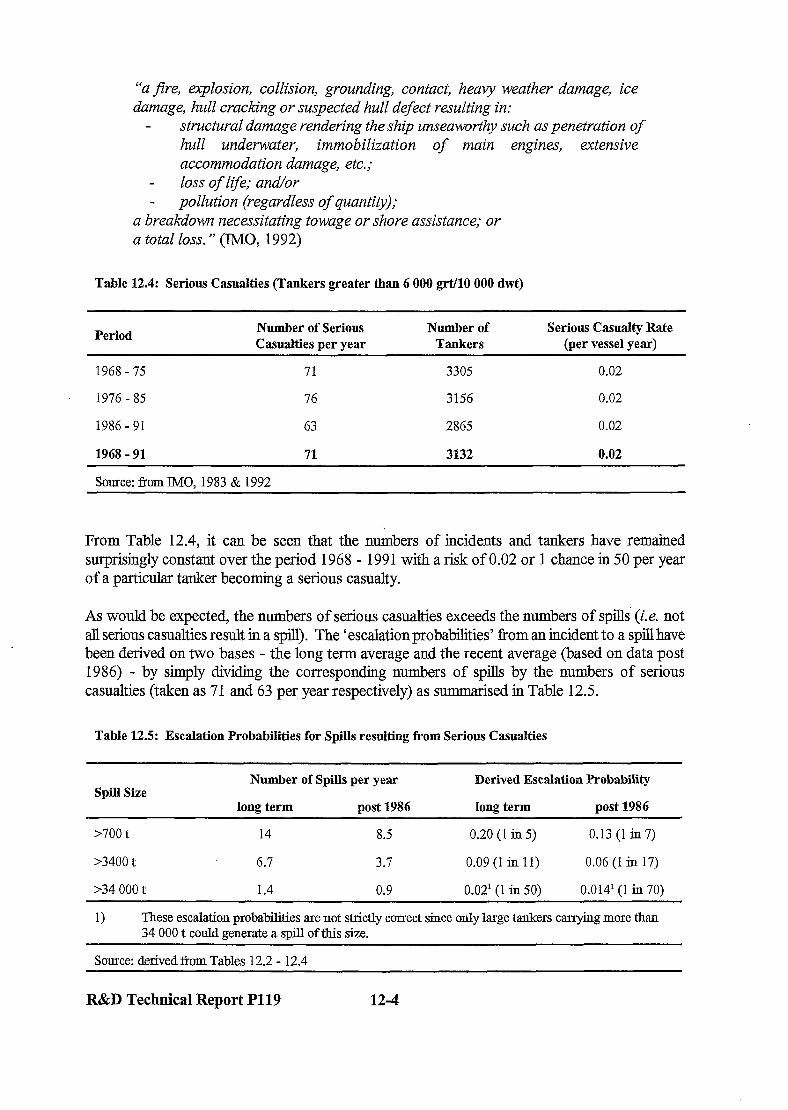
“a j5-e, explosion, collision, grounding, contact, heavy weather damage, ice damage, hull cracking or suspected hull defect resulting in:
structural damage rendering the ship unseaworthy such as penetration of hull underwater, immobilisation of main engines, extensive accommodation damage, etc.; loss of life; and/or
- pollution (regardless of quantityl; a breakdown necessitating towage or shore assistance; or a total loss. ” (MO, 1992)
Table 12.4: Serious Casualties (Tankers greater than 6 000 grt/lO 000 dwt)
Period Number of Serious Number of Casualties per year Tankers
Serious Casualty Rate (per vessel year)
1968 - 75 71 3305 0.02
1976-85 76 3156 0.02
1986 - 91 63 2865 0.02
1968 - 91 71 3132 0.02
Source: from IMO. 1983 & 1992
From Table 12.4, it can be seen that the numbers of incidents and tankers have remained surprisingly constant over the period 1968 - 1991 with a risk of 0.02 or 1 chance in 50 per year of a particular tanker becoming a serious casualty.
As would be expected, the numbers of serious casualties exceeds the numbers of spills (i.e. not all serious casualties result in a .spih). The ‘escalation probabilities’ from an incident to a spill have been derived on two bases - the long term average and the recent average (based on data post 1986) - by simply dividing the corresponding numbers of spills by the numbers of serious casualties (taken as 71 and 63 per year respectively) as summarr ‘sed in Table 12.5.
Table 12.5: Escalation Probabilities for Spills resulting from Serious Casualties
Spill Size
>700 t
>3400 t
>34 000 t
Number of Spills per year
long term post 1986
14 8.5
6.7 3.7
1.4 0.9
Derived Escalation Probability
long term post 1986
0.20 (1 in 5) 0.13 (1 in 7)
0.09 (1 in 11) 0.06 (1 in 17)
0.02l (1 in 50) O.O14l(l in 70)
1) These escalation probabilities are not strictly correct since only large tankers caqing more than 34 000 t could generate a spill of this size.
Source: derived from Tables 12.2 - 12.4
R&D Technical Report P119 12-4
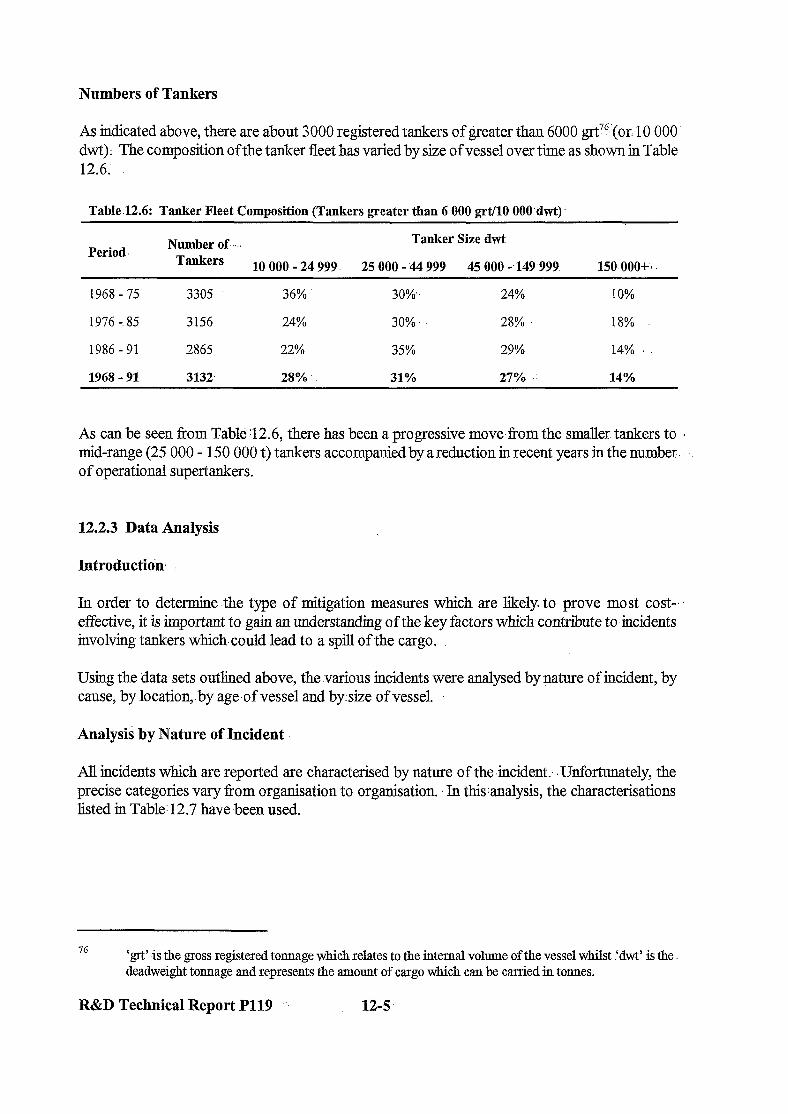
Numbers of Tankers
As indicated above, there are about 3000 registered tankers of greater than 6000 g~&~~‘(or. 10 000 dwt). The composition of the tanker fleet has varied by size of vessel over time as shown in Table 12.6;
Table.12.6: Tanker Fleet Composition (Tankers greater than 6 000 grt/lO OOO.dwt)
Period. Number of... Tanker Size dwt
Tankers 10 000 - 24 999 25 000 - 44 999 45 000 -.149,999 150 ooo+,
1968 - 75 3305 36% 30%,. 24% 10%
1976 - 85 3156 24% 30% 28% 18%
1986 - 91 2865 22% 35% 29% 14% .
1968 - 91 3132 28% 31% 27% 14%
As can be seen from Table 42.6, there has been a progressive move from the smaller tankers to . mid-range (25 000 - 150 000 t) tankers accompanied by a reduction in recent years in the number. of operational supertankers.
12.2.3 Data Analysis
Introduction, :
In order to determine -the type of mitigation measures which are likely. to prove most cost-. effective, it is important to gain an understanding of the key factors whkh contribute to incidents involving tankers which.could lead to a spill of the cargo.
Using the data sets outlined above, the various incidents were analysed by nature of incident, by cause, by location,. by age,of vessel and bysize of vessel.
Analysis by Nature of Incident
All incidents which are reported are characterised by nature of the incident.. .Unfortunately, the precise categories vary from organisation to organisation. In thisanalysis, the characterisations listed in Table: 12.7 have-been used.
76 ‘g&-is the gross registered tonnage which relates to the internal volume of the vessel whilst .‘dwt’ is the deadweight tonnage and represents the amount of cargo which can be carried in tonnes.
R&D Technical Report P119 12-5
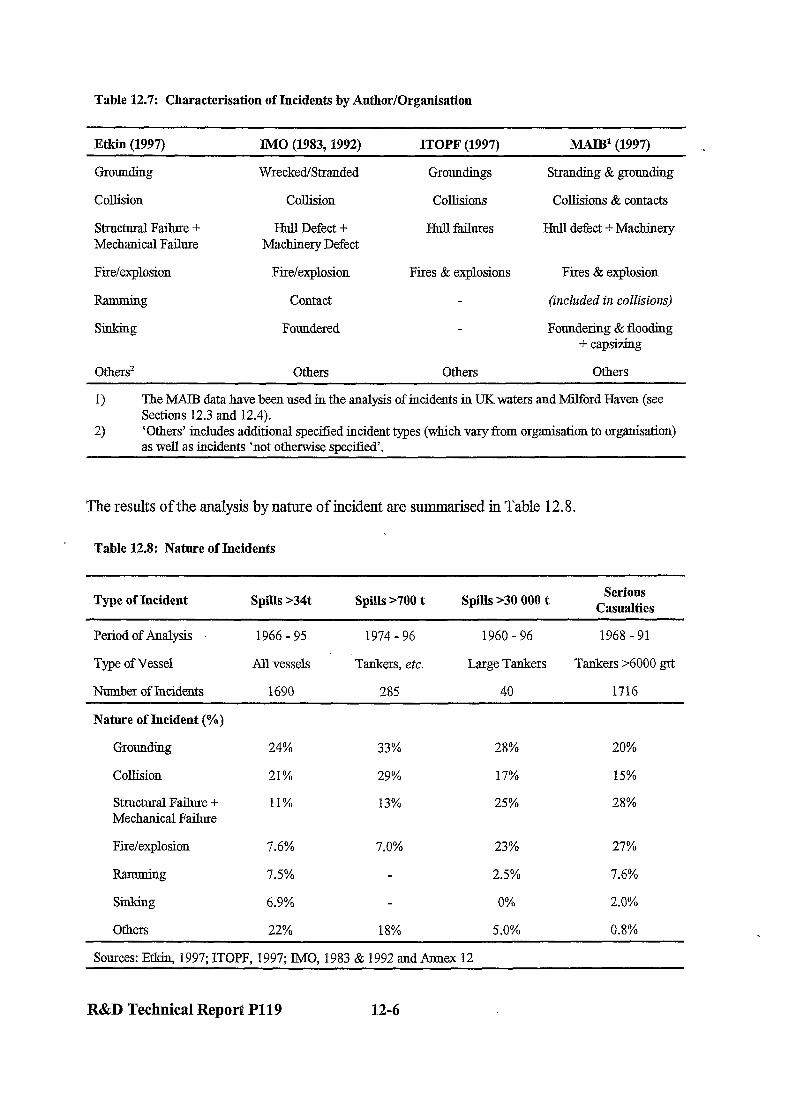
Table 12.7: Characterisation of Incidents by Author/Organisation
E&in (1997) IMO (1983,1992) ITOPF (1997) MAIB’ (1997) ~
Grounding Wrecked/Stranded Groundings stranding & grounding
collision collision collisions collisions & contacts
Structural Failure + Mechanical Failure
Fire/explosion
Ramming
sinking
Others’
Hull Defect + Machinery Defect
Fire/explosion
Contact
Foundered
Others
Hull failures
Fires & explosions
Others
Hull defect + Machinery
Fires & explosion
(included in collisions)
Foundering & flooding + capsizing
Others
The MAE3 data have been used m the analysis of incidents in UK waters and Milford Haven (see Sections 12.3 and 12.4). ‘Others’ includes additional specified incident types (which vary from organisation to organisation) as well as incidents ‘not otherwise specified’.
The results of the analysis by nature of incident are summarised in Table 12.8.
Table 12.8: Nature of Incidents
Type of Incident Spills >34t Spih >700 t Spilas >30 000 t Serious
Casualties
Period of Analysis 1966-95 1974 - 96 1960-96 1968 - 91
Type of Vessel All vessels Tankers, etc. Large Tankers Tankers >6000 grt
Number of Incidents 1690 285 40 1716
Nature of Incident (%)
Grounding
Collision
Structural Failure + Mechanical Failure
Fire/explosion
-g
sillking
Others
24% 33% 28% 20%
21% 29% 17% 15%
11% 13% 25% 28%
7.6% 7.0% 23% 27%
7.5% 2.5% 7.6%
6.9% 0% 2.0%
22% 18% 5.0% 0.8%
Sources: Etkin, 1997; ITOPF, 1997; IMO, 1983 & 1992 and hex 12
R&D Technical Report Pll9 12-6
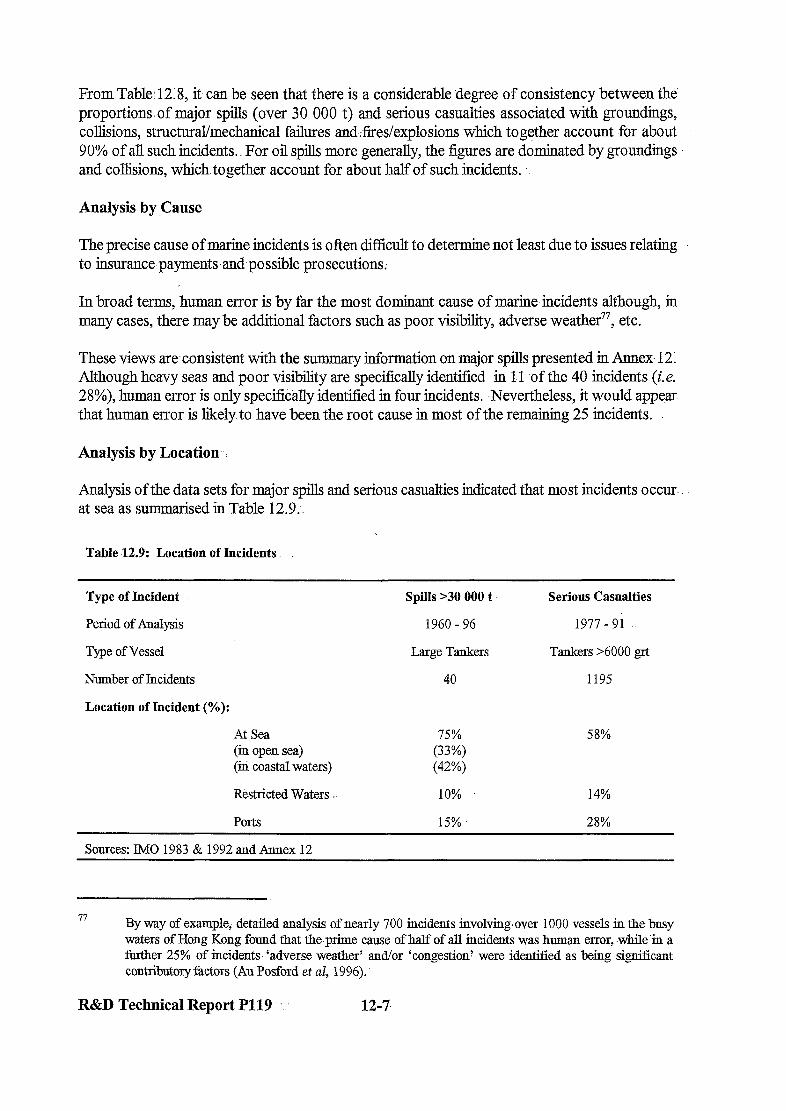
From Table: 12.8, it can be seen that there is a considerable degree of consistency between the proportionsof major spills (over 30 000 t) and serious casualties associated with groundings, collisions, structural/mechanical failures a&fires/explosions which together account for about 90% of all such incidents.. For oil spilkmore generally, the figures are dominated by groundmgs and collisions, which. together account for about half of such incidents.
Analysis by Cause
The precise cause of marine incidents is often difficult to determine not least due to issues relating to insurance~payments and possible prosecutions.
In broad terms, human error is by far the most dominant cause of marine incidents-although, in many cases, there may be additional factors such as poor visibility, adverse weather77, etc.
These views areconsistent with the summary information on major spills presented in Annex 12. Although heavy seas and poor visibility are specifically identified in 1-l ,of the 40 incidents (i.e. 28%), human error is only specifically identified in four incidents. Nevertheless, it would appe,ar that human error is likely. to have been the root cause in most of the remaining 25 incidents.
Analysis by Location .:
Analysis of the data sets for major spills and serious casualties indicated that most incidents occur. at sea as summarr ‘sed in Table 12.9.
Table 12.9: Location of Incidents
Type of Incident
Period of Analysis
Type of Vessel
Number of Incidents
Location of Incident (%):
At Sea (in open sea) (in coastal waters)
Restricted Waters
Ports
Spills >30 000 t Serious Casualties
1960-96 1977 - 9i
Large Tankers Tankers ~6000 grt
40 1195
75% 58% (33%) (42%)
10% 14%
15% 28%
Sources: lM0 1983 & 1992 and Annex 12
-_ 7.1 By way of example; detailed analysis of nearly 700 incidents involviug.over 1000 vessels in the busy
waters of Hong Kong found that the-prime cause of half of all incidents was human error: -while’in a further 25% of incidents ‘adverse weather’ and/or ‘congestion? were identified as being significant contributory factors (Au.Posford et al, 1996). ..
R&D Technical Report P119 12-7
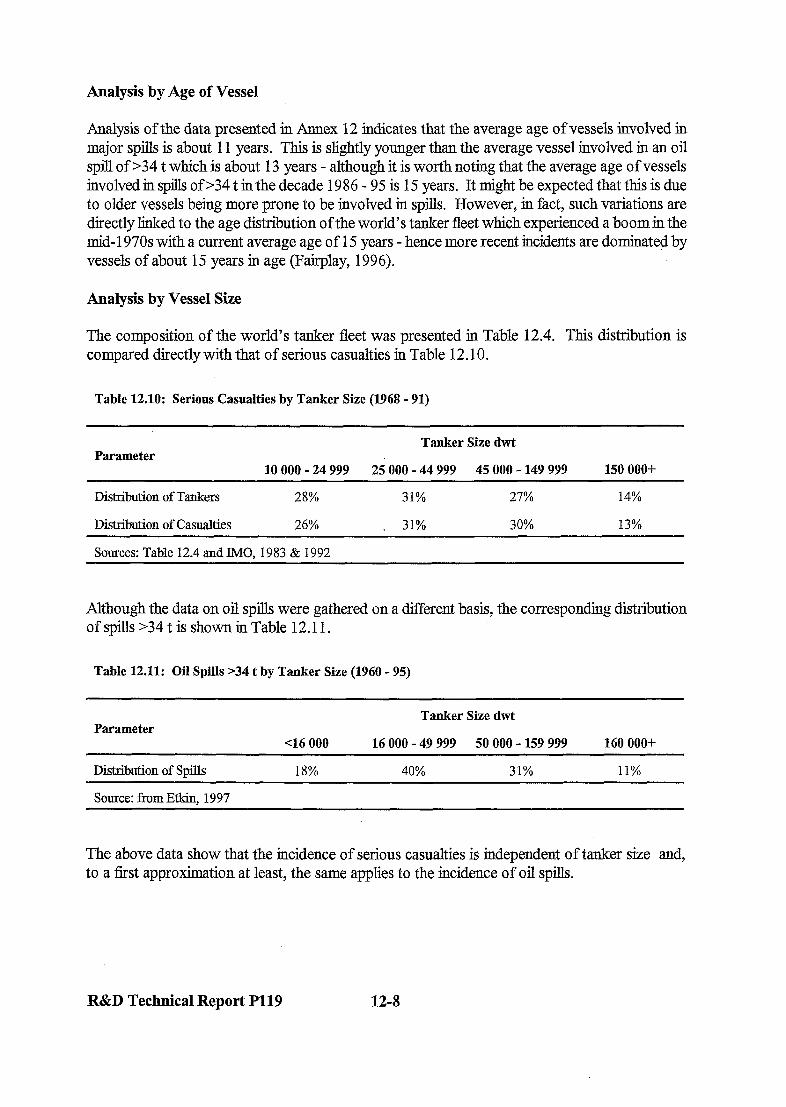
Analysis by Age of Vessel
Analysis of the data presented in Annex 12 indicates that the average age of vessels involved in major spills is about 11 years. This is slightly younger than the average vessel involved in an oil spill of >34 t which is about 13 years - although it is worth noting that the average age of vessels involved in spills of >34 t in the decade 1986 - 95 is 15 years. It might be expected that this is due to older vessels being more prone to be involved in spills. However, in fact, such variations are directly linked to the age distribution of the world’s tanker fleet which experienced a boom in the mid-l 970s with a current average age of 15 years - hence more recent incidents are dominated by vessels of about 15 years in age (Fairplay, 1996).
Analysis by Vessel Size
The composition of the world’s tanker fleet was presented in Table 12.4. This distribution is compared directly with that of serious casualties in Table 12.10.
Table 12.10: Serious Casualties by Tanker Size (1968 - 91)
Tanker Size dwt Parameter
10 000 - 24 999 25 000 - 44 999 45 000 - 149 999 150 ooo+
Distribution of Tankers 28% 31% 27% 14%
Distribution of Casualties 26% . 31% 30% 13%
Sources: Table 12.4 andlM0, 1983 & 1992
Although the data on oil spills were gathered on a different basis, the corresponding distribution ofspills>34tisshowninTable12.11.
Table 12.11: Oil Spills >34 t by Tanker Size (1960 - 95)
Parameter Tanker Size dwt
~16 000 16 000 - 49 999 50 000 - 159 999 160 000+
Distibution of spas 18% 40% 31% 11%
Source: from E&in: 1997
The above data show that the incidence of serious casualties is independent of tanker size and, to a first approximation at least, the same applies to the incidence of oil spills.
R&D Technical Report Pll9 12-a
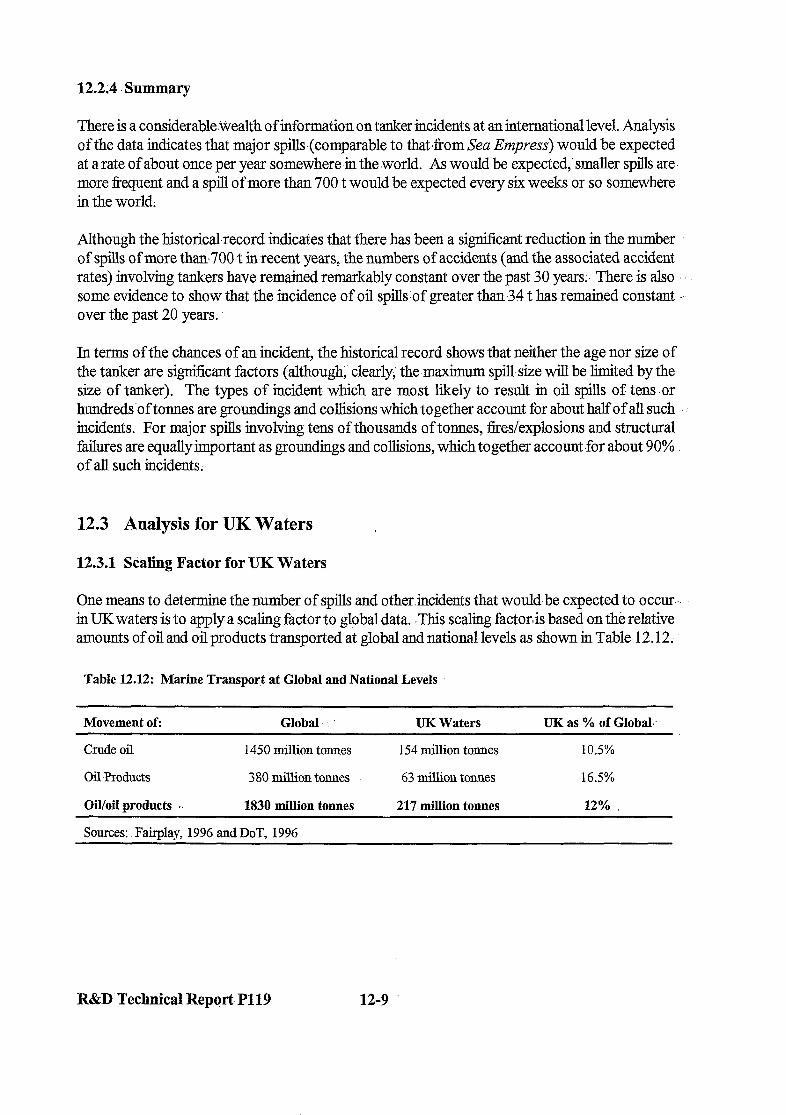
12.2.4 Summary
There is a considerable.Wealth of information on tanker incidents at an internationallevel. Analysis of the data indicates that major-spiUs(comparable to that from Sea Empress) would be expected at a rate of about once per year somewhere in the world. As would be expected,‘smaller spills are. more frequent and a spill of more than 700 t would be expected every six weeks or so somewhere in the world;
Although the historicaLrecord indicates that there has been a significant reduction in the number of spills of more than700 t in recent years; the numbers of accidents (and the associated accident rates) involving tankers have remained remarkably constant over the past 30 years;, There is also b some evidence to show that the incidence of oil spills,of greater than 34 t has remained constant over the past 20 years..
In terms of the chances of an incident, the historical record shows that neither. the age nor size of the tanker are significant factors (although; clearly; the maximum spillsize will be limited by the size of tanker). The types of incident. which are most likely to result in oil spills of tens. or hundreds’oftonnes are groundings and collisions which together account for about half of all such incidents. For major spills involving .tens of thousands of tonnes, fires/explosions and structural failures are equally important as groundings and collisions, which together account-for about 90% of all such incidents;
12.3 Analysis for UK Waters .
12.3.1 Scaling Factor for UK Waters
One means to determine the number of spills and otherincidents that would-be expected to occur- in UKwaters is to apply a scaling factor to global data. ,This scaling factor& based on the relative amounts of oil and oil products transported at global and national levels as shown in Table 12.12.
Table 12.12: Marine Transport at Global and National Levels
Movement of: Global UK Waters UK as % of Global..
Crude oil
Oil Products
Oil/oil products .-
1450 million tonnes
3 SO million tonnes
1830 million tonnes
154 million tonnes
63 million tonnes
217 million tonnes
10.5%
16.5%
12%
Sources: Fairplay: 1996 and DOT, 1996
R&D Technical Repsrt P119 12-9
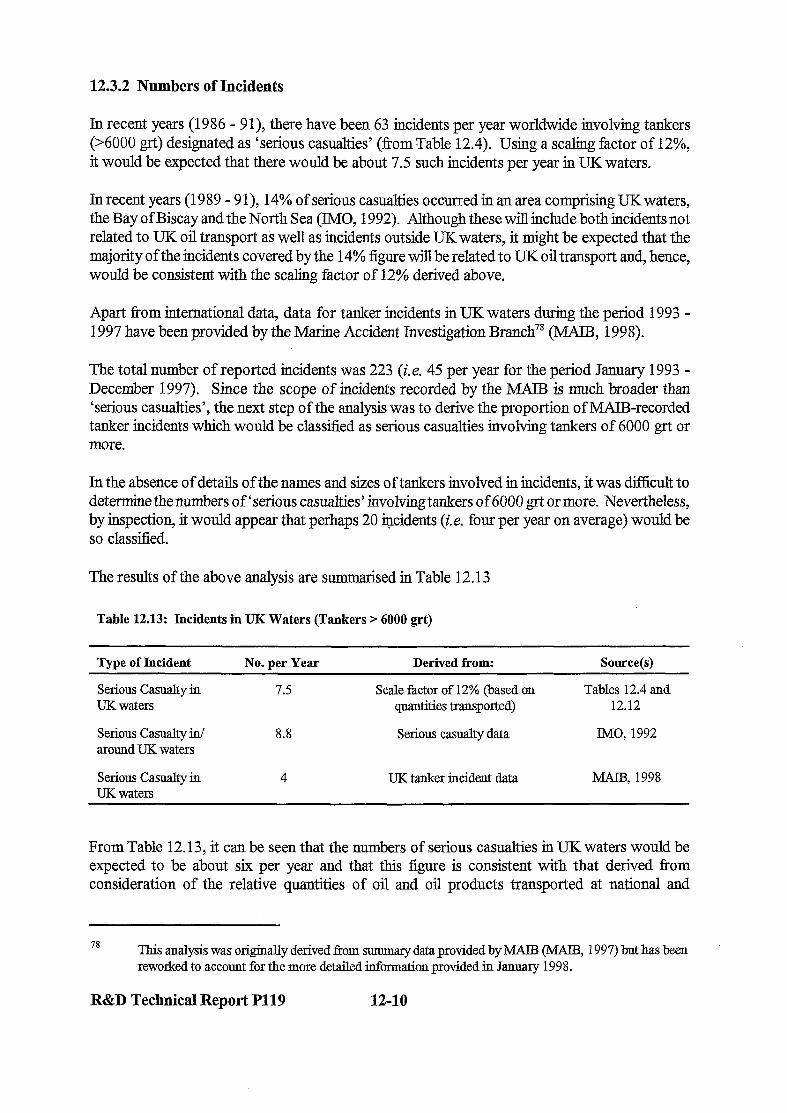
12.3.2 Numbers of Incidents
In recent years (1986 - 91), there have been 63 incidents per year worldwide involving tankers (>6000 grt) designated as ‘serious casualties’ (from Table 12.4). Using a scaling factor of 12%, it would be expected that there would be about 7.5 such incidents per year in UK waters.
In recent years (1989 - 9 l), 14% of serious casualties occurred in an area comprising UK waters, the Bay of Biscay and the North Sea (IMO, 1992). Although these will include both incidents not related to UK oil transport as well as incidents outside UK waters, it might be expected that the majority of the incidents covered by the 14% figure will be related to UK oil transport and, hence, would be consistent with the scaling factor of 12% derived above.
Apart from international data, data for tanker incidents in UK waters during the period 1993 - 1997 have been provided by the Marine Accident Investigation Branch78 (MAIB, 1998).
The total number of reported incidents was 223 (i.e. 45 per year for the period January 1993 - December 1997). Since the scope of incidents recorded by the MAIB is much broader than ‘serious casualties’, the next step of the analysis was to derive the proportion of MAIB-recorded tanker incidents which would be classified as serious casualties involving tankers of 6000 grt or more.
In the absence of details of the names and sizes of tankers involved in incidents, it was diffkult to determine the numbers of ‘serious casualties’ involving tankers of 6000 grt or more. Nevertheless, by inspection, it would appear that perhaps 20 incidents (i.e. four per year on average) would be so classified.
The results of the above analysis are summarised in Table 12.13
Table 12.13: Incidents in UK Waters (Tankers > 6000 grt)
Type of Incident
Serious Casualty in UK waters
Serious Casualty in/ around UK waters
No. per Year
7.5
8.8
Derived from: Source(s)
Scale factor of 12% (based on Tables 12.4 and quantities transported) 12.12
Serious casualty data MO: 1992
Serious Casualty in UK waters
4 U?L tanker incident data MAlB, 1998
From Table 12.13, it can be seen that the numbers of serious casualties in UK waters would be expected to be about six per year and that this figure is consistent with that derived from consideration of the relative quantities of oil and oil products transported at national and
78 This analysis was orig,im~Uy derived from surmnazy data provided by MAE3 (MAD, 1997) but has been reworked to account for the more detailed information provided in January 1998.
R&D Technical Report PllP 12-10

international levels. However, it is possible that a more rigorous analysis of the MATEI data would. lead to a slight reduction in this figure.
In other words, there is:insufficient evidence-to suggest that the general level of tanker safety in UK waters is significantly better: or-worse than, elsewhere.
12.3.3 Major UK Spills
In Table 12.5, probabilities for serious casualties to escalate to oil spills were derived... Over the.. past 35 years, the historical record shows that for every 50 serious casualties involving tankers of 6000 grt or more, there has been one spill of 34 000 t. ..
Applyingthis factor to an estimated serious casualty rate of six per year in UK waters over the last 35 years would lead to the view that there would have been four major oilspills during this period.
Tnfact, there have beenthree - Torrey Canyon (1967), Braer (1993) andtheSeaEmpress (1996). Indeed, against this background, it could-be argued-that, statistically.at least, an-incident similar to the -Sea Empress was to be expected.
In recent years, the probability&at a serious casualty incident escalates to a major spill has fallen to about 1 chance in:70. On this basis, for six serious casualties per year, it would be expected- .j, that there will be another major spill (>30 000 t) in UK waters within the next 12 years.
12.3.4 Types of Incident
Analysis of world data on spills and serious. casualties inditiated.. that such incidents were dominated by groundings, collisions, structural/mechanical failures and fires/explosions (see Table 12.8). -The MATB data for incidents mIlKwaters (MAlB,~1998) include both these more serious types of incidents as well as lesser incidents and ‘near misses’ as s ummarised in Table‘.l2.14.
Table-12.14: Nature of Incidents in UK Waters (all tankers)
Type of Incident Number (l/93 - 12/97) Numberper Year
Machinery + Hull.Defects 43 8.6
collisions & contacts 41 8.2
Fire/explosion : 15 3.0
Stranding & Grounding 23 4.6 II
Others 101 20
Totals: 223 45
Source: MAI& 1998
R&D Technical Report Pl19 12-1-l
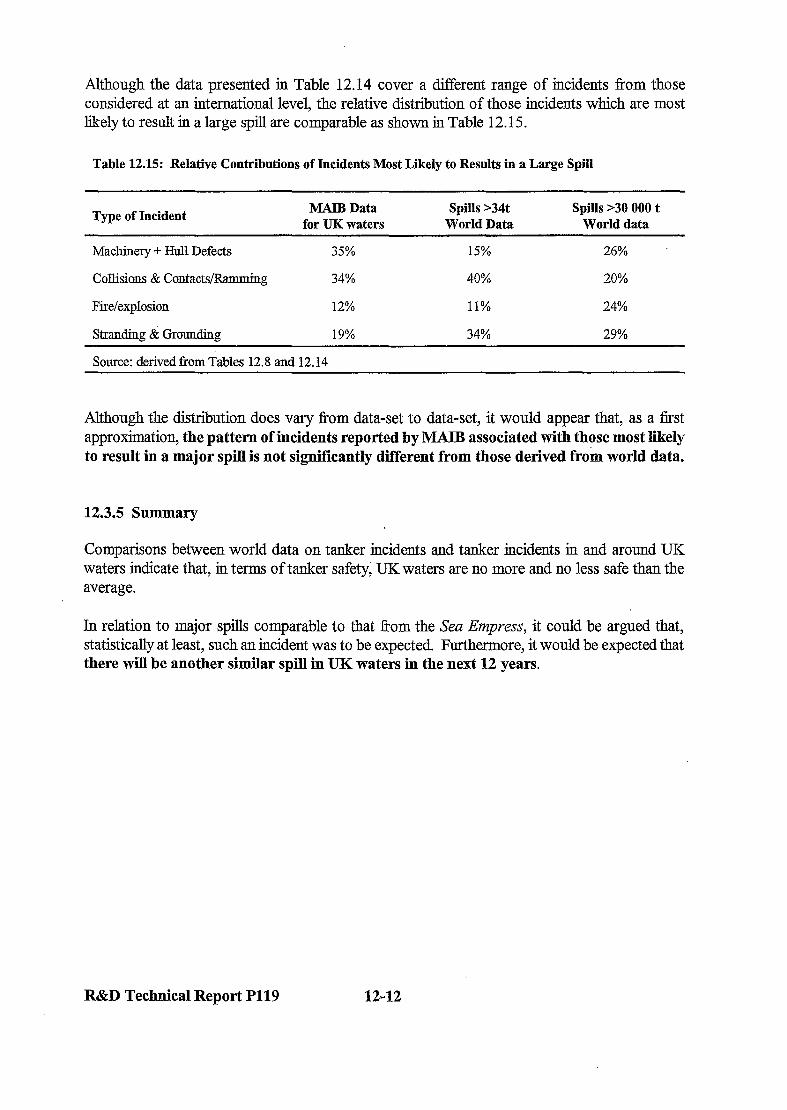
Although the data presented in Table 12.14 cover a different range of incidents from those considered at an international level, the relative distribution of those incidents which are most likely to result in a large spill are comparable as shown in Table 12.15.
Table 12.15: Relative Contributions of Incidents Most Likely to Results in a Large Spill
Type of Incident MAIB Data Spills >34t
for UK waters World Data Spills >30 000 t
World data
Machinery + Hull Defects
Collisions & Contacts/Ramming
Fire/explosion
Stranding & Grounding
35% 15% 26%
34% 40% 20%
12% 11% 24%
19% 34% 29%
Source: derived from Tables 12.8 and 12.14
Although the distribution does vary from data-set to data-set, it would appear that, as a first approximation, the pattern of incidents reported by MAIB associated with those most likely to result in a major spill is not significantly different from those derived from world data.
12.3.5 Summary
Comparisons between world data on tanker incidents and tanker incidents in and around UK waters indicate that, in terms of tanker safety; UK waters are no more and no less safe than the average.
In relation to major spills comparable to that from the Sea Empress, it could be argued that, statistically at least, such an incident was to be expected. Furthermore, it would be expected that there will be another similar spill in UK waters in the next 12 years.
R&D Technical Report P119 12-12

12.4 Analysis of Incidents in Milford Haven
12.4.1 Port Location and Description
Milford Haven is a ‘natural? harbour located on the western most tip of Wales. The seaward entrance to the Haven is from an westerly direction passing through a channel around 2.5 km in width, The branching pattern of Milford Haven and its tributary tidal creeks demonstrate a %a’ or drowned river system (see Figure 12.1). It is some 18 km from the Haven mouth to Mill Bay in the east whereupon the Havenswings northwards to the Daugelddau (the common estuary of the rivers Cleddau).
. St I Scale (approx) Brides I Bav Htiverfordwest 0 5
Milford ,, Haven
-0 - Head Shee
Isl. %
u
:i;
Lhney Head F--A--
Figure 12.1: Milford Haven St Gown’s Head
The .port of Milford Haven,includes the whole of the Haven with the seaward outer limits extending some 11 km southeast, and southwest of St. Ann’s Head. The inner limits of the.port are on,the upper reaches of the River Cleddau. The port is one of the few UK to be openly accessible to fully laden Very Large Crude Carriers (VLCCs, >200 000 dwt) with draughts of up to 20 m..
At the,time of the Sea Empress disaster, the Haven served three oil refineries, two on the north side and one on the south side. Milford Docks is an important centre for the fishing industry while containers and general cargo.are handled at Pembroke Dock, where a roll-on roll-off (Ro-Ro) ferry terminal provides services to.Ireland.
R&D .Technical Report -P119 12-13

Pembrokeshire Tourism,Federation (1996): Planning Application by the Milford Haven Port Authority- for a Jetty to Support use of Orimulsion ‘at Pembroke Power Station, recommendationby The Pembrokeshire Tourism Federation, 29 April 1996.
Posford Duvivier Environment (1991): Mablethorpe to Skegness Sea Defences Strategic Approach Study, Peterborough, Posford Dutivier Environment. -.
Prince William Sound Conservation Alliance (1989):’ Exxon Valdez Oil Spill, Valdez; PWSCA.
Ritchie W (1997): The Braer OilSpill - Lessons to be Learned, article downloaded.fromJnternet Site (http://www.ens-foundation.no/. 767wrhtml).
Seal D (1997): Messages- of the Sea Empress Disaster Fielding E (1997): The. Effects on Tourism - The Local. Perspective, in Proceedings of the Sea-Empress Conference, held on 2-3 April .1997;‘Pembrokeshire College..
SEEEC (1996):. Sea Emptiess Environmental Evaluation,Committee - Initial Report; July 1996.
Shell (1997): Oil Spill Prevention and Response, article downloaded from Shell Internet Site. (http://www.shell.com/c/c2~03.html).
SWSFC (1996a): Press Release 03/96., Z:
SWSFC (1996b): Press ReIease.l4/96;!:.
Texaco (1997): Protecting the WaterAround I%, article downloaded from-Texaco Internet Site,- (http://www.texaco;com/:;.).
Thomas D (1997): Anatomy of a Calamity, in Proceedings of the Sea Empress Conference,:held on 2-3 April 1997, Pembrokeshire College.,.
US National Response Team (1989): The Exxon Valdez Oil Spill- A Report to the President, .: Almeda, CA,‘USCG..
US National Response Team (1996): : Update of Implementation of Recommendationsfrom the NRTFoZZowing theExxon VaZdezSpiZl, article downloaded tiomNationalResponseTeam Internet Site (http://www.nrt.org/evqub.htm)~
Wolfscastle (1997): Interesting Places to:Visit in:Pembrokeshire, Pembrokeshire, Wolfscastle Hotel.
R&D Technical Report P119 15-10

Harris C (1997): T?ze Sea Empress Incident: Overview and Response at Sea, in Proceedings of the 1997 Oil Spill Conference, held on 7-10 April 1997, Broward County Convention Centre, Fort Lauderdale, Florida.
Hess WN (ed) (1978): The Amoco Cadii Oil Spill - A Preliminary Scientific Report, NOAA/EPA Special Report, Washington, US Printing Office.
ITOPF (1981 to 1986): Technical Information Papers 1 to 12, London, ITOPF.
ITOPF (1996): An Assessment of the Risk of Oil Spills and the State of Preparedness in 13 UNEP Regional Sea Areas, London.
Jones J (1997): Possible Impact on Tourism, in Proceedings of the Sea Empress Conference, held on 2-3 April 1997, Pembrokeshire College.
JRC (1997): Summary of Shoreline Oil Survey, Pembrokeshire, JRC.
King 0 (1994): Data Sources for Cost Benefit Analysis, CardifI, Department of Maritime Studies & International Transport.
Lewis M (1997): Compensation, in Proceedings of the Sea Empress Conference, held on 2-3 April 1997, Pembrokeshire College.
Lord Donaldson (1994): Safer Ships. Cleaner Seas - Report of Lord Donaldson’s Inquiry into the Prevention of Polhttion from Merchant Shipping, London, HMSO.
MAIB (1996): Report of the Investigation into the Grounding of the Tanker Borga at Milford Haven on 29 October 1995, London, HMSO.
OPCS (1994): 1991 Census - Dyfed, London, OPCS.
Parr S et al (1997): The Impact of the Sea Empress Oil Spill on Birds of the Pembrokeshire Coast and Islands, in Proceedings ofthe 1997 Oil Spill Conference, held on 7-10 April 1997, Broward County Convention Centre, Fort Lauderdale, Florida.
PCC (1997): Agenda Item on the Costs of the Sea Empress Incident to Pembrokeshire County Council, from the Director of Finance to the Policy and Resources Committee, dated 10 July 1997.
PCC (1997): Take a Walk in the Park PEMBROKESHIRE Britain’s Only Coastal National Park, Wales, Tourism & Leisure Services.
PCNP (1994): Draft National Park Review 1994-1999, Haverfordwest, PCNP.
PCNP (1997): Coast to Coast ‘97, Haverfordwest, PCNP.
R&D Technical Report P119 15-9
DERA Centre for Marine~~Technology (1997): Pollution/Search and .Rescue. and Tracking Prediction, article downloaded tiomthe DERA Internet Site (http://www.dra.hmg.gb/ organise/dradivn/seasect/ssotpsr.htm):~
Dicks B (nd): EnvironmentalImpact of Marine Oil Spills, paper provided by ITOPF, :London, ‘:. ITOPF:
DNV Technica (1995): Risk Analysis of Oil Spills in-UK Waters - For Mar&Pollution Control Unit, London, DNV Technica.
DOT (1995): Safer Ships, Cleaner Seas - Government Response to the. ,Report of Lord ’ Donaldson’s .Inquiry into the Prevention of. Pollution~from Merchant Shipping, London, IIMSO.
Dubber M (1997): -Sea Empress Oil Pollution Incident in Southwest Wales’:- Contingency Planning, in Proceedings of the Sea Empress. Conference,. held on 2-3 April 1997,, Pembrokeshire College. . .
Environment Agency (1997): Rod Fishing.Byelaws - A Guide for: Anglers in the Welsh ‘:. Region, Cardif
Environment Agency(1997): Anglers and the-Agency, Leaflet.
Georgiou S et al (1996): .Detenninants of Individuals Willingness to Pay for Reductions in Environmental Health Risks: A Case Study of Bathing Wrater Quality, presented at a Workshop on the-Contingent Valuation Method, May 96, University College, -London.
GoodsteinE & Solow A (1994): Saturday Effects in Tanker Oil Spills, Journal of Environmental Economics and Management, Vol26,3; pp293-299.
Goodstein E (1992): ~Saturday Effects in Tanker Oil Spills, Journal of Environmental Economics and Management, Vol23;3, ~~276-288.
Government Committee of Scientists (1967): The.Torrey Canyon - Report of the Committee of Scientists on .the: Scientific and Technological Aspects of the Torrey Canyon Disaster, Cabinet Office, London, HMSO,
Green C et al (1990): l%e Benefits of Coast Protection: Results from Testing the Contingent Valuation Method (CD4 for Valuing Beach Recreation, presented tothe Conference of the River and Coastal Engineers, July 1990, Loughborough University, England.
Groves B et al (1992): Optimal Monitoring of Oil Spills: Control in Stochastic, Dynamic : Context, University of California DiscussionDepartment ofEconomics DiscussionPaper 92-48, December-l992, San Diego, UC.
Harries D (1997): Movingfrom Emergency to Project Phase, in Proceedings of the Sea Empress Conference, held on 2;3 April 1997, Pembrokeshire-College.
R&D T&mica1 Report P119 3.5-8 .
Coates P (1995): Annual Report, Landings of Fish and Shellfish to the South Wales Sea Fisheries District - 1994.
Coates P (1995a): Director’s Report for the Quarter Ending 31 March 1995, South Wales Sea Fisheries Committee, 1995.
Coates P (1995b): Director’s Report for the Quarter Ending 30 June 1995, South Wales Sea Fisheries Committee, 1995.
Coates P (1995~): Director’s Report for the Quarter Ending 30 September 1995, South Wales Fisheries Committee, 1995.
Coates P (1995d): Director’s Report for the Quarter Ending 30 December 1995, South Wales Sea Fisheries Committee, 1995.
Coates P (1996a): Director’s Report for the Quarter Ending 31 March 1996, South Wales Sea Fisheries Committee, 1996.
Coates P (1996c): Director’s Report for the Quarter Ending 30 September 1996, South Wales Sea Fisheries Committee, 1996.
Coates P (1996d): Report of the Director for the Quarter Ending 31 December 1996, South Wales Sea Fisheries Committee, 1996.
Coates P (1997a): Director’s Report for the Quarter Ending 31 March 1997, South Wales Sea Fisheries Committee, 1997.
Coates P (1997b): Director’s Report for the Quarter Ending 30 June 1997, South Wales Sea Fisheries Committee, 1997.
Coates P & Davies C (1997): Annual Report, Landings of Fish and Shellfish to the South Wales Sea Fisheries District & Shellfish Permit Report - 1996.
Countryside Council for Wales (1996): The Sea Empress Oil Spill, A Survey of Visitors’ Perceptions, Cardiff, Beaufort Research.
Davies B (1997): Technical Aspects - Beach Clean Up, in Proceedings of the Sea Empress Conference, held on 2-3 April 1997, Pembrokeshire College.
Davies H (1997): Waste Disposal Issues of the Sea Empress Incident, in Proceedings of the Sea Empress Conference, held on 2-3 April 1997, Pembrokeshire College.
Department of Trade and Industry (1997): The Optimisation of Consumer Safety, a report prepared by CERM and RPA on behalf of the DTI Consumer Safety Unit.
Department of Transport (DOT, 1996): Transport Statistics Report - Port Statistics 1995, London, HMSQ.
R&D Technical Report Pll9 15-7
Other: Sources of Rackground ~Tnformation:
Agosta JM & V4iUb.s D (1997): Emergency Planning for Marine Oil.Spill Incidents,. article downloaded. from .I Stanford Research.‘: institute Internet Site (http://wwwerg.sri.com/people/johnmark/:IEEE-OilSpill.html).~-:-
Anderson EE .& Talley WK (1996):. Determinants of Tanker Accident Oil Spill .Risk, International Journal of Transport Economics, Vol23, 1, February -1996, pp3- 16.
Anderson- EE & Talley: WK (1995): The Oil- Spill Sizt? of -Tanker and .Barge Accid@nts: Determinants and Policj Implications, Land .Economics, Vol7,1,2, May 1995, pp2 16- 228.
Applied Science Associates (1997): OILhUP/Worldwide Oil Spill Transport and Fate Model; article downloaded- f?om ASA Internet Site (http://appsci.com/oilmapww.htm).
Au Posford et al (1996): .! Comprehensive Study on Marine Activities, Associated Risk Assessment and Development of a Future Strategy for the’optimum Usage of Hong Kong Waters - Topic Report 2 Marine Risk Assessment; report prepared for IMarine Department; Hong Kong Government.
Billington CJ (1997): The Application of Formal Safety Assessment to Tanker Movements in Confined Waters, unpublishedpaper l?omBomelEngineering Consultants (Maidenhead)..
Booker F et al (1967): The:Wreck of the’Torrey Canyon; New York, David & Charles.
Brockho ff I; et al (1993): Marine Transport of Dangerous Goods - Risk Assessment Based on Historical Accident Data, J. Loss Prev. Process Ind.;Vol6,4, pp219-225.
Coastguard AgencyiMPCU (1997): The Marine. Pollution Control: Unit, Internet Site (http://www.coastguard.gov.uk//mpcu/. . .).
Coastguard Agency/MPCU (1996): National Contingency Plan for,Marine Pollution from Shipping,, Southampton, Coastguard Agency.
Coates P (1994a): Acting Clerk:& Chief Fishery Offricer’s Report,for the Quarter Ended : 31.March 1994; South Wales Sea Fisheries Committee; 1994.
Coates P (1994b): Director’s Report for.the Quarter.Ended 30 June 1994, South:Wales Sea Fisheries Committee,- 1994.;
Coates P (1994c): ---Director’s Quarterly Report for the Months ,July i September. 1994; South Wales Sea Fisheries Committee, 1994.
Coates P (1994d): Director’s Report for the Quarter Ending 31 -December 1994, South Wales Sea Fisheries Committee, 1994: ..
R&D Technical Report P119 156
Pickett GD et al (1995): An Appraisal of the UK Bass Fishery and its Management, MAFF Laboratory Leaflet Number 75, Directorate of Fisheries Research, Lowestoft.
Radford A et al (1991): An Economic Evaluation of Salmon Fisheries iu Great Britain, CEMARE Report RI 6, Fortsmouth, CEMARE.
RCEP (198 1): Royal Commission on Environmental Pollution - Eighth Report on Pollution to the Sea, London, HMSO.
Rowe RD & Shaw WD (1992): Nestucca Oil Spill, in Natural Resource Damages: Law & Economics, (Eds: Ward KM & Duffield JW), New York, John Wiley & Sons.
RPA (1997): Economic Benefits of Flood Warning and Forecasting: Phase 1, Bristol, Environment Agency.
SEEEC (1996): Sea Empress EnvironmentalEvaluation Committee, InitialReport, Cardiff, SEEEC.
SEEEC (1997): Sea Empress Environmental Evaluation Committee - Final Report (Draft), 1997.
SEEEC (1998): Sea Empress Environmental Evaluation Committee - Final Report 1998.
Simpson D (1997): Report to The Environment Agency on Sea Empress Amenity Impact Survey, Nottingham, Marketing Focus UK Ltd.
SWSFC (1997): Annual Report - 1996, Swansea, SWSFC.
Tidy Britain Group (1997): The 1997 Seaside Awards, Norwich, Tidy Britain Group.
Walder S (1997): Joint Response Centre -Administration and Procurement, in Proceedings of the Sea Empress Conference, held on 2-3 April 1997, Pembrokeshire College.
Welsh Affairs Committee (1996): Current Problems Facing the Sea Fishing Industry in Wales, Second Report of the Welsh Affairs Committee, London, HMSO.
WTB (1997a): An Approach to Estimating the Impact of the Sea Empress Incident on Tourism Flows to Pembrokeshire During 1996, Cards, WTB.
WTB (1997b): Tourism in Wales Statistics 1995 article downloaded corn Internet Site (http://www.tourism.wales.gov.uk).
R&D Technical Report Pl19 15-5
Law et al (1997a):- Hydrocarbons and .PAH in Fish and Shellfish from Southwest Wales Following-the Sea Empress Oil Spill in 1996, in ,Proceedings-of the 1997 Oil Spill Conference,. held. on 7- 10 April.: 1997, Broward County Convention Centre, -Fort Lauderdale, Florida. ..
Law et al (1997b): J”he Sea Empress Oil Spill: Impact on Fisheries and Other-Marine Animals, in Proceedings of Oil Pollution 1997, 17-18 February 1997, London.c I
Leisure Consultants (1989): Boating and Water Sports in Britain, Sudbury (Suffolk); Leisure consultants;
Lyons et al (1996):.Reportto the Dyfed Powys Health Authorityon~the AcutelEffects of the- Sea Empress Oil Spill on the:Health of the South Pembrokeshire Population, Welsh Combined Centres for Public Health.‘.:.
MAIB (1997): Incidents involving ,Tankers iu UK Waters, Grouped by.Incident Type, since 1993; Summary data provided .to:, the Consultants : by .the Marine.,.Accident Investigation Branch- Department. of Transport (ref: MAIB 10/04/01);.,.dated 19 September 1997.
MIAIB (1997a): Recorded Incidents in Milford Haven since 1993, Data provided to the Consultants by the Marine Accident Investigation Branch, Department of Transport(ref: MAIB:~l0/04/01),.dated 19 September:l997.
MNB (1997b):. Report ofthe Chief Inspector of Marine Accidents into-the Grounding and .. Subsequent. Salvage of the .Tanker Sea Empress at Milford Haven, London,: The Stationary Office.
MATEI (1998): Incidents involving *Tankers in UK Waters, Grouped by,Incident Type, since 1993, Data provided to the Consultants by the. Marine-:Accident Investigation Branch, Department of ,Transport in January 199 8.
Maritech : Ltd (1997): Independent Assessment of: Clean-Up Operations,. Sea Empress Environmental -Evaluation Committee, .July 1997.
MPCU (1996): The Sea Empress Incident, Southampton, The Coastguard Agency;
NationalPower (1994):. Environmental Statement - Pembroke Power Station, submitted by National Power plc (Swindon) and dated November 1994.
Pahnkas LA et al (1993a): Sokial, Cultural.and PsYchological Impacts of the Exxon Valdex Oil I- Spill, Human Orpanisation, Vol. 52, No. 1, 1993:.
Palinkas LA et al (1993b): Community Patterns ofPsychiatric Disorders of the Exxon .Valdez Oil Spill, American Journal of Psvchiatrv, Vol. 150, 1993.
R&D Technical Report Pl19 15-4.
Foundation for Water Research (1994): Assessing the Benefits of River Water Quality Improvements, Interim Manual (available from water quality planning staff).
Foundation for Water Research (1996): Assessing the Benefits of Surface Water Quality Improvements Manual, Marlow, FWR.
Gates E (1996): Screening Clean-Up, Health & Safe@ at Work, December 1996, ~~10-12.
Grigalunas TA et al (1986): Estimating the Cost of Oil Spills: Lessons from the Amoco Cadiz Incident, Marine Resource Economics, Vo12, 1986, pp239-262.
Hearne M (1997): MFF Objectives/Statutory Role, in Proceedings of the Sea Empress Conference, held on 2-3 April 1997, Pembrokeshire College.
Hooke N (1997): Maritime Casualties 1963-1996, Second Edition, London, LLP.
IMO (1983): Analysis of Serious Casualties to Sea-going Tankers 1968-1982, London, International Maritime Organisation.
IMO (1992): Analysis of Serious Casualties to Sea-going Tankers 1977-1992 and Analysis of Serious Casualties to Fishing Vessels 1982-1991, London, International Maritime Organisation.
l&IO (1996): Taker SMety: the Workof theInternationalMaritime Organisation, article (dated March 1996) downloaded from httn://ww~~.imo.orir/info/focus/intro.htm.
IOPC (1996a): International Oil Pollution Compensation Funds Annual Report 1996, London, IOPC.
IOPC (1996b): Iuternational Oil Polhrtion Compensation Funds Claims Manual 1996, London, IOPC.
IOPC (1997a): Incidents Involving the I971 Fund Sea Empress, Note by the Director, International Oil Pollution CompensationFund 1971, Executive Committee, 54th Session, Agenda Item 3.
IOPC (1997b): Incidents Involving the 1971 Fund Sea Empress, Note by the United Kingdom Delegation, International Oil Pollution Compensation Fund 1971, Executive Committee, 54th Session, Agenda Item 3.
IOPC (1997c): Incidents Involving the 1971 Fund Sea Empress, Note by the Director, International OilPollution CompensationFund 1971, Executive Committee, 55th Session, Agenda Item 3.
ITOPF (1997): ITOPF Oil SpiIl Database, summary of information held by International Tanker Owners Federation Ltd., dated February 1997.
R&D Technical Report Pll9 15-3
Countryside Recreation Network (1,996): UK Day Visits Survey 1994, Cardif& CRN.
DOT (1996): Transport Statistics Great-Britain - 1996,!London, HMSO.
Dunn MR et al (1995): Further Economic Evaluation. of the Bass Fishery in ,England and ’ Wales 1992/93, CEMARJZ Report R30 prepared for-MAFF, .Portsmouth, CEMARE.
ECOTEC (1993): A Cost.Benefit Analysis of Reduced Acid Deposition:: UK. Natural and Semi-Natural Ecosystems, Working -Paper.5, Birmingham.
Elms-R (1997): .Use of -Volunteers, in Proceedings-of the.Sea Empress Conference, held on 2-3 April-1 997, Pembrokeshire College.,.
Environment Agency (1996): ‘. The Feasibility. of, Cost Benefit Analysis for Integrated Pollution Control,: a report prepared by ERM Economics on behalf of the Environment Agency.
Environment Agency (1997a): The Impact of the Sea Empress Oil Spill on the Commercial and RecreationalMigratory Sahnonid Fisheries in West Wales (MS). -1. Impact on Catches -of -Migratory Salmonids: (Interim Summary Report; Environment Agency Internal Ref. No. EA/M/l).
Environment Agency (1997b): The Impact of the Sea Empress Oil Spill on the Commercial ‘1 and Recreational Migratory Sahnonid Fisheries in West Wales (MS). 2. Impact on the.Abtmdance of Juvenile Stocks (linerim Summary Report, Environment Agency Internal Ref. No. EA/M/4):
Etkin DS (1994): The Financial-Costs of Oil Spills; USA, Cutter Information Corp..
E&in DS (1997: Oil Spills from.. Vessels, (1960-1995): An International Historical Perspective, an Oil Spill.‘Intelligence’-Report prepared by the Cutter Information Corporation (Arlington, MA, USA),
Evans S (1997): The Sea Empress - An Environmental Overview, in Proceedings of the Sea Empress Conference, held on 2-3 .Aprill997;Pembrokeshire College.
Fair-play (1996):., World Shipping Statistics 1996,.produced by Fairplay Publications (London) and the Institute of Shipping Analysis (Gothenburg).
Fielding E (1997): ZYhe Effects on ~Totirikm - l%e Local Perspective,-in Proceedings of the Sea Empress Conference, held on 2-3 April 1997, Pembrokeshire College..
Floyd P ‘et al (1997): I 2%e Economic Benefits of Flood IGaming andForecasting, in Water: :( Economics, Management and,.Demand (Eds: Kay M,,.Franks:T, Smith L), E & FN Spon.
R&D Technical Report Pl19 15-2
15. REFERENCES
Allee DJ et al (1980): The Impact of Flooding and Nonstructurai Solution, US Army Corps of Engineers, Army Engineer Institute for Water Resources, Fort Belvoir.
Anon (1997): Sea Empress Disaster Caused Illness in Local Community, The Safety & Health Practitioner, January 1997, pp4.
Anon (1997a): Sea Empress Bill may Reach f5U million, ENDS Report #265, February 1997, pp29-30.
BatemanD et al (199 1): EnvironmentalEconomics and Nature Conservation, Peterborough, Nature Conservancy Council.
Bateman I et al (1993): Consistency Between Contingent Valuation Estimates: A Comparison of Two Studies of UKNationaZ Parks, Regional Studies, Vo128 5, August 1993, pp457- 474.
Beaufort Research Ltd (1996): The Sea Empress Oil Spill - A Survey of Visitor Perceptions, Cardiff.
Bent E & Thomas M (1996): The Aesthetic Impact of OiI on Reaches, Environment Agency Technical Report P22, Bristol, Environment Agency.
Bryan et al (1996): The Economic Consequences of the Sea Empress Spillage, University of Wales.
Campbell et al (1994): Later Effects of Grounding of Tanker Braer on Health in Shetland, BMJ, Vol309, September 1994.
Carruthers DJ and Ellis KL (1997): Prediction of Ambient Concentration of VoIatiIe Organic Compounds (VOCs) from the Sea Empress Oii SpiIi using Vapour and Oil Property Models, a report to the Environment Agency, September 1997.
Carson RT et al (1994): Contingent Valuation and Lost Passive Use: Damages from the Exxon Valdez, Discussion Paper 94-l 8, Washington, DC, Resources for the Future.
Coates P (1996b): Director’s Report for the Quarter Ending 30 June 1996, South Wales Sea Fisheries Committee, 1996.
Coates P & Davies C (1996): AnnuaI Report, Landings of Fish and Shehfrsh to the South Wales Sea Fisheries District & Shehfish Permit Report - 1995.
Cohen MJ (1995): Technological Disasters and Natural Resource Damage Assessment: An Evaluation of the Exxon Valdez Oil Spill, Land Economics, Vo17 1, February 1995, pp65- 82.
R&D Technical Report Pl19 15-l
14.1.36 Although more detailed work involving. consultation with Milford Haven Harbour Authority and others would be required to develop an appropriately costed risk mitigation strategy, it is considered that significant improvements intrafIic management, piloting standards and navigational aids could be achieved cost-effectively.. In addition, many of .: the detailed, recommendations :made : by..MAIB with regard to the preparation and operation of an Emergency Plan could be implemented at a limited cost.
14.1.37 Once. these. measures -had been implemented and been shown to. be -effective, consideration could then be given.to the additional benefits that might accrue from, say, the banning of single hulled tankers and the provision of escort tugs and their likely cost- effectiveness.
14.2 Recommendations
14.2.1 The risks of another major spill involving tensof thousands .of tonnes are significant. Furthermore,- the costs of such spills arehigh: : It is estimated that those associated with : the-Sea Empress were at least &60m Andy could .have been a lot higher had the incident occurred under less favourable circumstances. It is therefore recommended that-measures to reduce the,chances of further such incidents are givena high priority.
14.2;2 It had been hoped that; as part of this study, it would be possible to review and analyse detailed accounts of allrecent-incidents and oil spills in and around Milford Haven through. data provided by the various-authorities; Although comprehensive data have not been forthcoming, in order to provide a more robust basis for further actions, it is recommended that suchan analysis is undertaken in any event.
14.2;3 The development of an effective approach to reducing the chances of further incidents and spills will require Ml co-operation amongst: the various authorities (both- locally, and nationally). It is therefore recommended that steps are taken to restore good relationships on all sides.
14.2.4 It is vital :that data on further incidents and spills are collected, analysed and, as importantly, disseminated in order to monitor the cost-effectiveness of the-improvement measures taken in Milford Haven.
14.2.5 At a national level, it is recommended that.much greater use is made of statistics gathered at both local and national-levels to analyse the causes of incidents in order to provide’ a robust basis for developing risk, reduction strategies. Clearly, such, strategies should ‘. account for the lessons Tom the Seti Empress disaster. (as well as those from previous disasters such as the Braer). l
R&D Technical Report P119 14-6 .’

14.1.28 It was not possible to value health costs to workers, but these are expected to be small due to the limited nunibers of workers involved.
14.1.29 The costs arising from the Sea Empress incident are summarised in Section 11. While the financial costs arising from the spill range between &60 million and 2114 million, economic costs are between &75 million and El06 million.
14.1.30 It should be noted that the costs associated with the oil spill could have been much higher. In particular, it is believed that the timing of the spill and the prevailing weather were key to limiting its impacts. Had the spill occurred later in the year, for example, impacts to tourism and recreation could have been at least two and a half times higher. Had weather conditions been less conducive to natural and chemical dispersion, the environmental effects could have been many times greater. By way of example, the Exxon Valdez oil spill (where conditions were not suitable for dispersant use) was halfthe volume but affected over ten times the length of coastline. Thus, when using the overall costs of the Sea Empress oil spill to examine the cost-effectiveness of various mitigation options it should be remembered that these costs are perhaps atypical of a >30 OOOt oil spill.
14.1.31 The analysis of tanker incidents and oil spills is presented in Section 12. Data were analysed at three levels - international, national (i.e. for UK waters) and local (i.e. for Milford Haven). Although the numbers and types of incidents in UK waters and international waters are broadly comparable, it was found that the incident rate in Word Haven was about twice the national average, accounting for nearly one quarter of tanker incidents in UK waters.
14.1.32 Based on the historical record, the Sea Empress disaster was to be expected. Furthermore, it is probable that another major oil spill (involving tens of thousands of tonnes) will occur within UK waters in the next 12 years. At Milford Haven, another Sea Empress type disaster would be expected within the next 50 years.
.4.1.33 Apart from major spills, there are many lesser incidents (which may or may not result in a spill) as well as many oil spills associated with ship-shore transfer operations. Currently, the Marine Accident Investigation Branch (MAIB) record about 10 incidents per year involving tankers in and around Milford Haven. Furthermore, Milford Haven Port Authority (MIIPA) record nearly 40 oil pollution incidents per year (although 80% involve small spills of less than 160 litres).
14.1.34 Analysis of tanker incidents and associated oil spills indicates that perhaps half can be attributed to simple human error. If the likelihoods of spills (of all sizes) and their associated costs are to be reduced, it would appear that improvements should be first directed towards reducing incidents caused by simple human error.
14.1.35 In relation to Milford Haven, a review of possible mitigation measures, their practicality and likely cost-effectiveness is presented in Section 13. This review includes cross- references to the recommendations which have already been made by MAIB following the formal investigation of the Sea Empress incident.
R&D Technical Report P119 14-5
locations. Applying the replacement costs approach to known losses of marine animals generates a value of go.05 million. However, if estimates of amphipod losses are taken . . into:account; then costs would.be of the order of millions of pounds.
14.1.22 One heavily affetited rocky shoreline species was the limpet and it is expected that in the worst affected areas limpet populations could take between ten to fifteen years to recover. There were also large scale mortalities of barnacles in some areas, but these effects were-. short-lived-and.by October 1996 barnacle densities were similar to those before the spill. In addition, 137 of the population of 150 cushion starfish (Asteuina phylactica) were lost . and recovery has been slow and ~uncertain. That asidej there-does not appear to be any serious or long-term damage to lower shore or rockpool communities.
14.1.23 The oil spill also resulted in some impacts to sediment shores which are particularly important as fish nurseries and are feeding areas for migrant birds. The greatest decrease was of small crustaceans, especially amphipods, with molluscs also being impacted to some extent. With respect to maritime vegetation, while some was impacted by the-oil,. most effects have been short-lived. The saltmarsh in Milford Haven waterway:was most directly impacted by the oil spill and studies have been initiated to map long-term effects.
14.1.24 There was no impact on mammals as a result of the Sea Empress incident, however; large numbers of birds were oiled. The worst hit species was the.common scoter,which made up two thirds of the birds recorded. Most of the rest were auks; mainly guillemots, which together with common scoters and razorbills made up over 90%.-of recorded casualties. These birds are vulnerable to oiling as they spend much time on the surface of the water and dive to feed. In,contrast, many gullsand herring gulls survived oiling,and a number. of important species appear to have avoidedany significant impact. In particular, pufiins, Manx shear-waters and stormpetrels were away Tom the region at the time ofthe spill, and the oil did not reach the important gannet population at Grasshohn Island..
14.1.25 Non-use values can be applied to give a monetary valuation ofthe environmental impacts of the oil spill;: There are three values which appear appropriate for. application to the Sea Empress:. willingness to pay (WTP) values for protecting EC designated beaches from oil :I.:’ pollution gives a valuation of &30 million per event; WTP values for avoiding a moderate. oil spill gives a valuation of &23 million per .event; and WTP values for avoiding .sn Exxon Yaldez type oil spill gives a valuation of 235 million per event.
14i1.26 The valuation of costs to human health is presented in.Section.10:. The %a Empress incident resulted in an increase in the prevalence of certain symptoms amongst the exposed population including headaches; nausea, sore eyes and itching:skin. Takinginto accoun-. exposure to the vapour cloud emanating from the oilspill and exposure to oil on beaches,: acute physical symptoms are valued in the-range go.23 million to &1 .l million.
14.1.27 The oil spill also resulted in psychological impacts, measured& terms of a reduction in. SF-3 6 health scores. These impacts were valued using a stress model which compared the j. stress arising .fiorn-an oil spill with that arising from-floods and other disasters. The resulting-valuations are in the range &0.95-million to &1.9 million,
R&D Technical Report -Pl19 14-4
14.1.15 The impacts of the oil spill on recreational fisheries are presented in Section 7. The main activities affected are freshwater fishing for salmon and sea trout, and sea- and coastal- based angling for bass, cod and other marine species. As for commercial fisheries, impacts mainly stem Tom the operation of the FEZ.
14.1.16 The owners and leasers of fishing rights on affected rivers have claimed compensation from the IOPC Fund for loss of income and other costs. These amount to about go.13 million. However, the operation of the FEZ also resulted in a 21% reduction in the number of angling visits by sahnonid fishermen which can be valued at between SO.56 million and go.95 million. Research also indicates that the oil spill may have adversely affected sea trout catches in the longer-term, although it has not been possible to assign a monetary value to this impact.
14.1.17 Both shore-based and boat-based sea angling were affected by the FEZ. It is estimated that 16% of all bass angling trips were affected by the ban resulting in consumer surplus losses as high as El.7 million. Fishing for cod, plaice and other species was also affected. However, these species are less valued than bass by the sea angler, thus the upper bound of losses is less than &0.3 million. Overall, costs to recreational fisheries are valued at between &0.76 million and &2.7 million.
14.1.18 The impacts of the oil spill on other industry is discussed in Section 8. The (then) three oil refineries at Milford Haven, the ferry horn Pembroke Dock to Ireland, Pembroke Power Station and the defence industry at Castlemartin and Pendine all experienced a negative impact as a result of the spill. However, it has only been possible to value the impacts on the last of these.
14.1.19 Personnel from the Pendine facility were involved in the clean-up of oiled beaches and some business was also lost. For the Castlemartin Range, costs were mainly associated with the loan of vehicles and equipment, the provision of meals for clean-up workers and staff-time. Had the spill occurred when the Castlemartin Range had been firing (March to December), the costs would have been much higher. Some costs to the defence industry were compensated by the IOPC Fund with residual costs valued at between EO.017 million and SO.025 million.
14.1.20 The environmental impacts ofthe oil spill are valued in Section 9. The affected coastline is of outstanding beauty and scientific interest, and most lies within Pembrokeshire Coast National Park, the only national park in Britain primarily designated for its coastal and estuarine landscapes. The main area impacted by the spill contains 35 Sites of Special Scientific Interest and two National Nature Reserves. In addition, part of the area forms one of the UK’s three Marine Nature Reserves and much of the coastline has been defined as Heritage Coast. Parts of the area are further designated by the European Commission as Special Protection Areas under the EC Birds Directive and there are also plans for three Special Areas of Conservation under the Habitats and Species Directive 1992.
14.112 1 In the weeks following the spill, large numbers of dead or moribund marine animals were washed-up on beaches. Longer-term impacts on the offshore marine community appears to be minimal, apart for a reduction in small crustacean species such as amphipods in some
R&D Technical Report Pll9 14-3
14.1.7 Data have allowed three estimates of financial impacts to be made:.Estimates based on the IOPC Fund provide a lower and upper bound of $4 million and &18 million respectively. A higher estimate of costs was provided by the :Wales Tourist Board .which estimates a lower and upper bound of &20 million and &27 million respectively based on reductions. in bed nights.. The widest.range of costs is provided by the Pembrokeshire -Tourism Federation which provides information suggesting that overall tourism performance may, fall between &12 million and &46 million.
14.1.8 The impacts of the oil spill on beach-based and other. recreational activity are presented *. in Section 5. Impacts were not only limited to the time when beaches were heavily oiled, recreational activities after this time being impacted by residual oil and users’ perceptions.
14.1.9 The main activities to be affected by the oil spill .were general-usage of beaches and swimming: With respect to the former, the incident appears to have resulted in the loss of around 450 000 visitor days valued at between go.45 million and Q.3 million., Around 100 000 swimmin g visits may also-have been affected at a value of &0.5 million.
14.1.10 Other affected activities include canoeing/kayaking, jet-skiing, land/sand yachting, sailing, sub-aqua diving, surfing, water-skiing and windsurfing.. In.total, recreational impacts have : been-valued at between &1 million and g2.8 million..
14.1.1 li-.As a result of the oil spill;.the Ministry of Agriculture, Fisheries and Food;.placed a&ban on fishing in anarea covering 2000 km2 (8lOsquare miles)-off the coast. of south west Wales. These impacts and others on commercial-&her-men are reported in Section?.
4.1.12. A number of claims have been made-to the IOPC Fund by:commercial fishermen, with most of these arising .fiom the implementation-of the fisheries exclusion-zone (FEZ). However, fishermenhave also put-forward claims relating to contamination of fishing gear by,oil,-and fish processors have claimed for loss of raw materials. A total of &6.8 million- :. had been-approved for payment by the Fund (by the.end of 1997) of which almost &5.5 million compensates fishermen for the operation of the.FEZ. In addition; claims of the order of &7 million had been rejected by the Fund.
14.1.13 .- With respect to molluscs, the FEZ had a severe impact on winkle landings and some impacts on landings of cockles, .mussels and whelks. There were also impacts on landings . . of crustaceans. In contrast, there was little impact on landings ofwhitefish. Overall, catch, data for the affected area indicates that 1996 catches were down on those for. 1995: However; owing to higher prices in 1996; the value of catch was higher in 1996 than 1995 and indeed on a par with previous years. On this basis,.payments under.the IOPC Fund are surprisingly high;
14.1.14 In total, costs- to commercial fisheries resulting.~t%-om the- oil spill are estimated to lie between g6.8, .million and 210 million. These costs are- mainly associated with, the operation oftheFEZ, with-limited costs associatedwithlongtermimpacts onharvest rates. and reduced markets. It appears.that impacts were limited by three main factors: the timing of the spill, the composition of the oil and the prevailing weather.
R&D Technical Report Pl19 14-2 :
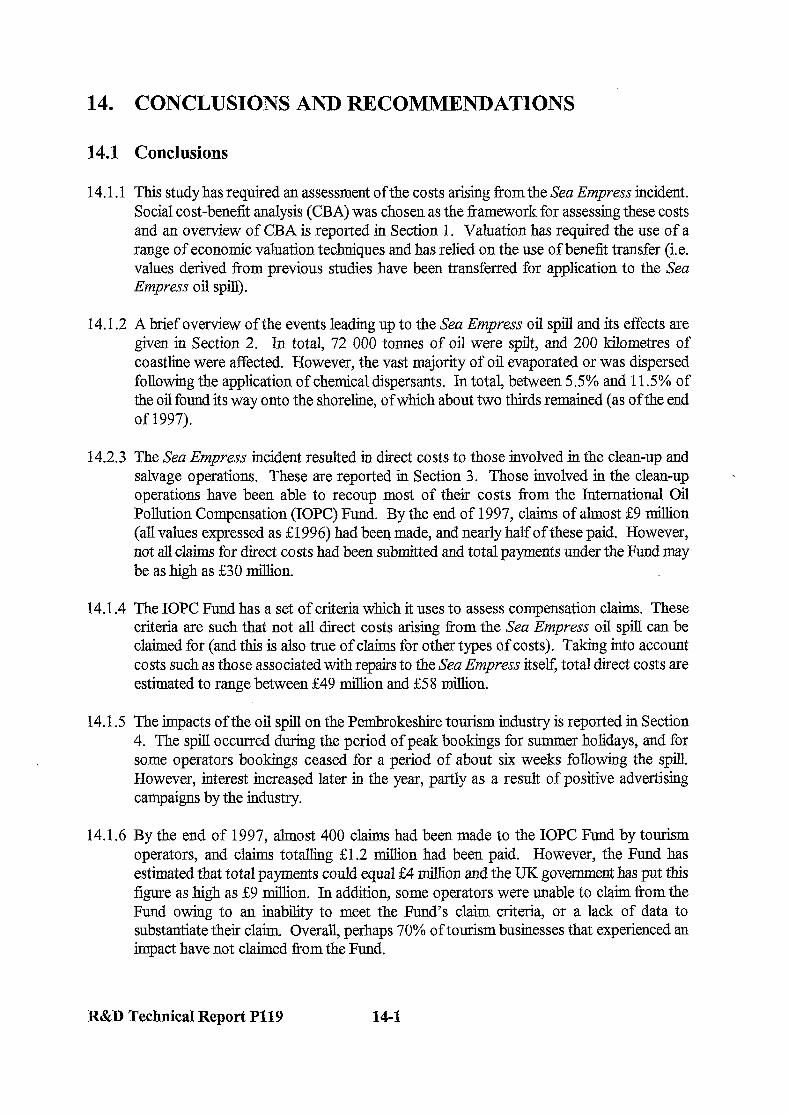
14. CONCLUSIONS AND RECOMMENDATIONS
14.1 Conclusions
14.1.1 This study has required an assessment of the costs arising from the Sea Empress incident. Social cost-benefit analysis (CBA) was chosen as the fi-amework for assessing these costs and an overview of CBA is reported in Section 1. Valuation has required the use of a range of economic valuation techniques and has relied on the use of benefit transfer (i.e. values derived from previous studies have been transferred for application to the Sea Empress oil spill).
14.12 A brief overview of the events leading up to the Sea Empress oil spill and its effects are given in Section 2. In total, 72 000 tonnes of oil were spilt, and 200 kilometres of coastline were affected. However, the vast majority of oil evaporated or was dispersed following the application of chemical dispersants. In total, between 5.5% and 11.5% of the oil found its way onto the shoreline, of which about two thirds remained (as of the end of 1997).
14.2.3 The Sea Empress incident resulted in direct costs to those involved in the clean-up and salvage operations. These are reported in Section 3. Those involved in the clean-up operations have been able to recoup most of their costs from the International Oil Pollution Compensation (IOPC) Fund. By the end of 1997, claims of almost &9 million (all values expressed as &I 996) had been made, and nearly half of these paid. However, not all claims for direct costs had been submitted and total payments under the Fund may be as high as $30 million.
.
14.1.4 The IOPC Fund has a set of criteria which it uses to assess compensation claims. These criteria are such that not all direct costs arising f?om the Sea Empress oil spill can be claimed for (and this is also true of claims for other types of costs). Taking into account costs such as those associated with repairs to the Sea Empress itself, total direct costs are estimated to range between E49 million and &58 million.
14.1.5 The impacts of the oil spill on the Pembrokeshire tourism industry is reported in Section 4. The spill occurred during the period of peak bookings for summer holidays, and for some operators bookings ceased for a period of about six weeks following the spill. However, interest increased later in the year, partly as a result of positive advertising campaigns by the industry.
14.1.6 By the end of 1997, almost 400 claims had been made to the IOPC Fund by tourism operators, and claims totalling 21.2 million had been paid. However, the Fund has estimated that total payments could equal &4 million and the UK government has put this figure as high as &9 million. In addition, some operators were unable to claim from the Fund owing to an inability to meet the Fund’s claim criteria, or a lack of data to substantiate their claim. Overall, perhaps 70% of tourism businesses that experienced an impact have not claimed from the Fund.
R&D Technical Report P119 14-l
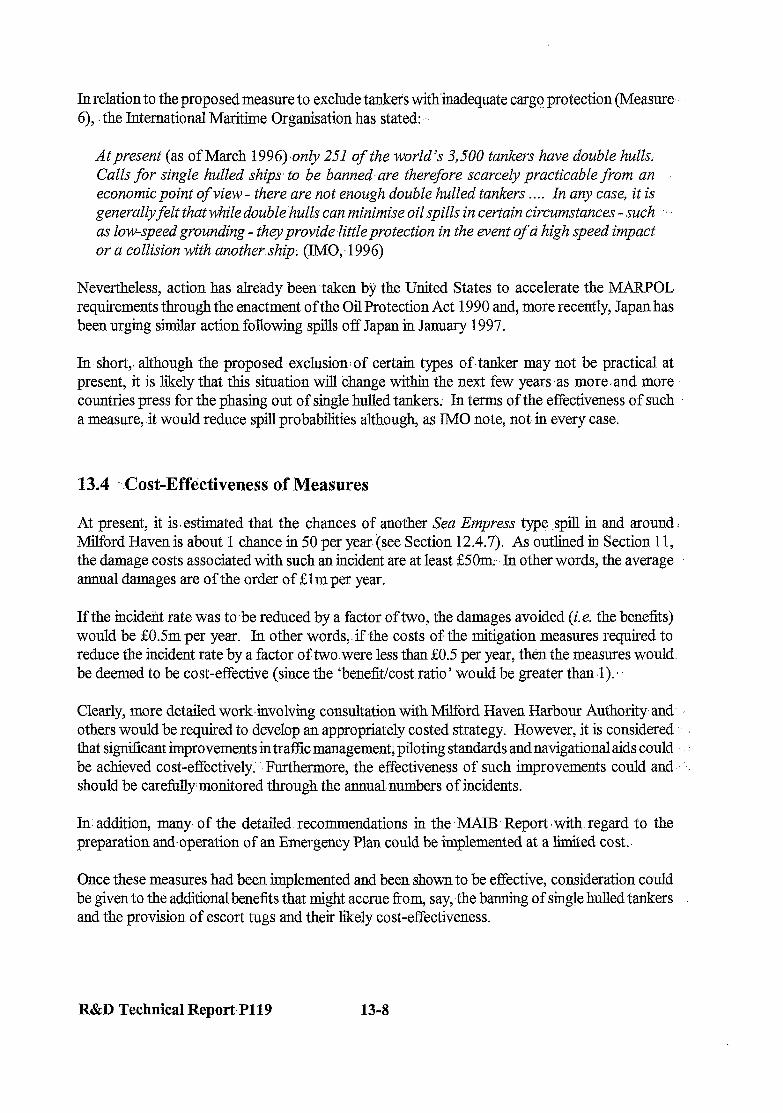
Inrelationto the proposed measure to exclude tankers withinadequate cargo protection (Measure 6), the International Maritime Organisation has stated:-,-
Atpresent (as of March 1996) ,only 251 of the world’s 3,500 tankers-have double hulls. Calls for single hulled ships to be banned-are therefore scarcely practicable from an economic point of view- there are not enough double hulled tankers . . . . In any case, it is generallyfelt that while double hulls can minimise oil spills in certain circumstances - such as low-speed grounding - they provide-little protection in the event of a high speed impact or a collision with anothership. (IMO, 1996)
Nevertheless, action has already been.taken by the United States to accelerate the MARPOL requirements through the enactment of the Oil Protection Act 1990 and, more recently, Japan has been urging similar action following spills off Japan in January 1997.
In short,. although the-proposed exclusion.of certain types of.tanker may not be practical at present, it is likely that this situation will change within the next few years .as more I and more countries press for the phasing out of single hulled tankers. In terms of the efrectiveness of such a measure, it would reduce spill probabilities although, as IMO note, not-in every case.
13.4 --Cost-Effectiveness of Measures
At present, it is. estimated that the chances of another Sea Empress type .spill in and around : Milford Haven is about -1 chance in 50 per year (see Section 12.4.7). As outlined in Section 11, the damage costs associated with such-an incident are at least &5Om,- In other words, the average annual damages are of the order of &?m per year.
If the incident rate was to:be reduced by a factor of two, the damages avoided (i.e. the benefits) would be &0.5m per year. In other words,. if the costs of the mitigation measures required to reduce the incident rate by a factor oftwo.were less than &0.5 per year, then the measures would be deemed to be cost-effective (since the ‘benefit/cost.ratio’ would be greater thanl).
Clearly, more detailed workinvolving consultation with Milford Haven Harbour.Authority and others would be required to develop an appropriately costed strategy. However, it is considered that significant improvements in traffic management; piloting standards and navigational aids could : be achieved cost-effectively: -Furthermore, the effectiveness of such improvements could and- . should be carefully monitored through the annual numbers of incidents.
In addition, many of the detailed recommendations in the MAIB -Report .with regard to the preparation and.operation of an Emergency Plan-could be implemented at a limited cost..
Once these measures had been implemented and been shown to be effective, consideration could be given to the additionalbenefits that might accrue from, say, the banning of single hulled tankers and the provision of escort tugs and their likely cost-effectiveness.
R&D Technical Report-P119 13-8
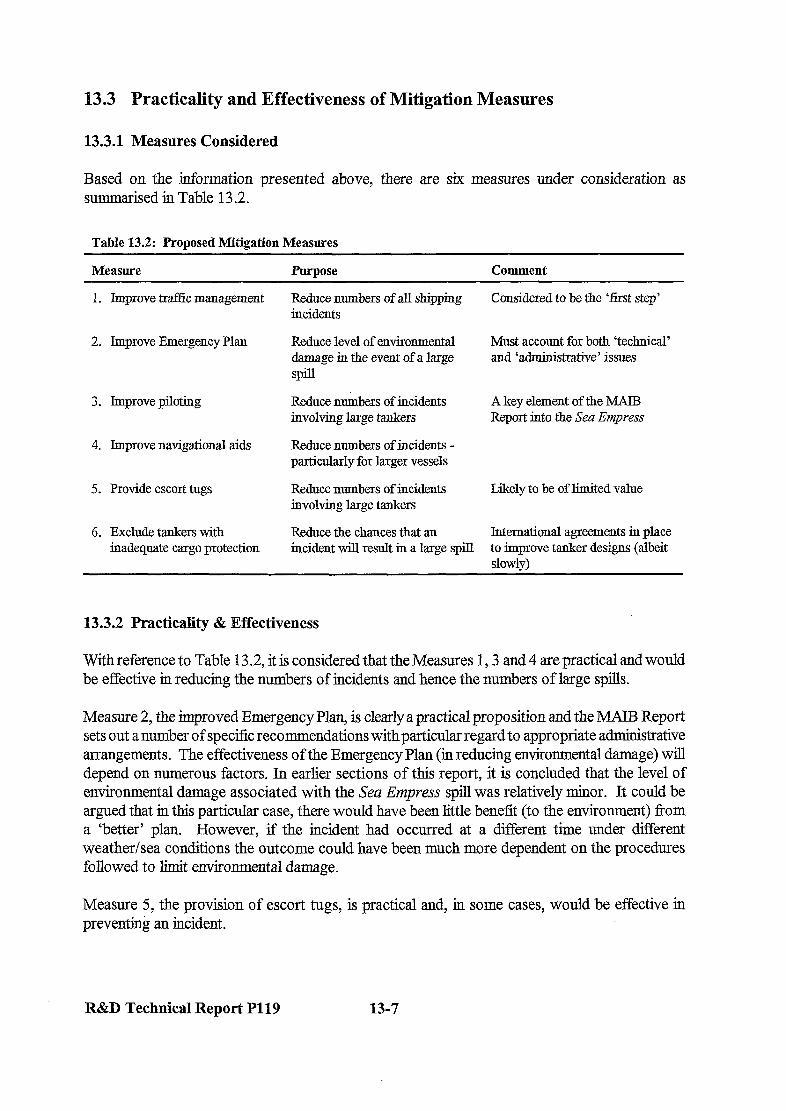
13.3 Practicality and Effectiveness of Mitigation Measures
13.3.1 Measures Considered
Based on the information presented above, there are six measures under consideration as summarised in Table 13.2.
Table 13.2: Prooosed Mitieation Measures
Measure Puruose Comment
1. Improve tmfiic management Reduce numbers of all shipping incidents
Considered to be de ‘first step’
2. Improve Emergency Plan Reduce level of enviromnenttal damage in the event of a large spill
Must account for both ‘technical and ‘administxative’ issues
3. Improve piloting
4. Improve navigational aids
Reduce numbers of incidents involving large tankers
Reduce numbers of incidents - particularly for larger vessels
A key element of the MAD3 Report into the Sea Empress
5. Provide escort tugs Reduce numbers of incidents involving large tankers
Likely to be of limited value
6. Exclude tankers with inadequate cargo protection
Reduce the chances that au International agreements in place incident w-ill result in a large spill to improve tanker designs (albeit
slowlv‘)
13.3.2 Practicality & Effectiveness
With reference to Table 13.2, it is considered that the Measures 1,3 and 4 are practical and would be effective in reducing the numbers of incidents and hence the numbers of large spills.
Measure 2, the improved Emergency Plan, is clearly a practical proposition and the MAIB Report sets out a number of specific recommendations with particular regard to appropriate administrative arrangements. The effectiveness of the Emergency Plan (in reducing environmental damage) will depend on numerous factors. In earlier sections of this report, it is concluded that the level of environmental damage associated with the Sea Empress spill was relatively minor. It could be argued that in this particular case, there would have been little benefit (to the environment) from a ‘better’ plan. However, if the incident had occurred at a different time under different weather/sea conditions the outcome could have been much more dependent on the procedures followed to limit environmental damage.
Measure 5, the provision of escort tugs, is practical and, in some cases, would be effective in preventing an incident.
R&D Technical Report P119 13-7
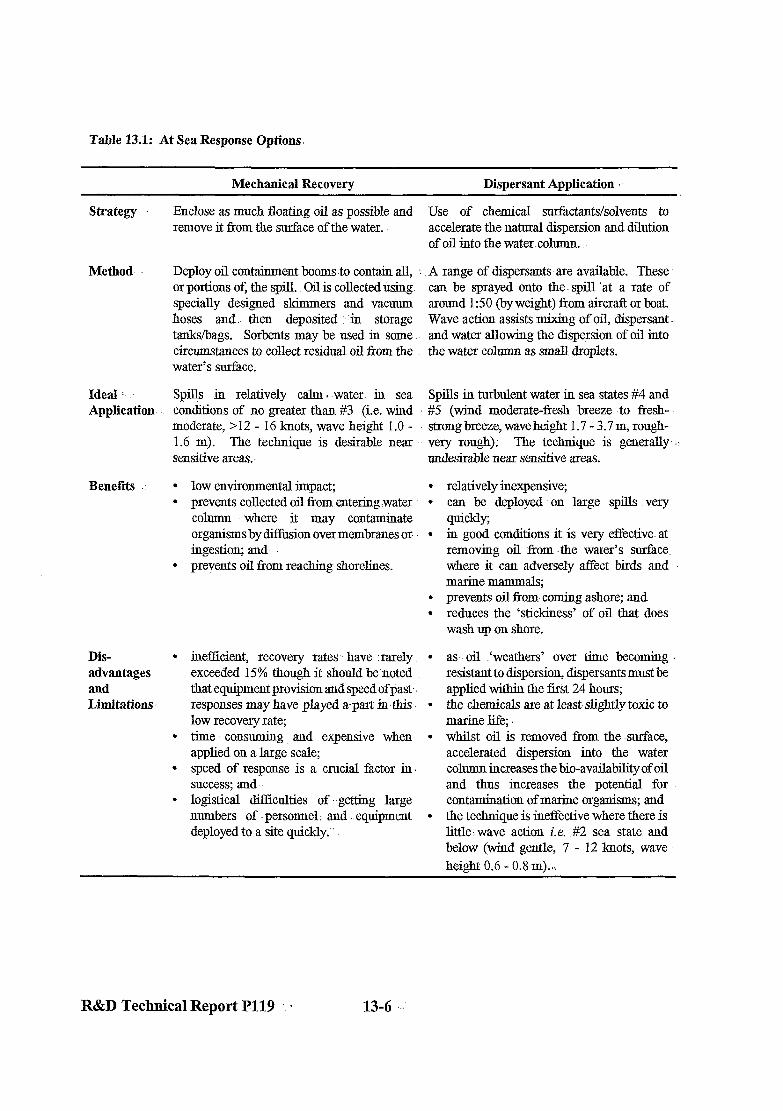
Table 13.1: At Sea Response Options
Mechanical Recovery Dispersant Application
Strategy
Method
Ideal : ‘- Application
Benefits :
Dis- advantages and Limitations
Enclose as much floating oil as possible and remove it fkom the surface of the water.
Deploy oil contaimnent booms to contain ah, or portions of, the spill.. Oil is collected using specially designed skimmers and vacuum hoses and: then deposited ,-‘in storage tanks/bags. Sorbents may be used in some circumstances to collect residual oil Corn the water’s surface.
A range of dispersants are available. These can be sprayed onto the. spill ‘at a. rate of around 1: 50 (by weight) from aircraft or boat. Wave action assists mixing of oil, dispersant and water allowing the dispersion of oil into the.water column as small droplets.
Spills in relatively calm I -water. in sea con&ions of no greater than #3 (i.e. wind
Spills in turbulent water in sea states $4 and #5 (wind moderate-fresh breeze to fresh-
moderate, >I2 - 16 knots, wave height 1.0 - strong breeze, wave height 1.7 - 3.7 m, rough- 1.6 m). The technique is desirable near very rough). The technique is generally .! sensitive areas.- undesirable near sensitive areas.
low environmentaJ. impact; prevents collected oil from entering.water column where it may contaminate organisms by ditTosion over membranes or. ingestion; and prevents oil Corn reaching shorelines.
inefficient, recovery rates have rarely exceeded 15% though it should be noted that equipment provision and speed ofpast responses may have played a-part intbis low recovery rate; time consuming and expensive when applied on a large scale; speed of response is a crucial factor in success; and logistical diftkulties of getting. large numbers of personnel : and equipment deployed to a site quickly.
Use of chemical surfacta.nts/solvents to accelerate the natural dispersion and dilution of oil into de water. cohmm.
relatively inexpensive; can be deployed on large spills .very quickly; in good conditions it is very effective at. removing oil from ‘the water’s surface. -where it can adversely afkt birds and marine mammals; prevents oil Tom coming ashore; and reduces the ‘stickiness’ of oil that does wash up on shore.
as oil .‘weathers’ over lime becoming resistant to dispersion, dispersants must be applied within de Ii& 24 hours; the chemicals are at least slightly toxic to marine He; whilst oil is removed from the surface, accelerated dispersion into the water column increases the bio-availability of oil and thus increases de potential for contamination of marine organisms; and the technique is ineffective where there is little: wave action i.e. #2 sea state and below (wind gentle, 7 - 12 knots, wave height 0.6 - 0.8 m).,:
R&D Technical Report P119 ‘. ’
‘Natural’ clean up and in-situ burning do not receive any further attention in this assessment as neither are suitable for application to Milford Haven. In the case of ‘natural’ clean up, this technique is only really applicable to open sea spills that are unlikely to come ashore. In-situ burning is unlikely to be a practical proposition for spills in and around Milford Haven due to the proximity of populated areas. Brief details on the re maining clean up options are provided in Table 13.1.
Once oil begins to wash up on the shore, the extent of the environmental damage from an oil spill is multiplied many-fold. In addition, the clean up of the oil spill becomes significantly more difhcuh. In the event that it becomes inevitable that oil will wash up on shore, there are effectively three responses that can be applied, ideally in combination. These options are:
. protect sensitive areas;
. clean up the shorelines; and
. allow ‘natural’ cleaning.
Sensitive areas can be protected by employing containment booms along the length of sensitive shoreline. Depending on the location, these areas might include fisheries, ecologically ‘valuable’ sites and tourist beaches7’.
Deployment of booms with weighted ‘skirts’ can effectively contain oil in current under washes of up to around 1.6 km/hr. In under washes above this, oil which builds up against the ‘floating wall’ gets carried underneath or, in fairly extreme conditions, over the top. For this reason deployment of mechanical recovery equipment at sea at such sites can be extremely beneficial, minimising or stopping oil horn coming ashore.
Oil behaves differently on different beach types. On pebble and shingle shores oil has a tendency to ‘sink’ into the substrate where it can gradually work its way down to form a reservoir. On such beaches re-oiling of a cleaned beach can be extremely problematic. On rocky shores 03 cannot sink into the substrate. As a result it clings to rocks and associated organisms with excess remaining in the sea. On sandy shores the substrate size is small enough to prevent most oil from sinking beneath the surface.
There are a number of d.ifEerent methods that can be employed to clean up oil that has washed up on shore. The method employed depends on the type of beach and each method has its own drawbacks in terms its environmental effects. The options available for cleanup of dif%erent beach types and their associated environmental impacts are too numerous for inclusion in this report.
In some circumstances, the best environmental option may be to leave some shorelines alone as clean up efforts may prove more damaging than the oil itself. By way of example, use of high pressure hoses or steam cleaning can effectively heat-kill or physically remove organisms from rock surfaces. Such clean up operations can effectively finish the job that the oil started.
79 It is interesting to note that in his report &fir ,%ips, Cleaner Seas after the Braer incident, Lord Donaldson (1994) proposed a scheme ofMarine Environmentally Hi& Risk Areas (MEHfXAs) that would feature not only on the Seaway Code but might also be marked on Admiralty Charts.
R&D Technical Report P119 13-5
13.2.4 Reducing Envirimmental Damage
Overview
Given a large spill, enviromental damage can be limited by taking- appropriate action. Initially, this may be through limiting the size of the release (by lightening for example). Subsequently, the: degree of environmental damage may. be influenced- by the use of dispersants. and clean-up methods. Clearly, the appropriate strategy will depend on-various factors such .as prevailing weather and sea conditions, nature of cargo spill (for example, a large spill ofvolatile gasoline will evaporate reasonably quickly with no intervention), quantity and rate.of spill, nature of receiving environment (rocky coastline versus sandy beaches), etc.
Sucha-strategy must be inkenced by the results of the detailed studies undertaken into the effects of such spills as the .Sea Eriprexs, Enon Valdei, etc. Of course, for the strategy to be implemented-promptly and effectively it must form part of an overall emergency plan and this is reinforced by the MAIB Report (Recommendations 9, 18, and 22 refer).
An important part of implementing an Emergency Plan is the involvement of other parties and .I clear definitions of responsibilities. By way of example, the relationship between the salvors. and .. those responsible for limiting the enviromnental.damage needs to be clearly defined since there may- be conflicts in determinin g .the :‘best’ response to a particular,situation. This matter is considered in some detail by MXB and various recommendations for improving the administrative management of a ‘disaster!~(including the liaison with salvors) are put,forward (Recommendations 9, 15, 19,20,21,23 and 24).
Factors which affect Environmental Damage
To provide an illustration of some of the (technical) factors which-need to be accounted for in the preparation of an appropriate Emergency Plan, consideration is given to a major spill of crude oil at sea.
The oil will spread.out across the water’s surface, typically.at a speed.of around. 1 - 3 km/h 1 depending on oil type. Within the first few.hours of a spill, most of the more toxic lighter traction compounds will.have evaporated. After 2 days of evaporation; the spill size will have reduced by as much as 50% but typically between 35 and 45%.depending.on oil type. In sea conditions of #3 (moderate) and above (i.e. wind moderate, >12 - 16 knots,,wave height 1 .O - 1.6 m) natural dispersioninto the water column is at an optimum. Oil becomes attached to particulate matter and drawn into the water column. Oils with high asphaltene content often form persistent emulsions after a few- days at sea.
In essence, there are four options for tackling an oil spill at sea:
. mechanical containment and-recovery;
. dispersant application;
. in-situ burning; and .I
. ‘natural’- clean up (do nothing).
R&D Technical Report I?119 13;4
13.2.3 Reducing Spill Probabilities
In broad terms, it might be expected that spills can be grouped into three:
. small spills (perhaps a few hundred litres) associated with leaks during the loading/discharge operations;
. medium spills (perhaps a few tens of tonnes) associated with failures of ship-shore connections, overflows from tanks, etc.; and
. large spills (perhaps hundreds of tonnes or more) associated with damage to cargo tanks on tankers.
It is considered that a more detailed analysis of the 40 or so pollution incidents per year in Milford Haven would provide a robust basis on which to reduce the occurrence of small and medium spills through improved procedures and management.
Large spills will tend to be associated with a serious tanker incident (grounding, collision, fire/explosion and major structural/mechanical failure). Given the occurrence of the initiating event, there will be often be a limited amount oftime in which to take prompt and effective action. By way of example, the MAIB Report notes that:
By the time it was recognised that the course change was inadequate, Sea Empress was already within two minutes of grounding . . . (para 9.3, MAIB, 1997b)
Similarly in the event of an explosion or a collision for example, the damage which results in a spill has already occurred.
With these points in mind, there has been considerable discussion at an international level on the introduction of new tanker designs. By way of example, the provision of double hull tankers is covered by the International Convention for the Prevention of Pollution from Ships (MARPOL). The MARPOL requirement for double hull (or equivalent) tankers were enacted in the UK by the Merchant Shipping (Prevention of Oil Pollution) Amendment Regulations 1993. As a result, all new tankers over 5000 dwt should be of double hull construction and all existing tankers will comply by 2026. As a result, it will be some years before a significant proportion of the shipping visiting Milford Haven will be of double hull construction. Nevertheless, the MAIB Report indicates that such regulations could be improved (Recommendations 16 and 17).
Although the annual rate for ‘serious casualties’ involving tankers has remained surprisingly constant for the past 30 years (see Table 12.4), the probabilities of large spills have decreased in recent years (see Table 12.5) which might reflect the gradual improvement in the degree of cargo protection provided on modern tankers.
Against this background, one possible mitigation measure would be to exclude tankers without ‘appropriate’ levels of cargo protection from sensitive environmental areas such as Milford Haven.
R&D Technical Report Pll9 13-3

13.2.2 Reducing the Chances of an Incident
As discussed in Section 12.4.4; the incident rate (associated with incidents per tanker movement) in Milford Haven appears to be twice the national average. Furthermore, by inspection of recent I incidents recorded by MAIB (see Annex 12), it would appear that many are due to simple human error.
It had been hoped that,.as part of thisstudy, it would be possible to review and analyse detailed accounts of all recent incidents in and around MiBord Haven through data provided by the,various authorities. In order to provide a more robust basis for further. actions, it is recommended that such,an analysis is undertaken in any event. . .
Nevertheless, the first recommended-mitigation measure is to improve the monitoring; control and enforcement action. This might be termed improved trafEc management through use of radar-and responding pro-actively to situations which may result in vessels passing too close, vesseis moving without permission etc. At the outset, this clearly. requires the provision of a. fully operational radar system (which is covered by Recommendation 4 of the MAIB Report):,,- Once.potential deviations are observed horn the radar, there should be prompt and effective intervention from the Word Haven Port Authority (for example by direct communication with the vessels and/or the use of a patrol launch). For cases where there has been a disregard of appropriate procedures (for example, unauthorised vessel movements), appropriate emorcement action should be taken.
For large tankers, such as the Sea Empress, the MAIB Report makes a series of recommendations concerning the improvement of the,: standsirds of. piloting- (with ,particular ! reference to Recommendations 1;,2; 3,5,6,;7,12,13 and 14). Inbroad terms, it would be difhcult to.disagree with these recommendations. However; it is ofnote that in Annex. 12, two dangerous occurrences arerecorded inwhichlarge tankers enteredMilford Havenwithout pilots - contraryto procedures. In other words, it is probably more important to improve the general traffic management rather than the quality. of the pilots.
The third area of mitigation is to improve the level-of navigational aids including designated channels, the provision of accurate charts and improved lighting. These matters are dealt with by Recommendations8 and.-1 1 and, as above, it would be diGcult to disagree with these.
Although escort tugs have been considered, it is unlikely that their presence would be effective.in preventing a disaster in all cases. There are a number .of issues which are discussed in the MAB I Report (Section.9 refers) which result in the recommendation that the matter should be examined further (Recommendation 10). It is our view that in relation to the prevention of tanker incidents generally (Le. not just those involving large takers), the benefits of escort tugs willbe limited and perhaps not as cost-effective as the other measures outlined above.
With improved traffic-management, piloting,standards and navigational aids, it might be expected that the overall tanker incident rate would:be reduced,by at least a factor of,two (i.~ at least to the national average).
R&D Technical Report Pl19 13;2
13. MITIGATION MEASURES
13.1 Overview
For a proposed risk mitigation measure to be implemented, there are criteria to be satisfied which include:
. the existing risk should be ‘significant’ - in other words, there is little merit in reducing a risk of negligible proportions;
. the proposed risk mitigation measure should be a practicable proposition;
. the proposed risk mitigation measure should reduce the overall risks - in some cases, a slight reduction in risks associated with one activity might lead to a significant increase elsewhere; and
. reductions in risk to be achieved should be compared with the associated costs to ensure that the proposed risk mitigation measure will be cost-effective.
In relation to Milford Haven, the records show that there are ten tanker incidents per year (see Table 12.18) and an oil spill of more than a 1000 t every ten years or so (see Table 12.19). Against this background, it would appear that the existing risks are ‘significant’ and that risk mitigation is required.
13.2 Possible Mitigation Measures
13.2.1 Overview
The Sea Empress disaster has been subject to a formal investigation &TAB, 1997b) which resulted in 24 recommendations covering such topics as improving the standards of piloting, reviewing emergency plans and procedures and urging the International Maritime Organisation to review regulations for tanker design. It is not the intention of this Section to review the practicality and cost-effectiveness of each of these recommendations in detail although reference to them will be made.
Rather, the intention is to ‘stand back’ from the Sea Empress disaster and consider some of the more general issues involved. In broad terms, risk mitigation can be directed to:
. reducing the chances of an incident;
. reducing the chances that an incident will escalate to a spill; and
. reducing the chances that a spill will lead to extensive environmental damage.
These are briefly reviewed in turn below.
R&D Technical Report P119 13-l
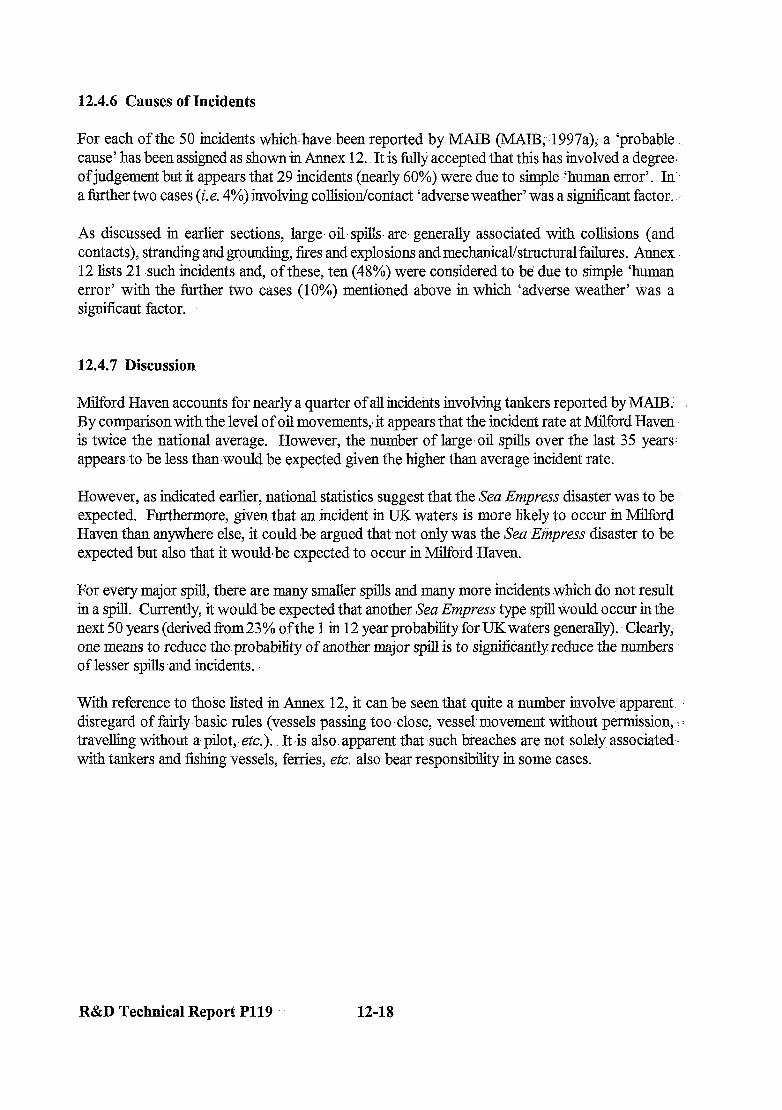
12.4.6 Causes of Incidents
For each of the 50 incidents whichihave been reported by MAIB’(MAIB;.1997a); a ‘probable. cause? has-been assigned as shown in Annex 12. It is fully accepted that this has involved a degree. of judgement but it appears that 29 incidents (nearly 60%) were due to simple ‘human error’. In a further two cases (i.e. 4%) involving collision/contact ‘adverse weather’ was a significant factor..
As discussed -in earlier sections, large oil spills are generally associated with collisions (and contacts), stranding and grounding, fires and explosions and mechanical/structural failures. Annex 12 lists 21 such incidents and, of these, .ten (48%) were considered to be due to simple ‘human error’ with the further two cases (10%) mentioned above in which ,‘adverse weather’ was a significant factor.
12.4.7. Discussion
Milford Haven accounts for nearly a quarter of all incidents involving tankers reported by MAE By comparison with the level of oil movements,- it appears that the incident rate at Milford Haven is twice the national average. However, the number of large, oil spills over the last 35 years- appears-to be less than-would be expected given the higher than average incident rate.
However, as indicated earlier, national statistics suggest that the Sea Empress disaster was to be expected. Furthermore, given that an incident in UK waters is more likely to occur in Milford Haven than anywhere else, it could ,be argued that.not only was the Sea Erizpress disaster to be expected but also that it would,be expected to occur in Milford ,Haven.
For every major spill, there are many smaller spills and many more incidents .which do not result in a spill. Currently, it would be expected that another Sea Empress type spill would occur in the next 50 years (derived fkom 23 % of the 1 in 12 year probability for UK waters generally). Clearly; one means to reduce the probability of another major spill is to signifkantly reduce the numbers of lesser spillsand incidents.
With reference to those listed in Annex- 12, it can be seen that quite a number involve apparent disregard of fairly basic rules (vessels passing too .close, vessel movement without permission, : : travelling without a pilot, etc.). It is also. apparent that such breaches are not solely associated. with tankers and fishing vessels, ferries, etc. also bear responsibility in some cases.
R&D Technical Report P119 12-18
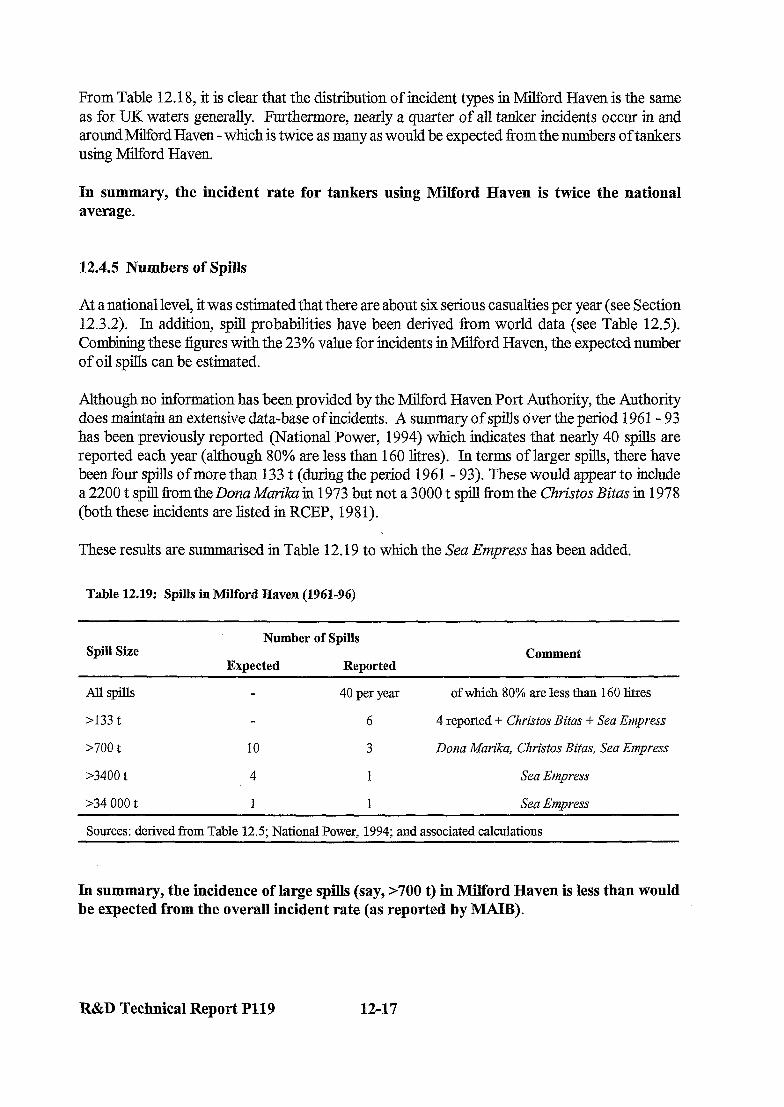
From Table 12.18, it is clear that the distribution of incident types in Milford Haven is the same as for IX waters generally. Furthermore, nearly a quarter of all tanker incidents occur in and aroundmord Haven - which is twice as many as would be expected from the numbers of tankers using Milford Haven.
In summary, the incident rate for tankers using M3ford Haven is twice the national average.
12.4.5 Numbers of Spills
At a national level, it was estimated that there are about six serious casualties per year (see Section 12.3.2). Jn addition, spill probabilities have been derived from world data (see Table 12.5). Combining these figures with the 23% value for incidents in Milford Haven, the expected number of oil spills can be estimated.
Although no information has been provided by the Milford Haven Port Authority, the Authority does maintain an extensive data-base of incidents. A summary of spills over the period 1961- 93 has been previously reported (National Power, 1994) which indicates that nearly 40 spills are reported each year (although 80% are less than 160 litres). In terms of larger spills, there have been four spills of more than 133 t (during the period 1961 - 93). These would appear to include a 2200 t spill fiomthe Dona Mar&a in 1973 but not a 3000 t spiu from the Christos Bitas in 1978 (both these incidents are listed in RCEP, 198 1).
These results are summaris ed in Table 12.19 to which the Sea Empress has been added.
Table 12.19: Spills in Milford Haven (1961-96)
Spill Size Number of Spills
Expected Reported Comment
Allspills
>I33 t
>700 t
>3400 t
.34 000 t
10
4
1
40 per year of which 80% are less than 160 litres
6 4 reported + Christos Bitas + Sea Empress
3 Dona Marika, Christos Bitas, Sea Empress
1 Sea Empress
1 Sea Empress
Sources: derived from Table 12.5; National Power, 1994; and associated calculations
In summary, the incidence of large spills (say, >700 t) in Milford Haven is less than would be expected from the overall incident rate (as reported by MAIB).
R&D Technical Report Pl19 12-17
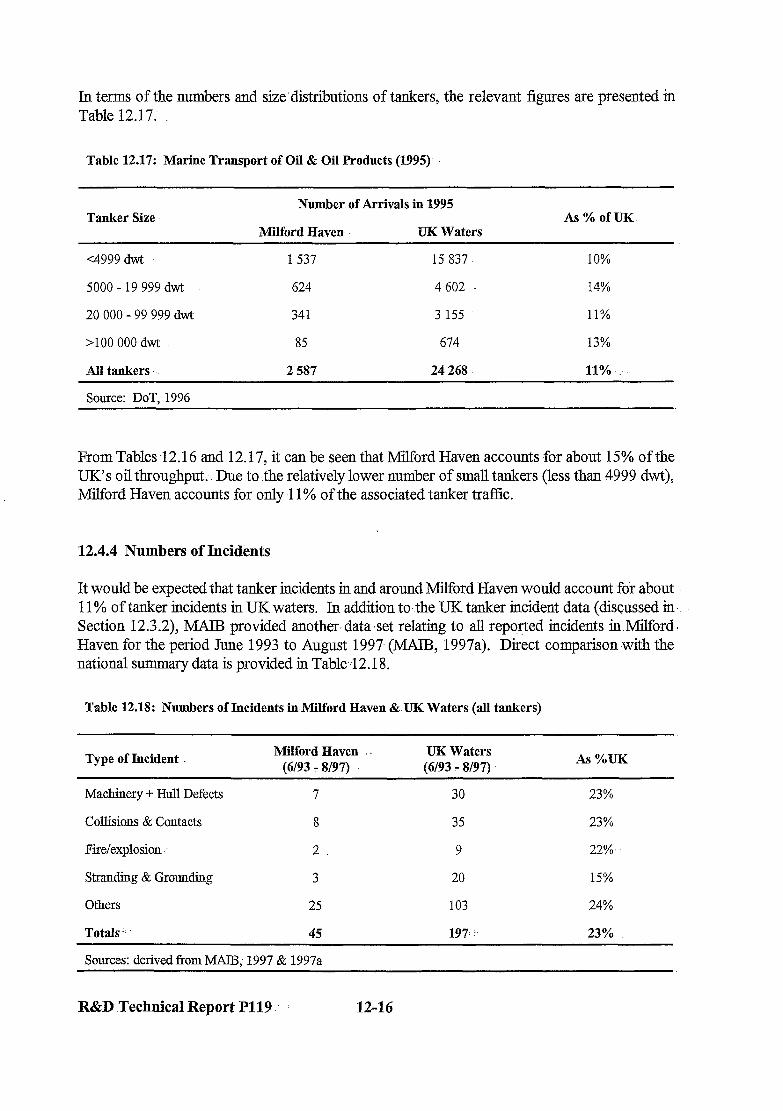
In terms of the numbers and size’distributions of tankers, the relevant figures are presented in Table 12.17:
Table 12.17: Marine Transport of Oil & Oil Products (1995)
Tanker Size Number. of Arrivals in 1995
Milford Haven- UK Waters As%ofUK
<4999 dwt 1 537 15 837 10%
5000 - 19 999 dwt 624 4 602 14%
20 000 - 99 999 dwt 341 3 155 11%
>I00 000 dwt 85 674 13%
All tankers. 2 587 24 268 11%
Source: DOT. 1996
From Tables 12.16 and 12.17, it can be seen that Milford Haven accounts .for about 15% of the UK’s oil throughput,-. Due to the relatively lower number of small tankers (less than 4999 dwt), Milford Haven accounts for only.1 1% of the associated tanker traffic.
12.4.4 Numbers of Incidents
It would be expected that tanker incidents in and around Milford Haven would account for about 11% of tanker incidents in UK waters. In addition to the UK tanker incident data (discussed in’ Section 12.3.2), MAIB provided another. dataset relating to all reported incidents in Milford! Haven for the period June 1993 to August 1997. (MAIB, 1997a). Direct comparison with the national summary data is provided in Table-:12.18.
Table 12.18: Numbers of Incidents in Milford Haven &UK Waters (all tankers)
Type of Incident Milford Haven .
(6193 - 8197). UK Waters (6193 - 8197)
As %uK
Machinery -t Hnll Defects 7 30 23%
Collisions & Contacts 8 35 23%
Fire/explosion 2 9 22%’
Stranding & Grounding 3 20 15%
Others 25 103 24%
Totals ;; 45 197: i 23%
Sources: derived from MAIB; 1997 & 1997a
R&D Technical Report P119 12-16
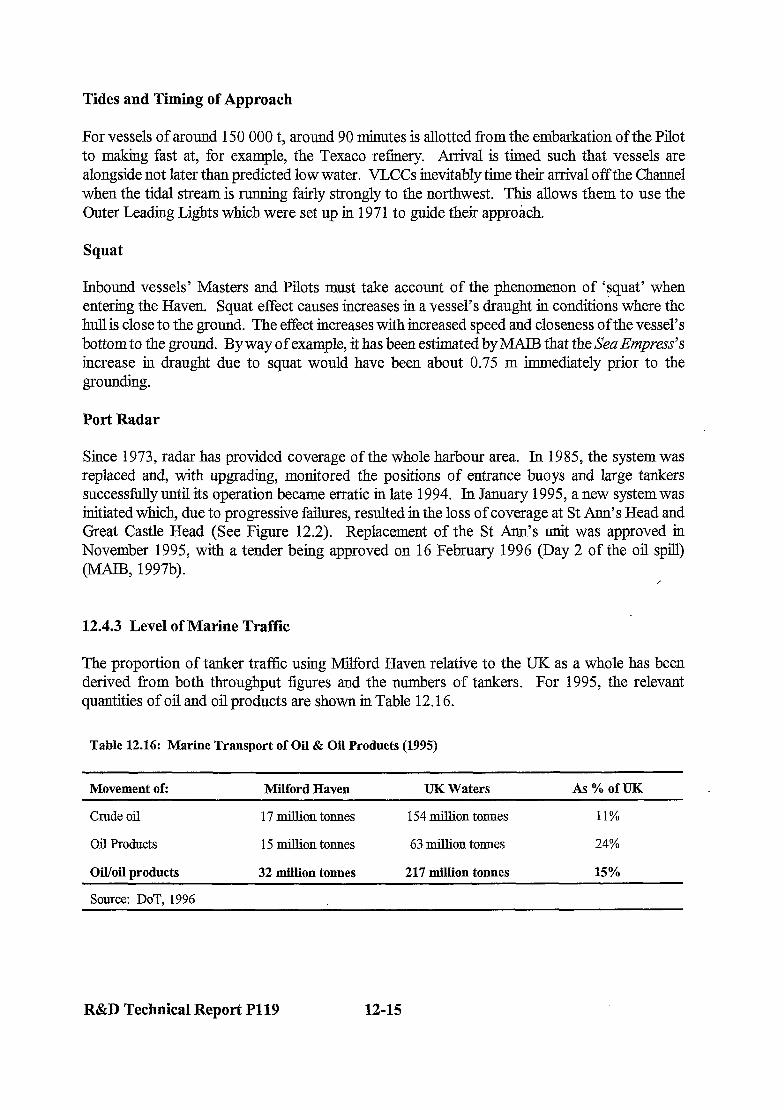
Tides and Timing of Approach
For vessels of around 150 000 t, around 90 minutes is allotted from the embarkation of the Pilot to making fast at, for example, the Texaco refinery. Arrival is timed such that vessels are alongside not later than predicted low water. VLCCs inevitably time their arrival off the Channel when the tidal stream is running fairly strongly to the northwest. This allows them to use the Outer Leading Lights which were set up in 1971 to guide their approach.
Squat
Inbound vessels’ Masters and Pilots must take account of the phenomenon of ‘squat’ when entering the Haven. Squat effect causes increases in a vessel’s draught in conditions where the hull is close to the ground. The effect increases with increased speed and closeness of the vessel’s bottom to the ground. By way of example, it has been estimated by MAIB that the Sea Empress’s increase in draught due to squat would have been about 0.75 m immediately prior to the grounding.
Port Radar
Since 1973, radar has provided coverage of the whole harbour area. In 1985, the system was replaced and, with upgrading, monitored the positions of entrance buoys and large tankers successfully until its operation became erratic in late 1994. In January 1995, a new system was initiated which, due to progressive failures, resulted in the loss of coverage at St Ann’s Head and Great Castle Head (See Figure 12.2). Replacement of the St Ann’s unit was approved in November 1995, with a tender being approved on 16 February 1996 (Day 2 of the oil spill) (MA& 1997b).
12.4.3 Level of Marine Traffic
The proportion of tanker traffic using Word Haven relative to the UK as a whole has been derived from both throughput figures and the numbers of tankers. For 1995, the relevant quantities of oil and oil products are shown in Table 12.16.
Table 12.16: Marine Transport of Oil & Oil Products (1995)
Movement of: Milford Haven UK Waters As%ofuK
Crude oil
Oil Products
Oil/oil uroducts
17 million tonnes
15 million tonnes
32 million tonnes
154 million tonnes
63 million tomes
217 million tonnes
11%
24%
15%
Source: DOT, 1996
R&D Technical Report P119 12-15
ANNEX 1: LIST:OF CONSULTEES
Al. CONSULTEES
Activity Wales Advisory Committee on Oil Pollution of the Sea (ACOPS) British Mountaineering Council British Resorts Association British Water Ski Federation- Carmarthenshire Fishermen’s Federation Centre for Environment, Fisheries and Aquaculture Science (CEFAS) Coastal Voyages Cardigan Bay Boat -Trips Dale Sailing (Island- Odyssey) Department of Environment, Transport and.the Regions (DETR) ,’ Department of Health Dyfed Powys Health.Authority English Tourist .Board Environment. Agency Fishguard Chamber of Commerce Haverford West and St Brid&.Bay Tourism Association Institute of Environmental Assessment International Maritime Organisation @MO) ; International Oil Pollution Compensation Fund (IOPC) International Tanker Owners Pollution Fund (ITOPF) Irish Ferries Joint Response Centre (JRC) L&R Leisure/Consulting Lloyds of London Publishing Limited (LLP ltd.) Marine Accident Investigation Branch (MAIB) Marine Pollution Control Unit (MPCU) Marine Safety Agency (MSA) ‘. -Milford Haven Coast Guard Milford Haven Poti.Authority (MHPA) Milford Haven Tourism Association Ministry of Agriculture, Fisheries and Food (MAFF) Ministry of Defence Morgwnnyg Health Authority Neyland Yacht Club Oil Pollution Research Unit (OPRU) Pembrokeshire Coast National Parks Authority (PCNPA) Pembrokeshire County Council: various departments and individuals (PCC) Pembrokeshire Hotels and Restaurants Association Pembrokeshire ,Tourism Federation Pembrokeshire Tourist Attractions Association Pembrokeshire Watersports Pembrokeshire Yacht Club ‘: Pendine Range Royal Society for. the Prevention of Cruelty to Animals (RSPCA) Scarborough Tourism Economic-Activity Monitor (STEAM) -.
R&D Technical Report P119 : Al-3
Sea Empress Environmental Evaluation Committee (SEEEC) Sea Empress Fisheries Claimants Association Sea Empress Solicitors Group Simon Jackson Solicitors South Wales Sea Fisheries Committee Sports Council for Wales St. Davids Peninsula Tourist Association Thousand Island Expedition Tourism South & West Wales University of Wales, Swansea Wales Tourist Board Welsh Association of Sub-Aqua Clubs Welsh Canoeing Association Welsh Economy Business Unit, CardiffBusiness School Welsh Federation of Sea Anglers Welsh Office Welsh Waterskiing Association Welsh Yachting Association West Wales Windsurfing Centre Wildlife Trust West Wales
In addition to these organisations, a number of individuals have been contacted for information. These have included: charter boat operators, tackle shop owners, hire operators, land yachters and paracarters and a number of other key individuals some of whom wish to remain anonymous.
R&D Technical Report P119 Al-4
ANNEX 2: SITE SENSITIVITY MAPS

Annex 2 Contents: :
Map 1 Broad Haven to St .Ann’s Head IMap 2. Skokholm Island.to Newgale- Sands Map 3 Newgale Sands to Ynys Deullyn. -.~ Map 19 Greenala Point to Marros Sands: -Map 2q . Marros Sands.to Pembrey Burrows
Reproduction of these maps has kindly been granted by the Oil Pollution Research Unit (OPRU) in Pembrokeshire. They are taken from:
Moore J and Elliot R (1995): Oil.S#l SensitivitjQMaps for the West Coast of Wales; Second :L Edition. A report fi-om the Oil Pollution Research Unit to Marathon Oil UK Ltd. -Report . . No. FSC/RC,‘17/95.
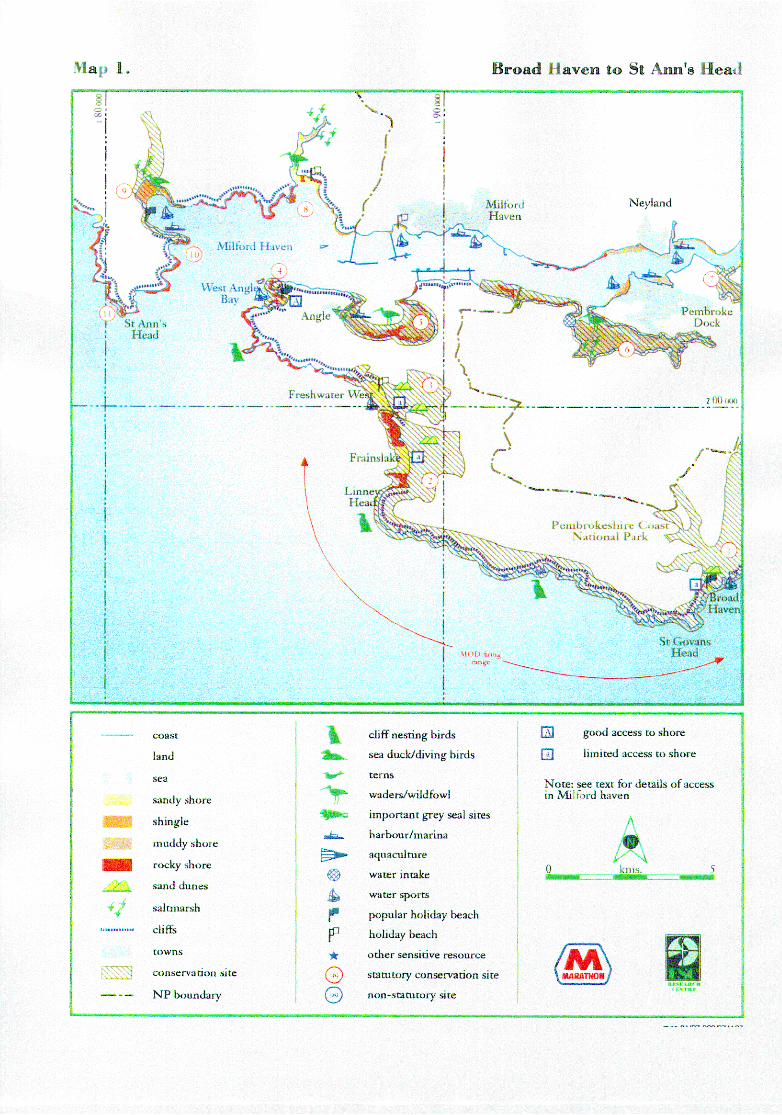
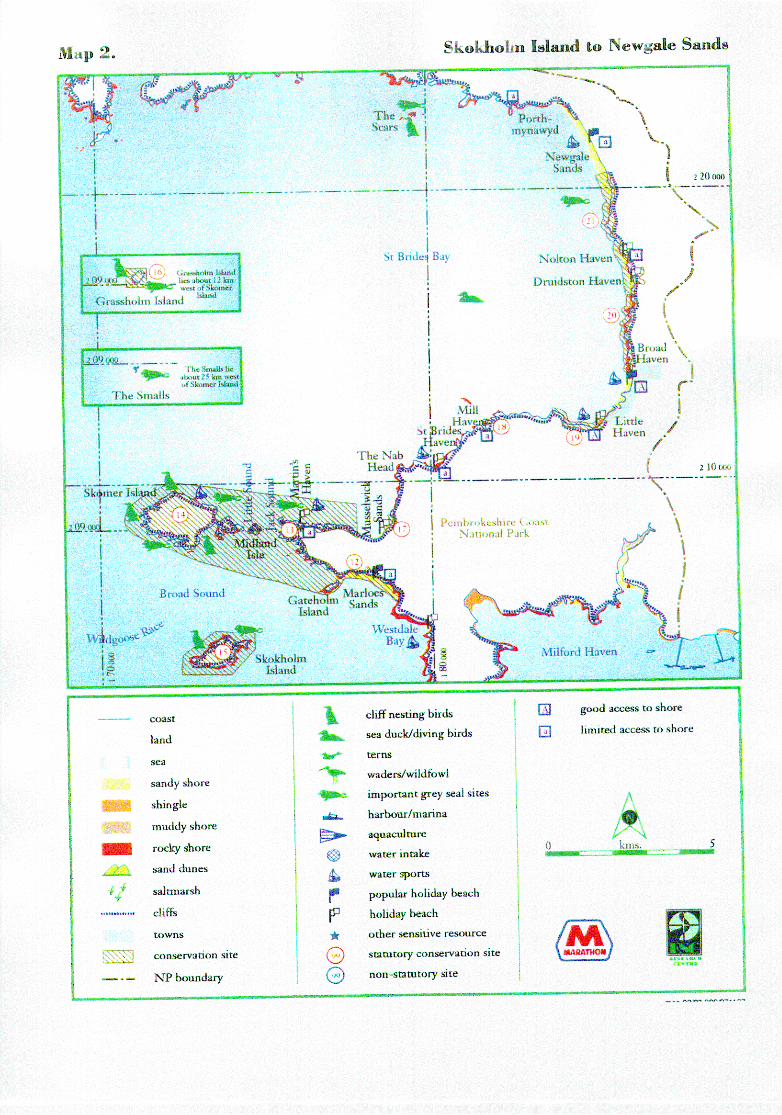
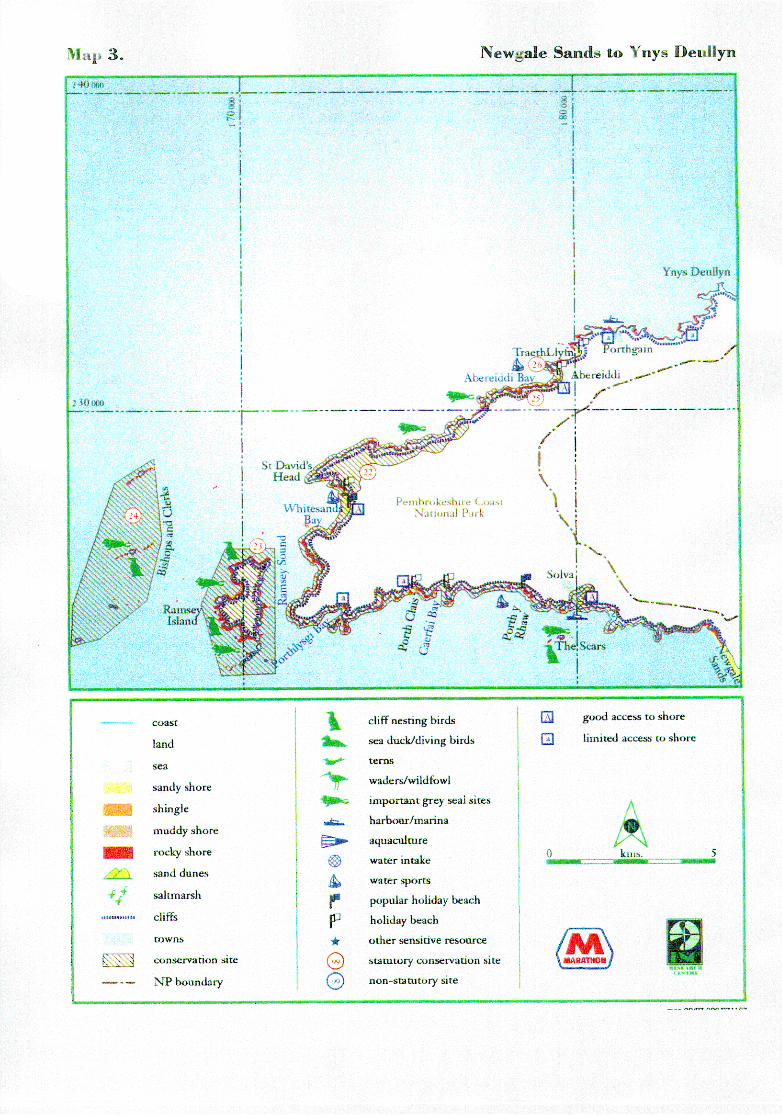
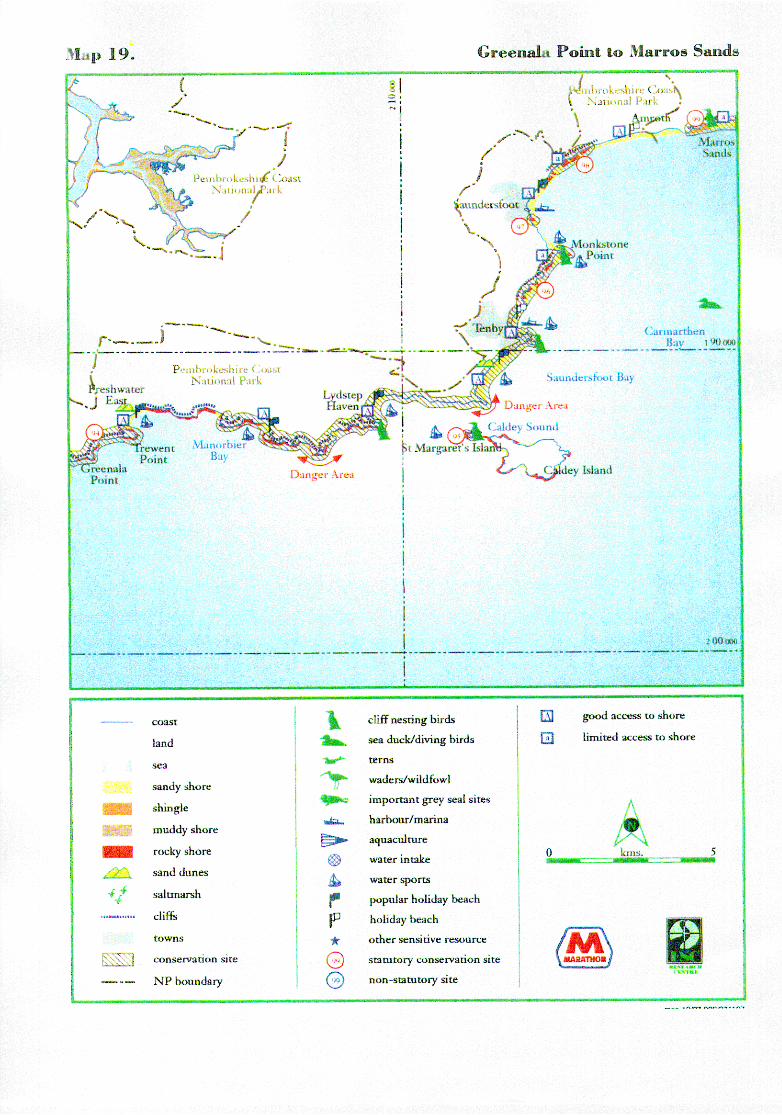
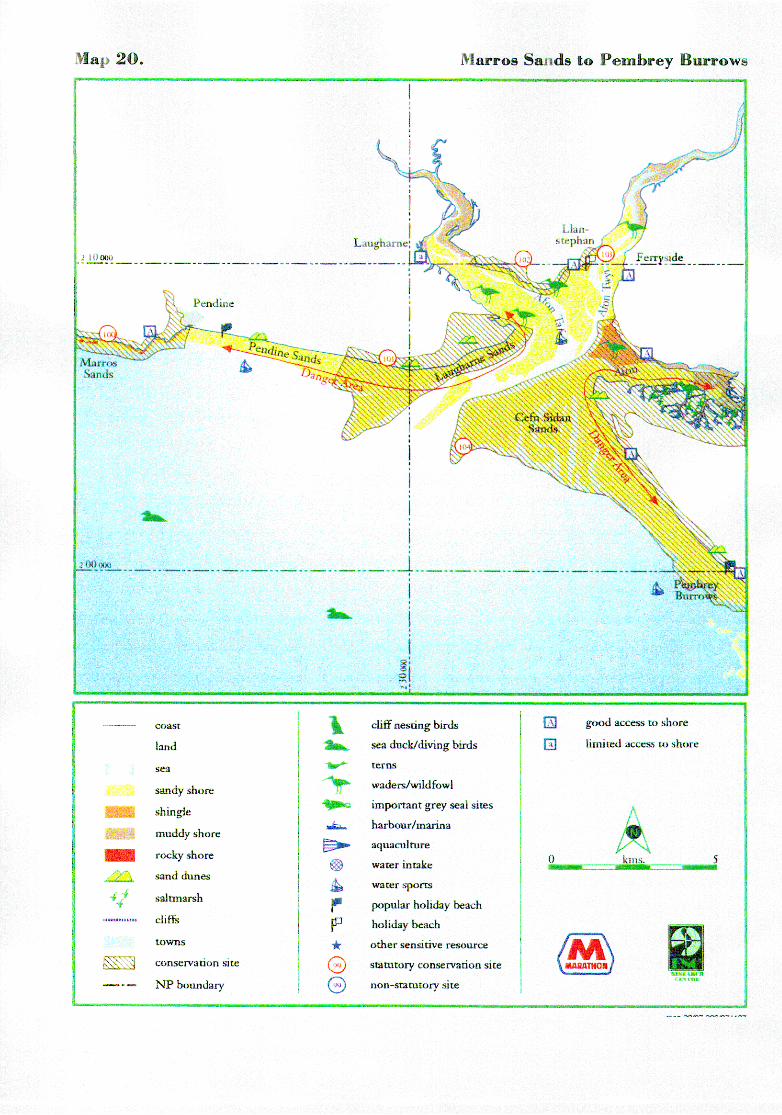
ANNEX 3: CLAIMS TO TEIE 1971 FUND

Annex 3 Contents:
Page
Table’ A3.1 Claims to the 1971,Fund for Clean-up .COsts to 3 l/12/96 . . A3-5
Table A3.2 Claims to the IOPCFund for Damages to Property to 3 l/12/96 A3-7
R&D Technical Report-P119 A3-3

R&D Technical Report P119 A3-4
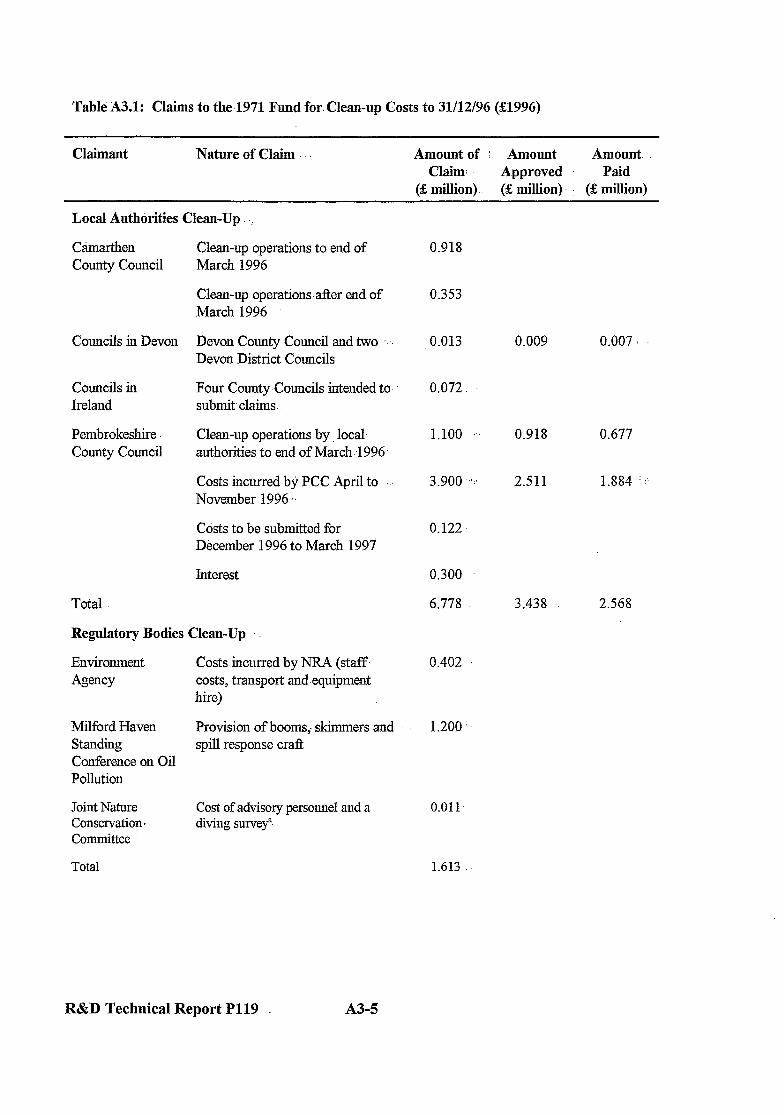
Table A3.1: Claims to the.1971 Fund for.Clean-up Costs to 31/12/96 (21996)
claimant Nature of Claim :
Local Authorities Clean-Up .
Amount of ! Amount Amount. Claim: Approved Paid
(& million).. (& million) (& million)
Camarthen County Council
Councils in Devon Devon County Council and two .. Devon District Councils
Councils in Four County-Councils intended to. Ireland submit claims
Pembrokeshire. County Council
Clean-up operations by. local- authorities to end of March:1 996
Total 6.778 3.438 2.568
Clean-up operations to end of March 1996
Clean-up operationsafter.end of March 1996
Costs incurred by PCC April to November 1996 ‘.
Costs to be submitted for December 1996 to March 1997
Interest
Regulatory Bodies Clean-Up
Environment Agency
Costs incurred by NlU (stat?? costs, transport and equipment hire)
Milford Haven Provision of booms; skimmers and standitlg spill response craft Conference on Oil Pollution
Joint Nature Conservation e Committee
Cost of advisory personnel and a diving snrve~
Total
0.918
0.353
0.013 0.009 0.007
0.072.
1.100 ., 0.918 0.677
3.900 c:’ 2.511 1.884 ’ .:
0.122
0.300
0.402 ‘
1.200
0.011.
1.613
R&D Technical Report P119 A3-5
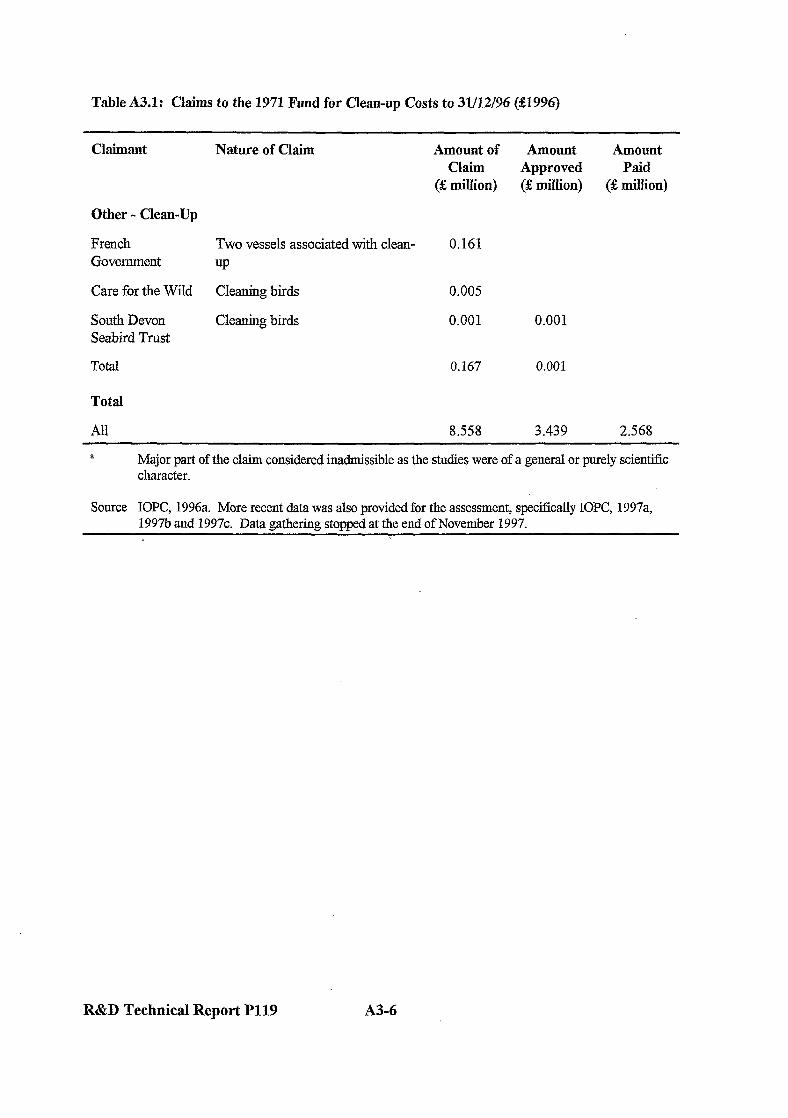
Table A3.1: Claims to the 1971 Fund for Clean-up Costs to 31112196 (21996)
Claimant Nature of Claim Amount of Amount Amount Claim Approved Paid
(& million) (92 million) (& million)
Other - Clean-Up
French Two vessels associated with clean- 0.161 Government UP
Care for the Wild Cleaning birds 0.005
South Devon Cleaning birds 0.001 Seabird Trust
Total 0.167
0.001
0.001
Total
All 8.558 3.439 2.568
a Major part of the claim considered inadmissible as the studies were of a general or purely scientific character.
Source IOPC, 1996a. More recent data was also provided for the assessment, specifically IOPC, 1997a, 1997b and 1997~. Data gathering stopped at the end of November 1997.
R&D Technical Report P119 A34
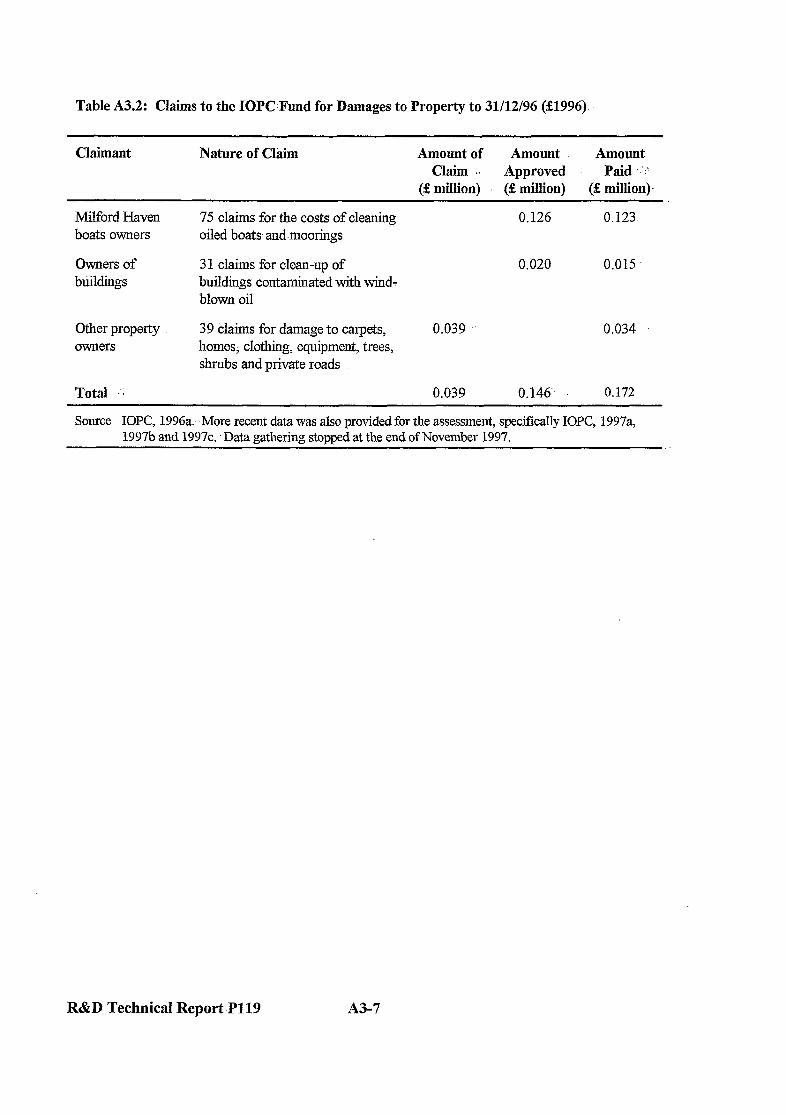
Table A3.2: Claims to the IOPCFund for Damages to Property to 31/12/96 (&1996)
Claimant Nature of Claim Amount of Amount Amount Claim . . Approved Paid ‘-I
(5 million) (S million) (& million)
Milford Haven boats owners
75 claims for the costs of cleaning oiled boats and.moorings
0.126 0.123
Owners of btildings
31 claims for clean-up of buildings contaminated with windy blown oil
0.020 0.015
Other property owners
39 claims for damage to carpets, homes, clothing, equipment, trees,. shrubs and private roads
0.039 0.034
Total .’ 0.039 0.146 0.172
Source IOPC, 1996a. More recent data was also provided for the assessment, specjfically IOPC, 1997a, 1997b and 1997c. -Data gathering stopped at the end of November 1997.
R&D Technical Report .P119 A3-7

R&D Technical Report P119 A3-S

ANNEX 4: DATA IN SUPPORT OF TOURISM-ANALYSIS
Annex 4 contents:
Page
A4.1. Introduction A4,2 Findings of the Welsh-Tourist Board A4.3 Other Evidence of Impacts.
A4-5 A4-5 A4-7-
R&D Technical Report-P119 A4-3

R&D Technical Report P119 A4-4

A4.1 Introduction . .
As set out in Section 4 of the main report, various studies have attempted to value- the impacts to Pembrokeshire’s tourism from the Sea Empress oil spill. and clean-up. Overall, it appears that. there may have been a 7% reductionin bedstock for the year as a whole, or a 6% reduction in Pembrokeshire?s performance overall compared with J995.. For completeness, a summary of the findings of studies is presented below, although-a summary is alsoiprovided in the draft SEEEC report (‘1997).
A4.2 Findings of the Wales Tourist Board:.:-
The impacts of the Sea Empress oil spill on tourism performance in Pembrokeshire in 1996 have been evaluated by the Wales .Tourist Board (WTB, 1997a): The study collated evidence-from a number of ad-hoc and continuous surveys with the aim of identifying consistent- and measurable trends in tourism. These surveys are described in Table.‘A4.1.
As a result of this review, the WTB concluded that no consistent or -measurable trends in tourism petiormance emerge for Pembrokeshire for 1996. That said, the ,Sea Empress incident-may have had a small effect on the conversion rate of enquiries to bookings; 26.3% of those requesting a Pembrokeshire brochure after the Sea Empress incident took a holiday in the county; compared with 23.5%. of those enquiring before the incident (WTB: Pembrokeshire -Brochure Enquiries, in WTB, ‘1997a).
In addition, thereport found that the hotel sector in south-west Wales appears to have perl’ormed less well in 1996 than that-in south east Wales and-in Wales as a whole!. By applyingthese data to hotel bedstock data for Pembrokeshire; the WTB:calculated a 7% decline in bednights sold- during 1996 compared to 1995, equivalent to a lossin turnover of &2 million.- X south.west. Wales hotels had performed .at thesame level as hotels across all Wales2, then the estimate of lost turnover increases to 22.6 million. WTB also postulated that if there had-been a,.similar 8% decline in bed nights in all other commercial accommodation sectors; then a &20 million reduction in expenditure could be estimated for Pembrokeshire for 1996 (rising to &27 million if south west Wales performed at the same level as all Wales3).
1 1996 annual bedspace occupancy data compared to that for 1995: :2.5% south west Wales, -l-3% south east Wales, +l% all Wales.
2 i.e. if there had been a 1% increase in bedspace occupancy.
3 Other data presented by WTl3 indicate that this may not be a valid assumption; the United Kingdom Tourism Survey indicated that expenditure for domestic UK visitors (the core market for staying : visitors) increased in overall terms in 1996 compared to 1995. WTB assumes that this implies growth in the self-catering and caravan/camping sectors and visiting friends and relatives.
R&D Technical Report -P119 A4-5
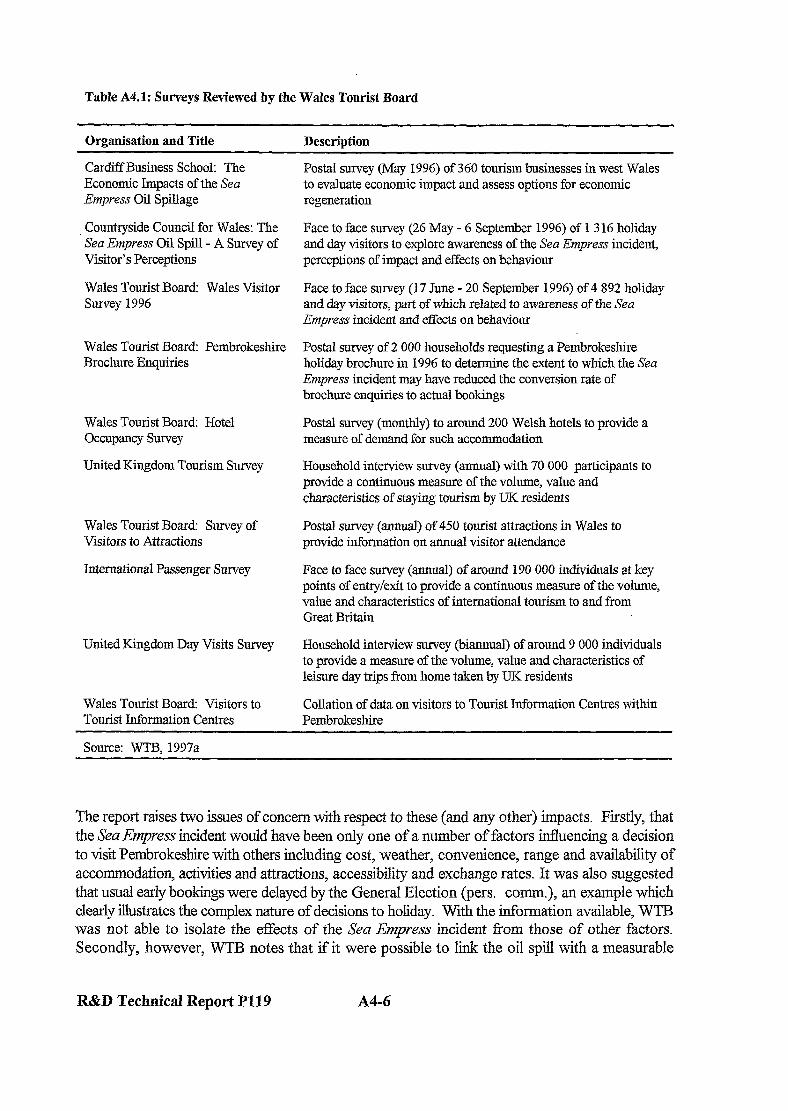
Table A4.1: Surveys Reviewed by the Wales Tourist Board
Organisation and Title Description
Cardiff Business School: The Postal survey (May 1996) of 360 tourism businesses in west Wales Economic Impacts of the Sea to evaluate economic impact and assess options for economic Empress Oil Spillage regeneration
Countryside Council for Wales: The Sea Empress Oil Spill - A Survey of Visitor’s Perceptions
Face to face survey (26 May - 6 September 1996) of 1316 holiday and day visitors to explore awareness of the Sea Empress incident, perceptions of impact and effects on behaviour
Wales Tourist Board: Wales Visitor Survey 1996
Face to face survey (17 June - 20 September 1996) of 4 892 holiday and day visitors, part of which related to awareness of the Sea Empress incident and effects on behaviour
Wales Tourist Board: Pembrokeshire Brochure Enquiries
Wales Tourist Board: Hotel Occupancy Survey
United Kingdom Tourism Survey
Wales Tourist Board: Survey of Visitors to Attractions
International Passenger Survey
United Kingdom Day Visits Survey
Wales Tourist Board: Visitors to Tourist Information Centres
Postal survey of 2 000 households requesting a Pembrokeshire holiday brochure in 1996 to determine the extent to which the Sea Empress incident may have reduced the conversion rate of brochure enquiries to actual bookings
Postal survey (monthly) to around 200 Welsh hotels to provide a measure of demand for such accommodation
Household interview survey (annual) with 70 000 participants to provide a continuous measure of the volume, value and characteristics of staying tourism by UK residents
Postal survey @mual) of 450 tourist attractions in Wales to provide information on annual visitor attendance
Face to face survey (annual) of around 190 000 individuals at key points of entry/exit to provide a continuous measure of the volume, value and characteristics of international tourism to and from Great Britain
Household interview survey (biarmual) of arotmd 9 000 individuals to provide a measure of the volume, value and characteristics of leisure day trips from home taken by UK residents
Collation of data on visitors to Tourist Information Centres within Pembrokeshire
Source: WTB, 1997a
The report raises two issues of concern with respect to these (and any other) impacts. Firstly, that the Sea Empress incident would have been only one of a number of factors influencing a decision to visit Pembrokeshire with others including cost, weather, convenience, range and availability of accommodation, activities and attractions, accessibility and exchange rates. It was also suggested that usual early bookings were delayed by the General Election (pers. comm.), an example which clearly illustrates the complex nature of decisions to holiday. With the information available, WTB was not able to isolate the effects of the Sea Enqmss incident Corn those of other factors. Secondly, however, WTB notes that if it were possible to link the oil spill with a measurable
R&D Technical Report Pll9 A4-6
downturn in .tourism, then, .the .fact that 1995 was a strong year for tourism growth.within .west Wales should be taken into accounti(i.e. the upward trend should be considered).
With respect to the last of these points, many consultees in the tourism industry have commented that 1995 was a very strong year due to the long and hot summer.. From both these anecdotal reports and other evidence, for example that provided on visits to Pembrokeshire National Park T&.X& Information C&&es (TICS) presented in Table A4,2 (at the end of this section); it appears that 1995 ‘was an anomaly and that annual visits in :1996 were returning to the trends. set by previous years. Consultation suggests, that. movement away from some TIC% may suggest that recently opened.attraction.s in the area are encouraging people away f?om more traditional tourist -’ locations where TICS are located, -such as Pembroke Castle (pers.. comm.).
With respect to separating out the impacts of the Sea Enzpress incident, WTB do&s acknowledgf: that “for one in five of those who actively considered Pembrokeshire as a prospective holiday destination in :1996, Sea Empress was a significant reason which led them.to reject the area”“. From this, the .Wales Tourist Board estimate that the.impact of this to the local-economy may have been somewhere between.21 3 million and &5 million (pers. c~mm.)~.
A4.3 Other Evidence of Impacts
The literature reviewed to date .provid& little additional information :on impacts to tourism. Consultation with those in the industry has suggested that impacts were specific to different types of tourism providers,.as such the overall impacts to the area were-minimal but impacts to some individuals and companies were severe.
The weather at Easter 1996 was ‘glorious’, so people visited Pembrokeshire .to see the spill for themselves. May and early June -1996 .were relatively quiet,- bookings for this period traditionally: being made’.in February and ,March when the ‘phones stopped ringing’..due $0 the oil spill. % . . addition, ‘inclement weather’ may have put off .‘last-minute bookers’ and. ‘day-visitors’. With T respect to the summer, there were on-gqing-requests for literature throughout the-season (which-; was unusual) -and visitor numbers to Tourist 3nformation Centres (TICS) indicate that the main season was on a par with 1995.which was considered good. The first of these suggests that. visitors may have delayed their holiday decisions til later, in the year as a result of,the oil spill. : With respect to the second, visit numbers will,have been enhanced by events such as the Radio. One Roadshow and the Celtic Watersports Festival in and around Tenby. The fact that overseas visitors to TICS were up by 50% corn 1995 may have indicated that this group was not impacted, but were cage? for information on the effects of the oil spill..
4 19% of those who did not visit Pembrokeshire agreed or strongly agreed witi the statement that %e Sea Empress oil spillage was the main reason why.1 decided not to holiday in Pembrokeshire in 1996” (WTB: Pembrokeshire Brochure Enquiries, in WTB, 1997a)
5 Based on 19% of the total number of enquiries for Pembrokeshire brochure in 1996, multiplied by the average expenditure per holiday trip to Wales sourced from the Wales Visitor Survey (55 10) and the UKTS (~336).
R&D Technical Report .P119 A4-7
There are conflicting anecdotal reports on longer-term impacts, some saying that reduced performance continued on into 1997 while some suggest that performance for Easter 1997 was very strong @ers comm).
Box A4.1 sets out additional data on the influence of the Sea Empress incident. As the associated respondents were already on holiday in the area, the results are considered to be of limited use in determining the extent of lost tourism to Pembrokeshire from the oil spill and clean-up.
Box A4.1: Additional Data on the Influence of the Sea Empress Incident
93% of respondents confirmed that the incident did not affect their decision to visit Wales (WTB: Wales visitor Survey 1996, in WTB, 1997a).
Only 10% who holidayed in Pembrokeshire said that the Sea Empress had affected their decision to visit the county (W’IB: Pembrokeshire Brochure Enquiries, in WTB, 1997a).
83% of respondents said that the incident had not affected their decision to visit Pembrokeshire, with figures of 87%, 80% and 86% for Welsh, other TJK and overseas visitors respectively (Beaufort Research, 1996).
5% of holiday visitors said that they had hesitated or delayed their decision to come to Pembrokeshire, whilst a further 3% had made enquiries before coming. 5% said that they were alreac@ committed, in the sense that their holiday had been booked earlier. Around 1% wished to see the clean-up operation or to support the area (Beaufort Research, 1996).
For those visiting Pembrokeshire in 1996, repeat visits seem likely; 74% of visitors stated that they would definitely visit Pembrokeshire again and 19% say&g probably.
R&D Technical Report P119 A4-8
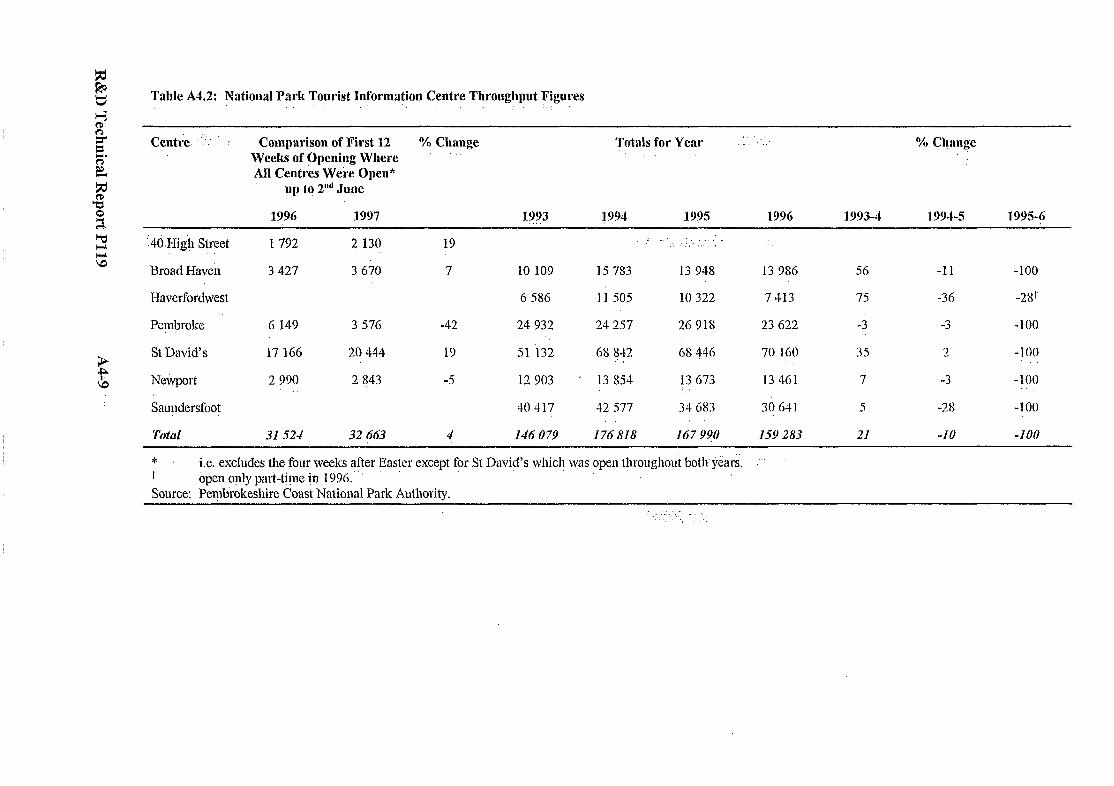
H t!z Table A4.2: Natioual Park Tourist Information Centre Throughput Figures
,.’ ‘. ” .“”
Cen&. ‘:: Comparison of First 12 % Change Tat&i for YCilr : ,‘.‘.: ‘% C~~ange ir. Weelrs of Ppeuiug Where ” G
E All Centres W&e Open*
4s up 1q 2”” June
“x 1996 1997 1993 1994 1995 1996 1993-J 1994-S 1995-6 .,
cd =:
:4d.Hig) Street u
Broad Haveh
Havcrfordwest
Pembroke
b St David’s
;P \lb Neivpor.1
Saundersfoot
Ibtr11
1792 2 130 19
3 427 3 670 7 10 109
6 586
6 1.49 3 576 -42 24 932
17 166 20 444 19 51 132
2 990 2 843 -5 12 903
40 417
31 524 32 riG3 4 146 079
15 783 13 948
11 50.5 10 322
24 257 26 318
68 !‘I2 68 +I6
13 8% 13 673
42 577 34 683
176 818 167 990
13 986 56 -11 -100
7413 75 -36 -28’
23 622 -3 -3 -I 00
70 160 35 2 - 00 !
13 461 7 -3 -100
30 64 I 5 -28 -100
159 283 21 -10 -100
* i.e. excludes the four weeks after Easter except for St Qmid’s which was opell throughout both jreais. .’ t bpen o+y part-time in 1996.’ Source: Pembrokeshire Coast National Park. Authority.
: . . : . ‘.,:, . , .
-“, ‘.

R&D Technical Report P119 A4-10
ANNEX 5: DATA IN SUPPORT OF RECREATIONAL ACTMTY ANALYSIS

Annex 5 Contents:
Figure A5.1 Popular Sites-for Special Recreational-Interests
Table A5.1 Summary of Recreational Characteristics of Pembrokeshire’s Affected Beaches Table A5 2 Criteria for Ranking Beaches Table A5.3 Popularity of Affected Beaches Table A5.4 Number of Visits Affected-by the Oil Spill; by Month Table A5.5. Impacts of Oil Spill on Specifid Coastal Recreational-Activities Table ,A5 :6 General Recreation Use Values
R&D Technical Report P119 AS-3

R&D Technical Report P119 AS-4
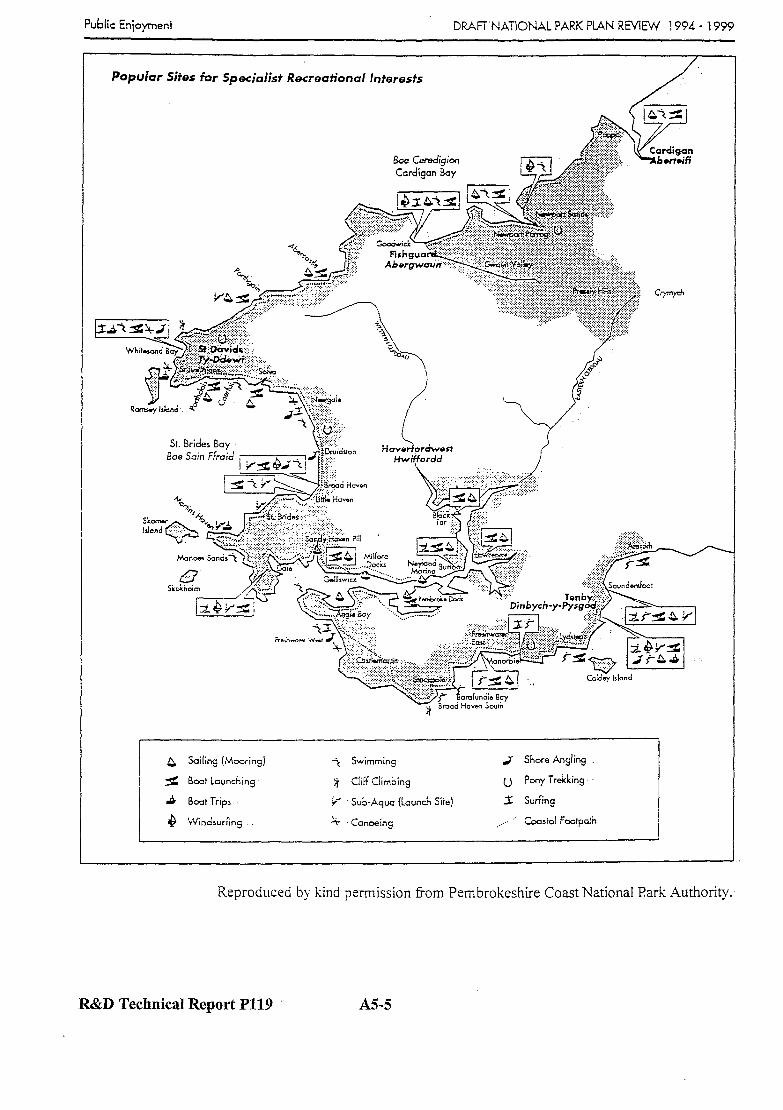
Public Enjoyment DRAFi’NATIONAL PARK PLAN REVIEW 1994 - 1999
Popuhr Sites for Speciaiist Recreational interests
Cardigan .bborroif?
i
& Suilirg (,Mwring}
f; Boat Launching
A Boat Trips
8 ‘~;‘ind~ur;;“g
3 Swimming
;i CM Climbing
i’ Sub-Aqua (Lcunch Siie]
4 Canoeing
J Shwe Angling
u Pony T&king
3: Surfing
,_..” ” Cwstal Footpath
Reproduced b> kind permission IYom Pembrokeshire Coast National Park Authority.
R&D Technical Report P119 AS5

R&D Technical Report Pl19 A5-6
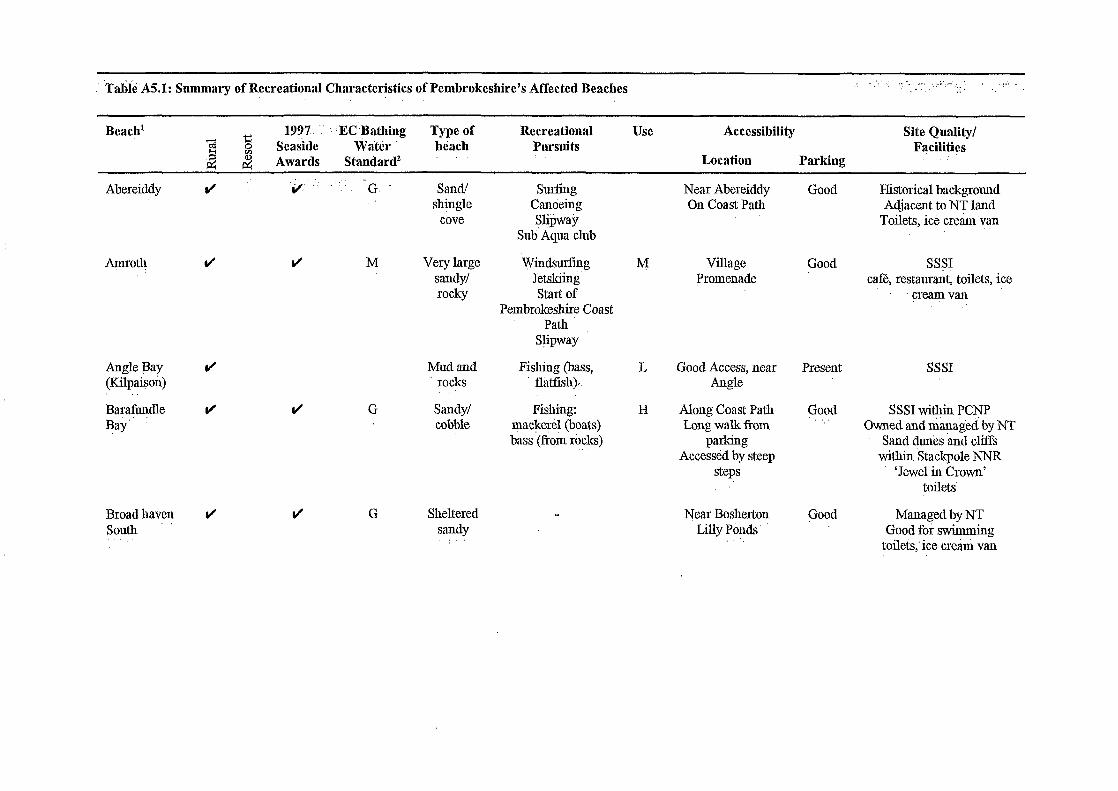
‘rabid A5.1: Summary of Recreational Characteristics of Pembrokeshire’s Affected Beaches
Beach’ 1997~. .,’ ,EC,Bathing Seaside
Type of Water beach
Awards Standard’
Recreational Pursuits
use Accessibility Site Quality/ Pgcilities
Location Parking
Abereiddy ti ‘, .i/ ‘.: ., ::, :G
Sand/ shingle
cove
Anlrotl~ J
Angle Bay d (Kilpaison)
Bara$mdle 1/ Bay’
Broad haven r/ south ”
M Very large sandy/ rocky
Mud and rocks
G Sandy/ cobble
G Sheltered sandy
surfing Candeiug Sli@way
Sub Aqua club
Windsurfiq Jetskiing Start of
Pembrokeshire Coast Path
Sl,ipway
Fishiug (bass, f&l tfisll) ,
Fishing: ma c&x-e1 (boats) bass (horn r@$s)
M
L
H
Near Abereiddy On Coast Path
Village Promenade
Good Access, near Angle
AIong Coast Path Long walk from
parking Accessed by steep
steps
Near Bosl~rton Lilly Pbnds
‘.
Good
Good
Present
Good
Good
Historical backgrotmd Adjacent to NT laud
Toilets, icC cream van
SSSJ caf6, restaurant, toilets, ice
cre<am van
SSSI
SSSI within PCNP Owned and &na~ed by NT
Sand dunes imd cliL-Ys within Stackpole ‘NNK
‘Jewel in Crown’ toiIets
Managed by NT Good foi sivimming
toilets;ice crcxim van
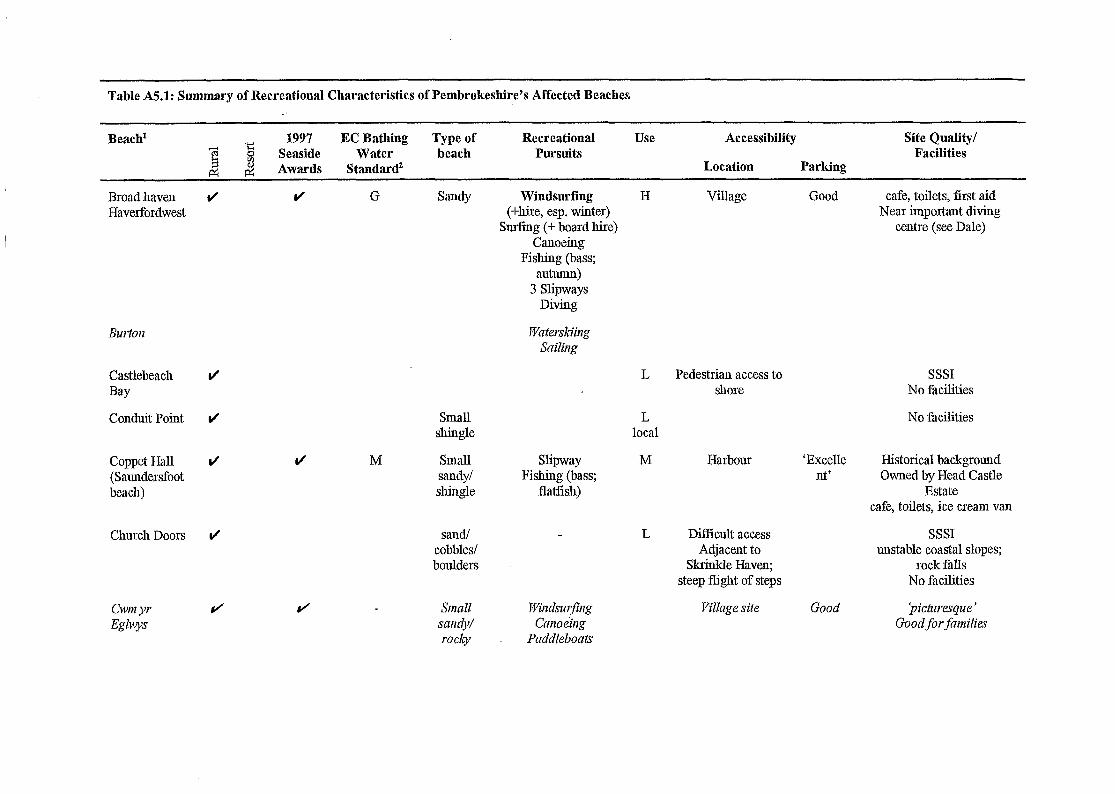
Table A5.1: Summary of Recrealiond Characteristics of Pembrokeshire’s Affected Beaches
Beach’ EC Bathing Type of Recreational Use Accessibility Site Quality/ Wder beach Pursuits Facilities
Standard’ Location Parking
Broad haven J Haverfordwest
G Simdy
Burtoll
Castlebeach d Bay
Conduit Point r/
Coppet Hall 1/ (Saundersfoot beach)
Church Doors I/
CWJYJ J’J J
Eglwys
J
Small shingle
M Sm‘all sandy/ shingle
sa1Kv
cobbles/ boulders
SJJlan
sawa))/ J-O@
Windsurfing (+hite, esp. winter)
Surfing (f board hire) Canoeing
Fishing (bass; aut1lulll)
3 Slipways Diving
Slipway Fishing (bass;
Ilatlisli)
wiJdsur-llg
CuJ~o&g
Paddleboats
1-I Village
L Pedestrian access to shore
L local
M Harbour
L Dillicult access SSSI Acljacent to unstable coastal slopes;
Stidde Haven; rock fills steep flight of steps No hciliti&
Village site Good
Good
‘Excelle nt?
cafe, toilets, fist aid Near important diving
centre (see Dale)
SSSI No facilities
No facilities
Historical backgrom~d Owned by Head Castle
Esl:ate cafe, toilets, ice cream van
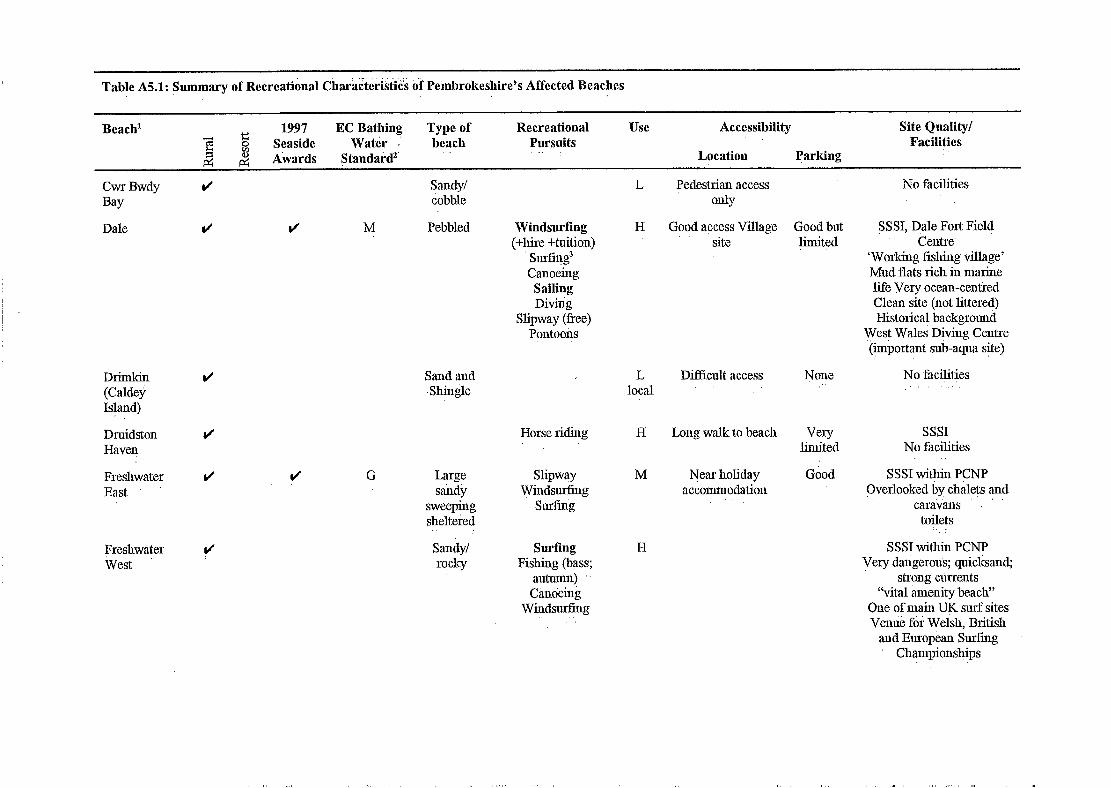
Table A5.1: Summary of Recreational Char&ter&‘~ ofPembrolw4dre’s Affected Beaches
Beach’ 1997 EC Bathing Type of Recreational Use Accessibility Site Quality/ Seaside Wat& : hl?ilCh Pursuits Pacilitics Akrds Stand&d’. .’ : LOCiltiOll Parking
Cwr Bwdy Bay
Dale
Sandy/ cobble
M Pebbled Windsurfing (+ltie +tuition)
Surfing3 Cano&g
Sidling Divirig
Slipway (free) Polltoo~s
d Sand and SIlhgI~
J Horse riding
DlhkiIl (Cal&S’ Island)
Druidston Haven
Freshwater East
d G Large Slipway saildy Winds&Q
sweeping SMilig sheltered
Freshwater West
” Sandy/ rocky
Surfing Fishing (bass;
autumn) Ctiiitiein~
Winds&n g
L
H
L IOGlI
H
M
H
Pedestrian access 61lly
Good access Village Good bat site limited
D.fi.cult access
Long walk to beach
Near holiday accommodation
None
Very limited
Good
No facilities
S$X, pale Fort Fie14 Centre,
‘Working fishing village’ Mud 11ats lich in marine lite Very ocean-cen.tied Clean site (not littered) Historical backgronnd
West Wales Diving Centre . (mportant sub-aqua site)
No $cilitjes .” ‘,
SSSI No facilities .’
S SST wit&in PCNP Qverlooked by chalets and
caravans toilets
SSSI wit&n PCNP Very dangerons; cluicl&n&
stmng currents “vital amenity beacr’
One of mah UK. surf sites Venue foi Welsh, British
and European Surfing Cliani~ionships

Table A5.1: Summary of Recreational Characteristics of Pembrokeshire’s Affected Beaches
Beach* 1997 EC Bathing Type of Recreational Use Accessibility Site Quality/ Seaside Water bcach Pursuits Facilities Awards Standard2 Location Parking
Gelliswiclc J M Large shiugle
The Glen I/
Gunky r/
Hakin Point
* Lindsway Bay d
Little Haven J
Small Fishing (bass; Flat rock/ ilatlisll) shingle Boating
Small Flat rock/ shingle
shingle/ concrete
sea defences
Two sandy coves
(1 large)
Very small
Canoeing Diving Sailing
‘Excellent’, free slipway into Haven
Wateiway
Fishing (bass; flatfish)
Fishing
Slipway Diving Fish&g Rowing Sailing
H Good access Ba eked by ‘roaclway’
Near to Hakin and MiKord Haven
Present Pembroke Yacht Club HQ toilets
Not very good for swilnnlillg
Busy dming race meetings
L
L
L local
M local
H
Access dificult Paths and down
steep cliffs
Access diKicult Paths and down
steep cliKs
Acljoins Hal&
One pedestrian access (steps)
Pubs either side of beach
Between SaundersfootiTenby
Near Gunky and Swallow Tree; No i:dcilities
Between Saundersfoot/Tenby Near The Glen and
Swallow Tree; No facilities
Good for swimming
Sheltered so good for watersports
Llanreath J Shingle M

. %‘able A5.1: Sutiimary’of R&xda~i&l Characteristics of Pembrolteshirc’s Affected Beaches
Llanstadwell and Hazelbeach
Lydstep Caverns
Beach’ 1997 EC Bathing Type of ‘.Rec&&hi$l . .‘. :,_. Usi .‘::,’ AcccssiPility Site Quality/ Seaside Water beach Pursuits Facilities Awards Sfandard’
., Location Parking
.“’ ‘. J
., ~“sl&&,:,“. .’ ‘. ., )&)&& :
rocks mud.
Lydstep Haven/Beach :
Manorbier
Small sandy/ IWky
ti Wide and sanciy
Slipway Boating
P.W.C Sailiug Canoeing
Marloes Sands 1/ d
Marros Sands I/ :’
G Sandy/ rocky
Windsurfing Surfing (‘exti-emely popular all year’)
Canoeing ”
G L Spacious golden’ sands
Sand/ slringle
M local
L
M
H
H
L
Limited access (no vehicles)
None Binl roosting/feeding area No facilities
Diflicult access h%vi 15 0 steep
steps; Access only from Coast Path.
Goqd access near Good Lydstepp Haven
Accessed via Good bat narrow public road limited
armtrack ”
Reshicted access; Good ball‘mile walkaway
Dficult; only accessible at very
low tides
None
SSSI No facilities ,.
SSST; slielterecl anchorage Good for swimming
SSSI; PCNPA sand dmle restoration project
“vital amenity beach” Crowded surling beacb
Toilets Historical. backgromul
: SSSI witbin MNR
Good for swimming ‘lovely 0Eihore views’ of Skomer and Stockholm Islands nature reserves
SSSI (ClilYs) Submerged forest
No facilities
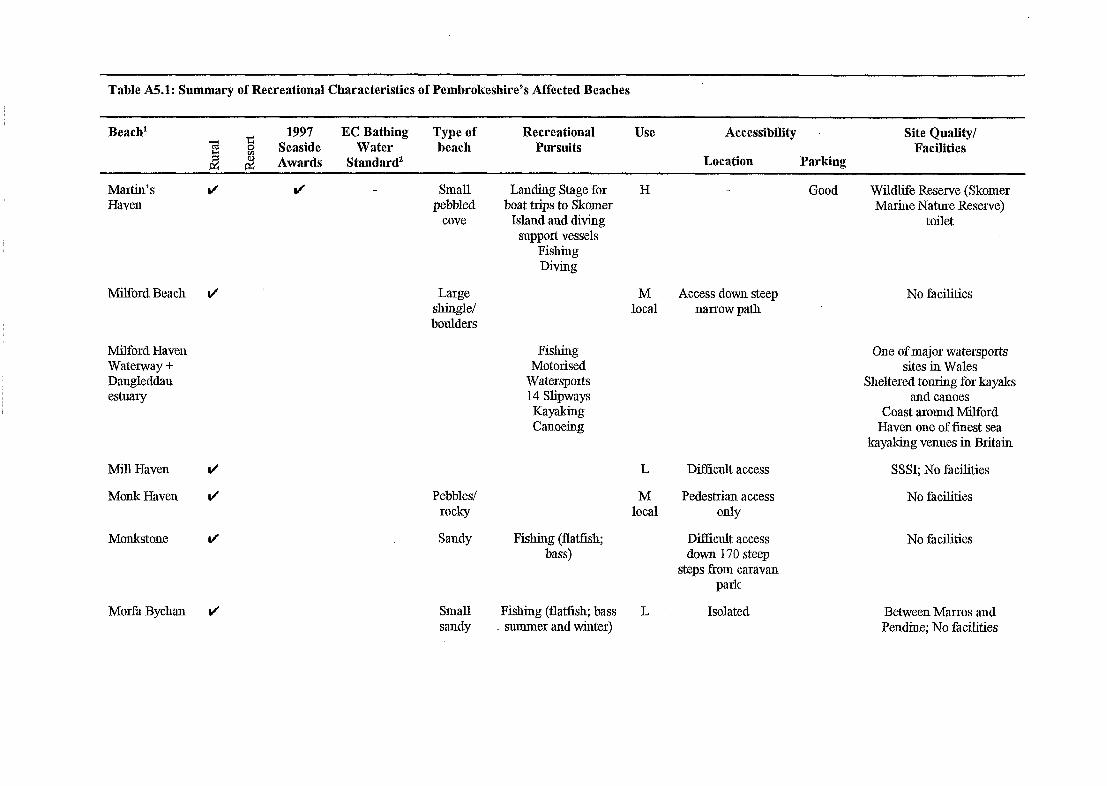
Table A5.1.: Summary of Recreational Characteristics of Pembrokeshire’s Affected ‘Beaches
Beach’
Martin’s HavE3n
Ifi 1997 EC Bathing Type of Recreational USC Accessibility Site Quality/
1 3 Seaside Water h?ilCll Pursuits Facilities Awards Standard’ Location Parking
r/ d Slllau. Landing Stage for H Good Wildlite Reserve (Skomer pebbled boat trips to Skomer Marine Natnre Reserve)
cove Island and diving toilet support vessels
Fishing Diving
Milford Beach I/
Milford Haven Waterway + Daugleddau esluaiy
Mill Haven r/
Monk Haven r/
Monkstone I/
Morfa By&an V’
Large shingle/ boulders
Fishing Motorised
Watersports 14 Slipways Kayaking Canoeing
M Access down steep local narrow path
L Dil’licult access
Pebbles/ rocky
Sandy Fishing (~latfish; bass)
M Pedestrian access local OdY
Difficult access down 170 steep
steps l%om caravan pad
Small Fishing (flatfish; bass sandy summer and winter)
L Isolated
No facilities
One ofmajor watersports sites in Wales
Sheltered touing for kayaks and caaoes
Coast around Milford Haven one of finest sea
kayaking venues in Britain
SSSI; No fhcilities
No facilities
No facilities
Between Marros and Pendine; No facilities
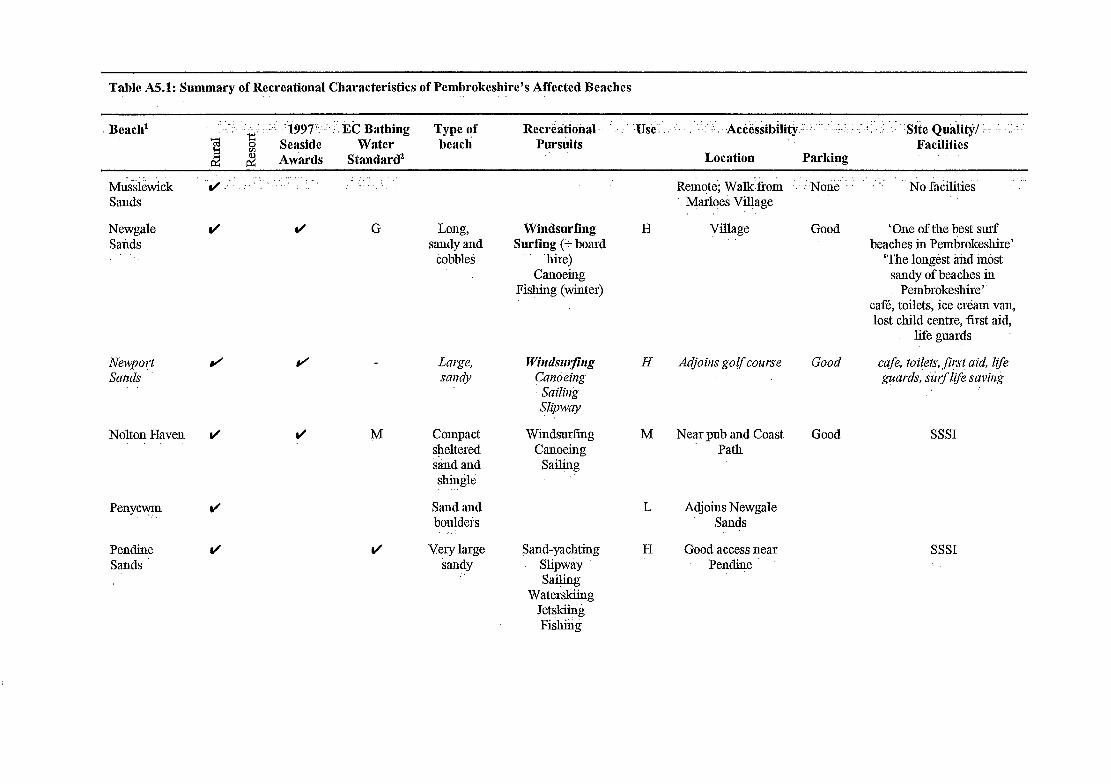
Table A5.1: Summary of Recreational Characteristics of Pembrokeshire’s Affected Beaches
BciKh’ :&)7::..-‘. ;: & Bathing Seaside Water Aw;li-ds Standard’
Type of Recrkatitinal bCilCh Pm-&its
M&i&ick ,-; .;: : ‘,’ :’ ,,;: ‘, :; ; ._’ : :,
Sands
Newgale Sands
J G Long, sandy and
cobbles
J
Nolton Haven /
Penycwfn
Pendine San.ds
J
d M Compact sheltered s&d and shinde
Sand and bouldeis
ti Very large sandy
‘.’
Windsurfing Surfing (i- board
“’ ‘hi=> Canoeing
Fishing (winter)
Windsurfimg Canoeiug
S+lg
Sand-yachting Slipway SaQing
Waterskiing Jetskii@ Fishiiig
H
H
M
L
H
Rem(?te;,Wa~~ii-om _’ ~.NonE.‘. : .‘.: .’ No ~~;?cilities’ ‘. ~’
Marlqes Village
Village Good ‘01x of the best surf beaches in Peml!xokeshire
‘The longest and most sandy ofbeaches in
Pembrokeshire” cafi:, toilets; ice &am van, lost child centre, first aid,
life guards
Good cafe, to ilels, jim t aid, kfe guards, ii$i{fe saving
Near pub and Coast Path
Good SSSI
Adjoins Newgale Sands
Good access ueal Pendine
SSSI
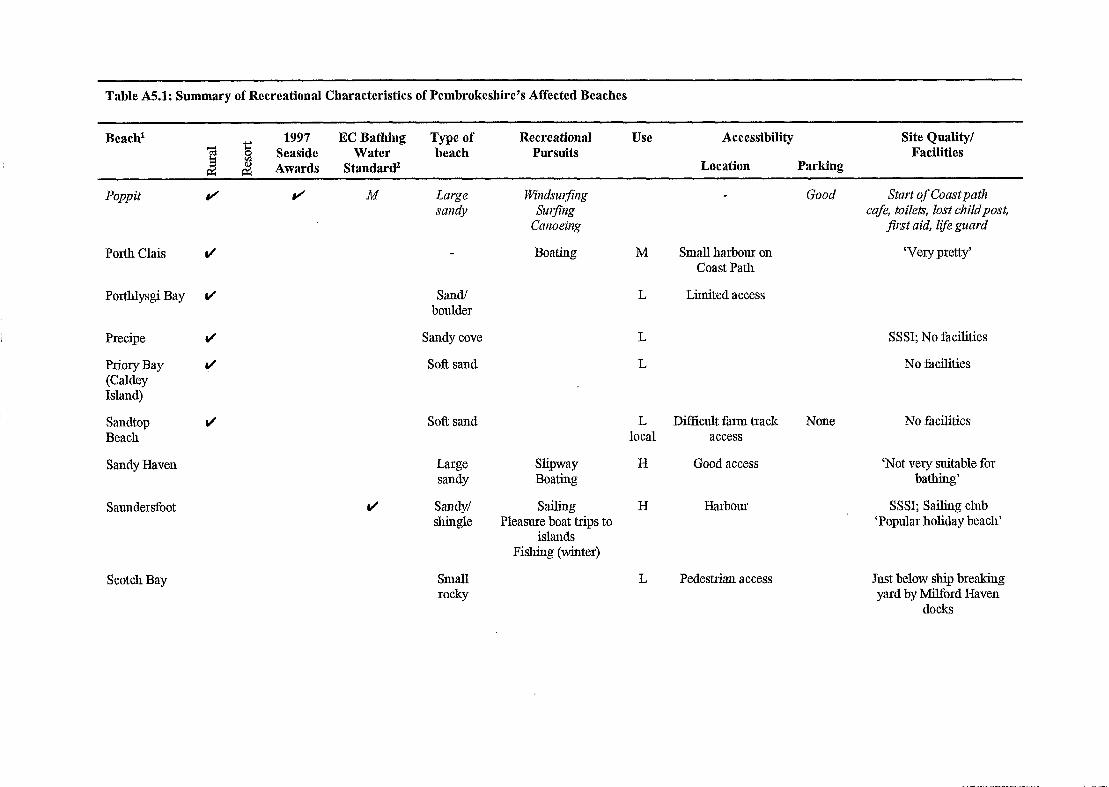
Table A5.1: Summary of Rccrcational Charact.eristics of Pembrokeshire’s Affected Beaches
Beach1 EC Bathing Water
Standard2
Type of beach
Recreational Pursuits
Use Accessibility Site Quality/ Facilities
Location Parking
Porth Clais c/
Porthlysgi Bay r/
Saundersfoot
Precipe
Priory Bay (Cakley Island)
Sandtop Beach
Sandy Haven
Popp it J J h4 Lurge sandy
Sa.TlN boulder
Sandy cove
Soft sand
SoR: sand
Large Slipway sandy Boating
S‘WdYl shingle
Sailing Pleasure boat hips to
islands Fishing (winter)
Scotch Bay Small roclcy
Good Start qf Coastpath mfe, toilets, lost childpost,
filst aid, llye guard
M Small harbour on ‘Very pretty’ Coast Path
L Limited access
L
L
L DiEcult faml track None local access
H Good access
H Harbour
L Pedestrian access
SSSI; No facilities
No facilities
No hdities
‘Not very suitable for bathing’
SSSI; Sailing club ‘Popular holiday beach
Just below ship breaking yard by Milford Haven
doclcs
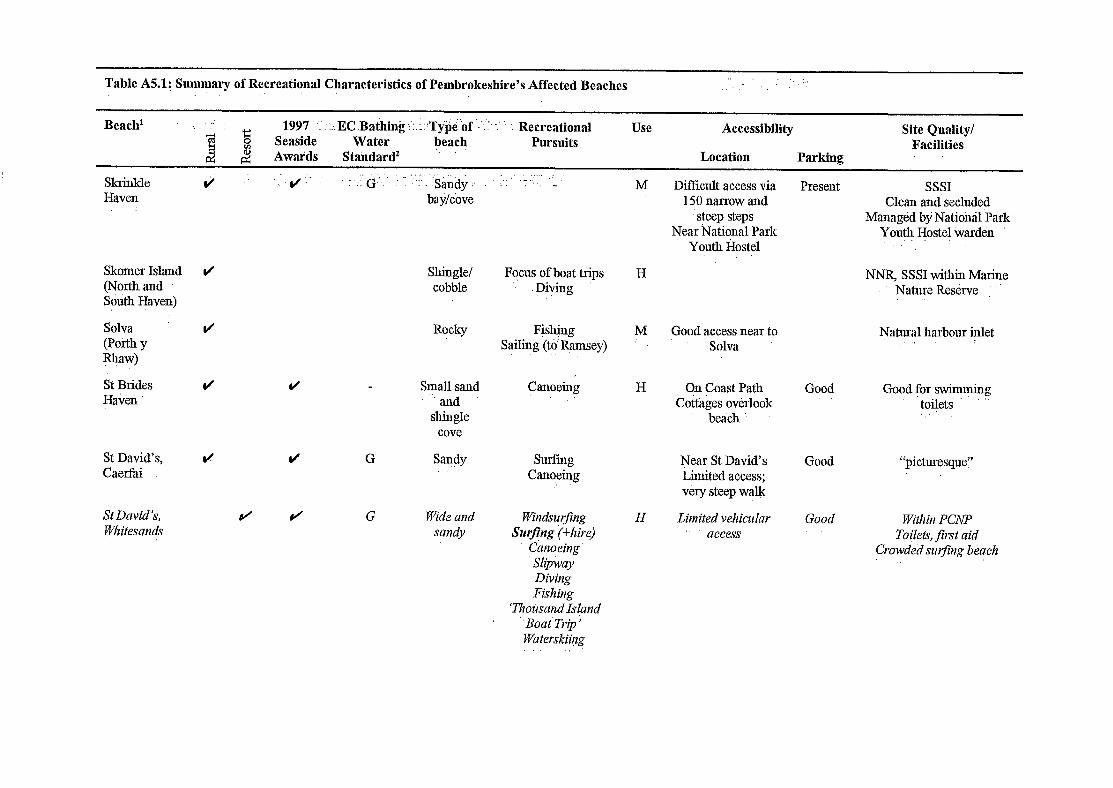
Table A5.1: Summary of Recreational Characteristics of Pembrokeshire’s Affected Beaches ” ” ..:, ‘_ ,. .;
Beach’ . . .’ ~ 1.997 _‘-I::, EC .Baihin& ;-: :::T~$e.bf -‘:‘:. ‘: : Recreational Use
-VI s: Seaside Water Accessibility
beach Site Quality/
Pursuits d 2 Stahdard’
Facilities Awards Location Parking
Sklillkle Haven
Skomer Island (North and South Haven)
Solva (P&Ah y yjaw)
St Brides Haven
St David’s, Caerfai
St David’s, Whitesands
Shiuglel Focus of boat trips cobble Diving
Rocky
Small sand and
shingle cove
J G Wide and sandy
Fishing Sailing (to’ Ramsey)
surfing Canoeing
windslfrfillg
Surjfng (i-hire) Canoeing Slipway Diving Fishiurg
‘Thousund Island Boat Trip ’ l+futerskii.~zg .,. .,
M Difiicult access via I 50 narrow and
steep steps Near National Park
Youth Hostel
H
M Good a.ccess near to Solva
H On Coast Path Cottages overlook
beach ’
Near St David’s Limited access; very steep walk
H Limited vehicular ~.CC~~S
Present SSSI Clean and secluded
Managed by National Park Youth Hostel tiarden
NNR, SSSI within Marine Nature Reserve .’
Natural harbour inlet
Good Good fjor swimming toilets ”
Good “picturesque” ”
Good Within PCNP To frets, jkst aid
Crowdedsurfing beach
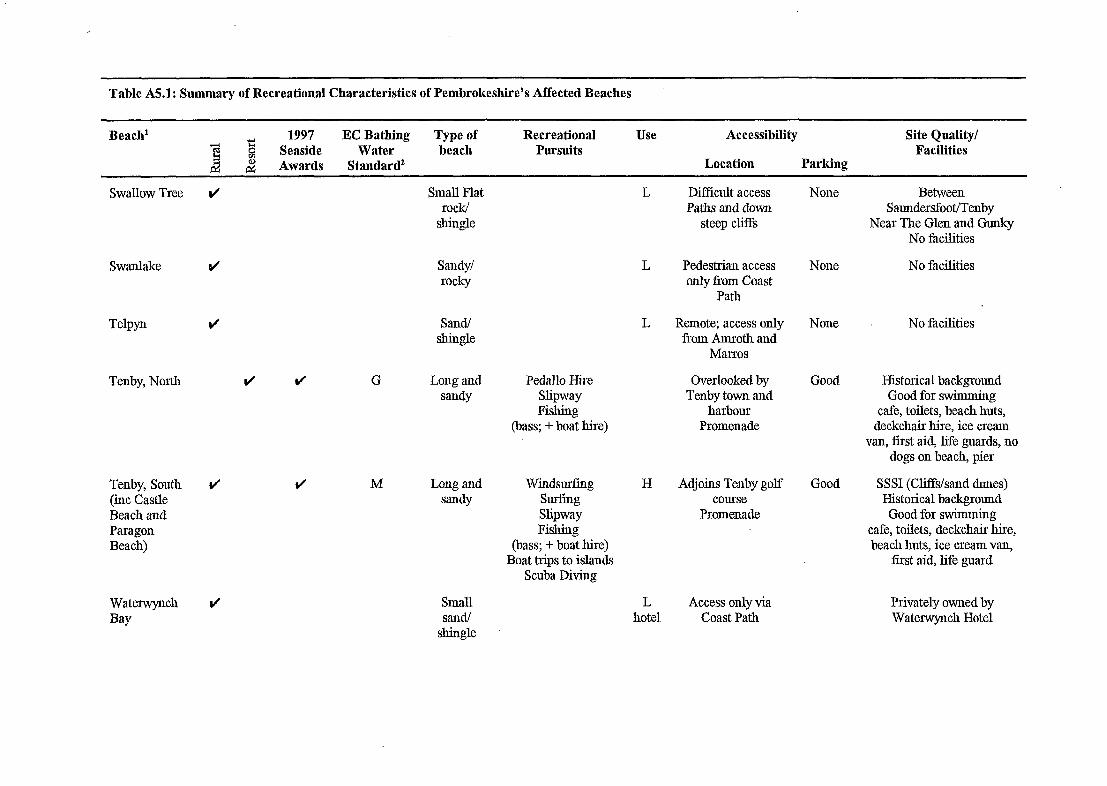
Table A5.1: Summary of Recreational Characteristics of Pembrokeshire’s Affected Beaches
Beach’ 1997 EC Bathing Type of Recreational Use Accessibility Site Quality/ Seaside Wiktter beach Pursuits Pacilitics Awards Standard’ Location Parking
Swanlake d
Telpyn r/
Tenby, North d J
Swallow Tree I/ Small Flat l.OCk/
shingle
Sandy/ SO&y
Sand/ shingle
G Long and
sandy
Tenby, South ti (inc Castle Beach and Paragon Beach)
Wa teiwynch ti Bay
M Long and sandy
Small sand/
shingle
Pedallo Hire Overlooked by Slipway Tenby town and Fishing harbour
(bass; + boat hire) Promenade
L
L
L
Windsm-fing H suriing slipway Fishing
(bass; + boat hire) Boat trips to islands
Scuba Diving
L hotel.
Diflicult access Paths ‘and down
steep cl%
Pedestrian access only fi-om Coast
Path
Remote; access only from Amroth and
Macros
Adjoins Tenby golf comxe
Promenade
Access only via Coast Path
None
None
None
Good
Good
Between SaundersfooVTenby
Near The Glen and Gunky No facilities
No facilities
No fiu$Iities
Historical background Good for swimming
cafe, toilets, beach huts, deckchair hire, ice cream
van, first aid, life guards, no dogs on beach, pier
SSSI (Cli&/sand dunes) Historical background Good for swimming
cafe, toilets, deckchair hire, beach huts, ice cream van.,
Grst aid, lik guard
Privately owned by Waterwynch Hotel
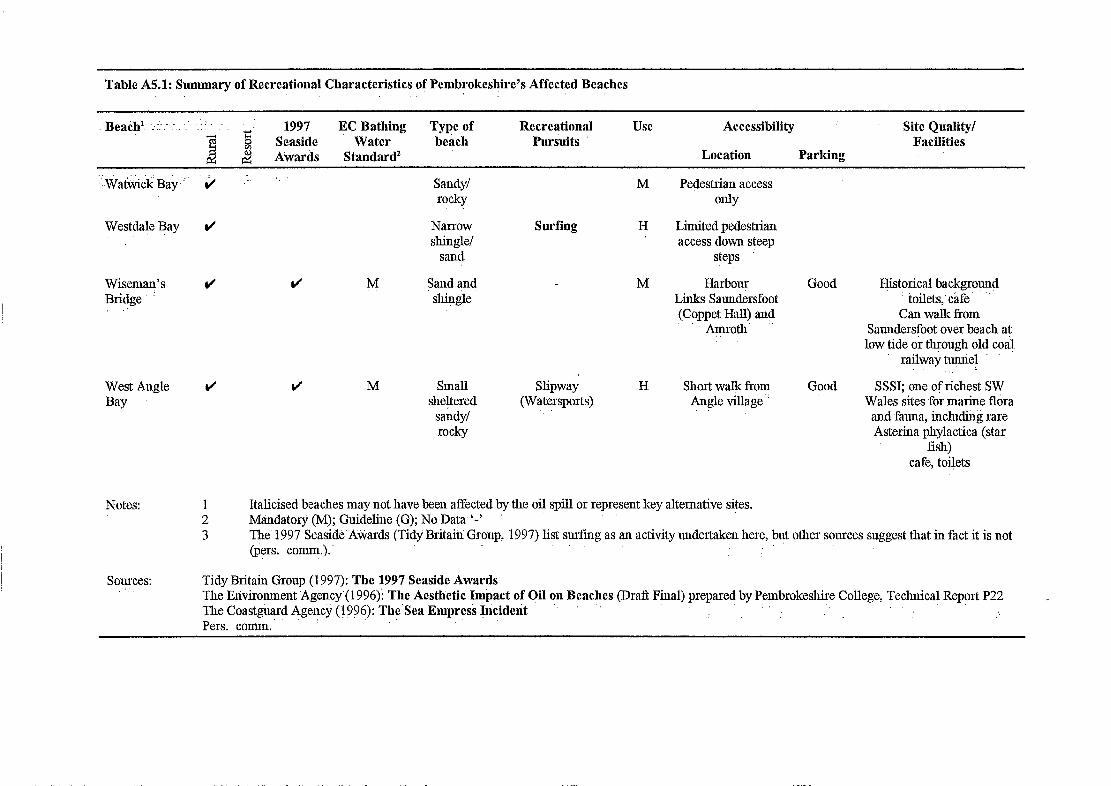
Table A5.1: Summary of Recreational Characteristics of Pembrokeshire’s Affected Beaches
1997 EC Bathing Seaside Water Awards Standard’
Type of Recreational bench Pm-suits
Use Accessibility Site Quality/ Facilities
Location Parking
.‘;~$&&l; B&,’ 2 ,- ‘. Sandy/ M Pedestrian access rocky only
Westda$ lgiy d Narrow Surfing II Limited pedestrian shingle/ access down steep
Sancl steps
Wiseman’s d d b! Sand and M Harbour Bridge ’ shingle Links Saundersfoot
: (Coppet Hall) and &ll-0th
West Angle u’ Bay ”
GWd Histori.cal background toilets, cafe
Can walk from Samrdersfoot over beach at
low tide or through old coal railway tumid . ..., :
M Small slipway I-I Short walk from Good SSSI; one of richest SW sheltered Wales sites for marine flora
sandy/ (Watersports) Angle village ’
and fauna, inchming rare rocky Asterina phyla&a (star
fish) cafe, toilets
Notes: 1 Italicised beaches may not have been affected by the oil spill or represent key alternative sites, 2 Mandatory (M); Guideline (G); No Data,‘-’ 3 The’ 1997 Seaside Awards (Tidy Britain Group, 1997) list snrfing as an activity mrdertaken here, but other sources suggest that in fact it is not
(pers. comm.).’
Sources: Tidy Britain Group (1997): The 1997 Seaside Awards The Enviromnent Agency (1996): The Acsthctjc Impact of qil on Beaches (Draft Final) prepared by Pembrokeshire College, Technical Report P22 The Coastguard Agency (1996): The’Sea Emprc& Incident ,’ Pers. conmi.’
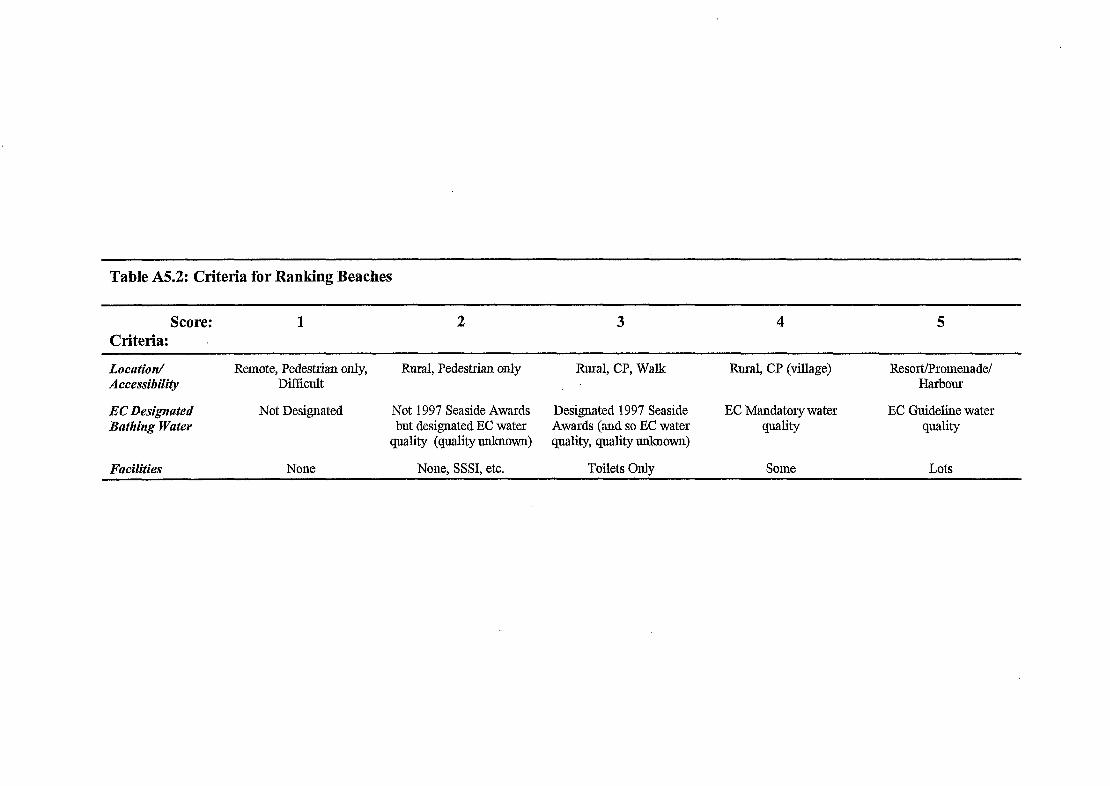
Table AS.2: Criteria for Ranking Beaches
Score: Criteria:
1 2 3 4 5
Locatio;rr/ Accessibility
EC Designated Bntliing Water
Facilities
Remote, Pedestrian only, Rural, Pedestrian only Rural, CP, Walk Rural, CP (village) Resort/Promenade/ Dil%cult Harbour
Not Designated Not 1997 Seaside Awards Designated 1997 Seaside EC Mandatory water EC Guideline water but designated EC water Awards (<and so EC water quality quality
quality (quality mhown) quality, quality mhown)
None None, SSSI, etc. Toilets Only Some Lots
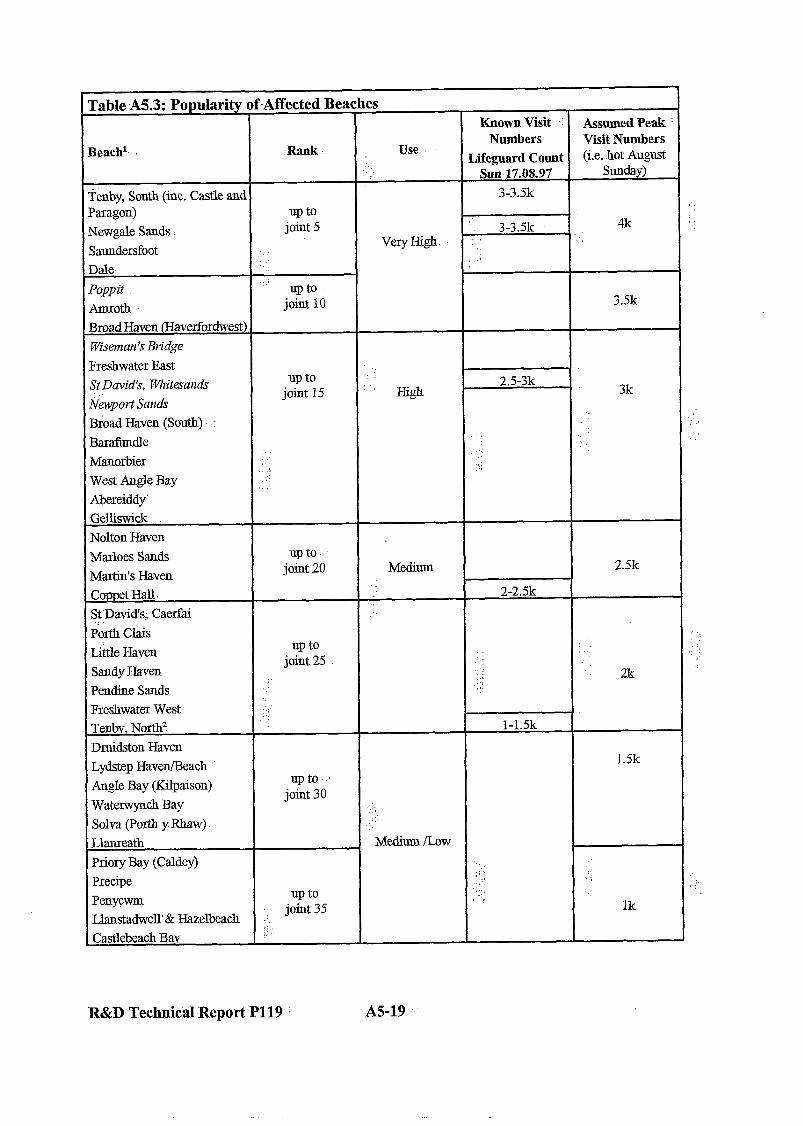
Da.,..l,..:+w c.C. A Rnss-hn,o I vpu1ar l&y “1 -txB1cLl.Gu Y&-L=-J
Beach’, . Rank: Use ,‘-_
fenby, South (inc. Castle and Paragon) up to Newgale Sands. joint 5
Very Hi&. Samdersfoot Dale
, Poppit up to Amroth ‘. joint 10
Broad Haven (Havetiordwest)
Wiseman ‘s Bridge Freshwater East St David’s, FVLhitesands upto ,i : . .
Newport Sands joint15 ’ Hi&
Known Visit .. Assumed Peak Numbers Visit Numbers
Lifeguard Count (i.e.~~$jW~ Sun~17.08.97
3-3.5k
3-3.5k 4k :’ ; :.
3.5k
2.5-3k 1 3k
Broad Haven (South)
Barafundle . .
:: lMa.norbier .: I: .:: :. West Angle Bay :.:
. Abereiddy Gel&wick Nolton Haven Marloes Sands upto-~
joint 20 Medim 2.5k Martin’s.Haven . Coppet Hall: 2-2.5k
St David’s; Caerfai . .
&th Clais L&e Haven up to *.
joint 25 : ; ‘. Sandy Haven ‘) I 2Js Pendine Sands :.:
Freshwater West .: :-: Tenbv. North: ._ l-1:5k
Druidston Haven Lydstep Haven/Beach .. 1.5k
Angle Bay (Kilpaison) up to ..
Waterwynch Bay joint 30
__i Solva (Portb y Rhaw) . .
‘: Llameath Medinm ILow
Priory Bay (Caldey)
Precipe II.. :. ?i
up to ‘..‘ Penycwm : :
Llanstadwell’& Hazelbeach 1:. joint 35 Ik
,. Castlebeach Bav
:;
R&D Technical Report Pl19 A5-19
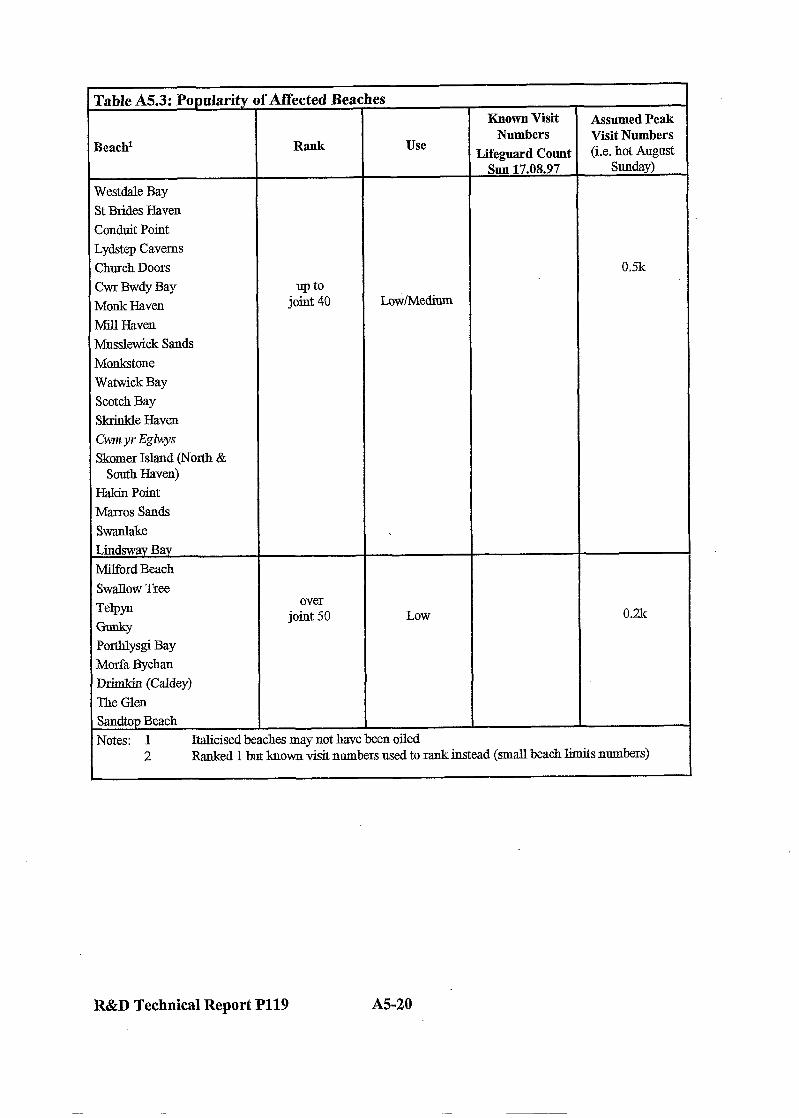
1 ame kk3.3: ropulamy UI iwmixxeu D~~C;II~;J
Known Visit Assumed Peak Numbers Visit Numbers
Beach1 Rank Use Lifeguard Count (i.e. hot August
slm 17.08.97 Sunday)
Nestdale Bay 3t Brides Haven Zonduit Point
Lydstep Caverns 2hurch Doors 02
hr Bwdy Bay q to Monk Haven joint40 LmdMedium
Mill Haven bl&lewick Sands Uonkstone Watwick Bay Scotch Bay Skrinkle Haven CwnzyrEghyys Skomer Island (North &
south Haven) E&kill Point
Marros Sands Swanlake Lindswav Bay Milford Beach
Swallow Tree
%w over
Low 0.2k Gmiky
joint 50
Portlilysgi Bay Morfa Bychan DArnkin (Caldey) The Glen Sandtop Beach Notes: 1 Italicised beaches may not have been oiled
2 Ranked 1 but known visit numbers used to rank instead (small beach limits numbers)
R&D Technical Report P119 A520

Broad haven (Hvfdwst)
Amroth St David’s, Whitesands
Wiseman’s Bridge
Freshwater E
Barsfundle Broad haven (Sth)
West Angle Bay
Manorbier
Abereiddy
Gelliswick
Nolton Haven MarIces Sands
Martin’s Haven
St Btides Haven
Coppet Hall St David’s, Caerfai
Skrinkle Haven
Perth Clais Little Haven
Sandy Haven
Freshwater W Pendine Sands Angle Bay Druidston Haven
Lydstep Haven/Beach
Waterwynch Bay
Solva Llanreath
Priory Bay (Caldey)
Penycwm Precipe
Llanstadwell & Hazelbeach
Castlebeach Bay
Westdale Bay Watwick Bay
Scotch Bay
Skomer Island (N & S Haven) Swanlake
Lindsway Bay
Hakin Point
Marros Sands Lydstep Caverns Conduit Point
Church Doors
Cwr Bwdy Bay
Monk Haven
Monkstone Musslewick Sands
Mill Haven
Morfa Bychan
Porthlysgi Bay
Sandtop Beach The Glen
Gunky
Milford Beach Drim kin (Caldey)
Telpyn
Swallow Tree
TOTALS
Table A5.4: Number of Visits Affected by the Oil Spill, by Month
Data in THOUSANDS of visits
Tenby, North
Saundersfoot
Nevrgale Sands Dale
Tenby, South (inc Castle and Paragon beaches)
based on 100% of 15 days in February and IO days in March; then 50% for fhe rest of March
0.010
0.020
0.020 0.020
0.020
0.017
0.017 L 0.015
0.015
0.015
0.015 0.015
0.015
0.015
0.015
0.015 0.012
0.012
0.012 0.012
0.012 0.010
0.010
0.010 0.010
0.010
0.010 0.010 0.007 0.007
0.007
0.007
0.007 0.007
0.005
0.005 0.005
0.005
0.005
0.002 0.002
0.002
0.002
0.002 0.002
0.002
0.002 0.002
0.002 0.002
0.002
0.002
0.002
0.002
0.002 0.001
0.001
0.001
0.001 0.001
0.001
0.001 0.001
0.001
0.503
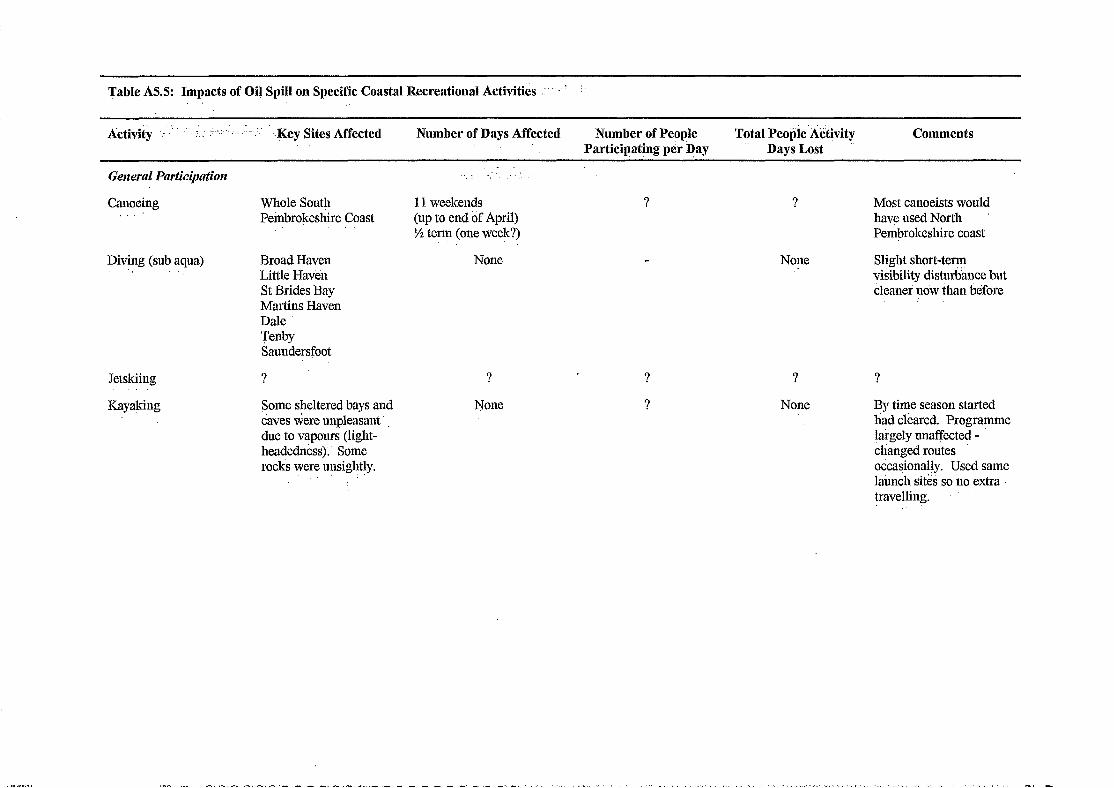
Table A5.5: Impacts of Oil Spill on Specific Coastal Recreational Activities .:‘. ’ :
Number of Days Affected Number of People Total Peo&‘&tivity Comments Participating per Day Days Lost
. ,., : .;
Canoeing ,.
Whole South Pembrokeshire Coast
11 weekends (up to end of April) % term (one week?)
1 ? Most canoeists would have used North Pem~rokesliire coast
Diving (sub aq~~a)
Jetskiing
Kayaking
Broad Haven Little Hav6n St Brides Bay Martins Haven Dale Tenby Saundersfoot
?
Noue
1
None :
7
Slight short-ter!Ji visibility disturbance but cleaner ndw than before
1
Some sheltered bays and &es tiere unpleasant due to vapours (light- headedn&s). Some rocks were unsightly.
Noue
7
? None By time season started had clkared. Programme largely unaffected - changed routes occasionally. Used same la&cli sit& so no extra travelling.
/ v s . . / .__ ^ ^ - - . - - . - . e ^ - - . - . . . . A._._ - - - - - - - . - _ . .A. . , . , . / . . . _ . . . < . _ . I . . . ,T . . . . , C.. i. , L , . , I -i i. ” . . - . I , : .d -
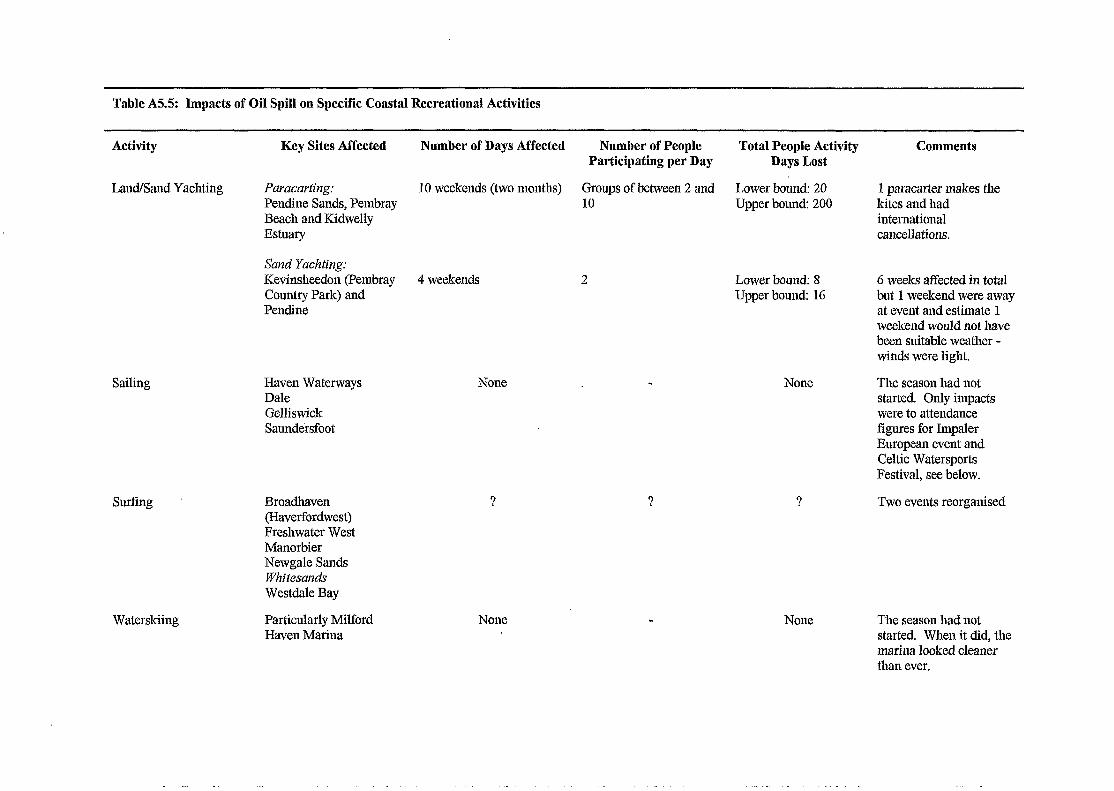
Table A5.5: Impacts of Oil Spill on Specific Coastal Recreational Activities
Activity Key Sites Affected
Land/Sand Yachting Paracarting: Pendine Sands, Pembray Beach and Kidwelly Estuary
Sand Yachting: Kevinsheedon (Pembray Country Park) and Pendine
Sailing
Surling
Waterskiing
Haven Waterways Dale Gelliswiclc Saundersfoot
Broadhaven (Haverfordwest) Freshwater West Manorbier Newgale Sands ?Vhitesands Westdale Bay
Particularly Milford Haven Marina
Number of Days Affected
10 weekends (two months)
4 weekends
Noue
None
Number of People Participating per Day
Groups of between 2 and 10
2
Total People Activity Days Lost
Comments
Lower bound: 20 Upper bound: 200
1 paracarter makes the kites and had international cancellations.
None
Lower bound: 8 Upper bound: 16
G weeks affected in total but 1 weekend were away at event and estimate 1 weekend would not have been suitable weather - winds were light.
The season had not started. Only impacts were to attendance figures for Impaler European event and Celtic Watersports Festival, see below.
Two events reorganised
Noue The season had not started. When it did, the marina looked cleaner than ever.
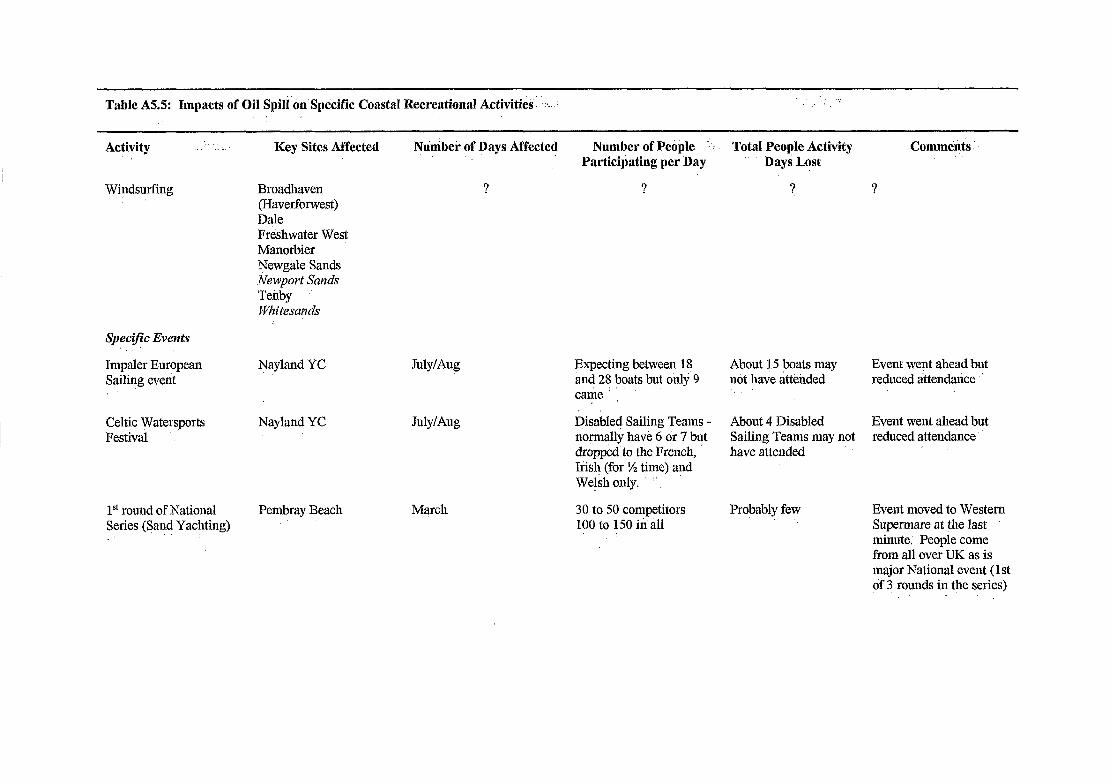
Table A5.5: Impacts of Oil Slkon’Sp&zific Coastal Recreational Activi&s :‘..
Activity .’ . Key Sites Affected Ntiuibei- of Days Affected Number of Pebple : : Total People Activity Comm&jts. Pqrticil$ing per Day ” Days Lost
Windsurfing Broadhaven (Haverforwest) Dale Freshwater West Manorbier Newgale Sands Newport Sands Tenby Whitesands
? ? ? 7
S~~ec~cific Events
Impaler European Sailing event
Nayland YC
Celtic Watersports Festival
Nayland YC
lSt round of National Series (Sand Yachting)
Pembray Beach
July/Aug
July/Aug
March
Expecting between 18 and 28 boats but only 9 came . Disabled Sailing Teams - normally have 6 or 7 but dropped to the French, Irish (for % time) and Welsh only. ”
30 to SO competitors 100 to 150 in all
About 15 boats may not have attended ‘.
Event went ahead but reduced attendance
About 4 Disabled Event went ahead but Sailing Teams may not reduced attendance have attended
Probably few Eveut moved to Western Supermare at the last minute. People come from all over IJK as is major National event (1 st of 3 romids in the series) ;.
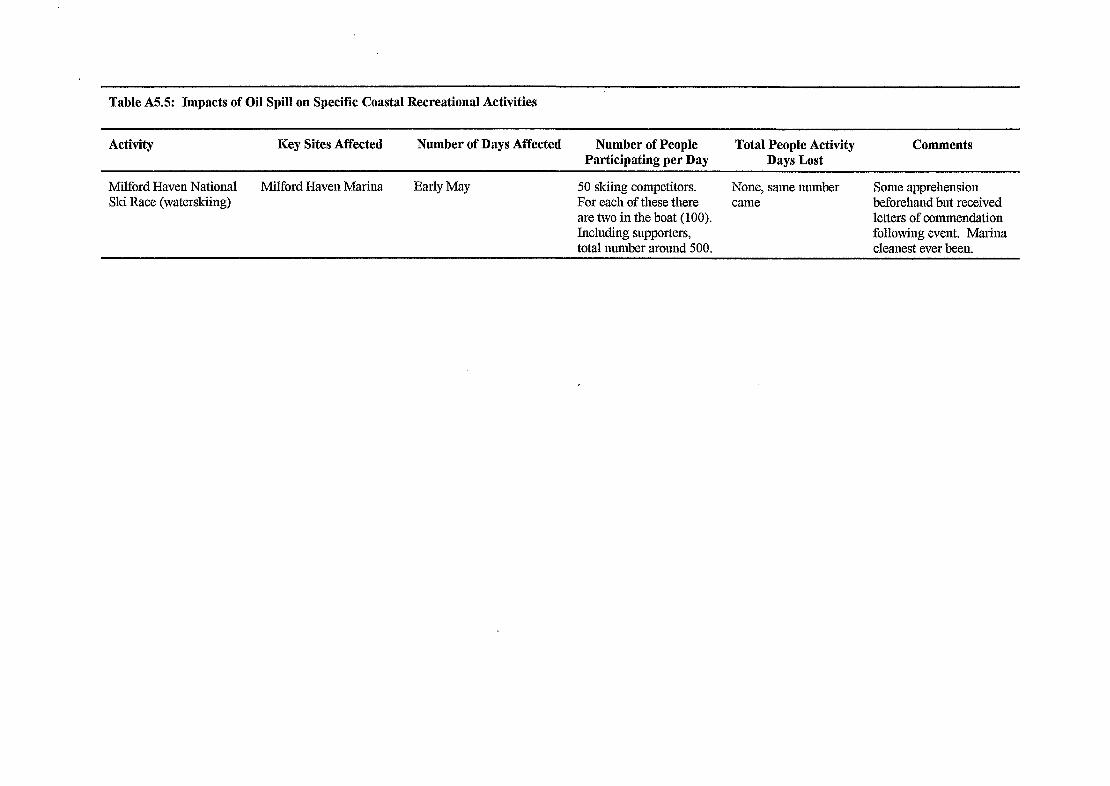
Table A5.5: Impacts of Oil Spill on Specific Coastal Recreational Activities
Activity
Milford Haven National Ski Race (waterslciing)
Key Sites Affected
Milford Haven Mariua
Number of Days Affectcd Number of People Total People Activity Comments Participating per Day Days Lost
Early May 50 skiing competitors. None, same munber Some apprehensiou For each of these there came beforehand but received are two in the boat (100). letters of commendatiou Including supporters, following event. Marina total number around 500. cleanest ever been.
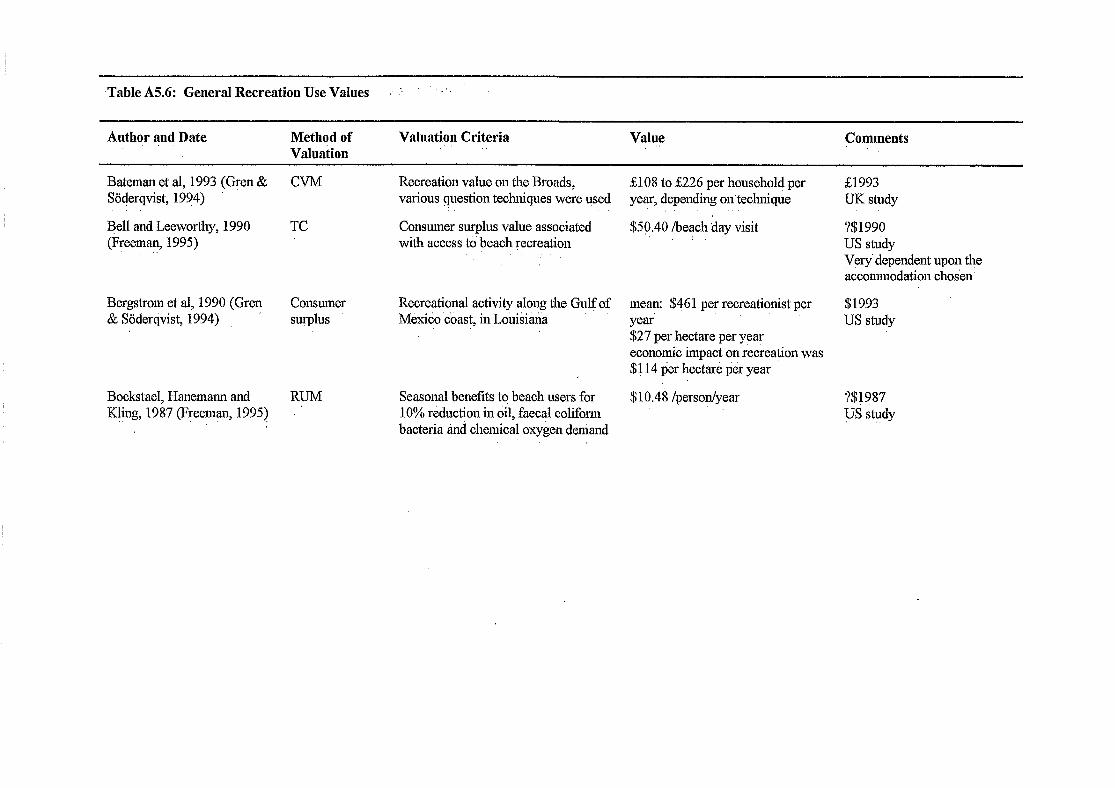
,Table A5.6: General Recreation Use Values ,’ ’ . ‘.
Author and Date Method of Valuation
Valuation Criteria .’ ,.’ Value Comments
Bateman et al, 1993 (@en & Siicjerqvist, 1994)
J+ll and Leeworthy, 1990 (Freeman, 1995)
Bergstrom et al, 1990 (Gren & Sadercjvist, 1994)
Bockstael, Hanemann and K!ing,’ 1987 (Freeman, 1995)
CVM
TC
Recreation value on the Broads, various question techniques were L!sed
Consumer surplus value associated wit11 access to beach recreation
Consmner surplus
Recreational activity along the Gulf of mean: $461 per recreationist per M&xico’&oast, in Louisiaria year
$27 per hectare per year economic impact on recreation was $i 14 per hectare per year
RUM Seasonal benefits tq beach users for 10% reduction in oil, faecal coliform bacteria tind chemical oxygen deniand
&I.08 to 5226 per household per year, depending on techniqtie
ZDQ.40 /beach day visit :
$10.48 /person/year
;E1993 UK study
?$I990 US study very dependent upon the accommodation chosen
$1993 US study
?$I987 US study
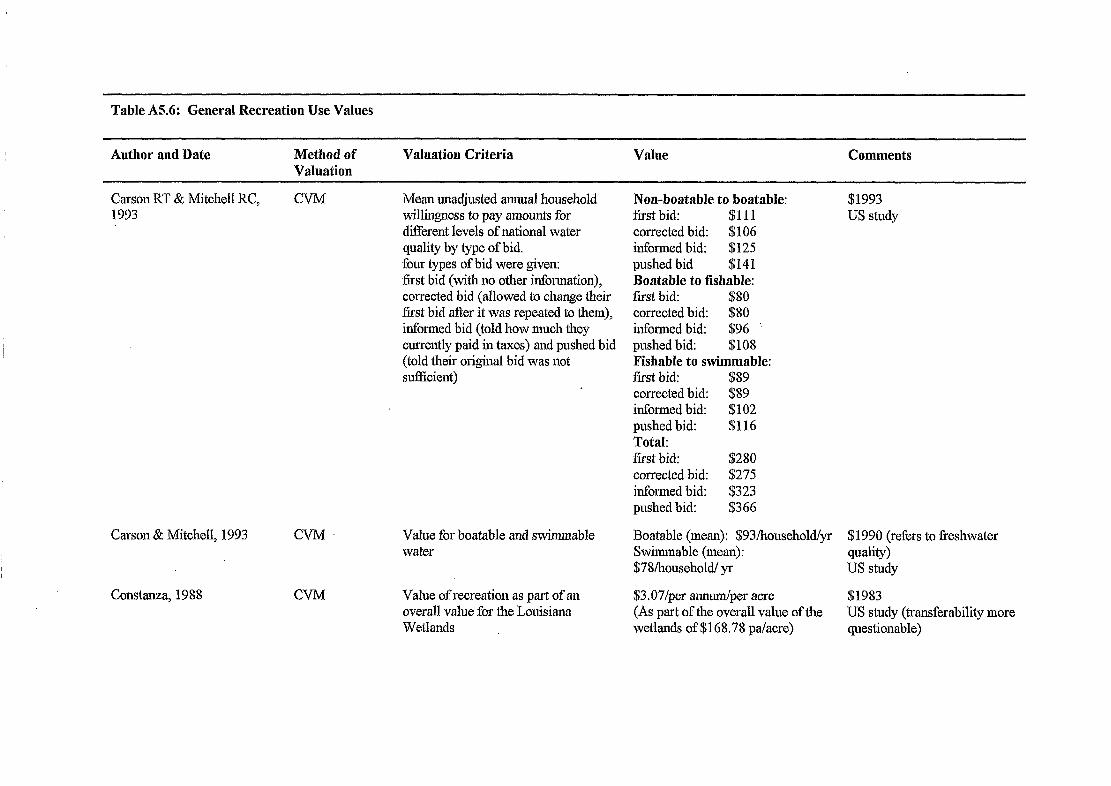
Table A5.6: General Recreation Use Values
Author and Date Method of Valuation
Valuation Criteria Value Comments
Carson R’T & Mitchell RC, 1993
CVM Mean unadjusted am~ual household willingness to pay amounts for different levels of national water quality by type of bid, four types of bid were given: first bid (with no other information), corrected bid (allowed to change their first bid after it was repeated to them), informed bid (told how much they currently paid in taxes) and pushed bid (told their original bid was not sufhcient)
Carson & Mitchell, 1993 CVM Value for boatable and swimmable water
Constanza, 1988 CVM Value of recreation as part of an overall value for the Louisiana Wetlands
Non-bodable to boatable: first bid: $111 corrected bid: $106 informed bid: $125 pushed bid $141 Boatable to fishable: fist bid: $80 corrected bid: $80 informed bid: $96 ’ pushed bid: $108 Fishable to swimmable: first bid: $89 corrected bid: $89 informed bid: $102 pushed bid: $116 Total: first bid: $280 corrected bid: $275 informed bid: $323 pushed bid: $366
Boatable (mean): $93/household/yr Swimmable (mean): $7X/household/ yr
$1993 US study
$1990 (refers to G-eshwater quality) US study
$3.07lper annum/per acre $1983 (As part of the overall vahte of the US study (transferability more wetlands ofS168.78 pa/acre) questionable)
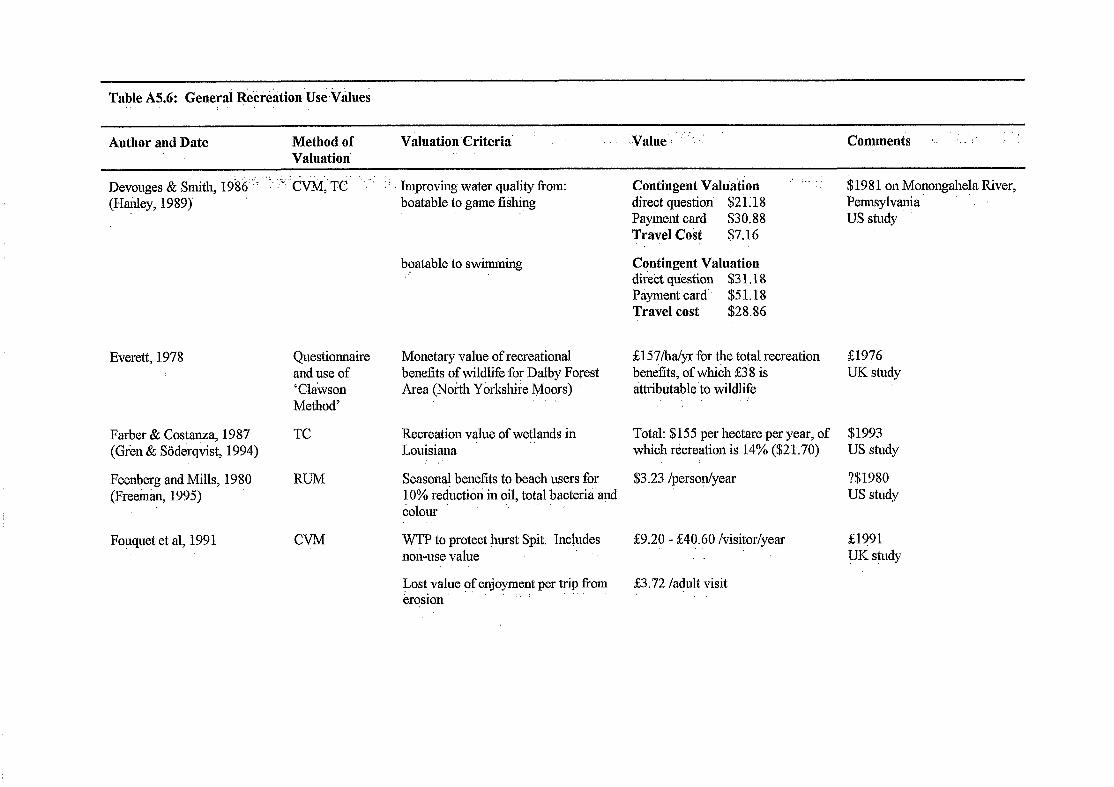
Table A5.6: General @%ition Use.Vilues :’ ”
Author and Date Method of Vahlation
Valuation Criteria‘ Walue.: ., ‘: ” Comments ‘. ;. :’
Devouges & Smith, 1986 “’ (Hanley, 1989)
Everett, 1.978
Farber & Costal!za, 1987 (Gien & SGderqvist, 1994)
Feenberg and Mills, 1980 (Freemin, 1995)
Fouquet et al, 1991 CVM
.‘. ” . .
” CVM, TC ,“’ : ’ Improving water quality from: Contingent V&i&on .’ :.. . .
$198 1 on Monongahela River, bokable to game kshing direct question $2 i : 18
Payment card $30.88 Travel Cost $7.16
Pennsylvania US study
Questionnaire and use of ‘clawsoll Method’
TC
RUM
boatable to swimming ,’
Contingent Valuation dire& qtiest;ion $3 1.18 Payment card” $51.18 Travel cost $28.86
Monetary value of recreational benefits of wildlife for Dalby Forest Area (North Y&shire Moors)
.
&I 5 7/ha/yr for the total recreation benefits, of whikh &3 8 is attributable to wildlife
Recreation value of wetlands in Louisiana
Total: $155 per hectare per year, of which rdcreation is 14% ($21.70)
Seasonal benefits to beach users for $3.23 /perso$year 10% reduc~iibri in oil, total bacteria’ and colour
WTP to protect burst Spit. Includes non-use value
&9.20 - g40.60 /visitor/year
&1976 UK study
$1993 US study
‘X$1980 US study
&1?91 UK study
Lost value of enjoyment per trip .fiom &3.72 /adult visit krosion ‘. :

Table A5.6: General Recreation Use Values
Author and Date Method of Valuation Criteria Value Comments Valuation
Georgiou et al, 1996 CVM WTP add litional water rates to ensure that bath ing water constantly passes EC stand ard
Green and Tunstall, 1991 (Bateman et al, 1993)
Green et al, 1990
CVM
CVM
WTP to 1 xotect coast - survey of residents in 5 towns
day of beach recreation, F6 sites around UK
WTP for survey 0:
WTP for survey 0:
day of beach recreation, f4 sites around UK
Great Yarmouth Mean S2.64 all per household S14.16 holiday per household S10.24 day trippers per household S9.33 local residents per household
Median SO.00 for all per household
Lowestoft Mean S14.32 all per household Sl4.49 holiday per household S14.53 day trippers per household S13.50 local residents per household
Median &4.75 all per household S5.00 holiday per household 54.50 day trippers per household &O.OO local residents per household
aE2 1.90 - g25.16 /resident/year
Mean &7.75 /adult recreation day
Mean $7.55 /adult recreation day
$1996 UK study
?&1991 UK study
&1988 UK study
~1989 UK study
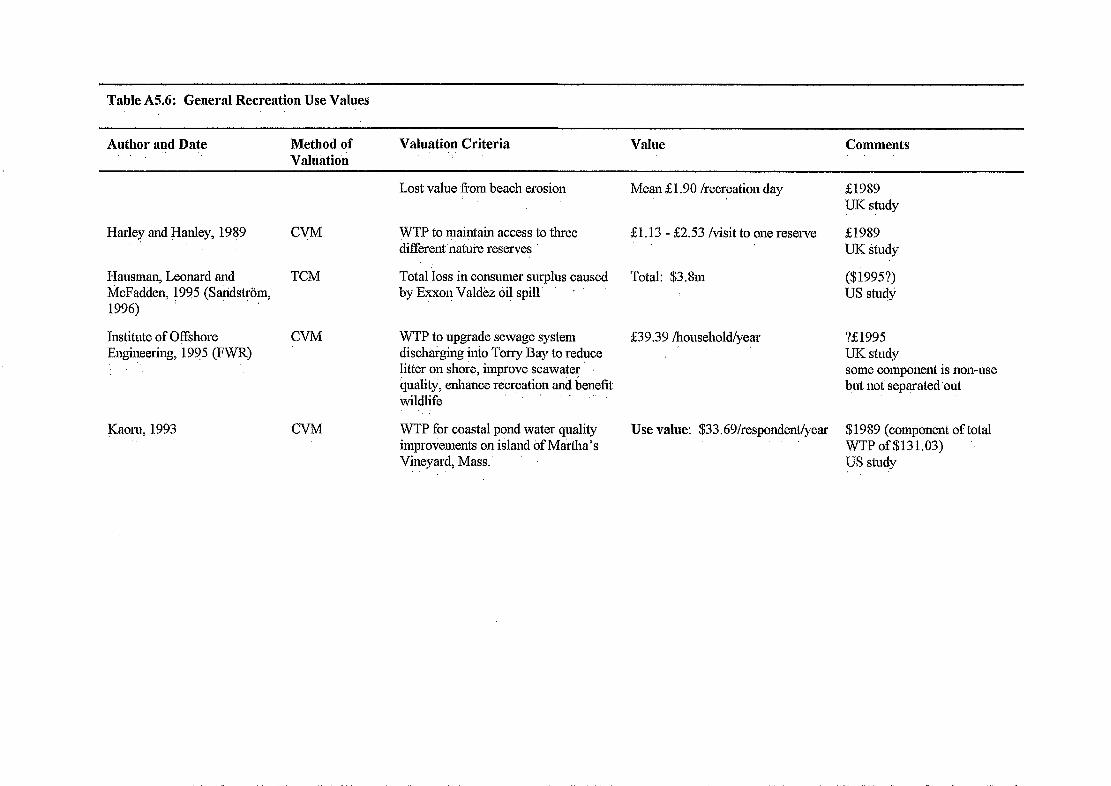
Table A5.6: General Recreation Use Values
Author and Date .‘,
Method of Valuation Criteria Value Comments Valtiktion
Harley and Hanley, 1989
Hausman, Leonard and &Fadden, f9?5 (Saridstrdm, 1996)
Institute of Offshore Engineering, 1995 (FWR)
Kaoru, 1993 CVM
Lost value from beach erosion
CI$!l WTP to maintain access to three different ‘nake reserves
TCM Total loss in consm~~er su~lus caused by Exxoll Valdkz oi! spill
CVM WTP to upgrade sewage system dischtiging into Tarry Bay to reduce litter on shore, improve seawater yuality, enhance recreation and benefit wildlife
WTP for coastal pond wat.er quality improvements on island of Martha’s Vineyard, Mass.
Mean &1.90 /recreation day
&1.13 - &2.53 /visit to one reserve
Total: $3.8111
539.39 /household/year
Use value: $33.69/respondent/year
&1989 UK study
&1989 UK St,udy
($i995?) US studJ;
?aE1995 UK study some component is non-use but not separated’ont
$1989 (component of total WTP of $131.03) US study
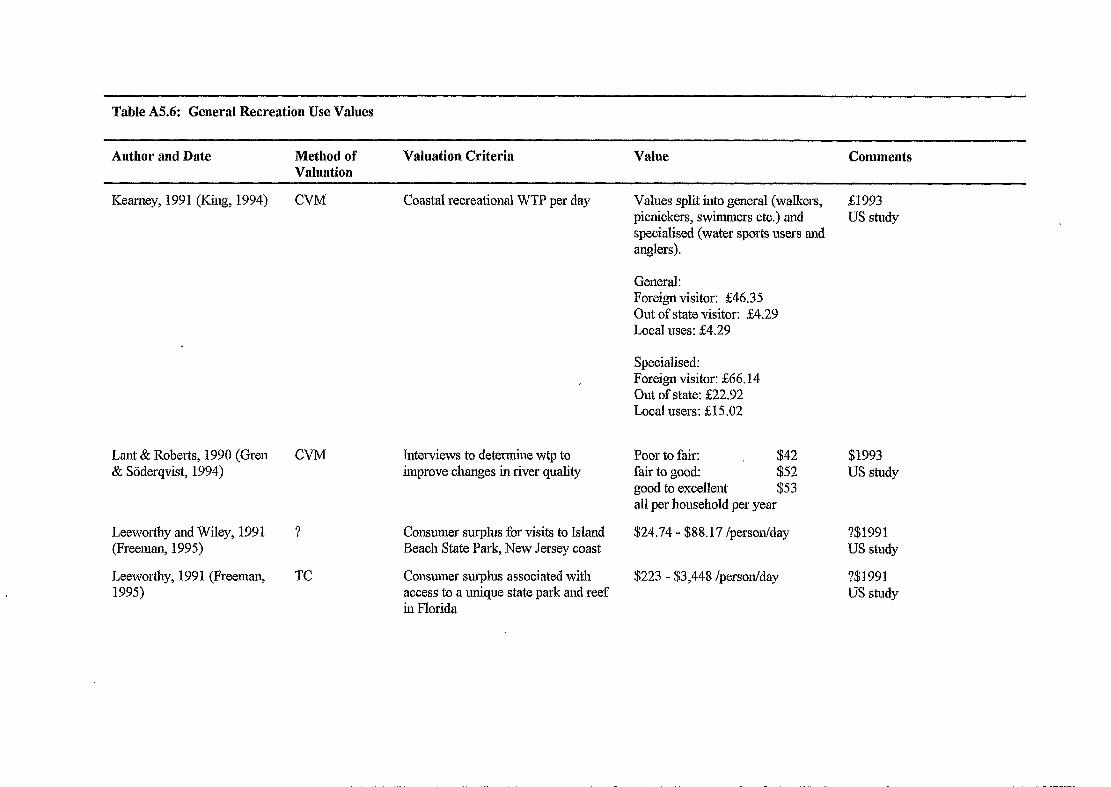
Table A5.6: General Recreation Use Values
Author and Date Method of Valuation
Valuation Criteria Value Comments
Kearney, 199 1 (King, 1994) CVM Coastal recreational WTP per day Values split into general (walkers, kc1993 picnickers, swimmers etc.) and US study specialised (water sports users and anglers).
General: Foreign visitor: 546.35 Out of state visitor: &4.29 Local uses: $4.29
Specialised: Foreign visitor: 566.14 Out of state: g22.92 Local users: &lS .02
Lant & Roberts, 1990 (Gren & Saderqvist, 1994)
CVM
Leeworthy and Wiley, 1991 (Freeman, 1995)
?
Leeworthy, 199 1 (Freeman, 1995)
TC
Interviews to delennine wtp to improve changes ti1 river quality
Poor to fair: $42 fair to good: $52 good to excellent $53 all per household per year
$1993 US study
Consumer surplus for visits to Island Beach State Park, New Jersey coast
Consumer surplus associated with access to a unique state park and reef in Florida
$24.74 - $88.17 /person/day
$223 - $3,448 /person/day
?$1991 US study
?$1991 US study
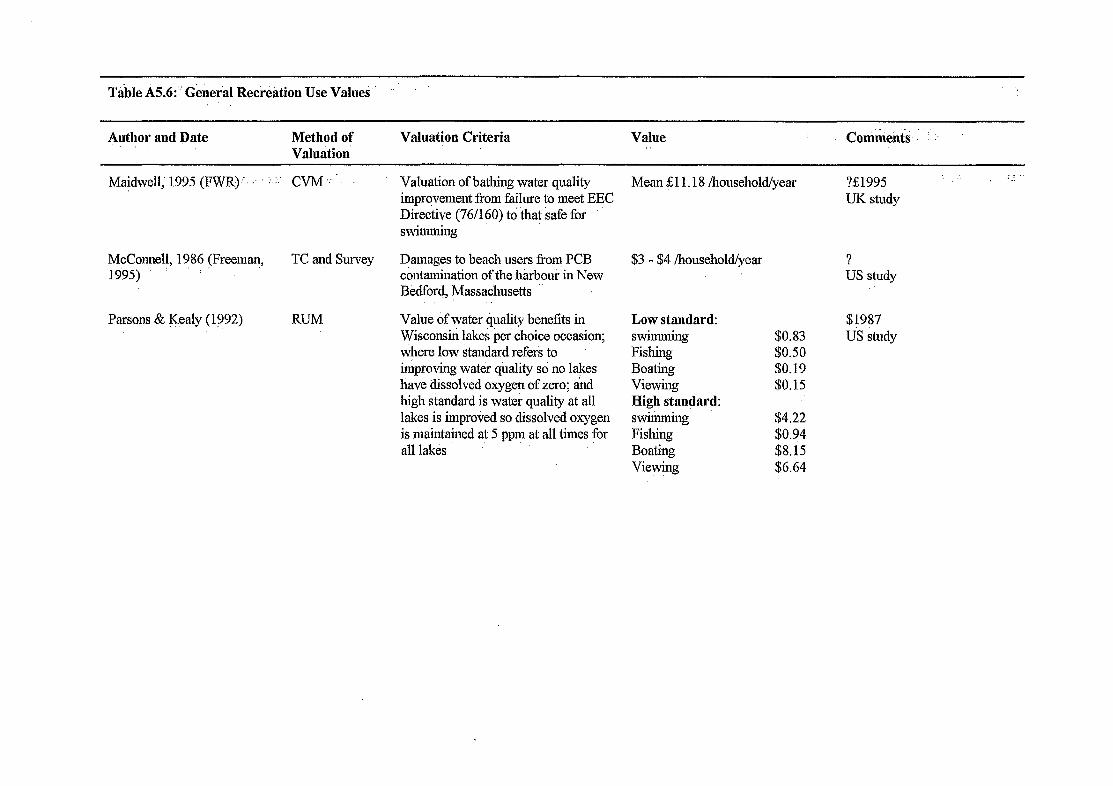
Table A5.6: :’ General Re&Gtion Use Valuei .’
Maidwell,’ 1995 (FWR)“‘.. : 1.’ CVM ‘:
McConnell, 1986 (Freeman, 1995) :
TC and Survey
parsons 4% @sly (1992) RUM
Valuation of bathing water quality imprqvement from failure to meet EEC Directive (76/160) tdihat Safe for ” swimming
lI?amages to beach users from PCB contamination of the harbour in New Bedford, Massachusetts
Value of water quality benefits in Wiscons& lakes per choice occasion; where low standard refers to &proving water qilality so no laltes have dissolved oxygen of zero; a?nd high standard js water quality at all lakes is improved so dissolved oxygen is maintained at 5 ppm at all times for all lakes
Author and Date Method of Valuation
Valuation Criteria Value
Mean $11.18 /household/year ?&I995
TJK study
‘, :.‘
$3 - $4 /household/year 1 US study
Low standard: swimming Fishing Boating Viewing High standard: swililming Fishing Boating Viewing
$0.83 $0.50 $0.19 $0.15
$J987 US study
$4.22 $0.94 $8.15 $6.64


Table A5.6: General Rkcrkation Use Values
‘Author fnd Date Method of Vahuition
Vdudion Criteria .‘,- _ Value : I ‘Comments
Penning-Rowsell et al, 1991 ’ ,’ &M
Penning-Rowsell et al, 1989 in Bat&&x et al, 1993
Sandstrlim, 1.996
CVM
Randqn Uti!ity Maximisa&on model
&-veys 0fcoasi:al &creation 1987- 199q: value bf e?joyment of t&s/~oday ‘s visit (me&l WTP)
“.”
ValYe of enjoyment per recreational visit to beaches in 4 conditions ., :
Total consumer surplus for re<lu$iol! in nutri&t’load along &itik S&edi$ co&t
Beaches and Prom&a&s.‘:” UK study .‘,.
19&3 Values as given in year Scsirborough &4.93 (users)
.’
Clicto11 &9.96 (users) DLmkiclz $6.87 (users) Filey 53.68 (Users) Frintqn HaStings
6E9.56 (users) $7.72 (users)
Spurn Head 333.50 (users) 1989 Bridlington &5.91 (users) Clacton ’ &IO.52 (users) Hun&anton 68.74 (users) Morecambe $5.76 (users) 1990 Herne Bay g12.34 (users) Herne ‘Bay 53.59 (residents)
Cliff Tops 1988 Peacehaven $3.50 (residents)
g3.86, g6.57, &7.76 and &I 1.46 ?&1989 /adult visit Ult study .
Estimated to be 240mSEK with the SEK1995 ~e~~ed’n~~~lti~~~~nnial logit model aiid Swedish Study 540r+BK with ‘l;he ‘conc#tional logit model ”
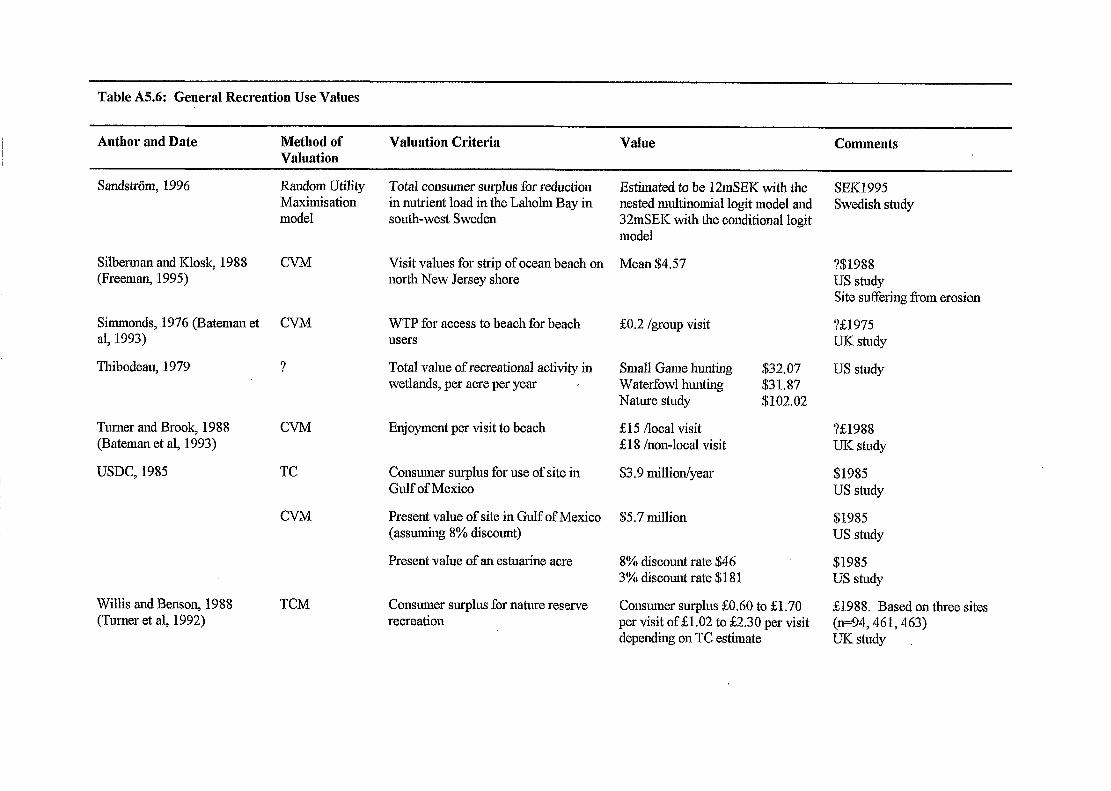
Table A5.6: General Recreation Use Values
Author and Date Method of Valuation
Valuation Criteria Value Comments
Sand&r&n, 1996
Silberman and Kiosk, 1988 (Freeman, 1995)
CVM
Simmonds, 1976 (Bateman et al, 1993)
CVM
Thibodeau, 1979 ?
Turner and Brook, 1988 (Bateman et al, 1993)
USDC, 1985
Random Ulilily Maximisation model
CVM
TC
CVM
Willis and Benson, 1988 (Turner et al, 1992)
TCM
Total consumer surplus for reduction in nutrient load in the Lahohn Bay in south-west Sweden
Visit values for strip of ocean beach on north New Jersey shore
WTP for access to beach for beach users
Total value of recreational activity in wetlands, per acre per year ’
Enjoyment per visit to beach
ConsLmier surplus for use of site in Gulf of Mexico
Present value of site in Gull: of Mexico (assmning 8% discount)
Present value of an estuarine acre
Consumer surplus for nature reserve recreation
Estimated to be 12mSEK with the SEKl995 nested multinomial logit model and Swedish study 32mSEK with the conditional logit model
‘Mean $4.57 ?$1988 US study Site surering from erosion
go.2 /group visit ?&1975 UK study
Small Game htmting Waterfowl hunting Nature study
&15 /local visit $18 /non-local visit
$3.9 million/year
$32.07 US study $31.87 $102.02
$5.7 million
8% discount rate $46 3% discount rate $18 1
?&I.988 UK study
$1985 US study
$1985 US study
$1985 US study
Consumer surplus &0.60 to &1.70 &1.988. Based on three sites per visit of &1.02 to &2.30 per visit (n=94,46 1,463) depending on TC estimate UK study
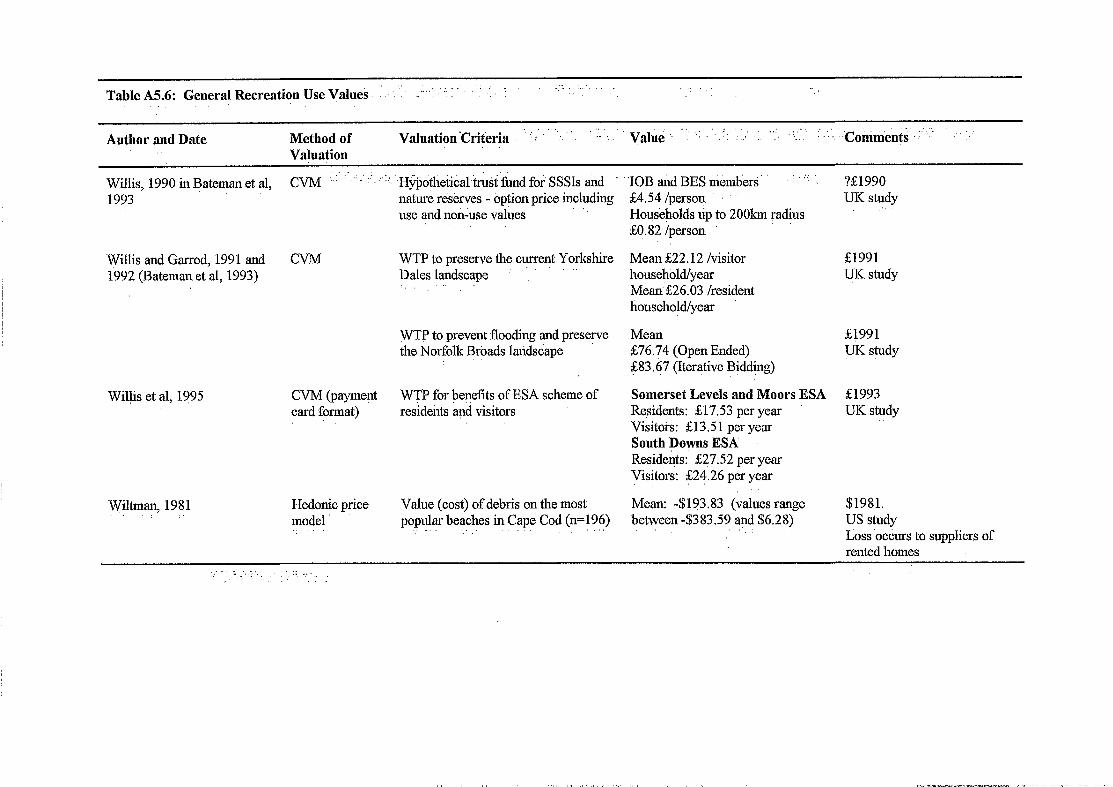
Willis, 1990 in Bateman et al, CVM ‘, .’ -‘,“. ‘: Hj$otheti&r& fimd fo; SSSIs and 1993
Willis and Garrod, 1991 and 1992 (Bzlteman et al, 1993)
CVM
Willis et al, 1995
Wiltman, 1981 ‘: ”
CVM (payme@ card format)
Hedonic price model
” :
nature res&es - option price including use and non-use values
‘.
WTP to preserve the cm-rent Yorkshire Dales landscape .’ ”
”
WTp to prevent flooding and preserve the Norfolk Broads’ lalidscape .’
WTP for benefits of ESA scheme of residents &d visitors
Value (cost) of debris on the most popular beaches in Cape Cod (n=196)
TOB alld BES niemb&s’ .’ :., I
&4.54 /person Hous’e~iolds Lip to 2OOkm radius gq.82 /person
Mean s22.12 /visitor household/year Mesui,&26.03 /resident household/year
Mean g76.74 (Open Ended) 583.67 (Iterqtive Bidding)
Somerset Levels and Moors ESA Residents: $17.53 per year Visitors: &13.51 peryear South Downs ESA Residents: s27.52 per year Visitors: $24.26 per year
Mean: -$193.83 (values range between $383.59 and $6.28)
?&1990 UK study
‘,
&1991 T$C study
&1991 UK study
51993 UK study
$1981. US study L&s ocdurs to suppliers of rented homes
. ” , , .‘I’. ,‘. , .
. ‘ . .
ANNEX 6:.DATA ON COMMElRCIAL FISHERIES
Annex 6 Contents:
Page
A6.1 Claims to the IOPC Fund A6.2 Cockles at the Burry Inlet.. A6.3 Cocklgs at the Three Rivers Estuary A6.4 Mussels A65 Winkle A6.6 Oysters A6.7. Scallops A6.8 Whelks A6.9 Bass A6.10 Demersal A6.11: Pelagic A6.12 Squid, etc.. A6.13 Lobster A6.14 Edible.Crab A6.15 Spider Crab A6.16 Crawfish A6;-17 Velvet Crab A6.18 Prawn.
Figure A6.1 Prices for Mollusca Figure A6.2. Prices for Whitefish. Figure A6.3 Prices for Crustaceans
6-5 6;6 6-7 6-S 6-9
6-10 6-11 6-12 6-13 6-14 6-15 6-16 6-17. 6-18.: 6-19:. 6-20 .. 6-21 6-22 :
6;23 6-24 * 6-25
R&D Technical Report P119 A6-3

R&D Technical Report P119 A6-4

A6.1 Claims to the IOPC Fund
Clainis to the IOPC Fund for Costs to Fisheries to 31/12/96
Claimant Nature of Claim .._ Amount of Amount Amount Claim : Approved?. Paid
(& million) a (;E million) (5 millidn),
10 fishermen in the area affected by the ban
148 fishermen in the area affected by the ban
1 oyster farmer in the area affected by the ban
7 fishermen outside area affected by ban
Reductions in catch of squid and whitefish in the Bristol Channel, North Devon and Swansea.
&Oil12
14 fish and. Claims for being deprived of raw 21.148 shellfish materials during the ban. processorsin the Companies trade in white fish (2), area affected by. whelks (5), crustaceans (5) and. the ban cockles, whelks and mussels (4).
3 fish and shellfish processors outside the area affected by the ban
One company based in New Quay (8Okm from the ban area) and one in Newport (16Okm from-the ban .- area). Claims admissible in principle due to the. close proximity to the ban area. 0ne.clan-n from a Comish based company was rejected due to the 400km distance from the ban area.
Total
Claims for lost fishing gear. Some claims were rejected cn the basis that gear was not in the water or was outside the affected area.
$0.040 20.028
Claims for loss of income due to the fishing ban, with some claims for damage to nets and-loss of pots. The majority catching whelks and crustaceans with some white fish. 112 claims paid..
55.449 54.194
Stock contaminated by the spill .. and loss of market due to the ban. 75% payments for stock which normally would have been harvested and sold since the incident.
so.112 SO.084
25.602 z5:454
Source: IOPC, 1996, 1997asnd 1997c a It is reported that rejected claims amount to &7 million.
R&D Technical Report P119 A6-5
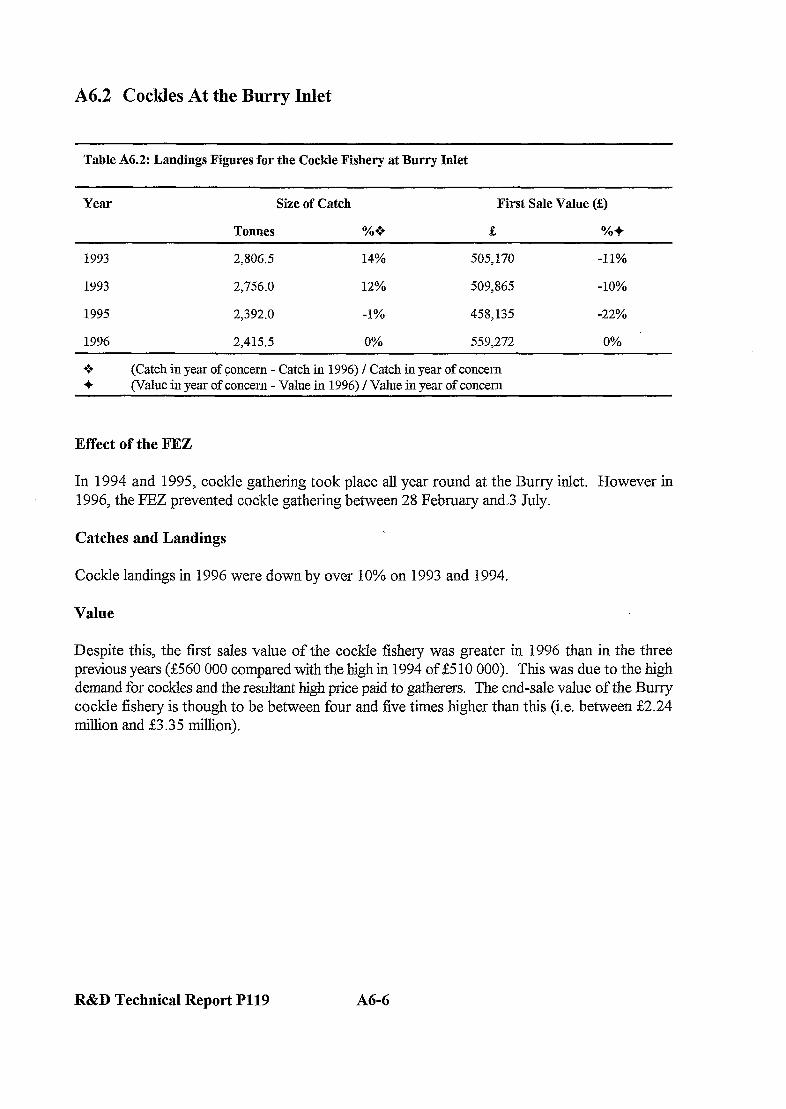
A6.2 Cockles At the Burry Inlet
Table A6.2: Landings Figures for the Cockle Fishen; at Burry Inlet
Year Size of Catch First Sale Value (%)
Tonnes %+ & %+
1993 2JO6.5 14% 505,170 -11%
1993 2,756.0 12% 509,865 -10%
1995 2,392.0 -1% 458,135 -22%
1996 2,415.j 0% 559,272 0%
+;+ (Catch in year of concern - Catch in 1996) / Catch in year of concern + (Value in year of concern - Value in 1996) / Value in year of concern
Effect of the FEZ
In 1994 and 1995, cockle gathering took place all year round at the Burry inlet. However in 1996, the FEZ prevented cockle gathering between 28 February and..3 July.
Catches and Landings
Cockle landings in 1996 were down by over 10% on 1993 and 1994.
Value
Despite this, the first sales value of the cockle fishery was greater in 1996 than in the three previous years (2560 000 compared with the high in 1994 of &510 000). This was due to the high demand for cockles and the resultant high price paid to gatherers. The end-sale value of the Burr-y cockle fishery is though to be between four and five times higher than this (i.e. between S2.24 million and 23.35 million).
R&D Technical Report P119 A64
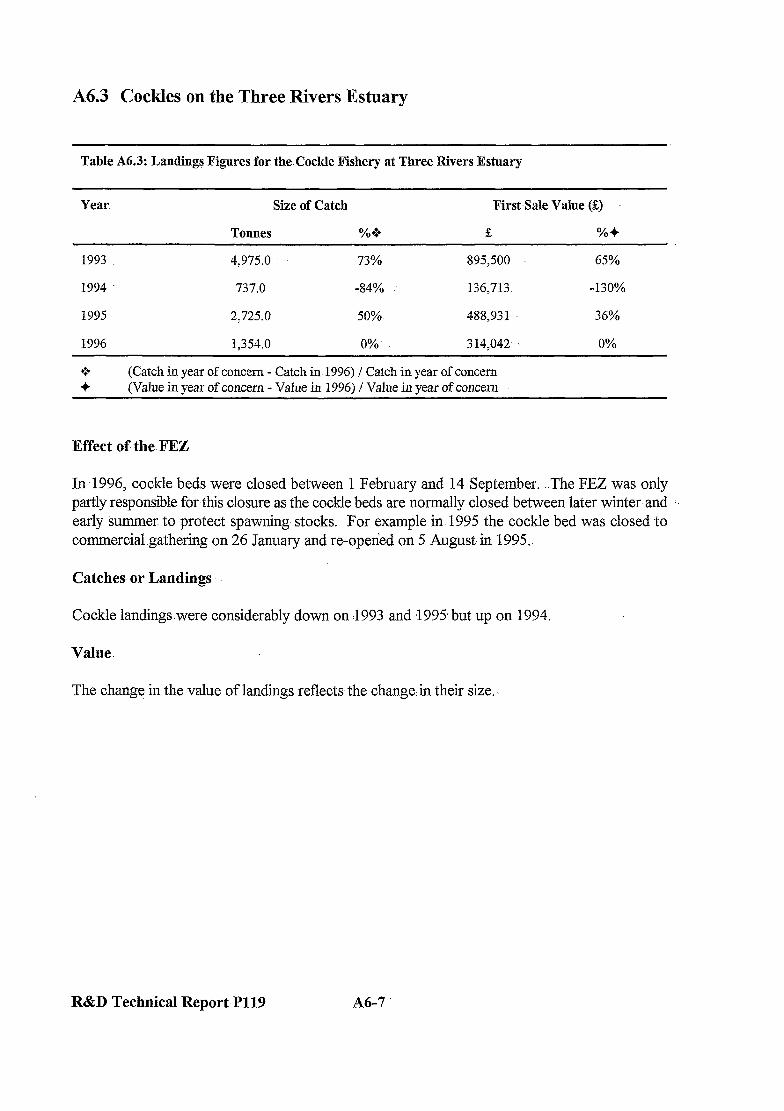
A6.3 Cockles on the Three Rivers Estuary
Table A6.3: Landings Figures for. the Cockle Fishery at Three Rivers Estuary
Year Size of Catch First Sale Value (&)
Tonnes %+3 & %+
1993 4,975.O 73% 895,500 65%
1994 737.0 -84% 136,713 -130%
1995 2,725.0 50% 488,931 36%
1996 1,354.0 0%. 3 14,042. 0%
: ;I
(Catch in year of concern - Catch in. 1996) ,f Catch in year of concern (Value in year of concern - Value in 1996) / Value in year of concern
Effect of the.FEZ
In-1996, cockle beds were closed between 1 February and 14 September. The FEZ was only partly responsible for this closure as the cockle beds are normally closed between later winter and .’ early summer to protect spawning stocks. For example in 1995 the cockle bed was closed to commercialgathering on 26 January and re-opened on 5 August,in 1995..
Catches or Landings
Cockle landings.w-ere considerably down on !1993 and-1995, but up on 1994.
Value
The change in the value of landings reflects the change:in their size.
R&D Technical Report P119 A6-7

A6.4 Mussels
Table A6.4: Landings Figures for the Mussel Fishery
Year Size of Catch First Sale Value (;E)
Tonnes %+3 e %+
1993 181.0 -81% 34,390 -84%
1991 521.0 37% 36,000 -76%
1995 360.0 9% 26,600 -138%
1996 327.0 0% 63,300 0%
+ (Catch in year of concern - Catch in 1996) / Catch in year of concern + (Value in year of concern - Value in 1996) / Value in year of concern
Effect of the FEZ
The FEZ had some impact on 80% of mussels landings in 1996, but there were also other factors contributing to the poor supply ofgood quality mussels. This included a prohibition to gathering on the north side of the Burr-y Inlet under the EC Directive on Bivalve Molluscs and a shortage of adult stock.
Catches or Landings
Cockle landings were down on those of 1994 and 1995, but up on 1993.
Value
Despite this, the value of mussels landed,was higher in 1996 than in the three previous years. This may have been due, in part, to a high demand in Europe in 1996.
R&D Technical Report Pll9 A6-8
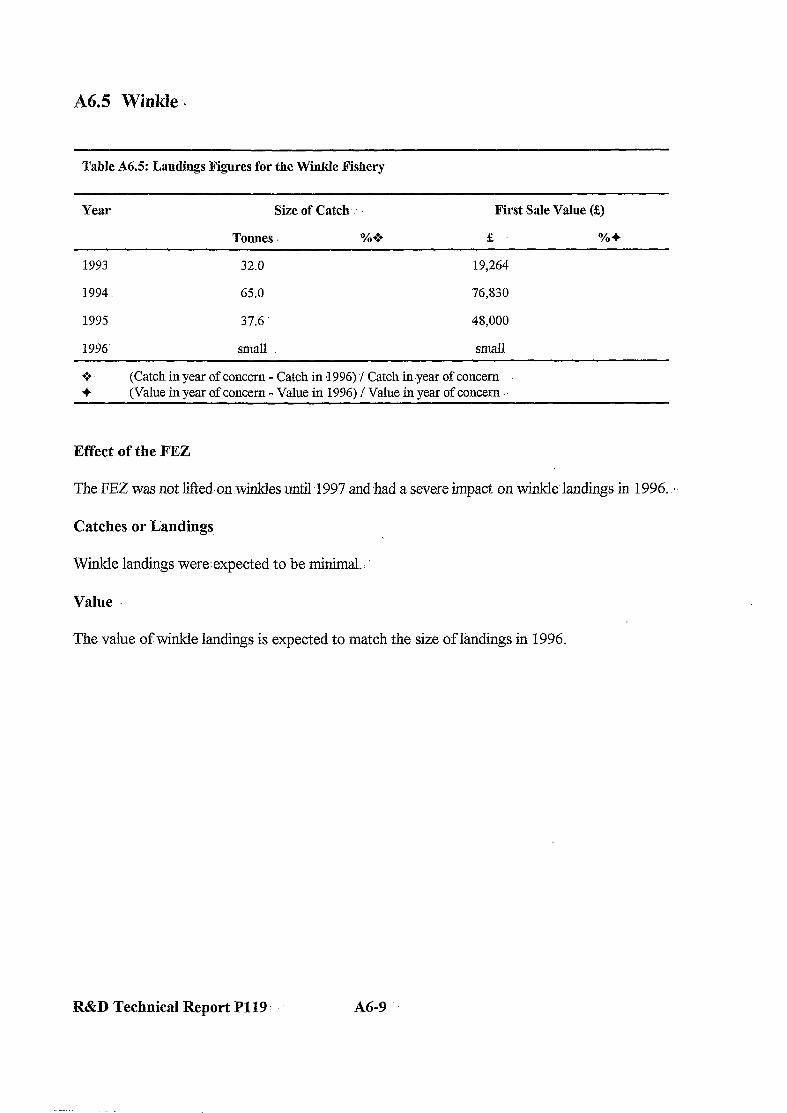
A6.5 Winkle .i
Table A6.5: Landings Figures for the Winkle Fishery
Year Size of Catch,: First Sale Value ($)
Tonnes %+3 e %+
1993 32.0 19,264
1994 65.0 76,830
1993 37.6 48,000
1996. small SlEdI
: ;:
(Catch in year of concern - Catch in .1996)./ Catch iu.year of concern (Value in year of concern - Value in .1996) / Value in year of concern . .
Effect of the FEZ
The J?EZ was not l&don knkks until 1997 and had a severe impact on wkkle landings in 1996. -
Catches or Landings
Winkle landings were:expected to be minimal.:
Value
The value of winkle landings is expected to match the size of landings in 1996.
R&D Technical Report P119. A6-9
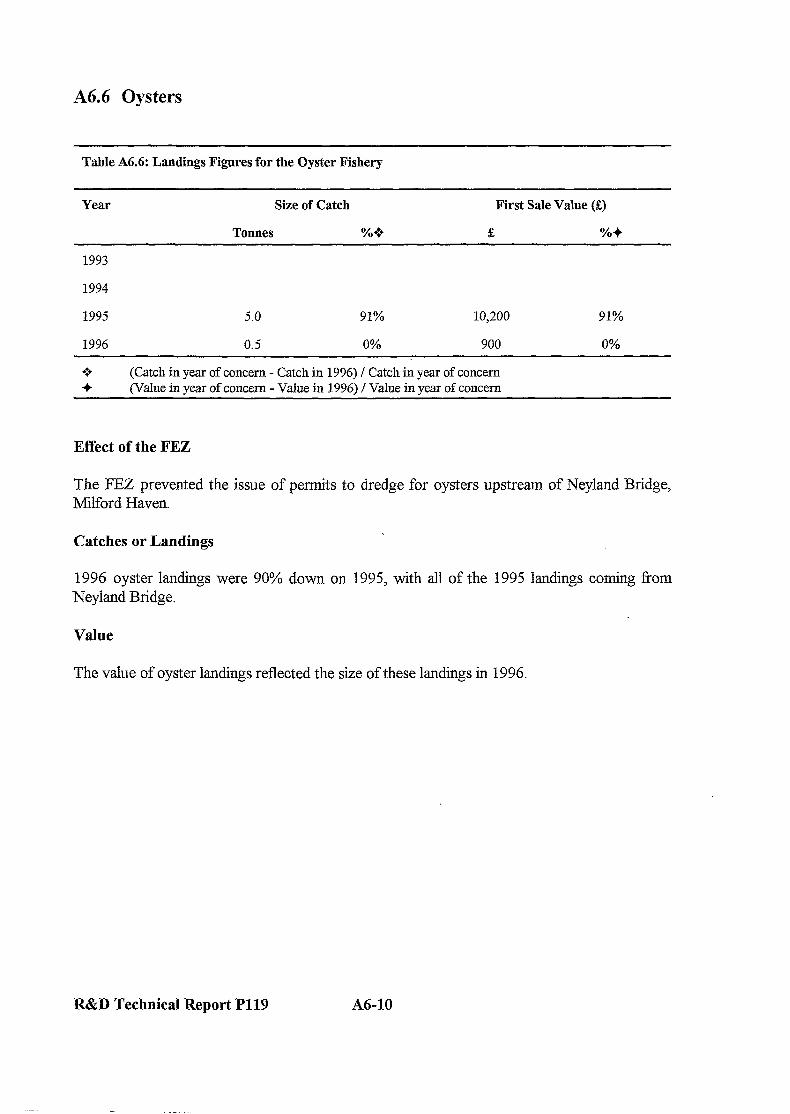
A6.6 Oysters
Table A6.6: Landings Figures for the Oyster Fishery
Year Size of Catch First Sale Value (Q
Tonnes %s+ 4 %+
1993
1994
1995 5.0 91% 10,200 91%
1996 0.5 0% 900 0%
l a (Catch in year of concern - Catch in 1996) / Catch in year of concern + (Value in year of concern - Value in 1996) I Value in year of concern
Effect of the FEZ
The FEZ prevented the issue of permits to dredge for oysters upstream of Neyland Bridge, Milford Haven.
Catches or Landings
1996 oyster landings were 90% down on 1995, with all of the 1995 landings coming from Neyland Bridge.
Value
The value of oyster landings reflected the size of these landings in 1996.
R&D Technic4 Report P119 A6-10

A6.7 Scallops,
Table A&7: Landings Figures for the Scallop Fishery
Year Size of Catch- First Sale Vdue (%)
Touues. O/( + e %4
1993 28.0 -396% 34,071 -363%
1994 70.0 -99% 91,999 -71%
1995 28.0 ” -396% 43,780 -260%
1996 139.0 0% 157,611 0%
: ;:
(Catch in year of concern - Catch ir 1996) 1 Catch in year of concern (Value in year of concern --Value in 1996) / Value in year of concern,
Effect of the FEZ
In 1996, .the majority .of scallop landings were.taken from the north.and-west of the-SWSFC District and from outside the District. The FEZ hadlittle impact on landings of scallops.
Catches or Landings
1996 scallop landings were twice those in 1994 and.four. times whose in 1993 and 1995.
Value
1996 prices appear to be slightly lower then those in previous years.
R&D Technical Report P119 I’ A6-11
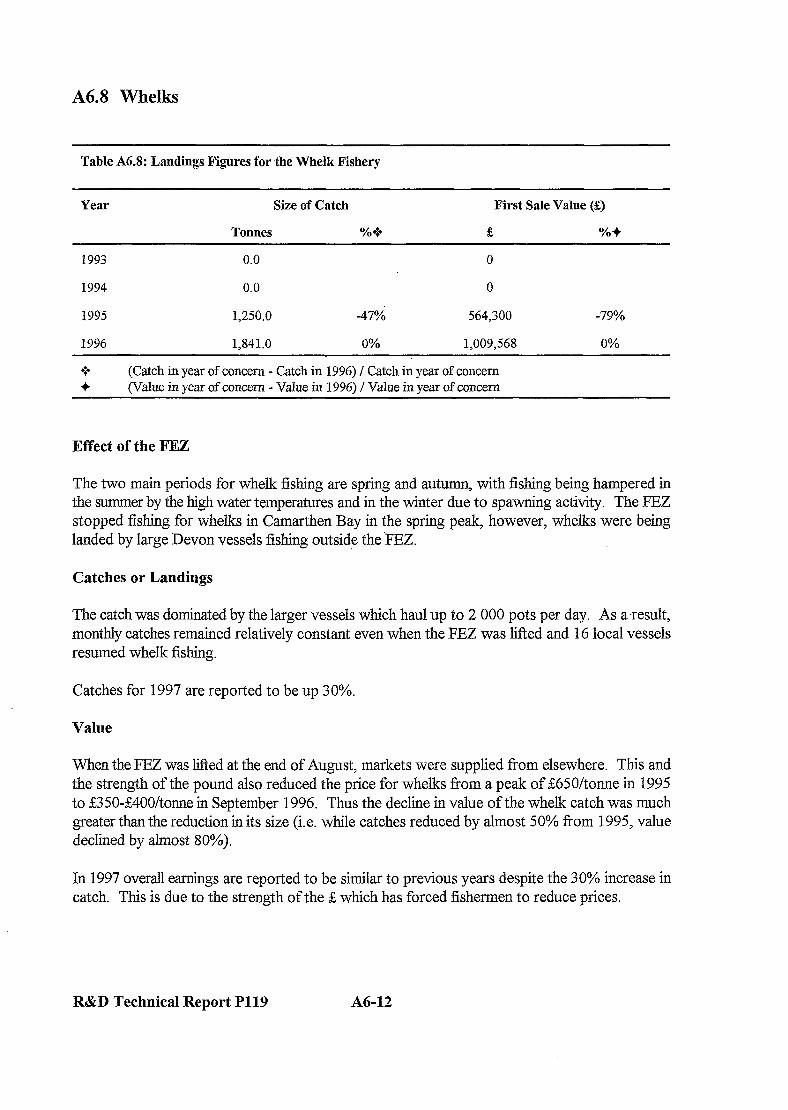
A6.8 Whelks
Table A6.8: Landings Figures for the Whelk Fishery
Year Size of Catch First Sale Value (2)
Tonnes %+3 & %+
1993 0.0 0
1994 0.0 0
1995 1,250.O -47% 564,300 -79%
1996 1341.0 0% 1,009,568 0%
Q (Catch in year of concern - Catch in 1996) / Catch in year of concern + (Value in year of concern - Value in 1996) / Value in year of concern
Effect of the FEZ
The two main periods for whelk fishing are spring and autumn with fishing being hampered in the summer by the high water temperatures and in the winter due to spawning activity. The FEZ stopped fishing for whelks in Camarthen Bay in the spring peak, however, whelks were being landed by large Devon vessels fishing outside the ‘FEZ.
Catches or Landings
The catch was dominated by the larger vessels which haul up to 2 000 pots per day. As aresult, monthly catches remained relatively constant even when the FEZ was lifted and 16 local vessels resumed whelk fishing.
Catches for 1997 are reported to be up 30%.
Value
When the FEZ was lifted at the end of August, markets were supplied from elsewhere. This and the strength of the pound also reduced the price for whelks from a peak of&650/tonne in 1995 to &350-&4OO/tonne in September 1996. Thus the decline in value of the whelk catch was much greater than the reduction in its size (i.e. while catches reduced by almost 50% from 1995, value declined by almost 80%).
In 1997 overall earnings are reported to be similar to previous years despite the 30% increase in catch. This is due to the strength of the & which has forced fishermen to reduce prices.
R&D Technical Report P119 A6-12
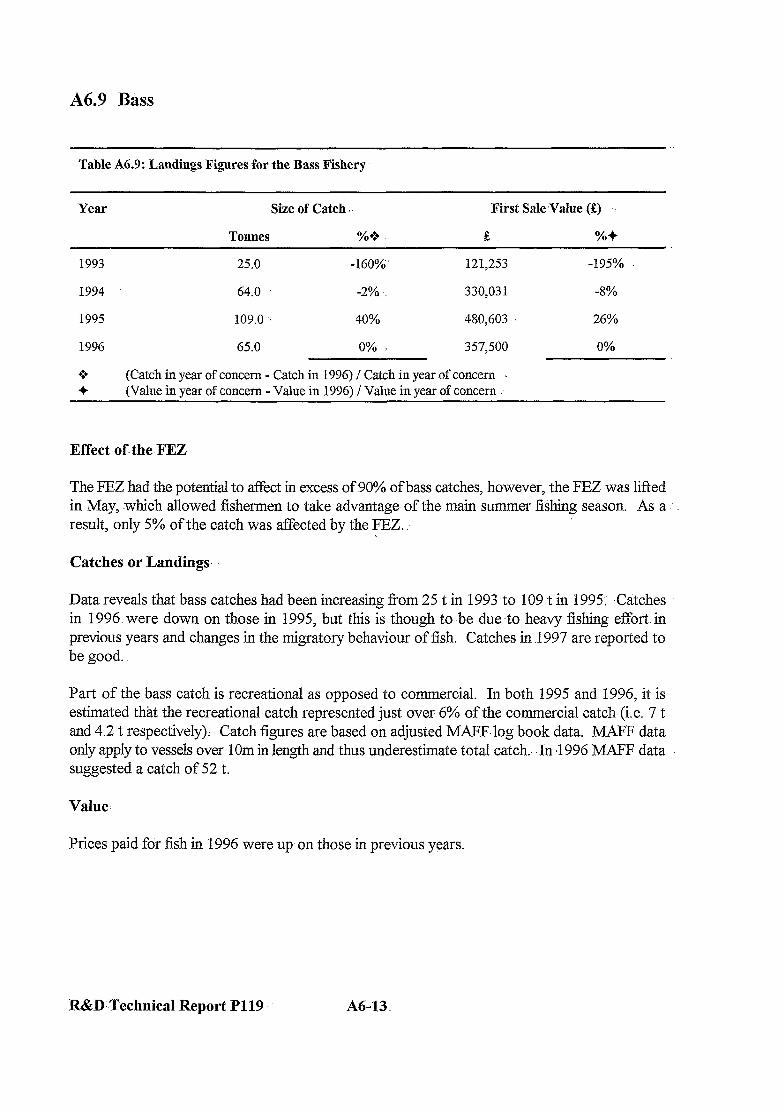
A6.9 B&is
Table A6.9: Landings Figures for the Bass Fishery
Year Size of Catch .: First SakValue (5-Z)
Tonnes O/o*% a %+
1993 25.0 -160%’ 121,253 -195%
1994 64.0 -2% 330,03 1 -8%
1995 109.0 .I 40% 480,603 26%
1996 65.0 0% 357;500 0%
+;+ (Catch in year of concern - Catch in 1996) / Catch in year .of concern . + (Value in year of concern - Value in 1996) ! Value in year of concern
Effect of. the FEZ
The FEZ had the potential to affect in excess of 90% of bass catches, however, the FEZ was lifted in May, -which allowed fishermen to take advantage of the main summer fishing season. As a .. result, only 5% of the catch was affected by the FEZ..
Catches or Landings,
Data reveals that bass catches had been increasing from 25 t in 1993to 109 t in 1995; Catches in 1996. were down on those in 1995, but this is though to be due to heavy fishing effort. in previous years and changes in the migratory behaviour of fish. Catches in 1997 are reported to be good.
Part of the bass catch is recreational as opposed to commercial. In both 1995 and 1996, it is estimated that the recreational catch represented just over 6% of the commercial catch-(i.e. 7 t and 4.2 t respectively); Catch figures are based on adjusted MAFF.log book data. MAFF data only apply to vessels over 10m in length and thus underestimate total catch.- .In l996 MAFF data suggested a catch of 52 t.
Value.
Prices paid for fish in 1996 were up- on those in previous years.
R&D:.Technical Report P119. A6-13

A6.10 Demersal
Table A6.10: Landings Figures for the Demersal Fishery
Year Size of Catch First Sale Value (Q
Tonnes %+3 e %+
1993 2,042.o 13% 3,073,994 22%
1994 1397.0 7% 2,684,246 10%
1995 1,657.0 -7% 1,897,662 -27%
1996 1,770.o 0% 2,406,157 0%
l z* (Catch in year of concern - Catch in 1996) / Catch in year of concern + (Value in vear of concern - Value in 1996) / Value in vear of concern
Effect of the FEZ
Most landings of demersal fish are sourced from outside the 6 mile limit of the SWSFC District and were thus not affected by the ban.
Catches or Landings
Catches fluctuate little in terms of tonnes caught. The 1996 catch was up on that for 1995. Catches for 1997 are reported to be on a par with previous years.
Catch figures are those reported to MAFF which apply to vessels over 10m in length thus these underestimate total catch. The scale of this underestimate is not known, although a survey of ports in the SWSFC District in 1995 identified 35 vessels over 10m and 299 less than 10m.
Value
Prices paid for fish in 1996 were up on those for 1995. .
R&D Technical Report P119 A6-14

A6.11 :,-I Pelagic ;.
Table A6.11: Landings Figures for the Pelagic Fishery
Year Size of Catch First Sale Value (;E)
Tonnes ’ o/O+ e % +
1993. 20.0 -215% 10,000 -443%
1994 5.0 -1160% 2,000 -2613%
1995 4.6 -1270% 2,300 -2259%
1996 63.0 0% 54,267 0%
l a
+ (Ctitch in year of concern - Catch in 1996) I Catch in year of concern (Value in year of concern - Value in 1996) I Value in year of concern
Effect of the FEZ
Not known. :
Catches or Landing!
The 1996 catch was much higher than that in previous years. Catches for -1997 are reported to be on a par with.previous.years.
Catch figures are those reported to MN33 .which apply. to vessels.over 10m in length, thus these underestimate total catch. The scale of this underestimate is not known, although asurvey of ports in the SWSFC District in 1995 identified 35 vessels over lOm-and 299 less than 1 Om:
Value
Prices paid for fish in -1996 appear to be twice those paid in previous years.
R&D Technical Report P119 A615
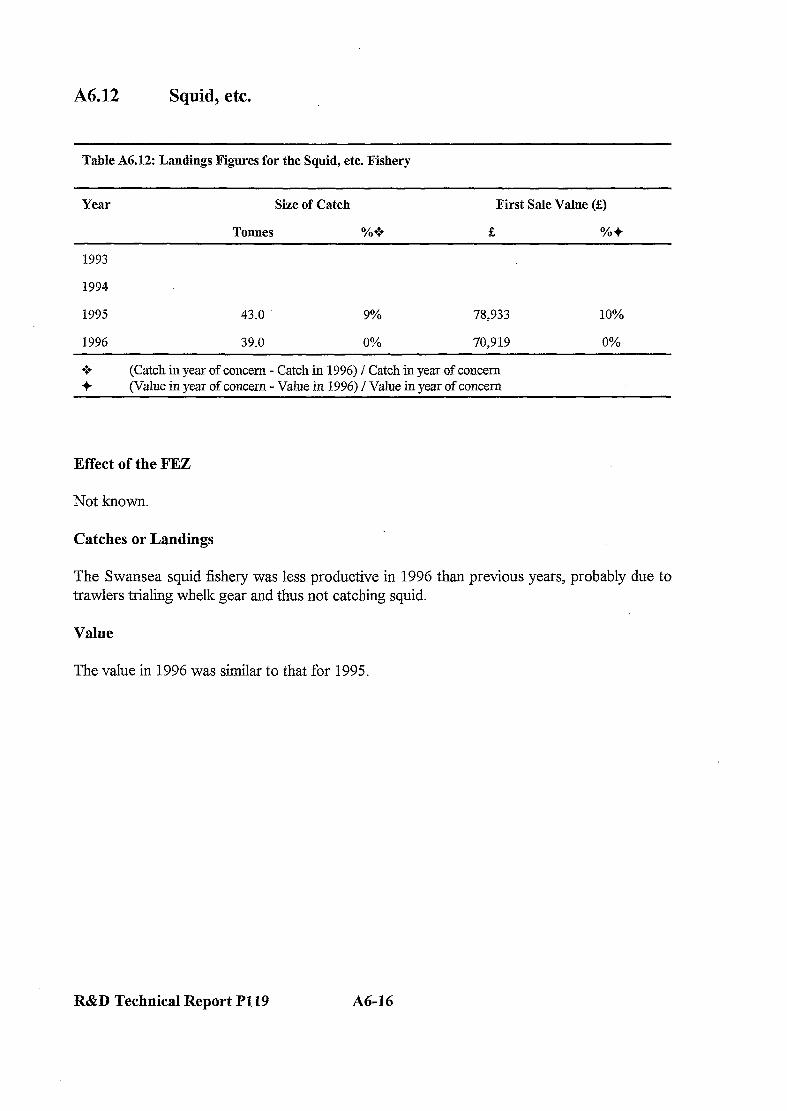
A6 12 Squid, etc.
Table 86.12: Landings Figures for the Squid, etc. Fishery
Year Size of Catch l?irst Sale Value (g)
Tonnes %+ & %+
1993
1994
1995 43.0 9% 78,933 10%
1996 39.0 0% 70,919 0%
Q
+ (Catch in year of concern - Catch in 1996) / Catch in year of concern (Value in year of concern - Value in 1996) / Value in year of concern
Effect of the FEZ
Not known.
Catches or Landings
The Swansea squid fishery was less productive in 1996 than previous years, probably due to trawlers trialing whelk gear and thus not catching squid.
Value
The value in 1996 was similar to that for 1995
R&D Technical Report P119 A6-16

A6S3 Lobster
Table A6.13: Landings Figures for the Lobster Fishery
Year. Size of Catch First Sale Value (%)
Tonnes %+ E %+
1993 70.5 68% 575,070 61%:
1994 62.5 64% 537,371 58%
1995 70.2 68% 613,298 64%
1996 22.4 .. 0% 223,220 0%
: ;T
(Catch in year of concern - Catch in 1996) I Catch in year of concern (Value in year of concern - Value in 1996) / Value in year of concern
Effect of -the -FEZ
The FEZ affected 90% of the lobster catch. The lobster season is typically between April-and September. The removal of the FEZ coincided tith the‘normal winding down period of the. lobster season..
Catches or Landings
Lobster landings in January 1996 were similar to those in 1995, how-ever there was a rapid drop in February.1996 with.catches between May and August 1996 being 800/d down on those for 1995. After the FEZ was removed, catches improved to 2995 levels. Indeed by December 1996, catches were twice those for 1995. In total, lobster catches were down almost 70% on 1995 catches. Catches of lobster in 1997 are reported to be very good due to under-fishing in 1996, Catches have improved in terms of both the numbers caught and the size of individual specimens.
Landings per unit effort (LPUE) w-as 12.6% down on 1995 which bucks the general upward trend since 1990. This is due to lower LPUE figures for areas outside the-FEZ which dominate the higher-LPUE figures which were achieved inside the FEZ once it was lied.
Value
Lobster prices were.slightly up on 1995..
R&D Technical Report P119 A6-17
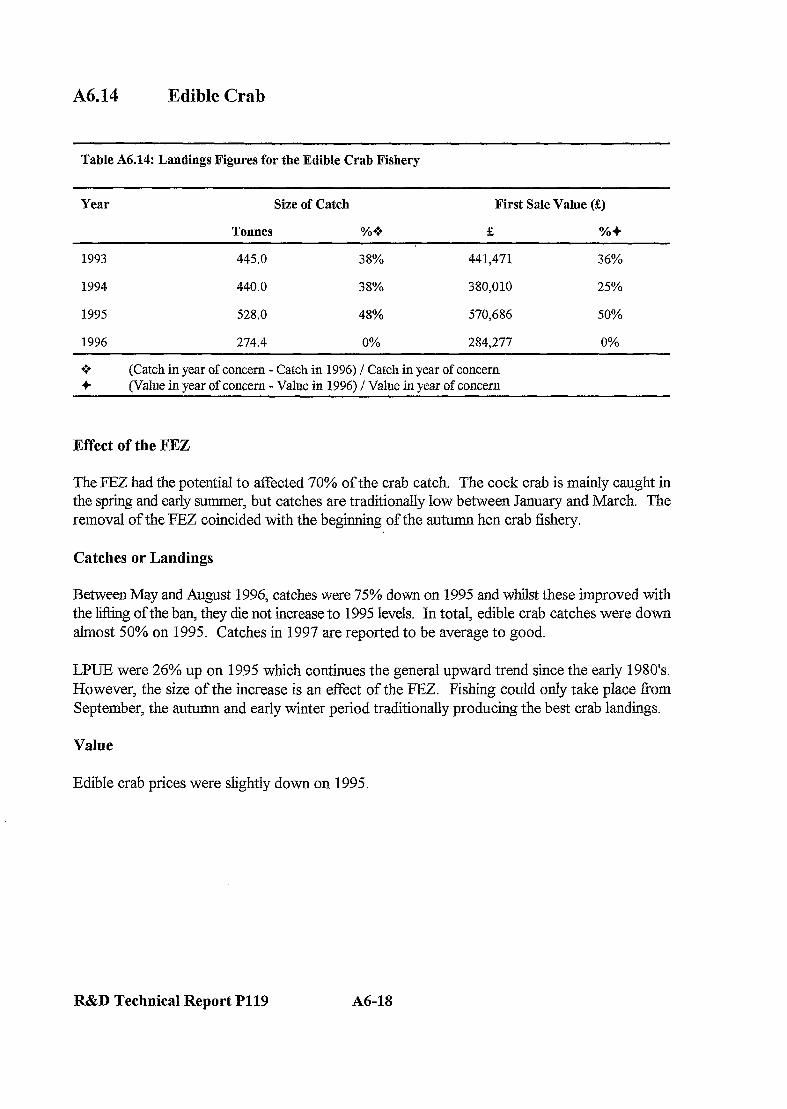
A6.14 Edible Crab
Table A6.14: Landings Figures for the Edible Crab Fishery
Year Size of Catch First Sale Value (2)
Tonnes %+ e %+
1993 445.0 38% 441,471 36%
1994 440.0 38% 3S0,OlO 25%
1995 528.0 48% 570,686 50%
1996 274.4 0% 284,277 0%
: ;:
(Catch in year of concern - Catch in 1996) / Catch in year of concern (Value in year of concern - Value in 1996) / Value in year of concern
Effect of the FEZ
The FEZ had the potential to affected 70% of the crab catch. The cock crab is mainly caught in the spring and early summer, but catches are traditionally low between January and March. The removal of the FEZ coincided with the beginning of the autumn hen crab fishery.
Catches or Landings
Between May and August 1996, catches were 75% down on 1995 and whilst these improved with the lifting of the ban, they die not increase to 1995 levels. In total, edible crab catches were down almost 50% on 1995. Catches in 1997 are reported to be average to good.
LPUE were 26% up on 1995 which continues the general upward trend since the early 1980’s. However, the size of the increase is an effect of the FEZ. Fishing could only take place from September, the autumn and early winter period traditionally producing the best crab landings.
Value
Edible crab prices were slightly down on 1995
R&D Technical Report Pl19 A6-1s
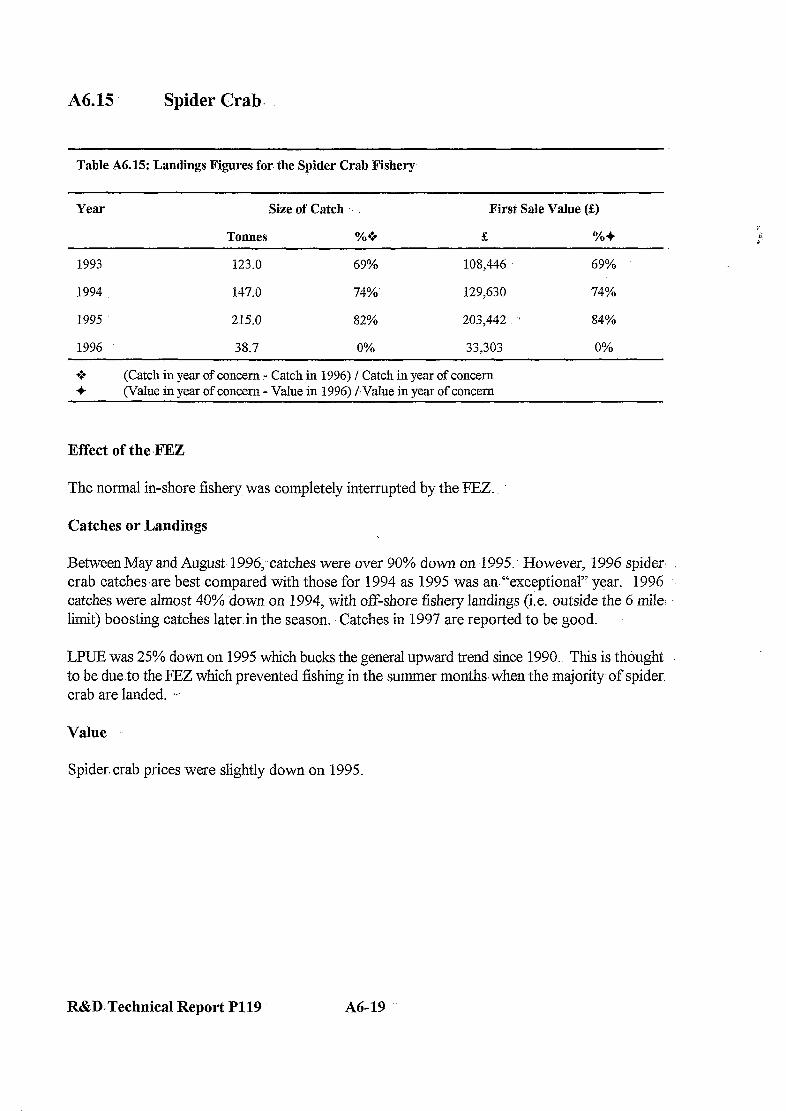
A6.15 Spider Crab.
Table A6.15: Landings Figures for. the Spider Crab Fishery
Year Size of Catch .. . . First Sale Value (S)
Tonnes %+3 & %+
1993 123.0 69% 108,446 69%
1994 147.0 74%’ 129,630 74%
1995 213.0 82% 203,442 84%
1996 38.7 0% 33,303 0%
(Catch in year of concern - Catch in 1996) I Catch in year of concern (Value in year of concern - Value in 1996) /.Value in year of concern
Effect of the :FEZ
The normal in-shore fishery was completely interrupted by the FEZ
Catches or Landings
Between May and August 1996;.catches were over 90% down on 1995. However, 1996 spider crab catches,are best compared with those for 1994 as 1995 was an “exceptional” year. 1996 catches were almost 40% ‘down on 1994, with off-shore fishery landings (i:e. outside the 6 mile: limit) boosting catches later-in the season. Catches in 1997 are reported to be good.
LPUE was 25% down on 1995 which bucks the general upward trend since 1990. This is thought to be due to the FEZ which prevented fishing in the summer months. when the majority: of spider. crab are landed. ‘..
Value.
Spider. crab prices were slightly down on 1995.
R&D.Technical Report P119 A6-19
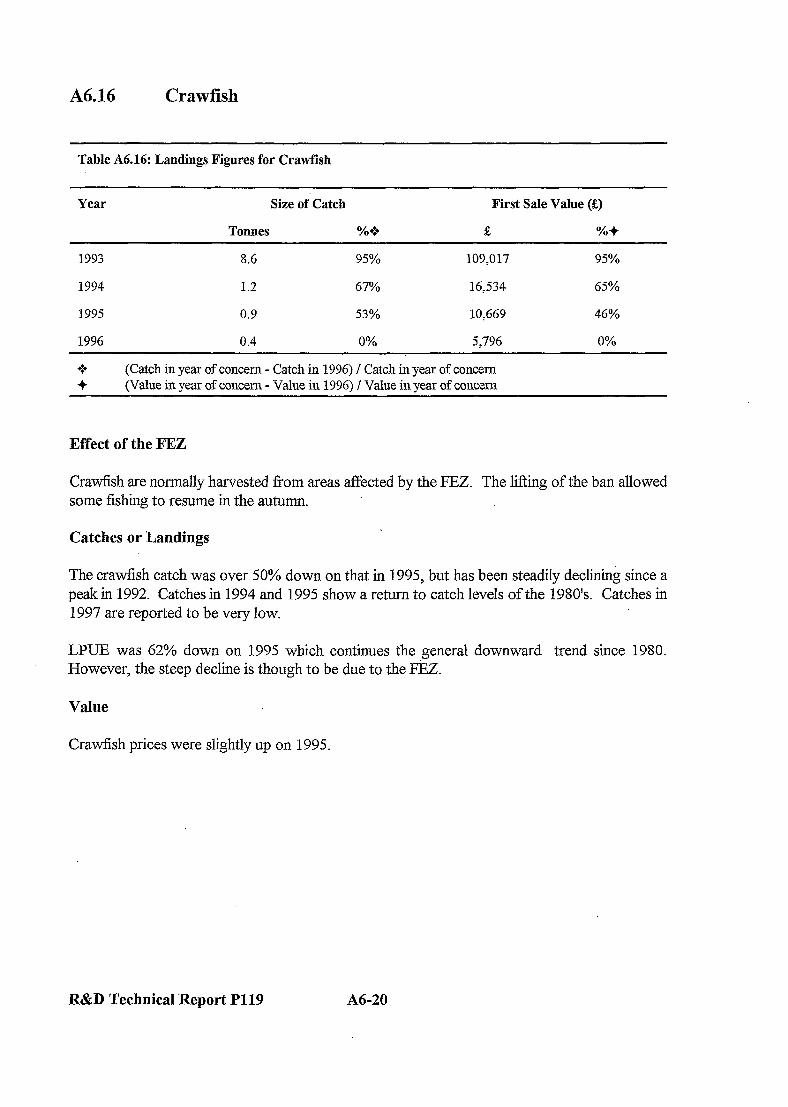
A6.3.6 Crawfish
Table A6.16: Landings Figures for Crawfish
Year Size of Catch First Sale Value ($)
Tonnes %+3 e %+
1993 8.6 95% 109,017 95%
1994 1.2 67% 16:534 65%
1995 0.9 53% lo;669 46%
1996 0.4 0% 5,796 0%
l a (Catch in year of concern - Catch in 1996) / Catch in year of concern + Wake in vear of concern - Value in 1996) / Value in vear of concern
Effect of the FEZ
Crawfish are normally harvested fi-om areas affected by the FEZ. The lifting of the ban allowed some fishing to resume in the autumn.
Catches or Landings
The crawfish catch was over 50% down on that in 1995, but has been steadily declining since a peak in 1992. Catches in 1994 and 1995 show a return to catch levels of the 1980’s. Catches in 1997 are reported to be very low.
LPUE was 62% down on 1995 which continues the general downward trend since 1980. However, the steep decline is though to be due to the FEZ.
Value
Crawfish prices were slightly up on 1995.
R&D Technical Report P119 A6-20
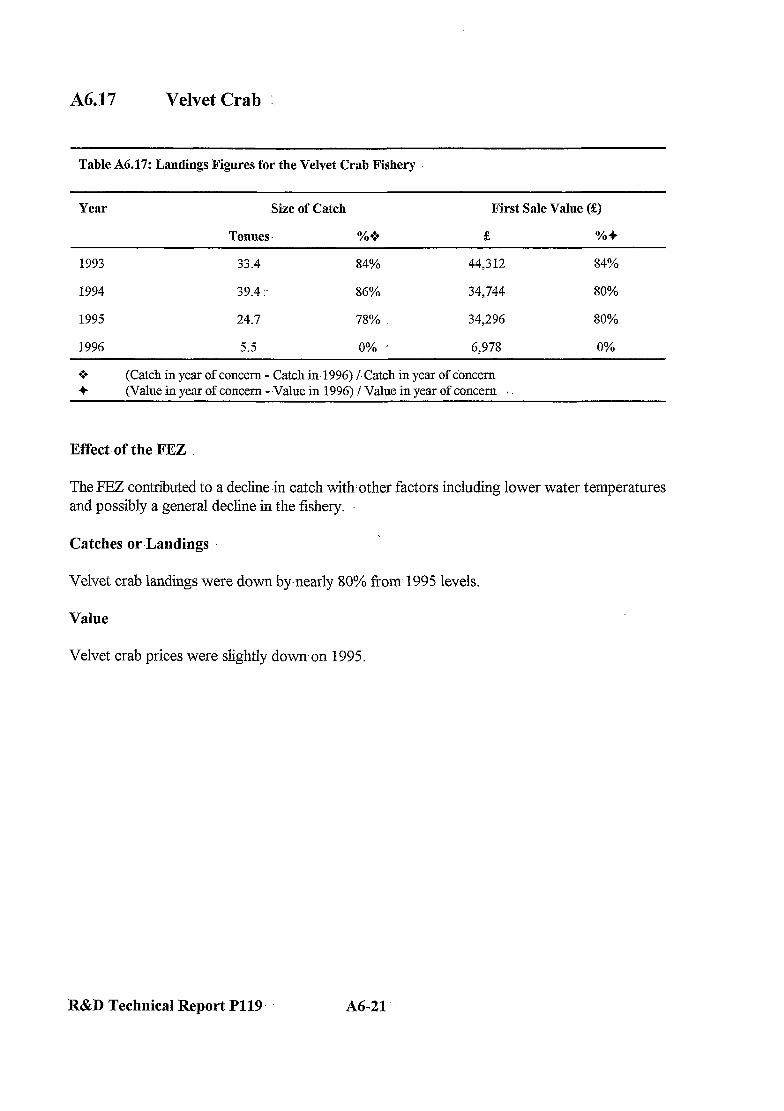
AU7 Velvet Crab :
Table A6.17: Landings Figures for the Velvet Crab Fishery
Year Size of Catch First Sale Value (2)
Tonnes. %+ d5 %-+
1993 33.4 84% 44;312 84%
1994 39.4 :- 86% 34,744 80%
1995 24.7 78% 34;296 80%
1996 5.5 0% 6:978 0%
: ;:
(Catch in year of concern - Catch in,1996) /-Catch in year of concern (Value in year of concern --Value in 1996) I Value in year of concern
Effect of the FEZ
The FEZ contributed to a decline-in catch with-other factors including lower water temperatures and possibly a general decline in the fishery.
Catches or-Landings
Velvet crab landings were down by.nearly 80% from 1995 levels.
Value
Velvet crab prices were slightly down on 1995.
R&D Technical-Report P119. A6-21
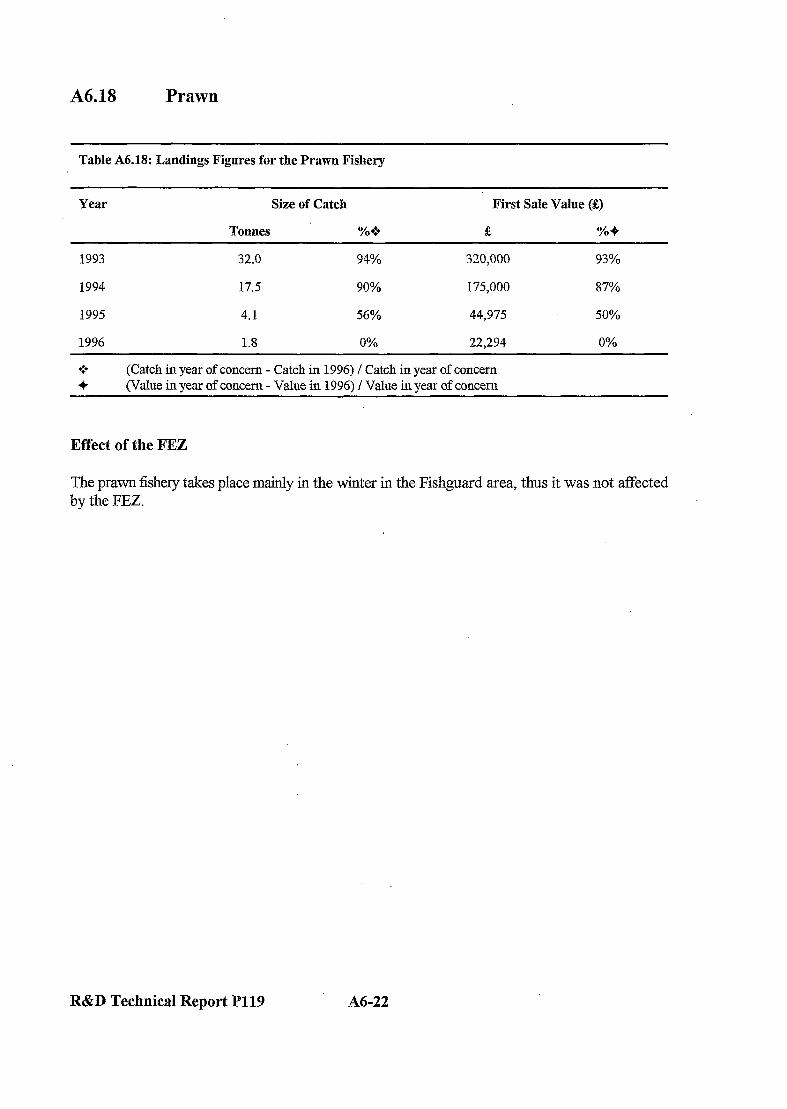
A618 Prawn
Table A6.18: Landings Figures for the Prawn Fishery
Year Size of Catch First Sale Value (g)
Tonnes %+ e %+
1993 32.0 94% 320,000 93%
1994 17.5 90% 175,000 87%
1995 4.1 56% 44,975 50%
1996 1.8 0% 22,294 0%
.:, (Catch in year of concern - Catch in 1996) I Catch in year of concern + (Value in year of concern - Value in 1996) / Value iu year. of concern
Effect of the FEZ
The prawn fishery takes place mainly in the winter in the Fishguard area, thus it was not affected by the FEZ.
R&D Technical Report P119 A6-22
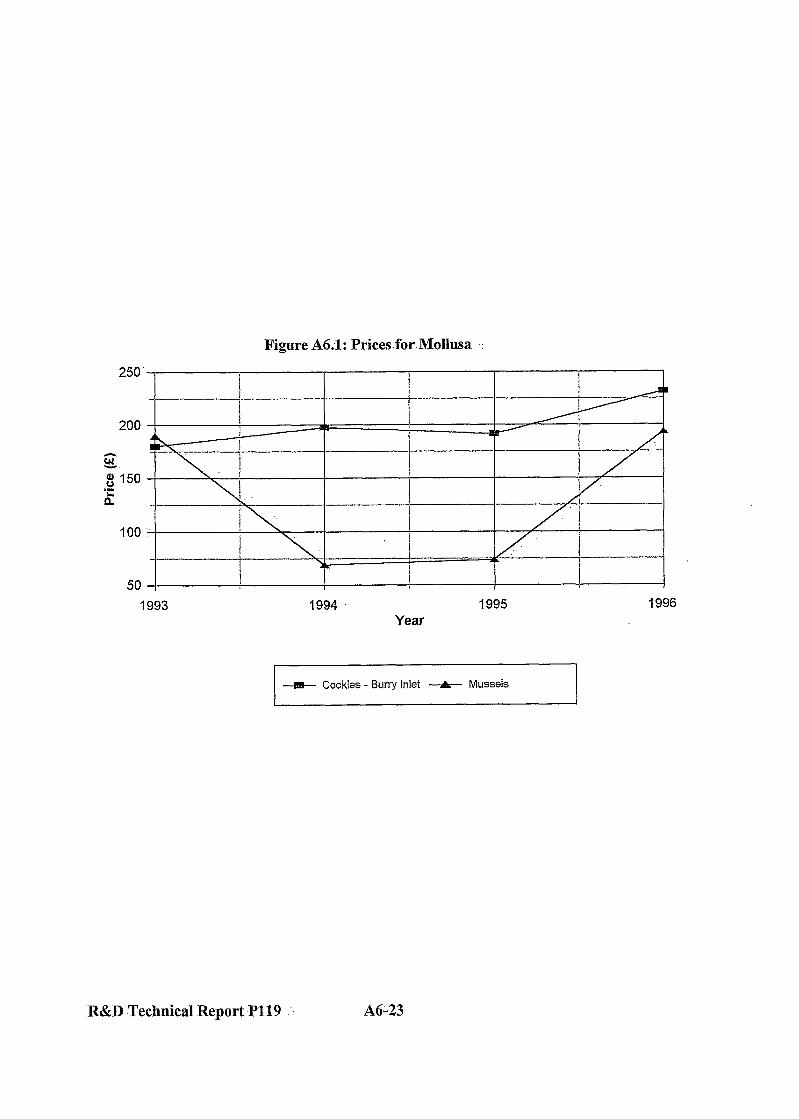
Figure A6.1: Pricesfor.Mollusa .:
Year
A Cockles - Bun-y Inlet --&- Mussels
R&D.Technical Report ,P119 A6L23
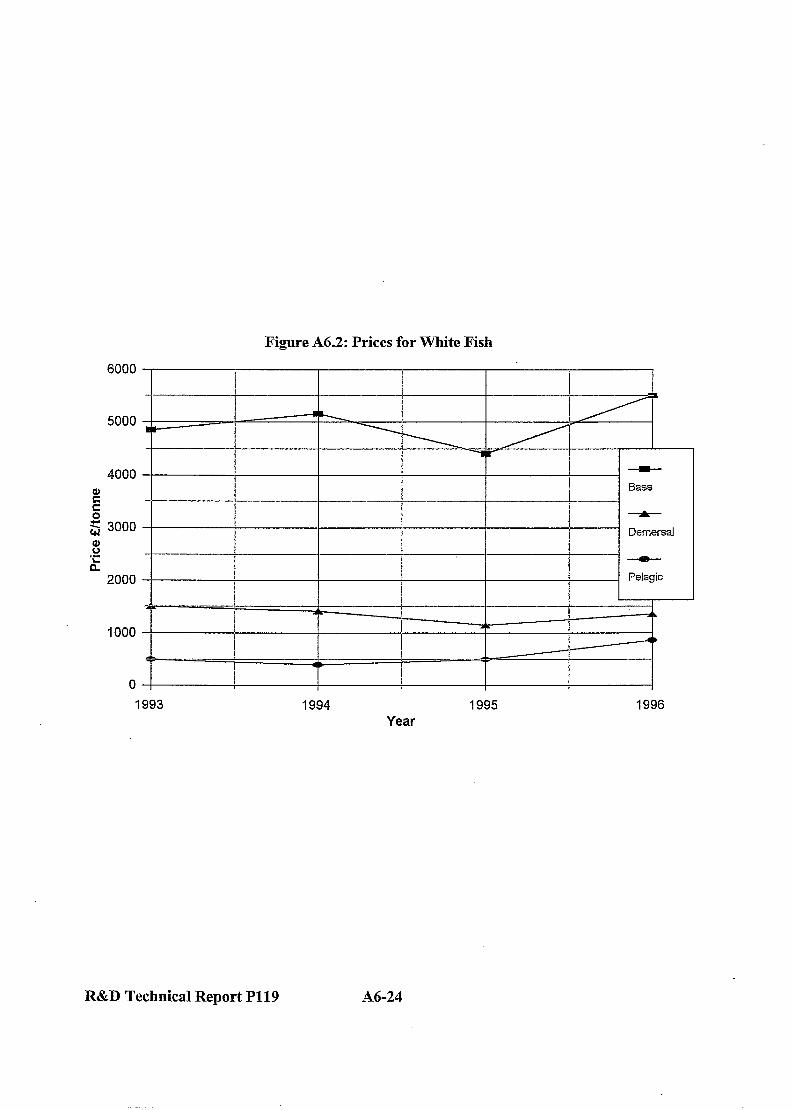
Figure A6.2: Prices for White Fish
6000
5000
4000 1 ! 1 E
! Bass !
E I I
! 5 3000 I I i I Demersal z 1 i ‘;:
- n
i
2000 1 f
j I
Pelagic
] I 7 I I
I t I A I
1000 D
0 1993
1
1994 1995 Year
1996
R&D Technical Report P119 A6-24
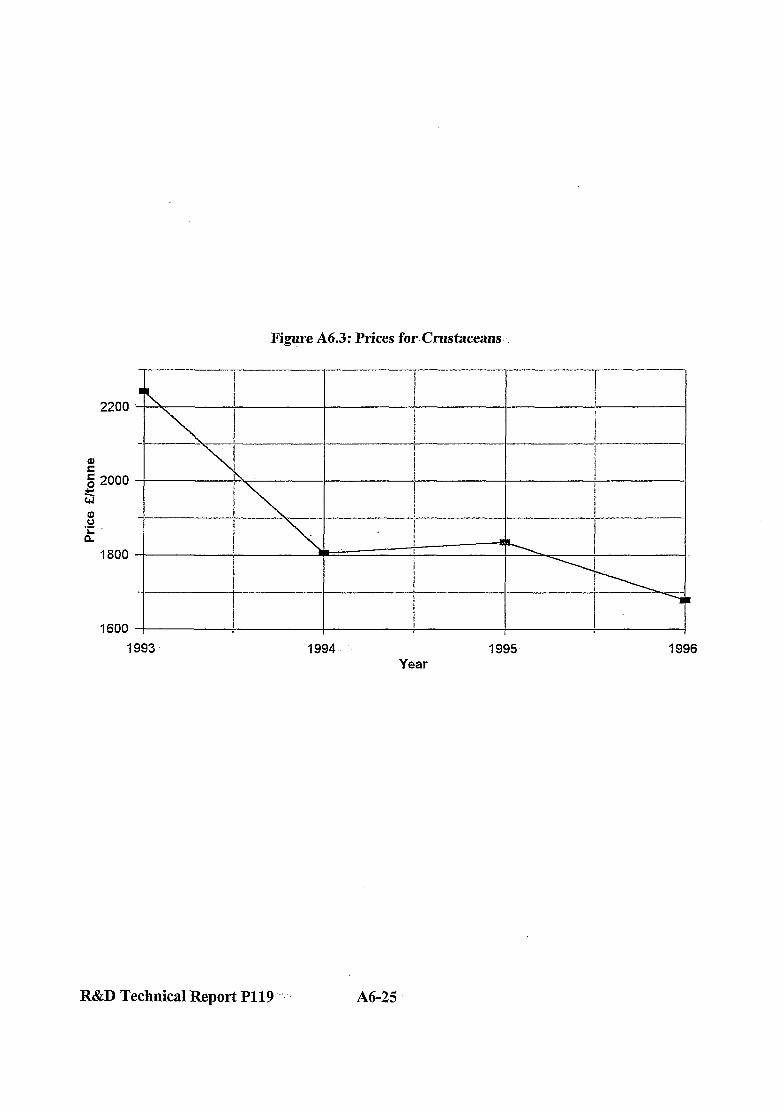
ii g-2000 c 41
8 ‘= P
1800
1600
Figure A6.3: Prices for. Crustaceans.
1993 1994 Year
1995 1996
R&D Technical Report P119 : : A6-25

R&D Technical Report A6-26
ANNEX 7:.DATA IN SUPPORT OF RECREATIONAL FISHERIES
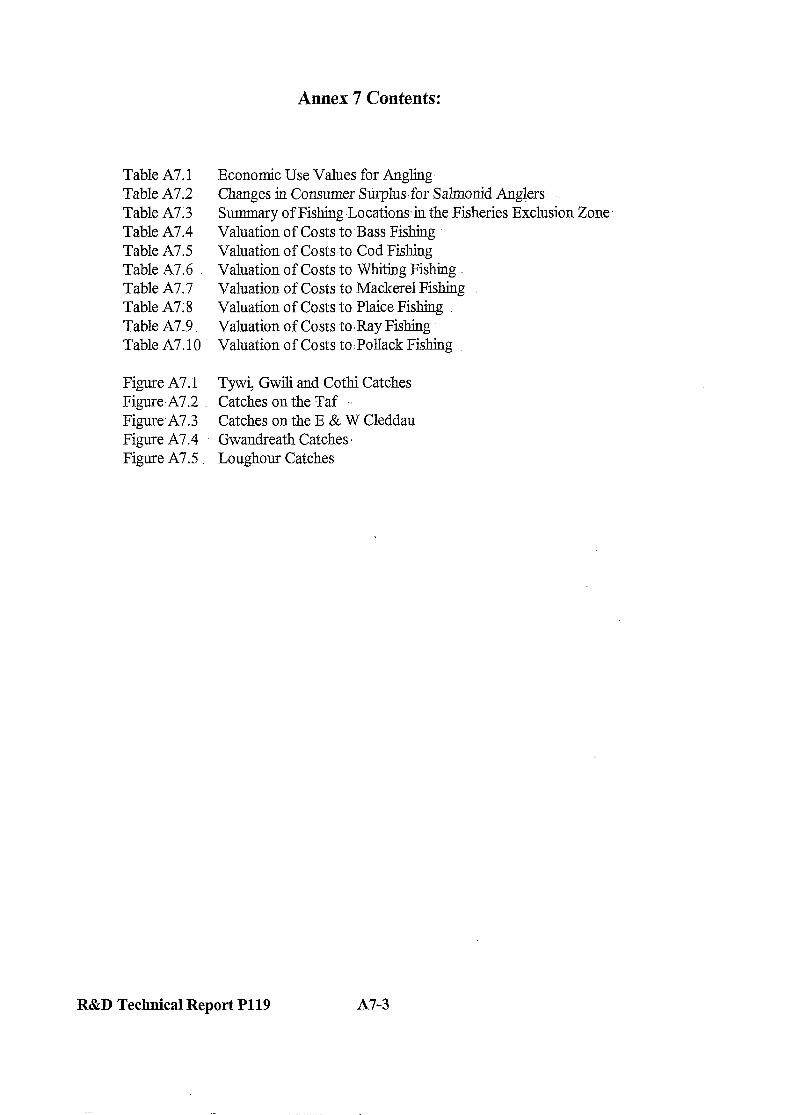
Annex 7 Contents:
Table A7.1 Table A7.2 Table A73 Table A7.4 Table A7.5 Table A7.6 Table A7.7 Table A7.8 Table A7.9. Table A7.10
Economic Use Values for Angling Changes in Consumer Sttrplusfor Sahnonid Anglers Summary of Fish&Locations-in the Fisheries Exclusion Zone Valuation of Costs to Bass Fishing Valuation of Costs to Cod Fishing Valuation of Costs to Whiting Fishing Valuation of Costs to Mackerel Fishing Valuation of Costs to Plaice Fishing Valuation of Costs to.Ray Fishing Valuation of Costs to:Pollack Fishiug
Figure A7.1 Tywi, Gwili and Cothi Catches Figure.A7.2 Catches on the Taf .’ Figure-A73 Catches on the E & W Cleddau Figure A7.4 Gwandreath Catches’ Figure A7.5 Loughour Catches
R&D Technical Report Pll9 A7-3

R&D Technical Report P119 A7-4
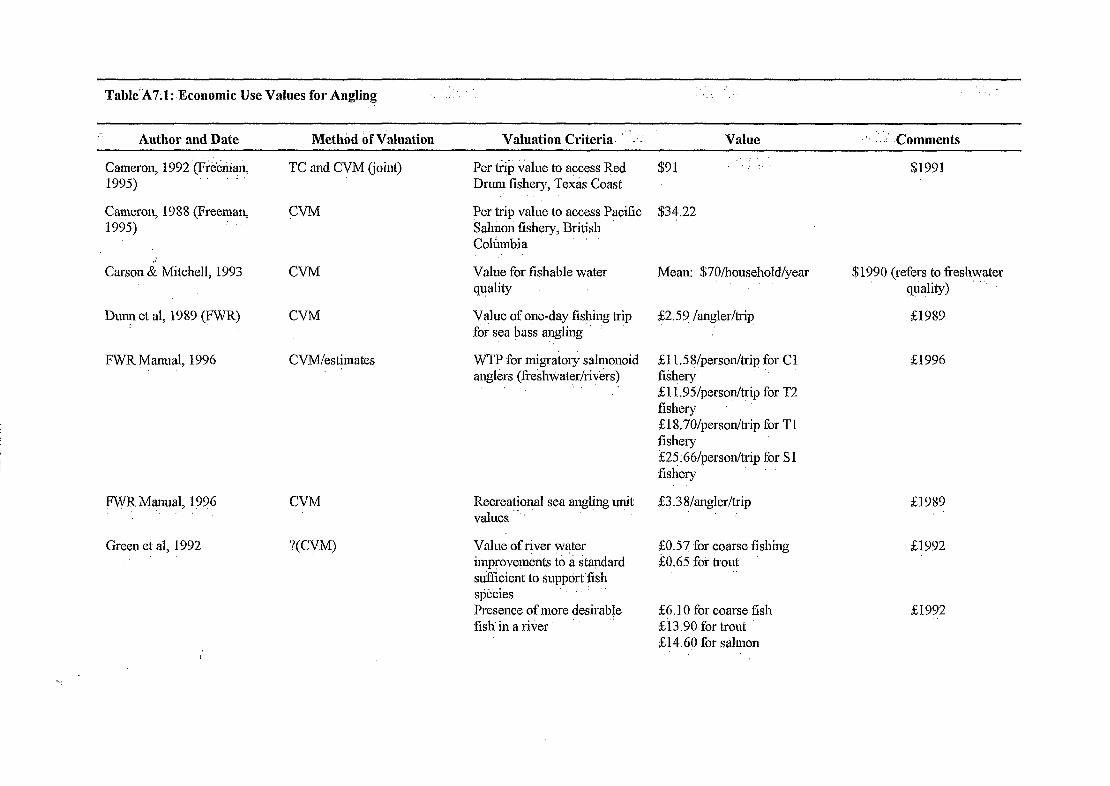
Table”A7;l: .Economic Use Values for Angling ‘. : : : :
Author and Date Methhd iif Valuation Valuation Criteria. ‘..‘.J: Value .: Commer!ts
Cameron, 1992 ‘(Fketiian, 1995)
,, TC and CVM (‘joint) Per tiip value to Access Red Drum fishery, Texas Coast
Cameron, 1988 (Freeman, 1995)
Carson & Mitchell, 1993
CVM
CVM
Per trip value to access Pacific Salmon fishery, British Cohmbia
Value for fishable water quality :
Dunn et al, 1989 (FWR) CVM Value of one-day fis@ng trip for sea bass angling
FWR Manual, 1996 CVMleslimates ,’
WTP for migratory salmonoid anglers (fre&tiater/rivers)
FJVR Iv&mual, l?‘)G
Green et al, 1992
CVM
?( CVM)
Recreational sea angljng u+t values ”
Value ofrjver w$er improvements to a standard suficient to support’fish sptcies
:
Presence of more desirable fish hi a riiter
$91 :.:. $1991
$34.22
Mean: $70/household/year ,’
&2.S 9 /angler/trip
t6 1990 (refers to ‘e&water gu?lily)
&19&9
&I 1.58/personk-ip for Cl fiisliery 6t;l.1.95/person/trip for ‘T2 fishery &18,70/person/trip for Tl fishery &25 G/person/trip for S 1 fishery
&1996
$3.3 8langlerhip
&OS? for coarse fishing LO.65 for trout ,.
26.10 tar coarse fish 513.90 for trout ’ U4.60 for salmon
ill.989
21992
21992
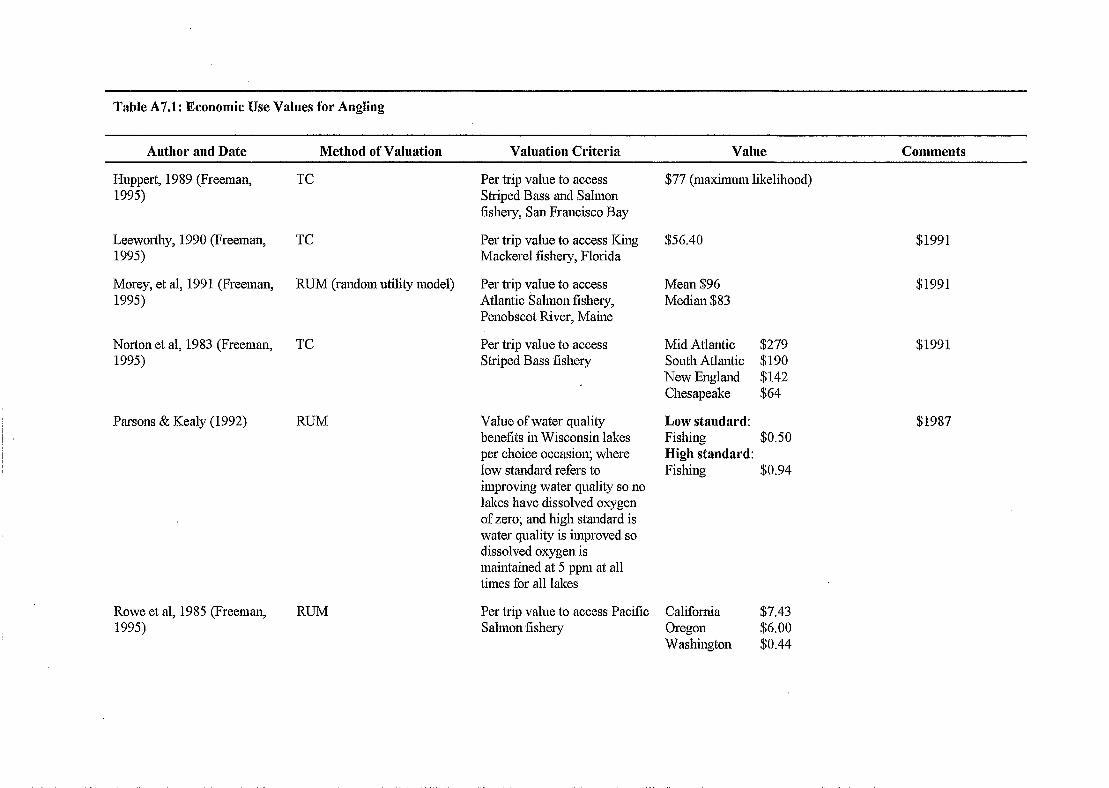
Table A7.1: Economic Use Vahles for Angling
Author and Dute Method of Valuation Valuation Criteria V&e Comments
I-Iuppert, 1989 (Freeman, 1995)
TC
Leeworthy, 1990 (Freeman, 1995)
Morey, et al, 1991. (Freeman, 1.995)
TC
RUM (random utility model)
Norton et al, 1983 (Freeman, 1995)
TC
Parsons & Kealy (1992) RUM
Rowe et al, 1985 (Freeman, 1995)
RUM
Per trip value to access Striped Bass and Salmon fishely, San Francisco Bay
Per trip value to access King Mackerel fishery, Florida
Per trip value to access Atlantic Sahnon fishery, Penobscot River, Maine
Per trip value to access Striped Bass fishery
Value of water qualily benefits in Wisconsin lakes per choice occasion; where low standard refers to improving water quality so no lakes have dissolved oxygen of zero; and high standard is water quality is improved so dissolved oxygen is maintained at 5 ppm at all times for all lakes
Per trip value to access Pacific Salmon fisheq7
$77 (maximum likelihood)
$56.40 $1991
Mean $96 Median $83
$1991
Mid Atlantic $279 South Atlantic $190 New England $142 Chesapealte $64
Low standard: Fishing $0.50 High standard: Fishing $0.94
$1991
$1.987
California Oregon Washington
$7.43 $6.00 $0.44

Table A7.j: Econouiic Use Values for Angling
Aithor and Date Method,&f Wuation Valuation Criteria Value ‘.:. Comments : .‘..‘.:
.’ Thibodeau, 1979
. : ” “ ? .‘TGal value of activity in T.&p fishing $13.35 .:: ‘i;.
.’ wetlands, per acre per year
Walsh et al, 1978 (Loomis $ CVM The viability of fish Walsh, 1986)
Recreational use $56 per populatiotis for various use household and no+use categories, ivith existence value based on thti preselice of clean water
$1978
Wegge et al, 1988 (Freeman, NRUM (Nested random 1995) ikility rnbdel)
Per trip value to access Pacific $48.50 $1991 Salmon fishery, Alaska
Note: Freeman, 1995 :ilso leas multi-species fishery trip j&es by type of trip (shore, hire bo&‘&.) For pacific, Atlantic and gulf&&t. Also has values for a person annGal access to a single species fishery and to a multi-syecies fishery and values for increases’ in catcli rates per species.
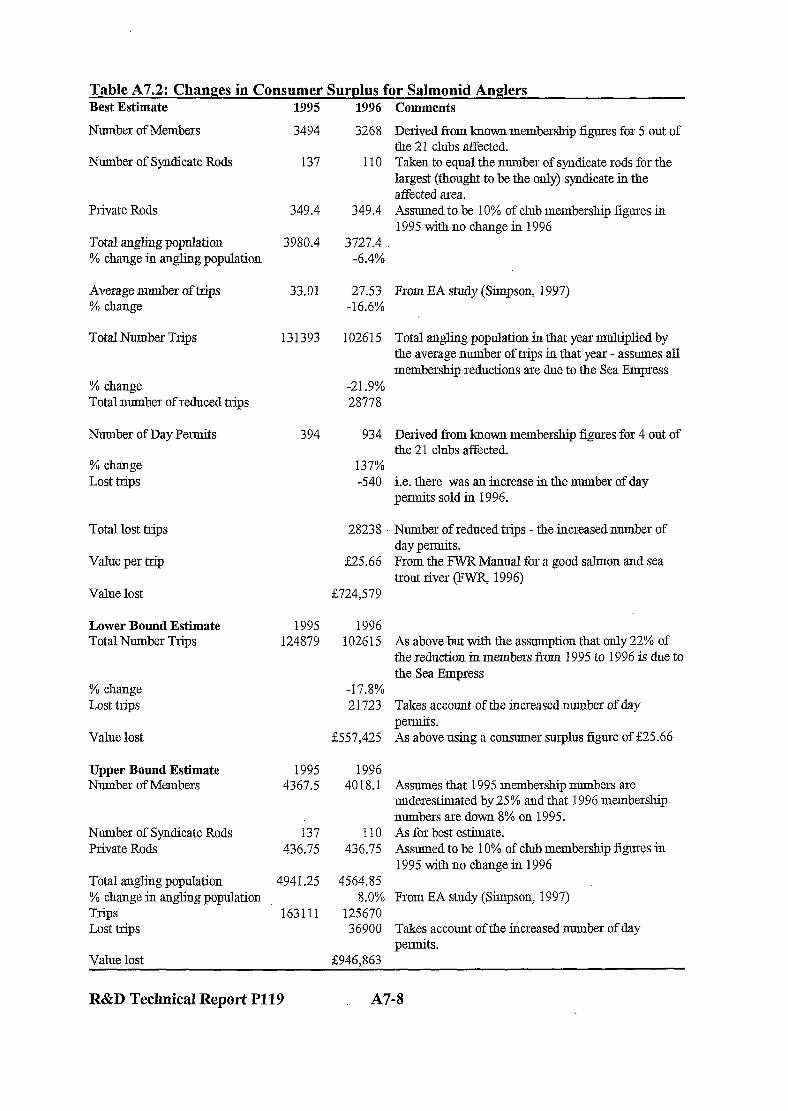
Table A72 Changes in Consumer Surplus for Salmonid Anglers Best Estimate 1995 1996 Comments
Number of Members 3494
Number of Syndicate Rods 137
Private Rods
Total angling population % change in angling population
Average number of hips % change
Total Number Trips
349.4
3980.4
3268 Derived from known membership figures for 5 out of the 2 1 clubs afkted.
110 Taken to equal the number of syndicate rods for de largest (thought to be the only) syndicate in the affected area.
349.4 Assumed to be 10% of club membership figures in 1995 with no change in 1996
3727.4 -6.4%
33.01 27.53 From EA study (Simpson, 1997) -16.6%
131393
% change Total number of reduced trips
Number of Day Permits
% change Lost trips
102615 Total angling population in that year multiplied by the average number of trips in that year - assumes all membership reductions are due to the Sea Empress
-21.9% 28778
394 934 Derived from lurown member&p figures for 4 out of the 21 clubs affected.
137% -540 i.e. there was an increase in de number of day
permits sold iu 1996.
Total lost hips
Value per trip
Value lost
28238 L Number of reduced trips - the increased number of day permits.
$25.66 From the FWR Mauual for a good salmon and sea trout river (FWR, 1996)
$724,579
Lower Bound Estimate 1995 Total Number Trips 124879
% change Lost trips
Value lost
1996 1026 15 As above but with de assumption that only 22% of
the reduction in members from 1995 to 1996 is due to the Sea Empress
-17.8% 2 1723 Takes account of the increased number of day
permits. &557,425 As above using a consumer surplus figure of g25.66
Upper Bound Estimate 1995 Number of Members 4367.5
Nutnber of Syndicate Rods Private Rods
Total angling population % change in angiing population Trips Lost hips
i37 436.75
494 1.25
163111
1996 40 18.1 Assumes that 1995 membership numbers are
underestimated by 25% aud that 1996 membership numbers are down 8% on 1995.
1 IO As for best estimate. 436..75 Assumed to be 10% of club membership figures in
1995 withno changein 1996 4564.85
8.0% From EA study (Simpson, 1997) 125670 36900 Takes accouut of the increasednumber of day
permits. Value lost g946.863
R&D Technical Report P119 A7-8
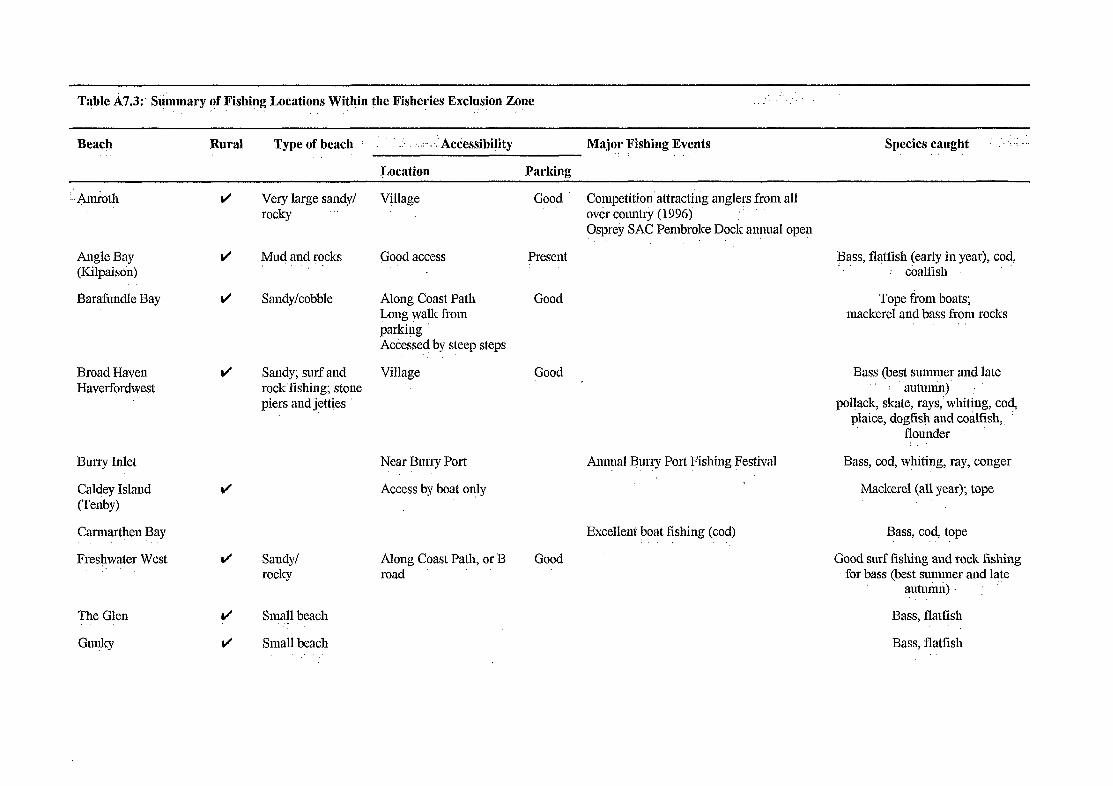
Table A7.3:. Stimmary of Fishipg Locations Witl!in the Fisheries Exclusion Zone ..’ ;. ‘,.,. ,_:-.
Beach Rural Type of beach : .:, ,.~.:- Accessibility ‘Major Fishing Events Species caught .,:.! 1. :
Location Parking
:_. &nroth ti Very large sandy/ Village rocky
Angle Bay (Kilp’aison)
ti Mud and rocks Good access
Barafundle Bay
Broad Haven Haverfordwest
d Sandy/cobble Along Coast Path Long walk from parki!ig Acdessed by steep steps
v+ Sandy; surf and Village rock’fishiiig; stone piers and jetties
Burry Inlet
Caldey Island (Tenby)
Carmarthen Bay
Fresilwater West J Sandy/ rocky
The Glen
Guqlcy
r/ Sni+ beach
u’ Slnall beach .“.
Good Competition’attracling anglers from all ovkr country (1996) : Osprey SAC Pembrolce Dock annual open
Presenl
Good
Bass, fl&fish (early in year), cod, : &alfisli
Tope from boats; mackerel and bass from rocks
Good Bass (best smmer and late : au&n)
pollack, skate, rays, whiting, cod, plaice, doglish a!id co&ish,,
flounder :
Near Burly Port Annual Burry Port Fishing Festival Bass, cod, whiting, ray, conger
Access by boat only Mackerel (all year); tope
Along Coast Path, or B road
Excellent boat fishing (cod) Bass, cod, tope
Good Good surf fisl+g and rock fishil~g :for bass (best sununer and late
autmiui) ;
Bass, flat&h
Bass, flatiish
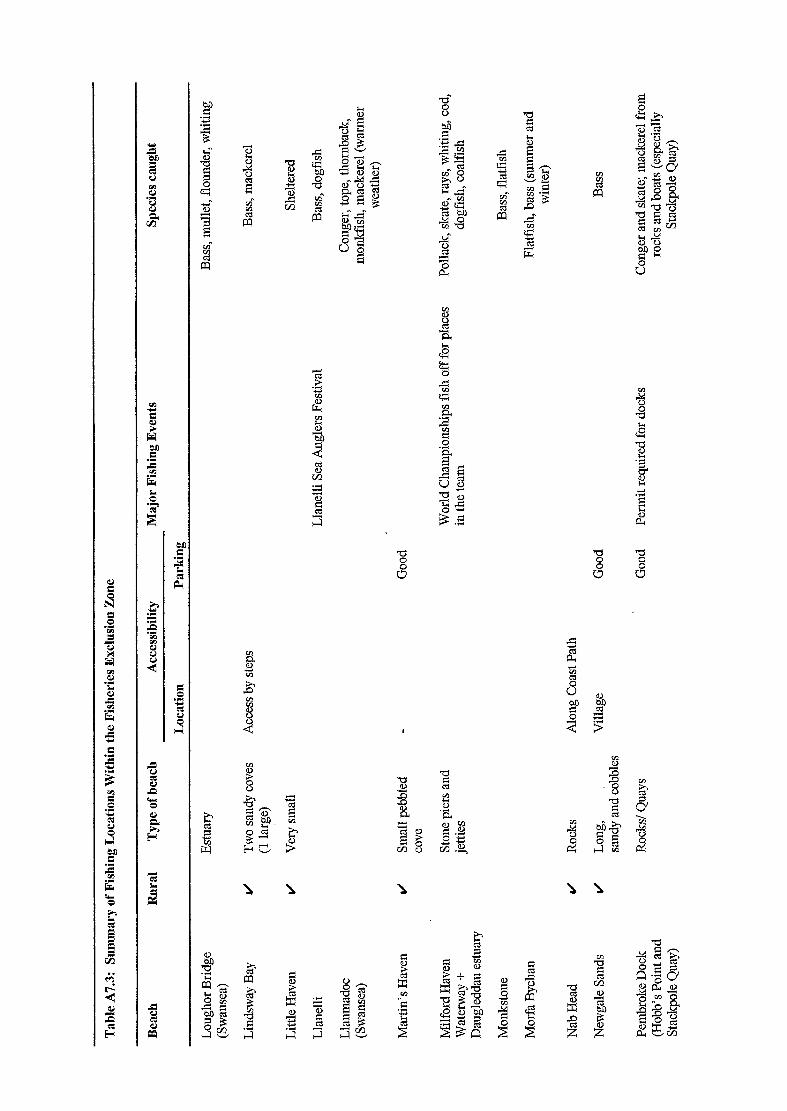
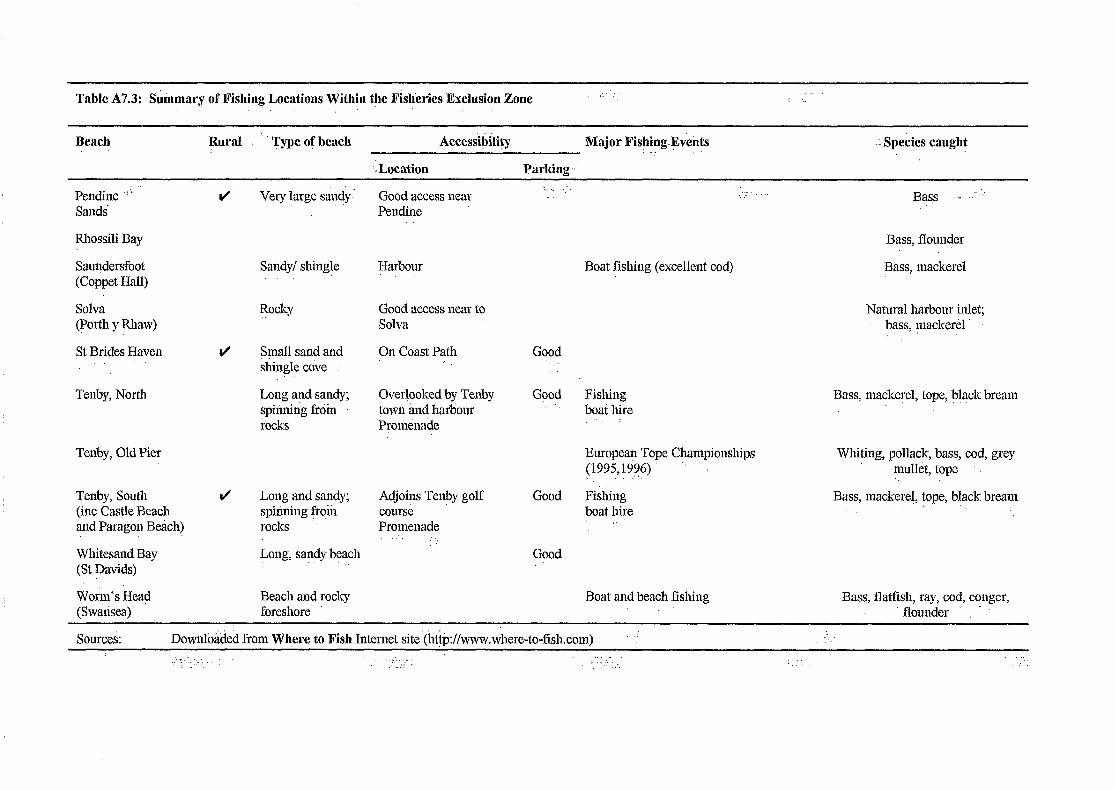
TiIbk A7.3: Summary of Fishing Locations Within the Fisheries Exclusion Zone ” : ‘._ .‘.
Beach Rural ‘. Type of beach Acces&~~lity Major Fishing.Evc& .- Species caught :’
,-Location Parking ,,.
Pendine :’ Sands
Good access near Pendine
Rhossili Bay
Sauqdersfoot (Coppet Hall)
Solva (~0rl.h y Rhaw)
St Brides Haven
Tenby, North
Tenby, Old Pier
Tenby, South (inc Castle ‘Beach and Paragon Beach)
Whitesand Bay (St pavids)
Worm’s He@ (Swansea)
Sandy/ shingle
Rocky
J $lnall sand alld shingle c&e
Long and sandy; spiiliitiiig froin rocks
Long and sandy; spinning froiil rocks
Long, sandy beach
Beach and rocky foreshore
I-Iarbour
Good access near to Solva
On Coast Path I
Overlooked by Tenby town and harbour Proln&ade
Adjoins Tenpy golf course Promenade
“. .‘.
Good
Gpod
Good
Good
Boat lishing (excellent cod)
Fishing boat hire : :
European Tope Championships pgyy
Fishing boat hire
Bass ..“‘,
Bass, flounder
Bass, mackerel
Natural harbour inlet; bass, mackerel
Bass, mackerel, tope, ~~~clc bream
Whiting, po!lack, bass, cod, grey mullet, tope ‘.
Bass, mackerel, tope, black bream
Boat and beach .fishing Bass, flatfish, ray, cod, conger, flounder
Sources: Downlb$ded from Where to Fish Internet site (ht$://www.where-to-fish.com) ’
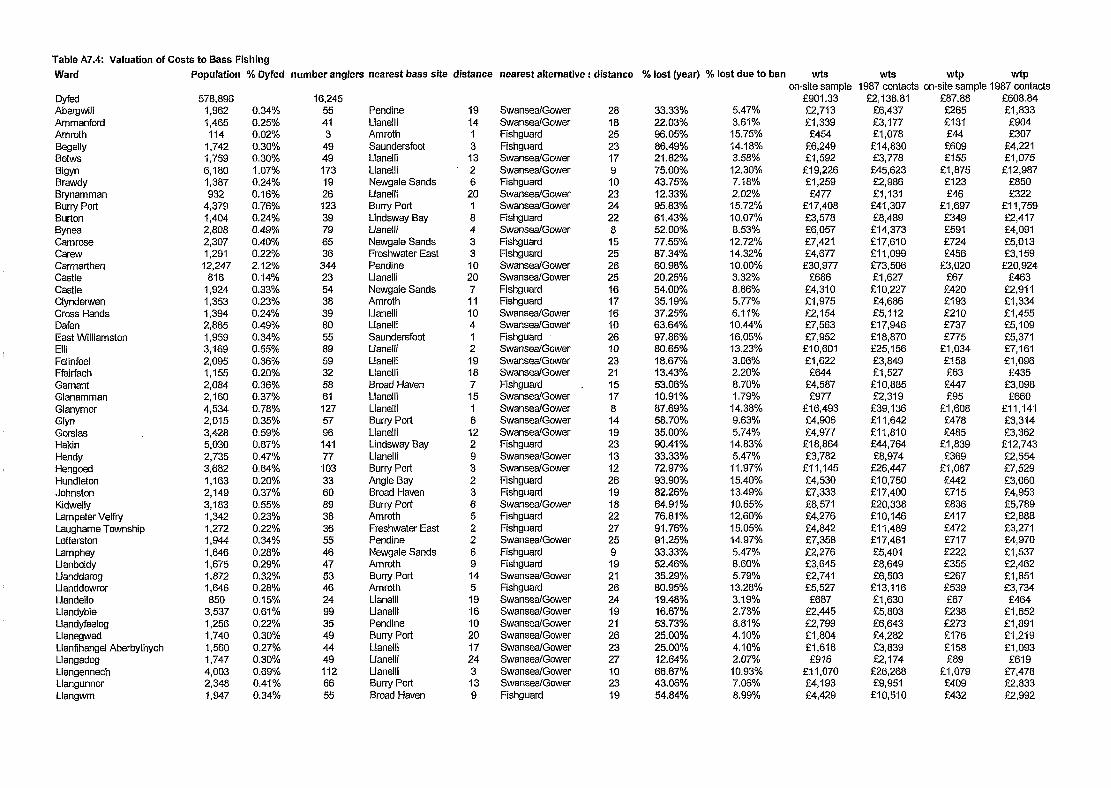
Table A7.4: Valuation of Costs to Bass Fishing
Ward Population % Dyfed
Dyfed 578,896 Abergwili 1,962 Ammanford 1,465 Amroth 114 Begelly 1,742 Betws 1,759 Bigyn 6,180 Brawdy I ,387 Brynamman 932 Buny Port 4,379 Burton 1,404 Bynea 2,808 Camrose 2,307 Carew 1,291 Carmarthen 12,247 Castle 816 Castle 1,924 Clynderwen 1,353 Cross Hands 1,394 Dafen 2,865 East Williamston 1,959 Elk 3,169 Felinfoel 2,095 Ffairfach 1,155 Gamant 2,084 Glanamman 2,160 Glanymor 4,534 Glyn 2,015 Gorslas 3,428 Hakin 5,030 Hendy 2,735 Hengoed 3,682 Hundleton 1,163 Johnston 2,149 Kidwelly 3,183 Lampeter Velfry 1,342 Laughame Township 1,272 Letterston 1,944 Lamphey 1,646 Llanboidy 1,675 Llanddarog 1,872 Llanddowror 1,646 Llandello 850 Llandybie 3,537 Llandyfaelog 1,256 Llanegwad 1,740 Llanfihangel Aberbythych 1,560 Llangadog 1,747 Llangennech 4,003 Llangunnor 2,348 Llangwm 1,947
0.34% 0.25% 0.02% 0.30% 0.30% 1.07% 0.24% 0.16% 0.76% 0.24% 0.49% 0.40% 0.22% 2.12% 0.14% 0.33% 0.23% 0.24% 0.49% 0.34% 0.55% 0.36% 0.20% 0.36% 0.37% 0.78% 0.35% 0.59% 0.87% 0.47% 0.64% 0.20% 0.37% 0.55% 0.23% 0.22% 0.34% 0.28% 0.29% 0.32% 0.28% 0.15% 0.61% 0.22% 0.30% 0.27% 0.30% 0.69% 0.41% 0.34%
16,245 55 41 3
49 49 173 19 26 123 39 79 65 36
344 23 54 38 39 80 55 89 59 32 58 61 127 57 96 141 77 103 33 60 89 38 36 55 46 47 53 46 24 99 35 49 44 49 112 66 55
Pendine 19 SwansealGower Llanelli 14 SwansealGower Amroth 1 Fishguard Saundersfoot 3 Fishguard Llanelli 13 SwansealGower Llanelli 2 SwansealGower Newgale Sands 6 Fishguard Llanelli 20 SwanseafGower Buny Port 1 SwansealGower Lindsway Bay 8 Fishguard Llanelli 4 Swansea/Gower Newgale Sands 3 Fishguard Freshwater East 3 Fishguard Pendine IO SwansealGower Llanelli 20 SwansealGower Newgale Sands 7 Fishguard Amroth 11 Fishguard Llanelli IO Swansea/Gower Llanelli 4 SwansealGower Saundersfoot 1 Fishguard Llanelli 2 Swansea/Gower Llanelli 19 SwanseaIGower Llanelli 18 SwansealGower Broad Haven 7 Fishguard Llanelli 15 SwansealGower Llanelli 1 Swansea/Gower Bun-y Port 6 SwansealGower Llanelli 12 SwansealGower Lindsway Bay 2 Fishguard Llanelli 9 SwansealGower Burry Port 3 SwansealGower Angle Bay 2 Fishguard Broad Haven 3 Fishguard Buny Port 6 Swansea/Gower Amroth 5 Fishguard Freshwater East 2 Fishguard Pendine 2 SwansealGower Newgale Sands 6 Fishguard Amroth 9 Fishguard Burry Port 14 Swansea/Gower Amroth 5 Fishguard Llanelli 19 Swansea/Gower Llanelli 16 SwansealGower Pendine 10 Swansea/Gower Buny Port 20 SwansealGower Llanelli 17 SwansealGower Llanelli 24 SwansealGower Llanelli 3 SwansealGower Buny Port 13 SwanseaIGower Broad Haven 9 Fishguard
28 33.33% 5.47% 18 22.03% 3.61% 25 96.05% 15.75% 23 86.49% 14.18% 17 21.82% 3.58% 9 75.00% 12.30% 10 43.75% 7.18% 23 12.33% 2.02% 24 95.83% 15.72% 22 61.43% 10.07% 8 52.00% 8.53% 15 77.55% 12.72% 25 87.34% 14.32% 26 60.98% 10.00% 25 20.25% 3.32% 16 54.00% 8.86% 17 35.19% 5.77% 16 37.25% 6.11% 10 63.64% 10.44% 26 97.86% 16.05% IO 80.65% 13.23% 23 18.67% 3.06% 21 13.43% 2.20% 15 53.06% 8.70% 17 10.91% 1.79% a 87.69% 14.38% 14 58.70% 9.63% 19 35.00% 5.74% 23 90.41% 14.83% 13 33.33% 5.47% 12 72.97% 11.97% 26 93.90% 15.40% 19 82.26% 13.49% 18 64.91% 10.65% 22 76.81% 12.60% 27 91.76% 15.05% 25 91.25% 14.97% 9 33.33% 5.47% 19 52.46% 8.60% 21 35.29% 5.79% 26 80.95% 13.28% 24 19.48% 3.19% 19 16.67% 2.73% 21 53.73% 8.8’1% 26 25.00% 4.10% 23 25.00% 4.10% 27 12.64% 2.07% IO 66.67% 10.93% 23 43.06% 7.06% 19 54.84% 8.99%
on-site sample 1987 contacts on-site sample 1987 contacts f901.33' !Z2,713 f1,339 f454
f6,249 f1,592 f19,226 f 1,259 f477
f17,408 f33,578 f6,057 f7,421 f4,677 f30,977
f686 f4,310 f1,975 f2,154 f7,563 f7,952 f10,601 f1,622 f644
f4,587 f977
f16,493 f4,906 f4,977 f18,864 f3,782
f11,145 f4,530 f7,333 f8,571 f4,276 f4,842 f7,358 f2,276 f3,645 f2,741 f5,527 f687
f2,445 f2,799 fl,a04 f1,618 f916
f11,070 f4,193 f4,429
f2,i38.81 f6,437 f3,177 f1,078 f14,830 f3,778 f45,623 f2,986 El,131 f41,307 fa,489 f14,373 fl7,610 f11,099 f73,506 El-627
f10,227 f4,686 f5,112 f17,946 f18,870 f25,156 f3,849 f1,527 f10,885 f2,319 f39,136 fl1.642 fli,alo f44,764 fa,974 f26,447 f10,750 f17,400 DO,338 f10,146 f11,489 f17,461 f5,401 f8,649 f6,503 f13,116 f1,630 f5,803 f6,643 f4,282 f3,839 f2,174 f26,268 f9,951 f10,510
f87.88 a65 f131 f44 f609 fl55
fl,a75 f123 f46
El,697 f349 f591 f724 f456
f3,020 f67
f420 f193 f210 f737 f775
f1,034 El58 f63 f447 f95
f1,608 f478 f485
El,839 ,f369 f1,087 f442 f715 f836 f417 f472 f717 f222 f355 f267 f539 f67 f238 f273 El76 f158 f89
f1,079 f409 f432
f608.84 fi,a33 f904 f307
f4,221 fl,O75
f12,987
f322 fl1,759 f2,417 f4,091 f5,013 f3,159
f20,924 f463
f2,911 f 1,334 f1,455 f5,109 f5,371 f7,161 f1,096 f435
f3,098
f11,141 f3,314 f3,362
f12,743 f2,554 f7,529 f3,060 f4,953 f5,789 f2,888 f3,271 f4,970 El,537 f2,462 f1,851 f3,734 f464
f1,652 fi,a9i f1,219 f1,093 f619
f7,478 f2,833 f2,992

R&D Technical Report P119 A12-4

Table A7.5: Valuation of Costs to Cod Fishing
Ward Dyfed Abergwili Ammanford Amroth Begelly Betws Bigyn Brawdy Brynamman Buny Port Burton Bynea Camrose Carew Carmarthen Castle Castle
5’78,896 f,962 1,465 114
1,742 1,759 6,180 1,387 932
4,379 1,404 2,808 2,307 1,291
12,247 816
1,924 1,353 1,394 2,865 1,959 3,169 2,095 1,155 2,084 2,160 4,534 2,015 3,428 5,030 2,735 3,682 1,163 2,149 3,183 1,342 1,272 1,944 1,646 1,675 1,872 1,646 850
3,537 1,256 1,740 1,560 1,747 4,003 2,348 1,947 2,983
% Dyfed number anglers nearest site
0.34% 0.25% 0.02% 0.30% 0.30% 1.07% 0.24% 0.16% 0.76% 0.24% 0.49% 0.40% 0.22% 2.12% 0.14% 0.33% 0.23% 0.24% 0.49% 0.34% 0.55% 0.36% 0.20% 0.36% 0.37% 0.78% 0.35% 0.59% 0.87% 0.47% 0.64% 0.20% 0.37% 0.55% 0.23% 0.22% 0.34% 0.28% 0.29% 0.32% 0.28% 0.15% 0.61% 0.22% 0.30% 0.27% 0.30% 0.69% 0.41% 0.34% 0.52%
Clynderwen Cross Hands Dafen East Williamston Elli Felinfoel Ffairfach Gamant Glanamman Glanymor Glyn Gorslas Hakin Hendy Hengoed Hundleton Johnston Kidwelly Lampeter Velfry Laugharne Township Letterston Lamphey Llanboidy Llanddarog Llanddowror Llandeilo Llandybie Llandyfaelog Llanegwad Llanfihangel Aberbythych Llangadog Llangennech Llangunnor Llangwm Llangyndeyrn
10,568- 36 27 2
32 32 113 13 17 80 26 51 42 24
224 15 35 25 25 52 36 58 38 21 38 39 83 37 63 92 50 67 21 39 58 24 23 35 30 31 34 30 16 65 23 32 28 32 73 43 36 54
Pendine Llanelli Amroth Saundersfoot Llanelli Llanelli Newgale Sands Llanelli Burry Port Lindsway Bay Llanelli Newgale Sands Freshwater East Pendine Llanelli Newgale Sands Amroth Llanelli Llanelli Saundersfoot Llanelli Llanelli Llanelli Broad Haven Llanelll Llanelli Burry Port Llanelli Lindsway Bay Llanelli Burry Port Angle Bay Broad Haven Bun-y Port Amroth Freshwater East Pendine Newgale Sands Amroth Burry Port Amroth Llanelli Llanelli Pendine Buny Port Llanelli Llanelli Llanelll Burry Port Broad Haven Buny Port
distance nearest alternative site distance % lost (year)
19 14 1 3 13 2 6
20 1 8 4 3 3
10 20 7 11 10 4 1 2 19 18 7 15 1 6 12 2 9 3 2 3 6 5 2 2 6
194 5
19 16 10 20 1’7 24 3 13 9 9
SwansealGower 28 SwansealGower 18 Fishguard 25 Fishguard 23 SwansealGower 17 SwanseaIGower 9 Fishguard 10 Swansea/Gower 23 Swansea/Gower 24 Fishguard 22 SwansealGower 8 Fishguard 15 Fishguard 25 Swansea!Gower 26 Swansea/Gower 25 Fishguard 16 Fishguard 17 SwanseaIGower 16 SwanseafGower 10 Fishguard 26 SwansealGower 10 SwansealGower 23 SwansealGower 21 Fishguard 15 SwansealGower 17 Swansea/Gower 8 SwansealGower 14 SwansealGower 19 Fishguard 23 Swansea/Gower 13 Swansea/Gower 12 Fishguard 26 Fishguard 19 Swansea/Gower 18 Fishguard 22 Fishguard 27 SwanseaiGower 25 Fishguard 9 Fishguard 19 SwansealGower 21 Fishguard 26 Swansea/Gower 24 SwansealGower 19 SwansedGower 21 Swansea/Gower 26 Swansea/Gower 23 SwanseafGower 27 SwanseaIGower 10 SwanseaIGower 23 Fishguard 19 SwansealGower 18
% lost due to ban
33.33% 5.47% 22.03% 3.61% 96.05% 15.75% 86.49% 14.18% 21.82% 3.58% 75.00% 12.30% 43.75% 7.18% 12.33% 2.02% 95.83% 15.72% 61.43% 10.07% 52.00% 8.53% 77.55% 12.72% 87.34% 14.32% 60.98% 10.00% 20.25% 3.32% 54.00% 8.86% 35.19% 5.77% 37.25% 6.11% 63.64% 10.44% 97.86% 16.05% 80.65% 13.23% 18.67% 3.06% 13.43% 2.20% 53.06% 8.70% 10.91% 1.79% 87.69% 14.38% 58.70% 9.63% 35.00% 5.74% 90.41% 14.83% 33.33% 5.47% 72.97% 11.97% 93.90% 15.40% 82.26% 13.49% 64.91% 10.65% 76.81% 12.60% 91.76% 15.05% 91.25% 14.97% 33.33% 5.47% 52.46% 8.60% 35.29% 5.79% 80.95% 13.28% 19.48% 3.19% 16.67% 2.73% 53.73% 8.81% 25.00% 4.10% 25.00% 4.10% 12.64% 2.07% 66.67% 10.93% 43.06% 7.06% 54.84% 8.99% 52.54% 8.62%
wts f100.95
f198 f98 f33
2455 fl16
f 1,401 f92 f35
f1,268 f261 f441 f541 f341
f2,257 f50 f314 f144 f157 f551 f579 f772 f118 f47 f334 f71
f1,202 8357 f363
f1,374 a76 S812 f330 f534 f624 f312 f353 f536 fl66 f266 f200 MO3 f50 f178 f204 f131 f118 f67
f807 f308 f323 f474
WtS WP f239.55 f9.84
e469 f19 f232 f10 f79 f3
f1,080 f44 f275 fll
f3,324 f137 f218 f9 f82 f3
f3,OlO f124 f619 f25
f 1,047 f43 f 1,283 f53
f809 233 f5,356 f220 f119 f5 f745 f31 f341 El4 f372 f15
fl,308 f54 fl.375 f56 f 1,833 f75 f280 f12 El11 f5 f793 f33 El69 f7
f2,851 f117 f848 f35 f860 f35
f 3,261 f134 f654 f27
f1,927 f79 f783 f32
f1.268 f52 El,482 f61 f739 f30 f837 234
f1,272 f52 f393 f16 f630 f26 f474 fl9 f956 f39 f119 f5 f423 El7 f484 f20 f312 f13 f280 fll f158 f7
f1,914 f79 f725 f30 f766 f31
f1,124 f46
wtp f68.19
El34 f66 f22 f308 f78
f946 f62 f23
f176 f298 f365 f230
f1,525 f34
f212 f97
f108 2372 f391 2522 f80 f32
f226 f48
f812 f241 f245 f928 2186 f549 f223 f361 f422 f210 2238 2362 f112 f179 f135 f272 f34 f120 f138 f89 f80 f45 f545 f206 f218 f320
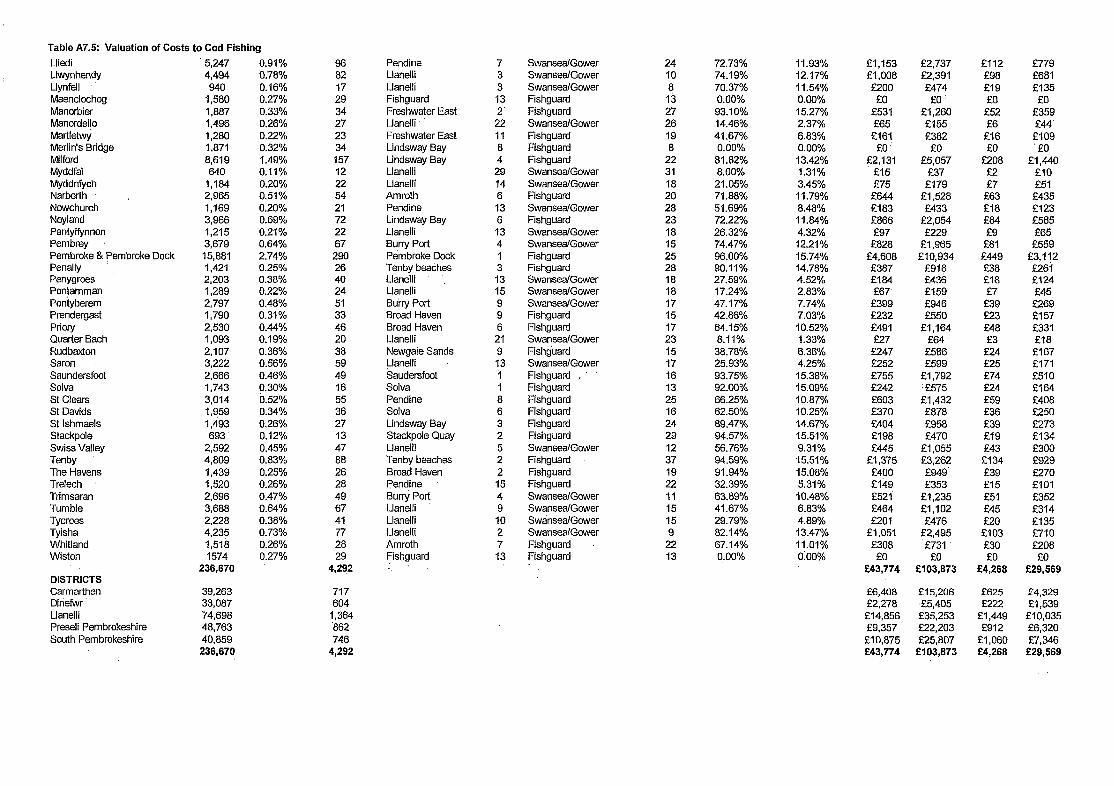
Table A7.5: Valuation of Costs to Cod Fishing
Lliedi Llwynhendy Llynfell Maenclochog Manor-bier
5,247 4,494 940
1,580 1,887 1,496 1,280 1,871 8,619 640
1,184 2,965 1,169 3,966 1,215 3,679
15,881 1,421 2,203 1,289 2,797 1,790 2,530 1,093 2,107 3,222 2,666 1,743 3,014 1,959 1,493 893
2,592 4,809 1,439 1,520 2,696 3,688 2,228 4,235 1,518 1574
236,670
0.91% 0.78% 0.16% 0.27% 0.33% 0.26% 0.22% 0.32% 1.49% 0.11% 0.20% 0.51% 0.20% 0.69% 0.21% 0.64% 2.74% 0.25% 0.38% 0.22% 0.48% 0.31% 0.44% 0.19% 0.36% 0.56% 0.46% 0.30% 8.52% 0.34% 0.26% 0.12% 0.45% 0.83% 0.25% 0.26% 0.47% 0.64% 0.38% 0.73% 0.26% 0.27%
Martletwy Merlin’s Bridge Milford - Myddfai Mycldnfych Narberth Newchurch ’ Neyland Pantyffynnon Pembrey Pembroke 8 Pembroke Dock Penally Penygrces Pontamman Pontyberem Prendergast priory Quarter Bach Rudbaxton Saran Saundersfoot Solva St Clears St Davids St lshmaels Stackpole Swiss Valley Tenby The Havens Trelech Trimsaran Tumble Tycroes Tyisha Whitland Wiston
DISTRICTS Carmarthen Diriefwr Llanelli Preseli Pembrokeshire South Pembrokeshire
96 82 17 29 34 27 23 34 157 12 22 54 21 72 22 67
290 26 40 24 51 33 46 20 38 59 49 16 55 36 27 13 47 88 26 28 49 67 41 77 28 29
4,292
Pendine 7 Llanelli 3 Llanelli 3 Fishguard 13 Freshwater East 2’ Llanelli 22 Freshwater East 11 Lindsway Bay 8 Lindsway Bay 4 Llanelli 29 Llanelli 14 Amroth 6 Pendine 13 Lindsway Bay 6 Llanelli 13 Burry Port 4 Pembroke Dock 1 Tenby beaches 3 Llanelli 13 Llanelli 15 Briny Port 9 Broad Haven 9 Broad Haven 6 Llanelli 21 Newgale Sands 9 Llanelli 13 Saudersfoot i Solva 1 Pendine 8 Solva 6 Lindsway Bay 3 Stackpde Quay 2 Llanelll 5 Tenbybeaches 2 Broad Haven 2 Pendine 15 Buny Port 4 Llanelli 9 Llanelli 10 Llanelli 2 Amroth 7 Fishguard 13
Swansea/Gower SwansealGower SwansealGower Fishguard Fishguard Swansea!Gower Fishguard Fishguard Fishguard Swansea/Gower Swansea/Gower Fishguard SwansealGower Fishguard Swansea/Gower Swansea/Gower Fishguard Fishguard SwanseafGower Swansea/Gower SwansealGower Fishguard Fishguard SwanseaIGower Fishguard SwanseafGower Fishguard , Fishguard Fishguard Fishguard Fishguard Fishguard SwansealGower Fishguard Fishguard Fishguard SwanseafGower Swansea/Gower SwansealGower SwansealGower Fishguard Fishguard
24 72.73% 11.93% 10 74.19% 12.17% 8 70.37% 11.54% 13 0.00% 0.00% 27 93.10% 15.27% 26 14.46% 2.37% 19 41.67% 6.83% 8 0.00% 0.00%
22 81.82% 13.42% 31 8.00% 1.31% 18 21.05% 3.45% 20 71.88% 11.79% 28 51.69% 8.48% 23 72.22% 11.84% 18 26.32% 4.32% 15 74.47% 12.21% 25 96.00% 15.74% 28 90.11% 14.78% 18 27.59% 4.52%. 18 17.24% 2.83% 17 47.17% 7.74% 15 42.86% 7.03% 17 64.15% 10.52% 23 8.11% 1.33% 15 38.78% 6.36% 17 25.93% 4.25% 16 93.75% 15.38% 13 92.00% 15.09% 25 66.25% 10.87% 16 62.50% 10.25% 24 89.47% 14.67% 29 94.57% 15.51% 12 56.76% 9.31% 37 94.59% 15.51% 19 91.94% 15.08% 22 32.39% 5.31% 11 63.89% 10.48% 15 41.67% 6.83% 15 29.79% 4.89% 9 82.14% 13.47%
22 67.14% 11.01% 13 0.00% o:ooo/
!?I,153 El,008 f200
f0 !z531 265
2161 f0
E2,131 fl5 275
f644 2183
f97 f828
f4,608 f3a7 f184 f67
f399 f232 f491 f27
f247 f252 f755 f242 E603 f370 f404 f198 f445
f1,375 f400 f149 f521 f464 f201
f 1,051 f308
f0 f43,774
f2,737 f112 f779 f2,391 f98 f681 f474 fl9 f135 f0 f0 f0
f1,260 f52 f359 f155 f6 f44 f382 f16 f109 f0 f0 'f0
f5,057 f208 fl,440 f37 f2 f10 f179 f7 f51
f1,528 f63 f435 f433 218 f123
f2,054 f84 f585 f229 f9 f65
f1,965 f81 f559 f10,934 f449 f3,1?2
f9la f38 2261 f436 f18 f124 f159 f7 f45 f946 f39 f269 f550 2.23 f157
f1,164 f48 f331 f64 f3 f18
f586 f.24 2167 f599 f25 f171
f1,792 f74 f510 if575 f24 El64 f1,432 f59 f408 f878 f36 f250 f958 f39 f273 f470 El9 fl34
f1,055 f43 f300 f3,262 f134 f929 f949' f39 f270 f353 f15 flO1
f1,235 f51 f352 f1,102 f45 f314 f476 f20 f135
f2,495 f103 f710 f731 f30 f208 EO f0 f0
E103,673 E4,268 E29,569
39,263 717 f6,408 f15,206 f625 f4,329 33,087 604 22,278 f5,405 f222 f1,539 74,698 ?,364 f 14,856 f35,253 f1,449 f10,035 48,763 862 f9,357 f22,203 f912 f6,320 40,859 746 f10,875 f25,807 f1,060 f7,346 236,670 4,292 f43,774 E103,673 f4,268 f29,569
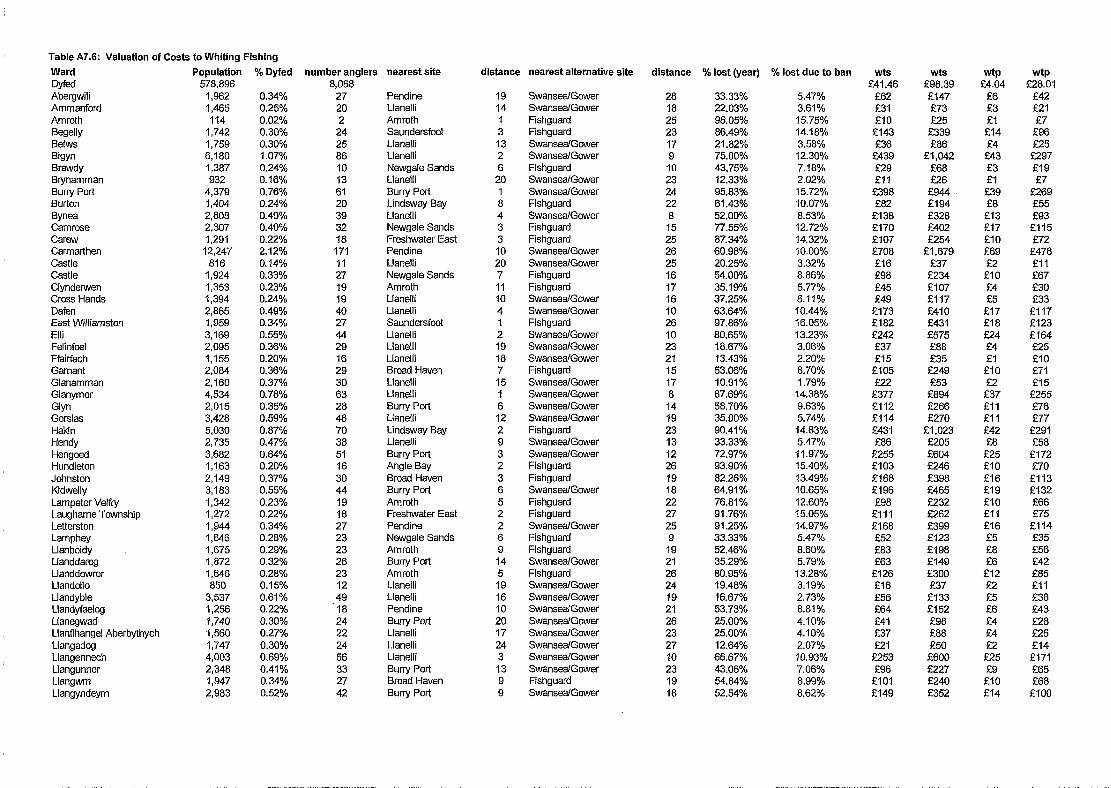
Table A7.6: Valuation of Costs to Whiting Fishing
Ward Population Dvfd 578,896 Abergwili 1,962 Ammanford 1,465
Amroth 114 Begelly 1,742
Betws 1,759 Bigyn 6,180
Brawdy 1,387 Brynamman 932 Burry Port 4,379 Burton 1,404 Bynea 2,808 Camrose 2,307 Carew 1,291 Carmarthen 12,247 Castle 816 Castle 1,924 Clyndetwen 1,353 Cross Hands 1,394 Dafen 2,865 East Williamston 1,959 Elli 3,169 Felinfoel 2,095 Ffairfach 1,155 Garnant 2,084 Glanamman 2,160 Glanymor 4,534 Glyn 2,015 Gorslas 3,428 Hakin 5,030 Hendy 2,735 Hengoad 3,682 Hundleton 1,163 Johnston 2,149 Kidwelly 3,183 Lampeter Velfry 1,342 Laugharne Township 1,272 Letterston 1,944 Lamphey 1,646 Llanboidy 1,675 Llanddarog 1,872 Llanddowror 1,646 Llandeilo 850 Llandybie 3,537 Llandyfaelog 1,256 Llanegwad 1,740 Llanfihangel Aberbythych 1,560 Llangadog 1,747 Llangennech 4,003 Llangunnor 2,348 Llangwm 1,947 Llangyndeyrn 2,983
% Dyfed
0.34% 0.25%
0.02% 0.30%
0.30% 1.07%
0.24% 0.16%
0.76% 0.24% 0.49% 0.40% 0.22% 2.12% 0.14% 0.33% 0.23% 0.24% 0.49% 0.34% 0.55% 0.36% 0.20% 0.36% 0.37% 0.78% 0.35%
0.59% 0.87% 0.47% 0.64% 0.20%
0.37% 0.55% 0.23% 0.22% 0.34% 0.28% 0.29% 0.32% 0.28% 0.15% 0.61% 0.22% 0.30% 0.27% 0.30% 0.69% 0.41% 0.34% 0.52%
number analers nearest site 8,068"
27 20
2 24 25 a6
IO 13
61 20
39 32 18
171 11 27 19 19 40 27 44 29 16 29 30 63 28
48 70 38 51 16 30 44 19 18 27 23 23 26 23 12 49
'18 24 22 24 56 33 27 42
Pendine 19 SwansealGower Llanelli 14 SwansealGower Amroth 1 Fishguard Saundersfoot 3 Fishguard Llanelli 13 SwansealGower Llanelli 2 SwansealGower Newgale Sands 6 Fishguard Llanelli 20 Swansea/Gower Buny Port 1 SwansesIGower Lindsway Bay 8 Fishguard Llanelli 4 SwanseaIGower Newgale Sands 3 Fishguard Freshwater East 3 Fishguard Pendine 10 Swansea/Gower Llanelli 20 Swansea/Gower Newgale Sands 7 Fishguard Amroth 11 Fishguard Llanelli IO Swansea/Gower Llanelli 4 SwansealGower Saundersfoot 1 Fishguard Llanelli 2 SwanseaIGower Llanelli 19 Swansea!Gower Llanelli 18 Swansea/Gower Broad Haven 7 Fishguard Llanelli 15 SwansealGower Llanelli 1 Swansea/Gower Burry Port 6 SwansealGower Llanelli 12 Swansea/Gower Lindsway Bay 2 Fishguard Llanelli 9 SwanseaIGower Buny Port 3 SwansealGower Angle Bay 2 Fishguard Broad Haven 3 Fishguard Buny Port 6 SwansealGower Amroth 5 Fishguard Freshwater East 2 Fishguard Pendine 2 Swansea/Gower Newgale Sands 6 Fishguard Amroth 9 Fishguard Buny Port 14 Swansea/Gower Amroth 5 Fishguard Llanelli 19 SwansealGower Llanelli 16 SwansealGower Pendine 10 Swansea/Gower Buny Port 20 SwansealGower Llanelli 17 SwansealGower Llanelli 24 Swansea/Gower Llanelli 3 Swansea/Gower Burry Port 13 SwansealGower Broad Haven 9 Fishguard Buny Port 9 SwansealGower
distance nearest alternative site distance % lost (year) % lost due to ban
28 33.33% 5.47% 18 22.03% 3.61%
25 96.05% 15.75% 23 86.49% 14.18%
17 21.82% 3.58% 9 75.00% 12.30%
IO 43.75% 7.18% 23 12.33% 2.02%
24 95.83% 15.72% 22 61.43% 10.07% a 52.00% 8.53%
15 77.55% 12.72% 25 87.34% 14.32% 26 60.98% 10.00% 25 20.25% 3.32% 16 54.00% 8.86% 17 35.19% 5.77% 16 37.25% 6.11% 10 63.64% 10.44% 26 97.86% 16.05% 10 80.65% 13.23% 23 18.67% 3.06% 21 13.43% 2.20%
15 53.06% 8.70% 17 10.91% 1.79%
8 87.69% 14.38% 14 58.70% 9.63% 19 35.00% 5.74% 23 90.41% 14.83% 13 33.33% 5.47% 12 72.97% 11.97% 26 93.90% 15.40%
19 82.26% 13.49% 18 64.91% 10.65%
22 76.81% 12.60% 27 91.76% 15.05%
25 91.25% 14.97% 9 33.33% 5.47%
19 52.46% 8.60% 21 35.29% 5.79% 26 80.95% 13.28% 24 19.48% 3.19% 19 16.67% 2.73% 21 53.73% 8.81% 26 25.00% 4.10% 23 25.00% 4.10% 27 12.64% 2.07% 10 66.67% 10.93% 23 43.06% 7.06% 19 54.84% 8.99% 18 52.54% 8.62%
WtS
f41.46 f62 f31 El0
f143 f36
f439 f29 fll
f398 f82
El38 f170 El07 f708 f16 f98 f45 f49
f173 El82 E242 f37 f15
El05 E22
f377 El12 El14 f431 f86
f255 El03
El68 f196 f98
flll El68 f52 f83 f63
El26 f16 f56 f64 f41 f37 f21
f253 fS6
El01 El49
WtS f98.39 f147 f73 E25 f339 f86
f1.042 f68 f26
f944 El94
f328 f402 f254
f1.679 f37
f234 f107 f117 f410 w31 f575 f88 f35
f53 f894 f266 f270
El.023
f604 f246 f398 f465 f232 f262 f399 El23 f198 El49 f300 f37 f133 f152 ES8 faa f50 f600 f227 f240 f352
MP wtp f4.04 f28.01
f-6 f42 f3 f21 fl f7
fl4 ES6 f4 f25
f43 E297
f3 f19 fl f7 f39 E2.69 f8 f55
f13 ES3 f17 f115 f10 f72 f69 f478 f2 fll fl0 f67 f4 f30 f5 f33
f17 f117 f18 f123 f24 f164 f4 f25 fl f10
El0 f71 f2 f15
f37 if255 fll f76 fll f77 f42 f291 f8 f58
f25 f172 f10 f70 f16 El13 f19 El32 f10 f66 fll f75 f16 f114 f5 f35 fa f56 f6 f42
f12 f85 f2 fll f5 f38 f6 f43 f4 f28 f4 f25 f2 f14
f25 f171 f9 f65
f10 f68 f14 El00
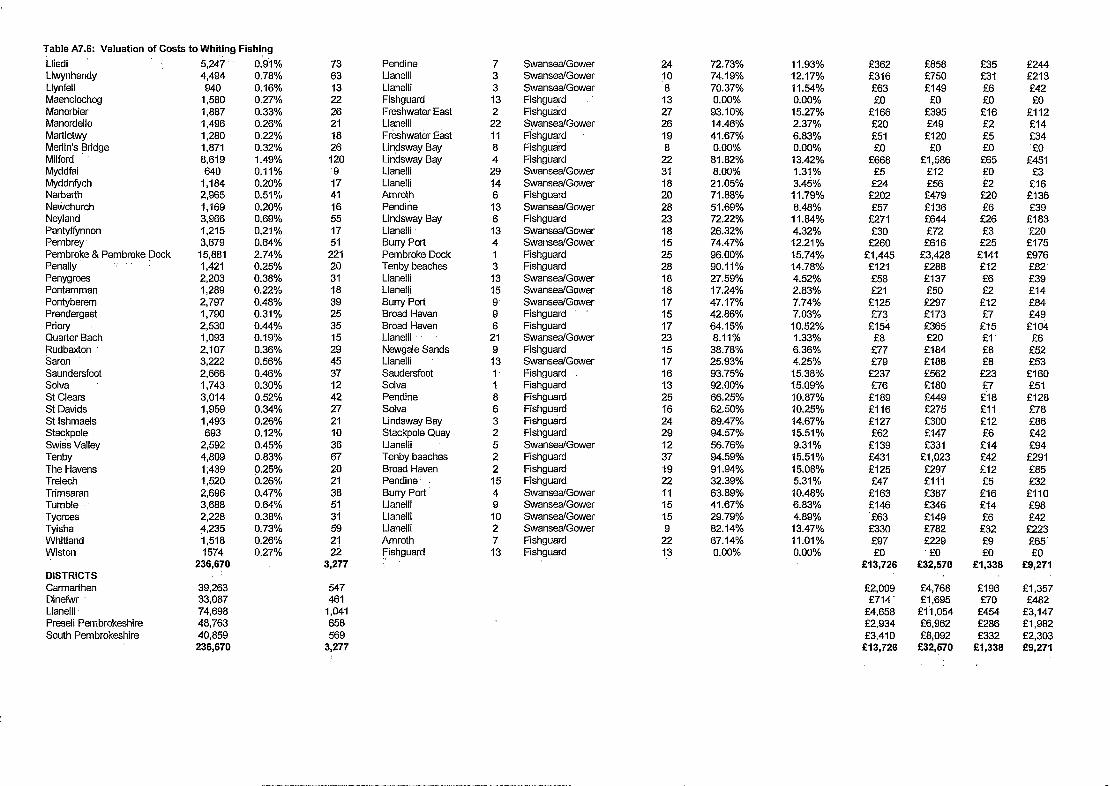
Table A7.6: Valuation of Costs to Whiting Fishing
Lliedi 5,247 0.91% Llwynhendy 4,494 0.78% Llynfell 940 0.16% Maenclcchcg 1,580 0.27% Manorbier 1,887 0.33% Manordeilo 1,496 0.26% Martletwy 1,280 0.22% Merlin’s Bridge 1.871 0.32% Milford 8,619 1.49% Myddfai 640 0.11% Myddnfych 1,184 0.20% Narberth 2,965 0.51% Newchurch 1,169 0.20% Neyland 3,966 0.69% Pantyffynnon 1,215 0.21% Pembrey 3,679 0.64% Pembroke & Pembroke Dock 15,881 2.74% Penally : 1,421 0.25% Penygrces 2,203 0.38% Pontamman 1,289 0.22% Pontyberem 2,797 0.48% Prendergast 1,790 0.31% Priory 2,530 0.44% Quarter Bach 1,093 0.19% Rudbaxton 2,107 0.36% Saron 3,222 0.56% Saundersfoot 2,666 0.46% Solva 1,743 0.30% St Clears 3,014 0.52% St Davids 1,959 0.34% St lshmaels 1,493 0.26% Stackpole 693 0.12% Swiss Valley 2,592 0.45% Tenby 4,809 0.83% The Havens 1,439 0.25% Trelech 1,520 0.26% Trimsaran 2,696 0.47% Tumble 3,688 0.64% Tycroes 2,228 0.38% Tyisha 4,235 0.73% Whitland 1,518 0.26% Wiston 1574 0.27%
236,670 DISTRICTS Carmarthen Dinefwr Llanelli Preseli Pembrokeshire South Pembrokeshire
73 63 13 22 26 21 18 26 120 ‘9 17 41 16 55 17 51
221 20 31 18 39 25 35 15 29 45 37 12 42 27 21 IO 36 67 20 21 38 51 31 59 4 22
3,277
Pendine 7 Swansea/Gower 24 72.73% 11.93% Llanelli 3 Swansea/Gower IO 74.19% 12.17% Llanelli 3 Swansea/Gower a 70.37% 11.54% Fishguard 13 Fishguard 13 0.00% 0.00% Freshwater East 2 Fishguard 27 93.10% 15.27% Llanelli 22 SwanseaIGower 26 14.46% 2.37% Freshwater East 11 Fishguard 19 41.67% 6.83% Lindsway Bay 8 Fishguard 8 0.00% 0.00% Lindsway Bay 4 Fishguard 22 81.82% 13.42% Llanelli 29 Swansea/Gower 31 8.00% 1.31% Llanelli 14 SwansealGower 18 21.05% 3.45% Amroth 6 Fishguard 20 71.88% 11.79% Pendine 13 Swansea/Gower 28 51.69% 8.48% Lindsway Bay 6 Fishguard 23 72.22% 11.84% Llanelli 13 SwansealGower 18 26.32% 4.32% Burry Port 4 SwanseafGower 15 74.47% 12.21% Pembroke Dock 1 Fishguard 25 96.00% 15.74% Tenby beaches 3 Fishguard 28 90.11% 14.78% Llanelli 13 SwanseaIGower 18 27.59% 4.52% Llanelti 15 Swansea/Gower 18 17.24% 2.83% Burry Port 9 Swansea/Gower 17 47.17% 7.74% Broad Haven 9 Fishguard 15 42.86% 7.03% Broad Haven 6 Fishguard 17 64.15% 10.52% Llanelli 21 Swansea/Gower 23 8.11% 1.33% Newgale Sands 9 Fishguard 15 38.78% 6.36% Llanelli 13 Swansea/Gower 17 25.93% 4.25% Saudersfoot 1, Fishguard I 16 93.75% 15.38% Solva 1 Fishguard 13 92.00% 15.09% Pendine 8 Fishguard 25 66.25% 10.87% Sdva 6 Fishguard 16 62.50% 10.25% Lindsway Bay 3 Fishguard 24 89.47% 14.67% Stackpole Quay 2 Fishguard 29 94.57% 15.51% Llanelli 5 Swansea!Gower 12 56.76% 9.31% Tenbybeaches 2 Fishguard 37 94.59% 15.51% Broad Haven 2 Fishguard 19 91.94% 15.08% Pendine’ 15 Fishguard 22 32.39% 5.31% Burry Port 4 SwansealGower 11 63.89% 10.48% Llanelli 9 SwanseaIGower 15 41.67% 6.83% Llanelli IO Swansea/Gower 15 29.79% 4.89% Llanelli 2 SwanseaIGower 9 82.14% 13.47% Amroth 7 Fishguard 22 67.14% 11.01% Fishguard 13 Fishguard 13 0.00% 0.00%
f362 f858 f35 f244 f316 f750 f31 f213 S63 f149 f6 f42 f0 EO f0 f0
f166 f395 f16 fl12 E20 f49 f2 f14 e51 f120 f5 f34 f0 f0 f0 ‘f0
f668 f1,586 f65 f451 f5 f12 f-0 f3
f24 f56 f2 El6 f202 f479 f20 f136 f57 f136 f6 f39
f271 f644 f26 f183 f30 f72 f3 f20 f260 f616 f25 f175
f 1,445 f 3,428 fl41 f976 f121 f288 fl2 f82’ f58 f137 f6 f39 f21 f50 f2 f14 f125 f297 f12 f84 5z73 f173 f7 f49 El54 f365 El5 fl04
f8 f20 fl f6 f77 f184 f8 f52 f79 f188 f8 f53 .U37 f562 a3 f160 f76 El80 f7 f51 f189 f449 f18 f128 f?16 2275 fll f78 f127 f300 f12 f86 f62 f147 f6 f42
f139 f331 f14 f94 f431 fl,023 f42 f291 f125 f297 f12 f85 f47 fll’l f5 f32
El63 f387 El6 El10 f146 f346 f14 f98 ‘f63 f149 f6 f42 f330 f782 f32 f223 f97 f229 f9 f65 f0 f0 f0 f0
f13,726 f32,670 El,338 f 9,271
39,263 547 f2.009 f4.768 f196 f 1,357 33,087 461 f714. fl,695 f70 f482 74,698 1,041 f4,658 fl1,054 f454 f3,147 48,763 658 f2,934 f6,962 f286 f 1,982 40,859 569 f3,410 f8,092 f332 f2,303 236,670 3,277 E13,726 E32,570 El,338 f9,271
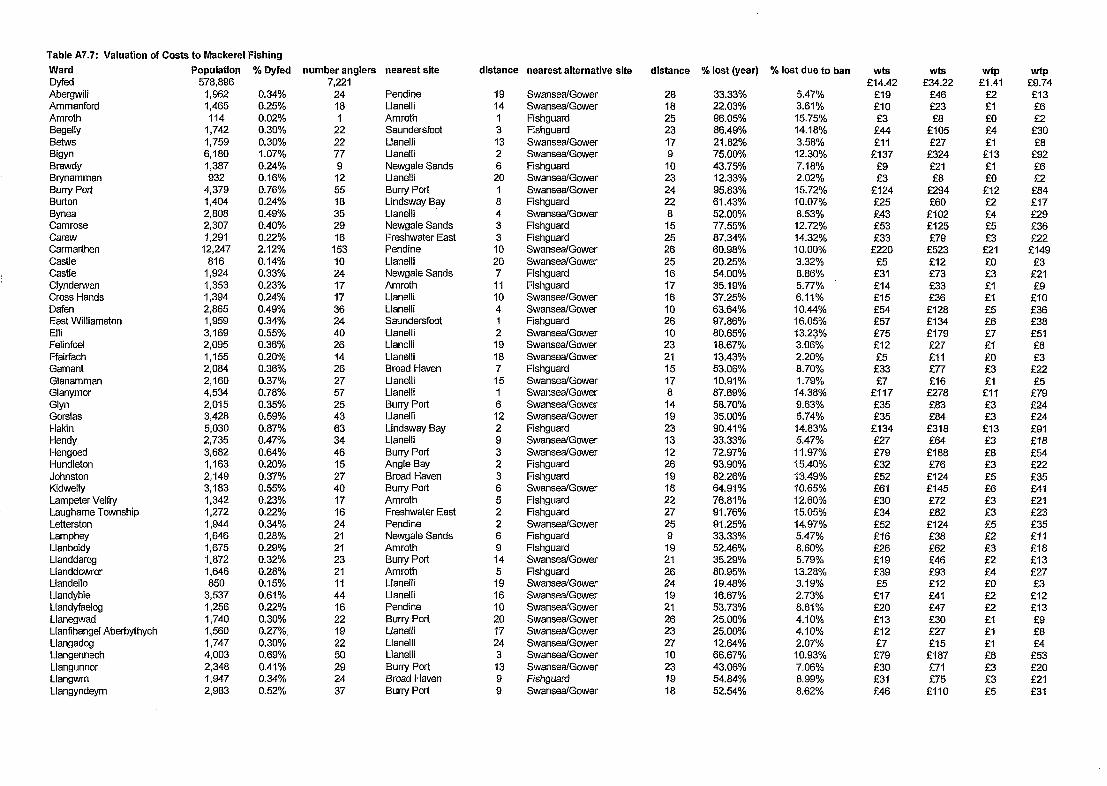
Table A7.7: Valuation of Costs to Mackerel Fishing
Ward DYfd Abergwili Ammanford Amroth Begelly Betws Bigyn Brawdy Brynamman Buny Port Burton Bynea Camrose Carew Carmarthen Castle Castle Clyndetwen Cross Hands Dafen East Williamston Elli Felinfoel Ffairfach Gamant Glanamman Glanymor Glyn Gorslas Hakln Hendy Hengoed Hundleton Johnston Kidwelly Lampeter Velfry Laughame Township Letterston Lamphey Llanboidy Llanddarog Llanddowror Llandeilo Llandybie Llandyfaelog Llanegwad Llanfihangel Aberbythych Llangadog Llangennech Llangunnor Llangwm Llangyndeym
Population 578,896
1,962 1,465 114
1,742 1,759 6,180 1,387 932
4,379 1,404 2,808 2,307 1,291
12,247 816
1,924 1,353 1,394 2,865 1,959 3,169 2,095 1,155 2,084 2,160 4,534 2,015 3,428 5,030 2,735 3,682 1,163 2,149 3,183 1,342 1,272 1,944 1,646
.I,675 1,872 1,646 850
3,537 1,256 1,740 1,560 1,747 4,003 2,348 1,947 2,983
% Dyfed number analers nearest site
0.34% 0.25% 0.02% 0.30% 0.30% 1.07% 0.24% 0.16% 0.76% 0.24% 0.49% 0.40% 0.22% 2.12% 0.14% 0.33% 0.23% 0.24% 0.49% 0.34% 0.55% 0.36% 0.20% 0.36% 0.37% 0.78% 0.35% 0.59% 0.87% 0.47% 0.64% 0.20% 0.37% 0.55% 0.23% 0.22% 0.34% 0.28% 0.29% 0.32% 0.28% 0.15% 0.61% 0.22% 0.30% 0.27%. 0.30% 0.69% 0.41% 0.34% 0.52%
7,221- 24 18 1
22 22 77 9 12 55 18 35 29 16 153 IO 24 17 17 36 24 40 26 14 26 27 57 25 43 63 34 46 15 27 40 17 16 24 21 21 23 21 II 44 16 22 19 22 50 29 24 37
Pendine 19 Swansea/Gower Llanelli 14 Swansea/Gower Amroth 1 Fishguard Saundersfoot 3 Fishguard Llanelli 13 SwansealGower Llanelli 2 Swansea/Gower Newgale Sands 6 Fishguard Llanelli 20 Swansea/Gower Bun-y Port 1 SwansealGower Lindsway Bay 8 Fishguard Llanelli 4 SwansealGower Newgale Sands 3 Fishguard Freshwater East 3 Fishguard Pendine IO SwansealGower Llanelli 20 SwansealGower Newgale Sands 7 Fishguard Amroth 11 Fishguard Llanelli 10 SwansealGower Llanelli 4. Swansea/Gower Saundersfoot 1 Fishguard Llanelli 2 SwansealGower Llanelli 19 SwansealGower Llanelli 18 Swansea/Gower Broad Haven 7 Fishguard Llanelli 15 Swansea/Gower Llanelli 1 Swansea/Gower Burly Port 6 SwanseaIGower Llanelli 12 SwansealGower Lindsway Bay 2 Fishguard Llanelli 9 Swansea/Gower Burry Port 3 SwansealGower Angle Bay 2 Fishguard Broad Haven 3 Fishguard Buny Port 6 Swansea/Gower Amroth 5 Fishguard Freshwater East 2 Fishguard Pendine 2 Swansea/Gower Newgale Sands 6 Fishguard Amroth 9 Fishguard Buny Port 14 SwansealGower Amroth 5 Fishguard Llanelli 19 Swansea/Gower Llanelll 16 SwanseaIGower Pendine IO Swansea/Gower Buny Port 20 SwansealGower Llanelli 17 Swansea/Gower Llanelll 24 SwanseaIGower Llanelli 3 SwanseafGower Buny Port 13 SwanseaIGower Broad Haven 9 Fishguard Buny Port 9 Swansea/Gower
distance nearest alternative site distance % lost (year)
28 33.33% 5.47% 18 22.03% 3.61% 25 96.05% 15.75% 23 86.49% 14.18% 17 21.82% 3.58% 9 75.00% 12.30% 10 43.75% 7.18% 23 12.33% 2.02% 24 95.83% 15.72% 22 61.43% 10.07% 8 52.00% 8.53%
15 77.55% 12.72% 25 87.34% 14.32% 28 60.98% 10.00% 25 20.25% 3.32% 16 54.00% 8.86% 17 35.19% 5.77% 16 37.25% 6.11% 10 63.64% 10.44% 26 97.86% 16.05% IO 80.65% 13.23% 23 18.67% 3.06% 21 13.43% 2.20% 15 53.06% 8.70% 17 10.91% 1.79% 8 87.69% 14.38%
14 58.70% 9.63% 19 35.00% 5.74% 23 90.41% 14.83% 13 33.33% 5.47% 12 72.97% 11.97% 26 93.90% 15.40% 19 82.26% 13.49% 18 64.91% 10.65% 22 76.81% 12.60% 27 91.76% 15.05% 25 91.25% 14.97% 9 33.33% 5.47%
19 52.46% 8.60% 21 35.29% 5.79% 26 80.95% 13.28% 24 19.48% 3.19% 19 16.67% 2.73% 21 53.73% 8.81% 26 25.00% 4.10% 23 25.00% 4.10% 27 12.64% 2.07% 10 66.67% 10.93% 23 43.06% 7.06% 19 54.84% 8.99% 18 52.54% 8.62%
% lost due to ban wts E14.42
El9 f10 f3
f44 fll
f137 f9 f3
f124 E25 f43 f53 f33
f220 f5 f31 f14 f15 f54 f57 f75 f12 f5 f33 f7
f117 f35 f35
f134 f27 f79 f32 f52 f61 f30 f34 f52 f16 f26 El9 f39 f5
f17 f20 f13 El2 f7 f79 f30 f31 f46
WtS WtP WtP f 34.22 f1.41 f9.74
f46 f2 f13 f23 fl f6 f8 f0 f2
f105 f4 f30 f27 El f8
f324 f13 f92 f21 fl f6 f8 f0 f2
f294 f12 f84 f60 f2 El7
f102 f4 f29 f125 f5 f36 f79 f3 f22
f523 f21 f149 f12 f0 f3 f73 f3 f21 f33 fl f9 f36 fl El0 f128 f5 f36 El34 f6 f38 El79 f7 f51 f27 fl f8 El1 f0 f3 f77 f3 f22 f16 fl f5
f278 fll f79 f83 f3 f24 f84 f3 f24 f318 El3 f91 f64 f3 fl8 f188 f8 f54 f76 f3 f22 f124 f5 f35 f145 f6 E41 f72 f3 f21 f82 f3 f23 f124 f5 f35 f38 f2 fll 462 f3 f18 f46 f2 f13 f93 f4 f27 f12 f0 f3 f41 f2 El2 f47 f2 f13 f30 fl f9 f27 fl f8 f15 El f4 f187 f8 f53 f71 f3 f20 f75 f3 f21 fll0 f5 f31

Table A7.7: Valuation of Costs to Mackerel Fishing
Lliedi Llwynhendy Llynfell Maenclochog Manorbier Manordeilo Martletwy Merlin’s Bridge Milford - Myddfai Myddnfych Narberth Newchurch Neyland Pantyffynnon Pembrey, Pembroke & Pembroke Dock Penally Penygroes Pontamman Pontyberem Prendergast Priory Quarter Bach Rudbaxton Saron Saundersfoot S&a St Clears St Davids St lshmaels Stackpo!e Swiss Valley Tenby The Havens Trelech Trimsaran Tumble Tycroes Tyisha Whitland Wiston
5,247 4,494
940 1,580 1,887 1,496 1,280 1,871 8,619 640
1,184 2,965 1,169 3,966 1,215 3,679 15,aa: 1,421 2,203 1,289 2,797 1,790 2,530 1,093 2,107 3,222 2,666 1,743 3,014 1,959 1,493 693
2,592 4,809 1,439 1,520 2,696 3,688 2,228 4,235 1,518 1574
236,670
0.91% 0.78% 0.16% 0.27% 0.33% 0.26% 0.22% 0.32% 1.49% 0.11% 0.20% 0.51% 0.20% 0.69% 0.21% 0.64% 2.74% 0.25% 0.38% 0.22% 0.48% 0.31% 0.44% 0.19% 0.36% 0.56% 0.46% 0.30% 0.52% 0.34% 0.26% 0.12% 0.45% 0.83% 0.25% 0.26% 0.47% 0.64% 0.38% 0.73% 0.26% 0.27%
DISTRICTS Carmarthen Dinefwr Llanelli Preseli Pembrokeshire South Pembrokeshire
65 56 12 20 24 19 16 23 108 a 15 37 15 49 15 46 198 la 27 16 35 22 32 14 26 40 33 11 38 24 19 9
32 60 ia 19 34 46 28 53 19 20
2,933
Pendine 7 SwansealGower 24 72.73% 11.93% Llanelli 3 Swansea/Gower IO 74.19% 12.17% Llanelli 3 SwansealGower a' 70.37% 11.54% Fishguard 13 Fishguard 13 0.00% 0.00% Freshwater East 2 Fishguard 27 93.10% 15.27% Llanelli 22 SwansesJGower 26 14.46% 2.37% Freshwater East 11 Fishguard 19 41.67% 6.83% Lindsway Bay a Fishguard a 0.00% 0.00% Lindsway Bay 4 Fishguard 22 81.82% 13.42% Llanelli 29 SwansealGower 31 8.00% 1.31% Llanelli 14 Swansea/Gower la 21.05% 3.45% Amroth 6 Fishguard 20 71.88% 11.79% Pendine 13 SwanseaIGower 28 51.69% 8.48% Lindsway Bay 6 Fishguard 23 72.22% 11.84% Llanelli 13 SwansealGower 18 26.32% 4.32% Burly Port 4 Swansea/Gower 15 74.47% 12.21% Pembroke Dock 1 Fishguard 25 96.00% 15.74% Tenby beaches 3 Fishguard 28 90.11% 14.78% Llanelli 13 SwansealGower la 27.59% 4.52% Llanelli 15 SwansealGower la 17.24% 2.83% Burly Port 9 SwansealGower 17 47.17% 7.74% Broad Haven 9 Fishguard 15 42.86% 7.03% Broad Haven 6 Fishguard 17 64.15% 10.52% Llanelli 21 SwansealGower 23 8.11% 1.33% Nawgale Sands 9 Fishguard 15 38.78% 6.36% Llanelli 13 SwanseaIGower 17 25.93% 4.25% Saud&foot 1 Fishguard , 16 93.75% 15.38% Solva 1 Fishguard 13 92.00% 15.09% Pendine a Fishguard 25 66.25% 10.87% Solva 6 Fishguard 16 62.50% 10.25% Lindsway Bay 3 Fishguard 24 89.47% 14.67% Stackpole Quay 2 Fishguard 29 94.57% 15.51% Llanelli 5 SwansealGower 12 56.76% 9.31% Tenby beaches 2 Fishguard 37 94.59% 15.51% Broad Haven 2 Fishguard 19 91.94% 15.08% Pendine 15 Fishguard 22 3’2.39% 5.31% Burj Port 4 SwansealGower 11 63.89% 10.48% Llanelli 9 Swansea/Gower 15 41.67% 6.83% Llanelli IO SwansealGower 15 29.79% 4.89% Llanelli 2 SwansealGower 9 82.14% 13.47% Amroth 7 Fishguard 22 67.14% 11.01% Fishguard 13 Fishguard 13 0.00% 0.00%
El13 f267 f98 2233 f20 f46 f0 f0
f52 f123 f6 215
f16 f37 f0 f0
f2oa f494 f2 f4 f7 f17
f63 f149 f'18 f42 f85 f201 EQ f22
fal f192 f450 El,067 f3a ES0 fla f43 f7 f16
f39 f92 !z23 f54 f48 f114 f3 f6
f24 f57 f25 f58 f74 f175 f24 f56 f59 f140 f36 f86 f39 f94 fl9 f46 f43 f103
f134 f318 f39 f93 fl5 f34 f51 f121 f45 f108 f20 f46
f103 f244 f30 f71 f0 f0
f4,273 El0,139
39,263 490 f626 f1,4a4 33,087 413 f222 f52a 74.698 932 El,450 f3,441 48,763 589 f913 =,I67 40,859 510 f1.062 f2,519 236,670 2,933 84,273 fl0,139
El1 E76 f10 f66 f2 f13 f0 f0 f5 f35 fl f4 f2 fll f0 'f0
f20 f141 f0 fl fl f5 f6 f42 f2 i312 f8 f57 fl 26 fa f55
f44 f304 f4 f26 f2 f12 fl 'f4 f4 f26 f2 f15 f5 f32 f0 f2 f2 f16 f2 f17 f7 f50 f.2 f16 f6 f40 f4 f24 f4 f27 f2 f13 f4 f29
f13 f91 f4 f26 fl f10 f5 f34 f4 f31 f2 f13 f10 f69 f3 f20 f0 ,fO
8417 fi,886
i61 f423 f22 f150 f141 f980 f89 f617 f104 f717 8417 f2,886
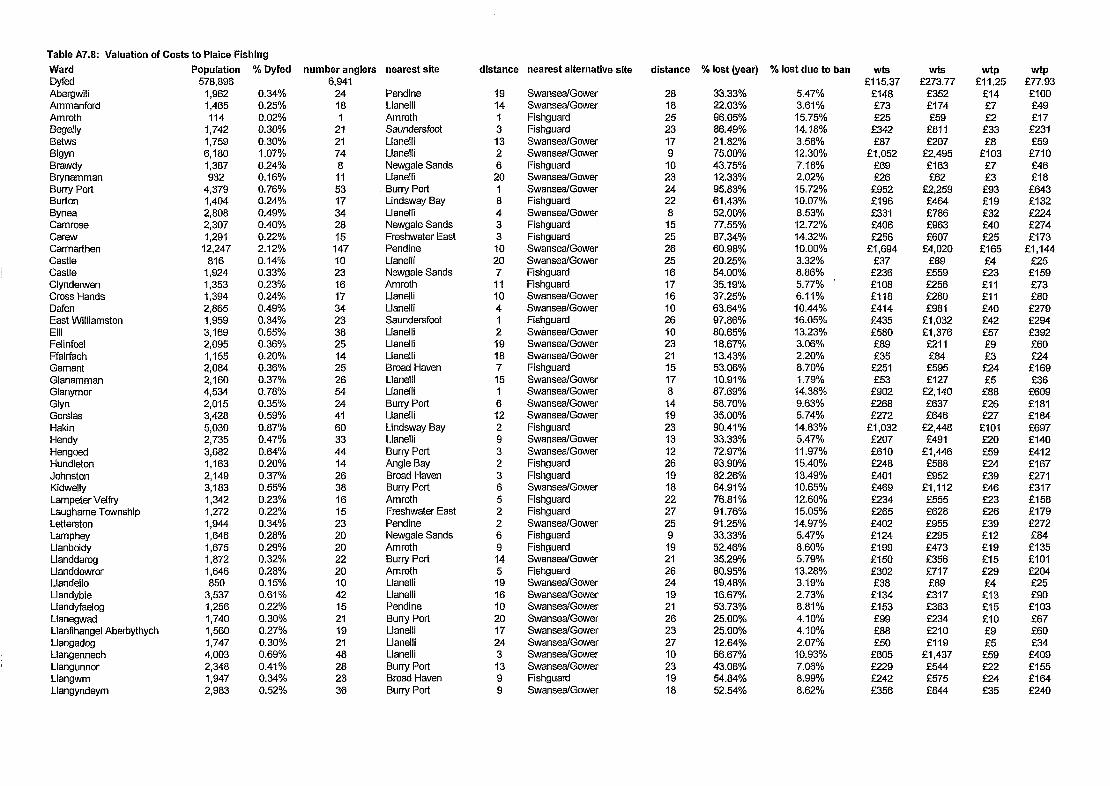
% Dyfed number anglers nearest site
Table A7.8: Valuation of Costs to Plaice Fishing
Ward Dyfed Abergwili Ammanford Amroth Begelly Betws Bigyn Brawdy Brynamman Buny Port Burton Bynea Camrose Carew Carmarthen Castle Castle Clynderwen Cross Hands Dafen East Williamston Elk Felinfcel Ffairfach Garnant Glanamman Glanymor Glyn Gorslas Hakin Hendy Hengced Hundleton Johnston Kidwelly Lampeter Velfry Laugharne Township Letterston Lamphey Llanboidy Llanddarog Llanddowror Llandeilo Llandyble Llandyfaelog Llanegwad Llantihangel Aberbythych Llangadog Llangennech Llangunnor Llangwni Llangyndeyrn
Population 578,896
1,962 1,465 114
1,742 1,759 6,180 1,367 932
4,379 1,404 2,808 2,307 1,291
12,247 816
1,924 1,353 1,394 2,865 1,959 3,169 2,095 1,155 2,084 2,160 4,534 2,015 3,428 5,030 2,735 3,682 1,163 2,149 3,183 1,342 1,272 1,944 1,646 1,675 1,872 1,646 850
3,537 1,256 1,740 1,560 1,747 4,003 2,348 1,947 2,983
0.34% 0.25% 0.02% 0.30% 0.30% 1.07% 0.24% 0.16% 0.76% 0.24% 0.49% 0.40% 0.22% 2.12% 0.14% 0.33% 0.23% 0.24% 0.49% 0.34% 0.55% 0.36% 0.20% 0.36% 0.37% 0.78% 0.35% 0.59% 0.87% 0.47% 0.64% 0.20% 0.37% 0.55% 0.23% 0.22% 0.34% 0.28% 0.29% 0.32% 0.28% 0.15% 0.61% 0.22% 0.30% 0.27% 0.30% 0.69% 0.41% 0.34% 0.52%
6,941- 24 18 1
21 21 74 8 11 53 17 34 28 15 147 10 23 16 17 34 23 38 25 14 25 26 54 24 41 60 33 44 14 26 38 16 15 23 20 20 22 20 10 42 15 21 19 21 48 28 23 36
Pendine 19 Llanelli 14 Amroth 1 Saundersfoot 3 Llanelli 13 Llanelli 2 Newgale Sands 6 Llanelli 20 Burry Port 1 Lindsway Bay 8 Llanelli 4 Newgale Sands 3 Freshwater East 3 Pendine 10 Llanelli 20 Newgale Sands 7 Amroth 11 Llanelll IO Llanelli 4 Saundersfc-ot 1 Llanelli 2 Llanelli 19 Llanelli 18 Broad Haven 7 Llanelli 15 Llanelli 1 Buny Port 6 Llanelli 12 Lindsway Bay 2 Llanelli 9 Burry Port 3 Angle Bay 2 Broad Haven 3 Burly Port 6 Amroth 5 Freshwater East 2 Pendine 2 Newgale Sands 6 Amroth 9 Burry Port 14 Amroth 5 Llanelli 19 Llanelli 16 Pendine 10 Burry Port 20 Llanelli 17 Llanellt 24 Llanelli 3 Buny Port 13 Broad Haven 9 Burry Port 9
distance nearest alternative site distance % lost (year)
Swansea/Gower SwanseaIGower Fishguard Fishguard SwansealGower SwansealGower Fishguard Swansea/Gower Swansea/Gower Fishguard SwansealGower Fishguard Fishguard Swansea/Gower Swansea/Gower Fishguard Fishguard Swansea/Gower SwansealGower Fishguard SwansealGower SwansealGower SwansealGower Fishguard SwansealGower SwanseaIGower SwansealGower SwansealGower Fishguard SwansealGower SwansealGower Fishguard Fishguard Swansea/Gower Fishguard Fishguard SwansealGower Fishguard Fishguard SwansealGower Fishguard Swansea/Gower SwansealGower SwansedGower SwanseaIGower SwansealGower SwansealGower SwansesfGower SwanseaIGower Fishguard SwansealGower
28 33.33% 18 22.03% 25 96.05% 23 86.49% 17 21.82% 9 75.00%
10 43.75% 23 12.33% 24 95.63% 22 61.43% 8 52.00%
15 77.55% 25 87.34% 26 60.98% 25 20.25% 16 54.00% 17 35.19% 16 37.25% IO 63.64% 26 97.86% 10 80.65% 23 18.67% 21 13.43% 15 53.06% 17 10.91% 8 87.69% 14 58.70% 19 35.00% 23 90.41% 13 33.33% 12 72.97% 26 93.90% 19 82.26% 18 64.91% 22 76.81% 27 91.76% 25 91.25% 9 33.33% 19 52.46% 21 35.29% 26 80.95% 24 19.48% 19 16.67% 21 53.73% 26 25.00% 23 25.00% 27 12.64% 10 66.67% 23 43.06% 19 54.84% 18 52.54%
% lost due to ban
5.47% 3.61% 15.75% 14.18% 3.58% 12.30% 7.18% 2.02% 15.72% 10.07% 8.53% 12.72% 14.32% 10.00% 3.32% 8.86% 5.77% 6.11% 10.44% 16.05% 13.23% 3.06% 2.20% 8.70% 1.79%
14.38% 9.63% 5.74% 14.83% 5.47% 11.97% 15.40% 13.49% 10.65% 12.60% 15.05% 14.97% 5.47% 8.60% 5.79% 13.28% 3.19% 2.73% 8.81% 4.10% 4.10% 2.07% 10.93% 7.06% 8.99% 8.62%
WtS
El 15.37 f148 f73 f25
f342 f87
f1.052 f69 226
f952 f196 f331 f406 f256
f1.694 f37
f236 fioa El18 f414 f435 f5ao fag f35 2251 f53
f902 a68 f272
f 1,032 E207 f610 f24a f401 f469 f234 f265 f402 f124 f199 f150 f302 f38
f134 f153 f99 faa f50
f605 f229
f356
WtS wtp f273.77 f11.25
f352 El4 f174 f7 f59 f2
f811 f33 f207 fa
f2,495 f103 f163 f7 E62 f3
f2,259 f93 f464 fl9 f786 f32 f963 f40 f607 f25
f4,020 f165 f89 f4 f559 f23 f256 fll f2ao fll f981 f40
f1,032 f42 f1,376 f57 f211 f9 f84 f3 f595 f24 f127 f5
f2,140 f88 f637 226 f646 !z!7
f2,448 f101 f491 f20
f1,446 f59 f588 f24 f952 f39
f1,112 f46 f555 zz3 f628 f26 f955 f39 f295 f12 f473 f19 f356 f15 f717 f29 fag f4 f317 f13 f363 f15 f234 fl0 f210 f9 f119 25
f1,437 f59 f544 f22 f575 f24 fa44 f35
wtp f77.93 f100 f49 f17
f59 f710 f46 fia f643 f132
f274 f173
f1,144 f25 f159 f73 fao f279
f392 f60 f24 f169 f36
f609 fial fla4
f140 f412 f167 E271 f317 f158 f179 f272 f84 f135 flO1 f204 f25 f90 f103 f67 f60 f34 f409 El55 f164 f240
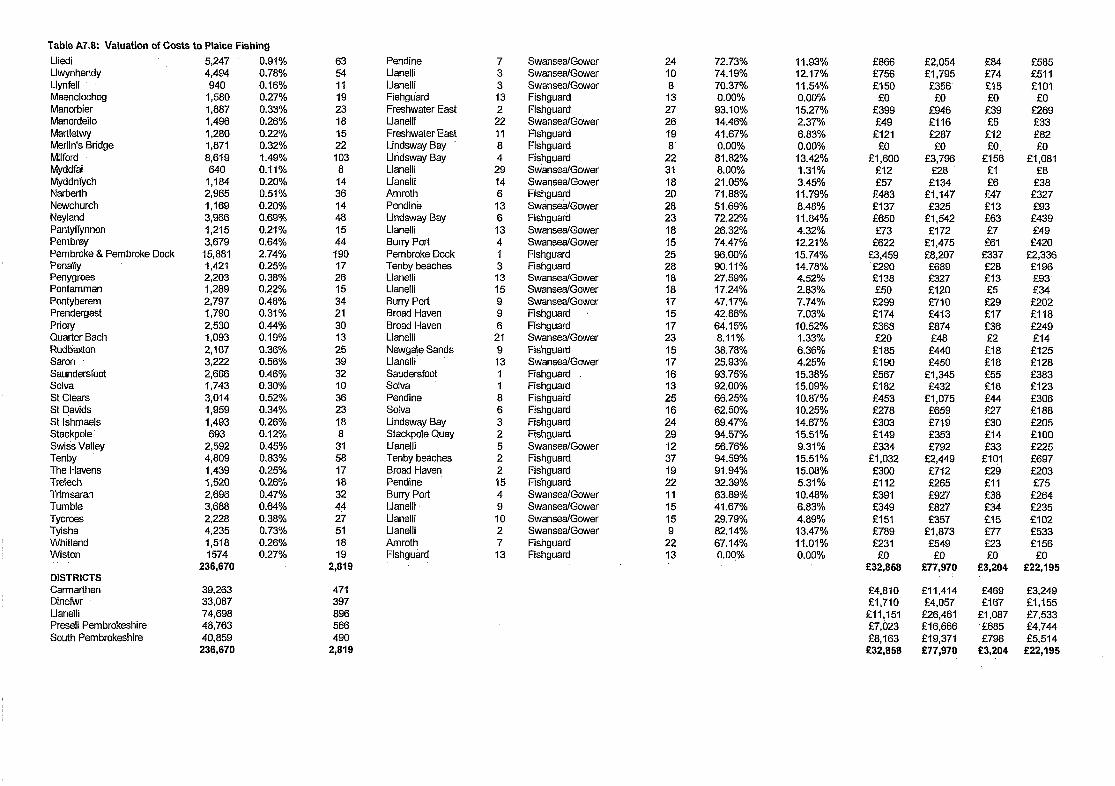
Table A7.8: Valuation of Costs to Plaice Fishing
Lliedi Llwynhendy Llynfell Maenclochog Manorbier
5,247 4,494 940
1,580 1,887 1,496 1,280 1,871 8,619 640
1,184 2,965 1,169 3,966 1,215 3,679 15,881 1,421 2,203 1,289 2,797 1,790 2,530 1,093 2,107 3,222 2,666 1,743 3,014 1,959 1,493 693
2,592 4,809 1,439 1,520 2,696 3,688 2,228 4,235 1,518 1574
236,670
0.91% 0.78% 0.16% 0.27% 0.33% 0.26% 0.22% 0.32% 1.49% 0.11% 0.20% 0.51% 0.20% 0.69% 0.21% 0.64% 2.74% 0.25% 0.38% O.qc?% 0.48% 0.31% 0.44% 0.19% 0.36% 0.56% 0.46% 0.30% 0.52% 0.34% 0.26% 0.12% 0.45% 0.83% 0.25% 0.26% 0.47% 0.64% 0.38% 0.73% 0.26% 0.27%
Martletwy Merlin’s Bridge Milford Myddfai Myddnfych Narberth Newchurch Neyland Pantyffynnon Pembrey Pembroke & Pembroke Dock Penally Penygroes Pontamman Pontyberem Prendergast Priory Quarter Bach Rudbaxton Saron Saundersfoot Solva St Clears St Davtds St lshmaels Stackpole SwiS;s Valley Tenby The Havens Trelech Trimsaran Tumble Tycroes Tyisha Whitland Wiston
DISTRICTS Carmarthen Dinefwr Llanelli Preseli Pembrokeshire South Pembrokeshire
63 54 11 19 23 18 15 22 103
8 14 36 14 48 15 44 190 17 26 15 34 21 30 13 25 39 32 IO 36 23 18 8
31 58 17 18 32 44 27 51 18 19
2,819
Pendine 7 SwansealGower 24 72.73% 11.93% Llanelli 3 SwansealGower IO 74.19% 12.17% Llanelli 3 Swansea/Gower 8 70.37% 11.54% Fishguard 13 Fishguard 13 0.00% 0.00% Freshwater East 2 Fishguard 27 93.10% 15.27% Llanelli 22 SwansealGower 26 14.46% 2.37% Freshwater East 11 Fishguard 19 41.67% 6.83% Lindsway Bay 8 Fishguard 8 0.00% 0.00% Lindsway Bay 4 Fishguard 22 81.82% 13.42% Llanelli 29 SwansealGower 31 8.00% 1.31% Llaneili 14 SwanseaIGower 18 21.05% 3.45% Amroth 6 Fishguard 20 71.88% 11.79% Pendine 13 SwansealGower 28 51.69% 8.46% Lindsway Bay 6 Fishguard 23 72.22% 11.64% Llanelli 13 SwanseaIGower 18 26.32% 4.32% Buny Port 4’ SwanseaIGower 15 74.47% 12.21% Pembroke Dock 1 Fishguard 25 96.00% 15.74% Tenbybeaches 3 Fishguard 28 90.11% 14.78% Llanelli 13 Swansea/Gower 18 27.59% 4.52% Llanelli 15 SwanseaIGower 18 17.24% 2.83% Bun-y Port 9 SwansealGower 17 47.17% 7.74% Broad Haven 9 Fishguard 15 42.86% 7.03% Broad Haven 6 Fishguard 17 64.15% 10.52% Llanelli 21 Swansea/Gower 23 8.11% 1.33% Newgate Sands 9 Fishguard 15 38.78% 6.36% Llanelli 13 Swansea/Gower 17 25.93% 4.25% Saudersfoot 1 Fishguard , 16 93.75% 15.38% Solva 1 Fishguard 13 92.00% 15.09% Pendine 8 Fishguard 25 66.25% 10.87% Solva 6 Fishguard 16 62.50% 10.25% Lindsway Bay 3 Fishguard 24 89.47% 14.67% Stackpde Quay 2 Fishguard 29 94.57% 15.51% Llanelli 5 SwanseaIGower 12 56.76% 9.31% Tenbybeaches 2 Fishguard 37 94.59% 15.51% Broad Haven 2 Fishguard 19 91.94% 15.08% Pendine 15 Fishguard 22 32.39% 5.31% Buny Port 4 SwansealGower 11 63.89% 10.48% Llanelli 9 SwansealGower 15 41.67% 6.83% Llanelli IO SwansealGower 15 29.79% 4.89% Llanelli 2 SwansealGower 9 82.14% 13.47% Amroth 7 Fishguard 22 67.14% 11.01% Fishguard 13 Fishguard 13 0.00% 0.00%
f866 f756 fl50
f0 f399 f49 El21
f0 f 1,600
El2 f57
2483 f137 f650 f73
f622 E3,459 f290 El38 f50
f299 f174 2368 I?20
f185 f190 f567 f182 f453 f278 f303 f149 f334
f 1,032 f300 f112 f391 f349 f151 f789 f231
EO 832,868
f2,054 f 1,795 23.56
f0 f946 f116 f287
f0 f3,796
828 f134
f1,147 f325
f1,542 f172
El ,475 88,207
E327 f120 f710 f413 2874 f48
f440 f450
El ,345 f432
f1,075 f659 f719 f353 f792
f2,449 f712 f265 f927 f827 f357
f1,873 f549
f0 f77,970
f64 874 f15 f0
f39 f5 f12 f0,
El56 fl f6 f47 f13 f63 f7
f61 8337 f28 f13 f5
f29 f17 f36 f2 El8 f18 f55 El8 f44 a7 E30 El4 f33
El01 f29 fll f38 f34 f15 f77 f23 f0
83,204
f585 f511 flO1
f0 f269 f33 f82 f0
fl,OBl f8
f38 f327 f93 f439 f49
f420 a,336 f196 f93 f34
f118 f249 f14 f125 f128 f383 f123 f306 f188 f205 flO0
f697 f203 f75
f264 =35 f102 f533 f156
f0 f22,195
39,263 471 f4,810 f11,414 f469 f3,249 33,087 397 El,710 f4,057 El67 El,155 74,698 896 f11,151 f26,461 fl,O87 f7,533 48,763 566 f7,023 f 16,666 ‘f685 f4,744 40,859 490 f8,163 f19,371 f796 f5,514 236,670 2,819 832,868 877,970 E3,204 f22,196
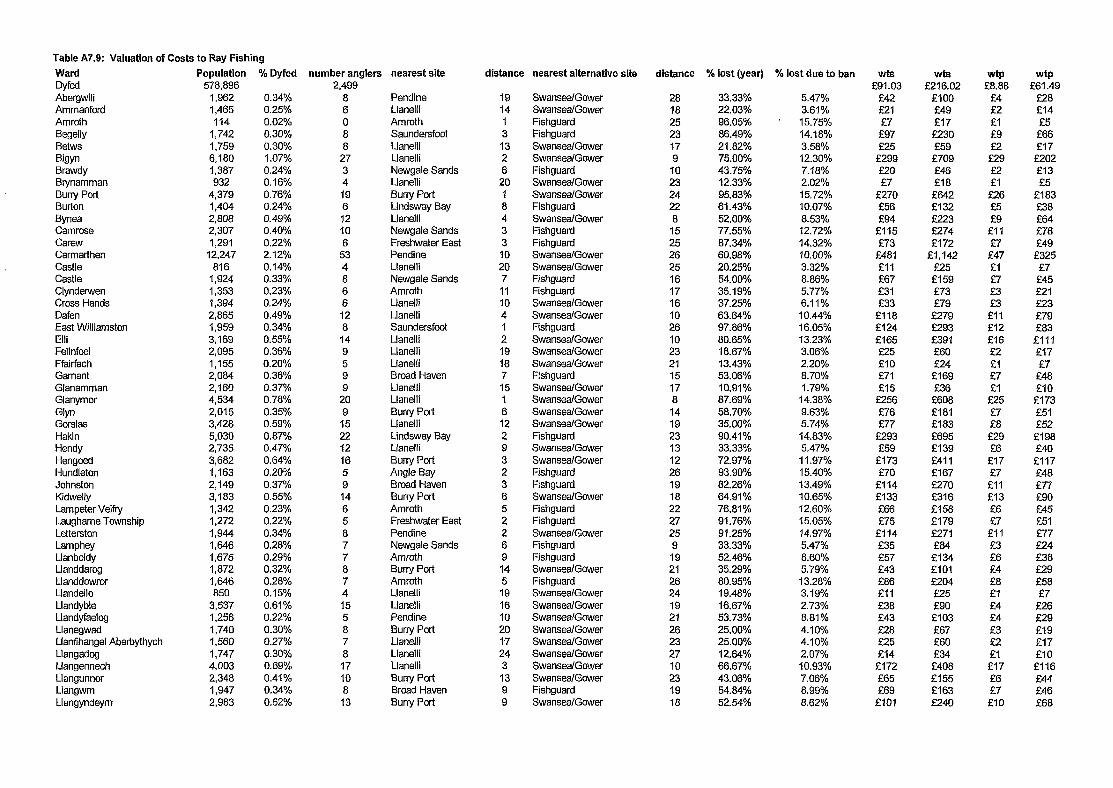
Table A7.9: Valuation of Costs to Ray Fishing
Ward oyfd Abergwili Ammanford Amroth Begelly Betws Bigyn Brawdy Brynamman Buny Port Burton Bynea Camrose Carew Carmarthen Castle Castle Clynderwen Cross Hands Dafen East Williamston Elli Felinfcel Ffairfach Gamant Glanamman Glanymor Glyn Gorslas Hakin Hendy
Population 578,896
1,962 1,465 114
1,742 1,759 6,180 1,387 932
4,379 1,404 2,808 2,307 1,291
12,247 816
1,924 1,353 1,394 2,865 1,959 3,169 2,095 1,155 2,084 2,160 4,534 2,015 3,428 5,030 2,735 3,682 1,163 2,149 3,183 1,342 1,272 1,944 1,646 1,675 1,872 1,646 850
3,537 1,256 1,740 1,560 1,747 4,003 2,348 1,947 2,983
% Dyfed
0.34% 0.25% 0.02% 0.30% 0.30% 1.07% 0.24% 0.16% 0.76% 0.24% 0.49% 0.40% 0.22% 2.12% 0.14% 0.33% 0.23% 0.24% 0.49% 0.34% 0.55% 0.36% 0.20% 0.38% 0.37% 0.78% 0.35% 0.59% 0.87% 0.4.70/o 0.64% 0.20% 0.37% 0.55% 0.23% 0.22% 0.34% 0.28% 0.29% 0.32% 0.28% 0 15% 0:61% 0.22% 0.30% 0.27% 0.30% 0.69% 0.41% 0.34% 0.52%
Hengoed Hundleton Johnston Kidwelly Lampeter Velfry Laughame Township Letterston Lamphey Llanboidy Llanddarq Llanddowror Llandeilo Llandybie Llandyfaelog Llanegwad Llanfihangel Aberbythych Llangadog Llangennech Llangunnor Llangwm Llangyndeym
number anglers nearest site 2,499
8 6 0 8 8
27 3 4 19 6 12 10 6
53 4 8 6 6 12 8 14 9 5 9 9
20 9
15 22 12 16 5 9 14 6 5 8 7 7 8 7 4 15 5 8 7 8 17 10 8
13
Pendine Llaneili Amroth Saundersfoot Llanelli Llanelli Newgale Sands Llanelli Buny Poti Lindsway Bay Llanelli Newgale Sands Freshwater East Pendine Llanelli Newgale Sands Amroth Llanelli Llanelli Saundersfoot Llanelli Llanelli Llanelli Broad Haven Llanelli Llanelli Burry Port Llanelli Lindsway Bay Llanelli Buny Port Angle Bay Broad Haven Burry Port Amroth Freshwater East Pendine Newgale Sands Amroth Buny Port Amroth Llanelli Llanelli Pendine Burry Port Llanelli Llanelli Llanelli Buny Port Broad Haven Burty Port
distance nearest alternative site distance % lost (year)
19 14 1 3
13 2 6 20 1 8 4 3 3 10 20 7 11 10 4 1 2 19 18 7 15 1 6 12 2 9 3 2 3 6 5 2 2 6 9 14 5 19 16 10 20 ?7 24 3
13 9 9
SwansealGower Swansea/Gower Fishguard Fishguard SwansealGower Swansea/Gower Fishguard SwansealGower SwansealGower Fishguard Swansea/Gower Fishguard Fishguard Swansea/Gower SwansealGower Fishguard Fishguard SwansealGower SwanseaIGower Fishguard SwansealGower SwansealGower SwansealGower Fishguard SwanseafGower Swansea/Gower Swansea/Gower Swansea/Gower Fishguard SwanseaIGower Swansea/Gower Fishguard Fishguard SwanseaIGower Fishguard Fishguard SwanseaIGower Fishguard Fishguard SwansealGower Fishguard SwansealGower SwansealGower SwanseajGower SwanseaIGower Swansea/Gower Swansea/Gower Swansea!Gower SwanseafGower Fishguard SwansealGower
28 33.33% 18 22.03% 25 96.05% 23 86.49% 17 21.82% 9 75.00% 10 43.75% 23 12.33% 24 95.83% 22 61.43% 8 52.00% 15 77.55% 25 87.34% 26 60.98% 25 20.25% 16 54.00% 17 35.19% 16 37.25% 10 63.64% 26 97.86% 10 80.65% 23 18.67% 21 13.43% 15 53.06% 17 10.91% 8 87.69% 14 58.70% 19 35.00% 23 90.41% 13 33.33% 12 72.97% 26 93.90% 19 82.26% 18 64.91% 22 76.81% 27 91.76% 25 91.25% 9 33.33% 19 52.46% 21 35.29% 26 80.95% 24 19.48% 19 16.67% 21 53.73% 26 25.00% 23 25.00% 27 12.64% 10 66.67% 23 43.06% 19 54.84% 18 52.54%
% lost due to ban
5.47% 3.61%
15.75% 14.18% 3.58% 12.30% 7.18% 2.02% 15.72% 10.07% 8.53%
12.72% 14.32% 10.00% 3.32% 8.86% 5.77% 6.11% 10.44% 16.05% 13.23% 3.06% 2.20% 8.70% 1.79%
14.38% 9.63% 5.74% 14.83% 5.47%
11.97% 15.40% 13.49% 10.65% 12.60% 15.05% 14.97% 5.47% 8.60% 5.79% 13.28% 3.19% 2.73% 8.81% 4.10% 4.10% 2.07% 10.93% 7.06% 8.99% 8.62%
WtS
f91.03 E42 f2.1 f7
E97 f25
f299 f20 f7
f270 E56 !z94
f115 f73
f481 El1 f67 f31 f33
f118 f124 f165 u5 El0 f71 f15
E256 f76 E.77
f293 f59
f173 f70
f114 f133 f66 f75
f114 f35 f57 f43 f86 fll f3a f43 a28 a5 f14 f172 f65 f69
flO1
WtS
f216.02 flO0 f49 f17 a30 f59 f709 f46 f18 f642 f132
f274 f172
f1.142 f25 f159 f73 f79
f279 f293 f391 f60 f24
f169 f36
f608 f181 f183
El39 f411 f167 f270 f316 f158 f179 z?71 f84 f134 flO1
f25 f90 f103 f67 f60 f34 f408 fl55 f163 f240
WtP WtP f8.88 f61.49
f4 f28 f2 f14 fl f5 f9 f66 f2 f17
f29 f202 f2 f13 fl f5
f26 f183 f5 f38 f9 f64 fll f78 f7 f49 f47 f325 fl f7 f7 f45 f3 f21 f3 f23 El1 f79 f12 f83 f16 flll f2 f17 fl f7 f7 f48 El f10 f25 f173 f7 f51 f8 f52 f29 f198 f6 f40 El7 f117 f7 f48 fll f77 f13 f90 f6 f45 f7 f51 El1 f77 f3 f24 f6 f38 f4 f29 fa f58 fl f7 f4 f26 f4 f29 f3 f19 f2 f17 fl f10 f17 f116 f6 f44 f7 f46 f10 f68
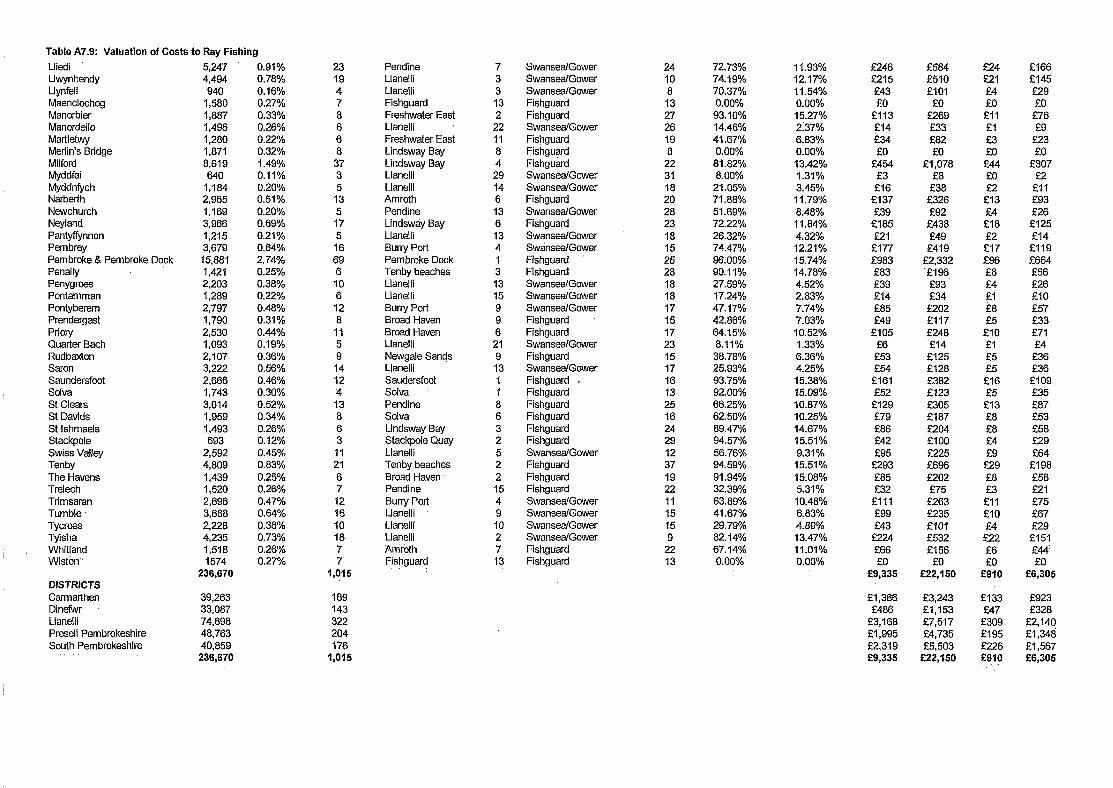
Table A7.9: Valuation of Costs to Ray Fishing
Lliedi Llwynhendy Llynfell Maenclochog Manorbier Manordeilo Martletwy Merlin’s Bridge Milford Myddfai Myddnfych Narberth Newchurch Neyland Pantyffynnon Pembrey Pembroke 8 Pembroke Dock Penally Penygrces Pontamman Pontyberem Prendergast Priory Quarter Bach Rudbaxton Saron Saundersfcot Solva St Clears St Davids St lshmaels Stackpole Swis's Valley Tenby The Havens Trelech Trimsaran Tumble Tycroes Tyisha Whitland Wiston
DISTRICTS Carmarthen Dinefwr Llanelli Preseli Pembrokeshire South Pembrokeshire
,.
5,247 4,494
940 1,580
1,887 1,496 1,280 1,871 8,619
640 1,184 2,965
1,169 3,966
1,215 3,679
15,881 1,421 2,203 1,289 2,797 1,790 2,530 1,093 2,107 3,222
2,666 1,743
3,014 1,959
1,493 693
2,592 4,809
1,439 1,520 2,696 3,688 2,228 4,235 1,518 1574
236,670
39,263 33,087 74,698 48,763 40,859
236,670
0.91% 0.78% 0.16% 0.27% 0.33% 0.26% 0.22% 0.32% 1.49% 0.11% 0.20% 0.51% 0.20% 0.69%
0.21% 0.64% 2.74% 0.25% 0.38% 0.22% 0.48% 0.31% 0.44% 0.19% 0.36% 0.56% 0.46% 0.30% 0.52% 0.34% 0.26% 0.12% 0.45% 0.83% 0.25% 0.26% 0.47% 0.64% 0.38% 0.73% 0.26% 0.27%
23 19
4 7 8 6 6 8
37 3 5
13 5
17 5
16 69 6 10 6
12 8
11
Pendine Llanelli Llanelli Fishguard Freshwater East Llanelli Freshwater East Llndsway Bay Lindsway Bay Llanelli Llanelli Amroth Pendine Lindsway Bay Llanelli Buny Port Pembroke Dock Tenbybeaches Llanelli Llanelli Buny Port Broad Haven Broad Haven Llanelli Newgale Sands Llanelli Saudersfoot Sdva Pendine Solva Lindsway Bay Stackpole Quay Llanelli Tenby beaches Broad Haven Pendine Burry Port Llanelli Llanelli Llanelli Amroth Fishguard
” :
7 3 3
13 2
22 11 8 4
29
14 6
13 6
13 4
SwansealGower 24 Swansea/Gower 10
72.73% 74.19%
70.37% 0.00%
93.10% 14.46% 41.67% 0.00%
81.82% 8.00%
21.05% 71.88%
51.69% 72.22%
26.32% 74.47%
96.00% 90.11% 27.59% 17.24% 47.17% 42.86% 64.15% 8.11%
38.78% 25.93%
11.93% f246 f584 E24 12.17% f215 f510 f21
f166 f145 f29 f0
f76 f9
f23 f0
f307
8 13 27 26 19 8
22 31 18 20
28 23
18 15
25 28 18 18 17 15 17 23 15 17
16 13
25 16 24 29 12 37 19 22 11 15 15 9
22 13
11.54% 0.00%
15.27% 2.37%
6.83% 0.00%
f43 f0
f113 Cl4
f34 f0
f454 f3 f16
f137 f39
f185 f21,
f177 f983 f83 f39 f14 f85 f49
f105 f6
E53 f54
f161 f52 f129 f79 f86 f42
flO1 f0
f269 ‘f33 f82 f0
f1,078 f8
f38 f326
f4 f0
El1 fl f3 f0
f44 f0
fE f4
f18 f2
El7 f96 f8 f4 fl f8 f5
f10 fl’ f5 f5
El6 f5 f13 f8 f8 f4 f9
f29 f8 f3
fll fl0 f4
E22 f6 f0
f910
Fishguard Fishguard
Fishguard Fishguard Fishguard 13.42%
1.31% 3.45%
11.79% 8.48%
11.84% 4.32%
12.21%
15.74% 14.78% 4.52% 2.83% 7.74% 7.03%
10.52% 1.33% 6.36% 4.25%
f2 El1 SwansealGower
Fishguard SwanseafGower Fishguard Swansea/Gower SwanseaIGower Fishguard Fishguard SwansealGower SwansealGower SwansealGower Fishguard Fishguard
f93 E26
f125 f14
fll9 f664 E56 f26 fl0 f57 f33 f71 f4
f36 f36
f109 f35 f87 f53 f58 f29 f64
f198
f92 f438 f49
f419 f2,332 ‘f196
f93’ f34
f202 El17 f248 f14
f125 f128 f382 f123 f305 f187 f204 flO0
f225 f696 f?02 f75
E263 f235 flO1 f532 El56
f0 E22,150
f3,243 f1,153 f7,517 f4,735 f5,503
f22,150
3 13 15 9 9 6
21 9
13
5
9 Fishguard SwansealGower Fishguard , Fishguard Fishguard Fishguard Fishguard Fishguard Swansea/Gower Fishguard Fishguard Fishguard
14 12 4 13 8 6 3
11 21 6 7
12 16
93.75% 15.38% 92.00% 15.09%
8 6 3 2 5 2 2
15 4 9
66.25% 62.50% 89.47% 94.57% 56.76% 94.59% 91.94%
10.87% 10.25% 14.67% 15.51% 9.31%
15.51% 15.08% 5.31%
10.48% 6.83% 4.89% 13.47% 11.01% 0.00%
f95 f293 f85 f32
flll f99 f43
f224 f66 f0
f9,335
f58 f21 f75 f67 f29
El51 f44 f0
f6,305
32.39% 63.89% 41.67%
10 18
10 2
29.79% 82.14% 67.14% 0.00%
Swansea/Gower Fishguard Fishguard
7 13 7
1,015
169 f1,366 143 f486
f133 w7 f309 f195 f226 es10
f923 f328
f2,140 f1,348 El,567 f 6,305
322 204 176
1,015
f3,168 f1,995 f2,319 f9,335
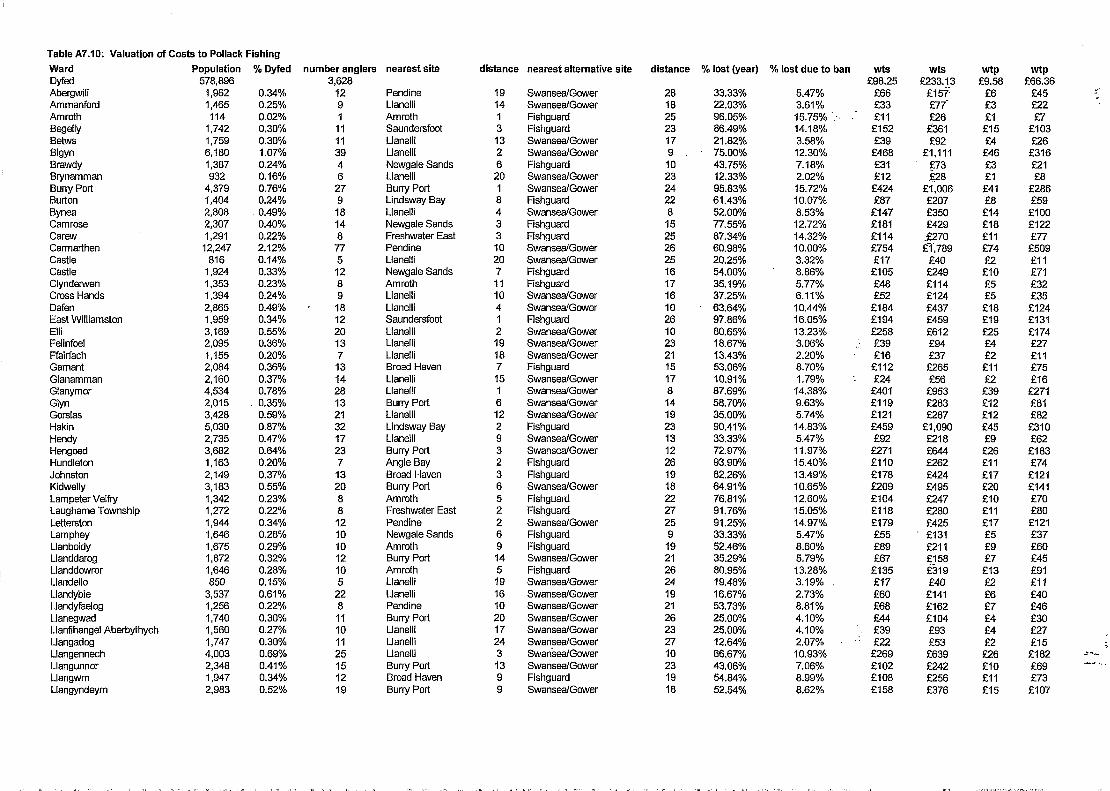
Table A7.10: Valuation of Costs to Pollack Fishing
Ward % Dyfed DYfed Aberowili
Amroth Begelly Betws Bigyn Brawdy Brynamman Buny Port Burton Bynea Camrose Carew Carmarthen Castle Castle Clynderwen Cross Hands Dafen East Williamston Elli Felinfoel Ffairfach Gamant Glanamman Glanymor Glyn Gorslas Hakin Hendy Hengoad Hundleton Johnston Kidwelly Lampeter Velfry Laughame Township Letterston Lamphey Llanboidy Llanddarog Llanddowror Llandeilo Llandybie Llandyfaelog Llanegwad Llanfihangel Aberbythych Llangadog Llangennech Llangunnor Llangwm Llangyndeym
Population 578,896
1,962 1,465 114
1,742 1,759 6,180 1,387 932
4,379 1,404 2,808 2,307 1,291
12,247 816
1,924 1,353 1,394 2,866 1,959 3,169 2,095 1,155 2,084 2,160 4,534 2,015 3,428 5,030 2,735 3,682 1,163 2,149 3,183 1,342 1,272 1,944 1,646 1,675 1,872 1,646 850
3,537 1,256 1,740 1,560 1,747 4,003 2,348 1,947 2,983
0.34% 0.25% 0.02% 0.30% 0.30% 1.07% 0.24% 0.16% 0.76% 0.24% 0.49% 0.40% 0.22% 2.12% 0.14% 0.33% 0.23% 0.24% 0.49% 0.34% 0.55% 0.36% 0.20% 0.36% 0.37% 0.78% 0.35% 0.59% 0.87% 0.47%
0.20% 0.37% 0.55% 0.23% 0.22% 0.34% 0.28% 0.29% 0.32% 0.28% 0.15% 0.61% 0.22% 0.30% 0.27% 0.30% 0.69% 0.41% 0.34% 0.52%
number anglers nearest site 3,628
12 9 1
11 11 39 4 6 27 9 18 14 8
77 5 12 8 9 18 12 20 13 7 13 14 28 13 21 32 17 23 7 13 20 8 8
12 10 10 12 10 5 22 8
11 10 11 25 15 12 19
Pendine Llanelli Amroth Saundersfcot Llanelli Llanelli Newgale Sands Llanelli Burry Port Lindsway Bay Llanelli Newgale Sands Freshwater East Pendine Llanelli Newgale Sands Amroth Llanelli Llanelli Saundersfoot Llanelli Llanelli Llanelli Broad Haven Llanelli Llanelli Buny Port Llanelli Lindsway Bay Llanelli Buny Port Angle Bay Broad Haven Burly Port Amroth Freshwater East Pendine Newgale Sands Amroth Burry Port Amroth Llanelli Llanelli Pendine Burry Port Llanelli Llanelli Llanelli Buny Port Broad Haven Burry Port
distance nearest alternative site distance % lost (year)
19 14 1 3 13 2 6
20 1 8 4 3 3 10 20 7 11 10 4 1 2 19 18 7 15 1 6 12 2 9 3 2 3 6 5 2 2 6 9 14 5 19 16 10 20 17 24 3 13 9 9
Swansea/Gower Swansea/Gower Fishguard Fishguard SwansealGower Swansea/Gower Fishguard SwansealGower SwansealGower Fishguard SwanseafGower Fishguard Fishguard SwanseaIGower SwansealGower Fishguard Fishguard Swansea/Gower Swansea/Gower Fishguard SwansealGower Swansea!Gower Swansea/Gower Fishguard SwanseaIGower Swansea/Gower SwansealGower Swansea/Gower Fishguard SwansealGower SwansealGower Fishguard Fishguard SwansealGower Fishguard Fishguard SwansealGower Fishguard Fishguard SwansealGower Fishguard Swansea/Gower Swansea/Gower SwansezlGower SwansealGower SwanseafGower SwanseaIGower Swan’sealGower SwansealGower Fishguard Swansea/Gower
28 18 25 23 17 9
10 23 24 22 8
15 25 26 25 16 17 16 10 26 10 23 21 15 17 8 14 19 23 13 12 26 19 18 22 27 25 9
19 21 26 24 19 21 26 23 27 10 23 19 18
33.33% 22.03% 96.05% 86.49% 21.82% 75.00% 43.75% 12.33% 95.83% 61.43% 52.00% 77.55% 87.34% 60.98% 20.25% 54.00% 35.19% 37.25% 63.64% 97.86% 80.65% 18.67% 13.43% 53.06% 10.91% 87.69% 58.70% 35.00% 90.41% 33.33% 72.97% 93.90% 82.26% 64.91% 78.81% 91.76% 91.25% 33.33% 52.46% 35.29% 80.95% 19.48% 16.67% 53.73% 25.00% 25.00% 12.64% 66.67% 43.06% 54.84% 52.54%
% lost due to ban WtS
5.47% 3.61% 15.75% 14.18% 3.58% 12.30% 7.18% 2.02% 15.72% 10.07% 8.53%
12.72% 14.32% 10.00% 3.32% 8.86% 5.77% 6.11% 10.44% 16.05% 13.23% 3.06% 2.20% 8.70% 1.79%
.f4.38% 9.63% 5.74%
14.83% 5.47% 11.97% 15.40% 13.49% 10.65% 12.60% 15.05% 14.97% 5.47% 8.60% 5.79% 13.28% 3.19% 2.73% 8.81% 4.10% 4.10% 2.07% 10.93% 7.06% 8.99% 8.62%
f98.25 f66 f33 fll
El52 f39
f468 f31 f12
f424 E87
f147 El81 f114 f754 f17
f105 f48 f52
f184 f194 f258
,i f39 f16
f112 : a4
f401 f119 f121 f459 f92
f271 fll0 f178 f209 El04 f118 f179 f55 f89 f67
f135 f17 f60 f68 f44 f39
,: f22 f269 El02 f108 f158
wts 2233.13
fl57 f77’ f26 f361 f92
fl,lll
fj73 .28
El,006
f350 f429 .g70 f1,789
f40
f114 f124 f437 f459 f612 f94 f37
f265 f56
f953 E283 2287
fl,090 f218 f64t 2262 f424 f495 f247 f280 f425 f131 f211 $?58 f319 f40
f141 f162 f104 f93 f53
f639 f242
f376
wtp f9.58
f6 f3 fl El5 f4 f46 f3 fl f41 f8
f14 f18 fll f74 f2
f10 f5 f5
f18 f19 f25 f4 f2
fll f2
f39 f12 El2 f45 f9
f26 fll f17 f20 El0 El1 El7 f5 f9 f7
f13 f2 f6 f7 f4 f4 f2
!Z6 f10 El1 f15
wtp f66.36
f45 f22 f7
El03 f26
f316 f21 f8
f286 f59 El00 f122 f77 f509 fll f71 f32 f35 El24 f131 El 74 f27 fll f75 f16
f271 f81 f82 f310 f62 f183 f74 f121 f141 f70 f80 f121 f37 f60 f45 f91 fll f40 f46 f30 f27 El5 $2182 Z-F ’ f69 -&’ ,.. f73 f107
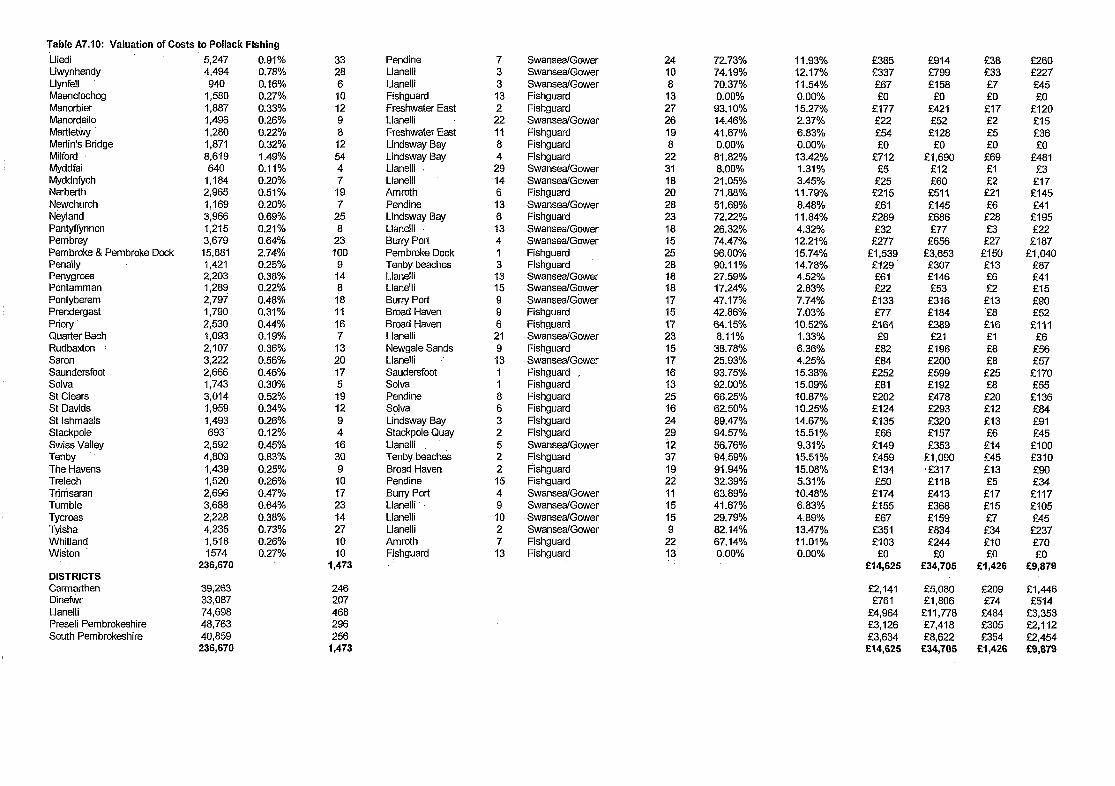
Table A7.10: Valuation of Costs to Poiiack Fishing
Liiedi Llwynhendy Llynfeli Maenclochog Manorbier Manordeiio Martletwy Merlin’s Bridge Milford Myddfai Myddnfych Narberth Newchurch Neyland PantyKynnon Pembrey Pembroke & Pembroke Dock Penally Penygroes Pontamman Pontyberem Prendergast Priory Quarter Bach Rudbaxton Saron Saundersfoot Solva St Clears St Davids St lshmaels Stackpole Swiss Valley Tenby The Havens Trelech Trimsaran Tumble Tycroes Tyisha Whitland Wiston
5,247 4,494
940 1,580 1,887 1,496 1,280 1,871 8,619 640
1,184 2,965 1,169 3,966 1,215 3,679 15,881 1,421 2,203 I ,289 2,797: 1,790 2,530 1,093 2,107 3,222 2,666 1,743 3,014 1,959 1,493 693
2,592 4,809 1,439 1,520 2,696 3,688 2,228 4,235 1,518 1574
236,670
0.91% 0.78% 0.16% 0.27% 0.33% 0.26% 0.22% 0.32% 1.49% 0.11% 0.20% 0.51% 0.20% 0.69% 0.21% 0.64% 2.74% 0.25% 0.38% 0.22% 0.48% 0.31% 0.44% 0.19% 0.36% 0.56% 0.46% 0.30% 0.52% 0.34% 0.26% 0.12% 0.45% 0.83% 0.25% 0.26% 0.47% 0.64% 0.38% 0.73% 0.26% 0.27%
DISTRICTS Carmarthen Dinetwr Llanelli Preseli Pembrokeshire South Pembrokeshire
33 28 6 10 12 9 a 12 54 4
SwansealGower SwansealGower SwansedGower Fishguard Fishguard SwansealGower Fishguard Fishguard Fishguard
19 7
25 a
23 100
9 14 8 18 11 16 7 13 20 17 5 19 12 9 4 16 30 9 10 17 23 14 27 10 10
1,473
Pendine Llanelli Llaneili Fishguard Freshwater East Llanelli Freshwater East Lindsway Bay Lindsway Bay Llanelli Llanelii Amroth Pendine Lindsway Bay Llanelli Buny Port Pembroke Dock Tenby beaches Llanelli Llanelll Bun-y Port Broad Haven Broad Haven Llanelii Newgaie Sands Llanelli Saudersfoot Solva Pendine Sdva Lindsway Bay Stackpde Quay Llanelli Tenby beaches Broad Haven Pendine Burr-y Port Llanelli Llanelli Llanelli Amroth Fishguard
7 3 3 13 2 22 11 8 4 29 14 6 13 6 13 4
SwanseaiGower Fishguard Swansea/Gower Fishguard Swansea/Gower
3 13 15 9 9 6 21 9 13
8 6 3 2 5 2 2 15 4 9 IO 2
Fishguard Fishguard SwansealGower Swansea/Gower SwansealGower Fishguard Fishguard Swansea/Gower Fishguard SwansealGower Fishguard . Fishguard Fishguard Fishguard Fishguard Fishguard SwansealGower Fishguard Fishguard Fishauard
13
Swansea/Gower SwansealGower SwansealGower Fishguard Fishguard
24 72.73% 11.93% 10 74.19% 12.17% 8 70.37% 11.54%
13 0.00% 0.00% 27 93.10% 15.27% 26 14.46% 2.37% 19 41.67% 6.83% 8 0.00% 0.00%
22 81.82% 13.42% 31 8.00% 1.31% ia 21.05% 3.45% 20 71 .aa% 11.79% 28 51.69% 8.48% 23 72.22% 11.84% ia 26.32% 4.32% 15 74.47% 12.21% 25 96.00% 15.74% 28 90.11% 14.78% 18 27.59% 4.52% 18 17.24% 2.83% 17 47.17% 7.74% 15 42.86% 7.03% 17 64.15% 10.52% 23 8.11% 1.33% 15 38.78% 6.36% 17 25.93% 4.25% 16 93.75% 15.38% 13 92.00% 15.09% 25 66.25% 10.87% 16 62.50% 10.25% 24 89.47% 14.67% 29 94.57% 15.51% i2 56.76% 9.31% 37 94.59% 15.51% 19 91.94% 15.08% 22 32.39% 5.31% 11 63.89% 10.48% 15 41.67% 6.83% 15 29.79% 4.89% 9 82.14% 13.47%
22 67.14% 11.01% 13 0.00% 0.00%
f385 f914 f38 f260 f337 f799 f33 f227 ‘f67 fi58 f7 f45 f0 f0 eo f0
f177 f421 El7 f120 f22 f52 f2 f15 f54 f128 f5 f36 f0 f0 f0 f0
f712 El,690 f69 f4ai f5 f12 fl f3
f25 f60 f2 f17 f215 f511 f21 f145 f61 f145 f6 f41
f289 f686 f28 f195 f32 f77 f3 f22
f277 f656 f27 fia7 f1,539 f3,653 f150 f1,040 f12q f307 f13 fa7 f61 f146 f6 f41 f22 f53 f2 f15
El33 f316 f13 f90 f77 f184 'f8 f52
f164 f389 El6 El11 f9 f21 fl f6
f82 f196 f8 f56 f84 f200 f8 f57
f252 f599 f25 f170 f81 f192 f8 f55 f202 f47a f20 fl36 El24 f293 f12 fa4 f135 f320 f13 f91 f66 f157 f6 f45
f149 f353 f14 flO0 f459 f 1,090 f45 f310 El34 ,f317 f13 f90 f50 f118 f5 f34
f174 f413 f17 f117 f155 f368 f15 f105 f67 f159 f7 f45 f351 f834 f34 f237 f103 f244 f10 f70
f0 f0 f0 f0 f 14,625 f34,705 El,426 f9,879
39,263 246 f2,141 f5.080 f209 f1,446 33,087 207 f761' f1,806 f74 f514 74,698 468 f4.964 fii,778 f4a4 f3,353 48,763 296 f3,126 f7,4ia f305 f2,112 40,859 256 f3,634 f8,622 f354 f2,454 236,670 1,473 E14,625 f34,705 Et,426 f9,879
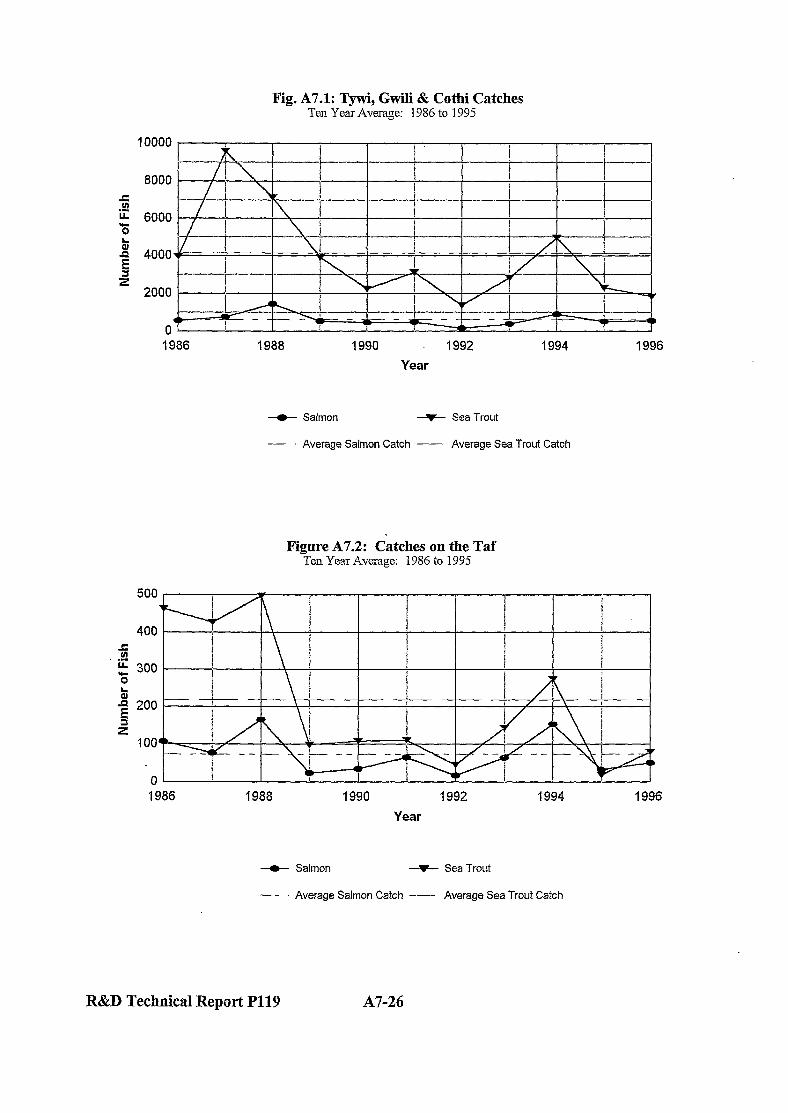
Fig. A7.1: Tywi, Gwili & Cothi Catches Ten Year Average: 1986 to 1995
1986 1988 1990 1992 1994 1996
Year
-0- Salmon --F Sea Trout
- Average Salmon Catch - Average Sea Trout Catch
Figure A7.2: Catches on the Taf Ten Year Average: 1986 to 1995
500 r
1986 1988 1990 1992 1994 1996
Year
-0- Salmon --F Sea Trout
- Average Salmon Catch - Average Sea Trout Catch
R&D Technical Report P119 A7-26

FigumA7.3: Catches on.E & W Cleddau ..: Ten Year Average: 1986 to 1995
iz 1500 % 5 $ 1000 3 500
1986 1988 1990 1992 :. 1994 1996
Year
e Salmon + Sea Trout
- Average Salmon Catch - Average Sea Trout Catch
Figure A7.4: GwendraethsCatches .. Ten Year Average: 1986 to 1995
800 I I ! 1
I 1 i
1986 1988 1990
Year
1992 1994 1996
e Sea Trout - Average Sea Trout Catch
R&D Technical Report Pl19 A’7-27
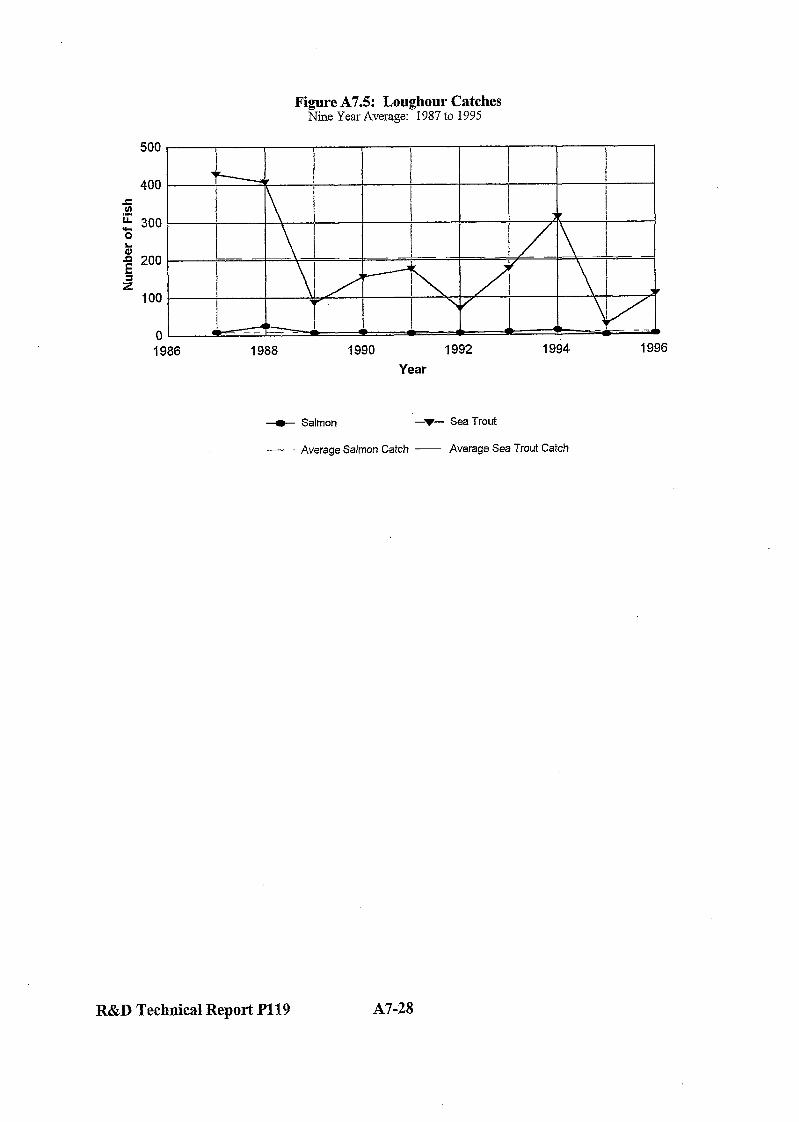
Figure A7.5: Loughour Catches Nine Year Average: 1987 to 1995
500
400
5 L' 300 B 5 2 200
3 100
0 1986 1988 1992 1994 1996
Year
-0- Salmon ‘-i- Sea Trout
- Average Salmon Catch - Average Sea Trout Catch
R&D Technical Report PI19 A7-28
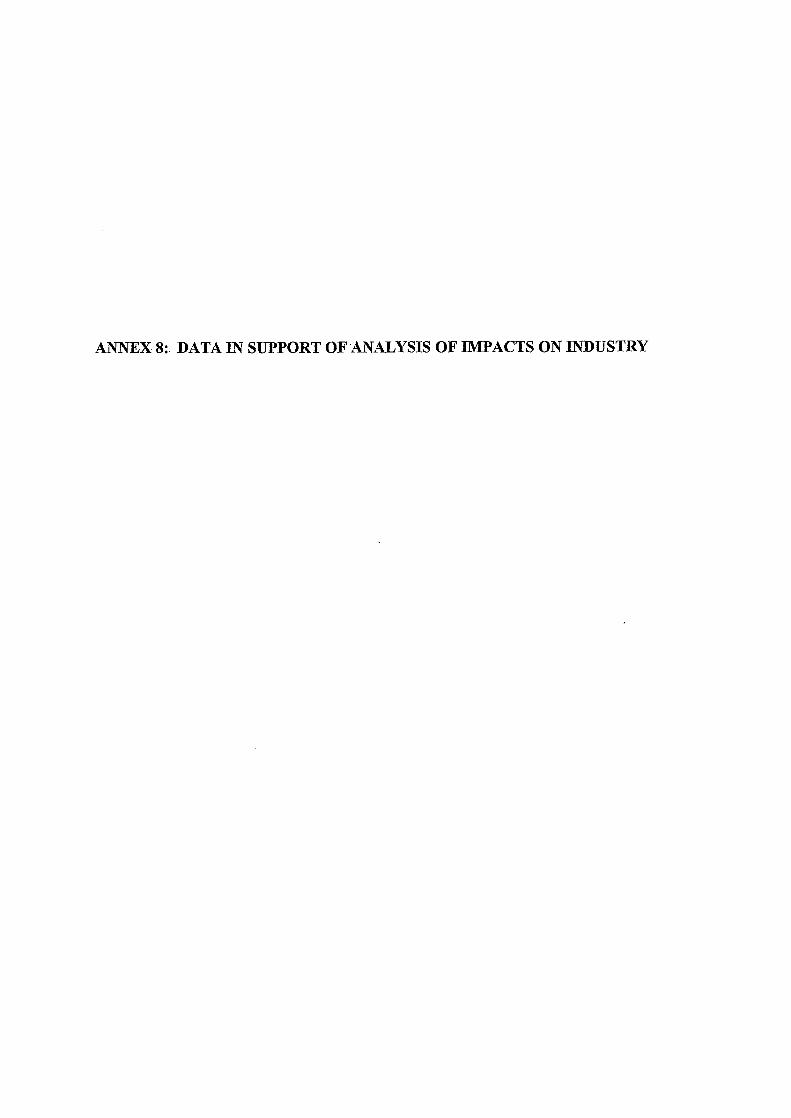
ANNEX 8:. DATA IN SUPPORT OF.ANALYSIS OF IMPACTS ON INDUSTRY
There are no additional data to support the analysis of impacts on local industry.
R&D Technical RepoH P119 ‘. a AS-3

R&D Technical Report P119 AS-4
ANNEX 9: DATA IN SUPPORT OF ANALYSIS OF CONSERVATION EFFECTS
Annex 9 Contents:
Table -A9.1. Costs of Replacing Species Stranded After Sea Enpess Incident Table A92 Non-Use Values
R&D Technical Report P119 1.. A9;3

R&D Technical Report P119 A9-4
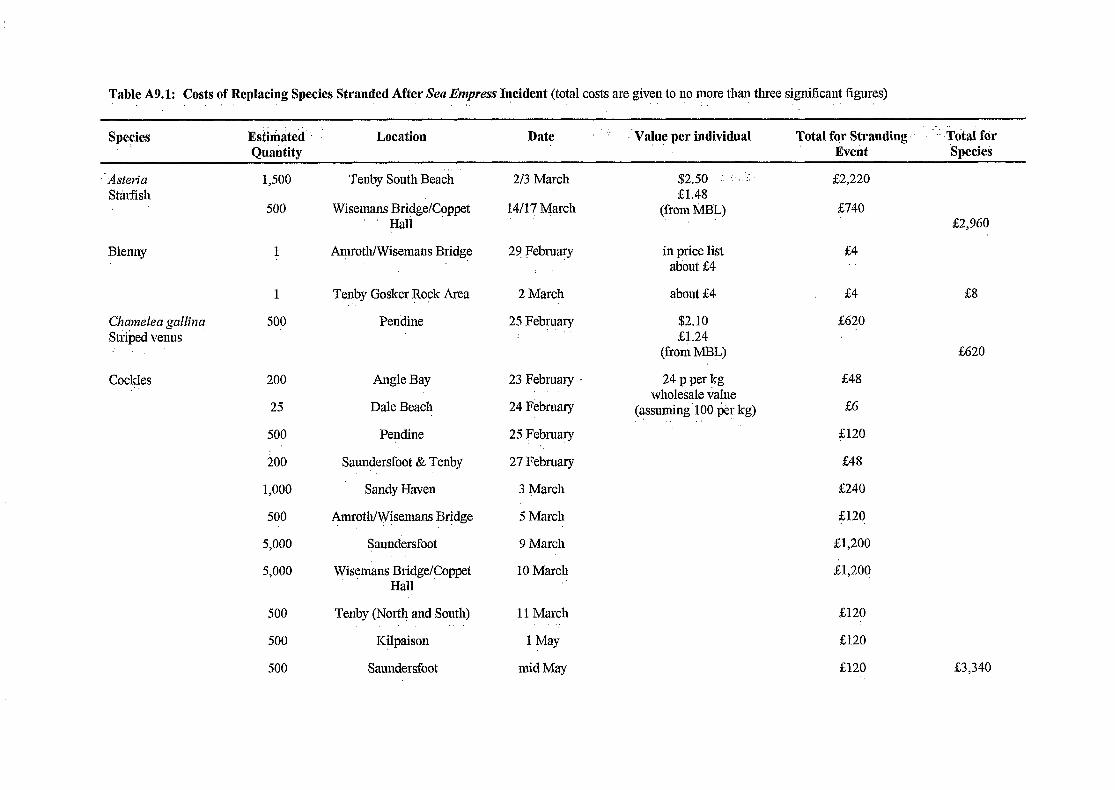
Table A9.1: Costs of Keplacing Species Stranded After Sea Empress Incident (total costs are given to no more than three significant figures)
Species E&tinted I Quantity
Location Date I -l’Value per individual Total fqr Stranding “’ ,T&I fcir Event ‘Species
Asteria St&tish
1,500
500
Blenny
Charnelen gallina Stiibed Venus
Cockles
1
1
500
200
25
500
100
1,000
500
5,000
5,000
500
500
500
Tenby South Beach
Wisemans BridgeKoppet Hali
+roth/Wisemans Bridge
Tenby Gosker Rock Area
Pen’&ne
Angle Bay
Dale Beach
Pendine
Saundersfoot & Tenby
Sandy Haven
Amrotl~Wisemans Bridge
Saundersfoot
Wisqmans Bridge/Coppet Hall
Tenby (North and South)
Kilpaison
Saundersfoot.
2/3 March
14/17 March
29 February
2 March
25 February
23 February
24 February
25 February
27 February
3 March
5 March
9 March
10 March
11 March ‘,’
1 May
mid May
$2.50 ,‘.. ::‘ $1.48
(from MBL)
in price list about &4
&4
about f4 $4 &8
$2.10 &1..24
(from MBL)
24 p per kg wholesale dalue
(?ssmning’lOO l&l. kg)
$2,220
5740
&620
&48
&6
4120
&48
6240
Y&12q
&1,200
&1,200
52,960
&620
z&3,340
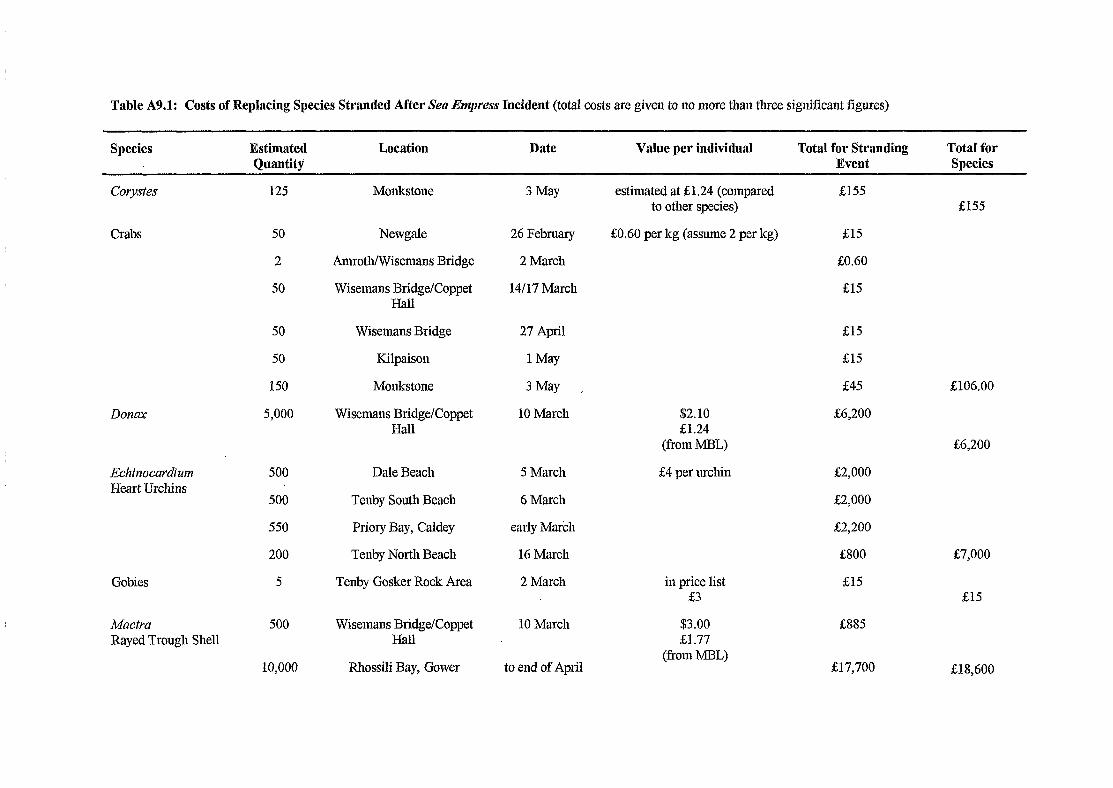
Table A9.1: Costs of Replacing Species Stranded After Sen Empress Incident (total costs are given to no more than three significant figures)
Species Estimated Quantity’
Location lhtc Value per individual Total for Stranding Event
Total for Species
Corysfes
Crabs
Donax
Echinocardiwn Heart Urchins
Gobies
Ma&a Rayed Trough Shell
125
50
2
50
50
50
150
5,000
500
500
550
200
5
500
10,000
Monkstone 3 May
Newgale
Amrotl~isemans Bridge
Wisemans Bridge/Coppet Hall
Wisemans Bridge
Kilpaison
Monkstone
Wisemans BridgeKoppet Hall
26 February
2 March
1407 March
27 April
1 May
3 May
10 March
Dale Beach
Tenby South Beach
Priory Bay, Caldey
Tenby North Beach
Tenby Goslcer Rock Area
5 March
6 March
early Mar&
16 March
2 March
Wisemans BridgeKoppet ‘Hall
10 March
Rhossili Bay, Gower to end of April
estimated at 51.24 (compared to other species)
go.60 per kg (asslmx 2 per kg)
&155 &155
$15
go.60
&15
$15
515
‘$45 5106.00
$2.10 61.24
(from MBL)
&6,200
56,200
&4 per urchin $2,000
f2,OOO
&2,200
BOO
in price list $3
&15
&7,OOO
515
$3.00 &I .77
(from MBL)
&885
07,700 $18,600
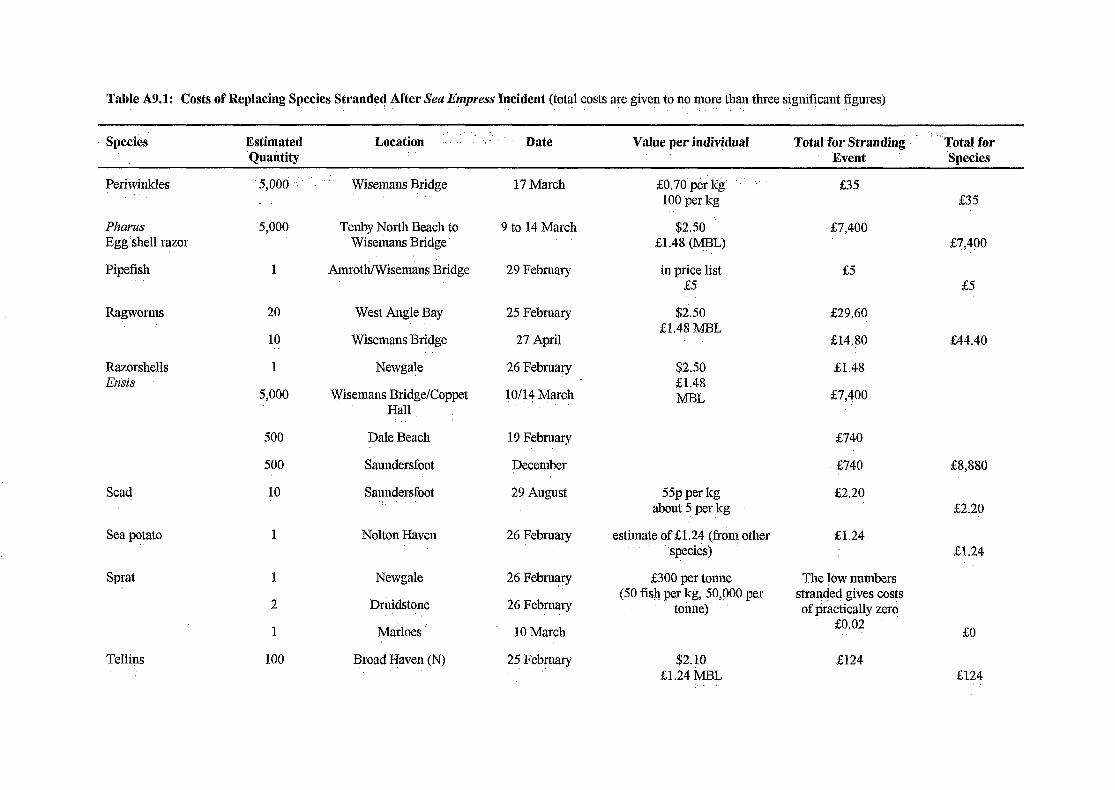
Table A9.1: Costs of Replacing Species Strander! After Sea Eczpress Incident (total costs are given to no more than three signifjcant figures) ” :..
Species Estimated ‘Quantity
Location .:‘. ., : Value per individual Total for Strandink I : :.:
Date Total for Event ‘Species
Scad
Sea potato
Sprat
Tellins
Periwinkles
Pharus Egg shell razor
Pipefish
Ragworms
Razorshells Ensis
5,dod ,:
5,000
1
20
10
1
5,000
500
500
10
1
1
2
I
100
Wisemans Bridge
Tenby North Beach to Wisemans Bridge
AmrothIWisemans Bridge
West Angle Bay
Wisemans Bridge .‘..
Newgale
Wisemans BridgeKoppet Hall
Dale Beach
Saundersfoot
Saundersfoot .,
Nolton Haven
Newgale
Druidstone .’
Marloes
Broad Haven (IV)
17 March
9 to 14 March
29 February
25 February
27 April
26 February
JO/14 March
19 February
December
29 August
26 February
26 February
26 February
10 March
25 February
;EO,70 p&l& ,’ :;
100 per kg
$2.50 &1.48 (MBL)
in price list &5
$2.50 61.4s MBL
$2.50 &L48 MBL
55p per kg about 5 ‘per kg
g740 L8,880
&2.20 $2.20
estimate of 61.24 (from other &1.24 species) ’ 51.24
&300 per toniie (50 fish per kg, 50,QOO per
tonlle)
$2.10 $1.24 MBL
&35 &35
&7,400 &7,4PO
&5 &5
g29.60
&14.go g44.40
51.48
&7,400
6740
The low numbers stranded gives costs of practically zero
go.02 50
2124 &I24
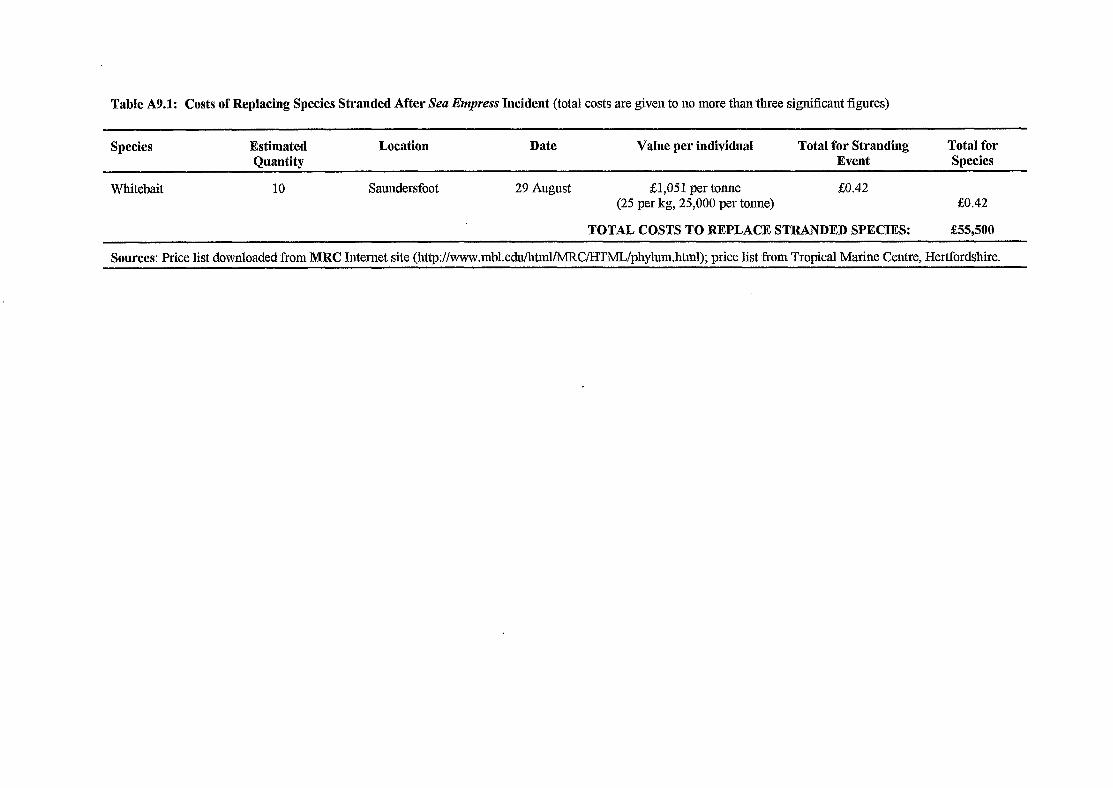
Table A9.1: Costs of Replacing Species Stranded After Sea Empress Incident (total costs are given to no more thaxthree significant figures)
Species
Whitebait
Estimated Quantity
10
Location Date
Saundersfoot 29 August
Value per individual
~9,051 per tonne (25 per kg, 25,000 per tonne)
Total for Stranding Event
go.42
Total for Species
go.42
TOTAL COSTS TO RJXPLACE STRANDED SPECIES: 335,500
Sources: Price list downloaded from MRC Internet site (http://www.mbl.edu/html/MRCkITML/phyl~~m.html); price list from Tropical Marine Centre, Hertfordshire.
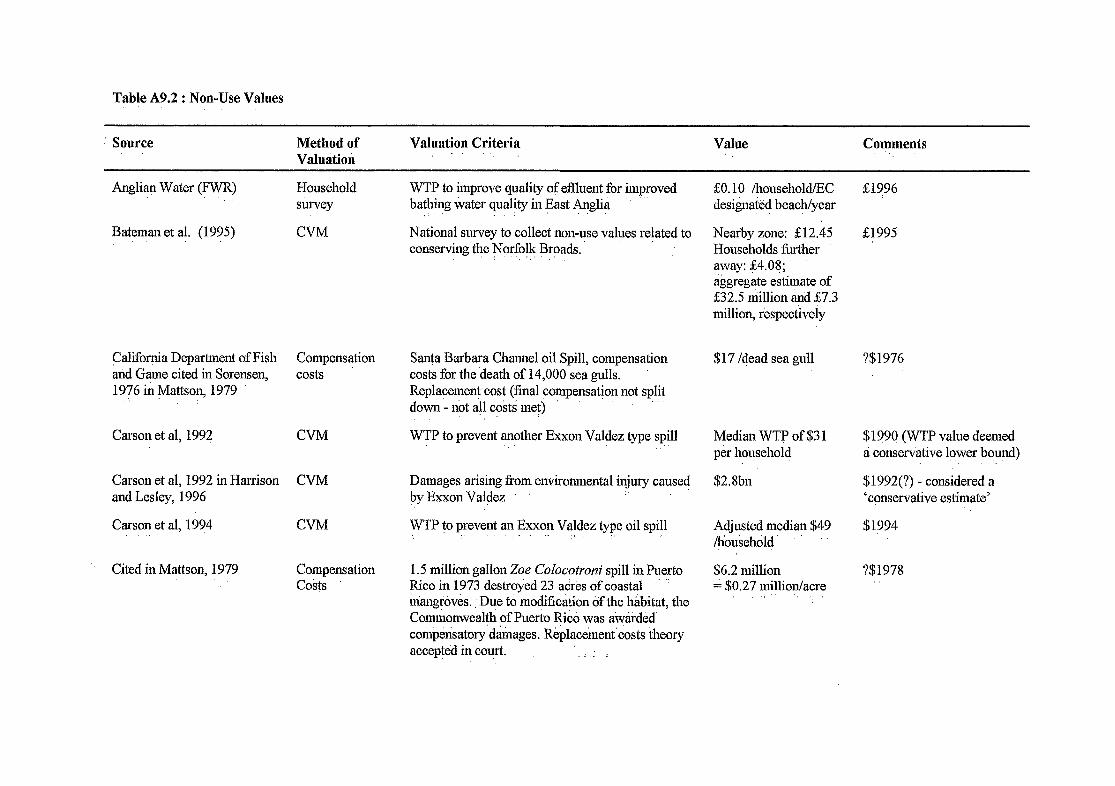
Table A9.2 : Non-Use Values
Source Method of Valuatiori
Valuation Criteria ” ‘. :
Valve Comments
Anglia? Water (FWR)
Bateman et al. (1995)
Household survey
CVM
California Deparhnent of Fish Compensation and Game cited in Sorensen, costs 1976 in Mattson, 1979 ”
Carson et al, 1992 CVM
Carson et al, 1992 in Harrison CVM and Lesley, 1996
Carson et al, 1994 CVM
Cited in Mattson, 1.979 Compensation costs
WTP to improve qualily of eflluent for improved bathing water quality in East Anglia
:
National sLtiey to collect non-use vahles related to conserving &e Norfolk Broads.. . ..“.
Santa Barbara Channel oil Spill, compensation costs for the death of 14,000 sea gulls. Replacemenf ‘cost (final compensation not split down - not a!1 co& met) ”
WTP to prevent another Exxon Valdez type spill
Damages arising from enviromnental injury caused by ExxonValdez .’
WTP to prevent an Exxon Valdez type oil spill ” ” :’
1.5 million gapon Zoe Colocotroni spill in Puerto Rico in 1973 destroyed 23 adres of coastal ” &angro&s. : Due to modification of the htibitat, the Commonwealth of PueGo R&b was atitided comperisatory d&ages. R&plac&nent’costs theory accepted in court. : : :
&O. 10 /household/EC designaibd beach/year
Nearby zone: $12.45 Households further ,’ away: g4.08; aggregate estimate of &32.5 million and $7.3 niiliioi~ respectively
$17 /dead sea gull ?$1976
Median WTp of $3 1 per household
$2.8bn
Adjusted median $49 /h&sehold
$6.2 million 4 $0.27 million/acre ‘. ‘.
51996
21995
$199q (WTP value deemed ti conservative lower bomid)
$1992(?) - considered i’ ‘conservative estimate’
$1994
‘?$1978
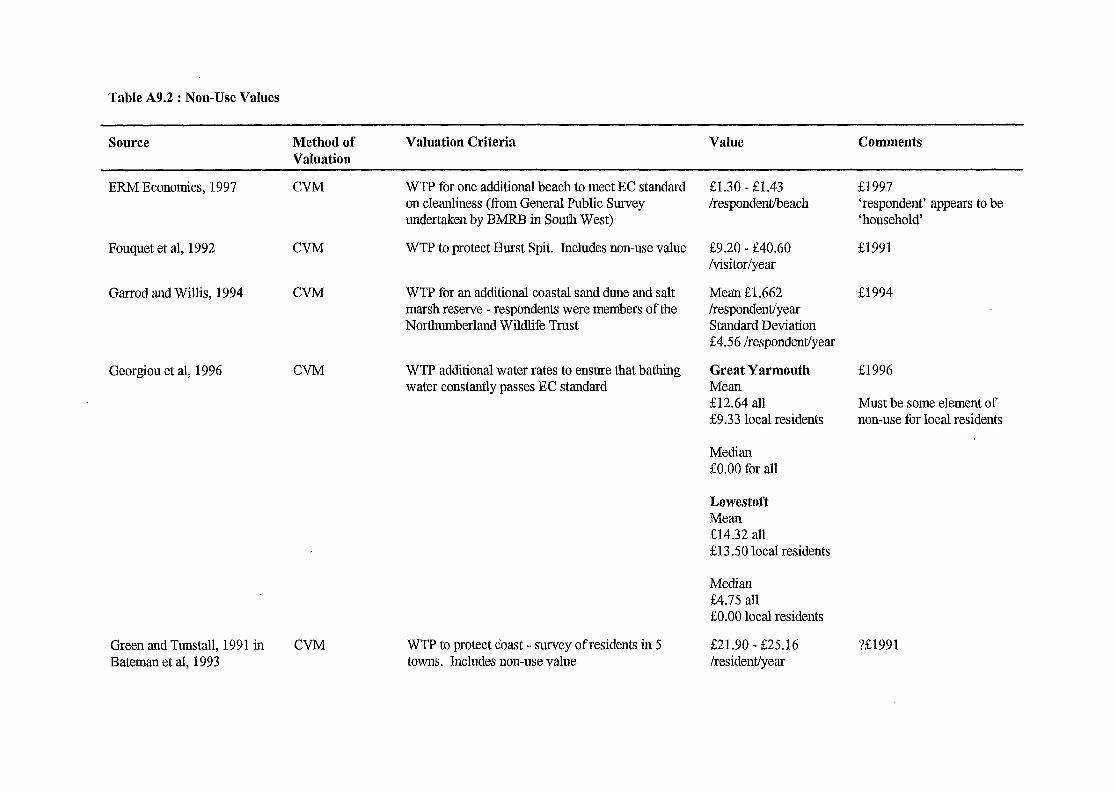
Table A9.2 : Non-Use Vslues
Source Method of Valuation
Valuation Criteria Value Comments
ERM Economics, 1997
Fouquet et al, 1992
Garrod and Willis, 1994
CVM
CVM
CVM
WTP for one additional beach to meet EC standard on cleanliness (from General Public Survey undertaken by BMRB in South West)
WTP to protect Hurst Spit. Inch~des non-use value
WTP for an additional coastal sand dune and salt marsh reserve - respondents were members of the Northumberland Wildltfe Tiust
Georgiou et al, 1996 CVM WTP additional water rates to ensure that bathing water constantly passes EC standard
Green and Tunstall, 1991 in CVM Bateman et al, 1993
WTP to protect c’oast - survey ofresidents in 5 221.90 - $25.16 towns. Includes non-use value /resident/year
21.30 - &I..43 /respondentieach
c&9.20 - ~40.60 /visitor/year
Mean 0.662 /respondent/year Standard Deviation 24.56 lrespondentlyear
Great Yarmouth Mean g12.64 all 29.33 local residents
Median go.00 for all
Lowestoft Mean U4.32 all g13.50 local residents
Median L4.75 all 20.00 local residents
$1997 ‘respondent’ appears to be ‘household
El991
El994
$1996
Must be some element of non-use for local residents
?&1991
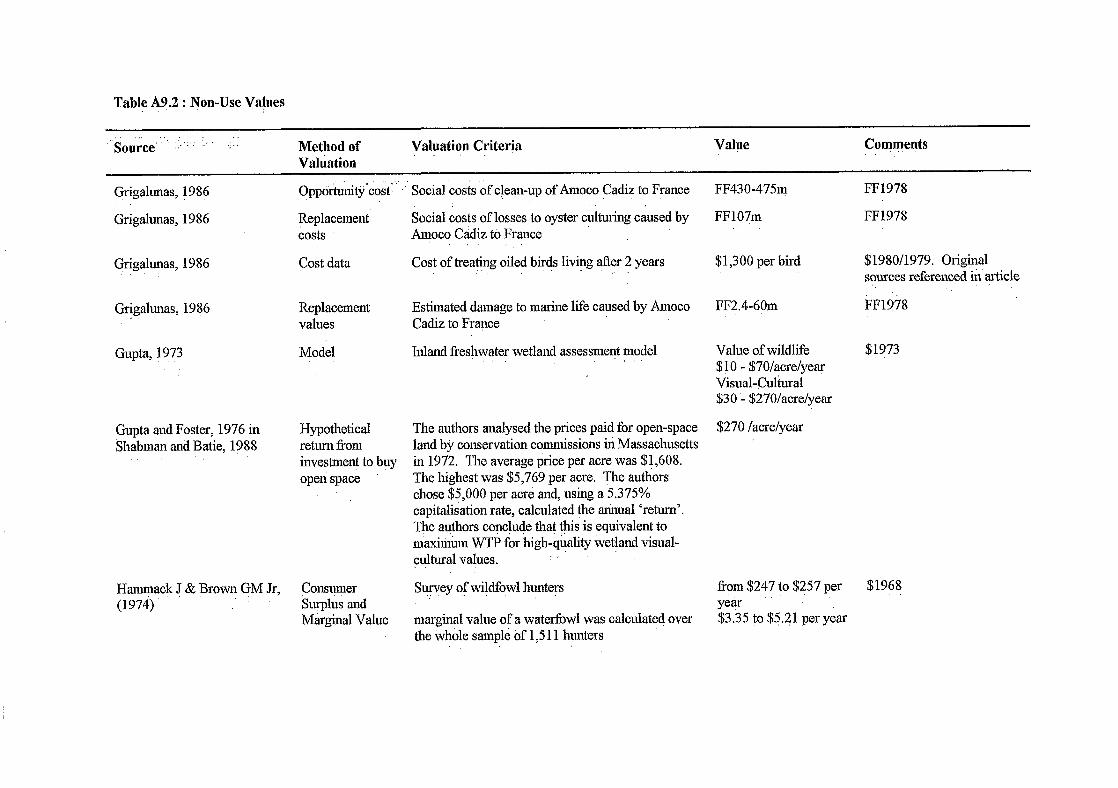
Table A9.2 : Non-Use Values
$o&e. ‘.. ,,:_ :. .;:: Method of yaluation Criteria Valye Comments Vuluution
Grigalunas, 1986 qppo&&‘&t“
Grigahmas, 1?86 Replacement costs
Fgalumas, 1986 Cost data
Grigalunas, 1986 Replacement values
Gupta, 1973 Model
Gupta and Foster, 1976 in &abman,and Batie, 1988
Hypothetical return fi-om investment to buy open space
Han$lack J & Brown C+M Jr, Const!vler (1974)’ S~uplus and
M&&al Value
_’ : Social costs of ctean-up of Amoco Cadiz to France
Social costs of losses to oyster c+ring caused by Aqoco Cidiz to France
Cost of treating oiled birds livi?lg after 2 years
Estimated damage to marine life caused by Amoco Cadiz to France
Inland freslnvater wetland assessme$ model ,,
The authors analysed the prices paid for open-space land by conservation commissions iti Massachusetts in 1972.. The average price per acre was $1,608. The highest was $5,769 per acre. ‘jAe authors chose $5,000 per acre and, using a 5.375% capitalisation rate, calculated the annual ‘return’. The @hors conc@e thaf This is equivalent to tiaxi&m WTP for high-quality wetland visual- cultural values.
Survey qf wi!&owl humtefs
marginal value of a waterlowl was calculated over the tihole sample of 1,5 11 hunters
FF430-4751~ FF1978
FF107m FF1978
$1,300 per bird $1980/1979. Original sources refereked’k article
FF2.4-60m F1;1??8
Value of wildlife $10 - $7Olacrelyear Visual-Cultural $30 - $270/acrelyear
$1?73
$270 lacrelyear
from $247 to $257 per $1968 year $3.35 to $5.21 per year
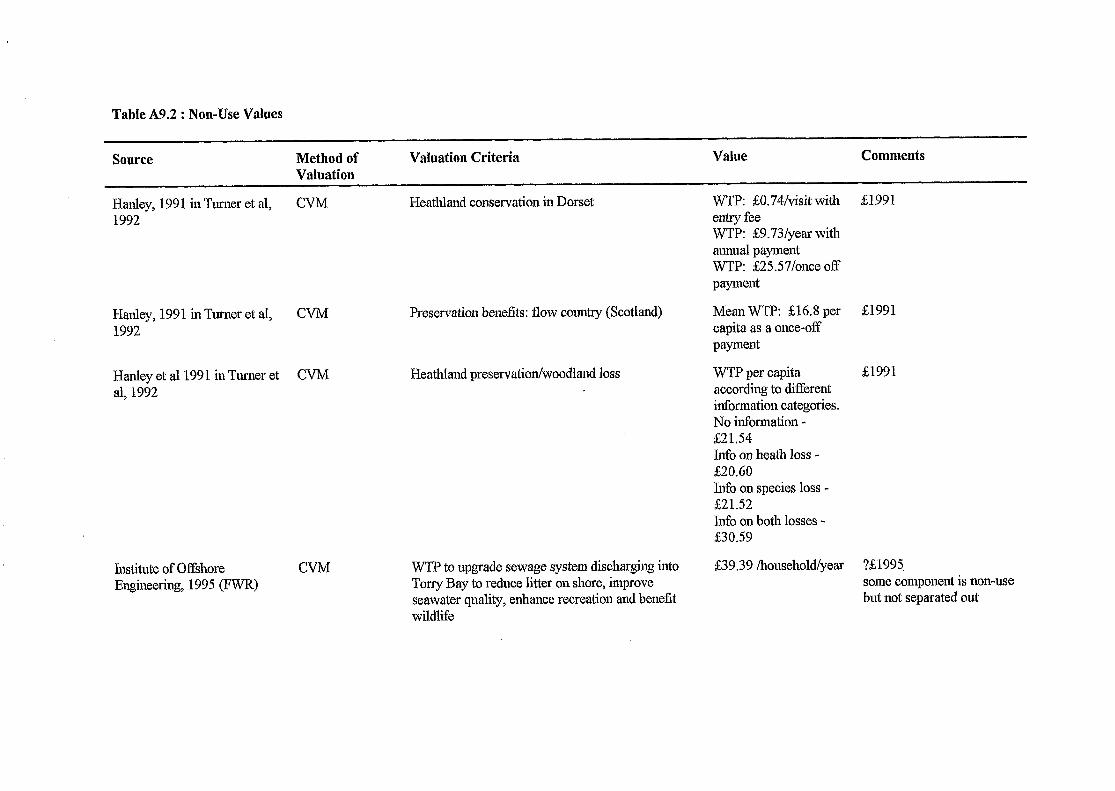
Table A9.2 : Non-Use Values
Source Method of Valuation
Valuation Criteria Value Comments
Hanky, 1991 in Turner et al, CVM Heathland conservation in Dorset WTP: &0.74/visit with $1991 1992 entry fee
WTP: &9.73/year with annual payment WT.P: &25.57/once off payment
Hanley, 1991 in Turner et al, 1992
CVM Preservation benefits: flow country (Scotland)
Hanley et al 1991 in Turner et CVM al, 1992
Institute of Of%liore Engineering, 1995 (FWR)
CVM
Mean WTP: &l&S per &1991 capita as a once-off payment
Heathland preservation/woodland loss WTP per capita according to different information categories. No infoimation - g21.54
$1991
Info on heath loss - &20.60 Info on species loss - s21.52 Info on both losses - 230.59
WTP to upgrade sewage system discharging into Tony Bay to reduce litter on shore, improve seawater quality, enhance recreation and benefit wildlife
S39.39 /housel~old/year ?&1995. some component is non-use but not separated out
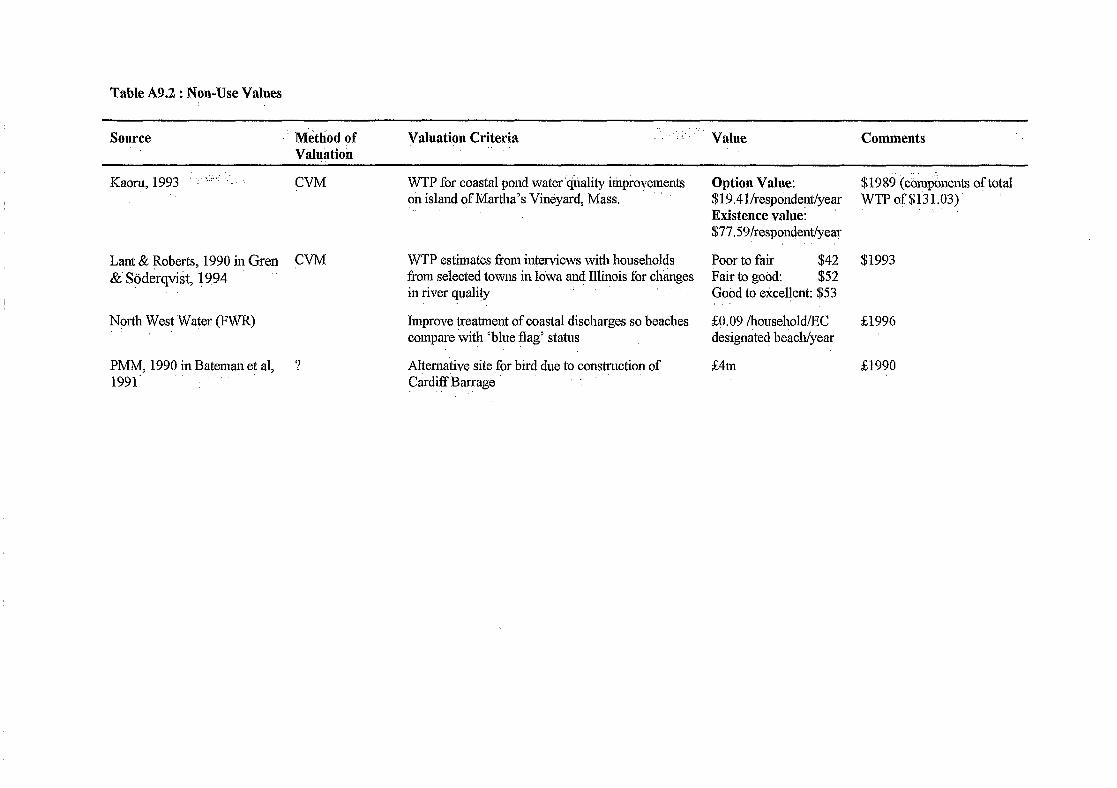
Table A9.2 : Non-Use Values
Source “‘M&hod of Valuktion
J7aluation Criteria . . ‘.. ,‘, :’ Value Comments
Kaom, 1993 :, ..I.:.’ ,.‘_. ‘. CVM WTP for coastal pond water ‘duality improvements ok island of Martha’s Vineyard, Mass.
Lant & Roberts, 1990 in Gren CVM &’ S(iderqvkt, 1994
North West Waker (FWR) :
PMM, 1990 in Bateman et al, ? 1991.
WTP estimates ikom interviews with househo@ from selected towns in Ioinra and Illinois for clianges in river quality
hnprove treatment of coastal discharges so beaches compare ‘with ‘blue flag’ status
Alternative site for bird due to construction of Cardiff Barrage :
“’
Option Value: t6 19 86 (c&+&ents of total $19.4l/respdnde@year WTPof$J31.03)’ Existence value: $77SS)/respondent/yea~
Poor to fair $42 $1993 Fair to good: $52 Good to exceljent: $53
$0.09 /household/JX $2996 designated beach/year
FE4111 0990
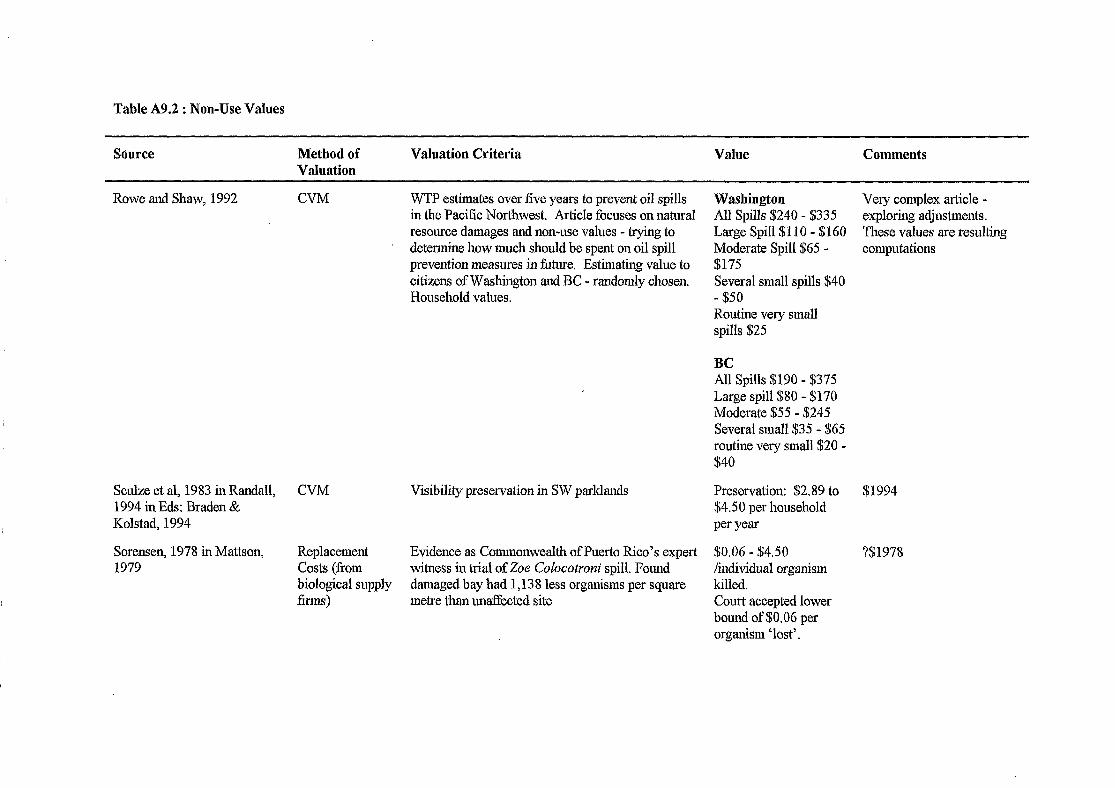
Table A9.2 : Non-Use Values
Source Method of Valuation
Valuation Criteria Value Comments
Rowe and Shaw, 1992 CVM
Sculze et al, 1983 in Randall, 1994 in Eds: Braden & Kolstad, 1994
Sorensen, 1978 in Mattson, 1979
CVM
Replacement costs @01n
biological supply firms)
WTP estimates over five years to prevent oil spills in the Pacific Northwest. Article focuses on natural resource damages and non-use vahles - trying to determine how much should be spent on oil spill prevention measures in future. Estimating value to citizens of Washington and BC - randomly chosen. Household values.
Visibility preservation in SW parklands
Evidence as Commonwealth of Puerto Rico’s expert witness in trial of Zoe Colocotront spill, Found damaged bay had 1,138 less organisms per square metre than unaffected site
Washington Very complex article - All Spills $240 - $335 exploring adjustments . Large Spill $110 - $160 These values are resulting Moderate Spill $65 - computations $175 Several small spills $40 - $50 Routine very small spills $25
BC All Spills $190 - $375 Large spill $80 - $170 Moderate $55 - $245 Several small $35 - $65 routine very small $20 - $40
Preservation: $2.89 to $4.50 per household per year
$1994
$0.06 - $4.50 /individual organism killed. Court accepted lower bound of $0.06 per organism ‘lost’.
?$1978
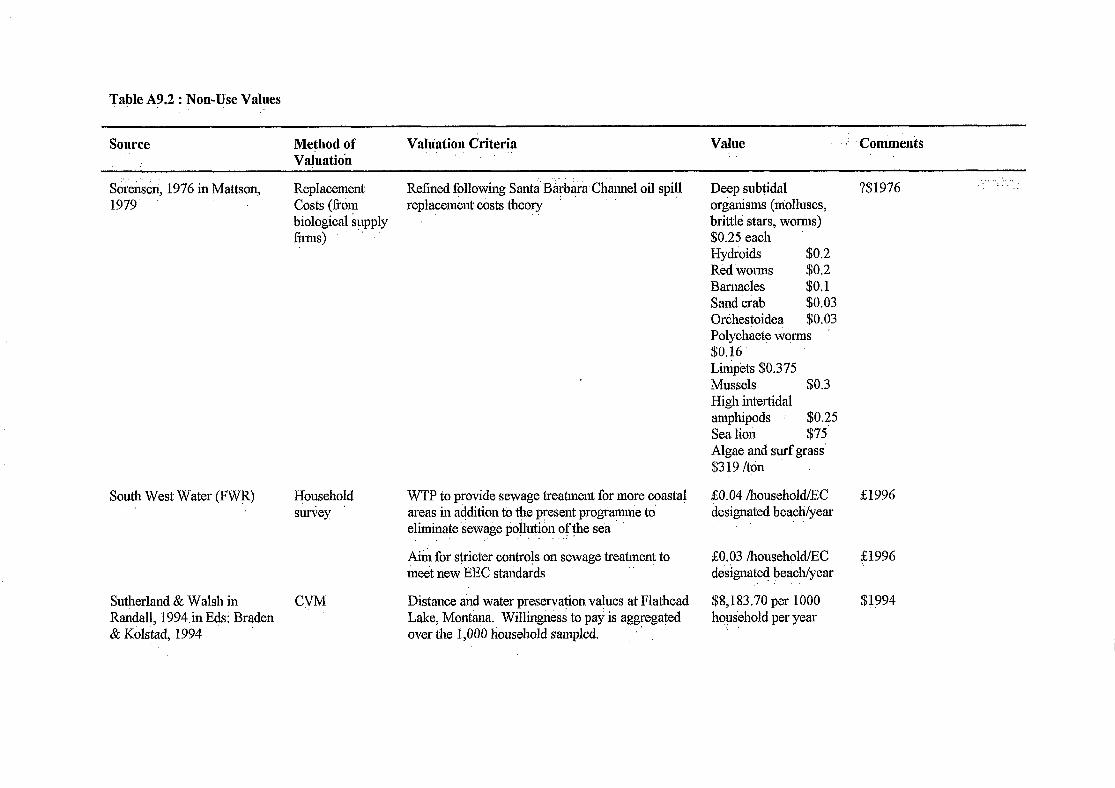
Table A9.2 : Non-Use Values
Source Me$hod of Valuatih
Valuation Criteria Value :
,. Comments
S&e&ri, 1976 in Mattson, 1979’
Replacement Costs (from
Refined fqllowing Sant~B$x$%mnel oil spill replacement costs theory
biological supply fi11ns)
South West Water (FWjX) Household ntiey
WTP to provide sewage treatment for more coastal areas in addition tb’ the present programme to eliminate Seivaie po&&n oftbe sei . ...’
Sut$erland & Walsh in CVM Randall, 1994. in Eds: Braden & Kdlstad, 1994
Aiin for stricter contro!s on sewage treatment to meet new EEC standards
Distance and water preservapon vatl;les at Flathead Lake, Mont@a. Willingness to pay IS aggregated over the 1,000 household sampled.
. ...’ . ,
Deep &tidal ?$1976 organisms (niolluscs, brittlle stars, worms) $0.25 eacil Hydrbids $0.2 Red worms $0.2 Barnacles $0.1 Sand crab $0.03 Ortihestoidea $0.03 Polychaete wqrms $0.16 Limp’ets $0.375 Mussels $0.3 High intertidal amphipods $0.25 Sea lion $75’ Algae and s@ grass’ $319 ltgn
&O.O+ /household/EC designated beach/year
&1996
20.03 /household/EC designated beach/year
$8,183.70 per 1000 household per year
:
$1996
$lc)94
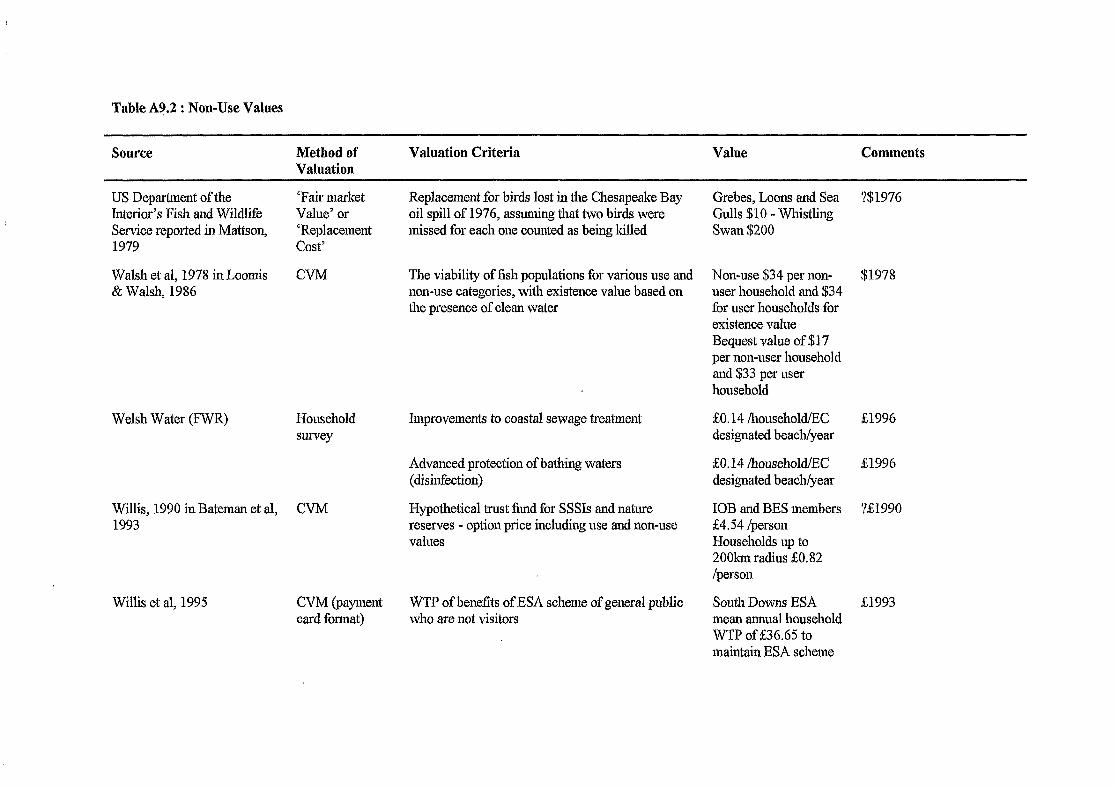
Table A9.2 : Non-Use Values
Source Method of Valuation
Valuation Criteria Value Comments
US Department ofthe Interior’s Fish and Wildlife Service reported in Mattson, 1979
‘Fair market Value’ or ‘Replacement Cost’
Replacement for birds lost in the Chesapeake Bay oil spill of 1976, assuming that two birds were missed for each one counted as being killed
Walsh et al, 1978 iu Loomis & Walsh, 1986
CVM The viability of fish populations for various use and non-use categories, with existence value based on the presence of clean water
Welsh Water (FWR) Household survey
Willis, 1990 in Bateman et al, CVM 1993
Willis et al, 1995
Improvements to coastal sewage treatment
Advanced protection of bathing waters 20.14 /household/EC (disiltiection) designated beach/year
Hypothetical trust fimd for SSSIs and nature reserves - option price including use and non-use values
IOB and BES members ?&I990 &4.54 /person Households up to 200km radius SO.82 /person
CVM (payment card format)
WTP of benefits of ESA scheme of general public who are not visitors
Grebes, Loons and Sea ?$1976 Gulls $10 -Whistling Swan $200
Non-use $34 per non- $1978 user household and $34 for user households for existence value Bequest value of $17 per non-user household and $33 per user household
SO.14 /household/EC designated beach/year
$1996
$1996
South Downs ESA &1993 mean annual household WTP of s36.65 to maintain ESA scheme

: : :
;‘,a
:. :..
ANNEX-lo: --DATA ON HUMAN HEALTH EFFECTS
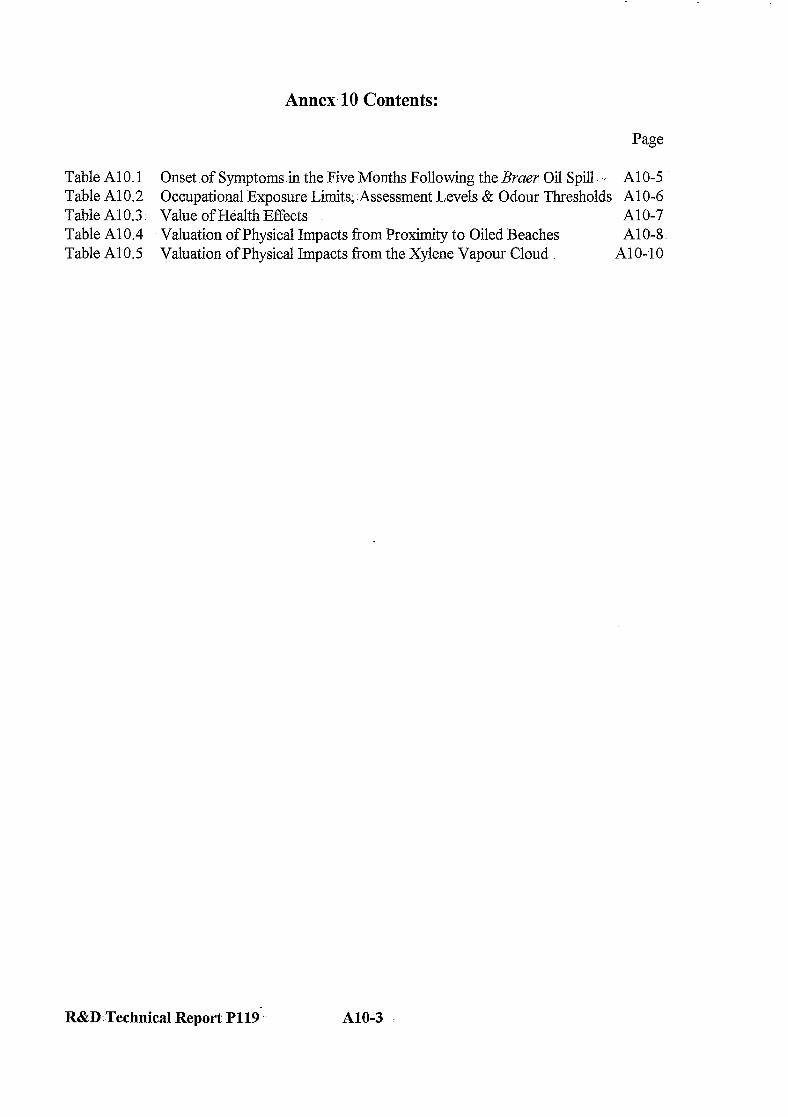
Annex- 10 Contents:
Page
Table Al 0.1 Onsetof Symptoms in the Five Months Following the Brner Oil Spill .a A10-5 Table A10.2 Occupational Exposure Limits;:Assessment Levels & Odour Thresholds A10-6 Table A10.3. Value of Health Effects A10-7 Table A10.4 Valuation of Physical Impacts from Proximity to Oiled Beaches A10-8 Table Al 0.5 Valuation of Physical Impacts from the Xylene Vapour Cloud Al0-10
R&D:Technical ReportP119--, A10-3

R&D Technical Report P119 A10-4
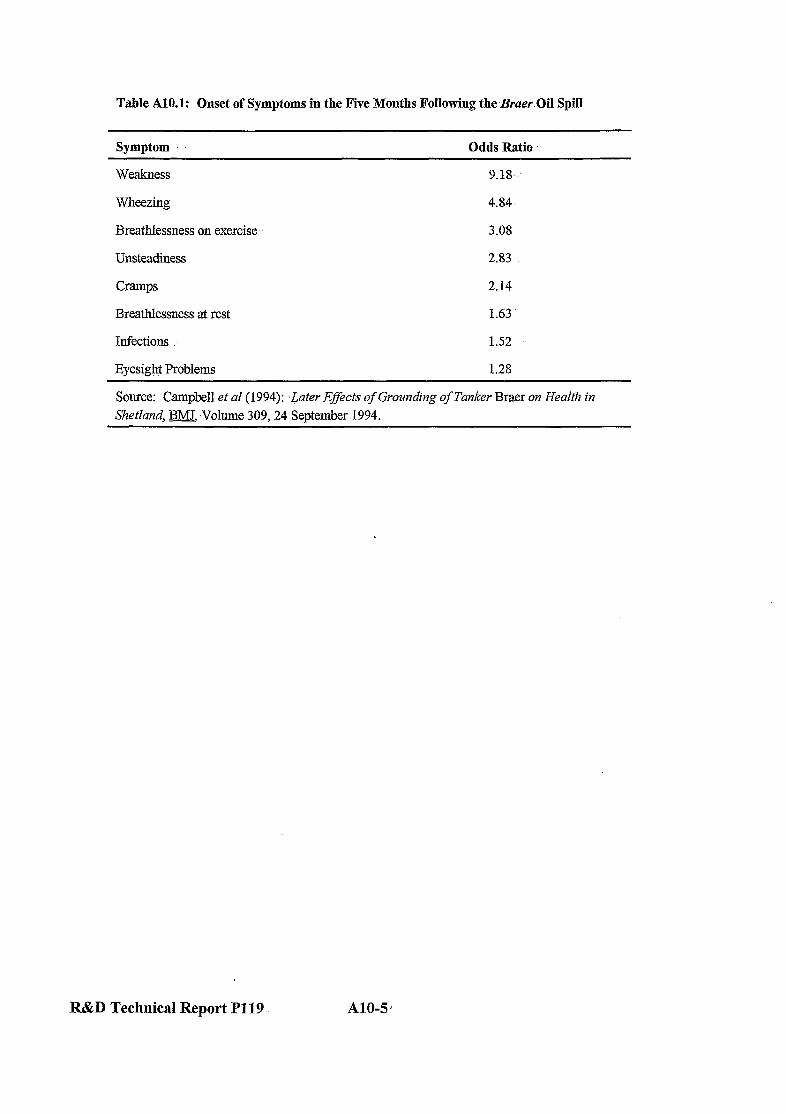
Table A1O.l: Onset of Symptoms in the Five Months Following the~Bcur.Oil Spill
Symptom Odds Ratio
Weakness 9.1%
Wheezing 4.84
Breathlessness on exercise .. 3.08
Unsteadiness 2.83
Cramps
Breathlessness at rest
2.14
1.63
Infections 1.52
Eyesight Problems 1.28
Source: Campbell et al (1994): ,Later EJ%cts of Grounding of Tanker Braer on Health in Shetland, F&Q-Volume 309,24 September S994.
R&D Technical Report P119 A10-5 1
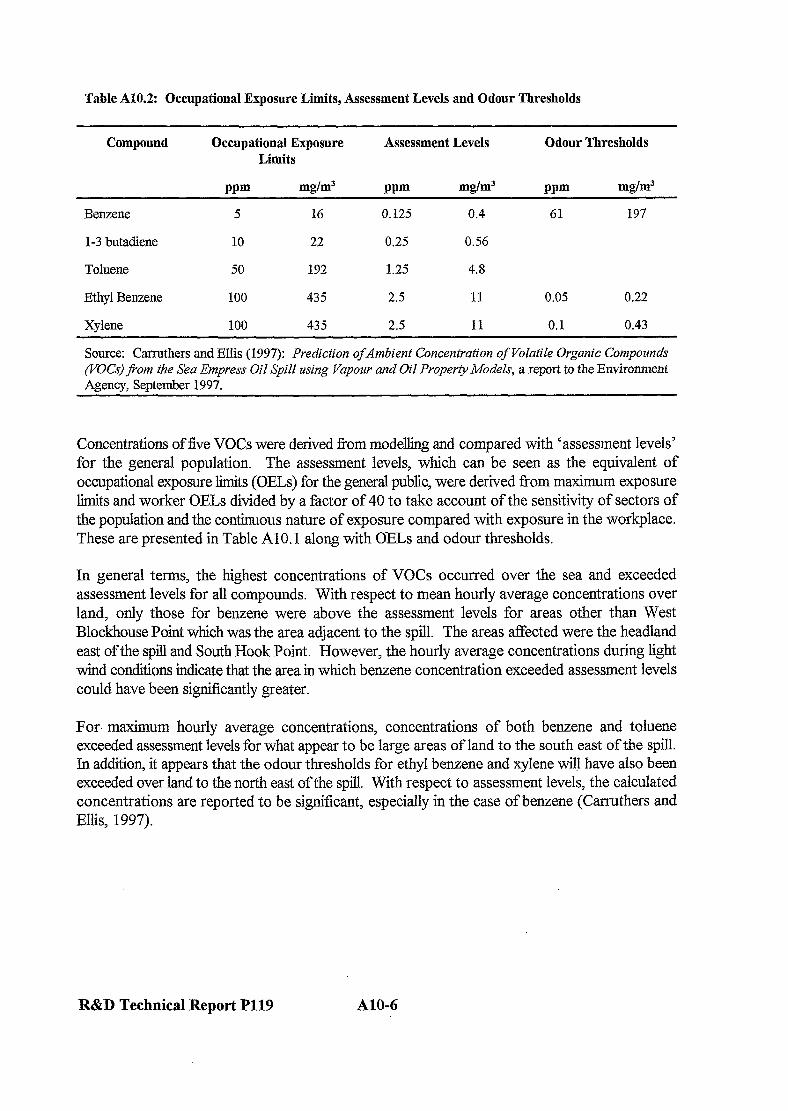
TabIe Al&Z: Occupational Exposure Limits, Assessment Levels and Odour Thresholds
Compound Occupational Exposure Limits
Assessment Levels Odour Thresholds
pw mg/m3 mm mg/m” mm mg/m3
Benzene 5 16 0.125 0.4 61 197
l-3 butadiene 10 22 0.25 0.56
Toluene 50 192 1.25 4.8
Ethyl Benzene 100 435 2.5 11 0.05 0.22
Xylene 100 435 2.5 11 0.1 0.43
Source: Carruthers and Ellis (1997): Prediction ofAmbient Concentration of Volatile Organic Componn& (YOCs) j?om the Sea Empress Oil Spill using Vapow and Oil Property Models, a report to the Environment Agency, September 1997.
Concentrations of five VOCs were derived from modelling and compared with ‘assessment levels’ for the general population. The assessment levels, which can be seen as the equivalent of occupational exposure limits (OELs) for the general public, were derived from maximum exposure limits and worker OELs divided by a factor of 40 to take account of the sensitivity of sectors of the population and the continuous nature of exposure compared with exposure in the workplace. These are presented in Table AlO. 1 along with OELs and odour thresholds.
In general terms, the highest concentrations of VOCs occurred over the sea and exceeded assessment levels for all compounds. With respect to mean hourly average concentrations over land, only those for benzene were above the assessment levels for areas other than West Blockhouse Point which was the area adjacent to the spill. The areas affected were the headland east of the spill and South Hook Point. However, the hourly average concentrations during light wind conditions indicate that the area in which benzene concentration exceeded assessment levels could have been significantly greater.
For- maximum hourly average concentrations, concentrations of both benzene and toluene exceeded assessment levels for what appear to be large areas of land to the south east of the spill. In addition, it appears that the odour thresholds for ethyl benzene and xylene will have also been exceeded over land to the north east of the spill. With respect to assessment levels, the calculated concentrations are reported to be significant, especially in the case of benzene (Can-uthers and Ellis, 1997).
R&D Technical Report P119 A10-6

Table A10.3: Value of Health Effects ($1996)
Symptom Length of Illness Willingness-to-Pay (day+ Value (% per day)
Source
Weakness
Headache
Runny Nose
Sore Throat (throat congestion)
Cough
-.
1
1
30
1
1
1
30 ..
1
1
30
Generally ,Ill a.
Nausea
Sore Eyes
1 34 Tolley et al (1986)
30 4 Tolley et al (1986)
1 10 Dickie et al (1987/88)
1 18 Tolley et al (1986) :
30 5 Tolley et a2 (1986)
Itching Skin ‘i.
Shortness of Breath (mild)
Shortness of Breath (severe)
-
1
7
90 ”
1
7
90
17.
42
114
34
103
241 /
Skin Rash.
12 Dickie et ai (1987/88)
27 Tolley et al (1986) ‘.
11 Tolley et al (1986)
6 Dickie et al (1987/S&) 1.
11 Dickie et al (1987/88).
19 Tolley et al (1986) .:
5 Tolley et al (1986) :.
7 Dickie et al (1987/88)
17 Tolley et al (1986)
4 Tolley et al (1986)
Loehman (1979) ‘.
Loehman (1979)
Loehman (1979) :
Loehman (1979)
Loehman (1979) .:: -
Loehman (1979) .
Source: Environment Agency (1996): The Feasibility of Cost Benefit Analysis for Integrated Pollution Control, ‘a report prepared by ERM Economics on behalf of the Environment Agency.
R&D,sTechnical Report P119 Al0-7

Table A10.4: Valuation of Physical Impacts from Proximity to Oiled Beaches (Page 1 of 2)
Symptom Prevalence in
Control Group
Odds Ratio A** Odds Ratio B** Estimated % of Population
Experiencing Symptom
Because of Sea Empress
(Adjusted Using Odds Ratio A)
Estimated % of Population
Experiencing Symptom
Because of Sea Empress
(Adjusted Using Odds Ratio 6)
*weakness
headache
runny nose sore throat
cough
*generally ill nausea
sore eyes *itching skin
shortness of breath
*skin rash
Total Valuation
12.70% 1.9 12.00% 3.9 11.30% 1.9 10.50% 2.9 9.60% 1.9 7.30% 3.5
5.80% 2.4
4.90% 3.5
4.70% 2.3 4.40% 2.3 2.90% 2.3
2.47
3.04
2.78
2.37
11.43%
34.60%
10.17% 19.95%
8.64% 18.25% 8.12% 12.25%
6.11%
5.72%
3.77%
17.64%
21.42%
12.99%
6.71%
Notes: l No WTP values available for marked symptoms, so the lowest available value for any symptom (f6) was applied
** See Section 10.2.1 and Table 10.1 for details of these odds ratios.
*** See Table A10.1 for a range of WTP values. Only values for symptoms lasting one day were used here.
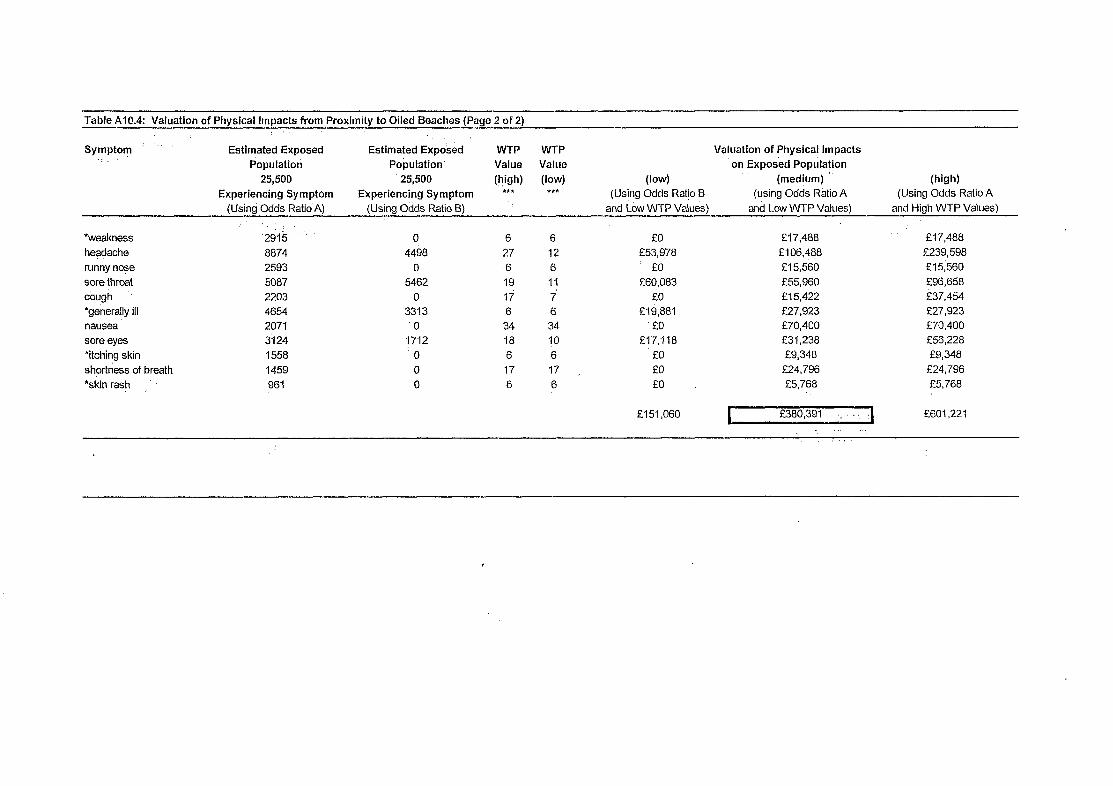
Table A10.4: Valuation of Physical Impacts from Proximity to Oiled Beaches (Page 2 of 2)
Symptom ‘. .:.
*weakness headache
runny nose sore throat
cough ', *generally ill
nausea sore eyes
*itching skin
shortness of breath
“skin rash
Estimated Exposed Estimated Exposed WTP WTP Valuation of Physical Impacts
Populatlori Pobulation Value Value on Exposed Population
25,500 25,500 !“;r”,“’ (low) (low) (medium) (high) Experiencing Symptom Experiencing Symptom *** (Using Odds Rat/o B (using Odds Ratio A (Using Odds Ratio A
(Usins Odds Ratio A) (Using Odds Ratio B) and Lbw WTP Valu&) and Low WTP Values) and High WTP Values)
‘.‘,.
.2915 ‘. :
0 6 6 EO f17,48a f17,488 8874 4498 27 12 f53,978 f 106,488 f239,598 2593 0 6 6 f0 fl5,560 f15,560 5087 5462 19 11 f6!,083 f55,960 f96,658 2203 0 Ii i f0 f15,422 f37,454 4654 3313 6 6 f19,881 f27,923 f27,923 2071 ‘0 34 34 'EO f70,400 f70,400 3124 1712 18 10 f17,118 f31,238 f56,228 1558 :0 6 6 F-0 f9,348 f9,348: 1459 0 17 17 . f0 f24,796 f24,796 961 0 6 6 EO f5,768 f5,768
f151,060 I
f380,391 : f601,221
" "
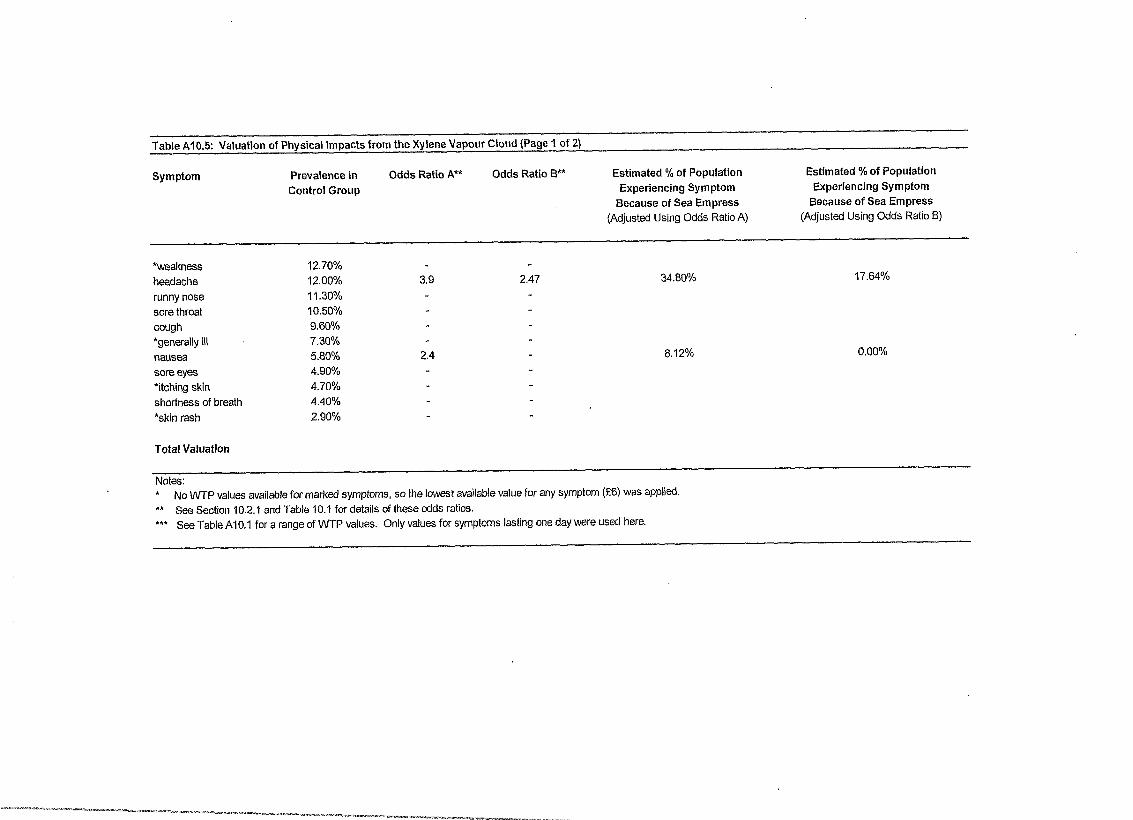
Table A10.5: Valuation of Physical Impacts from the Xylene Vapour Cloud (Page I of 2)
Symptom Prevalence in
Control Group
Odds Ratio A** Odds Ratio E** Estimated % of Population Experiencing Symptom
Because of Sea Empress
(Adjusted Using Odds Ratio A)
Estimated % of Population
Experiencing Symptom
Because of Sea Empress (Adjusted Using Odds Ratio B)
*weakness
headache
runny nose
sore throat cough
*generally ill
nausea sore eyes
*itching skin
shortness of breath
*skin rash
12.70%
12.00% 3.9 2.47 34.80% j7.64%
1 I .30%
10.50% 9.60%
7.30%
5.80% 2.4 8.12% 0.00%
4.90%
4.70%
4.40%
2.90%
Total Valuation
Notes:
* No WTP values available for marked symptoms, so &he lowest available value for any symptom (f6) was applied. ** See Section 10.2.1 and Table 10.1 for details of these odds ratios.
*** See Table Al0.1 for a range of WTP values. Only values for symptoms lasling one day were used here.
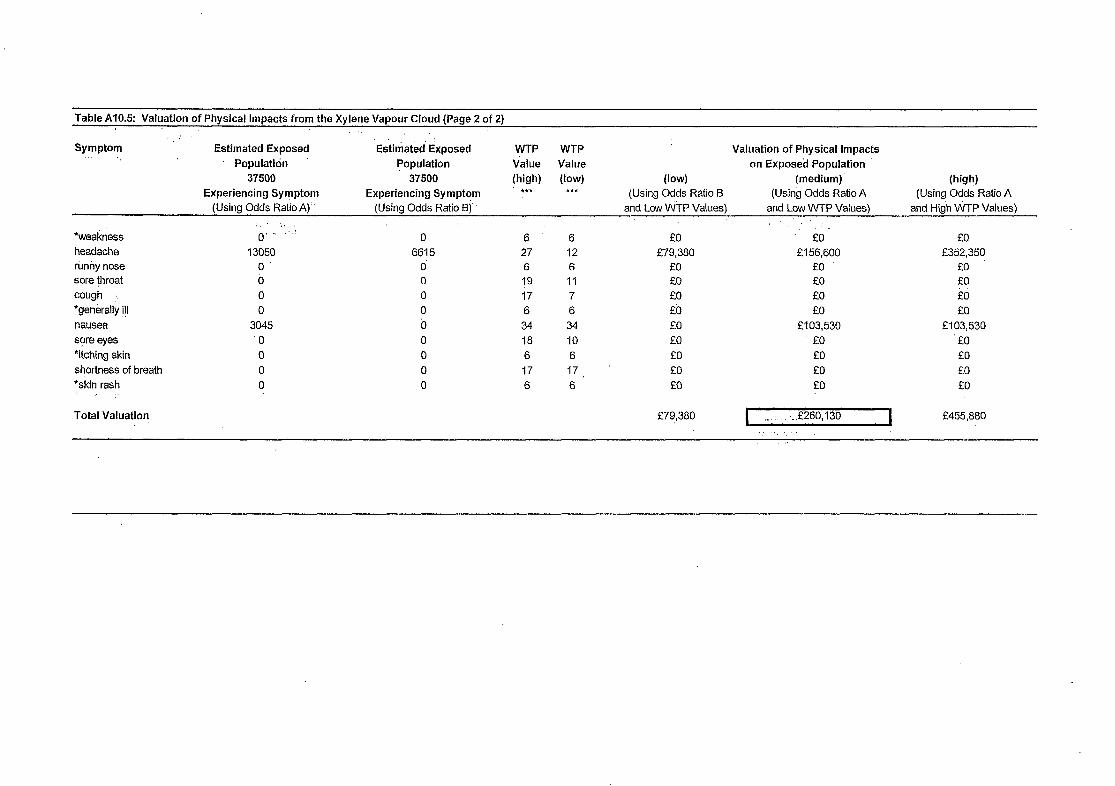
Table A10.5: Valuation of Physical Impacts from the Xylene Vapour Cloud (Page 2 of 2)
Symptom Estimated Exposed Estimated’ Exposed WTP WTP Valuation of Physical Impacts “’ 1,
Populatidn Population Value Value on Exposed Population 37500 37500 (high) (low) w.4 (mtidium) (Hill?)
Experiencing Symptom Experiencing Symptom *** *** (Using Odds Ratio B (Using Odds Ratio A (Using Odds Ratio A (Using Odds Ratio A) (Using Odds Ratio Bj” and Low V\jTP Values) and Low WTP Values) and High WTP Values)
,’ ‘,. ‘. *weakness 0’ -” ” : 0 6’ 6 f0 f0' f0 headache 13050 6615 27 12 f79,380 f 156,600 f352,350 rimiy nose 0’ d 6 6 f0 f0 f0 sore ihroat b 0 19 11 f0 f0 EO cough : 0 0 17 7 f0 f0 i?O *generally !!I 0 0 6 6 fb f0 f0 nausea 3045 b 34 34 f0 f103,530 f103,530 sore eyes 0 0 18 10 f0 EO 'f0 *itching skin 0 0 6 6 f0 f0 f0 shortness of breath 0 0 17 ‘7 . f0 f0 f0 ‘skin rash 0 0 6 6 f0 ., f0 f0
Total Valuation f79,380 ,_.: . ..f26q.l30 I f455,880
ANNEX 11: FLORIDA’S DAMAGE COMPENSATION FORMULA
Annex 11 Contents:
Box All;1 Florida’s Damage Compensation Formula; Table Al 1.1 Application of the FDCF to the Sea Empress
R&D Technical Report P119 All-3

R&D Technical Report P119 All-4
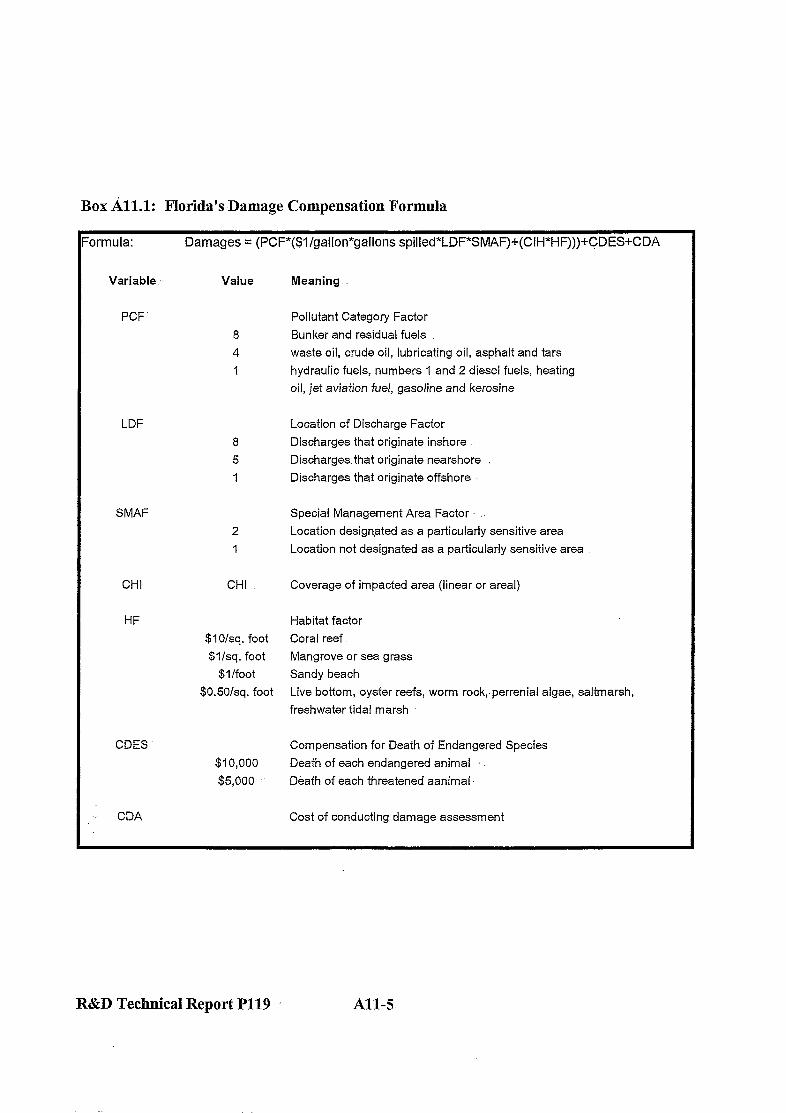
Box All.1: Florida’s-Damage Compensation Formula
:ormula: Damages = (PCF*($l/gallon*gallons spilled*LDF*SMAF)+(ClH*HF))))+CDES+CDA
Variable Value Meaning..
PCF
8
4
1
Pollutant Category Factor
Bunker and residual fuels
waste oil, crude oil, lubricating oil, asphalt and tars
hydraulic fuels, numbers 1 and 2 diesel fuels, heating
oil, jet aviation fuel, gasoline and kerosine
LDF
8
5
1
Location of Discharge Factor
Discharges that originate inshore
Discharges.that originate nearshore ,
Discharges that originate offshore
SMAF
2
1
Special Management Area Factor
Location designated as a particularly sensitive area
Location not designated as a particularly sensitive area
CHI CHI Coverage of impacted area (linear or areal)
HF
CDES
$1 o/sq. foot
$l/sq. foot
$l/foot
SO.5OIsq. foot
$10,000
$5,000
Habitat factor
Coral reef.
Mangrove or sea grass
Sandy beach
Live bottom, oyster reefs, worm rock,.perrenial algae, saltmarsh,
freshwater tidal marsh
Compensation for Death of Endangered Species
Death of each endangered animal
Death of each threatened aanimal
CDA Cost of conducting damage assessment
R&D Technical Report Pl19 All-5
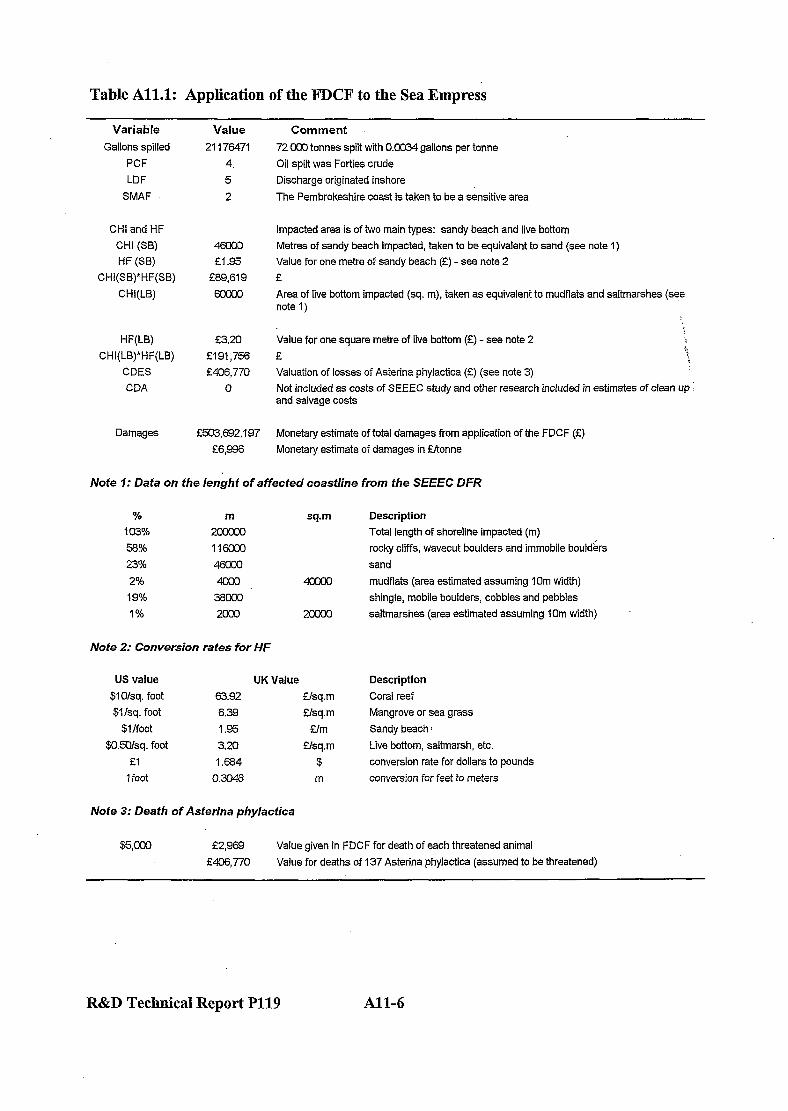
Table All.1: Application of the FDCF to the Sea Empress
Variable Value
Gallons spilled 21176471
PCF 4.
LDF 5
SMAF 2
CHI and HF
CHI (SE)
HF (SE)
CHI(SB)*HF(SB)
CHI(LB)
HF(LB)
CHI(LB)*HF(LB)
CDES
CDA
f3.20 f191,756 f406,770
0
Damages frn,692,197 f6,996
Comment
72 CXIO tonnes spilt with 0.0034 gallons per tonne
Oil spilt was Forties crude
Discharge originated inshore
The Pembrokeshire coast is taken to be a sensitive area
Impacted area is of two main types: sandy beach and live bottom
Metres of sandy beach impacted, taken to be equivalent to sand (see note 1)
Value for one metre of sandy beach (f) - see note 2
f Area of live bottom impacted (sq. m), taken as equivalent to mudflats and saltmarshes (see note 1)
Value for one square metre of live bottom (f) - see note 2
f I
Valuation of losses of Asterina phylactica (f) (see note 3)
Not included as costs of SEEEC study and other research included in estimates of clean up : and salvage costs
Monetary estimate of total damages from application of the FDCF (f) Monetary estimate of damages in Tonne
Nofe I: Dafa on fhe lenghf of affecfed coastline from fhe SEEEC DFR
%
103%
5S?h
23%
2%
19%
1%
m
2m
llmxl
4oal
33m'
2cm
sq.m
2m
Nofe 2: Conversion rates for HF
US value
$1 o/sq. foot
$llsq. foot
$l/foot
$0.5%q. foot
fl 1 foot
UK Value
63.92 Usq.m
6.39 ffsq.m
1.95 f/m
3.20 5lsq.m
1 .m4 $
0.3048 m
Nofe 3: Deafh of Asterina phylacfica
Description
Total length of shoreline impacted (m)
rocky cliffs, wavecut boulders and immobile boulders
sand
mudflats (area estimated assuming IOm width)
shingle, mobile boulders, cobbles and pebbles
saltmarshes (area estimated assuming 10m width)
Description
Coral reef
Mangrove or sea grass
Sandy beach *
Live bottom, saltmarsh, etc.
conversion rate for dollars to pounds
conversion for feet to meters
f2,969
f4Of5,770 Value given in FDCF for death of each threatened animal
Value for deaths of 137 Asterina phylactica (assumed to be threatened)
R&D Technical Report Pll9 All-6
ANNEX 12: INTERNATIONAL OIL SPILLS OVER 30,OOOt AND INCIDENTS-INVOLVING TANKERS IN MlIiFORD HAVEN SINCE JUNE 1993 !

Annex 12 Contents:
Page
Table A12.1: Details of Spills over 30,OOOt since 1960 Table A12.2: Incidents in Milford Haven since June.1993
A12-5 A12-16
R&D Technical Report-P119 Al2-3

R&D Technical Report P119 A12-4
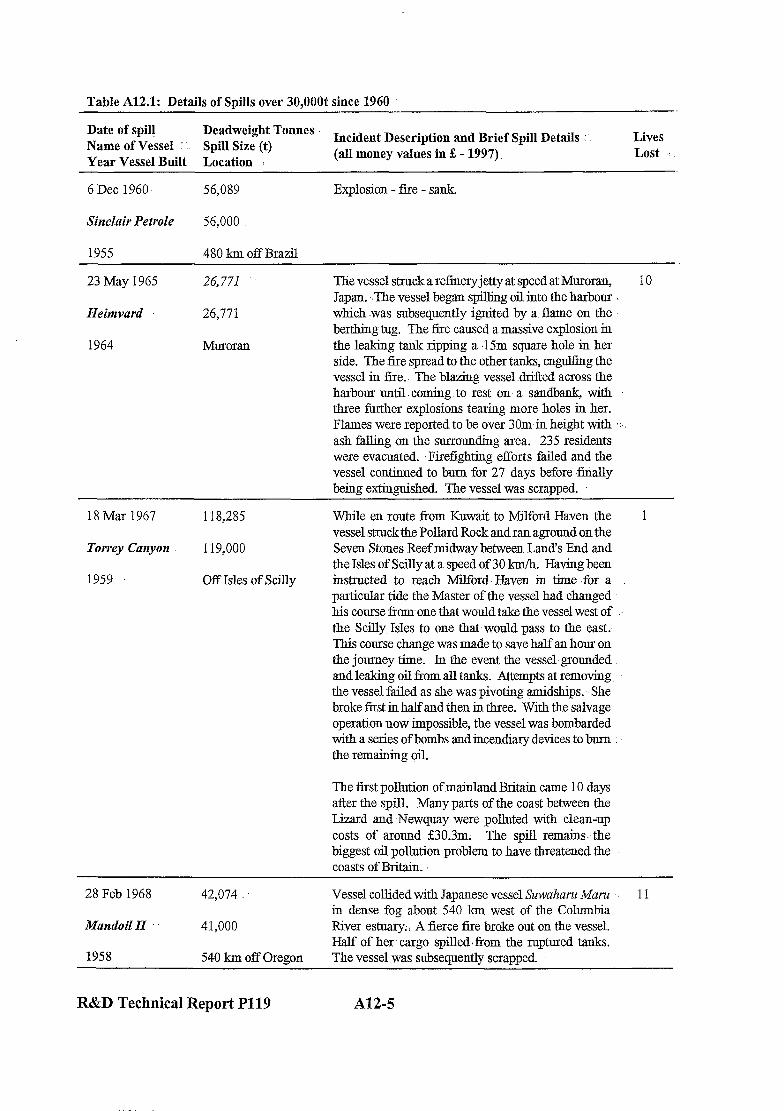
Table A12.1: Details of Spills over 30,OOOt since 1960
Date of spil! Deadweight Tonnes Name of Vessel : Spill Size (t)
Incident Description and Brief Spill-Details ” Lives
Year Vessel Built Location : (all money values in $ - 1997). Lost .-.
6 Dee 1960. 56,089 Explosion - fire - sank.
Sinclair Petrole 56,000
1955 480 km off Brazil
23 May 1965
Heinrvard
1964
26,771 -.
26,771
Muroran
The vessel struck areflneryjetty at speed at Muroran, 10 Japan. The vessel began spilling oil into de harbour which was subsequently ignited by a flame on the berthing tug. The fire caused a massive explosion in the leaking tank ripping a .15m square hole in her side. The fire spread to the other tanks, enguhmg the vessel in fire.. The blazing vessel drifted across the harbour until. coming. to rest on. a sandbank, with three further explosions tearing more holes in her. Flames were reported to be over 30m iu height with I.-. ash falling on the surrounding area. 235 residents were evacuated. -Firefighting efforts failed and the vessel continued to burn for 27 days before ,Gually being extinguished. The vessel was scrapped
18 Mar 1967 118,285
Torrey Canyon 119,000
1959 Off Isles of Scilly
While en route from Kuwait to Milhord Haven the 1 vessel struckthe Pollard Rock and ran aground on the Seven Stones Reef midway between Land’s End and the Isles of Scilly at a speed of30 kmh. Having been instructed to reach Milford. Haven iu time .for a particular tide.the Master of the vessel had changed his come from one that would take the vessel west of . . the Scilly Isles to one that would pass to the east. This course change was made to save halfan hour on de journey time. In de event the vessel-grouuded andleal&g oil corn all tanks. Attempts at removing the vessel failed as she was pivoting amidships. She broke first in half and then in three. With the salvage operation now impossible, the vessel was bombarded with a series of bombs and incendiary devices to burn : the remaining oil.
The first pollution of mainland Britaiu came 10 days after the spill. Many parts of the coast between the Lizard and -Newquay were polluted with clean-up costs of around &30.3m. The spill remainsthe biggest oil pollution problem to have threatened the coasts of Britain.
28 Feb 1968
Mandoil II
1958
42,074
41,000
540 km off. Oregon
Vessel collided with Japanese vessel Suwaham &fat-u . . 11 in dense fog about 540 km west of de Columbia River estuary. : A fierce fire broke out on the vessel. Half of her cargo spilled,fiom the ruptured tanks. The vessel was subsequently scrapped.
R&D Technical Report Pl19 A12-5
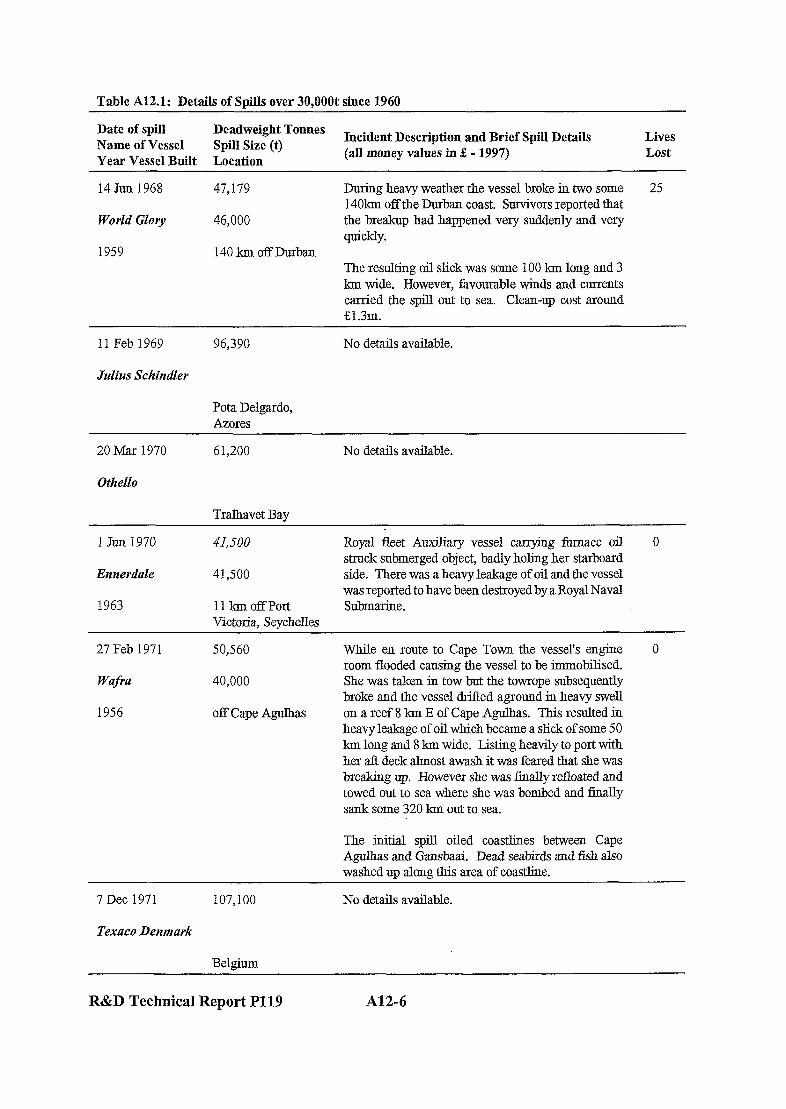
Table A12.1: Details of Spills over 30,OOOt since 1960
Date of spill Deadweight Tonnes Name of Vessel Spill Size (t)
Incident Description and Brief Spill Details Lives
Year Vessel Built Location (all money values in % - 1997) Lost
14 Jun 1968
World Glory
1959
47,179 During heavy weather the vessel broke in two some 25 14Okm off the Durban coast. Survivors reported that
46,000 the breakup had happened very suddenly and very quickly.
14OkmoffDurban The resulting oil slick was some 100 km long and 3 km wide. However, favourable winds and currents carried the spill out to sea. Clean-up cost around g1.3m.
11 Feb 1969 96,390 No details available.
Julius Schindler
Pota Delgardo, Azores
20 Mar 1970
Othello
61,200
Trahnavet Bav
No details available.
1 Jun 1970
Ennerdale
1963
41,500 Royal fleet Auxiliary vessel carrying furnace oil struck submerged object, badly holing her starboard
41,500 side. There was a heavy leakage of oil and the vessel was reported to have been destroyed by a Royal Naval
11 kmoffport Submarine. Victoria. Sevchelles
0
27 Feb 1971 50,560
Wafra 40,000
1956 off Cape Agulhas
While en route to Cape Town the vessel’s engine room flooded causing the vessel to be immobilised. She was taken iu tow but the towrope subsequently broke and the vessel drifted aground in heavy swell on a reef 8 km E of Cape Agulhas. This resulted in heavy leakage of oil which became a slick of some 50 km long and 8 km wide. Listing heavily to port with her aft deck almost awash it was feared that she was breaking up. However she was finally refloated and towed out to sea where she was bombed and finally sank some 320 km out to sea.
0
The initial spill oiled coastlines between Cape Agulhas and Gansbaai. Dead seabirds and fish also washed up along this area of coastline.
7 Dee 1971 107,100 No details available.
Texaco Denmark
Belgium
R&D Technical Report P119 Al2-6
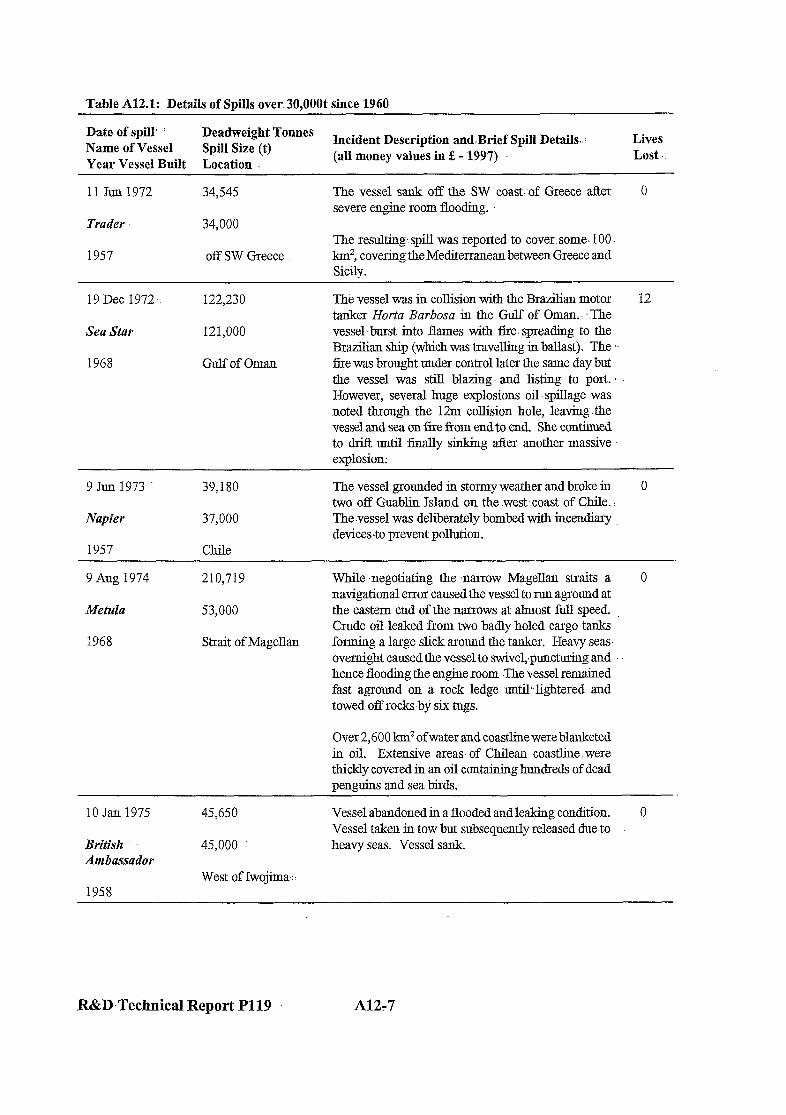
Table A12.1: Details of Spills over.30,OOOt since 1960
Date of spill’ Deadweight Tonnes Name of Vessel Spill Size (t)
Incident Description andBrief Spill Details. Lives
Year Vessel Built Location . (all money values in % - 1997) Lost.
11 Jun 1972 34,545
Trader 34,000
1957 off SW Greece
The vessel sank off the SW .coast of Greece after severe engine room flooding.
The resulting: spill was reported to cover. some. 100 Id, covering the Mediterranean between Greece and Sitiilv
0
19 Dee 1972 122,230
Sea Star 121,000
1968 Gulf-of Oman
The vessel was in collision with the Brazilian motor 12 tanker Horta Barbosa in the Gulf of Oman.. The vessel burst into flames with fire. spreading to de Brazilian ship (which was travelling in ballast). The .’ fire was brought under control later the same day but the vessel was still blazing. and listing to port. . However, several huge explosions oil. spillage was noted through the 12m collision hole, leaving the vessel and sea on fire from end to end. She continued to drift until finally sinking after another massive explosion:
9Jun1973: 39,180
Napier 37,000
1957 Chile
The vessel grounded in stormy weather and broke in two off Guablin Island on the .west-coast of Chile. 1 The vessel was deliberately bombed with incendiary devicesto prevent pollution.
0
9 Aug 1974
Met&a
1968
210,719
53,000
Strait of -MagelIan
While ,negotiating the narrow MagelIan straits a 0 navigational error caused de vessel to run aground at the eastern end of the narrows at almost full speed. Crude oil leaked from two badly holed cargo tanks forming a large slick around the tanker. Heavy seas overnight caused the vessel to swivel,~puncturing and hence flooding the engine room The vessel remained fast aground on a rock ledge until~~lightered and towed off rocks by six tugs.
Over 2,600 km* ofwater and coastline were blanketed in oil. Extensive areas of Chilean coastline. were thickly covered in an oil containing hundreds of dead pen-m& and sea birds.
10 Jan 1975
British Ambassador
1958
45,650
45,000
West of Iwojima-
Vessel abandoned in a flooded and leaking condition. 0 Vessel taken in tow but subsequently released due to heavy seas. Vessel sank
R&D:Technical Report P119 Al2-7

Table A12.1: Details of Spills over 30,OOOt since 1960
Date of spill Deadweight Tonnes Name of Vessel Spill Size (t)
Incident Description and Brief Spill Details Lives
Year Vessel Built Location (all money values in $ - 1997) Lost
29 Jan 1975 89,412
Jacob Maersk ss,ooo
1966 off Leixoes
While ma.noeuvSng to berth with the assistance of tugs de vessel struck the bottom causing explosions in her engine room which ripped through the vessel causing it to ignite. The Port of Leixoes was quickly closed After further explosions the vessel broke in two and sank some 2 days later, spilling more horning cargo into the sea.
6
Clouds of poisonous fumes from the burning cargo caused scores of casualties to local inhabitants throughcrot de area. The oil polluted some 32 km of beaches and fishing beds.
31 Jan 1975
Corintkos
1963
%I3988
36,000
Philadelphia
Whilst discharging its caxgo of Algerian crude at 26 Marcus Hook on the Delware River, the vessel was struck by the American oil/chemical Tanker Edgar M Queeny which was manoeuvring out of de dock Explosions ripped through de Corinthos with resultant ties. Flames were reported to be 15Om tall and a 75 t section of the Corirzthos was blown into the air, landing on the American vessel. The explosions were felt some 30 km away. The Corinthos broke in two, de forward part drifting, in flames, down river. Blaziurr oil also drifted down river.
13 May 1975 65,673 Vessel was en route from Venezuela to New York 0 when she was abandoned about 100 km NW of Puerto
Epic Cdoctronis 58,000 Rico due to an uncontrollable fire in her engine room and large cracks in her hull. The blazing vessel
100kmNw0f continued to drift, eventuaJly settling lower in the 1965 Puerto Rico water. The tie burnt itselfout, whereupon the vessel
was towed for scrapping.
R&D Technical Report P119 A12-8
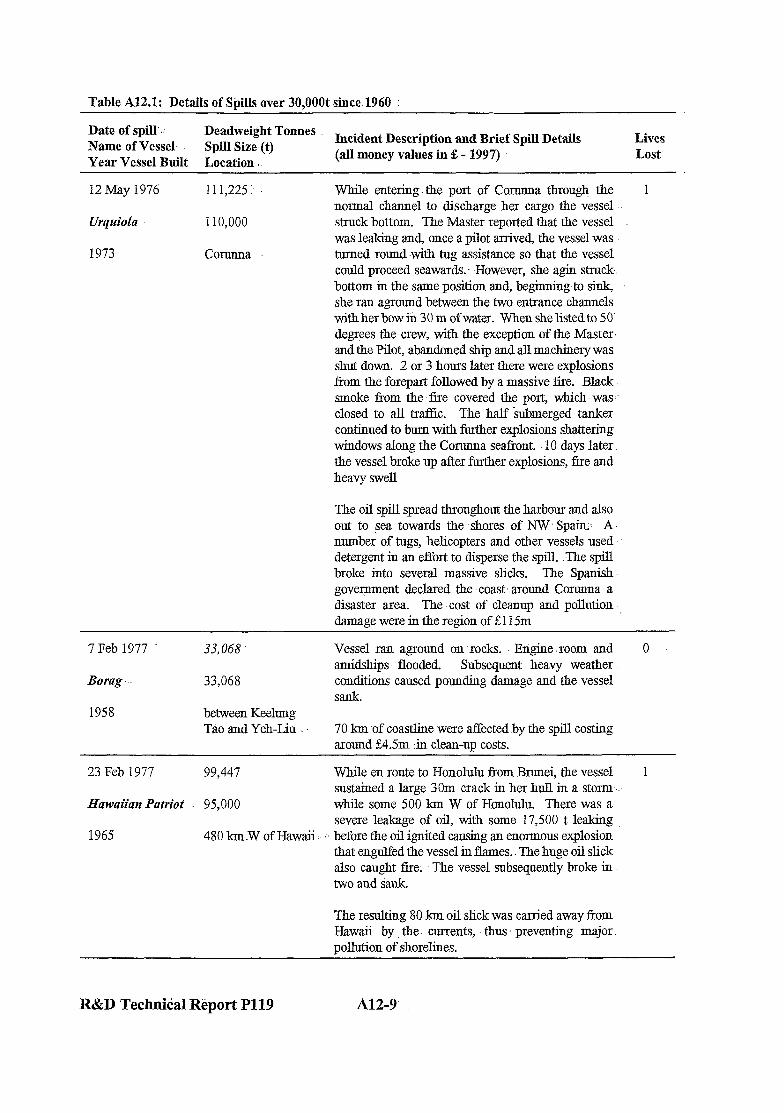
Table A12.1: Details of Spills over 30,OOOt since.1960 :
Date of spill..: Deadweight Tonnes Name of Vessel- Spill Size-(t)
Incident Description and Brief Spill Details Lives
Year Vessel Built Location (all money values in E - 1997) Lost
12 May 1976 111,225.
Urquioia 110,000
1973 Conmna
While entering the port of Conmna through. de 1 normal channel to discharge her cargo the vessel struck bottom. The Master reported that the vessel was leaking and once a pilot arrived, the vessel was turned round .with tug assistance so that the vessel could proceed seawards: -However, she agin struck. bottom m the same position and, begrmung-to sink, she ran agrormd between the two entrance chmels with her bow m 30 m of water. When she listed to 50. degrees the- crew, with the exception of the Master, and the Pilot, abandoned ship and all machinery was shut down. 2 or 3 hours later there were explosions from the forepart followed by a massive fire. Black. smoke from the fire covered the port, which was closed to all trtic. The half submerged tanker continued to burn with further explosions shattering windows along the Conmna.seaI?ont. 10 days later the vessel broke up after further explosions, fire and heavy swell
The oil spill spread throughout de harbour and also out to sea towards the shores of NW Spain A. number of tugs, helicopters and other vessels used. detergent in an effort to disperse the spill. .The spill broke into several massive slicks. The Spanish government declared the coast. around Conmna a disaster area. The cost of cleanup and pollution. damage were in de region of & 115m
7 Feb 1977
Borag ‘..
1958
33,068
33,068
between Keehmg Tao and Yeh-Liu
Vessel ran aground on rocks. Engine .room and amidships flooded Subsequent heavy weather conditions caused pounding damage and the vessel Sank.
70 km ,of coastline were affected by the spill costing around &4.5m in clean-up costs.
0
23 Feb 1977 99,447 While en route to Honolulu from Brunei, the vessel 1 sustained a large 30m crack in her hull in a storm.
Hawaiian Patriot 95,000 while some 500 km W of Honolulu. There was a severe -leakage of oil, with some 17,500 t leaking
1965 480 km W of Hawaii ;. before de oil ignited causing an enormous explosion that engulfed the vessel in flames.. The huge oil slick also caught fire. The vessel subsequently broke in two and sank.
The resulting 80 km oil slick was carried away from Hawaii by the. currents, thus preventing major uolhrtion of shorelines.
R&D Technical R&port P119 Al2-9.
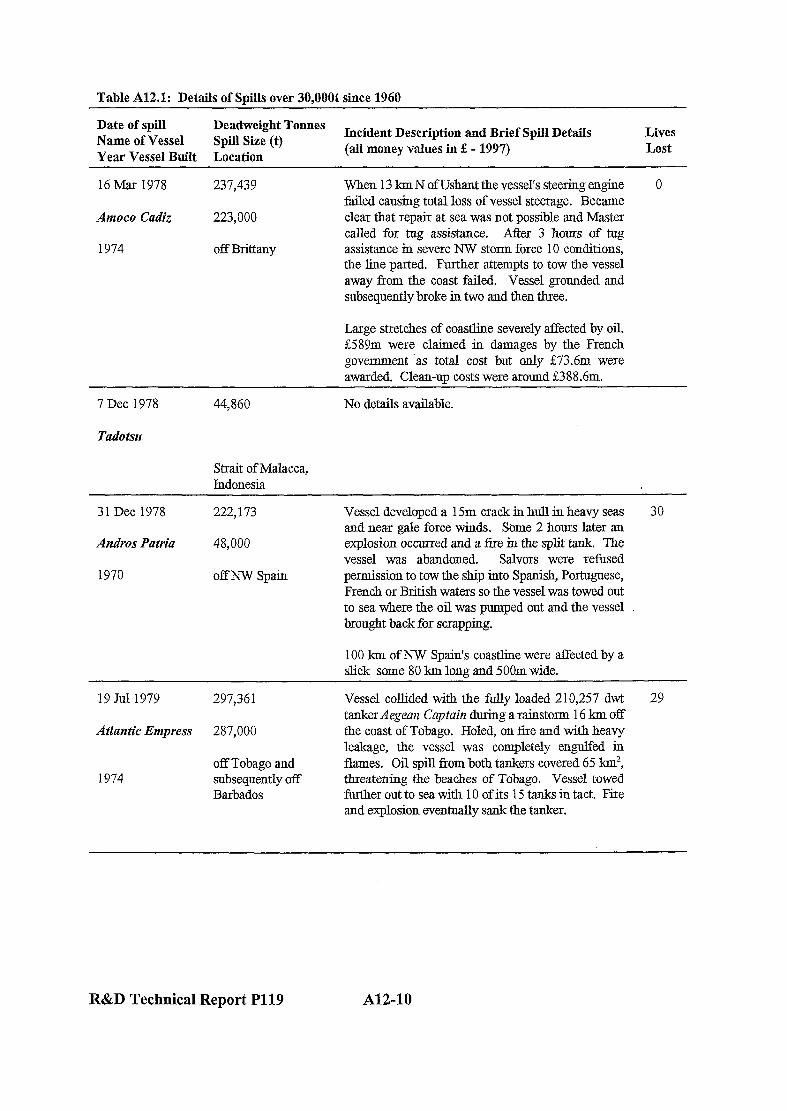
Table A12.1: Details of Spills over 30,OOOt since 1960
Date of spill Deadweight Tonnes Name of Vessel Spill Size (t)
Incident Description aud Brief Spill Details Lives
Year Vessel Built Location (all money values in S - 1997) Lost
16 Mar 1978 237,439
Amoco Cadiz 223;OOO
1974 off Brittany
When I3 hu N of Ushant the vessel’s steering engine failed causing total loss of vessel steerage. Became clear that repair at sea was not possible and Master called for tug assistance. After 3 hours of tug assistance in severe NW storm force 10 conditions, the line parted. Further attempts to tow the vessel away from the coast failed Vessel grounded and subsequently broke in two and den three.
0
Large stretches of coastline severely affected by oil. &589m were claimed in damages by the French government .as total cost but only &73.6m were awarded. Clean-uu costs were around &388.6m.
7 Dee 1978 44,860 No details available.
Tadotsu
Strait of Malacca, Indonesia
31 Dee 1978 222,173
Andros Patria 48,000
1970 off NW Spain
Vessel developed a 15m crack in hull in heavy seas 30 and near gale force winds. Some 2 hours later an explosion occurred and a lire in the split tank. The vessel was abandoned Salvers were refused permission to tow the ship into Spanish+ Portuguese, French or British waters so the vessel was towed out to sea where de oil was pumped out and the vessel brought back for scrapping.
100 km of NW Spain’s coastline were affected by a slick some 80 km long and 5OOm wide.
19Jul1979 297,361 Vessel collided with the fully loaded 210,257 dwt 29 tanker Aegeuiz Captain during a rainstorm 16 km off
Atlantic Empress 287,000 de coast of Tobago. Holed, on fire and with heavy leakage, the vessel was completely engulfed in
off Tobago and flames. Oil spill from both tankers covered 65 km2, 1974 subsequently off threatening the beaches of Tobago. Vessel towed
Barbados further out to sea with 10 of its 15 tanks in tact. Fire and explosion eventually sank the tanker.
R&D Technical Report Pl19 A12-10

Table A12rl: Details of Spills over 30,OOOt since 1960.
Date of spill Deadweight Tonnes Name of Vessel Spill Size (t)
Incident Description and Brief Spill Details .: Lives
Year Vessel Built. Location (all money values in f - 1997). Lost
1 Nov 1979
Burmah Agate
1963
62,663
41,000
Galveston Bay
While - en route from .the Bahamas to Houston 32 carrying Nigerian light and blended crude,--vessel . . collided with the bulk carrier Mimsa which was at anchor 6 km outside Galveston Bay. Both vessels burst into flames, igniting. the ever increasing oil ‘. slick. The vessel was put aground some 9 lm south .. of Galveston Bay where she continued to burn More explosions spilledmore oil. .The fire burned itself out some .l 0 weeks after de collision and.the vessel was towed off for scrapping.
250 km -of Texan coastline were affected by oil pollution costing around &10.3m in clean-up.
15 Nov 1979 152,408
Independenta 95,000
1978 Bosphorus: .Turkey
The vessel was involved in a catastrophic collision 42 ” with de Greek motor vessel EwiaZy off Istanbul. The vessel exploded and burst into flames killing 42 of the. 45 crew. The force of the explosions. smashed windows some 6 km inland. Still. blazing and pouring oil, the .vessel drifted out of control until she ran aground and broke intwo only 1.5km Tom- the crowded Kadikoy district of Istanbul. The lire was 1. allowed‘to burn itself out. However, some 3 days after the collision, a new, fiercer fire came to life. Some 19 days later there was another huge explosion sending flames over 300m into de sky and raining burning debris onto the shore while a burning slick spread across the water. The tie stopped one month .’ after the initial collision.
The oil slick was said to have caused immense ecological damage, having drifted south into the sea of Maramara. Thousands of dead fish washed up on the coast. Thick black tar balls washed up along the shore of resort and residential districts on the Sea of Maramara. A thick, acrid black smoke covered the city of Istanbul for a number of days.
23 Feb 1980
Irenes Serenade
1965
105,460
82,000
off Pylos, Greece
While anchoring to take on supplies and fuel at 2 Navarino, an explosion occurredin de forecastle area of the vessel. A tie enveloped the whole vessel in 30 minutes. The vessel sank some 12 hours later.
A large volume of burning oil had been spilled into the sea, causing pollution and burning vegetation on the eastern coastline .of Sfaktiria< Island Little pollution was reported in the bay as the winds and. .- current had taken the 3 0 km by 6 or 7 km wide slick out to sea. Clean-up costs were around E439,OOO;
R&D Technical Report P119 : Al2-11
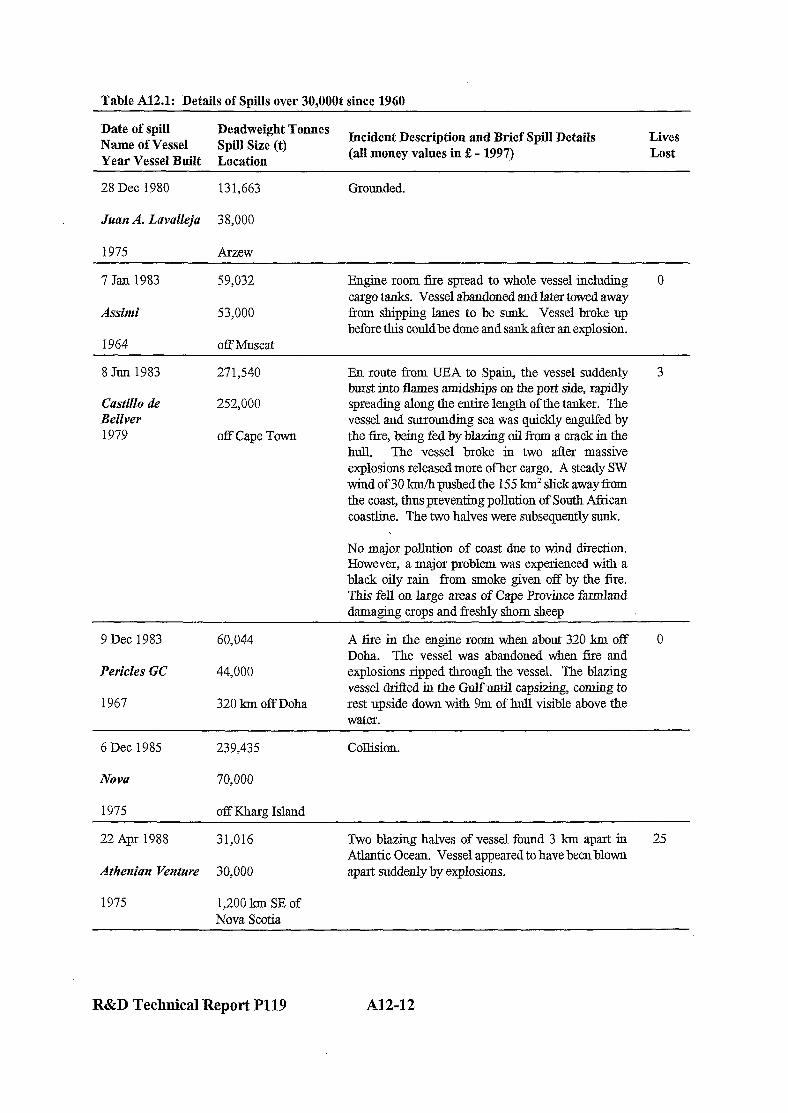
Table A12.1: Details of Spills over 30,OOOt since 1960
Date of spill Deadweight Tonnes Name of Vessel Spill Size (t)
Incident Description and Brief Spill Details Lives
Year Vessel Built Location (all money values in g - 1997) Lost
28 Dee 1980 131,663 Grounded.
Juan A. Lavalleja 38,000
1975 Arzew
7 Jan 1983 59,032
Assim i 53,000
1964 off Muscat
Engine room fire spread to whole vessel including cargo tanks. Vessel abandoned and later towed away from shipping lanes to be sunk. Vessel broke up before this could be done and sank after an explosion.
0
8 Jim 1983
Castillo de Bellver 1979
271,540
252,000
off Cape Town
En route from UEA to Spain, the vessel suddenly burst into flames amidships on the port side, rapidly spreading along the entire length of the tanker. The vessel and surrounding sea was quickly engulfed by the tie, being fed by blaring oil f?om a crack in the hull. The vessel broke in two after massive explosions released more of her cargo. A steady SW wind of 30 km/h pushed the 155 km’ slick away from de coast, thus preventing pollution of South African coastline. The two halves were subsequently stmk.
3
No major pollution of coast due to wind direction. However, a major problem was experienced with a black oily rain from smoke given off by the fire. This fell on large areas of Cape Province farmland damaging crops and freshly shorn sheep
9 Dee 1983 60,044
Pericles GC 44,000
1967 320 km off Doha
A fire in the engine room when about 320 km off Doha. The vessel was abandoned when fire and explosions ripped through de vessel. The blaring vessel drifted in the Gulfuntil capsizing, coming to rest upside down with 9m of hull visible above the water.
0
6 Dee 1985 239,435 Collision.
Nova 70,000
1975 off Kharg Island
22 Apr 1988 31,016
Athenian Venture 30,000
Two blazing halves of vessel found 3 km apart in Atlantic Ocean. Vessel appeared to have been blown apart suddenly by explosions.
25
1975 1,200 km SE of Nova Scotia
R&D Technical Report P119 Al%12
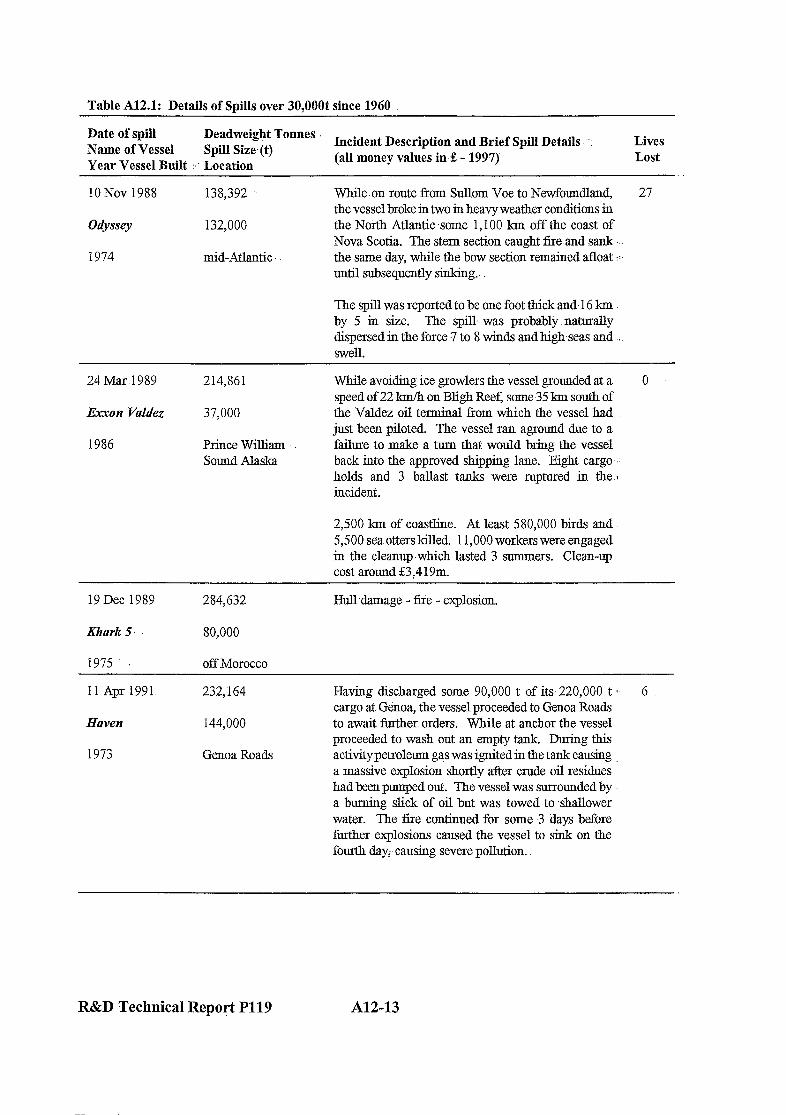
Table A12.1: Details of Spills over 30,OOOt since 1960
Date of spill Deadweight Tonnes Name of Vessel Spill Size- (t)
Incident Description and Brief Spill Details ‘: Lives
Year Vessel Built ..’ Location (all money values in S - 1997) Lost
1ONov 1988 138,392
Odyssey 132,000
1974 mid-Atlantic
While-on route f?om Sullom Voe to Newfoundland, 27 the vessel broke in two in heavy weather conditions in the North Atlantic some 1,100 km off the coast of Nova Scotia. The stern section caught f&and sank.. the same day, while de bow section remained afloat + until subsequently sinking.
The spill was reported to be one foot thick and 16 km by 5 in size. The spill -was probably. naturally dispersed in the force 7 to 8 winds and high seas and swell.
24 Mar 1989
Exxon Valdez
1986
214,861
37,000
Prince WiLliam : Sound Alaska
While avoiding ice growlers the vessel grounded at a 0 speed of 22 km&i on Bligh Reef, some 35 km south of the Valdez oil terminal from which the vessel had just been piloted. The vessel ran aground due to a failur to make a turn that would bring de vessel back into the approved shipping lane. Eight cargo-.- holds and 3 ballast tanks were ruptured in the : incident.
2,500 km of coastline. At least 580,000 birds and 5,500 sea otters killed, 11,000 workers were engaged in the cleanup.which lasted 3 summers. Clean-up cost around &3,419m.
19 Dee 1989
Khark 5
1975
284,632
so,ooo
off Morocco
HuRdamage - tie - explosion.
11 Apr 1991 232,164
Haven 144,000
1973 Genoa Roads
Haviug discharged some 90,000 t of its 220,000 t cargo at Genoa, the vessel proceeded to’Genoa Roads to await further orders. While at anchor the vessel proceeded to wash out an empty tank. During this activity petroleum gas was ignited in the tank causing a massive explosion shortly after crude oil residues had been pumped out. The vessel was surrounded by a humiug slick of oil but was towed to shallower water. The tie continued for some 3 days before further explosions caused the vessel to sink on the fourth day;- causing severe pollution.
6
R&D Technical Report P119 A12-13
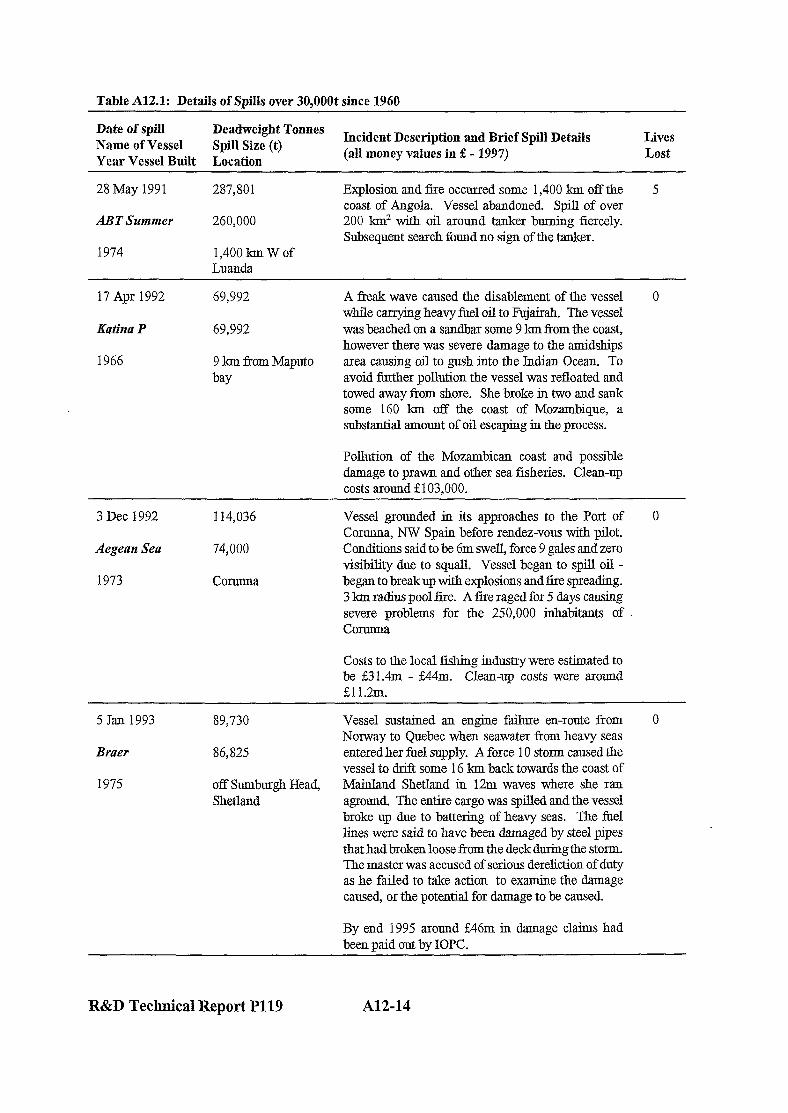
Table A12.1: Details of Spills over 30,OOOt since 1960
Date of spill Deadweight Tonnes Name of Vessel Spill Size (t)
Incident Description and Brief Spill Details Lives
Year Vessel Built Location (all money values in E - 1997) Lost
28 May 1991
ABT Summer
1974
287,801
260,000
1,400kmWof Luanda
Explosion and fire occurred some 1,400 km off the coast of Angola. Vessel abandoned. Spill of over 200 ld with oil around tanker burning fiercely. Subsequent search found no sign of the tanker.
5
17 Apr 1992
Katina P
1966
69,992
69,992
9 km from Maputo bay
A freak wave caused the disablement of the vessel while cmyiug heavy fuel oil to Fujairah. The vessel was beached on a sandbar some 9 km from de coast, however there was severe damage to the amidships area causing oil to gush into the IinIian Ocean. To avoid further pollution the vessel was refloated and towed away from shore. She broke m two and sank some 160 km off the coast of Mozambique: a substantial amount of oil escaping in de process.
0
Pollution of the Mozambican coast and possible damage to prawn and other sea fisheries. Clean-up costs around $103,000.
3 Dee 1992 114,036
Aegean Sea 74,000
1973 Conmna
Vessel grounded in its approaches to the Port of 0 Conmna, NW Spain before rendez-vous with pilot. Conditions said to be 6m swell, force 9 gales and zero visibility due to squall. Vessel began to spill oil - began to breakup with explosions and tie spreading. 3 km radius pool fire. A fire raged for 5 days causing severe problems for de 250,000 inhabitants of Comma
Costs to the local fishing industry were estimated to be &3 1.4m - g44m. Clean-up costs were around &11.2m.
5 Jan 1993
Braer
1975
89,730 Vessel sustained au engine failure en-route from 0 Norway to Quebec when seawater from heavy seas
86,825 enteredher fuel supply. A force 10 stomr caused de vessel to drift some 16 luu back towards de coast of
off Sumburgh Head, Mainland Shetland in 12m waves where she ran Shetland aground. The entire cargo was spilled and the vessel
broke up due to battering of heavy seas. The fuel lines were said to have been damaged by steel pipes that had broken loose from the deck dming the storm. The master was accused of serious dereliction of duty as he failed to take action to examine the damage caused or the potential for damage to be caused
By end 1995 aromd &46m in damage claims had been paid out by IOPC.
R&D Technical Report P119 Al%14

Table A12.1:’ Details of Spills over.30,OOOt since 1960
Date of spill Deadweight Tonnes Name of Vessel I SpiU.Size (t)
Incident Description-and Brief Spill Details Lives
Year Vessel Built Location :. . . (all money vahies in 2 - 1997) Lost.
21 act 1994
Thanassis
1976
38,877
37,060.
630 km SE of Hong Kong
The vessel was carrying a cargo of fuel oil fiorn! 16 Eastern Russia to Singapore when she broke intwo dming typhoon Teresa. Winds were force 9 with wave heights of 7m.
15 Feb 1996 147,273
Sea Empress 72,000
1993 off Milford Haven
While entering the Port of Milford Haven with Pilot 0 t&vessel grounded a number of times. The initial grounding was at full speed Despite de efforts of the ‘. pilot and crew to slow the listing vessel, she struckup on rocks, finally coming to rest.. -Already with : extensive to de bottom and with ruptured starboard tanks, the vessel was refloated. However. her increased draft and list meant that she was trapped in a ‘saucer’ shaped basin. Despite efforts to maintain :. her position the vessel grounded several more times m-bad weather-spilling more of her.cargo.
R&D Technical Report Pl19 AlZ-15
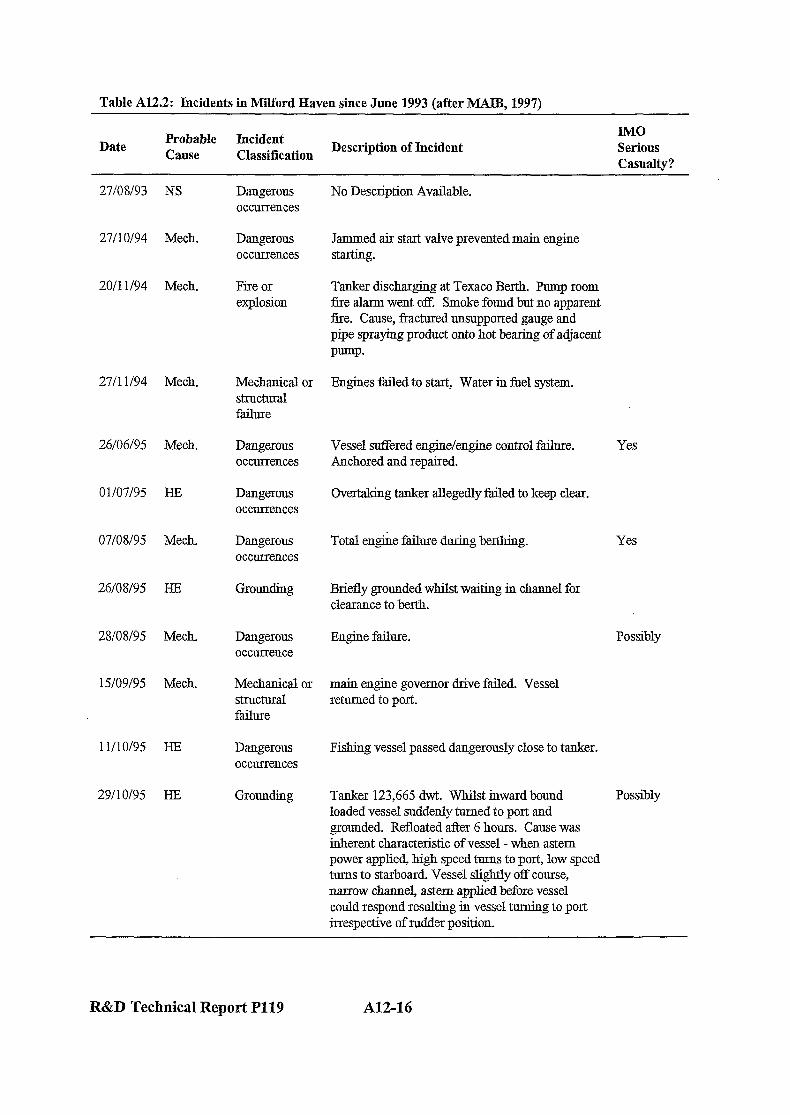
Table A12.2: Incidents in Milford Haven since June 1993 (after MAE, 1997)
Date Probable Incident
IMO
Cause Classification Description of Incident Serious
Casualty?
27!08/93 NS
27/l O/94 Mech.
20/I If94 Mech.
27/I l/94 Mech.
26/06/95 IMech.
01/07/95 HE
07/08/95 Mech.
26/08/95 HE
28108195 Mech.
15/09/95 Mech.
11/10/95 HE Dangerous occurrences
29110195 HE Grounding
Dangerous ocxunences
Dangerous occmxnces
Fire or
explosion
Mechanical or
StIUCt0Ia.l
failure
Dangerous occurrences
Dangerous occurrences
Dangerous occmrences
Grounding
Dangerous occurrence
Mechanical or stnlchlIa.l failure
No Description Available.
Jammed air start valve prevented main engine starting.
Tanker discharging at Texaco Berth. Pump room tire alarm went off. Smoke found but no apparent fire. Cause, tiactured unsupported gauge and pipe spraying product onto hot bearing of adjacent Pump*
Engines failed to star& Water in fuel system.
Vessel sufFered engine/engine control failure. Anchored and repaired.
Overtaking tanker allegedly failed to keep clear.
Total engme failure during berthing.
Briefly grounded whilst waiting in channel for clearance to berth.
Engine f&me.
main engine governor drive failed. Vessel returned to port.
Fishing vessel passed dangerously close to tanker.
Tanker 123,665 dwt. Whilst inwardbound loaded vessel suddenly turned to port and grounded. Refloated after 6 hours. Cause was inherent characteristic of vessel - when astern power applied, high speed turns to port, low speed turns to starboard. Vessel slightly off course, narrow channel, astern applied before vessel could respond resulting in vessel turning to port irrespective of rudder position.
Yes
Yes
Possibly
Possibly
R&D Technical Report Pl19 AU-16

TableaA12.2: Incidents in Milford Haven since June 1993 (after h%4lB, 1997)
Date Probable. kident . .
JMO
Cause Classification Description of Incident Serious
Casualty?-
09/11/95 HE
27/l l/95 HE
29/l l/95 NS
30/11/95 HE
09112195 HE
05/01/96 HE
2010 l/96 HE+W
09!02/96 HE.
15/02/96 HE
22102196 HE
Grounding
Dangerous occurrences
12103196 HE Grounding :
13/03/96 Mech. Ramming
Dangerous occumences
Dangerous occurrences
Mechanical or structnral failure
Dangerous . . occurrences
Dangerous occurrences
Dangerous 0ccmTences
-mm-a
Dangerous occurrences
Close pass between inbound fishing vessel and outbound tanker.
Inbound fishing vessel on wrong side of channel. Close pass with outbound tanker.
A hole m number 5 tank caused some oil pollution iu Milford Haven. DNVdetected a crack in de hull plate but the cause was UIlhlOWll.
Yes
Vessel left with only back springs fast because of shortage of mooring party ashore; Wind _rmsting to 35 knots.- Mooring later completed without incident.
Vessel started to leave berth without clearance while another .was leaving the next berth with. clearance. Mooring gang had cast-off without instructions. Tide pushed vessel away from berth..
Close pass between outbound tanker and inbound-,- fishing vessel.
Lauded heavily alongside dolphin when berthing in strong winds. Damage to forecastle spaces. Minor damage to dolphin.
Pilot aborted attempts to board a tanker due to I swell. Vessel re-booked but on second attempt pilot again could not board The vessel continued inwards without a pilot - who eventually boarded at Chapel Buoy.
Sea Empress. Yes
Close quarters situation off Angle Buoy. Inward . . . ferry did not comply with request to wait for. outbound tanker.
Dragged anchor and. grounded on mud when manoeuvring alongside jetty. .Refloated after au hour with tug assistance.
Possibly
Contact with jetty after alleged loss of engine control and power.
Yes
R&D Technical Report P119 A12-17
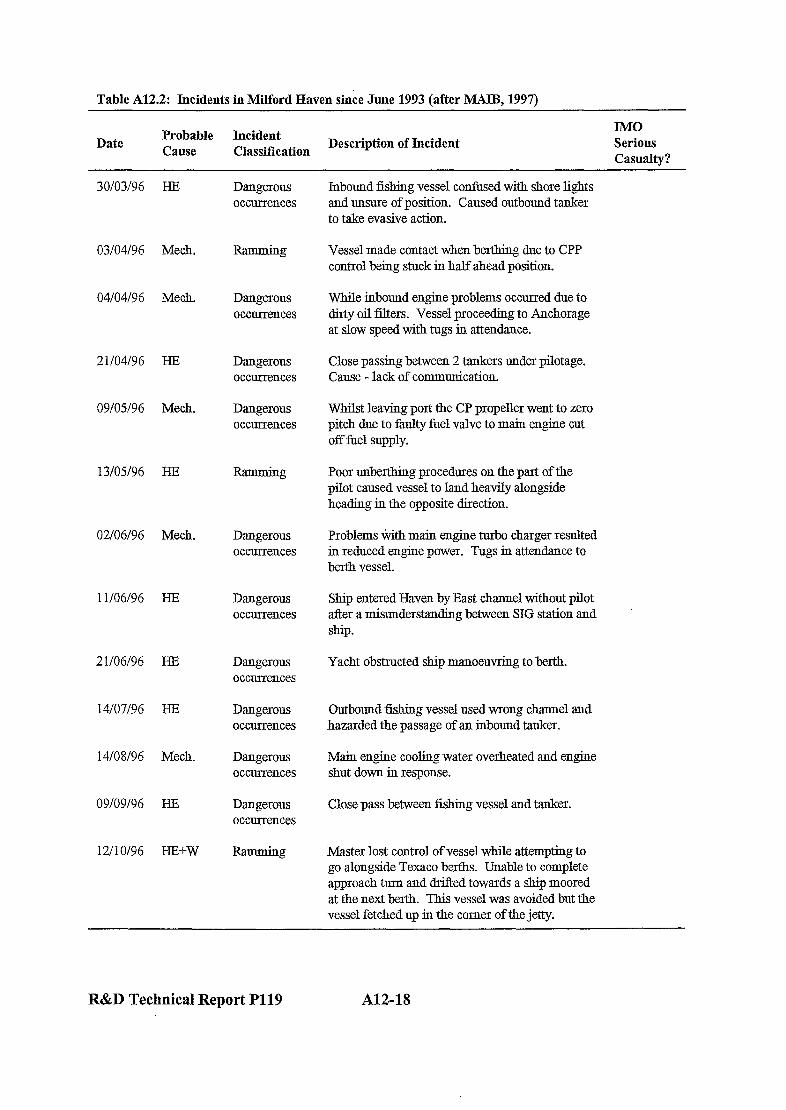
Table A12.2: Incidents in Milford Haven since June 1993 (after MAIB, 1997)
Date Probable Incident Cause Classification
Description of Incident IMO Serious Casualty?
30/03/96 HE Dangerous occurrences
03/04/96 Mech.
04/04/96 Mech.
Ramming
Dangerous occurrences
21104196 HE
09/M/96 Mech.
Dangerous occurrences
Dangerous occurrences
13lW96 HE -g
02lO6l96 Mech. Dangerous occurrences
11/06/96 HE Dangerous occurrences
21/06/96 HE
14lO7J96 HE
Dangerous occurrences
Dangerous occurrences
14lOW96 Mech. Dangerous occurrences
09/09/96 HE Dangerous omunences
12/10/96 HE+W -g
Inbound fishing vessel confused with shore lights and unsnre of position. Caused outbound tanker to take evasive action.
Vessel made contact when berthing due to CPP control being stuck in half ahead position.
While inbound engine problems occurred due to dirty oil filters. Vessel proceeding to Anchorage at slow speed with tugs iu attendance.
Close passing between 2 tankers under pilotage. Cause - lack of communication.
Whilst leaving port de CP propeller went to zero pitch due to faulty fuel valve to main engine cut off fuel supply.
Poor unberthmg procedures on the part of the pilot caused vessel to land heavily alongside heading in the opposite direction.
Problems with main engine turbo charger resulted in reduced engine power. Tugs in attendance to berth vessel.
Ship entered Haven by East channel without pilot after a misunderstanding between SIG station and Ship.
Yacht obstructed ship manoeuvring to berth.
Outbound fishing vessel used wrong channel and hazarded the passage of an inbound tanker.
Main engine cooling water overheated and engine shut down in response.
Close pass between fishing vessel and tanker.
Master lost control of vessel while attempting to go alongside Texaco berths. Unable to complete approach turn and drifted towards a ship moored at the next berth. This vessel was avoided but the vessel fetched up in the comer of the jetty.
Al2-18 R&D Technical Report P119
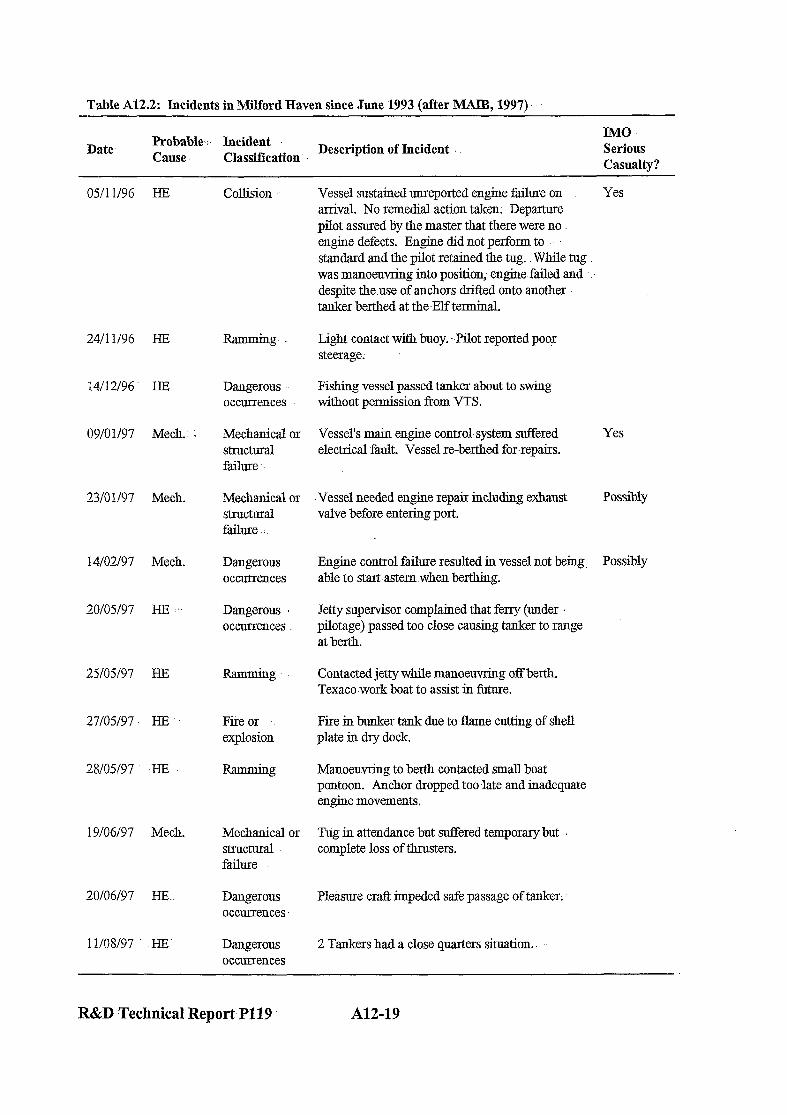
Table A12.2: Incidents in Milford Haven since June 1993 (after MAIB, 1997)
Date Probable : Incident Cause. Classification.
Description of Incident IMO Serious Casualty?
05/11/96 HE
24/I II96 HE
14112196 HE
09/01/97 Mech:
2310 l/97 Mech.
14/02/97 Mech.
20/05/97 HE
25/05/97 HE
27/05/97 HE
28/05/97 -HE
19106197 IMe&.
20106197 HE.
11/08/97 HE
Ramming
Dangerous occurrences
Mechanical or stnlcturd failure
Mechanical or structoral failure . . .
Dangerous occurrences
Dangerous i occurrences
Fire or explosion
Mechanical or StruChUd
failure
Dangerous occurrences
Dangerous occurrences
Vessel sustained unreported engine faiure on Yes arrival. No remedial action taken Departure pilot assured by the master that,there were no engnre defects. Engine didnot perform to standard and the pilot retained the tog. While tug was manoeuvring into position; engine.failed and ‘: despite the use of anchors drifted onto another tanker berthed at the~Elfterminal.
Light contactwith buoy. .-Pilot reported poor steerage;
Fishing vessel passed tanker about to swing without permission ftom VTS.
Vessel’s main engine control.system suffered electrical fault. Vessel re-berthed for.repairs.
Yes
Vessel needed engine repair including exhaust valve before entering port.
Possibly
Engine control failure resulted in vessel not being. Possibly able to start asternwhen berthing.
Jetty supervisor complained that ferry (under pilotage) passed too close causing tanker to range at berth.
Contacted jetty while manoeuvring off berth. Texaco work boat to assist in future;
Fire in bunker tank due to flame cutting of shell plate in dry dock
Mauoeuvriug to.berth contacted small boat pontoon. Anchor dropped too.late and inadequate engiue movements.
Tug iu attendance but suffered temporary but complete loss of thrusters.
Pleasure craft impeded safe passage of tanker.
2 Tankers had a close quarters situation..
R&D Technical Reporb Pl19 A12-19

R&D Technical Report P119 AlZ-20
ANNEX 13: ,ANNEX REFERENCES-
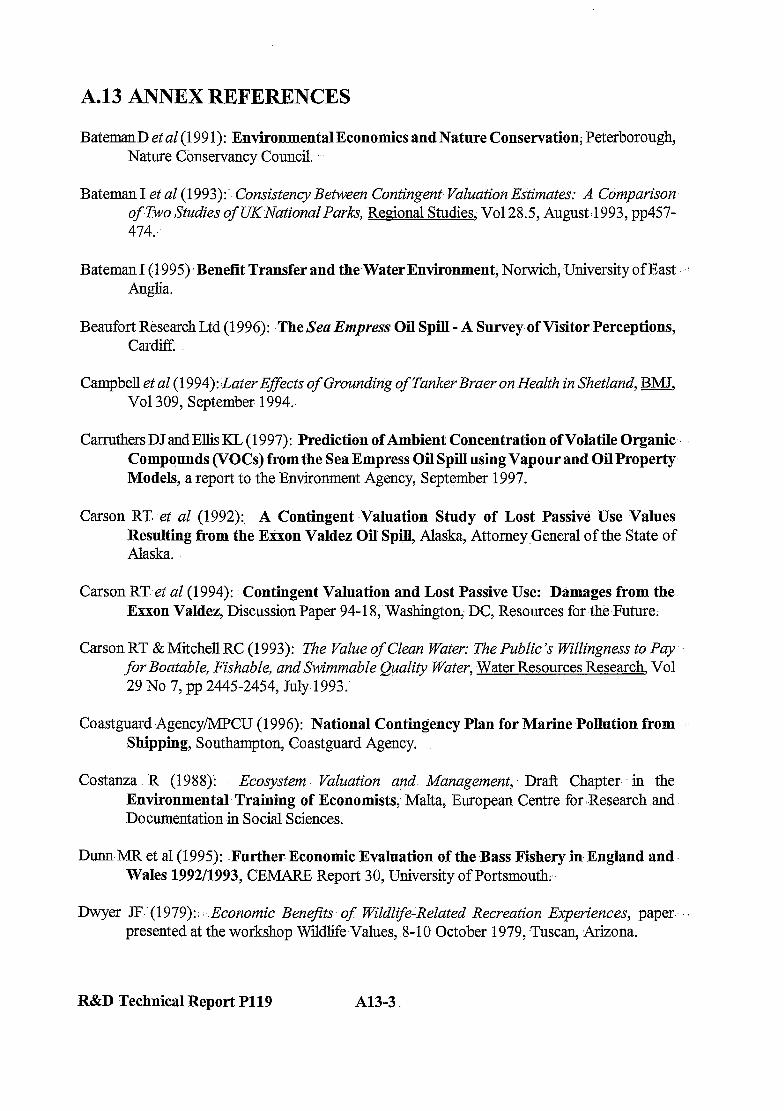
A.13 ANNEX REFERENCES
BatemanD et al (199 1): Environmental Economics and Nature Conservation; Peterborough, Nature Conservancy Council.
Bateman I et al (1993):. Consistency Between Contingent Valuation Estimates: A Comparison of Two Studies of UKNational Parks, Re,tional Studies; Vo128.5, August.1993,.pp457- 474:
Bateman I (1995) .Benefit Transfer and the.Water Environment; Norwich, -University of East : Anglia.
Beaufort Research Ltd (1996): ,The Sea Empress Oil Spill - A Survey of Visitor.Perceptions, ChdiE
Campbell et al (1994): iLater Effects of Grounding of Tanker Braer on Health in Shetland, BMJ. Vol309, September 1994..
Carruthers DJ and Ellis KL (1997): Prediction of Ambient Concentration of Volatile Organic., Compounds (VOCs) from the Sea Empress Oil Spill using Vapour and Oil Property Models, a report to the Environment Agency, September 1997.
Carson RT, %t al (1992): A Contingent Valuation Study of Lost Passive Use Values Resulting from the Etion Valdez Oil’ Spill, Alaska, Attorney General of the State of Alaska.
Carson RT:et al (1994): Contingent Valuation and Lost Passive Use: Damages from the. Exxon Valdez, Discussion Paper 94-l 8,. Washington; DC, Resources for the-Future;
Carson RT & Mitchell RC (1993): The Value of Clean Water: The Public’s Willingness to Pay for Boatable, Fishable, and Swimmable &ality Water,. Water Resources Research, Vol 29 No 7, pp 2445-2454, July.1 993:
Coastguard Agency/MPCU (1996): National Contingency Plan for Marine Pollution from Shipping, Southampton, Coastguard Agency.
Costanza R (1988): Ecosystem ---Valuation and. Management,. Draft Chapter-: in the Environmental~ Training of Economists; Malta, European Centre for *Research and Documentation in Social Sciences.
DunnMR et al (1995): -Further. EconomkEvaluation of the.Bass Fishery in England and Wales 1992/1993, CEMARE Report 30, University of Portsmouth:,
Dwyer JF.(1979):. .Economic Benefits- of. Wildlife-Related Recreation Experiences, paper ” presented at the workshop Wildlife Values,. 8-l 0 October 1979, -Tuscan Arizona.
R&D Technical Report P119 A13-3
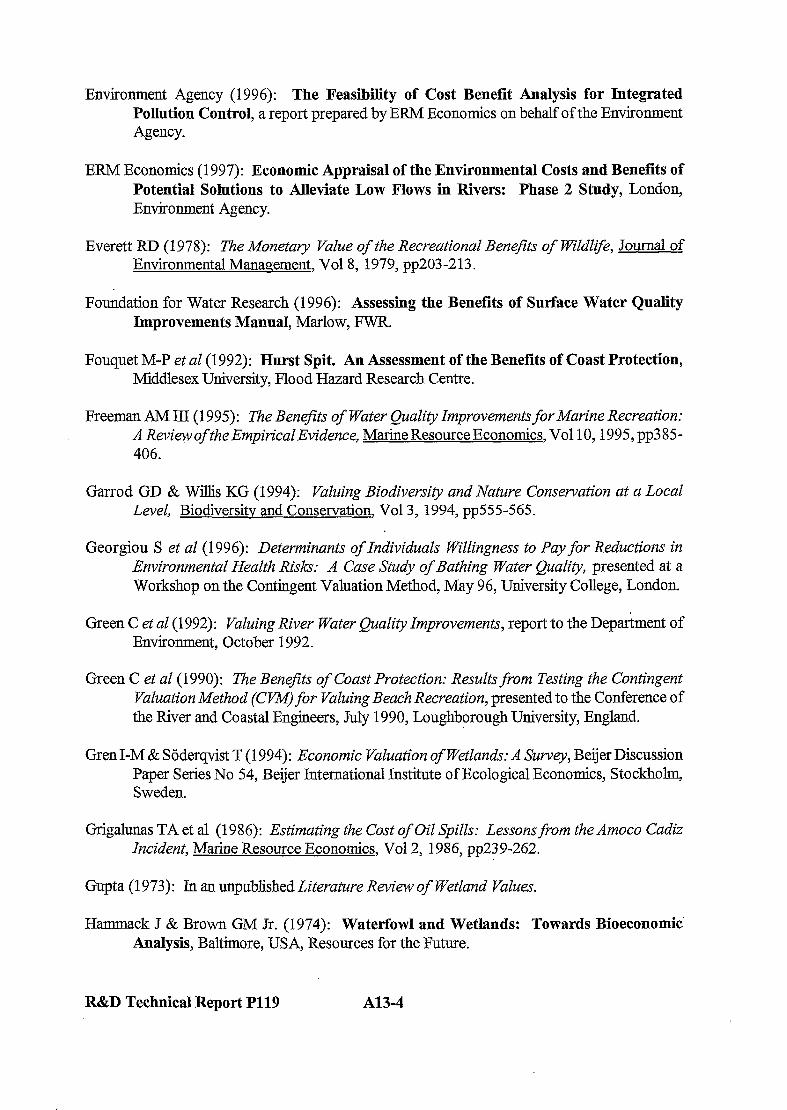
Environment Agency (1996): The Feasibility of Cost Benefit Analysis for Integrated Polhrtion Control, a report prepared by ERM Economics on behalf of the Environment Agency.
ERM Economics (1997): Economic Appraisal of the Environmental Costs and Benefits of Potential Solutions to Alleviate Low Flows in Rivers: Phase 2 Study, London, Environment Agency.
Everett liD (1978): The Monetary Value of the Recreational Benefits of Wildlif Journal of Environmental Management, Vo18, 1979, pp203 -2 13.
Foundation for Water Research (1996): Assessing the Benefits of Surface Water Quality Improvements lllanual, Marlow, FWR.
Fouquet M-P et al (1992): Hurst Spit. An Assessment of the Benefits of Coast Protection, Middlesex University, Flood Hazard Research Centre.
Freeman AM III (1995): The Benefits of Water Quality Improvements for Marine Recreation: A Reviqv of the Empirical Evidence, Marine Resource Economics, Vol 10,1995, pp3 85- 406.
Garrod GD & Willis KG (1994): Valuing Biodiversity and Nature Conservation at a Local Level, Biodiversitv and Conservation, Vo13, 1994, ~~555-565.
Georgiou S et al (1996): Determinants of Individuals Willingness to Pay for Reductions in Environmental Health Risks: A Case Study of Bathing Water Quality, presented at a Workshop on the Contingent Valuation Method, May 96, University College, London.
Green C et al (1992): Valuing River Water Quality Improvements, report to the Department of Environment, October 1992.
Green C et al (1990): The Benefits of Coast Protection: Results from Testing the Contingent Valuation Method (Cm) for Valuing Beach Recreation, presented to the Conference of the River and Coastal Engineers, July 1990, Loughborough University, England.
Gren I-M & Stiderqvist T (1994): Economic Valuation of Wetlands: A Survey, Beijer Discussion Paper Series No 54, Beijer International Institute of Ecological Economics, Stockhohn, Sweden
Grigalunas TA et al (1986): Estimating the Cost of Oil Spills: Lessons from the Amoco Cadiz Incident, Marine Resource Economics, Vo12, 1986, pp23 9-262.
Gupta (1973): In an unpublished Literature Review of Wetland Values.
Hammack J & Brown GM Jr. (1974): Waterfowl and WetIands: Towards Bioeconomic Analysis, Baltimore, USA, Resources for the Future.
R&D Technical Report Pll9 A13-4
Hanley ND (1989): ::. Valuing Rural Recreation ,Benefifs: An Empirical Comparison of Two Approaches, Journal of Aaricultural Economics, Vol40, pp 361-374.
Harley DC & HanleyND (1989): Economic Benefit Estimates for Nature R&serves: Methods and,Results, Stirling, Department of Economics.
Harrison GW & Lesley JC (1996):’ Must Contingent Valuation Suweys Cost SoMuch?, Journal of Environmental Economics and Management, Vo13 1,1996, pp79-95.
IOPC (1996): ,Znternational Oil Pollution Compensation; Funds Annual Report 1996, London, IOPC;
IOPC (1997a):. Incidents Involving the I971 ilFund Sea Empress, Note by the .Director,; International OilPollution CompensationFund. 971, Executive Committee, 54th Session,, Agenda Item 3.
IOPC (1997b): -Incidents Involving the 1971 Fund Sea Empress, Note by the United-Kingdom, Delegation, International Oil Pollution Compensation Fund 1971, Executive Committee, 54th Session;Agenda Item 3.
IOPC (1997c): Incidents. Involving the 1971. Fund Sea Empress, Note by. the Director, International OilPollution CompensationFund 1971, Executive Committee, 55th Session, Agenda Item 3..
Kaoru Y (1993): -- Differentiating Use and.Nonuse Values. for Coastal Pond Water Quality Improvements, Environmental and.Resource Economics, Vol3, 1993, pp487-494.
King 0 (1994): Data Sources for CostBenefit Analysis, .Cardiff, Department of Maritime.: Studies & International Transport.
Loomis JB & Walsh RG (1986): Assessing Wildlif and Environmental Values.in Cost-Benefit Analysis: State ofthe Art; Journal of Environmental Management, Vol22,-pp l25-13 1.
MAIEI (1997a): Recorded,Incidents in Milford Haven simx.1993, Data provided to the Consultants by the Marine,Accident Investigation Branch, Department of Transport (ref MAIB 10/04/01), dated 19 September 1997.
Mattson JS (1979): Compensating States and the.Federal Governmentfor Damages to Natural Resources Resulting from Oil Spills, Coastal Zone Management Journal, -Vol5, 1979, I ~~307-332::
Moore J and Elliot R(1995):. Oil Spill Sensitiviq Maps for the West Coast of Wales, (Second Edition), Oil Pollution Research Unit.Report No. FSC/RC/17/95 for Marathon Oil UK Ltd.
Penning-RowsellEC et al (1992): The Economics of CoastalManagement, London, Belhaven Press.
R&D Technical Report P119 A13;5

Posford Duvivier Environment (1991): Mablethorpe to Skegness Sea Defences Strategic Approach Study, Peterborough, Posford Duvivier Environment.
Rowe RD & Shaw WD (1992): Nestucca Oil Spill, in Natural Resource Damages: Law & Economics, (Eds: Ward KM & Dufheld JW), New York, John Wiley & Sons.
Sandstriim M (1996): Recreational Benefits from Improved Water Quahty: A Random Utility Model of Swedish Seaside Recreation, Stockholm, School of Economics.
Shabman LA & Batie SS (1988): Socio-economic Values for Wetlands: Literature Review, 1970-1985, Wetlands Research Program Technical Report Y-88, Virginia Polytechnic Institute and State University Blacksburg, Virginia.
Simpson D (1997): Report to The Environment Agency on Sea Empress Amenity Impact Survey, Nottingham, Marketing Focus UK Ltd.
Thibodeau FR (1979): Au Economic Analysis of Wetland Protection, Journal of Environmental Management Vol 12,1981, pp19-30.
Turner RK et al (1992): Valuing Environmental Preferences: The United Kingdom Experience, University of East Anglia and University College London, UK.
Wiltman EA (198 1): Hedonic Prices and Beach Recreational Values, Advances in Applied Microeconomics, Vol 1, 198 1, pp77- 103.
WTl3 (1997a): Au Approach to Estimating the Impact of the Sea Empress Incident on Tourism FIows to Pembrokeshire During 1996, Cardiff, WIB.
Other Sources of Background Information
Bockstael et al (1994): Recreation, in Measuring the Demand for Environmental Quality, Eds. Braden JB & Kolstad, North-Holland, Elsevier Science.
Brown G (1982): Estimating rVon-Market Economic Losses from Oil Spills: Amoco Cadiz, Steuati Transpotiation, Zoe Colocotroni, presented at The Cost of Oil Spills, an OECD Seminar, 1982.
Burrows P et al. (1974): Torrey Canton: A Case Study in Accidental Pollution, Scottish Journal of Political Economv, Vol XXI No 3, November 1974, pp 237-258.
Carson RT (1993): The Value of Clean Water: l3e Public’s willingness to Pay for Boatable, Fishable, and Swimmable Quality Water, Water Resource Research Vo129, July 1993, ~~2445-2454.
Garrod GD & Willis KG (1995): Valuing the Benefits of the South Downs Environmentally Sensitive Area, Journal of Aticultural Economics, Vol46,1995, pp 160- 173.
R&D Technical Report P119 A13-6
GosselinkJG et.aZ (1974): The Value of the Tidal,Marsh, Louisiana State University, Center for Wetland Resources.
Graves PE (1994): ~Aesthetics, in Measuring the,Demand foi Environmental Quality; Eds. Braden JB & Kolstad, .North-Holland,. Elsevier Science.
Guillotreau P & CunninghamS (1994): -An Economic Appraisal of the Solent Oyster Fishery: Historical and Institutional Aspects,. CEMARE Research Paper, No 65,22pp.
Hayes KM et al (1992): Estimating the Benefits of Water Quality Improvements in the Upper. Narragansett Bay, Marine Resource Economics, Vol7; 1992, ~~75-85..
Kerry Smith V & Pahnquist IX% (1993):. Temporal Substitution and the Recreational Value of Coastal Amenities, Discussion Paper QE93-09 for Resources forthe Future, April .1993 . .
Larson JS (1988): Wetland Value.Assessment, Wetland and Shallow Continental Water Bodies, Vol 1, 1988, (proof in press).
Martinka C (1979): An Ecological Approach. to Measuting FF/ildlif Values, paper presented at, the workshop Wildlife Values, 8- 10 October 1979, Tuscan,: Arizona.
National Rivers Authority (1993): Economic Appraisal Manual (DraR);.Bristol, NRA.
Oster S (1977): ,$~~ey Results on the Benefits of. Water Pollution Abatement in the Merrimack River.Basin; Water Resources Research Vol,l3, December.1 977; ~~882-884.
Parsons GR & Kelly MJ (1992): Randomly Drawn Opportunity Sets in A Random Utility Model of Lake Recreation, Land Economics, Vo168 No -1, pp 93-106, February .1992,
Parsons GR & Hauber AB (1996): Spatial Boundaries and Choice SetDefinition in a Random Utility Model of Recreation Demand, Land Economics (in press). .
Parsons GR-& Kealy MJ (1995): .A Demand.7Yteoryfor.Number of ,Tnps in A Random Utility Model of Recreation, Journal of Environmental Economics and Management, Vo129, pp 357-367.
Parsons GR & Kelly MJ (1997)i: Incidental and Joint Consumption in Recreation Demand, A@culture and Resource Economics Review, April 1997.
Parsons GR & Kesily MJ (1994): Benefit Transfer in a Random Utility Model of Recreation, Water Resources Research, Vo13 0 No 8, pp ,2477-2484;‘August. 1994.
Payne BR & DeGraf RM (1975): Economic Values and Recreational .Trends Associated with Human Enjoyment of Nongame Birds, in Proceedings of the Symposium on Management of.Forest and Range Habitats for Non-Game Birds, US Department of Agriculture Forest Service, Technical Report No. 1.
R&D Technical Report P119 ‘.; A13-7
Posford Duvivier Environment (1990): An Assessment of Habitat Mitigation Options for the Proposed East Sands Reclamation Scheme, Leith Docks, Peterborough, PDE.
Potten S et al (1992): Information Needs and the Management of Joint Commercial and Recreational Fisheries: the UK Fishery for Sea Bass (Dicentrarchus labrax), paper presented at the VIth International Conference of the International Institute of Fisheries Economics and Trade (IIFET), Paris, 6-9 July 1992.
Potten SD (1990): 1989 Survey of Boat Anglers in England and Wales, CEMARE Research Paper, No 33, 63 pp.
Potten SD (1990): A Revised Methodology for Estimating the Relative Size of the Annual Recreational Catch of Bass in England and Wales over the Period 1986-88,. CEMARE Research Paper, No 34,25 pp.
Randall A (1994): Total and Nonuse Values, in Measuring the Demand for Environmental Quality, Eds. Braden JB & Kolstad, North-Holland, Elsevier Science.
Sebek V (19982): Compensation for Oil Pollution Damage to Seabirds: Legal and Economic Assessment, presented at The Cost of Oil Spills, an OECD Seminar, 1982.
Seip KL, & Hem K-G (1993): Contingent Evaluations of Marine Natural Resources are Non Consistent, Marine Pollution Bulletin, Vol26, July 1993, ~~404-404.
Steinhoff HW (1979): Analysis of Major Conceptual Systems for Understanding and Measuring Wildlz@ Values, paper presented at the workshop Wildlife Values, 8-10 October 1979, Tuscan, Arizona.
Thilbodeau FR (1979): An Economic Analysis of Wetland Protection, Journal of Environmental Management Vol12, 1981, pp19-30.
U.S.D.C. In an unpublished Literature Review of Wetland Values.
Whitehead JC (1993): Total Economic Values for Coastal and Marine Wildlife: Specification, Validity, and Valuation Issues, Marine Resource Economics, Vol8, 1993, pp 119-132.
Willis KG (1990): Valuing Non-Market Wzldlzif Commodities: An Evaluation and Comparison of Benefits and Costs, Annlied Economics, Vol22,1990, ~~13-30.
Willis KG & Benson JF (1988): A Comparison of User Benefits and .Costs of Nature Conservation at Three Nature Reserves, Regional Studies, Vo122.5, February 1988, ~~417-228.
Willis KG et al (1994): Benefits of Environmentally Sensitive Area Policy in England: A Contingent Valuation Assessment, Journal of Environmental Management, Vol44,1995, ~~105-125.
R&D Technical Report Pll9 A13-8
Related Documents


