SDS-PAGE gel analysis SDS-PAGE analysis is done to study the expression of a protein from the control and the sample, to detect the molecular weight of the protein using the molecular weight marker and to detect the quantity by the intensity of the protein. For this purpose IMAGE QUANT TL(IQTL) software is used. Related LOs: Standard markers, Quantitation, IQTL software > Prior Viewing – IDD-6. Extraction of serum protein, IDD-11. Protein quantification, IDD-17. SDS-PAGE, IDD-19. Coomassie staining > Future Viewing – IDD-26. Spot picking, IDD-30. Matrix Instrumentation Course Name: SDS-PAGE gel analysis Level(UG/PG): UG Author(s): Dinesh Raghu, Vinayak Pachapur Mentor: Dr. Sanjeeva Srivastava *The contents in this ppt are licensed under Creative Commons Attribution-NonCommercial- ShareAlike 2.5 India license

SDS-PAGE gel analysis SDS-PAGE analysis is done to study the expression of a protein from the control and the sample, to detect the molecular weight of.
Dec 23, 2015
Welcome message from author
This document is posted to help you gain knowledge. Please leave a comment to let me know what you think about it! Share it to your friends and learn new things together.
Transcript
SDS-PAGE gel analysisSDS-PAGE analysis is done to study the expression of a protein from the control and the sample, to detect the molecular weight of the protein using the molecular weight marker and to detect the quantity by the intensity of the protein. For this purpose
IMAGE QUANT TL(IQTL) software is used.
Related LOs: Standard markers, Quantitation, IQTL software > Prior Viewing – IDD-6. Extraction of serum protein, IDD-11. Protein quantification, IDD-17. SDS-PAGE, IDD-19. Coomassie staining > Future Viewing – IDD-26. Spot picking, IDD-30. Matrix Instrumentation
Course Name: SDS-PAGE gel analysis Level(UG/PG): UG Author(s): Dinesh Raghu, Vinayak Pachapur Mentor: Dr. Sanjeeva Srivastava
*The contents in this ppt are licensed under Creative Commons Attribution-NonCommercial-ShareAlike 2.5 India license

Learning objectives
After interacting with this learning object, the learner will be able to:
1. Identify the molecular weight for the protein of interest
2. Analyze the protein based on the intensity of the band
3. Infer the steps involved in the software
4. Assess the troubleshooting steps involved in the experiments.
5
3
2
4
1
Master Layout
5
3
2
4
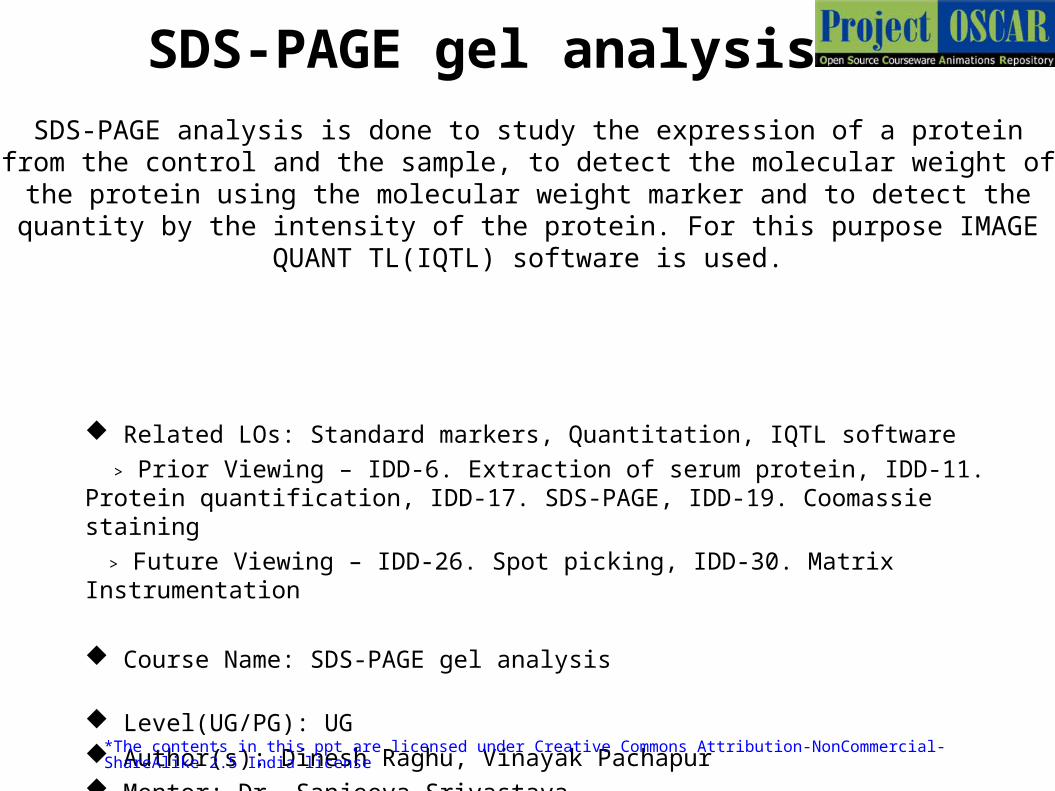
1Start up window &
Gel loading(Slide: 5-8)
Gel Analysis(Slide: 9-16)
Band Detection(Slide: 17-18)
Molecular size calculation(Slide: 19-20)
Quantification (Slide: 21-24)
Display a image from each of these steps, with user click.
SDS-PAGE gel image should be changed
Definitions and Keywords
5
3
2
4
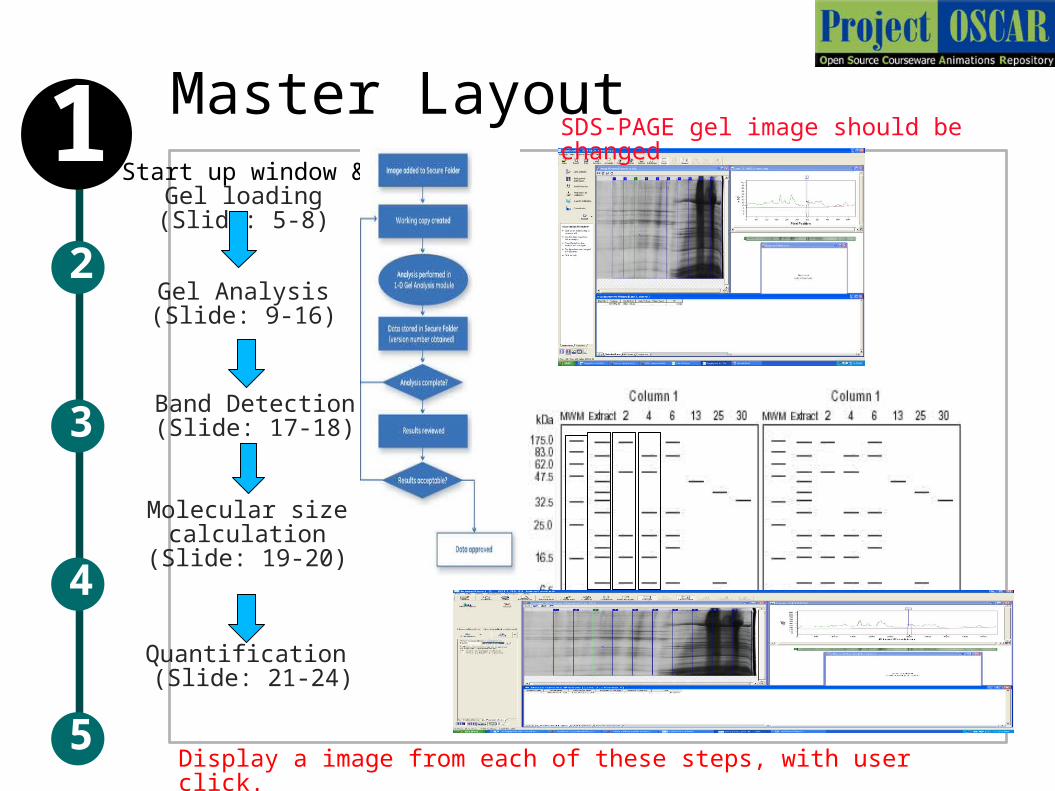
11. IQTL: Image Quant TL from the GE healthcare provides us tools for analysing
1D gels, array channels, Colony counting. The software is user friendly and faster for quantifying the amount of proteins in the sample without any wetlab quantification studies.
2. Molecular Marker: these are specific markers of known size used to identify proteins of unknown size. Molecular markers come in different range to provide a wide range for protein size comparison.
Step 1: Audio Narration
Description of the action
T1: Start up window
5
2
1
4
3
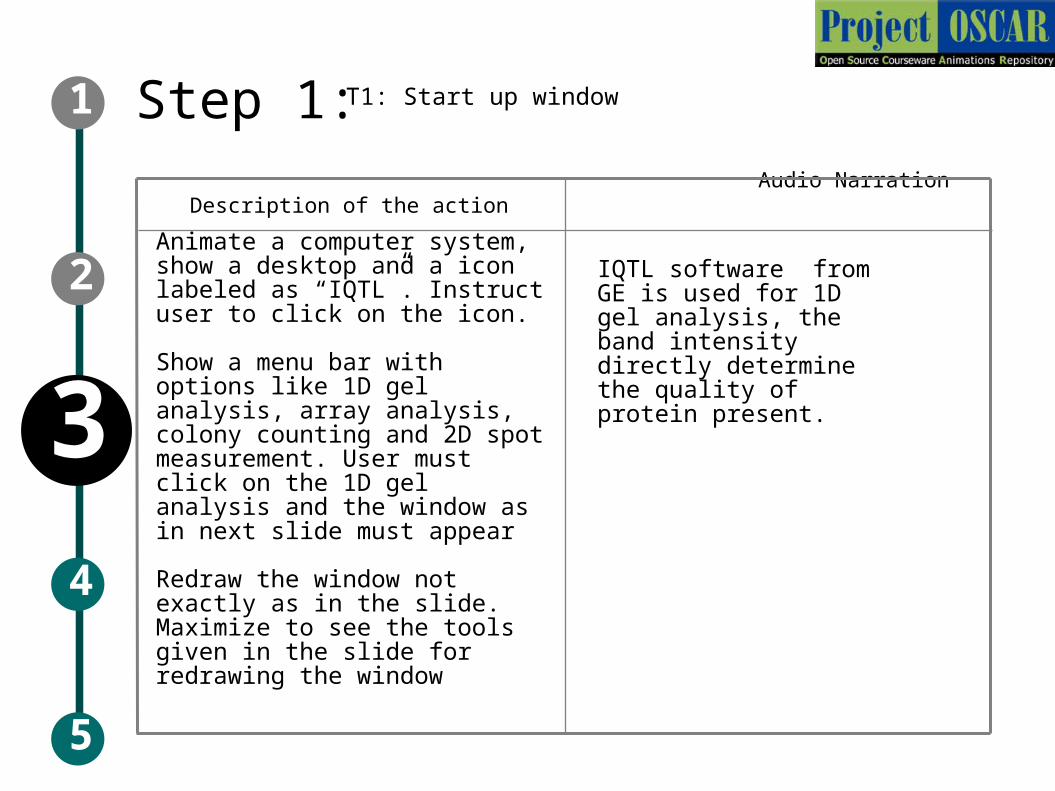
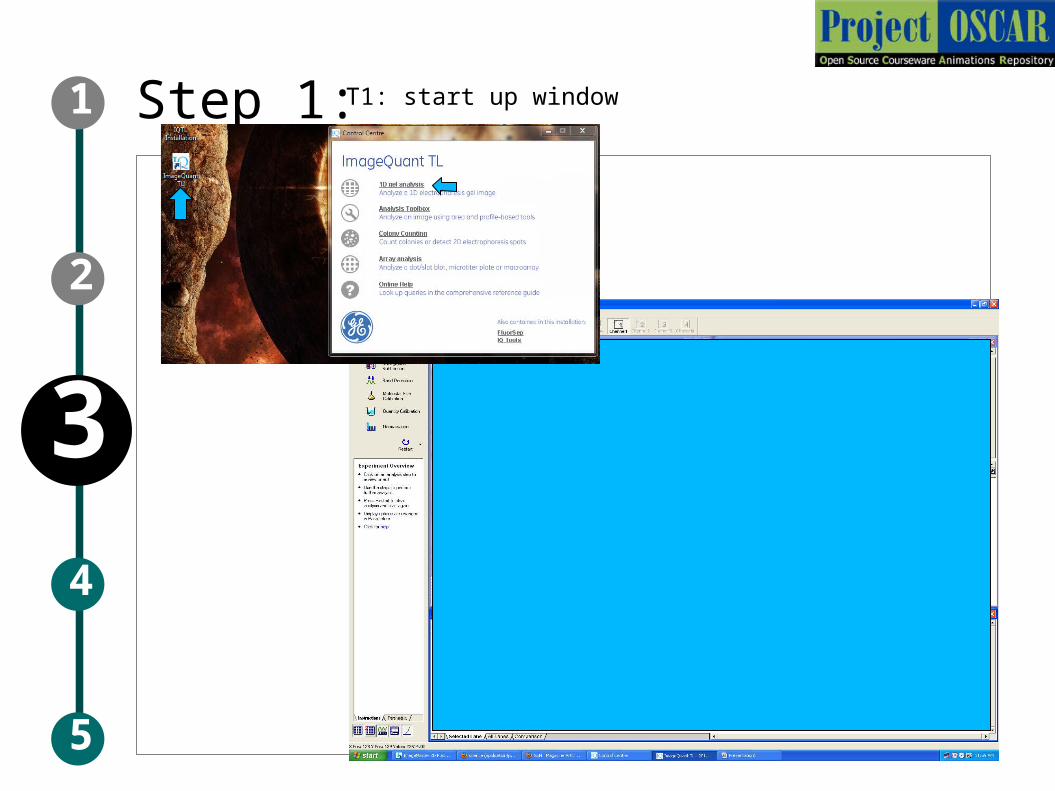
Animate a computer system, show a desktop and a icon labeled as “IQTL”. Instruct user to click on the icon.
Show a menu bar with options like 1D gel analysis, array analysis, colony counting and 2D spot measurement. User must click on the 1D gel analysis and the window as in next slide must appear
Redraw the window not exactly as in the slide. Maximize to see the tools given in the slide for redrawing the window
IQTL software from GE is used for 1D gel analysis, the band intensity directly determine the quality of protein present.
Step 1: T1: start up window
5
2
1
4
3

Step 2: Audio Narration
Description of the action
T1: Gel loading
5
2
1
4
3
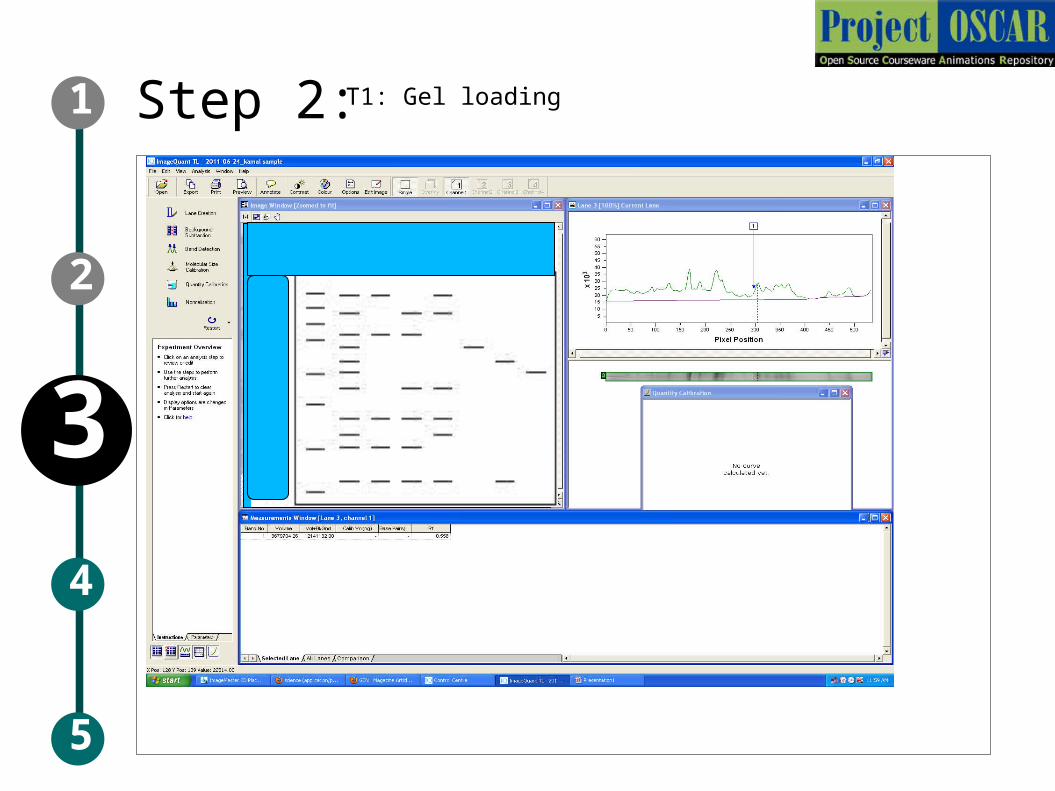
Animate like user click on the file toolbar and show a drop down menu for open, save, save as options.
Instruct user to click on the open and animate a small window with files labeled as “gel 1, gel 2 and gel 3” in list view.
Instruct user to select gel1, user should click on the hand for selection and show the window with a figure as shown in next slide
Load the gel for analysis in to the software, the gel on which analysis need to carried out must be loaded on the software.
Step 2: T1: Gel loading
5
2
1
4
3
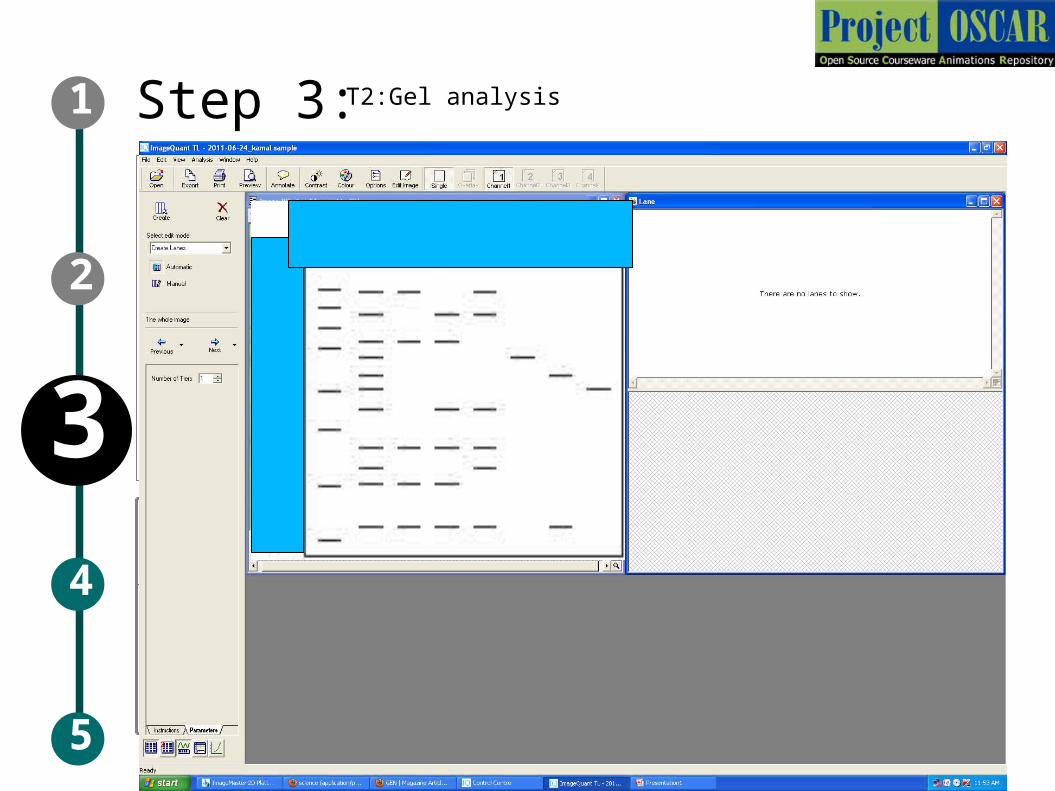
Step 3: T2:Gel analysis
5
2
1
4
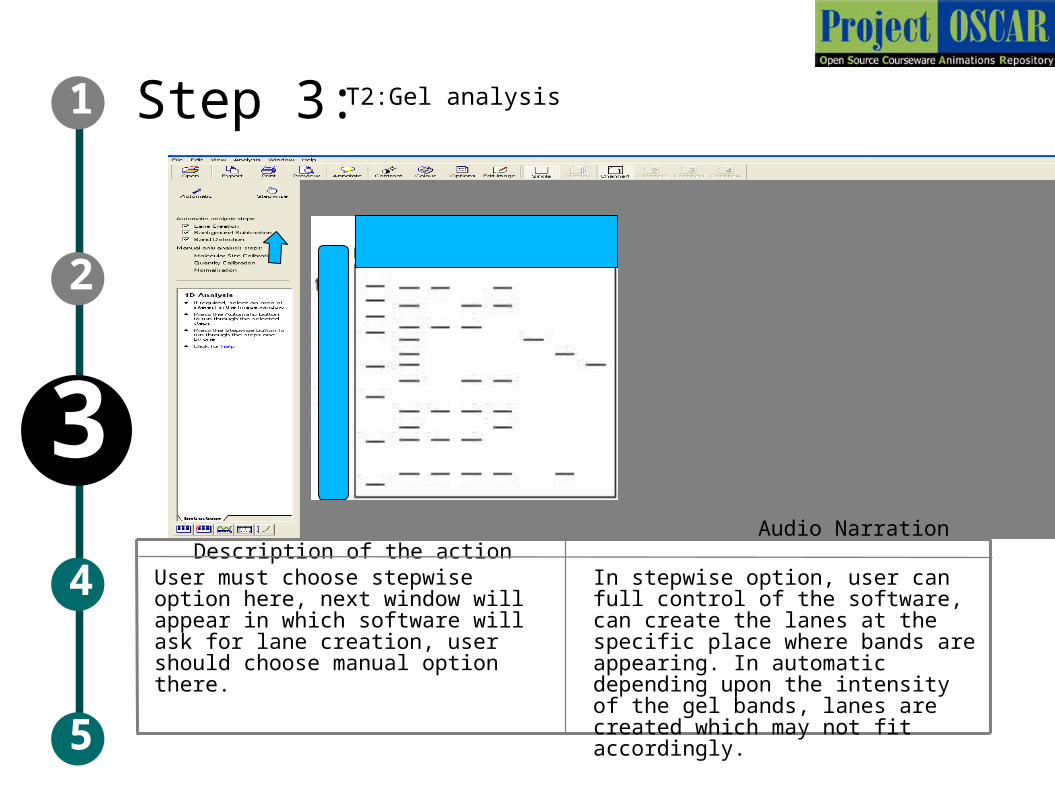
3User must choose stepwise option here, next window will appear in which software will ask for lane creation, user should choose manual option there.
Audio Narration Description of the action
In stepwise option, user can full control of the software, can create the lanes at the specific place where bands are appearing. In automatic depending upon the intensity of the gel bands, lanes are created which may not fit accordingly.
Step 3:
Audio Narration
(if any)
Text to be displayed (if any)(DT)
Description of the action/ interactivity
T2:Gel analysis
Image/graphic for the step
5
2
1
4
3

Fill the number of lanes here
Step 3: Audio Narration
Description of the action
T2:Gel analysis
5
2
1
4
3
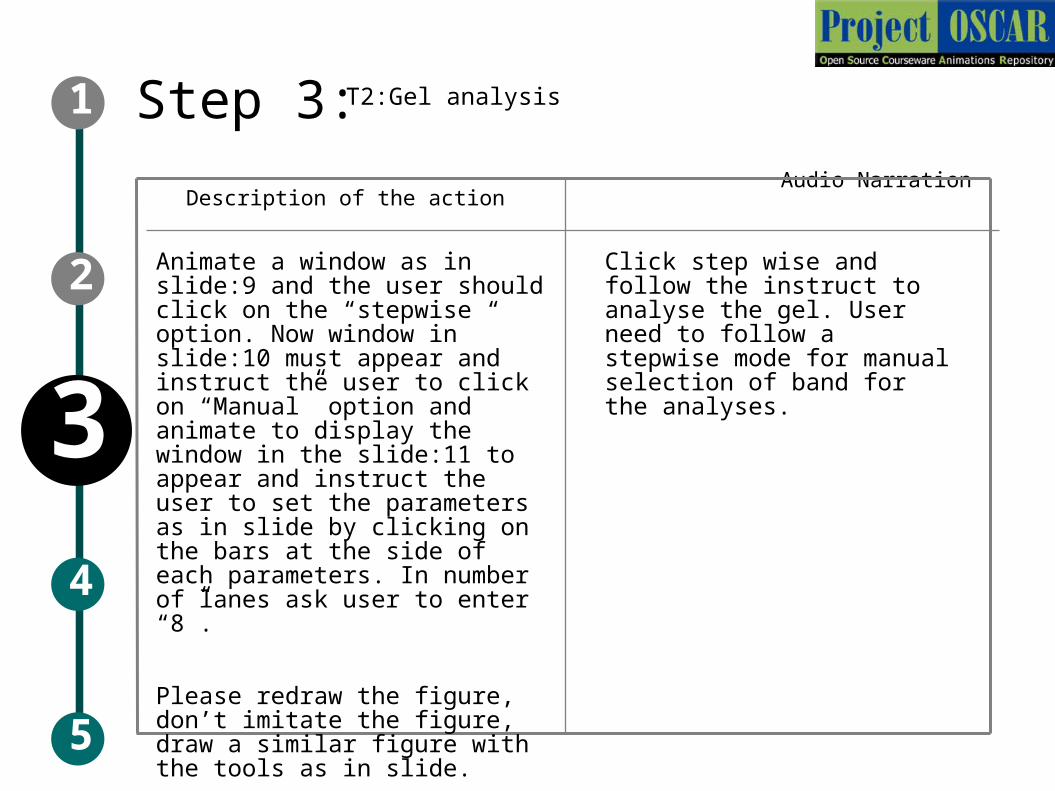
Animate a window as in slide:9 and the user should click on the “stepwise “ option. Now window in slide:10 must appear and instruct the user to click on “Manual” option and animate to display the window in the slide:11 to appear and instruct the user to set the parameters as in slide by clicking on the bars at the side of each parameters. In number of lanes ask user to enter “8”.
Please redraw the figure, don’t imitate the figure, draw a similar figure with the tools as in slide.
Click step wise and follow the instruct to analyse the gel. User need to follow a stepwise mode for manual selection of band for the analyses.
Step 4:
5
2
1
4
3
1 2 3 4 5 6 7 8
T2:Gel analysis
Step 4: Audio Narration Description of the action
5
2
1
4
3
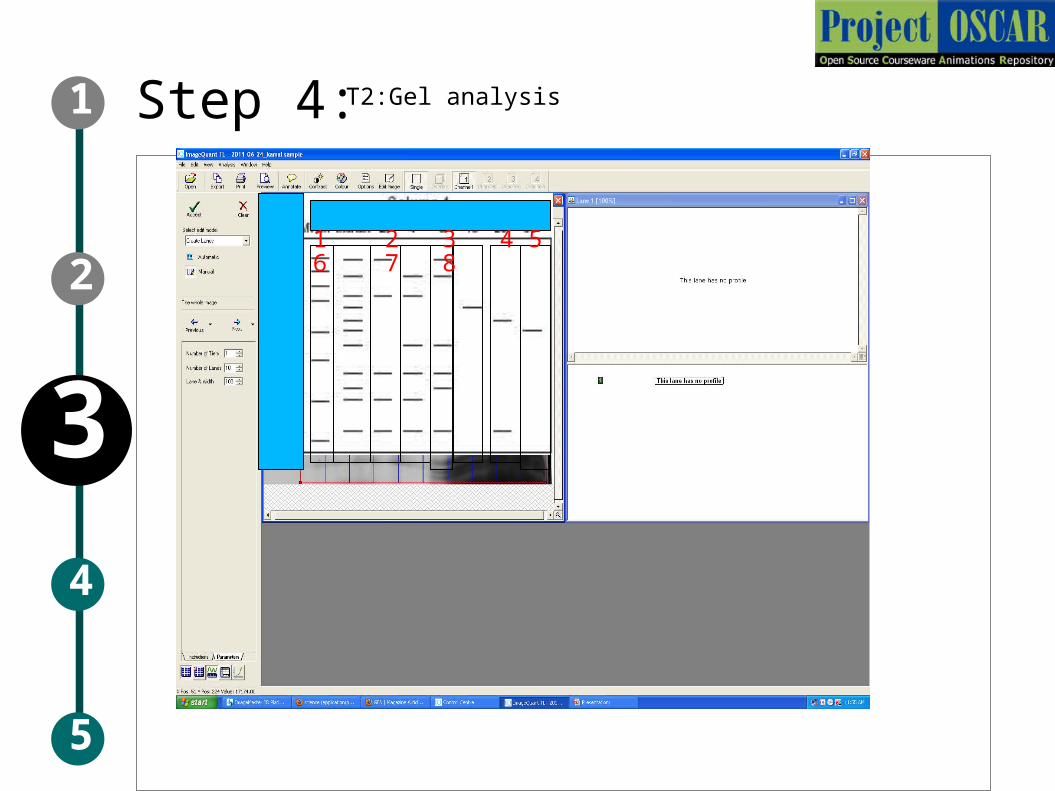
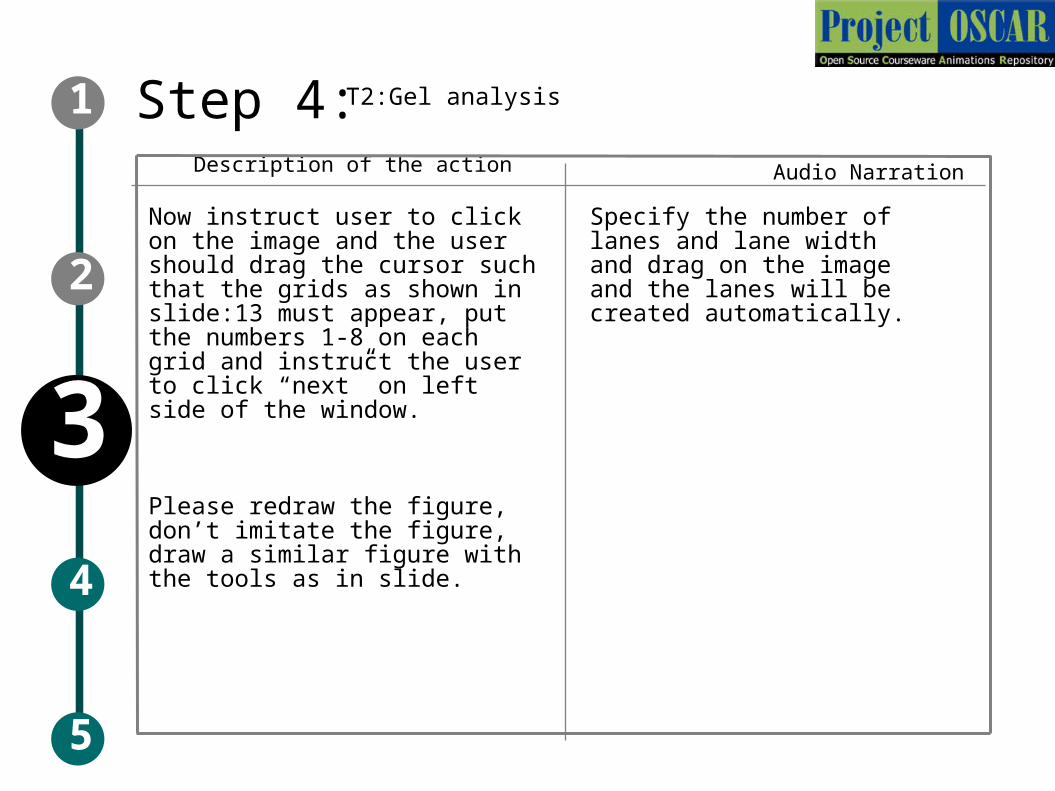
Now instruct user to click on the image and the user should drag the cursor such that the grids as shown in slide:13 must appear, put the numbers 1-8 on each grid and instruct the user to click “next” on left side of the window.
Please redraw the figure, don’t imitate the figure, draw a similar figure with the tools as in slide.
Specify the number of lanes and lane width and drag on the image and the lanes will be created automatically.
T2:Gel analysis
Step 5:
5
2
1
4
3
T2:Gel analysis
Step 5: Audio Narration Description of the action
5
2
1
4
3
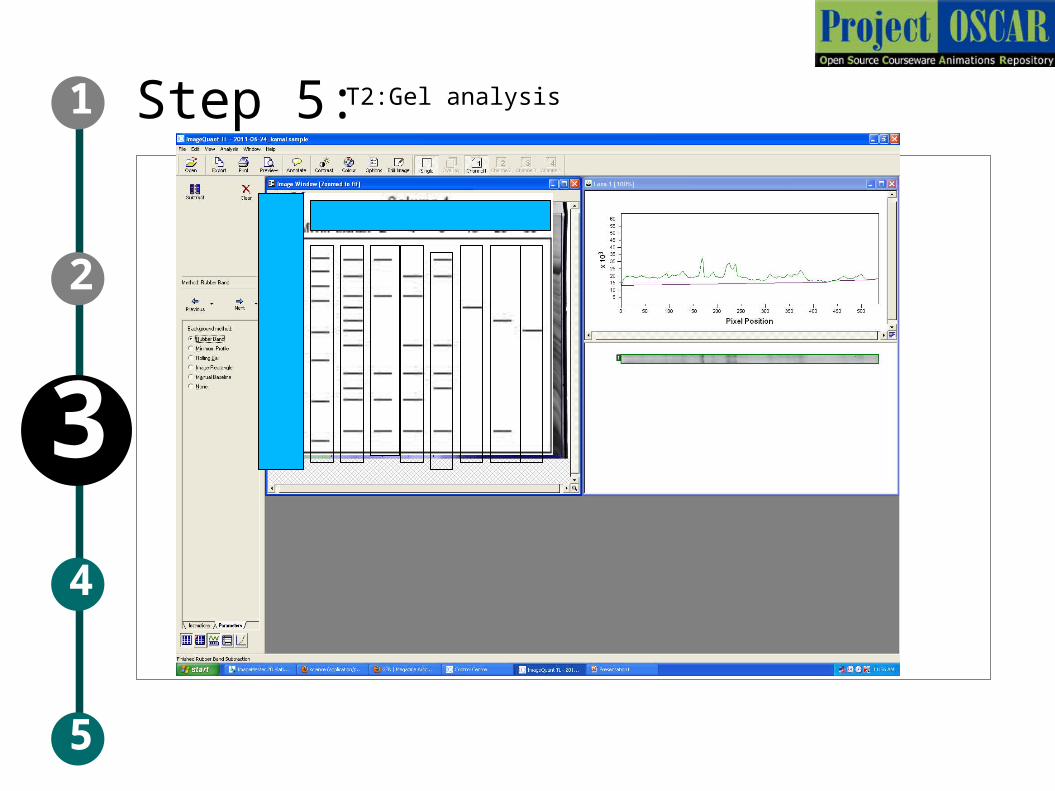
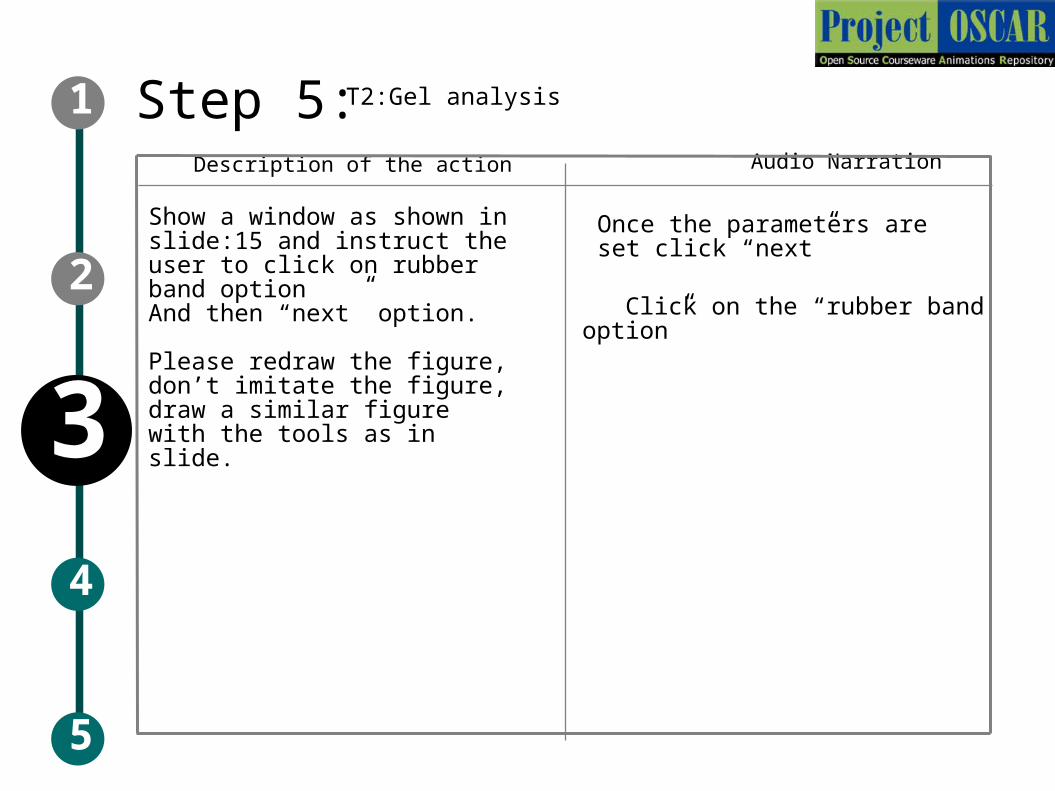
Show a window as shown in slide:15 and instruct the user to click on rubber band optionAnd then “next” option.
Please redraw the figure, don’t imitate the figure, draw a similar figure with the tools as in slide.
Click on the “rubber band option”
Once the parameters are set click “next”
T2:Gel analysis
Step 5: T3: Lane Detection (Band detection)
5
2
1
4
3
Step 5: Audio Narration
Description of the action
5
2
1
4
3
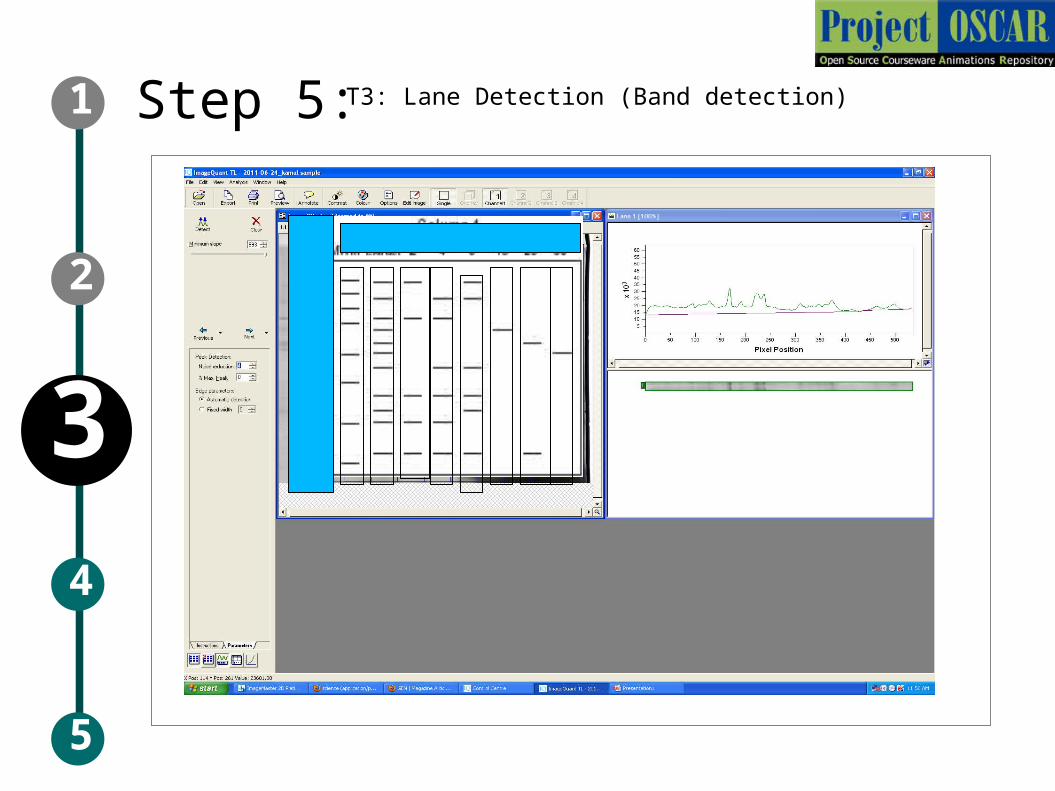
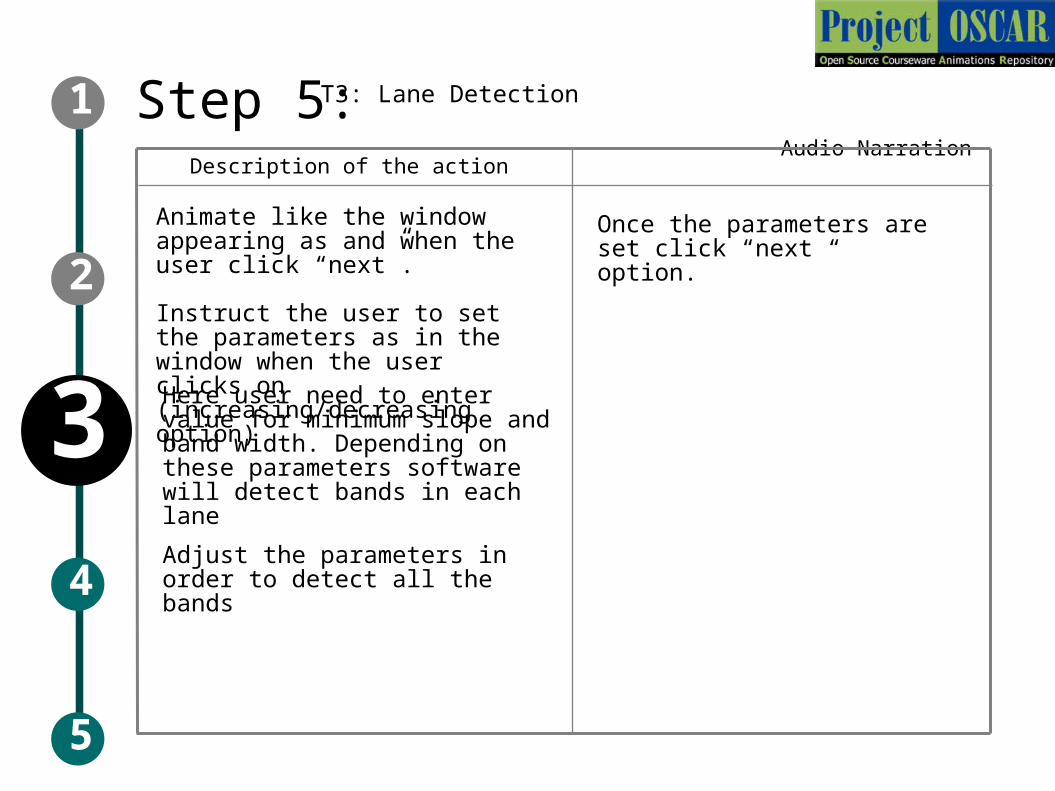
Animate like the window appearing as and when the user click “next”.
Instruct the user to set the parameters as in the window when the user clicks on (increasing/decreasing option)
Once the parameters are set click “next “ option.
T3: Lane Detection
Here user need to enter value for minimum slope and band width. Depending on these parameters software will detect bands in each lane
Adjust the parameters in order to detect all the bands
Step 6:
5
2
1
4
3
1 2 3 4 5 6 7 8
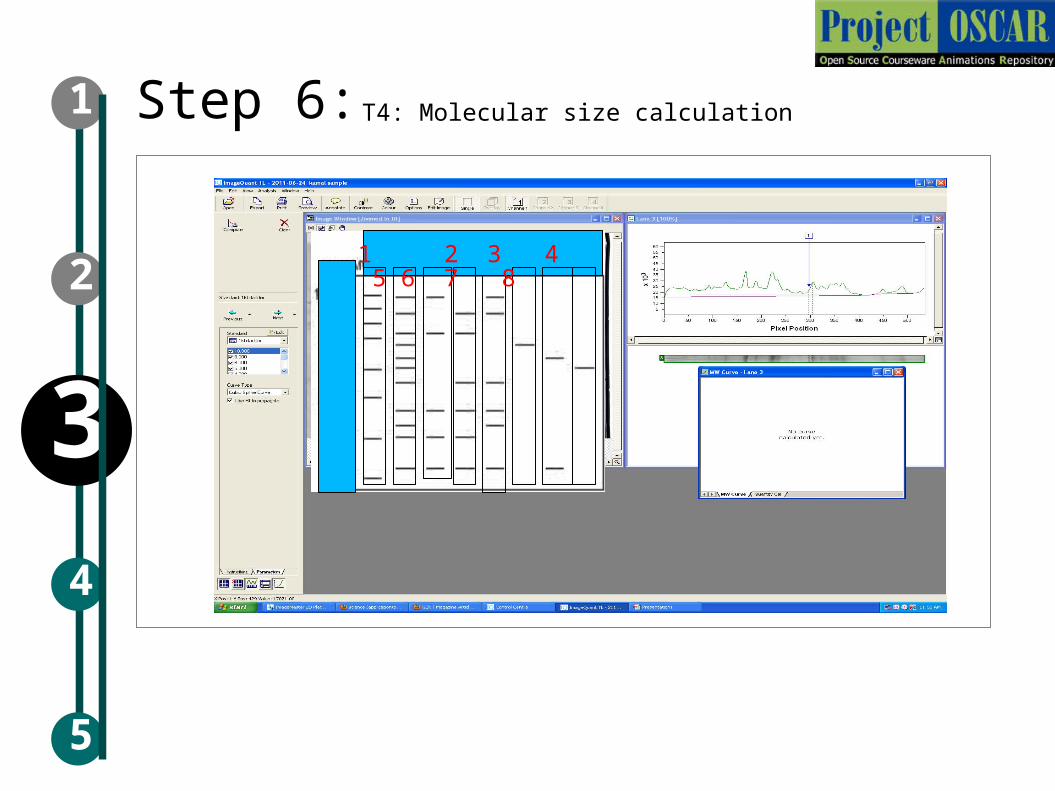
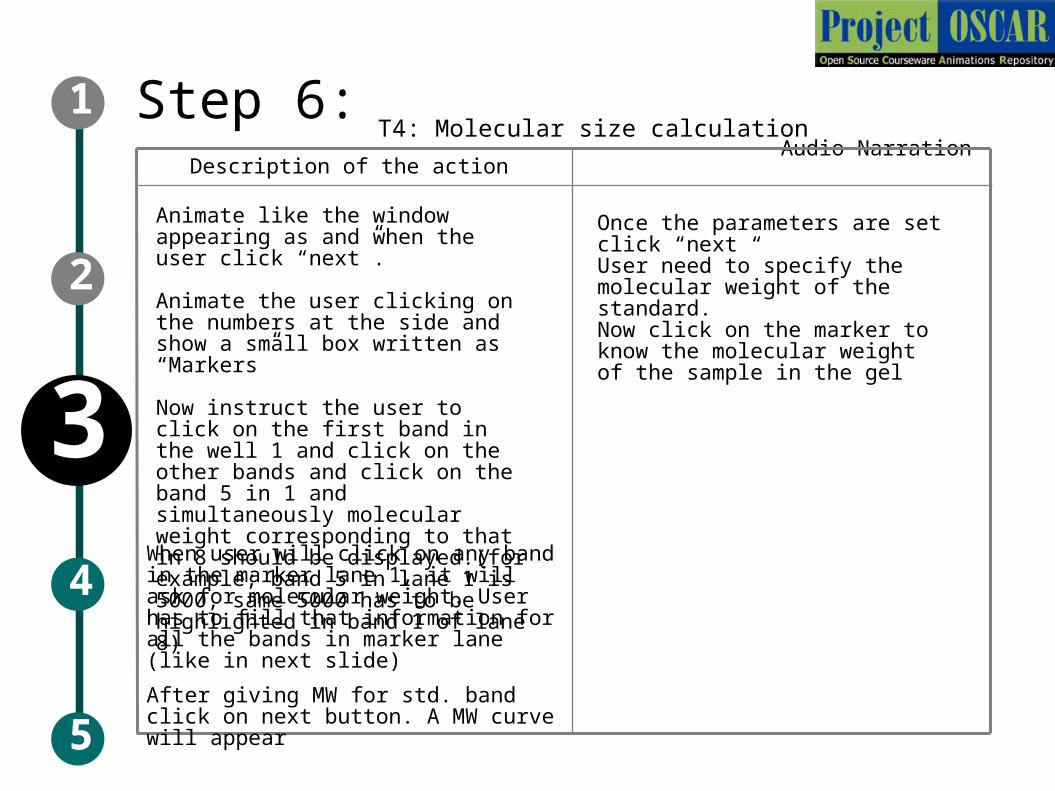
T4: Molecular size calculation
Step 6: Audio Narration
Description of the action
5
2
1
4
3
Animate like the window appearing as and when the user click “next”.
Animate the user clicking on the numbers at the side and show a small box written as “Markers”
Now instruct the user to click on the first band in the well 1 and click on the other bands and click on the band 5 in 1 and simultaneously molecular weight corresponding to that in 8 should be displayed.(for example; band 5 in lane 1 is 5000, same 5000 has to be highlighted in band 1 of lane 8)
Once the parameters are set click “next “User need to specify the molecular weight of the standard.Now click on the marker to know the molecular weight of the sample in the gel
T4: Molecular size calculation
When user will click on any band in the marker lane 1, it will ask for molecular weight. User has to fill that information for all the bands in marker lane (like in next slide)
After giving MW for std. band click on next button. A MW curve will appear

Step 7:
5
2
1
4
3
1 2 3 4 5 6 7 8
T5: Quantification

Step 7: Audio Narration
Description of the action
5
2
1
4
3
Show the window as in slide 22 as and when the user clicks “next” and please redraw the figure with same tools without mimicking exactly the window.
Now show the drop down menu where” nanogram, microgram, milligram” options has to be inserted.
Now ask the user to click on the nanogram and ask him to click “next”
Specify the unit in which the quantity of the protein has to be displayed.
T5: Quantification

Step 8:
5
2
1
4
3
1 2 3 4 5 6 7 8
T5: Quantification

Step 8: Audio Narration
Description of the action
5
2
1
4
3
Now instruct the user to click on one of the band in lane 5 and simultaneously the quantification value has to be displayed as in the slide: 23.
Please redraw the figure and tools without exactly mimicking the window
Click on the band to know the quantification value of the protein band.
Once the protein quantification is done, gel can be taken for protein identification by spot picking. Please do follow the future viewing IDD for more information.
T5: Quantification
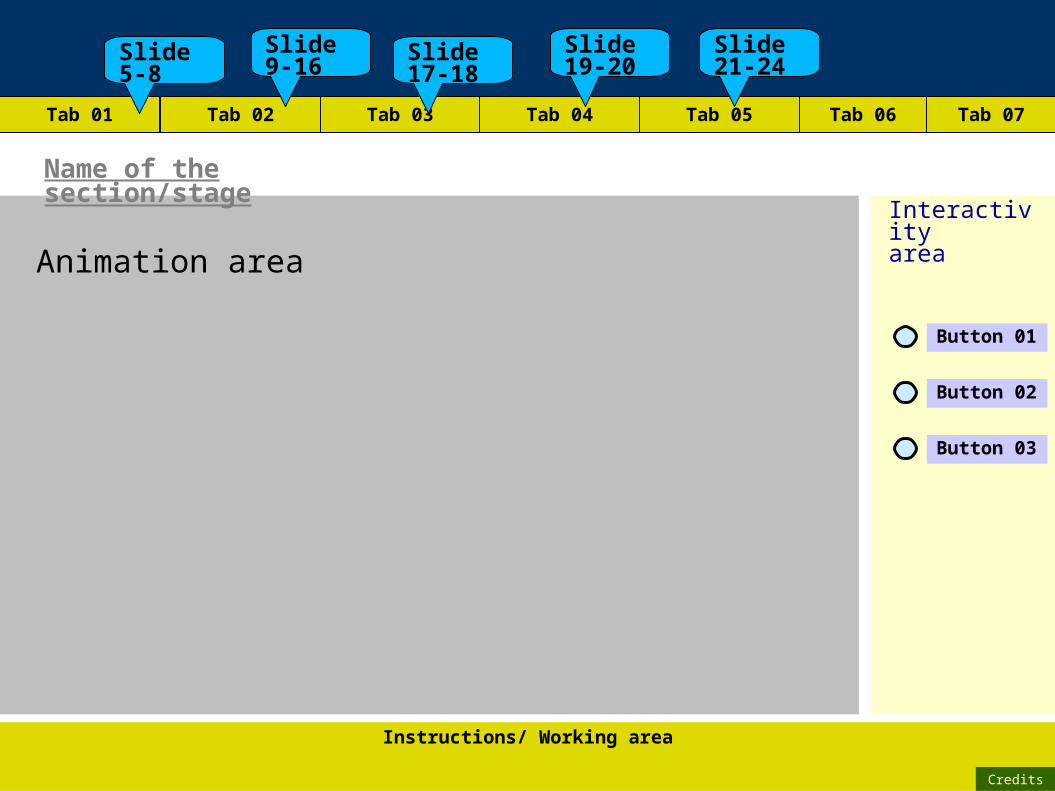
Animation area
Instructions/ Working area
Credits
Name of the section/stage
Interactivityarea
Tab 02 Tab 03 Tab 04 Tab 05 Tab 06 Tab 07
Button 01
Button 02
Button 03
Tab 01
Slide 5-8
Slide 9-16
Slide 17-18
Slide 19-20
Slide 21-24
Links for further reading
Reference websites:
1.www.whitelabs.org/instrument%20manuals/typhoon/IQ%20TL%202003%2003.pdf
2.www.gelifesciences.com
APPENDIX 2

Summary
APPENDIX 3
Software requires loading of gel, setting the parameters to detect the lane, band creation, molecular weight detection and quantification. The software converts the image intensities to numerical value of optical density helps to calculates precise quantitative data across a wide range of concentrations.
Related Documents