Flexible Plug and Play Implementation of active voltage and active power flow management within FPP Trial area - SDRC 9.6 By UK Power Networks December 2014 ukpowernetworks .co.uk /innovation

Welcome message from author
This document is posted to help you gain knowledge. Please leave a comment to let me know what you think about it! Share it to your friends and learn new things together.
Transcript

| 1
Flexible Plug and PlayImplementation of active voltage and active power flow management within FPP Trial area - SDRC 9.6By UK Power Networks
December 2014
ukpowernetworks.co.uk/innovation

Acknowledgement
The authors gratefully acknowledge the support from the
UK Power Networks team involved in the project and in
particular the valuable inputs from Mr. Sotiris Georgiopoulos,
Mr. Sam Chachulski, Dr. Martin Wilcox, Ms. Laura Hannant
and Mr. Paul Measday from UK Power Networks in reviewing,
developing and finalising this report. The authors would also
like to thank Finlay McNicol, Mr. Dhurian Vitoldas and Prof.
Graham Ault from Smarter Grid Solutions; and Dr. Maciej
Fila from Fundamentals for their valuable input to the work
presented in this report.
AuthorsMr. Tim Manandhar, Mr. Gilbert Manhangwe,
Mr. Paul Pretlove and Dr. Panagiotis Papadopoulos -
UK Power Networks
Mr. Emmanuel Cerqueira - EDF Energy R&D UK

Definitions
Active Network
Management (ANM)
Automatic Voltage Control (AVC)
Back-haul
Canopy
Combined Heat and Power (CHP)
Communications platform
Distributed Generation (DG)
Distributed Network Protocol
(DNP3)
Dynamic line rating (DLR)
ENMAC
Flexible Connections
IEC 61850
Intertripping
Low Carbon Network Fund (LCNF)
Term
Autonomous, software-based control system that monitors grid conditions
and issues instructions to distributed generators or other field devices in order
to maintain the distribution network within operating limits.
Substation level system that is used to maintain the substation voltage at a
constant value and within the statutory limits.
The back-haul network is the communications connection between the RF
Mesh Network and Active Network Management (ANM) solution for data
exchange. Also, the management connection between the RF Mesh Network
and GridScape management application.
Geographical coverage of the RF Mesh Network and the consequent footprint
for communications connection.
Co-generation or use of power plant to simultaneously generate electricity
and useful heat.
The communications platform installed and commissioned in the FPP trial in
March 2013. It is based on the Radio Frequency wireless mesh technology.
Electricity generation connected to the distribution network.
Communication protocol widely used currently in the utilities industry.
System for calculating real-time ratings of overhead lines based on actual
weather data.
The system that UK Power Networks is using at Control Centre level to
manage its distribution network in the Eastern region.
Generation customers connected to the distribution network whose output
can be controlled by the DNO for operational purposes.
The International Electrotechnical Committee’s Standard for the design of
electrical substation automation.
Turning a customer’s generation equipment off at times when the electricity
network requires it.
A funding mechanism introduced by Ofgem to promote projects that will help
all DNOs understand how they can provide security of supply at value for
money as Britain moves to a low carbon economy.
Description

Modern Protection Relays or
Novel Protection scheme
Ofgem
PI – Data Historian
Point of connection (POC)
RMU
Quadrature-booster
RF Mesh Network
RF Mesh Nodes
SCADA
A protection scheme to be trialled by the FPP project to overcome the
limitations Novel Protection scheme associated with the use Directional
Overcurrent schemes for protection of Grid transformers.
The Office of Gas and Electricity Markets: regulator for the electricity and gas
markets in Great Britain.
The IT system UK Power Networks is using for collection and archiving of real-
time data and events, mainly measurements from the distribution network.
The interface between the UK Power Networks’ equipment (main fuse,
energy meter) and the consumer’s equipment (supply panel).
Ring Main Unit
A specialised form of transformer used to control the flow of real power on a
three phase electricity transmission network.
The wireless Radio Frequency Mesh Network delivered by SNN that includes
all RF Mesh Nodes – Master eBridges, Remote eBridges and Relay to provided
data connectivity and coverage.
This defines the communication devices that make up the RF Mesh Network –
Master eBridges, Remote eBridges and/or Relay.
Supervisory Control and Data Acquisition: centralised computer-based systems
that monitor and control the electricity distribution network.
Term Description

| 5
Contents
Definitions 3
1. Executive Summary 6
1.2 Purpose 7
1.3 Document Structure 7
2. Introduction 8
2.1 Background 9
2.2 FPP Technical solution 10
2.3 Value addition to previous work 12
3. Trial Description 13
3.1 Problems and solutions 14
3.2 FPP Trial Methodology 15
4. Configuration of ANM 19
4.1 Introduction 20
4.2 Factors for consideration of parameter
settings for a power flow constraint 20
4.3 ANM configuration parameters 22
4.4 Caste study: March Grid reverse power
flow constraint 24
4.5 Case study 2: Peterborough Central to
Bury Primary overhead line thermal
constraint 28
5. Learning outcomes for the Active
Power Flow application 31
6. Learning outcomes for the Active
Voltage Management Trial 57
7. Additional Learning outcomes 67
7.1 The potential capabilities and limits of
energy storage on 33kV networks in
the FPP area. 68
7.2 Variation of DG connection scenarios 71
Scenario A: A new DG connection 71
Scenario B: Upgrade of an existing firm
DG connection 71
Scenario C: Addition of export on an
existing load connection 71
Scenario D: Addition of export on an
existing load and firm DG connection 71
7.3 Cyber security considerations for DG
integration 72
7.4 Integration of the ANM with UK Power
Networks RTU 72
7.5 System integration with IEC 61850 72
7.6 Integration of DG control system with
the ANM 72
7.7 Deployment of DLR technology 73
8. Key findings and lessons learnt from
the overall FPP project trial 75
9. Conclusion 77
Appendix 1 – FPP communications architecture 79
Appendix 2 – Power flow thresholds equations 80
Appendix 3 – sgs ratings vs DLR relay 82
Appendix 4 – 33kV AVC trial diagram 83
Appendix 5 – 11kV AVC trial diagram 84
Appendix 6 – Energy Balance equation 85
Appendix 7 – Table for Energy storage
case analysis 86
Appendix 8 – Formulae 87
Appendix 9 – MP Configuration Parameters 89
Flexible Plug and Play Implementation of active voltage and active power flow management
within FPP Trial area
| 5

There has been continued significant growth in Distributed
Generation (DG) across distribution networks from 2008
which has resulted in very limited generation capacity
being available for new customers across the Eastern Power
Networks network area. This has resulted in a large increase
in connection requests in a relatively short space of time and
has led to several challenges for UK Power Networks and
other DNOs. DNOs have an obligation to offer the cheapest
viable connection to a customer, also known as the minimum
cost scheme; therefore each connection request is assessed to
find the closest suitable point of connection. The availability
of accessible and affordable capacity for generators to
connect to the electricity network is continuously decreasing,
due to network capacity already being fully committed to
existing or planned generation projects or unless extensive
and costly reinforcement works take place, paid for either
by DG customers or the DNO. The closest suitable point of
connection can subsequently be much further away, usually
requiring lengthy cable routes or connecting customers to a
higher voltage level of the network. These are both expensive
options and as a result can often mean that the DG scheme
becomes financially unviable.
Flexible Plug and Play (FPP) is a Second Tier Low Carbon
Network Fund (LCNF) project that conducted a trial to connect
DG onto constrained parts of the electricity distribution network
without the need for conventional network reinforcement. To
achieve this, innovative technical and commercial solutions
were trialled to manage constraints and maximise network
utilisation. Among a number of technical solutions, Active
Network Management (ANM) was a key component that
integrated the smart functionalities of all the solutions.
The ANM solution carries out real time monitoring of the
network using the status and measurement information
from the field devices and is able to configure a number of
application thresholds at which it can take pre-determined
actions. Once the threshold is breached, the ANM solution
automatically issues a power export curtailment instruction to
the associated generators as agreed by UK Power Networks and
the flexible generation customers. ANM maintains an end-to-
end connection to the generator equipment in order to perform
this action. The ANM also includes fail-safe mechanisms to
ensure the security of the grid in case of the failure or loss of
communication with any components within the solution.
This report outlines the main trial outcomes of active
power flow management and active voltage management
applications using a centralised ANM system in coordination
with a number of smart solutions. ANM is a fairly recent
technology in the industry but is increasingly becoming a
familiar concept. This report further explores the capability
of the ANM in utilising the functionalities of various smart
technologies that in this report are termed as smart devices.
Following the demonstration of the technical characteristics
in September 2013 as part of Successful Delivery Reward
Criteria SDRC 9.4, the project proved the functionalities of
the technical solution over the one year trial period, using
the live infrastructure comprising of the central ANM system,
remote field devices and the Radio Frequency (RF) mesh
based communications infrastructure.
The ANM trial was structured in various stages with a key focus
on simulation and operational phases. The simulation phase
was the critical part of the trial as it ensured all functionalities
were tested and proven on the live infrastructure with
simulated elements. As DG customers connected to the UK
Power Networks distribution network under the flexible
contractual terms, the system was closely monitored to
ensure the expected performance was achieved. This was
the operational phase of the trial which validated the results
from the simulation phase.
This trial demonstrated the capability of ANM applications
to address a number of challenges. The key challenges
Executive Summary1

Flexible Plug and Play Implementation of active voltage and active power flow management
within FPP Trial area
| 7
overcome by the Active Power Flow application are the
mitigation of thermal constraint on 33kV overhead line
and the mitigation of reverse power flow constraint of
a 132/33kV grid transformer. Due to the lack of voltage
constraint scenario in the trial area, the functionality of the
Active Voltage Management application was trialled via
simulated experiments.
The trial also successfully demonstrated real time variation
of thermal rating threshold of overhead line based on the
measurements sent by Dynamic Line Rating (DLR) solution in
the field as well as management of the grid in coordination
with local devices such as the Automatic Voltage Control (AVC)
and the Quadrature-booster Control System (QBCS). The trial
also proved that the ANM was capable of dealing with changes
in running arrangements/configuration of the 33kV network
under study and dealing with abnormal network events.
A distinct contribution of the FPP project is that the project
not only demonstrated the functionalities, but actually made
it possible for the constrained network to accommodate the
connection of new generation within the project timescales.
A total of 14 generators were signed up during this period.
These generation customers would otherwise have to pay
significant reinforcement costs to connect over a significantly
longer timescales if business-as-usual approaches were used,
as discussed in SDRC 9.7 – Quicker and more cost effective
connections of renewable generation to the distribution
network using a flexible approach.
The FPP project has demonstrated a simple yet a robust
concept of network management by identifying only the
critical constraint points in the distribution network and
actively managing them using smart applications and smart
devices. While the generation power export management
is the key technique used, the main philosophy of the FPP
project is to unlock the capacity headroom in the network by
using a portfolio of smart solutions.
1.2PurposeThe prime purpose for the report is to provide the evidence
for successful completion of the deliverables set out in SDRC
9.6, and which are repeated below. This report focuses on the
remaining deliverable as outlined below:
Trial results for the Active Power Flow Management
and Active Voltage Management trials. Key findings
aredocumentedinthebodyofthisreportanddetailed
informationisincludedintheappendices.
It should be noted that the other deliverables set out in SDRC
9.6, which are not covered by this report, have been included
elsewhere as follows:
• Pre-production functional test results for Active Power Flow
Management and Active Voltage Management applications.
This has been covered by the report SDRC 9.4 Demonstration
of FPP Technical solutions in September 2013.
• Installation and commissioning documentation of
production Active Power Flow Management and Active
Voltage Management applications in accordance with the
specification included in the contracts with the relevant
partners. This has been covered by SDRC 9.4 Demonstration
of FPP Technical solutions in September 2013.
• Suitable agreements with generators in place. This has
been covered by SDRC 9.7 submitted in parallel with this
report.
1.3DocumentStructure• Section 2 provides introduction to the FPP project and the
trial.
• Section 3 provides background the Active Power Flow and
Active Voltage Management trial
• Sections 4 and 5 describes the outcome of the trial
deliverables as part of SDRC 9.6
• Sections 6 captures additional ANM trial output not covered
elsewhere
• Sections 7 and 8 summarises all the key findings and
lessons learnt.

2Introduction

Flexible Plug and Play Implementation of active voltage and active power flow management
within FPP Trial area
| 9
2.1BackgroundThe United Kingdom (UK) government is maintaining a
strong commitment to cost effective renewable energy as
part of diverse, low-carbon and secure energy mix as stated
in the UK Renewable Energy Roadmap Update 20131. This is
supported by the UK’s ambitious target for 30% electricity
generation from renewable energy by the year 20202 .
The FPP, a trial and demonstration project, has contributed
in addressing this agenda within the electricity distribution
network. In 2011, UK Power Networks was awarded £6.7
million in funding from Ofgem via the LCNF to undertake the
FPP project. A further £2 million was invested from UK Power
Networks, with the final £1m provided by the FPP project
partners making a total cost of £9.7 million.
The aim of the FPP project is to facilitate cheaper and faster
connection of DG to constrained areas of the distribution
network. This approach involves offering flexible connections
which allow generators to connect to the distribution network
without extensive reinforcement that otherwise would be
required. As part of this flexible connection approach, the
electricity distribution network operator is able to actively
manage the output of the DG to keep the network within
operating limits.
The 700km² area of distribution network between March and
Peterborough in the East of England was chosen for the FPP
trial area as it had a number of characteristics which made it
a suitable area for testing within FPP:
• This rural Cambridgeshire area had 90MW of connected
wind generation, mostly connected at 33kV;
• Other generation technologies were already connected,
such as the existing generation plant (Combined Heat and
Power) at Wissington;
• Additional 57MW of generation had been consented,
34.5MW of generation had been requested and 97MW of
generation were in some scoping stage; and
• Finally, existing network assets were reaching their
operational limits.
The FPP project has allowed additional generation to
connect in the trial area without the requirement for costly
reinforcement works by unlocking the hidden capacity in this
network. Since the introduction of flexible connections in the
trial area in March 2013 there has been significant interest,
which has seen the project achieve the following:
• 45 DG connection requests;
• Issue 39 connection offers for 176MW of generation;
• Receive with 14 or (35.88MW) customers acceptances of
the flexible connection.
• As of December 2014, the project has commissioned four
customer(s), totalling 2.75MW, which has given the project
the opportunity to generate and implement new learning
for future flexible connections that are to be commissioned.
The FPP project partnered up with a number of industry
leading organisations and academic institutions who were
selected for their expertise and innovative culture. Smarter
Grid Solutions, who were selected to provide the ANM
solution, had been involved in previous implementations
of similar solutions but with different context, architecture
and approach. Vodafone and Silver Spring Networks were
selected to provide smart grid communications platform.
Other smart devices were provided by Fundamentals, Alstom
Grid and GE Power Conversion.
This report provides detailed information on the outcome the
ANM trial with a key focus on the following areas:
• Learning outcomes from key ANM use cases including
challenges and solutions;
• Overall approach and methodology in undertaking the
trial;
1 Department of Energy and Climate Change, HM Government, 2013, “UK Renewable Energy Roadmap 2013”2 Department of Energy and Climate Change, HM Government, 2009, “The UK Renewable Energy Strategy”
Flexible Plug and Play Implementation of active voltage and active power flow management within FPP Trial area
10 |
• Key functionalities of the ANM solution within the FPP trial
scope; and
• Key requirements, lesson learnt and future recommendations.
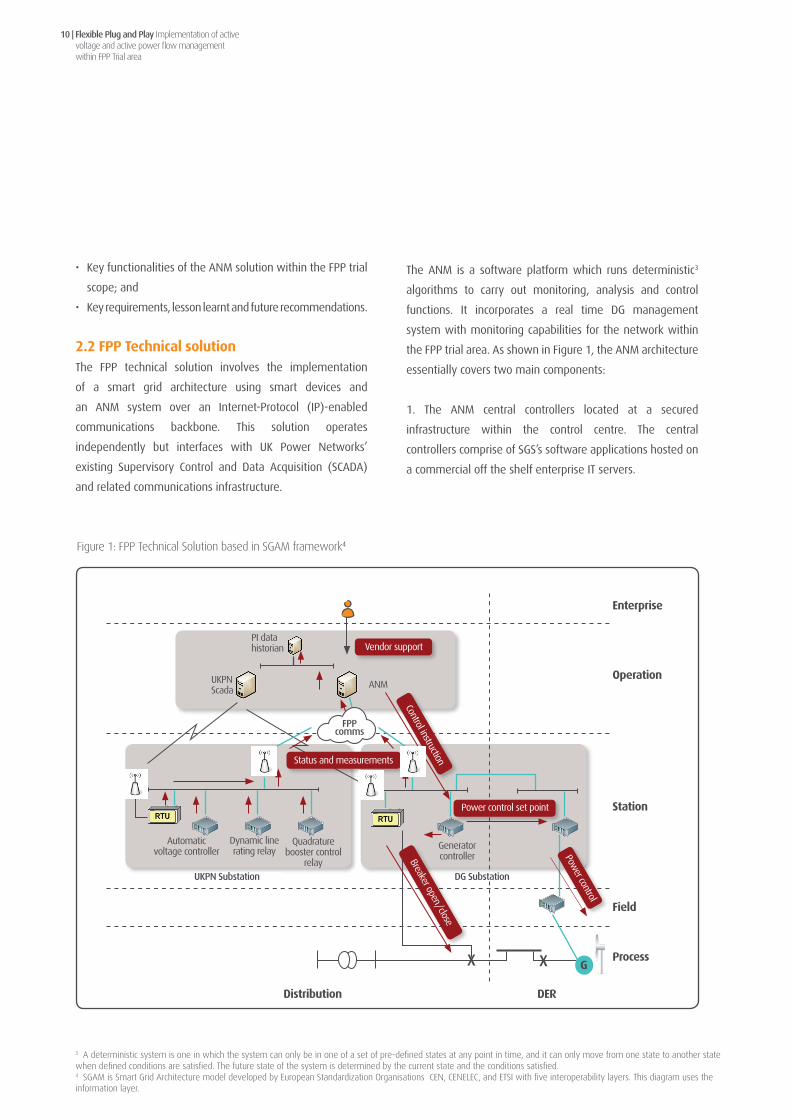
2.2FPPTechnicalsolutionThe FPP technical solution involves the implementation
of a smart grid architecture using smart devices and
an ANM system over an Internet-Protocol (IP)-enabled
communications backbone. This solution operates
independently but interfaces with UK Power Networks’
existing Supervisory Control and Data Acquisition (SCADA)
and related communications infrastructure.
The ANM is a software platform which runs deterministic3
algorithms to carry out monitoring, analysis and control
functions. It incorporates a real time DG management
system with monitoring capabilities for the network within
the FPP trial area. As shown in Figure 1, the ANM architecture
essentially covers two main components:
1. The ANM central controllers located at a secured
infrastructure within the control centre. The central
controllers comprise of SGS’s software applications hosted on
a commercial off the shelf enterprise IT servers.
3 A deterministic system is one in which the system can only be in one of a set of pre-defined states at any point in time, and it can only move from one state to another state when defined conditions are satisfied. The future state of the system is determined by the current state and the conditions satisfied.4 SGAM is Smart Grid Architecture model developed by European Standardization Organisations CEN, CENELEC, and ETSI with five interoperability layers. This diagram uses the information layer.
Figure 1: FPP Technical Solution based in SGAM framework4
Distribution DER
UKPN Substation
UKPN Scada
PI data historian
ANM
Vendor support
Status and measurements
Control instruction
Flexible Plug and Play Successful Reward Delivery Criteria 9.4 Report
UK Power Networks (Operations) Limited. Registered in England and Wales. Registered No. 3870728. Registered Office: Newington House, 237 Southwark Bridge Road, London, SE1 6NP Page18 of 55
The equipment used to form the integration platform (please refer to Figure 3 for the relevant schematic):
• ANM Pre-‐production platform • 3 RF mesh devices (2 remote E-‐bridges and 1 master E-‐bridge)
• 1 measurement simulator (OMICRON) • 1 computer to run IEC 61850 Integration tools (see next section) • 1 optical switch
Figure 3: FPP integration platform
Client/Server Simulator
Generator Controller Generator Controller
RF comms
Ethernet Switch
MastereBridge
Remote eBridge
Smart ApplicationsFront End
Generator Simulator
Optical/Ethernetswitch
RTU
Ethernet
Measurements Simulator
Wired
Ethernet Ethenet
Remote eBridge
RF comms
Ethernet
QBCS DLR AVC
Wired
Wired
Wired
Fibre Fibre
Fibre
Ethernet
ANM Pre-ProductionPlatfrom
ANM Pre-ProductionPlatfrom
Automaticvoltage controller
Dynamic line rating relay
Quadraturebooster control
relay
Power control set point
X X
Station
Field
Process
Breaker open/close
Power control
G
Flexible Plug and Play Successful Reward Delivery Criteria 9.4 Report
UK Power Networks (Operations) Limited. Registered in England and Wales. Registered No. 3870728. Registered Office: Newington House, 237 Southwark Bridge Road, London, SE1 6NP Page18 of 55
The equipment used to form the integration platform (please refer to Figure 3 for the relevant schematic):
• ANM Pre-‐production platform • 3 RF mesh devices (2 remote E-‐bridges and 1 master E-‐bridge)
• 1 measurement simulator (OMICRON) • 1 computer to run IEC 61850 Integration tools (see next section) • 1 optical switch
Figure 3: FPP integration platform
Client/Server Simulator
Generator Controller Generator Controller
RF comms
Ethernet Switch
MastereBridge
Remote eBridge
Smart ApplicationsFront End
Generator Simulator
Optical/Ethernetswitch
RTU
Ethernet
Measurements Simulator
Wired
Ethernet Ethenet
Remote eBridge
RF comms
Ethernet
QBCS DLR AVC
Wired
Wired
Wired
Fibre Fibre
Fibre
Ethernet
ANM Pre-ProductionPlatfrom
ANM Pre-ProductionPlatfrom
FPPcomms
Generator controller
DG Substation
Enterprise
Operation

Flexible Plug and Play Implementation of active voltage and active power flow management
within FPP Trial area
| 11
2. The Local generator controllers at the substation level
referred to as sgs connect in this document. The local
controllers comprise of SGS’s software hosted on an
Intelligent Electronic Device (IED) or Remote Terminal Unit
(RTU). Brodersen RTU32 devices were used in the FPP trials.
Figure 1 shows the high level diagram of the technical
solution showing the connection of the central ANM system
with the local ANM generator controller at the DG substation
and the smart devices at the UK Power Networks substation.
This diagram is based on the use case mapping of the
generator control by the ANM using the information layer of
Smart Grid Architecture Model (SGAM) framework. Detailed
communications architecture is shown in Appendix 1. Further
details on the design and implementation of the technical
solution are described within the SDRC 9.4 report. The FPP
communication platform is described in detail within the
SDRC 9.35 report.
In order to support the ANM requirements, the FPP project
implemented a dedicated Internet Protocol version 6 (IPv6)
enabled communications platform in March 2013. This
involved deployment of a RF mesh network to cover the
entire trial area supported by up to two back-haul Wide Area
Network (WAN) sites linking to the ANM system at the UK
Power Networks control centre as shown in Appendix 1. The
RF mesh network is designed to provide a radio canopy6 over
the FPP trial area in readiness for “plug and play” connection
of any prospective DG substation and its corresponding
generator controller.
The FPP project demonstrated multi-vendor interoperability
and efficiency in the design and commissioning process using
the IEC 61850 standard. The IEC 61850 standard is widely
used in the industry for substation communications however,
the project stretched the capabilities of the standard by
trialing its use for network control application outside the
substation and over the RF mesh network. Adopting a central
management role in the functional architecture, the ANM
system acted as the IEC 61850 client ( i.e., the master) to
all the field devices acting as the IEC 61850 servers (i.e. the
slave). As part of this client server model, the ANM system
was able to send control messages to the field devices as
well as receive necessary measurements and monitoring
data.
Following the delivery of the technical solution in September
2013, the project moved into a structured trial phase with
seven trial cases as follows:
1. Active Network Management (ANM)
2. Dynamic Line Rating (DLR)
3. Communications
4. Automatic Voltage Controller (AVC)
5. Quadrature-booster
6. Novel Protection Relays
7. System Integration
Out of the seven trial cases, the ANM is the most
comprehensive trial as it also integrates the output of the
rest of trials. Trials 2 and 6 are discussed in Chapter 4 and trial
4 is discussed in chapter 5. Trials 1, 3, 5 and 7 are discussed
in chapters 4, 5 and 6.
The FPP solution deployed smart devices from various
vendors to address and manage existing or anticipated
network constraints and operational limitations of the
distribution network that either restrict the connection of
new DGs or are introduced by their connection. The range
of smart devices include: DLR, AVC, a Quadrature-booster
and associated control system; and generation controllers.
Figure 2 overleaf shows a simplified FPP network layout and
location of devices linked to the ANM and accepted flexible
generations. The diagram also highlights the sections of the
FPP network where additional capacity has been freed up by
the implementation of these smart devices.
5 SDRC 9.3 report: Delivery of FPP Communications platform6 PI is UK Power Networks data historian solution

Flexible Plug and Play Implementation of active voltage and active power flow management within FPP Trial area
12 |
2.3ValueadditiontopreviousworkSimilar work has been carried out by other DNOs, notably by
Scottish and Southern Electric Power Distribution (SSEPD) as
part of the Orkney project. While SSEPD has implemented
similar ANM technology to mitigate the network constraints,
the FPP project built upon this and has generated additional
learning to the industry as detailed below.
• To our knowledge, the first implementation of a Quadrature-
booster on 33kV distribution network worldwide.
• Demonstration of a capacity quota as an innovative
commercial arrangement in addition to the Last In First Off
(LIFO) scheme.
• The first implementation of a purpose-built DNO
communications platform based on RF mesh technology in
the UK.
• Use of the open standard IEC 61850 based protocol to
integrate multi-vendor devices
• Implementation of an ANM solution in a control centre
environment in comparison to schemes based in a
substation environment.
• Integration and coordination of multiple smart solutions.
Figure 2 – Simplified FPP network layout
Legend
Additional capacity for generators
joining these lines, particularly wind
generators
Additional capacity created for DG on these
linesAdditional
capacity created for DG on these
lines
Additional capacity for
export created
Controlled power flow
Remote control introduced and DG managed
under all switching arrangements
Additional capacity created on this network
for export
PeterboroughCentral Grid
MPR3 MPR4
DLR 2
DLR 1b
DLR 4
4MW 10 MW
33kVWhittleseyFuntham’s
Lane
Farcet
8MW
250kW
P90
1MW
6.93MW
1.5MW
1.2MW0.5MW 0.5MW 0.5MW
Wissington
To Downham
T-Point
To Northwold Primary
MarchGrid
MPR1 MPR2
GGGGGG
G
G
G
Bury
11v
K N
etw
ork Chatteris Primary
11kV NetworkMarch Primary 11kV Network
G
G
Qua
drat
ure
Boos
ter
G132kV33kV11kV
Normally Open Point
Normally Closed Point
Accepted Flexible Generator
Quadrature-booster
132/33kV Transformer
33/11kV Transformer
MPR: Modern Protection RelayDLR Dynamic Line Rating
DLR 1a

3Trial Description

Flexible Plug and Play Implementation of active voltage and active power flow management within FPP Trial area
14 |
3.1ProblemsandsolutionsThere are a number of network constraints, which were
overcome by implementing smart solutions as described
in this section. A detailed description of individual problem
and solution has been provided in the SDRC 9.4 report in
September 2013.
Thermalconstraints:
Thermal overloads arising at certain pinch points, partly due
to the natural flow of power through the interconnected
network, which leaves some capacity underutilised. This
is a common problem in the 33kV interconnected network
particularly in the Eastern region.
In order to mitigate the thermal constraints, the FPP
project has trialled weather based dynamic rating solution
with a safety margin, since conductor temperature or sag
monitoring solutions may not be economic at 33kV. Three
thermal constraint zones were identified where four DLR
solutions were trialled based on Alstom MiCOM P341 relays
as shown below.
1. DLR_1a : Bury Primary – Farcet Primary 33kV circuit
(Installed at Farcet substation)
2. DLR_1b : Farcet T2 – Peterborough Central 33kV circuit
(Installed at Farcet substation)
3. DLR_2 : Funtham’s Lane Primary – Whittlesey T2/Chatteris
T2 tee point 33kV circuit (Installed at Funtham’s Lane
substation)
4. DLR_4 : March Grid – Whittlesey T2/Chatteris T2 tee point
33kV circuit (Installed at March Grid substation)
The main function of these relays was to use local weather
data and calculate real-time ampacity ratings based on the
real weather conditions. The real-time ampacity rating is
provided to the ANM system, which dynamically manages
thermal constraints.
Increaseinreversepowerflows:
Existing grid substation transformers have limits on Reverse
Power Flow (RPF), which is due to the allowable Directional
Overcurrent (DOC) protection settings and the size/rating
of the grid transformers. The existing infrastructure within
the FPP trial area consists of two 132/33kV grid sites and
an interconnected 33kV network supplying ten 33/11kV
primary substations as shown in Figure 1.
The ‘main’ protection on the 132kV circuits from Walpole –
March – Peterborough Central is via pilot cables rented from
BT. At the start of the project, the network relied on DOC
as the backup to the intertripping function. The DOC was
designed to detect faults just outside Walpole, which may
also be fed via Walsoken, which limits the reverse power
through March Grid and Peterborough Central.
The DOC protection on the 33kV side of the transformer
feeders was operating with increased RPF settings of 75%
instead of 50% to accommodate the backfeed from the
local embedded generation. The increase in setting had
degraded the sensitivity to such a point that 132kV source
faults might not be cleared should the intertripping fail. This
is a major problem when the fault is “back-fed” from the
adjacent 132kV circuit, as the transformers add significant
source impedance to the fault. In order to mitigate the DOC
constraint, the FPP project trialled the novel protection relay
with Direction Negative Phase Sequence (DNPS) and Load
Blinding schemes at March Grid and Peterborough Central
using Alstom P142 relays.
Voltageconstraints:
Generally, the original design of most European distribution
networks occurred over four decades ago and did not consider
impacts from distributed generation, such as bi-directional
power flows and voltage rises. Voltage control is made
more difficult particularly by reverse power flow through tap
changer transformers. The connection of DG on the 11kV side

Flexible Plug and Play Implementation of active voltage and active power flow management
within FPP Trial area
| 15
at primary substations may cause voltage levels to exceed
the statutory limits unless appropriate measures are taken at
design stage. To increase the network capacity with regards
to connection of DG it is important to allow bi-directional
power flows with voltage regulating strategies equipped
to handle the effects of distributed generation on system
voltage profile.
At March Grid and March Primary, over 60MW of generation
was planned to connect at the start of the project which is
anticipated to result in high levels of reverse power flow.
The project commissioned the UK Power Networks standard
AVC solutions, equipped with additional functionalities to
deal with the problems created by a high penetration of
DG connections. The solution is based on the coordination
of ANM with the Fundamentals’ SuperTAPP n+ AVC relays
to optimise the voltage set point at the primary or grid
substation in order to maximise the voltage headroom/
legroom and accommodate additional generation capacity.
3.2FPPTrialMethodologyThe FPP trial was undertaken in a structured manner leading
to the formulation of the overall trial delivery approach
applicable for any Information and Communications
Technology (ICT) solutions trial. The overall approach is
represented by the diagram in Figure 3 while the key trial
stages are described below.
3.2.1TrialdesignThe design of the FPP trial was carried out after the
completion of the delivery of the FPP technical solution in
September 2013. A trial design document was developed
for each of the seven trial cases providing a methodology
for the structured tests and analysis required for fulfilling the
corresponding Use Cases stated within the FPP High Level
Use Cases document. The trial design document also ensured
that the envisaged learning outcomes were covered by the
trial activities. The ANM trial, as guided by the ANM trial
design document, was categorised as three separate sets of
Figure 3: FPP Trial delivery approach
Trial Design Monitoring Trial Simulations Operations
Define Hypotheses
Validate and baseline data
Carry out experiments
Monitor and assess
Trial documentation
FFP livenetwork
FFP live network & simulation platform
FFP live network
Overallapproach
Trialactivities
Platformused
Sept2013toJan2014
Jan-Mar2014 April-Sept2014 April-Dec2014

Flexible Plug and Play Implementation of active voltage and active power flow management within FPP Trial area
16 |
use cases that were fulfilled by the trial of three separate
smart applications hosted by the ANM platform as shown
in Table 1.
The design process of the ANM Trial considered the following
elements:
• Defining hypotheses, scenarios and related experiments to
meet specific objectives.
• The validation of the information gathered using the
various field devices of the FPP technical solution.
• The monitoring of power flows and voltages on the various
substations impacted in the area.
• The simulation of scenarios to validate the Use Cases.
• The capture, storage and retrieval of data during the
operational phase.
• The analyses of power flows, voltages and other relevant
data from the PI historian7 during the simulation and
operating phase to cover the ANM trial hypotheses.
• The optimisation and enhancement works.
3.2.2HypothesesTwelve hypotheses were developed, each focussing on
a particular set of functionalities of the ANM solution as
summarised below. Section 5 addresses Use Case U04.1, Use
Case U04.3 and hypotheses 1, 2, 3, 4, 5, 6, 10 and 11. Section
6 addresses Use Case U04.2 and hypotheses 3, 7, 8, 9 and
10. Section 7 covers additional learning outcomes including
hypothesis 12.
1.Hypothesis ANM001: ANM manages DG output to
mitigatereversepowerflowconstraints
2.Hypothesis ANM002: ANM manages DG output to
mitigatethermalconstraints
3.Hypothesis ANM003: ANM manages DG output
consideringcommercialarrangements
4.HypothesisANM004:ANMisabletocopewithvarious
runningarrangementstoactivelymanagethegrid
5.Hypothesis ANM005: ANM uses Dynamic Rating
informationinthepowerflowcalculation
6.HypothesisANM006:ANMactivelymanagesthegrid
incoordinationwiththeQBCS
7.Hypothesis ANM007: ANM manages DG output to
mitigatevoltageconstraints
8.Hypothesis ANM008: ANM manages DG output to
mitigatevoltageconstrainsincoordinationwithAVC
9.Hypothesis ANM009: ANM coordinates the
managementofPowerFlowandVoltage
10.HypothesisANM010:ANMisabletocopewithdevices
andcommunicationfailures
11.HypothesisANM011:TheRatingApplicationincreases
theuseableratingofconstrainedlines
12.HypothesisANM012:ANMactivelymanagesthegrid
incoordinationwithastoragedevice
3.2.3TrialScenariosThe approach applied by the FPP project consisted of three
scenarios, the monitoring; the simulation; and the operational
scenarios as shown in Figure 3. The three scenarios were
spread across a period of over 12 calendar months to cover
U04.1
U04.2
U04.3
Usecasereference Usecasename
Table 1: Use cases and smart applications
Active Power Flow Management
Active Voltage Management
Thermal Ratings Estimation
Smartapplication
sgs power flow
sgs Voltage
sgs ratings
7 PI is UK Power Networks data historian solution

Flexible Plug and Play Implementation of active voltage and active power flow management
within FPP Trial area
| 17
various seasonal variations and operating conditions in order
to carry out overall assessment of the ANM approach.
Monitoring
This scenario consisted of monitoring the status of the
network, more specifically active power flows and voltages,
in the trial area. It aimed to define the baseline performance
to allow the comparison carried out at the simulation and
operational phases. For that purpose the existing Remote
Terminal Units (RTUs), already in place in the trial area and
the smart devices commissioned as part of the FPP project,
have been used to gather the measurements using the FPP
communication infrastructure. The monitoring was conducted
throughout the trial period.
Simulation
As the planning and delivery process of the new generator
connections were not under the full control of the project, it
was necessary to robustly test the concept in a simulation
environment in order to build adequate trial experience. A
simulation platform was designed to enable the assessment
of various use cases including those network contexts which
would not be possible to carry out during the project duration.
This allowed a number of enhancements and optimisations
to be implemented during the trial.
Operation
The purpose of the operational scenario was to undertake
close assessment of the system performance after the
connection of the live generators in the trial area. This allowed
the system to be put under genuine constraint scenarios and
observe the response of the ANM and performance of the
overall system.
3.2.4TestPlatformIn addition to the ANM production platform, a simulation
platform was developed consisting of the following
components.
Generatorsimulator
The main purpose of a generator simulator was to simulate
the behaviour of a generation connection with active
interaction with the generator controller. It supported the
following functionalities:
• Simulate circuit breaker controls and indications: This
provided an indication of the circuit breaker position/
status based on a trip or close signal from the ANM system.
• Simulate DG output: This simulated the real power output
of the generator based on the ANM target set-point. A
ramp algorithm was used to permit a gradual change of
the export power towards the set-point.
• Simulate communications delay: This was used whiletesting
the response of ANM application to field devices.
The generator simulator runs on the same hardware as the
generator controller that was used to interact with DG. During
the simulation phase of the ANM trial, two generator controllers
were deployed into the trial area and the two additional
devices were installed in a laboratory environment aiming to
simulate a minimum of four generators simultaneously.
ConstraintMeasurementPointSimulator
A number of analogue measurement values were handled
by the ANM which were referred to as Measurement Points
(MP). As the ANM actions were directly linked to a constraint
measurement, it was important to accurately simulate the
behaviour of the constraint MP using MP simulators. With
a flexibility of being operated on both the local generator
controller and the ANM server platforms, the MP simulator
ran a simulation algorithm for each MP.
The MP simulator was able to aggregate the real time
measurements received from the trial area and the DG power
output measurements received from the generator simulator
to represent a simulated constraint MP as shown in Figure 4.

Flexible Plug and Play Implementation of active voltage and active power flow management within FPP Trial area
18 |
Both generator simulators and MP simulators were installed
in the laboratory and configured to communicate with the
ANM production platform located at the control centre. Two
generator simulators were also implemented within the
trial area in order to represent two potential DG customers
communicating using the RF mesh communication
infrastructure. All the relevant trial data was stored in the UK
Power Networks data historian. The overall FPP simulation
platform is illustrated in the Figure 5.
Figure 4: Constraint Measurement Point Simulation approach
Figure 5: FPP Simulation Platform
RealTimeMP
SimulatedNon-Firm
DG
SimulatedFirmDG
SimulatedMP
Controlcentre
2 SGS Core & Somms HUB
2 SGS Applications
ENMAC MP Simulator
4 SGS Connects (inc. Generator Simulator)
IEDs(QBCS, AVC, DLR, WS)
Substation LAN
12 RTUs
Master eBridge
2 SGS connects(inc. Generator
Simulator)
eBridge
FPPTrialArea UKPNLaboratory
RF MeshComms
RF Mesh Comms
UKPNIT
Flexible Plug and Play Successful Reward Delivery Criteria 9.4 Report
UK Power Networks (Operations) Limited. Registered in England and Wales. Registered No. 3870728. Registered Office: Newington House, 237 Southwark Bridge Road, London, SE1 6NP Page18 of 55
The equipment used to form the integration platform (please refer to Figure 3 for the relevant schematic):
• ANM Pre-‐production platform • 3 RF mesh devices (2 remote E-‐bridges and 1 master E-‐bridge)
• 1 measurement simulator (OMICRON) • 1 computer to run IEC 61850 Integration tools (see next section) • 1 optical switch
Figure 3: FPP integration platform
Client/Server Simulator
Generator Controller Generator Controller
RF comms
Ethernet Switch
MastereBridge
Remote eBridge
Smart ApplicationsFront End
Generator Simulator
Optical/Ethernetswitch
RTU
Ethernet
Measurements Simulator
Wired
Ethernet Ethenet
Remote eBridge
RF comms
Ethernet
QBCS DLR AVC
Wired
Wired
Wired
Fibre Fibre
Fibre
Ethernet
ANM Pre-ProductionPlatfrom
ANM Pre-ProductionPlatfrom
PI
Flexible Plug and Play Successful Reward Delivery Criteria 9.4 Report
UK Power Networks (Operations) Limited. Registered in England and Wales. Registered No. 3870728. Registered Office: Newington House, 237 Southwark Bridge Road, London, SE1 6NP Page18 of 55
The equipment used to form the integration platform (please refer to Figure 3 for the relevant schematic):
• ANM Pre-‐production platform • 3 RF mesh devices (2 remote E-‐bridges and 1 master E-‐bridge)
• 1 measurement simulator (OMICRON) • 1 computer to run IEC 61850 Integration tools (see next section) • 1 optical switch
Figure 3: FPP integration platform
Client/Server Simulator
Generator Controller Generator Controller
RF comms
Ethernet Switch
MastereBridge
Remote eBridge
Smart ApplicationsFront End
Generator Simulator
Optical/Ethernetswitch
RTU
Ethernet
Measurements Simulator
Wired
Ethernet Ethenet
Remote eBridge
RF comms
Ethernet
QBCS DLR AVC
Wired
Wired
Wired
Fibre Fibre
Fibre
Ethernet
ANM Pre-ProductionPlatfrom
ANM Pre-ProductionPlatfrom

4Configuration of ANM

Flexible Plug and Play Implementation of active voltage and active power flow management within FPP Trial area
20 |
4.1IntroductionOne of the key learning points gained from the ANM trial is the
methodology of optimising the operation of ANM application
in order to protect the network assets while maximising the
export of generation at all times. Using the case study of the
Active Power Flow application trial, studies were undertaken to
establish relationship among various ANM parameters and their
impact on the overall system operation which are discussed in
this section of the report. It is to be noted that the same concept
applies for the operation of the active voltage management
application.
4.2FactorsforconsiderationofparametersettingsforapowerflowconstraintPrimaryfactors:
The main factors that directly influence the setting of parameters
of a system that manages power flow constraint include:
• Systemlimit:
The first step in this process is to identify the true system limit.
This usually corresponds to the rating of the component in the
system with the lowest thermal capacity such as an overhead
line current flow rating, or a transformer reverse power
flow rating. This is also the limit which needs to be updated
following reinforcement and may need to be updated
following any outage periods.
• Ramp-uprate:
The major factor to consider is the maximum cumulative
ramp-up rate which can occur at the constraint MP. This ramp
rate depends on the amount and the combined variability
effect from individual ramp rates of both firm and non-firm
generations as well as the load. The faster the rampup rates,
the higher the need to increase the separation of the ANM
thresholds from the system limit.
• Ramp-downrate:
The ramp-down rate directly impacts on the speed of
constraint management by the ANM.
• Networksafetyparameters:
Protection schemes and settings should also be studied to
ensure the ANM operation cannot interfere with or trigger any
protection system.
• Communicationnetwork:
The system needs to be configured according to the
characteristics and performance of the communication
network. A sensitive ANM configuration over a communication
link with high amount of short term failures can lead to an
unstable system with higher levels of curtailment of DG
power export for communications reasons rather than due to
network constraints.
Given that some of these factors can change over time as well
as the fact that initial settings should be conservative to ensure
operability, it was established that the parameter settings
should be regularly reviewed and revised both to improve
performance and address the dynamic nature of the network
and devices connected to it.
Secondaryfactors:
The project undertook a thorough study of the trial network
and the assets in order to establish threshold settings and
system parameters and identified the following additional
factors for consideration in setting these parameters.
• Voltagestepchange
The management of multiple generators using ANM
presented a challenge as they can cumulatively cause
voltage step change in the event of the simultaneous loss
or introduction of group of generation. The maximum step
change that can normally be allowed for connection of
generation is 3% at the point of common coupling. Therefore
the total loss of a single generation site should not result
in figures greater than this. The problem may occur when
a group of generation needs to be disconnected from the
network to manage a breach of a constraint. Engineering
Recommendation (ER) P28 gives information on both the

Flexible Plug and Play Implementation of active voltage and active power flow management
within FPP Trial area
| 21
step change and ramp rates, so if the total loss of a number
of sites will result in a step change greater than 3% then
some of those sites may need to be slowly ramped down in
order to prevent step changes in excess of P28 limits.
• Tapchangeoperation
The other factor in implementing a slow turndown was
to allow tap change operation to compensate for loss of
volts due to generation in some scenarios. The UK Power
Networks standards on AVC specify a tap change operation
delay of 60 seconds for grid substations and 90 seconds for
primary substations. For example, it was identified during
the design of the interface for one of the DG connections that
the “normal” turbine ramp rate needed to be slow enough
to allow the tap changer at Chatteris Primary to operate.
Given the 90 second operating time of the tap changer at
Chatteris primary substation, the voltage limits would be
exceeded by a change in DG output of greater than 600kW
in the 90 seconds timeframe. As such, a 6kW/s ramp rate
was proposed for the generator to remain below the 600kW
limit with a 540kW change in 90 seconds, allowing the AVC
adequate time to react.
• Generationconstraints
Generation technologies may dictate at which speed the
generation output can be curtailed. For example, solar
generators can come offline without much impact but
tripping a wind turbine will result in excessive mechanical
stress which can limit the life of the plant. Where required,
an emergency shutdown signal can be considered which
can use the fastest ramp rate supported by the generation
plant rather than a hard tripping signal.
• Auto-reclose
Consideration should also be made for the temporary loss of
circuits that can be restored by protection schemes referred
to as auto reclose for 33kV and delayed auto reclose for
132kV circuits. The 33kV auto reclose protection attempts
to reclose once typically 20 seconds after a trip and if
unsuccessful locks out. This process can take up to a total
of 30 seconds which may need to be taken into account for
some ANM waiting timer configuration. Again the motivation
is to avoid curtailment of DG in reaction to interruption
which are about to be rectified by the recloser. The initial
conservative approach for FPP project could not accept the
risk of 30 seconds waiting time and was considered for
future optimisation after gaining a reasonable operational
experience.

Flexible Plug and Play Implementation of active voltage and active power flow management within FPP Trial area
22 |
4.3ANMconfigurationparametersThe ANM uses various operational parameters to carry out
its analysis and decisions. The effective deployment of
ANM application is dependent upon the proper setting of
its configuration parameters as they pertain to the unique
conditions associated with a given constraint. These parameters
ultimately define the activation thresholds, time delays and
response magnitudes associated with any ANM action.
For simplicity, the ANM configuration parameters can be
divided into four categories as given in Table 2.
As part of the implementation of the sgs power flow application
in the FPP project, a number of parameters needed to be
configured for MPs, generators and local ANM controllers as
shown in Appendix 9. The following thresholds are defined as
part of the constraint management scheme of the sgs power
flow as illustrated in Figure 6.
• Global trip threshold – When the MP breaches this
threshold, the ANM system simultaneously trips all those
generators that are associated with the MP.
• Sequential trip threshold – ANM system trips the
associated generators in the pre-defined intervals when this
threshold is breached for a sufficient length of time until the
MP is brought below the trim threshold.
• Trimthreshold – When the MP breaches this threshold, the
ANM system issues curtailment to associated generators in
order to reduce power flow associated with the constraint to
below the reset threshold.
• Trimlessthreshold: ANM system target value for power
flow associated with the constraint during a release event.
It is used to ensure that the release of generation does not
cause power flow to breach the trim threshold immediately
after.
• Resetthreshold – Releasing the curtailment level allowing
controlled ramp up
Table 2: Generic ANM configuration parameters
1
2
3
4
No Parameters
Operational Thresholds
Operating Margin
Operational timer settings
Fail safe settings
Description
Operational thresholds trigger ANM to take a specific action. The ANM system makes
intelligent decision to use a pre-configured static threshold or a real-time dynamic
threshold for each constraint based on the requirements of each operational scenario.
It is a safety margin between the various thresholds including the system limit. It is
designed to give the system time to react and potentially solve the constraint prior
to breaching the next threshold.
Operational timers are pre-defined sustained time periods for a system component
to wait before taking any action. The calculation of timers is based on the impact
analysis of an event to ensure the safest action while keeping the system stable.
During any abnormal condition, the ANM system is designed to take a pre-defined
fail safe action in order to minimise the risk to the network.

Flexible Plug and Play Implementation of active voltage and active power flow management
within FPP Trial area
| 23
• Resetlessthreshold – The ANM system target value for
power flow associated with the constraint following a
trim event. It is used to ensure that curtailment is reduced
sufficiently below the reset threshold.
Methodology
The ANM thresholds were calculated using the standard SGS
methodology which considers all the relevant factors to define
a formula for each threshold. The formula accounts for the
relevant ramp rate of the MP for each threshold multiplied by
the maximum duration of the time before the corresponding
action can be completed. The resultant value then represents
the minimum separation required between the thresholds
defining their operating margins.
The computed operating margins are designed to give the
system adequate time to react and solve the thermal constraint
prior to breaching the next threshold. This is the theoretical
approach which formed the starting point for the configuration
of the ANM and yields the most conservative results. It was
recognised that this approach required further optimisation at
design stage based on operational experience, expert vendor
knowledge and sound engineering judgement. The project
team identified the following key guiding principles in setting
the thresholds:
• The severity of the ANM response action should be
proportional to the degree of deviation from a defined
operational range of a power flow constraint;
Figure 6: ANM thresholds
SystemLimit
GlobalTrip
SequentialTrip
Trim
TrimLess
Reset
ResetLess
GlobalTripOperating
SequentialTripOperating
TrimOperating
ResetOperating

Flexible Plug and Play Implementation of active voltage and active power flow management within FPP Trial area
24 |
• A global trip action should occur prior to any protective
setting power flow being reached;
• The operating margins depend upon the variability of the
load and generation contributing to the constraint as well as
the time allocated to the ANM system to react to a breach of
a particular margin.
In addition, the following threshold calculation method was
developed and applied:
• the first step is to establish minimum, average and maximum
figures for the variable parameters such as communication
delay, ramp rates and generator response time.
• the second step is to use the relevant figures to compute the
operating margins for each threshold as described above.
• the third step is an iterative one, which involves adjustment
of the non-variable parameters such as observation times
and communications timeouts to establish optimum
threshold settings based on the size, type, behaviour and
connection timescales of the expected flexible generators.
As more generators connect some parameters need to
be adjusted to optimise the threshold settings in order to
maximise the generation export while avoiding any possibility
of a breach of system limit. The behaviour of curtailment event
can be represented by a sequence diagram showing object
interactions in time sequence as per Figure 7.
Figure 7 shows the sequence of events starting from the
moment when a constraint MP breaches a threshold until the
moment it is brought back below the threshold. Every object
in the sequence diagram represents one of participating
components of the FPP project architecture while the time
elements represent the parameters involved in the calculation
of operating margins. The sequence diagram shows the total
time of 32.2 seconds based on the parameters set on this case
study. This process can be used to calculate the maximum
action time criteria for the each ANM event and is represented
by the formulae given in Appendix 8 and tested by the
experiment described in section 5.1.
Figure 7: ANM action sequence diagram
Central ANM Controller
Communication Local ANM Controller
UKPN Circuit breaker
DG Control System
DG Plant
Feeback = 0.1s
Comms Delay = 1s
Comms Delay = 1s
Feeback = 0.1s
Breach of aconstraint
Constraintmanaged
Feeback = 0.1s
Processing time = 3s
Observation time = 6s
Processing time = 3sResponse time = 20s

Flexible Plug and Play Implementation of active voltage and active power flow management
within FPP Trial area
| 25
4.4Casestudy1:MarchGridReversePowerFlowconstraintBackground
As explained in section 3.2, the legacy system limit for
March Grid Reverse Power Flow (RPF) was DOC protection
constraint which was 34MVA based on an n-18 condition.
An assessment was carried out from five years of historic
data to understand the behaviour of transformer power flow
measurement. As represented by the graph in Figure 8, the
duration curves show the amount of time that limits were
actually threatened, the spare energy transfer capacity, and
the additional energy export facilitated by ANM. The analysis
considered 30.6MVA system limit based on an existing DOC
limit of 34MVA with a 10% operating margin.
The positive half of the scale in the Y-axis of the graph
represents reverse power (i.e. net export) and the negative
half represents the forward power (i.e. net demand). The
curves compare the duration of the reverse power flow with
and without potential FPP generation of 19MW projected at
the time. Two export limit scenarios with DOC (30.6MVA trim
threshold based on 10% operating margin against a 34MVA
Figure 8: March Grid constraint duration curve
8 An n-1 condition in the context of electricity networks is when one of the components of the network (e.g. a transformer, a cable or a switch) has failed and is no longer in operation. Electricity networks designed for n-1 reliability can continue to operate normally (i.e. without loss of load or voltage issues) when one of the components fails.
Export with curtailment
Total Power Flow before added DG
Transformer rating
Potential Export with no Curtailment (breach)
New Export Limit
DOC Export Limit
B A
0% 10% 20% 30% 40% 50% 60% 70% 80% 90% 100%
60
50
40
30
20
10
0
-10
-20
-30
-40
-50
-60
A
C
B
98% 100%
30
40
50
60
20
Percentile(%)
Pow
erF
low
(M
W)
Key

Flexible Plug and Play Implementation of active voltage and active power flow management within FPP Trial area
26 |
DOC constraint) and without DOC (41MVA trim threshold
based on 10% operating margin against a new 45MVA
system limit) are considered. The curve A represents the
duration of power flow without flexible generation without
breaching the new export limit. The curve B shows the
increased duration of reverse power with the added 19MW
generation that would exceed both the system limit and the
export limit. The curve C represents the duration when ANM
system would take curtailment action in order to maintain
the power flow below the export limit essentially, defining
the ANM’s operational envelope over that period of time.
At March grid, the simplicity of the constraint, allowed a new
principle of access (Pro-rata) to be trialled, which has proven
popular. The area has seen the highest rate of connection
requests over Peterborough Central grid.
Rampratecalculation
For the calculation of ramp-up rate for the March Grid
power flow, the trial data for the March Grid power flow MP
were analysed. The trial data were based on the real-time
measurements, without any averaging that was reported
to the ANM by the March Grid RTU. Approximately three
months of data sets of MW measurements were selected
to analyse the step changes in MW. The calculation uses the
variation in power and time between consecutive readings
to determine the MW/s changes, i.e. the ramp rates. The
graph in Figure 9 shows the distribution of these values,
highlighting some very large outliers but the vast majority
of the time the changes in MW flow are relatively small.
It can be observed that nearly all the changes in MW flow
are for small changes less than 0.5 MW/s with only a small
Figure 9: March Grid MW Ramp rate
Percentile
MW
/sC
hang
e
80
60
40
20
0
-20
-40
-60
10 20 30 40 50 60 70 80 90 100
Starting 2014-08-09 Starting 2014-07-17 Starting 2014-06-10Key
0

Flexible Plug and Play Implementation of active voltage and active power flow management
within FPP Trial area
| 27
percentage of bigger step changes. This suggests a maximum
ramp rate of 0.5MW/s for threshold calculations based on
the observation that the ramp rates above 0.5MW/s occur
occasionally and do not persist over a sustained period of
time. The detailed configuration settings are provided in
Table 3 above.
Systemlimitandsafetyoperatingmargin
The first step was to remove the DOC protection thereby,
gaining a headroom of 11MVA with a new system limit
of 45MVA corresponding to the continuous transformer
rating. This was achieved by the implementation of load
blinding protection as part of the novel protection relay trial
described in section 3 of this document. The second step
was to implement ANM to ensure the flexible DG export do
not breach the new system limit.
Following factors were considered to establish the system
limit of 45MVA for March Grid reverse power flow constraint.
• Continuous Rating of 45MVA when cooling fans are on
(OFAF rating);
• De-rated to 22.5MVA when cooling fans are off (ONAN
rating);
• Tap changers were rated to 100% reverse power flow;
• Cyclic rating of the transformer was not used by network
control;
• Emergency rating 110% (49.5MVA) for 15 minutes was
considered as the most conservative rating.
Based on the methodology described above, the ramp rate
data and parameters settings were used to establish the
March Grid constraint thresholds. An initial safety operating
margin of 10% was considered with the trim threshold
defined at 40.5MVA with a view of reviewing the margin
after sufficient operational experience. Based on transformer
emergency rating of 110% this allows for at least 20% total
safety margin for a minimum of 15 minutes. This meant the
highest ANM threshold the global trip, was set to 45MVA
transformer rating and 42.75MVA which is 5% below the
global trip.
The 10% operating margin was considered while defining
Principles of Access and curtailment assessment for March
Grid as part of smart commercial arrangements and are
described in the SDRC 9.7 report. A capacity quota of
33.5MVA was agreed and publicised and the first flexible
connection offers were issued with an expected curtailment
level of 5.3%. The expected curtailment levels represent the
duration of time when the export was expected to exceed
the trim threshold as shown by the duration curve in Figure 8.
Table 3: ANM settings for March Grid based on system limit of 45MVA
Parameters
Thresholds
Observation Times
Response times
Ramp Step
Trim
40.5MVA
(0.9 x limit)
6 seconds
20 seconds
N/A
Sequentialtrip
42.75MVA
(0.95 x Limit)
5 seconds
20 seconds
N/A
Globaltrip
45MVA
(1 x Limit)
4 seconds
4 seconds
N/A
Release
N/A
10 seconds
N/A
500kW
Reset
36MVA
(0.8 x Limit)
N/A
N/A
N/A
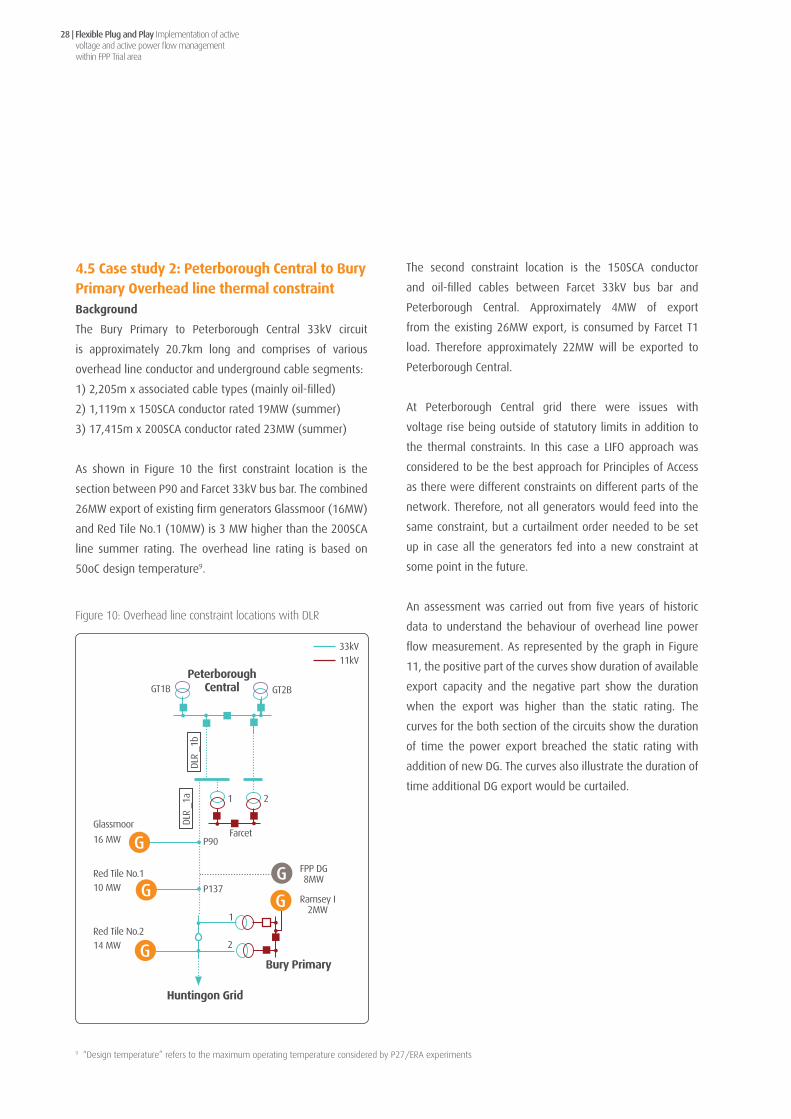
Flexible Plug and Play Implementation of active voltage and active power flow management within FPP Trial area
28 |
4.5Casestudy2:PeterboroughCentraltoBuryPrimaryOverheadlinethermalconstraintBackground
The Bury Primary to Peterborough Central 33kV circuit
is approximately 20.7km long and comprises of various
overhead line conductor and underground cable segments:
1) 2,205m x associated cable types (mainly oil-filled)
2) 1,119m x 150SCA conductor rated 19MW (summer)
3) 17,415m x 200SCA conductor rated 23MW (summer)
As shown in Figure 10 the first constraint location is the
section between P90 and Farcet 33kV bus bar. The combined
26MW export of existing firm generators Glassmoor (16MW)
and Red Tile No.1 (10MW) is 3 MW higher than the 200SCA
line summer rating. The overhead line rating is based on
50oC design temperature9.
The second constraint location is the 150SCA conductor
and oil-filled cables between Farcet 33kV bus bar and
Peterborough Central. Approximately 4MW of export
from the existing 26MW export, is consumed by Farcet T1
load. Therefore approximately 22MW will be exported to
Peterborough Central.
At Peterborough Central grid there were issues with
voltage rise being outside of statutory limits in addition to
the thermal constraints. In this case a LIFO approach was
considered to be the best approach for Principles of Access
as there were different constraints on different parts of the
network. Therefore, not all generators would feed into the
same constraint, but a curtailment order needed to be set
up in case all the generators fed into a new constraint at
some point in the future.
An assessment was carried out from five years of historic
data to understand the behaviour of overhead line power
flow measurement. As represented by the graph in Figure
11, the positive part of the curves show duration of available
export capacity and the negative part show the duration
when the export was higher than the static rating. The
curves for the both section of the circuits show the duration
of time the power export breached the static rating with
addition of new DG. The curves also illustrate the duration of
time additional DG export would be curtailed.
Figure 10: Overhead line constraint locations with DLR
9 “Design temperature” refers to the maximum operating temperature considered by P27/ERA experiments
DLR
_1a
G
PeterboroughCentral
HuntingonGrid
BuryPrimary
FPP DG8MW
Ramsey I2MW
P137
P90Farcet
Glassmoor
16 MW
Red Tile No.110 MW
Red Tile No.214 MW
GT2B
DLR
_1b
1 2
1
2
GT1B
11kV33kV
G
G
G
G

Flexible Plug and Play Implementation of active voltage and active power flow management
within FPP Trial area
| 29
Rampratecalculation
For the calculation of ramp-up rate of the Peterborough
Central Grid to Bury Primary overhead line thermal
constraint, the same method was used as per March Grid
ramp rate calculation by analysing the behaviour of the
current measurements data on the overhead line. The data
was based on the real time measurements on the overhead
lines, reported to the ANM by the Farcet RTU. As this circuit
consists of two separate overhead line sections with
separate current measurement data, both sets of data were
analysed. The graph in Figure 12 shows the distribution
of these values, highlighting some very large outliers but
the vast majority of the time the changes in MW flow are
relatively small.
Nearly all the changes in MVA flow observed in the data
were for small changes less than 0.03MVA/s and 0.04MVA/s
for MP2 and MP3 respectively. Only a small percentage of
changes were bigger steps.
The most likely ramp rate at the location is obtained by visualising
the information near the border of the graphs, between 0 and
5th; and between the 95th and 100th percentiles.
Systemlimitandsafetyoperatingmargin
The DLR solution is based on an indirect estimation of
the overhead line ratings using the local weather station
information and hence, an operating margin would be required
to account for the potential inaccuracies in establishing the
least favourable weather conditions across the span of the
Figure 11: OHL power flow duration curve
0% 10% 20% 30% 40% 50% 60% 70% 80% 90% 100%
-20
-10
0
10
20
30
40
Percentile(%)
Expo
rt(
MVA
)
Export before added DG Total Export with Curtailment Potential Export with no curtailment (breach)
FarcettoPeterboroughCentralCircuit
0% 10% 20% 30% 40% 50% 60% 70% 80% 90% 100%
Percentile(%)
-10
0
10
-20
30
40
Expo
rt(
MVA
)
Export before added DG Total Export with Curtailment Potential Export with no curtailment (breach)
FarcettoBurycircuit

Flexible Plug and Play Implementation of active voltage and active power flow management within FPP Trial area
30 |
overhead line. An operational assessment period of one
year was recommended by the DLR trial with the adoption
of most conservative settings. A 10% safe operating margin
was selected as an initial conservative setting for the trim
threshold. An initial setting of 130% maximum uplift was
also recommended based on the trial data analysis to avoid
inadvertent over-stressing of the asset.
Figure 12: Overhead line ramp rate
Table 4: ANM settings for Peterborough Central to Bury overhead lines based on a dynamic system limit (where system limit = DLR ampacity)
Parameters
Thresholds
Observation Times
Response times
Ramp Step
Trim
(0.9 x limit)
6 seconds
20 seconds
N/A
Sequentialtrip
(0.95 x Limit)
5 seconds
20 seconds
N/A
Globaltrip
(1 x Limit)
4 seconds
4 seconds
N/A
Release
N/A
10 seconds
N/A
500kW
Reset
(0.8 x Limit)
N/A
N/A
N/A
Based on the methodology described above, the ramp rate
data and parameter settings were used to establish the
constraint thresholds for Peterborough Central Grid to Bury
Primary overhead lines. An initial safety operating margin of
10% was considered with the trim threshold defined at 90%
level of the dynamic ampacity calculated by the DLR.
MP2
Percentile
0 5 10 15 20 25 30 35 40 45 50 55 60 65 70 75 80 85 90 95 100
MVA
/sC
hang
e
0.05
0.04
0.03
0.02
0.01
0
-0.01
-0.02
-0.03
-0.04
-

5Learning outcomes for the Active Power Flow application

Flexible Plug and Play Implementation of active voltage and active power flow management within FPP Trial area
32 |
This section discusses the seven Use Cases related to the
Active Power Flow application, following the case study
for its configuration in section 4. As part of the ANM trial,
the Active Power Flow management application from SGS
was deployed to manage multiple thermal constraints on
the distribution network in a coordinated manner. This
application was designed to actively monitor the flow of
real power and current measurements at key constraint
points. Using the benefit of real time network visibility of the
ANM system, this application calculates and issues control
instructions to generators in order to maintain network
loading within its capacity limits. The capability of ANM to
interact with field devices locally managing the power flow,
such as the QBCS, was also assessed.
5.1Thecapabilities,limitsandrequirementsofgeneratorcontrolaspartofanactivepowerflowmanagementapplication.Whatweretheobjectivesandchallenges?
The active power flow application was designed to run
on a real-time deterministic ANM platform in order to
achieve required response within pre-defined timescales.
The algorithm was required to continuously monitor the
constraint and DG MPs in order to maintain a dynamic set
point for real power export of DGs. This DG set point was
dynamically varied according to the individual commercial
arrangement to prevent a breach of constraint thresholds.
The challenge for this application was to establish the
optimum system configuration parameters that ensure
safety of the assets while allowing maximum possible DG
export, taking into account the fact that nothing is able to
happen instantaneously. A detailed study was undertaken as
described in the section 4.2 in order to produce a methodology
to set and continue to maintain these parameters. The delays
experienced by the DG customer projects meant that the
majority of the connection dates moved towards the end or
beyond the project timescales. Accordingly, the trial phase
was not able to benefit from the operational testing of the
application functionality with multiple DG customers. This
scenario was anticipated from the early stage of the project
and necessary actions were taken to prepare a simulation
environment capable of thoroughly testing the functionality
as described in section 3.3. However, UK Power Networks
intends to keep sharing the learning from the operational
phase to the industry following the completion of the project.
The trial set out the following objectives in order to
demonstrate this concept:
• Curtail real power output from DG to ensure thermal loading
and reverse power flow constraints are not breached.
• Establish optimum separation levels for ANM thresholds.
• Manage constraints by automatically issuing set points to
DG to ramp down the generator.
• Maintain a stable operation by controlled ramping up of
the generator.
• Automatic issue of control instruction to electrically
disconnect DG if set points fail to manage the constraints.
• Curtail and release generator according to the pre-
configured Principles of Access Maximise power export
from generator at all times.
• Measure the time taken to achieve the above actions.
Howwasthetrialconducted?
The experiments tested the philosophy of generator control
by mitigating reverse power flow and thermal loading
constraints respectively with multiple iterations of both
simulation and operational experiments. The simulated
experiment for RPF used the real power measurement of
March Grid transformers with one firm (i.e. already connected
DG) and four simulated flexible connections (i.e. new DGs)
using “shared” POA.

Flexible Plug and Play Implementation of active voltage and active power flow management
within FPP Trial area
| 33
For simulation purposes all the thresholds were first defined
and then a set of success criteria was set for the maximum
time duration for relevant actions based on the methodology
described in section 4.1 and illustrated in Figure 7. Calculations
were undertaken as per the formulae in Appendix 8 to set
the criterion of 68 seconds to reduce the power flow from
trim threshold to below reset threshold and a criterion of 260
seconds to increase the power flow to reach the trim less
threshold from below the reset threshold. The criteria defined
the maximum acceptable action time of each event based on
the parameters set in the simulated environment. It is to be
noted that, for the operational scenario, the criteria will vary
depending on the ramp rates and response capabilities of the
associated operational generator equipment.
The first simulated action was the increase in real power
measurement by increase in firm generation as shown in
Figure 13. Following this step, the trim threshold was seen to
be breached after 2 seconds. After a waiting time of 7 seconds
the ANM initiated curtailment instructions in steps. After the
next 5 seconds it was seen that all three generators started
to reduce power. Consequently, the constraint measurement
dropped below the trim threshold and continued to drop
until it reached the reset threshold taking the total time
period of 32 seconds from constraint breach to safe level of
reset threshold and well below the criterion of 68 seconds.
Similarly, the action to increase the power flow to reach the
trim less threshold took 185 seconds which was well below
the criterion of 260 seconds.
Figure 13: Constraint management event for Active Power Flow application
40000
35000
30000
25000
20000
15000
10000
5000
0
kW
18:37:00 18:38:00 18:39:00 18:40:00 18:41:00 18:42:00 18:43:00
March Grid Transformer
Global Trip
Green Vale Power
Seq Trip
Hundredroad Power
Reset
Boardinghouse Power
Trim
Firm Generation Power
Trim less Reset less
Trim
Bre
ach
Key
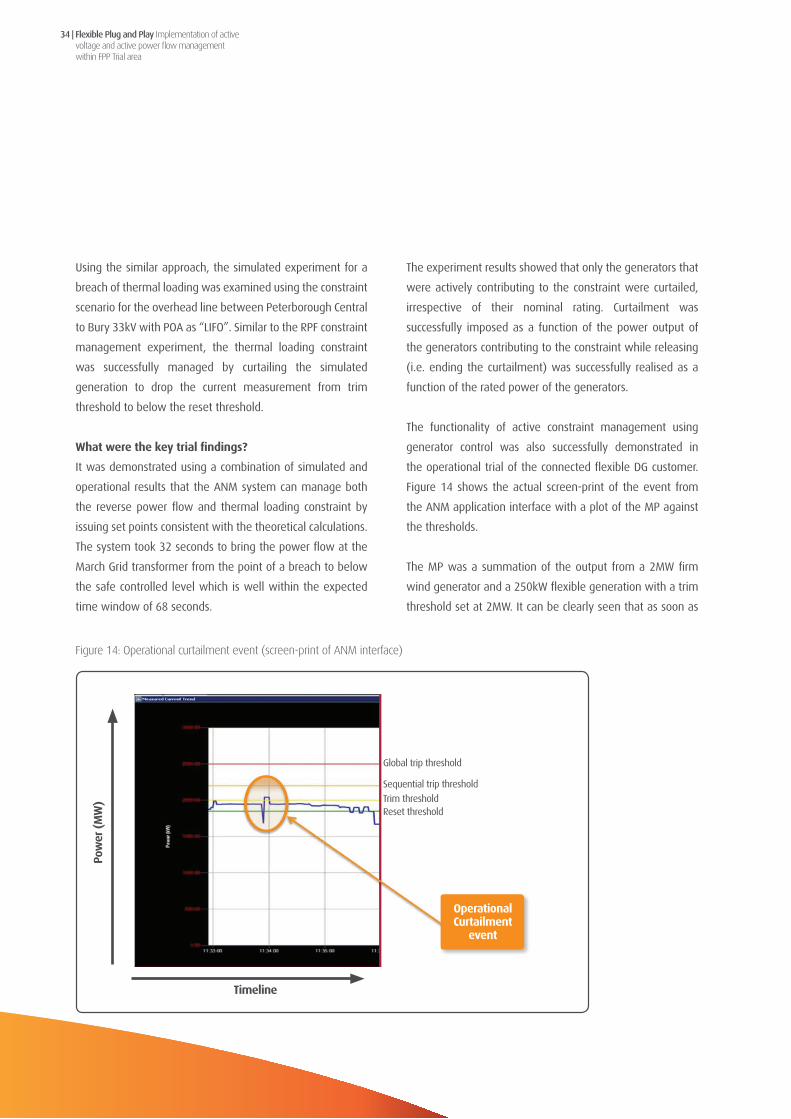
Flexible Plug and Play Implementation of active voltage and active power flow management within FPP Trial area
34 |
Using the similar approach, the simulated experiment for a
breach of thermal loading was examined using the constraint
scenario for the overhead line between Peterborough Central
to Bury 33kV with POA as “LIFO”. Similar to the RPF constraint
management experiment, the thermal loading constraint
was successfully managed by curtailing the simulated
generation to drop the current measurement from trim
threshold to below the reset threshold.
Whatwerethekeytrialfindings?
It was demonstrated using a combination of simulated and
operational results that the ANM system can manage both
the reverse power flow and thermal loading constraint by
issuing set points consistent with the theoretical calculations.
The system took 32 seconds to bring the power flow at the
March Grid transformer from the point of a breach to below
the safe controlled level which is well within the expected
time window of 68 seconds.
The experiment results showed that only the generators that
were actively contributing to the constraint were curtailed,
irrespective of their nominal rating. Curtailment was
successfully imposed as a function of the power output of
the generators contributing to the constraint while releasing
(i.e. ending the curtailment) was successfully realised as a
function of the rated power of the generators.
The functionality of active constraint management using
generator control was also successfully demonstrated in
the operational trial of the connected flexible DG customer.
Figure 14 shows the actual screen-print of the event from
the ANM application interface with a plot of the MP against
the thresholds.
The MP was a summation of the output from a 2MW firm
wind generator and a 250kW flexible generation with a trim
threshold set at 2MW. It can be clearly seen that as soon as
Figure 14: Operational curtailment event (screen-print of ANM interface)
Timeline
Pow
er(
MW
)
OperationalCurtailment
event
Global trip threshold
Sequential trip threshold
Trim thresholdReset threshold

Flexible Plug and Play Implementation of active voltage and active power flow management
within FPP Trial area
| 35
the MP breached the trim threshold it was swiftly reduced
down below the trim threshold. The curve then continues
to descend until it drops below the reset threshold. This
demonstrated two key functionalities of the active power
flow application:
1 ANM quickly acted on a breach of the trim threshold in
order to avoid breaching the next threshold;
2) ANM continued to manage the constraint until the MP
dropped below the Reset threshold in order to maintain
stability.
It was demonstrated that the amount of time used by the
ANM to prevent an overload is much lower than the time
constants required by the assets to “feel” that overload. The
assets (overhead lines, transformers etc.) need a considerable
amount of time to increase/decrease their temperature
when their power flow changes. As the trim threshold was
below the asset rating, the ANM system was capable of
taking preventive measures before an overload is identified.
In effect, the rapid ANM action time within one minute can
allow the distribution network to operate closer to its limit
and at the same time avoid equipment deterioration.
The key learning generated was the demonstration of the
capability of ANM application to actively manage thermal
loading and reverse power flow constraints. One of the
additional learning outcomes was the study in setting an
operational envelope to implement an optimum configuration
setting for the ANM which is separately covered in section 4.
5.2Thecapabilities,limitsandrequirementsofQuadrature-booster(phaseshiftingtransformers)Whatweretheobjectivesandchallenges?
The capabilities of the Quadrature-booster Control System
(QBCS) to effectively balance power flows on two circuits was
proven earlier in the project during the commissioning stage
in 2013. It was further demonstrated by the Quadrature-
booster trial that the system can increase the capacity
headroom at the Wissington 33kV network by approximately
10MW. To further improve the functionalities of the QBCS to
take into account generation connections on the two parallel
33kV circuits under control, an innovative algorithm was
developed and hosted on the ANM platform to issue optimal
load sharing set-points.
On 26 July 2013, the Quadrature-booster was commissioned
on the network as shown in Figure 15 to run either in an
automatic or in a manual mode. The Wissington CHP
generator is very sensitive to line disturbances, so it was not
experimentally possible to demonstrate the interaction of
the ANM and QBCS systems in the operational network. As
mentioned in SDRC 9.8 report, British Sugar currently operate
automatic turndown scheme on their generation which
takes into account the Wissington British Sugar substation
outgoing 33kV feeder circuit breakers status as well as
analogue measurements on from the feeders. In order
for this scheme to incorporate the Quadrature-booster
operations it was necessary to provide ‘Tapping in progress’
status information for the Quadrature-booster, to trigger the
masking of the generation turndown scheme and ensure the
generator ignores any changes on line currents for which it
would normally initiate a reduction in generation output. To
mitigate this, network conditions were simulated ensuring
these actions did not impact the validity of the results.
In July 2013 the Downham Market No.2 circuit was switched
off to connect the Quadrature-booster. It can be seen from
Figure 16 that the imbalance in current loading between
Northwold No.1 and Downham Market No.2 circuits was
reduced significantly when the Quadrature-booster was
brought online from 26 July 2013. There was no significant
effect on the flow on the Southery line because it does not
run electrically in parallel with the Quadrature-booster circuit
(Downham Market line). The gap in the curves represents

Flexible Plug and Play Implementation of active voltage and active power flow management within FPP Trial area
36 |
the time period when data was not available between 16
September and 10 October 2013 due to the technical issues
related to the communications network and the data storage.
The following observations were made in reference to the
graph in Figure 16 overleaf.
• Downham Market No.2 circuit was loaded approximately
twice as much as both the Northwold No.1 and Southery
No.3 circuits for the period September 2012 to June 2013.
With an average of approximately 800A delivered by the
CHP generator, the Downham Market No.2 circuit was load
at approximately 400A with both the Northwold No.1 and
Southery No.3 circuits carrying approximately 200A each
on average.
• Following the commissioning of the Quadrature-booster, it
is clear from Figure 16 that load profiles for Northwold No.1
and Downham Market No.2 circuits are generally closer
to each other. The Northwold No.1 circuit load averaged
about 200A while the load on the Downham Market No.2
reduced to an average of 250A.
Figure 15: Simplified Wissington 33kV network
NOP
QB
11.07 km6.31 km
3 2 1
5.36
km
8.154 km8.275 km
33 kV
11 kV
Wissington33kV
WissingtonCHP
Northwold
Southery
MarchGridViaLittleport
WalsokenGridViaOutwellMoors
KingsLynnSouthGrid
TeeWaltingtonDownham
Market
SwaffamGrid
G
NOP - Normally Open Point
QB - Quadrature-booster

Flexible Plug and Play Implementation of active voltage and active power flow management
within FPP Trial area
| 37
Figure 17 overleaf shows a scatter graph of recorded actual
circuits loads against the recorded CHP export during the trial
period.
By inserting lines of best fit (trend lines) and extrapolation
of the trend lines it can be seen that all the three 33kV lines
would be loaded below their thermal seasonal ratings up
to a generation export of approximately 64MW – which is
10MW above the current 54MW (winter) export restriction.
At the inception of the project, the QBCS was based on the
simplified assumptions that only power flow measurements at
Wissington side 33kV on the Northwold No.1 and Downham
Market No.2 circuits would be used to regulate the power
sharing between these two circuits. It was also not envisaged
at that time that other new distributed generation would
be connected on these two lines between Wissington and
Northwold or Wissington and Downham Market tee point.
The 33kV network has since changed with the connection
of a new 5MW solar farm generation on the Northwold
No.1 line at the half-way point of the circuit. This situation
has changed the power flows, rendering in the initial
assumptions on which the current QBCS algorithm as
Figure 16: Wissington 33kV circuit loads showing impact of Quadrature-booster (2012 - 2014)
29/0
8/12
18/1
0/12
07/1
2/12
26/0
1/13
17/0
3/13
06/0
5/13
25/0
6/13
14/0
8/13
03/1
0/13
22/1
1/13
11/0
1/14
02/0
3/14
21/0
4/14
10/0
6/14
30/0
7/14
Time(2012-2014)
Load
-Cu
rren
t[a
mps
]
0
100
200
300
400
500
600
700
800
9000
1000
Key
CHP Export Northwold No.1 Downham Market No.2 Southery No.3
Winter Rating Autumn/Spring Rating Summer Rating

0
5
10
15
20
25
30
35
20 22 24 26 28 30 32 34 36 38 40 42 44 46 48 50 52 54 56 58 60 62 64
Circ
uit L
oad
[MW
]
Wissington CHP Generation Export [MW]
Northwold Downham Southery Winter static rating
Summer Static Rating Linear (Northwold) Linear (Downham ) Linear (Southery )
Flexible Plug and Play Implementation of active voltage and active power flow management within FPP Trial area
38 |
installed to be no longer valid. To correct this, it became clear
that circuit load measurements at both end ends of the two
lines were required to input into the control system. This was
discussed in February 2014, and the project introduced an
additional QBCS trial – picking up additional measurements
at the remote ends of the lines and using ANM to calculate
required inputs to feed into the QBCS as shown below.
The key measures of success for this trial were:
• Demonstrate the ability of the ANM and QBCS systems to
work together to increase the utilisation of existing network
assets and unlock additional capacity to connect DG; and
• Demonstrate functionality and operability of the scheme
using IEC 61850 communication platform, ANM and QBCS.
The trial set out the following objectives in order to
demonstrate this concept.
• Prove that the use of the Quadrature-booster can improve
capacity utilisation on Downham Market No.2 and
Northwold No.1 circuits;
• Prove that the central ANM system can execute intelligent
algorithms to calculate an optimum load sharing ratio and
provides it as input to the QBCS for use in adjusting power
flows on the two circuits;
Figure 17: Graph showing Wissington 33kV circuit loads Vs CHP generation export
WissingtonCHPGenerationExport[MW]
0
5
10
15
20
25
30
35
Circ
uit
Load
[M
W]
20 22 24 26 28 30 32 34 36 38 40 42 44 46 48 50 52 54 56 58 60 62 64
Key
0
5
10
15
20
25
30
35
20 22 24 26 28 30 32 34 36 38 40 42 44 46 48 50 52 54 56 58 60 62 64
Circ
uit L
oad
[MW
]
Wissington CHP Generation Export [MW]
Northwold Downham Southery Winter static rating
Summer Static Rating Linear (Northwold) Linear (Downham ) Linear (Southery )
Northwold Downham Southery Winter static rating
Summer Static Rating Linear (Northwold) Linear (Downham) Linear (Southery)

Flexible Plug and Play Implementation of active voltage and active power flow management
within FPP Trial area
| 39
• Prove the capability of the ANM and the QBCS to efficiently
interact with each other to apply the load sharing ratio
using IEC 61850 communications standard; and
• Prove the thermal loading estimation of the circuits by
monitoring remote measurements
Howwasthetrialconducted?
The Quadrature-booster normally adjusts its tap ratio in order
to share power flows in proportion to the thermal ratings
of the parallel circuits, based on the local measurements.
The trial explored the use of the ANM to access remote
measurements and to calculate a power sharing “ratio”
that, defines the proportion of power that the QBCS
Figure 18: Trial architecture for the QBCS Algorithms
RFMesh
Simulated P, Q Measurement CT3
Potential DG Connection
Remote P, Q Measurement
Remote P, Q Measurement
Existing P, Q Measurement (CT2)
Existing P, Q Measurement (CT1)
ToMarchGrid
WissingtonBSC
Simulated P, Q Measurement CT4
TAPCON 260
N Ratio
P, Q
P, Q
P, Q
N Ratio
P, Q
SGS ANM
QBCSAlgorithm
QB
GG
G
Wissington33kV
Northwold
DownhamMarket
Southery

Flexible Plug and Play Implementation of active voltage and active power flow management within FPP Trial area
40 |
attempts to push through one of the two circuits. Provision
to utilise dynamic rating data was also incorporated in the
ANM-QBCS management scheme. Further to the successful
demonstration of QBCS integration to the ANM by using IEC
61850 standard in 2013, the trial further explored the use of
the standard to update QBCS load ratio setting from ANM.
Figure 18 opposite shows the network diagram showing the
proposed current transformers (CTs) at each end of each line
and the information flows between ANM and QBCS.
As per Figure 18, CT1 was installed on the Downham Market
(Quadrature-booster, Line2) line at the Wissington substation
side, while CT3 was located (which was a simulation for the
time being) at the other end of this same line2. CT2 was
installed on the Northwold line (Line1) at the Wissington
substation side, and CT4 was to be simulated at the other
end of this line1.
The objective was not only sharing the power through the
lines equally, but also to account for any generation connected
on any of the lines between the two ends. Accordingly, the
algorithm was designed to detect any generation between
“CT1 and CT3”, and between “CT2 and CT4” and calculate
the power sharing factor/ratio. The controllable power was
the one that passes only through CT1 (Downham Market
line Wissington substation side) and CT2 (Northwold line
Wissington substation side), this was because of the position
of the Quadrature-booster. Any generation that pushes
power at any point between the ends of any of these lines
was considered to be forced rather than controllable; hence
the corresponding line has to deal with this power regardless
of the power flowing through the Wissington substation side.
The concept of the ANM to issue set-points to smart devices
such as the AVC relay has been demonstrated by another
use case and the innovation here is to apply to a different
control device such as the QBCS. The end to end process flow
of the algorithm is summarised by the flowchart in Figure
19 overleaf.
The algorithm was first tested through a desktop validation
process. This was then followed by the testing in the
simulation platform as follows:
1. With no DG, control power flow was observed to be the
same on both circuits, which corresponded to a power
sharing ratio of 0.5.
2. DG was then introduced to increase the power flow on the
Northwold end of Circuit 1.
3. The behaviour of Quadrature-booster was monitored when
QBCS received only local measurements at Wissington.
4. The trial functionality in ANM was enabled with additional
measurements and Quadrature-booster control algorithm.
5. The behaviour of Quadrature-booster was simulated when
the QBCS received a modified power sharing ratio from
ANM.
6. The DG was removed and the response of ANM and
Quadrature-booster was observed.
Whatwerethekeytrialfindings?
The capability of the QBCS to coordinate with the ANM to
unlock additional capacity on the grid, was proven using
desktop simulation. The ANM was able to interact with the
QBCS to send the optimal load sharing ratio. As potential
new generators connect on network in the future, it was
evident that the system will need to evolve to accommodate
measurements from the new generations connected. The
flexibility of the centralised ANM solution enabled the
processing of additional measurements and coordinate with
the QBCS to enhance the powerflow balancing functionality
of the Quadrature-booster.

Flexible Plug and Play Implementation of active voltage and active power flow management
within FPP Trial area
| 41
This enabled the project to generate the following learning
outcomes;
1) A centrally located application such as the ANM can be
utilised to:
a) carry out computations of control algorithms for optimal
load sharing;
b) estimate thermal loading of the circuits by monitoring
remote measurements in real time; and
c) send the optimal load sharing ratio to the QBCS.
2) It was demonstrated that actively managed QBCS with
remote overhead line measurements, algorithm hosted on
Figure 19: ANM – QBCS algorithm
Remote CT Measurements(End of Lines)
Local CT Measurements
(Wissington Side)
Start
Calculate maximum power flowing through each line
Calculate total power flowing through both lines
Calculate the thermal sharing
ratio (nt)
Calculate the power that should flow through each line
Calculate the controlled power (power pushed from Wissington) and then Uncontrolled Power (power pushed from elsewhere) for each line
Test if the power pushed through any of the lines is Higher than the power
that should flow through that line
If the power pushed through a line is higher than what should flow through that line, all the power should be diverted through the other line. Else, the power from
Wissington through a line is the difference between what should flow and what is being pushed
Power sharing factor (N) = Power exported from Wissington (Line2)/(Power exported from Wissington (Line1) + Power exported from Wissington
(Line2))
Update the power sharing factor on the TAPCON260
Update the Overloadingflag statusTest for overloading
Thermal ratingsof the lines

Flexible Plug and Play Implementation of active voltage and active power flow management within FPP Trial area
42 |
ANM (SGS platform) can increase 33kV capacity headroom
at Wissington by approximately 10MW.
3) It was also shown that the system creates additional
capacity on the Wissington 33kV network (before the
network was at full capacity and could not allow further
generation export). This can offer more flexible and
cheaper connection for potential DG customers.
4) As a recommendation for future work, the trial also
identified a potential gain in additional headroom for
generation export on each line by considering the
integration of DLR technology with QBCS and ANM.
5.3Demonstratetheabilityofanactivepowerflowmanagementapplicationtoadapttodifferentnetworkrunningarrangements.Whatweretheobjectivesandchallenges?
The main objective of this experiment was to prove that ANM
can be pre-configured to automatically cope in real-time
with the changing network conditions without the need of
manual interventions.
The standard configuration of the ANM was based on the
Normal Running Arrangement (NRA) as specified by the
network outage planning team10. The trial involved carrying
out power system analysis to identify all possible running
arrangements and their corresponding impact to the
constraints and the associated DG customers connected.
Within the trial area, the Normally Open Points (NOPs) and
Normally Closed Points (NCPs) were not remotely controllable
and indicated. Hence, the philosophy was tested and proven
using simulated network indications. The use case in the section
4.4.3 covers the integration of remotely controllable switches.
The trial successfully met the following requirements in order
to demonstrate this concept:
• Analyse the network to identify all the NOPs and NCPs that
can vary the running arrangement;
• Identify all possible running arrangements with their
corresponding constraints and contributing DGs;
• Configure the ANM with multiple scenarios and multiple
thresholds; and
• Prove that ANM can seamlessly change the association
of the DGs to a constraint threshold based on variation of
running arrangement.
Howwasthetrialconducted?
The experiment involved pre-configuration of the Active
Power Flow application and sequential change of running
arrangements. The expected outcome was for ANM system
to recognise a change in network configuration, reading the
configuration data for the specific network arrangement and
immediately use these to manage the network.
The experiment tested three NRAs with the associated NOP/
NCP as Pole 49 (P49) isolators with simulated firm DGs and
simulated flexible connections. For each NRA, the nature
of constraint was varied for the flexible connections as per
Table 5 overleaf. The network indications monitored were
March Grid circuit breaker status, P49 isolator status and
Peterborough Central circuit breaker status. MP4 represents
the power flow on circuits between March Grid and the P49
isolator while MP5 represents the power flow on circuits
between Peterborough Central and the P49 isolator.
The experiment demonstrated that the flexible simulated DG
was not affected on NRA1 as expected. As soon as the change
occurred from NRA1 to NRA2, curtailment was issued to the
DG1 that was associated with MP4 constraint. Similarly, as
soon as the change occurred from NRA2 to NRA3, curtailment
was issued to DG2 that was associated with MP5 constraint
while releasing DG1.
10 “Normal Running Arrangement refers to the distribution network configuration under normal network operating conditions

Flexible Plug and Play Implementation of active voltage and active power flow management
within FPP Trial area
| 43
Whatwerethetrialfindings?
The experiment demonstrated that ANM automatically
detected the change in constraint type of a MP on change
of NRA and acted accordingly. This means ANM curtailed
generation in the scenario when the constraint MP became an
active constraint based on the specific running arrangement.
It was proven that the ANM application can manage multiple
running arrangements if these are pre-defined and the
relevant analysis is completed.
This enabled the project to generate the following learning
outcomes;
• The dynamic and flexible characteristics of the Active
Power Flow management application can add value to the
overall ANM functionality in detecting and responding to
change in the network running arrangements.
• With the capability of the ANM to operate in different
seasonal and abnormal running arrangements, DGs can be
correctly associated with the real time constraint and avoid
unnecessary curtailment of the power export.
• The possible changes in the running arrangements could
be pre-defined and pre-configured in the ANM system to
take into account any possible variation of relationships
between the constraint and the contributing DG. This
means constraints would always be accurately managed
and again would reduce the possibility of DGs being
unnecessarily curtailed.
5.4DemonstratethevalueofRingMainUnits(previouslyFUSinUseCasedocument)whendeployedwithanactivepowerflowmanagementapplication.Whatweretheobjectivesandchallenges?
The purpose of Frequent Use Switches (FUS) trial in the FPP
project area was to provide remote switching flexibility to
adopt different network configurations on the existing 33kV
overhead lines in a cheaper and faster way, compared to the
traditional method of sending a resource to site. For clarity,
it should be noted that the term FUS refers only to a switch
capable of high mechanical endurance during its useful life.
The FUS is not intended to be frequently switched open/
close, for example several times a day.
The original scope of the project included a provision for FUS
to be deployed at a strategic location on the 33kV overhead
line circuits between Peterborough Central and March Grid
substations to optimise the amount of DG in the trial area.
At these strategic locations a business-as-usual project was
taking place to upgrade the RMUs, which have the same
functionality as FUSs, and therefore the FPP project decided
to use these in the trial. This change was approved by Ofgem
and also highlighted in SDRC 9.4.
Table 5: Running arrangement and switch status
RunningArrangement
NRA 1 (normal)
NRA 2
NRA 3
MarchGridcircuitbreaker
Closed
Closed
Open
P49isolator
Open
Closed
Closed
PeterboroughCentralcircuitbreaker
Closed
Open
Closed
ConstraintAssociated
No constraint
Thermal limit (MP 4)
Thermal limit (MP 5)
AssociatedDGcurtailed
None
DG1
DG2

Flexible Plug and Play Implementation of active voltage and active power flow management within FPP Trial area
44 |
A number of considerations were made when trialling the
RMUs:
• There was a need to shift Funtham’s Lane and Whittlesey
load between March Grid and Peterborough Central under
n-1 condition at either grid site.
• The primary function of the RMUs installation was to enable
remote switching to modify the network. The existing NOP
was a manual Air Break Switch Disconnector (ABSD), and
was not remotely controllable. It was therefore difficult
to make network re-configurations as network conditions
change from time to time.
• The FUS trials on this network tested the principle for
potential application at other network locations.
• The benefit is mainly an improved flexibility for network
configuration change.
Howwasthetrialconducted?
Section 4.3.3 demonstrated the capability of the ANM to
cope with various running network arrangements. This use
case experiment demonstrated how RMUs can be used to
assist the ANM system by reconfiguring network to enhance
network performance or remove barriers to DG. It consisted
of first simulating how the system responded to a change of
switch position and secondly to demonstrate that the system
could communicate with field device such as the newly
commissioned RMU at Whittlesey.
Two RMUs were installed at Whittlesey Primary with
Normally Open Points on the Chatteris/March Grid circuits as
shown in the simplified network drawing in Figure 20.The
RMUs were installed to address an existing issue with the
loading of the 33kV circuits feeding Chatteris, Whittlesey and
Funtham’s Lane from March Grid. An outage affecting one
Figure 20: Simplified FPP trial network showing location of RMUs at Whittlesey Primary
PeterboroughCentral132/33kV
FunthamsLane
WhittleseyChatteris
MarchGrid132/33kV
GT1B GT2B
RMU_2
RMU_1
Networkre-arrangement
2
2 1
1
33kV 11kV ABSD Ring Main Unit
Normally Open, manually operated
Normally Open, auto operated

Flexible Plug and Play Implementation of active voltage and active power flow management
within FPP Trial area
| 45
of these circuits at peak load would subject the remaining
circuit to a current of approximately 720A compared to the
circuit rating of 575A.
The RMUs are controlled by the Control Engineers via the
RTUs using DNP3 protocol over the SCADA communication
network. The ANM system received the switch position
indications in real time from the RTU using the IEC 61850
protocol thereby, actively updating its database to reflect the
topology of the network.
Whatwerethetrialfindings?
The simulated trial demonstrated in principle that RMUs
could provide the flexibility to run the network with normally
open points (NOPs) on the March Grid legs/circuits at
Whittlesey. This could enable Funtham’s Lane and Whittlesey
primary substations to be fed from Peterborough Central and
overcome the loading issue referred above. Through the ANM
monitoring the status of the March Grid legs of the Whittlesey
RMUs, the constraint management scenarios could be altered
if Funtham’s Lane and Whittlesey primary substations were
configured to be fed from March Grid.
The RMU equipped with automatic switching feature can also
provide remote operation capability for change of switch
position providing flexibility for control room staff to change
the arrangement of the network without sending personnel
to site. The provision of the switch indications to ANM system
demonstrated functional benefits in better management of
the constraint and DGs.
The key learning was that RMU can be used to implement
active network configuration and thereby facilitates ANM
to enhance active power flow management process. This
learning compliments the use case described in section 4.3.3
exploring the capability of ANM in utilising switch status
information to detect the change in running arrangements.
This enabled the project to generate the following learning
outcomes;
• The use of RMUs can offer value in reconfiguring the
network to utilise the spare capacity from one circuit and
mitigate thermal overloads on another circuit thereby,
removing barriers to the connection of DGs.
• Based on the indications provided by RMUs, the ANM
can be implemented with flexible control algorithms to
increase the energy export from the DGs.
5.5DemonstratetheabilityofanactivepowerflowmanagementapplicationtoadapttodifferentnetworkratingsasprovidedbyDLRdevicesorbyathermalratingsestimationapplication.Whatweretheobjectivesandchallenges?
The aim of the trial was to demonstrate that the ANM
application was able to use dynamic asset rating information
provided by DLR devices or thermal rating estimation
application to dynamically change the ANM’s threshold
parameters thus allowing the asset to be loaded according
to its real time capacity.
The trial set out the following objectives in order to
demonstrate this concept:
• Process the ampacity data calculated by both field based
and server based dynamic rating solutions;
• Curtail real power output from DG to ensure thermal
constraint is not breached based on the real time rating;
• Establish a safety operating margin between the ampacity
values and the ANM threshold based on the reliability
factor concluded by the DLR trial;
• Establish an optimum sensitivity setting for using the
dynamic ratings data;
• Establish optimum separation levels for ANM thresholds;

Flexible Plug and Play Implementation of active voltage and active power flow management within FPP Trial area
46 |
• Manage constraints by issuing set points (curtailing) or by
tripping the DG circuit breaker;
• DG is curtailed and “released” according to the configured
Principles of access; and
• Maximise real power output from DG at all times.
The challenge in this case was to identify an optimum sensitivity
setting for ANM application to process the dynamic rating
information. This setting was required to specify how often ANM
captures the dynamic rating information and what percentage of
ampacity rating deviation triggers a change of threshold. Similar
to the challenge in setting threshold for RPF, the separations
between the various ANM thresholds should be correctly set to
ensure safety of assets while maximising the DG export.
Howwasthetrialconducted?
The trial experiments demonstrated the functionality
by using data from DLR relays and thermal estimation
application respectively. Alstom MiCOM P341 relays calculated
the overhead line ampacity data using the weather
measurements from the locally installed weather stations
and continuously send them to ANM. The ANM system used
sgs ratings application as described in section 3.3.1 to process
these ampacity data to set the dynamic thresholds.
Figure 21: Process flow to update dynamic threshold
DLR Relay Rating Calculation
Is the new rating different from previous?
ANM Receives Rating
Is the new rating different from current?
Keeps previous sgs power flow application thresholds abd does not
update sgs data historian
Updates sgs power flow application thresholds and sgs data historian
No
Yes
Yes
Yes No

Flexible Plug and Play Implementation of active voltage and active power flow management
within FPP Trial area
| 47
In order to achieve a stable system performance, various
sensitivity settings were tested. The frequency of DLR data
received by ANM and the rate of change of the ampacity values
were closely observed to set optimum scheme in threshold
variation.
The DLR data was received by ANM approximately every 2
seconds with a minimum change rate of every 4 seconds
to a maximum change rate of every 15 seconds. The ANM
application was configured to wait 5 seconds before calculating
a new threshold. The maximum change in thresholds every 5
seconds allowed by the ANM system was 0.5A (amperes). The
5 second update rate and 0.5A maximum threshold change
were chosen to ensure a smooth variation in thresholds and to
filter out fast weather variations that do not affect the conductor
thermal behaviour.
Figure 21 left describes the process flow of updating the
dynamic threshold from the point of the ANM receiving dynamic
ratings data.
An optimum separation value of 20A between thresholds
was established by considering the system’s selectivity to
trigger the most adequate action for each situation. In one
hand if the separation between thresholds was too small, it
created a very sensitive system with unnecessary threshold
breaches and frequent ANM actions. On the other hand if
the separation between thresholds was too wide the system
became too insensitive leading to system inefficiencies with
generator exports to lower levels.
Whatwerethetrialfindings?
The graph in Figure 22 illustrates the behaviour of ANM
thresholds changing in real time in accordance to the dynamic
ampacity data provided by the DLR. In this case study, the
global trip threshold was equal to the DLR ampacity values
which meant all the threshold values also altered dynamically
while maintaining the 20A separation value.
As seen in the graph, when the constraint MP3 breached the
dynamic trim threshold of 23,591kW, the setpoint instructions
were issued to curtail the power output of DG1. Similarly,
after MP3 was safely brought below the reset threshold of
22,448kW, the set-point instructions were issued in steps to
release the power output while ensuring the MP3 stayed
below the trim threshold.
The experiment was also repeated to use real time ratings
information calculated by the thermal estimation application
hosted by the ANM. The Active Power Flow behaved in similar
fashion with the data provided by thermal rating estimation
application as it did with the DLR data. The comparison of the
calculations between these two real time rating solutions is
covered in section 4.3.6.
It was demonstrated using simulated experiment that Active
Power Flow management application can manage the thermal
constraint using dynamic threshold to manage power export of
DG. The comparison of the ANM behaviour between DLR relay
data and the thermal estimation application data proved that the
concept could be applied to work with any type of data source.
Based on the results of the experiment it was verified that
the Active Power Flow application is capable of using real
time thresholds to issue set-points for curtailing and releasing
the generators under its control. The outcome of the trial
showed that the usage of dynamic thresholds could unlock
additional capacity on the network by integrating dynamic
rating solutions with the ANM application.
As described in section 5.1, the Active Power Flow application
was proven to manage DG active power output based on static
rating or a pre-defined threshold of an overhead line. As part
of this use case, the trial further demonstrated its capability to
use a DLR technology to maximise DG power export allowing
additional headroom beyond the static rating of the overhead
line to accommodate higher power output from DG.

Flexible Plug and Play Implementation of active voltage and active power flow management within FPP Trial area
48 |
5.6DemonstratethevalueofDLRandthermalratingsestimationwhendeployedwithanactivepowerflowmanagementapplication.Whatweretheobjectivesandchallenges?
In addition to a site based DLR trial, the project also trialled
a thermal ratings estimation application at the central
ANM system providing dynamic rating information for the
power flow analysis. The objective was to prove that the
implementation of both site based DLR solution and server
application based thermal estimation application can add
value to the efficient operation of the ANM system. The
functionality was trialled by the implementation of the sgs
ratings application within the ANM platform.
The challenge was to assess the accuracy and reliability of
each solution as there is no baseline reference available.
Based on the different technologies and rating calculation
methods, differences in the circuit ratings were expected but
it was difficult to establish which estimation technique was
more accurate.
A comparative analysis was required to be undertaken to
validate application based thermal estimation with the site
based conventional P341 relay dynamic line rating solution.
The objective of the analysis was to identify the origin of the
differences in the calculated values between the sgs ratings
application and the DLR relay.
Figure 22: Time evolution graph for DG management based on DLR threshold
Trim
Bre
ach
19:19:30 19:20:00 19:20:30 19:21:00 19:21:30 19:22:00 19:22:30 19:23:000
5000
10000
15000
20000
25000
30000
kW
DG1 SetpointDG1 Power Global Trip
Seq Trip
Firm Generation MP3
Reset
MP3 Power
Trim Trim less Reset less

Flexible Plug and Play Implementation of active voltage and active power flow management
within FPP Trial area
| 49
Howwasthetrialconducted?
The line rating calculated by the sgs ratings application was
compared against results from the calculations provided by the
DLR relays. Both solutions used the weather information provided
by the same weather station for a like-by-like comparison.
The sgs ratings application ran an algorithm to provide real-time
rating estimations based on a thermal model, measurements
of environmental parameters and measurements of conductor
temperature and current. For the FPP project, conductor
temperature was not used in the calculation.
Four different methods were used by the algorithm in a
hierarchy to calculate circuit ratings as shown in Figure
23. Each method calculated ratings to a certain degree of
accuracy with the more accurate method requiring more
computation time. By using this principle, the application was
still able to provide thermal estimation using any one of the
method if any of the methods were impacted by failures in
measurements or communications link. For the FPP project,
only three out of the four modules were trialled without
including the temperature rating module as the temperature
measurement data was not available.
The conductor thermal rating was calculated from the energy
balance between heat dissipated by the Joule effect within the
conductor and the heat exchange on the conductor surface, as
influenced by environmental parameters and represented by
the steady state energy balance equation given in Appendix
6. Two key elements were identified that were expected to
cause the differences in the calculated values between the
sgs ratings application and the DLR Relay as follows.
Figure 23: sgs ratings application algorithm hierarchy
Start
Seasonal Rating Module
Temperature Rating Module
Meteoroligical rating module
Estimation Rating Module
Stop
OutputCirc1 123Circ2 234Circ3 245
OutputCirc1 123Circ2 234Circ3 245
OutputCirc1 123Circ2 234Circ3 245
OutputCirc1 123Circ2 234Circ3 245
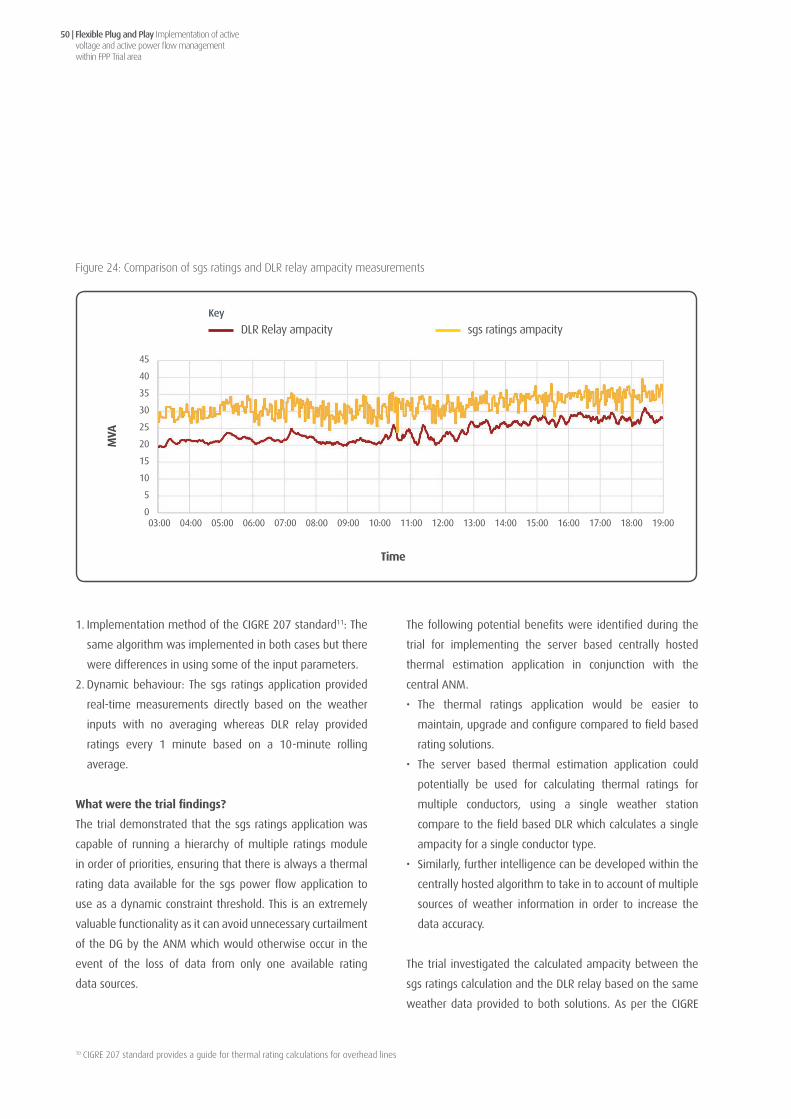
Flexible Plug and Play Implementation of active voltage and active power flow management within FPP Trial area
50 |
1. Implementation method of the CIGRE 207 standard11: The
same algorithm was implemented in both cases but there
were differences in using some of the input parameters.
2. Dynamic behaviour: The sgs ratings application provided
real-time measurements directly based on the weather
inputs with no averaging whereas DLR relay provided
ratings every 1 minute based on a 10-minute rolling
average.
Whatwerethetrialfindings?
The trial demonstrated that the sgs ratings application was
capable of running a hierarchy of multiple ratings module
in order of priorities, ensuring that there is always a thermal
rating data available for the sgs power flow application to
use as a dynamic constraint threshold. This is an extremely
valuable functionality as it can avoid unnecessary curtailment
of the DG by the ANM which would otherwise occur in the
event of the loss of data from only one available rating
data sources.
The following potential benefits were identified during the
trial for implementing the server based centrally hosted
thermal estimation application in conjunction with the
central ANM.
• The thermal ratings application would be easier to
maintain, upgrade and configure compared to field based
rating solutions.
• The server based thermal estimation application could
potentially be used for calculating thermal ratings for
multiple conductors, using a single weather station
compare to the field based DLR which calculates a single
ampacity for a single conductor type.
• Similarly, further intelligence can be developed within the
centrally hosted algorithm to take in to account of multiple
sources of weather information in order to increase the
data accuracy.
The trial investigated the calculated ampacity between the
sgs ratings calculation and the DLR relay based on the same
weather data provided to both solutions. As per the CIGRE
Figure 24: Comparison of sgs ratings and DLR relay ampacity measurements
10 CIGRE 207 standard provides a guide for thermal rating calculations for overhead lines
03:00 04:00 05:00 06:00 07:00 08:00 09:00 10:00 11:00 12:00 13:00 14:00 15:00 16:00 17:00 18:00 19:000
5
10
15
20
25
30
35
40
45
Time
MVA
sgs ratings ampacityDLR Relay ampacityKey

Flexible Plug and Play Implementation of active voltage and active power flow management
within FPP Trial area
| 51
standard it can be interpreted that wind speed and wind
direction have the greatest influence on the calculation of
ampacity.
Figure 24 shows a time series graph comparing the ampacity
calculated by the sgs ratings and the DLR. The main cause
for the difference between the magnitudes of the ampacity
data was found to be due to the different values used for
wind direction parameter in each system. The sgs ratings
used a fixed value of 70 degrees (relative to the conductor’s
orientation) which generated a higher ampacity compared to
the DLR Relay which used fixed value of 20 degrees (relative
to the conductor’s orientation).
Another difference observed between the two ampacity
data is the behaviour of the curves. The wind speed
used by the DLR relay was based on a 10 minutes rolling
average, whereas the wind speed used by the sgs ratings
application was based on the real time wind speed data sent
by the weather station. Due to this averaging function, the
calculated ampacity from the DLR relay shows a smoother
characteristics compared to the calculated ampacity of the sgs
ratings (without averaging) which shows sharp fluctuations.
Further learning outcomes from the DLR trial are separately
covered in section 7.7.
5.7Thecapabilitiesandlimitsofthecommunicationsplatformtosupporttheevolvingneedsofactivepowerflowmanagement.Whatweretheobjectivesandchallenges?
As part of the analysis carried out during the bid stage, the FPP
team considered a number of communication solutions that
could potentially meet the initial requirements at different
costs. It was concluded the RF mesh based solution can
potentially meet all requirements even though the initially
specified bandwidth and latency requirements of ANM
solution were quite demanding. Significant learning was
gained in implementing system optimisation techniques to
meet the end objectives without the need of installing high
bandwidth but relatively inflexible communication solutions.
The added benefit of flexibility, resilience, scalability and
ease of installation gained from the RF mesh network was
proven to outweigh the limitations in bandwidth and latency
when operating under an optimised setting.
As part of the trial, various scenarios were required to be trialled
to verify ANM performs as expected in order to maintain the
system under safe limits. The FPP communications solution
was designed and tested with the dual hardware redundancy
feature on every possible component of the architecture
and where the dual redundancy was not possible to be
implemented, the ANM application was designed to take fail
safe actions. The deterministic nature of the ANM solution
rigorously tested the performance of the communication
platform requiring the system as a whole to undergo a
number of enhancements and optimisations. The design
parameters of all the communicating devices were also
required to be adapted to allow the best operation of the
overall system.
The challenge was to understand the overall impact of
communication failures to various components in the
architecture. A communications system failure between the
ANM system and critical MP could result in the ANM system
issuing full curtailment to all associated DG to ensure that the
power flows on the network remain within limits.
The RF Mesh Network was initially intended to support one
second polling12 to meet the worst case scenario of the ANM
data requirements. However, the initial lab testing showed
that RF mesh network would not be able to support the
data loading for a larger number of DG connections. Hence,
various system optimisation actions needed to be taken to
reduce the data loading on the network as detailed in SDRC
9.4 report.
11 Polling refers to a continuous messaging mechanism from one device to another device

Flexible Plug and Play Implementation of active voltage and active power flow management within FPP Trial area
52 |
The knowledge gained from the system integration testing
and the ANM trial highlighted some key communication
requirements as follows:
• Average latency = <1 second
• Average Availability >99%
• Bandwidth = Depends on number of devices. Refer to
Table 6 for bandwidth breakdown of individual device.
• Capability of transmitting simultaneous multiple IP based
protocols.
• The communications platform should be able to support IP
based communications.
• Capability to operate communication devices with 48V or
24V DC.
• Ability to support time synchronisation protocols and
applications. The ability for the communications equipment
to carry out its internal time synchronisation is also desirable.
• Resolution of fault resulting in a loss of communications to
be fixed within 24 hours.
Table 6 shows the overall data requirement for FPP trial
network based on the commissioned smart devices and
fourteen expected DG connections. This can be summarised
as the bandwidth requirement of 18 kilobits per second with
12.856 kilobits per second data transmitted from the field to
ANM while 5.1928 kilobits per second data transmitted from
the ANM to the field.
Howwasthetrialconducted?
The performance of the communications platform were
tested during various field based experiments within both the
ANM and smart devices trials. A structured communications
trial was also undertaken in order to assess the overall
performance of the platform. This involved stress testing of
the network to establish the tipping point of the system i.e.,
the maximum data handling capacity of the platform beyond
which the network underperforms or the ANM system
performance is impacted.
Table 6: FPP device data utilisation statistics
SmartDevice
RTU (Bytes/sec)
DLR (Bytes/sec)
QBCS (Bytes/sec)
AVC (Bytes/sec)
sgs connect
(Bytes/sec)
Total (Bytes/sec)
Total (kbits/sec)
17.4
219.5
16
72.1
30
355
2.84
IndividualdeviceutilisationAverage
Upstream Downstream
4.3
52.76
18.46
34
25
134.52
1.07616
Numberofdevices
12
4
1
2
14
33
33
TotaldeviceutilisationAverage
208.8
878
16
144.2
420
1667
13.336
Upstream Downstream
51.6
211.04
18.46
68
350
699.1
5.5928
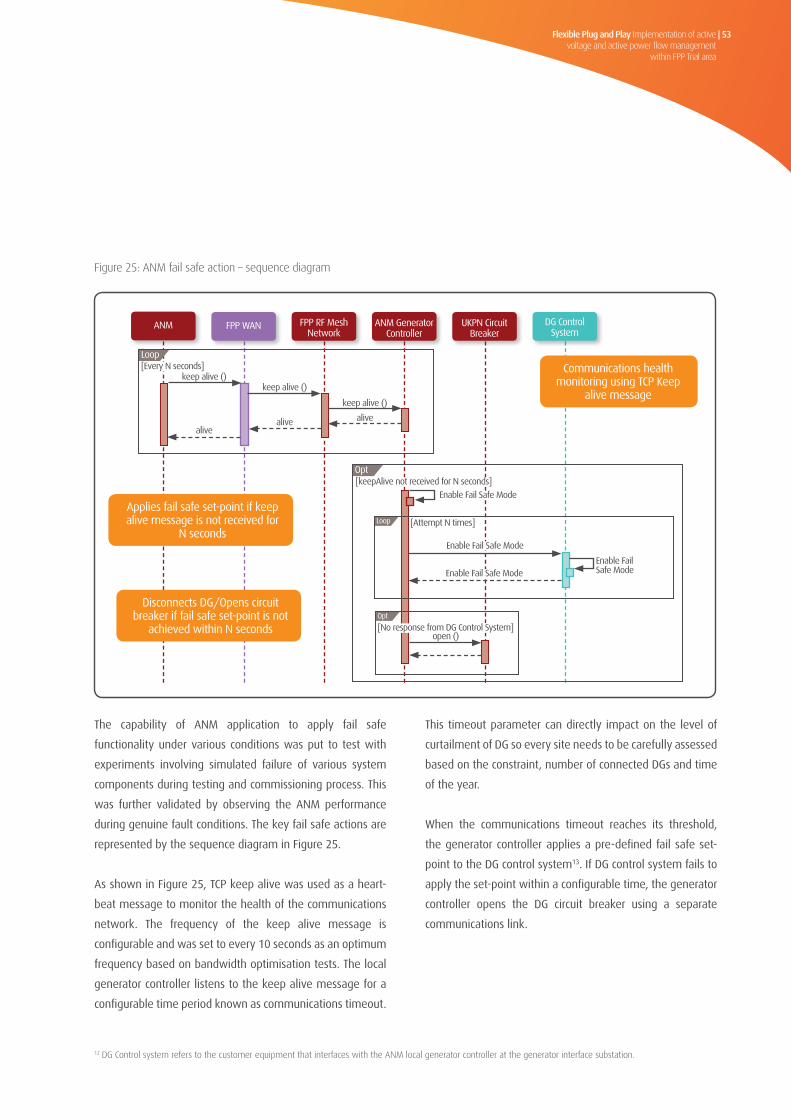
Flexible Plug and Play Implementation of active voltage and active power flow management
within FPP Trial area
| 53
The capability of ANM application to apply fail safe
functionality under various conditions was put to test with
experiments involving simulated failure of various system
components during testing and commissioning process. This
was further validated by observing the ANM performance
during genuine fault conditions. The key fail safe actions are
represented by the sequence diagram in Figure 25.
As shown in Figure 25, TCP keep alive was used as a heart-
beat message to monitor the health of the communications
network. The frequency of the keep alive message is
configurable and was set to every 10 seconds as an optimum
frequency based on bandwidth optimisation tests. The local
generator controller listens to the keep alive message for a
configurable time period known as communications timeout.
This timeout parameter can directly impact on the level of
curtailment of DG so every site needs to be carefully assessed
based on the constraint, number of connected DGs and time
of the year.
When the communications timeout reaches its threshold,
the generator controller applies a pre-defined fail safe set-
point to the DG control system13. If DG control system fails to
apply the set-point within a configurable time, the generator
controller opens the DG circuit breaker using a separate
communications link.
Figure 25: ANM fail safe action – sequence diagram
12 DG Control system refers to the customer equipment that interfaces with the ANM local generator controller at the generator interface substation.
Applies fail safe set-point if keep alive message is not received for
N seconds
Disconnects DG/Opens circuit breaker if fail safe set-point is not
achieved within N seconds
Communications health monitoring using TCP Keep
alive message
ANM FPP WAN FPP RF Mesh Network
ANM Generator Controller
UKPN Circuit Breaker
DG Control System
Loop[Every N seconds]
alive
keep alive ()
alive
keep alive ()
alive
keep alive ()
[keepAlive not received for N seconds]
Enable Fail Safe Mode
Enable Fail Safe Mode
Enable Fail Safe Mode
[Attempt N times]
Enable FailSafe Mode
[No response from DG Control System]
Opt
Loop
Opt
open ()

Flexible Plug and Play Implementation of active voltage and active power flow management within FPP Trial area
54 |
The trial phase continued to enhance and optimise the
performance of the communications platform as follows.
• Dataoverload: Dramatic reduction of the data traffic was
achieved by changing the one second polling mechanism
to reporting by exception
• ANMapplicationconfiguration: Reducing frequency of TCP
keep alive messages from ANM from five times a second to
every ten seconds to reduce unnecessary data traffic
• Lackofradiosignalcoverage: Reinforcing the RF mesh
performance and flexibility with four additional relays
• Device performance: Upgrade of hardware from the
initially deployed version (generation-2) to newer version
(generation-4) showed improvement in RF sensitivity,
throughput, data success rate and latency
• Relaysfailuresduetoweatherconditions: Installation of
lightning arrestors on all pole mounted relays
Whatwerethetrialfindings?
The capability of the whole ANM solution including both the
central system and the field device was tested and proven
to identify a communications failure; take fail safe action
and quickly restore the system to normal operation once the
system becomes healthy.
Availability of the communications platform was found
to be the highest priority performance indicator for the
deployment of an ANM system. One of the attributes of
the RF mesh network is the self-healing mechanism which
provides multiple routes back to the destination in event
of a node failure, improving the availability and resilience
of the network. However, it was seen that the overall
communication architecture needed to be optimally designed
and thoroughly tested including the WAN architecture as the
trial results demonstrated that the network can only be as
strong as its weakest link. Throughput and latency were also
other important parameters affecting the performance of
the overall ANM system. The FPP communication platform
performance results were seen:
• Availability: Even though both the WAN and the RF mesh
availability was individually seen to attain over 99%
performance levels, the end to end network suffered
intermittent outages. This seriously impacted the overall
network availability performance levels.
• Throughput: It can vary from >200kbps to <20kbps
depending on the device with number of hops to the
master node and link quality
• Latency: Multiple factors affect latency – Layer 3 routing
issues, number of RF mesh hops, routing via different
master node.
The trial highlighted that the quality of actions by ANM during
abnormal events is crucial to maintaining quality of supply
and protecting the health of distribution assets and equally
in maximising the export of the DG power to the network.
Table 7: Communication failure scenarios
No.
1
2
NetworkEvent
Failure of communications between the Central
ANM and the local ANM controller
Failure of communications between the Central
ANM and the MPs
ANMaction
Local ANM controller detects loss of communication and
falls into fail safe mode which curtails the output of the
DG to a predefined value that ensures that the network
constraint is not breached.
Central ANM detects loss of communication and instructs
the local ANM controller to apply fail safe mode.

Flexible Plug and Play Implementation of active voltage and active power flow management
within FPP Trial area
| 55
Table 7, on the previous page, represents key network
events which require ANM to take specific actions under
communication failure scenarios. The performance monitoring
of the first connected DG customer highlighted one of the
hidden issues with the communications platform related to
intermittent failures. This led to a series of investigation and
testing on both WAN and RF mesh solutions to find the root
cause of the issue generating huge learning from the project.
The basic topology of the RF mesh technology is normally
based on multiple remote nodes communicating back to
a central system via one designated master node. The
FPP project decided to implement fully dynamic RF mesh
architecture which meant any RF mesh remote node at any
part of the 700km² trial area would be capable of routing via
any of the four RF mesh master nodes installed at the two
back-haul sites.
This innovative design required synchronisation between the
four master nodes using Master Failover Protocol (MFP) to
achieve guaranteed failover functionality. The synchronisation
mechanism determined which of the four master nodes has
the best available route for each remote node and as such
should be the single master to announce that route to the
upstream WAN’s routing domain, disregarding the routes
from the three remaining master nodes.
The investigation identified a number of factors contributing
to the suboptimal performance. The main cause of the
issue was related to implementation issues on the WAN
infrastructure devices which hindered the ability of the master
nodes to fully synchronise with each other over the WAN.
This resulted in intermittent failures of remote nodes and
higher latencies due to sub-optimal or conflicting routings. A
number of corrective actions were taken to resolve this issue
as follows.
• Removal of route summarisation in the WAN in order to
prevent the loss of cost metrics in the routes announced
by the Master nodes. Loss of cost led to an asymmetric
routing of communications through the WAN.
• Addition of specific filter rules in the WAN routers at each
backhaul sites to prevent a condition where the remote
node routes learned by the WAN were then re-distributed
back to the substation routers, causing a conflict with RIP
that led to the loss of routes and therefore loss of end-to-
end communication capability.
• Introduction of an additional Ethernet switch between the
WAN router and the RF mesh master nodes at each back-
haul site. This mitigated the issue caused by the interface
module of the WAN routers not being able to reliably
support communications required by the Master Failover
Protocol.
The corrective actions led to a stable performance with
high availability of remote nodes and lower latencies.
The performance of the RF mesh network was further
improved by network optimisation exercise which involved
replacement and re-location of under-performing relays and
reinforcement of additional relays in parts of the network
with lower signal quality.
Figure 26 shows the improvement in the latency for some
devices communicating to the ANM after a number of
corrective actions were taken as part of the fault resolution
process The ability of both the ANM central system and
the sgs connect to identify a communications failure was
demonstrated. The autonomous and fail safe characteristics
increased the confidence of the solution by proving that
when a communications failure occurred, the ANM managed
generation export would not increase the risk of breaching
the threshold of a constraint to the network.

Flexible Plug and Play Implementation of active voltage and active power flow management within FPP Trial area
56 |
The key learning was that the high availability of the
communications network is the most important requirement
for the ANM system. Other parameters such as bandwidth and
latency are important to meet the performance requirement
of the ANM system but a low availability network can directly
lead to high levels of curtailment and loss of revenue for the
DG customers.
Figure 26: Latency comparison before and after resolution of issues
FPPenddevices
Late
ncy
(ms)
WhittleseyDGMeasurementPoint
FarcetFunthamsChatterisBury
Bury
100.00
200.00
300.00
400.00
500.00
600.00
700.00
800.00
900.00
Average 26/11Average 22/09
Key

6Learning outcomes for the Active Voltage Management Trial

Flexible Plug and Play Implementation of active voltage and active power flow management within FPP Trial area
58 |
This section discusses the six Use Cases related to the Active
Voltage management application. As part of the ANM trial
an active voltage management application was deployed
to manage multiple voltage constraints on the distribution
network in conjunction with the power flow management.
The aim of the application was to monitor system
parameters in the areas with potential voltage constraints
using real time network measurements and control the
generators contributing to voltage constraints and any
other smart devices that offer a means of alleviating those
constraints. The smart application was also trialled to explore
its capability to interact with the AVC as well as QBCS for
voltage management function using the IEC 61850 standard.
6.1Thecapabilities,limitsandrequirementsofgeneratorcontrolaspartofanactivevoltagemanagementapplicationWhatweretheobjectivesandchallenges?
As part of this use case, the Active Voltage application was
trialled to test the feasibility of using generators to control
voltages on a typical GB 33 kV distribution network. High
volumes of generation connecting on the FPP trial network
was initially expected to affect the voltage profile, and
possible unacceptable voltage rise at the point of common
coupling PCC. Steady state Voltage Studies were carried out
on the 33kV and 11kV network within the FPP project area
using the network analysis tool, the Power Factory software
from DigSILENT (with target voltage set at 1.025pu at 11kV
and 1.01pu at 33kV) to identify the impact of planned
generation on voltage rise, and step voltage change under
network disturbance. A worst case scenario of minimum
network load and maximum generation output was studied.
The results of above studies indicated that the connection
of the contracted firm generation and ANMcontrolled
generation would not cause voltage levels to rise above the
network defined limits that are even stricter than statutory
limits. As real voltage constraint scenario was not present in
the trial network, the experiments were undertaken in the
simulation environment.
Howwasthetrialconducted?
The trial experiment tested the mitigation of a voltage
constraint using the sgs voltage application based on the
philosophy of actively adjusting both real and reactive power
flow as part of generator control. The sgs voltage application
was configured with a series of thresholds and operation
zones as defined below and illustrated in Figure 27.
• Targetvalue: The value that the system will attempt to
achieve when a threshold was breached for the defined
observation time;
• Release zone: The area between release lower and
release upper defining the limits that the system may
release between;
• Lower thresholds: Two thresholds were defined to be
of lower voltage than release lower. The priority of the
threshold was inversely proportional to the value of the
threshold;
• Upper thresholds: Two thresholds were defined to be
of higher voltage than release upper. The priority of the
threshold was directly proportional to the value of the
threshold.
• Normalzone: The area indicating that no thresholds were
being breached bounded by the lowest upper threshold
and the highest lower threshold. The release zone will
always be contained wholly within the normal zone;
The set-point calculation was based on determining the
reactive power curtailment and, if required, real power
curtailment to reach the voltage target value. The formula
for reactive set-point calculation is given in Appendix 8.

Flexible Plug and Play Implementation of active voltage and active power flow management
within FPP Trial area
| 59
A voltage constraint scenario in the March Grid network
was used in the experiment using a combination of live
measurements from UK Power Networks RTUs and simulated
generators. The following method was followed during the
simulation:
1. Any constraints in the simulation were removed;
2. Simulated firm generation was increased to breach the MP
first upper threshold;
3. DG was regulated using reactive and real power control;
4. Once the MP release zone was reached, the DG was
released
5. Set points were issued to bring the voltage to the release
upper threshold;
6. The constraint simulation was cleared; and
7. All DG was fully released.
One firm generator and one flexible generator were simulated
in this scenario. Each had an associated sgs connect that
simulates generator real power output and circuit breaker
indications.
Whatwerethetrialfindings?
Figure 27 shows the response of the ANM system to the
breach of the MP upper 1 threshold. The voltage at the MP
breached the upper 1 threshold of 35kV at 13:01:34 for 31
seconds. Following the breach of the upper 1 threshold, the
sgs voltage application calculated and issued curtailment
required to reduce the voltage observed at the MP to the
target threshold. The real and reactive power set points were
issued to the DG and the power output of the DG reduced
in response to its new set points. Upon the voltage at the
Figure 27: Active Voltage Management thresholds
HighVoltage
LowVoltage
Overvoltage Protection
Undervoltage Protection
Upper Threshold 2
Upper Threshold 1
Release Upper
Target Value
Release Lower
Lower Threshold 1
Lower Threshold 2
ReleaseZoneNormalZone
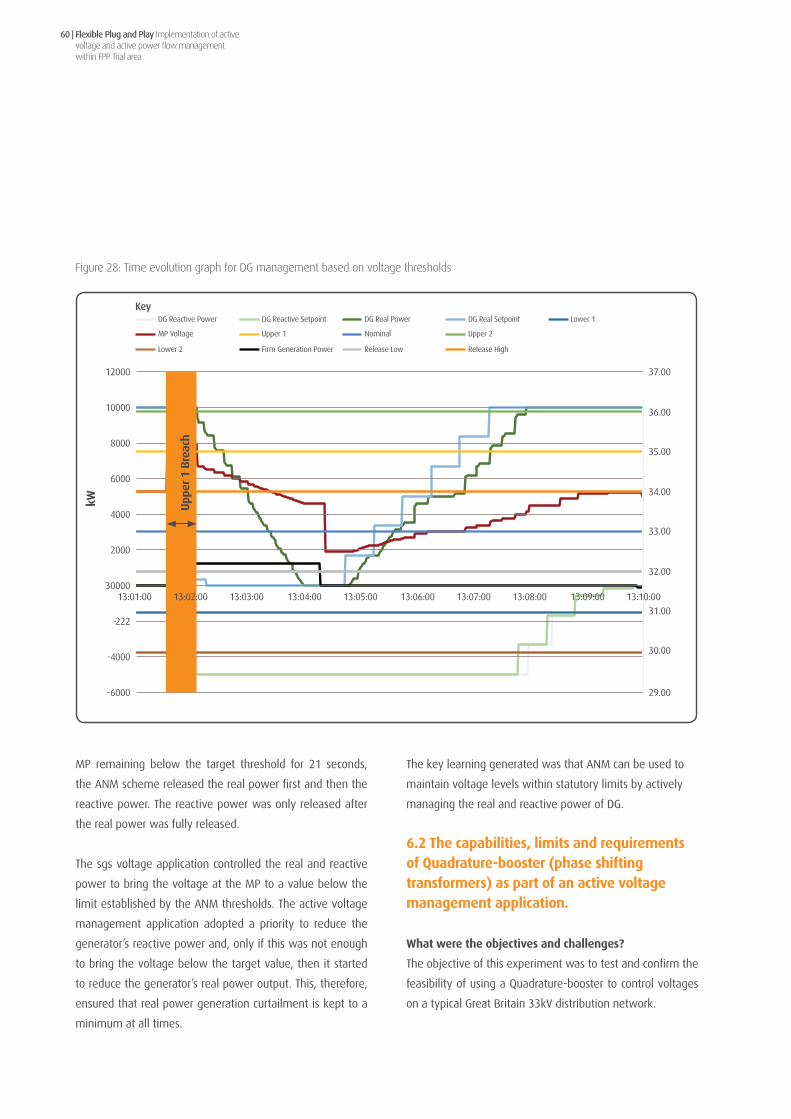
Flexible Plug and Play Implementation of active voltage and active power flow management within FPP Trial area
60 |
MP remaining below the target threshold for 21 seconds,
the ANM scheme released the real power first and then the
reactive power. The reactive power was only released after
the real power was fully released.
The sgs voltage application controlled the real and reactive
power to bring the voltage at the MP to a value below the
limit established by the ANM thresholds. The active voltage
management application adopted a priority to reduce the
generator’s reactive power and, only if this was not enough
to bring the voltage below the target value, then it started
to reduce the generator’s real power output. This, therefore,
ensured that real power generation curtailment is kept to a
minimum at all times.
The key learning generated was that ANM can be used to
maintain voltage levels within statutory limits by actively
managing the real and reactive power of DG.
6.2Thecapabilities,limitsandrequirementsofQuadrature-booster(phaseshiftingtransformers)aspartofanactivevoltagemanagementapplication.
Whatweretheobjectivesandchallenges?
The objective of this experiment was to test and confirm the
feasibility of using a Quadrature-booster to control voltages
on a typical Great Britain 33kV distribution network.
Figure 28: Time evolution graph for DG management based on voltage thresholds
12000
10000
8000
6000
4000
2000
30000
-222
-4000
-6000
kW Upp
er1
Bre
ach
13:05:00 13:06:00 13:07:00 13:08:00 13:10:0013:01:00 13:02:00 13:03:00 13:04:00 13:09:00
37.00
36.00
35.00
34.00
33.00
32.00
31.00
30.00
29.00
DG Reactive Power DG Reactive Setpoint DG Real Power DG Real Setpoint Lower 1
MP Voltage Upper 1 Nominal Upper 2
Lower 2 Firm Generation Power Release Low Release High
Key

Flexible Plug and Play Implementation of active voltage and active power flow management
within FPP Trial area
| 61
The challenge for the experiment was to establish a method to
test the capability of the Quadrature-booster as a tool for voltage
management functionality on the installed 33kV trial network.
A method could not be established to test this approach using
the Quadrature-booster in the live network, hence desktop
modelling and study was carried out to test the hypothesis.
The requirement of the experiment was to identify voltage
sensitivity factors caused by Quadrature-booster varying
power flow.
Howwasthetrialconducted?
Desktop simulations studies were defined that explored
how the Quadrature-booster could be used instead of, or in
combination with, other methods to actively manage network
voltage constraints. Voltage sensitivity studies were carried
out on the interconnected 33kV and 11kV network at the
inception of the FPP project and after the Quadrature-booster
was commissioned. The Quadrature-booster operation in its
real-world location was studied using two approaches using
real-life characteristics of the installed Quadrature-booster:
• Useofmodellingdata – the Power Factory simulation tool
from DigSILENT was used to run steady state load flows and
on an assumption of maximum generation plus minimum
summer network load. After running load flows on the
existing network (Quadrature-booster on by-pass), the
transformer taps for the rest of the network transformers
were fixed at the optimum levels reached when the load
flows converged. The busbar volts were recorded. This was
used as a baseline to compare the recorded voltage with
the Quadrature-booster at various tap positions.
• Use of Power Quality Monitoring data – to capture
actual network behaviour and the Quadrature-booster
voltage influence at times of tap change. The percentage
busbar 33kV voltage level step changes (at substations
interconnected with Wissington 33kV substation) were
recorded under the following scenarios when the
Quadrature-booster changed tap position:
1. Tap10: change in voltage from network without
Quadrature-booster to network with Quadrature-
booster in line and placed at Tap10
2. Tap11: % change in p.u. voltage with tap change from
Tap10 to Tap11
3. Tap12: % change in p.u. voltage with tap change from
Tap11 to Tap12
4. Tap13: % change in p.u. voltage with tap change from
Tap12 to Tap13
5. Tap14: % change in p.u. voltage with tap change from
Tap13 to Tap14
The simulations show that the biggest change at all studied
sites within the interconnected 33kV/11kV networks occurs
on transition from network with no Quadrature-booster (on
by-pass) to Quadrature-booster connected and placed at
Tap10. The biggest change of approximately -3% is recorded
at Wissington, Southery and Littleport.
Whatwerethetrialfindings?
The results showed that Quadrature-booster is more effective
when utilised on power flow control compared to voltage
control. The voltage change with each tap change was found
to be negligible. The power flow management using the
Quadrature-booster is covered in section 4.3.2.
The key learning generated was the outcome of the
investigation to test if a Quadrature-booster can be used as
a voltage management tool. This was only possible to be
investigated by carrying out network modelling and desktop
study as no immediate opportunity was available to run real-
world testing, i.e. have instructions flowing from ANM to the
Quadrature-booster.

Flexible Plug and Play Implementation of active voltage and active power flow management within FPP Trial area
62 |
6.3 Demonstrate the value of Quadrature-Boostercontrolwhendeployedwithanactivevoltagemanagementapplication.As concluded in section 5.3.2, the use of a Quadrature-
booster modelled, in the trial 33kV network is not effective
as part of a voltage control application. Hence, no value could
be demonstrated in deploying Quadrature-booster control
with an active voltage management application.
6.4Thecapabilities,limits,requirementsandvalueoftransformertapchangerrelaysaspartofanactivevoltagemanagementapplication.Whatweretheobjectivesandchallenges?
The main objective was to mitigate voltage constraints on
the network contributed by the introduction of DG. The trial
also addressed the challenges to optimise voltage control
profile and minimise circulating current flow on the 33kV and
11kV distribution networks. Smart algorithms needed to be
developed for this purpose and hosted in ANM platform.
The objective of the 33kV control algorithm was to update the
voltage set points on two parallel Fundamental SuperTAPP N+
relays at a 132/33kV grid substation. The principal function
of this algorithm was therefore to check the voltage set-point
of each relay and maintain both relays with the same voltage
set-point value.
The objective of the 11kV control algorithm was to update
the load ratio on two parallel Fundamental SuperTAPP
N+ relays at a 33/11kV primary substation. The principal
function of this algorithm was to check the load ratio of each
transformer relay and maintain both relays with the same
load ratio value.
The trial set out the following objectives in order to
demonstrate this concept:
• Assess the possible interaction between the local and
centralised voltage regulation strategies;
• Accommodate remote measurements of voltage within the
voltage control scheme using ANM and SuperTAPP n+ relay;
• Implement voltage control algorithms on ANM software
platform;
• Demonstrate functionality of the system which can be
employed on wider 33kV interconnected network with
significant amount of DG;
• Demonstrate functionality of the system which can be
employed on a typical primary substation with significant
amount of DG;
• Assess complexity and challenges of implementing IEC
61850 for AVC schemes; and
• Demonstrate more robust, reliable and more accurate
voltage control solution.
Howwasthetrialconducted?
The trial has been designed to implement enhanced voltage
control scheme on the existing SuperTAPP n+ relays by
incorporating remote measurements on the network using IEC
61850 communications over the RF mesh network.
The trial was undertaken in three main stages: desktop simulation,
off-line trial and on-line trial. Desktop studies provided an initial
assessment of the proposed solution and potential challenges.
When all the equipment installed and commissioned the off-
line simulation was performed. With the use of real data and
implemented algorithms the evaluation of the impact of the
system on the network profile and performance of the voltage
control schemes was evaluated. After satisfactory results of the
off-line evaluation stage the system enabled and performance
of the scheme was monitor for the remaining time of the trial.
Two separate trials were conducted, one at 33kV and one at
11kV voltage levels.

Flexible Plug and Play Implementation of active voltage and active power flow management
within FPP Trial area
| 63
In order to demonstrate functionality of this ANM solution
the voltage target was calculated and updated only at
the March Grid substation. However it was designed to be
easily extended to manage the wider interconnected 33kV
network, including Swaffham, Hempton, Kings Lynn and
Walsoken grid substations.
The functionality of the implemented algorithm was validated
against an off-line spreadsheet-based tool developed by
Fundamentals. The functional testing uses the following test
cases:
• Test Case 1 – Maximum Load, No DG
• Test Case 2 – Maximum Load, Maximum DG
• Test Case 3 – Minimum Load, No DG
• Test Case 4 – Minimum Load, Maximum DG
The tool defined a set of input measurements and bandwidth
ranges for each test case and produced the results. The
MarchGrid33kVtrial
This involved updating/sending the basic voltage target via
IEC61850 from ANM to SuperTAPP n+ relay. The voltage set-
point at the transformer relay was updated periodically based
on algorithm hosted by the ANM.The algorithm is summarised
by the flowchart in Figure 29 and the architecture is presented in
Appendix 4.
The calculation of the required voltage target was based on
an estimation of the maximum voltage drop on selected
feeders within the interconnected 33kV network and
choosing the feeder with the highest voltage drop. This
feeder was then used as the representative load to calculate
the required voltage boost and optimal voltage target which
can be sent to all grid substations.
Figure 29: 33kV Voltage target calculation flow chart
Calculate True Load for each feeder
Calculate voltage drops on each feeder on the network
Calculate required voltage target for the Grid
substations
Update voltage targeton AVC relay
RemoteDGPandQ
Measurements
LocalFeederPandQ
MeasurementsFeeders’VoltageDropFactors
(fromnetworkanalysis)

Flexible Plug and Play Implementation of active voltage and active power flow management within FPP Trial area
64 |
algorithm was then tested against live measurements from
March Grid substation for a period of more than seven days
and the results were examined to validate that the calculated
control actions were expected and within limits.
MarchPrimary11kVtrial
This involved updating/sending “Load Ratio” via IEC61850
from ANM to SuperTAPP n+ relays, based on real generator
output measurements. The “Load Ratio” on the relay was
updated every 30 minutes by averaging the load ratio
calculations done every 60 seconds by the ANM or when the
load ratio calculated by the ANM breaches a deadband. The
algorithm is summarised by the flowchart in Figure 30 and
the architecture is presented in Appendix 5.
In standard scheme, the SuperTAPPn+ relays used a
fixed value for the load ratio parameter to determine the
voltage target at the primary substation and eventually, the
transformer tap position. This fixed value is calculated offline
using data from a period that reflects different loading and
generation conditions for particular 33/11kV feeders.
By gathering remote generator and feeder measurements
and hosting a load ratio calculation algorithm, the ANM
enabled the relays to be kept up to date with load ratio
values that reflect current network conditions. To safeguard
against erroneous or missing measurements, an average
load ratio value was derived from measurements taken
every 60 seconds over a 30 minutes time period.
The load ratio algorithm was updated when a particular
deadband was exceeded, by the calculation that was done
every 60 seconds, or every 30 minutes, thus maintaining
a load ratio value suitable for current network loading
Figure 30: 11kV load ratio calculation
Calculate True Load and total generation
Calculate dynamic load ratio
Using rolling average calculate new load ratio
Update load ratioon AVC relay
RemoteDGPandQ
Measurements
LocalFeederPandQ
Measurements

Flexible Plug and Play Implementation of active voltage and active power flow management
within FPP Trial area
| 65
and generator power injections. The functionality of the
implemented algorithm was validated against an off-line
spreadsheet-based tool provided by Fundamentals Ltd.
The spreadsheet tool provided four test cases with various
settings, with load and generation conditions defined for
each. Test case 1 (A and B) was used as a basic test of the
calculations whereas test cases 2 and 3 were performed with
the purpose of testing the algorithm’s accuracy with different
settings and resilience for mismatched measurements.
Upon completion of functional testing the algorithm was
integrated within the FPP pre-production environment. The
test environment allowed the algorithm to be tested against
live measurements from March Primary substation. The
algorithm was left to run for a period of more than seven
days and the results were examined to validate that the
calculated control actions were expected and within limits.
Whatwerethetrialfindings?
It was demonstrated from the results of the trial that the
voltage profile could be optimised on the 33kV and 11kV
network by coordinating ANM with the tap changer relays.
The trial also proved successful coordination between two
vendor solutions from SGS and Fundamentals using IEC 61850
standard. It was highlighted that reliable and consistent
communication between ANM and AVC schemes as well as
remote measurements was extremely important to maintain
a stable system.
The key learning generated was the enhancement in the
AVC scheme by coordinating transformer tap changer relays
with ANM application. The tap changer relays conventionally
perform AVC functionality within the boundary of the
substation. The experiment successfully tested the
philosophy of using a centrally located ANM application
to monitor the impact of the distributed generation in the
network and send an optimum voltage target and optimum
load ratio to the remote AVC relays. A set of smart algorithms
were developed and implemented in the ANM to estimate
distributed generation output and total network load based
on local substation measurements.
6.5ThecapabilitiesandlimitsofthecommunicationsplatformtosupporttheevolvingneedsofactivevoltagemanagementThis learning has been demonstrated by repeating
the experiments carried out for the Active Power Flow
management described in detail within section 4.3.7. Identical
results were seen for both applications highlighting the same
requirements for the communications platform irrespective of
the application on ANM system.
6.6Demonstratethevalueofactivevoltagemanagementandactivepowerflowmanagementcoordination.Whatweretheobjectivesandchallenges?
The objective was to demonstrate that the ANM system is able
to co-ordinate real and reactive power control of DG to manage
thermal and voltage constraints simultaneously. This tested
the scenario when both the active power flow management
and active voltage management applications were required to
control the same devices and in this situation there needed to
be a requirement for arbitration between the applications. This
approach to arbitration will also be necessary to ensure that the
operation of either application does not pose an operational
challenge to the other, e.g. the action of one application should
not result in unnecessary action of the other.
Howwasthetrialconducted?
The success measure was based on the ANM system’s ability
to issue real and reactive power set-points that remove the
constraints identified by the trim and upper threshold breaches;
and its compliance with the list of ANM system performance
indicators. The following indicators were used to establish if the
ANM system was performing correctly:

Flexible Plug and Play Implementation of active voltage and active power flow management within FPP Trial area
66 |
• Time that ANM took to issue a set-point after the trim/
upper threshold was breached
• Communications delay
• Time duration to reduce the power flow/voltage measured
from trim/upper threshold to below reset/target threshold
• Generation release duration to reach trim less/release
higher thresholds.
Whatwerethetrialfindings?
The coordination of two applications was achieved by
calculating the set-points required to solve both constraints,
by two distinct control processes (sgs voltage and sgs power
flow), and issuing the most restrictive of those set-points. The
advantage of approach was that it was simple and provided
a conservative approach to mitigate voltage and power flow
breaches.
The key learning generated was the demonstration of
capability of the ANM system to carry out simultaneous
management of voltage and power flow constraints, enabling
the system to be manage the network more efficiently.

7Additional Learning outcomes

Flexible Plug and Play Implementation of active voltage and active power flow management within FPP Trial area
68 |
7.1Thepotentialcapabilitiesandlimitsofenergystorageon33kVnetworksintheFPParea.Whatweretheobjectivesandchallenges?
The objective of this Use Case was to explore the potential
capabilities of the energy storage in the FPP trial area. A
desktop study was carried out to prove that energy storage
can offer additional flexibility used with an ANM system to
manage flexible connections and potentially reduce the level
of their overall curtailment. The power and energy capabilities
of the energy storage device in the Smarter Network Storage
(SNS) project (i.e. 6MW/10MWh) were used.
BackgroundtoSNSproject
UK Power Networks was awarded funding for another LCNF
Tier 2 LCNF proposal, the SNS project, which commenced
in 2013 and will be concluded at the end of 2016. The SNS
project involves the installation of a 6MW/10MWh energy
storage system at Leighton Buzzard Primary Substation
in Bedfordshire, and associated hardware and software
infrastructure to deliver important learning on the integration
of storage into distribution networks. The SNS project builds
on the experience acquired through the initial LCNF Tier 1
storage project of UK Power Networks at Hemsby and aims to
trial a number of applications from energy storage systems
including peak shaving and reactive power support to the
DNO, response and reserve services to the Transmission
System Operator, tolling services to energy suppliers, but also
coordinate the delivery of all these services in an optimal
way to improve the current business case while maintaining
security of supply for the local network.
Howwasthetrialconducted?
A curtailment assessment tool that enables the estimation
of curtailment of generators was used. The effect of energy
storage on the level of curtailment was assessed.
Whatwerethetrialfindings?
Six case studies were defined to evaluate the effect of
energy storage on the curtailment of FPP generators.
The sensitivity of that effect on micro-generation (mGen)
penetration was evaluated using the three mGen penetration
levels. The parameters used in all six case studies and the
description of the case studies are provided in in Appendix 7.
The effect of energy storage use on the curtailment of FPP
generators can be shown in the following time series extract
with data for the year 2011.
The 5-year simulation showed that energy storage was able
to reduce the curtailment of FPP generators. In the absence of
micro-generators, the energy storage was found to reduce the
curtailment from 2,914MWh to 1,647MWh, which translates to
a reduction of 1,267MWh or 43.48%. In the case of 8.374MW
of mGen penetration, the energy storage was found to
reduce the curtailment from 5,221MWh to 3,318MWh, which
translates to a reduction of 1,903MWh or 36.45%. In the case
of 11.853MW of mGen penetration, the energy storage was
found to reduce the curtailment from 6,522MWh to 4,350MWh,
which translates to a reduction of 2,172MWh or 33.3%. The
reduction of the curtailment (in MWh) was increased with the
use of storage. However the percentage reduction was shown
to be reduced due to the capacity of the storage system.
The conversion losses in the energy storage system were
found to increase with the increase of mGen sources, due
to the higher storage utilisation14 It was important to note
however that the utilisation of storage was found to be below
2% for all three mGen levels. This finding suggests that the
storage would be underutilised allowing more than 98% of
the time available to provide other services such as energy
market participation (e.g. short/long-term electricity market
participation) or ancillary services (e.g. reserve, response) to
the Transmission System Operator.
14 The term utilisation is used here to express the percentage of half-hourly times that the storage is used for the curtailment service, either charging or discharging

Flexible Plug and Play Implementation of active voltage and active power flow management
within FPP Trial area
| 69
Figure 31: Effect of energy storage on curtailment of FPP generators
Figure 32: (Left) Effect of Energy storage on curtailment and on storage losses and Utilisation (without cases 1, 3 and 5) (right)
0 2,000 4,000 6,000
8,000
No mGen 8.374MW mGen
11.853MW mGen
No mGen 8.374MW mGen
11.853MW mGen
0.07 0.12 0.15 0.04 0.08 0.10
2,914 5,221
6,522
1,647 3,318 4,350
Average Power Curtailed (MW) Total Energy Curtailed (MWh)
0
100
200
300
No mGen 8.374MW mGen 11.853MW mGen
1.11 1.45 1.59
123.47 185.55 211.77
Storage Utilisation (%) Storage Losses (MWh)

Flexible Plug and Play Implementation of active voltage and active power flow management within FPP Trial area
70 |
The installed cost of the storage system within SNS project
is £11.2million. Assuming that the lifetime of the storage
device will be 20 years, the contribution to the CAPEX cost is
£116.6k for the 5-year simulated period.
The OPEX for the 5-year period has been calculated using the
fraction of the time reserved for the service (i.e. one hour
per day) on total availability related charges (these include
availability, standing and metering charges) and the total
utilisation-related charges from charging and discharging the
device for 60 minutes each day (these include Distribution
Use of System (DUoS) , energy charges, Balancing Use of
System (BUoS), and the remaining charges that are typically
included in an energy bill). The resulting OPEX is £187,5k.
Thekeylearningoutcomesaresummarisedasfollows:
• Energy storage can be used to reduce curtailment of FPP
generators. The case studies conducted showed that a
storage device equivalent to SNS, if installed in March Grid,
could reduce the curtailment of generators of up to 43.5%.
• The utilisation of storage for reducing curtailment would
be very low. In the March Grid area, curtailment would
be required only for short periods that account for
approximately 2% of the time. Delivery of other services
could be considered in the remaining time.
Table 8: Curtailment cost reduction using storage
Yearsofstoragesystem’slife AverageCurtailmentcost(£/MWh)
£11,200,000.00
No mGen
8.374MW mGen
11.853MW mGen
SNSInstalledCost(£)
Curtailmentreductionfromstorage
20
1267
1903
2172
Energy(MWh)
124.2
157,420.14
236,440.83
269,863.10
CurtailmentCostReduction(£)
The average curtailment cost of the accepted generators for
flexible connections in the FPP area is £124.2/MWh. In the
three scenarios used above (i.e. no mGen, 8.3MW mGen and
11.8MW mGen), it can be calculated that the curtailment
cost reduction from using the storage for minimising the
curtailment is £157.4k, £236.4k and £269.9k respectively.
The capital expenditure (CAPEX) and operational expenditure
(OPEX) for providing the curtailment minimisation service
are estimated. Although the utilisation of storage as seen
above (Figure 32) does not exceed 2%, it has been assumed
that the storage would be reserved for one hour per day
to provide this service; this equates to 4.16% and this
assumption is based on:
• the current scheduling system of SNS operates in half-
hourly periods (i.e. the storage system can either charge
or discharge during a half-hourly period); and
• the curtailment minimisation function has been assumed
to allow the storage absorb energy when required to
minimise curtailment and supply that energy back as
soon as possible, keeping the constrained asset within
acceptable operating limits.

Flexible Plug and Play Implementation of active voltage and active power flow management
within FPP Trial area
| 71
• The power and energy characteristics of the storage need
to be carefully considered. The higher the power and
energy characteristics, the lower the curtailment.
• The use of storage for reducing curtailment of generators
is expensive due to currently high CAPEX and OPEX. The
benefit of this reduced curtailment sits with the generators,
and hence storage is most appropriately considered by
the developer/generators as part of their overall project
business case. In a similar model to that being explored in
the SNS project, a full cost-benefit analysis could consider
the conflicts and synergies with other services (with their
characteristics) that could be provided by the storage
device alongside curtailment reduction, which could
increase the potential revenue to offset this high CAPEX.
The extent to which this business model could be viable
would depend on a number of factors, such as connection
constraints, curtailment levels and PPA arrangements and
therefore need specific assessment by developers as part
of an integrated business case.
7.2VariationofDGconnectionscenariosThe trial learnt that the connection of DG will not always
be a standard design as it depends on the other elements
associated with the POC such as network load and firm
generator. Many of the accepted FPP customers have
existing firm generation and load connected on the same
site. The majority of customers request that they connect
their new flexible connection behind the same utility meter
and therefore avoid the costs associated with a new point
of connection to the UK Power Networks electricity network.
This approach introduced complications in considering the
resultant effect of the existing load or generation, or both.
An approach was taken by the project to ensure that the
customer controls the generation and export of the overall
site against the existing generation and load to avoid
complications.
The connection design variations can be categorised in four
scenarios
ScenarioA:AnewDGconnection
This is a standard scenario where a developer requests for a
new power export DG connection to the DNO on a new POC
ScenarioB:UpgradeofanexistingfirmDGconnection
This is a scenario where an existing firm DG customer
requests for additional export capacity. This can fall into two
options.
• Scenario B1: The first option involves the provision of a
separate metering circuit breaker to control the flexible
connection.
• Scenario B2: The second option utilises the existing
metering circuit breaker to control both the firm and
non-firm generation. The DG customer is expected to
understand and accept the possibility of the loss of total
export capacity including firm and non-firm generation
during abnormal network conditions
ScenarioC:Additionofexportonanexistingloadconnection
This is a scenario where an existing load customer requests to
install export capacity utilising the existing load connection
infrastructure without a new POC. The delivery of this
additional capacity is achieved using an flexible connection.
This is expected to be for small generation sizes typically
below 500kW. In this case, the ANM directly controls a given
circuit breaker to implement the flexible connection.
ScenarioD:Additionofexportonanexistingloadand
firmDGconnection
This scenario is the combination of scenarios B and C.

Flexible Plug and Play Implementation of active voltage and active power flow management within FPP Trial area
72 |
7.3CybersecurityconsiderationsforDGintegrationSmart grid systems are complex systems which require careful
design and management to ensure that they are resilient
and robust. This requirement for care also extends to cyber
security given the highly interconnected and ICT dependent
nature of these systems. The approach to smart grid cyber
security for the FPP project was established at an early stage
in the project, and sought to embed cyber security into the
early stages of the project lifecycle itself. The cyber security
management for the FPP solution was achieved largely by
incorporating security related activities through the lifecycle
of development, deployment and operation of the project.
As part of the cyber security management process, a security
assessment was carried out on the as-built technical solution,
including the security risk assessment on the communications
interface of the ANM with the first connected generator. It
highlighted a very limited isolation between the ANM and
an untrusted network (i.e. the customer’s corporate LAN
and beyond which the DNO does not have visibility). It was
concluded that if the interface between the ANM and the
customer’s generator controller is via Ethernet, an additional
layer of security between the ANM local controller (sgs
connect) and the customer’s generator controller is required.
This was achieved by the deployment of an industrial Ethernet
switch with security controls designed to isolate networks and
restrict traffic to specific protocols and pre-defined IP addresses.
7.4IntegrationoftheANMwithUKPowerNetworksRTUIn order to maintain the fail safe feature in the ANM solution,
the DG circuit breaker control interface of the sgs connect has
been kept separate to the DG power management interface.
This allows for the ANM to disconnect the DG connection
under abnormal scenarios where the DG control system fails
to respond to ANM instructions.
Where there is a UK Power Networks RTU available, the
ANM instructs the RTU to carry out breaker control in order
to avoid potential conflict of simultaneous control messages
coming from RTU and ANM. Further security functionalities
were developed on the UK Power Networks RTU to ensure
the SCADA control message was given a priority should there
be a simultaneous control instruction from SCADA and ANM.
7.5SystemintegrationwithIEC61850The ANM system required to interface with a range of “smart
devices”, such as QBCS, DLR, AVC and RTUs. Integration
time was greatly reduced when considering the alternative
communication protocols such as DNP3, MODBUS and IEC
60870. The ANM system could send and receive data to all
smart devices with less than an hour of integration time.
As a specific example the DLR relay device proved more
challenging to integrate with the ANM system than the other
smart devices. The DLR relay required a specific set of actions
to be taken before data could be transferred to/from the ANM
system. Through troubleshooting this unexpected behaviour a
greater understanding of IEC 61850 was gained in particular
an appreciation of the different data reporting mechanisms..
Although a specific issue with regards to the DLR relay has been
highlighted, the general integration with third party devices
using IEC 61850 has been a great success, primarily in terms of
greatly reduced systems integration and commissioning effort.
7.6IntegrationofDGcontrolsystemwiththeANMThere was a considerable amount of learning associated
with the overall process of designing the DG interface and
integrating it with the ANM solution. It should be noted that
due to the variation of the control system technologies used
by DG customers, it is likely for the ANM system to encounter
issues in integrating with an un-tested platform. In earlier
instances, there were challenges in finalising all the required
interface details by the commissioning date due to a number
of reasons such as:

Flexible Plug and Play Implementation of active voltage and active power flow management
within FPP Trial area
| 73
• A lack of full clarity of DG control system characteristics and
requirements;
• A lack of sufficient technical documentations on customer’s
network; and
• Availability of the DG control system provider for testing and
troubleshooting.
The above issues led to delays in the commissioning of the
generator and consequently repeated visits to site. This
highlighted the need to ensure that the all details regarding
the interface between the ANM system and the DG control
system must be agreed before beginning commissioning.
The following learning outcomes were generated and were
implemented for the future commissioning procedure:
1) To minimise the possibility of any technical issues that could
affect commissioning, where feasible, bench testing of all
interfaces need to be carried out prior to final commissioning
on site with the generators control unit. Where bench testing
is not possible, cold commissioning should be undertaken
prior to full commissioning. This is an activity that can be
completed remotely, and could identify any potential issues
that could be fixed prior to the full generation commissioning
day;
2) To ensure any potential technical issues that are raised
during the final commissioning day can be resolved on
the day, the DG customers control unit engineer needs to
be present on site for the whole commissioning day. This
ensures any issues with their control equipment can be
dealt with quickly and preferably on the same day; and
3) There is the need to standardise the communications
protocols that are used for interfacing with the generators
control system. This can be achieved to a certain extent but
as there are a large number of different control systems
supporting different protocols, standardisation will take
time.
7.7DeploymentofDLRtechnologyThe objective of the DLR trial in the FPP project was to increase
the utilisation (where possible) of the existing 33kV overhead
lines at a lower cost compared to traditional conductor
replacement, and to expedite the development of baseline
DLR package for deployment elsewhere on the network as
required. The trial utilised previous experiences from various
trials of the weather based DLR systems, focusing on those
undertaken within the UK. Particular reference was made
to the Western Power Distribution (formerly E.ON Central
Networks) trial of a weather based DLR system, which was
installed on a 132kV circuit from Skegness to Boston.
The DLR trial focused on identifying suitable considerations
for the design, installation, configuration and management
processes associated with the implementation of indirect
weather based DLR systems. This was achieved by installing a
number of DLR systems across the Flexible Plug and Play area
so as to gain an understanding of the installation requirements,
typical system architecture and configuration requirements.
Each of the DLR systems consisted of the following components:
• An Alstom Micom P341 relay; and
• A Lufft WS501-UMB weather station complete with a digital
to analogue converter;
In addition to the core system components, an Alstom
BiTRONICS M871 Data Logger was also installed to provide a
means of storing the data collected as part of the trial.
The main configurable elements of the DLR system revolved
around the manipulation of the inputs from the weather
station. Initial assumptions, based on recommendations from
previous projects, were used to initially configure the system.
These were further analysed to validate the approach and
to identify opportunities to optimise the system and was
achieved by comparing the weather data collected from each

Flexible Plug and Play Implementation of active voltage and active power flow management within FPP Trial area
74 |
of the trial sites to identify the correlation and variance
between the datasets. The summary of this comparison is as
follows:
• The ambient temperature was found to highly correlate
across the sites and was only subject to small changes.
• For the wind velocity it was found that a 30 minute rolling
average for the wind velocity would enable ampacity
comparisons to continue at an appropriate level of precision.
However, improvements in the correlation peaked for a 10
minute rolling average.
• For the wind direction, there was a considerable smaller
correlation across the site, which justified the approach to
applying a fixed wind direction.
Based on this assessment, the final DLR system settings were:
• Wind Direction: 20°
• Solar radiation: 890 W/m2
• Wind Velocity: 10 minute rolling average
• Ambient temperature: 1 minute rolling average
In addition to the system settings, a recommended approach
was identified to account for variations in weather conditions
across the line. This approach included the installation of
multiple weather stations at appropriate intervals along the
line under consideration. The ampacity would be calculated
at each location, with the values compared within the ANM
system. The ANM system would subsequently utilise the
smallest ampacity calculated when determining the necessary
levels of curtailment of the connected distributed generation.
Considering this approach, and limiting the maximum
permissible ampacity to 600A to align with the general
circuit restrictions in the area, the additional capacity that
could be made available through the implementation of this
system was 47%. This increase was limited by the maximum
permissible ampacity, with a further summary of the additional
headroom that could be created through the implementation
of the DLR system contained in Table 8.This additional capacity
would exceed that which could be achieved by increasing the
operating conductor temperature to 65°C and would mitigate
any risks associated with operating the overhead line near
its operational capacity. Using this approach there would be
no known excursions from the calculated ampacity values,
although it should be noted that there is still a risk that this
does not fully represent the ampacity across the entire circuit.
Further details on the DLR trial are described within a separate
DLR trial report.
Table 9: Summary of additional headroom that could be made available using the minimum calculated ampacity
Averageincreaseinampacity(%) Additionalcapacity(GWh) Additionalcapacity(%)
minimum ampacity 14.0 30.1 47

Additionalcapacity(%)
8Key findings and lessons learnt from the overall FPP project trial

Flexible Plug and Play Implementation of active voltage and active power flow management within FPP Trial area
76 |
ANMPlatform
• The FPP trial developed a capability of adding new generators
onto the SGS ANM system without a need for system restart
which was one of the constraints of the solution.
• The FPP trial also developed functionality for the time stamp
data from site to be sent to the PI historian logs that was not
previously available.
CommunicationsPlatform:
• Learning generated on designing, managing and testing RF
mesh technology for distribution network.
• The project learnt that the RF mesh network improved its
performance with the increase of its node density. That
means more devices participate on the mesh the better the
performance is, hence suitable for large scale deployments.
• IPv4 and IPv6: Both can be implemented in a same solution
and can enable host of applications and technologies.
SystemIntegration:
• Availability of test lab environment for the life cycle
of innovation and trial projects is hugely beneficial to
troubleshoot, test and enhance the functionality.
• Initial understanding of IEC 61850 standard and design
process was challenging but cost and time savings were
demonstrated during commissioning and upgrade process.
SmartGridcyberSecurity:
• Implementation of cyber security is a process not a
product. Once designed and tested, every solution needs to
periodically assess for cyber security compliance.
• Cyber security is a complex and a specialist field for which
smart grid designers and operators may not have adequate
knowledge. A Smart Grid Cyber Security framework can help
to a certain extent in providing guidance in understanding
when and what security considerations should be made
within a project life cycle.
• The risk management is one of the major elements of
managing cyber security and it requires a different approach
compared to traditional risk assessment in IT systems, due to
the highly distributed nature of smart grid systems.

9Conclusion

Flexible Plug and Play Implementation of active voltage and active power flow management within FPP Trial area
78 |
As an output of the FPP trials, ANM has been proven to
be an effective tool to actively manage DG not only as a
standalone solution but also when it is integrated with other
smart solutions. The active power flow and active voltage
management applications were capable of integrating and
coordinating with existing and new solutions using open-
standard protocols in order to make more accurate and
smart decisions to enable efficient utilisation of existing
network assets and to deliver additional capacity.
The capability of the ANM to simultaneously manage
multiple constraints as well as various network running
arrangements can create further opportunities for DNOs to
relieve the additional pinch points in the network, removing
barriers to the connection of DG.
A number of benefits are highlighted within this report
related to the FPP’s approach of implementing a central
ANM system installed at a control centre environment with
direct interaction with network control and SCADA systems.
This centrally managed approach has demonstrated the
benefits of:
• offering a more holistic view of the network when several
generator contribute the same constraint for instance;
• increasing the option for scalability to accommodate a
growing demand in terms of DG connection;
• providing a centrally controlled platform for efficient
operations and maintenance; and
• providing the flexibility to easily integrate and interact
with other smart grid technologies by using standardised
methods.

Flexible Plug and Play Implementation of active voltage and active power flow management
within FPP Trial area
FPP communications architectureAppendix 1
| 79
ANM
PIENMAC
ControlCentre
Gridsubstations
Peterborough CE
PrimarySubstation
DistributedGeneration
PrimarySubstation
RFMeshNetwork
DistributedGeneration
CE CE
Ipsec VPN
Ipsec VPN
eBridge eBridge
eBridge
eBridge
eBridge
eBridge
eBridge eBridge
eBridge
eBridgeMaster
eBridgeMaster
eBridgeMaster
eBridgeMaster
AP Access point
Relay
Relay
WAN
PEPE
RIP2RIP2
AP Access point

Flexible Plug and Play Implementation of active voltage and active power flow management within FPP Trial area
Appendix 2Power flow thresholds equations
80 |
Flexible Plug and Play Low Carbon Networks Sucessful Delivery Reward Criteria 9.6
UK Power Networks (Operations) Limited. Registered in England and Wales. Registered No. 3870728. Registered Office: Newington House, 237 Southwark Bridge Road, London, SE1 6NP Page 83 of 90
Appendix 2 – Power flow thresholds equations
Global Trip operating margin equation
( )TTTDdt
dPdt
dPOM GlobalTrip
upNFGupexistingGlobalTrip +×⎥
⎦
⎤⎢⎣
⎡+=
max,,max,,
Equation 1 – Global Trip Operating Margin Where,
dtdP upexisting max,, = Practical maximum ramp up rate associated with the constraint (MP) from existing generation
(MW/s);
dtdP upNFG max,, = Practical maximum ramp up rate associated with the constraint (MP) from NFG (MW/s);
GlobalTripTD = Time taken by the system to measure and process the threshold breach as well as an observation delay specific to the Global Trip Operating Margin (seconds); TT = Global Trip action time (seconds).
Sequential Trip operating margin equation
( )STTDdt
dPdt
dPOM TripSequential
upNFGupexistingTripSequential +×⎥
⎦
⎤⎢⎣
⎡+=
,,
Equation 2 – Sequential Trip Operating Margin Where,
dtdP upexisting,
= Operator defined ramp up rate at the power export level of the operating margin from existing
generation associated with the constraint (MP) (MW/s);
dtdP upNFG, = Operator defined ramp up rate at the power export level of the operating margin from NFG associated with
the constraint (MP) (MW/s); TripSequentialTD = Time taken by the system to measure and process the threshold breach as well as an observation
delay specific to the Sequential Trip Operating Margin (seconds); ST = Sequential Trip action time (seconds).

Flexible Plug and Play Implementation of active voltage and active power flow management
within FPP Trial area
| 81
Flexible Plug and Play Low Carbon Networks Sucessful Delivery Reward Criteria 9.6
UK Power Networks (Operations) Limited. Registered in England and Wales. Registered No. 3870728. Registered Office: Newington House, 237 Southwark Bridge Road, London, SE1 6NP Page 84 of 90
Trim operating margin equation
( )⎥⎥⎦
⎤
⎢⎢⎣
⎡×⎟⎟⎠
⎞⎜⎜⎝
⎛−+
⎥⎥⎦
⎤
⎢⎢⎣
⎡+×⎟
⎟⎠
⎞⎜⎜⎝
⎛+= RTF
dtdP
dtdP
RTDTDdt
dPdt
dPOM downNFGupexisting
TrimupNFGupexisting
Trim,,,,
Equation 3 – Trim Operating Margin Where,
dtdP upexisting,
= Operator defined ramp up rate at the power export level of the operating margin from existing
generation associated with the constraint (MP) (MW/s);
dtdP upNFG, = Operator defined ramp up rate at the power export level of the operating margin from NFG associated with
the constraint (MP) (MW/s); TrimTD = Time taken by the system to measure and process the threshold breach as well as an observation delay
specific to the Trim Operating Margin (seconds); RTD = Trim action time (seconds);
dtdP downNFG, = Ramp down rate of NFG caused by the trim action (MW/s);
RTF = Time allowed for NFG to respond before system recalculates NFG set-points (seconds). Appendix 3 – sgs ratings vs DLR relay Table 9: Table of results comparing sgs ratings and DLR relay
Percentile DLR relay rating [MVA] sgs ratings rating [MVA] sgs ratings / DLR relay 0% 19.32 19.65 1.02
10% 19.65 26.43 1.34 20% 20.03 27.67 1.38 30% 20.36 28.51 1.40 40% 20.70 29.22 1.41 50% 21.07 29.83 1.42 60% 21.49 30.49 1.42 70% 22.03 31.15 1.41 80% 22.76 31.91 1.40 90% 23.88 32.97 1.38
100% 31.00 39.42 1.27

Flexible Plug and Play Implementation of active voltage and active power flow management within FPP Trial area
82 |
sgs ratings vs DLR relayAppendix 3Table 8: Table of results comparing sgs ratings and DLR relay
Percentile
0%
10%
20%
30%
40%
50%
60%
70%
80%
90%
100%
DLRrelayrating(MVA) sgsratingsrating(MVA) sgsratings/DLRrelay
19.32
19.65
20.03
20.36
20.70
21.07
21.49
22.03
22.76
23.88
31.00
19.65
26.43
27.67
28.51
29.22
29.83
30.49
31.15
31.91
32.97
39.42
1.02
1.34
1.38
1.40
1.41
1.42
1.42
1.41
1.40
1.38
1.27

VoltageControlAlgorithm
SGSANM
Flexible Plug and Play Implementation of active voltage and active power flow management
within FPP Trial area
| 83
Appendix 433kV AVC trial diagram
RFMesh
iHost
Monitoring
GridS/SAVCSystem
RTU
RTU RTU DGDG
33kVPCC33kVPCC
Tran
sfor
mer
Mea
sure
men
tsFe
eder
Mea
sure
men
ts
GPRSGPRS GPRS
Envoy
SNTP
Can-
Bus
Vtarget
V, P, Q
V, P, Q
Vtarget
V, P, QV, P, QSNTP
Remotemeasurements
SuperTAPP n+ Tx1
SuperTAPP n+ Tx2
DAM 1
Remotemeasurements
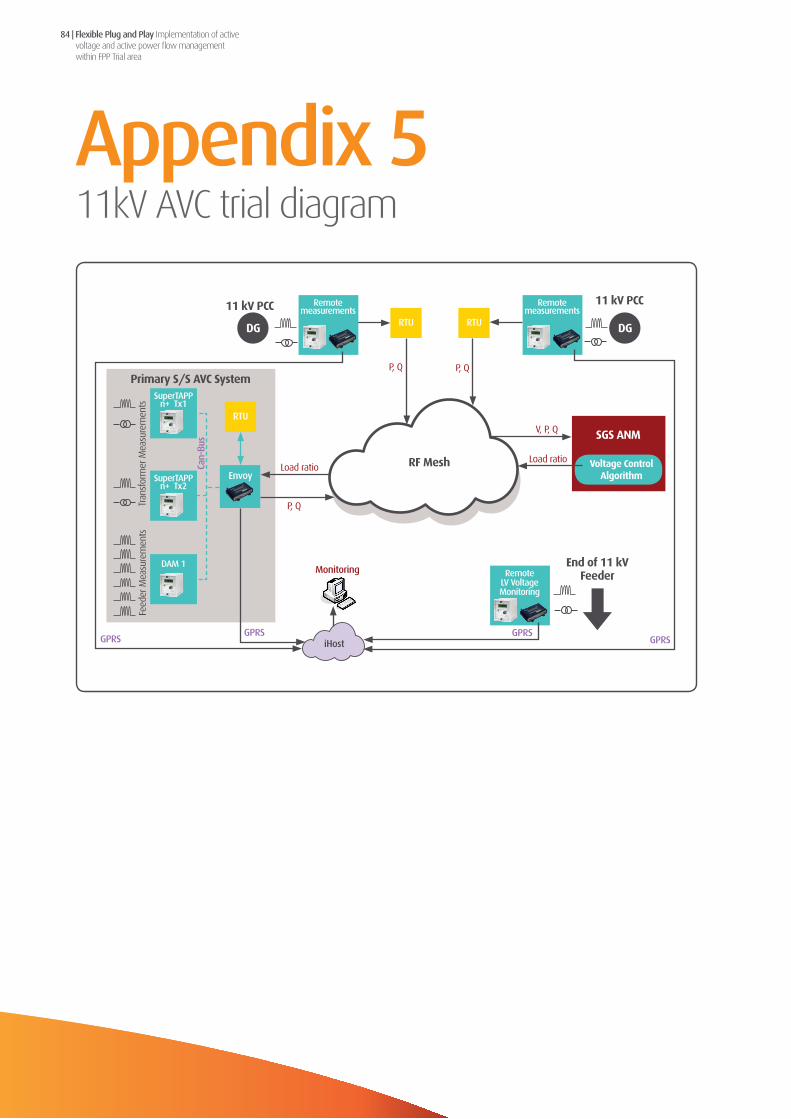
Flexible Plug and Play Implementation of active voltage and active power flow management within FPP Trial area
84 |
11kV AVC trial diagramAppendix 5
RFMesh
iHost
Monitoring
PrimaryS/SAVCSystem
RTU
RTU RTU DGDG
11kVPCC11kVPCC
Tran
sfor
mer
Mea
sure
men
tsFe
eder
Mea
sure
men
ts
GPRSGPRS
GPRS
Envoy
Can-
Bus
Load ratio
P, Q
V, P, Q
Load ratio
P, QP, Q
Remotemeasurements
SuperTAPP n+ Tx1
SuperTAPP n+ Tx2
DAM 1
Remotemeasurements
VoltageControlAlgorithm
SGSANM
RemoteLV Voltage Monitoring
Endof11kVFeeder
GPRS

Flexible Plug and Play Implementation of active voltage and active power flow management
within FPP Trial area
| 85
Appendix 6Energy Balance equation
Flexible Plug and Play Low Carbon Networks Sucessful Delivery Reward Criteria 9.6
UK Power Networks (Operations) Limited. Registered in England and Wales. Registered No. 3870728. Registered Office: Newington House, 237 Southwark Bridge Road, London, SE1 6NP Page 86 of 90
Appendix 5 – 11kV AVC trial diagram
Appendix 6 – Energy Balance equation The conductor thermal rating as part of the sgs rating application, was calculated from the energy balance between heat dissipated by the Joule effect within the conductor and the heat exchange on the conductor surface, as influenced by environmental parameters and represented by the steady state energy balance equation given below,
Where: • Qc [W/m] - Convective heat exchange
• Qr [W/m] - Radiative heat exchange
• Qs [W/m] - Solar gain
• I [A]- Current flowing in the conductor
• R(Tc) [Ω/m] - Conductor electrical resistance at specified conductor temperature
• Tc [°C]-conductor temperature

Flexible Plug and Play Implementation of active voltage and active power flow management within FPP Trial area
86 |
Table for Energy storage case analysisAppendix 7
Reverse Power Flow Limit (MVA)
Any other FPP Generators
45
0.5
ANM Export Limit (MVA)
Wind Turbine FPP Generators (MW)
40.5
21.5
ANM operating Margin
PV FPP Generation (MW)
10.00%
11.5
AverageSensitivity Factor
TOTAL FPP Generation (MW)
0.8872
33.5
ParametersusedinallCases
Case 1 – No storage No mGen
Case 2 – SNS storage No mGen
Case 3 – No Storage 8.374 MW PV mGen
Case 4 – SNS Storage 8.374 MW PV mGen
CaseStudiesDescription
Case 5 – No Storage 11.853 MW PV mGen
Case 6 – SNS Storage 11.853 MW PV mGen

Flexible Plug and Play Implementation of active voltage and active power flow management
within FPP Trial area
| 87
Appendix 8Timing criteria calculation for Real powerflow thresholdFlexible Plug and Play Low Carbon Networks Sucessful Delivery Reward Criteria 9.6
UK Power Networks (Operations) Limited. Registered in England and Wales. Registered No. 3870728. Registered Office: Newington House, 237 Southwark Bridge Road, London, SE1 6NP Page 88 of 90
Appendix 8 – Formulae Timing criteria calculation for Real powerflow threshold The criteria of 68 seconds to reduce the power flow from TRIM threshold to below RESET threshold, was computed using the formulae.
Where,
• , time from breach to issuing a setpoint after
• , time from the issue of setpoint to feedback of power reduction • is the requested step change in generator power output, • is the generator ramp rate
Similarly, a criteria of 260 seconds was established to increase the power flow to reach the TRIM LESS threshold using the formula.
Where,
• , consists of the number of steps required for the system reach the TRIM LESS
• , is the amount of time that the system waits for the setpoint to be reached Real Power control setpoint calculation The real power setpoint required to solve the voltage breach can be calculated using the following equation:
• – Represents the generator power output • – Represents the summation of power output of all generators under the Shared PoA
contributing to the breach • – Represents the existing power flow at the constraint minus the target power flow at the
constraint, where the target is the RESET LESS threshold • − Represents the sensitivity factor. In this work the sensitivity factor is equal to 1 kW/kW.
The generator setpoint when a release is required is determined by the following equation:
• – Represents the generator setpoint before releasing • – Represents the rated power of the generator in question
Flexible Plug and Play Low Carbon Networks Sucessful Delivery Reward Criteria 9.6
UK Power Networks (Operations) Limited. Registered in England and Wales. Registered No. 3870728. Registered Office: Newington House, 237 Southwark Bridge Road, London, SE1 6NP Page 88 of 90
Appendix 8 – Formulae Timing criteria calculation for Real powerflow threshold The criteria of 68 seconds to reduce the power flow from TRIM threshold to below RESET threshold, was computed using the formulae.
Where,
• , time from breach to issuing a setpoint after
• , time from the issue of setpoint to feedback of power reduction • is the requested step change in generator power output, • is the generator ramp rate
Similarly, a criteria of 260 seconds was established to increase the power flow to reach the TRIM LESS threshold using the formula.
Where,
• , consists of the number of steps required for the system reach the TRIM LESS
• , is the amount of time that the system waits for the setpoint to be reached Real Power control setpoint calculation The real power setpoint required to solve the voltage breach can be calculated using the following equation:
• – Represents the generator power output • – Represents the summation of power output of all generators under the Shared PoA
contributing to the breach • – Represents the existing power flow at the constraint minus the target power flow at the
constraint, where the target is the RESET LESS threshold • − Represents the sensitivity factor. In this work the sensitivity factor is equal to 1 kW/kW.
The generator setpoint when a release is required is determined by the following equation:
• – Represents the generator setpoint before releasing • – Represents the rated power of the generator in question

Flexible Plug and Play Implementation of active voltage and active power flow management within FPP Trial area
88 |
Flexible Plug and Play Low Carbon Networks Sucessful Delivery Reward Criteria 9.6
UK Power Networks (Operations) Limited. Registered in England and Wales. Registered No. 3870728. Registered Office: Newington House, 237 Southwark Bridge Road, London, SE1 6NP Page 89 of 90
• – Represents the summation of the rated power of all generators under the Shared PoA contributing to the breach
• – Represents the existing power flow at the constraint minus the target power flow at the constraint, where the target is the TRIM LESS threshold
• − Represents the sensitivity factor. In this work the sensitivity factor is equal to 1 kW/kW.
Reactive Power control setpoint calculation The reactive power setpoint required to solve the voltage breach can be calculated using the following equation:
• – Variation in the reactive power output • – Variation in the real power output • – Actual voltage minus the desired value • – Sensitivity Factor, V/W, in this test is 0.00015 V/W • – Sensitivity Factor, V/VAr, in this test is 0.00015 V/VAr
If is greater than the equipment capacity the system caps the variation to its limit. The remaining required power is curtailed from the generator’s real power output. The release setpoints are calculated based on achieving the RELEASE UPPER threshold with a maximum step change of 250 V, which is equivalent to 1667 kW or kVAr, each time a setpoint is issued.

Flexible Plug and Play Implementation of active voltage and active power flow management
within FPP Trial area
| 89
The following table provides a list of all MP configuration parameters for sgs power flow application.
MP Configuration ParametersAppendix 9
Parameter
Global Trip Threshold
Global Trip
Observation Time
Sequential Trip
Threshold
Sequential Trip
Observation Time
Trim Threshold
Trim Observation Time
Reset Threshold
Release
Observation Time
Reset Less Threshold
Trim Less Threshold
Sequential Trip
Response Time
Trim Response Time
Release Response
Time
Release Ramp Step
Release Ramp Time
Communications
Time-out
Description
ANM system trips all associated generators when breached for sufficient length of time.
Time that the line current continuously exceeds the Global Trip threshold before an ANM
response is executed.
ANM system trips associated generators in turn when breached for a sufficient length of time
until the current has fallen back below; normal actions for a breach of the Trim threshold are
subsequently initiated.
Time that the line current continuously exceeds the Sequential Trip threshold before an ANM
response is executed.
ANM system issues curtailment to associated generators in order to reduce power flow associated
with the constraint to below the Reset threshold.
Time that the line current continuously exceeds the Trim threshold before an ANM response
is executed.
Safe value the ANM system attempts to bring current to following a qualifying breach of
higher thresholds.
Time that the line current is continuously below the Reset threshold before releasing generation
in succession.
ANM system target value for power flow associated with the constraint following a trim event.
It is used to ensure that curtailment is reduced sufficiently below the Reset threshold.
ANM system target value for power flow associated with the constraint during a release event.
It is used to ensure that the release of generation does not cause power flow to breach the Trim
threshold immediately after.
Time delay between tripping ANM generators if the line current remains above the Sequential
Trip threshold.
Time delay before additional curtailment is issued if the line current remains above the Trim
Threshold.
Time delay before additional network capacity is recalculated if the line current remains below
the Trim Less threshold.
Magnitude of released capacity allocated to generators each Ramp Time.
Time delay between releasing capacity to generators.
Time delay following the previous successful data transfer between the measurement sensor and
sgs comms hub before a communication error is set.

UK Power Networks Holdings LimitedRegistered office: Newington House 237 Southwark Bridge Road London SE1 6NPRegistered in England and WalesRegistered number: 7290590
[email protected]/innovation
Related Documents