SDOT ASSET MANAGEMENT Status and Condition Report 2015

Welcome message from author
This document is posted to help you gain knowledge. Please leave a comment to let me know what you think about it! Share it to your friends and learn new things together.
Transcript

SDOT ASSET MANAGEMENT
Status and Condition Report
2015

Karen Melanson, Deputy Director Finance & Administration
Emily Burns, PMP, Asset Management Strategic Advisor Terry Martin, P.E., Asset Management Program Manager
This report represents the work of many SDOT staff including: Kenny Alcantara, Laeth Al-Rashid, Stephen Barham, Matt Beaulieu, Bill Bryant, Krista Bunch, John Buswell, Susan Byers, Jason Cambridge, Carter Danne, Ahmed Darrat, Nataliya Dernbach, Monica Dewald, Jonathan Dong, Brian Dougherty, Christopher Eaves, Emily Ehlers, Erich Ellis, Adiam Emery, Joshua Erickson, Mike Estey, Angel Garcia, Jinny Green, Cathi Greenwood, Benjamin Hansen, Erin Harris, Bob Hiller, Gary Hren, Larry Huggins, Eze Klarnet, Chad Lynch, John Marek, Hannah McIntosh, Carol McMahan, Ainalem Molla, Craig Moore, Darren Morgan, Trevor Partap, Christine Patterson, Margo Polley, Kyle Rowe, Chris Ruffini, Nolan Rundquist, Monica Schmitz, Michael Shaw, Elizabeth Sheldon, Kristen Simpson, Tim Skeel, MaryCatherine Snyder, Michael Solheim, Sam Spencer, Dana Trethewy, JaneLee Waldock, Jude Willcher, and Howard Wu. Special thanks to Daniel Bretzke, Facility Operations Division, FAS.
Photo Credits All photos courtesy of the City of Seattle Cover Photos - Top photos are 2P
ndP Ave Paving from 1943 and reconfigured
channelization as of 2015 - Bottom photos are construction of the Jose Rizal Bridge (Dearborn
Street Bridge) 1917 and after rehabilitation in 2013
Sources - Financial figures used in this document are generally expressed in
2015 dollars unless otherwise noted - Financial/budget data was obtained from the City’s Summit
Peoplesoft and Hansen Work Management databases - Asset data was obtained from Hansen Asset Management,
BridgeWorks, and StreetSaver as of December 2015 - Page 21: Seattle Growth and Development, U.S. Census Bureau,
Decennial Census 100% Count Data, (2000, 2010), Retrieved from http://www.seattle.gov/dpd/cityplanning/populationdemographics
-
- Published: December 7, 2015
ACKNOWLEDGEMENTS

2015 SDOT Status & Condition Report Table of Contents
Executive Summary ............................................................................................................................................................................... 1 PURPOSE OF THIS DOCUMENT ................................................................................................................................... 1
ASSET MANAGEMENT FRAMEWORK & MAP-21 ......................................................................................................... 1
TRANSPORTATION MAINTENANCE FUNDING HISTORY .............................................................................................. 2
SDOT ASSETS ............................................................................................................................................................... 3
LONG-TERM OPERATIONAL COST FORECASTING ....................................................................................................... 4
PERFORMANCE MEASURES ......................................................................................................................................... 5
ASSET CONDITION & DATA QUALITY ........................................................................................................................... 7
REPLACEMENT VALUE & DATA CONFIDENCE ............................................................................................................. 8
SDOT TRANSPORTATION INFRASTRUCTURE ASSETS ................................................................................................... 9
Introduction ........................................................................................................................................................................................... 10 PURPOSE AND SCOPE OF THIS REPORT .................................................................................................................... 10
SDOT ASSET MANAGEMENT PROGRAM ................................................................................................................... 11
SDOT ASSET MANAGEMENT GUIDING GOALS AND VISION ...................................................................................... 12
TRANSPORTATION OVERVIEW .................................................................................................................................. 15
STATUS AND CONDITION OF SDOT INFRASTRUCTURE ASSETS ................................................................................. 19
Section 1 – Bicycle and Pedestrian System ............................................................................................................................. 21 BICYCLE RACKS .......................................................................................................................................................... 22
KIOSKS ....................................................................................................................................................................... 23
MARKED CROSSWALKS ............................................................................................................................................. 24
SIDEWALK SYSTEM .................................................................................................................................................... 26
STAIRWAYS ................................................................................................................................................................ 29
STREET FURNISHINGS ............................................................................................................................................... 30
TRAILS ....................................................................................................................................................................... 31
Section 2 – Bridges and Structures ........................................................................................................................................... 32 AIR RAID SIREN TOWER ............................................................................................................................................. 33

AREAWAY STREET WALLS .......................................................................................................................................... 33
BRIDGES .................................................................................................................................................................... 35
BRIDGE HYDRANT VALVES ......................................................................................................................................... 39
ELEVATOR ................................................................................................................................................................. 39
RETAINING WALLS ..................................................................................................................................................... 40
TUNNELS ................................................................................................................................................................... 41
Section 3 – Channelization .......................................................................................................................................................... 42 PAVEMENT MARKINGS ............................................................................................................................................. 42
Section 4 – Intelligent Transportation System ....................................................................................................................... 45 BEACONS ................................................................................................................................................................... 50
BLUETOOTH / WI-FI READERS ................................................................................................................................... 51
CAMERA ASSEMBLIES ............................................................................................................................................... 51
COMMUNICATION NETWORK ................................................................................................................................... 52
COUNTERS................................................................................................................................................................. 53
DYNAMIC MESSAGE SIGNS (DMS) ............................................................................................................................. 54
NETWORK HUBS ........................................................................................................................................................ 55
RADAR SPEED SIGNS ................................................................................................................................................. 56
TRANSPORTATION OPERATIONS CENTER (TOC) ....................................................................................................... 56
TRAFFIC SIGNAL ASSEMBLIES .................................................................................................................................... 58
Section 5 – Parking Payment Devices ...................................................................................................................................... 60 PAY STATIONS ........................................................................................................................................................... 62
Section 6 – Pavement System .................................................................................................................................................... 64 ARTERIAL PAVEMENT ................................................................................................................................................ 65
NON-ARTERIAL PAVEMENT ....................................................................................................................................... 74
Section 7 – Real Property ............................................................................................................................................................ 76 BUILDINGS & YARDS .................................................................................................................................................. 76
PARCELS .................................................................................................................................................................... 78
SHORELINE STREET ENDS .......................................................................................................................................... 79
2015 Status and Condition Report – Table of Contents| ii

Section 8 – Signs ............................................................................................................................................................................ 80 SIGN ASSEMBLIES ...................................................................................................................................................... 80
Section 9 – Traffic Safety Structures & Devices ..................................................................................................................... 83 CHICANES .................................................................................................................................................................. 84
CRASH CUSHIONS ...................................................................................................................................................... 84
GUARDRAILS ............................................................................................................................................................. 85
MEDIAN ISLANDS ...................................................................................................................................................... 85
SPEED CUSHIONS ...................................................................................................................................................... 85
SPEED DOTS .............................................................................................................................................................. 86
SPEED HUMPS ........................................................................................................................................................... 86
TRAFFIC CIRCLES ....................................................................................................................................................... 86
Section 10 – Transit ....................................................................................................................................................................... 87 HISTORIC TRANSIT SHELTERS .................................................................................................................................... 87
REAL TIME TRANSIT INFORMATION SIGNS (DYNAMIC MESSAGE SIGNS).................................................................. 88
SEATTLE STREETCAR SYSTEM .................................................................................................................................... 88
TRANSIT ISLAND PLATFORMS.................................................................................................................................... 91
Section 11 – Urban Forest ........................................................................................................................................................... 92 IRRIGATION ............................................................................................................................................................... 93
LANDSCAPED AREAS ................................................................................................................................................. 94
TREES ........................................................................................................................................................................ 96
Appendices ............................................................................................................................................................................................ 99 APPENDIX A: SDOT ASSET MANAGEMENT OVERVIEW ............................................................................................. 99
APPENDIX B: THE ASSET HIERARCHY ....................................................................................................................... 101
APPENDIX C: ASSET CONDITION RATINGS AND CRITERIA ....................................................................................... 103
APPENDIX D: G-34 REPORTING ............................................................................................................................... 113
APPENDIX E: GLOSSARY........................................................................................................................................... 114
2015 Status and Condition Report – Table of Contents| iii
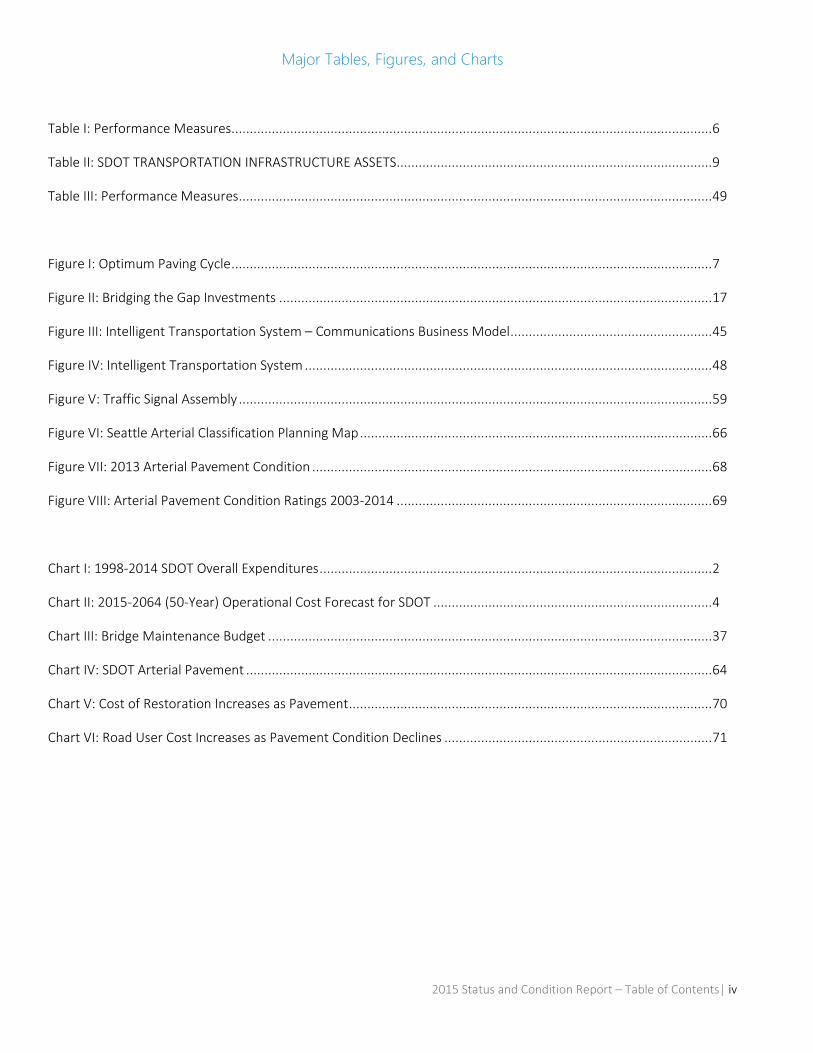
Major Tables, Figures, and Charts
Table I: Performance Measures ................................................................................................................................... 6
Table II: SDOT TRANSPORTATION INFRASTRUCTURE ASSETS ...................................................................................... 9
Table III: Performance Measures ................................................................................................................................. 49
Figure I: Optimum Paving Cycle ................................................................................................................................... 7
Figure II: Bridging the Gap Investments ...................................................................................................................... 17
Figure III: Intelligent Transportation System – Communications Business Model ....................................................... 45
Figure IV: Intelligent Transportation System ............................................................................................................... 48
Figure V: Traffic Signal Assembly ................................................................................................................................. 59
Figure VI: Seattle Arterial Classification Planning Map ................................................................................................ 66
Figure VII: 2013 Arterial Pavement Condition ............................................................................................................. 68
Figure VIII: Arterial Pavement Condition Ratings 2003-2014 ...................................................................................... 69
Chart I: 1998-2014 SDOT Overall Expenditures ........................................................................................................... 2
Chart II: 2015-2064 (50-Year) Operational Cost Forecast for SDOT ............................................................................ 4
Chart III: Bridge Maintenance Budget ......................................................................................................................... 37
Chart IV: SDOT Arterial Pavement ............................................................................................................................... 64
Chart V: Cost of Restoration Increases as Pavement ................................................................................................... 70
Chart VI: Road User Cost Increases as Pavement Condition Declines ......................................................................... 71
2015 Status and Condition Report – Table of Contents| iv

EXECUTIVE SUMMARY
PURPOSE OF THIS DOCUMENT This is the third edition of the Seattle Department of Transportation’s (SDOT) Asset Status and Condition Report. The Asset Management program developed the initial two editions in 2007 and 2010, respectively. The report acts as a reference guide for SDOT’s transportation infrastructure assets. Asset data is utilized to provide a baseline in prioritizing Asset Management efforts in the Department; for business process improvements; and management decisions on the operation, maintenance, and preservation or replacement of SDOT-owned and maintained infrastructure.
The demands on Seattle’s transportation system have grown dramatically in recent years. Meanwhile, the system is aging. SDOT must balance infrastructure expansion, preservation, and maintenance by aligning Asset Management practices with service delivery strategies. This must occur within the limits of available resources to ensure that we strategically manage the transportation system for years to come.
The report includes the following information on transportation infrastructure assets:
Value and condition; Data quality; Funding needed to maintain and preserve them; and Input on new asset needs along with transportation network capacity.
Statistics provided in this report reflect the Department’s state of the assets as of July 2015.
ASSET MANAGEMENT FRAMEWORK & MAP-21 The Federal Highway Administration (FHWA) describes Asset Management (AM) as a business process and decision-making framework that covers an extended time horizon and draws from economics and engineering, while considering a broad range of assets. The AM approach incorporates an economic assessment of trade-offs among alternative investment options and uses this information to help make cost-effective investment decisions.
Transportation Asset Management is a strategic approach to managing transportation infrastructure assets. It focuses on business processes for resource allocation and utilization with the objective of better decision-making based upon quality information about assets and well-defined objectives expressed as levels of service. This approach achieves the best results of performance for the preservation, improvement, and operation of infrastructure assets given the resources available. International Organization for Standardization (ISO) 55000 outlines the management of physical assets and the key principles of Asset Management as a way of doing business.
MAP-21 (Moving Ahead for Progress in the 21P
stP
Century) legislation, enacted in 2012, both funds surface transportation improvements and transforms policy and programs for development and replacement of transportation infrastructure. MAP-21 allocates transportation improvement funding using performance based metrics, multi-modal transportation, safety, congestion reduction, asset condition, and efficiency through innovation. Transportation agencies that adopt Asset Management models for managing their assets, including data supported Asset Management plans, will have more success in obtaining funding. You can find more information on transportation Asset Management and MAP-21 on FHWA’s web site at: Uhttps://www.fhwa.dot.gov/map21/U
Initially, MAP-21 is focusing on pavement, bridge, and transit Asset Management plans. Once agencies reach maturity in reporting these assets, legislation may require pavement markings, culverts, guardrail, signs, traffic signals, lighting, and Intelligent Transportation Systems (ITS) infrastructure Asset Management Plans.
2015 Status and Condition Report – Executive Summary| 1

TRANSPORTATION MAINTENANCE FUNDING HISTORY Between 1995 and 2006, the Department experienced a 66% loss in dedicated transportation funding. This decrease in funding is attributable to multiple statewide tax-revenue-limiting initiatives, reorganization of the City departments, and a mild recession in the early 2000s.
The mayor and council supplemented SDOT’s budget using other funding sources, including the general fund. However, because of competing citywide priorities, this was not a sustainable solution.
Bridging the Gap (BTG), initially conceived as a 20-year levy program in response to 35 years of deferred maintenance aggravated by years of shrinking dedicated transportation revenues, ultimately became a 9-year program. The voting public approved the levy in 2006. 2007 marked the first year of the $365M Bridging the Gap (BTG) funding package, a combination of a voter–approved transportation levy and a mayor/council-approved parking tax and employee hour tax. Later, the City abandoned the employee hour tax.
From 2007 thru 2015, SDOT has programmed more than $40 million per year from BTG revenue sources and has achieved its annual goals in a variety of asset categories, for maintenance or new construction. BTG allowed SDOT to further leverage grant funding for infrastructure replacement as well.
BTG restored dedicated transportation revenues. This funding has enabled SDOT to establish better maintenance, replacement and preservation programs. 2015 is the final year of BTG funding. For more information about BTG’s goals and progress on meeting these goals, visit the BTG web page:
Uhttp://www.seattle.gov/transportation/BridgingtheGap.htmU
In 2015, Seattle voters passed the BTG Levy replacement Let’s Move Seattle. This levy provides dedicated transportation funding from 2016 to 2024 for maintenance and repair; safety; and congestion relief. Funded by property taxes, Move Seattle levy funds will leverage additional state, federal, and private investments.
Chart I: 1998-2014 SDOT Overall Expenditures (infl. adj. to 2015 Dollars)
$0M
$50M
$100M
$150M
$200M
$250M
$300M
$350M
$400M
$450M
1998 2002 2006 2010 2014
Street Repair (infl adj)Transit Corridor Imps (infl adj)Transit & HOV (infl adj)Traffic Signals (infl adj)Signs & Markings (infl adj)Parking (infl adj)ITS (infl adj)Neighborhood Large (infl adj)Streetcar System (infl adj)Major Projects (Other) (infl adj)Sidewalks / Pedestrian (infl adj)Spokane St. (inf adj)Mercer (infl adj)AWV and Seawall (infl adj)Cap Bridge Rehab (infl adj)Cap Arterial Pavement (infl adj)General Budget (infl adj)
2015 Status and Condition Report – Executive Summary| 2
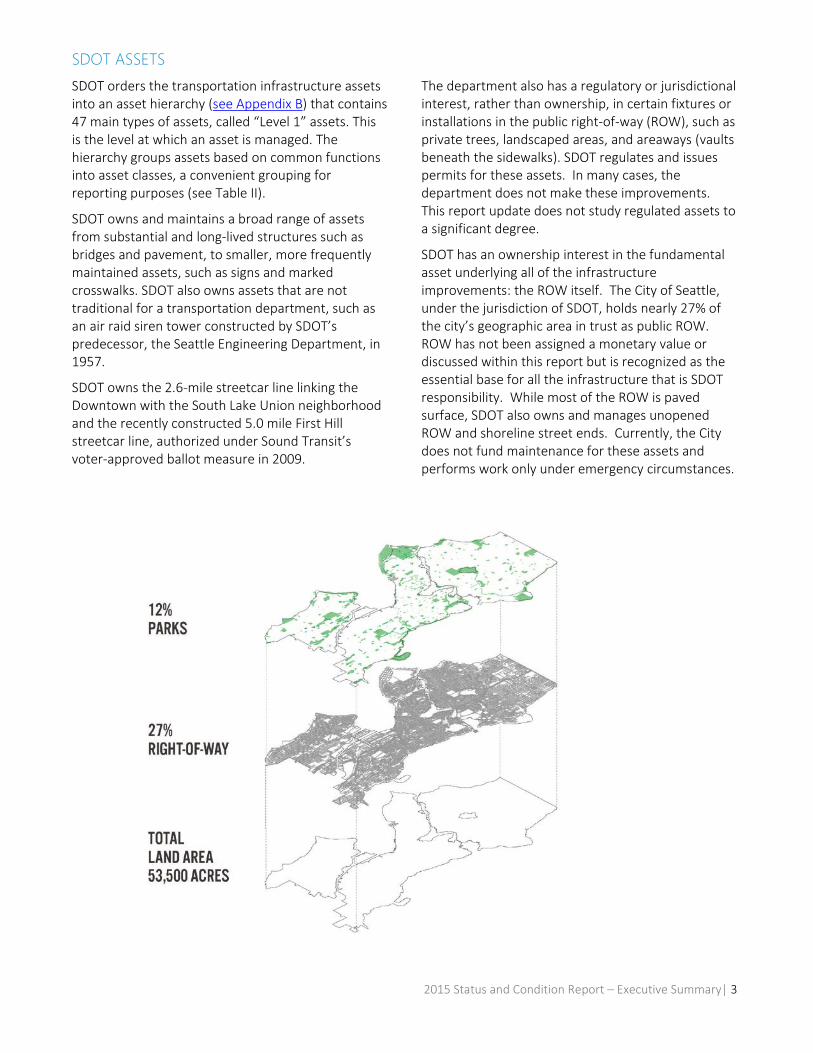
SDOT ASSETSSDOT orders the transportation infrastructure assets into an asset hierarchy (Usee Appendix BU) that contains 47 main types of assets, called “Level 1” assets. This is the level at which an asset is managed. The hierarchy groups assets based on common functions into asset classes, a convenient grouping for reporting purposes (see Table II).
SDOT owns and maintains a broad range of assets from substantial and long-lived structures such as bridges and pavement, to smaller, more frequently maintained assets, such as signs and marked crosswalks. SDOT also owns assets that are not traditional for a transportation department, such as an air raid siren tower constructed by SDOT’s predecessor, the Seattle Engineering Department, in 1957.
SDOT owns the 2.6-mile streetcar line linking the Downtown with the South Lake Union neighborhood and the recently constructed 5.0 mile First Hill streetcar line, authorized under Sound Transit’s voter-approved ballot measure in 2009.
The department also has a regulatory or jurisdictional interest, rather than ownership, in certain fixtures or installations in the public right-of-way (ROW), such as private trees, landscaped areas, and areaways (vaults beneath the sidewalks). SDOT regulates and issues permits for these assets. In many cases, the department does not make these improvements. This report update does not study regulated assets to a significant degree.
SDOT has an ownership interest in the fundamental asset underlying all of the infrastructure improvements: the ROW itself. The City of Seattle, under the jurisdiction of SDOT, holds nearly 27% of the city’s geographic area in trust as public ROW. ROW has not been assigned a monetary value or discussed within this report but is recognized as the essential base for all the infrastructure that is SDOT responsibility. While most of the ROW is paved surface, SDOT also owns and manages unopened ROW and shoreline street ends. Currently, the City does not fund maintenance for these assets and performs work only under emergency circumstances.
2015 Status and Condition Report – Executive Summary| 3
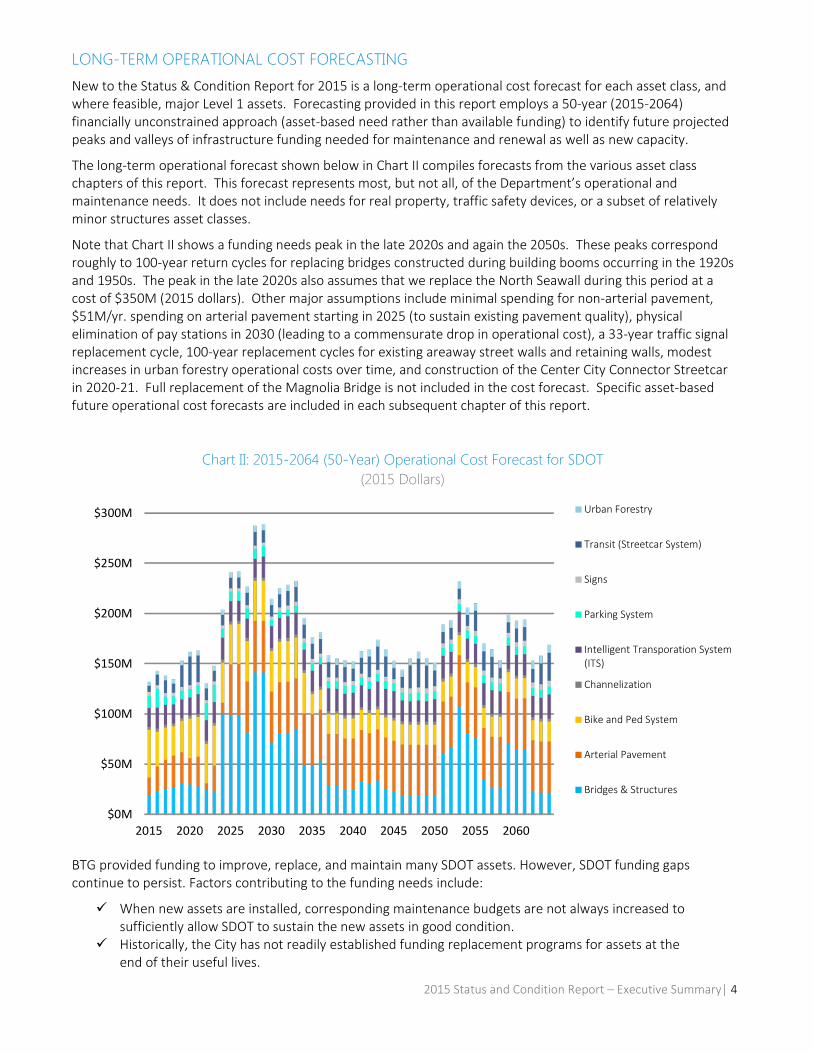
LONG-TERM OPERATIONAL COST FORECASTING New to the Status & Condition Report for 2015 is a long-term operational cost forecast for each asset class, and where feasible, major Level 1 assets. Forecasting provided in this report employs a 50-year (2015-2064) financially unconstrained approach (asset-based need rather than available funding) to identify future projected peaks and valleys of infrastructure funding needed for maintenance and renewal as well as new capacity.
The long-term operational forecast shown below in Chart II compiles forecasts from the various asset class chapters of this report. This forecast represents most, but not all, of the Department’s operational and maintenance needs. It does not include needs for real property, traffic safety devices, or a subset of relatively minor structures asset classes.
Note that Chart II shows a funding needs peak in the late 2020s and again the 2050s. These peaks correspond roughly to 100-year return cycles for replacing bridges constructed during building booms occurring in the 1920s and 1950s. The peak in the late 2020s also assumes that we replace the North Seawall during this period at a cost of $350M (2015 dollars). Other major assumptions include minimal spending for non-arterial pavement, $51M/yr. spending on arterial pavement starting in 2025 (to sustain existing pavement quality), physical elimination of pay stations in 2030 (leading to a commensurate drop in operational cost), a 33-year traffic signal replacement cycle, 100-year replacement cycles for existing areaway street walls and retaining walls, modest increases in urban forestry operational costs over time, and construction of the Center City Connector Streetcar in 2020-21. Full replacement of the Magnolia Bridge is not included in the cost forecast. Specific asset-based future operational cost forecasts are included in each subsequent chapter of this report.
BTG provided funding to improve, replace, and maintain many SDOT assets. However, SDOT funding gaps continue to persist. Factors contributing to the funding needs include:
When new assets are installed, corresponding maintenance budgets are not always increased to sufficiently allow SDOT to sustain the new assets in good condition.
Historically, the City has not readily established funding replacement programs for assets at the end of their useful lives.
$0M
$50M
$100M
$150M
$200M
$250M
$300M
2015 2020 2025 2030 2035 2040 2045 2050 2055 2060
Urban Forestry
Transit (Streetcar System)
Signs
Parking System
Intelligent Transporation System(ITS)
Channelization
Bike and Ped System
Arterial Pavement
Bridges & Structures
Chart II: 2015-2064 (50-Year) Operational Cost Forecast for SDOT (2015 Dollars)
2015 Status and Condition Report – Executive Summary| 4

SDOT maintains some assets based on customer request rather than through programmed maintenance. Condition of these assets is generally unknown until they reach the point where asset replacement is required to maintain the level of service, which, depending on the asset, may be more expensive than the cost of performing timely, routine maintenance. This is particularly the case with the Intelligent Transportation System (ITS), pavement, bicycle and pedestrian system, urban forest and roadway structures.
Funding to maintain or replace expensive assets has tended to not compete well in the budget setting process.
PERFORMANCE MEASURES The City of Seattle established an external facing performance measures website in 2015: Uhttps://performance.seattle.gov/U. Performance measures track our progress toward both maintaining our success rates as well as improving our service delivery for the benefit of all Seattle residents.
Performance measures, including BTG accomplishments, are included in this report to track the department’s ability to reach targets which measure SDOT’s success at delivering different aspects of service. Table I below compiles some of the most important measures from the various asset class chapters in this report and identifies whether SDOT met a particular goal as well as the direction it is currently trending. Performance measures increase transparency and efficiency and ensure that SDOT remains accountable to the public.
2015 Status and Condition Report – Executive Summary| 5
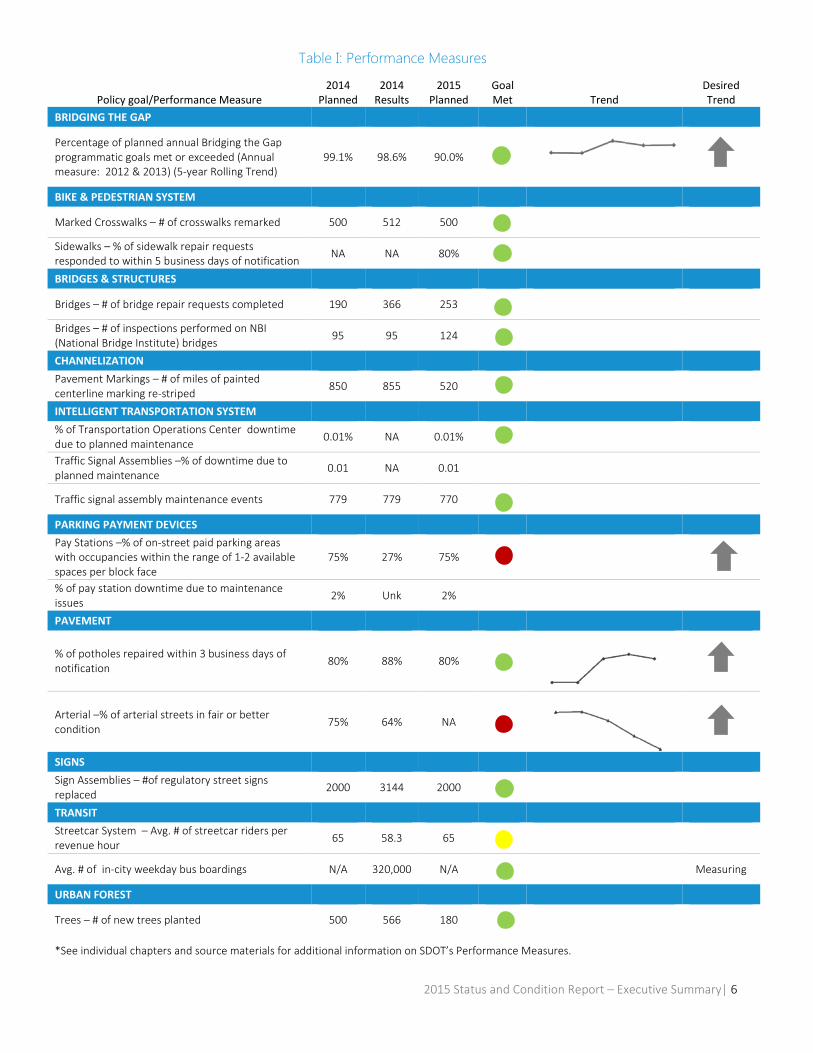
Table I: Performance Measures
Policy goal/Performance Measure 2014
Planned 2014
Results 2015
Planned Goal Met Trend
Desired Trend
BRIDGING THE GAP Percentage of planned annual Bridging the Gap programmatic goals met or exceeded (Annual measure: 2012 & 2013) (5-year Rolling Trend)
99.1% 98.6% 90.0%
BIKE & PEDESTRIAN SYSTEM Marked Crosswalks – # of crosswalks remarked 500 512 500
Sidewalks – % of sidewalk repair requests responded to within 5 business days of notification
NA NA 80%
BRIDGES & STRUCTURES
Bridges – # of bridge repair requests completed 190 366 253 Bridges – # of inspections performed on NBI (National Bridge Institute) bridges
95 95 124
CHANNELIZATION
Pavement Markings – # of miles of painted centerline marking re-striped
850 855 520
INTELLIGENT TRANSPORTATION SYSTEM
% of Transportation Operations Center downtime due to planned maintenance
0.01% NA 0.01%
Traffic Signal Assemblies –% of downtime due to planned maintenance
0.01 NA 0.01
Traffic signal assembly maintenance events 779 779 770
PARKING PAYMENT DEVICES
Pay Stations –% of on-street paid parking areas with occupancies within the range of 1-2 available spaces per block face
75% 27% 75%
% of pay station downtime due to maintenance issues
2% Unk 2%
PAVEMENT
% of potholes repaired within 3 business days of notification
80% 88% 80%
Arterial –% of arterial streets in fair or better condition
75% 64% NA
SIGNS
Sign Assemblies – #of regulatory street signs replaced
2000 3144 2000
TRANSIT Streetcar System – Avg. # of streetcar riders per revenue hour
65 58.3 65
Avg. # of in-city weekday bus boardings N/A 320,000 N/A
Measuring
URBAN FOREST
Trees – # of new trees planted 500 566 180
*See individual chapters and source materials for additional information on SDOT’s Performance Measures.
2015 Status and Condition Report – Executive Summary| 6
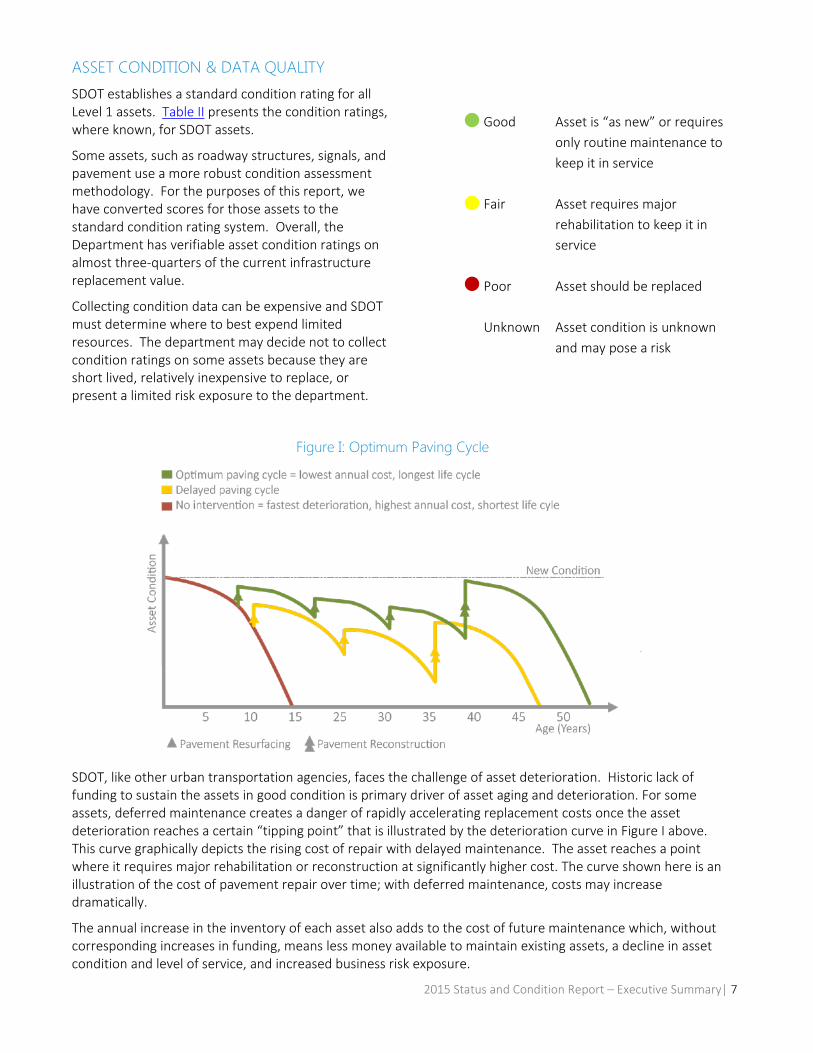
ASSET CONDITION & DATA QUALITY SDOT establishes a standard condition rating for all Level 1 assets. UTable IIU presents the condition ratings, where known, for SDOT assets.
Some assets, such as roadway structures, signals, and pavement use a more robust condition assessment methodology. For the purposes of this report, we have converted scores for those assets to the standard condition rating system. Overall, the Department has verifiable asset condition ratings on almost three-quarters of the current infrastructure replacement value.
Collecting condition data can be expensive and SDOT must determine where to best expend limited resources. The department may decide not to collect condition ratings on some assets because they are short lived, relatively inexpensive to replace, or present a limited risk exposure to the department.
Figure I: Optimum Paving Cycle
SDOT, like other urban transportation agencies, faces the challenge of asset deterioration. Historic lack of funding to sustain the assets in good condition is primary driver of asset aging and deterioration. For some assets, deferred maintenance creates a danger of rapidly accelerating replacement costs once the asset deterioration reaches a certain “tipping point” that is illustrated by the deterioration curve in Figure I above. This curve graphically depicts the rising cost of repair with delayed maintenance. The asset reaches a point where it requires major rehabilitation or reconstruction at significantly higher cost. The curve shown here is an illustration of the cost of pavement repair over time; with deferred maintenance, costs may increase dramatically.
The annual increase in the inventory of each asset also adds to the cost of future maintenance which, without corresponding increases in funding, means less money available to maintain existing assets, a decline in asset condition and level of service, and increased business risk exposure.
Good Asset is “as new” or requires only routine maintenance to keep it in service
Fair Asset requires major rehabilitation to keep it in service
Poor Asset should be replaced
Unknown Asset condition is unknown and may pose a risk
2015 Status and Condition Report – Executive Summary| 7

REPLACEMENT VALUE & DATA CONFIDENCE “Replacement value” quantifies the total value of Seattle’s transportation infrastructure. It represents the cost in 2015 dollars to replace all of SDOT’s assets, and does not imply that the entire infrastructure requires replacement. Knowing an asset’s replacement value helps direct decision-making about investment strategies for repair or replacement. Postponing asset maintenance could result in earlier replacement rather than extending
an asset’s useful life if we perform preventative maintenance.
New to the 2015 edition of this report is an estimation of data quality. This evaluation assists the department in determining unknown risks based on asset value and other factors.
The estimated replacement value of SDOT infrastructure assets is approximately $20 billion. The value of the ROW is not included in this total.
Pavement System $8,562M 43%
Bike/Ped System $5,449M 27%
Bridges & Structures $5,237M 26%
All Other Assets $794M 4%
Total Replacement Cost
High $8,920M 45%
Medium-High $466M 2%
Medium $10,256M 51%
Medium-Low $104M .5%
Low $296M 1.5%
Data Confidence
2015 Status and Condition Report – Executive Summary| 8

Table II: SDOT TRANSPORTATION INFRASTRUCTURE ASSETS
Asset Class/Asset Inventory Status Replacement Value ($M)
Data Confidence
Condition Good Fair Poor Unk.
BIKE & PEDESTRIAN SYSTEM $5,449 Bicycle Racks 3,301 $2.2 High 97.8% 1.2% 0.5% 0.5% Kiosk 150 (e) $1.1 Low 100% Marked Crosswalks 5,357 $5.4 Medium-High 53.4% 16.7% 29.6% <1% Sidewalks 33,373 block faces $5,280 Medium 23.9% 5.6% 1.0% 69.6% Stairways 509 $63.6 Medium-High 61% 28% 11% Street Furnishings Unknown Unknown Low 100% Trails 40.2 lane miles $96.3 Medium-Low 100%
BRIDGES & STRUCTURES $5,237 Air Raid Siren Tower 1 $.5 High 100% N/A Areaway Street Walls 236 $218.0 Low 11% 58% 12% 19% Bridges 117 $4,112.0 High 31% 52% 17% 0% Bridge Hydrant Vaults 13 $.65 High 100% Elevator 1 $1.5 High 100% Retaining Walls 582 $903.1 Medium 42% 36% 19% 3% Tunnel 1 $.74 High 100%
CHANNELIZATION $4.9 Pavement Markings $4.9 Medium 100%
INTELLIGENT TRANSPORTATION SYSTEM $377.5 Beacons 391 $5.9 Medium 32.5% 6.6% 1.0% 59.8% Bluetooth Readers Service $0.0 Cameras 257 $2.6 Medium 52.5% 47.5% Communications Network 150 miles (e) $75.0 Low 100% Counters 13 $.3 Medium-High Dynamic Message Signs 51 $9.7 Medium-High 100% Network Hubs 14 $.9 Medium-High 100% Radar Speed Signs 43 $.43 Medium 53.5% 46.5% Transportation Operations Center 1 $1.0 High 100% Traffic Signal Assemblies 1,071 $281.1 Medium-High 12% 51% 35% 2%
PARKING PAYMENT DEVICES $20 Pay Stations 2,022 $20 High 100%
PAVEMENT SYSTEM $8,562 Arterial 1,547 lane miles $4,678 High 46.5% 17.8% 35.7% Non-arterial 2,407 lane miles $3,884 Medium 59.9% 11.5% 13.6% 15.0%
REAL PROPERTY $80.5 Buildings & Yards 15 $80.5 Medium-High 40% 40% 20% Parcels 57 N/A Medium-High N/A Shoreline Street Ends (ROW) 143 (e) N/A Medium-Low N/A
SIGNS $66.8 Sign Assemblies 181,431 $66.8 Medium 39.5% <.01% <.01% 60.5%
TRAFFIC SAFETY STRUCTURES & DEVICES $30.9 Chicanes 22 $.66 Low 100% Crash Cushions 40 $.78 Medium 82.1% 7.7% 5.1% 5.1% Guardrails 75,000 LF, 772 units $7.5 Medium-Low 50.9% 44.6% 0.3% 4.3% Median Islands 500 (e) Unknown Low 100% Speed Cushions 25 (e) $.31 Low 100% Speed Dots 3 $.02 Low 100% Speed Humps 100 (e) $.50 Low 100% Traffic Circles 1,056 $21.1 Medium High 94.7% 3.8% 0.2% 1.3%
TRANSIT $106.2 Historic Transit Shelters 2 $.22 High 100% Real Time Transit Information Signs 13 $2.3 Medium-High 100% Streetcar System 2 Lines $103.0 High 100% Transit Loading Platforms 6 (e) $.70 Low 100%
URBAN FOREST $107.2 Irrigation 131 Unknown Low 100% Landscaped Areas 5,371k SF, 218 units $37.5 Medium 15.4% 6.3% 0.9% 77.4% Trees 41,000 (e) $69.7 Medium 75% 17% 5% 3%
(e) = estimated count
= $20 BILLION
2015 Status and Condition Report – Executive Summary | 9

Some of the many Regulated Assets in the Street ROW
INTRODUCTION
PURPOSE AND SCOPE OF THIS REPORT This is the third edition of the Seattle Department of Transportation’s (SDOT) Status and Condition Report. The Asset Management program developed the initial two editions in 2007 and 2010, respectively.
This updated Status and Condition Report focuses on the physical infrastructure assets in the transportation right-of-way (ROW) that are owned and/or operated by SDOT and directly affect the delivery of transportation services to the public. The report provides a description of the assets including: value, condition, data quality, the funding needed for financially sustainable preservation of the infrastructure, and input on new asset needs along with transportation network capacity. Except where noted, asset count and value data is as of July 2015.
SDOT also has jurisdiction over physical assets in the ROW owned by other parties. These assets, termed Regulated Assets, encompass those assets/improvements that exist in the street ROW, not owned by SDOT, but over which SDOT has a jurisdictional interest. SDOT has an ownership interest in the ROW itself, but in many cases does not make the improvements that exist in the ROW, for example, trees or other landscaping. This report update does not study regulated assets to a significant degree. A partial list of these assets includes:
• Areaways, not owned by SDOT • Landscaped areas, not owned by SDOT • Shoreline Street Ends • Trees, not owned by SDOT • Unopened ROW
Intended Use of this Document
This report serves multiple purposes:
It provides a base of technical information about SDOT assets that will serve as a useful reference for department staff when making decisions and for better managing scarce resources.
Acts as a reference guide of SDOT assets for the general public.
Asset funding requirements information will be available for budgeting and capital funding decisions. In subsequent years, as the Asset Management program matures, we will better understand the preservation needs of SDOT assets and the related funding requirements. This will inform future year budgets and transportation capital project development.
Serves as a gap analysis, helpful in identifying steps SDOT will need to take to increase its competency in Asset Management.
Finally, it briefly discusses the primary system automation tool SDOT employs in its asset and work management efforts. The Hansen (Infor) enterprise database system serves as the central asset data repository and integrates with SDOT’s Geographic Information System (GIS) to allow for spatial reporting and analysis.
How this Document was Prepared
The Department’s Asset Management program prepared this report. We primarily obtained data through the Hansen (Infor) central data repository and confirmed data quality with SDOT asset owners.
2015 Status and Condition Report – Introduction | 10

Asset Management Framework & MAP-21
The Federal Highway Administration describes Asset Management (AM) as a business process and decision-making framework that covers an extended time horizon and draws from economics and engineering, while considering a broad range of assets. The Asset Management approach incorporates an economic assessment of trade-offs among alternative investment options and uses this information to help make cost-effective investment decisions.
Transportation Asset Management is a strategic approach to managing transportation infrastructure assets. It focuses on business processes for resource allocation and utilization with the objective of better decision-making based upon quality information about assets and well-defined objectives expressed as levels of service. This approach achieves the best results of performance for the preservation, improvement, and operation of infrastructure assets given the resources available. The International Organization for Standardization (ISO) 55000 outlines the management of physical assets and the key principles of Asset Management as a way of doing business.
Map-21 (Moving Ahead for Progress in the 21P
stP Century) legislation, enacted in 2012, funds surface
transportation improvements and transforms policy and programs for development and replacement of transportation infrastructure. MAP-21 allocates transportation improvement funding using performance based metrics, multi-modal transportation, safety, congestion reduction, asset condition, and efficiency through innovation. Transportation agencies that adopt Asset Management models for managing their assets, including data supported Asset Management plans, will have more success in obtaining funding. You can find more information on transportation Asset Management and MAP-21 on FHWA’s web site at: Uhttps://www.fhwa.dot.gov/map21/U
Initially, MAP-21 will request pavement, bridge, and transit Asset Management plans. Once agencies reach maturity in reporting these assets, additional Asset Management plans will likely be required for other asset classes such as pavement markings, signs, traffic signals, and Intelligent Transportation Systems (ITS) infrastructure, just to name a few.
SDOT ASSET MANAGEMENT PROGRAM SDOT has adopted Asset Management to enable it to meet the challenges of preserving Seattle’s transportation infrastructure. SDOT has elected to implement the Asset Management business model through a multi-year program of continuous improvement in infrastructure policies and practices. More information about SDOT Asset Management principles is available in Appendix A.
The program’s approach is to develop basic building blocks, create collaborative “early wins” where possible in the organization, and lay the foundation for a sustainable program. The Department continues to compile asset inventory data (status and condition), has begun to develop level of service standards, a risk methodology, and asset-based performance measures. Development of standardized life cycle cost analysis, risk-based decision models, and Asset Management Plans are underway. The organization is in the process of increasing the capability of its Hansen (Infor) enterprise data management system, both in terms of a “build-out” of the system’s capacities, and also in terms of the Department’s ability to analyze the data available.
To support the Asset Management program, SDOT established a governing and program management structure. The governing body is a steering committee comprised of Division Directors and an Executive Sponsor. The Asset Owners Forum advises the Asset Management program. The forum is comprised of departmental subject matter experts from a variety of disciplines including engineering, planning, landscape architecture, maintenance, information technology, operations, and finance who prioritize and implement program initiatives.
2015 Status and Condition Report – Introduction | 11

SDOT ASSET MANAGEMENT GUIDING GOALS AND VISION
Relationship to Other Planning Documents
This report is a snapshot of the state of SDOT transportation infrastructure. Over time, SDOT will refresh and refine this report to depict historical trends in the expected life, value, and condition of SDOT assets. It is a companion document to other SDOT guiding, planning and reporting documents, including:
UTransportation 2040U – Puget Sound Regional Council’s action plan to meet the transportation needs of the central Puget Sound area for the next 25 years. For more information about the plan: Uhttp://www.psrc.org/transportation/t2040U
UCity of Seattle Comprehensive Plan U – A twenty-year plan (new draft released in May 2015) that outlines a vision and roadmap for Seattle’s future. For more information on the transportation chapter in the plan: Uhttp://www.seattle.gov/dpd/cityplanning/U
UTransportation Capital Improvement Program (TCIP)U – Updated annually, the TCIP is a six-year plan for improvement and asset preservation projects.
USDOT Biennial BudgetU – A two-year projection of the revenues and resources required to support SDOT’s annual operations and maintenance activities, including the planning and administration of the organization.
Sidewalk System
VISION
TRANSPORTATION EXCELLENCE
THROUGH EXPERT, CREDIBLE,
RESPONSIVE ASSET
MANAGEMENT
2015 Status and Condition Report – Introduction | 12
Equitable
Smart Decisions
Stewardship
Agility
Sustainability
Accountability
Transparency
Long-Term Decision Making
Move Seattle – A 10-year (2015-2024) strategic vision for SDOT. This document identifies how the department will integrate, prioritize and implement the visions established in the Bicycle, Pedestrian, Freight, Intelligent Transportation System and Transit Master Plans as well as the City of Seattle’s Comprehensive Plan. Furthermore, it lays out performance measures to ensure that SDOT remains accountable to those plans and the public. For more information about the plan: http://www.seattle.gov/transportation/moveSeattle.htm
Vision Zero – A plan to end traffic fatalities and serious injuries in Seattle by 2030. Vision Zero provides an opportunity to integrate our safety efforts by combining the street design recommendations of our Pedestrian, Bicycle, Transit, and Freight Master Plans with targeted enforcement patrols and educational outreach to address behavioral issues. For more information about the plan: http://www.seattle.gov/visionzero
Intelligent Transportation Systems (ITS) Strategic Plan – A 10-year approach for implementing ITS in Seattle. ITS employs electronics and communications technologies and automated traffic systems to enhance mobility for all modes of transportation by increasing the efficiency and safety of the transportation infrastructure. For more information about the plan: http://www.seattle.gov/transportation/its_plan.htm
Bicycle Master Plan (BMP) – A 20-year plan that identifies projects and programs to meet the vision of making riding a bike a comfortable and integral part of daily life in Seattle for people of all ages and abilities. For more information about the plan: http://www.seattle.gov/transportation/bikemaster.htm
Pedestrian Master Plan (PMP) – Both a near-term and a long-term plan, the PMP takes an extended view of the actions that must happen to sustain Seattle as a walkable city. For more information about the plan: http://www.seattle.gov/transportation/pedestrian_masterplan/default.htm
Transit Master Plan (TMP) – The TMP is a comprehensive 20-year look ahead towards the type of transit system that will be required to meet Seattle’s transit needs through 2030. For more information about the plan: http://www.seattle.gov/transportation/transitmasterplan.htm
Freight Master Plan (FMP) – SDOT is developing the FMP to address the unique characteristics, needs, and impacts of freight mobility by focusing primarily on urban truck freight movement to support Seattle’s increasing demand for goods and services in a safe and reliable manner. For more information about the plan: http://www.seattle.gov/transportation/freight_fmp.htm
Future Expectations for this Report
As the Asset Management program matures, SDOT will develop Asset Management Plans for each major asset class. These plans will contain detailed Asset Management strategies that will be the source of information used in subsequent Status and Condition Reports. The Asset Management Plans will advance departmental goals with specific actionable projects associated with each asset.
Overcoming Challenges
Seattle is one of the fastest growing cities in the U.S. and the demands on the transportation system have grown dramatically. Meanwhile, the system is aging. The Seattle Department of Transportation (SDOT) must balance infrastructure expansion, preservation, and maintenance by aligning its Asset Management practices with its service delivery strategies. All of this must occur within the limits of available resources and ensure that the Department strategically manages the transportation system for years to come.
2015 Status and Condition Report – Introduction | 13
The Asset Management initiative provides a long-term vision of how SDOT intends to accomplish its mission. SDOT continues to work on Asset Management practices including:
Establishing a common vocabulary. We will establish criteria for clearly determining at what level we will manage, count, value, and fund an asset.
Establishing common asset standards. The maturity of Asset Management practices differ widely across SDOT divisions. As a result of developing this report, SDOT has launched an effort to set common standards for all of Asset Management. Divisions are working to adjust practices and implement standards.
Maintaining accurate repositories of asset inventories. SDOT divisions manage asset inventories independently through a wide variety of systems and practices. The level of information varies significantly. This report makes more definitive statements where information levels are high about maintenance needs and funding requirements.
Establishing clear ownership for assets. Other city departments own assets in the ROW, such as Seattle City Light which installs and maintains pedestrian lighting. Occasionally assets are created through a new capital project where ownership was not clearly established, making SDOT division responsibility unclear. As the Asset Management program matures, we are defining ownership on a more routine basis.
Establishing clear responsibility for maintenance. While the maintenance responsibilities for most SDOT-owned assets are clear, these obligations can be ambiguous for assets that cross organizational lines. As the Asset Management program matures, we will better define maintenance responsibility.
Managing donated assets and asset on-boarding. We are developing an improved process for managing new assets installed via private development, utility projects, and Capital Improvement Projects that are turned over to SDOT Divisions.
Managing Regulated Assets. Although SDOT does not own all of the assets in the ROW, the Department has jurisdiction and legal responsibility. A different management approach is required for these assets.
Establishing meaningful performance measures. The Asset Management program is providing a method to establish clear, goal-oriented performance measures by establishing a level of service standard for each asset.
Strategic asset implementation. As the Department matures, SDOT staff will have the tools to manage assets at a more strategic level, such as considering travel corridors and neighborhoods, rather than on an asset-by-asset basis. This in fact has already started as SDOT incorporates strategic considerations into its planning using the directives of the “Complete Streets” ordinance.
Determining installation and maintenance costs per asset. SDOT management and financial systems do not always track costs at the asset levels developed in this report. To determine life cycle costs, information systems require comprehensive and standardized asset identification methods to track acquisition costs and maintenance activity and costs. This requires a long-term information systems initiative. The Asset Management program is working to establish requirements for this data as an ongoing activity.
Developing asset-based long-term operational cost forecasting. First introduced in this report edition, long-term operational forecasting defines expected life and replacement costs for 10, 20, and 50-year horizons. SDOT will continue to refine its long-term operational cost forecasting as better life-cycle costs are developed.
Developing Asset Management Plans. These plans will assemble information on asset status and condition, levels of service, performance measures, business risk exposure, and lifecycle cost analyses to build decision rules on asset investments and management and share this information throughout the department.
2015 Status and Condition Report – Introduction | 14
TRANSPORTATION OVERVIEW
The City of Seattle covers 142.5 square miles - 83.87 square miles consisting of land and 58.67 square miles of water. The Seattle Metropolitan Area covers 8,186 square miles. There are approximately 3,954 12-foot wide lane miles of streets within the City of Seattle. The street ROW occupies 27% of the city surface area.
Seattle’s urban transportation system consists of a street network with paved roads, a sidewalk system, a bicycle network, bridges and other roadway structures, a traffic control network, paths and trails, street signs, traffic safety structures and devices, parking devices, a streetcar system, and an urban forest. All of these infrastructure assets exist within the public ROW.
SDOT Mission, Vision, and Core Values
We're focused on creating a safe, interconnected, vibrant, affordable, and innovative city for all as guided by our core values:
A Safe City – We will not accept traffic deaths as an inevitable part of traveling together in a safe city. Our goal is to eliminate serious and fatal crashes in Seattle. Safety also means being prepared for a natural disaster by seismically reinforcing our bridges to withstand earthquakes.
An Interconnected City – More travel options doesn't always equate to an easy-to-use, interconnected system. Our goal is to provide an easy-to-use, reliable transportation system that gives you the options you want when you need them.
A Vibrant City – A vibrant city is one where the streets and sidewalks hum with economic and social activity. People meet and shop and enjoy the beautiful city we live in, side by side with goods delivery and freight shipping. Our goal is to use Seattle's streets and sidewalks to improve the city's health, prosperity, and happiness.
An Affordable City – Our goal is to give all people high-quality and low-cost transportation options that allow them to spend their money on things other than transportation. The transportation system in an affordable city improves the lives of all travelers – those with the latest model smart phones in their pockets and those without.
An Innovative City – Demographic changes and technological innovation are radically reshaping transportation. Our goal is to understand and plan for the changes of tomorrow, while delivering great service today. This includes newer, more nimble approaches to delivering projects and programs to our customers.
Value of the Transportation System
SDOT estimates replacement value of the transportation infrastructure assets at approximately $20 billion. For an itemized breakdown of individual asset replacement costs see Table II.
Investment in Transportation Assets
The city has invested in transportation infrastructure since its founding in 1851. Furthermore, each year private entities construct new assets and turn them over to SDOT when construction is completed. Since 1980, the department has maintained an explicit record of costs to build and perform major rehabilitation on infrastructure assets and to align with for Governmental Accounting Standards Board, Statement 34, (GASB-34) reporting (see Appendix D). The Department has made an investment of $1.96 billion in transportation infrastructure from 1980 to 2014.
SDOT Mission: To deliver a high-quality transportation system for Seattle
SDOT Vision: a vibrant Seattle with connected people, places, and products
2015 Status and Condition Report – Introduction | 15
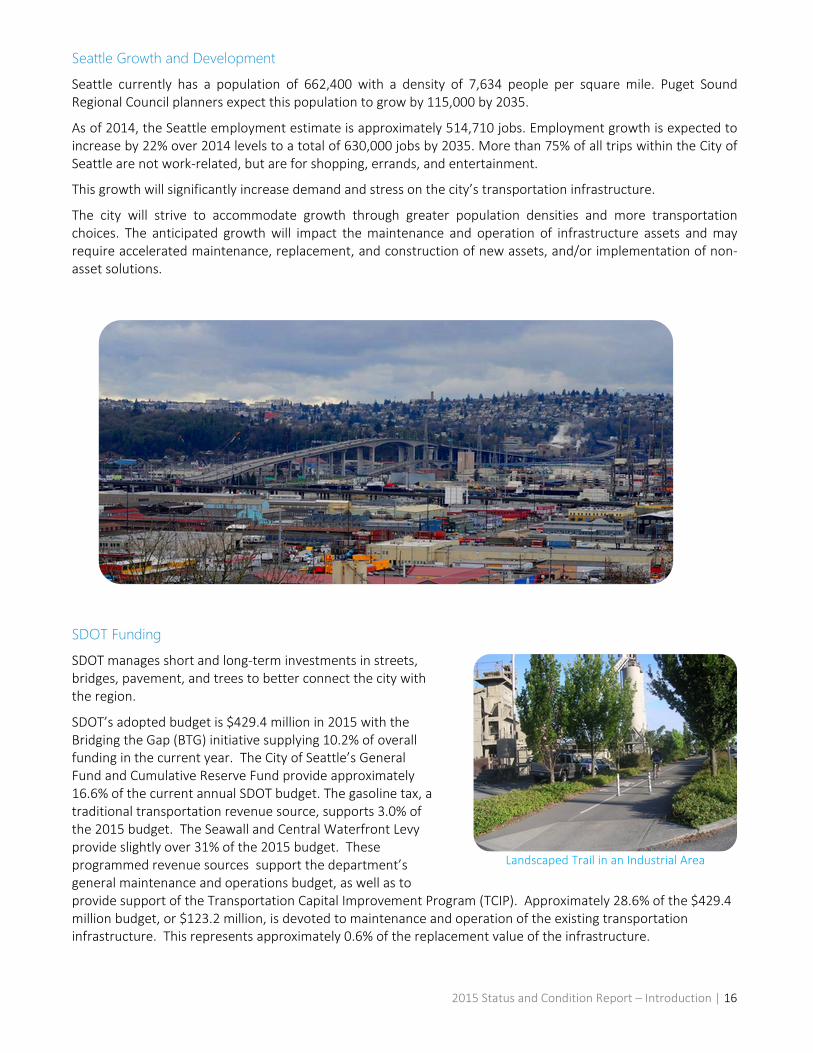
Seattle Growth and Development
Seattle currently has a population of 662,400 with a density of 7,634 people per square mile. Puget Sound Regional Council planners expect this population to grow by 115,000 by 2035.
As of 2014, the Seattle employment estimate is approximately 514,710 jobs. Employment growth is expected to increase by 22% over 2014 levels to a total of 630,000 jobs by 2035. More than 75% of all trips within the City of Seattle are not work-related, but are for shopping, errands, and entertainment.
This growth will significantly increase demand and stress on the city’s transportation infrastructure.
The city will strive to accommodate growth through greater population densities and more transportation choices. The anticipated growth will impact the maintenance and operation of infrastructure assets and may require accelerated maintenance, replacement, and construction of new assets, and/or implementation of non-asset solutions.
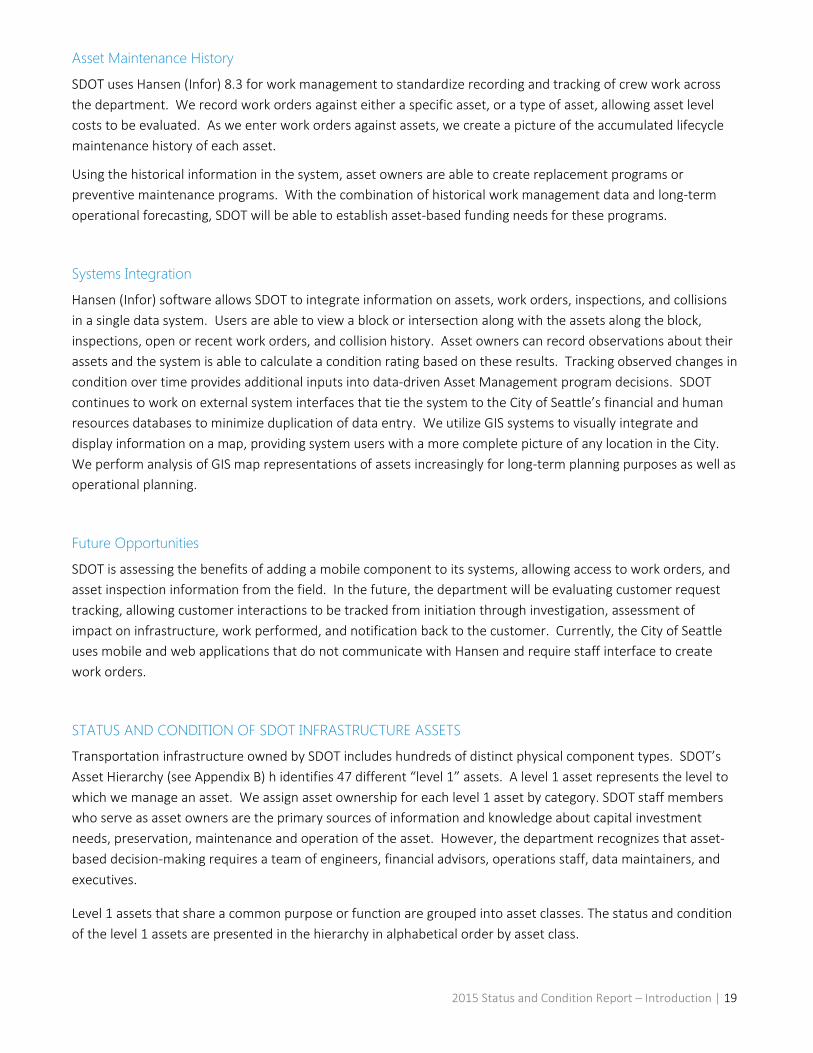
SDOT Funding
SDOT manages short and long-term investments in streets, bridges, pavement, and trees to better connect the city with the region.
SDOT’s adopted budget is $429.4 million in 2015 with the Bridging the Gap (BTG) initiative supplying 10.2% of overall funding in the current year. The City of Seattle’s General Fund and Cumulative Reserve Fund provide approximately 16.6% of the current annual SDOT budget. The gasoline tax, a traditional transportation revenue source, supports 3.0% of the 2015 budget. The Seawall and Central Waterfront Levy provide slightly over 31% of the 2015 budget. These programmed revenue sources support the department’s general maintenance and operations budget, as well as to provide support of the Transportation Capital Improvement Program (TCIP). Approximately 28.6% of the $429.4 million budget, or $123.2 million, is devoted to maintenance and operation of the existing transportation infrastructure. This represents approximately 0.6% of the replacement value of the infrastructure.
Landscaped Trail in an Industrial Area
2015 Status and Condition Report – Introduction | 16

Figure II: Bridging the Gap Investments The map below details SDOT areas of investment and accomplishments by census tract under BTG
2015 Status and Condition Report – Introduction | 17

Enterprise Data Management System
SDOT uses Hansen (Infor) version 8.3 software for managing asset, work management and inspections data in order to retain the vast majority of asset-related information in a central repository. To meet the specific demands of pavement analysis, SDOT maintains primary paving data in its StreetSaver Pavement Management System with links to Hansen. Likewise, SDOT maintains bridge data in a bridge-specific database (BridgeWorks). The Department maintains spatial information about the location of each asset in ESRI ArcGIS and is available for viewing and analysis in Hansen’s MapDrawer viewer and ESRI products. Reports are available through Business Objects (SAP) Crystal Reports and other business interface reporting applications. The database platform is in Oracle 10g. The central data repository has enforced standardization in data management across the department and improves the quality of transportation system service delivery.
Asset Data Maintenance
Asset data stewards are responsible for the completeness and quality of their asset data. However, in recent years the department has experienced a high activity of asset changes due to new capital projects and private developments. This decentralized model of asset data maintenance causes inconsistent asset data quantity and quality, whereby many assets are not properly on-boarded into Hansen. The department is evaluating various models of asset on-boarding and data maintenance improvements for implementation.
SDOT’s Asset Management program has established standards for the maintained asset data to ensure that information is consistent across all assets. Standard data includes asset status, condition information, ownership, maintenance responsibility, and location information. In addition to standard data, we maintain attribute information including material, color, size, category, and warranty information specific assets.
As of December 2015, SDOT is able to maintain the following asset inventories in the Asset Management database:
Air Raid Siren Tower Irrigation Systems Sign Assemblies Areaway Street Walls* Kiosks Speed Cushions Beacons Landscaped Complexes Speed Dots Bicycle Racks Marked Crosswalks Speed Humps Bridges* Median Islands Stairways* Bridge Hydrant Vaults Network Hubs Street Furnishings Camera Assemblies Pavement* Traffic Circles Chicane Pay Station Locations Traffic Signals Crash Cushions Radar Speed Signs Trails Counters Retaining Walls* Trees Dynamic Message Signs Shoreline Street Ends Tunnel Guardrails Sidewalks
The assets marked with an asterisk (*) have additional data maintained in other data systems.
2015 Status and Condition Report – Introduction | 18
Asset Maintenance History
SDOT uses Hansen (Infor) 8.3 for work management to standardize recording and tracking of crew work across the department. We record work orders against either a specific asset, or a type of asset, allowing asset level costs to be evaluated. As we enter work orders against assets, we create a picture of the accumulated lifecycle maintenance history of each asset.
Using the historical information in the system, asset owners are able to create replacement programs or preventive maintenance programs. With the combination of historical work management data and long-term operational forecasting, SDOT will be able to establish asset-based funding needs for these programs.
Systems Integration
Hansen (Infor) software allows SDOT to integrate information on assets, work orders, inspections, and collisions in a single data system. Users are able to view a block or intersection along with the assets along the block, inspections, open or recent work orders, and collision history. Asset owners can record observations about their assets and the system is able to calculate a condition rating based on these results. Tracking observed changes in condition over time provides additional inputs into data-driven Asset Management program decisions. SDOT continues to work on external system interfaces that tie the system to the City of Seattle’s financial and human resources databases to minimize duplication of data entry. We utilize GIS systems to visually integrate and display information on a map, providing system users with a more complete picture of any location in the City. We perform analysis of GIS map representations of assets increasingly for long-term planning purposes as well as operational planning.
Future Opportunities
SDOT is assessing the benefits of adding a mobile component to its systems, allowing access to work orders, and asset inspection information from the field. In the future, the department will be evaluating customer request tracking, allowing customer interactions to be tracked from initiation through investigation, assessment of impact on infrastructure, work performed, and notification back to the customer. Currently, the City of Seattle uses mobile and web applications that do not communicate with Hansen and require staff interface to create work orders.
STATUS AND CONDITION OF SDOT INFRASTRUCTURE ASSETS
Transportation infrastructure owned by SDOT includes hundreds of distinct physical component types. SDOT’s Asset Hierarchy (see Appendix B) h identifies 47 different “level 1” assets. A level 1 asset represents the level to which we manage an asset. We assign asset ownership for each level 1 asset by category. SDOT staff members who serve as asset owners are the primary sources of information and knowledge about capital investment needs, preservation, maintenance and operation of the asset. However, the department recognizes that asset-based decision-making requires a team of engineers, financial advisors, operations staff, data maintainers, and executives.
Level 1 assets that share a common purpose or function are grouped into asset classes. The status and condition of the level 1 assets are presented in the hierarchy in alphabetical order by asset class.
2015 Status and Condition Report – Introduction | 19

A condition rating has been specified for each of the level 1 assets where known. This condition rating is a consistent measure used for all SDOT assets. An “Unknown” (UNK) asset condition rating means the condition of the asset is not available. We generally rate assets as UNK if the time period between periodic inspections is long, or the asset is managed on a customer-request basis and no requests have been received for the asset that necessitated an on-site inspection.
Collecting condition data can be expensive and SDOT must determine where to best expend limited resources. The department may decide not to collect condition ratings on some assets because they are short lived, relatively inexpensive to replace, or present a limited risk exposure to the department.
While we consistently use condition rating for all SDOT assets, evaluation criteria against which the asset is rated are different for each asset. Some assets, like pavement, traffic signals, and bridges, require a more robust range of condition assessment ratings that generally range from 0 to 100. Condition criteria methodologies are available in Appendix C.
Asset Condition Ratings
Data confidence levels consider availability of asset condition data, accuracy of inventory counts, and presence of critical attribute data.
In the discussion of asset useful life, statements about cost of routine maintenance over the life of the asset represent maintaining the asset through an optimized investment strategy that addresses risk, condition, and available funding.
The discussion of maintenance approaches includes references to repair activity or work performed to address a safety concern. The term “safety” means prioritizing maintenance work against limited funding and is not an assessment of defects that would result in judging an asset as unsafe or dangerous.
Financial figures used in this document are in 2015 dollars unless otherwise noted. The funding requirements discussed in this section are estimates based on available financial information about each asset. This report does not cover a rigorous reconciliation to budget and financial information primarily because current financial systems, with few exceptions, do not track budgets or costs by asset. We present unmet funding needs in this report for informational purposes, rather than as a recommendation.
Good Asset is “as new” or requires only routine maintenance to keep it in service
Fair Asset requires major rehabilitation to keep it in service
Poor Asset should be replaced
Unknown Asset condition is unknown and may pose a significant risk
2015 Status and Condition Report – Introduction | 20

Asset Class – Bicycle and Pedestrian System Section 1
The Bicycle and Pedestrian System asset class serves pedestrians and bicyclists and encourages walking and bicycling for transportation and recreation. It includes the following assets:
Assets in the Bicycle & Pedestrian System have ownership responsibilities distributed across multiple divisions. For some of these assets, the general maintenance budget may include assets from other classes.
$0.0M
$5.0M
$10.0M
$15.0M
$20.0M
$25.0M
$30.0M
$35.0M
$40.0M
$45.0M
$50.0M
2015 2020 2025 2030
2015-2034 (20-Year) Operational Cost Forecast for Bike & Ped System (2015 Dollars)
Trails Rehab/Replacement
Stairway Rehab/Replacement
Curb Ramps (New Growth)
Curb Ramps Rehab/Replacement
Curb Rehab/Replacement
Sidewalk Rehab/Replacement
Marked Crosswalks
**Pedestrian Master Plan Spending (NewGrowth)
*Bicycle Master Plan Spending (New Growth)
Asset Replacement Value
Condition Data
Confidence
Good
Fair
Poor
Unk Bicycle Racks $2,197,825 97.8% 1.2% 0.5% 0.5% High Kiosks $1,125,000 - - - 100% Low Marked Crosswalks $5,550,000 63.0% 15.8% 19.0% 2.2% Medium-High Sidewalks $5,279,859,118 23.9% 5.6% 1.0% 69.6% Medium Stairways $63,618,000 61% 28% 11% - Medium-High Street Furnishings Unknown - - - 100% Low Trails $96,279,000 - - - 100% Medium
Total: $5.449 Bill ion
2015 Status and Condition Report – Bicycle and Pedestrian System | 21

Performance Measures 2014 Planned 2014 Results 2015 Planned
Number of Marked Crosswalks remarked 500 512 500
Number of Bicycle Rack Spaces installed (Supports Bicycle Master Plan performance measure goal of 6,000 spaces installed between 2007 and 2017)
500 515 500
Percent of sidewalk repair requests responded to within 5 business days of notification
New
Measure 80%
Number of new Sidewalks block faces built 7 7 10
Number of Sidewalks block faces repaired 25 25 25
Number of Stairways rehabilitated 3 7 5
Number of trail miles inspected 40 40 40
BICYCLE RACKS Bicycle parking supports the bicycle network by establishing an end-of-trip facility. Providing an adequate supply of convenient bicycle parking is an important tool to increase cycling. Traffic Signs and Markings Crews install and maintain bicycle racks .
Inventory Status and Anticipated Annual Growth
In 2009, the Traffic Operations group conducted a comprehensive field inventory of bicycle racks. The survey focused on known locations of racks, as well as urban villages throughout the city. The
department obtained inventory and condition for2,500 racks and uploaded the information into the asset data repository. Staff in the Bicycle Program maintain the inventory.
Asset Inventory
Count Data
Confidence Replacement
Value
Useful Life
(Years)
System Replacement
Value
Anticipated Annual Growth
Bike Racks
3305 racks/ 8786 spaces
Medium-High
$380 to $950 20 $2,197,825 250 racks / 500 spaces*
*most racks provide two bike parking spaces, except corrals, which vary in size.
Bicycle Rack Converted from a Meter Pole
2015 Status and Condition Report – Bicycle and Pedestrian System | 22

Life Cycle Costs, Maintenance Approach and Funding
Routine maintenance of a bicycle rack requires one (1) bolt-reset over the twenty (20) year life which typically costs approximately $330. In higher traffic areas, racks are more susceptible to damage and
collisions. The Bicycle Program continues to evaluate full life cycle and programmed maintenance needs, especially for new rack styles like on-street corrals (pictured below.)
We generally perform bicycle rack maintenance in response to customer requests or accident reports. We have not tracked maintenance costs independently for this asset and have been included in a general maintenance budget; hence, life cycle costs are not available.
In 2014, we maintained, replaced, and installed 262 new bicycle racks, or 515 spaces. For 2015, Traffic Operations plans to install 500 new bicycle parking spaces.
KIOSKS Kiosks are small, non-dynamic physical structures in the right-of-way that provide information and way-finding.
Inventory Status and Anticipated Annual Growth
Asset Inventory
Count Data
Confidence Replacement
Value
Useful Life
(Years)
System Replacement
Value
Anticipated Annual Growth
Way-finding Kiosks 15 Medium $5,000 – 10,000
20 $1,112,500 Unknown
Lapsed Permit Kiosks in ROW
135 * estimate
Low Unknown
Total 150* Medium-
Low $1,112,500
*Some types of Kiosks in the right-of-way may have lapsed permits, and thus unknown ownership and responsibility. An example is the kiosk on 5P
thP Avenue and Seneca. To better identify risks associated with these assets, the department should undertake a review of
existing Street Use Permits to develop a management plan. These counts exclude Seattle Parks Department owned kiosks added under the Feet First effort.
Corral Type Bicycle Rack
2015 Status and Condition Report – Bicycle and Pedestrian System | 23
Life Cycle Costs, Maintenance Approach and Funding
Maintenance costs have been included in a general maintenance budget, and specific costs for maintenance of kiosks are not available. Kiosk maintenance includes: updating the maps with new graphics, printing, and installing new maps; replacing glass; graffiti removal; base repair; and relocation due to construction (on request).
SDOT owns and maintains multiple colors of Kiosks. Colors typically represent the time period or project associated with installation. The department can develop a replacement and maintenance strategy
based on Kiosk color and identification of associated type failures. Colors are an easy reference point for the style of kiosk. A full inventory of kiosks is required to establish a maintenance and replacement program. In some cases, the department will consider kiosk removal. As part of this, SDOT should determine and refine a kiosk policy.
There is no dedicated funding for this asset. In 2014, we spent approximately $20,000 on maintenance, replacement, and installation of way-finding signs and street furniture maintenance.
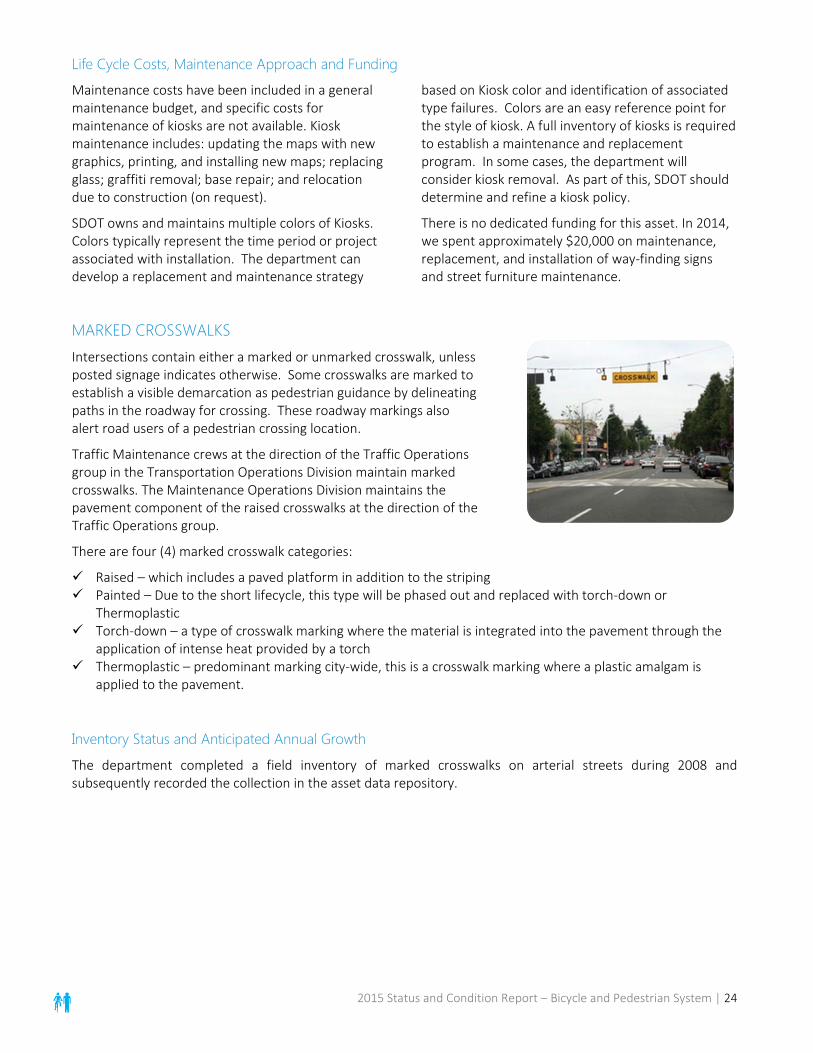
MARKED CROSSWALKS Intersections contain either a marked or unmarked crosswalk, unless posted signage indicates otherwise. Some crosswalks are marked to establish a visible demarcation as pedestrian guidance by delineating paths in the roadway for crossing. These roadway markings also alert road users of a pedestrian crossing location.
Traffic Maintenance crews at the direction of the Traffic Operations group in the Transportation Operations Division maintain marked crosswalks. The Maintenance Operations Division maintains the pavement component of the raised crosswalks at the direction of the Traffic Operations group.
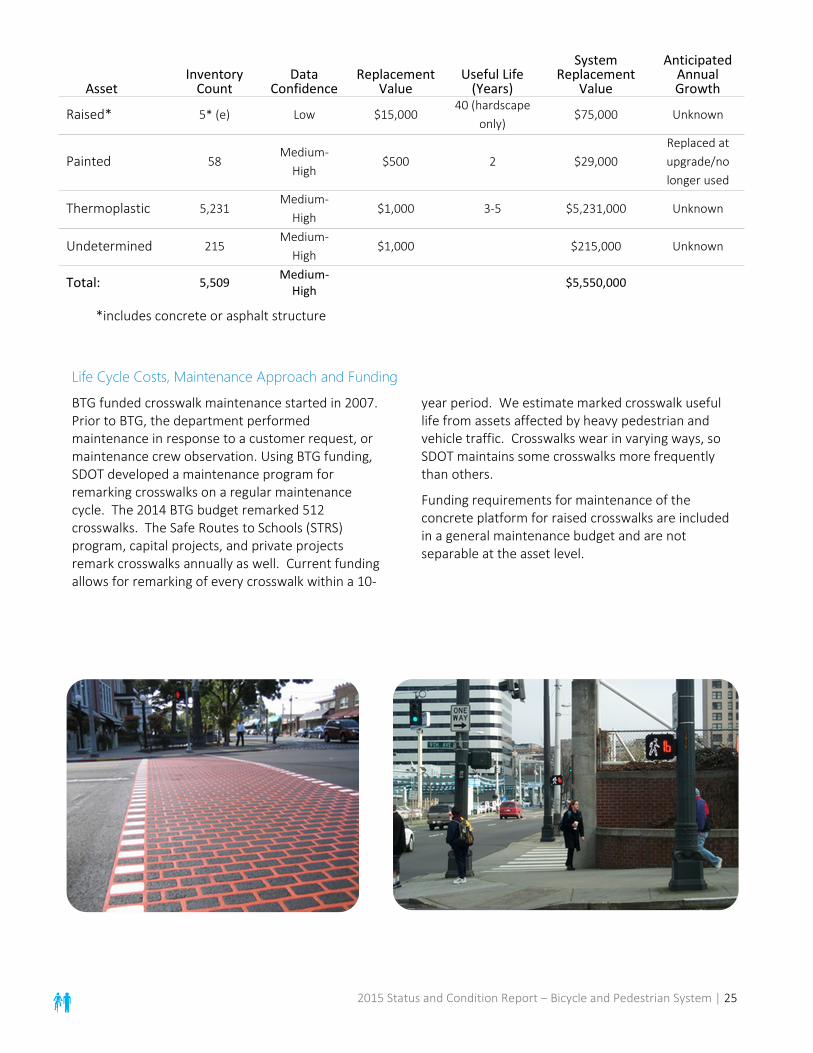
There are four (4) marked crosswalk categories:
Raised – which includes a paved platform in addition to the striping Painted – Due to the short lifecycle, this type will be phased out and replaced with torch-down or
Thermoplastic Torch-down – a type of crosswalk marking where the material is integrated into the pavement through the
application of intense heat provided by a torch Thermoplastic – predominant marking city-wide, this is a crosswalk marking where a plastic amalgam is
applied to the pavement.
Inventory Status and Anticipated Annual Growth
The department completed a field inventory of marked crosswalks on arterial streets during 2008 and subsequently recorded the collection in the asset data repository.
2015 Status and Condition Report – Bicycle and Pedestrian System | 24
Asset Inventory
Count Data
Confidence Replacement
Value Useful Life
(Years)
System Replacement
Value
Anticipated Annual Growth
Raised* 5* (e) Low $15,000 40 (hardscape
only) $75,000 Unknown
Painted 58 Medium-
High $500 2 $29,000
Replaced at upgrade/no longer used
Thermoplastic 5,231 Medium-
High $1,000 3-5 $5,231,000 Unknown
Undetermined 215 Medium-
High $1,000 $215,000 Unknown
Total: 5,509 Medium-High $5,550,000
*includes concrete or asphalt structure
Life Cycle Costs, Maintenance Approach and Funding
BTG funded crosswalk maintenance started in 2007. Prior to BTG, the department performed maintenance in response to a customer request, or maintenance crew observation. Using BTG funding, SDOT developed a maintenance program for remarking crosswalks on a regular maintenance cycle. The 2014 BTG budget remarked 512 crosswalks. The Safe Routes to Schools (STRS) program, capital projects, and private projects remark crosswalks annually as well. Current funding allows for remarking of every crosswalk within a 10-
year period. We estimate marked crosswalk useful life from assets affected by heavy pedestrian and vehicle traffic. Crosswalks wear in varying ways, so SDOT maintains some crosswalks more frequently than others.
Funding requirements for maintenance of the concrete platform for raised crosswalks are included in a general maintenance budget and are not separable at the asset level.
2015 Status and Condition Report – Bicycle and Pedestrian System | 25

SIDEWALK SYSTEM The sidewalk system consists of paved walkways (concrete, asphalt, and pavers), a few soft-surface pathways, curbs, filler areas, curb bulbs, and curb ramps. Curbs, if present, separate the pedestrian area from the street and also provide a drainage function. The filler area is between the sidewalk and the roadway. The sidewalk system may be improved or unimproved, and is the zone occupied by the street shoulder, planting strip, trees, light poles, pay stations, and other street furniture. Curb bulbs are extensions of the sidewalk or curb line into the parking lane that physically narrow the roadway, thereby reducing pedestrian crossing distance. Curb bulbs improve pedestrian safety by increasing the amount of protected, dedicated space for walking and encourage walking as a mode of transportation.
Curb ramps provide access to the sidewalk system at street crossings and are usually located at intersections. Curb ramps may also be located mid-block. Some sidewalks in the existing sidewalk system do not have curb ramps, and without a curb ramp, the Americans with Disabilities Act (ADA) may not consider a sidewalk fully accessible.
Most sidewalks constructed in Seattle occurred at the time each area was originally subdivided, and paid for through Local Improvement Districts (LIDs), along with each development’s roads, sewers and water service. Not all developers chose
to include sidewalks. Areas annexed to the city in the 1950s developed sidewalks under the standards of unincorporated King County, which did not require sidewalks.
The land use code requires public and private development projects to build new sidewalks. SDOT’s Pedestrian Program also installs new sidewalks.
The Seattle Municipal Code, 15.72 requires that adjacent property owners keep their sidewalks in good repair and safe for public travel. This means keeping the sidewalk clear from vegetation overgrowth, snow and ice accumulation, as well as
making repairs to the sidewalks when damaged.
SDOT is responsible for repairing sidewalk when adjacent to an SDOT owned property, or damaged by SDOT (SDOT owned trees). Curb repairs are the responsibility of the city. The department shares responsibility for the sidewalk system between the Project Development Division, which plans, designs and builds new sidewalks, and the Maintenance Operations Division, which is responsible for maintenance of the sidewalk system.
Inventory Status and Anticipated Annual Growth
The Hansen database maintains the sidewalk system physical inventory. In 2008, the department conducted a partial condition survey of sidewalks in several locations throughout the city, focusing on areas of known higher pedestrian volume such as the Urban Villages. Observable signs of distress or uplifts in the sidewalk surfaces determine condition ratings. BTG provided the funding to build 7-20 new block faces of sidewalk per year between 2007 and 2015. Street Use permits and SDOT capital projects build or replace additional sidewalks.
The cost of new sidewalk does not include ROW acquisition, substantial excavation, or retaining wall construction. It also assumes minimal drainage costs. Any one of these factors can substantially increase the cost of new sidewalk. SDOT crews complete temporary repairs to minimize safety risks and maintain accessibility by placing asphalt shims between sidewalk sections or grinding to achieve a more level walking surface. The department spends up to $700,000 per year on this type of routine maintenance for all sidewalks.
2015 Status and Condition Report – Bicycle and Pedestrian System | 26

Asset Inventory
Count Data
Confidence Replacement
Value Useful Life
(Years)
System Replacement
Value
Anticipated Annual Growth
Sidewalk/ Walkway
68,528,900 square feet
Medium $40 100 $2,741,156,008 26,400
linear feet
Curbs 12,368,283 linear feet
Medium $170 100 $2,102,608,110
3,300 linear feet
lf
Curb Ramps 29,073 unit
count* Medium $15,000 $436,095,000 265
Curb Bulb Unknown Low $40 100 Unknown Unknown
Total 33,373 block faces Medium $5,279,859,118
*Data quality issues occurred with the initial 2007 sidewalk/curb ramp inventory and subsequent additions of curb ramps to the database from capital projects, private developments and utility projects. The initial inventory defined two types of ramps: 1) one ramp serving two sidewalks is a diagonal ramp and both sidewalk records record it in Hansen and 2) a ramp serving a single sidewalk is a directional ramp. This caused inconsistent quantity reporting and added approximately 7,000 of duplicated ramps to the inventory totals. Furthermore, mapping analysis identified multiple records of both diagonal and directional ramps demonstrating that the data maintainers inconsistently apply data rules. Furthermore, many constructed curb ramps are not in the database due to availability of as-built plans and/or data maintenance resources.
In 2015, SDOT hired a consultant to perform an ADA self-evaluation field survey of existing curb ramps. Data from this effort will support the Pedestrian Master Plan and improve data quality for compliance with Department of Justice and Federal Highway Administration guidance.
Life Cycle Costs, Maintenance Approach and Funding
SDOT currently provides two (2) basic types of maintenance for its sidewalks:
Preliminary repair Permanent repair
Preliminary repair typically involves a site visit where maintenance staff may paint defects with white paint, place a barricade, and/or initiate a preliminary repair. SDOT “Pothole Ranger” crews make the preliminary repairs, usually by applying an asphalt patch to correct faults, settlement or other distress. If crews cannot correct the defect with a spot repair, they may close or evaluate the sidewalk as a candidate for permanent repair.
The intent of permanent repairs is to extend the useful life of the sidewalk surface by 40-60 years, although sidewalks adjacent to street trees may require much more frequent maintenance.
Three primary sources trigger repairs:
Customer Request Claims Field observations
In order for the SDOT sidewalk repair program to consider a damaged sidewalk for repair it must:
Be adjacent to City-owned property, or City owned trees must be causing the damage.
Program staff forward damage caused by other City agencies or public utilities to the appropriate agency for repair.
If the location meets the above criteria, then the Sidewalk Repair Program repairs selected locations based on the following criteria:
1. Leveraging opportunities with other capital projects as part of SDOT‘s commitment to Complete Streets principles as expressed and adopted in Ordinance 122386
2015 Status and Condition Report – Bicycle and Pedestrian System | 27

2. Within an urban village 3. Adjacent to an arterial street 4. High priority project areas as identified in the Pedestrian Master Plan 5. Within three blocks of a community or healthcare facility such as a school, park, library, clinic, hospital, or
senior housing 6. On a block with a transit stop 7. Geographic and social justice distribution 8. Constructability and cost
The above criterion intends to ensure that the repairs will benefit a significant number of pedestrians, and the greatest number of users. The greater the number of selection criteria a specific location meets, the more likely the program will prioritize repair at that location. However, the City has a significant backlog of potential repair locations and SDOT is unable to repair many of the identified locations that meet all the criteria.
Program staff refers sidewalk damage associated with private property to the Street Use group in the Street Use and Urban Forestry Division for action. The Department of Planning & Development (DPD) typically handles notices of vegetation overgrowth from private property that impacts the sidewalk, although Maintenance Operations crews may abate immediate concerns.
BTG funding has provided the ability to administer a modest, permanent sidewalk repair program that allows rehabilitation of approximately 12-16 block equivalents (2,000 square feet = 1 block equivalent) of sidewalk annually. Preliminary repairs (shims) on 100-300 block equivalents are extending the reach of SDOT’s sidewalk repair efforts.
Sidewalks are key building blocks of an effective pedestrian network. Approximately seventy-four percent of Seattle’s block faces (one side of one block) have sidewalks, for a total of more than 33,600 existing block faces with sidewalks. This leaves 11,600 block faces where there is not a sidewalk. The 2009 Pedestrian Master Plan (PMP) identified about 10 percent of these block faces (1,200 block faces) as the highest priority for building new sidewalks. The department is currently updating the PMP.
The Sidewalk Development Program uses prioritization criteria established in the PMP to determine new sidewalk installations. The PMP uses a data-driven prioritization process to identify high priority locations. Each block receives a score that reflects the physical characteristics of that block, including traffic speeds, volumes and collision data. A second scoring process identifies high priority areas in the city by evaluating potential pedestrian demand, socioeconomic and health equity, and corridor function.
Funding for new sidewalks in Seattle currently comes from a variety of sources, including:
Sidewalk Development Program Safe Routes to School Program Neighborhood Street Fund Capital projects (e.g. Greenwood Avenue North) Private development Other agencies
Projects funded through the Safe Routes to School program are prioritized using similar criteria. The Neighborhood Street Fund projects are prioritized by the district councils and selected by the Bridging the Gap oversight committee.
2015 Status and Condition Report – Bicycle and Pedestrian System | 28

Maintenance and Operations
The 2015 Maintenance Operations budget for sidewalk repair is $2.0 million. Approximately $700,000 of this total maintenance funding is for preliminary repairs. The division uses the remaining $1.36 million for permanent repair, which will fund repair of less than 0.1% of the total sidewalk system.
Where full condition information is not be available, based on the 100-year life cycle of sidewalks, an estimated 2% of the sidewalk system, including curbs,
filler, and curb ramps, should be permanently repaired or replaced annually.
We estimate new sidewalks constructed by SDOT, developers and capital projects will require additional funding for maintenance and operations of approximately $5,700 per year. While initially a modest amount, it is a compounded cost for each year and factored into the long-term cost of routine maintenance and operations.
STAIRWAYS Due to the many hills throughout Seattle, there are numerous locations where it becomes too steep for a street or sidewalk. The city built stairways to maintain the connection between adjacent neighborhoods and to provide an interconnected network of sidewalks. Stairways encourage walking and provide access to public transportation. Some stairways include pedestrian viewing platforms. These structural decks provide space for pedestrians to view the city and its surroundings away from vehicular traffic.
The Roadway Structures group in the Capital Projects and Roadway Structures Division maintains stairways.
Inventory Status and Anticipated Annual Growth
The Structures database has maintained the inventory of stairways in since 1994. Since 2012, we maintained has the stairway inventory in the Hansen central data repository for work order creation.
SDOT conducts periodic inspections of stairways including emergency response to an incident or
customer request. Funding is needs to establish a regular, 7-year cycle of inspections. Inspectors assessed more than 50% of stairways for condition within the last 3 years. We record condition information in the Hansen system.
Asset Inventory
Count Data
Confidence Replacement
Value Useful Life
(Years)
System Replacement
Value
Anticipated Annual Growth
Stairways 36,353 lf
consisting of 509 units
Medium-High
$1,750 75 (Concrete)
40 (Wood) $63,618,000 0-5 per year
2015 Status and Condition Report – Bicycle and Pedestrian System | 29
Life Cycle Costs, Maintenance Approach and Funding
Rehabilitation of a stairway in poor condition costs $10,000-$50,000. A stairway that degrades to poor condition has a life expectancy of less than fifteen (15) years and goes on the replacement list.
Crews repair stairways on a priority basis within the available funding according to the criteria in the following table.
Priority Classification Maintenance Response
Emergency Condition warrants immediate attention
High Maintenance should be scheduled in the work plan for attention in the next six (6) months
Medium Schedule the maintenance work within next 1-3 years
Note Schedule as priority long-term maintenance
Routine Schedule as routine long-term maintenance
Low Monitor the condition of the deficiency
The department allocated the 2015 maintenance budget according to the priorities above and for rehabilitation of three to five stairways from poor to good condition. Given the estimated 55 stairways in poor condition, it would take 11-18 years to rehabilitate all poor stairways. Roadway Structures estimates a cost of approximately $1,500/linear foot to rehabilitate a stairway. At an average of 75 linear feet per stairway, a onetime cost to rehabilitate all poor condition stairways is therefore $6.18 million. If we rehabilitated an average of ten (10) stairways each year, an allocation of $618,000/year is required. At this funding rate the SDOT would eliminate poor condition stairways within ten years. We calculated this funding amount using averages, and individual stairway projects in any one year will vary. However, at some point the total linear feet of stairway in fair
or poor condition will need to be rehabilitated, and this funding requirement represents an average amount of annual funding that must be sustained over a series of years to accomplish the rehabilitation.
Because the rate of deterioration of aging stairways exceeds the rate of rehabilitation (six stairways of average length per year), the backlog of stairways rated in poor condition will persist. Roadway Structures engineers estimate that 5% of the stairways rated as fair condition will deteriorate to poor condition each year, and that 3% will deteriorate from good to fair condition in that same time period.
STREET FURNISHINGS Street Furnishings include rails, benches, chairs, tables, and walls in the right-of-way and typically come from capital projects and private developments. An inventory of street furnishings was unavailable for this report. Maintenance costs have been included in a general maintenance budget, and specific costs for maintenance of street furnishings are not available.
2015 Status and Condition Report – Bicycle and Pedestrian System | 30

TRAILS SDOT multi-use trails are off-road paved paths. Trails encourage walking and biking, as well as other forms of recreational transportation, such as rollerblading. These trails provide important connections to the sidewalk network, greenways, urban centers, and to the region. Primarily SDOT, Parks and the Port of Seattle depending on various agreements, maintain trails. Maintenance crews perform minor trail maintenance.
Under the City’s Bicycle Master Plan, SDOT is developing a multi-use trails upgrade and maintenance plan. This plan assesses existing multi-use trail conditions, provides recommendations to improve the multi-use trail environment, and develops multi-use trail capacity studies to evaluate trail expansion needs, crossing improvements, maintenance agreements, and public outreach.
Inventory Status and Anticipated Annual Growth
Trail reconstruction costs do not include construction of other structures, such as bridges or retaining walls, required to support the asset and continuous access
over Seattle’s topography. The Trails Upgrade Plan, due January 2016, includes maintenance cost estimates.
Asset Inventory
Count Data
Confidence Replacement
Value Useful Life
(Years)
System Replacement
Value
Anticipated Annual Growth
Trail 40.2 lane
miles Medium $2,395,000
20 (Asphalt) 10 (Gravel)
$96,279,000 0.5 to 1 mile
Life Cycle Costs, Maintenance Approach and Funding
Prior to BTG funding, crews performed maintenance only in response to customer request. BTG has allowed Traffic Operations to complete:
Spot repair of pavement, drainage, bollards, and curb ramps
Sign and marking maintenance Mowing, trimming, and sweeping
Prior to BTG, the department did not fund trail maintenance separately. We completed trail spot repair as part of the overall budget to maintain pavement. Maintenance costs have not been tracked independently for this asset and have been included in a general maintenance budget for bicycle facility improvements; hence, life cycle costs are not available. Multiple capital and interagency projects funded recent trail upgrades.
2015 Status and Condition Report – Bicycle and Pedestrian System | 31

Asset Class – Bridges and Structures Section 2
The Bridges and Structures asset class consists of the transportation structures that are associated with the street network and a few one-of-a-kind roadway structures. The Roadway Structures group in the Capital Projects and Roadway Structures (CPRS) Division maintains all roadway structures.
2015 - 2064 (50-Year) Unconstrained Cost Forecast for Bridges & Structures (2015 Dollars)
*Bridge Replacement forecast does not include full rebuild of the Magnolia Bridge, estimated to cost $350 million in 2015
$0.0M
$20.0M
$40.0M
$60.0M
$80.0M
$100.0M
$120.0M
$140.0M
2015 2020 2025 2030 2035 2040 2045 2050 2055 2060
North Sea Wall Replacement
Bridges Replacement Capital
Bridges New Capital Growth
Bridges O&M
Fill-In Existing Areaway Street Walls on100-Year Cycle
Replace Existing Areaway Street WallsIn-Kind on 100-Year Cycle
Replace Existing Retaining Walls (100-Year Cycle)
Replace New Added Retaining Walls(100-Year Cycle)
Asset Replacement
Value
Condition Data
Confidence
Good
Fair
Poor Unk Air Raid Siren Tower $500,000 - 100% - - High Areaway Street Walls $218,000,000 11% 58% 12% 19% Low Bridges $4,112,390,000 31% 52% 17% - High Bridge Hydrant Vaults $650,000 100% - - - High Elevator $1,500,000 100% - - - High Retaining Walls $903,137,000 42% 36% 19% 3% Medium Tunnels $738,000 - 100% - - High
Total: $5.237 Bill ion
2015 Status and Condition Report – Bridges and Structures | 32

Performance Measures 2014 Planned 2014 Results 2015 Planned
Bridge repair requests completed 190 366 253
Inspections performed on NBI (National Bridge Institute) Bridges 95 95 124
Inspections performed on Areaway Street Walls 11 11 13
Inspections performed on Retaining Walls 116 116 116
AIR RAID SIREN TOWER The Seattle Engineering Department, the precursor to SDOT, built the air raid siren tower in 1957 with the Department of Civil Defense as a response to the threats of the Cold War. Recognized as an historical landmark, it is located in the Phinney Ridge neighborhood at the intersection of N 67th St and Phinney N. The air raid siren tower was once part of a 21-siren system throughout the Seattle area designed to alert residents in the case of a nuclear missile attack.
The department completed Emergency maintenance on the tower in 2006 and needs funding for additional maintenance. The tower is no longer in service.
AREAWAY STREET WALLS Areaways are spaces that exist under sidewalks and between the street and the adjacent building. Although there are a variety of reasons why areaways exist around Seattle, the most common case is the reconstruction and raising of street grades in the Pioneer Square area following the Great Seattle Fire of 1889. The city built street walls and filled the street area from the 1890s through the 1940s.
SDOT owns and maintains most of the areaway street walls in the city of Seattle, as well as a few of the sidewalks that are adjacent to areaway street walls and supported by them. In most cases, the areaway itself is considered private, as used by the adjacent property owner under the authority of a street use permit.
The areaway street wall provides a necessary and important support to the sidewalk, street fill and utilities.
2015 Status and Condition Report – Bridges and Structures | 33

Inventory Status and Anticipated Annual Growth
Roadway Structures has maintained an inventory of areaway street walls since 1994. We maintain the inventory in the Asset Management central data repository in Hansen. We performed physical inventories in Pioneer Square in 2000 and the International District in 2011.
During the 1930s and 40s, areaways were heavily permitted by adjacent property owners for a right-of-way usage fee. An example is the building at 3P
rdP and
Pine, where areaways exist around the entire structure. Records of the original construction of street walls are often missing. We discover new areaways during the process of new development, renovation of buildings, or when property changes hands. When this occurs, the department researches
ownership and maintenance responsibilities and adds the inventory to the system.
SDOT conducts periodic inspections of the known areaway street walls. Inspectors note areaway critical defects and contact Street Use Division staff who then contact the adjacent property owner and request repairs occur.
Much of the areaway condition assessment data is out of date and dedicated resources are not available for an established inspection cycle. Roadway Structures estimates a 3 to 5 year inspection cycle is desirable to adequately monitor condition and provide a timely response. The Move Seattle levy provides one-time funding to thoroughly assess condition for these assets in 2016 and 2017.
Asset Inventory
Count Data
Confidence Replacement
Value
Useful Life
(Years)
System Replacement
Value
Anticipated Annual Growth
Areaway Street Walls 435 each Low $500 per sf of
wall space (est. 10ft high walls)
75 $218,000,000 Growth occurs
when areaways are
discovered
Life Cycle Costs, Maintenance Approach and Funding
Sidewalks are an integral structural component of the areaway and considered in the areaway street wall condition rating. SDOT and the adjacent property owner decide maintenance responsibility on a case-by-case basis.
Roadway Structures does not have funding for a regular maintenance program for the areaway street walls. Emergency response situations may require midyear budget adjustments or new appropriations. The large number of areaways for which condition is unknown represents the largest risk for this asset. As they deteriorate, sections of the sidewalk can collapse posing a risk to the public and emergency responders. Furthermore, the impending Alaska Way Viaduct closure could move buses on city streets into the parking lane, which will impact the areaway condition with increased weight.
The city’s capital project improvement process allocates funding for areaway work, either fill or restoration, is on a case-by-case basis. SDOT
recommends establishing additional funding for a multi-year effort to acquire current condition data on all areaway street walls.
The areaway street walls are of varying construction ranging from brick to reinforced concrete. None of the street walls meet current design standards. Less than 5% of the areaway street walls have been rebuilt or replaced since initial construction. We do not know accurate condition information for many areaway street walls, current rehabilitation / replacement funding is not likely at a sustainable level given their advanced age. The heightened condition assessment program mentioned above will allow SDOT staff to better evaluate proper long-term funding in the near future.
Areaways/areaway street walls in poor condition should either be cavity filled or restored depending on historic designation. , SDOT updates and re-categorizes the asset attributes after filling an areaway.
2015 Status and Condition Report – Bridges and Structures | 34

BRIDGES Bridges are elevated structures that facilitate efficient and direct travel routes between points in Seattle’s street network disrupted by physical features or topography. Absent a bridge at such locations, travel routes would be inefficient and circuitous, if possible at all. One exception to this definition is the structural deck over water that provides a viewing platform for both pedestrians and vehicles.
Inventory Status and Anticipated Annual Growth
Asset Inventory
Count Data
Confidence Replacement
Value
Useful Life
(Years)
System Replacement
Value
Anticipated Annual Growth
Movable Vehicular Bridges
4 High
$3,000/SF 100 $282,000,000 Unknown
Non-movable Vehicular Bridges
83 High $1,300/SF 66 $3,713,000,000 14,000 SF
Pedestrian Bridges
30 High $1,300/SF 60 $122,262,000 500 SF
Total 117 High $4,117,262,000
We classify non-movable vehicular bridges for maintenance purposes based on the structural materials used in the bridge:
Steel Timber Reinforced Concrete Composite
SDOT has both sole ownership and maintenance responsibility and shares partial ownership and maintenance responsibilities for other bridges within the City of Seattle boundaries. For bridges partially owned by SDOT, the department is responsible for maintenance which is funded through the General Fund; the partner funds full replacement. SDOT performs reimbursable maintenance work on bridges belonging to other city and state departments, and performs inspections on SDOT bridges as well as privately owned bridges within the right of way. Occasionally, SDOT inspects and maintains other city department bridges on an as needed basis.
In previous editions of the Status & Condition report, SDOT identified a pier in the asset hierarchy. We consider this pier as part of the bridge inventory because SDOT inspects and manages it like a bridge. Located at the Washington Street Boat Ramp at the intersection of South Washington Street and Alaskan Way, the pier structure was built in 1920. The steel pergola is historic and is included in the preventive maintenance program that allows for painting of the steel structures (mostly bridges) to prevent their deterioration in the marine environment. This pier is currently undergoing replacement as part of the Seawall Replacement Project.
The Roadway Structures group maintains bridge inspection and asset inventory data in the Washington State Department of Transportation’s BridgeWorks database. The inventory of bridges includes all bridges where SDOT performs maintenance work. This includes bridges where SDOT has sole/partial ownership, as well as privately owned bridges in the right of way and bridges where SDOT crews perform reimbursable work. SDOT utilizes the Hansen database to track work activities on bridges and shares this data with the BridgeWorks database.
We update the bridge inventory annually after the routine bridge inspection program is completed.
2015 Status and Condition Report – Bridges and Structures | 35

While the city’s bridge inventory is largely fully built-out, SDOT occasionally builds or inherits new bridge infrastructure to operate and maintain. Since 2007, SDOT’s bridge deck square footage in the bridge inventory has increased by 8%.
During the annual bridge inspection program, SDOT inspects components of each bridge on a regular cycle:
Routine Inspection – every 1-2 years Underwater Inspection – every 5 years Fracture Critical – every 2 years Special Features – every 2 years
The department establishes an inspection schedule for each bridge, and a bridge may undergo more than one inspection in any given year if condition dictates. We conduct inspections according to federal regulations.
A bridge rated in poor condition does not imply that the bridge is unsafe for vehicular traffic. A bridge condition rating considers many factors beyond component assessments, including traffic volumes. Bridges rated in poor condition qualify for replacement funding, and the department may pursue funding, for example, when current traffic demand has grown to a level that exceeds the traffic volume for which the bridge was designed. If the condition of a bridge deteriorates below a level considered safe for the load carrying capacity, the allowable vehicle weight is restricted on that bridge. SDOT has eight (7) bridges where weight restrictions have been posted and two (2) bridges that have been closed to vehicular traffic.
Life Cycle Costs, Maintenance Approach and Funding
The useful life of a bridge depends on the structural materials and also the level of ongoing maintenance applied to the bridge. The cost of a new bridge varies considerably and is dependent on many factors, including structural materials, span, expected traffic volume, and topography. Construction costs average $650 per square foot of bridge deck area.
The lifecycle cost of routine maintenance on non-moveable bridge can range from $150,000 to $10
million depending on the size, material, and complexity of the bridge. For SDOT’s movable bridges, operational costs for 2014 are $3.6 million.
We repair bridges on a priority basis up to the level of available funding according to the criteria in the following table. Issued work orders represent routine maintenance activities and do not include major rehabilitation or replacement of major bridge components, such as expansion joints.
The Roadway Structures group responds to emergency responses within eight (8) hours of notification.
Priority Class Maintenance Response
Emergency Condition warrants immediate attention
High Maintenance should be scheduled in the work plan for attention in the next six (6) months
Medium Schedule the maintenance work within next 1-3 years
Note Schedule as priority long-term maintenance
Routine Schedule as routine long-term maintenance
Low Monitor the condition of the deficiency
2015 Status and Condition Report – Bridges and Structures | 36
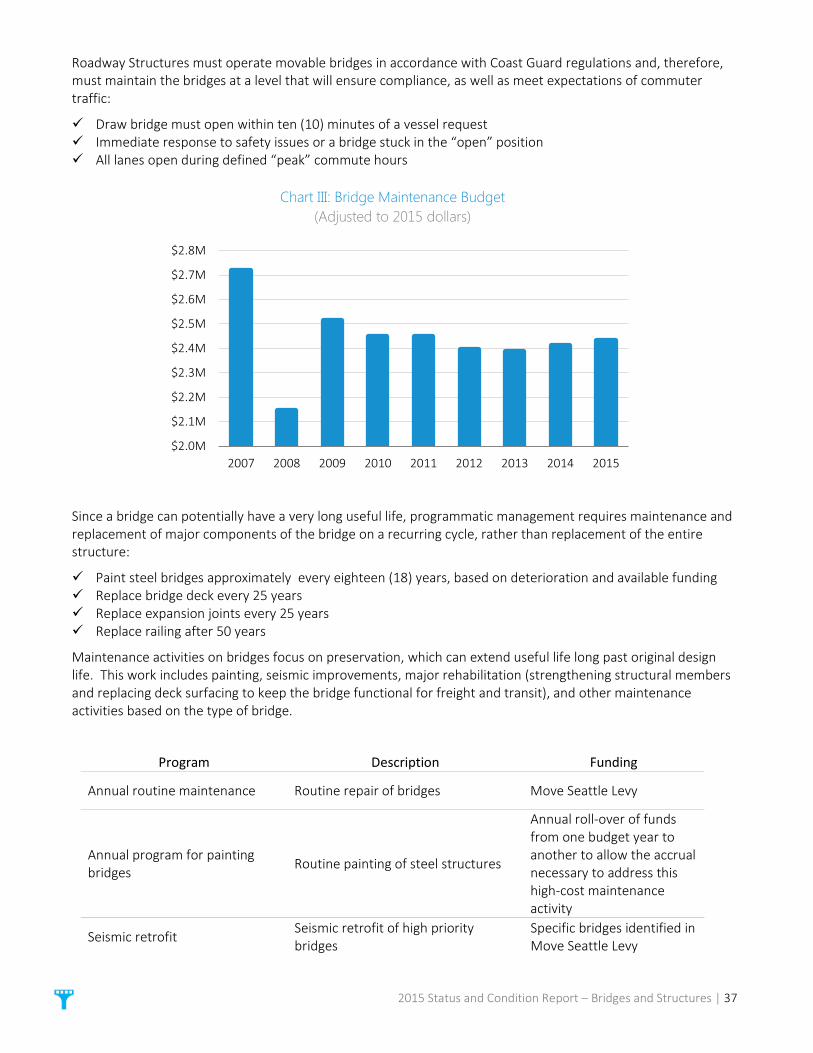
Roadway Structures must operate movable bridges in accordance with Coast Guard regulations and, therefore, must maintain the bridges at a level that will ensure compliance, as well as meet expectations of commuter traffic:
Draw bridge must open within ten (10) minutes of a vessel request Immediate response to safety issues or a bridge stuck in the “open” position All lanes open during defined “peak” commute hours
Chart III: Bridge Maintenance Budget
(Adjusted to 2015 dollars)
Since a bridge can potentially have a very long useful life, programmatic management requires maintenance and replacement of major components of the bridge on a recurring cycle, rather than replacement of the entire structure:
Paint steel bridges approximately every eighteen (18) years, based on deterioration and available funding Replace bridge deck every 25 years Replace expansion joints every 25 years Replace railing after 50 years
Maintenance activities on bridges focus on preservation, which can extend useful life long past original design life. This work includes painting, seismic improvements, major rehabilitation (strengthening structural members and replacing deck surfacing to keep the bridge functional for freight and transit), and other maintenance activities based on the type of bridge.
Program Description Funding
Annual routine maintenance Routine repair of bridges Move Seattle Levy
Annual program for painting bridges Routine painting of steel structures
Annual roll-over of funds from one budget year to another to allow the accrual necessary to address this high-cost maintenance activity
Seismic retrofit Seismic retrofit of high priority bridges
Specific bridges identified in Move Seattle Levy
$2.0M
$2.1M
$2.2M
$2.3M
$2.4M
$2.5M
$2.6M
$2.7M
$2.8M
2007 2008 2009 2010 2011 2012 2013 2014 2015
2015 Status and Condition Report – Bridges and Structures | 37
Program Description Funding
Bridge control system Replace Bridge Control System (Spokane Street Bridge due for replacement)
Currently unfunded, target replacement of 1 control system every 5 years
Deck replacement Seals the deck surface so water doesn’t affect the steel. Minimizes impact loading for joints.
Currently unfunded
Bridge Vehicle Rail Safety Program
Upgrades bridge vehicle rails standards to current AASHTO industry construction standards, which support heavier vehicle heavier and higher clearances
Currently unfunded
During BTG (2007-2015), we rehabilitated six bridges and seismically retrofitted seven. With remaining BTG funding, the department was able to design and begin construction on the “Yesler Over 4th Avenue Bridge” and design the “Fairview Bridge”.
BTG provided $450,000 per year for six years to help eliminate the backlog for the bridge maintenance program, but inflation eroded much of the buying power over the 9-year life of BTG and the number of overall defects increased. SDOT continues to focus on cost effective solutions yet the backlog is increasing. This is primarily due to:
BTG dollars remained static and are not indexed to inflation (and therefore have decreasing buying power over time), and
Bridges continue to increase in age, which in turn increases maintenance needs.
We evaluate bridges under a robust inspection program that identifies each defect and prioritizes the work. SDOT staff understands the backlog well in terms of routine maintenance. When we replace bridges, the maintenance backlog of the associated bridge is eliminated, allowing the department to focus on other defect-related work. The total current bridge defect maintenance backlog is estimated at $9.5 million. As the amount of defect-related maintenance grows with aging bridge infrastructure, current funding levels will not sustain the existing bridge transportation network. In turn, decreases in bridge infrastructure quality will likely accelerate. Comprehensive federal bridge regulations require mitigation measures for certain defective conditions, ranging from load limits to full closures in the event of a structural failure.
Since its inception Seattle has experienced periods of large cyclical growth. As a result, the City constructed infrastructure in large waves and replacement may also be required in an uneven fashion. The first generation of steel and concrete bridges is nearing the end of their design lives. In 2015, the average age of all of SDOT’s bridges is 60.7 years old. Bridges 70 years of age or older, represent $900 million in replacement value. The average age of bridges that we recently replaced is 65 years.
A Sufficiency Rating (SR) is a calculated value that indicates a bridge’s sufficiency to remain in service and determines federal funding eligibility. An SR value of 100 represents a bridge in new condition. A bridge with an SR rating of less than 80 is typically a candidate for rehabilitation and a bridge with an SR of less than 50 is a candidate for full replacement. Thirteen percent of SDOT’s bridges have an SR of less than 50 and are therefore candidates for full replacement. This cohort of bridges represents the current replacement backlog and has a combined current (2015) value of $990M. For more information on the SR ratings see the Bridge Management Program Status and Condition: http://www.seattle.gov/transportation/docs/transportation20130108_8a.pdf
At the beginning of 2015, the Roadway Structures group carried a backlog of 863 bridge-related work orders. Work orders vary in cost, but the current average is more than $5,000. As a bridge ages, there is a point at which the amount of required routine maintenance begins to rise significantly. Where rehabilitation is completed, the
2015 Status and Condition Report – Bridges and Structures | 38
amount of maintenance decreases. Both of these factors will affect the rate of increase/decrease of the backlog, and, if maintenance is deferred, the amount of maintenance will increase accordingly.
BRIDGE HYDRANT VALVES Bridge hydrant vaults are utility vaults located on bridges that house the piping and electrical systems which provide water to hydrants used by the Seattle Fire Department (SFD). Hydrant vaults are built to meet SFD guidelines for hydrant placement.
Inventory Status and Anticipated Annual Growth
Bridge hydrant vaults are located on the Klickitat Bridge, the West Seattle Swing Bridge, the West Seattle High-rise Bridge, the 1st Avenue Bridge, and
the 4th Avenue Bridge. We track the inventory of bridge hydrant vaults through bridge utility maps that show where they are located underground.
Asset Inventory
Count Data
Confidence Replacement
Value
Useful Life
(Years)
System Replacement
Value
Anticipated Annual Growth
Bridge Hydrant Vaults 13 High
$50,000 30 $650,000 None
Life Cycle Costs, Maintenance Approach and Funding
Condition is not currently recorded for bridge hydrant vaults, however, SDOT performs preventive maintenance monthly to ensure that they remain in service 98% of the time on a 24/7 basis.
We did not pursue additional information for this reporting period.
ELEVATOR SDOT owns one elevator at the Royal Brougham Bridge installed under the 519 Phase II project. The elevator provides ADA access along the pedestrian corridor due to steep grades.
Inventory Status and Anticipated Annual Growth
Asset
Inventory
Count Data
Confidence
Replacement
Value
Useful Life
(Years)
System Replacement
Value
Anticipated Annual Growth
Elevator 1 High $750,000 30 $750,000 None
Life Cycle Costs, Maintenance Approach and Funding
Roadway Structures assesses the elevator structure during annual bridge inspections. A service based contractor performs elevator maintenance and follows elevator regulations established under the Department of Planning and Development. We did not pursue additional information for this reporting period.
2015 Status and Condition Report – Bridges and Structures | 39
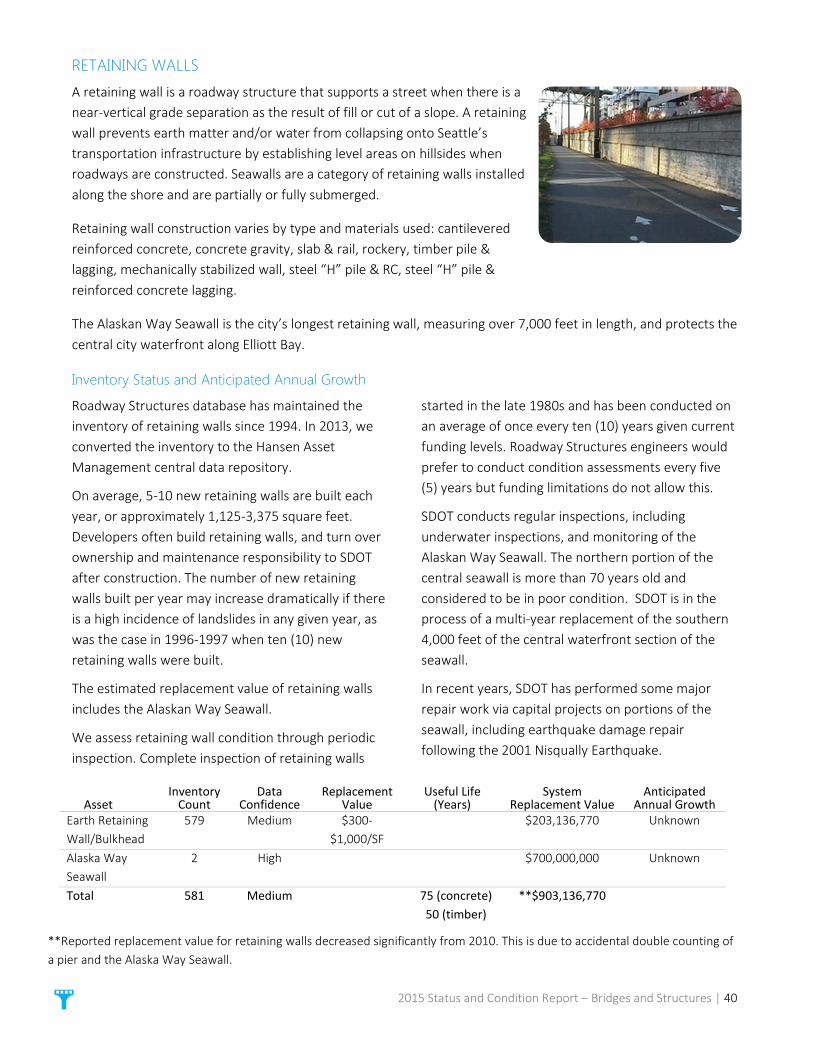
RETAINING WALLS A retaining wall is a roadway structure that supports a street when there is a near-vertical grade separation as the result of fill or cut of a slope. A retaining wall prevents earth matter and/or water from collapsing onto Seattle’s transportation infrastructure by establishing level areas on hillsides when roadways are constructed. Seawalls are a category of retaining walls installed along the shore and are partially or fully submerged.
Retaining wall construction varies by type and materials used: cantilevered reinforced concrete, concrete gravity, slab & rail, rockery, timber pile & lagging, mechanically stabilized wall, steel “H” pile & RC, steel “H” pile & reinforced concrete lagging.
The Alaskan Way Seawall is the city’s longest retaining wall, measuring over 7,000 feet in length, and protects the central city waterfront along Elliott Bay.
Inventory Status and Anticipated Annual Growth
Roadway Structures database has maintained the inventory of retaining walls since 1994. In 2013, we converted the inventory to the Hansen Asset Management central data repository.
On average, 5-10 new retaining walls are built each year, or approximately 1,125-3,375 square feet. Developers often build retaining walls, and turn over ownership and maintenance responsibility to SDOT after construction. The number of new retaining walls built per year may increase dramatically if there is a high incidence of landslides in any given year, as was the case in 1996-1997 when ten (10) new retaining walls were built.
The estimated replacement value of retaining walls includes the Alaskan Way Seawall.
We assess retaining wall condition through periodic inspection. Complete inspection of retaining walls
started in the late 1980s and has been conducted on an average of once every ten (10) years given current funding levels. Roadway Structures engineers would prefer to conduct condition assessments every five (5) years but funding limitations do not allow this.
SDOT conducts regular inspections, including underwater inspections, and monitoring of the Alaskan Way Seawall. The northern portion of the central seawall is more than 70 years old and considered to be in poor condition. SDOT is in the process of a multi-year replacement of the southern 4,000 feet of the central waterfront section of the seawall.
In recent years, SDOT has performed some major repair work via capital projects on portions of the seawall, including earthquake damage repair following the 2001 Nisqually Earthquake.
Asset Inventory
Count Data
Confidence Replacement
Value Useful Life
(Years) System
Replacement Value Anticipated
Annual Growth Earth Retaining Wall/Bulkhead
579 Medium $300-$1,000/SF
$203,136,770 Unknown
Alaska Way Seawall
2 High $700,000,000 Unknown
Total 581 Medium 75 (concrete) 50 (timber)
**$903,136,770
**Reported replacement value for retaining walls decreased significantly from 2010. This is due to accidental double counting of a pier and the Alaska Way Seawall.
2015 Status and Condition Report – Bridges and Structures | 40

Life Cycle Costs, Maintenance Approach and Funding
Retaining walls that we rate in fair condition have a life expectancy of 15-39 years and we assume a retaining wall that has degraded to poor condition has a remaining useful life of less than fifteen (15) years.
We repair retaining walls on a priority basis up to the level of available funding according to the same maintenance response criteria described in the bridge section. This funding allows Roadway Structures to inspect and maintain the retaining walls in a functional state, but does not allow establishment of a maintenance program that will ensure repair of defects that would prevent further deterioration of the retaining wall, nor to rehabilitate or replace aging retaining walls. Rehabilitation and/or replacement of
retaining walls is conducted on a case-by-case basis as part of a capital project.
The Roadway Structures group has a modest annual budget of approximately $212,000 for routine maintenance of retaining walls. This funding is static and does not cover the annual increase in square footage of new retaining walls nor replacement of poor condition retaining walls. Roadway Structures estimates approximately $1.5 million is required per year to sustainably fund replacement, not including the Northern Alaska Way Seawall.
Given adequate funding, the department strives to maintain retaining walls in a manner that there is no more than one (1) lane closure per year due to a failure in the retaining walls.
TUNNELS Tunnels provide an underground means for underpass or below grade crossings. There is only one (1) crossing underpass/tunnel owned by SDOT, and it is located under Aurora Avenue at N 79th. The pedestrian / bicycle tunnel was built in 1929 and is currently walled off and closed for public safety reasons.
Inventory Status and Anticipated Annual Growth
Asset Inventory
Count Data
Confidence Replacement
Value Useful Life
(Years)
System Replacement
Value
Anticipated Annual Growth
Tunnels 1 High $1,300/SF $738,000 Unknown
Life Cycle Costs, Maintenance Approach and Funding
Maintenance costs have been included in a general maintenance budget, and specific costs for maintenance of tunnels are not available. The Roadway Structures group maintains the records for the tunnel.
2015 Status and Condition Report – Bridges and Structures | 41
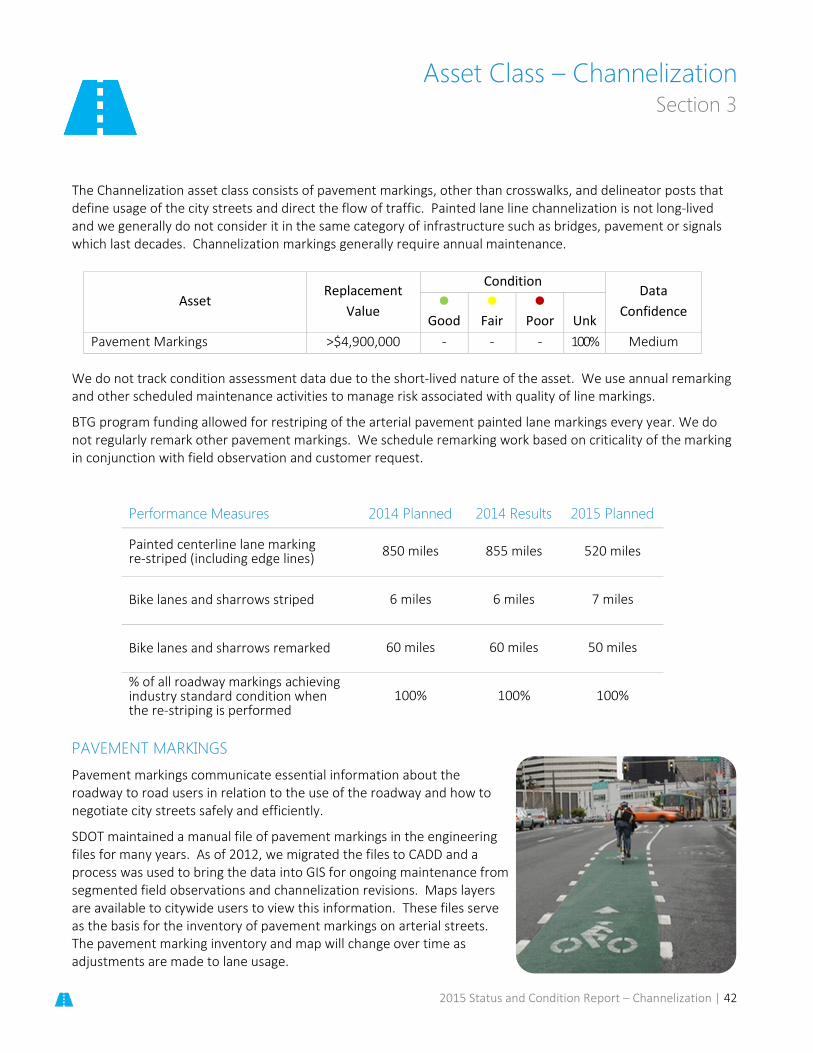
Asset Class – Channelization Section 3
The Channelization asset class consists of pavement markings, other than crosswalks, and delineator posts that define usage of the city streets and direct the flow of traffic. Painted lane line channelization is not long-lived and we generally do not consider it in the same category of infrastructure such as bridges, pavement or signals which last decades. Channelization markings generally require annual maintenance.
We do not track condition assessment data due to the short-lived nature of the asset. We use annual remarking and other scheduled maintenance activities to manage risk associated with quality of line markings.
BTG program funding allowed for restriping of the arterial pavement painted lane markings every year. We do not regularly remark other pavement markings. We schedule remarking work based on criticality of the marking in conjunction with field observation and customer request.
Performance Measures 2014 Planned 2014 Results 2015 Planned
Painted centerline lane marking re-striped (including edge lines) 850 miles 855 miles 520 miles
Bike lanes and sharrows striped 6 miles 6 miles 7 miles
Bike lanes and sharrows remarked 60 miles 60 miles 50 miles
% of all roadway markings achieving industry standard condition when the re-striping is performed
100% 100% 100%
PAVEMENT MARKINGS Pavement markings communicate essential information about the roadway to road users in relation to the use of the roadway and how to negotiate city streets safely and efficiently.
SDOT maintained a manual file of pavement markings in the engineering files for many years. As of 2012, we migrated the files to CADD and a process was used to bring the data into GIS for ongoing maintenance from segmented field observations and channelization revisions. Maps layers are available to citywide users to view this information. These files serve as the basis for the inventory of pavement markings on arterial streets. The pavement marking inventory and map will change over time as adjustments are made to lane usage.
Asset Replacement
Value
Condition Data
Confidence
Good
Fair
Poor Unk Pavement Markings >$4,900,000 - - - 100% Medium
2015 Status and Condition Report – Channelization | 42

Inventory Status and Anticipated Annual Growth
Asset Inventory
Count Data
Confidence Replacement
Value
Useful Life
(Years)
Anticipated Annual Growth
Maintenance Approach
Painted lane markings 1,726+
centerline miles
High $175 per mile of 4” line 1 UNK Re-stripe
annually
Bicycle Lane Line High $175 per mile of 4” line 3 UNK
Customer request, field observation
Legends, Bike Sharrows Medium-
low $150-250 per
legend 5-7 UNK Customer request, field observation
Legends, Channelization High $150-$200 per
legend 3-5 UNK Customer request, field observation
Hatchings (also called painted barrier areas) Low UNK
Customer request, field observation
Stop Bars Low $250 3-5 UNK Customer request, field observation
Delineator Posts Low Customer request, field observation
Parking space delineators (typically no longer maintained)
Low Customer request, field observation
Raised pavement markings (“buttons”) Low
Customer request, field observation
Curb markings (not currently marked due to budget constraints)
Low Customer request, field observation
Total >$4,900,000 million estimated
Life Cycle Costs, Maintenance Approach and Funding
We maintain legends and stop lines, typically thermoplastic material, when they deteriorate over a 3-5 year period, depending on traffic volumes. Channelization design may include perpendicular or angled line hatching to further delineate traffic behaviors. This type of channelization is labor intensive to install and remark. Line hatching is a low maintenance priority because it requires hand applied equipment rather than traditional vehicle equipment. Lane use markers may endure indefinitely, as long as they are not impacted by snow plow operations. We often place delineator posts
adjacent to traffic flow and are subject to vehicle impact.
In some situations, channelization is re-engineered to support multi-modal transportation, reduce collisional potential, and/or address safety concerns. For an example of a project involving remarking see the Dexter Ave N Safety Improvements Project or the 23rd Avenue Corridor Improvements Project. Also, SDOT evaluates existing marking patterns for revision as roadways undergo new development, capital project improvements, and overlay maintenance.
2015 Status and Condition Report – Channelization | 43

The Traffic Signs and Markings group in the Transportation Operations Division maintains pavement markings.
We fund annual re-striping from the maintenance budget, and capital improvement projects often construct new layouts. In 2014, Traffic Operations budgeted $1.54 million for curb and pavement markings. Current funding is considered inadequate to meet all performance targets for arterials, and non-arterials, to adequately maintain lane markings, symbols, bike lanes, and sharrows, and tuff posts - in addition to addressing the current level of customer requests.
SDOT is experimenting with more durable, lane marking materials such methyl methacrylate (MMA) in certain applications (green bike boxes, red bus lanes) in pursuit of cost-savings through reduced-frequency of maintenance.
The program estimates $2 million is needed to adequately manage lane markings and maintain new types of infrastructure (such as green bike lanes) which are typically added by capital projects. Remarking pavement is weather dependent and requires at least three functional vehicles with marking crews. Legends are currently not adequately maintained and the primary focus of maintenance program is centerlines, bike facilities, transit facilities, and lane separation lines (dash lines).
2015 Status and Condition Report – Channelization | 44

Asset Class – Intelligent Transportation System Section 4
Intelligent Transportation System, or ITS, is a new asset class for the 2015 Status & Condition Report. It combines Intelligent Transportation Signs and Traffic Signal Assemblies in order to recognize the system as a network of interdependent data-driven assets. The ITS class includes all of the assets that are either electrically- or solar-powered and comprise the system that regulates, controls, communicates and manages the flow of traffic.
Asset Replacement Value Condition
Data Confidence Good
Fair
Poor Unk
Beacon $5,865,000 32.5% 6.6% 1% 58.8% Medium Bluetooth Wi-Fi Readers (Purchased Service) - - - - NA Camera Assemblies $2,625,000 52.5% - - 47.5% Medium Communication Network $75,000,000 - - - 100% Low Counters $292,500 - - - 100% Medium-High Dynamic Message Signs $10,164,000 100% - - - Medium-High Network Hubs $980,000 - - - 100% Medium-High Radar Speed Signs $430,000 53.5% - - 46.5% Medium Transportation Operations Center $1,000,000 100% - - - High Traffic Signal Assemblies $281,137,500 12% 51% 35% 2% Medium-High
Total: $377.5 Million
Figure III: Intelligent Transportation System – Communications Business Model
2015 Status and Condition Report – Intelligent Transportation System | 45

2015 - 2064 (50-Year) Operational Cost Forecast for ITS (2015 Dollars)
*Projected annual traffic signal assembly costs assume a consistently applied 33-year replacement cycle
The ITS uses emerging hardware and software technology to move traffic and improve road capacity by optimizing traffic flows for a more effective and efficient transport system. Benefits of ITS include safety outcomes by enforcing mode separation and managing traffic-flow conflicts at busy intersections, along with hazard alerts and essential travel information. Overall, these systems provide real time roadway related information to the users in order to improve safety, reduce congestion, decrease travel time, and reduce fuel consumption.
SDOT operates an ITS communication system composed of radio, twisted-pair, and fiber optics elements that touch all sections of the road network. The data that is transmitted over the system comes from many ITS elements that are part of our overall traffic management efforts.
$0.0M
$5.0M
$10.0M
$15.0M
$20.0M
$25.0M
$30.0M
2015 2020 2025 2030 2035 2040 2045 2050 2055 2060
"AE" Annual Gen'l O&M (non-asset specific) *Traffic Signal Assemblies
Communication Network Traffic Cameras
Transit Signal Prioritiy Lights Dynamic Message Signs
Dynamic Message Sign Structures Real-Time Transit Signs
Real-Time Transit Sign Structures Network Hubs
In-Pavement Data Collection Devices "AE" 3rd Party Services (INRIX, Travel Times, etc.)
Video Wall TMC Re-Model
Servers Central Signal Control Software
"AE" Miscellaneous (Licenses, DOIT support, etc.) Beacon Assembly
Radar Speed Signs
2015 Status and Condition Report – Intelligent Transportation System | 46

Seattle’s first fully operational ITS, corridor traffic responsive operation system, was implemented in 2010 and includes ITS Key Arterial Network corridors such as Aurora Avenue, Elliott Way, 15th Avenue Northwest, East Marginal Way South, First Avenue South, and Fourth Avenue South. The traffic responsive operation system is considered one of the most effective operational modes in traffic signal systems. Taken in conjunction with historical data methods, responsive operations systems improve traffic conditions by adapting to real time situations. SDOT’s ITS Strategic Plan identifies the ITS Key Arterial Network where ITS technology will be implemented.
As part of the ITS system, SDOT maintains the Travelers Information website http://web6.seattle.gov/travelers/ . This website provides traffic conditions on city streets, congestion information, traffic alerts, travel time information, and traffic camera images. Personalized traffic alerts are an example of a fairly common service provided by traveler information websites in the US. SDOT is working with WSDOT and King County Metro to integrate comparisons of travel times by route and mode.
The Transportation Operations Division primarily maintains ITS assets. Current maintenance resource allocations allow for annual ground-level visual reviews of traffic signal hardware such as poles, mounting and support hardware, back plates, and signal and pedestrian indications. Associated follow-up maintenance then occurs for any discovered issues. We perform diagnostic evaluations every four years. ITS assets currently receive only responsive maintenance. In 2015, the department will embark on an age and condition based ITS asset replacement program.
As technology improves and the department increases the ITS network, more assets are added to the ITS inventory for which no maintenance funding has been identified. Providing comprehensive preventative maintenance of these devices is, therefore, not feasible under current funding levels. Without additional resources, these devices will receive responsive maintenance, at best, when required.
2015 Status and Condition Report – Intelligent Transportation System | 47

Figure IV: Intelligent Transportation System
2015 Status and Condition Report – Intelligent Transportation System | 48
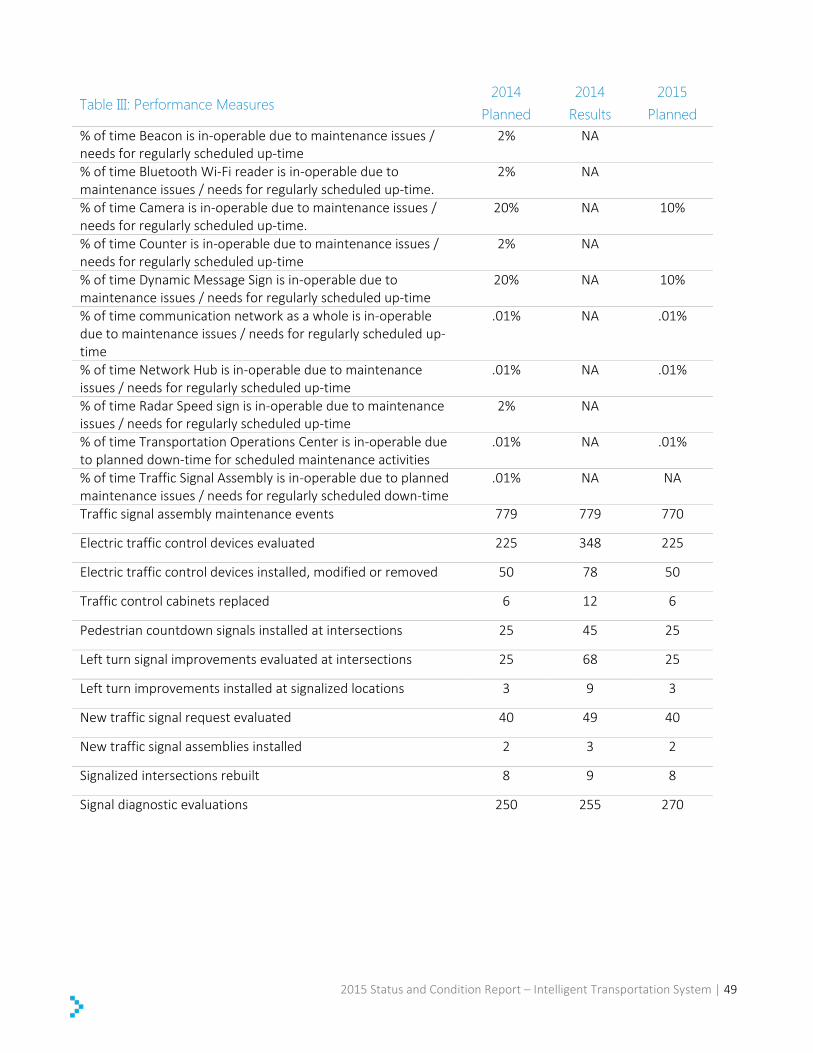
Table III: Performance Measures 2014
Planned 2014
Results 2015
Planned % of time Beacon is in-operable due to maintenance issues / needs for regularly scheduled up-time
2% NA
% of time Bluetooth Wi-Fi reader is in-operable due to maintenance issues / needs for regularly scheduled up-time.
2% NA
% of time Camera is in-operable due to maintenance issues / needs for regularly scheduled up-time.
20% NA 10%
% of time Counter is in-operable due to maintenance issues / needs for regularly scheduled up-time
2% NA
% of time Dynamic Message Sign is in-operable due to maintenance issues / needs for regularly scheduled up-time
20% NA 10%
% of time communication network as a whole is in-operable due to maintenance issues / needs for regularly scheduled up-time
.01% NA .01%
% of time Network Hub is in-operable due to maintenance issues / needs for regularly scheduled up-time
.01% NA .01%
% of time Radar Speed sign is in-operable due to maintenance issues / needs for regularly scheduled up-time
2% NA
% of time Transportation Operations Center is in-operable due to planned down-time for scheduled maintenance activities
.01% NA .01%
% of time Traffic Signal Assembly is in-operable due to planned maintenance issues / needs for regularly scheduled down-time
.01% NA NA
Traffic signal assembly maintenance events 779 779 770
Electric traffic control devices evaluated 225 348 225
Electric traffic control devices installed, modified or removed 50 78 50
Traffic control cabinets replaced 6 12 6
Pedestrian countdown signals installed at intersections 25 45 25
Left turn signal improvements evaluated at intersections 25 68 25
Left turn improvements installed at signalized locations 3 9 3
New traffic signal request evaluated 40 49 40
New traffic signal assemblies installed 2 3 2
Signalized intersections rebuilt 8 9 8
Signal diagnostic evaluations 250 255 270
2015 Status and Condition Report – Intelligent Transportation System | 49

BEACONS A beacon is a warning device to draw a vehicle operator’s attention to an associated message that is important to the safe operation of the vehicle on a specific stretch of roadway.
Many of the beacons operate on schedules and have one or more scheduled periods of operation during the day. School beacons are operational twice daily (morning and afternoon) during pre-determined ranges of hours when children are present. All-way stop beacons and emergency/warning beacons are operational on a 24/7 basis.
Inventory Status and Anticipated Annual Growth
Staff members in the Transportation Operations Center (TOC) maintain the inventory of beacons in the Asset Management database (Hansen) and
program/schedule the hours of operation for the School Beacons.
There are a variety of beacon categories, as follows:
Asset Inventory
Count Data
Confidence Replacement
Value
Useful Life
(Years)
System Replacement
Value
Anticipated Annual Growth
School 153 High $15,000 20 $2,160,000 10-15
Regulatory 115 High $15,000 20 $1,725,000 Unknown
Crosswalk 66 Medium $15,000 20 $885,000 -1-2
Warning 36 Medium $15,000 20 $555,000 10-15
Undetermined 20 Low $15,000 20 $285,000 Unknown
Total 391 Medium $5,865,000
Life Cycle Costs, Maintenance Approach and Funding
We have not tracked maintenance independently for this asset and have been included in a general maintenance budget; hence, life cycle costs are not available.
Prior to 2007, the maintenance approach for beacons was to respond to damage or operational problems as reported and according to maintenance priorities. If the reported problem was safety-related, response was immediate. The 2014 budget included $200,000 for programmed beacon maintenance.
Since limited information is available about the beacons, specifically age and condition, it is difficult to assess funding needs in any specific year. Using a life cycle of twenty years for replacement approximately nineteen beacons should be replaced annually, at a cost of approximately $285,000 per year. In some cases, we can replace beacons with reflective signage, which is less expensive and easier to maintain. This is determined on a case by case basis.
2015 Status and Condition Report – Intelligent Transportation System | 50

BLUETOOTH / WI-FI READERS SDOT purchases Bluetooth/Wi-Fi Reader-gathered data as a service, which utilize Wi-Fi device location detection to determine travel times. These devices are housed in signal cabinets and may require maintenance by both SDOT crews and the service provider. We have not tracked maintenance costs independently for supporting this service.
CAMERA ASSEMBLIES Camera assemblies under the management of the SDOT Traffic Operations Division include closed circuit television (CCTV) and license plate readers (LPR). A CCTV camera assembly provides video images of traffic and roadway conditions to the Traffic Management Center, as well as to the public on the Traveler’s Map. These images provide information to assist motorists in making intelligent decisions with respect to their trips, and thereby reduce travel time. A CCTV camera assembly also assists SDOT in diagnosing potential and actual traffic congestion and in decision-making about changes in synchronization of traffic signals that will enhance the flow of traffic.
LPRs scan license plate numbers, using CCTV camera technology, to measure travel time along a corridor and convert it to display congestion levels on the Traveler’s Information map. The system is set up to have an entry point and an exit point that create a cordon. When a vehicle enters a cordon its license plate number is recorded. If the vehicle goes all the way to the exit point its license plate number is recorded again as well as the time the vehicle took to travel through. This data averaged over many vehicles creates an accurate picture of current travel times. Once the travel time data for a vehicle is recorded the license plate record is discarded.
Inventory Status and Anticipated Annual Growth
The TOC staff maintains the camera inventory in the Asset Management database. The department experienced a high rate of growth in recent years in the camera inventory related to the Traveler’s
Information map. However, travel time technology improvements have made LPR Cameras obsolete due to high installation and maintenance costs. We will not replace these assets in kind when failure occurs.
Asset Inventory Count
Data Confidence
Replacement Value
Useful Life
(Years)
System Replacement
Value
Anticipated Annual Growth
CCTV 180 Medium $7,500 8 $1,350,000 20
LPR 102 Medium $12,500 8 1,275,000 0
Total 282 Medium $2,625,000
*excludes pole installation
2015 Status and Condition Report – Intelligent Transportation System | 51

Life Cycle Costs, Maintenance Approach and Funding
Due to deterioration in the electronics, cameras undergo periodic repairable random failures. Failures tend to occur and multiply during years 7 and 8. At that point, it is more cost effective to replace the unit rather than continuing to repair the camera to maintain continuous operability.
We have not tracked maintenance costs independently for this asset and have been included in a general maintenance budget; hence, life cycle costs are not available.
SDOT’s maintenance approach for camera assemblies is to respond to damage or operational problems as reported and according to maintenance priorities.
Approximately $50,000 from the combined general maintenance budget has been allocated for preventative maintenance of camera assemblies. Replacement of these devices began in 2012. From 2015 through 2019, $600,000 is allocated annually for replacement of 40 cameras per year. Accurate costs of maintenance have not been determined.
COMMUNICATION NETWORK The communication network includes a system of cables and wireless technologies that link the ITS system. It is the vital link between the ITS assets and the TOC. It serves as the backbone through which all traffic signal data, as well as transmits video, allowing for communication between these devices. The communication cable network runs overhead and through underground conduits.
Fiber optic communications media is required to provide highly reliable communications to all ITS devices. Not only does a fiber network provide robust service to the ITS devices, it reduces maintenance calls. Some locations in the City are served by copper communications, and some locations have no communications for ITS. Long-term ITS deployments require more fiber optic cable. Some of this fiber will be required to replace older copper communications media from major construction projects. Fiber optic resources also support transit signal priority and real-time transit arrival time systems.
Three major types of communication networks comprise the system:
1. Twisted pair wiring: Consists of conductors of a single circuit twisted together. The city will phase out this older style of communication network over time and replace with fiber. As we integrate IP addressable devices, the desire is to replace twisted-pair with fiber. This is primarily due to age, obsolescence, and the increasing need for more data and performance capabilities. SDOT owns and maintains all twisted pair wiring.
2. Fiber: DoIT manages and administers the fiber system under the Fiber One Agreement although SDOT technically owns the portion of the system that it uses. The agreement consists of many partners such as: SFD, Library, KC, and WSDOT.
3. Wireless: The wireless network avoids the costly process of undergrounding cables and is generally implemented and administered using radio communication.
Inventory Status and Anticipated Annual Growth
The number of linear feet of the communications network is unknown. SDOT has begun the process of migrating to an IP-based communications network from the existing serial network. This change enables additional communications capacity using the same number of fibers, provides a ring-based network that
can withstand a major break in the fiber, and readies the City for the next wave of ITS equipment (which is moving toward becoming exclusively IP-based). We maintain maps of the inventory in the TOC.
2015 Status and Condition Report – Intelligent Transportation System | 52

Asset Inventory
Count Data
Confidence Replacement
Value
Useful Life
(Years)
System Replacement
Value
Anticipated Annual Growth
Twisted pair wiring
UNK Low 50 Unknown
Fiber DoIT
Maintains High 35 2 miles
Wireless UNK Low Unknown
Total 150 miles Low $500,000 (mile) $75,000,000
Life Cycle Costs, Maintenance Approach and Funding
We have not tracked maintenance costs independently for this asset and have been included in a general maintenance budget; hence, life cycle costs are not available.
The maintenance approach for the communication network is to respond to damage or operational problems as reported and according to maintenance priorities. Additional funding is required to establish a preventive maintenance program for the network.
Approximately $350,000 from the combined general maintenance budget has been allocated for annual maintenance of the communication network.
Very limited condition information is available about the twisted-pair communications network. WE perform maintenance as needed; however, the information is not available to determine what level of replacement activity is included in this maintenance. At some point, the city will replace portions of the communications network with fiber and administrate terms under the Fiber One Agreement with DoIT. We have not developed a replacement program for the communications network, and an annual funding figure for replacement is not available.
COUNTERS Counters are permanently installed devices that provide volume, speed, classification, and weight data.
Inventory Status and Anticipated Annual Growth
Traffic Management Data and Records maintain inventory in the Asset Management database.
Asset Inventory
Count Data
Confidence Replacement
Value
Useful Life
(Years)
System Replacement
Value
Anticipated Annual Growth
Vehicle 5 Medium-High Varies 10 20
Pedestrian 0 Medium-High Unknown
Bike 4 Medium-High 7 4
Pedestrian / Bike combined 4 Medium-
High 7 1
Total 13 Medium-High
$5,000-40,000 $292,500
2015 Status and Condition Report – Intelligent Transportation System | 53
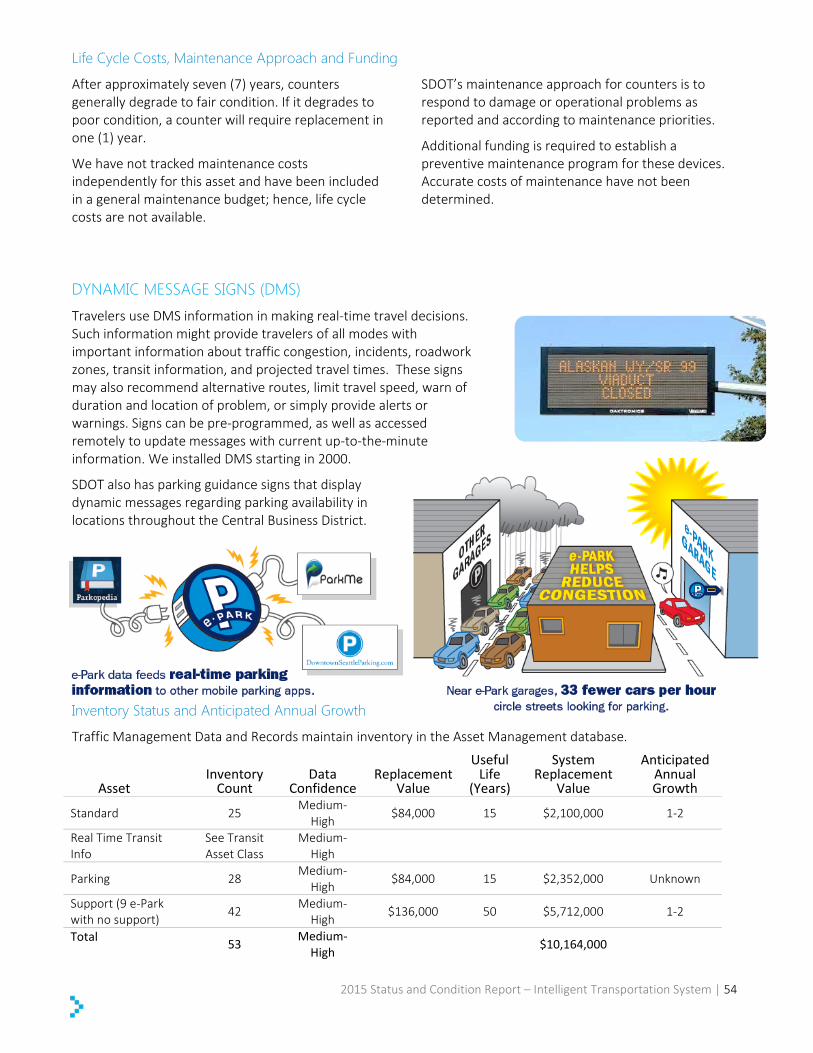
Life Cycle Costs, Maintenance Approach and Funding
After approximately seven (7) years, counters generally degrade to fair condition. If it degrades to poor condition, a counter will require replacement in one (1) year.
We have not tracked maintenance costs independently for this asset and have been included in a general maintenance budget; hence, life cycle costs are not available.
SDOT’s maintenance approach for counters is to respond to damage or operational problems as reported and according to maintenance priorities.
Additional funding is required to establish a preventive maintenance program for these devices. Accurate costs of maintenance have not been determined.
DYNAMIC MESSAGE SIGNS (DMS) Travelers use DMS information in making real-time travel decisions. Such information might provide travelers of all modes with important information about traffic congestion, incidents, roadwork zones, transit information, and projected travel times. These signs may also recommend alternative routes, limit travel speed, warn of duration and location of problem, or simply provide alerts or warnings. Signs can be pre-programmed, as well as accessed remotely to update messages with current up-to-the-minute information. We installed DMS starting in 2000.
SDOT also has parking guidance signs that display dynamic messages regarding parking availability in locations throughout the Central Business District.
Inventory Status and Anticipated Annual Growth
Traffic Management Data and Records maintain inventory in the Asset Management database.
Asset Inventory
Count Data
Confidence Replacement
Value
Useful Life
(Years)
System Replacement
Value
Anticipated Annual Growth
Standard 25 Medium-
High $84,000 15 $2,100,000 1-2
Real Time Transit Info
See Transit Asset Class
Medium-High
Parking 28 Medium-
High $84,000 15 $2,352,000 Unknown
Support (9 e-Park with no support)
42 Medium-High
$136,000 50 $5,712,000 1-2
Total 53 Medium-High $10,164,000
2015 Status and Condition Report – Intelligent Transportation System | 54

Life Cycle Costs, Maintenance Approach and Funding
The maintenance approach for a DMS is to respond to damage or operational problems as reported and assign work according to maintenance priorities.
When a DMS reaches half its useful life, it generally degrades to fair condition. If it degrades to poor condition, the sign will require replacement in three (3) years or less.
Since these are newer assets, we are just recording maintenance costs, full life cycle costs have not yet
been determined and we have not established a preventive maintenance program. We perform condition assessments during preventive maintenance checks.
An accurate assessment of funding requirements for these devices is not available due to the low maintenance priority and limited maintenance performed on DMS.
NETWORK HUBS Network hubs serve as junctions in the communication system between the traffic signal assemblies, the CCTV camera assemblies, and the TOC, using the communication network. We house a variety of electronic communications equipment in the network hubs. We outfit some hubs with Uninterruptible Power Source (UPS) to ensure continuance of communication capability during a power outage lasting less than 24 hours.
Inventory Status and Anticipated Annual Growth
TOC staff maintain the network hub inventory in the Asset Management database by the. After approximately six (6) years, the network hub generally degrades to fair condition. If it degrades to poor condition, the network hub will generally require replacement in one (1) year. Electrical
components within the hub, such as switches, have useful lives that average four (4) years.
We have not tracked maintenance costs independently for this asset and have been included in a general maintenance budget; hence, life cycle costs are not available.
Asset Inventory
Count Data
Confidence Replacement
Value
Useful Life
(Years)
System Replacement
Value
Anticipated Annual Growth
Network Hubs 14 Medium-High $70,000 7-20 $980,000 0-1
Life Cycle Costs, Maintenance Approach and Funding
The maintenance approach for the network hub is to regularly provide software pushes, security network penetration tests, verification of operation, and troubleshooting. We repair external cabinet damage, perform non-standard preventative maintenance to the cabinet, and repair electronic equipment failure as problems are reported and according to maintenance priorities. Additional funding is
required to establish a preventive maintenance program for these devices.
We have not yet developed a replacement program for the network hubs.
We perform maintenance as needed; however, the information is not available to determine what level of replacement activity is included in this maintenance.
2015 Status and Condition Report – Intelligent Transportation System | 55
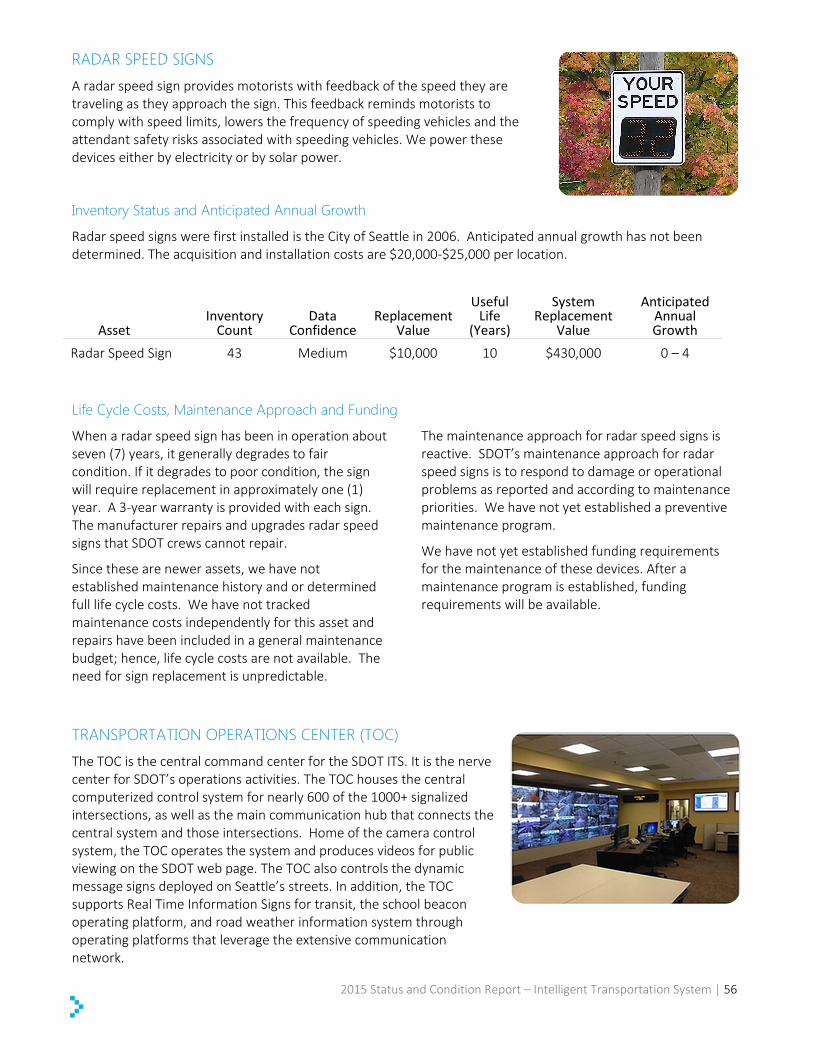
RADAR SPEED SIGNS A radar speed sign provides motorists with feedback of the speed they are traveling as they approach the sign. This feedback reminds motorists to comply with speed limits, lowers the frequency of speeding vehicles and the attendant safety risks associated with speeding vehicles. We power these devices either by electricity or by solar power.
Inventory Status and Anticipated Annual Growth
Radar speed signs were first installed is the City of Seattle in 2006. Anticipated annual growth has not been determined. The acquisition and installation costs are $20,000-$25,000 per location.
Asset Inventory
Count Data
Confidence Replacement
Value
Useful Life
(Years)
System Replacement
Value
Anticipated Annual Growth
Radar Speed Sign 43 Medium $10,000 10 $430,000 0 – 4
Life Cycle Costs, Maintenance Approach and Funding
When a radar speed sign has been in operation about seven (7) years, it generally degrades to fair condition. If it degrades to poor condition, the sign will require replacement in approximately one (1) year. A 3-year warranty is provided with each sign. The manufacturer repairs and upgrades radar speed signs that SDOT crews cannot repair.
Since these are newer assets, we have not established maintenance history and or determined full life cycle costs. We have not tracked maintenance costs independently for this asset and repairs have been included in a general maintenance budget; hence, life cycle costs are not available. The need for sign replacement is unpredictable.
The maintenance approach for radar speed signs is reactive. SDOT’s maintenance approach for radar speed signs is to respond to damage or operational problems as reported and according to maintenance priorities. We have not yet established a preventive maintenance program.
We have not yet established funding requirements for the maintenance of these devices. After a maintenance program is established, funding requirements will be available.
TRANSPORTATION OPERATIONS CENTER (TOC) The TOC is the central command center for the SDOT ITS. It is the nerve center for SDOT’s operations activities. The TOC houses the central computerized control system for nearly 600 of the 1000+ signalized intersections, as well as the main communication hub that connects the central system and those intersections. Home of the camera control system, the TOC operates the system and produces videos for public viewing on the SDOT web page. The TOC also controls the dynamic message signs deployed on Seattle’s streets. In addition, the TOC supports Real Time Information Signs for transit, the school beacon operating platform, and road weather information system through operating platforms that leverage the extensive communication network.
2015 Status and Condition Report – Intelligent Transportation System | 56

We gather real-time information from many sources including traffic detectors (Bluetooth Wi-Fi readers and License Plate Reader Cameras), CCTV cameras, WSDOT feed, SPD scanner, twitter, road crews, incident response teams, and media traffic reporters. SDOT uses this information to develop real-time situational awareness, coordinate responses to clear accidents, react quickly to problems that occur, and notify the public and the media of these events to avoid surprises.
The TOC houses SDOT’s Travelers Information website. The map uses an interactive virtual background, which uses live data to display traffic conditions both for city arterials and state highways on one map. We post incidents, planned events, and links to other key transportation sites on the website.
SDOT put the TOC into operation in 2002 and located it in the Seattle Municipal Tower (SMT). We staff the TOC 16 hours every day to monitor the effective operation of the transportation system. The TOC is 24/7 capable and has a redundant power source to maintain a 99.99% up-time.
Inventory Status and Anticipated Annual Growth
The TOC houses numerous electronic components. TOC staff maintains these components in a spreadsheet.
We have not assigned condition ratings to the components, although most electronic components have life cycles of four (4) years or less at which point we will replace them with newer technology. The electronic component with the longest useful life is the video wall which is seven (7) years.
Useful life for the TOC itself is indeterminate since a TOC in some form will always be required. We base the estimated replacement value for the TOC on the
2014 TOC upgrade. We do not track maintenance costs separately for the TOC.
In the long-term ITS Strategic Plan, SDOT plans to implement a secondary satellite TOC outside of the downtown core. This is currently unfunded however. The satellite TOC will provide remote access to ITS assets, if the primary TOC loses power or is inaccessible for any reason. The satellite TOC would serve as a redundant back-up ensuring we can manage traffic signals and ITS functions in case of such emergencies.
Asset Inventory
Count Data
Confidence Replacement
Value
Useful Life
(Years)
System Replacement
Value
Anticipated Annual Growth
Transportation Operations Center 1 High $1,000,000 Varies $1,000,000 0
Life Cycle Costs, Maintenance Approach and Funding
We allocate the TOC budget from the combined general maintenance budget. Approximately $50,000 is allocated to the costs of maintenance, which covers the annual cost of replacement of electronic components that make up the TOC, and $1,000,000 is allocated to the annual cost of operations.
Elements of growth that may require additional funding include:
Increasing functionality as newer technology is made available
Creation of a back-up site
Additional staffing for more responsive operations
2015 Status and Condition Report – Intelligent Transportation System | 57

TRAFFIC SIGNAL ASSEMBLIES A traffic signal assembly is the set of assets that comprise a functioning traffic signal at a given intersection or location, from the overhead equipment and poles, to the controller cabinet and electronics within it that operate the traffic signal.
A traffic signal assembly controls the movement of vehicles, pedestrians and bicyclists, minimizes conflicts, and optimizes the flow of traffic throughout the street network.
We populate some traffic signals with detection technology to manage increases in traffic volume data and maximize the efficiency of the roadway. When the volume of both pedestrians and vehicles are low, the traffic signal control system can bypass optimized timing routines and operate the intersection to respond to the detected demand.
Transit signal priority preempt devices are installed along transit routes. This system detects buses as they approach signalized intersections. If a bus is detected and the signal is about to turn red for the bus, the signal instead will extend the green light for the bus in an effort to reduce delays for riders. SDOT is updating many signal cabinets for the Rapid Ride Transit Corridors to support this operation.
Inventory Status and Anticipated Annual Growth
We maintain the signal inventory in the Asset Management database. SDOT is responsible for operating and maintaining assets under other agency jurisdiction such as WSDOT and King County. We partially verify the traffic signal assemblies inventory annually during preventive maintenance visits to each location.
SDOT first assessed the overall condition of traffic signal assemblies in 2008. We collected condition information of the component assets, such as poles, mast arms, spans and connections and if we rated one component as poor, we considered the entire
asset in poor condition. In 2014, the rating system was redesigned with point based scores for each component that correlate to the Hansen database standard code values of good, fair, and poor. As of the publication date of this report, we’ve rated 50% of the traffic signal assembly system with the revised condition assessment criteria.
Capital projects, SDOT’s new signal program, or developers may install new traffic signal assemblies as a requirement under a development permit. Developers transfer newly-built signals to SDOT for maintenance and operation upon completion.
Asset Inventory
Count Data
Confidence Replacement
Value
Useful Life
(Years)
System Replacement
Value
Anticipated Annual Growth
Traffic Signal Assemblies 1,071 Medium-
High $150,000 to
350,000 7-50 $281,137,500 3-8
Life Cycle Costs, Maintenance Approach and Funding
A traffic signal assembly has an open-ended life and persists through time as long as the intersection or mid-block location remains signalized. We replace deteriorating or failed component assets, rather than replacing the traffic signal assembly in its entirety. Below is a depiction of the Traffic Signal Assembly components and relationships to other assets:
2015 Status and Condition Report – Intelligent Transportation System | 58
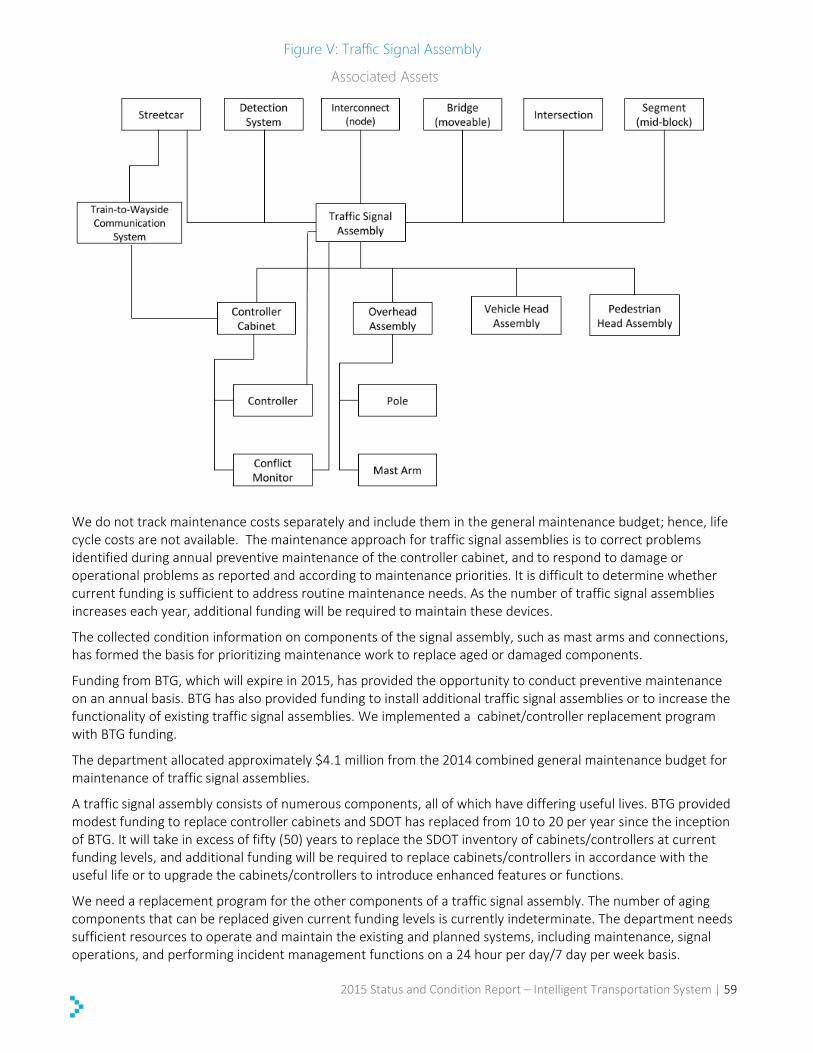
We do not track maintenance costs separately and include them in the general maintenance budget; hence, life cycle costs are not available. The maintenance approach for traffic signal assemblies is to correct problems identified during annual preventive maintenance of the controller cabinet, and to respond to damage or operational problems as reported and according to maintenance priorities. It is difficult to determine whether current funding is sufficient to address routine maintenance needs. As the number of traffic signal assemblies increases each year, additional funding will be required to maintain these devices.
The collected condition information on components of the signal assembly, such as mast arms and connections, has formed the basis for prioritizing maintenance work to replace aged or damaged components.
Funding from BTG, which will expire in 2015, has provided the opportunity to conduct preventive maintenance on an annual basis. BTG has also provided funding to install additional traffic signal assemblies or to increase the functionality of existing traffic signal assemblies. We implemented a cabinet/controller replacement program with BTG funding.
The department allocated approximately $4.1 million from the 2014 combined general maintenance budget for maintenance of traffic signal assemblies.
A traffic signal assembly consists of numerous components, all of which have differing useful lives. BTG provided modest funding to replace controller cabinets and SDOT has replaced from 10 to 20 per year since the inception of BTG. It will take in excess of fifty (50) years to replace the SDOT inventory of cabinets/controllers at current funding levels, and additional funding will be required to replace cabinets/controllers in accordance with the useful life or to upgrade the cabinets/controllers to introduce enhanced features or functions.
We need a replacement program for the other components of a traffic signal assembly. The number of aging components that can be replaced given current funding levels is currently indeterminate. The department needs sufficient resources to operate and maintain the existing and planned systems, including maintenance, signal operations, and performing incident management functions on a 24 hour per day/7 day per week basis.
Figure V: Traffic Signal Assembly
Associated Assets
2015 Status and Condition Report – Intelligent Transportation System | 59
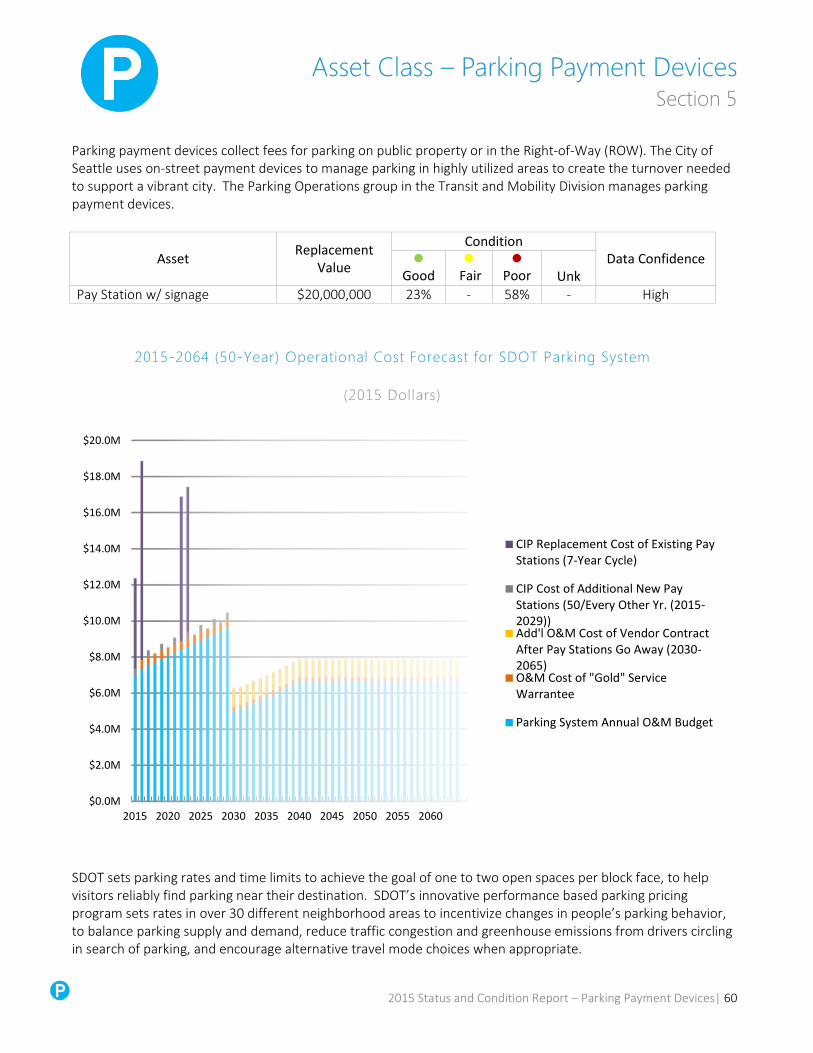
Asset Class – Parking Payment Devices Section 5
Parking payment devices collect fees for parking on public property or in the Right-of-Way (ROW). The City of Seattle uses on-street payment devices to manage parking in highly utilized areas to create the turnover needed to support a vibrant city. The Parking Operations group in the Transit and Mobility Division manages parking payment devices.
2015-2064 (50-Year) Operational Cost Forecast for SDOT Parking System
(2015 Dollars)
SDOT sets parking rates and time limits to achieve the goal of one to two open spaces per block face, to help visitors reliably find parking near their destination. SDOT’s innovative performance based parking pricing program sets rates in over 30 different neighborhood areas to incentivize changes in people’s parking behavior, to balance parking supply and demand, reduce traffic congestion and greenhouse emissions from drivers circling in search of parking, and encourage alternative travel mode choices when appropriate.
$0.0M
$2.0M
$4.0M
$6.0M
$8.0M
$10.0M
$12.0M
$14.0M
$16.0M
$18.0M
$20.0M
2015 2020 2025 2030 2035 2040 2045 2050 2055 2060
CIP Replacement Cost of Existing PayStations (7-Year Cycle)
CIP Cost of Additional New PayStations (50/Every Other Yr. (2015-2029))Add'l O&M Cost of Vendor ContractAfter Pay Stations Go Away (2030-2065)O&M Cost of "Gold" ServiceWarrantee
Parking System Annual O&M Budget
Asset Replacement Value
Condition Data Confidence
Good
Fair
Poor
Unk Pay Station w/ signage $20,000,000 23% - 58% - High
2015 Status and Condition Report – Parking Payment Devices| 60
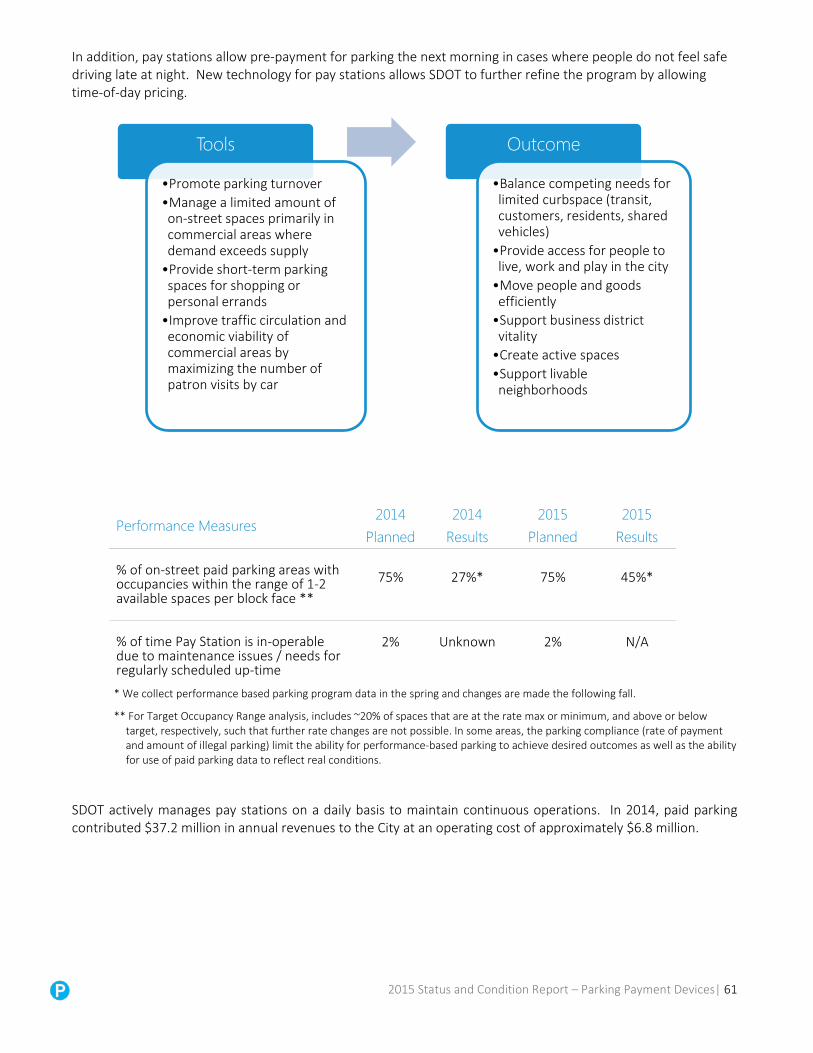
In addition, pay stations allow pre-payment for parking the next morning in cases where people do not feel safe driving late at night. New technology for pay stations allows SDOT to further refine the program by allowing time-of-day pricing.
Performance Measures 2014
Planned 2014
Results 2015
Planned 2015
Results % of on-street paid parking areas with occupancies within the range of 1-2 available spaces per block face **
75% 27%* 75% 45%*
% of time Pay Station is in-operable due to maintenance issues / needs for regularly scheduled up-time
2% Unknown 2% N/A
* We collect performance based parking program data in the spring and changes are made the following fall.
** For Target Occupancy Range analysis, includes ~20% of spaces that are at the rate max or minimum, and above or below target, respectively, such that further rate changes are not possible. In some areas, the parking compliance (rate of payment and amount of illegal parking) limit the ability for performance-based parking to achieve desired outcomes as well as the ability for use of paid parking data to reflect real conditions.
SDOT actively manages pay stations on a daily basis to maintain continuous operations. In 2014, paid parking contributed $37.2 million in annual revenues to the City at an operating cost of approximately $6.8 million.
Tools
•Promote parking turnover •Manage a limited amount of on-street spaces primarily in commercial areas where demand exceeds supply •Provide short-term parking spaces for shopping or personal errands •Improve traffic circulation and economic viability of commercial areas by maximizing the number of patron visits by car
Outcome
•Balance competing needs for limited curbspace (transit, customers, residents, shared vehicles) •Provide access for people to live, work and play in the city •Move people and goods efficiently •Support business district vitality •Create active spaces •Support livable neighborhoods
2015 Status and Condition Report – Parking Payment Devices| 61

PAY STATIONS Pay stations are electronic payment devices installed on sidewalks adjacent to on-street parking. A pay station controls more than one parking space and accepts payment by both credit/debit card and coin. Components of this parking payment device include a payment card reader, a receipt printer, and a solar panel.
We connect the pay stations to a data management system hosted by the vendors, communicating directly with the Parking Maintenance Shop which monitors performance of the pay stations on a real-time basis. During pay station hours of operation, we provide help to customers via telephone.
SDOT began installing pay stations in 2004 to replace single-space parking meters. By 2013, single-space parking meters had been completely replaced by pay stations in the City of Seattle. Replacement of all pay stations is occurring over a two-year period in 2015 and 2016 due to first generation pay stations reaching the end of their useful lives (accounting for the high percentage of stations in “poor” condition as shown in the table at the beginning of this chapter).
Inventory Status and Anticipated Annual Growth
We maintain the inventory of pay stations in the Asset Management database (Hansen) system. Total replacement value represents the vendor contract over the 7-year duration including: signage, curbspace design, pay station removal and installation, training, user interface development, systems integration, and monthly data and wireless communication costs.
SDOT periodically examines on-street parking conditions in various neighborhoods and business districts throughout the city, which may or may not result in modifications to paid parking in each area.
New pay stations come with a comprehensive warranty that will protect the City from changes in cellular networks, payment card industry compliance requirements, Euro Visa MasterCard requirements, parts obsolescence, and all component failure.
Asset Inventory
Count
Data Confidence
Level Replacement Value (Each)
Useful Life (Years)
Asset Replacement
Value Anticipated
Annual Growth
Pay Station w/ signage 2022 High $5,000 7 *$20,000,000
50 stations every 2 years through
2029
*Includes purchase, installation, signage, and monthly data and wireless communication costs
2015 Status and Condition Report – Parking Payment Devices| 62
Life Cycle Costs, Maintenance Approach and Funding
SDOT estimates that the next pay station replacement project will occur in the 2022-2023 biennium given the average expected life of 7 years of each unit. The parking industry anticipates that sometime in the near future, agencies will transition from primarily a physical payment methodology to primarily a virtual payment scheme whereby customers will make all payments by phone or means other than the physical transfer of cash. For the purposes of projecting long-term operational costs for parking payment devices, we assume this will take place in the year 2030. Operations and maintenance of Seattle’s paid parking system is roughly $6.8 million per year (in 2015 dollars):
$2.7 million in staffing costs (labor, benefits and overhead costs). These staff provide all of the day-to-day operations and maintenance for the parking pay stations, equipment and system troubleshooting, system maintenance, removal and reinstallation of pay stations for construction, changes to curbspace in paid parking areas (e.g. new loading zones, etc.) some graffiti removal, system and revenue reporting, analytics, customer support and response and management of the operation.
$3.1 million in professional services: monthly fees for wireless communications and back office, credit card fees, and data collection.
$1.0 million in warranty costs for pay stations, vehicle costs, consumables for pay stations and supplies for the shop.
We repair or replace malfunctioning components on pay stations as needed. While under warranty, these repair costs are borne by the vendor.
2015 Status and Condition Report – Parking Payment Devices| 63
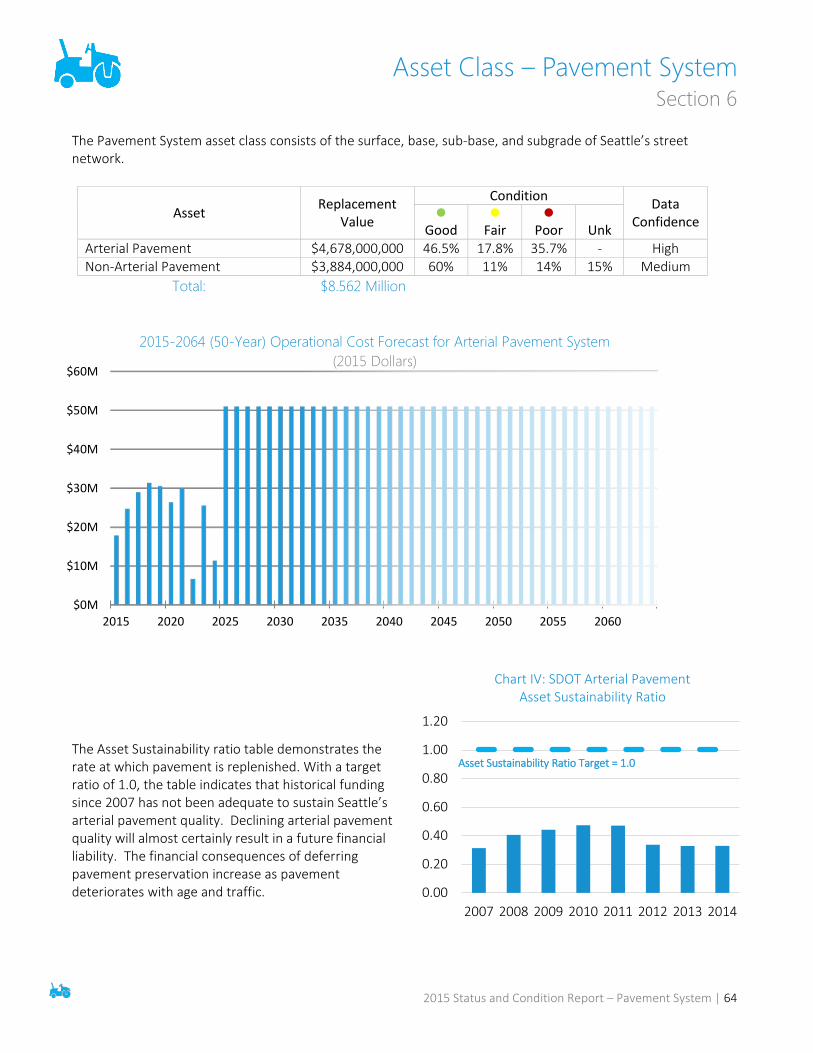
Asset Class – Pavement System Section 6
The Pavement System asset class consists of the surface, base, sub-base, and subgrade of Seattle’s street network.
The Asset Sustainability ratio table demonstrates the rate at which pavement is replenished. With a target ratio of 1.0, the table indicates that historical funding since 2007 has not been adequate to sustain Seattle’s arterial pavement quality. Declining arterial pavement quality will almost certainly result in a future financial liability. The financial consequences of deferring pavement preservation increase as pavement deteriorates with age and traffic.
$0M
$10M
$20M
$30M
$40M
$50M
$60M
2015 2020 2025 2030 2035 2040 2045 2050 2055 2060
2015-2064 (50-Year) Operational Cost Forecast for Arterial Pavement System (2015 Dollars)
Asset Replacement Value
Condition Data Confidence
Good
Fair
Poor Unk Arterial Pavement $4,678,000,000 46.5% 17.8% 35.7% - High Non-Arterial Pavement $3,884,000,000 60% 11% 14% 15% Medium
Total: $8.562 Million
0.00
0.20
0.40
0.60
0.80
1.00
1.20
2007 2008 2009 2010 2011 2012 2013 2014
Asset Sustainability Ratio Target = 1.0
Chart IV: SDOT Arterial Pavement Asset Sustainability Ratio
2015 Status and Condition Report – Pavement System | 64

Performance Measures 2014 Planned 2014 Results 2015 Planned Number of road lane miles paved 17 miles 17 miles 4.4* miles
% of potholes repaired within three business days of notification
80% 88% 80%
% of arterial streets in fair or better condition
75% 64% NA
*An additional 10.6 lane miles (23rd Ave and Roosevelt Way NE) will be under contract with 2015 dollars, but owing to the complexity of the projects they will not be substantially complete until 2016.
PAVEMENT SYSTEM We divide the Pavement System asset class into four (4) major categories:
Arterial Non-Arterial Alleyways Excess ROW in use for access and parking
Pavement must have adequate structure to support the traffic it carries at the roadway’s design speed and must also withstand environmental degradation. Pavement serves a secondary function as a drainage structure, channeling runoff to storm water collection facilities. The primary focus of SDOT’s pavement management program is the maintenance, preservation, and rehabilitation of existing streets to support evolving transportation uses.
The total arterial and non-arterial pavement network in Seattle consists of 3,954 12-foot-wide lane miles. We base this figure on a comprehensive pavement management assessment conducted in 2013-2014.
Since the majority of the pavement infrastructure is represented by the arterials and non-arterials, we emphasize these two pavement categories have been emphasized in this report. We have not performed an inventory of alleys and parking areas to date.
Seattle’s street network is essentially “built out” and its overall size changes very little from year-to-year. Over the last decade, the overall size of the street system has grown by just eight lane-miles (0.2%), up slightly from 3,946 lane-miles in 2003 to 3,954 in 2014.
ARTERIAL PAVEMENT Arterials are Seattle’s busiest streets and we classify them according to the traffic they carry:
Principal arterial – the most important, busiest through-streets, such as Rainier Ave S or 15P
thP Ave NW. In
2012, SDOT re-classified principal arterials in their entirety to be included in the Federal Highway Administration (FHWA) National Highway System (NHS).
Minor arterial – streets that link neighborhoods together, such as California Ave SW or N 80P
thP ST
Collector arterial – streets that tie the least traveled streets, the non-arterials, into the arterial street system, such as Magnolia Boulevard W or 31P
stP Ave S.
2015 Status and Condition Report – Pavement System | 65
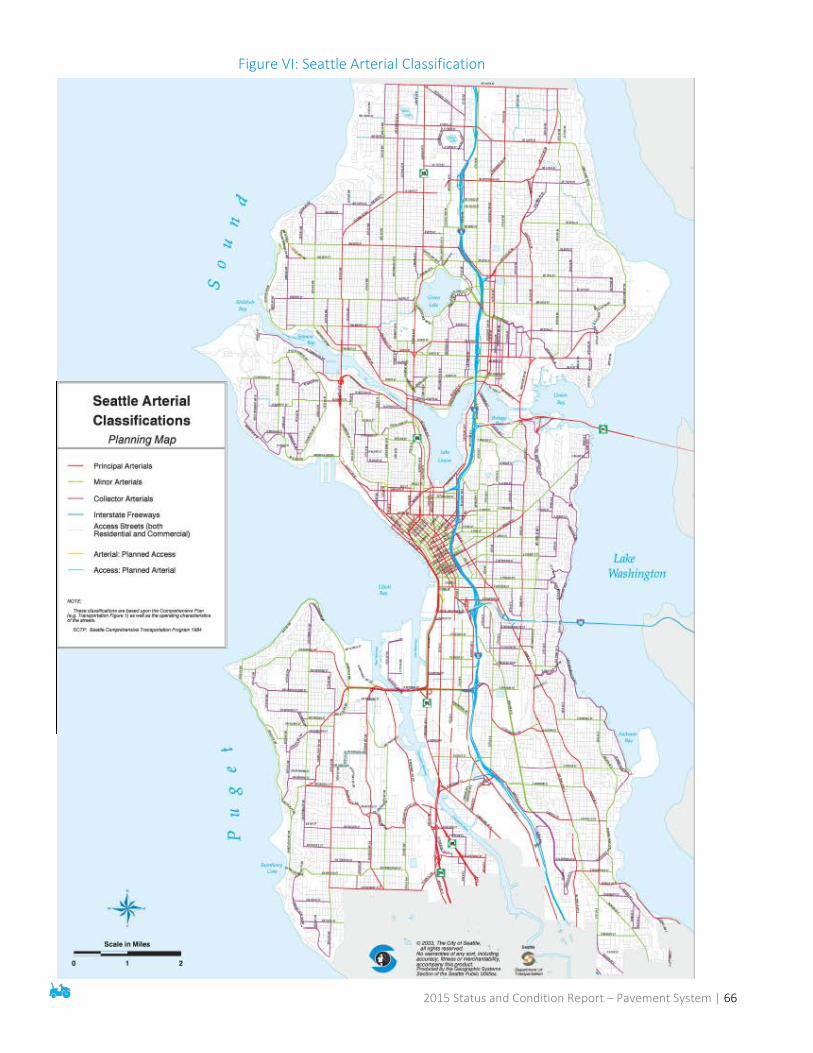
Figure VI: Seattle Arterial Classification Planning Map
Seattle Arterial Classifications Planning Map
Principal Arterials Minor Arterials Collector Arterials Interstate Freeways Access Streets (both Residential and Commercial) Arterial: Planned Access Access: Planned Arterial Note: These classifications are based upon the Compressive Plan (e.g. Transportation Figure 1) as well as the operating characteristics of the streets. Seattle Comprehensive Transportation Program Additional maps available at: http://www.seattle.gov/transportation/streetclassmaps.htm
2015 Status and Condition Report – Pavement System | 66

Arterials account for 39% of Seattle’s pavement network, or 1,547 twelve-foot-wide lane miles. The break-down of arterials according to the functional classification is:
Functional Classification
Pavement Area (12-ft Lane Miles)
Fraction of Network
Principal Arterial 627 40%
Minor Arterial 569 37%
Collector Arterial 351 23%
We maintain the pavement inventory in the Pavement Management System database where condition and maintenance information is also recorded. We enter new pavement into the database annually, and SDOT typically updates arterial condition ratings every three (3) years. The city adds very little new inventory to the street network annually. Additions that occur are usually in connection with redevelopment or (rarely) annexation.
is estimated The arterial pavement network replacement cost in 2015 dollars, not including the cost of the right-of-way, drainage improvements, additional new curb ramps, or other improvements that might be required or desired if streets were reconstructed.
SDOT conducted the 2013-2014 arterial pavement condition survey using an automated system that employed an array of cameras and sensors to record pavement distress. In addition to pavement distress information, we collected digital photo logs. We assess pavement condition using an industry-standard rating methodology described in Appendix C to derive a Pavement Condition Index (PCI).
Inventory Status and Anticipated Annual Growth
Asset Inventory
Count Data
Confidence
Design Life
(Years, typical)
System Replacement
Value
Anticipated Annual Growth
Concrete Rigid (PCC)
552 High 40+ Unknown
Asphalt Flexible (AC or AC/AC)
133 High 20+ Unknown
Composite (AC/PCC)
855 High 20+ Unknown
Bituminous Surface Treatment (ST)
7 High 20+
Unknown
Other (O) .1 High varies Unknown Total 1,547 High $4,678,000,000
2015 Status and Condition Report – Pavement System | 67

Figure VII: 2013 Arterial Pavement Condition
*See Figure VII I below for legend
2015 Status and Condition Report – Pavement System | 68
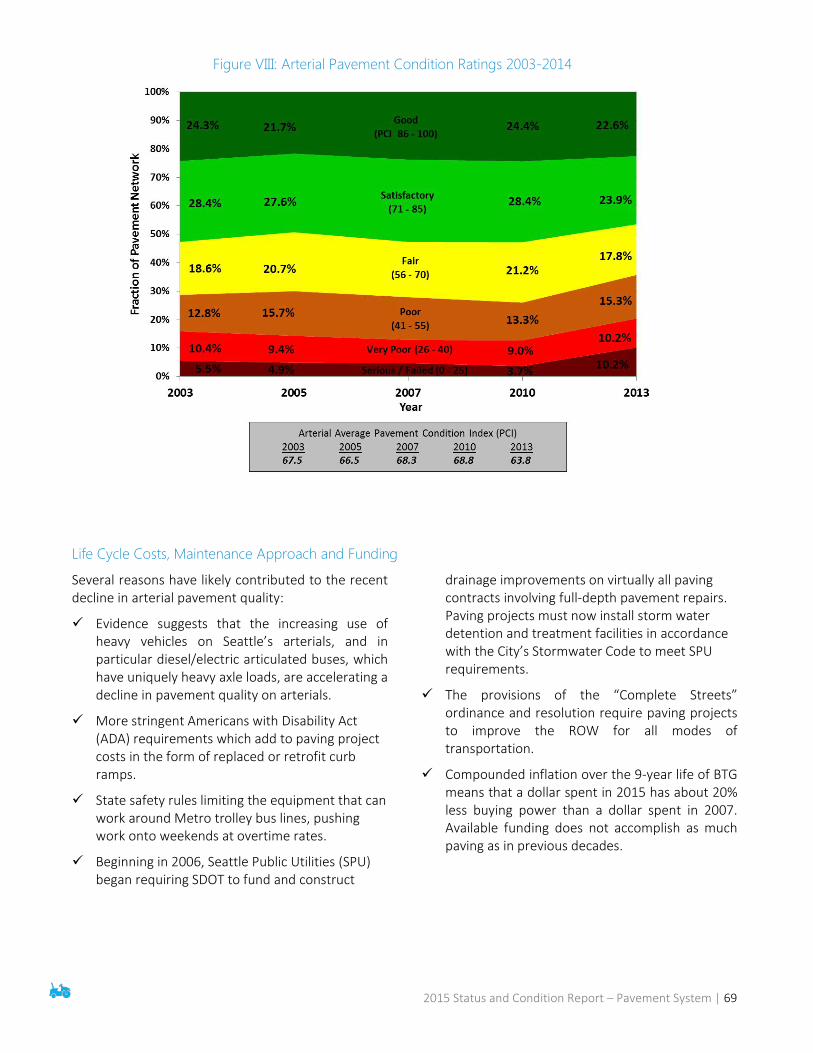
Figure VIII: Arterial Pavement Condition Ratings 2003-2014
Life Cycle Costs, Maintenance Approach and Funding
Several reasons have likely contributed to the recent decline in arterial pavement quality:
Evidence suggests that the increasing use of heavy vehicles on Seattle’s arterials, and in particular diesel/electric articulated buses, which have uniquely heavy axle loads, are accelerating a decline in pavement quality on arterials.
More stringent Americans with Disability Act (ADA) requirements which add to paving project costs in the form of replaced or retrofit curb ramps.
State safety rules limiting the equipment that can work around Metro trolley bus lines, pushing work onto weekends at overtime rates.
Beginning in 2006, Seattle Public Utilities (SPU) began requiring SDOT to fund and construct
drainage improvements on virtually all paving contracts involving full-depth pavement repairs. Paving projects must now install storm water detention and treatment facilities in accordance with the City’s Stormwater Code to meet SPU requirements.
The provisions of the “Complete Streets” ordinance and resolution require paving projects to improve the ROW for all modes of transportation.
Compounded inflation over the 9-year life of BTG means that a dollar spent in 2015 has about 20% less buying power than a dollar spent in 2007. Available funding does not accomplish as much paving as in previous decades.
2015 Status and Condition Report – Pavement System | 69

Useful Life & Life Cycle Cost of Arterial Pavement
Delaying repairs on arterial pavement when the pavement condition indicates a need creates deferred maintenance. Deferred maintenance is work that is postponed to a future budget cycle or until funds are available. As maintenance is continuously deferred, arterial pavement deteriorates to the point where it will eventually need to be replaced or reconstructed.
When an existing pavement structure is sound, we can often renew the driving surface at a fraction of the cost of digging up and replacing the entire roadway. The 2007 paving work on N/NE 45P
thP St in Wallingford and the
University District and the 2014 paving on Holman Rd NW in Ballard are two examples of resurfacing or surface renewal projects. If we cannot apply a major maintenance treatment, the arterial pavement structure continues to deteriorate to the point where it must be completely reconstructed as shown in the graph below. Reconstruction, where we remove and replace the entire pavement structure, is approximately 5 to 7 times more costly than resurfacing or other forms of major maintenance. An example of a reconstruction project is 15P
thP Ave NE along the University of Washington campus in 2011. Pavement managers strive to follow a lowest
life-cycle-cost approach to pavement maintenance, emphasizing treatments that extend the life of existing pavement structures where possible. However, we must balance this against reconstruction needs on streets critical to the transportation system.
Chart V: Cost of Restoration Increases as Pavement Condition Declines
Project Prioritization
SDOT is embarking on an improved method of prioritizing pavement preservation and restoration work by determining the highest benefit-to-cost street segments in need of maintenance treatment. By estimating the cost to road users of deteriorated pavement conditions and the cost of appropriate treatment to restore its condition, we can calculate a benefit/cost ratio for restoring each street segment. The benefit/cost ratio will provide a first-cut screening of street segments with highest priority to receive limited funds for pavement rehabilitation.
SDOT’s tool for first-cut prioritization is under development. This tool will be an economic decision model that uses street segment data on: a) traffic –
average daily volume of cars, trucks, buses and bikes, b) current pavement condition, c) future condition based on expected deterioration rate without treatment based on pavement type and use, d) impact on vehicle operating costs of current and future pavement condition, and e) the cost of pavement restoration using the appropriate treatment with the lowest life-cycle cost for each segment.
The model will calculate the life-cycle benefits to road users from reduced vehicle operating costs and compare them to the life-cycle costs of pavement restoration. We rank streets with high traffic volumes (including vehicle, , highly deteriorated
$0
$100,000
$200,000
$300,000
$400,000
$500,000
$600,000
$700,000
$800,000
020406080100An
nual
ized
Life
Cyc
le C
ost p
er M
ile
PCI
Crack Seal & Microsurfacing
Mill & Overlay
Reconstruction
2015 Status and Condition Report – Pavement System | 70
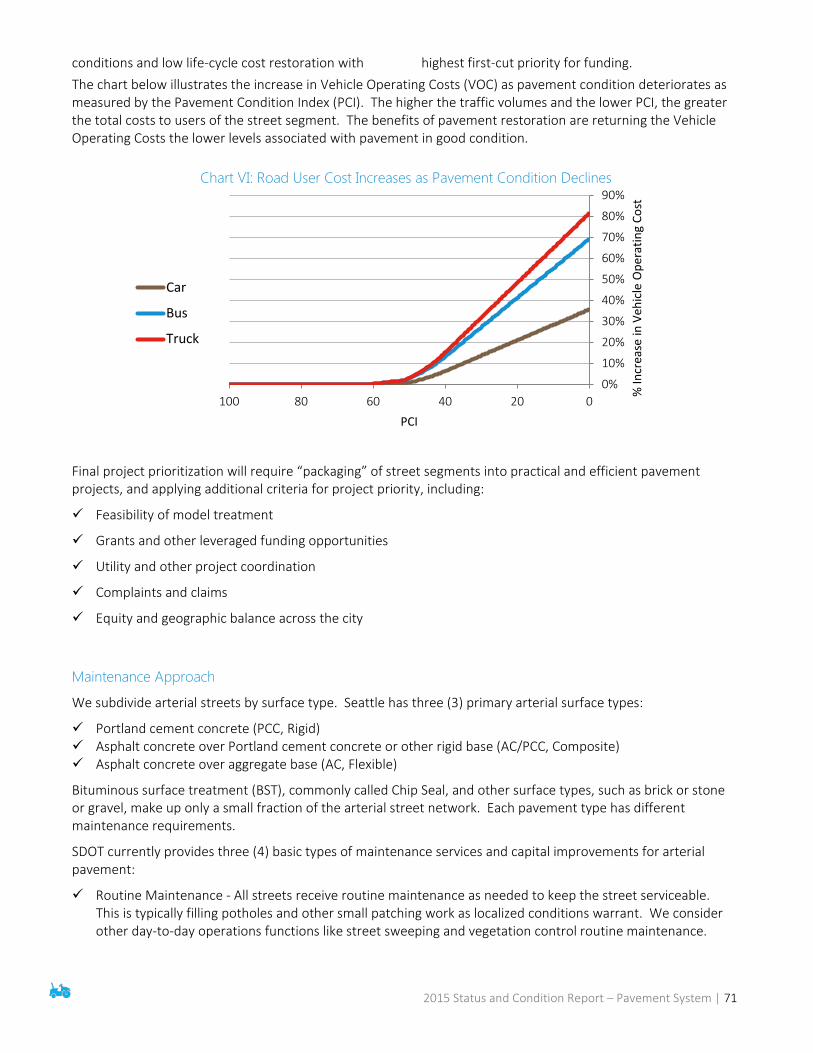
conditions and low life-cycle cost restoration with highest first-cut priority for funding. The chart below illustrates the increase in Vehicle Operating Costs (VOC) as pavement condition deteriorates as measured by the Pavement Condition Index (PCI). The higher the traffic volumes and the lower PCI, the greater the total costs to users of the street segment. The benefits of pavement restoration are returning the Vehicle Operating Costs the lower levels associated with pavement in good condition.
Final project prioritization will require “packaging” of street segments into practical and efficient pavement projects, and applying additional criteria for project priority, including:
Feasibility of model treatment
Grants and other leveraged funding opportunities
Utility and other project coordination
Complaints and claims
Equity and geographic balance across the city
Maintenance Approach
We subdivide arterial streets by surface type. Seattle has three (3) primary arterial surface types:
Portland cement concrete (PCC, Rigid) Asphalt concrete over Portland cement concrete or other rigid base (AC/PCC, Composite) Asphalt concrete over aggregate base (AC, Flexible)
Bituminous surface treatment (BST), commonly called Chip Seal, and other surface types, such as brick or stone or gravel, make up only a small fraction of the arterial street network. Each pavement type has different maintenance requirements.
SDOT currently provides three (4) basic types of maintenance services and capital improvements for arterial pavement:
Routine Maintenance - All streets receive routine maintenance as needed to keep the street serviceable. This is typically filling potholes and other small patching work as localized conditions warrant. We consider other day-to-day operations functions like street sweeping and vegetation control routine maintenance.
0%
10%
20%
30%
40%
50%
60%
70%
80%
90%
020406080100
% In
crea
se in
Veh
icle
Ope
ratin
g Co
st
PCI
Car
Bus
Truck
Chart VI: Road User Cost Increases as Pavement Condition Declines
2015 Status and Condition Report – Pavement System | 71
Preventive Maintenance – Streets with a PCI rating of 61-80 are typically candidates for preventive maintenance. These are streets that are smooth, in good structural condition, and have only minor defects related to exposure to the elements. Work of this type typically consists of low cost preservation treatments such as sealing cracks & joints and, on asphalt pavements, the application of surface seals.
Major Maintenance or Minor Rehabilitation – We typically consider streets with a PCI rating of 41-60 candidates for major maintenance. These are typically deeper preservation treatments intended to extend the life of the existing pavement structure. Common treatments in this category include milling off the top layer of an asphalt pavement and then overlaying a new asphalt surface and, on concrete pavements, replacing select concrete panels and re-profiling the surface.
Reconstruction or Major Rehabilitation – When streets fall below a PCI of 40, they have typically accumulated enough structural distress where they must be reconstructed from the subgrade all the way to the surface. In some cases, we can save a portion of the existing pavement and refer to it as partial reconstruction.
While BTG provided a substantial increase in funding for SDOT’s arterial pavement starting in 2007, the overall quality of Seattle’s arterial pavement has declined recently, particularly from 2010-present.
2015 Status and Condition Report – Pavement System | 72
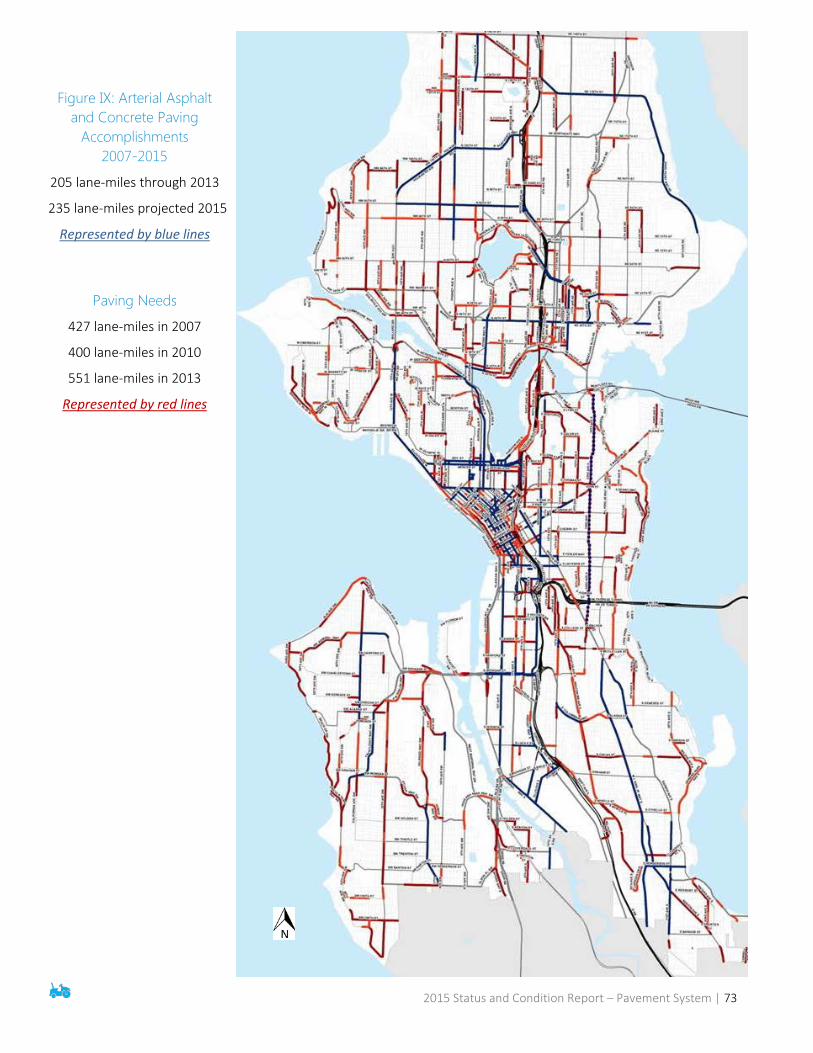
Figure IX: Arterial Asphalt and Concrete Paving
Accomplishments 2007-2015
205 lane-miles through 2013
235 lane-miles projected 2015
Represented by blue lines
Paving Needs
427 lane-miles in 2007
400 lane-miles in 2010
551 lane-miles in 2013
Represented by red lines
2015 Status and Condition Report – Pavement System | 73
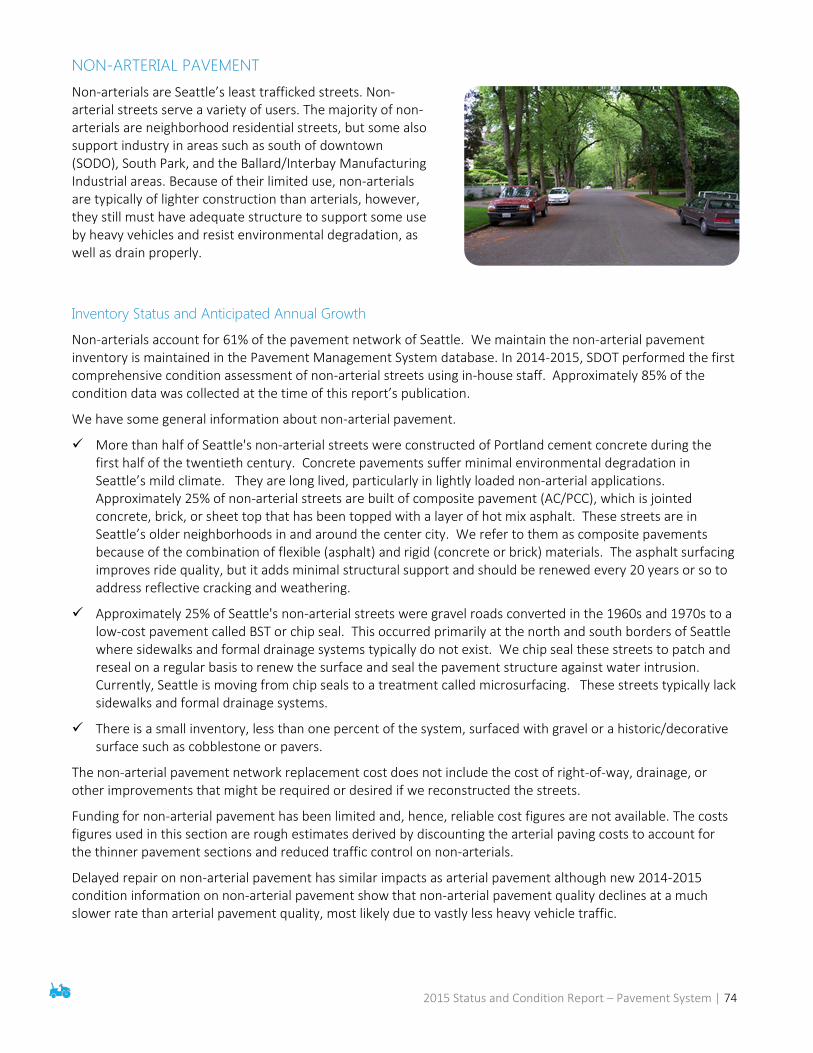
NON-ARTERIAL PAVEMENT Non-arterials are Seattle’s least trafficked streets. Non-arterial streets serve a variety of users. The majority of non-arterials are neighborhood residential streets, but some also support industry in areas such as south of downtown (SODO), South Park, and the Ballard/Interbay Manufacturing Industrial areas. Because of their limited use, non-arterials are typically of lighter construction than arterials, however, they still must have adequate structure to support some use by heavy vehicles and resist environmental degradation, as well as drain properly.
Inventory Status and Anticipated Annual Growth
Non-arterials account for 61% of the pavement network of Seattle. We maintain the non-arterial pavement inventory is maintained in the Pavement Management System database. In 2014-2015, SDOT performed the first comprehensive condition assessment of non-arterial streets using in-house staff. Approximately 85% of the condition data was collected at the time of this report’s publication.
We have some general information about non-arterial pavement.
More than half of Seattle's non-arterial streets were constructed of Portland cement concrete during the first half of the twentieth century. Concrete pavements suffer minimal environmental degradation in Seattle’s mild climate. They are long lived, particularly in lightly loaded non-arterial applications. Approximately 25% of non-arterial streets are built of composite pavement (AC/PCC), which is jointed concrete, brick, or sheet top that has been topped with a layer of hot mix asphalt. These streets are in Seattle’s older neighborhoods in and around the center city. We refer to them as composite pavements because of the combination of flexible (asphalt) and rigid (concrete or brick) materials. The asphalt surfacing improves ride quality, but it adds minimal structural support and should be renewed every 20 years or so to address reflective cracking and weathering.
Approximately 25% of Seattle's non-arterial streets were gravel roads converted in the 1960s and 1970s to a low-cost pavement called BST or chip seal. This occurred primarily at the north and south borders of Seattle where sidewalks and formal drainage systems typically do not exist. We chip seal these streets to patch and reseal on a regular basis to renew the surface and seal the pavement structure against water intrusion. Currently, Seattle is moving from chip seals to a treatment called microsurfacing. These streets typically lack sidewalks and formal drainage systems.
There is a small inventory, less than one percent of the system, surfaced with gravel or a historic/decorative surface such as cobblestone or pavers.
The non-arterial pavement network replacement cost does not include the cost of right-of-way, drainage, or other improvements that might be required or desired if we reconstructed the streets.
Funding for non-arterial pavement has been limited and, hence, reliable cost figures are not available. The costs figures used in this section are rough estimates derived by discounting the arterial paving costs to account for the thinner pavement sections and reduced traffic control on non-arterials.
Delayed repair on non-arterial pavement has similar impacts as arterial pavement although new 2014-2015 condition information on non-arterial pavement show that non-arterial pavement quality declines at a much slower rate than arterial pavement quality, most likely due to vastly less heavy vehicle traffic.
2015 Status and Condition Report – Pavement System | 74

Asset Inventory
Count Data
Confidence
Design Life
(Years, typical)
System Replacement
Value
Anticipated Annual Growth
Concrete Rigid (PCC)
1,278 Medium 40+ Unknown
Asphalt Flexible (AC or AC/AC)
562 Medium
20+ Unknown
Composite (AC/PCC)
9 Medium
20+ Unknown
Bituminous Surface Treatment (BST)
548 Medium
20+ Unknown
Gravel (GR) 5 Medium Unknown
Other (O) 5 Medium Unknown
Total 2,407 Medium $3,884,000,000
Maintenance Approach
We subdivide non-arterial streets by surface type. Seattle has four (4) primary non-arterial surface types:
Portland cement concrete (PCC) Asphalt concrete over Portland cement concrete
or other rigid base (AC/PCC) Asphalt concrete over flexible base (AC) BST (Chip Seal)
Brick, stone, or gravel (classified as other) makes up a small fraction of the non-arterial street network. Each pavement type has different maintenance requirements. A breakdown of non-arterial surface types is shown below. The table also contrasts SDOT non-arterial pavement maintenance practices with the standard replacement cycles for each surface type.
Life Cycle Costs, Maintenance Approach and Funding
SDOT currently provides two (2) basic types of maintenance services for non-arterial pavement:
Pothole and Spot repair Preventive maintenance (rehabilitation)
Pothole and spot repair does not improve non-arterial pavement condition, but is a stop-gap measure to keep the streets in a safe driving condition until a major rehabilitation project can be undertaken.
We perform routine or preventive maintenance (rehabilitation) as funds permit. The transportation levy funding does not provide for non-arterial pavement maintenance. The current maintenance budget primarily provides spot safety repair and a small amount of asphalt and concrete rehabilitation, including microsurfacing under SDOT’s Preventive Maintenance Program.
2015 Status and Condition Report – Pavement System | 75

Asset Class – Real Property Section 7
The Real Property asset class includes land, buildings, and yards that support SDOT transportation purposes. While SDOT’s primary mission is the management of the ROW, the department owns real property assets for several reasons. Firstly, SDOT uses operations buildings and yards to support maintenance activities and personnel. SDOT pays for capital improvements and maintenance on SDOT real property. Property used for operations is either under the jurisdiction of SDOT or is located on leased land. SDOT, Department of Finance and Administrative Services (FAS) or by King County Facility Operations provide maintenance and management of operational facilities. Secondly, transportation capital projects have acquired some parcels and buildings, which include a variety public and private uses. FAS’s Facility Operation’s Division, with direction from SDOT’s CPRS Division, manages these parcels and buildings.
*Replacement value excludes non-transportation related infrastructure, captured in the report below.
Performance Measures 2014 Planned 2014 Results 2015 Planned
Facility Upgrades 1
Parcels disposed or transferred 1 1 4
The Facility Operations Division in FAS maintains a comprehensive inventory of real property assets owned by SDOT in the Real Property Asset Management System. In cooperation with SDOT’s CPRS Division, FAS provides varying degrees of management services for non-transportation related infrastructure. SDOT manages assets that affect the delivery of transportation services to the public.
BUILDINGS & YARDS SDOT owns buildings that support transportation services and buildings indirectly acquired through the ROW acquisition process for capital projects. When acquiring parcels for street and multi-purpose ROW usage, a parcel may have a building present, which is purchased as part of the transaction. Buildings that directly support the delivery of transportation services are typically sited on FAS jurisdictional properties. These buildings support several divisions in SDOT including Maintenance Operations (MO), Capital Projects and Roadway Structures (CPRS), Transit & Mobility (TM), and Transportation Operations (TO). These buildings include:
Asset
Replacement Value
Condition Data Confidence
Good
Fair
Poor Unk
Buildings & Yards *$80,500,000 40% 40% 20% N/A Medium-High Parcels N/A - - - N/A Medium-High Shoreline Street Ends (ROW) N/A - - - N/A Medium-Low
2015 Status and Condition Report – Real Property | 76
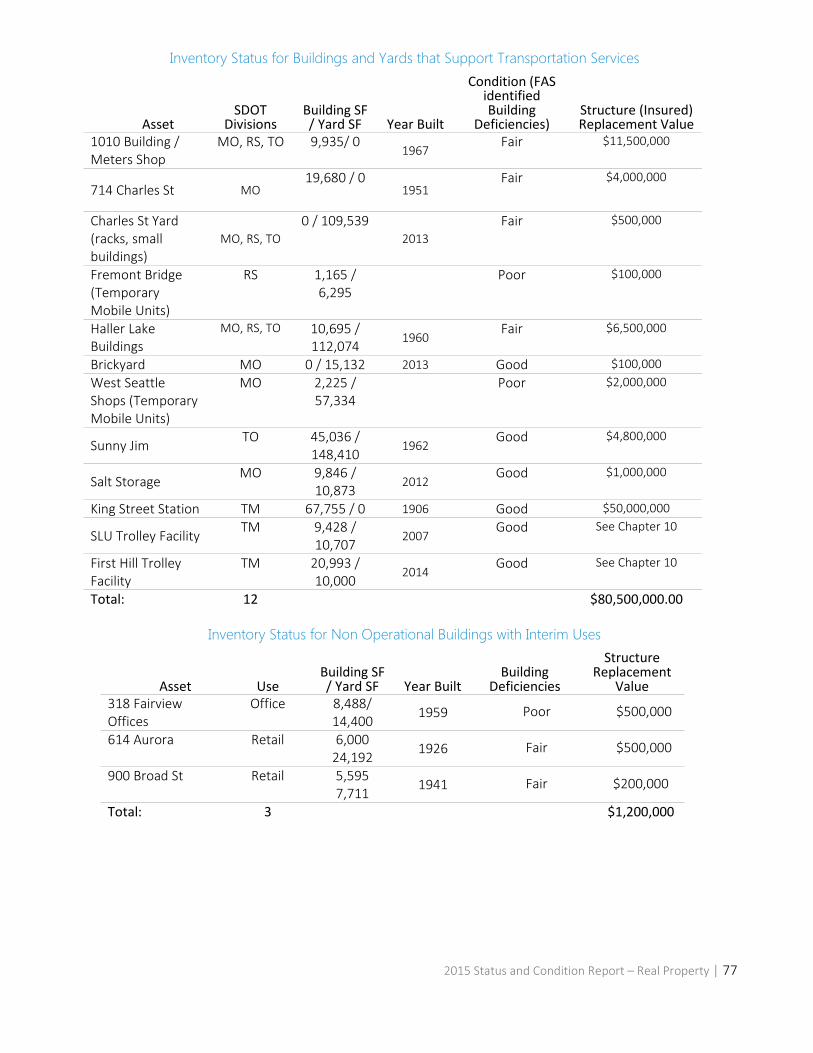
Inventory Status for Buildings and Yards that Support Transportation Services
Asset SDOT
Divisions Building SF / Yard SF Year Built
Condition (FAS identified Building
Deficiencies) Structure (Insured) Replacement Value
1010 Building / Meters Shop
MO, RS, TO 9,935/ 0 1967
Fair $11,500,000
714 Charles St MO 19,680 / 0
1951 Fair $4,000,000
Charles St Yard (racks, small buildings)
MO, RS, TO 0 / 109,539
2013 Fair $500,000
Fremont Bridge (Temporary Mobile Units)
RS 1,165 / 6,295
Poor $100,000
Haller Lake Buildings
MO, RS, TO 10,695 / 112,074
1960 Fair $6,500,000
Brickyard MO 0 / 15,132 2013 Good $100,000 West Seattle Shops (Temporary Mobile Units)
MO 2,225 / 57,334
Poor $2,000,000
Sunny Jim TO 45,036 / 148,410
1962 Good $4,800,000
Salt Storage MO 9,846 / 10,873
2012 Good $1,000,000
King Street Station TM 67,755 / 0 1906 Good $50,000,000
SLU Trolley Facility TM 9,428 / 10,707
2007 Good See Chapter 10
First Hill Trolley Facility
TM 20,993 / 10,000
2014 Good See Chapter 10
Total: 12 $80,500,000.00
Inventory Status for Non Operational Buildings with Interim Uses
Asset Use Building SF / Yard SF Year Built
Building Deficiencies
Structure Replacement
Value 318 Fairview Offices
Office 8,488/ 14,400 1959 Poor $500,000
614 Aurora Retail 6,000 24,192 1926 Fair $500,000
900 Broad St Retail 5,595 7,711 1941 Fair $200,000
Total: 3 $1,200,000
2015 Status and Condition Report – Real Property | 77

Life Cycle Costs, Maintenance Approach and Funding The useful life of a building depends on the materials and level of ongoing maintenance. The cost of a new building varies considerably.
The lifecycle cost of routine maintenance on buildings has a large range depending on the size,
material, and complexity of the building. We fund operational costs out of a general budget and have not historically tracked cost by building. We repair buildings on a priority basis up to the level of available funding.
PARCELS A parcel is a defined piece of real estate consisting of physical land. SDOT jurisdictional parcels have been acquired for capital projects, or are properties remaining after projects are completed, or parcels that need to be dedicated as ROW. Some parcels are remnants of former railroad ROW purchased for the Burke Gilman Trail. We purchased other parcels are large pieces or remnants that for various reasons, such as to widen streets and sidewalks, and for constructing bicycle and pedestrian trails. These parcels may include buildings or other structures. The Facilities Division of the Department of Finance and Administration (FAS) maintains an inventory of city-owned property, including those parcels under the jurisdiction of SDOT.
Inventory Status and Anticipated Annual Growth As capital projects are completed, and at the direction of SDOT, FAS manages the disposal or jurisdictional transfer of excess SDOT parcels. In 2015 FAS identified a work plan for the eventual transfer of jurisdiction or disposal of many excess SDOT properties:
Asset Inventory Count
Data Confidence
Anticipated Annual Growth
Parcels to be Retained and Dedicated as ROW*
12 -1 to -4
Parcels to be Jurisdictionally Transferred to Other City Departments
7 -1 to -4
Parcels to be Disposed of 32 -1 to -4 Parcel Options Under Development 6
Total 57 High Unknown
*May involve a partial parcel transfer.
The parcel inventory is recorded in the Real Property Asset Management Information System.
Anticipated annual growth for this asset is identified as property disposal or surplus, which is subject to City Council approval and City of Seattle surplus procedures and applicable street vacation requirements as noted under RCW Title 35.79, Ordinance 113915, and Clerk File 310078.
2015 Status and Condition Report – Real Property | 78
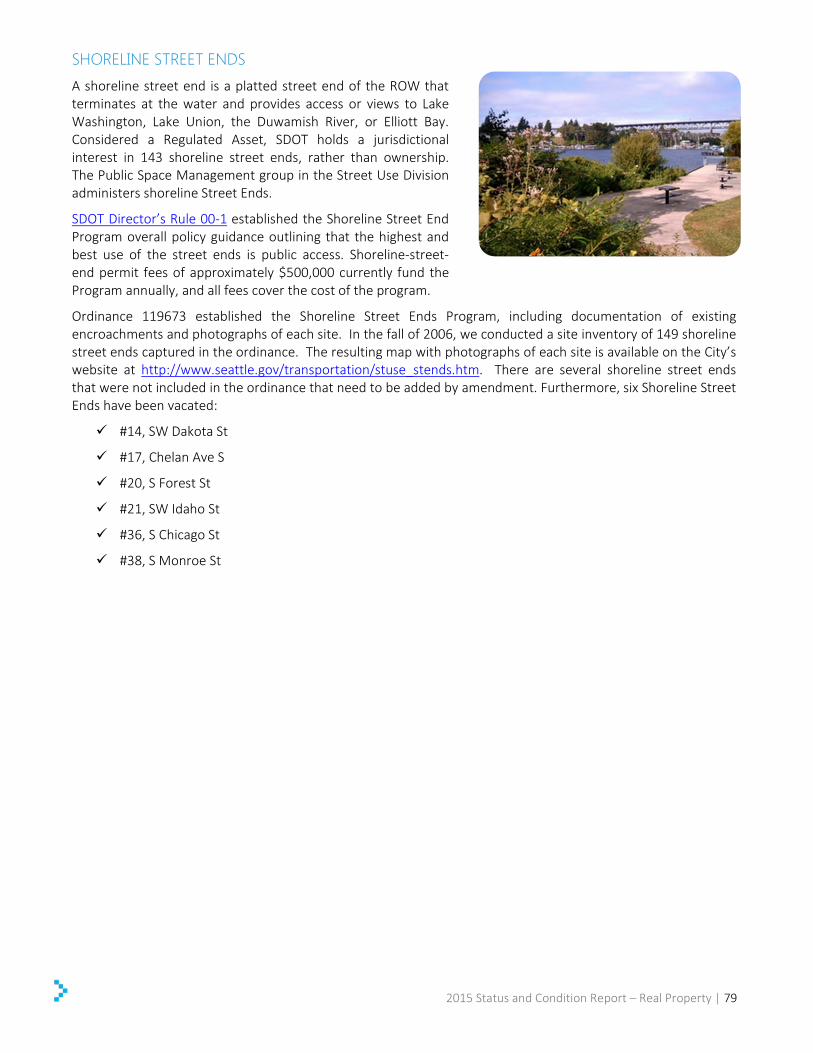
SHORELINE STREET ENDS A shoreline street end is a platted street end of the ROW that terminates at the water and provides access or views to Lake Washington, Lake Union, the Duwamish River, or Elliott Bay. Considered a Regulated Asset, SDOT holds a jurisdictional interest in 143 shoreline street ends, rather than ownership. The Public Space Management group in the Street Use Division administers shoreline Street Ends.
SDOT Director’s Rule 00-1 established the Shoreline Street End Program overall policy guidance outlining that the highest and best use of the street ends is public access. Shoreline-street-end permit fees of approximately $500,000 currently fund the Program annually, and all fees cover the cost of the program.
Ordinance 119673 established the Shoreline Street Ends Program, including documentation of existing encroachments and photographs of each site. In the fall of 2006, we conducted a site inventory of 149 shoreline street ends captured in the ordinance. The resulting map with photographs of each site is available on the City’s website at http://www.seattle.gov/transportation/stuse_stends.htm. There are several shoreline street ends that were not included in the ordinance that need to be added by amendment. Furthermore, six Shoreline Street Ends have been vacated:
#14, SW Dakota St
#17, Chelan Ave S
#20, S Forest St
#21, SW Idaho St
#36, S Chicago St
#38, S Monroe St
2015 Status and Condition Report – Real Property | 79
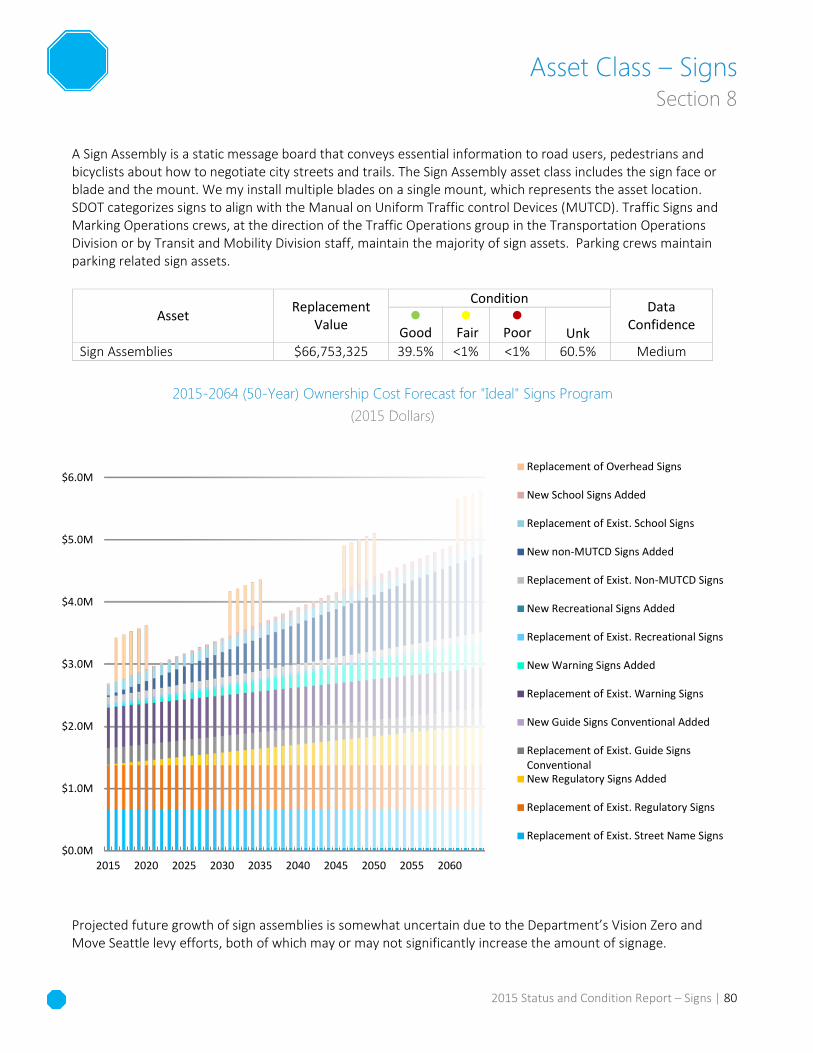
Asset Class – Signs Section 8
SIGN ASSEMBLIES A Sign Assembly is a static message board that conveys essential information to road users, pedestrians and bicyclists about how to negotiate city streets and trails. The Sign Assembly asset class includes the sign face or blade and the mount. We my install multiple blades on a single mount, which represents the asset location. SDOT categorizes signs to align with the Manual on Uniform Traffic control Devices (MUTCD). Traffic Signs and Marking Operations crews, at the direction of the Traffic Operations group in the Transportation Operations Division or by Transit and Mobility Division staff, maintain the majority of sign assets. Parking crews maintain parking related sign assets.
2015-2064 (50-Year) Ownership Cost Forecast for "Ideal" Signs Program
(2015 Dollars)
Projected future growth of sign assemblies is somewhat uncertain due to the Department’s Vision Zero and Move Seattle levy efforts, both of which may or may not significantly increase the amount of signage.
$0.0M
$1.0M
$2.0M
$3.0M
$4.0M
$5.0M
$6.0M
2015 2020 2025 2030 2035 2040 2045 2050 2055 2060
Replacement of Overhead Signs
New School Signs Added
Replacement of Exist. School Signs
New non-MUTCD Signs Added
Replacement of Exist. Non-MUTCD Signs
New Recreational Signs Added
Replacement of Exist. Recreational Signs
New Warning Signs Added
Replacement of Exist. Warning Signs
New Guide Signs Conventional Added
Replacement of Exist. Guide SignsConventionalNew Regulatory Signs Added
Replacement of Exist. Regulatory Signs
Replacement of Exist. Street Name Signs
Asset Replacement Value
Condition Data Confidence
Good
Fair
Poor
Unk Sign Assemblies $66,753,325 10T39.5% 10T<1% 10T<1% 10T60.5% 10TMedium
2015 Status and Condition Report – Signs | 80

Performance Measures 2014 Planned 2014 Results 2015 Planned
School zones with safety signs improved 6 6 7
Regulatory street signs replaced 2,000 3,144 2,000
Street name signs replaced (by intersection)
1,250 1,264 1,650
# of miles of bike route signs installed 26.5 miles 26.5 miles 29 miles
Inventory Status and Anticipated Annual Growth
The department has maintained an inventory of signs since the 1920s when they were initially recorded in a system of card files. From 1979-1981, this inventory was transcribed into electronic format in the Data General System which was later imported into the Hansen Asset Management database in 2000 where it is currently maintained. This inventory counted the signs rather than the sign assemblies. Multiple signs may exist on any sign assembly. SDOT’s current inventory of signs is as follows:
Asset Inventory
Count Data
Confidence Replacement
Value
Useful Life
(Years)
System Replacement
Value
Anticipated Annual Growth
Regulatory Signs (R1-R6, R9-R10)
23,701 Medium-High
$400 10 $9,480,400
250-420
Regulatory Parking Signs (R7-R8)
82,951 Medium -High
$250 12 $20,737,750
200
Guide Signs Conventional (non-SNS)
36,662 Low $500 15
$18,331,000 Unknown
Street Name Signs (D3-103, D3-104, D-106)
8,309 High $275 15
$2,284,975 Unknown
Warning Signs 19,635 Medium-Low
$400 12 $7,854,000
240
Recreational and Cultural Interest, Tourist Direction Signs
1,452
Medium-low $500 15
$726,000
Unknown
Non-MUTCD Signs**
3,564 Low $500 15
$1,782,000 750
School Signs 5,143 Medium high
$400 12 $2,057,200
100
Overhead Signs 1,000 (e) Low $3,500 15 $3,500,000 Unknown Total 182,417 Medium $66,753,325
* Regulatory Parking (R7-R8) signs are not included in this section but are discussed in Parking Payment Devices (Section 6) of this report.
**Non-MUTCD Signs include bike / pedestrian wayfinding, neighborhood identification, alley utilization regulation, storage of material, no loitering, shoreline street end signs, views, and tourist direction signs.
2015 Status and Condition Report – Signs | 81
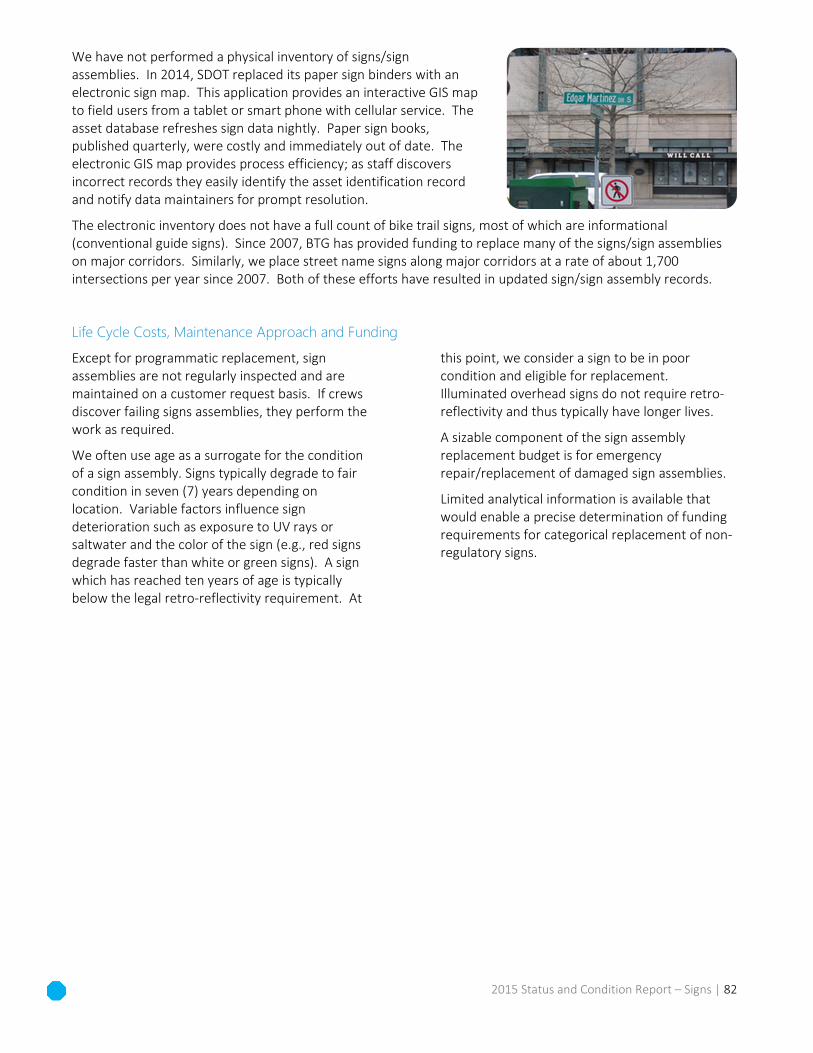
We have not performed a physical inventory of signs/sign assemblies. In 2014, SDOT replaced its paper sign binders with an electronic sign map. This application provides an interactive GIS map to field users from a tablet or smart phone with cellular service. The asset database refreshes sign data nightly. Paper sign books, published quarterly, were costly and immediately out of date. The electronic GIS map provides process efficiency; as staff discovers incorrect records they easily identify the asset identification record and notify data maintainers for prompt resolution.
The electronic inventory does not have a full count of bike trail signs, most of which are informational (conventional guide signs). Since 2007, BTG has provided funding to replace many of the signs/sign assemblies on major corridors. Similarly, we place street name signs along major corridors at a rate of about 1,700 intersections per year since 2007. Both of these efforts have resulted in updated sign/sign assembly records.
Life Cycle Costs, Maintenance Approach and Funding
Except for programmatic replacement, sign assemblies are not regularly inspected and are maintained on a customer request basis. If crews discover failing signs assemblies, they perform the work as required.
We often use age as a surrogate for the condition of a sign assembly. Signs typically degrade to fair condition in seven (7) years depending on location. Variable factors influence sign deterioration such as exposure to UV rays or saltwater and the color of the sign (e.g., red signs degrade faster than white or green signs). A sign which has reached ten years of age is typically below the legal retro-reflectivity requirement. At
this point, we consider a sign to be in poor condition and eligible for replacement. Illuminated overhead signs do not require retro-reflectivity and thus typically have longer lives.
A sizable component of the sign assembly replacement budget is for emergency repair/replacement of damaged sign assemblies.
Limited analytical information is available that would enable a precise determination of funding requirements for categorical replacement of non-regulatory signs.
2015 Status and Condition Report – Signs | 82
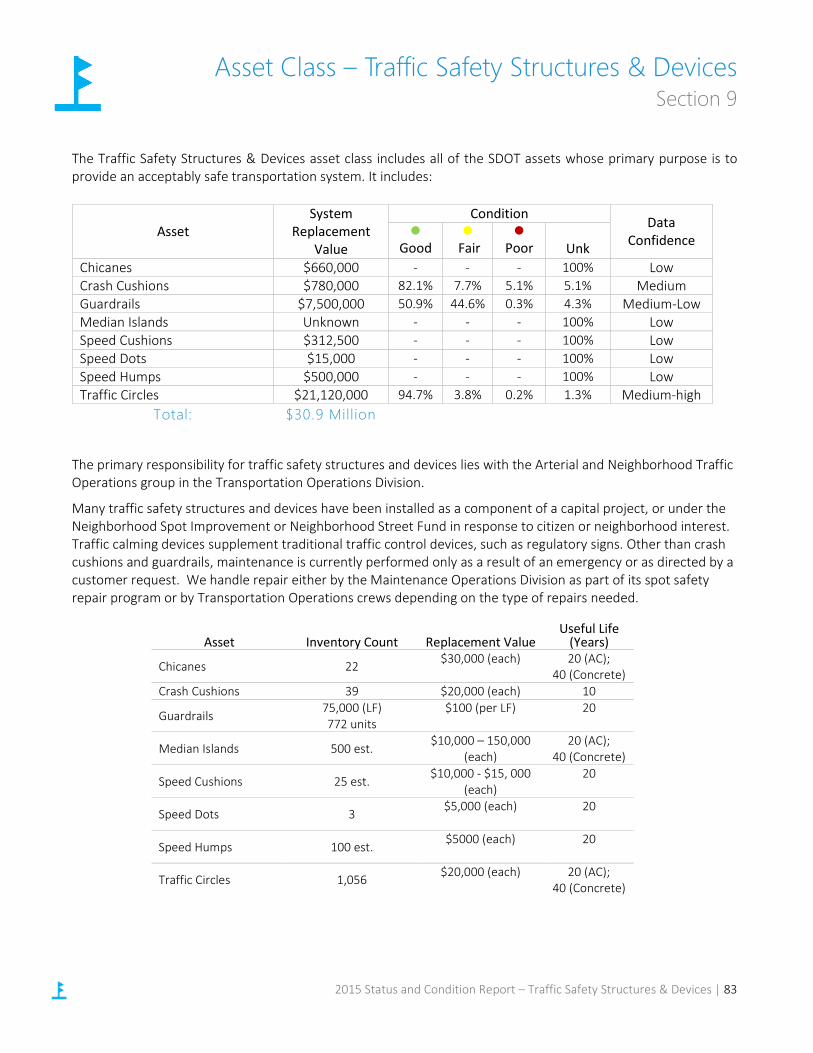
Asset Class – Traffic Safety Structures & Devices Section 9
The Traffic Safety Structures & Devices asset class includes all of the SDOT assets whose primary purpose is to provide an acceptably safe transportation system. It includes:
The primary responsibility for traffic safety structures and devices lies with the Arterial and Neighborhood Traffic Operations group in the Transportation Operations Division.
Many traffic safety structures and devices have been installed as a component of a capital project, or under the Neighborhood Spot Improvement or Neighborhood Street Fund in response to citizen or neighborhood interest. Traffic calming devices supplement traditional traffic control devices, such as regulatory signs. Other than crash cushions and guardrails, maintenance is currently performed only as a result of an emergency or as directed by a customer request. We handle repair either by the Maintenance Operations Division as part of its spot safety repair program or by Transportation Operations crews depending on the type of repairs needed.
Asset Inventory Count Replacement Value Useful Life
(Years)
Chicanes 22 $30,000 (each) 20 (AC); 40 (Concrete)
Crash Cushions 39 $20,000 (each) 10
Guardrails 75,000 (LF) 772 units
$100 (per LF) 20
Median Islands 500 est. $10,000 – 150,000
(each) 20 (AC);
40 (Concrete)
Speed Cushions 25 est. $10,000 - $15, 000
(each) 20
Speed Dots 3 $5,000 (each) 20
Speed Humps 100 est. $5000 (each) 20
Traffic Circles 1,056 $20,000 (each) 20 (AC); 40 (Concrete)
Asset System
Replacement Value
Condition Data Confidence
Good
Fair
Poor
Unk Chicanes $660,000 10T- 10T- 10T- 100% Low Crash Cushions $780,000 82.1% 7.7% 5.1% 5.1% Medium Guardrails $7,500,000 50.9% 44.6% 0.3% 4.3% Medium-Low Median Islands Unknown 10T- 10T- 10T- 100% Low Speed Cushions $312,500 10T- 10T- 10T- 100% Low Speed Dots $15,000 10T- 10T- 10T- 100% Low Speed Humps $500,000 10T- 10T- 10T- 100% Low Traffic Circles $21,120,000 94.7% 3.8% 0.2% 1.3% Medium-high
Total: $30.9 Million
2015 Status and Condition Report – Traffic Safety Structures & Devices | 83
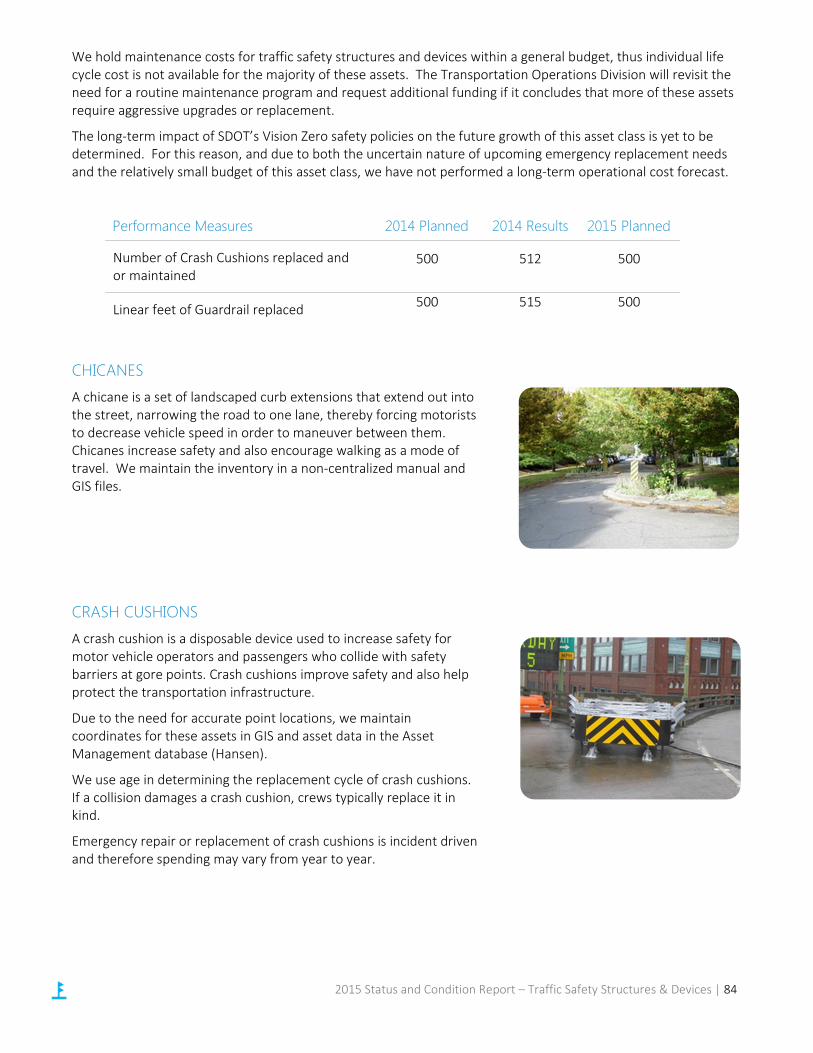
We hold maintenance costs for traffic safety structures and devices within a general budget, thus individual life cycle cost is not available for the majority of these assets. The Transportation Operations Division will revisit the need for a routine maintenance program and request additional funding if it concludes that more of these assets require aggressive upgrades or replacement.
The long-term impact of SDOT’s Vision Zero safety policies on the future growth of this asset class is yet to be determined. For this reason, and due to both the uncertain nature of upcoming emergency replacement needs and the relatively small budget of this asset class, we have not performed a long-term operational cost forecast.
Performance Measures 2014 Planned 2014 Results 2015 Planned
Number of Crash Cushions replaced and or maintained
500 512 500
Linear feet of Guardrail replaced 500 515 500
CHICANES A chicane is a set of landscaped curb extensions that extend out into the street, narrowing the road to one lane, thereby forcing motorists to decrease vehicle speed in order to maneuver between them. Chicanes increase safety and also encourage walking as a mode of travel. We maintain the inventory in a non-centralized manual and GIS files.
CRASH CUSHIONS A crash cushion is a disposable device used to increase safety for motor vehicle operators and passengers who collide with safety barriers at gore points. Crash cushions improve safety and also help protect the transportation infrastructure.
Due to the need for accurate point locations, we maintain coordinates for these assets in GIS and asset data in the Asset Management database (Hansen).
We use age in determining the replacement cycle of crash cushions. If a collision damages a crash cushion, crews typically replace it in kind.
Emergency repair or replacement of crash cushions is incident driven and therefore spending may vary from year to year.
2015 Status and Condition Report – Traffic Safety Structures & Devices | 84
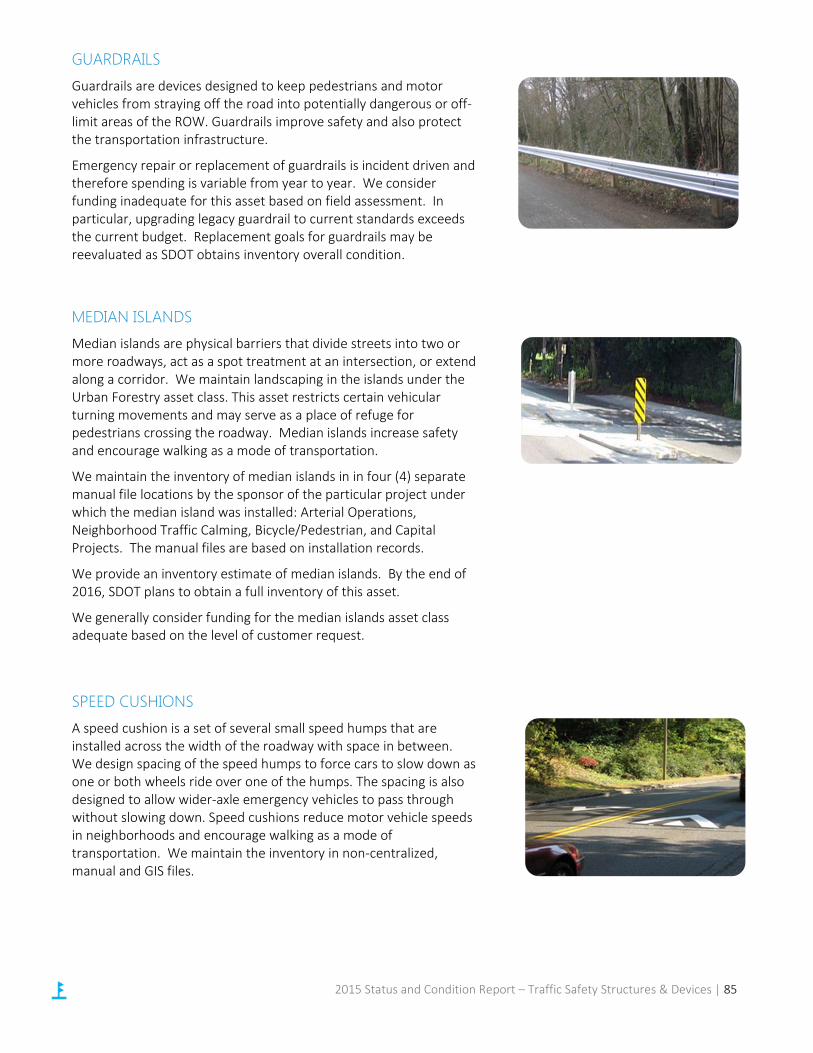
GUARDRAILS Guardrails are devices designed to keep pedestrians and motor vehicles from straying off the road into potentially dangerous or off-limit areas of the ROW. Guardrails improve safety and also protect the transportation infrastructure.
Emergency repair or replacement of guardrails is incident driven and therefore spending is variable from year to year. We consider funding inadequate for this asset based on field assessment. In particular, upgrading legacy guardrail to current standards exceeds the current budget. Replacement goals for guardrails may be reevaluated as SDOT obtains inventory overall condition.
MEDIAN ISLANDS Median islands are physical barriers that divide streets into two or more roadways, act as a spot treatment at an intersection, or extend along a corridor. We maintain landscaping in the islands under the Urban Forestry asset class. This asset restricts certain vehicular turning movements and may serve as a place of refuge for pedestrians crossing the roadway. Median islands increase safety and encourage walking as a mode of transportation.
We maintain the inventory of median islands in in four (4) separate manual file locations by the sponsor of the particular project under which the median island was installed: Arterial Operations, Neighborhood Traffic Calming, Bicycle/Pedestrian, and Capital Projects. The manual files are based on installation records.
We provide an inventory estimate of median islands. By the end of 2016, SDOT plans to obtain a full inventory of this asset.
We generally consider funding for the median islands asset class adequate based on the level of customer request.
SPEED CUSHIONS A speed cushion is a set of several small speed humps that are installed across the width of the roadway with space in between. We design spacing of the speed humps to force cars to slow down as one or both wheels ride over one of the humps. The spacing is also designed to allow wider-axle emergency vehicles to pass through without slowing down. Speed cushions reduce motor vehicle speeds in neighborhoods and encourage walking as a mode of transportation. We maintain the inventory in non-centralized, manual and GIS files.
2015 Status and Condition Report – Traffic Safety Structures & Devices | 85

SPEED DOTS A speed dot is a raised section of pavement in the middle of an intersection and is intended to slow traffic. While uncommon, we use these assets as an alternative to a traffic circle. We maintain the inventory in manual and GIS files.
SPEED HUMPS A speed hump is a paved mound in the street that forces motor vehicles to slow down. Speed humps improve safety and encourage walking as a mode of transportation. We maintain the inventory in manual and GIS files.
We generally consider maintenance funding for existing speed humps adequate. However, the department receives up to five times more requests for new installation of speed humps than can be funded.
TRAFFIC CIRCLES Traffic circles are raised islands constructed at intersections of residential streets. Traffic circles provide separation of oncoming vehicles and cause motorists to decrease speed. Many of SDOT’s existing traffic circles include landscaping, which a local neighborhood group maintains. However, enthusiasm to maintain the landscaping has diminished over time for many traffic circles. Traffic circles increase safety for pedestrians and bicyclists by reducing speeds. When landscaped, they also contribute to a more vibrant neighborhood.
We maintain the inventory of traffic circles in the Hansen system in the Transportation Operations engineering office and is based on installation records verified against an independent source.
We generally consider funding adequate based on the level of customer request.
2015 Status and Condition Report – Traffic Safety Structures & Devices | 86
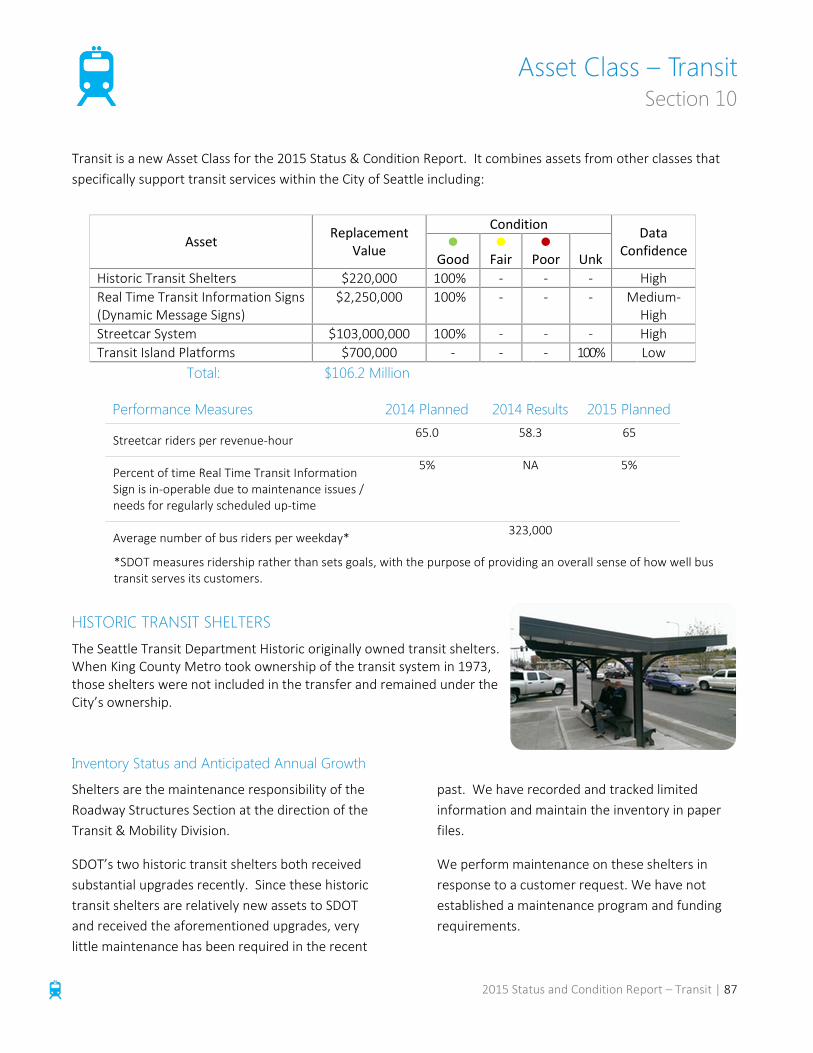
Asset Class – Transit Section 10
Transit is a new Asset Class for the 2015 Status & Condition Report. It combines assets from other classes that specifically support transit services within the City of Seattle including:
Performance Measures 2014 Planned 2014 Results 2015 Planned
Streetcar riders per revenue-hour 65.0 58.3 65
Percent of time Real Time Transit Information Sign is in-operable due to maintenance issues / needs for regularly scheduled up-time
5% NA 5%
Average number of bus riders per weekday* 323,000
*SDOT measures ridership rather than sets goals, with the purpose of providing an overall sense of how well bus transit serves its customers.
HISTORIC TRANSIT SHELTERS The Seattle Transit Department Historic originally owned transit shelters. When King County Metro took ownership of the transit system in 1973, those shelters were not included in the transfer and remained under the City’s ownership.
Inventory Status and Anticipated Annual Growth
Shelters are the maintenance responsibility of the Roadway Structures Section at the direction of the Transit & Mobility Division.
SDOT’s two historic transit shelters both received substantial upgrades recently. Since these historic transit shelters are relatively new assets to SDOT and received the aforementioned upgrades, very little maintenance has been required in the recent
past. We have recorded and tracked limited information and maintain the inventory in paper files.
We perform maintenance on these shelters in response to a customer request. We have not established a maintenance program and funding requirements.
Asset Replacement Value
Condition Data Confidence
Good
Fair
Poor Unk Historic Transit Shelters $220,000 100% - - - High Real Time Transit Information Signs (Dynamic Message Signs)
$2,250,000 100% - - - Medium-High
Streetcar System $103,000,000 100% - - - High Transit Island Platforms $700,000 - - - 100% Low
Total: $106.2 Million
2015 Status and Condition Report – Transit | 87

Asset Inventory
Count Data
Confidence Replacement
Value
Useful Life
(Years)
System Replacement
Value
Anticipated Annual Growth
Historic Transit Shelters
2 High $110,000 $220,000
REAL TIME TRANSIT INFORMATION SIGNS (DYNAMIC MESSAGE SIGNS) Signs provide transit users with real time transit information including alerts or warnings. Signs can be pre-programmed, as well as accessed remotely to update messages with current up-to-the-minute information. We installed these signs starting in 2010.
Inventory Status and Anticipated Annual Growth
Traffic Management Data and Records maintain inventory in the Asset Management database.
When a dynamic message sign reaches half its useful life, it generally degrades to fair condition. If it degrades to poor condition, the sign will typically require replacement in three (3) years or less.
Asset Inventory
Count Data
Confidence Replacement
Value
Useful Life
(Years)
System Replacement
Value
Anticipated Annual Growth
Real Time Transit Info (non-Street Car)
45 Medium-
High $50,000 15 $2,250,000 0-9
SEATTLE STREETCAR SYSTEM The streetcar system consists of streetcars, paved trackway, station platforms and shelters, the traction power system, a train-to-wayside communication system, and a real-time passenger information system. The streetcars are maintained through King County-operated maintenance facilities.
2015 Status and Condition Report – Transit | 88
Inventory Status and Anticipated Annual Growth
South Lake Union Line (Constructed 2006-2007)
Asset Category Inventory Count
Data Confidence
Level
Replacement Value
each($M)
Asset Replacement Value ($M)
Useful Life (years)
O&M Facilities 1 High $ 4.96 $ 4.96 35 Vehicles 4 High $ 4.0 $16.0 30 Trackways 2.6 Miles High $ 4.5 $11.7 50 Overhead Contact System 2.6 Miles High $1.1 $2.86 25 Substations 3 High $0.5 $1.5 25 Train Signal System 4 Intersections High $.15 $.6 7-50 Platforms 10 High $0.15 $1.5 50 Switch Machines 4 High $0.05 $0.20 15 Shelters 10 High $0.02 $0.20 20 Real Time Arrival Signs 10 High $0.005 $0.05 10 Total High $39.57
First Hill Line (Constructed 2012-2014)
Asset Category Inventory Count
Data Confidence
Level
Replacement Value
each($M)
Asset Replacement Value ($M)
Useful Life (years)
O&M Facilities 1 High $ 4.96 $ 4.96 35 Vehicles 6 High $ 4.0 $24.0 30 Trackways 5 Miles High $ 4.5 $22.5 50 Overhead Contact System 5 Miles High $1.1 $5.5 25 Substations 5 High $0.5 $2.5 25 Train Signal System 7 Intersections High $.15 $1.05 7-50 Platforms 15 High $0.15 $2.25 50 Switch Machines 6 High $0.05 $0.30 15 Shelters 15 High $0.02 $0.30 20 Real Time Arrival Signs 15 High $0.005 $0.075 10 Total High $63.44
SDOT anticipates two streetcar line additions to the existing inventory. A map of the current and proposed system is available at: http://www.seattlestreetcar.org/images/big/2014-12-04%20Streetcar%20Overview%20Map.pdf
Center City Connector (Anticipated Construction 2019-2021)
Asset Category Inventory Count
Data Confidence
Level
Replacement Value
each($M)
Asset Replacement Value ($M)
Useful Life (years)
O&M Facilities (Expansion) 1 n/a $3 $ 3.0 35 Vehicles 9 n/a $ 4.0 $36.0 30 Trackways 2.4 Track Miles n/a $ 5 $10.8 50 Overhead Contact System 0.5 Miles n/a $1.1 $0.55 25 Substations 2 n/a $0.5 $1 25 Train Signal System 6 Intersections n/a $.15 $0.9 7-50 Platforms 6 n/a $0.25 $1.5 50 Switch Machines 4 n/a $0.05 $0.20 15 Shelters 6 n/a $0.02 $0.12 20 Real Time Arrival Signs 6 n/a $0.005 $0.03 10 Total n/a $54.1
2015 Status and Condition Report – Transit | 89

Broadway Extension Line (Anticipated Construction 2016-2017)
Asset Category Inventory Count
Data Confidence
Level
Replacement Value
each($M)
Asset Replacement Value ($M)
Useful Life (years)
Vehicles 1 n/a $ 4.0 $4.0 30 Trackways 1.0 Track Miles n/a $ 4.5 $4.5 50 Overhead Contact System 0.8 Miles n/a $1.1 $.88 25 Train Signal System 2 Intersections n/a $.15 $.3 7-50 Platforms 5 n/a $0.15 $0.75 50 Switch Machines 2 n/a $0.05 $0.10 15 Shelters 5 n/a $0.02 $0.10 20 Real Time Arrival Signs 5 n/a $0.005 $0.025 10 Total n/a $10.66
Life Cycle Costs, Maintenance Approach and Funding
SDOT maintains an inter-local agreement with King Country Metro for operation and maintenance of the streetcar systems. King County Metro performs preventive maintenance on the streetcars, the trackway, including the train-to-wayside communication system rails, track drains, track switches, the traction electrification system, containing power substations and the overhead catenary system, and the streetcar maintenance facility.
We assess the condition rating of the rail system elements using American Public Transportation Association (APTA) rail industry standards.
SDOT retains responsibility for maintenance of the station platforms and shelters, major maintenance and replacement, and the First Hill Streetcar Operations & Maintenance Facility.
2015-2064 (50-Year) Ownership Cost Forecast for Fully Built-Out Streetcar System
(2015 Dollars)
$0.0M
$5.0M
$10.0M
$15.0M
$20.0M
$25.0M
$30.0M
2015
2018
2021
2024
2027
2030
2033
2036
2039
2042
2045
2048
2051
2054
2057
2060
2063
Broadway Extension Total
Center City Connector Total
First Hill Total
South Lake Union Total
2015 Status and Condition Report – Transit | 90
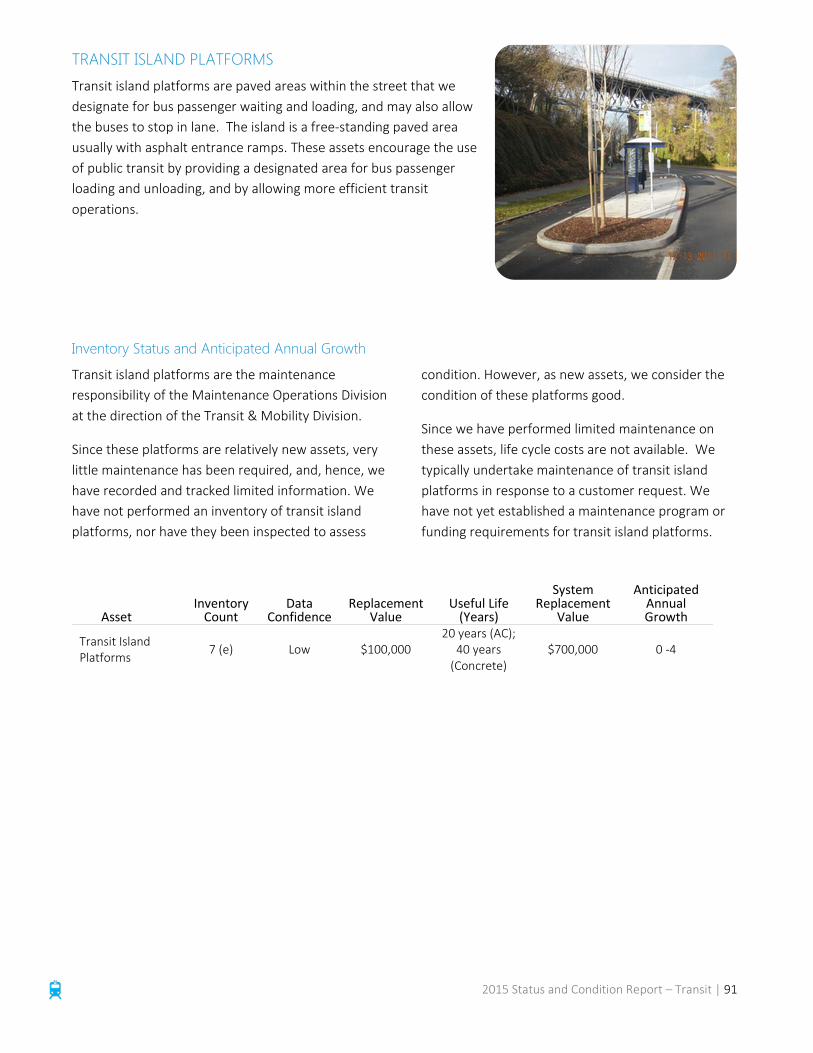
TRANSIT ISLAND PLATFORMS Transit island platforms are paved areas within the street that we designate for bus passenger waiting and loading, and may also allow the buses to stop in lane. The island is a free-standing paved area usually with asphalt entrance ramps. These assets encourage the use of public transit by providing a designated area for bus passenger loading and unloading, and by allowing more efficient transit operations.
Inventory Status and Anticipated Annual Growth
Transit island platforms are the maintenance responsibility of the Maintenance Operations Division at the direction of the Transit & Mobility Division.
Since these platforms are relatively new assets, very little maintenance has been required, and, hence, we have recorded and tracked limited information. We have not performed an inventory of transit island platforms, nor have they been inspected to assess
condition. However, as new assets, we consider the condition of these platforms good.
Since we have performed limited maintenance on these assets, life cycle costs are not available. We typically undertake maintenance of transit island platforms in response to a customer request. We have not yet established a maintenance program or funding requirements for transit island platforms.
Asset Inventory
Count Data
Confidence Replacement
Value Useful Life
(Years)
System Replacement
Value
Anticipated Annual Growth
Transit Island Platforms
7 (e) Low $100,000 20 years (AC);
40 years (Concrete)
$700,000 0 -4
2015 Status and Condition Report – Transit | 91
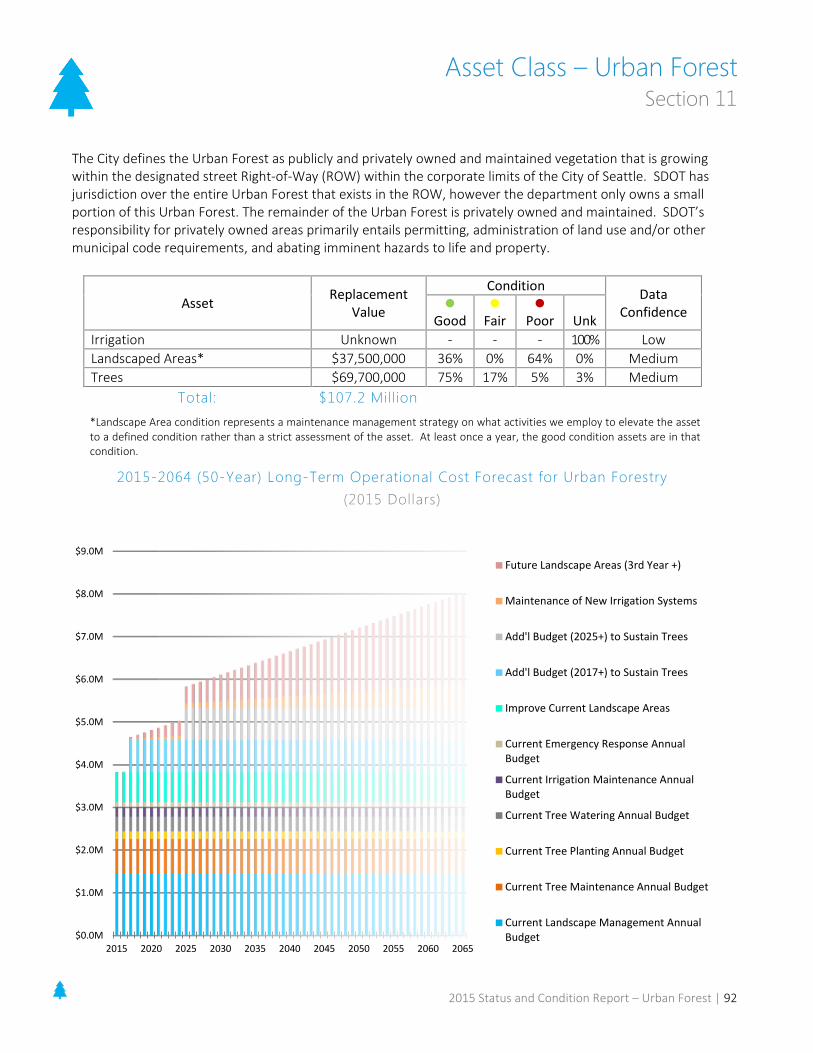
Asset Class – Urban Forest Section 11
The City defines the Urban Forest as publicly and privately owned and maintained vegetation that is growing within the designated street Right-of-Way (ROW) within the corporate limits of the City of Seattle. SDOT has jurisdiction over the entire Urban Forest that exists in the ROW, however the department only owns a small portion of this Urban Forest. The remainder of the Urban Forest is privately owned and maintained. SDOT’s responsibility for privately owned areas primarily entails permitting, administration of land use and/or other municipal code requirements, and abating imminent hazards to life and property.
*Landscape Area condition represents a maintenance management strategy on what activities we employ to elevate the asset to a defined condition rather than a strict assessment of the asset. At least once a year, the good condition assets are in that condition.
2015-2064 (50-Year) Long-Term Operational Cost Forecast for Urban Forestry (2015 Dollars)
$0.0M
$1.0M
$2.0M
$3.0M
$4.0M
$5.0M
$6.0M
$7.0M
$8.0M
$9.0M
2015 2020 2025 2030 2035 2040 2045 2050 2055 2060 2065
Future Landscape Areas (3rd Year +)
Maintenance of New Irrigation Systems
Add'l Budget (2025+) to Sustain Trees
Add'l Budget (2017+) to Sustain Trees
Improve Current Landscape Areas
Current Emergency Response AnnualBudget
Current Irrigation Maintenance AnnualBudget
Current Tree Watering Annual Budget
Current Tree Planting Annual Budget
Current Tree Maintenance Annual Budget
Current Landscape Management AnnualBudget
Asset Replacement Value
Condition Data Confidence
Good
Fair
Poor Unk Irrigation Unknown - - - 100% 10TLow Landscaped Areas* $37,500,000 36% 0% 64% 0% 10TMedium Trees $69,700,000 75% 17% 5% 3% 10TMedium
Total: $107.2 Million
2015 Status and Condition Report – Urban Forest | 92

SDOT funds all Urban Forestry assets through a single combined budget, and the funding requirements discussed in this section are based on an approximation of the percentage of the budget allocated to each asset. The total budget for maintenance and operation of the SDOT Urban Forest in 2015 is $3.927 million. The Urban Forestry group in the Maintenance Operations Division manages these assets.
Performance Measures 2014 Planned 2014 Results 2015 Planned Number of Landscape Maintenance events
840 1,113 840
Number of Trees planted 500 566 180
Number of Trees pruned 3,000 3,134 3,000
IRRIGATION Irrigation systems provide water to landscaping and trees through underground pipes. New capital projects install irrigation systems in SDOT landscapes. SDOT then assumes ownership and maintenance of these systems, although some are intentionally abandoned after the establishment period for new plantings. New irrigation systems are being built with technology upgrades that allow staff to program irrigation systems remotely through cellular connections to controllers and advanced software. We have not conducted full analysis of the irrigation assets as of this report update. Urban Forestry will need to train and invest in its maintenance team to ensure that SDOT can stay abreast of this new type of system.
Inventory Status and Anticipated Annual Growth
Asset Inventory
Count Data
Confidence Replacement
Value
Useful Life
(Years)
System Replacement
Value
Anticipated Annual Growth
Irrigation 131 Low Unknown 15 Use Acres of landscaped
2-4 per year
Life Cycle Costs, Maintenance Approach and Funding
Crews maintain irrigation systems annually as a seasonal activity. Condition of irrigation is unknown. We track maintenance costs at the landscape complex level and life cycle costs are not available. We generally consider funding inadequate based on the level of deterioration in the system. Urban Forestry estimates a budget of $400,000 would adequately fund a preventative maintenance program for irrigation.
SDOT adjusts irrigation systems to match vegetation needs in a manner consistent with water conservation policies to minimize water usage. Crews make system adjustments during scheduled maintenance at spring start-up, in response to gardener field observation, or in response to a customer request.
Replacement cost is based on bare land and new equipment.
2015 Status and Condition Report – Urban Forest | 93
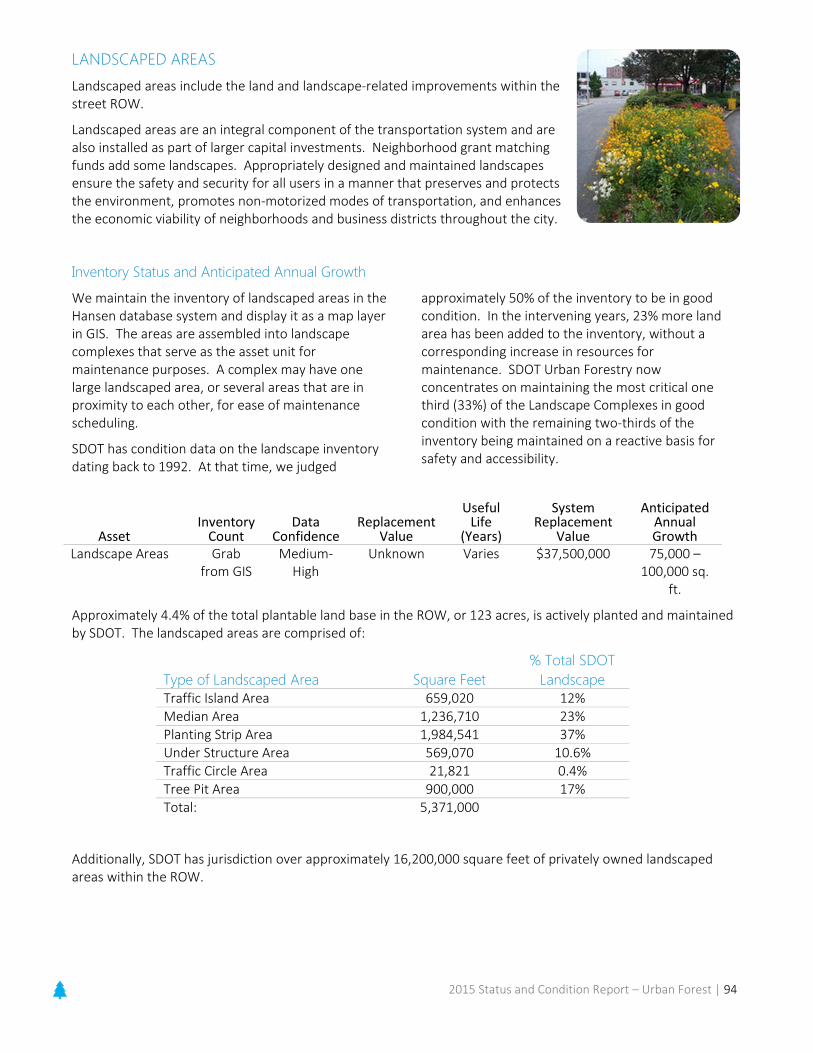
LANDSCAPED AREAS Landscaped areas include the land and landscape-related improvements within the street ROW.
Landscaped areas are an integral component of the transportation system and are also installed as part of larger capital investments. Neighborhood grant matching funds add some landscapes. Appropriately designed and maintained landscapes ensure the safety and security for all users in a manner that preserves and protects the environment, promotes non-motorized modes of transportation, and enhances the economic viability of neighborhoods and business districts throughout the city.
Inventory Status and Anticipated Annual Growth
We maintain the inventory of landscaped areas in the Hansen database system and display it as a map layer in GIS. The areas are assembled into landscape complexes that serve as the asset unit for maintenance purposes. A complex may have one large landscaped area, or several areas that are in proximity to each other, for ease of maintenance scheduling.
SDOT has condition data on the landscape inventory dating back to 1992. At that time, we judged
approximately 50% of the inventory to be in good condition. In the intervening years, 23% more land area has been added to the inventory, without a corresponding increase in resources for maintenance. SDOT Urban Forestry now concentrates on maintaining the most critical one third (33%) of the Landscape Complexes in good condition with the remaining two-thirds of the inventory being maintained on a reactive basis for safety and accessibility.
Asset Inventory
Count Data
Confidence Replacement
Value
Useful Life
(Years)
System Replacement
Value
Anticipated Annual Growth
Landscape Areas Grab from GIS
Medium-High
Unknown Varies $37,500,000 75,000 –100,000 sq.
ft.
Approximately 4.4% of the total plantable land base in the ROW, or 123 acres, is actively planted and maintained by SDOT. The landscaped areas are comprised of:
Type of Landscaped Area Square Feet % Total SDOT
Landscape Traffic Island Area 659,020 12% Median Area 1,236,710 23% Planting Strip Area 1,984,541 37% Under Structure Area 569,070 10.6% Traffic Circle Area 21,821 0.4% Tree Pit Area 900,000 17% Total: 5,371,000
Additionally, SDOT has jurisdiction over approximately 16,200,000 square feet of privately owned landscaped areas within the ROW.
2015 Status and Condition Report – Urban Forest | 94

Life Cycle Costs, Maintenance Approach and Funding
SDOT performs maintenance on all landscape areas in good condition several times per year to maintain this condition. When we downgrade a landscaped area to poor condition, it is no longer part of a routine maintenance plan. We maintain landscape areas in poor condition as needed on an incident-response basis. Given the expanding volume of area
where planned maintenance has been deferred, emergency and safety responses efforts have increased. This has reduced SDOTs ability to visit landscapes in good condition as frequently, resulting in a declining percentage of landscape areas that we classify as “good”.
Maintenance Approach per Landscape Condition
Landscape Condition Maintenance Approach
Average SF Cost to Maintain
(2010 -2015) Good Minimal Litter – picked up weekly, bi-weekly, or monthly as
needed Minimal weeds Adequate mulch – restored annually or twice annually as
required to maintain 2-3” depth Trees and shrubs both healthy and properly pruned or
trimmed
$0.36
Poor Litter - removal only to mitigate public safety hazard in response to complaint
Weed control – only to mitigate a noxious weed infestation or if a public safety hazard
Mulch – only as necessary to cover bare soil as a means of temporary erosion control
Pruning – only to mitigate a public safety hazard
$0.27
Urban Forestry has established a maintenance approach according to the following priorities:
Public safety
Maintainability of the vegetation by controlling weeds adequately so that the desired plant material can thrive
Aesthetics
Urban Forestry requires additional funding in order to address the following maintenance objectives:
Ensure that critical sight lines are maintained in landscaped areas. Crews a address this only during regular scheduled maintenance of the landscaped areas or in response to a customer request.
Control noxious weeds in the ROW in areas other than landscaped areas. We base control on citation by King County Weed Control Board for which mitigation is required within a two-week period, or in response to a customer request.
Ensure that hazardous waste (primarily contaminated litter) is mitigated in all landscaped areas owned by SDOT. Approximately 25% of the landscaped areas that exist in highly urban portions of the city, such as the Central Business District which is visited twice monthly, are considered compliant, and the remaining 75% are placed on a watch list.
2015 Status and Condition Report – Urban Forest | 95
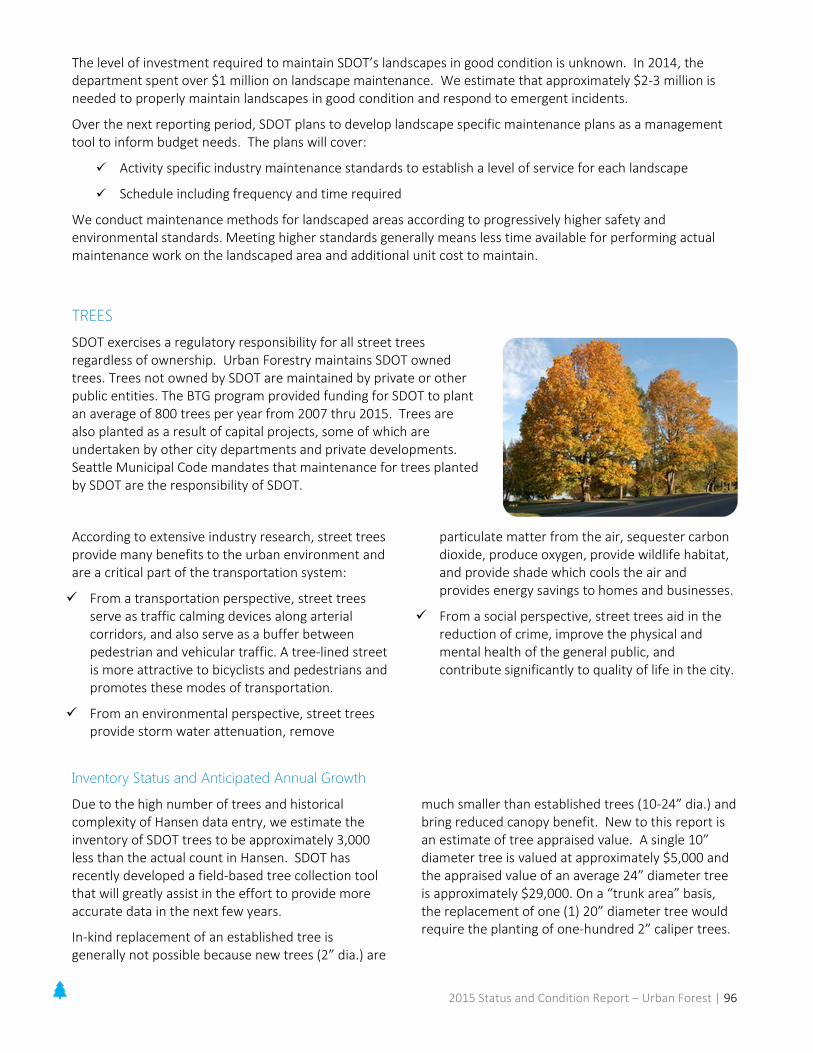
The level of investment required to maintain SDOT’s landscapes in good condition is unknown. In 2014, the department spent over $1 million on landscape maintenance. We estimate that approximately $2-3 million is needed to properly maintain landscapes in good condition and respond to emergent incidents.
Over the next reporting period, SDOT plans to develop landscape specific maintenance plans as a management tool to inform budget needs. The plans will cover:
Activity specific industry maintenance standards to establish a level of service for each landscape
Schedule including frequency and time required
We conduct maintenance methods for landscaped areas according to progressively higher safety and environmental standards. Meeting higher standards generally means less time available for performing actual maintenance work on the landscaped area and additional unit cost to maintain.
TREES SDOT exercises a regulatory responsibility for all street trees regardless of ownership. Urban Forestry maintains SDOT owned trees. Trees not owned by SDOT are maintained by private or other public entities. The BTG program provided funding for SDOT to plant an average of 800 trees per year from 2007 thru 2015. Trees are also planted as a result of capital projects, some of which are undertaken by other city departments and private developments. Seattle Municipal Code mandates that maintenance for trees planted by SDOT are the responsibility of SDOT.
According to extensive industry research, street trees provide many benefits to the urban environment and are a critical part of the transportation system:
From a transportation perspective, street trees serve as traffic calming devices along arterial corridors, and also serve as a buffer between pedestrian and vehicular traffic. A tree-lined street is more attractive to bicyclists and pedestrians and promotes these modes of transportation.
From an environmental perspective, street trees provide storm water attenuation, remove
particulate matter from the air, sequester carbon dioxide, produce oxygen, provide wildlife habitat, and provide shade which cools the air and provides energy savings to homes and businesses.
From a social perspective, street trees aid in the reduction of crime, improve the physical and mental health of the general public, and contribute significantly to quality of life in the city.
Inventory Status and Anticipated Annual Growth
Due to the high number of trees and historical complexity of Hansen data entry, we estimate the inventory of SDOT trees to be approximately 3,000 less than the actual count in Hansen. SDOT has recently developed a field-based tree collection tool that will greatly assist in the effort to provide more accurate data in the next few years.
In-kind replacement of an established tree is generally not possible because new trees (2” dia.) are
much smaller than established trees (10-24” dia.) and bring reduced canopy benefit. New to this report is an estimate of tree appraised value. A single 10” diameter tree is valued at approximately $5,000 and the appraised value of an average 24” diameter tree is approximately $29,000. On a “trunk area” basis, the replacement of one (1) 20” diameter tree would require the planting of one-hundred 2” caliper trees.
2015 Status and Condition Report – Urban Forest | 96
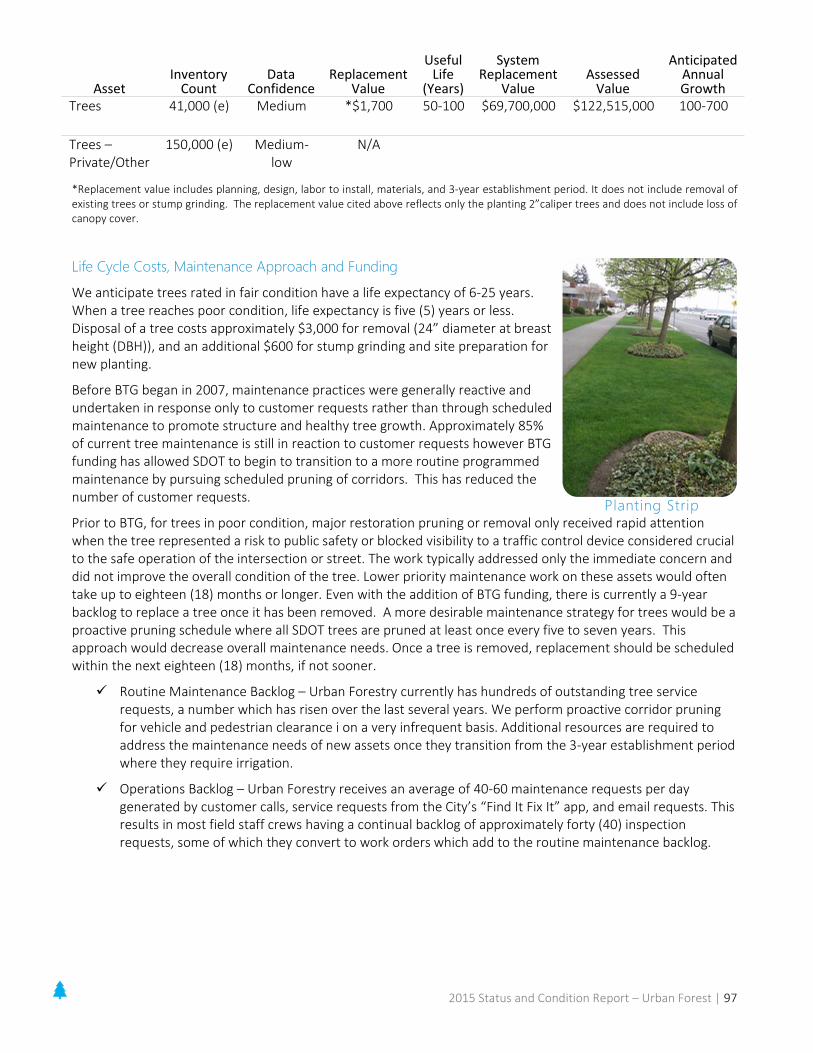
Asset Inventory
Count Data
Confidence Replacement
Value
Useful Life
(Years)
System Replacement
Value Assessed
Value
Anticipated Annual Growth
Trees 41,000 (e) Medium *$1,700 50-100 $69,700,000 $122,515,000 100-700
Trees – Private/Other
150,000 (e) Medium-low
N/A
*Replacement value includes planning, design, labor to install, materials, and 3-year establishment period. It does not include removal of existing trees or stump grinding. The replacement value cited above reflects only the planting 2”caliper trees and does not include loss of canopy cover.
Life Cycle Costs, Maintenance Approach and Funding
We anticipate trees rated in fair condition have a life expectancy of 6-25 years. When a tree reaches poor condition, life expectancy is five (5) years or less. Disposal of a tree costs approximately $3,000 for removal (24” diameter at breast height (DBH)), and an additional $600 for stump grinding and site preparation for new planting.
Before BTG began in 2007, maintenance practices were generally reactive and undertaken in response only to customer requests rather than through scheduled maintenance to promote structure and healthy tree growth. Approximately 85% of current tree maintenance is still in reaction to customer requests however BTG funding has allowed SDOT to begin to transition to a more routine programmed maintenance by pursuing scheduled pruning of corridors. This has reduced the number of customer requests.
Prior to BTG, for trees in poor condition, major restoration pruning or removal only received rapid attention when the tree represented a risk to public safety or blocked visibility to a traffic control device considered crucial to the safe operation of the intersection or street. The work typically addressed only the immediate concern and did not improve the overall condition of the tree. Lower priority maintenance work on these assets would often take up to eighteen (18) months or longer. Even with the addition of BTG funding, there is currently a 9-year backlog to replace a tree once it has been removed. A more desirable maintenance strategy for trees would be a proactive pruning schedule where all SDOT trees are pruned at least once every five to seven years. This approach would decrease overall maintenance needs. Once a tree is removed, replacement should be scheduled within the next eighteen (18) months, if not sooner.
Routine Maintenance Backlog – Urban Forestry currently has hundreds of outstanding tree service requests, a number which has risen over the last several years. We perform proactive corridor pruning for vehicle and pedestrian clearance i on a very infrequent basis. Additional resources are required to address the maintenance needs of new assets once they transition from the 3-year establishment period where they require irrigation.
Operations Backlog – Urban Forestry receives an average of 40-60 maintenance requests per day generated by customer calls, service requests from the City’s “Find It Fix It” app, and email requests. This results in most field staff crews having a continual backlog of approximately forty (40) inspection requests, some of which they convert to work orders which add to the routine maintenance backlog.
Planting Strip
2015 Status and Condition Report – Urban Forest | 97

In 2014, the actual costs for maintenance and operations of trees totaled $1.15 million. To a large degree BTG-funded pruning has addressed public safety concerns and reduced conflicts with other infrastructure assets. However, additional funding is needed to allow Urban Forestry to address structural anomalies of many trees which, if not attended to, will allow them to degrade over time. To maintain all trees, including newly-planted trees, at their current condition ratings and prevent deterioration would require two (2) additional tree crews at an annual cost approximating $750,000. Additional funds would be needed for tools and equipment for the crews as well.
The Society of Municipal Arborists recommends a 7-year pruning cycle for mature trees (minimum 21” DBH), and a 3-5 year pruning cycle for small trees. The addition of two (2) additional tree crews and a tree crew supervisor would allow SDOT to more closely align with national standards.
Trees decline due to age and environmental issues. Sometimes, infrastructure conflicts require tree removal. The tree population of SDOT’s urban forest is younger than the national average. As the population ages, trees will begin to decline based on age and species, increasing tree-related risk. For example, programs like Forward Thrust funded the planting of approximately 23,000 trees over several years in the 1970s. Given an estimated life span of fifty (50) years, we anticipate removal and replacement funding to be 4-5 times higher in the mid-2020s and beyond to address the decline of trees planted under large scale installation programs such as this.
Street Tree: Tupelo
2015 Status and Condition Report – Urban Forest | 98
APPENDICES APPENDIX A: SDOT ASSET MANAGEMENT OVERVIEW Asset Management (AM) is the business model for informing all resource allocation decision-making related to the transportation infrastructure. SDOT‘s statement of principles describes the mature Asset Management environment it is working toward.
The objective of SDOT Asset Management is to:
Build, preserve, and operate transportation infrastructure services more cost effectively with improved asset performance;
Deliver to customers the best value for the public tax dollar spent; and
Enhance the credibility and accountability of SDOT to the Mayor, City Council, and general public
Background
In 2007, the Seattle Department of Transportation began implementation of Asset Management, a strategic and systematic process that guides decisions about construction, maintenance and operation of SDOT infrastructure. SDOT recognizes that we are embarking on a long-term effort to achieve that end state through a process of continuous improvement. We have updated the original Asset Management principles below to reflect eight years of progress and the Department’s future direction in Asset Management is best described as follows:
Asset Inventory. SDOT will develop information on our asset inventories that will include all those assets that we are responsible for and order them according to a hierarchy that reflects SDOT’s business responsibilities and advanced Asset Management practices.
Condition Assessment. SDOT will collect information on the condition of our assets that will be consistent and easily understood across all the categories of our assets. We will use this information to develop Asset Management plans for the maintenance and operation of our assets that will achieve sustainable service levels. Condition assessments will occur on a frequency that meets all business and reporting needs.
Maintenance. SDOT will develop and adopt a maintenance and preservation policy for our assets that moves us toward an operation that achieves sustainable and high levels of performance based on agreed upon service levels. We will assist this policy in its implementation by the development and use of a work management system that will work in cooperation with AM practices to retain necessary maintenance and condition information.
Levels of Service (LOS). SDOT will develop level of service information that reflects and includes, to the extent feasible, our customer and stakeholder input. We will use this information to report on our performance in meeting, or failing to meet, the LOS and the implications thereof.
Financial Planning. SDOT will incorporate full life-cycle costing into our financial planning to achieve cost-effective Asset Management planning and operation to minimize full life-cycle costs. Our financial reporting will reflect full lifecycle costing, and will include the implications of meeting, or failing to meet the funding requirements indicated by full life-cycle costing.
CIP and Annual Budget Funding Processes and Procedures. SDOT will incorporate Asset Management principles into budgeting and CIP decision-making, across the Department so that decisions are based on critical asset needs, conditions, and levels of service.
2015 Status and Condition Report – Appendix A | 99

Capital Improvement Planning. SDOT capital planning for replacement, renewal or new infrastructure will include Asset Management principles related to LOS, full life-cycle costing and an understanding of the criticality of the asset and its sustainable service levels.
Information Technologies and Management. SDOT will adhere to its integrated systems strategy in developing information systems that support the business and user needs of Asset Management; be they inventory, condition, work management, financial, or project planning systems. Asset information is an essential but expensive foundation for effective Asset Management decisions. Our information management practices will ensure that we collect and actively maintain only the critical minimum information at the level of quality needed by the business, and that this information is accessible from authoritative sources (for example, pavement management, structures database, Bridge Works, and the Hansen system). SDOT will follow knowledge management practices to standardize and disseminate Asset Management data and practices across the organization.
Reporting. SDOT will ultimately report on its performance in relation to an annual Strategic Asset Management Plan (SAMP) and report, and in periodic asset status and condition reports.
Triple-bottom line. SDOT will align the financial, environmental and social costs and impacts of asset decisions with the City’s policy as embodied in its Race and Social Justice Initiative.
Asset Management in SDOT is a strategic and systematic process that guides decisions about construction, maintenance and operation of SDOT infrastructure. Best practice Asset Management requires an enterprise-wide approach that guides investment decisions and priority-setting to strengthen management of transportation assets.
A strategic process:
Has a long-term view
Has a department-wide and city-wide perspective
Accomplishes SDOT’s vision, mission, and goals
Optimally reflects SDOT plans, such as Move Seattle
A systematic process:
Is procedural
Is disciplined
Occurs regularly
Is documented
Reflects a well understood workflow
Reflects a set of rules through documented business procedures
2015 Status and Condition Report – Appendix A | 100
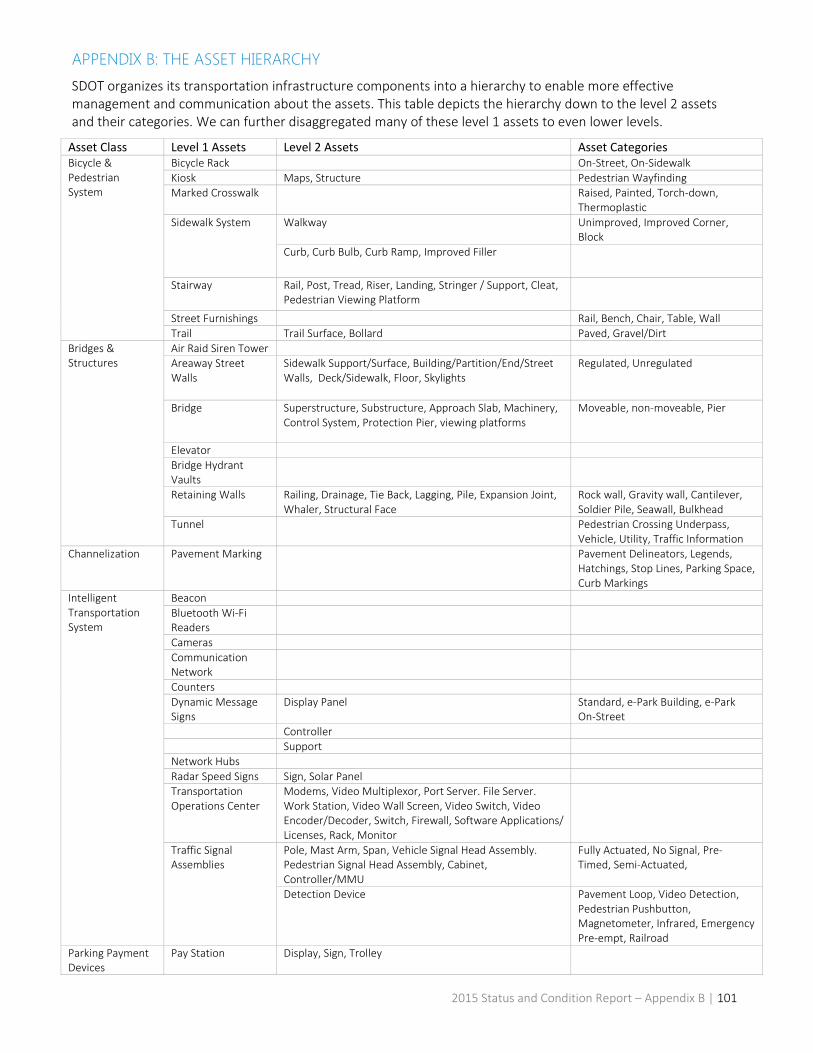
APPENDIX B: THE ASSET HIERARCHY SDOT organizes its transportation infrastructure components into a hierarchy to enable more effective management and communication about the assets. This table depicts the hierarchy down to the level 2 assets and their categories. We can further disaggregated many of these level 1 assets to even lower levels.
Asset Class Level 1 Assets Level 2 Assets Asset Categories Bicycle & Pedestrian System
Bicycle Rack On-Street, On-Sidewalk Kiosk Maps, Structure Pedestrian Wayfinding Marked Crosswalk Raised, Painted, Torch-down,
Thermoplastic Sidewalk System Walkway Unimproved, Improved Corner,
Block Curb, Curb Bulb, Curb Ramp, Improved Filler
Stairway Rail, Post, Tread, Riser, Landing, Stringer / Support, Cleat, Pedestrian Viewing Platform
Street Furnishings Rail, Bench, Chair, Table, Wall Trail Trail Surface, Bollard Paved, Gravel/Dirt
Bridges & Structures
Air Raid Siren Tower Areaway Street Walls
Sidewalk Support/Surface, Building/Partition/End/Street Walls, Deck/Sidewalk, Floor, Skylights
Regulated, Unregulated
Bridge Superstructure, Substructure, Approach Slab, Machinery, Control System, Protection Pier, viewing platforms
Moveable, non-moveable, Pier
Elevator Bridge Hydrant Vaults
Retaining Walls Railing, Drainage, Tie Back, Lagging, Pile, Expansion Joint, Whaler, Structural Face
Rock wall, Gravity wall, Cantilever, Soldier Pile, Seawall, Bulkhead
Tunnel Pedestrian Crossing Underpass, Vehicle, Utility, Traffic Information
Channelization Pavement Marking Pavement Delineators, Legends, Hatchings, Stop Lines, Parking Space, Curb Markings
Intelligent Transportation System
Beacon Bluetooth Wi-Fi Readers
Cameras Communication Network
Counters Dynamic Message Signs
Display Panel Standard, e-Park Building, e-Park On-Street
Controller Support Network Hubs Radar Speed Signs Sign, Solar Panel Transportation Operations Center
Modems, Video Multiplexor, Port Server. File Server. Work Station, Video Wall Screen, Video Switch, Video Encoder/Decoder, Switch, Firewall, Software Applications/ Licenses, Rack, Monitor
Traffic Signal Assemblies
Pole, Mast Arm, Span, Vehicle Signal Head Assembly. Pedestrian Signal Head Assembly, Cabinet, Controller/MMU
Fully Actuated, No Signal, Pre-Timed, Semi-Actuated,
Detection Device Pavement Loop, Video Detection, Pedestrian Pushbutton, Magnetometer, Infrared, Emergency Pre-empt, Railroad
Parking Payment Devices
Pay Station Display, Sign, Trolley
2015 Status and Condition Report – Appendix B | 101

Asset Class Level 1 Assets Level 2 Assets Asset Categories Pavement System Pavement Arterials, Non-Arterials, Alleys,
Excess ROW in use for access & parking
Real Property Buildings & Yards Parcel Shoreline Street Ends
Transit Historic Transit Shelters
Real Time Transit Information Signs (Dynamic Message Signs)
Display Panel, Controller, Support RTIS
Streetcar System Streetcar, Paved Trackway, Streetcar Station Shelter, Traction Power System, Train-to-Wayside Communication System, Passenger Information System
Transit Island Platforms
Signs Sign Assemblies Sign Regulatory, Parking, Guide Signs Conventional, Street Name, Warning, Recreational and Cultural Interest, Tourist Direction, Non-MUTCD, School, Overhead
Support Traffic Safety Structures & Devices
Chicane Choker, Standard Crash Cushion Guardrails Rail, Post Curb Bulb Median Islands Median Island Curb, Raised Asphalt Interior, Fencing,
Landscape Pedestrian Refuge Island, Other channelization, Transit Islands
Speed Cushions Speed Dots Speed Humps Traffic Circles
Urban Forest Irrigation System Controller Permanent, Seasonal, Temporary Water Source, Backflow Prevention, Pipes, Valves, Sensors
Landscaped Area Tree
2015 Status and Condition Report – Appendix B | 102
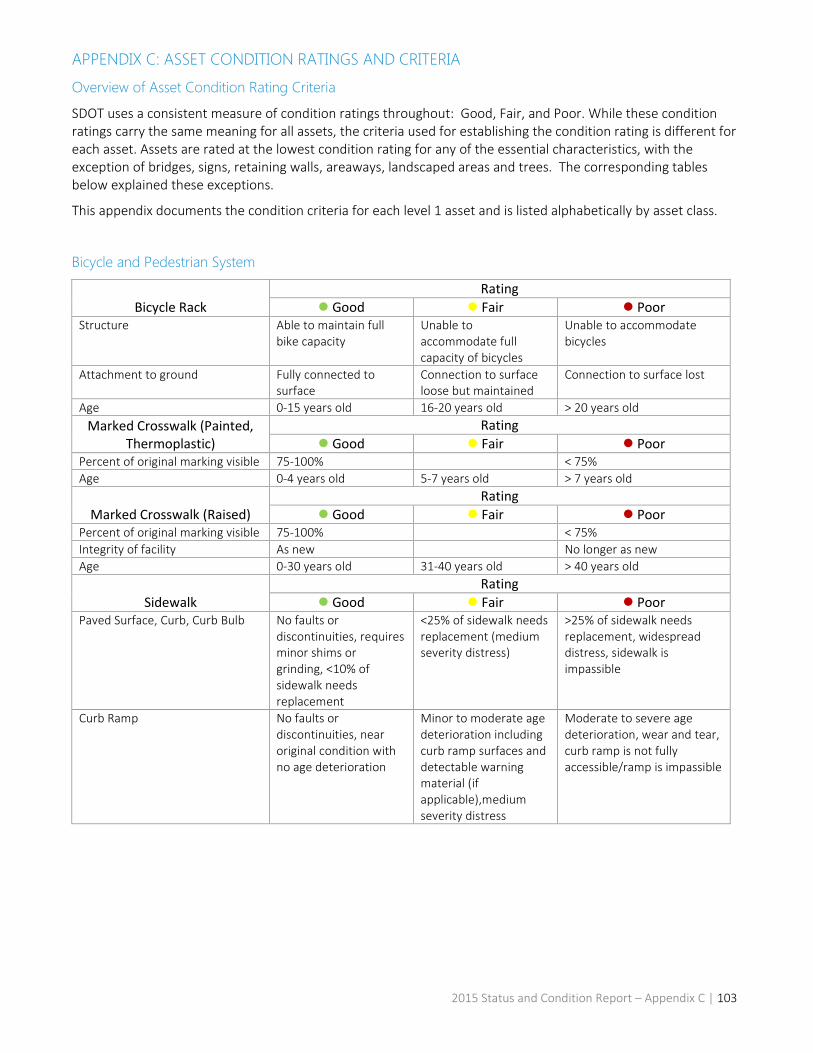
APPENDIX C: ASSET CONDITION RATINGS AND CRITERIA
Overview of Asset Condition Rating Criteria
SDOT uses a consistent measure of condition ratings throughout: Good, Fair, and Poor. While these condition ratings carry the same meaning for all assets, the criteria used for establishing the condition rating is different for each asset. Assets are rated at the lowest condition rating for any of the essential characteristics, with the exception of bridges, signs, retaining walls, areaways, landscaped areas and trees. The corresponding tables below explained these exceptions.
This appendix documents the condition criteria for each level 1 asset and is listed alphabetically by asset class.
Bicycle and Pedestrian System
Bicycle Rack Rating
Good Fair Poor Structure Able to maintain full
bike capacity Unable to accommodate full capacity of bicycles
Unable to accommodate bicycles
Attachment to ground Fully connected to surface
Connection to surface loose but maintained
Connection to surface lost
Age 0-15 years old 16-20 years old > 20 years old Marked Crosswalk (Painted,
Thermoplastic) Rating
Good Fair Poor Percent of original marking visible 75-100% < 75% Age 0-4 years old 5-7 years old > 7 years old
Marked Crosswalk (Raised) Rating
Good Fair Poor Percent of original marking visible 75-100% < 75% Integrity of facility As new No longer as new Age 0-30 years old 31-40 years old > 40 years old
Sidewalk Rating
Good Fair Poor Paved Surface, Curb, Curb Bulb No faults or
discontinuities, requires minor shims or grinding, <10% of sidewalk needs replacement
<25% of sidewalk needs replacement (medium severity distress)
>25% of sidewalk needs replacement, widespread distress, sidewalk is impassible
Curb Ramp No faults or discontinuities, near original condition with no age deterioration
Minor to moderate age deterioration including curb ramp surfaces and detectable warning material (if applicable),medium severity distress
Moderate to severe age deterioration, wear and tear, curb ramp is not fully accessible/ramp is impassible
2015 Status and Condition Report – Appendix C | 103
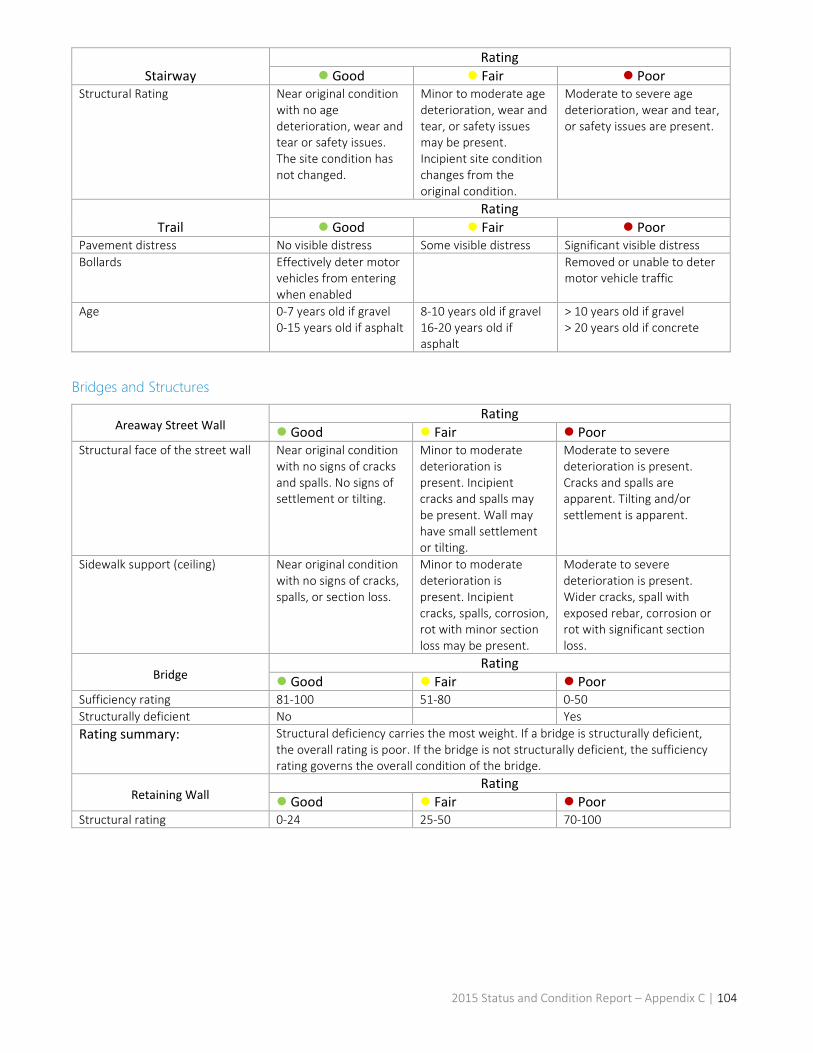
Stairway Rating
Good Fair Poor Structural Rating Near original condition
with no age deterioration, wear and tear or safety issues. The site condition has not changed.
Minor to moderate age deterioration, wear and tear, or safety issues may be present. Incipient site condition changes from the original condition.
Moderate to severe age deterioration, wear and tear, or safety issues are present.
Trail Rating
Good Fair Poor Pavement distress No visible distress Some visible distress Significant visible distress Bollards Effectively deter motor
vehicles from entering when enabled
Removed or unable to deter motor vehicle traffic
Age 0-7 years old if gravel 0-15 years old if asphalt
8-10 years old if gravel 16-20 years old if asphalt
> 10 years old if gravel > 20 years old if concrete
Bridges and Structures
Areaway Street Wall Rating
Good Fair Poor Structural face of the street wall Near original condition
with no signs of cracks and spalls. No signs of settlement or tilting.
Minor to moderate deterioration is present. Incipient cracks and spalls may be present. Wall may have small settlement or tilting.
Moderate to severe deterioration is present. Cracks and spalls are apparent. Tilting and/or settlement is apparent.
Sidewalk support (ceiling) Near original condition with no signs of cracks, spalls, or section loss.
Minor to moderate deterioration is present. Incipient cracks, spalls, corrosion, rot with minor section loss may be present.
Moderate to severe deterioration is present. Wider cracks, spall with exposed rebar, corrosion or rot with significant section loss.
Bridge Rating
Good Fair Poor Sufficiency rating 81-100 51-80 0-50 Structurally deficient No Yes Rating summary: Structural deficiency carries the most weight. If a bridge is structurally deficient,
the overall rating is poor. If the bridge is not structurally deficient, the sufficiency rating governs the overall condition of the bridge.
Retaining Wall Rating
Good Fair Poor Structural rating 0-24 25-50 70-100
2015 Status and Condition Report – Appendix C | 104
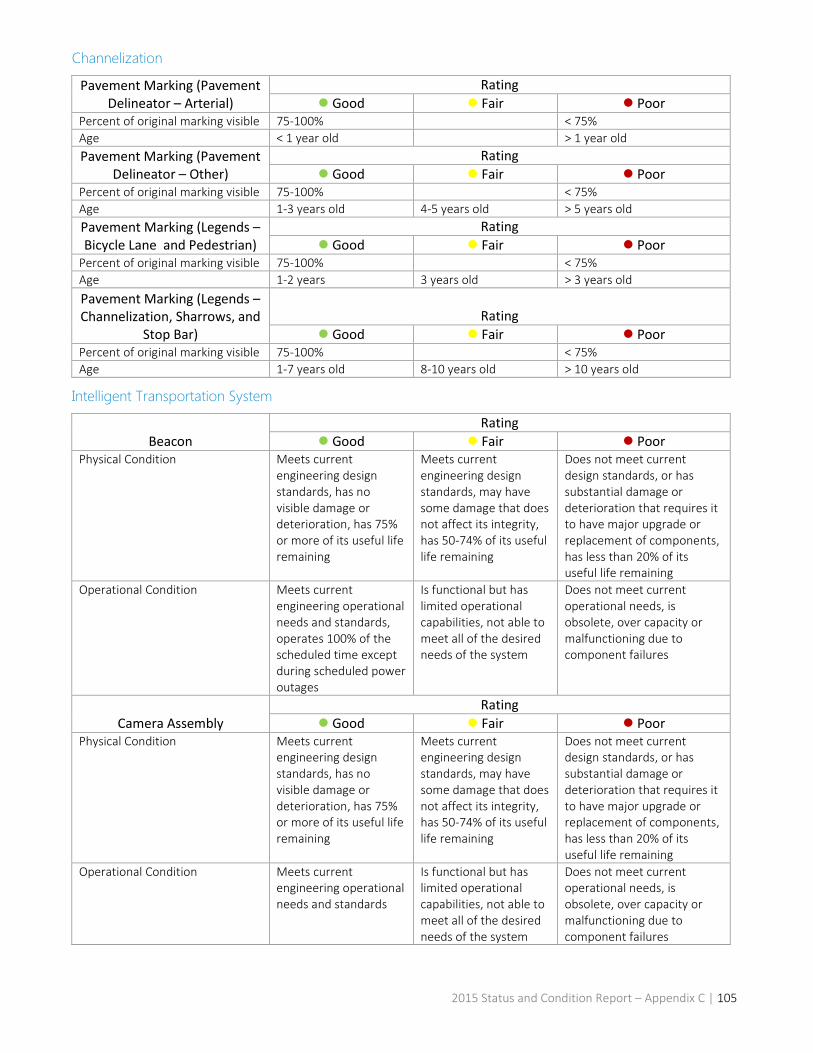
Channelization
Pavement Marking (Pavement Delineator – Arterial)
Rating Good Fair Poor
Percent of original marking visible 75-100% < 75% Age < 1 year old > 1 year old Pavement Marking (Pavement
Delineator – Other) Rating
Good Fair Poor Percent of original marking visible 75-100% < 75% Age 1-3 years old 4-5 years old > 5 years old Pavement Marking (Legends – Bicycle Lane and Pedestrian)
Rating Good Fair Poor
Percent of original marking visible 75-100% < 75% Age 1-2 years 3 years old > 3 years old Pavement Marking (Legends – Channelization, Sharrows, and
Stop Bar) Rating
Good Fair Poor Percent of original marking visible 75-100% < 75% Age 1-7 years old 8-10 years old > 10 years old
Intelligent Transportation System
Beacon Rating
Good Fair Poor Physical Condition Meets current
engineering design standards, has no visible damage or deterioration, has 75% or more of its useful life remaining
Meets current engineering design standards, may have some damage that does not affect its integrity, has 50-74% of its useful life remaining
Does not meet current design standards, or has substantial damage or deterioration that requires it to have major upgrade or replacement of components, has less than 20% of its useful life remaining
Operational Condition Meets current engineering operational needs and standards, operates 100% of the scheduled time except during scheduled power outages
Is functional but has limited operational capabilities, not able to meet all of the desired needs of the system
Does not meet current operational needs, is obsolete, over capacity or malfunctioning due to component failures
Camera Assembly Rating
Good Fair Poor Physical Condition Meets current
engineering design standards, has no visible damage or deterioration, has 75% or more of its useful life remaining
Meets current engineering design standards, may have some damage that does not affect its integrity, has 50-74% of its useful life remaining
Does not meet current design standards, or has substantial damage or deterioration that requires it to have major upgrade or replacement of components, has less than 20% of its useful life remaining
Operational Condition Meets current engineering operational needs and standards
Is functional but has limited operational capabilities, not able to meet all of the desired needs of the system
Does not meet current operational needs, is obsolete, over capacity or malfunctioning due to component failures
2015 Status and Condition Report – Appendix C | 105
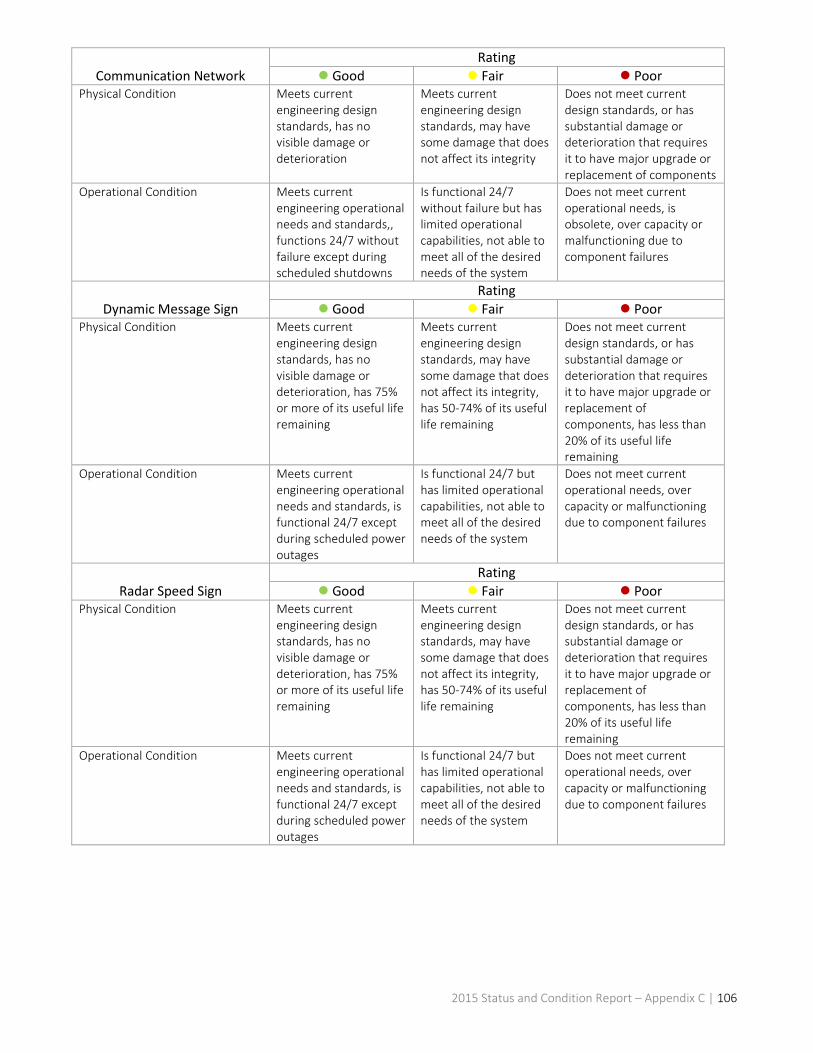
Communication Network Rating
Good Fair Poor Physical Condition Meets current
engineering design standards, has no visible damage or deterioration
Meets current engineering design standards, may have some damage that does not affect its integrity
Does not meet current design standards, or has substantial damage or deterioration that requires it to have major upgrade or replacement of components
Operational Condition Meets current engineering operational needs and standards,, functions 24/7 without failure except during scheduled shutdowns
Is functional 24/7 without failure but has limited operational capabilities, not able to meet all of the desired needs of the system
Does not meet current operational needs, is obsolete, over capacity or malfunctioning due to component failures
Dynamic Message Sign Rating
Good Fair Poor Physical Condition Meets current
engineering design standards, has no visible damage or deterioration, has 75% or more of its useful life remaining
Meets current engineering design standards, may have some damage that does not affect its integrity, has 50-74% of its useful life remaining
Does not meet current design standards, or has substantial damage or deterioration that requires it to have major upgrade or replacement of components, has less than 20% of its useful life remaining
Operational Condition Meets current engineering operational needs and standards, is functional 24/7 except during scheduled power outages
Is functional 24/7 but has limited operational capabilities, not able to meet all of the desired needs of the system
Does not meet current operational needs, over capacity or malfunctioning due to component failures
Radar Speed Sign Rating
Good Fair Poor Physical Condition Meets current
engineering design standards, has no visible damage or deterioration, has 75% or more of its useful life remaining
Meets current engineering design standards, may have some damage that does not affect its integrity, has 50-74% of its useful life remaining
Does not meet current design standards, or has substantial damage or deterioration that requires it to have major upgrade or replacement of components, has less than 20% of its useful life remaining
Operational Condition Meets current engineering operational needs and standards, is functional 24/7 except during scheduled power outages
Is functional 24/7 but has limited operational capabilities, not able to meet all of the desired needs of the system
Does not meet current operational needs, over capacity or malfunctioning due to component failures
2015 Status and Condition Report – Appendix C | 106

Transportation Operations Center
Rating Good Fair Poor
Physical Condition Meets desired engineering design standards, and has room for expansion of new assets and operations
Meets current minimum engineering design standards, is limited in its expansion potential, Has some assets that have expended over half of their useful lives. Still provides the necessary functions required,
Does not meet current minimum design standards, or has substantial damage or deterioration that requires it to have major upgrade or replacement of components, has some components with less than 20% of its useful life remaining
Operational Condition Meets current engineering operational needs and standards, has room for expansion of new operations, fully functional 24/7 or 100% of scheduled up-time
Is functional 24/7 or 100% of scheduled up-time, but has limited operational capabilities, not able to meet all of the desired needs of the Department
Does not meet current operational needs, is obsolete, over capacity or malfunctioning due to component failures
Traffic Signal Assembly Rating
Good Fair Poor Composite Component-Based Score
100 - 81 80 - 41 40 -0
Physical Condition Meets current engineering design standards, has no visible damage or deterioration
Meets current engineering design standards, may have some damage that does not affect its integrity
Does not meet current design standards, or has substantial damage or deterioration that requires it to have major upgrade or replacement of components
Operational Condition Meets current engineering operational needs and standards, operates 24/7 except during scheduled power outages
Is functional but has limited operational capabilities, not able to meet all of the desired needs of the system
Does not meet current operational needs, is obsolete, over capacity or malfunctioning due to component failures
2015 Status and Condition Report – Appendix C | 107

Parking Payment Devices
Pay Station Rating
Good Fair Poor Vendor support All parts and systems
supported by vendor at warranty standards or competitive replacement costs
Parts and system no longer supported by vendor at warranty standards or competitive replacement costs
Technology condition Parking payment: collects parking fees effectively and efficiently, credit cards and credit card systems are in common Revenue collection: credit card processing and coin counting/deposit practices efficiently and economically support system. Communications system: online conductivity meets or exceeds 98.5% uptime. Data security: meets or exceeds annual Visa and MasterCard audit standards. Reporting and alarms system: meets or exceeds City requirements and vendor fully supports. Parking rate & policy change system requirements: fully supported by both vendor systems and City O&M budget.
Parking payment: does not collect parking fees effectively and efficiently, parking fees exceed practical coin payment amounts, credit card technology changes require major equipment retrofit, other payment processes replace current systems. Revenue collection: credit card processing and coin counting/ deposit practices do not efficiently and economically support system. Communications system: online conductivity is less than 98.5% uptime. Data security: does not meet annual Visa and MasterCard audit standards. Reporting and alarms system: does not meet City requirements to maintain system operational efficiency and/or vendor no longer fully supports. Parking rate & policy change system requirements: not fully supported by vendor systems and/or City O&M budget.
Physical condition and appearance
Color and appearance is uniform and smooth with few if any dents, abrasions, scrapes or other physical deformities. Labels are legible and smooth
Sun-faded and exterior plastic is cracked, or exterior is damaged to the extent that repair costs equal replacement and recondition costs
2015 Status and Condition Report – Appendix C | 108
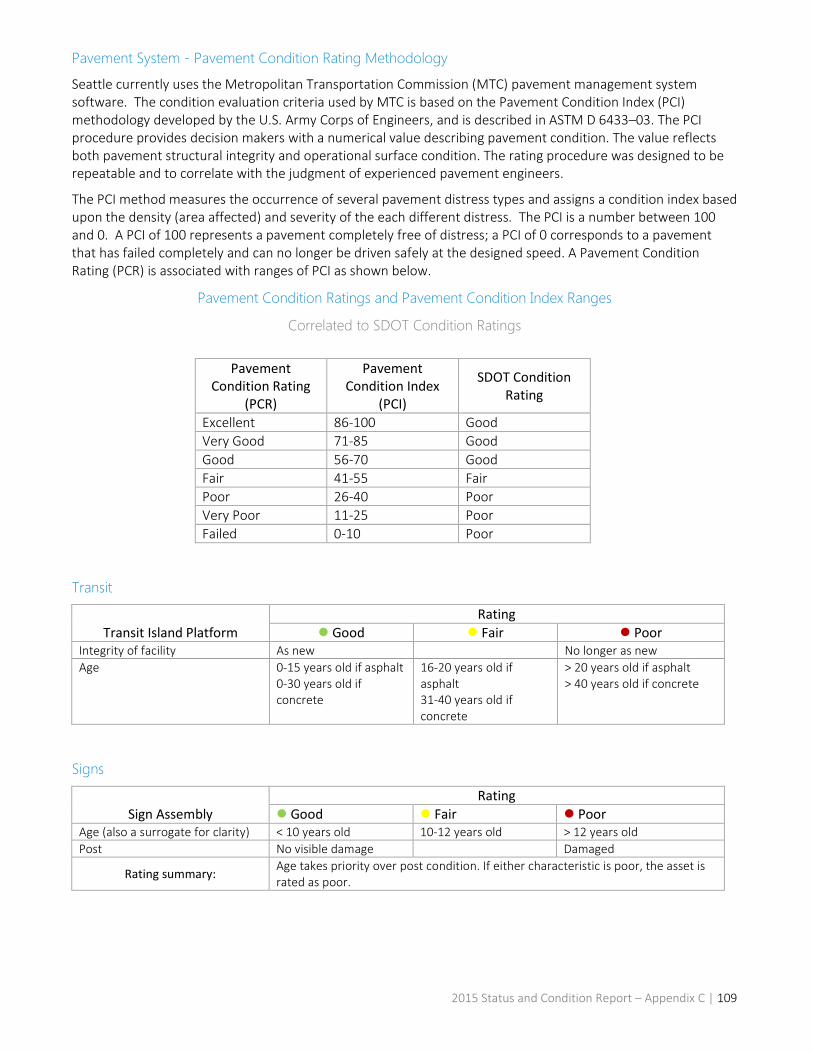
Pavement System - Pavement Condition Rating Methodology
Seattle currently uses the Metropolitan Transportation Commission (MTC) pavement management system software. The condition evaluation criteria used by MTC is based on the Pavement Condition Index (PCI) methodology developed by the U.S. Army Corps of Engineers, and is described in ASTM D 6433–03. The PCI procedure provides decision makers with a numerical value describing pavement condition. The value reflects both pavement structural integrity and operational surface condition. The rating procedure was designed to be repeatable and to correlate with the judgment of experienced pavement engineers.
The PCI method measures the occurrence of several pavement distress types and assigns a condition index based upon the density (area affected) and severity of the each different distress. The PCI is a number between 100 and 0. A PCI of 100 represents a pavement completely free of distress; a PCI of 0 corresponds to a pavement that has failed completely and can no longer be driven safely at the designed speed. A Pavement Condition Rating (PCR) is associated with ranges of PCI as shown below.
Pavement Condition Ratings and Pavement Condition Index Ranges
Correlated to SDOT Condition Ratings
Pavement
Condition Rating (PCR)
Pavement Condition Index
(PCI)
SDOT Condition Rating
Excellent 86-100 Good Very Good 71-85 Good Good 56-70 Good Fair 41-55 Fair Poor 26-40 Poor Very Poor 11-25 Poor Failed 0-10 Poor
Transit
Transit Island Platform Rating
Good Fair Poor Integrity of facility As new No longer as new Age 0-15 years old if asphalt
0-30 years old if concrete
16-20 years old if asphalt 31-40 years old if concrete
> 20 years old if asphalt > 40 years old if concrete
Signs
Sign Assembly Rating
Good Fair Poor Age (also a surrogate for clarity) < 10 years old 10-12 years old > 12 years old Post No visible damage Damaged
Rating summary: Age takes priority over post condition. If either characteristic is poor, the asset is rated as poor.
2015 Status and Condition Report – Appendix C | 109

Traffic Safety Devices & Structures
Chicane Rating
Good Fair Poor Integrity of facility As new No longer as new Age 0-15 years old 16-20 years old > 20 years old
Crash Cushion Rating
Good Fair Poor Crash history No crash history Suffered a vehicular impact Age 0-7 years old 8-10 years old > 10 years old
Guardrail Rating
Good Fair Poor Crash history No crash history Suffered a vehicular impact Age 0-17 years old 17-25 years old > 25 years old
Median Island Rating
Good Fair Poor Integrity of facility As new No longer as new Age 0-15 years old if asphalt
0-30 years old if concrete
16-20 years old if asphalt 31-40 years old if concrete
> 20 years old if asphalt > 40 years old if concrete
Speed Cushion Rating
Good Fair Poor Bolt connection Stable connection to
the surface Bolts disconnected or visibly
loosened from roadway Age 0-7 years old 8-10 years old > 10 years old
Speed Dot Rating
Good Fair Poor Integrity of facility As new No longer as new Age 1-15 years old 16-20 years old > 20 years old
Speed Hump Rating
Good Fair Poor Integrity of facility As new No longer as new Age 0-15 years old if asphalt
0-30 years old if concrete
16-20 years old if asphalt 31-40 years old if concrete
> 20 years old if asphalt > 40 years old if concrete
Traffic Circle Rating
Good Fair Poor Integrity of facility As new No longer as new Age 0-17 years old 17-25 years old > 25 years old
2015 Status and Condition Report – Appendix C | 110
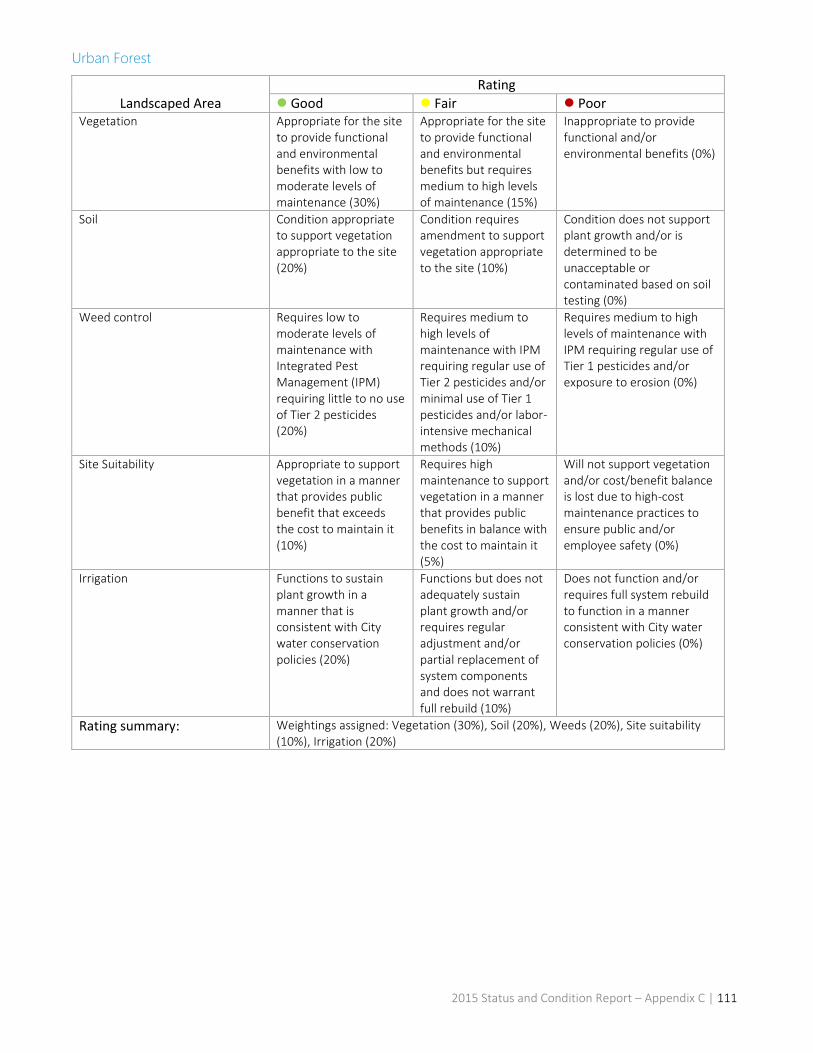
Urban Forest
Landscaped Area Rating
Good Fair Poor Vegetation Appropriate for the site
to provide functional and environmental benefits with low to moderate levels of maintenance (30%)
Appropriate for the site to provide functional and environmental benefits but requires medium to high levels of maintenance (15%)
Inappropriate to provide functional and/or environmental benefits (0%)
Soil Condition appropriate to support vegetation appropriate to the site (20%)
Condition requires amendment to support vegetation appropriate to the site (10%)
Condition does not support plant growth and/or is determined to be unacceptable or contaminated based on soil testing (0%)
Weed control Requires low to moderate levels of maintenance with Integrated Pest Management (IPM) requiring little to no use of Tier 2 pesticides (20%)
Requires medium to high levels of maintenance with IPM requiring regular use of Tier 2 pesticides and/or minimal use of Tier 1 pesticides and/or labor-intensive mechanical methods (10%)
Requires medium to high levels of maintenance with IPM requiring regular use of Tier 1 pesticides and/or exposure to erosion (0%)
Site Suitability Appropriate to support vegetation in a manner that provides public benefit that exceeds the cost to maintain it (10%)
Requires high maintenance to support vegetation in a manner that provides public benefits in balance with the cost to maintain it (5%)
Will not support vegetation and/or cost/benefit balance is lost due to high-cost maintenance practices to ensure public and/or employee safety (0%)
Irrigation Functions to sustain plant growth in a manner that is consistent with City water conservation policies (20%)
Functions but does not adequately sustain plant growth and/or requires regular adjustment and/or partial replacement of system components and does not warrant full rebuild (10%)
Does not function and/or requires full system rebuild to function in a manner consistent with City water conservation policies (0%)
Rating summary: Weightings assigned: Vegetation (30%), Soil (20%), Weeds (20%), Site suitability (10%), Irrigation (20%)
2015 Status and Condition Report – Appendix C | 111
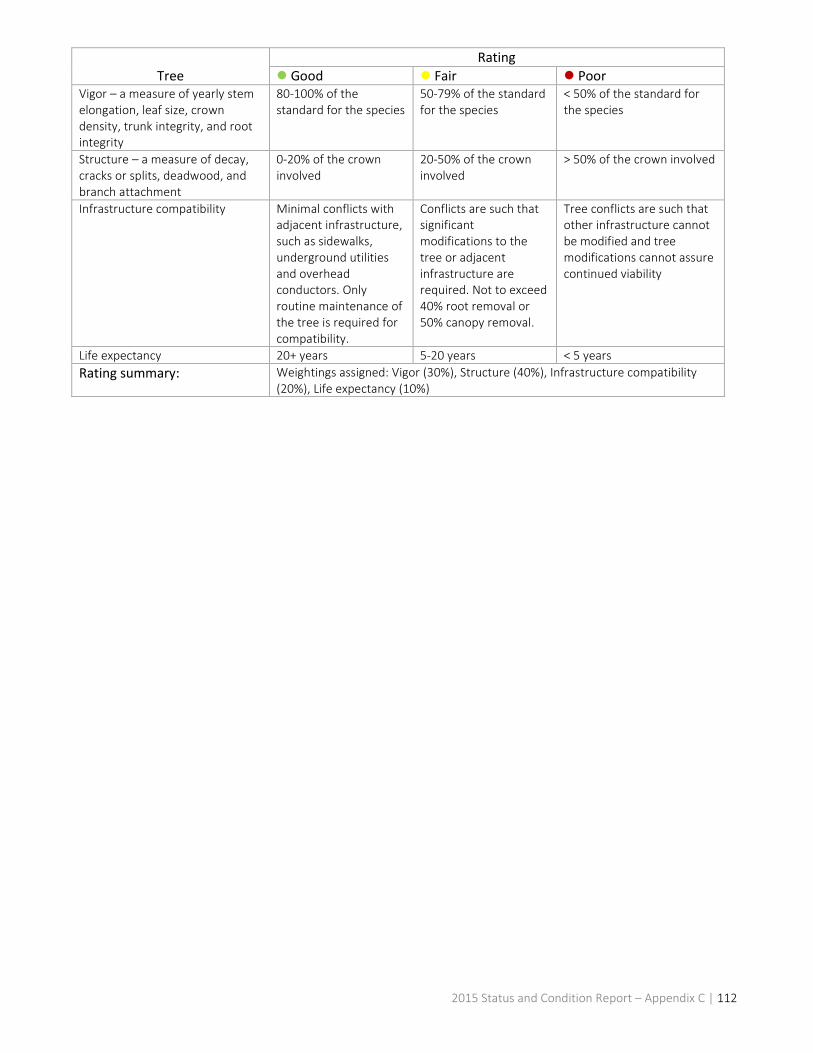
Tree Rating
Good Fair Poor Vigor – a measure of yearly stem elongation, leaf size, crown density, trunk integrity, and root integrity
80-100% of the standard for the species
50-79% of the standard for the species
< 50% of the standard for the species
Structure – a measure of decay, cracks or splits, deadwood, and branch attachment
0-20% of the crown involved
20-50% of the crown involved
> 50% of the crown involved
Infrastructure compatibility Minimal conflicts with adjacent infrastructure, such as sidewalks, underground utilities and overhead conductors. Only routine maintenance of the tree is required for compatibility.
Conflicts are such that significant modifications to the tree or adjacent infrastructure are required. Not to exceed 40% root removal or 50% canopy removal.
Tree conflicts are such that other infrastructure cannot be modified and tree modifications cannot assure continued viability
Life expectancy 20+ years 5-20 years < 5 years Rating summary: Weightings assigned: Vigor (30%), Structure (40%), Infrastructure compatibility
(20%), Life expectancy (10%)
2015 Status and Condition Report – Appendix C | 112

APPENDIX D: G-34 REPORTING A major initiative undertaken by the Governmental Accounting Standards Board (GASB), which establishes requirements for the annual financial reports of state and local governments, may provide a significant impetus for state Departments of Transportation and local governments to deploy an Asset Management system.
In June 1999, GASB issued Statement No. 34, “Basic Financial Statements for State and Local Governments,” which requires state and local agencies to enhance the types of information provided as part of their annual financial statements in a manner more consistent with that used by private-sector companies and governmental utilities. Annual reports in compliance with the new rule will include financial statements prepared using full accrual-based accounting practices which reflect all of the government’s activities — not just those that cover costs by charging a fee for service.
This new approach will cover all capital assets and long-term liabilities, including infrastructure as well as current assets and liabilities. Accrual accounting reports all of the costs and revenues of providing services each year.
GASB recommends that state, city, and county government agencies, in reporting capital assets as part of their modified financial statements, use an historical-cost approach to establish transportation infrastructure values. If historical cost information is not available, GASB provides guidance for a proxy estimate using the current replacement cost.
Statement 34 indicates that governments may use any established depreciation method and identifies both straight-line depreciation and condition-based depreciation as acceptable. However, the GASB requirements indicate that infrastructure assets that are part of a network or subsystem of a network do not have to be depreciated if two distinct criteria are met — namely, if the government manages the infrastructure assets using an Asset Management system, and if the government documents that the infrastructure assets are being preserved at, or above, a condition level originally established for the assets. The Asset Management system should:
Have an up-to-date inventory of assets; Perform condition assessment of the infrastructure assets at least once every three (3) years and
summarize the results using a measurement scale; and Estimate the annual amount required to maintain and preserve the infrastructure assets at the condition
level originally established for those assets.
Source: United States Department of Transportation (USDOT) Asset Management Primer
2015 Status and Condition Report – Appendix D | 113

APPENDIX E: GLOSSARY Terms and acronyms used in this document:
Term/Acronym Definition/Description AC Asphalt concrete over flexible base AC/PCC Asphalt concrete over Portland cement concrete or other rigid base ADA Americans with Disabilities Act Asset Class A grouping of Level 1 Assets that is based on commonality of function of the
Asset Asset Hierarchy The decomposition of an Asset into its successive lower-level component
Assets; the overall framework into which SDOT has organized its Assets Asset Owner A position in the SDOT organization that is recognized as the primary source
of information and knowledge about capital investment needs, preservation, maintenance and operation of an asset.
Bike Boulevard A shared roadway which has been optimized for bicycle traffic. In contrast with other shared roadways, bicycle boulevards discourage cut-through motor traffic but typically allow local motor vehicle traffic. Bike boulevards are designed to give priority to cyclists as through-going traffic
Block Face One side of a street segment Block Face Equivalent 2000 square feet BST Bituminous surface treatment, commonly referred to as Chip Seal Catenary Curve of cable; the curve adopted by a length of heavy cable, rope, or chain
of uniform density, hanging between two points, or something with this shape; refers to the overhead cables associated with the streetcar system
CBD Central Business District CIP Capital Improvement Program Complete Streets Seattle’s Complete Streets policy is about creating and maintaining safe
streets for everyone. In 2007, the Seattle City Council passed Ordinance 122386, known as the Complete Streets ordinance, which directs SDOT to design streets for pedestrians, bicyclists, transit riders, and persons of all abilities, while promoting safe operation for all users, including freight. This is the lens through which SDOT views our major maintenance and construction projects.
Construction Includes replacement DBH Diameter at Breast Height, or 4.5 feet; used as a standard measure of tree
size Encroachment Non-permitted private use of the public ROW GASB-34 Governmental Accounting Standards Board, Statement 34 Gore Area The area of the roadway in-between two (2) diverging lanes before reaching a
structural delineator Infrastructure Includes the rights-of-way Lane-Line Mile A measure of pavement marking that is equivalent to a 4” line of painting that
extends one (1) mile in length Level 1 Asset The highest level of the physical Asset Hierarchy; the level at which
investment decisions are commonly considered Maintenance Includes preservation Movable Bridge A bridge with one or more spans that open to allow passage of vessel traffic Microsurfacing Paving Program Microsurfacing, an alternative to chip sealing, is a protective seal coat which
extends the life of pavement. It is a thin, tough layer of asphalt emulsion blended with finely crushed stone for traction.
Operation Includes use
2015 Status and Condition Report – Appendix E | 114
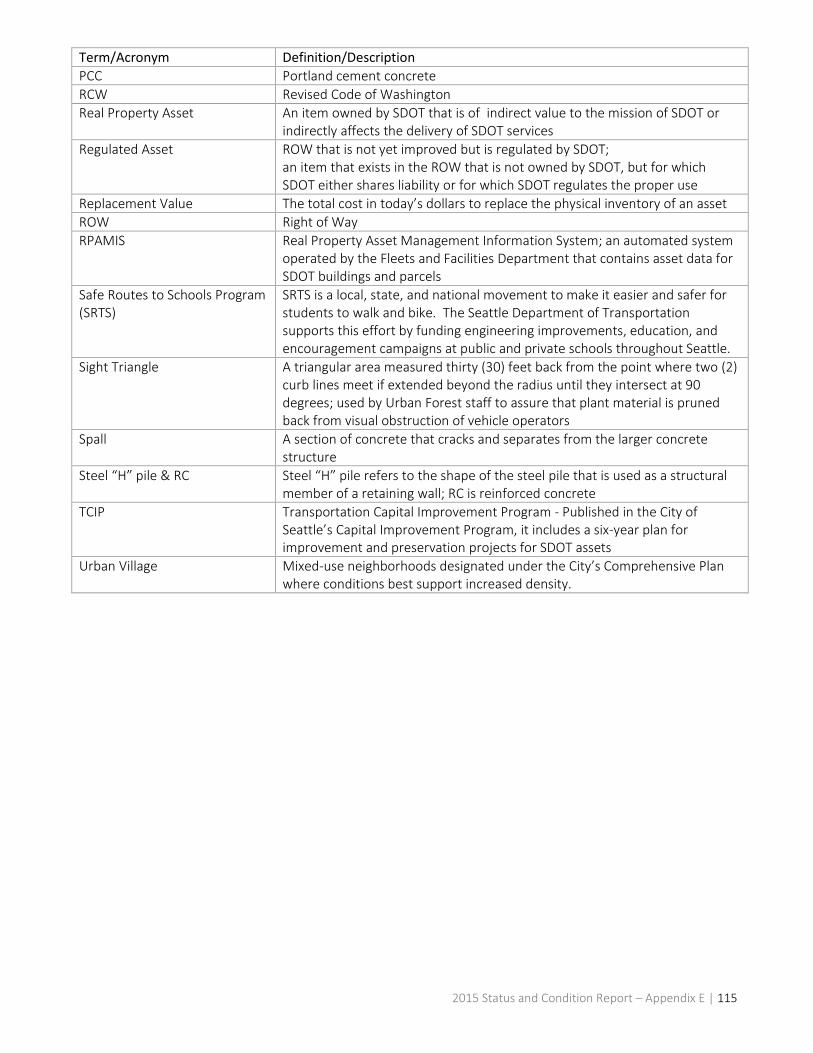
Term/Acronym Definition/Description PCC Portland cement concrete RCW Revised Code of Washington Real Property Asset An item owned by SDOT that is of indirect value to the mission of SDOT or
indirectly affects the delivery of SDOT services Regulated Asset ROW that is not yet improved but is regulated by SDOT;
an item that exists in the ROW that is not owned by SDOT, but for which SDOT either shares liability or for which SDOT regulates the proper use
Replacement Value The total cost in today’s dollars to replace the physical inventory of an asset ROW Right of Way RPAMIS Real Property Asset Management Information System; an automated system
operated by the Fleets and Facilities Department that contains asset data for SDOT buildings and parcels
Safe Routes to Schools Program (SRTS)
SRTS is a local, state, and national movement to make it easier and safer for students to walk and bike. The Seattle Department of Transportation supports this effort by funding engineering improvements, education, and encouragement campaigns at public and private schools throughout Seattle.
Sight Triangle A triangular area measured thirty (30) feet back from the point where two (2) curb lines meet if extended beyond the radius until they intersect at 90 degrees; used by Urban Forest staff to assure that plant material is pruned back from visual obstruction of vehicle operators
Spall A section of concrete that cracks and separates from the larger concrete structure
Steel “H” pile & RC Steel “H” pile refers to the shape of the steel pile that is used as a structural member of a retaining wall; RC is reinforced concrete
TCIP Transportation Capital Improvement Program - Published in the City of Seattle’s Capital Improvement Program, it includes a six-year plan for improvement and preservation projects for SDOT assets
Urban Village Mixed-use neighborhoods designated under the City’s Comprehensive Plan where conditions best support increased density.
2015 Status and Condition Report – Appendix E | 115
Related Documents