1 SDG monitoring tool for 3 Gram Panchayats in Uddyam – Talasari Integrated Skills Development Project Research Report By Pankaj Shrivastav CEO Tathyashodh Development Consultants Dehradun [email protected] Feb 2018

Welcome message from author
This document is posted to help you gain knowledge. Please leave a comment to let me know what you think about it! Share it to your friends and learn new things together.
Transcript
1
SDG monitoring tool for 3 Gram Panchayats in Uddyam – Talasari Integrated Skills Development Project
Research Report
By Pankaj Shrivastav
CEO Tathyashodh Development Consultants
Dehradun [email protected]
Feb 2018
2
TABLE OF CONTENTS Executive Summary .................................................................................................................... 4
Abbreviations Used .................................................................................................................... 5
A. Evolution and importance of the Sustainable Development Goals ........................................ 6
1. The Millennium Development Goals and gaps in their achievement ............................................................6 2. The Sustainable Development Goals - SDGs .................................................................................................7 3. The importance of India in achieving global SDGs ........................................................................................7 4. Need for localisation of the SDGS ................................................................................................................8 5. Approach to the SDGs of the Government of India ......................................................................................8
B. Background to the study area and project ............................................................................. 9
1. The Uddyam project context .......................................................................................................................9
C. Why should we track the SDG Indicators? ............................................................................ 10
D. Methodology adopted for developing the SDG monitoring tool .......................................... 10
Step 1: Shortlisting the SDGs that would be monitored ................................................................................. 10 Step 2: Shortlisting of targets and Indicators for selected SDGS ..................................................................... 11 Step 3: Field testing of the indicator list and finalisation of indicators ............................................................ 11 Step 4: Data collection on each indicator....................................................................................................... 11 Step 5: Gap filling of missing data.................................................................................................................. 11 Step 6: Pruning of Indicators based on comparability with State and national data ........................................ 11 Step 7: Constructing the final baseline of the SDG indicators for Project Uddyam .......................................... 11
E. Major Findings from the SDG Baseline Data ......................................................................... 14
Goal 1 ........................................................................................................................................................... 14 Indicator 1.1. Proportion of population living below the national poverty line ............................................................ 14 Indicator 1.2. Resource allocated by government directly to poverty reduction ......................................................... 14 a. Expenditure under MNREGS – 2016-17 ................................................................................................ 14 Indicator 1.3. Proportion of population covered by social protection floors systems .................................................. 14 a. Indira Awas Yojana .............................................................................................................................. 15 b. MNREGS ............................................................................................................................................. 15 Indicator 1.4. SC & ST students under post matric scholarship ................................................................................... 15
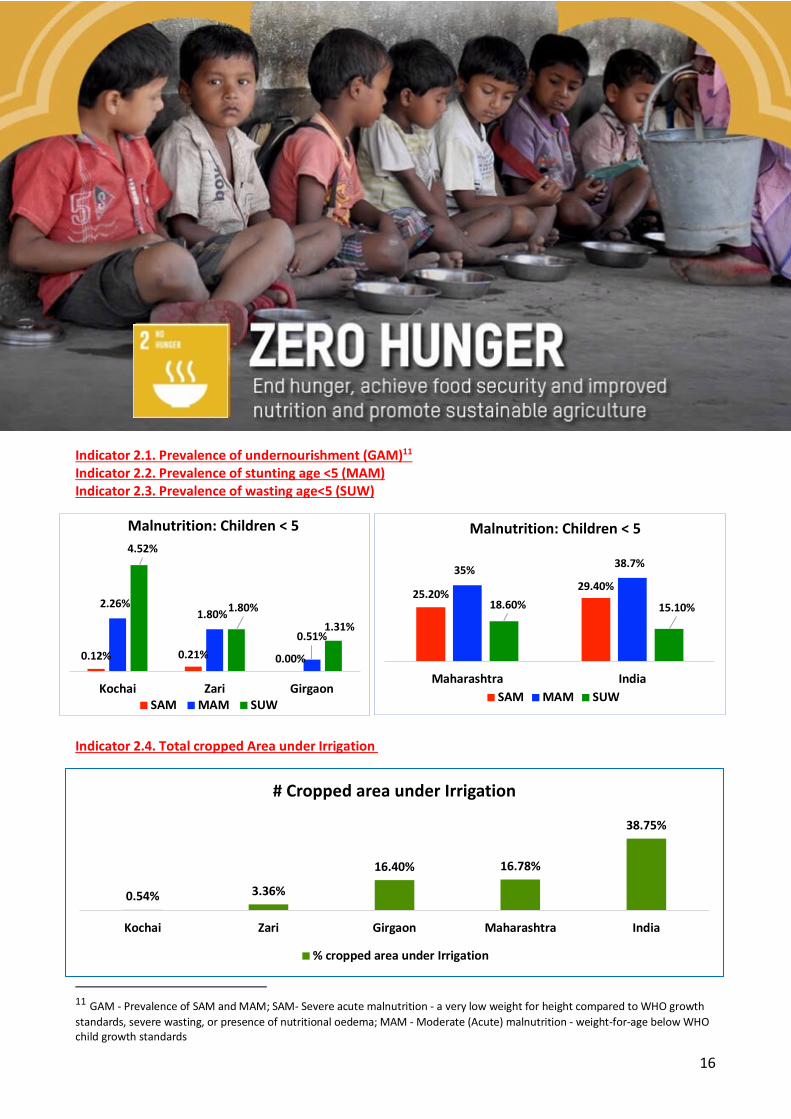
Goal 2 ........................................................................................................................................................... 16 Indicator 2.1. Prevalence of undernourishment (GAM) .............................................................................................. 16 Indicator 2.2. Prevalence of stunting age <5 (MAM) .................................................................................................. 16 Indicator 2.3. Prevalence of wasting age<5 (SUW) ..................................................................................................... 16 Indicator 2.4. Total cropped Area under Irrigation ..................................................................................................... 16
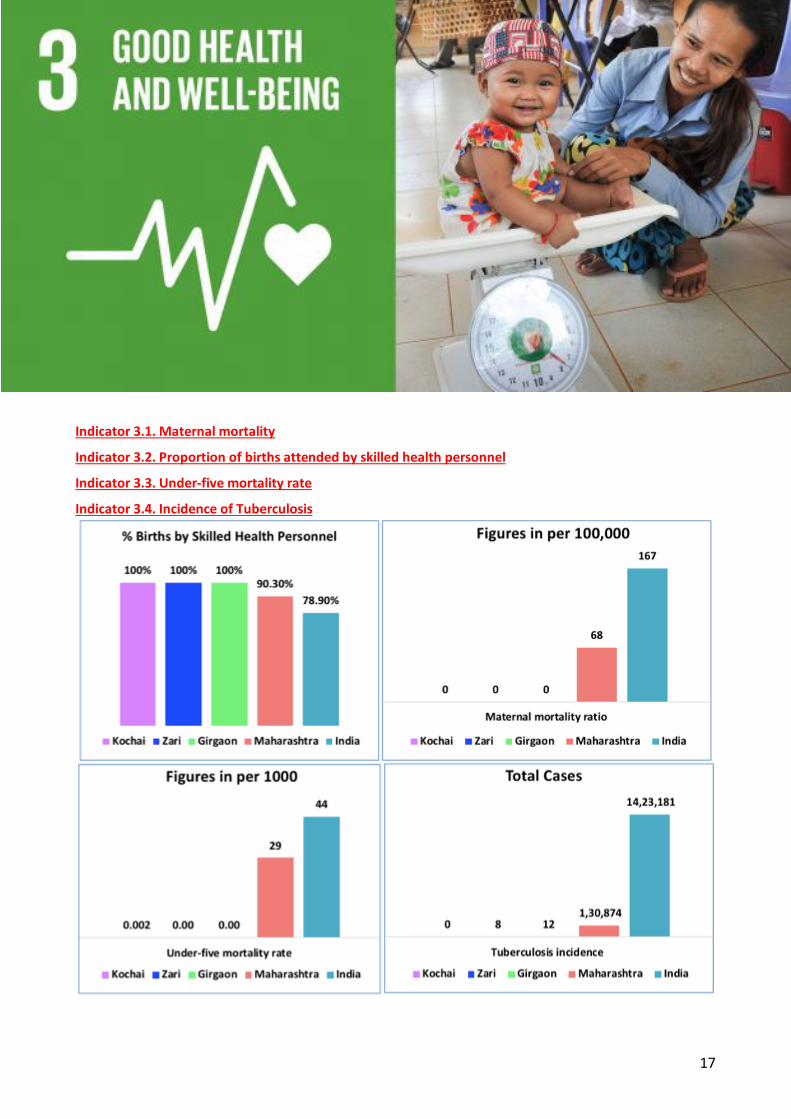
Goal 3 ........................................................................................................................................................... 17 Indicator 3.1. Maternal mortality .............................................................................................................................. 17 Indicator 3.2. Proportion of births attended by skilled health personnel .................................................................... 17 Indicator 3.3. Under-five mortality rate ..................................................................................................................... 17 Indicator 3.4. Incidence of Tuberculosis .................................................................................................................... 17
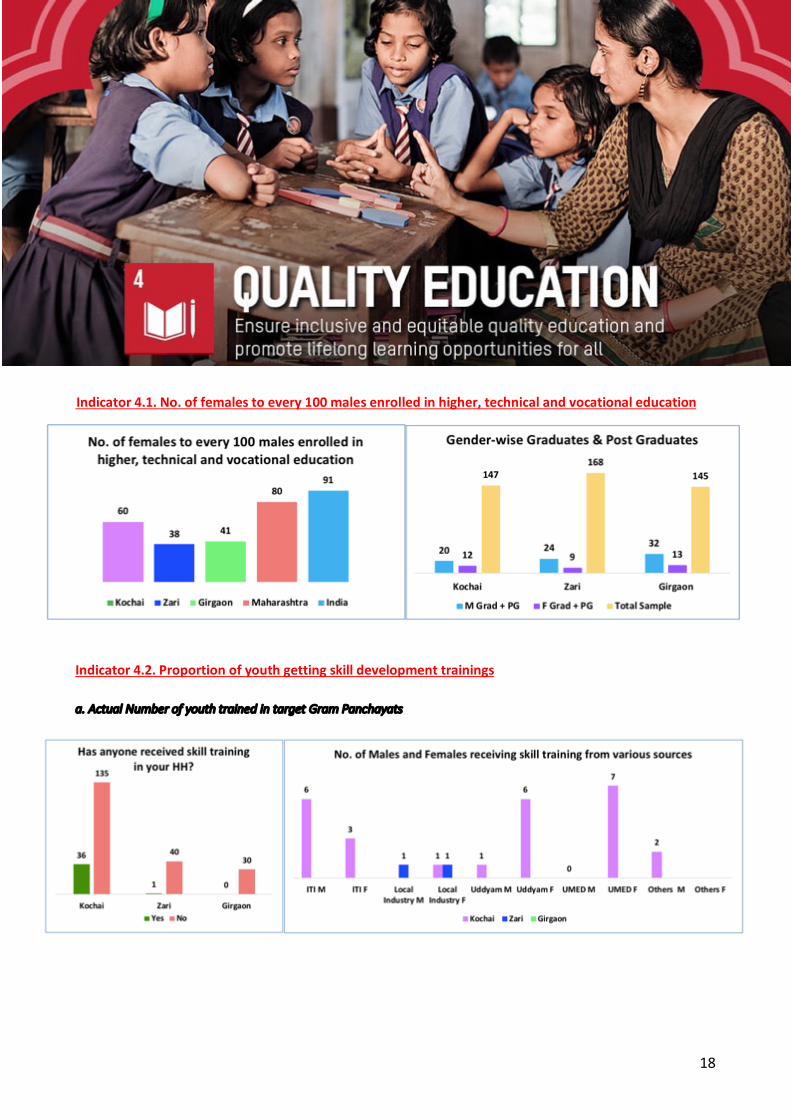
Goal 4 ........................................................................................................................................................... 18 Indicator 4.1. No. of females to every 100 males enrolled in higher, technical and vocational education .................... 18 Indicator 4.2. Proportion of youth getting skill development trainings ....................................................................... 18 a. Actual Number of youth trained in target Gram Panchayats ................................................................ 18 b. Proportion of youth trained in skill development .................................................................................. 19 c. Youth Enrolment in vocational institutions ........................................................................................... 19
Goal 5 ........................................................................................................................................................... 20 Indicator 5.1. Child Sex Ratio .................................................................................................................................... 20
3
Indicator 5.2. Proportion of seats held by women in National, State and Panchayat Elected Bodies ............................ 20 Indicator 5.3. Proportion of female agricultural labourers ......................................................................................... 20 Indicator 5.4. Wages of casual labourers (gender wise) ............................................................................................. 21 Indicator 5.5. Agricultural wages (gender wise) ......................................................................................................... 21 Indicator 5.6. Number of mobile phone users, by sex ................................................................................................ 21
Goal 8 ........................................................................................................................................................... 22 Indicator 8.1. Annual agriculture production ............................................................................................................. 22 Indicator 8.2. Proportion of informal employment in non - agriculture employment .................................................. 22 Indicator 8.3. Average annual income of workers (indicator for decent work) ............................................................ 23 Indicator 8.4. Workforce Participation Rate (WPR) of women .................................................................................... 23 Indicator 8.5. Proportion of Households with out-migrant workers ............................................................................ 23 Indicator 8.6. Employment generated under MNREGS ............................................................................................... 24
Goal 12 ......................................................................................................................................................... 25 Indicator 12.1. No. of Farmers practicing organic agriculture ..................................................................................... 25 Indicator 12.2. Per ha use of chemical fertilisers and pesticides ................................................................................. 25
Goal 13 ......................................................................................................................................................... 26 13.1. What do understand by the term "climate change"? ......................................................................................... 26 13.2. Have you observed any of above changes in past 5-10 years in your village/ area? ............................................ 26 13.3. What are the effects of the above climate changes on your lives? ..................................................................... 27 13.4. Why do you think these changes are happening?.............................................................................................. 27 13.5. What do you think can be done to reduce problems of climate change? ........................................................... 28
F. Suggested Way Forward: Collecting data for the SDG Tracking Tool from next year............ 28
G. General Observations and Conclusions ................................................................................ 29
1. SDGs as an approach for integrated development planning ....................................................................... 29 2. Need to strengthen natural resource base for long-term sustainability ...................................................... 29 3. Crop diversification and building Value Chains ........................................................................................... 29 4. Water Conservation technologies.............................................................................................................. 29 5. Developing skills and opportunities for unemployed youth ........................................................................ 29 6. Potential for Eco-tourism .......................................................................................................................... 30 7. Protection to migrating persons ................................................................................................................ 30 8. Linking to MNREGS for strengthening natural resource base ..................................................................... 30 9. Linking to the Integrated Tribal Development Programme ......................................................................... 30 10. Climate Change Adaptation ..................................................................................................................... 30 11. Overall approach ..................................................................................................................................... 30
Annexes
Annex 1: SDG Monitoring Tool – Baseline Data Sheet
Annex 2: Indicator-wise sources of Data
Annex 3: Some other Indicators to track at Gram Panchayat Level
Annex 4: Details of Uddyam Project
Annex 5: Format for Primary Data Collection on gaps in existing data
Annex 6: Draft list of SDG Indicators from MOSPI, GoI
Annex 7: Global SDG Indicators
4
Executive Summary According to global estimates the Millennium Development Goal on reducing global poverty by half has been achieved. In spite of this, 1 billion people globally continue to live in extreme poverty and malnourishment. The largest proportion of these global poor live in India. The situation on the Multidimensional Poverty Index is even more alarming. India is home to 41% of the MPI- poor people, and 31% of the Global MPI-poor children in the world. Thus, achievement of the SDGs by India will be a key element in the world achieving the SDGs. Additionally, if the SDGs are to be achieved, much of the action and changes needs to happen at the Gram Panchayat level. With this rationale, LTPCT and UNDP initiated a project on localisation of the SDGs in three Gram Panchayats in Talasari Block of Palghar district in Maharashtra. The initiative is located within the Uddyam project, which is being jointly implemented in the target Gram Panchayats by LTPCT and UNDP. The project will cover 10,000 families in in the three Gram Panchayats through interventions in enhancing production of vegetables, pulses, small ruminants and poultry. Additionally, the project will set up a career guidance and counselling centre and also facilitate production and marketing of Warli arts and crafts from the region. This is the report of an assignment for designing a system for tracking the progress on the SDGs within the three target Gram Panchayats. The methodology adopted for the same was as follows:
1: Shortlisting the SDGs that would be monitored
2: Shortlisting of targets and Indicators for selected SDGS
3: Field testing of the indicator list and finalisation of indicators
4: Data collection on each indicator
5: Gap filing of missing data
6: Pruning of Indicators based on comparability with State/ national data
7: Constructing the baseline of the SDG indicators (See Annex 1 to this report).
30 Indicators on 8 SDGs were identified and data at Gram Panchayat level were collected on these. Simultaneously, State and National data was also collected to place the Gram Panchayat data in perspective. The findings of the baseline exercise are presented in Section E below. Based on data collected and the process followed, following are our main observations and conclusions:
1. SDG tracking can be a vehicle for integrated development planning at Gram Panchayat and higher levels. They can also be used to raise critical awareness on imperatives of local development needs.
2. The project needs to strengthen natural resource base through soil and water conservation measures for long-term sustainability, in addition to intervening in on-farm, off-farm livelihoods.
3. Crop diversification is urgently required as the villages practice paddy mono-cropping. A value chain approach will further strengthen agriculture and allied interventions.
4. With an annual rainfall of 856 mm, the adoption of water conservation technologies needs to be urgently enhanced.
5. Enhancing skills and opportunities for the large number of unemployed educated youth, e.g. through the Career Guiding and Counselling Centre, could be a key focus.
6. Talasari offers huge potential for Eco-tourism, which could be a win-win intervention.
7. The high number of local populations migrating for fishing assignment could be linked to life and medical insurance service-providers.
8. The high utilisation of MNREGS in the target villages could be used to strengthen local water harvesting and soil conservation structures.
9. The large ST population in target villages could be linked to the Integrated Tribal Development Programme for enhanced entitlements and finances.
10. Climate Change Adaptation is a future that local communities can be helped to support.
11. The project needs to make its planning more integrated, and set realistic growth targets, given the current socio-economic and natural resource limitations.
5
Abbreviations Used
GAM : Global Acute Malnutrition
HH : Households
ITDP : Integrated Tribal Development Programme
LTPCT : L & T Public Charitable Trust
MAM : Moderate Acute Malnutrition
MDG : Millennium Development Goals
MDG : Millennium Development Goals
MNREGS : Mahatma Gandhi National Rural Employment Guarantee Scheme
MOSPI : Ministry of Statistics and Programme Implementation, Govt. of India
MPI : Multi-dimensional Poverty Index
MSRLM : Maharashtra State Rural Livelihood Mission
MT : Metric Tons
NGOs : Non-Governmental Organisations
ODI : Overseas Development Institute
SAM : Severe Acute Malnutrition
SC : Scheduled Castes
SDG : Sustainable Development Goals
ST : Scheduled Tribes
SUW : Severely Under Weight
UCLG : United Cities and Local Governments
UMED : Brand Name of MSRLM
UNDP : United Nations Development Programme
6
A. Evolution and importance of the Sustainable Development Goals 1. The Millennium Development Goals and gaps in their achievement In the year 2000, World leaders had come together to set eight ambitious goals for the next 15 years – until 2015 - to eradicate poverty and ensure development for all nations and peoples. These goals were called the Millennium Development Goals. In 2015 – at the end of the specified 15-year period, on reviewing how much the world has achieved on these goals, they found that progress on these goals has been uneven. For e.g., while the MDG Goal 1 (reduce global poverty by half) had been achieved in 2010, a number of gaps still remain, as described by a study by ODI in 20151:
• “Around a billion people continue to live in extreme poverty, on less than $1.25 a day. One third are likely to be children, although they make up just one fifth of the non-poor population. Also, over one third of the poor are actually in work – an estimated 375 million people. Under the Millennium Development Goals (MDGs), although poverty was reduced, the gains have been close to zero for the poorest.
• One billion people age-15-and-up have either no schooling or an incomplete primary education. Poor rural girls are often particularly deprived: on average, across 79 developing countries, 44% of poor rural females had 4 years-or-less of education compared with 23% of young adults.
• Close to one billion people (800 million) are malnourished – three quarters of whom live in rural areas.
• In all of the above, people from minority groups are significantly overrepresented. For example, more than two thirds of education- and health-poverty is found among households where the head is a member of an ethnic minority group. Moreover, across 16 countries the poorest women from disadvantaged ethnic groups were the most likely to have been left behind by progress in education and health”.
• The study also found that the poorest and most marginalized groups at the bottom 5% of the global income distribution had made no progress at all on the MDG targets on reducing poverty. The report points out that while the richest 1% of people own 48% of global wealth, there has been little progress in raising the “floor” for the income of those at the bottom.
Other issues needing urgent attention are:
• 800 million people are malnourished three quarters of which live in rural areas only
• 20% of old people globally have pensions
• Half of all women at work globally are in vulnerable employments
• Household surveys omit by design the homeless, people and Institutions, mobile nomadic or pastoralist populations
• Along with poverty, excluded groups often face discrimination on the basis of socially marginalised identities (race, ethnicity, caste, religion2 or language or sexual orientation3), with gender4 cutting across these groups. They also suffer from spatial inequalities as they tend to be concentrated in disadvantaged locations – remote rural areas or overcrowded slum neighbourhoods.
1 "Leave no one behind -The real bottom billion", Bhatkal, Tanvi, Emma Samman and Elizabeth Stuart, Sep 2015, ODI, UK 2 In 15 out of 58 countries more than 30% people said they would not want people of different religion as neighbours 3 75 countries currently criminalize same-sex sexual acts among consenting adults 4 Across 61 low and middle-income countries an average of 3 in 10 women believe wife beating to be acceptable. All footnotes sourced from ODI Study – Footnote 1 above
7
2. The Sustainable Development Goals - SDGs
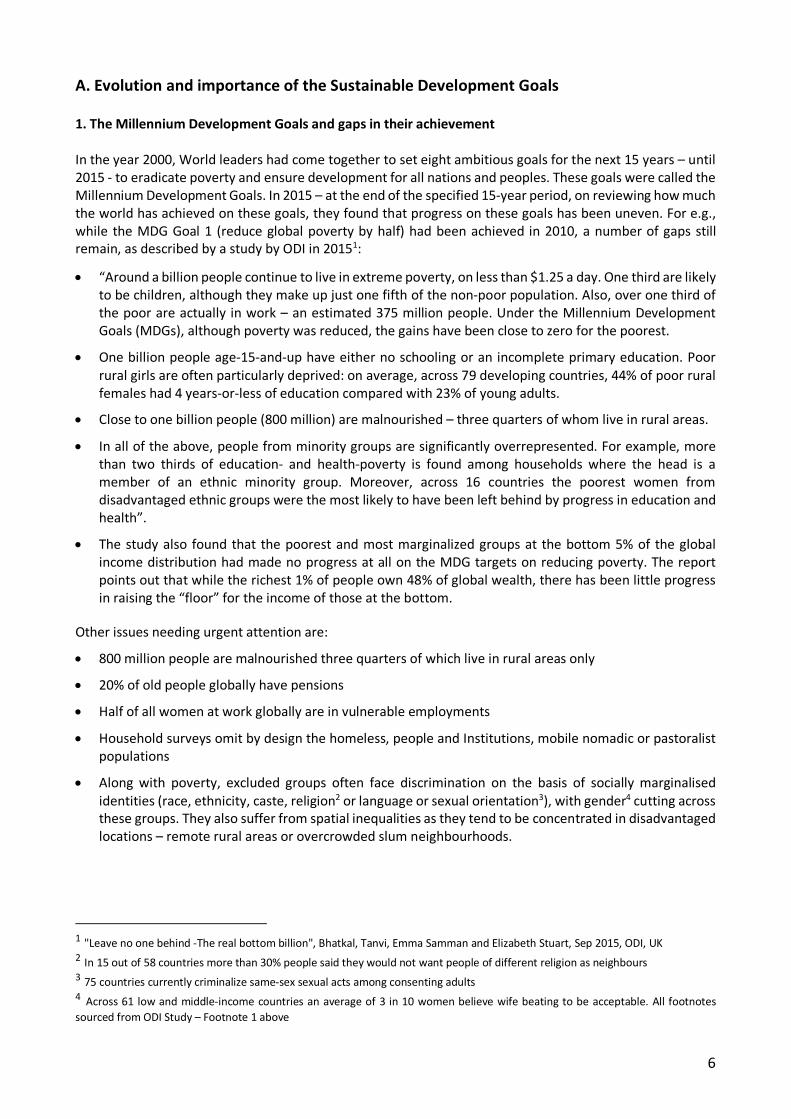
On September 25, 2015, 193 countries adopted a set of 17 goals to end poverty, protect the planet and ensure prosperity for all by year 2030, as part of a new sustainable development agenda, called Agenda 2030. The 17 goals are shown above.
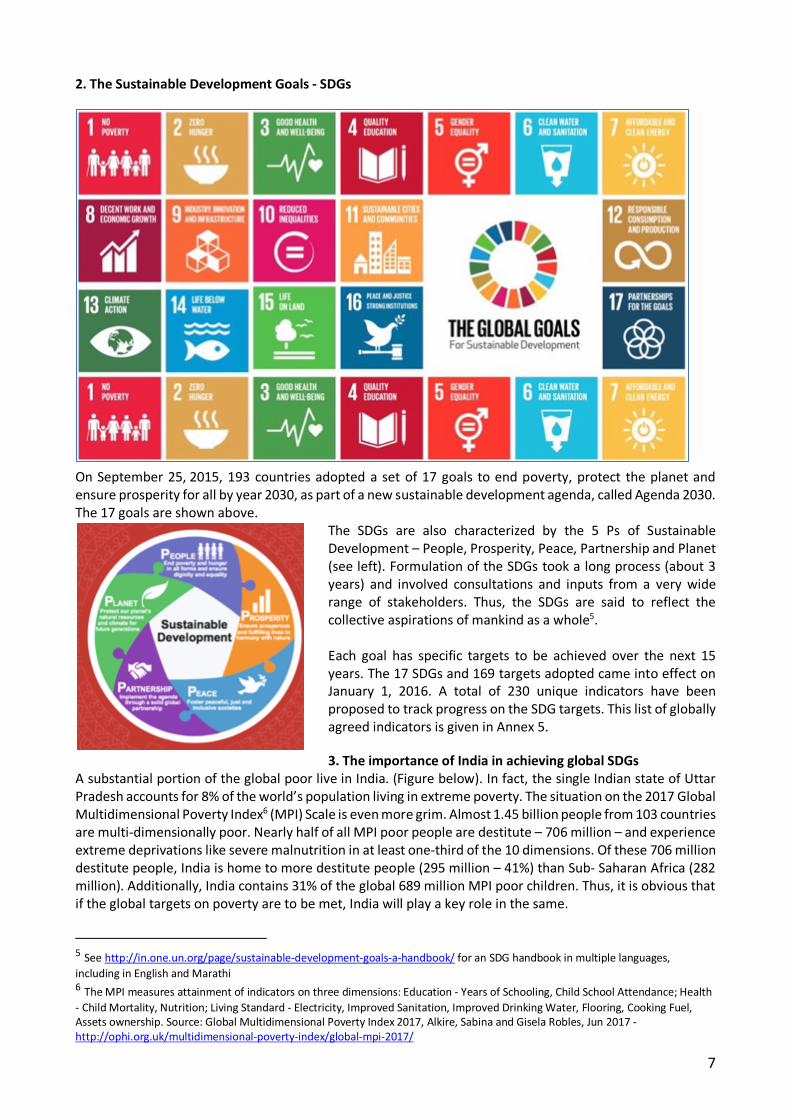
The SDGs are also characterized by the 5 Ps of Sustainable Development – People, Prosperity, Peace, Partnership and Planet (see left). Formulation of the SDGs took a long process (about 3 years) and involved consultations and inputs from a very wide range of stakeholders. Thus, the SDGs are said to reflect the collective aspirations of mankind as a whole5. Each goal has specific targets to be achieved over the next 15 years. The 17 SDGs and 169 targets adopted came into effect on January 1, 2016. A total of 230 unique indicators have been proposed to track progress on the SDG targets. This list of globally agreed indicators is given in Annex 5.
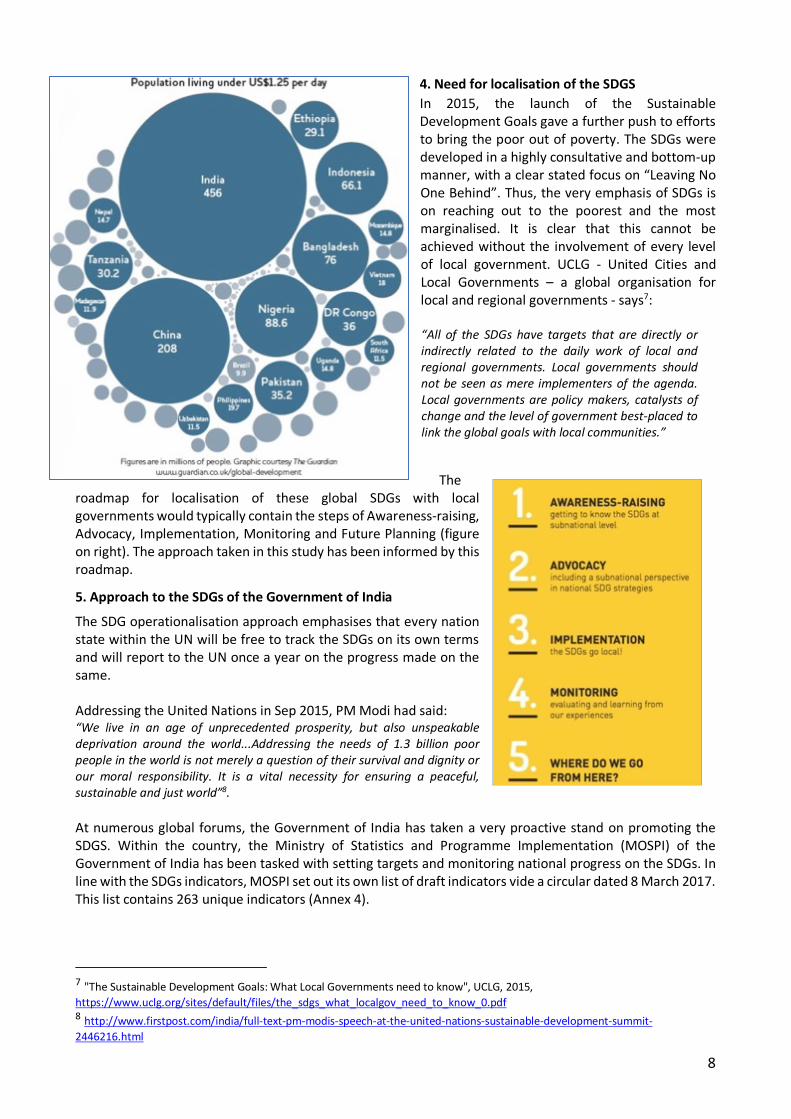
3. The importance of India in achieving global SDGs A substantial portion of the global poor live in India. (Figure below). In fact, the single Indian state of Uttar Pradesh accounts for 8% of the world’s population living in extreme poverty. The situation on the 2017 Global Multidimensional Poverty Index6 (MPI) Scale is even more grim. Almost 1.45 billion people from 103 countries are multi-dimensionally poor. Nearly half of all MPI poor people are destitute – 706 million – and experience extreme deprivations like severe malnutrition in at least one-third of the 10 dimensions. Of these 706 million destitute people, India is home to more destitute people (295 million – 41%) than Sub- Saharan Africa (282 million). Additionally, India contains 31% of the global 689 million MPI poor children. Thus, it is obvious that if the global targets on poverty are to be met, India will play a key role in the same.
5 See http://in.one.un.org/page/sustainable-development-goals-a-handbook/ for an SDG handbook in multiple languages, including in English and Marathi 6 The MPI measures attainment of indicators on three dimensions: Education - Years of Schooling, Child School Attendance; Health - Child Mortality, Nutrition; Living Standard - Electricity, Improved Sanitation, Improved Drinking Water, Flooring, Cooking Fuel, Assets ownership. Source: Global Multidimensional Poverty Index 2017, Alkire, Sabina and Gisela Robles, Jun 2017 - http://ophi.org.uk/multidimensional-poverty-index/global-mpi-2017/
8
4. Need for localisation of the SDGS
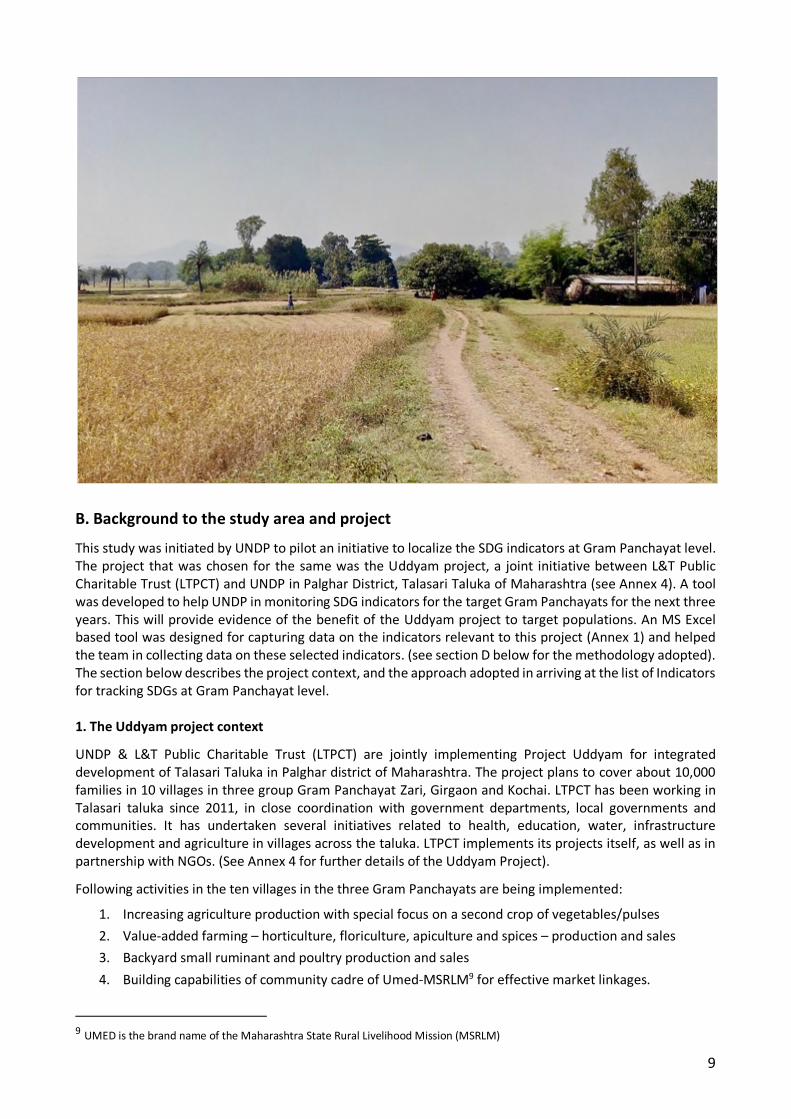
In 2015, the launch of the Sustainable Development Goals gave a further push to efforts to bring the poor out of poverty. The SDGs were developed in a highly consultative and bottom-up manner, with a clear stated focus on “Leaving No One Behind”. Thus, the very emphasis of SDGs is on reaching out to the poorest and the most marginalised. It is clear that this cannot be achieved without the involvement of every level of local government. UCLG - United Cities and Local Governments – a global organisation for local and regional governments - says7: “All of the SDGs have targets that are directly or indirectly related to the daily work of local and regional governments. Local governments should not be seen as mere implementers of the agenda. Local governments are policy makers, catalysts of change and the level of government best-placed to link the global goals with local communities.”
The
roadmap for localisation of these global SDGs with local governments would typically contain the steps of Awareness-raising, Advocacy, Implementation, Monitoring and Future Planning (figure on right). The approach taken in this study has been informed by this roadmap.
5. Approach to the SDGs of the Government of India
The SDG operationalisation approach emphasises that every nation state within the UN will be free to track the SDGs on its own terms and will report to the UN once a year on the progress made on the same. Addressing the United Nations in Sep 2015, PM Modi had said: “We live in an age of unprecedented prosperity, but also unspeakable deprivation around the world...Addressing the needs of 1.3 billion poor people in the world is not merely a question of their survival and dignity or our moral responsibility. It is a vital necessity for ensuring a peaceful, sustainable and just world”8. At numerous global forums, the Government of India has taken a very proactive stand on promoting the SDGS. Within the country, the Ministry of Statistics and Programme Implementation (MOSPI) of the Government of India has been tasked with setting targets and monitoring national progress on the SDGs. In line with the SDGs indicators, MOSPI set out its own list of draft indicators vide a circular dated 8 March 2017. This list contains 263 unique indicators (Annex 4).
7 "The Sustainable Development Goals: What Local Governments need to know", UCLG, 2015, https://www.uclg.org/sites/default/files/the_sdgs_what_localgov_need_to_know_0.pdf 8 http://www.firstpost.com/india/full-text-pm-modis-speech-at-the-united-nations-sustainable-development-summit-2446216.html
9
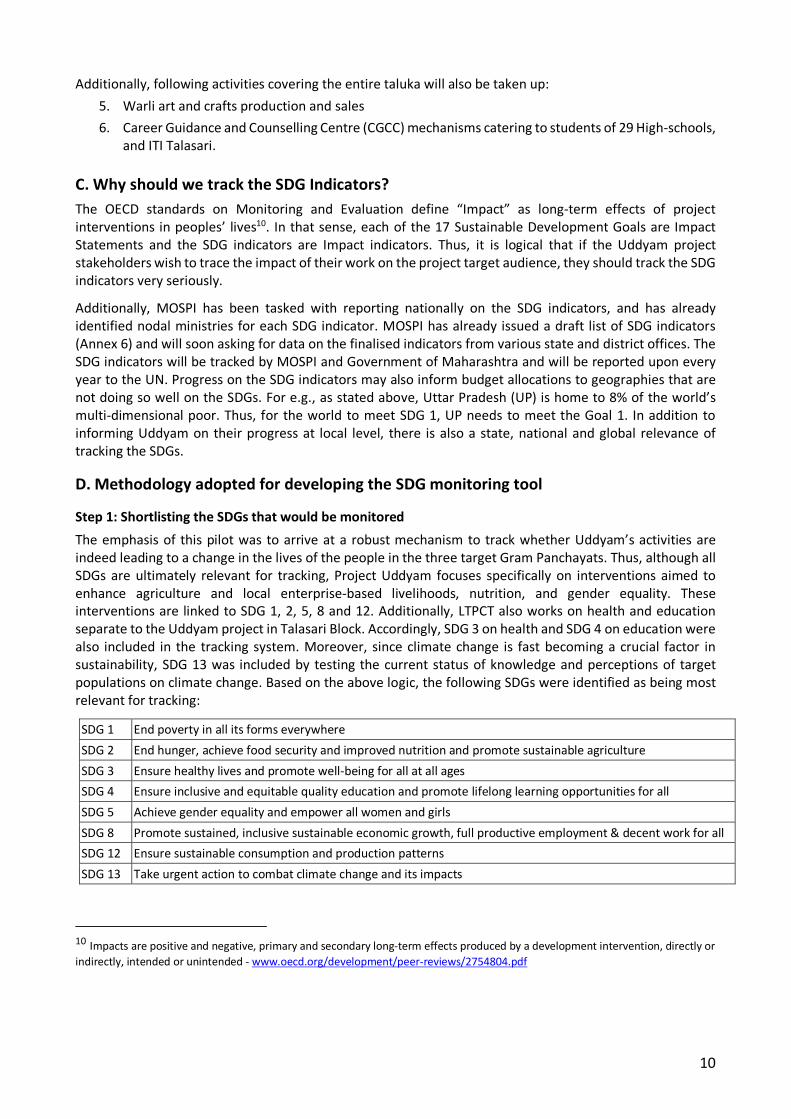
B. Background to the study area and project
This study was initiated by UNDP to pilot an initiative to localize the SDG indicators at Gram Panchayat level. The project that was chosen for the same was the Uddyam project, a joint initiative between L&T Public Charitable Trust (LTPCT) and UNDP in Palghar District, Talasari Taluka of Maharashtra (see Annex 4). A tool was developed to help UNDP in monitoring SDG indicators for the target Gram Panchayats for the next three years. This will provide evidence of the benefit of the Uddyam project to target populations. An MS Excel based tool was designed for capturing data on the indicators relevant to this project (Annex 1) and helped the team in collecting data on these selected indicators. (see section D below for the methodology adopted). The section below describes the project context, and the approach adopted in arriving at the list of Indicators for tracking SDGs at Gram Panchayat level. 1. The Uddyam project context
UNDP & L&T Public Charitable Trust (LTPCT) are jointly implementing Project Uddyam for integrated development of Talasari Taluka in Palghar district of Maharashtra. The project plans to cover about 10,000 families in 10 villages in three group Gram Panchayat Zari, Girgaon and Kochai. LTPCT has been working in Talasari taluka since 2011, in close coordination with government departments, local governments and communities. It has undertaken several initiatives related to health, education, water, infrastructure development and agriculture in villages across the taluka. LTPCT implements its projects itself, as well as in partnership with NGOs. (See Annex 4 for further details of the Uddyam Project).
Following activities in the ten villages in the three Gram Panchayats are being implemented:
1. Increasing agriculture production with special focus on a second crop of vegetables/pulses
2. Value-added farming – horticulture, floriculture, apiculture and spices – production and sales
3. Backyard small ruminant and poultry production and sales
4. Building capabilities of community cadre of Umed-MSRLM9 for effective market linkages.
9 UMED is the brand name of the Maharashtra State Rural Livelihood Mission (MSRLM)
10
Additionally, following activities covering the entire taluka will also be taken up:
5. Warli art and crafts production and sales
6. Career Guidance and Counselling Centre (CGCC) mechanisms catering to students of 29 High-schools, and ITI Talasari.
C. Why should we track the SDG Indicators?
The OECD standards on Monitoring and Evaluation define “Impact” as long-term effects of project interventions in peoples’ lives10. In that sense, each of the 17 Sustainable Development Goals are Impact Statements and the SDG indicators are Impact indicators. Thus, it is logical that if the Uddyam project stakeholders wish to trace the impact of their work on the project target audience, they should track the SDG indicators very seriously.
Additionally, MOSPI has been tasked with reporting nationally on the SDG indicators, and has already identified nodal ministries for each SDG indicator. MOSPI has already issued a draft list of SDG indicators (Annex 6) and will soon asking for data on the finalised indicators from various state and district offices. The SDG indicators will be tracked by MOSPI and Government of Maharashtra and will be reported upon every year to the UN. Progress on the SDG indicators may also inform budget allocations to geographies that are not doing so well on the SDGs. For e.g., as stated above, Uttar Pradesh (UP) is home to 8% of the world’s multi-dimensional poor. Thus, for the world to meet SDG 1, UP needs to meet the Goal 1. In addition to informing Uddyam on their progress at local level, there is also a state, national and global relevance of tracking the SDGs.
D. Methodology adopted for developing the SDG monitoring tool
Step 1: Shortlisting the SDGs that would be monitored
The emphasis of this pilot was to arrive at a robust mechanism to track whether Uddyam’s activities are indeed leading to a change in the lives of the people in the three target Gram Panchayats. Thus, although all SDGs are ultimately relevant for tracking, Project Uddyam focuses specifically on interventions aimed to enhance agriculture and local enterprise-based livelihoods, nutrition, and gender equality. These interventions are linked to SDG 1, 2, 5, 8 and 12. Additionally, LTPCT also works on health and education separate to the Uddyam project in Talasari Block. Accordingly, SDG 3 on health and SDG 4 on education were also included in the tracking system. Moreover, since climate change is fast becoming a crucial factor in sustainability, SDG 13 was included by testing the current status of knowledge and perceptions of target populations on climate change. Based on the above logic, the following SDGs were identified as being most relevant for tracking:
SDG 1 End poverty in all its forms everywhere SDG 2 End hunger, achieve food security and improved nutrition and promote sustainable agriculture SDG 3 Ensure healthy lives and promote well-being for all at all ages
SDG 4 Ensure inclusive and equitable quality education and promote lifelong learning opportunities for all
SDG 5 Achieve gender equality and empower all women and girls SDG 8 Promote sustained, inclusive sustainable economic growth, full productive employment & decent work for all SDG 12 Ensure sustainable consumption and production patterns SDG 13 Take urgent action to combat climate change and its impacts
10 Impacts are positive and negative, primary and secondary long-term effects produced by a development intervention, directly or indirectly, intended or unintended - www.oecd.org/development/peer-reviews/2754804.pdf
11
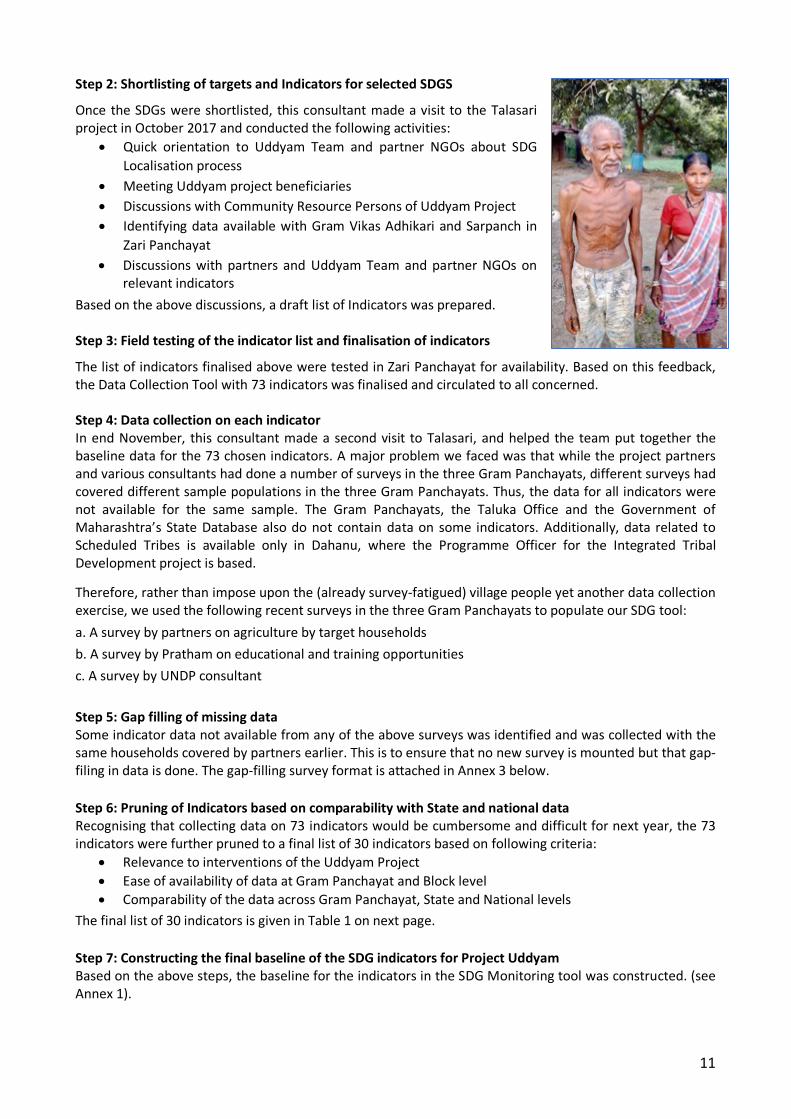
Step 2: Shortlisting of targets and Indicators for selected SDGS
Once the SDGs were shortlisted, this consultant made a visit to the Talasari project in October 2017 and conducted the following activities:
• Quick orientation to Uddyam Team and partner NGOs about SDG Localisation process
• Meeting Uddyam project beneficiaries • Discussions with Community Resource Persons of Uddyam Project • Identifying data available with Gram Vikas Adhikari and Sarpanch in
Zari Panchayat • Discussions with partners and Uddyam Team and partner NGOs on
relevant indicators
Based on the above discussions, a draft list of Indicators was prepared. Step 3: Field testing of the indicator list and finalisation of indicators
The list of indicators finalised above were tested in Zari Panchayat for availability. Based on this feedback, the Data Collection Tool with 73 indicators was finalised and circulated to all concerned. Step 4: Data collection on each indicator In end November, this consultant made a second visit to Talasari, and helped the team put together the baseline data for the 73 chosen indicators. A major problem we faced was that while the project partners and various consultants had done a number of surveys in the three Gram Panchayats, different surveys had covered different sample populations in the three Gram Panchayats. Thus, the data for all indicators were not available for the same sample. The Gram Panchayats, the Taluka Office and the Government of Maharashtra’s State Database also do not contain data on some indicators. Additionally, data related to Scheduled Tribes is available only in Dahanu, where the Programme Officer for the Integrated Tribal Development project is based.
Therefore, rather than impose upon the (already survey-fatigued) village people yet another data collection exercise, we used the following recent surveys in the three Gram Panchayats to populate our SDG tool:
a. A survey by partners on agriculture by target households
b. A survey by Pratham on educational and training opportunities
c. A survey by UNDP consultant
Step 5: Gap filling of missing data
Some indicator data not available from any of the above surveys was identified and was collected with the same households covered by partners earlier. This is to ensure that no new survey is mounted but that gap-filing in data is done. The gap-filling survey format is attached in Annex 3 below. Step 6: Pruning of Indicators based on comparability with State and national data Recognising that collecting data on 73 indicators would be cumbersome and difficult for next year, the 73 indicators were further pruned to a final list of 30 indicators based on following criteria:
• Relevance to interventions of the Uddyam Project • Ease of availability of data at Gram Panchayat and Block level • Comparability of the data across Gram Panchayat, State and National levels
The final list of 30 indicators is given in Table 1 on next page. Step 7: Constructing the final baseline of the SDG indicators for Project Uddyam Based on the above steps, the baseline for the indicators in the SDG Monitoring tool was constructed. (see Annex 1).
12
Special note: For some Gram Panchayat indicators, comparable data was not available at State and National level. However, this does not make these indicators useless. In fact, tracking these indicators will be critical to track the health of the project and beneficiaries. We have included these indicators in Annex 3, and Project Uddyam may like to track these, in addition to the 30 SDG indicators.
13
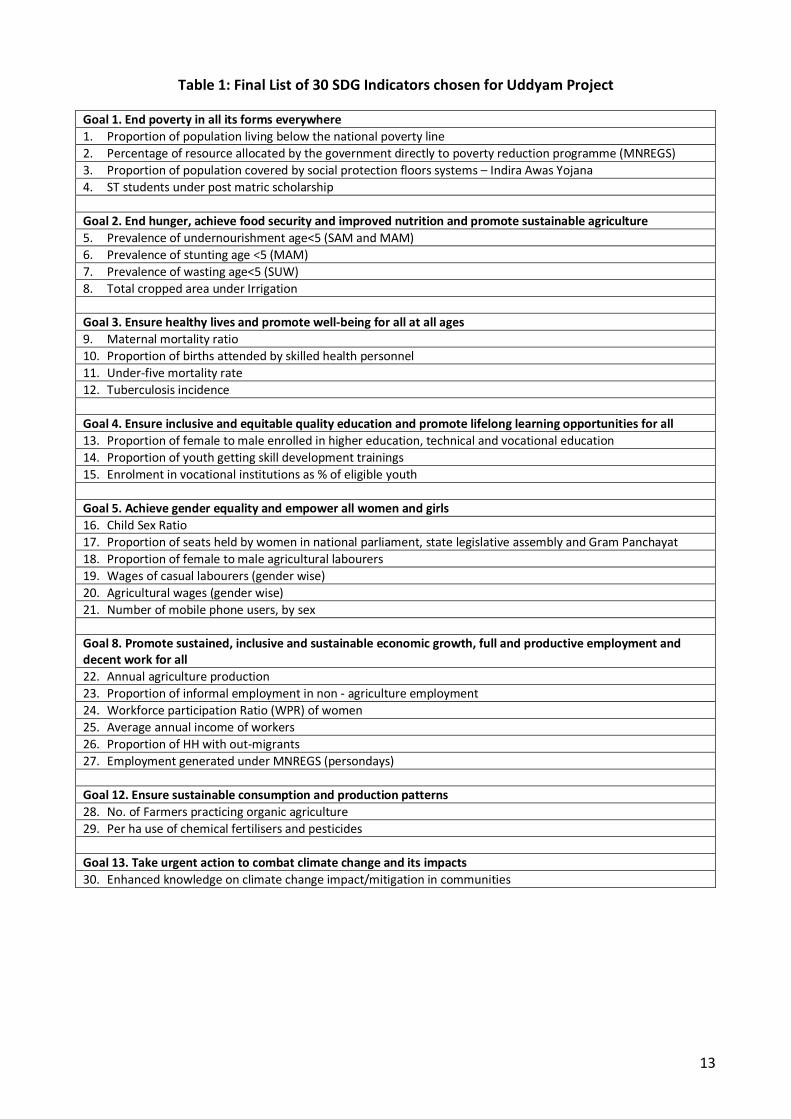
Table 1: Final List of 30 SDG Indicators chosen for Uddyam Project
Goal 1. End poverty in all its forms everywhere 1. Proportion of population living below the national poverty line 2. Percentage of resource allocated by the government directly to poverty reduction programme (MNREGS) 3. Proportion of population covered by social protection floors systems – Indira Awas Yojana 4. ST students under post matric scholarship Goal 2. End hunger, achieve food security and improved nutrition and promote sustainable agriculture 5. Prevalence of undernourishment age<5 (SAM and MAM) 6. Prevalence of stunting age <5 (MAM) 7. Prevalence of wasting age<5 (SUW) 8. Total cropped area under Irrigation Goal 3. Ensure healthy lives and promote well-being for all at all ages 9. Maternal mortality ratio 10. Proportion of births attended by skilled health personnel 11. Under-five mortality rate 12. Tuberculosis incidence Goal 4. Ensure inclusive and equitable quality education and promote lifelong learning opportunities for all 13. Proportion of female to male enrolled in higher education, technical and vocational education 14. Proportion of youth getting skill development trainings 15. Enrolment in vocational institutions as % of eligible youth Goal 5. Achieve gender equality and empower all women and girls 16. Child Sex Ratio 17. Proportion of seats held by women in national parliament, state legislative assembly and Gram Panchayat 18. Proportion of female to male agricultural labourers 19. Wages of casual labourers (gender wise) 20. Agricultural wages (gender wise) 21. Number of mobile phone users, by sex Goal 8. Promote sustained, inclusive and sustainable economic growth, full and productive employment and decent work for all 22. Annual agriculture production 23. Proportion of informal employment in non - agriculture employment 24. Workforce participation Ratio (WPR) of women 25. Average annual income of workers 26. Proportion of HH with out-migrants 27. Employment generated under MNREGS (persondays) Goal 12. Ensure sustainable consumption and production patterns 28. No. of Farmers practicing organic agriculture 29. Per ha use of chemical fertilisers and pesticides Goal 13. Take urgent action to combat climate change and its impacts 30. Enhanced knowledge on climate change impact/mitigation in communities
14
E. Major Findings from the SDG Baseline Data
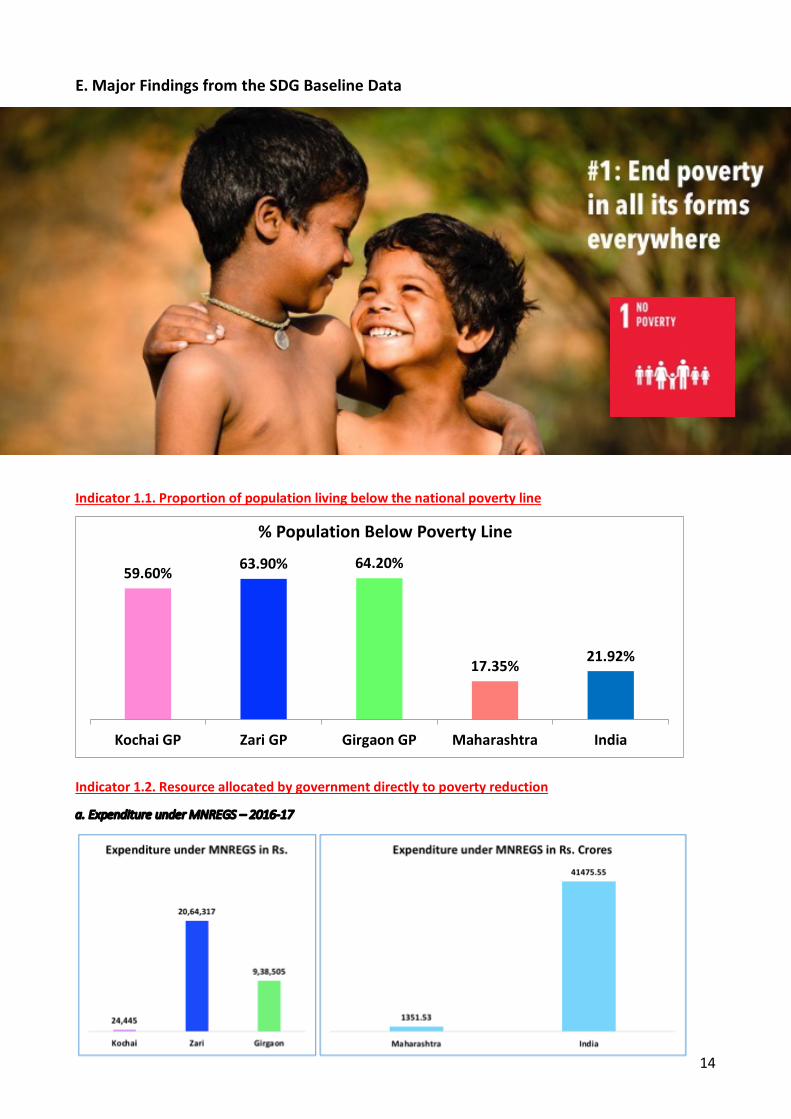
Goal 1 Indicator 1.1. Proportion of population living below the national poverty line
Indicator 1.2. Resource allocated by government directly to poverty reduction
a. Expenditure under MNREGS – 2016-17
59.60% 63.90% 64.20%
17.35% 21.92%
Kochai GP Zari GP Girgaon GP Maharashtra India
% Population Below Poverty Line
15
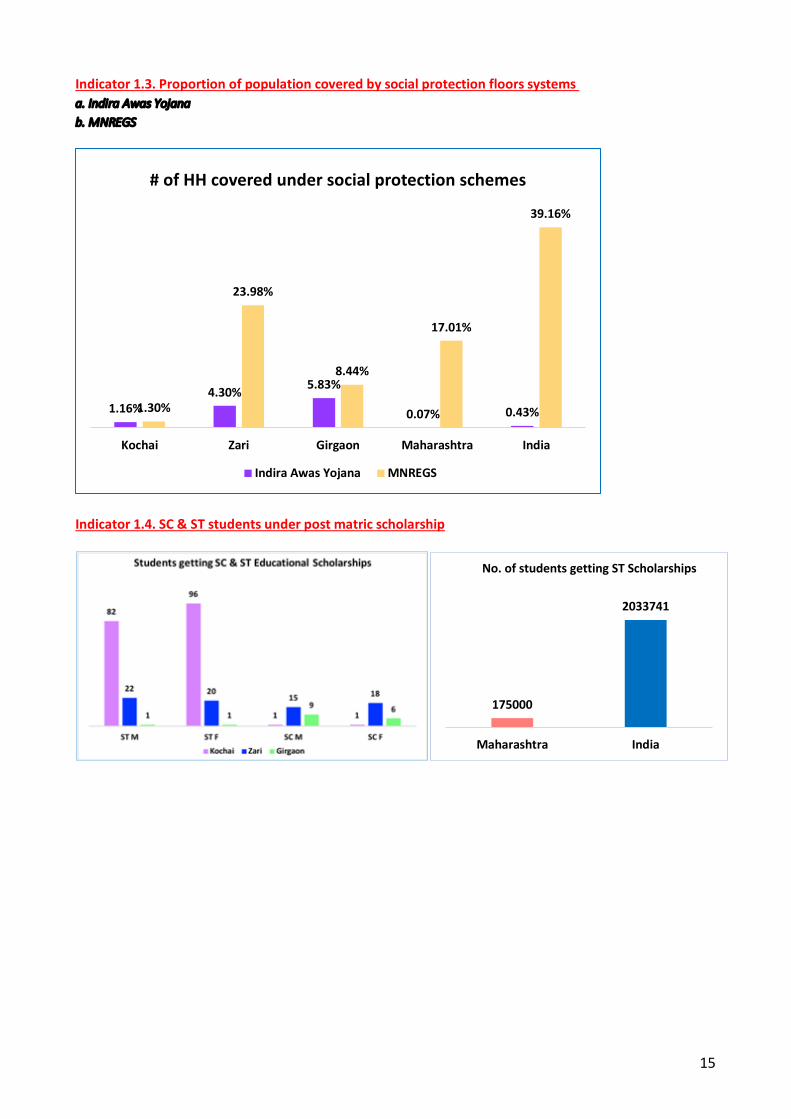
175000
2033741
Maharashtra India
No. of students getting ST Scholarships
Indicator 1.3. Proportion of population covered by social protection floors systems a. Indira Awas Yojana
b. MNREGS
Indicator 1.4. SC & ST students under post matric scholarship
1.16%4.30% 5.83%
0.07% 0.43%1.30%
23.98%
8.44%
17.01%
39.16%
Kochai Zari Girgaon Maharashtra India
# of HH covered under social protection schemes
Indira Awas Yojana MNREGS
16
0.12% 0.21% 0.00%
2.26%1.80%
0.51%
4.52%
1.80%1.31%
Kochai Zari Girgaon
Malnutrition: Children < 5
SAM MAM SUW
25.20%29.40%
35% 38.7%
18.60% 15.10%
Maharashtra India
Malnutrition: Children < 5
SAM MAM SUW
0.54% 3.36%
16.40% 16.78%
38.75%
Kochai Zari Girgaon Maharashtra India
# Cropped area under Irrigation
% cropped area under Irrigation
Goal 2 Indicator 2.1. Prevalence of undernourishment (GAM)11 Indicator 2.2. Prevalence of stunting age <5 (MAM) Indicator 2.3. Prevalence of wasting age<5 (SUW)
Indicator 2.4. Total cropped Area under Irrigation
11 GAM - Prevalence of SAM and MAM; SAM- Severe acute malnutrition - a very low weight for height compared to WHO growth standards, severe wasting, or presence of nutritional oedema; MAM - Moderate (Acute) malnutrition - weight-for-age below WHO child growth standards
17
Goal 3
Indicator 3.1. Maternal mortality
Indicator 3.2. Proportion of births attended by skilled health personnel
Indicator 3.3. Under-five mortality rate
Indicator 3.4. Incidence of Tuberculosis
18
Goal 4 Indicator 4.1. No. of females to every 100 males enrolled in higher, technical and vocational education
Indicator 4.2. Proportion of youth getting skill development trainings a. Actual Number of youth trained in target Gram Panchayats
19
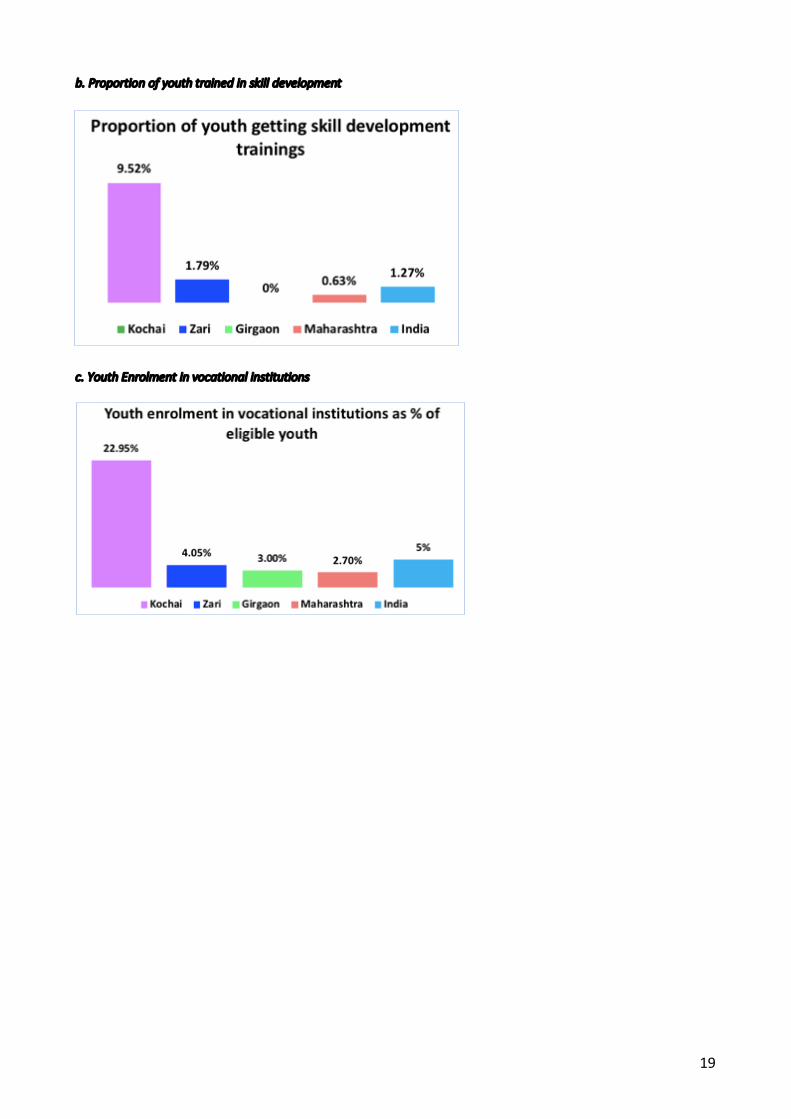
b. Proportion of youth trained in skill development
c. Youth Enrolment in vocational institutions
20
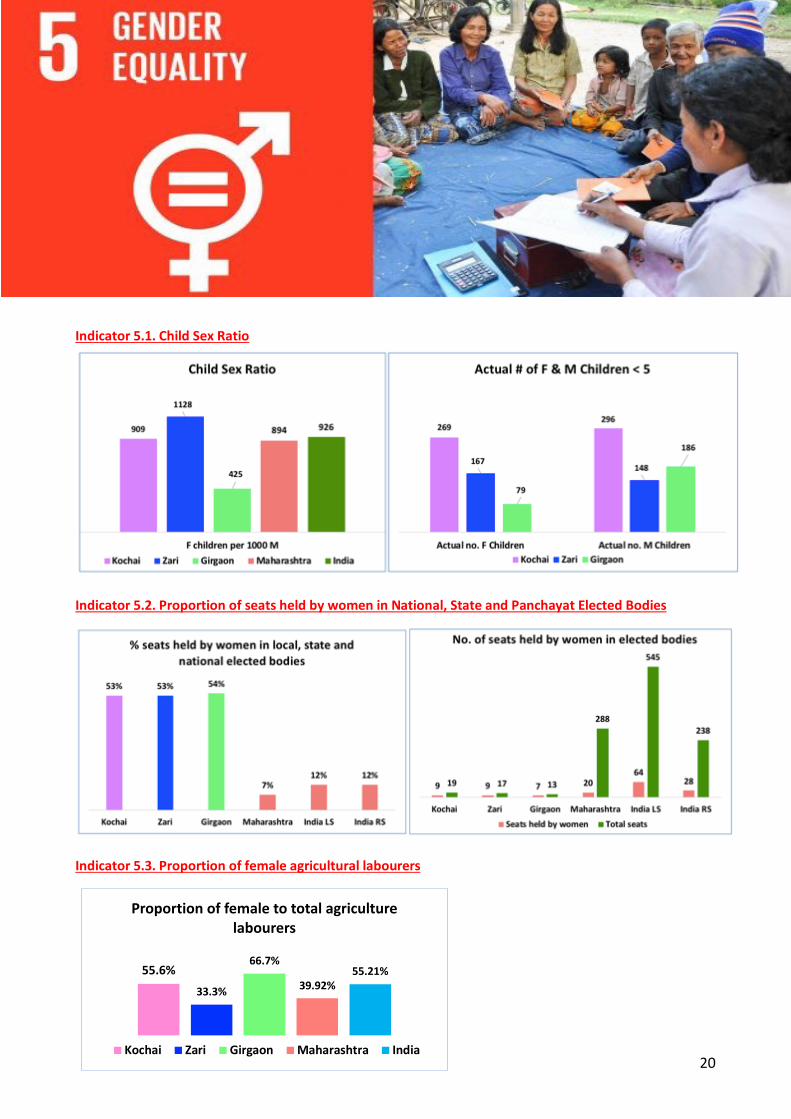
55.6%33.3%
66.7%
39.92%55.21%
Proportion of female to total agriculture labourers
Kochai Zari Girgaon Maharashtra India
Goal 5 Indicator 5.1. Child Sex Ratio
Indicator 5.2. Proportion of seats held by women in National, State and Panchayat Elected Bodies
Indicator 5.3. Proportion of female agricultural labourers
21
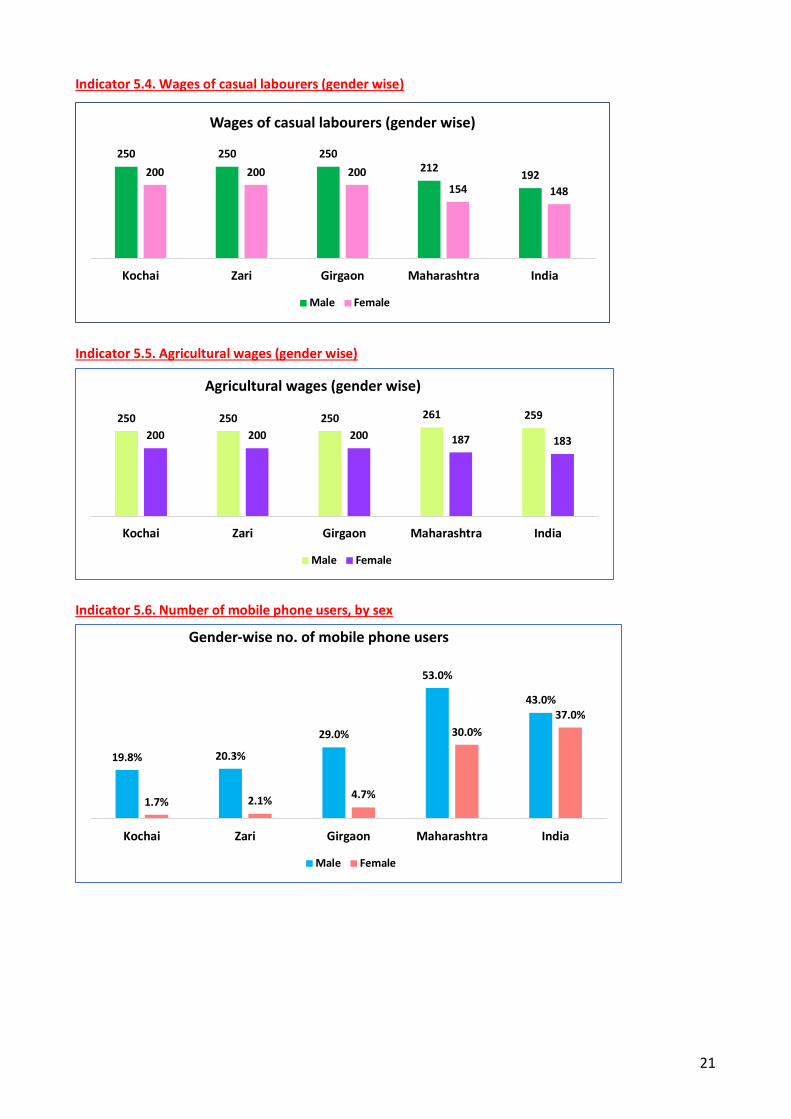
Indicator 5.4. Wages of casual labourers (gender wise)
Indicator 5.5. Agricultural wages (gender wise)
Indicator 5.6. Number of mobile phone users, by sex
250 250 250212 192200 200 200
154 148
Kochai Zari Girgaon Maharashtra India
Wages of casual labourers (gender wise)
Male Female
250 250 250 261 259
200 200 200 187 183
Kochai Zari Girgaon Maharashtra India
Agricultural wages (gender wise)
Male Female
19.8% 20.3%
29.0%
53.0%
43.0%
1.7% 2.1% 4.7%
30.0%37.0%
Kochai Zari Girgaon Maharashtra India
Gender-wise no. of mobile phone users
Male Female
22
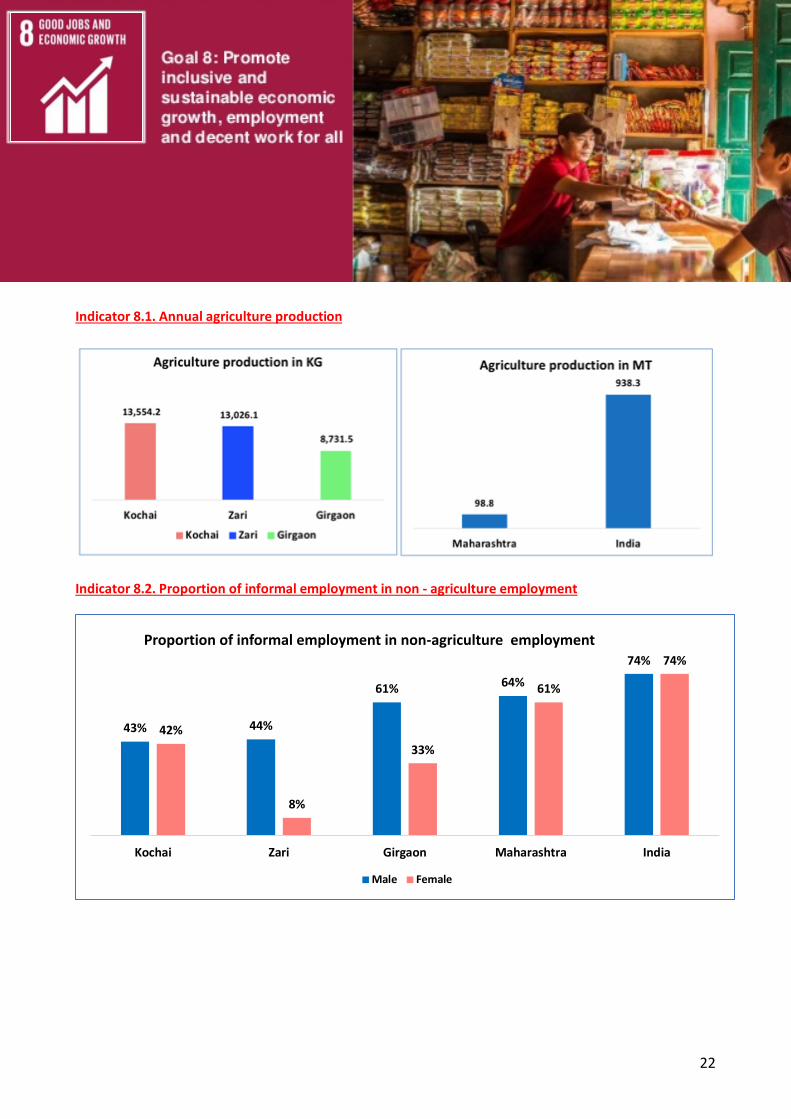
Goal 8 Indicator 8.1. Annual agriculture production
Indicator 8.2. Proportion of informal employment in non - agriculture employment
43% 44%
61% 64%74%
42%
8%
33%
61%
74%
Kochai Zari Girgaon Maharashtra India
Proportion of informal employment in non-agriculture employment
Male Female
23
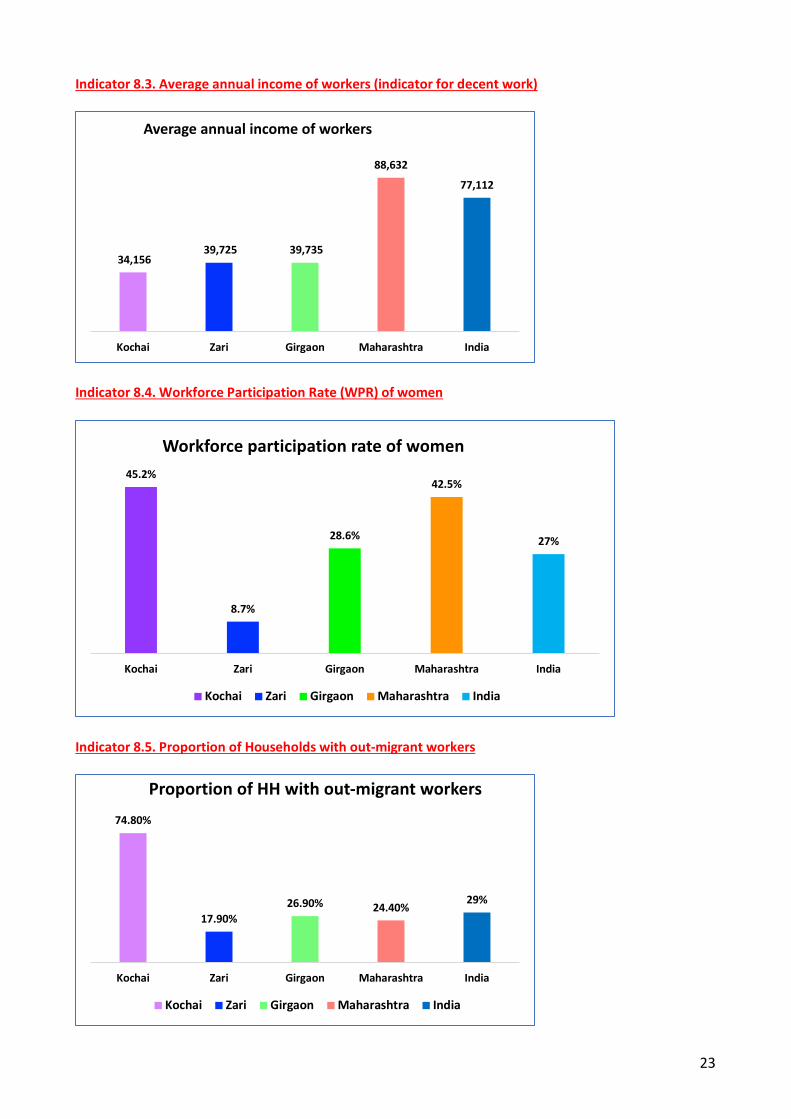
Indicator 8.3. Average annual income of workers (indicator for decent work)
Indicator 8.4. Workforce Participation Rate (WPR) of women
Indicator 8.5. Proportion of Households with out-migrant workers
34,156 39,725 39,735
88,632
77,112
Kochai Zari Girgaon Maharashtra India
Average annual income of workers
45.2%
8.7%
28.6%
42.5%
27%
Kochai Zari Girgaon Maharashtra India
Workforce participation rate of women
Kochai Zari Girgaon Maharashtra India
74.80%
17.90%26.90% 24.40%
29%
Kochai Zari Girgaon Maharashtra India
Proportion of HH with out-migrant workers
Kochai Zari Girgaon Maharashtra India
24
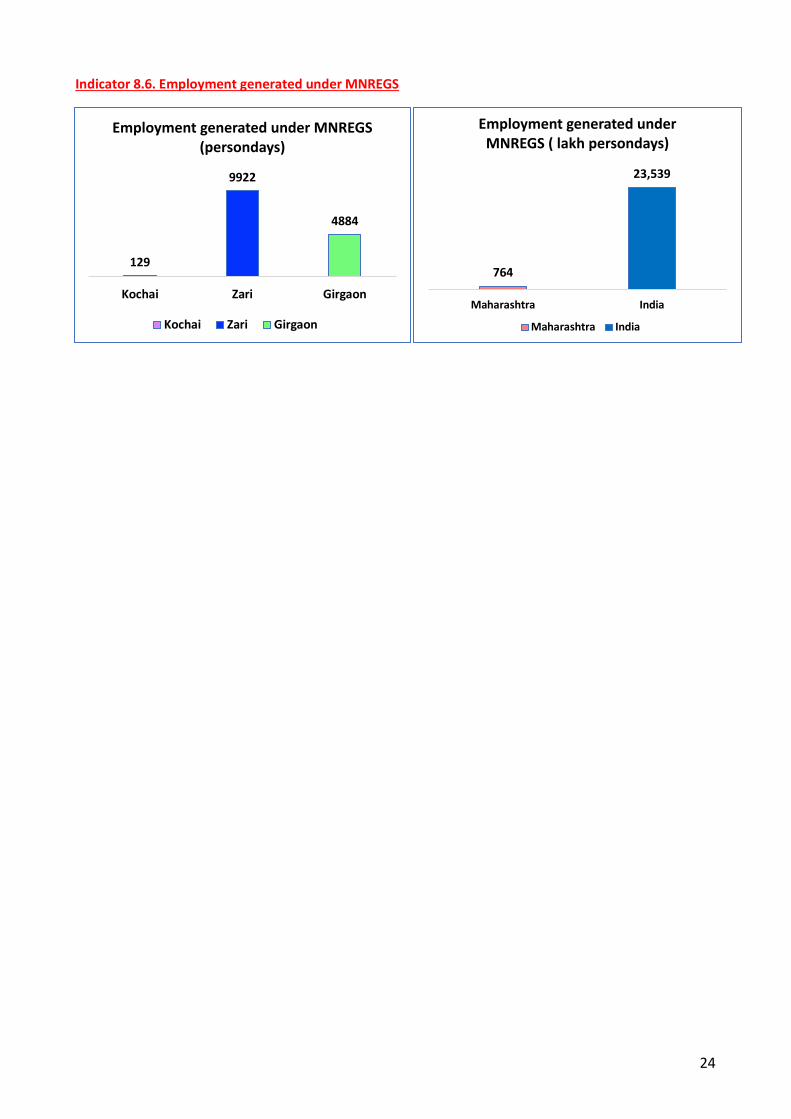
764
23,539
Maharashtra India
Employment generated under MNREGS ( lakh persondays)
Maharashtra India
129
9922
4884
Kochai Zari Girgaon
Employment generated under MNREGS (persondays)
Kochai Zari Girgaon
Indicator 8.6. Employment generated under MNREGS
25
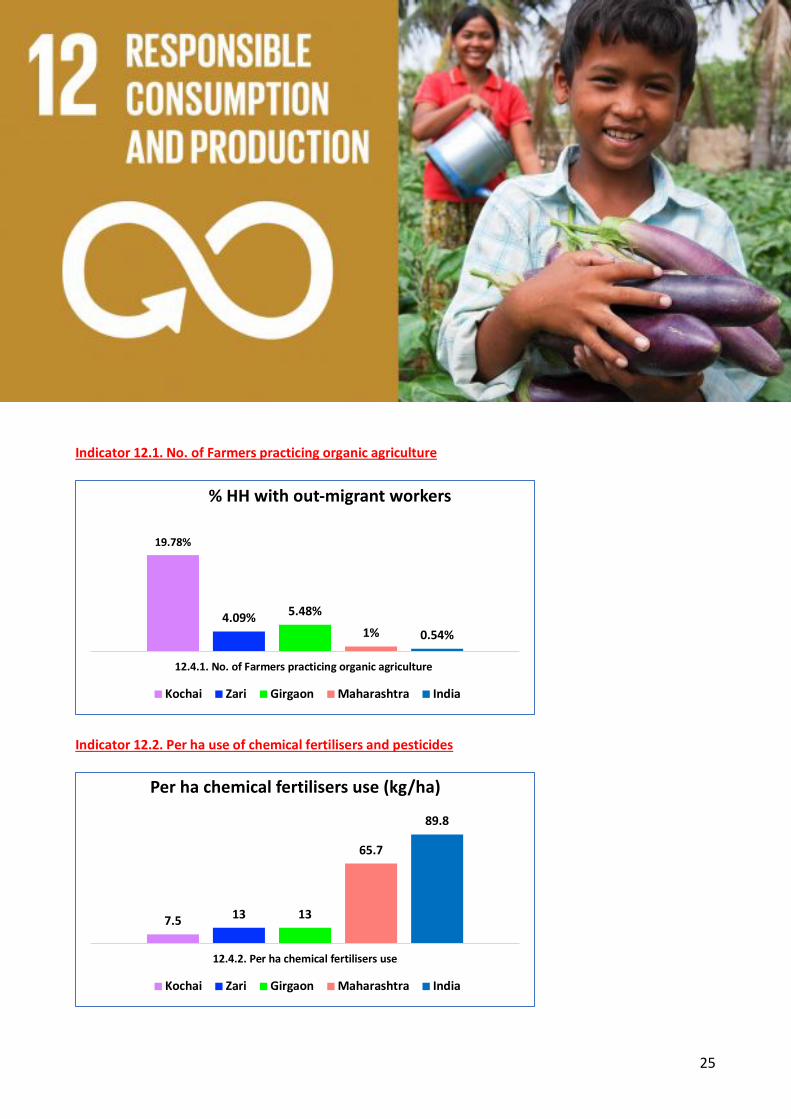
Goal 12 Indicator 12.1. No. of Farmers practicing organic agriculture
Indicator 12.2. Per ha use of chemical fertilisers and pesticides
19.78%
4.09% 5.48%1% 0.54%
12.4.1. No. of Farmers practicing organic agriculture
% HH with out-migrant workers
Kochai Zari Girgaon Maharashtra India
7.5 13 13
65.7
89.8
12.4.2. Per ha chemical fertilisers use
Per ha chemical fertilisers use (kg/ha)
Kochai Zari Girgaon Maharashtra India
26
84%69%
88%
2%8% 4%
69% 63%
40%
100%
75%
100%98%
71%
32%26%
15%28%
10% 13% 20%
93%79%
8%
56% 50%
72%
Kochai Zari Girgaon
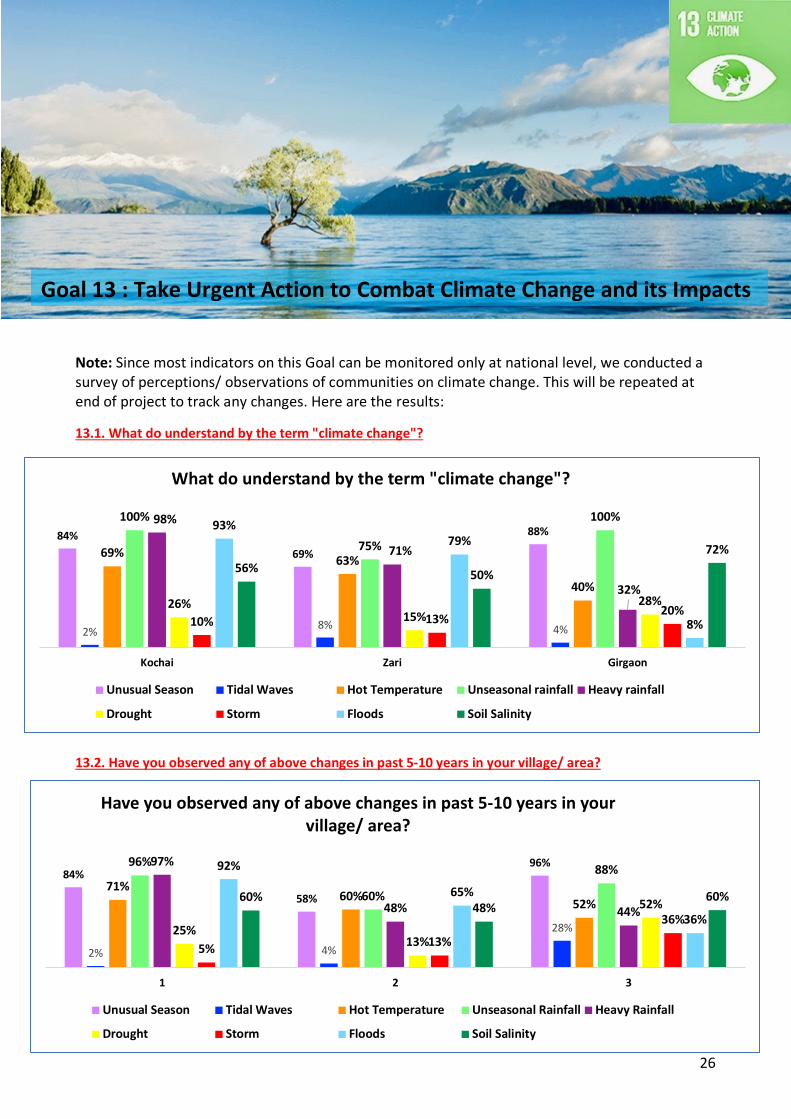
What do understand by the term "climate change"?
Unusual Season Tidal Waves Hot Temperature Unseasonal rainfall Heavy rainfall
Drought Storm Floods Soil Salinity
84%
58%
96%
2% 4%
28%
71%60% 52%
96%
60%
88%97%
48% 44%25%
13%
52%
5% 13%
36%
92%
65%
36%
60%48%
60%
1 2 3
Have you observed any of above changes in past 5-10 years in your village/ area?
Unusual Season Tidal Waves Hot Temperature Unseasonal Rainfall Heavy Rainfall
Drought Storm Floods Soil Salinity
Goal 13
Note: Since most indicators on this Goal can be monitored only at national level, we conducted a survey of perceptions/ observations of communities on climate change. This will be repeated at end of project to track any changes. Here are the results:
13.1. What do understand by the term "climate change"?
13.2. Have you observed any of above changes in past 5-10 years in your village/ area?
Goal 13 : Take Urgent Action to Combat Climate Change and its Impacts
27
91%100%
80%
64% 60%52%
57% 60%72%
42%
67%
32%
64% 60%52%
37%
63%
44%
5%
60%
0%
51%
100%92%91%
75%80%
Kochai Zari Girgaon
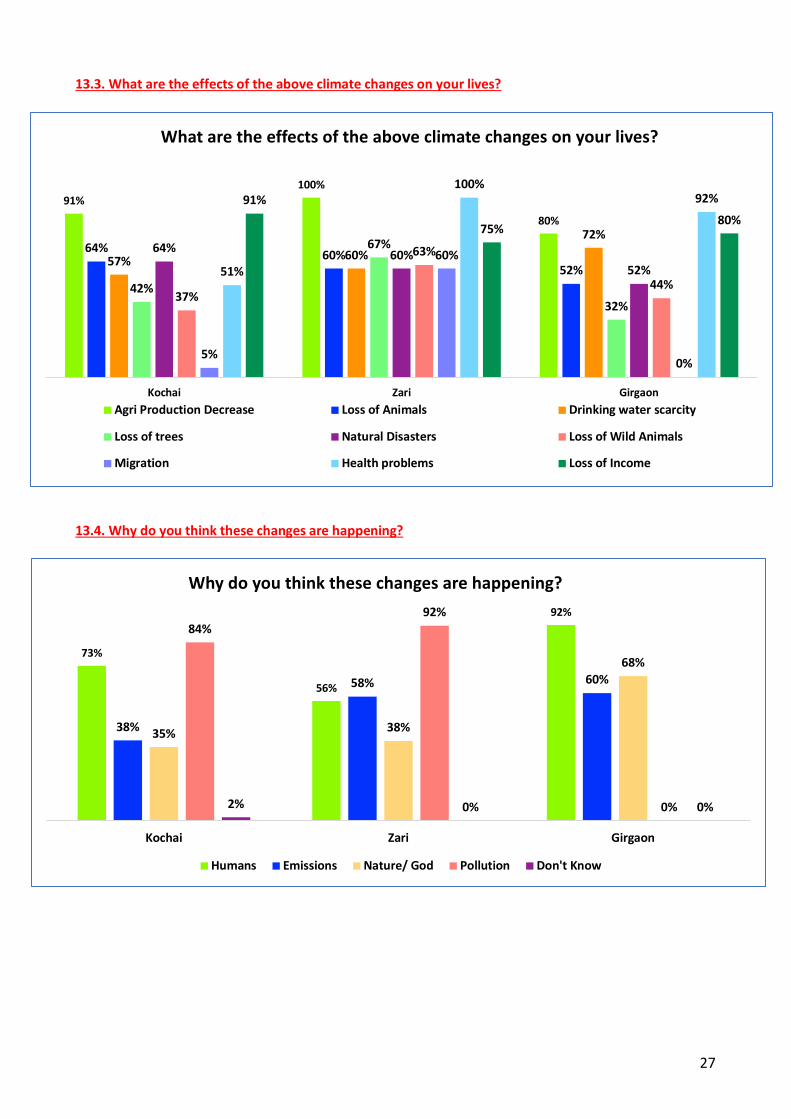
What are the effects of the above climate changes on your lives?
Agri Production Decrease Loss of Animals Drinking water scarcity
Loss of trees Natural Disasters Loss of Wild Animals
Migration Health problems Loss of Income
73%
56%
92%
38%
58% 60%
35% 38%
68%
84%92%
0%2% 0% 0%
Kochai Zari Girgaon
Why do you think these changes are happening?
Humans Emissions Nature/ God Pollution Don't Know
13.3. What are the effects of the above climate changes on your lives? 13.4. Why do you think these changes are happening?
28
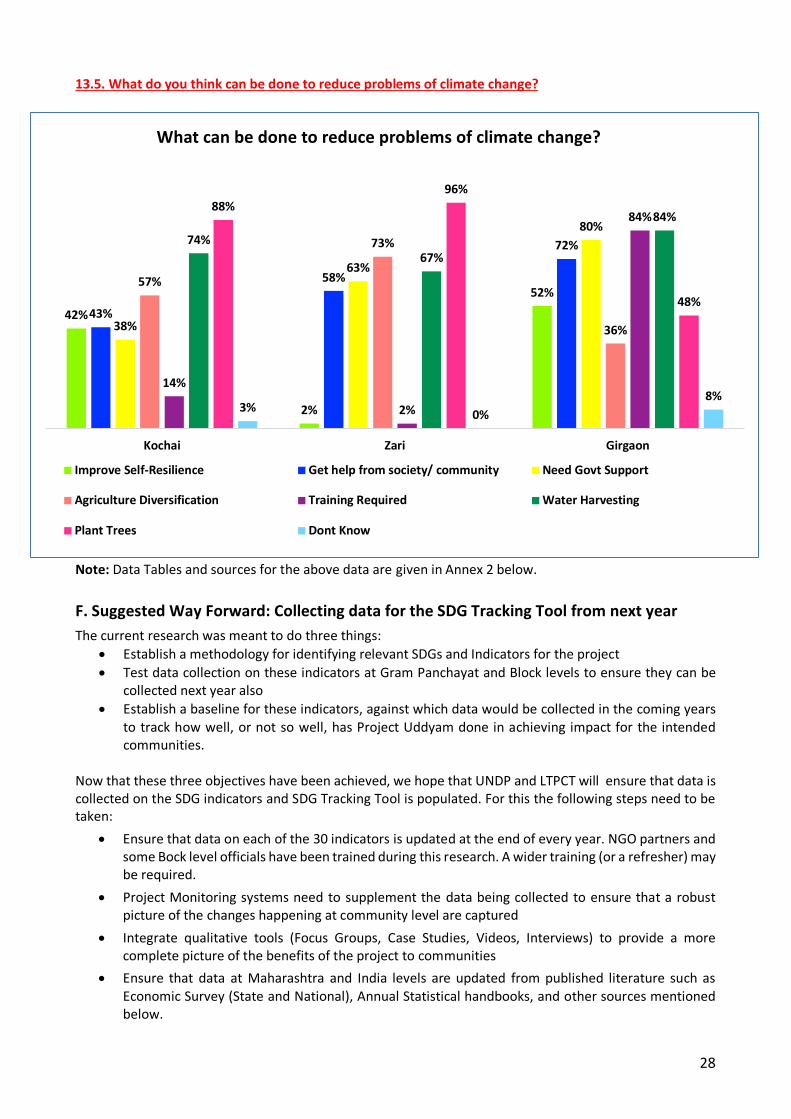
42%
2%
52%43%
58%
72%
38%
63%
80%
57%
73%
36%
14%
2%
84%
74%67%
84%88%
96%
48%
3% 0%8%
Kochai Zari Girgaon
What can be done to reduce problems of climate change?
Improve Self-Resilience Get help from society/ community Need Govt Support
Agriculture Diversification Training Required Water Harvesting
Plant Trees Dont Know
13.5. What do you think can be done to reduce problems of climate change? Note: Data Tables and sources for the above data are given in Annex 2 below.
F. Suggested Way Forward: Collecting data for the SDG Tracking Tool from next year
The current research was meant to do three things: • Establish a methodology for identifying relevant SDGs and Indicators for the project • Test data collection on these indicators at Gram Panchayat and Block levels to ensure they can be
collected next year also • Establish a baseline for these indicators, against which data would be collected in the coming years
to track how well, or not so well, has Project Uddyam done in achieving impact for the intended communities.
Now that these three objectives have been achieved, we hope that UNDP and LTPCT will ensure that data is collected on the SDG indicators and SDG Tracking Tool is populated. For this the following steps need to be taken:
• Ensure that data on each of the 30 indicators is updated at the end of every year. NGO partners and some Bock level officials have been trained during this research. A wider training (or a refresher) may be required.
• Project Monitoring systems need to supplement the data being collected to ensure that a robust picture of the changes happening at community level are captured
• Integrate qualitative tools (Focus Groups, Case Studies, Videos, Interviews) to provide a more complete picture of the benefits of the project to communities
• Ensure that data at Maharashtra and India levels are updated from published literature such as Economic Survey (State and National), Annual Statistical handbooks, and other sources mentioned below.
29
G. General Observations and Conclusions
The data collected from target Gram Panchayats has been contrasted against similar data for Maharashtra and for India. (See attached Excel Sheet and Annex 1). Based on the data currently available, some key learnings and observations are listed below that the project may find useful: 1. SDGs as an approach for integrated development planning Our experience during this assignment showed that collecting data on the selected eight SDGs was a Herculean task. This is because data is not available in one place or with one agency. Hopefully, MOSPI’s emphasis on getting data on all SDG indicators will streamline such data collection.
However, for all round development, development planning needs to address all 17 SDGs. This implies regular collection and review of data. The current district and Block administration seem to be interested in taking this process forward, but need support in putting in place a system for data collation and analysis.
Additionally, if the SDGs need to be localized, they need to be part of the consciousness of the stakeholders at Gram Panchayat, Block and District Level. This needs concerted efforts at awareness raising on SDGs, and, in consequence, on various aspects of local development. 2. Need to strengthen natural resource base for long-term sustainability Agriculture, industrial labour in nearby factories and brick kilns, and fishing are the three major occupations for a majority of the households in the three target Gram Panchayats. The average annual household income in the three Gram Panchayats (esp. from agriculture) is very low compared to the state average. Additionally, the 3 Gram Panchayats have almost negligible area under irrigation. In such a situation, interventions into Mogra cultivation, vegetable cultivation and SRI paddy without complementary interventions in soil and water conservation could seriously impair future growth and sustainability. Introduction of the odd solar pumping systems and the odd check-dams by the projects is a good beginning. However, such interventions could be part of a more planned and integrated approach (e.g. using a watershed lens to plan interventions). 3. Crop diversification and building Value Chains Almost all land in the target villages is under paddy as the single most taken crop in the area. High yielding varieties of paddy, with accompanying use of chemical fertilisers and pesticides is mono-cropped. In the absence of organic manure, and irrigation, this could cause water and soil pollution and health concerns in future. Thus, crop diversification in the target villages is an urgent need. Therefore, interventions by the project to undertake vegetables, flowers and kitchen gardens is a welcome step. Since the key strategy of the project is enhancement of livelihoods, the project needs to consolidate the above interventions into a value chain approach. Right now, the approach seems to be local production for Dadar (for Mogra) and other nearby markets (for vegetables, etc.). This approach needs to be thought through, and various interventions such as linking to bank loans/ capital and business development services need to be part of the strategy. Similarly, skill development needs to be major plank, which the project is already planning to do. Organic agriculture is completely missing in this area, which could be another win-win intervention for value chain development. 4. Water Conservation technologies Use of drip, micro irrigation, mulching and other water conservation practices appears to be poor, and given that the average annual rainfall in this area is 856 millimetres, the project could further promote water conservation. 5. Developing skills and opportunities for unemployed youth The three Gram Panchayats have a large number of graduates and post graduates in the target gram panchayats. However, during field discussions they related how they do not find opportunities to convert this education into skill-based employment. A number of private sector organisations are active in promoting skills in the three Gram Panchayats. However, these are oriented only towards the specific products which these companies make. It might be useful for the project to look more carefully into a broader capacity
30
development and developing a job value chain. The Career Guiding and Counselling Centre, when it comes up, will play a key role in the same. 6. Potential for Eco-tourism Tourism is a major livelihood for some village people, and the Talasari beach and the temples in the area are quite popular. However, the project appears to have left this entire stream of interventions untouched. There is also scope for eco-tourism as the crabs in Talasari are considered rare species. This could be a win-win intervention. 7. Protection to migrating persons Households which have persons going for fishing for long periods (almost 6 months) expressed their fear for the lives of these migrants. These populations could benefit from life and health insurance benefits, which the project could help in facilitating access. 8. Linking to MNREGS for strengthening natural resource base MNREGS seems to have played a key role in supplementing incomes of poor households in the target Gram Panchayats, judging from the 450 households (11%) from the three Gram Panchayats benefitted from an average of 33 days of employment. This also provides an opportunity for the project for collaboration with local authorities, since MNREGS is open to supporting work on local ponds and soil and water conservation measures. The project could explore these interventions in future. 9. Linking to the Integrated Tribal Development Programme The ITDP Programme Officer for these Gram Panchayats is based in Dahanu, which is some distance away from the target gram panchayats. However, national statistics show that fund utilisation under Tribal Sub Plans and other tribal development measures is abysmally low. The project could facilitate a tie-up between ST families and ITDP Programme Officer’s office for ensuring ST families get entitlements. 10. Climate Change Adaptation Climate change is an inevitable slow disaster that is already happening. Developing a sound strategy for local communities for climate change adaptation could be a sound and futuristic intervention whose time has come. 11. Overall approach Finally, the general impression that this consultant carried away from the project was that not enough ground-work has been done in planning interventions. Also, project owners seem to be in a hurry to achieve “development”, without putting in necessary time for planning and preparation into the process. Development history has shown that to be sustainable, Development needs to be organic in its approach. It cannot be rolled out like an industrial process. Undue work pressure also leads to burn-out and attrition of project staff and project partners and makes communities confused. Moreover, due to time pressure, ensuring people’s participation and capacity building is often not given adequate attention, which makes interventions unsustainable. Additionally, the Uddyam Project beneficiaries come predominantly from scheduled tribe and scheduled caste families, and have their own limitations in terms of adoption and sustainably continuing project interventions. A slow, steady and strategic approach would, in my humble opinion, pay greater dividends in the long run.
¨¨¨
SDG Tracking Tool – Project Uddyam – Feb 2018 32
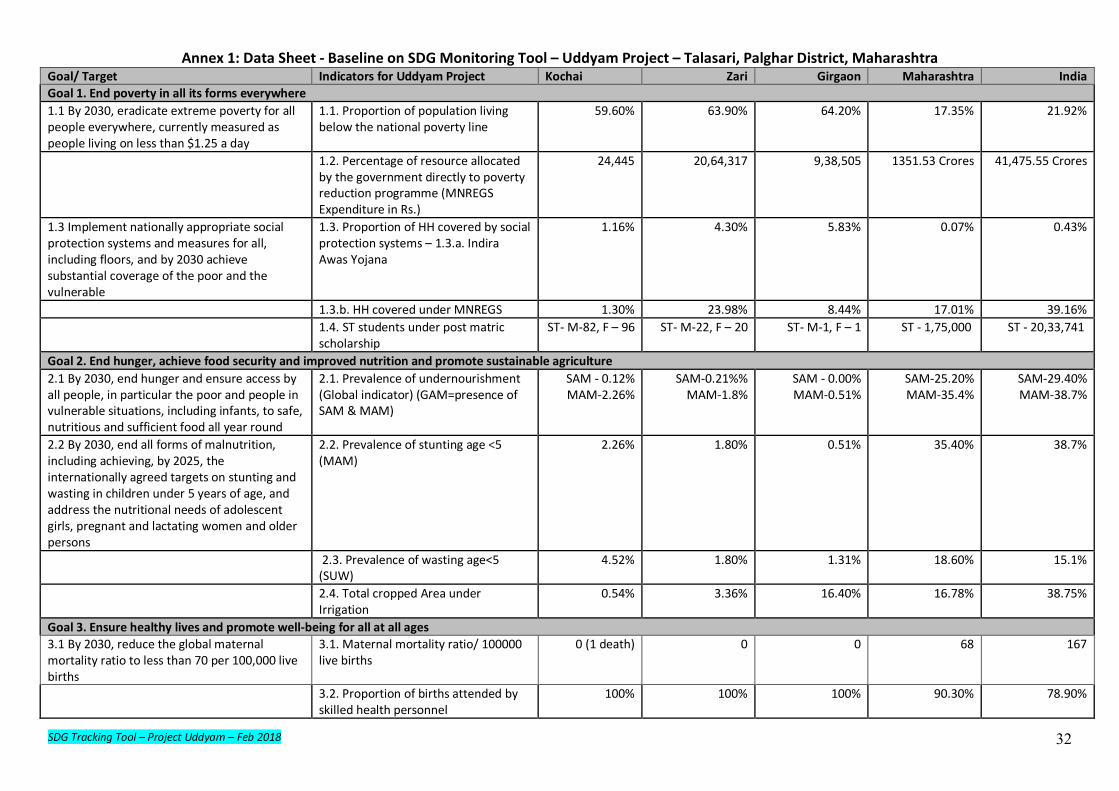
Annex 1: Data Sheet - Baseline on SDG Monitoring Tool – Uddyam Project – Talasari, Palghar District, Maharashtra Goal/ Target Indicators for Uddyam Project Kochai Zari Girgaon Maharashtra India Goal 1. End poverty in all its forms everywhere 1.1 By 2030, eradicate extreme poverty for all people everywhere, currently measured as people living on less than $1.25 a day
1.1. Proportion of population living below the national poverty line
59.60% 63.90% 64.20% 17.35% 21.92%
1.2. Percentage of resource allocated by the government directly to poverty reduction programme (MNREGS Expenditure in Rs.)
24,445 20,64,317 9,38,505 1351.53 Crores 41,475.55 Crores
1.3 Implement nationally appropriate social protection systems and measures for all, including floors, and by 2030 achieve substantial coverage of the poor and the vulnerable
1.3. Proportion of HH covered by social protection systems – 1.3.a. Indira Awas Yojana
1.16% 4.30% 5.83% 0.07% 0.43%
1.3.b. HH covered under MNREGS 1.30% 23.98% 8.44% 17.01% 39.16% 1.4. ST students under post matric
scholarship ST- M-82, F – 96
ST- M-22, F – 20
ST- M-1, F – 1 ST - 1,75,000 ST - 20,33,741
Goal 2. End hunger, achieve food security and improved nutrition and promote sustainable agriculture 2.1 By 2030, end hunger and ensure access by all people, in particular the poor and people in vulnerable situations, including infants, to safe, nutritious and sufficient food all year round
2.1. Prevalence of undernourishment (Global indicator) (GAM=presence of SAM & MAM)
SAM - 0.12% MAM-2.26%
SAM-0.21%% MAM-1.8%
SAM - 0.00% MAM-0.51%
SAM-25.20% MAM-35.4%
SAM-29.40% MAM-38.7%
2.2 By 2030, end all forms of malnutrition, including achieving, by 2025, the internationally agreed targets on stunting and wasting in children under 5 years of age, and address the nutritional needs of adolescent girls, pregnant and lactating women and older persons
2.2. Prevalence of stunting age <5 (MAM)
2.26% 1.80% 0.51% 35.40% 38.7%
2.3. Prevalence of wasting age<5 (SUW)
4.52% 1.80% 1.31% 18.60% 15.1%
2.4. Total cropped Area under Irrigation
0.54% 3.36% 16.40% 16.78% 38.75%
Goal 3. Ensure healthy lives and promote well-being for all at all ages 3.1 By 2030, reduce the global maternal mortality ratio to less than 70 per 100,000 live births
3.1. Maternal mortality ratio/ 100000 live births
0 (1 death) 0 0 68 167
3.2. Proportion of births attended by skilled health personnel
100% 100% 100% 90.30% 78.90%
SDG Tracking Tool – Project Uddyam – Feb 2018 33
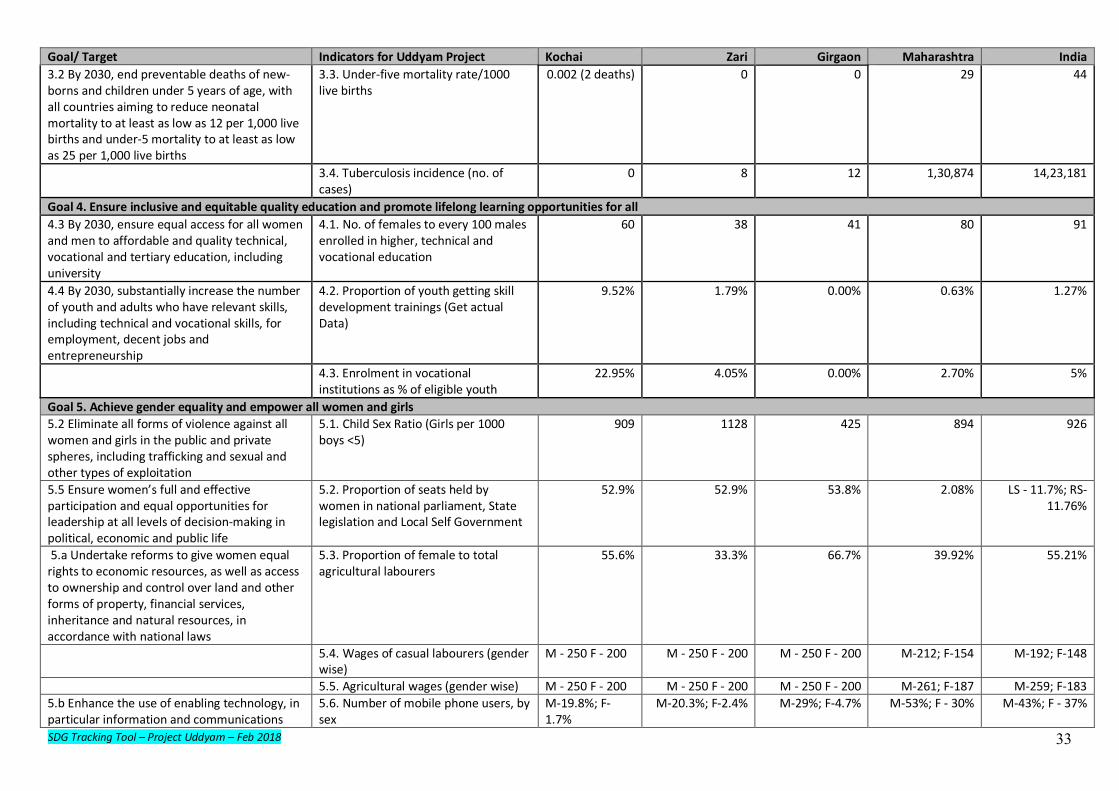
Goal/ Target Indicators for Uddyam Project Kochai Zari Girgaon Maharashtra India 3.2 By 2030, end preventable deaths of new-borns and children under 5 years of age, with all countries aiming to reduce neonatal mortality to at least as low as 12 per 1,000 live births and under-5 mortality to at least as low as 25 per 1,000 live births
3.3. Under-five mortality rate/1000 live births
0.002 (2 deaths) 0 0 29 44
3.4. Tuberculosis incidence (no. of cases)
0 8 12 1,30,874 14,23,181
Goal 4. Ensure inclusive and equitable quality education and promote lifelong learning opportunities for all 4.3 By 2030, ensure equal access for all women and men to affordable and quality technical, vocational and tertiary education, including university
4.1. No. of females to every 100 males enrolled in higher, technical and vocational education
60
38
41
80
91
4.4 By 2030, substantially increase the number of youth and adults who have relevant skills, including technical and vocational skills, for employment, decent jobs and entrepreneurship
4.2. Proportion of youth getting skill development trainings (Get actual Data)
9.52% 1.79% 0.00% 0.63% 1.27%
4.3. Enrolment in vocational institutions as % of eligible youth
22.95%
4.05%
0.00% 2.70%
5%
Goal 5. Achieve gender equality and empower all women and girls 5.2 Eliminate all forms of violence against all women and girls in the public and private spheres, including trafficking and sexual and other types of exploitation
5.1. Child Sex Ratio (Girls per 1000 boys <5)
909 1128 425 894 926
5.5 Ensure women’s full and effective participation and equal opportunities for leadership at all levels of decision-making in political, economic and public life
5.2. Proportion of seats held by women in national parliament, State legislation and Local Self Government
52.9%
52.9%
53.8%
2.08%
LS - 11.7%; RS-11.76%
5.a Undertake reforms to give women equal rights to economic resources, as well as access to ownership and control over land and other forms of property, financial services, inheritance and natural resources, in accordance with national laws
5.3. Proportion of female to total agricultural labourers
55.6% 33.3% 66.7% 39.92% 55.21%
5.4. Wages of casual labourers (gender wise)
M - 250 F - 200 M - 250 F - 200 M - 250 F - 200 M-212; F-154 M-192; F-148
5.5. Agricultural wages (gender wise) M - 250 F - 200 M - 250 F - 200 M - 250 F - 200 M-261; F-187 M-259; F-183 5.b Enhance the use of enabling technology, in particular information and communications
5.6. Number of mobile phone users, by sex
M-19.8%; F-1.7%
M-20.3%; F-2.4% M-29%; F-4.7% M-53%; F - 30% M-43%; F - 37%
SDG Tracking Tool – Project Uddyam – Feb 2018 34
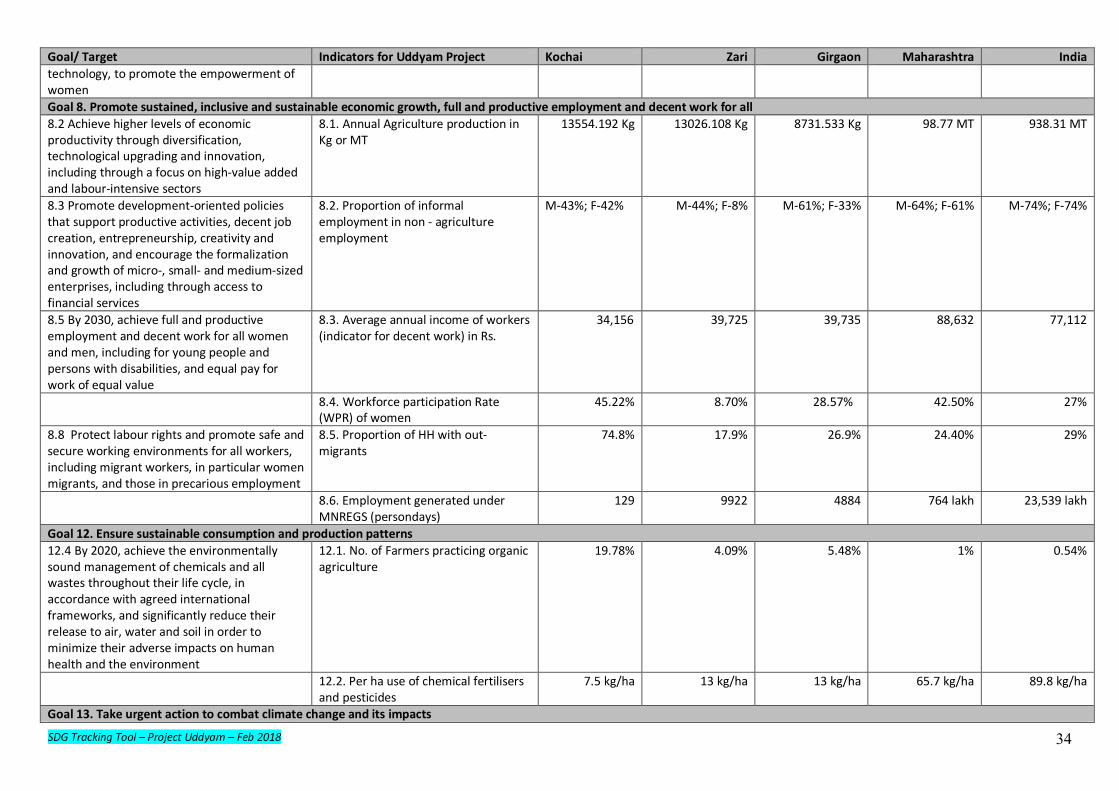
Goal/ Target Indicators for Uddyam Project Kochai Zari Girgaon Maharashtra India technology, to promote the empowerment of women Goal 8. Promote sustained, inclusive and sustainable economic growth, full and productive employment and decent work for all 8.2 Achieve higher levels of economic productivity through diversification, technological upgrading and innovation, including through a focus on high-value added and labour-intensive sectors
8.1. Annual Agriculture production in Kg or MT
13554.192 Kg 13026.108 Kg 8731.533 Kg 98.77 MT 938.31 MT
8.3 Promote development-oriented policies that support productive activities, decent job creation, entrepreneurship, creativity and innovation, and encourage the formalization and growth of micro-, small- and medium-sized enterprises, including through access to financial services
8.2. Proportion of informal employment in non - agriculture employment
M-43%; F-42% M-44%; F-8% M-61%; F-33% M-64%; F-61% M-74%; F-74%
8.5 By 2030, achieve full and productive employment and decent work for all women and men, including for young people and persons with disabilities, and equal pay for work of equal value
8.3. Average annual income of workers (indicator for decent work) in Rs.
34,156 39,725 39,735 88,632 77,112
8.4. Workforce participation Rate (WPR) of women
45.22% 8.70% 28.57% 42.50% 27%
8.8 Protect labour rights and promote safe and secure working environments for all workers, including migrant workers, in particular women migrants, and those in precarious employment
8.5. Proportion of HH with out-migrants
74.8% 17.9% 26.9% 24.40% 29%
8.6. Employment generated under MNREGS (persondays)
129 9922 4884 764 lakh 23,539 lakh
Goal 12. Ensure sustainable consumption and production patterns 12.4 By 2020, achieve the environmentally sound management of chemicals and all wastes throughout their life cycle, in accordance with agreed international frameworks, and significantly reduce their release to air, water and soil in order to minimize their adverse impacts on human health and the environment
12.1. No. of Farmers practicing organic agriculture
19.78% 4.09% 5.48% 1% 0.54%
12.2. Per ha use of chemical fertilisers and pesticides
7.5 kg/ha 13 kg/ha 13 kg/ha 65.7 kg/ha 89.8 kg/ha
Goal 13. Take urgent action to combat climate change and its impacts
SDG Tracking Tool – Project Uddyam – Feb 2018 35
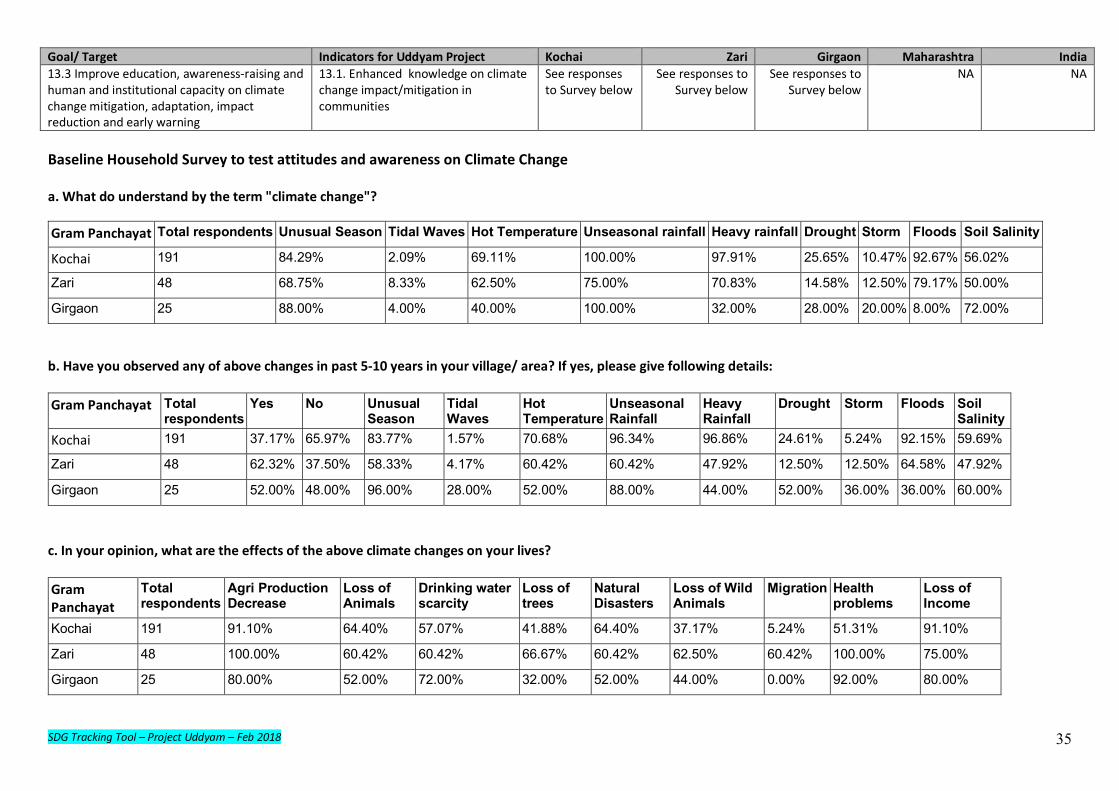
Goal/ Target Indicators for Uddyam Project Kochai Zari Girgaon Maharashtra India 13.3 Improve education, awareness-raising and human and institutional capacity on climate change mitigation, adaptation, impact reduction and early warning
13.1. Enhanced knowledge on climate change impact/mitigation in communities
See responses to Survey below
See responses to Survey below
See responses to Survey below
NA NA
Baseline Household Survey to test attitudes and awareness on Climate Change a. What do understand by the term "climate change"?
Gram Panchayat Total respondents Unusual Season Tidal Waves Hot Temperature Unseasonal rainfall Heavy rainfall Drought Storm Floods Soil Salinity
Kochai 191 84.29% 2.09% 69.11% 100.00% 97.91% 25.65% 10.47% 92.67% 56.02%
Zari 48 68.75% 8.33% 62.50% 75.00% 70.83% 14.58% 12.50% 79.17% 50.00%
Girgaon 25 88.00% 4.00% 40.00% 100.00% 32.00% 28.00% 20.00% 8.00% 72.00%
b. Have you observed any of above changes in past 5-10 years in your village/ area? If yes, please give following details: Gram Panchayat Total
respondents Yes No Unusual
Season Tidal Waves
Hot Temperature
Unseasonal Rainfall
Heavy Rainfall
Drought Storm Floods Soil Salinity
Kochai 191 37.17% 65.97% 83.77% 1.57% 70.68% 96.34% 96.86% 24.61% 5.24% 92.15% 59.69%
Zari 48 62.32% 37.50% 58.33% 4.17% 60.42% 60.42% 47.92% 12.50% 12.50% 64.58% 47.92%
Girgaon 25 52.00% 48.00% 96.00% 28.00% 52.00% 88.00% 44.00% 52.00% 36.00% 36.00% 60.00%
c. In your opinion, what are the effects of the above climate changes on your lives? Gram Panchayat
Total respondents
Agri Production Decrease
Loss of Animals
Drinking water scarcity
Loss of trees
Natural Disasters
Loss of Wild Animals
Migration Health problems
Loss of Income
Kochai 191 91.10% 64.40% 57.07% 41.88% 64.40% 37.17% 5.24% 51.31% 91.10%
Zari 48 100.00% 60.42% 60.42% 66.67% 60.42% 62.50% 60.42% 100.00% 75.00%
Girgaon 25 80.00% 52.00% 72.00% 32.00% 52.00% 44.00% 0.00% 92.00% 80.00%
SDG Tracking Tool – Project Uddyam – Feb 2018 36
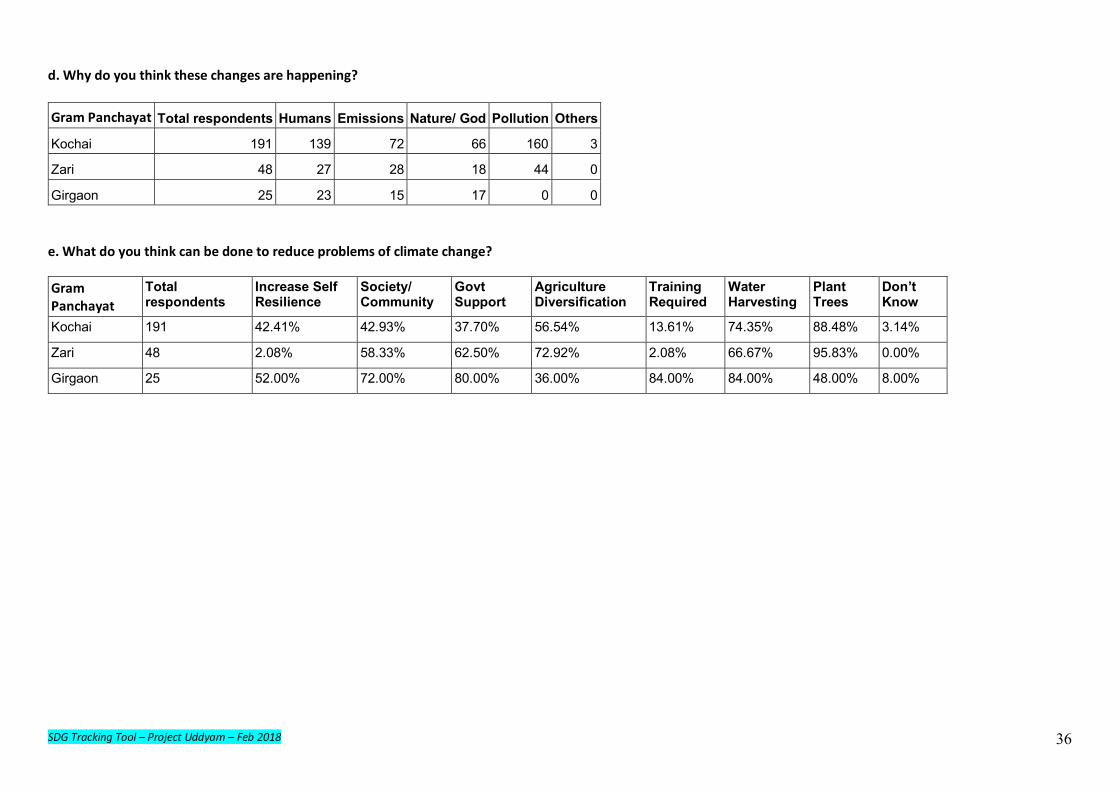
d. Why do you think these changes are happening? Gram Panchayat Total respondents Humans Emissions Nature/ God Pollution Others
Kochai 191 139 72 66 160 3
Zari 48 27 28 18 44 0
Girgaon 25 23 15 17 0 0 e. What do you think can be done to reduce problems of climate change?
Gram Panchayat
Total respondents
Increase Self Resilience
Society/ Community
Govt Support
Agriculture Diversification
Training Required
Water Harvesting
Plant Trees
Don’t Know
Kochai 191 42.41% 42.93% 37.70% 56.54% 13.61% 74.35% 88.48% 3.14%
Zari 48 2.08% 58.33% 62.50% 72.92% 2.08% 66.67% 95.83% 0.00%
Girgaon 25 52.00% 72.00% 80.00% 36.00% 84.00% 84.00% 48.00% 8.00%
31
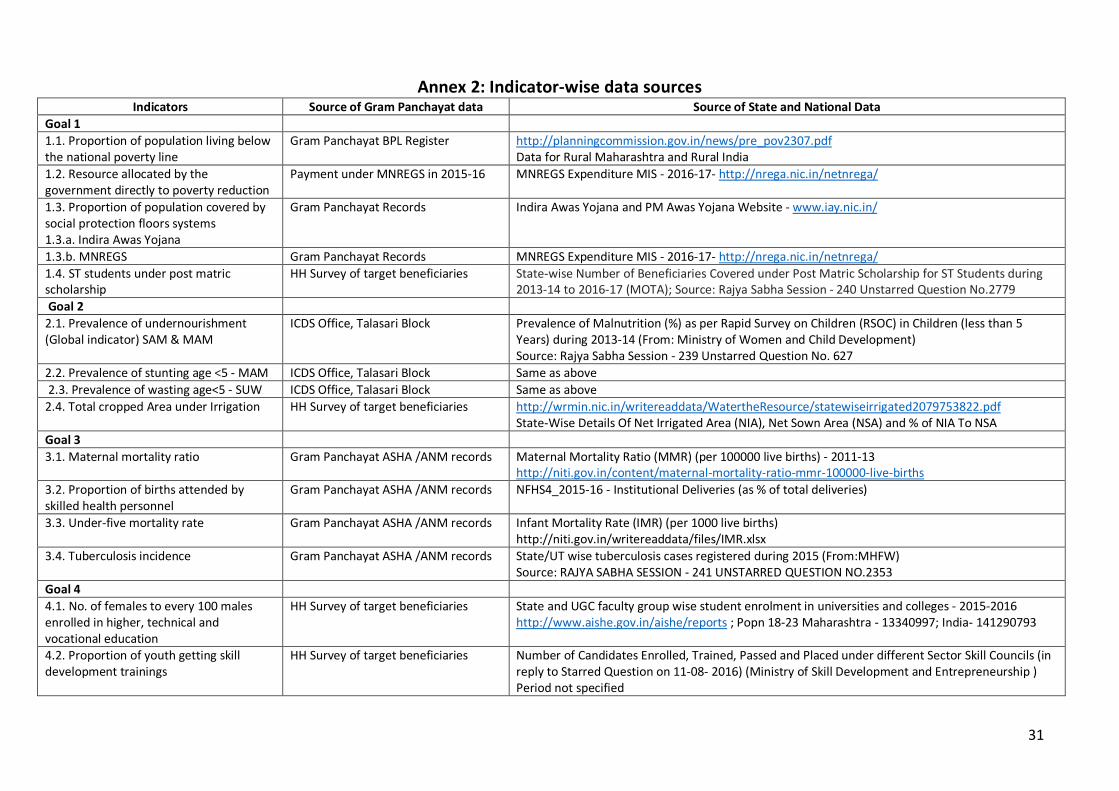
Annex 2: Indicator-wise data sources Indicators Source of Gram Panchayat data Source of State and National Data
Goal 1 1.1. Proportion of population living below the national poverty line
Gram Panchayat BPL Register http://planningcommission.gov.in/news/pre_pov2307.pdf Data for Rural Maharashtra and Rural India
1.2. Resource allocated by the government directly to poverty reduction
Payment under MNREGS in 2015-16 MNREGS Expenditure MIS - 2016-17- http://nrega.nic.in/netnrega/
1.3. Proportion of population covered by social protection floors systems 1.3.a. Indira Awas Yojana
Gram Panchayat Records Indira Awas Yojana and PM Awas Yojana Website - www.iay.nic.in/
1.3.b. MNREGS Gram Panchayat Records MNREGS Expenditure MIS - 2016-17- http://nrega.nic.in/netnrega/ 1.4. ST students under post matric scholarship
HH Survey of target beneficiaries State-wise Number of Beneficiaries Covered under Post Matric Scholarship for ST Students during 2013-14 to 2016-17 (MOTA); Source: Rajya Sabha Session - 240 Unstarred Question No.2779
Goal 2 2.1. Prevalence of undernourishment (Global indicator) SAM & MAM
ICDS Office, Talasari Block Prevalence of Malnutrition (%) as per Rapid Survey on Children (RSOC) in Children (less than 5 Years) during 2013-14 (From: Ministry of Women and Child Development) Source: Rajya Sabha Session - 239 Unstarred Question No. 627
2.2. Prevalence of stunting age <5 - MAM ICDS Office, Talasari Block Same as above 2.3. Prevalence of wasting age<5 - SUW ICDS Office, Talasari Block Same as above 2.4. Total cropped Area under Irrigation HH Survey of target beneficiaries http://wrmin.nic.in/writereaddata/WatertheResource/statewiseirrigated2079753822.pdf
State-Wise Details Of Net Irrigated Area (NIA), Net Sown Area (NSA) and % of NIA To NSA Goal 3 3.1. Maternal mortality ratio Gram Panchayat ASHA /ANM records Maternal Mortality Ratio (MMR) (per 100000 live births) - 2011-13
http://niti.gov.in/content/maternal-mortality-ratio-mmr-100000-live-births 3.2. Proportion of births attended by skilled health personnel
Gram Panchayat ASHA /ANM records NFHS4_2015-16 - Institutional Deliveries (as % of total deliveries)
3.3. Under-five mortality rate Gram Panchayat ASHA /ANM records Infant Mortality Rate (IMR) (per 1000 live births) http://niti.gov.in/writereaddata/files/IMR.xlsx
3.4. Tuberculosis incidence Gram Panchayat ASHA /ANM records State/UT wise tuberculosis cases registered during 2015 (From:MHFW) Source: RAJYA SABHA SESSION - 241 UNSTARRED QUESTION NO.2353
Goal 4 4.1. No. of females to every 100 males enrolled in higher, technical and vocational education
HH Survey of target beneficiaries State and UGC faculty group wise student enrolment in universities and colleges - 2015-2016 http://www.aishe.gov.in/aishe/reports ; Popn 18-23 Maharashtra - 13340997; India- 141290793
4.2. Proportion of youth getting skill development trainings
HH Survey of target beneficiaries Number of Candidates Enrolled, Trained, Passed and Placed under different Sector Skill Councils (in reply to Starred Question on 11-08- 2016) (Ministry of Skill Development and Entrepreneurship ) Period not specified
32
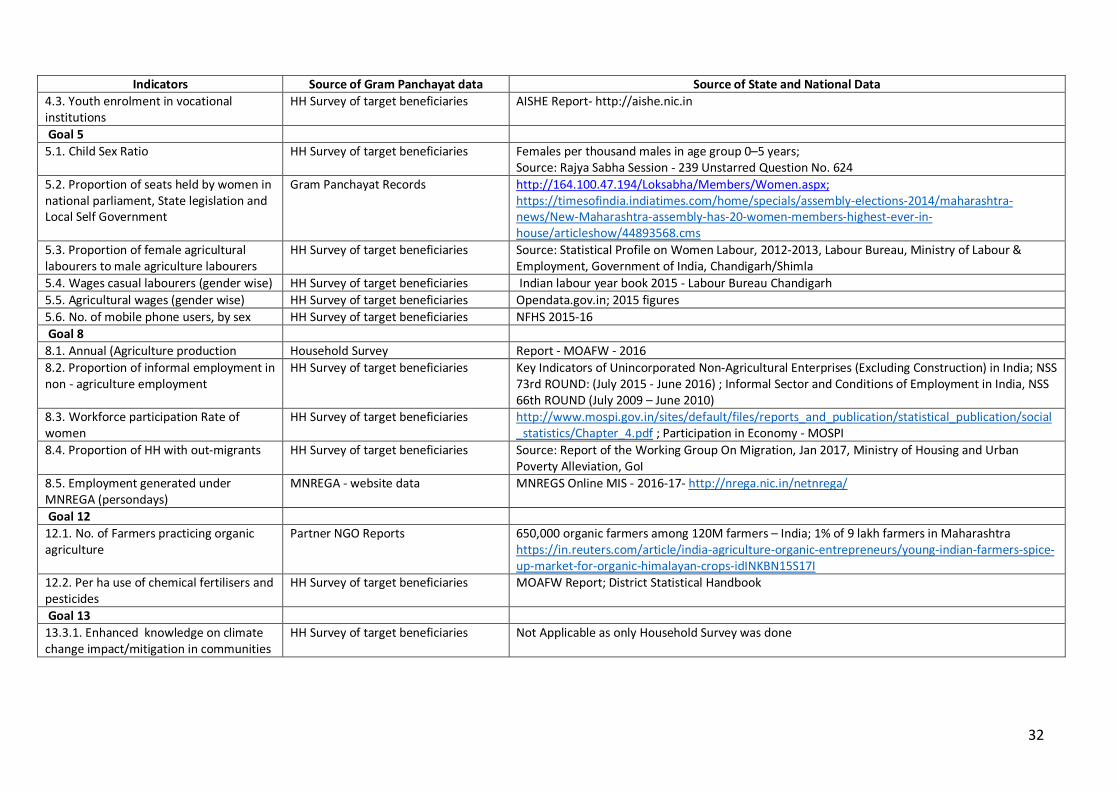
Indicators Source of Gram Panchayat data Source of State and National Data 4.3. Youth enrolment in vocational institutions
HH Survey of target beneficiaries AISHE Report- http://aishe.nic.in
Goal 5 5.1. Child Sex Ratio HH Survey of target beneficiaries Females per thousand males in age group 0–5 years;
Source: Rajya Sabha Session - 239 Unstarred Question No. 624 5.2. Proportion of seats held by women in national parliament, State legislation and Local Self Government
Gram Panchayat Records http://164.100.47.194/Loksabha/Members/Women.aspx; https://timesofindia.indiatimes.com/home/specials/assembly-elections-2014/maharashtra-news/New-Maharashtra-assembly-has-20-women-members-highest-ever-in-house/articleshow/44893568.cms
5.3. Proportion of female agricultural labourers to male agriculture labourers
HH Survey of target beneficiaries Source: Statistical Profile on Women Labour, 2012-2013, Labour Bureau, Ministry of Labour & Employment, Government of India, Chandigarh/Shimla
5.4. Wages casual labourers (gender wise) HH Survey of target beneficiaries Indian labour year book 2015 - Labour Bureau Chandigarh 5.5. Agricultural wages (gender wise) HH Survey of target beneficiaries Opendata.gov.in; 2015 figures 5.6. No. of mobile phone users, by sex HH Survey of target beneficiaries NFHS 2015-16 Goal 8 8.1. Annual (Agriculture production Household Survey Report - MOAFW - 2016 8.2. Proportion of informal employment in non - agriculture employment
HH Survey of target beneficiaries Key Indicators of Unincorporated Non-Agricultural Enterprises (Excluding Construction) in India; NSS 73rd ROUND: (July 2015 - June 2016) ; Informal Sector and Conditions of Employment in India, NSS 66th ROUND (July 2009 – June 2010)
8.3. Workforce participation Rate of women
HH Survey of target beneficiaries http://www.mospi.gov.in/sites/default/files/reports_and_publication/statistical_publication/social_statistics/Chapter_4.pdf ; Participation in Economy - MOSPI
8.4. Proportion of HH with out-migrants HH Survey of target beneficiaries Source: Report of the Working Group On Migration, Jan 2017, Ministry of Housing and Urban Poverty Alleviation, GoI
8.5. Employment generated under MNREGA (persondays)
MNREGA - website data MNREGS Online MIS - 2016-17- http://nrega.nic.in/netnrega/
Goal 12 12.1. No. of Farmers practicing organic agriculture
Partner NGO Reports 650,000 organic farmers among 120M farmers – India; 1% of 9 lakh farmers in Maharashtra https://in.reuters.com/article/india-agriculture-organic-entrepreneurs/young-indian-farmers-spice-up-market-for-organic-himalayan-crops-idINKBN15S17I
12.2. Per ha use of chemical fertilisers and pesticides
HH Survey of target beneficiaries MOAFW Report; District Statistical Handbook
Goal 13 13.3.1. Enhanced knowledge on climate change impact/mitigation in communities
HH Survey of target beneficiaries Not Applicable as only Household Survey was done
SDG Tracking Tool – Project Uddyam – Feb 2018 33
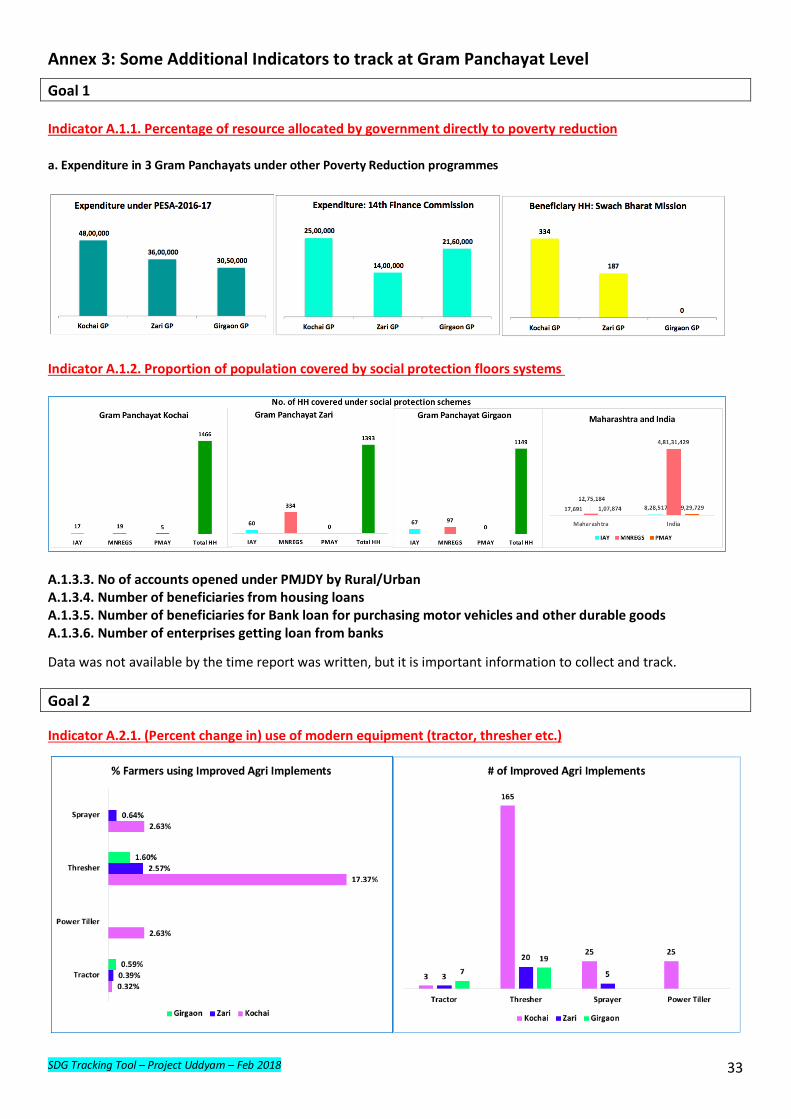
Annex 3: Some Additional Indicators to track at Gram Panchayat Level
Goal 1 Indicator A.1.1. Percentage of resource allocated by government directly to poverty reduction a. Expenditure in 3 Gram Panchayats under other Poverty Reduction programmes
Indicator A.1.2. Proportion of population covered by social protection floors systems
A.1.3.3. No of accounts opened under PMJDY by Rural/Urban A.1.3.4. Number of beneficiaries from housing loans A.1.3.5. Number of beneficiaries for Bank loan for purchasing motor vehicles and other durable goods A.1.3.6. Number of enterprises getting loan from banks
Data was not available by the time report was written, but it is important information to collect and track. Goal 2 Indicator A.2.1. (Percent change in) use of modern equipment (tractor, thresher etc.)
SDG Tracking Tool – Project Uddyam – Feb 2018 34
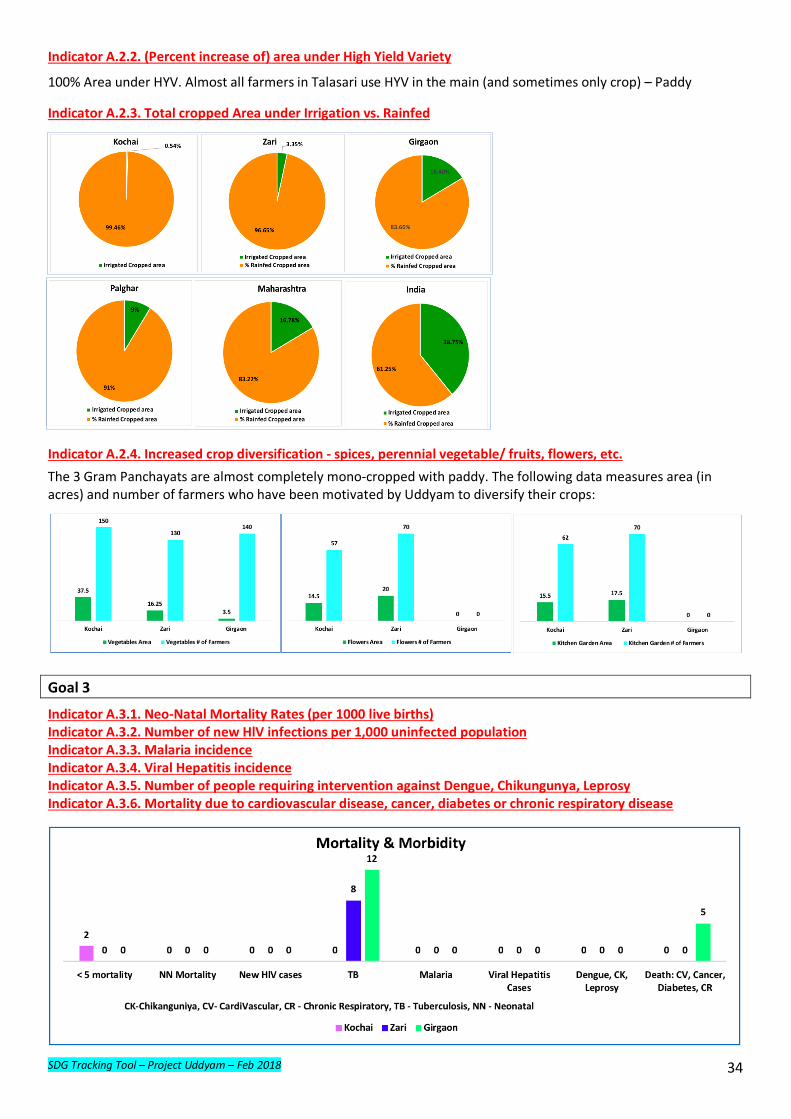
Indicator A.2.2. (Percent increase of) area under High Yield Variety
100% Area under HYV. Almost all farmers in Talasari use HYV in the main (and sometimes only crop) – Paddy
Indicator A.2.3. Total cropped Area under Irrigation vs. Rainfed
Indicator A.2.4. Increased crop diversification - spices, perennial vegetable/ fruits, flowers, etc.
The 3 Gram Panchayats are almost completely mono-cropped with paddy. The following data measures area (in acres) and number of farmers who have been motivated by Uddyam to diversify their crops:
Goal 3
Indicator A.3.1. Neo-Natal Mortality Rates (per 1000 live births) Indicator A.3.2. Number of new HlV infections per 1,000 uninfected population Indicator A.3.3. Malaria incidence Indicator A.3.4. Viral Hepatitis incidence Indicator A.3.5. Number of people requiring intervention against Dengue, Chikungunya, Leprosy Indicator A.3.6. Mortality due to cardiovascular disease, cancer, diabetes or chronic respiratory disease
SDG Tracking Tool – Project Uddyam – Feb 2018 35
Goal 4
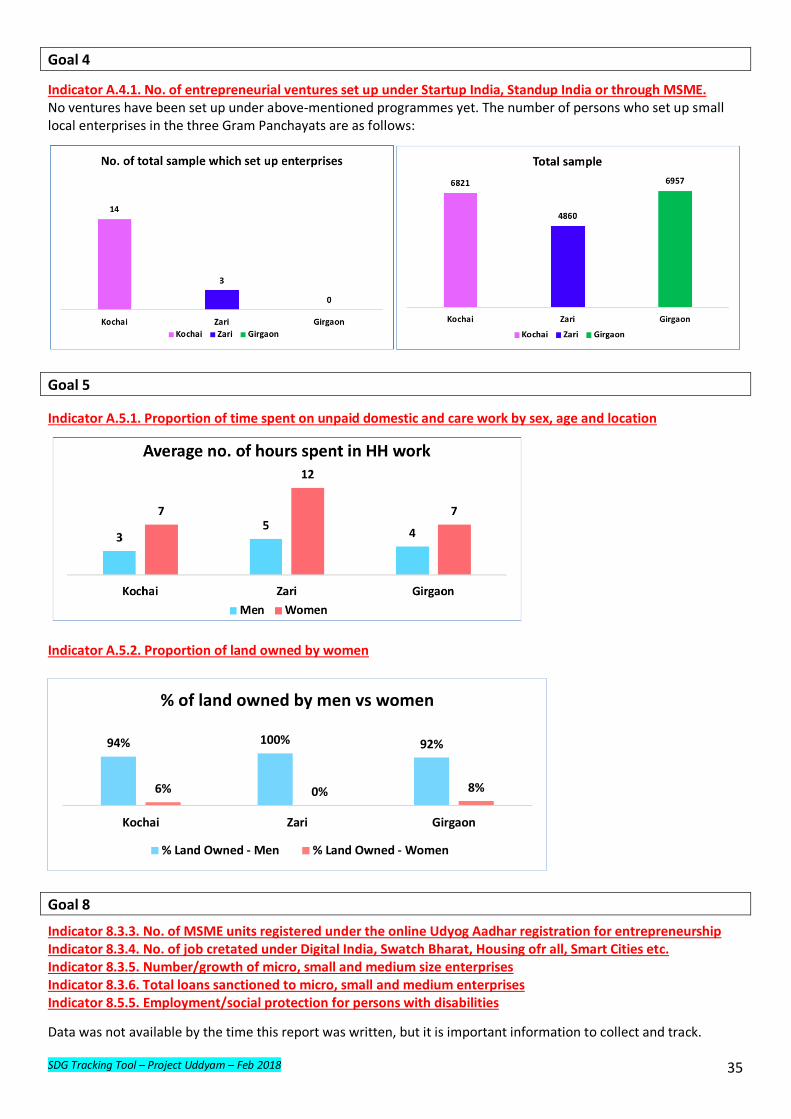
Indicator A.4.1. No. of entrepreneurial ventures set up under Startup India, Standup India or through MSME. No ventures have been set up under above-mentioned programmes yet. The number of persons who set up small local enterprises in the three Gram Panchayats are as follows:
Goal 5
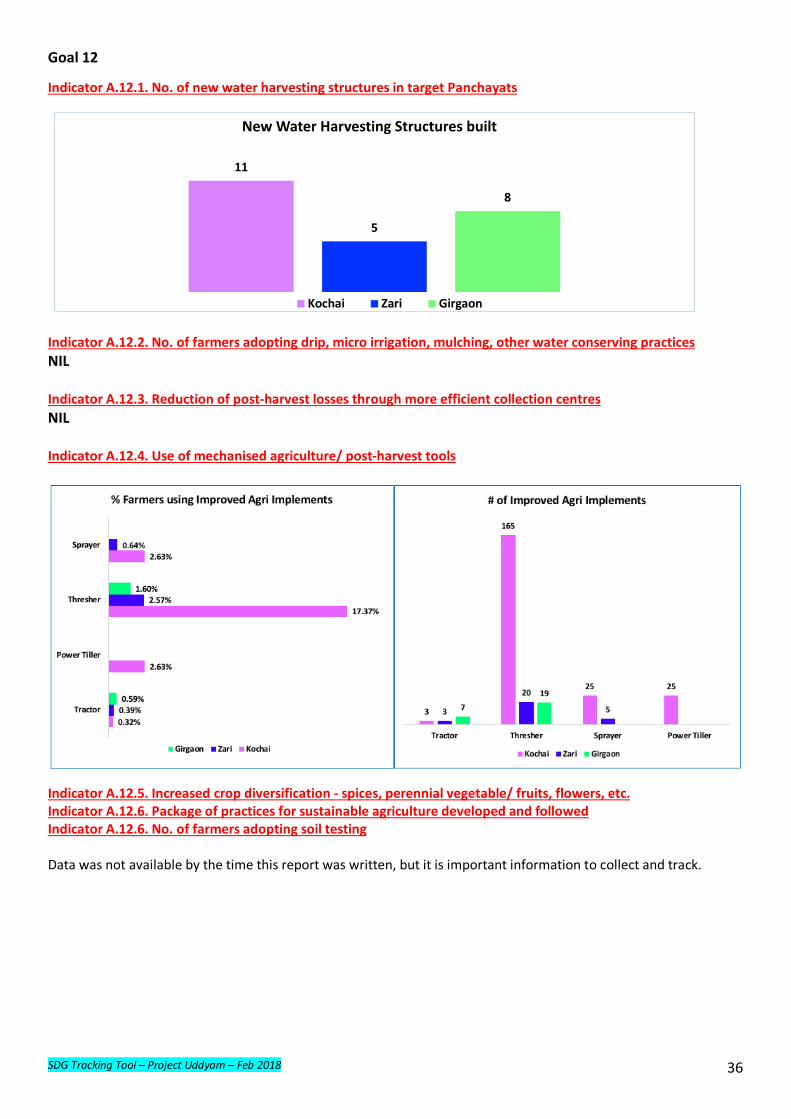
Indicator A.5.1. Proportion of time spent on unpaid domestic and care work by sex, age and location Indicator A.5.2. Proportion of land owned by women
Goal 8
Indicator 8.3.3. No. of MSME units registered under the online Udyog Aadhar registration for entrepreneurship Indicator 8.3.4. No. of job cretated under Digital India, Swatch Bharat, Housing ofr all, Smart Cities etc. Indicator 8.3.5. Number/growth of micro, small and medium size enterprises Indicator 8.3.6. Total loans sanctioned to micro, small and medium enterprises Indicator 8.5.5. Employment/social protection for persons with disabilities
Data was not available by the time this report was written, but it is important information to collect and track.
94% 100% 92%
6% 0% 8%
Kochai Zari Girgaon
% of land owned by men vs women
% Land Owned - Men % Land Owned - Women
SDG Tracking Tool – Project Uddyam – Feb 2018 36
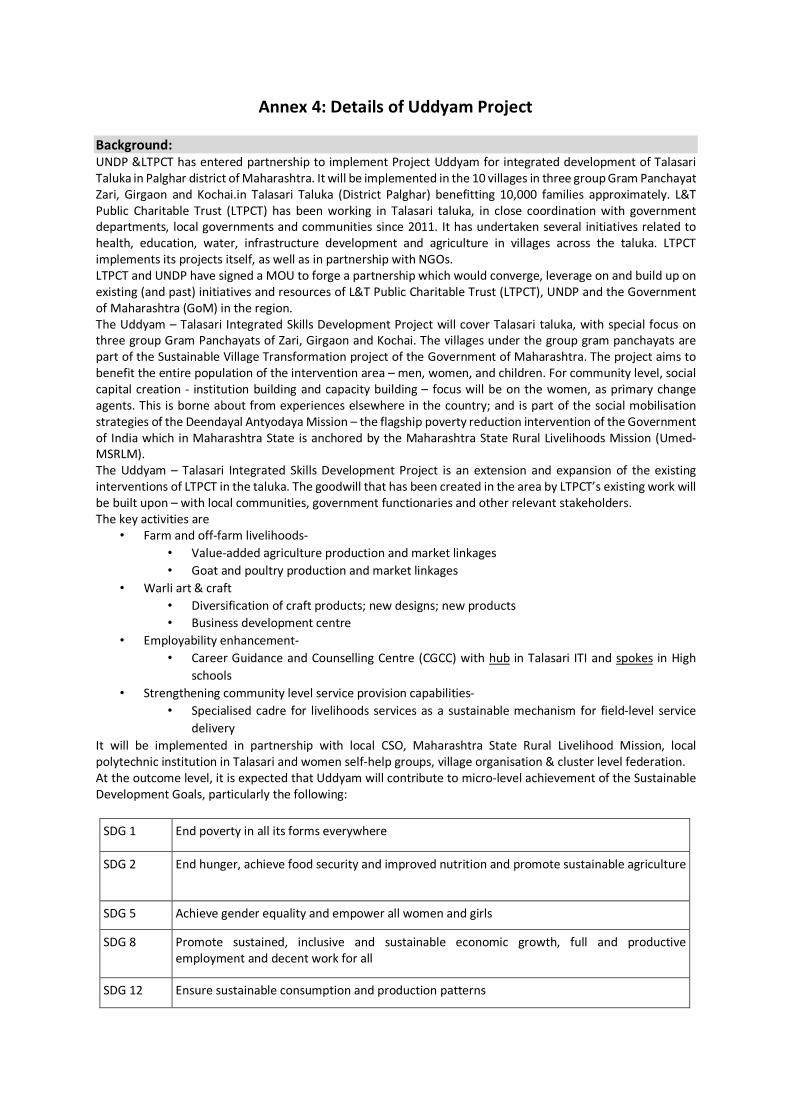
11
5
8
New Water Harvesting Structures built
Kochai Zari Girgaon
Goal 12
Indicator A.12.1. No. of new water harvesting structures in target Panchayats Indicator A.12.2. No. of farmers adopting drip, micro irrigation, mulching, other water conserving practices NIL Indicator A.12.3. Reduction of post-harvest losses through more efficient collection centres NIL Indicator A.12.4. Use of mechanised agriculture/ post-harvest tools
Indicator A.12.5. Increased crop diversification - spices, perennial vegetable/ fruits, flowers, etc. Indicator A.12.6. Package of practices for sustainable agriculture developed and followed Indicator A.12.6. No. of farmers adopting soil testing Data was not available by the time this report was written, but it is important information to collect and track.

SDG Tracking Tool – Project Uddyam – Feb 2018 37
Goal 13
Indicator 13.1.1. Climate change mitigation measures adopted (e.g. germ-plasm conservation, introduction of residual moisture crop, seasonal and perennial arhar, etc.)
Annex 4: Details of Uddyam Project
Background: UNDP <PCT has entered partnership to implement Project Uddyam for integrated development of Talasari
Taluka in Palghar district of Maharashtra. It will be implemented in the 10 villages in three group Gram Panchayat
Zari, Girgaon and Kochai.in Talasari Taluka (District Palghar) benefitting 10,000 families approximately. L&T
Public Charitable Trust (LTPCT) has been working in Talasari taluka, in close coordination with government
departments, local governments and communities since 2011. It has undertaken several initiatives related to
health, education, water, infrastructure development and agriculture in villages across the taluka. LTPCT
implements its projects itself, as well as in partnership with NGOs.
LTPCT and UNDP have signed a MOU to forge a partnership which would converge, leverage on and build up on
existing (and past) initiatives and resources of L&T Public Charitable Trust (LTPCT), UNDP and the Government
of Maharashtra (GoM) in the region.
The Uddyam – Talasari Integrated Skills Development Project will cover Talasari taluka, with special focus on
three group Gram Panchayats of Zari, Girgaon and Kochai. The villages under the group gram panchayats are
part of the Sustainable Village Transformation project of the Government of Maharashtra. The project aims to
benefit the entire population of the intervention area – men, women, and children. For community level, social
capital creation - institution building and capacity building – focus will be on the women, as primary change
agents. This is borne about from experiences elsewhere in the country; and is part of the social mobilisation
strategies of the Deendayal Antyodaya Mission – the flagship poverty reduction intervention of the Government
of India which in Maharashtra State is anchored by the Maharashtra State Rural Livelihoods Mission (Umed-
MSRLM).
The Uddyam – Talasari Integrated Skills Development Project is an extension and expansion of the existing
interventions of LTPCT in the taluka. The goodwill that has been created in the area by LTPCT’s existing work will
be built upon – with local communities, government functionaries and other relevant stakeholders.
The key activities are
• Farm and off-farm livelihoods-
• Value-added agriculture production and market linkages
• Goat and poultry production and market linkages
• Warli art & craft
• Diversification of craft products; new designs; new products
• Business development centre
• Employability enhancement-
• Career Guidance and Counselling Centre (CGCC) with hub in Talasari ITI and spokes in High
schools
• Strengthening community level service provision capabilities-
• Specialised cadre for livelihoods services as a sustainable mechanism for field-level service
delivery
It will be implemented in partnership with local CSO, Maharashtra State Rural Livelihood Mission, local
polytechnic institution in Talasari and women self-help groups, village organisation & cluster level federation.
At the outcome level, it is expected that Uddyam will contribute to micro-level achievement of the Sustainable
Development Goals, particularly the following:
SDG 1 End poverty in all its forms everywhere
SDG 2 End hunger, achieve food security and improved nutrition and promote sustainable agriculture
SDG 5 Achieve gender equality and empower all women and girls
SDG 8 Promote sustained, inclusive and sustainable economic growth, full and productive
employment and decent work for all
SDG 12 Ensure sustainable consumption and production patterns
Through the first-year interventions of the Uddyam project, the following outputs are expected.
1. Incomes of participating families increased through improved utilisation of land and animal-bird
resources in the villages under the three selected Group Gram Panchayats 2. Increased income for families engaged in Warli painting and crafts
Interventions made by the Project will lead to increased incomes for participating families. The exact nature of
increase will be determined while preparing the detailed implementation plans, considering the nature of
involvement of the families in different activities and the resource and skills base from which they engage in the
activities. However, given the current understanding of the context, the increase in cash incomes should not be
less than Rs.9000, on average per participating family, during the first year. It needs to be noted that the
increased income flows will continue, on an increasing basis, after the end of the one-year intervention.
3. Career guidance, counselling and support mechanisms catering to students and school drop-outs are
made available locally Employability of students of the government ITI and selected high-schools in Talasari taluka will be enhanced by
creating a community based career guidance and counselling system. This will also result in increased
interactions between job seekers, training institutions and employers. The project will result in increased focus
on aspirations, employability, skills and support mechanisms for young women. The Project will result in increasing the capabilities of the Sancharaks in the existing LTPCT supported high-school
interventions and selected faculty members of the Talasari ITI to continue to provide career guidance services
to the youth in the taluka.
4. Effective project management, monitoring and reporting mechanisms for multi-partner interventions
developed and demonstrated The Project management and monitoring systems established for Uddyam Talasari will serve a demonstration
for similar initiatives at much larger scales across India. Project Strategies As indicated earlier, the Uddyam Project in Talasari will build on the existing work done by LTPCT in the taluka.
It will also synergise directly, with interventions of the Government, particularly that of Umed-MSRLM and the
Directorate of Vocational Education and Training. Convergence will be achieved with other government
schemes, especially those related to land and water management, school education and strengthening of digital
services. The Project will also draw upon the technical capabilities of non-governmental organisations with
substantial sectoral experience as well as those active in the taluka. It will draw upon the global experience that
UNDP brings, to learn from best practices and build a comprehensive management and monitoring system in
line with the SDGs. The specific field-level strategies to be adopted by the Project are the following.
• Strengthening the community institution network (SHG-VO) promoted by Umed-MSRLM to take part
in the project and achieve its results • Strengthening technical support cadre at the local level to implement and sustain interventions • Creating institutions and mechanisms for backward and forward market linkage to strengthen farm and
non-farm production systems • Capacity building of community members, local governments, government departments and agencies
and other stakeholders • Creating project management and monitoring system that allows for transparent monitoring, avoid
duplication of efforts and synergising the capabilities of the community, local governments,
government departments and agencies, civil society organisations and the UN • Effective documentation and reporting of the processes, results and challenges
Key activity areas
To achieve the above results, the Uddyam project in Talasari, during Year 1, will focus on the following activities.
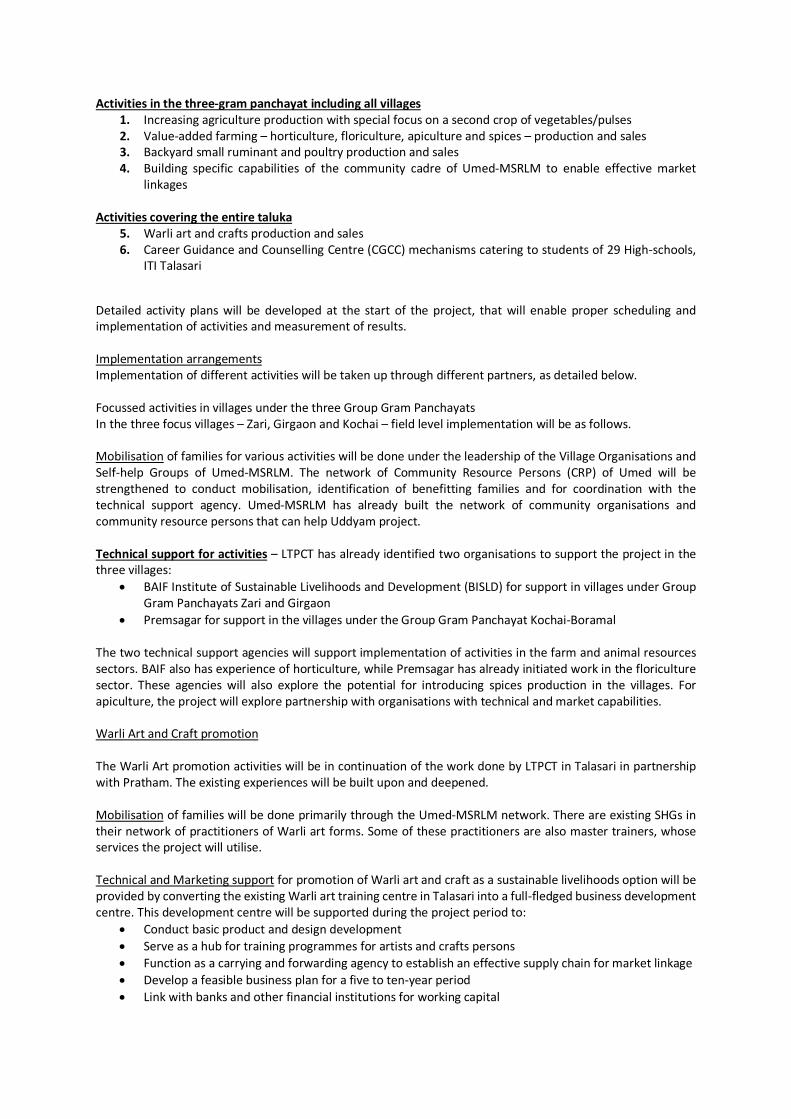
Activities in the three-gram panchayat including all villages 1. Increasing agriculture production with special focus on a second crop of vegetables/pulses 2. Value-added farming – horticulture, floriculture, apiculture and spices – production and sales 3. Backyard small ruminant and poultry production and sales 4. Building specific capabilities of the community cadre of Umed-MSRLM to enable effective market
linkages Activities covering the entire taluka
5. Warli art and crafts production and sales 6. Career Guidance and Counselling Centre (CGCC) mechanisms catering to students of 29 High-schools,
ITI Talasari
Detailed activity plans will be developed at the start of the project, that will enable proper scheduling and
implementation of activities and measurement of results.
Implementation arrangements
Implementation of different activities will be taken up through different partners, as detailed below.
Focussed activities in villages under the three Group Gram Panchayats
In the three focus villages – Zari, Girgaon and Kochai – field level implementation will be as follows. Mobilisation of families for various activities will be done under the leadership of the Village Organisations and
Self-help Groups of Umed-MSRLM. The network of Community Resource Persons (CRP) of Umed will be
strengthened to conduct mobilisation, identification of benefitting families and for coordination with the
technical support agency. Umed-MSRLM has already built the network of community organisations and
community resource persons that can help Uddyam project. Technical support for activities – LTPCT has already identified two organisations to support the project in the
three villages: • BAIF Institute of Sustainable Livelihoods and Development (BISLD) for support in villages under Group
Gram Panchayats Zari and Girgaon • Premsagar for support in the villages under the Group Gram Panchayat Kochai-Boramal
The two technical support agencies will support implementation of activities in the farm and animal resources
sectors. BAIF also has experience of horticulture, while Premsagar has already initiated work in the floriculture
sector. These agencies will also explore the potential for introducing spices production in the villages. For
apiculture, the project will explore partnership with organisations with technical and market capabilities. Warli Art and Craft promotion
The Warli Art promotion activities will be in continuation of the work done by LTPCT in Talasari in partnership
with Pratham. The existing experiences will be built upon and deepened. Mobilisation of families will be done primarily through the Umed-MSRLM network. There are existing SHGs in
their network of practitioners of Warli art forms. Some of these practitioners are also master trainers, whose
services the project will utilise. Technical and Marketing support for promotion of Warli art and craft as a sustainable livelihoods option will be
provided by converting the existing Warli art training centre in Talasari into a full-fledged business development
centre. This development centre will be supported during the project period to: • Conduct basic product and design development • Serve as a hub for training programmes for artists and crafts persons • Function as a carrying and forwarding agency to establish an effective supply chain for market linkage • Develop a feasible business plan for a five to ten-year period • Link with banks and other financial institutions for working capital
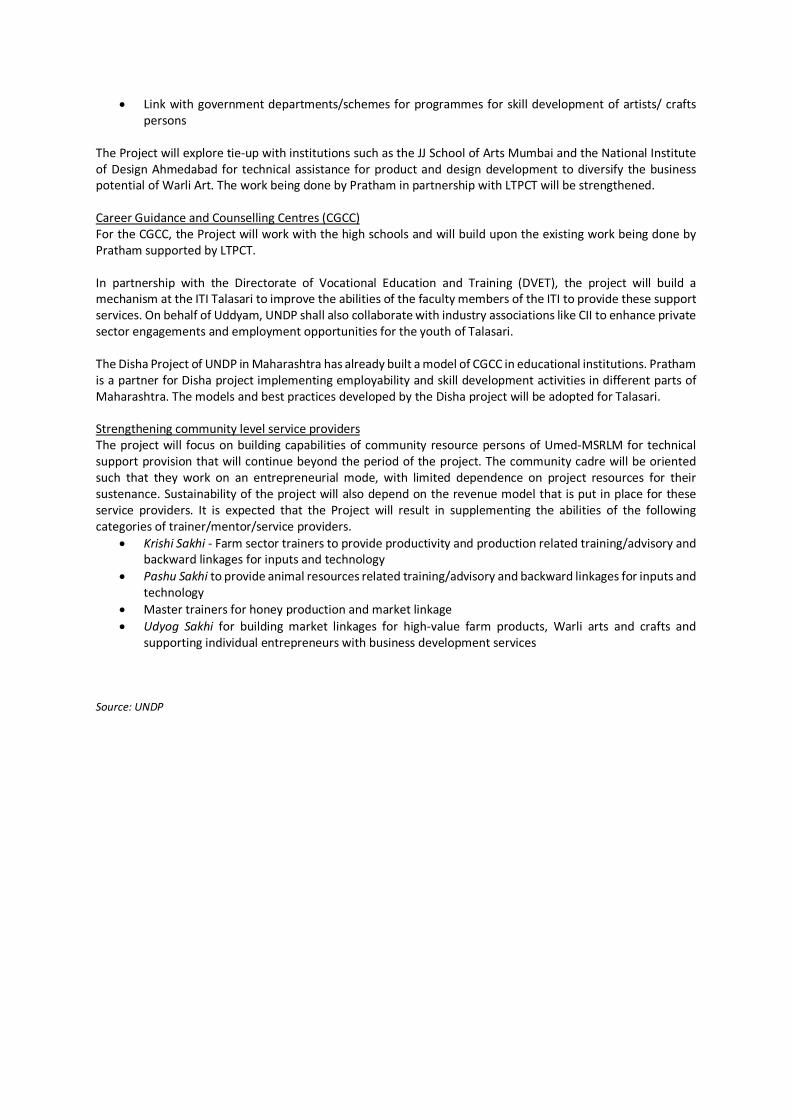
• Link with government departments/schemes for programmes for skill development of artists/ crafts
persons
The Project will explore tie-up with institutions such as the JJ School of Arts Mumbai and the National Institute
of Design Ahmedabad for technical assistance for product and design development to diversify the business
potential of Warli Art. The work being done by Pratham in partnership with LTPCT will be strengthened. Career Guidance and Counselling Centres (CGCC)
For the CGCC, the Project will work with the high schools and will build upon the existing work being done by
Pratham supported by LTPCT. In partnership with the Directorate of Vocational Education and Training (DVET), the project will build a
mechanism at the ITI Talasari to improve the abilities of the faculty members of the ITI to provide these support
services. On behalf of Uddyam, UNDP shall also collaborate with industry associations like CII to enhance private
sector engagements and employment opportunities for the youth of Talasari. The Disha Project of UNDP in Maharashtra has already built a model of CGCC in educational institutions. Pratham
is a partner for Disha project implementing employability and skill development activities in different parts of
Maharashtra. The models and best practices developed by the Disha project will be adopted for Talasari. Strengthening community level service providers
The project will focus on building capabilities of community resource persons of Umed-MSRLM for technical
support provision that will continue beyond the period of the project. The community cadre will be oriented
such that they work on an entrepreneurial mode, with limited dependence on project resources for their
sustenance. Sustainability of the project will also depend on the revenue model that is put in place for these
service providers. It is expected that the Project will result in supplementing the abilities of the following
categories of trainer/mentor/service providers. • Krishi Sakhi - Farm sector trainers to provide productivity and production related training/advisory and
backward linkages for inputs and technology • Pashu Sakhi to provide animal resources related training/advisory and backward linkages for inputs and
technology • Master trainers for honey production and market linkage • Udyog Sakhi for building market linkages for high-value farm products, Warli arts and crafts and
supporting individual entrepreneurs with business development services
Source: UNDP
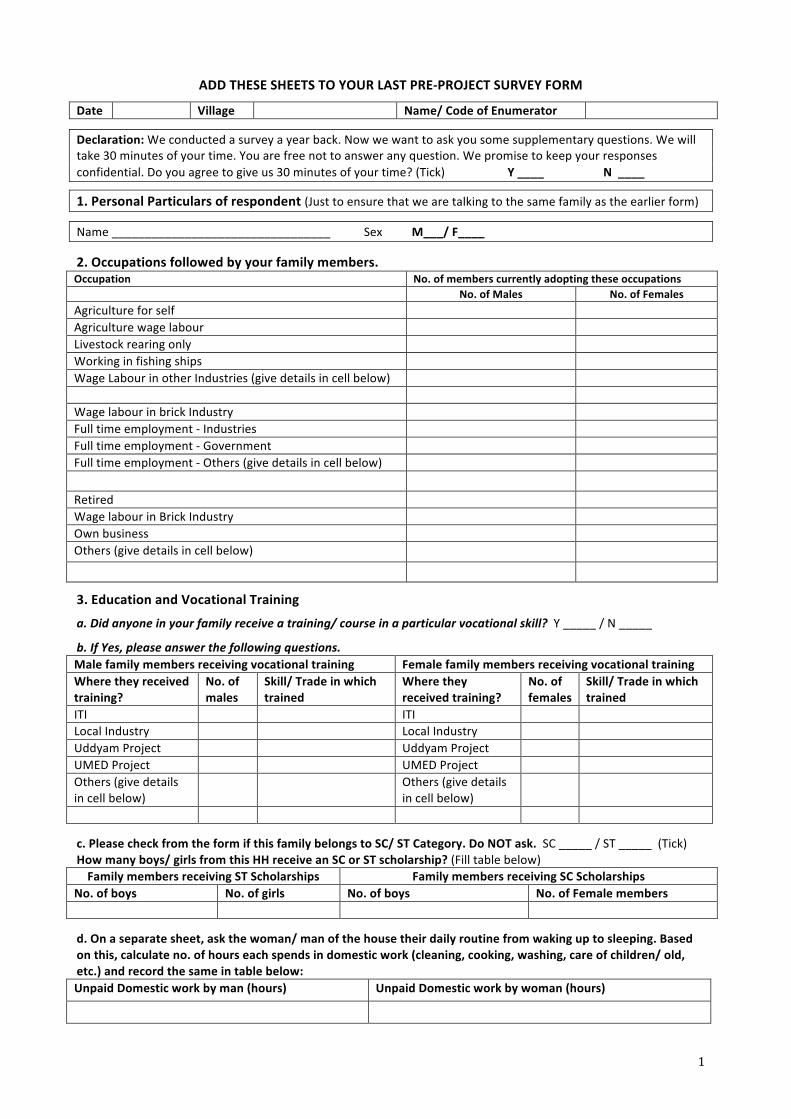
1
ADDTHESESHEETSTOYOURLASTPRE-PROJECTSURVEYFORM
Date Village Name/CodeofEnumerator
Declaration:Weconductedasurveyayearback.Nowwewanttoaskyousomesupplementaryquestions.Wewilltake30minutesofyourtime.Youarefreenottoansweranyquestion.Wepromisetokeepyourresponsesconfidential.Doyouagreetogiveus30minutesofyourtime?(Tick) Y____ N____
1.PersonalParticularsofrespondent(Justtoensurethatwearetalkingtothesamefamilyastheearlierform)
Name_________________________________ Sex M___/F____
2.Occupationsfollowedbyyourfamilymembers.Occupation No.ofmemberscurrentlyadoptingtheseoccupations
No.ofMales No.ofFemales
Agricultureforself Agriculturewagelabour Livestockrearingonly Workinginfishingships WageLabourinotherIndustries(givedetailsincellbelow) WagelabourinbrickIndustry Fulltimeemployment-Industries Fulltimeemployment-Government Fulltimeemployment-Others(givedetailsincellbelow) Retired WagelabourinBrickIndustry Ownbusiness Others(givedetailsincellbelow)
3.EducationandVocationalTraining
a.Didanyoneinyourfamilyreceiveatraining/courseinaparticularvocationalskill?Y_____/N_____
b.IfYes,pleaseanswerthefollowingquestions.Malefamilymembersreceivingvocationaltraining FemalefamilymembersreceivingvocationaltrainingWheretheyreceivedtraining?
No.ofmales
Skill/Tradeinwhichtrained
Wheretheyreceivedtraining?
No.offemales
Skill/Tradeinwhichtrained
ITI ITI LocalIndustry LocalIndustry UddyamProject UddyamProject UMEDProject UMEDProject Others(givedetailsincellbelow)
Others(givedetailsincellbelow)
c.PleasecheckfromtheformifthisfamilybelongstoSC/STCategory.DoNOTask.SC_____/ST_____(Tick)Howmanyboys/girlsfromthisHHreceiveanSCorSTscholarship?(Filltablebelow)FamilymembersreceivingSTScholarships FamilymembersreceivingSCScholarships
No.ofboys No.ofgirls No.ofboys No.ofFemalemembers d.Onaseparatesheet,askthewoman/manofthehousetheirdailyroutinefromwakinguptosleeping.Basedonthis,calculateno.ofhourseachspendsindomesticwork(cleaning,cooking,washing,careofchildren/old,etc.)andrecordthesameintablebelow:UnpaidDomesticworkbyman(hours) UnpaidDomesticworkbywoman(hours)
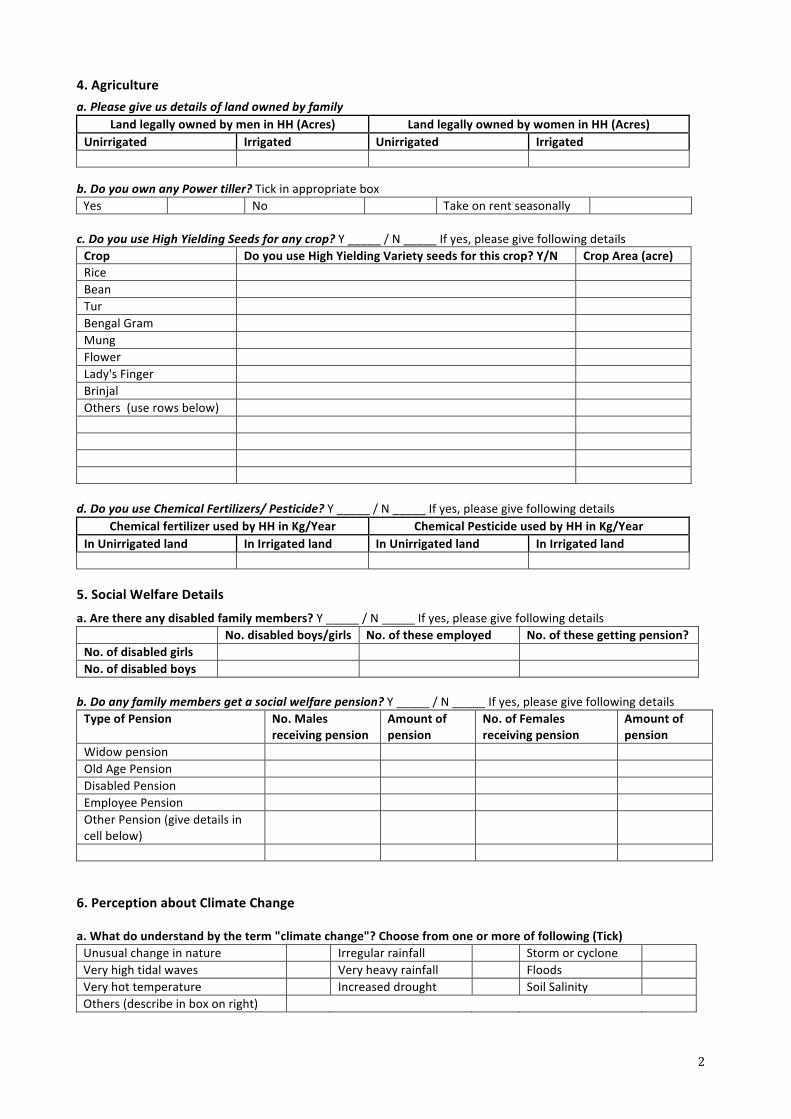
2
4.Agriculture
a.PleasegiveusdetailsoflandownedbyfamilyLandlegallyownedbymeninHH(Acres) LandlegallyownedbywomeninHH(Acres)
Unirrigated Irrigated Unirrigated Irrigated
b.DoyouownanyPowertiller?TickinappropriateboxYes No Takeonrentseasonally
c.DoyouuseHighYieldingSeedsforanycrop?Y_____/N_____Ifyes,pleasegivefollowingdetailsCrop DoyouuseHighYieldingVarietyseedsforthiscrop?Y/N CropArea(acre)Rice Bean Tur BengalGram Mung Flower Lady'sFinger Brinjal Others(userowsbelow)
d.DoyouuseChemicalFertilizers/Pesticide?Y_____/N_____Ifyes,pleasegivefollowingdetails
ChemicalfertilizerusedbyHHinKg/Year ChemicalPesticideusedbyHHinKg/YearInUnirrigatedland InIrrigatedland InUnirrigatedland InIrrigatedland
5.SocialWelfareDetails
a.Arethereanydisabledfamilymembers?Y_____/N_____Ifyes,pleasegivefollowingdetails No.disabledboys/girls No.oftheseemployed No.ofthesegettingpension?No.ofdisabledgirls No.ofdisabledboys
b.Doanyfamilymembersgetasocialwelfarepension?Y_____/N_____Ifyes,pleasegivefollowingdetailsTypeofPension No.Males
receivingpensionAmountofpension
No.ofFemalesreceivingpension
Amountofpension
Widowpension OldAgePension DisabledPension EmployeePension OtherPension(givedetailsincellbelow)
6.PerceptionaboutClimateChangea.Whatdounderstandbytheterm"climatechange"?Choosefromoneormoreoffollowing(Tick)Unusualchangeinnature Irregularrainfall Stormorcyclone Veryhightidalwaves Veryheavyrainfall Floods Veryhottemperature Increaseddrought SoilSalinity Others(describeinboxonright)

3
b.Haveyouobservedanyofabovechangesinpast5-10yearsinyourvillage/area?Y____/N_____Ifyes,pleasegivefollowingdetails(Scoreoneormorefrom1to10where1=verylittle,10=veryhigh)Change Score/10 Score/10 Score/10Unusualchangeinnature Irregularrainfall Stormorcyclone Veryhightidalwaves Veryheavyrainfall Floods Veryhottemperature Increaseddrought SoilSalinity Others(describeandscoreinboxonright)
c.Inyouropinion,whataretheeffectsoftheaboveclimatechangesonyourlives?(Tickoneormore)Agricultureproductiondecreased Lossoftrees/garden Migration Lossofdomesticanimals Lossesduetodisasters Healthproblems Scarcityofdrinkingwater Lossofwildanimals Lossofincome Others(describeinboxonright)
d.Whydoyouthinkthesechangesarehappening?(Tickoneormore)DuetoHumanbeings DuetoNature/God Duetoemissionsfromvarioussources Pollution Others(describeandscoreinboxonright)
e.Whatdoyouthinkcanbedonetoreduceproblemsofclimatechange?(Tickoneormore)Makeoneselfresilienttothesechanges Needmoretrainingonthisissue Getassistancefromthesociety/community Domorewaterharvesting Governmentshouldprovideasafetynetprogram Plantmoretrees Diversifyintofruit,flower,vegetablecrops Don'tknow Others(describeinboxonright)
7.Suggestions:WhatareyoursuggestionstoimprovetheUddyamproject?
______________________________________________________________________________________________
______________________________________________________________________________________________
______________________________________________________________________________________________
______________________________________________________________________________________________
______________________________________________________________________________________________
uuu
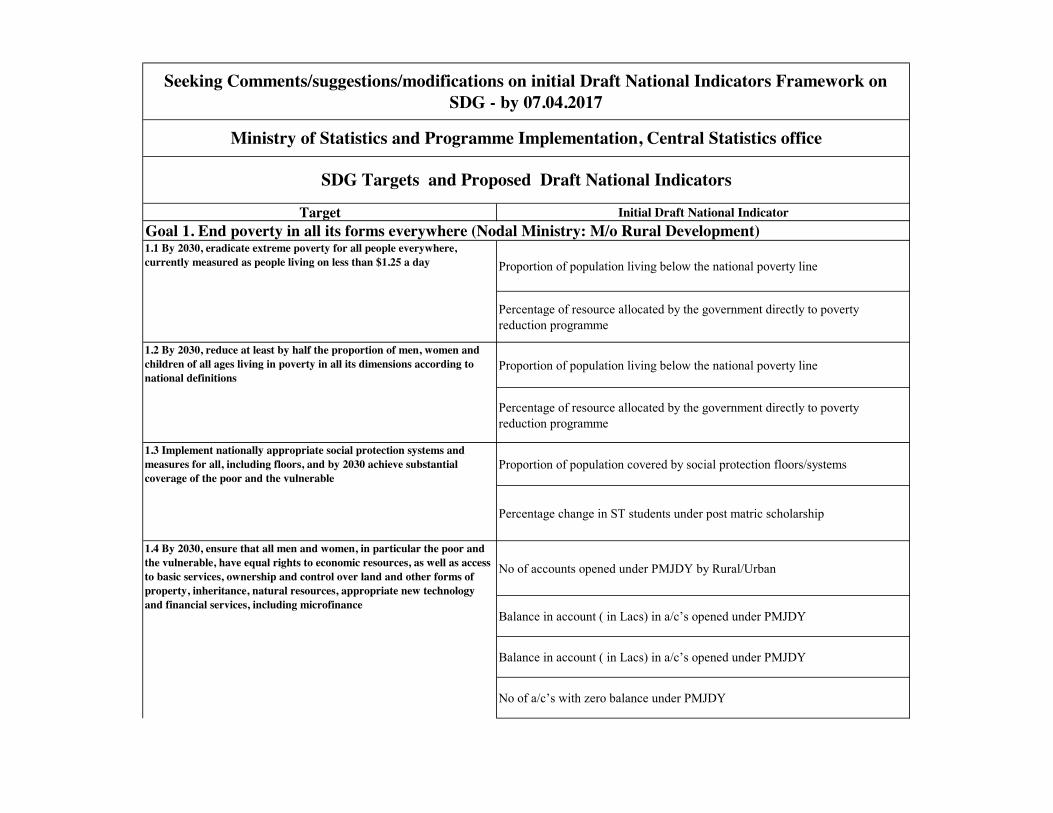
Target Initial Draft National Indicator
Proportion of population living below the national poverty line
Percentage of resource allocated by the government directly to poverty reduction programme
Proportion of population living below the national poverty line
Percentage of resource allocated by the government directly to poverty reduction programme
Proportion of population covered by social protection floors/systems
Percentage change in ST students under post matric scholarship
No of accounts opened under PMJDY by Rural/Urban
Balance in account ( in Lacs) in a/c’s opened under PMJDY
Balance in account ( in Lacs) in a/c’s opened under PMJDY
No of a/c’s with zero balance under PMJDY
Seeking Comments/suggestions/modifications on initial Draft National Indicators Framework on SDG - by 07.04.2017
SDG Targets and Proposed Draft National Indicators
Goal 1. End poverty in all its forms everywhere (Nodal Ministry: M/o Rural Development)1.1 By 2030, eradicate extreme poverty for all people everywhere, currently measured as people living on less than $1.25 a day
1.2 By 2030, reduce at least by half the proportion of men, women and children of all ages living in poverty in all its dimensions according to national definitions
1.4 By 2030, ensure that all men and women, in particular the poor and the vulnerable, have equal rights to economic resources, as well as access to basic services, ownership and control over land and other forms of property, inheritance, natural resources, appropriate new technology and financial services, including microfinance
1.3 Implement nationally appropriate social protection systems and measures for all, including floors, and by 2030 achieve substantial coverage of the poor and the vulnerable
Ministry of Statistics and Programme Implementation, Central Statistics office
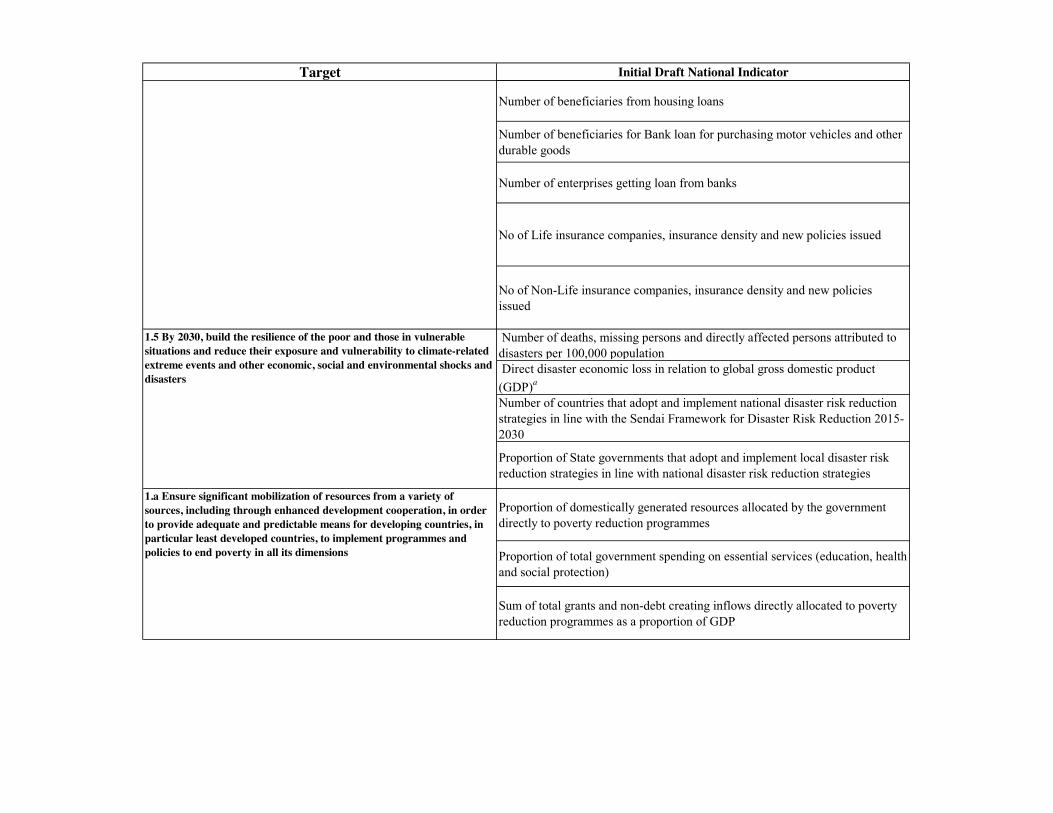
Target Initial Draft National Indicator
Number of beneficiaries from housing loans
Number of beneficiaries for Bank loan for purchasing motor vehicles and other durable goods
Number of enterprises getting loan from banks
No of Life insurance companies, insurance density and new policies issued
No of Non-Life insurance companies, insurance density and new policies issued
Number of deaths, missing persons and directly affected persons attributed to disasters per 100,000 population Direct disaster economic loss in relation to global gross domestic product (GDP)a
Number of countries that adopt and implement national disaster risk reduction strategies in line with the Sendai Framework for Disaster Risk Reduction 2015-2030
Proportion of State governments that adopt and implement local disaster risk reduction strategies in line with national disaster risk reduction strategies
Proportion of domestically generated resources allocated by the government directly to poverty reduction programmes
Proportion of total government spending on essential services (education, health and social protection)
Sum of total grants and non-debt creating inflows directly allocated to poverty reduction programmes as a proportion of GDP
1.4 By 2030, ensure that all men and women, in particular the poor and the vulnerable, have equal rights to economic resources, as well as access to basic services, ownership and control over land and other forms of property, inheritance, natural resources, appropriate new technology and financial services, including microfinance
1.5 By 2030, build the resilience of the poor and those in vulnerable situations and reduce their exposure and vulnerability to climate-related extreme events and other economic, social and environmental shocks and disasters
1.a Ensure significant mobilization of resources from a variety of sources, including through enhanced development cooperation, in order to provide adequate and predictable means for developing countries, in particular least developed countries, to implement programmes and policies to end poverty in all its dimensions
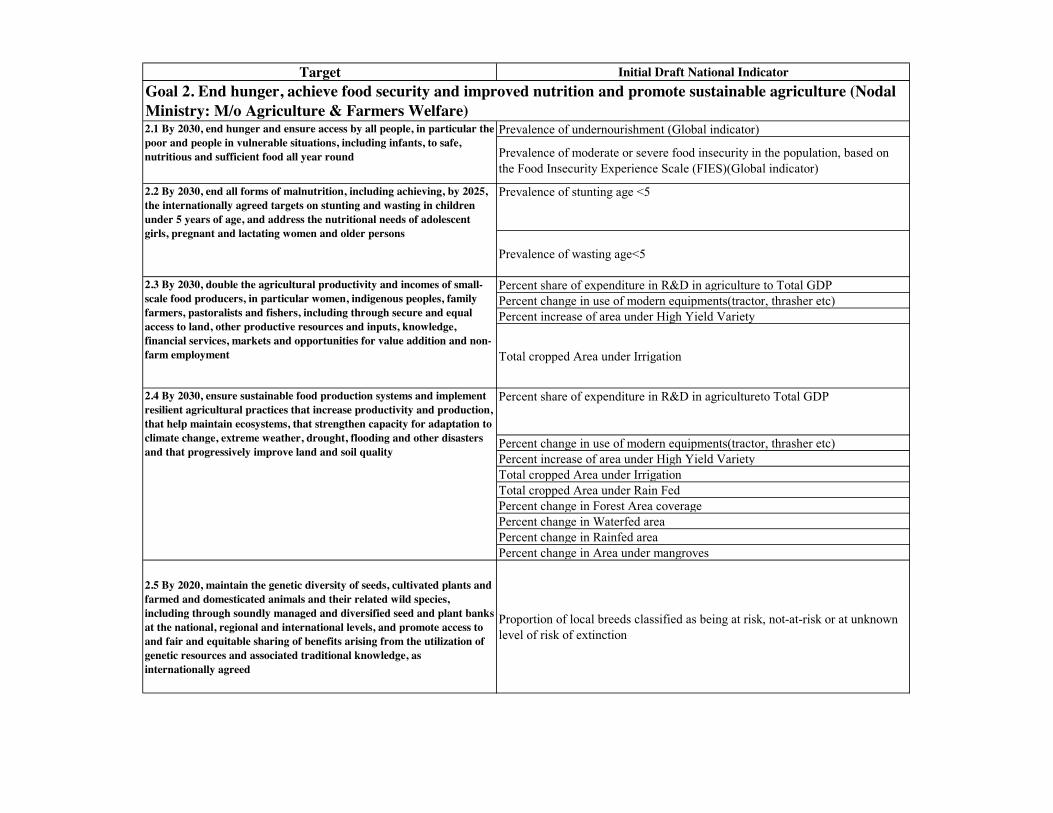
Target Initial Draft National Indicator
Prevalence of undernourishment (Global indicator)
Prevalence of moderate or severe food insecurity in the population, based on the Food Insecurity Experience Scale (FIES)(Global indicator)
Prevalence of stunting age <5
Prevalence of wasting age<5
Percent share of expenditure in R&D in agriculture to Total GDP Percent change in use of modern equipments(tractor, thrasher etc)Percent increase of area under High Yield Variety
Total cropped Area under Irrigation
Percent share of expenditure in R&D in agricultureto Total GDP
Percent change in use of modern equipments(tractor, thrasher etc)Percent increase of area under High Yield VarietyTotal cropped Area under IrrigationTotal cropped Area under Rain FedPercent change in Forest Area coveragePercent change in Waterfed areaPercent change in Rainfed areaPercent change in Area under mangroves
2.5 By 2020, maintain the genetic diversity of seeds, cultivated plants and farmed and domesticated animals and their related wild species, including through soundly managed and diversified seed and plant banks at the national, regional and international levels, and promote access to and fair and equitable sharing of benefits arising from the utilization of genetic resources and associated traditional knowledge, as internationally agreed
Proportion of local breeds classified as being at risk, not-at-risk or at unknown level of risk of extinction
2.1 By 2030, end hunger and ensure access by all people, in particular the poor and people in vulnerable situations, including infants, to safe, nutritious and sufficient food all year round
2.2 By 2030, end all forms of malnutrition, including achieving, by 2025, the internationally agreed targets on stunting and wasting in children under 5 years of age, and address the nutritional needs of adolescent girls, pregnant and lactating women and older persons
2.3 By 2030, double the agricultural productivity and incomes of small-scale food producers, in particular women, indigenous peoples, family farmers, pastoralists and fishers, including through secure and equal access to land, other productive resources and inputs, knowledge, financial services, markets and opportunities for value addition and non-farm employment
2.4 By 2030, ensure sustainable food production systems and implement resilient agricultural practices that increase productivity and production, that help maintain ecosystems, that strengthen capacity for adaptation to climate change, extreme weather, drought, flooding and other disasters and that progressively improve land and soil quality
Goal 2. End hunger, achieve food security and improved nutrition and promote sustainable agriculture (Nodal Ministry: M/o Agriculture & Farmers Welfare)
Target Initial Draft National Indicator
2.a Increase investment, including through enhanced international cooperation, in rural infrastructure, agricultural research and extension services, technology development and plant and livestock gene banks in order to enhance agricultural productive capacity in developing countries, in particular least developed countries
Total official flows (official development assistance plus other official flows) to the agriculture sector
2.b Correct and prevent trade restrictions and distortions in world agricultural markets, including through the parallel elimination of all forms of agricultural export subsidies and all export measures with equivalent effect, in accordance with the mandate of the Doha Development Round
The Indicator is being developed
2.c Adopt measures to ensure the proper functioning of food commodity markets and their derivatives and facilitate timely access to market information, including on food reserves, in order to help limit extreme food price volatility
The Indicator is being Developed
Maternal mortality ratio
Proportion of births attended by skilled health personnel
Under-five mortality rate
Neonatal mortality rate
Number of new HIV infections per 1,000 uninfected population
Tuberculosis incidence per 100,000 population
Goal 3. Ensure healthy lives and promote well-being for all at all ages (Nodal Ministry: M/o Health & Family Welfare)3.1 By 2030, reduce the global maternal mortality ratio to less than 70 per 100,000 live births
3.2 By 2030, end preventable deaths of newborns and children under 5 years of age, with all countries aiming to reduce neonatal mortality to at least as low as 12 per 1,000 live births and under-5 mortality to at least as low as 25 per 1,000 live births
3.3 By 2030, end the epidemics of AIDS, tuberculosis, malaria and neglected tropical diseases and combat hepatitis, water-borne diseases and other communicable diseases
Target Initial Draft National Indicator
Malaria incidence per 1,000 population
Viral Hepatitis (including A, B, C, D, E) incidence per 100,000 population
Number of people requiring intervention against Neglected tropical Diseases (Dengue, Chikungunya, Kala-azar, Leprosy, Lymplatic Filariasis, Soil Transmitted Helminths, V Lieshmaniasis)
Mortality rate attributed to cardiovascular disease, cancer, diabetes or chronic respiratory disease
Suicide mortality rate
Coverage of treatment interventions (pharmacological, psychosocial and rehabilitation and aftercare services) for substance use disorders
Harmful use of alcohol, defined according to the national context as alcohol per capita consumption (aged 15 years and older) within a calendar year in litres of pure alcohol
3.6 By 2020, halve the number of global deaths and injuries from road traffic accidents Death rate due to road traffic injuries
Proportion of women of reproductive age (aged 15-49 years) who have their need for family planning satisfied with modern methods
Annual number of births to women aged 15-19 years per 1,000 women in that age group
Proportion of delivery attended by skilled health personnel
Proportion of Institutional Deliveries
3.3 By 2030, end the epidemics of AIDS, tuberculosis, malaria and neglected tropical diseases and combat hepatitis, water-borne diseases and other communicable diseases
3.4 By 2030, reduce by one third premature mortality from non-communicable diseases through prevention and treatment and promote mental health and well-being
3.5 Strengthen the prevention and treatment of substance abuse, including narcotic drug abuse and harmful use of alcohol
3.7 By 2030, ensure universal access to sexual and reproductive health-care services, including for family planning, information and education, and the integration of reproductive health into national strategies and programmes
Target Initial Draft National Indicator
Proportion of women of reproductive age (aged 15-49 years) who have their need for family planning satisfied with modern methods
Percentage of women aged 15-49 years with a live birth in a given time period who received antenatal care, four times or more
Percentage of children aged 12-23 months who received the three doses of pentavalent vaccine before their first birthday
Percentage of children under 5 years of age with suspected pneumonia (cough and difficult breathing Not due to a problem in the chest and a blocked nose) in two weeks preceeding the survey who sought care from appropriate health facility or provider
Percentage of TB cases successfully treated (cured plus treatment completed) among TB cases notified to the national health authorities during a specified period
Percentage of people living with HIV currently receiving ART among the detected number of adults and children living with HIV
Percentage population in malaria-endemic areas who slept under an ITN the previous night or/and Percentage of population at risk protected by IRS during a specified time period
Percentage population using safely managed drinking water services and Percentage population using safely managed sanitation services
Proportion of population aged 18 years and older who are currently taking antihypertensive medication among number of adults 18 years and older who are taking medication for hypertension with systolic blood pressure ≥ 140 mmHg, or with distolic blood pressure ≥ 90mmHg
3.8 Achieve universal health coverage, including financial risk protection, access to quality essential health-care services and access to safe, effective, quality and affordable essential medicines and vaccines for all
Target Initial Draft National Indicator
Proportion of population aged 18 years and older who are currently taking medication for diabetes (insulin or glycaemic control pills) among number of adults 18 years and older who are taking medication for diabetes or with fasting plasma glucose ≥ 7.0 mmol/
Proportion of women aged 30-49 years who report they were ever screened for cervical cancer and the proportion of women aged 30-49 years who report they were screened for cervical cancer during the last 5 years
Age standarized prevalence of current tobacco use among persons aged 15+ years
Number of outpatient department visit per person per year and hospital(inpatient) admission per 100 population per year
Total physicians, nurses and midwives per 10000 population
Percentage of health facilities with essential medicines and life saving commodities
Percentage of attributes of 13 core capacities [1. National legislation, policy and financing 2. Coordination and national Focal Point Communications 3. Surveillance 4. response 5. Preparedness 6. Risk Communication 7. Human Resources 8. Laboratory 9. Point of entry 10. Zoonotic events 11. Food safety 12. Chemical events 13. Radio nuclear emergencies] that have been attained at a specific point in time
Poverty head count due to out-of-pocket payments on health
Out - of - Pocket expenditure on health
3.8 Achieve universal health coverage, including financial risk protection, access to quality essential health-care services and access to safe, effective, quality and affordable essential medicines and vaccines for all
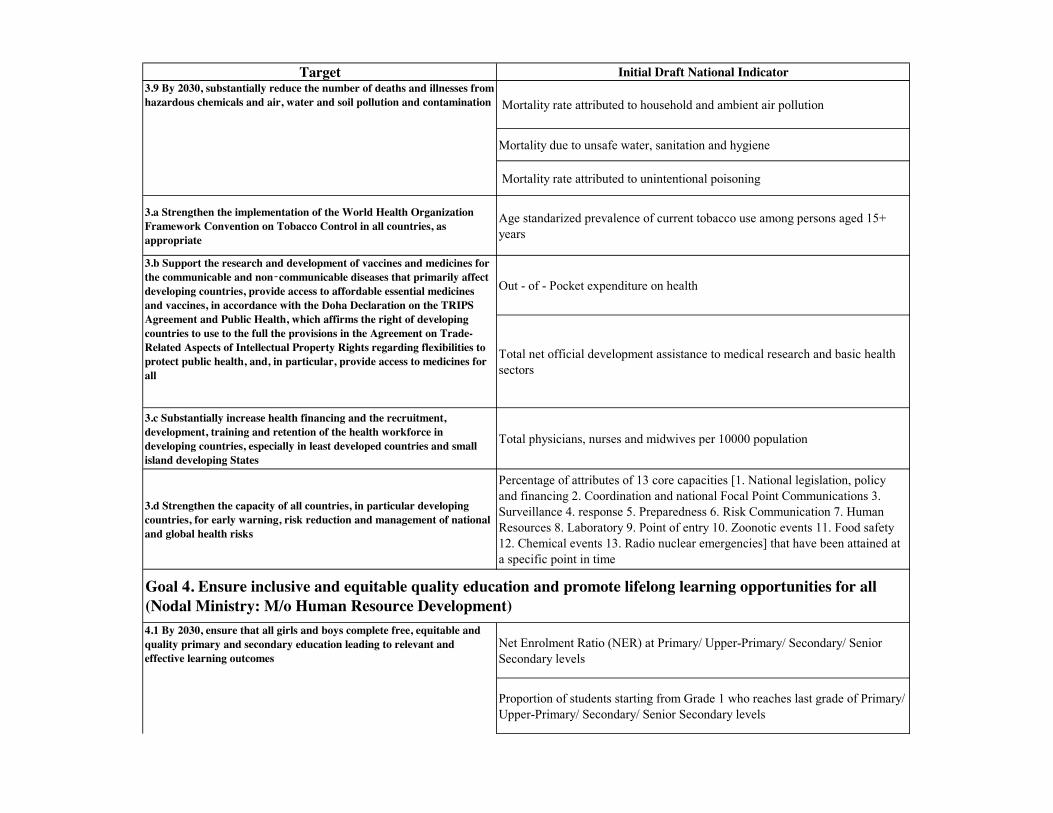
Target Initial Draft National Indicator
Mortality rate attributed to household and ambient air pollution
Mortality due to unsafe water, sanitation and hygiene
Mortality rate attributed to unintentional poisoning
3.a Strengthen the implementation of the World Health Organization Framework Convention on Tobacco Control in all countries, as appropriate
Age standarized prevalence of current tobacco use among persons aged 15+ years
Out - of - Pocket expenditure on health
Total net official development assistance to medical research and basic health sectors
3.c Substantially increase health financing and the recruitment, development, training and retention of the health workforce in developing countries, especially in least developed countries and small island developing States
Total physicians, nurses and midwives per 10000 population
3.d Strengthen the capacity of all countries, in particular developing countries, for early warning, risk reduction and management of national and global health risks
Percentage of attributes of 13 core capacities [1. National legislation, policy and financing 2. Coordination and national Focal Point Communications 3. Surveillance 4. response 5. Preparedness 6. Risk Communication 7. Human Resources 8. Laboratory 9. Point of entry 10. Zoonotic events 11. Food safety 12. Chemical events 13. Radio nuclear emergencies] that have been attained at a specific point in time
Net Enrolment Ratio (NER) at Primary/ Upper-Primary/ Secondary/ Senior Secondary levels
Proportion of students starting from Grade 1 who reaches last grade of Primary/ Upper-Primary/ Secondary/ Senior Secondary levels
Goal 4. Ensure inclusive and equitable quality education and promote lifelong learning opportunities for all (Nodal Ministry: M/o Human Resource Development)
3.b Support the research and development of vaccines and medicines for the communicable and non‑communicable diseases that primarily affect developing countries, provide access to affordable essential medicines and vaccines, in accordance with the Doha Declaration on the TRIPS Agreement and Public Health, which affirms the right of developing countries to use to the full the provisions in the Agreement on Trade-Related Aspects of Intellectual Property Rights regarding flexibilities to protect public health, and, in particular, provide access to medicines for all
4.1 By 2030, ensure that all girls and boys complete free, equitable and quality primary and secondary education leading to relevant and effective learning outcomes
3.9 By 2030, substantially reduce the number of deaths and illnesses from hazardous chemicals and air, water and soil pollution and contamination
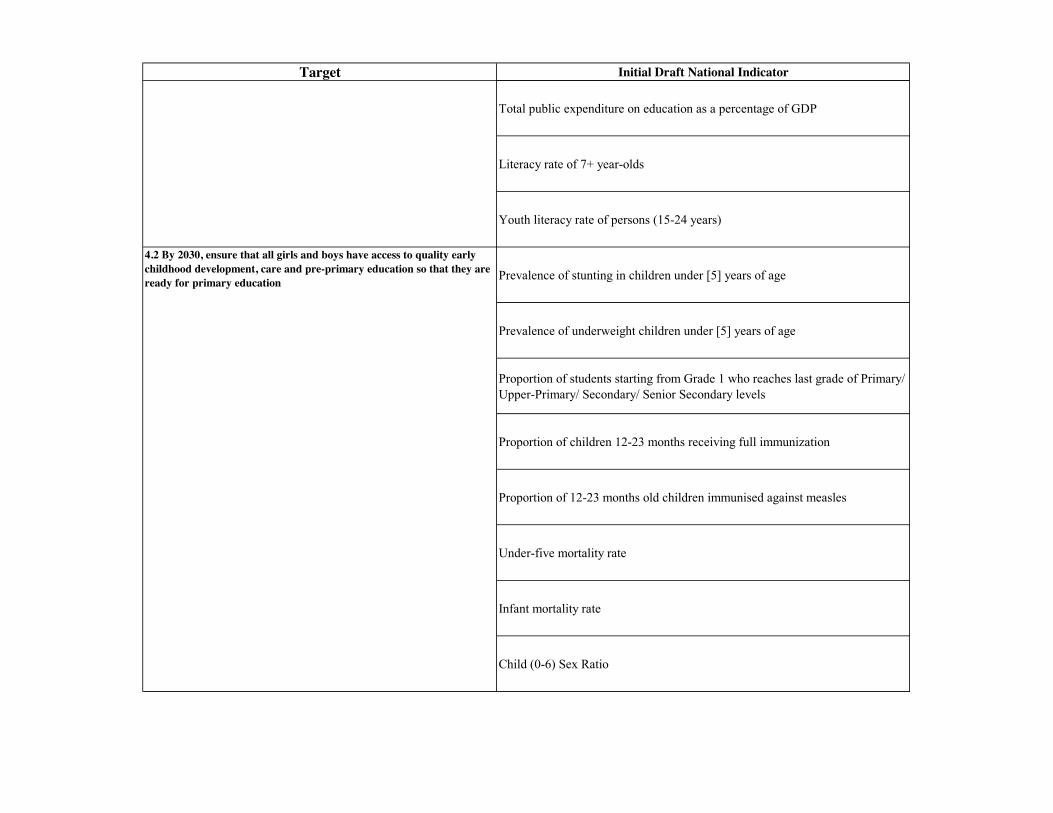
Target Initial Draft National Indicator
Total public expenditure on education as a percentage of GDP
Literacy rate of 7+ year-olds
Youth literacy rate of persons (15-24 years)
Prevalence of stunting in children under [5] years of age
Prevalence of underweight children under [5] years of age
Proportion of students starting from Grade 1 who reaches last grade of Primary/ Upper-Primary/ Secondary/ Senior Secondary levels
Proportion of children 12-23 months receiving full immunization
Proportion of 12-23 months old children immunised against measles
Under-five mortality rate
Infant mortality rate
Child (0-6) Sex Ratio
4.1 By 2030, ensure that all girls and boys complete free, equitable and quality primary and secondary education leading to relevant and effective learning outcomes
4.2 By 2030, ensure that all girls and boys have access to quality early childhood development, care and pre-primary education so that they are ready for primary education
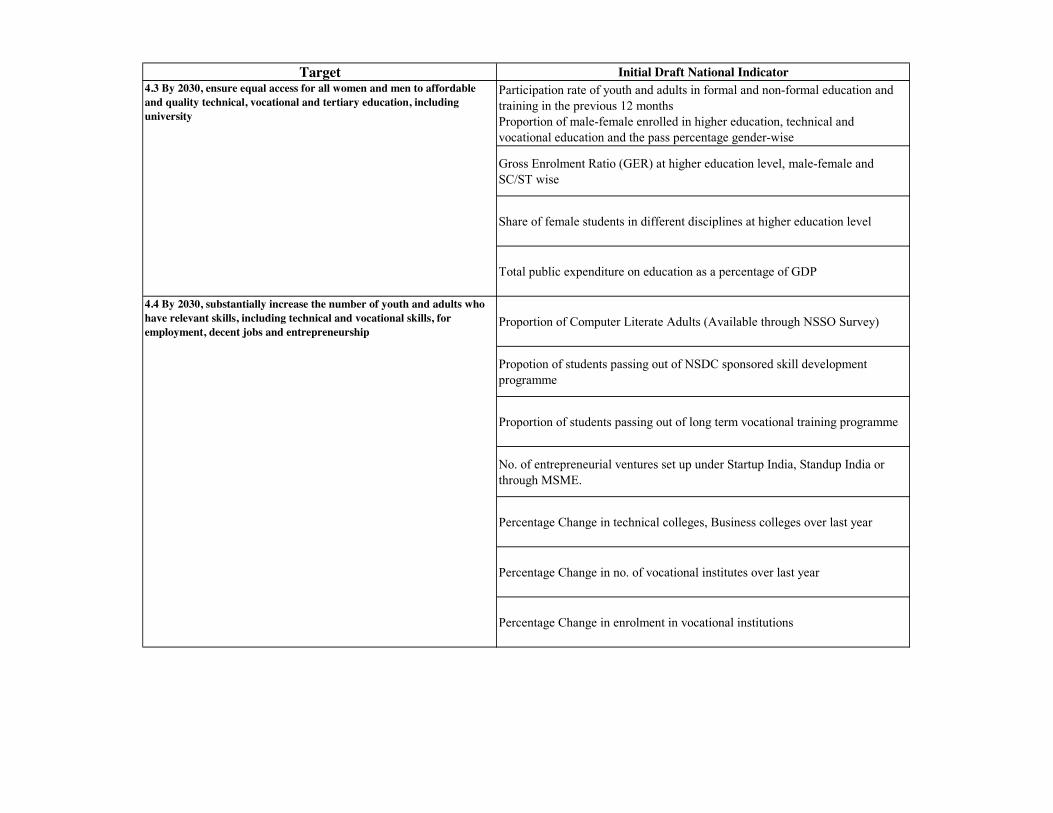
Target Initial Draft National IndicatorParticipation rate of youth and adults in formal and non-formal education and training in the previous 12 months Proportion of male-female enrolled in higher education, technical and vocational education and the pass percentage gender-wise
Gross Enrolment Ratio (GER) at higher education level, male-female and SC/ST wise
Share of female students in different disciplines at higher education level
Total public expenditure on education as a percentage of GDP
Proportion of Computer Literate Adults (Available through NSSO Survey)
Propotion of students passing out of NSDC sponsored skill development programme
Proportion of students passing out of long term vocational training programme
No. of entrepreneurial ventures set up under Startup India, Standup India or through MSME.
Percentage Change in technical colleges, Business colleges over last year
Percentage Change in no. of vocational institutes over last year
Percentage Change in enrolment in vocational institutions
4.3 By 2030, ensure equal access for all women and men to affordable and quality technical, vocational and tertiary education, including university
4.4 By 2030, substantially increase the number of youth and adults who have relevant skills, including technical and vocational skills, for employment, decent jobs and entrepreneurship
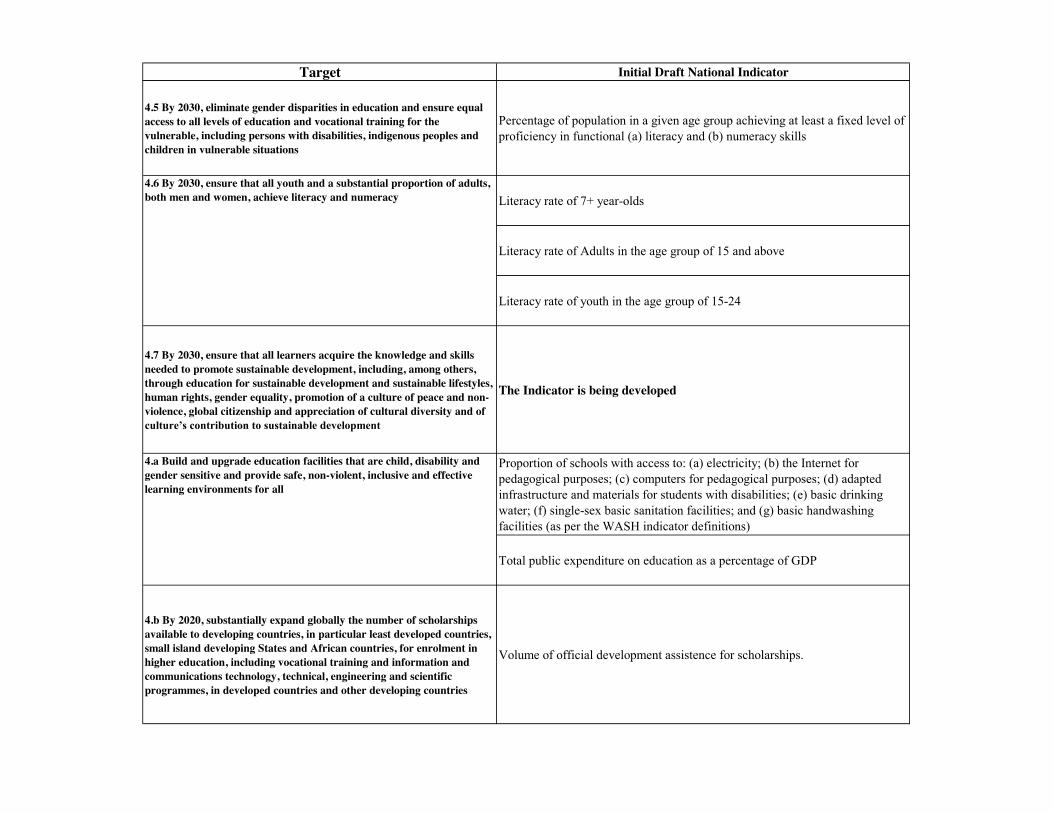
Target Initial Draft National Indicator
4.5 By 2030, eliminate gender disparities in education and ensure equal access to all levels of education and vocational training for the vulnerable, including persons with disabilities, indigenous peoples and children in vulnerable situations
Percentage of population in a given age group achieving at least a fixed level of proficiency in functional (a) literacy and (b) numeracy skills
Literacy rate of 7+ year-olds
Literacy rate of Adults in the age group of 15 and above
Literacy rate of youth in the age group of 15-24
4.7 By 2030, ensure that all learners acquire the knowledge and skills needed to promote sustainable development, including, among others, through education for sustainable development and sustainable lifestyles, human rights, gender equality, promotion of a culture of peace and non-violence, global citizenship and appreciation of cultural diversity and of culture’s contribution to sustainable development
The Indicator is being developed
Proportion of schools with access to: (a) electricity; (b) the Internet for pedagogical purposes; (c) computers for pedagogical purposes; (d) adapted infrastructure and materials for students with disabilities; (e) basic drinking water; (f) single-sex basic sanitation facilities; and (g) basic handwashing facilities (as per the WASH indicator definitions)
Total public expenditure on education as a percentage of GDP
4.b By 2020, substantially expand globally the number of scholarships available to developing countries, in particular least developed countries, small island developing States and African countries, for enrolment in higher education, including vocational training and information and communications technology, technical, engineering and scientific programmes, in developed countries and other developing countries
Volume of official development assistence for scholarships.
4.6 By 2030, ensure that all youth and a substantial proportion of adults, both men and women, achieve literacy and numeracy
4.a Build and upgrade education facilities that are child, disability and gender sensitive and provide safe, non-violent, inclusive and effective learning environments for all
Target Initial Draft National Indicator
4.c By 2030, substantially increase the supply of qualified teachers, including through international cooperation for teacher training in developing countries, especially least developed countries and small island developing States
Total public expenditure on education as a percentage of GDP
5.1 End all forms of discrimination against all women and girls everywhere
Whether or not legal frameworks are in place to promote, enforce and monitor equality and non‑discrimination on the basis of sex
Proportion of crime against women to total crime reported in the country during the calendar year
Proportion of sexual crimes against women to total crime against women during the calendar year
Proportion of cruelty/ physical violencce on women by husband or his relative to total crime against women during the calendar year
Proportion on rape of women by persons known to them, inter-alia, live-in partner or separated husband or ex-husband to total rape of women during the calendar year
Proportion of sexual crime against girls children to total crime against children during the calendar year
Goal 5. Achieve gender equality and empower all women and girls (Nodal Ministry: M/o Women and Child Development)
5.2 Eliminate all forms of violence against all women and girls in the public and private spheres, including trafficking and sexual and other types of exploitation
Target Initial Draft National Indicator
Proportion of Traffiking of girl children to total children trafficked during the calendar year
Percentage of currently partnered girls and women aged 15-49 years who have experience physical and / or sexual violence by their current intimate partner in the last 12 months
Child Sex Ratio
Proportion of women subjected to dowry related offences to total crime against women
Proportion of cases reported under the Prohibition of Child Marriage Act (early marriage of children below 18 years of age) total crime against children.
Proportion of women aged 20-24 years who were married or in a union before age 18
5.4 Recognize and value unpaid care and domestic work through the provision of public services, infrastructure and social protection policies and the promotion of shared responsibility within the household and the family as nationally appropriate
Proportion of time spent on unpaid domestic and care work by sex, age and location
Proportion of seats held by women in national parliament, State legislation and Local SelF Government
Number of women in Board of listed companies
5.3 Eliminate all harmful practices, such as child, early and forced marriage and female genital mutilation
5.5 Ensure women’s full and effective participation and equal opportunities for leadership at all levels of decision-making in political, economic and public life
5.2 Eliminate all forms of violence against all women and girls in the public and private spheres, including trafficking and sexual and other types of exploitation
Target Initial Draft National Indicator
Contraceptive Prevalence Rate
Unmet need for family planning for currently married women aged 15-49 years
Proportion of population aged 15-24 years with comprehensive correct knowledge of HIV / AIDS
Operational land holdings - gender wise
Proportion of female agricultural labourers
Wages of casual labourers (gender wise)
Agricultural wages (gender wise)
Number of accounts opened under PMJDY
Amount of Over Draft (OD) availed from PMJDY accounts by women
5.6 Ensure universal access to sexual and reproductive health and reproductive rights as agreed in accordance with the Programme of Action of the International Conference on Population and Development and the Beijing Platform for Action and the outcome documents of their review conferences
5.a Undertake reforms to give women equal rights to economic resources, as well as access to ownership and control over land and other forms of property, financial services, inheritance and natural resources, in accordance with national laws
Target Initial Draft National Indicator
5.b Enhance the use of enabling technology, in particular information and communications technology, to promote the empowerment of women Number of mobile phone users, by sex
5.c Adopt and strengthen sound policies and enforceable legislation for the promotion of gender equality and the empowerment of all women and girls at all levels
Number of Gender Budget Cells in Central and State Ministries
Proportion of population using safely managed drinking water services
Proportion of population using an improved drinking water by source
Proportion of population using safely managed sanitation services, including a hand-washing facility with soap and water
Percentage of population using basic sanitation services
Goal 6. Ensure availability and sustainable management of water and sanitation for all (Nodal Ministry: Mo Water Resources, River Development & Ganga Rejuvenation)6.1 By 2030, achieve universal and equitable access to safe and affordable drinking water for all
6.2 By 2030, achieve access to adequate and equitable sanitation and hygiene for all and end open defecation, paying special attention to the needs of women and girls and those in vulnerable situations
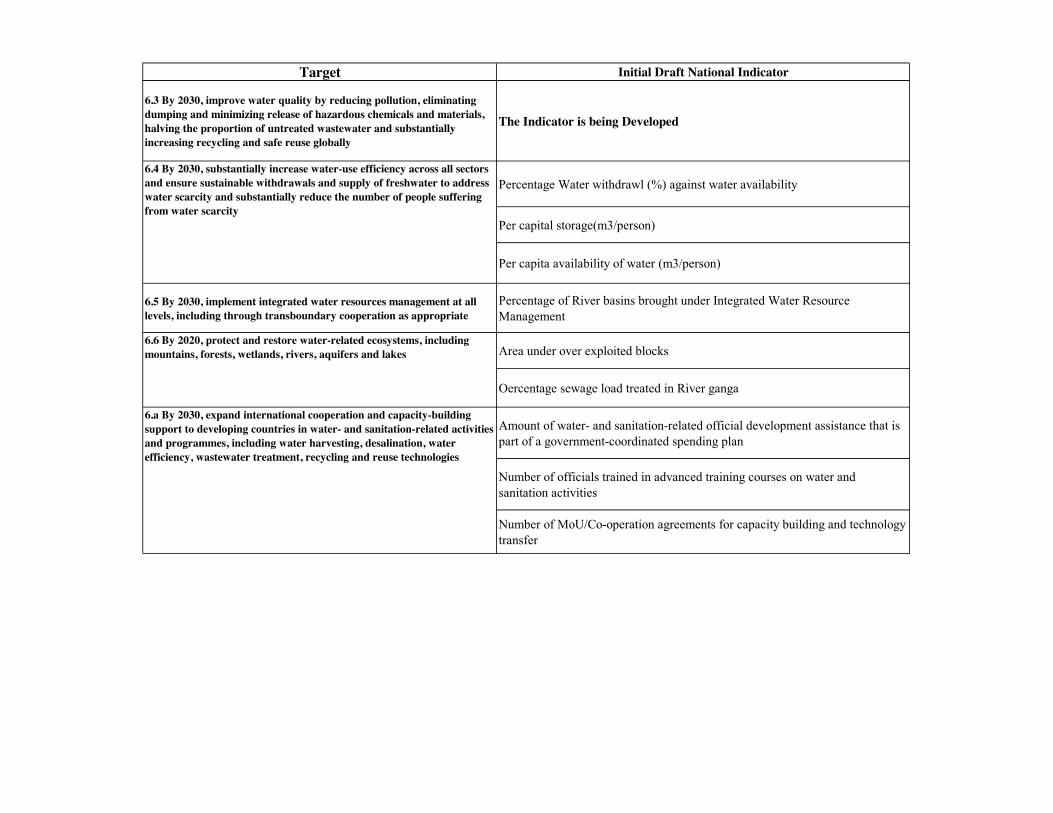
Target Initial Draft National Indicator
6.3 By 2030, improve water quality by reducing pollution, eliminating dumping and minimizing release of hazardous chemicals and materials, halving the proportion of untreated wastewater and substantially increasing recycling and safe reuse globally
The Indicator is being Developed
Percentage Water withdrawl (%) against water availability
Per capital storage(m3/person)
Per capita availability of water (m3/person)
6.5 By 2030, implement integrated water resources management at all levels, including through transboundary cooperation as appropriate
Percentage of River basins brought under Integrated Water Resource Management
Area under over exploited blocks
Oercentage sewage load treated in River ganga
Amount of water- and sanitation-related official development assistance that is part of a government-coordinated spending plan
Number of officials trained in advanced training courses on water and sanitation activities
Number of MoU/Co-operation agreements for capacity building and technology transfer
6.4 By 2030, substantially increase water-use efficiency across all sectors and ensure sustainable withdrawals and supply of freshwater to address water scarcity and substantially reduce the number of people suffering from water scarcity
6.6 By 2020, protect and restore water-related ecosystems, including mountains, forests, wetlands, rivers, aquifers and lakes
6.a By 2030, expand international cooperation and capacity-building support to developing countries in water- and sanitation-related activities and programmes, including water harvesting, desalination, water efficiency, wastewater treatment, recycling and reuse technologies
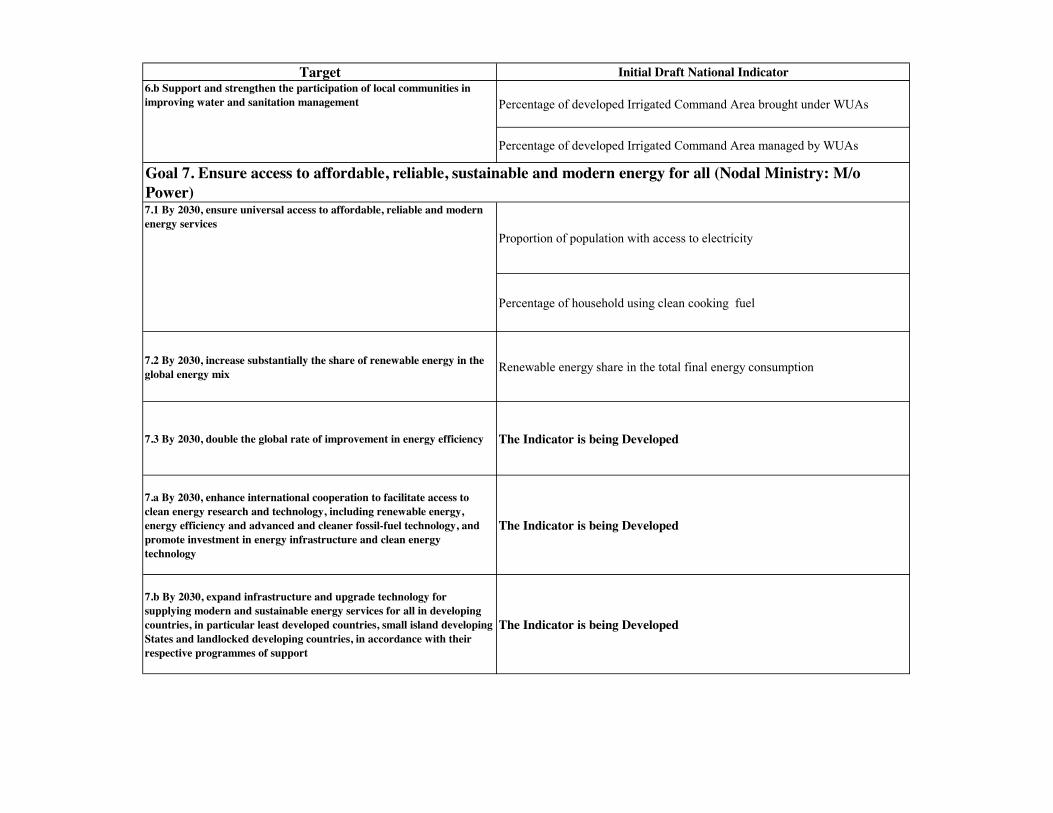
Target Initial Draft National Indicator
Percentage of developed Irrigated Command Area brought under WUAs
Percentage of developed Irrigated Command Area managed by WUAs
Proportion of population with access to electricity
Percentage of household using clean cooking fuel
7.2 By 2030, increase substantially the share of renewable energy in the global energy mix Renewable energy share in the total final energy consumption
7.3 By 2030, double the global rate of improvement in energy efficiency The Indicator is being Developed
7.a By 2030, enhance international cooperation to facilitate access to clean energy research and technology, including renewable energy, energy efficiency and advanced and cleaner fossil-fuel technology, and promote investment in energy infrastructure and clean energy technology
The Indicator is being Developed
7.b By 2030, expand infrastructure and upgrade technology for supplying modern and sustainable energy services for all in developing countries, in particular least developed countries, small island developing States and landlocked developing countries, in accordance with their respective programmes of support
The Indicator is being Developed
Goal 7. Ensure access to affordable, reliable, sustainable and modern energy for all (Nodal Ministry: M/o Power)7.1 By 2030, ensure universal access to affordable, reliable and modern energy services
6.b Support and strengthen the participation of local communities in improving water and sanitation management
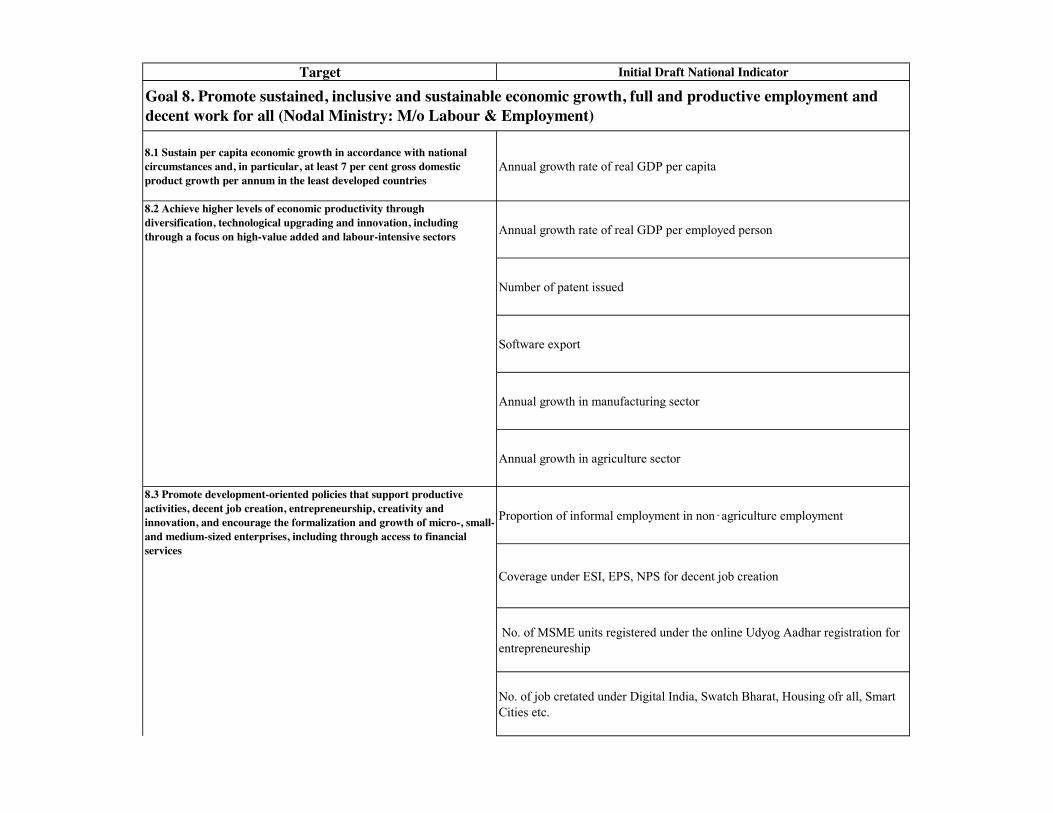
Target Initial Draft National Indicator
8.1 Sustain per capita economic growth in accordance with national circumstances and, in particular, at least 7 per cent gross domestic product growth per annum in the least developed countries
Annual growth rate of real GDP per capita
Annual growth rate of real GDP per employed person
Number of patent issued
Software export
Annual growth in manufacturing sector
Annual growth in agriculture sector
Proportion of informal employment in non‑agriculture employment
Coverage under ESI, EPS, NPS for decent job creation
No. of MSME units registered under the online Udyog Aadhar registration for entrepreneureship
No. of job cretated under Digital India, Swatch Bharat, Housing ofr all, Smart Cities etc.
8.3 Promote development-oriented policies that support productive activities, decent job creation, entrepreneurship, creativity and innovation, and encourage the formalization and growth of micro-, small- and medium-sized enterprises, including through access to financial services
Goal 8. Promote sustained, inclusive and sustainable economic growth, full and productive employment and decent work for all (Nodal Ministry: M/o Labour & Employment)
8.2 Achieve higher levels of economic productivity through diversification, technological upgrading and innovation, including through a focus on high-value added and labour-intensive sectors
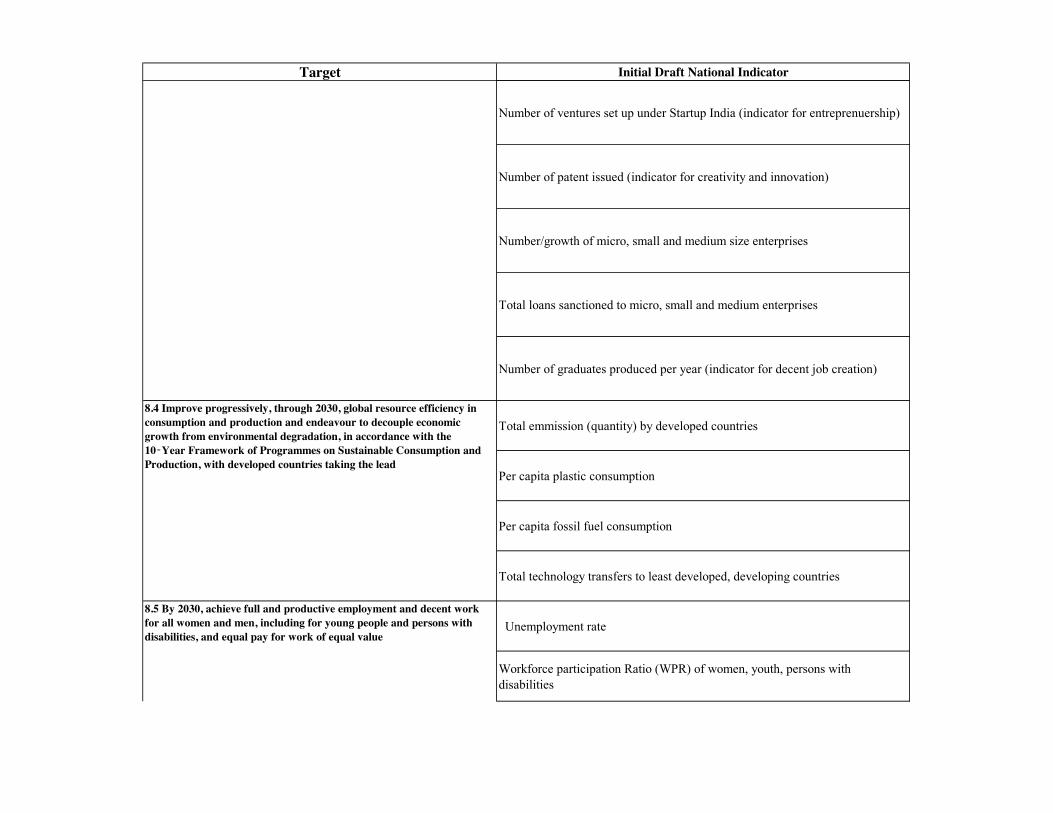
Target Initial Draft National Indicator
Number of ventures set up under Startup India (indicator for entreprenuership)
Number of patent issued (indicator for creativity and innovation)
Number/growth of micro, small and medium size enterprises
Total loans sanctioned to micro, small and medium enterprises
Number of graduates produced per year (indicator for decent job creation)
Total emmission (quantity) by developed countries
Per capita plastic consumption
Per capita fossil fuel consumption
Total technology transfers to least developed, developing countries
Unemployment rate
Workforce participation Ratio (WPR) of women, youth, persons with disabilities
8.3 Promote development-oriented policies that support productive activities, decent job creation, entrepreneurship, creativity and innovation, and encourage the formalization and growth of micro-, small- and medium-sized enterprises, including through access to financial services
8.4 Improve progressively, through 2030, global resource efficiency in consumption and production and endeavour to decouple economic growth from environmental degradation, in accordance with the 10‑Year Framework of Programmes on Sustainable Consumption and Production, with developed countries taking the lead
8.5 By 2030, achieve full and productive employment and decent work for all women and men, including for young people and persons with disabilities, and equal pay for work of equal value
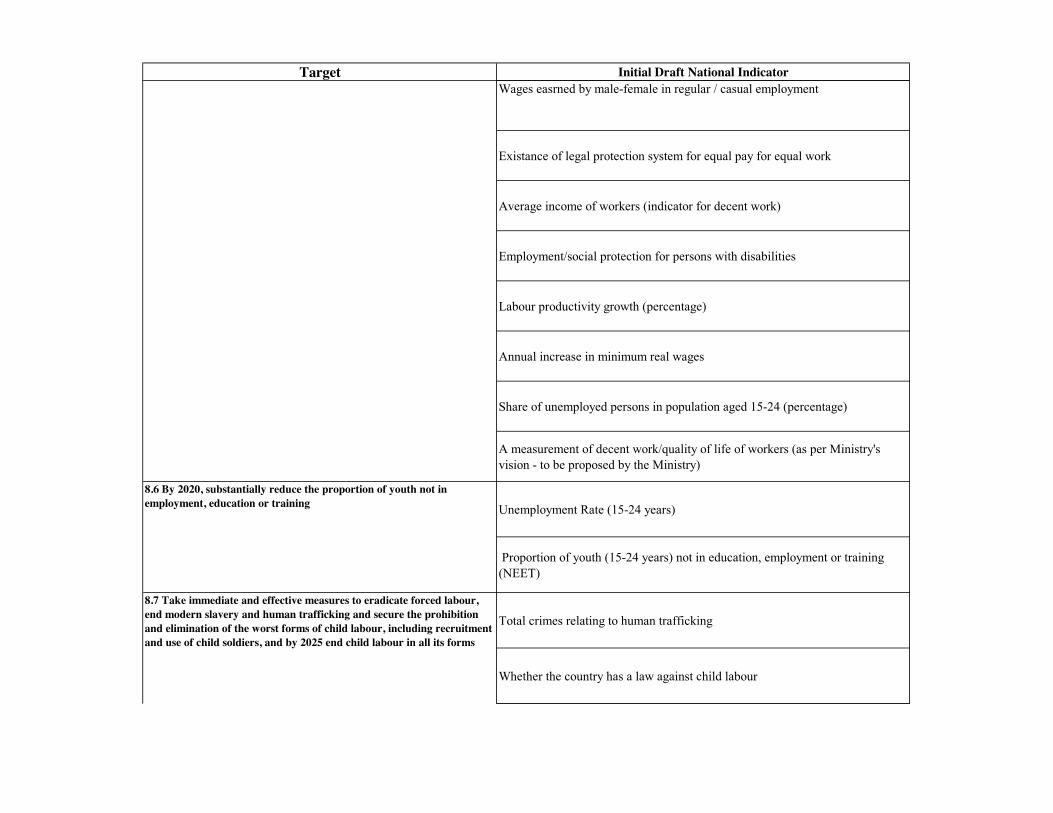
Target Initial Draft National IndicatorWages easrned by male-female in regular / casual employment
Existance of legal protection system for equal pay for equal work
Average income of workers (indicator for decent work)
Employment/social protection for persons with disabilities
Labour productivity growth (percentage)
Annual increase in minimum real wages
Share of unemployed persons in population aged 15-24 (percentage)
A measurement of decent work/quality of life of workers (as per Ministry's vision - to be proposed by the Ministry)
Unemployment Rate (15-24 years)
Proportion of youth (15-24 years) not in education, employment or training (NEET)
Total crimes relating to human trafficking
Whether the country has a law against child labour
8.5 By 2030, achieve full and productive employment and decent work for all women and men, including for young people and persons with disabilities, and equal pay for work of equal value
8.6 By 2020, substantially reduce the proportion of youth not in employment, education or training
8.7 Take immediate and effective measures to eradicate forced labour, end modern slavery and human trafficking and secure the prohibition and elimination of the worst forms of child labour, including recruitment and use of child soldiers, and by 2025 end child labour in all its forms
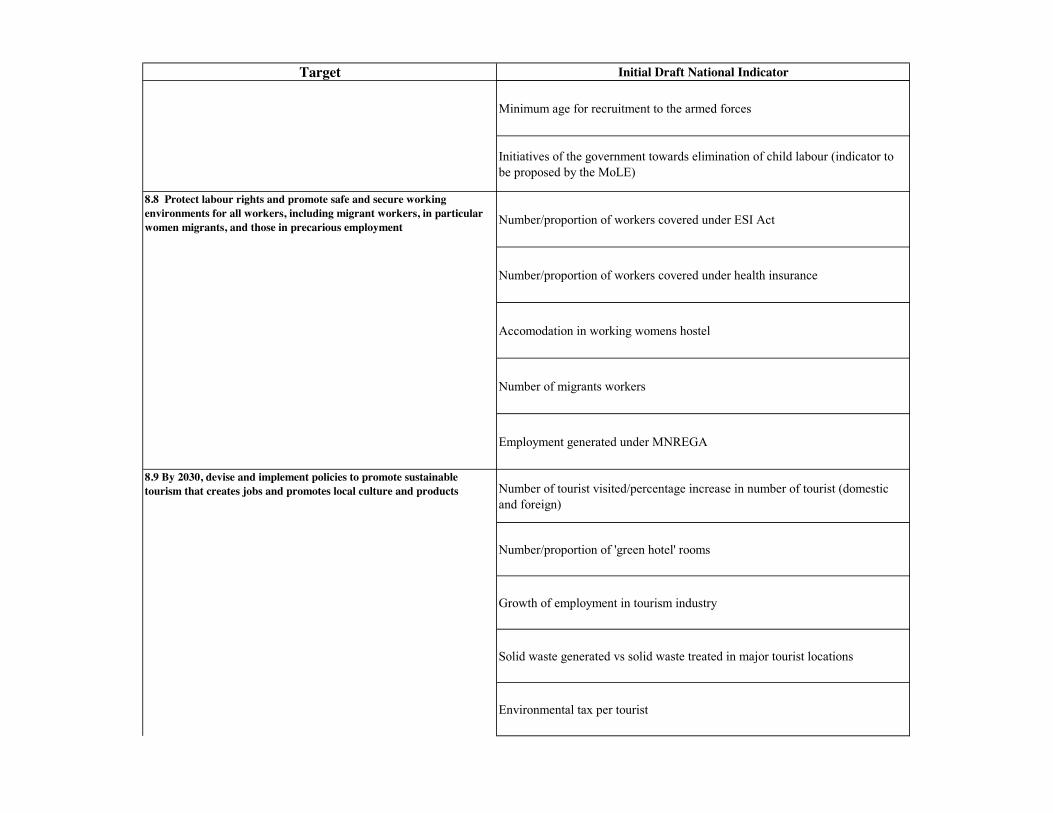
Target Initial Draft National Indicator
Minimum age for recruitment to the armed forces
Initiatives of the government towards elimination of child labour (indicator to be proposed by the MoLE)
Number/proportion of workers covered under ESI Act
Number/proportion of workers covered under health insurance
Accomodation in working womens hostel
Number of migrants workers
Employment generated under MNREGA
Number of tourist visited/percentage increase in number of tourist (domestic and foreign)
Number/proportion of 'green hotel' rooms
Growth of employment in tourism industry
Solid waste generated vs solid waste treated in major tourist locations
Environmental tax per tourist
8.7 Take immediate and effective measures to eradicate forced labour, end modern slavery and human trafficking and secure the prohibition and elimination of the worst forms of child labour, including recruitment and use of child soldiers, and by 2025 end child labour in all its forms
8.9 By 2030, devise and implement policies to promote sustainable tourism that creates jobs and promotes local culture and products
8.8 Protect labour rights and promote safe and secure working environments for all workers, including migrant workers, in particular women migrants, and those in precarious employment
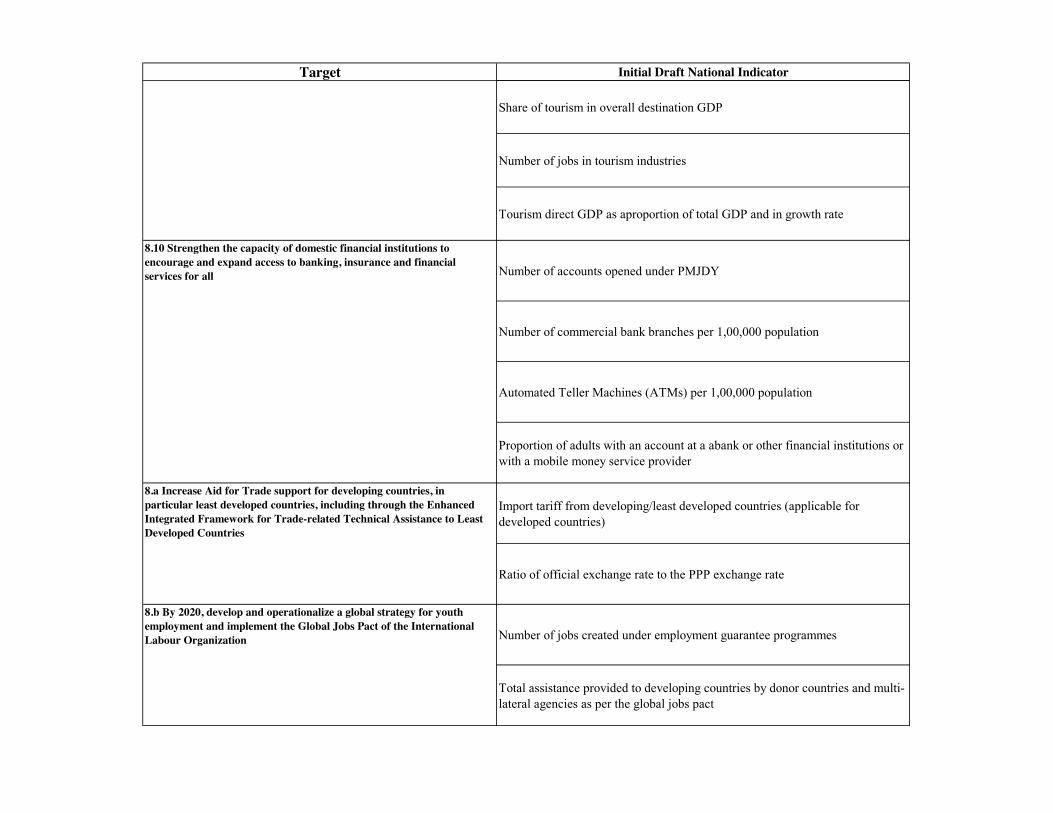
Target Initial Draft National Indicator
Share of tourism in overall destination GDP
Number of jobs in tourism industries
Tourism direct GDP as aproportion of total GDP and in growth rate
Number of accounts opened under PMJDY
Number of commercial bank branches per 1,00,000 population
Automated Teller Machines (ATMs) per 1,00,000 population
Proportion of adults with an account at a abank or other financial institutions or with a mobile money service provider
Import tariff from developing/least developed countries (applicable for developed countries)
Ratio of official exchange rate to the PPP exchange rate
Number of jobs created under employment guarantee programmes
Total assistance provided to developing countries by donor countries and multi-lateral agencies as per the global jobs pact
8.9 By 2030, devise and implement policies to promote sustainable tourism that creates jobs and promotes local culture and products
8.10 Strengthen the capacity of domestic financial institutions to encourage and expand access to banking, insurance and financial services for all
8.a Increase Aid for Trade support for developing countries, in particular least developed countries, including through the Enhanced Integrated Framework for Trade-related Technical Assistance to Least Developed Countries
8.b By 2020, develop and operationalize a global strategy for youth employment and implement the Global Jobs Pact of the International Labour Organization
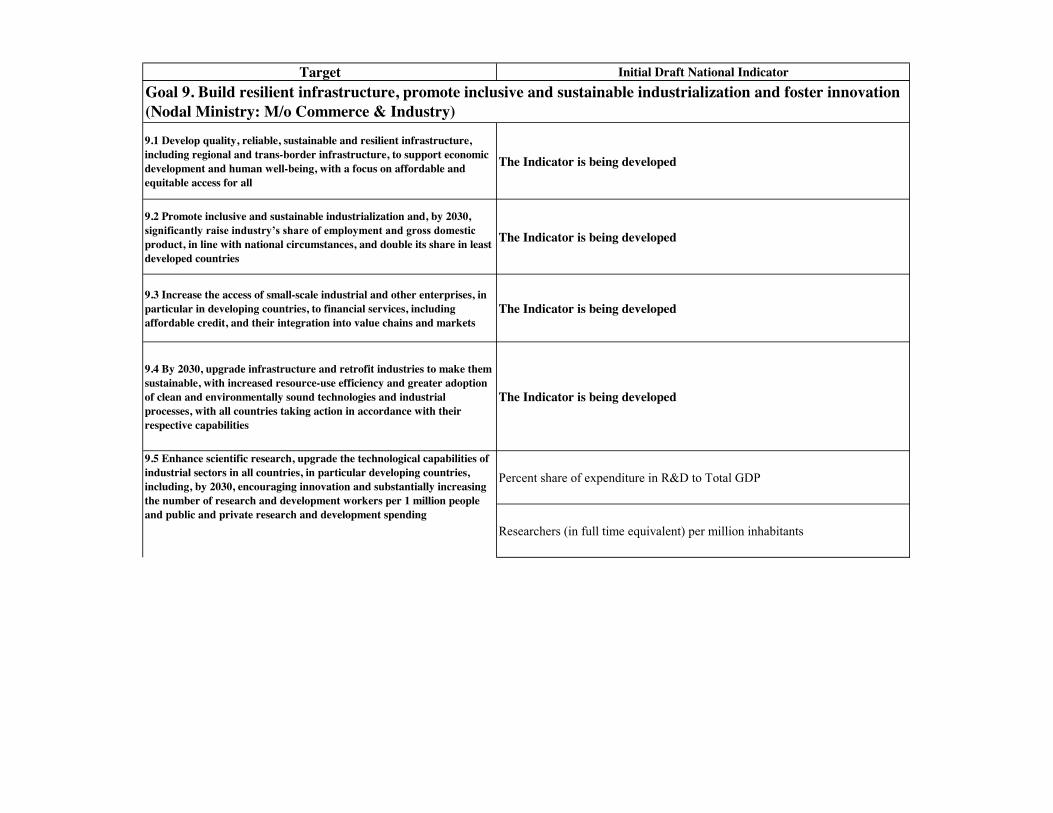
Target Initial Draft National Indicator
9.1 Develop quality, reliable, sustainable and resilient infrastructure, including regional and trans-border infrastructure, to support economic development and human well-being, with a focus on affordable and equitable access for all
The Indicator is being developed
9.2 Promote inclusive and sustainable industrialization and, by 2030, significantly raise industry’s share of employment and gross domestic product, in line with national circumstances, and double its share in least developed countries
The Indicator is being developed
9.3 Increase the access of small-scale industrial and other enterprises, in particular in developing countries, to financial services, including affordable credit, and their integration into value chains and markets
The Indicator is being developed
9.4 By 2030, upgrade infrastructure and retrofit industries to make them sustainable, with increased resource-use efficiency and greater adoption of clean and environmentally sound technologies and industrial processes, with all countries taking action in accordance with their respective capabilities
The Indicator is being developed
Percent share of expenditure in R&D to Total GDP
Researchers (in full time equivalent) per million inhabitants
9.5 Enhance scientific research, upgrade the technological capabilities of industrial sectors in all countries, in particular developing countries, including, by 2030, encouraging innovation and substantially increasing the number of research and development workers per 1 million people and public and private research and development spending
Goal 9. Build resilient infrastructure, promote inclusive and sustainable industrialization and foster innovation (Nodal Ministry: M/o Commerce & Industry)
Target Initial Draft National Indicator
Percentage share of private sector spending on R&D
9.a Facilitate sustainable and resilient infrastructure development in developing countries through enhanced financial, technological and technical support to African countries, least developed countries, landlocked developing countries and small island developing States
The Indicator is being developed
Proportion of medium and high-tech industry value added in total value added.
Percent share of expenditure in R&D to total GDP
Proportion of population covered by a mobile network, by technology
No. of Broadband Subscribers (In Million)
No. of Radio Stations (Public &Pvt.)
No. of TV Households
No. of Registered Newspapers
9.5 Enhance scientific research, upgrade the technological capabilities of industrial sectors in all countries, in particular developing countries, including, by 2030, encouraging innovation and substantially increasing the number of research and development workers per 1 million people and public and private research and development spending
9.b Support domestic technology development, research and innovation in developing countries, including by ensuring a conducive policy environment for, inter alia, industrial diversification and value addition to commodities
9.c Significantly increase access to information and communications technology and strive to provide universal and affordable access to the Internet in least developed countries by 2020
Target Initial Draft National Indicator
10.1 By 2030, progressively achieve and sustain income growth of the bottom 40 per cent of the population at a rate higher than the national average
The Indicator is being developed
10.2 By 2030, empower and promote the social, economic and political inclusion of all, irrespective of age, sex, disability, race, ethnicity, origin, religion or economic or other status
The Indicator is being developed
10.3 Ensure equal opportunity and reduce inequalities of outcome, including by eliminating discriminatory laws, policies and practices and promoting appropriate legislation, policies and action in this regard
The Indicator is being developed
10.4 Adopt policies, especially fiscal, wage and social protection policies, and progressively achieve greater equality The Indicator is being developed
10.5 Improve the regulation and monitoring of global financial markets and institutions and strengthen the implementation of such regulations The Indicator is being developed
10.6 Ensure enhanced representation and voice for developing countries in decision-making in global international economic and financial institutions in order to deliver more effective, credible, accountable and legitimate institutions
The Indicator is being developed
10.7 Facilitate orderly, safe, regular and responsible migration and mobility of people, including through the implementation of planned and well-managed migration policies
The Indicator is being developed
10.a Implement the principle of special and differential treatment for developing countries, in particular least developed countries, in accordance with World Trade Organization agreements
The Indicator is being developed
Goal 10. Reduce inequality within and among countries (Nodal Ministry: M/o Social Justice & Empowerment)
Target Initial Draft National Indicator
10.b Encourage official development assistance and financial flows, including foreign direct investment, to States where the need is greatest, in particular least developed countries, African countries, small island developing States and landlocked developing countries, in accordance with their national plans and programmes
The Indicator is being developed
10.c By 2030, reduce to less than 3 per cent the transaction costs of migrant remittances and eliminate remittance corridors with costs higher than 5 per cent
The Indicator is being developed
Proportion of urban population living in slums, informal settlements or inadequate housing
Proportion of population using an improved drinking water source
11.2 By 2030, provide access to safe, affordable, accessible and sustainable transport systems for all, improving road safety, notably by expanding public transport, with special attention to the needs of those in vulnerable situations, women, children, persons with disabilities and older persons
The Indicator is being developed
11.3 By 2030, enhance inclusive and sustainable urbanization and capacity for participatory, integrated and sustainable human settlement planning and management in all countries
The Indicator is being developed
11.4 Strengthen efforts to protect and safeguard the world’s cultural and natural heritage The Indicator is being developed
11.1 By 2030, ensure access for all to adequate, safe and affordable housing and basic services and upgrade slums
Goal 11. Make cities and human settlements inclusive, safe, resilient and sustainable (Nodal Ministry: M/o Urban Development)
Target Initial Draft National Indicator
11.5 By 2030, significantly reduce the number of deaths and the number of people affected and substantially decrease the direct economic losses relative to global gross domestic product caused by disasters, including water-related disasters, with a focus on protecting the poor and people in vulnerable situations
The Indicator is being developed
11.6 By 2030, reduce the adverse per capita environmental impact of cities, including by paying special attention to air quality and municipal and other waste management
The Indicator is being developed
11.7 By 2030, provide universal access to safe, inclusive and accessible, green and public spaces, in particular for women and children, older persons and persons with disabilities
The Indicator is being developed
11.a Support positive economic, social and environmental links between urban, peri-urban and rural areas by strengthening national and regional development planning
The Indicator is being developed
11.b By 2020, substantially increase the number of cities and human settlements adopting and implementing integrated policies and plans towards inclusion, resource efficiency, mitigation and adaptation to climate change, resilience to disasters, and develop and implement, in line with the Sendai Framework for Disaster Risk Reduction 2015-2030, holistic disaster risk management at all levels
The Indicator is being developed
11.c Support least developed countries, including through financial and technical assistance, in building sustainable and resilient buildings utilizing local materials
The Indicator is being developed
12.1 Implement the 10-Year Framework of Programmes on Sustainable Consumption and Production Patterns, all countries taking action, with developed countries taking the lead, taking into account the development and capabilities of developing countries
Formulation of national SCP framework and integration of SCP with national/state planning process
Goal 12. Ensure sustainable consumption and production patterns (Nodal Ministyr: M/o Environment Forest & Climate Change)
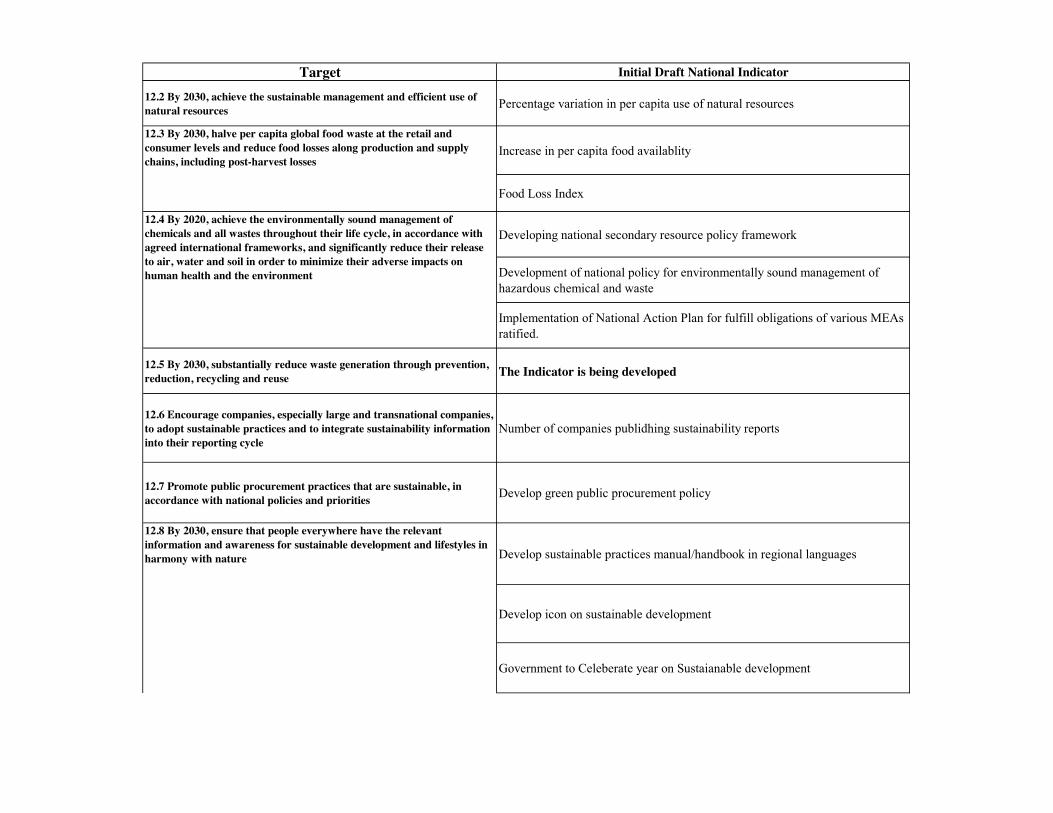
Target Initial Draft National Indicator
12.2 By 2030, achieve the sustainable management and efficient use of natural resources Percentage variation in per capita use of natural resources
Increase in per capita food availablity
Food Loss Index
Developing national secondary resource policy framework
Development of national policy for environmentally sound management of hazardous chemical and waste
Implementation of National Action Plan for fulfill obligations of various MEAs ratified.
12.5 By 2030, substantially reduce waste generation through prevention, reduction, recycling and reuse The Indicator is being developed
12.6 Encourage companies, especially large and transnational companies, to adopt sustainable practices and to integrate sustainability information into their reporting cycle
Number of companies publidhing sustainability reports
12.7 Promote public procurement practices that are sustainable, in accordance with national policies and priorities Develop green public procurement policy
Develop sustainable practices manual/handbook in regional languages
Develop icon on sustainable development
Government to Celeberate year on Sustaianable development
12.4 By 2020, achieve the environmentally sound management of chemicals and all wastes throughout their life cycle, in accordance with agreed international frameworks, and significantly reduce their release to air, water and soil in order to minimize their adverse impacts on human health and the environment
12.3 By 2030, halve per capita global food waste at the retail and consumer levels and reduce food losses along production and supply chains, including post-harvest losses
12.8 By 2030, ensure that people everywhere have the relevant information and awareness for sustainable development and lifestyles in harmony with nature
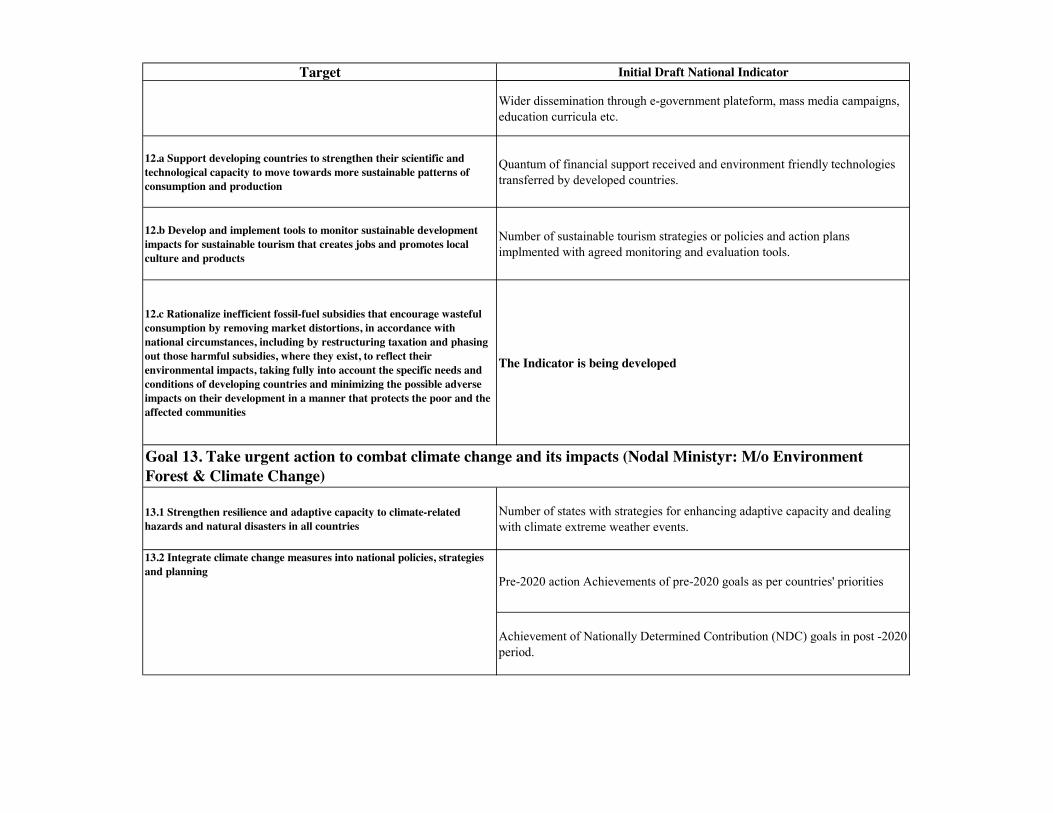
Target Initial Draft National Indicator
Wider dissemination through e-government plateform, mass media campaigns, education curricula etc.
12.a Support developing countries to strengthen their scientific and technological capacity to move towards more sustainable patterns of consumption and production
Quantum of financial support received and environment friendly technologies transferred by developed countries.
12.b Develop and implement tools to monitor sustainable development impacts for sustainable tourism that creates jobs and promotes local culture and products
Number of sustainable tourism strategies or policies and action plans implmented with agreed monitoring and evaluation tools.
12.c Rationalize inefficient fossil-fuel subsidies that encourage wasteful consumption by removing market distortions, in accordance with national circumstances, including by restructuring taxation and phasing out those harmful subsidies, where they exist, to reflect their environmental impacts, taking fully into account the specific needs and conditions of developing countries and minimizing the possible adverse impacts on their development in a manner that protects the poor and the affected communities
The Indicator is being developed
13.1 Strengthen resilience and adaptive capacity to climate-related hazards and natural disasters in all countries
Number of states with strategies for enhancing adaptive capacity and dealing with climate extreme weather events.
Pre-2020 action Achievements of pre-2020 goals as per countries' priorities
Achievement of Nationally Determined Contribution (NDC) goals in post -2020 period.
12.8 By 2030, ensure that people everywhere have the relevant information and awareness for sustainable development and lifestyles in harmony with nature
13.2 Integrate climate change measures into national policies, strategies and planning
Goal 13. Take urgent action to combat climate change and its impacts (Nodal Ministyr: M/o Environment Forest & Climate Change)
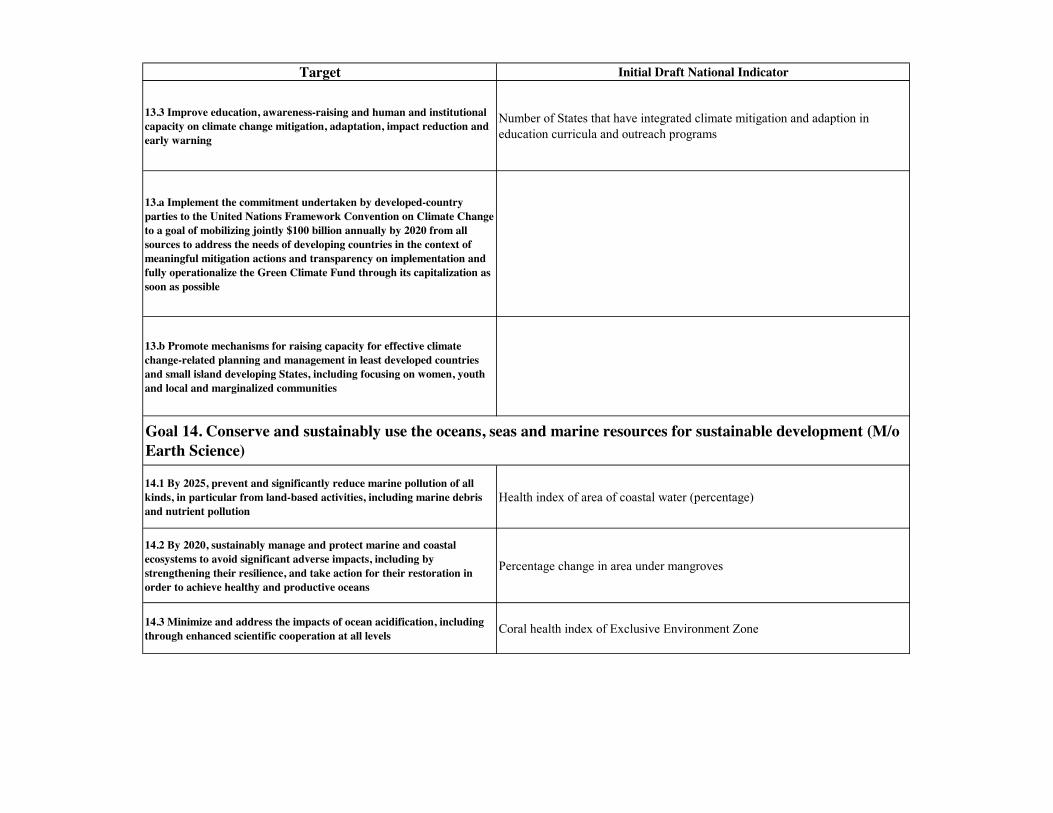
Target Initial Draft National Indicator
13.3 Improve education, awareness-raising and human and institutional capacity on climate change mitigation, adaptation, impact reduction and early warning
Number of States that have integrated climate mitigation and adaption in education curricula and outreach programs
13.a Implement the commitment undertaken by developed-country parties to the United Nations Framework Convention on Climate Change to a goal of mobilizing jointly $100 billion annually by 2020 from all sources to address the needs of developing countries in the context of meaningful mitigation actions and transparency on implementation and fully operationalize the Green Climate Fund through its capitalization as soon as possible
13.b Promote mechanisms for raising capacity for effective climate change-related planning and management in least developed countries and small island developing States, including focusing on women, youth and local and marginalized communities
14.1 By 2025, prevent and significantly reduce marine pollution of all kinds, in particular from land-based activities, including marine debris and nutrient pollution
Health index of area of coastal water (percentage)
14.2 By 2020, sustainably manage and protect marine and coastal ecosystems to avoid significant adverse impacts, including by strengthening their resilience, and take action for their restoration in order to achieve healthy and productive oceans
Percentage change in area under mangroves
14.3 Minimize and address the impacts of ocean acidification, including through enhanced scientific cooperation at all levels Coral health index of Exclusive Environment Zone
Goal 14. Conserve and sustainably use the oceans, seas and marine resources for sustainable development (M/o Earth Science)
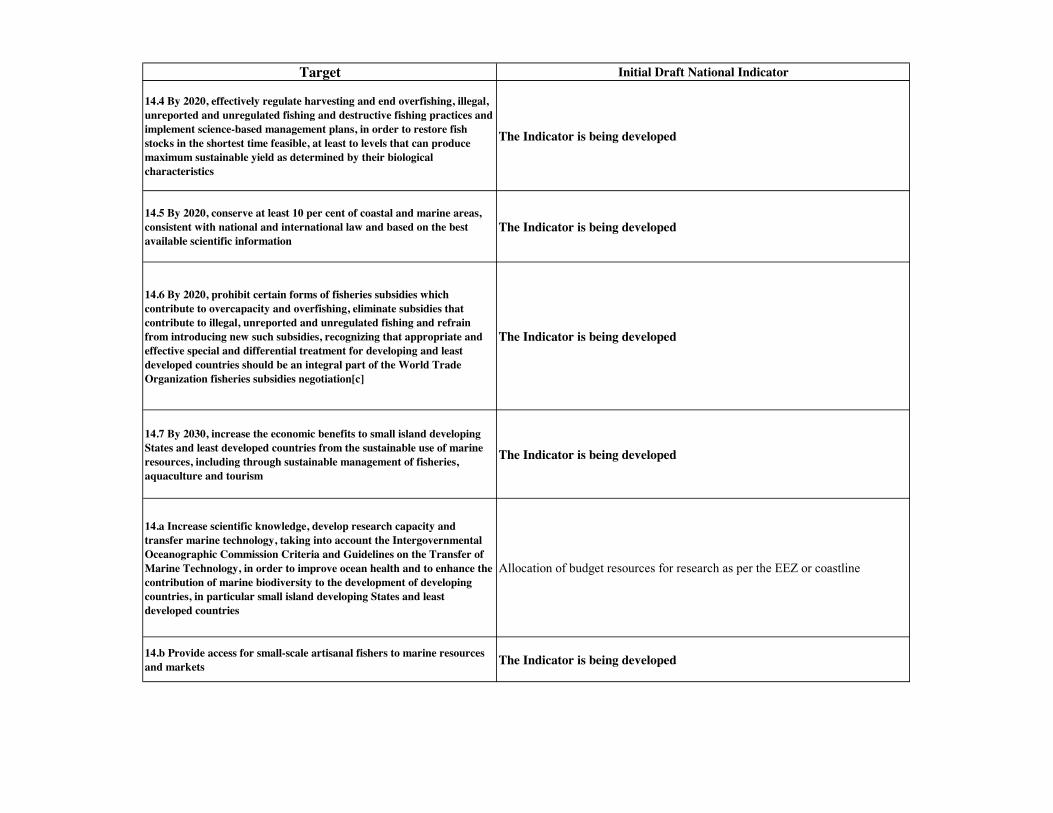
Target Initial Draft National Indicator
14.4 By 2020, effectively regulate harvesting and end overfishing, illegal, unreported and unregulated fishing and destructive fishing practices and implement science-based management plans, in order to restore fish stocks in the shortest time feasible, at least to levels that can produce maximum sustainable yield as determined by their biological characteristics
The Indicator is being developed
14.5 By 2020, conserve at least 10 per cent of coastal and marine areas, consistent with national and international law and based on the best available scientific information
The Indicator is being developed
14.6 By 2020, prohibit certain forms of fisheries subsidies which contribute to overcapacity and overfishing, eliminate subsidies that contribute to illegal, unreported and unregulated fishing and refrain from introducing new such subsidies, recognizing that appropriate and effective special and differential treatment for developing and least developed countries should be an integral part of the World Trade Organization fisheries subsidies negotiation[c]
The Indicator is being developed
14.7 By 2030, increase the economic benefits to small island developing States and least developed countries from the sustainable use of marine resources, including through sustainable management of fisheries, aquaculture and tourism
The Indicator is being developed
14.a Increase scientific knowledge, develop research capacity and transfer marine technology, taking into account the Intergovernmental Oceanographic Commission Criteria and Guidelines on the Transfer of Marine Technology, in order to improve ocean health and to enhance the contribution of marine biodiversity to the development of developing countries, in particular small island developing States and least developed countries
Allocation of budget resources for research as per the EEZ or coastline
14.b Provide access for small-scale artisanal fishers to marine resources and markets The Indicator is being developed
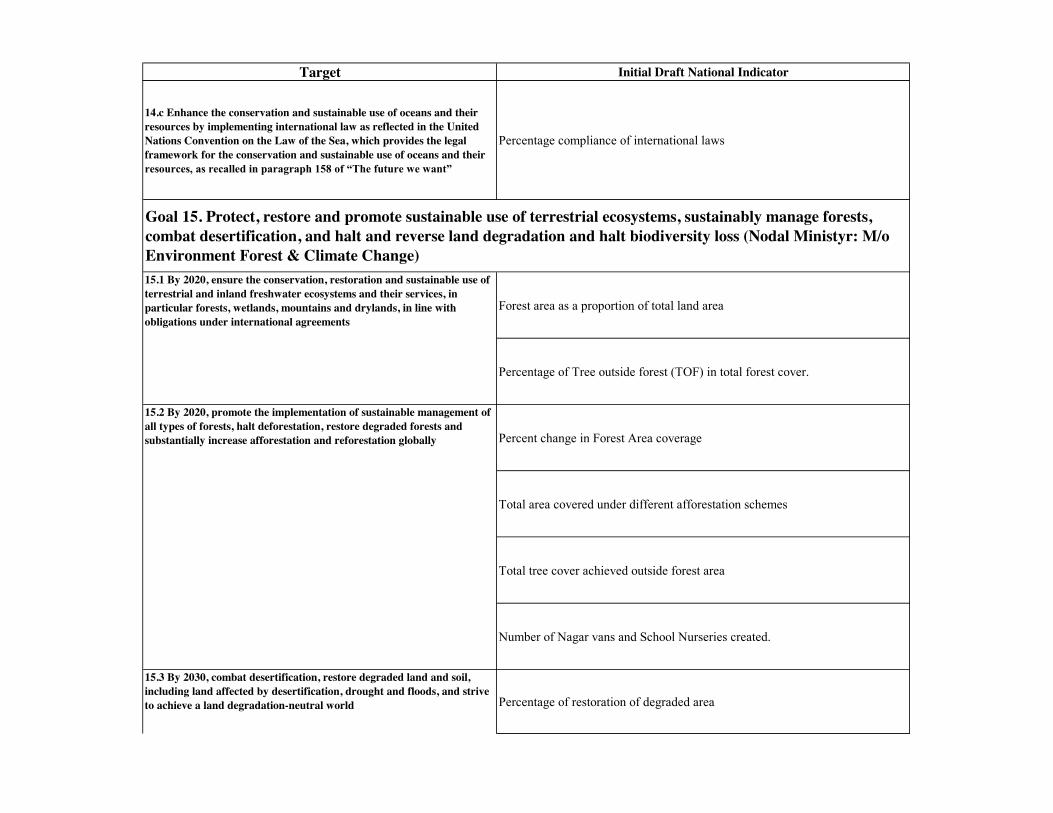
Target Initial Draft National Indicator
14.c Enhance the conservation and sustainable use of oceans and their resources by implementing international law as reflected in the United Nations Convention on the Law of the Sea, which provides the legal framework for the conservation and sustainable use of oceans and their resources, as recalled in paragraph 158 of “The future we want”
Percentage compliance of international laws
Forest area as a proportion of total land area
Percentage of Tree outside forest (TOF) in total forest cover.
Percent change in Forest Area coverage
Total area covered under different afforestation schemes
Total tree cover achieved outside forest area
Number of Nagar vans and School Nurseries created.
Percentage of restoration of degraded area
15.3 By 2030, combat desertification, restore degraded land and soil, including land affected by desertification, drought and floods, and strive to achieve a land degradation-neutral world
15.1 By 2020, ensure the conservation, restoration and sustainable use of terrestrial and inland freshwater ecosystems and their services, in particular forests, wetlands, mountains and drylands, in line with obligations under international agreements
Goal 15. Protect, restore and promote sustainable use of terrestrial ecosystems, sustainably manage forests, combat desertification, and halt and reverse land degradation and halt biodiversity loss (Nodal Ministyr: M/o Environment Forest & Climate Change)
15.2 By 2020, promote the implementation of sustainable management of all types of forests, halt deforestation, restore degraded forests and substantially increase afforestation and reforestation globally

Target Initial Draft National Indicator
Increasing Tree / forest cover in degraded area
Percentage of net sown area increased.
Increase in forest / vegetative cover in mountain areas
Restoration of waterbodies / streama in mountain areas
Conservation of local wildlife species
Improvement of local livelihoods
Increase in per capita income of mountain dwellers
15.3 By 2030, combat desertification, restore degraded land and soil, including land affected by desertification, drought and floods, and strive to achieve a land degradation-neutral world
15.4 By 2030, ensure the conservation of mountain ecosystems, including their biodiversity, in order to enhance their capacity to provide benefits that are essential for sustainable development
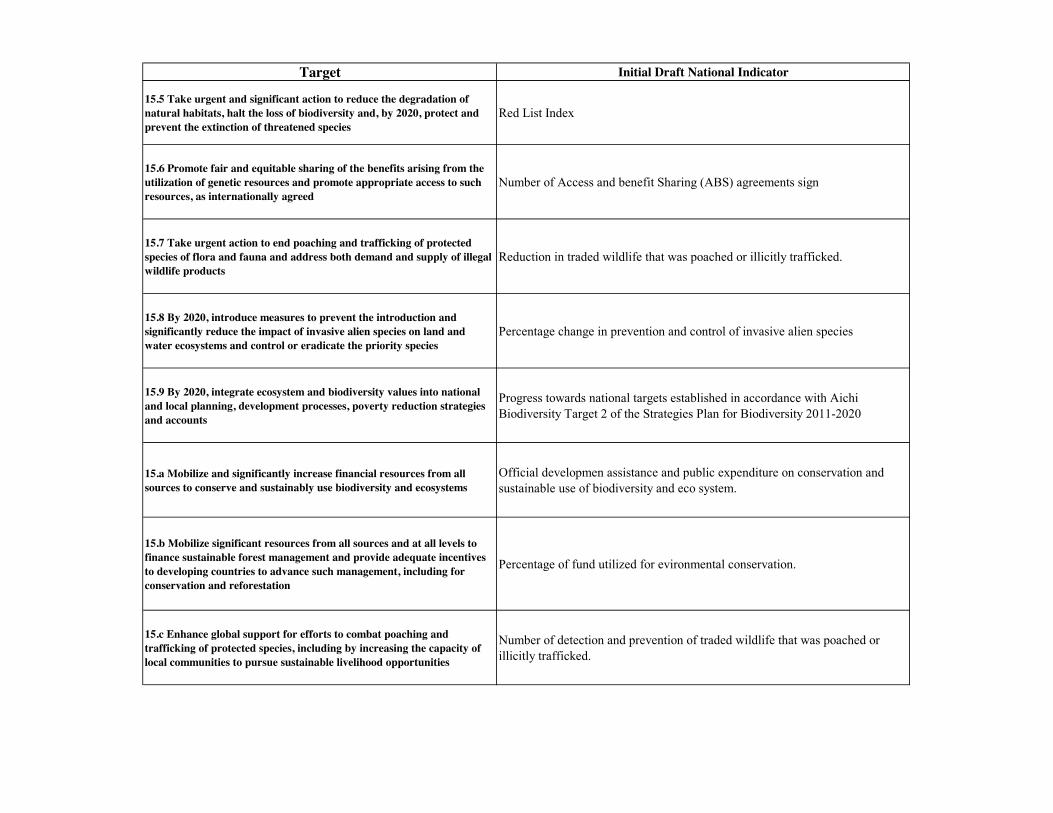
Target Initial Draft National Indicator
15.5 Take urgent and significant action to reduce the degradation of natural habitats, halt the loss of biodiversity and, by 2020, protect and prevent the extinction of threatened species
Red List Index
15.6 Promote fair and equitable sharing of the benefits arising from the utilization of genetic resources and promote appropriate access to such resources, as internationally agreed
Number of Access and benefit Sharing (ABS) agreements sign
15.7 Take urgent action to end poaching and trafficking of protected species of flora and fauna and address both demand and supply of illegal wildlife products
Reduction in traded wildlife that was poached or illicitly trafficked.
15.8 By 2020, introduce measures to prevent the introduction and significantly reduce the impact of invasive alien species on land and water ecosystems and control or eradicate the priority species
Percentage change in prevention and control of invasive alien species
15.9 By 2020, integrate ecosystem and biodiversity values into national and local planning, development processes, poverty reduction strategies and accounts
Progress towards national targets established in accordance with Aichi Biodiversity Target 2 of the Strategies Plan for Biodiversity 2011-2020
15.a Mobilize and significantly increase financial resources from all sources to conserve and sustainably use biodiversity and ecosystems
Official developmen assistance and public expenditure on conservation and sustainable use of biodiversity and eco system.
15.b Mobilize significant resources from all sources and at all levels to finance sustainable forest management and provide adequate incentives to developing countries to advance such management, including for conservation and reforestation
Percentage of fund utilized for evironmental conservation.
15.c Enhance global support for efforts to combat poaching and trafficking of protected species, including by increasing the capacity of local communities to pursue sustainable livelihood opportunities
Number of detection and prevention of traded wildlife that was poached or illicitly trafficked.
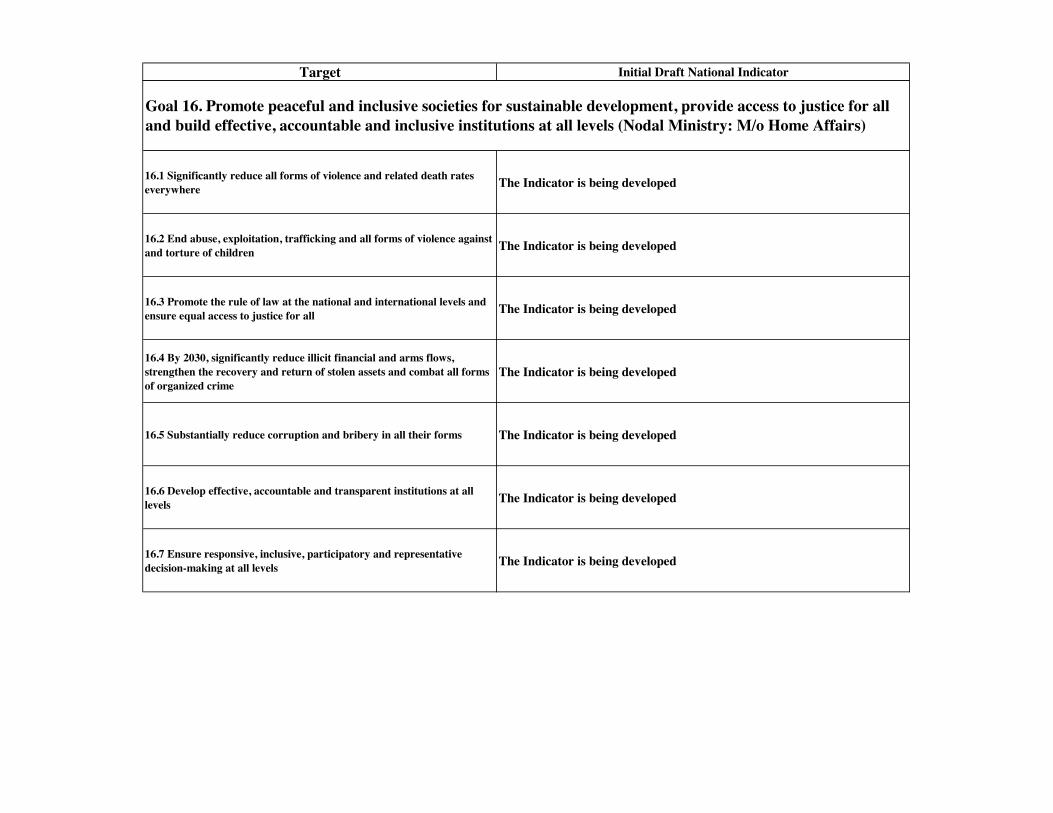
Target Initial Draft National Indicator
16.1 Significantly reduce all forms of violence and related death rates everywhere The Indicator is being developed
16.2 End abuse, exploitation, trafficking and all forms of violence against and torture of children The Indicator is being developed
16.3 Promote the rule of law at the national and international levels and ensure equal access to justice for all The Indicator is being developed
16.4 By 2030, significantly reduce illicit financial and arms flows, strengthen the recovery and return of stolen assets and combat all forms of organized crime
The Indicator is being developed
16.5 Substantially reduce corruption and bribery in all their forms The Indicator is being developed
16.6 Develop effective, accountable and transparent institutions at all levels The Indicator is being developed
16.7 Ensure responsive, inclusive, participatory and representative decision-making at all levels The Indicator is being developed
Goal 16. Promote peaceful and inclusive societies for sustainable development, provide access to justice for all and build effective, accountable and inclusive institutions at all levels (Nodal Ministry: M/o Home Affairs)
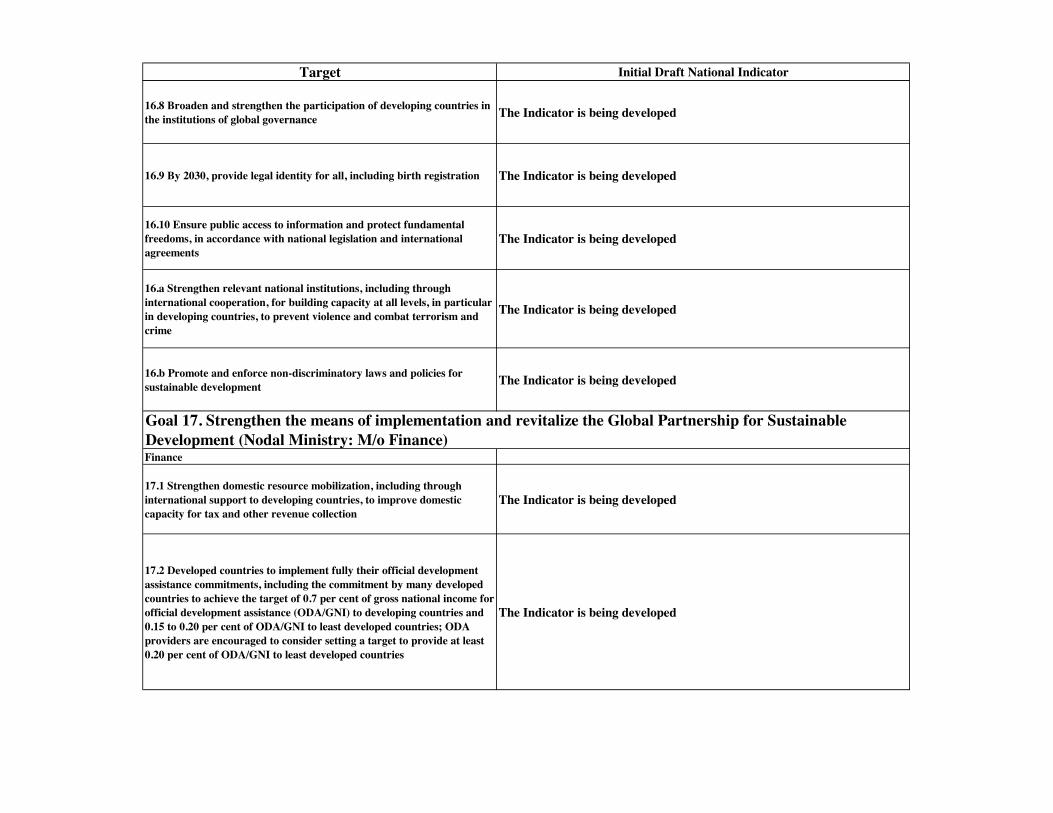
Target Initial Draft National Indicator
16.8 Broaden and strengthen the participation of developing countries in the institutions of global governance The Indicator is being developed
16.9 By 2030, provide legal identity for all, including birth registration The Indicator is being developed
16.10 Ensure public access to information and protect fundamental freedoms, in accordance with national legislation and international agreements
The Indicator is being developed
16.a Strengthen relevant national institutions, including through international cooperation, for building capacity at all levels, in particular in developing countries, to prevent violence and combat terrorism and crime
The Indicator is being developed
16.b Promote and enforce non-discriminatory laws and policies for sustainable development The Indicator is being developed
Finance
17.1 Strengthen domestic resource mobilization, including through international support to developing countries, to improve domestic capacity for tax and other revenue collection
The Indicator is being developed
17.2 Developed countries to implement fully their official development assistance commitments, including the commitment by many developed countries to achieve the target of 0.7 per cent of gross national income for official development assistance (ODA/GNI) to developing countries and 0.15 to 0.20 per cent of ODA/GNI to least developed countries; ODA providers are encouraged to consider setting a target to provide at least 0.20 per cent of ODA/GNI to least developed countries
The Indicator is being developed
Goal 17. Strengthen the means of implementation and revitalize the Global Partnership for Sustainable Development (Nodal Ministry: M/o Finance)
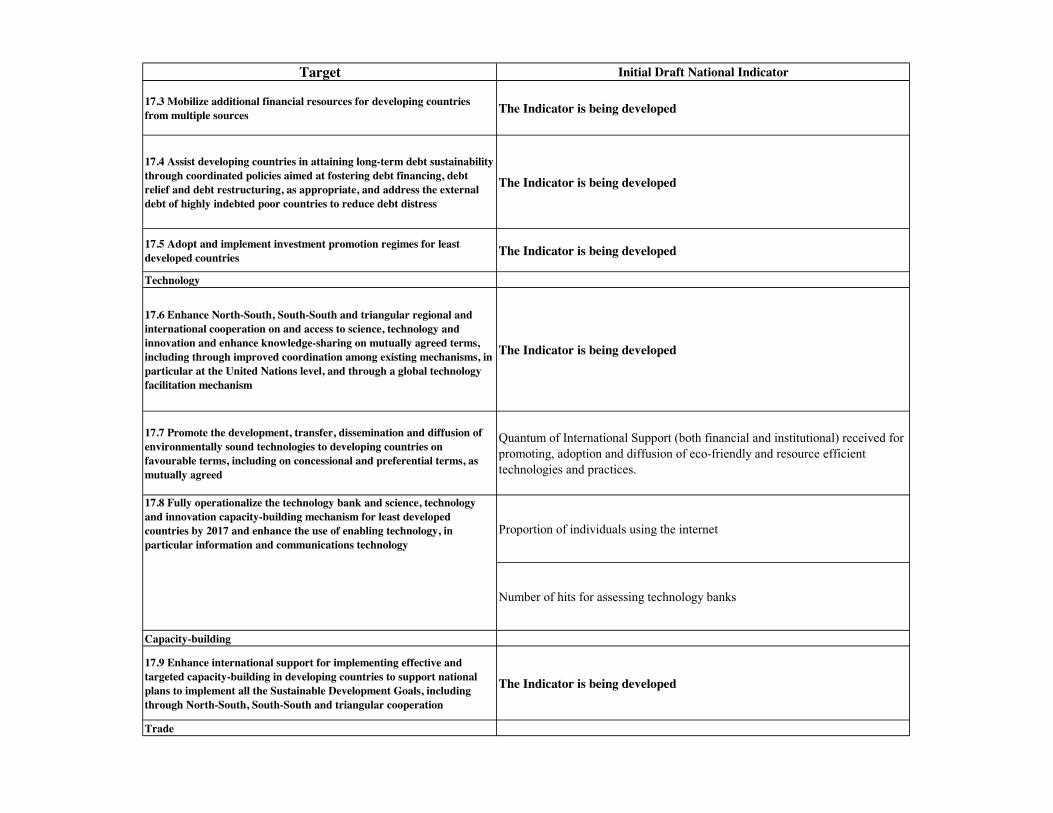
Target Initial Draft National Indicator
17.3 Mobilize additional financial resources for developing countries from multiple sources The Indicator is being developed
17.4 Assist developing countries in attaining long-term debt sustainability through coordinated policies aimed at fostering debt financing, debt relief and debt restructuring, as appropriate, and address the external debt of highly indebted poor countries to reduce debt distress
The Indicator is being developed
17.5 Adopt and implement investment promotion regimes for least developed countries The Indicator is being developed
Technology
17.6 Enhance North-South, South-South and triangular regional and international cooperation on and access to science, technology and innovation and enhance knowledge-sharing on mutually agreed terms, including through improved coordination among existing mechanisms, in particular at the United Nations level, and through a global technology facilitation mechanism
The Indicator is being developed
17.7 Promote the development, transfer, dissemination and diffusion of environmentally sound technologies to developing countries on favourable terms, including on concessional and preferential terms, as mutually agreed
Quantum of International Support (both financial and institutional) received for promoting, adoption and diffusion of eco-friendly and resource efficient technologies and practices.
Proportion of individuals using the internet
Number of hits for assessing technology banks
Capacity-building
17.9 Enhance international support for implementing effective and targeted capacity-building in developing countries to support national plans to implement all the Sustainable Development Goals, including through North-South, South-South and triangular cooperation
The Indicator is being developed
Trade
17.8 Fully operationalize the technology bank and science, technology and innovation capacity-building mechanism for least developed countries by 2017 and enhance the use of enabling technology, in particular information and communications technology
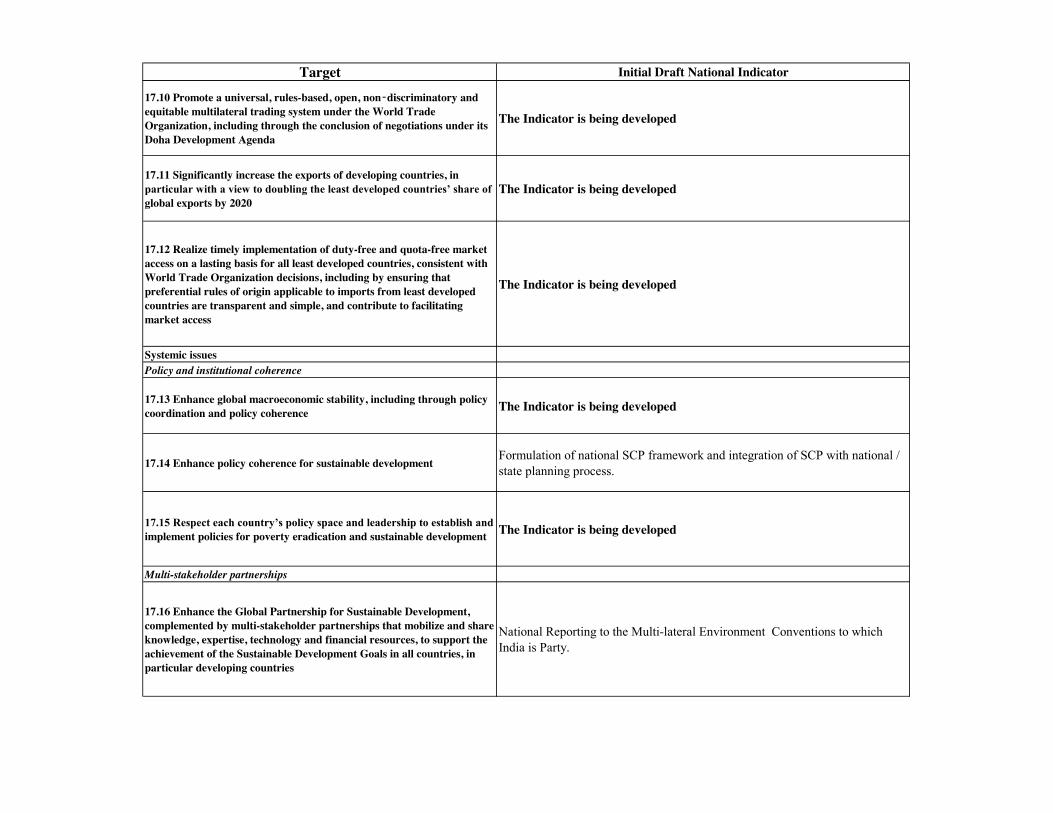
Target Initial Draft National Indicator
17.10 Promote a universal, rules-based, open, non‑discriminatory and equitable multilateral trading system under the World Trade Organization, including through the conclusion of negotiations under its Doha Development Agenda
The Indicator is being developed
17.11 Significantly increase the exports of developing countries, in particular with a view to doubling the least developed countries’ share of global exports by 2020
The Indicator is being developed
17.12 Realize timely implementation of duty-free and quota-free market access on a lasting basis for all least developed countries, consistent with World Trade Organization decisions, including by ensuring that preferential rules of origin applicable to imports from least developed countries are transparent and simple, and contribute to facilitating market access
The Indicator is being developed
Systemic issuesPolicy and institutional coherence
17.13 Enhance global macroeconomic stability, including through policy coordination and policy coherence The Indicator is being developed
17.14 Enhance policy coherence for sustainable developmentFormulation of national SCP framework and integration of SCP with national / state planning process.
17.15 Respect each country’s policy space and leadership to establish and implement policies for poverty eradication and sustainable development The Indicator is being developed
Multi-stakeholder partnerships
17.16 Enhance the Global Partnership for Sustainable Development, complemented by multi-stakeholder partnerships that mobilize and share knowledge, expertise, technology and financial resources, to support the achievement of the Sustainable Development Goals in all countries, in particular developing countries
National Reporting to the Multi-lateral Environment Conventions to which India is Party.
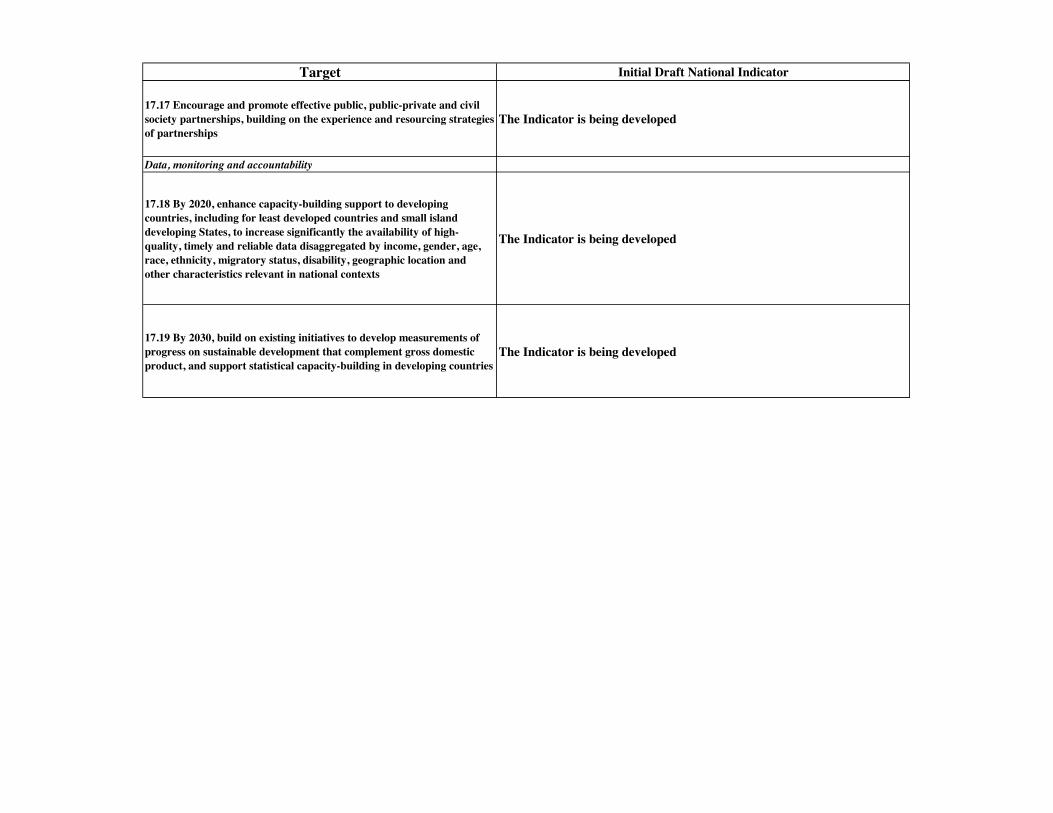
Target Initial Draft National Indicator
17.17 Encourage and promote effective public, public-private and civil society partnerships, building on the experience and resourcing strategies of partnerships
The Indicator is being developed
Data, monitoring and accountability
17.18 By 2020, enhance capacity-building support to developing countries, including for least developed countries and small island developing States, to increase significantly the availability of high-quality, timely and reliable data disaggregated by income, gender, age, race, ethnicity, migratory status, disability, geographic location and other characteristics relevant in national contexts
The Indicator is being developed
17.19 By 2030, build on existing initiatives to develop measurements of progress on sustainable development that complement gross domestic product, and support statistical capacity-building in developing countries
The Indicator is being developed
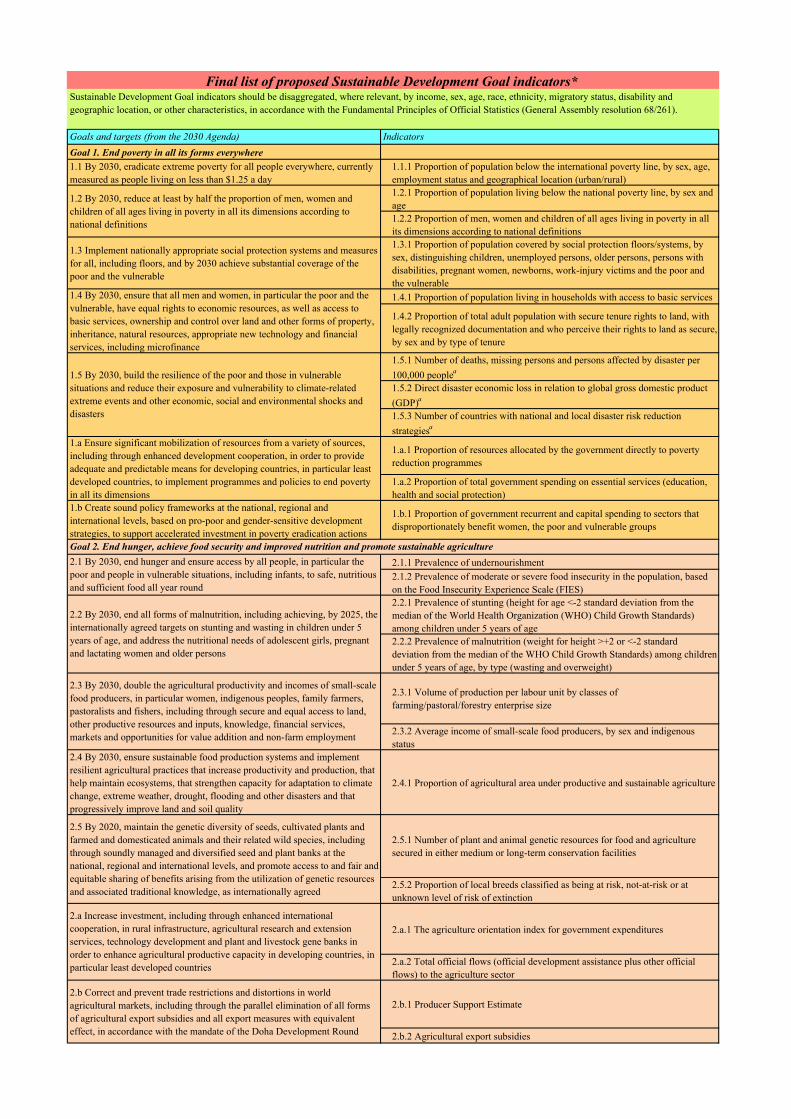
Goals and targets (from the 2030 Agenda) Indicators
Goal 1. End poverty in all its forms everywhere1.1 By 2030, eradicate extreme poverty for all people everywhere, currently measured as people living on less than $1.25 a day
1.1.1 Proportion of population below the international poverty line, by sex, age, employment status and geographical location (urban/rural)1.2.1 Proportion of population living below the national poverty line, by sex and age1.2.2 Proportion of men, women and children of all ages living in poverty in all its dimensions according to national definitions
1.3 Implement nationally appropriate social protection systems and measures for all, including floors, and by 2030 achieve substantial coverage of the poor and the vulnerable
1.3.1 Proportion of population covered by social protection floors/systems, by sex, distinguishing children, unemployed persons, older persons, persons with disabilities, pregnant women, newborns, work-injury victims and the poor and the vulnerable1.4.1 Proportion of population living in households with access to basic services
1.4.2 Proportion of total adult population with secure tenure rights to land, with legally recognized documentation and who perceive their rights to land as secure, by sex and by type of tenure
1.5.1 Number of deaths, missing persons and persons affected by disaster per 100,000 peoplea
1.5.2 Direct disaster economic loss in relation to global gross domestic product (GDP)a
1.5.3 Number of countries with national and local disaster risk reduction strategiesa
1.a.1 Proportion of resources allocated by the government directly to poverty reduction programmes
1.a.2 Proportion of total government spending on essential services (education, health and social protection)
1.b Create sound policy frameworks at the national, regional and international levels, based on pro-poor and gender-sensitive development strategies, to support accelerated investment in poverty eradication actions
1.b.1 Proportion of government recurrent and capital spending to sectors that disproportionately benefit women, the poor and vulnerable groups
2.1.1 Prevalence of undernourishment2.1.2 Prevalence of moderate or severe food insecurity in the population, based on the Food Insecurity Experience Scale (FIES)2.2.1 Prevalence of stunting (height for age <-2 standard deviation from the median of the World Health Organization (WHO) Child Growth Standards) among children under 5 years of age2.2.2 Prevalence of malnutrition (weight for height >+2 or <-2 standard deviation from the median of the WHO Child Growth Standards) among children under 5 years of age, by type (wasting and overweight)
2.3.1 Volume of production per labour unit by classes of farming/pastoral/forestry enterprise size
2.3.2 Average income of small-scale food producers, by sex and indigenous status
2.4 By 2030, ensure sustainable food production systems and implement resilient agricultural practices that increase productivity and production, that help maintain ecosystems, that strengthen capacity for adaptation to climate change, extreme weather, drought, flooding and other disasters and that progressively improve land and soil quality
2.4.1 Proportion of agricultural area under productive and sustainable agriculture
2.5.1 Number of plant and animal genetic resources for food and agriculture secured in either medium or long-term conservation facilities
2.5.2 Proportion of local breeds classified as being at risk, not-at-risk or at unknown level of risk of extinction
2.a.1 The agriculture orientation index for government expenditures
2.a.2 Total official flows (official development assistance plus other official flows) to the agriculture sector
2.b.1 Producer Support Estimate
2.b.2 Agricultural export subsidies
Final list of proposed Sustainable Development Goal indicators* Sustainable Development Goal indicators should be disaggregated, where relevant, by income, sex, age, race, ethnicity, migratory status, disability and geographic location, or other characteristics, in accordance with the Fundamental Principles of Official Statistics (General Assembly resolution 68/261).
1.2 By 2030, reduce at least by half the proportion of men, women and children of all ages living in poverty in all its dimensions according to national definitions
1.4 By 2030, ensure that all men and women, in particular the poor and the vulnerable, have equal rights to economic resources, as well as access to basic services, ownership and control over land and other forms of property, inheritance, natural resources, appropriate new technology and financial services, including microfinance
1.5 By 2030, build the resilience of the poor and those in vulnerable situations and reduce their exposure and vulnerability to climate-related extreme events and other economic, social and environmental shocks and disasters
1.a Ensure significant mobilization of resources from a variety of sources, including through enhanced development cooperation, in order to provide adequate and predictable means for developing countries, in particular least developed countries, to implement programmes and policies to end poverty in all its dimensions
Goal 2. End hunger, achieve food security and improved nutrition and promote sustainable agriculture2.1 By 2030, end hunger and ensure access by all people, in particular the poor and people in vulnerable situations, including infants, to safe, nutritious and sufficient food all year round
2.2 By 2030, end all forms of malnutrition, including achieving, by 2025, the internationally agreed targets on stunting and wasting in children under 5 years of age, and address the nutritional needs of adolescent girls, pregnant and lactating women and older persons
2.3 By 2030, double the agricultural productivity and incomes of small-scale food producers, in particular women, indigenous peoples, family farmers, pastoralists and fishers, including through secure and equal access to land, other productive resources and inputs, knowledge, financial services, markets and opportunities for value addition and non-farm employment
2.5 By 2020, maintain the genetic diversity of seeds, cultivated plants and farmed and domesticated animals and their related wild species, including through soundly managed and diversified seed and plant banks at the national, regional and international levels, and promote access to and fair and equitable sharing of benefits arising from the utilization of genetic resources and associated traditional knowledge, as internationally agreed
2.a Increase investment, including through enhanced international cooperation, in rural infrastructure, agricultural research and extension services, technology development and plant and livestock gene banks in order to enhance agricultural productive capacity in developing countries, in particular least developed countries
2.b Correct and prevent trade restrictions and distortions in world agricultural markets, including through the parallel elimination of all forms of agricultural export subsidies and all export measures with equivalent effect, in accordance with the mandate of the Doha Development Round
2.c Adopt measures to ensure the proper functioning of food commodity markets and their derivatives and facilitate timely access to market information, including on food reserves, in order to help limit extreme food price volatility
2.c.1 Indicator of food price anomalies
3.1.1 Maternal mortality ratio3.1.2 Proportion of births attended by skilled health personnel
3.2.1 Under-five mortality rate
3.2.2 Neonatal mortality rate3.3.1 Number of new HIV infections per 1,000 uninfected population, by sex, age and key populations3.3.2 Tuberculosis incidence per 1,000 population3.3.3 Malaria incidence per 1,000 population3.3.4 Hepatitis B incidence per 100,000 population3.3.5 Number of people requiring interventions against neglected tropical diseases3.4.1 Mortality rate attributed to cardiovascular disease, cancer, diabetes or chronic respiratory disease3.4.2 Suicide mortality rate3.5.1 Coverage of treatment interventions (pharmacological, psychosocial and rehabilitation and aftercare services) for substance use disorders3.5.2 Harmful use of alcohol, defined according to the national context as alcohol per capita consumption (aged 15 years and older) within a calendar year in litres of pure alcohol
3.6 By 2020, halve the number of global deaths and injuries from road traffic accidents
3.6.1 Death rate due to road traffic injuries
3.7.1 Proportion of women of reproductive age (aged 15-49 years) who have their need for family planning satisfied with modern methods3.7.2 Adolescent birth rate (aged 10-14 years; aged 15-19 years) per 1,000 women in that age group3.8.1 Coverage of essential health services (defined as the average coverage of essential services based on tracer interventions that include reproductive, maternal, newborn and child health, infectious diseases, non-communicable diseases and service capacity and access, among the general and the most disadvantaged population)3.8.2 Number of people covered by health insurance or a public health system per 1,000 population3.9.1 Mortality rate attributed to household and ambient air pollution3.9.2 Mortality rate attributed to unsafe water, unsafe sanitation and lack of hygiene (exposure to unsafe Water, Sanitation and Hygiene for All (WASH) services)3.9.3 Mortality rate attributed to unintentional poisoning
3.a Strengthen the implementation of the World Health Organization Framework Convention on Tobacco Control in all countries, as appropriate
3.a.1 Age-standardized prevalence of current tobacco use among persons aged 15 years and older
3.b.1 Proportion of the population with access to affordable medicines and vaccines on a sustainable basis
3.b.2 Total net official development assistance to medical research and basic health sectors
3.c Substantially increase health financing and the recruitment, development, training and retention of the health workforce in developing countries, especially in least developed countries and small island developing States
3.c.1 Health worker density and distribution
3.d Strengthen the capacity of all countries, in particular developing countries, for early warning, risk reduction and management of national and global health risks
3.d.1 International Health Regulations (IHR) capacity and health emergency preparedness
4.1 By 2030, ensure that all girls and boys complete free, equitable and quality primary and secondary education leading to relevant and effective learning outcomes
4.1.1 Proportion of children and young people: (a) in grades 2/3; (b) at the end of primary; and (c) at the end of lower secondary achieving at least a minimum proficiency level in (i) reading and (ii) mathematics, by sex4.2.1 Proportion of children under 5 years of age who are developmentally on track in health, learning and psychosocial well-being, by sex4.2.2 Participation rate in organized learning (one year before the official primary entry age), by sex
4.3 By 2030, ensure equal access for all women and men to affordable and quality technical, vocational and tertiary education, including university
4.3.1 Participation rate of youth and adults in formal and non-formal education and training in the previous 12 months, by sex
3.1 By 2030, reduce the global maternal mortality ratio to less than 70 per 100,000 live births3.2 By 2030, end preventable deaths of newborns and children under 5 years of age, with all countries aiming to reduce neonatal mortality to at least as low as 12 per 1,000 live births and under-5 mortality to at least as low as 25 per 1,000 live births
3.3 By 2030, end the epidemics of AIDS, tuberculosis, malaria and neglected tropical diseases and combat hepatitis, water-borne diseases and other communicable diseases
3.4 By 2030, reduce by one third premature mortality from non-communicable diseases through prevention and treatment and promote mental health and well-being
3.5 Strengthen the prevention and treatment of substance abuse, including narcotic drug abuse and harmful use of alcohol
3.7 By 2030, ensure universal access to sexual and reproductive health-care services, including for family planning, information and education, and the integration of reproductive health into national strategies and programmes
3.8 Achieve universal health coverage, including financial risk protection, access to quality essential health-care services and access to safe, effective, quality and affordable essential medicines and vaccines for all
3.b Support the research and development of vaccines and medicines for the communicable and non-communicable diseases that primarily affect developing countries, provide access to affordable essential medicines and vaccines, in accordance with the Doha Declaration on the TRIPS Agreement and Public Health, which affirms the right of developing countries to use to the full the provisions in the Agreement on Trade-Related Aspects of Intellectual Property Rights regarding flexibilities to protect public health, and, in particular, provide access to medicines for all
Goal 4. Ensure inclusive and equitable quality education and promote lifelong learning opportunities for all
3.9 By 2030, substantially reduce the number of deaths and illnesses from hazardous chemicals and air, water and soil pollution and contamination
4.2 By 2030, ensure that all girls and boys have access to quality early childhood development, care and pre-primary education so that they are ready for primary education
Goal 3. Ensure healthy lives and promote well-being for all at all ages
4.4 By 2030, substantially increase the number of youth and adults who have relevant skills, including technical and vocational skills, for employment, decent jobs and entrepreneurship
4.4.1 Proportion of youth and adults with information and communications technology (ICT) skills, by type of skill
4.5 By 2030, eliminate gender disparities in education and ensure equal access to all levels of education and vocational training for the vulnerable, including persons with disabilities, indigenous peoples and children in vulnerable situations
4.5.1 Parity indices (female/male, rural/urban, bottom/top wealth quintile and others such as disability status, indigenous peoples and conflict-affected, as data become available) for all education indicators on this list that can be disaggregated
4.6 By 2030, ensure that all youth and a substantial proportion of adults, both men and women, achieve literacy and numeracy
4.6.1 Percentage of population in a given age group achieving at least a fixed level of proficiency in functional (a) literacy and (b) numeracy skills, by sex
4.7 By 2030, ensure that all learners acquire the knowledge and skills needed to promote sustainable development, including, among others, through education for sustainable development and sustainable lifestyles, human rights, gender equality, promotion of a culture of peace and non-violence, global citizenship and appreciation of cultural diversity and of culture’s contribution to sustainable development
4.7.1 Extent to which (i) global citizenship education and (ii) education for sustainable development, including gender equality and human rights, are mainstreamed at all levels in: (a) national education policies, (b) curricula, (c) teacher education and (d) student assessment
4.a Build and upgrade education facilities that are child, disability and gender sensitive and provide safe, non-violent, inclusive and effective learning environments for all
4.a.1 Proportion of schools with access to: (a) electricity; (b) the Internet for pedagogical purposes; (c) computers for pedagogical purposes; (d) adapted infrastructure and materials for students with disabilities; (e) basic drinking water; (f) single-sex basic sanitation facilities; and (g) basic handwashing facilities (as per the WASH indicator definitions)
4.b By 2020, substantially expand globally the number of scholarships available to developing countries, in particular least developed countries, small island developing States and African countries, for enrolment in higher education, including vocational training and information and communications technology, technical, engineering and scientific programmes, in developed countries and other developing countries
4.b.1 Volume of official development assistance flows for scholarships by sector and type of study
4.c By 2030, substantially increase the supply of qualified teachers, including through international cooperation for teacher training in developing countries, especially least developed countries and small island developing States
4.c.1 Proportion of teachers in: (a) pre-primary; (b) primary; (c) lower secondary; and (d) upper secondary education who have received at least the minimum organized teacher training (e.g. pedagogical training) pre-service or in-service required for teaching at the relevant level in a given country
5.1 End all forms of discrimination against all women and girls everywhere 5.1.1 Whether or not legal frameworks are in place to promote, enforce and monitor equality and non-discrimination on the basis of sex5.2.1 Proportion of ever-partnered women and girls aged 15 years and older subjected to physical, sexual or psychological violence by a current or former intimate partner in the previous 12 months, by form of violence and by age5.2.2 Proportion of women and girls aged 15 years and older subjected to sexual violence by persons other than an intimate partner in the previous 12 months, by age and place of occurrence5.3.1 Proportion of women aged 20-24 years who were married or in a union before age 15 and before age 185.3.2 Proportion of girls and women aged 15-49 years who have undergone female genital mutilation/cutting, by age
5.4 Recognize and value unpaid care and domestic work through the provision of public services, infrastructure and social protection policies and the promotion of shared responsibility within the household and the family as nationally appropriate
5.4.1 Proportion of time spent on unpaid domestic and care work, by sex, age and location
5.5.1 Proportion of seats held by women in national parliaments and local governments5.5.2 Proportion of women in managerial positions5.6.1 Proportion of women aged 15-49 years who make their own informed decisions regarding sexual relations, contraceptive use and reproductive health care5.6.2 Number of countries with laws and regulations that guarantee women aged 15-49 years access to sexual and reproductive health care, information and education5.a.1 (a) Proportion of total agricultural population with ownership or secure rights over agricultural land, by sex; and (b) share of women among owners or rights-bearers of agricultural land, by type of tenure5.a.2 Proportion of countries where the legal framework (including customary law) guarantees women’s equal rights to land ownership and/or control
5.b Enhance the use of enabling technology, in particular information and communications technology, to promote the empowerment of women
5.b.1 Proportion of individuals who own a mobile telephone, by sex
5.c Adopt and strengthen sound policies and enforceable legislation for the promotion of gender equality and the empowerment of all women and girls at all levels
5.c.1 Proportion of countries with systems to track and make public allocations for gender equality and women’s empowerment
6.1 By 2030, achieve universal and equitable access to safe and affordable drinking water for all
6.1.1 Proportion of population using safely managed drinking water services
6.2 By 2030, achieve access to adequate and equitable sanitation and hygiene for all and end open defecation, paying special attention to the needs of women and girls and those in vulnerable situations
6.2.1 Proportion of population using safely managed sanitation services, including a hand-washing facility with soap and water
5.3 Eliminate all harmful practices, such as child, early and forced marriage and female genital mutilation
5.5 Ensure women’s full and effective participation and equal opportunities for leadership at all levels of decision-making in political, economic and public life
5.6 Ensure universal access to sexual and reproductive health and reproductive rights as agreed in accordance with the Programme of Action of the International Conference on Population and Development and the Beijing Platform for Action and the outcome documents of their review conferences
5.a Undertake reforms to give women equal rights to economic resources, as well as access to ownership and control over land and other forms of property, financial services, inheritance and natural resources, in accordance with national laws
Goal 6. Ensure availability and sustainable management of water and sanitation for all
5.2 Eliminate all forms of violence against all women and girls in the public and private spheres, including trafficking and sexual and other types of exploitation
Goal 5. Achieve gender equality and empower all women and girls
6.3.1 Proportion of wastewater safely treated
6.3.2 Proportion of bodies of water with good ambient water quality
6.4.1 Change in water-use efficiency over time
6.4.2 Level of water stress: freshwater withdrawal as a proportion of available freshwater resources6.5.1 Degree of integrated water resources management implementation (0-100)6.5.2 Proportion of transboundary basin area with an operational arrangement for water cooperation
6.6 By 2020, protect and restore water-related ecosystems, including mountains, forests, wetlands, rivers, aquifers and lakes
6.6.1 Change in the extent of water-related ecosystems over time
6.a By 2030, expand international cooperation and capacity-building support to developing countries in water- and sanitation-related activities and programmes, including water harvesting, desalination, water efficiency, wastewater treatment, recycling and reuse technologies
6.a.1 Amount of water- and sanitation-related official development assistance that is part of a government-coordinated spending plan
6.b Support and strengthen the participation of local communities in improving water and sanitation management
6.b.1 Proportion of local administrative units with established and operational policies and procedures for participation of local communities in water and sanitation management
7.1.1 Proportion of population with access to electricity7.1.2 Proportion of population with primary reliance on clean fuels and technology
7.2 By 2030, increase substantially the share of renewable energy in the global energy mix
7.2.1 Renewable energy share in the total final energy consumption
7.3 By 2030, double the global rate of improvement in energy efficiency 7.3.1 Energy intensity measured in terms of primary energy and GDP7.a By 2030, enhance international cooperation to facilitate access to clean energy research and technology, including renewable energy, energy efficiency and advanced and cleaner fossil-fuel technology, and promote investment in energy infrastructure and clean energy technology
7.a.1 Mobilized amount of United States dollars per year starting in 2020 accountable towards the $100 billion commitment
7.b By 2030, expand infrastructure and upgrade technology for supplying modern and sustainable energy services for all in developing countries, in particular least developed countries, small island developing States and landlocked developing countries, in accordance with their respective programmes of support
7.b.1 Investments in energy efficiency as a percentage of GDP and the amount of foreign direct investment in financial transfer for infrastructure and technology to sustainable development services
8.1 Sustain per capita economic growth in accordance with national circumstances and, in particular, at least 7 per cent gross domestic product growth per annum in the least developed countries
8.1.1 Annual growth rate of real GDP per capita
8.2 Achieve higher levels of economic productivity through diversification, technological upgrading and innovation, including through a focus on high-value added and labour-intensive sectors
8.2.1 Annual growth rate of real GDP per employed person
8.3 Promote development-oriented policies that support productive activities, decent job creation, entrepreneurship, creativity and innovation, and encourage the formalization and growth of micro-, small- and medium-sized enterprises, including through access to financial services
8.3.1 Proportion of informal employment in non-agriculture employment, by sex
8.4.1 Material footprint, material footprint per capita, and material footprint per GDP
8.4.2 Domestic material consumption, domestic material consumption per capita, and domestic material consumption per GDP8.5.1 Average hourly earnings of female and male employees, by occupation, age and persons with disabilities8.5.2 Unemployment rate, by sex, age and persons with disabilities
8.6 By 2020, substantially reduce the proportion of youth not in employment, education or training
8.6.1 Proportion of youth (aged 15-24 years) not in education, employment or training
8.7 Take immediate and effective measures to eradicate forced labour, end modern slavery and human trafficking and secure the prohibition and elimination of the worst forms of child labour, including recruitment and use of child soldiers, and by 2025 end child labour in all its forms
8.7.1 Proportion and number of children aged 5-17 years engaged in child labour, by sex and age
8.8.1 Frequency rates of fatal and non-fatal occupational injuries, by sex and migrant status8.8.2 Increase in national compliance of labour rights (freedom of association and collective bargaining) based on International Labour Organization (ILO) textual sources and national legislation, by sex and migrant status8.9.1 Tourism direct GDP as a proportion of total GDP and in growth rate8.9.2 Number of jobs in tourism industries as a proportion of total jobs and growth rate of jobs, by sex8.10.1 Number of commercial bank branches and automated teller machines (ATMs) per 100,000 adults8.10.2 Proportion of adults (15 years and older) with an account at a bank or other financial institution or with a mobile-money-service provider
8.4 Improve progressively, through 2030, global resource efficiency in consumption and production and endeavour to decouple economic growth from environmental degradation, in accordance with the 10-Year Framework of Programmes on Sustainable Consumption and Production, with developed countries taking the lead
8.5 By 2030, achieve full and productive employment and decent work for all women and men, including for young people and persons with disabilities, and equal pay for work of equal value
8.8 Protect labour rights and promote safe and secure working environments for all workers, including migrant workers, in particular women migrants, and those in precarious employment
8.9 By 2030, devise and implement policies to promote sustainable tourism that creates jobs and promotes local culture and products
8.10 Strengthen the capacity of domestic financial institutions to encourage and expand access to banking, insurance and financial services for all
6.5 By 2030, implement integrated water resources management at all levels, including through transboundary cooperation as appropriate
Goal 7. Ensure access to affordable, reliable, sustainable and modern energy for all
7.1 By 2030, ensure universal access to affordable, reliable and modern energy services
Goal 8. Promote sustained, inclusive and sustainable economic growth, full and productive employment and decent work for all
6.3 By 2030, improve water quality by reducing pollution, eliminating dumping and minimizing release of hazardous chemicals and materials, halving the proportion of untreated wastewater and substantially increasing recycling and safe reuse globally6.4 By 2030, substantially increase water-use efficiency across all sectors and ensure sustainable withdrawals and supply of freshwater to address water scarcity and substantially reduce the number of people suffering from water scarcity
8.a Increase Aid for Trade support for developing countries, in particular least developed countries, including through the Enhanced Integrated Framework for Trade-related Technical Assistance to Least Developed Countries
8.a.1 Aid for Trade commitments and disbursements
8.b By 2020, develop and operationalize a global strategy for youth employment and implement the Global Jobs Pact of the International Labour Organization
8.b.1 Total government spending in social protection and employment programmes as a proportion of the national budgets and GDP
9.1.1 Proportion of the rural population who live within 2 km of an all-season road
9.1.2 Passenger and freight volumes, by mode of transport
9.2.1 Manufacturing value added as a proportion of GDP and per capita
9.2.2 Manufacturing employment as a proportion of total employment
9.3.1 Proportion of small-scale industries in total industry value added
9.3.2 Proportion of small-scale industries with a loan or line of credit9.4 By 2030, upgrade infrastructure and retrofit industries to make them sustainable, with increased resource-use efficiency and greater adoption of clean and environmentally sound technologies and industrial processes, with all countries taking action in accordance with their respective capabilities
9.4.1 CO2 emission per unit of value added
9.5.1 Research and development expenditure as a proportion of GDP
9.5.2 Researchers (in full-time equivalent) per million inhabitants9.a Facilitate sustainable and resilient infrastructure development in developing countries through enhanced financial, technological and technical support to African countries, least developed countries, landlocked developing countries and small island developing States
9.a.1 Total official international support (official development assistance plus other official flows) to infrastructure
9.b Support domestic technology development, research and innovation in developing countries, including by ensuring a conducive policy environment for, inter alia, industrial diversification and value addition to commodities
9.b.1 Proportion of medium and high-tech industry value added in total value added
9.c Significantly increase access to information and communications technology and strive to provide universal and affordable access to the Internet in least developed countries by 2020
9.c.1 Proportion of population covered by a mobile network, by technology
10.1 By 2030, progressively achieve and sustain income growth of the bottom 40 per cent of the population at a rate higher than the national average
10.1.1 Growth rates of household expenditure or income per capita among the bottom 40 per cent of the population and the total population
10.2 By 2030, empower and promote the social, economic and political inclusion of all, irrespective of age, sex, disability, race, ethnicity, origin, religion or economic or other status
10.2.1 Proportion of people living below 50 per cent of median income, by age, sex and persons with disabilities
10.3 Ensure equal opportunity and reduce inequalities of outcome, including by eliminating discriminatory laws, policies and practices and promoting appropriate legislation, policies and action in this regard
10.3.1 Proportion of the population reporting having personally felt discriminated against or harassed within the previous 12 months on the basis of a ground of discrimination prohibited under international human rights law
10.4 Adopt policies, especially fiscal, wage and social protection policies, and progressively achieve greater equality
10.4.1 Labour share of GDP, comprising wages and social protection transfers
10.5 Improve the regulation and monitoring of global financial markets and institutions and strengthen the implementation of such regulations
10.5.1 Financial Soundness Indicators
10.6 Ensure enhanced representation and voice for developing countries in decision-making in global international economic and financial institutions in order to deliver more effective, credible, accountable and legitimate institutions
10.6.1 Proportion of members and voting rights of developing countries in international organizations
10.7.1 Recruitment cost borne by employee as a proportion of yearly income earned in country of destination10.7.2 Number of countries that have implemented well-managed migration policies
10.a Implement the principle of special and differential treatment for developing countries, in particular least developed countries, in accordance with World Trade Organization agreements
10.a.1 Proportion of tariff lines applied to imports from least developed countries and developing countries with zero-tariff
10.b Encourage official development assistance and financial flows, including foreign direct investment, to States where the need is greatest, in particular least developed countries, African countries, small island developing States and landlocked developing countries, in accordance with their national plans and programmes
10.b.1 Total resource flows for development, by recipient and donor countries and type of flow (e.g. official development assistance, foreign direct investment and other flows)
10.c By 2030, reduce to less than 3 per cent the transaction costs of migrant remittances and eliminate remittance corridors with costs higher than 5 per cent
10.c.1 Remittance costs as a proportion of the amount remitted
Goal 11. Make cities and human settlements inclusive, safe, resilient and sustainable
10.7 Facilitate orderly, safe, regular and responsible migration and mobility of people, including through the implementation of planned and well-managed migration policies
Goal 9. Build resilient infrastructure, promote inclusive and sustainable industrialization and foster innovation9.1 Develop quality, reliable, sustainable and resilient infrastructure, including regional and trans-border infrastructure, to support economic development and human well-being, with a focus on affordable and equitable access for all9.2 Promote inclusive and sustainable industrialization and, by 2030, significantly raise industry’s share of employment and gross domestic product, in line with national circumstances, and double its share in least developed countries
9.3 Increase the access of small-scale industrial and other enterprises, in particular in developing countries, to financial services, including affordable credit, and their integration into value chains and markets
9.5 Enhance scientific research, upgrade the technological capabilities of industrial sectors in all countries, in particular developing countries, including, by 2030, encouraging innovation and substantially increasing the number of research and development workers per 1 million people and public and private research and development spending
Goal 10. Reduce inequality within and among countries
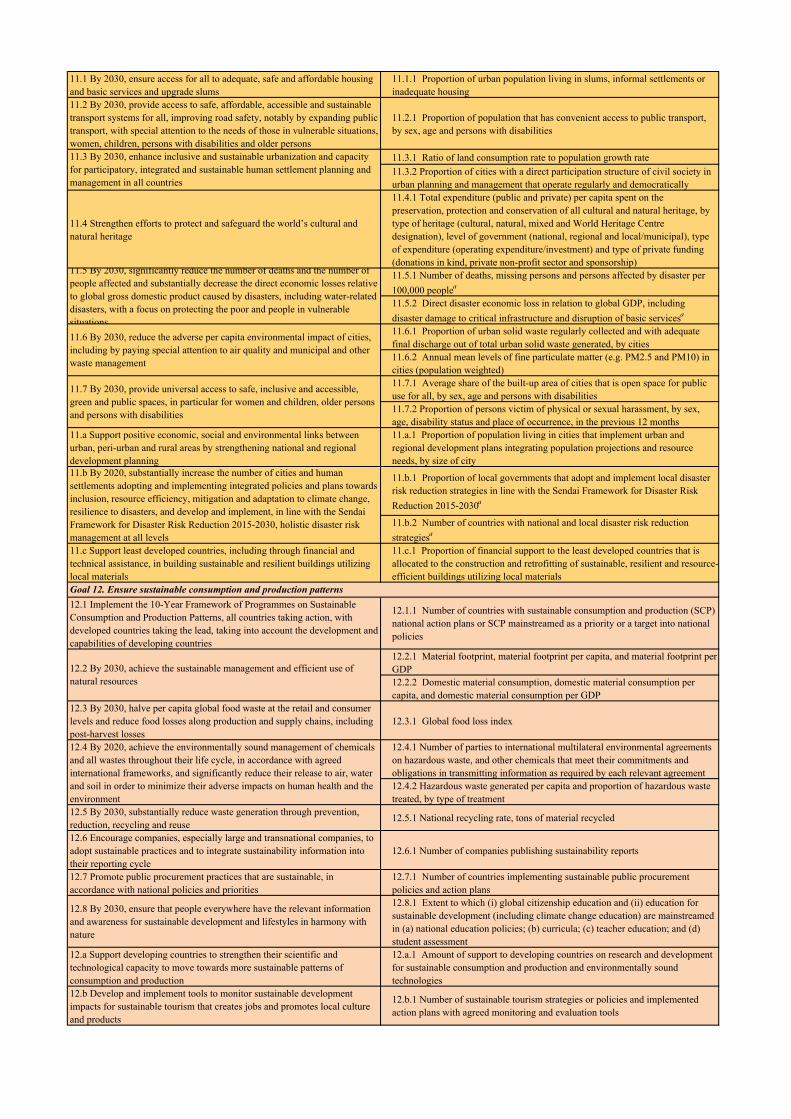
11.1 By 2030, ensure access for all to adequate, safe and affordable housing and basic services and upgrade slums
11.1.1 Proportion of urban population living in slums, informal settlements or inadequate housing
11.2 By 2030, provide access to safe, affordable, accessible and sustainable transport systems for all, improving road safety, notably by expanding public transport, with special attention to the needs of those in vulnerable situations, women, children, persons with disabilities and older persons
11.2.1 Proportion of population that has convenient access to public transport, by sex, age and persons with disabilities
11.3.1 Ratio of land consumption rate to population growth rate11.3.2 Proportion of cities with a direct participation structure of civil society in urban planning and management that operate regularly and democratically
11.4 Strengthen efforts to protect and safeguard the world’s cultural and natural heritage
11.4.1 Total expenditure (public and private) per capita spent on the preservation, protection and conservation of all cultural and natural heritage, by type of heritage (cultural, natural, mixed and World Heritage Centre designation), level of government (national, regional and local/municipal), type of expenditure (operating expenditure/investment) and type of private funding (donations in kind, private non-profit sector and sponsorship)11.5.1 Number of deaths, missing persons and persons affected by disaster per 100,000 peoplea
11.5.2 Direct disaster economic loss in relation to global GDP, including disaster damage to critical infrastructure and disruption of basic servicesa
11.6.1 Proportion of urban solid waste regularly collected and with adequate final discharge out of total urban solid waste generated, by cities11.6.2 Annual mean levels of fine particulate matter (e.g. PM2.5 and PM10) in cities (population weighted)11.7.1 Average share of the built-up area of cities that is open space for public use for all, by sex, age and persons with disabilities11.7.2 Proportion of persons victim of physical or sexual harassment, by sex, age, disability status and place of occurrence, in the previous 12 months
11.a Support positive economic, social and environmental links between urban, peri-urban and rural areas by strengthening national and regional development planning
11.a.1 Proportion of population living in cities that implement urban and regional development plans integrating population projections and resource needs, by size of city
11.b.1 Proportion of local governments that adopt and implement local disaster risk reduction strategies in line with the Sendai Framework for Disaster Risk Reduction 2015-2030a
11.b.2 Number of countries with national and local disaster risk reduction strategiesa
11.c Support least developed countries, including through financial and technical assistance, in building sustainable and resilient buildings utilizing local materials
11.c.1 Proportion of financial support to the least developed countries that is allocated to the construction and retrofitting of sustainable, resilient and resource-efficient buildings utilizing local materials
12.1 Implement the 10-Year Framework of Programmes on Sustainable Consumption and Production Patterns, all countries taking action, with developed countries taking the lead, taking into account the development and capabilities of developing countries
12.1.1 Number of countries with sustainable consumption and production (SCP) national action plans or SCP mainstreamed as a priority or a target into national policies
12.2.1 Material footprint, material footprint per capita, and material footprint per GDP12.2.2 Domestic material consumption, domestic material consumption per capita, and domestic material consumption per GDP
12.3 By 2030, halve per capita global food waste at the retail and consumer levels and reduce food losses along production and supply chains, including post-harvest losses
12.3.1 Global food loss index
12.4.1 Number of parties to international multilateral environmental agreements on hazardous waste, and other chemicals that meet their commitments and obligations in transmitting information as required by each relevant agreement12.4.2 Hazardous waste generated per capita and proportion of hazardous waste treated, by type of treatment
12.5 By 2030, substantially reduce waste generation through prevention, reduction, recycling and reuse
12.5.1 National recycling rate, tons of material recycled
12.6 Encourage companies, especially large and transnational companies, to adopt sustainable practices and to integrate sustainability information into their reporting cycle
12.6.1 Number of companies publishing sustainability reports
12.7 Promote public procurement practices that are sustainable, in accordance with national policies and priorities
12.7.1 Number of countries implementing sustainable public procurement policies and action plans
12.8 By 2030, ensure that people everywhere have the relevant information and awareness for sustainable development and lifestyles in harmony with nature
12.8.1 Extent to which (i) global citizenship education and (ii) education for sustainable development (including climate change education) are mainstreamed in (a) national education policies; (b) curricula; (c) teacher education; and (d) student assessment
12.a Support developing countries to strengthen their scientific and technological capacity to move towards more sustainable patterns of consumption and production
12.a.1 Amount of support to developing countries on research and development for sustainable consumption and production and environmentally sound technologies
12.b Develop and implement tools to monitor sustainable development impacts for sustainable tourism that creates jobs and promotes local culture and products
12.b.1 Number of sustainable tourism strategies or policies and implemented action plans with agreed monitoring and evaluation tools
11.3 By 2030, enhance inclusive and sustainable urbanization and capacity for participatory, integrated and sustainable human settlement planning and management in all countries
11.5 By 2030, significantly reduce the number of deaths and the number of people affected and substantially decrease the direct economic losses relative to global gross domestic product caused by disasters, including water-related disasters, with a focus on protecting the poor and people in vulnerable situations11.6 By 2030, reduce the adverse per capita environmental impact of cities, including by paying special attention to air quality and municipal and other waste management
11.7 By 2030, provide universal access to safe, inclusive and accessible, green and public spaces, in particular for women and children, older persons and persons with disabilities
11.b By 2020, substantially increase the number of cities and human settlements adopting and implementing integrated policies and plans towards inclusion, resource efficiency, mitigation and adaptation to climate change, resilience to disasters, and develop and implement, in line with the Sendai Framework for Disaster Risk Reduction 2015-2030, holistic disaster risk management at all levels
Goal 12. Ensure sustainable consumption and production patterns
12.2 By 2030, achieve the sustainable management and efficient use of natural resources
12.4 By 2020, achieve the environmentally sound management of chemicals and all wastes throughout their life cycle, in accordance with agreed international frameworks, and significantly reduce their release to air, water and soil in order to minimize their adverse impacts on human health and the environment
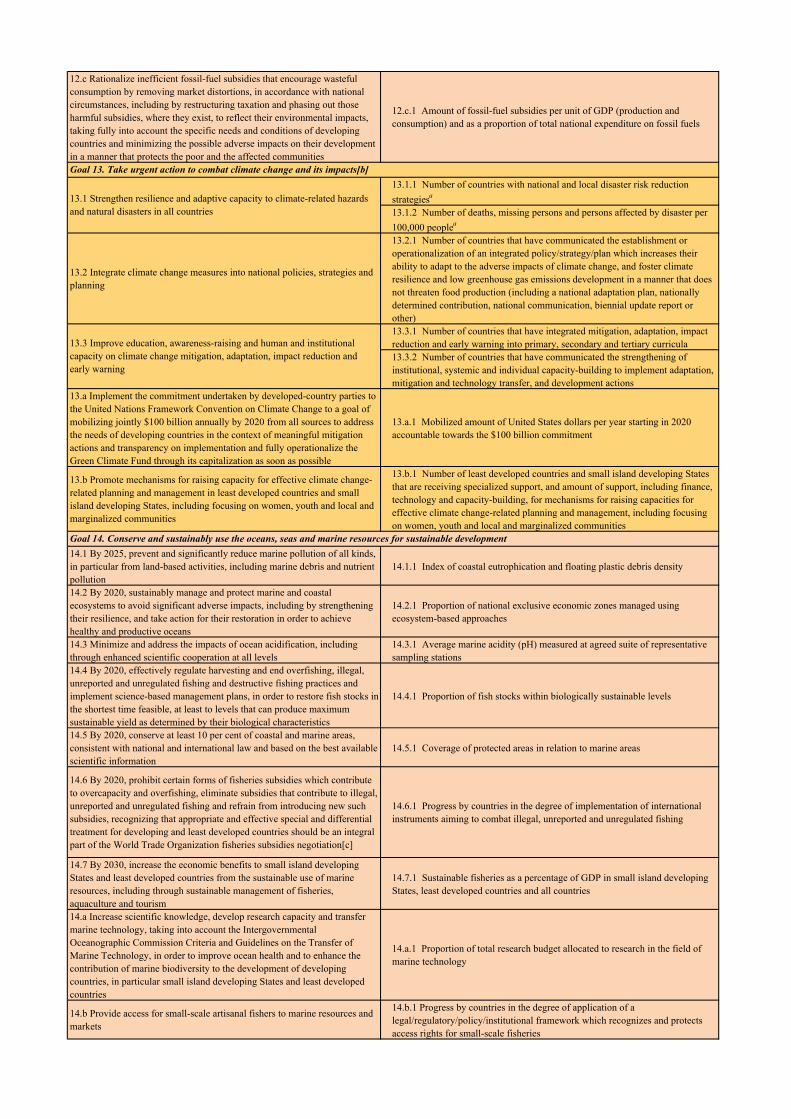
12.c Rationalize inefficient fossil-fuel subsidies that encourage wasteful consumption by removing market distortions, in accordance with national circumstances, including by restructuring taxation and phasing out those harmful subsidies, where they exist, to reflect their environmental impacts, taking fully into account the specific needs and conditions of developing countries and minimizing the possible adverse impacts on their development in a manner that protects the poor and the affected communities
12.c.1 Amount of fossil-fuel subsidies per unit of GDP (production and consumption) and as a proportion of total national expenditure on fossil fuels
13.1.1 Number of countries with national and local disaster risk reduction strategiesa
13.1.2 Number of deaths, missing persons and persons affected by disaster per 100,000 peoplea
13.2 Integrate climate change measures into national policies, strategies and planning
13.2.1 Number of countries that have communicated the establishment or operationalization of an integrated policy/strategy/plan which increases their ability to adapt to the adverse impacts of climate change, and foster climate resilience and low greenhouse gas emissions development in a manner that does not threaten food production (including a national adaptation plan, nationally determined contribution, national communication, biennial update report or other)13.3.1 Number of countries that have integrated mitigation, adaptation, impact reduction and early warning into primary, secondary and tertiary curricula13.3.2 Number of countries that have communicated the strengthening of institutional, systemic and individual capacity-building to implement adaptation, mitigation and technology transfer, and development actions
13.a Implement the commitment undertaken by developed-country parties to the United Nations Framework Convention on Climate Change to a goal of mobilizing jointly $100 billion annually by 2020 from all sources to address the needs of developing countries in the context of meaningful mitigation actions and transparency on implementation and fully operationalize the Green Climate Fund through its capitalization as soon as possible
13.a.1 Mobilized amount of United States dollars per year starting in 2020 accountable towards the $100 billion commitment
13.b Promote mechanisms for raising capacity for effective climate change-related planning and management in least developed countries and small island developing States, including focusing on women, youth and local and marginalized communities
13.b.1 Number of least developed countries and small island developing States that are receiving specialized support, and amount of support, including finance, technology and capacity-building, for mechanisms for raising capacities for effective climate change-related planning and management, including focusing on women, youth and local and marginalized communities
14.1 By 2025, prevent and significantly reduce marine pollution of all kinds, in particular from land-based activities, including marine debris and nutrient pollution
14.1.1 Index of coastal eutrophication and floating plastic debris density
14.2 By 2020, sustainably manage and protect marine and coastal ecosystems to avoid significant adverse impacts, including by strengthening their resilience, and take action for their restoration in order to achieve healthy and productive oceans
14.2.1 Proportion of national exclusive economic zones managed using ecosystem-based approaches
14.3 Minimize and address the impacts of ocean acidification, including through enhanced scientific cooperation at all levels
14.3.1 Average marine acidity (pH) measured at agreed suite of representative sampling stations
14.4 By 2020, effectively regulate harvesting and end overfishing, illegal, unreported and unregulated fishing and destructive fishing practices and implement science-based management plans, in order to restore fish stocks in the shortest time feasible, at least to levels that can produce maximum sustainable yield as determined by their biological characteristics
14.4.1 Proportion of fish stocks within biologically sustainable levels
14.5 By 2020, conserve at least 10 per cent of coastal and marine areas, consistent with national and international law and based on the best available scientific information
14.5.1 Coverage of protected areas in relation to marine areas
14.6 By 2020, prohibit certain forms of fisheries subsidies which contribute to overcapacity and overfishing, eliminate subsidies that contribute to illegal, unreported and unregulated fishing and refrain from introducing new such subsidies, recognizing that appropriate and effective special and differential treatment for developing and least developed countries should be an integral part of the World Trade Organization fisheries subsidies negotiation[c]
14.6.1 Progress by countries in the degree of implementation of international instruments aiming to combat illegal, unreported and unregulated fishing
14.7 By 2030, increase the economic benefits to small island developing States and least developed countries from the sustainable use of marine resources, including through sustainable management of fisheries, aquaculture and tourism
14.7.1 Sustainable fisheries as a percentage of GDP in small island developing States, least developed countries and all countries
14.a Increase scientific knowledge, develop research capacity and transfer marine technology, taking into account the Intergovernmental Oceanographic Commission Criteria and Guidelines on the Transfer of Marine Technology, in order to improve ocean health and to enhance the contribution of marine biodiversity to the development of developing countries, in particular small island developing States and least developed countries
14.a.1 Proportion of total research budget allocated to research in the field of marine technology
14.b Provide access for small-scale artisanal fishers to marine resources and markets
14.b.1 Progress by countries in the degree of application of a legal/regulatory/policy/institutional framework which recognizes and protects access rights for small-scale fisheries
Goal 14. Conserve and sustainably use the oceans, seas and marine resources for sustainable development
13.3 Improve education, awareness-raising and human and institutional capacity on climate change mitigation, adaptation, impact reduction and early warning
Goal 13. Take urgent action to combat climate change and its impacts[b]
13.1 Strengthen resilience and adaptive capacity to climate-related hazards and natural disasters in all countries

14.c Enhance the conservation and sustainable use of oceans and their resources by implementing international law as reflected in the United Nations Convention on the Law of the Sea, which provides the legal framework for the conservation and sustainable use of oceans and their resources, as recalled in paragraph 158 of “The future we want”
14.c.1 Number of countries making progress in ratifying, accepting and implementing through legal, policy and institutional frameworks, ocean-related instruments that implement international law, as reflected in the United Nation Convention on the Law of the Sea, for the conservation and sustainable use of the oceans and their resources
15.1.1 Forest area as a proportion of total land area
15.1.2 Proportion of important sites for terrestrial and freshwater biodiversity that are covered by protected areas, by ecosystem type
15.2 By 2020, promote the implementation of sustainable management of all types of forests, halt deforestation, restore degraded forests and substantially increase afforestation and reforestation globally
15.2.1 Progress towards sustainable forest management
15.3 By 2030, combat desertification, restore degraded land and soil, including land affected by desertification, drought and floods, and strive to achieve a land degradation-neutral world
15.3.1 Proportion of land that is degraded over total land area
15.4.1 Coverage by protected areas of important sites for mountain biodiversity15.4.2 Mountain Green Cover Index
15.5 Take urgent and significant action to reduce the degradation of natural habitats, halt the loss of biodiversity and, by 2020, protect and prevent the extinction of threatened species
15.5.1 Red List Index
15.6 Promote fair and equitable sharing of the benefits arising from the utilization of genetic resources and promote appropriate access to such resources, as internationally agreed
15.6.1 Number of countries that have adopted legislative, administrative and policy frameworks to ensure fair and equitable sharing of benefits
15.7 Take urgent action to end poaching and trafficking of protected species of flora and fauna and address both demand and supply of illegal wildlife products
15.7.1 Proportion of traded wildlife that was poached or illicitly trafficked
15.8 By 2020, introduce measures to prevent the introduction and significantly reduce the impact of invasive alien species on land and water ecosystems and control or eradicate the priority species
15.8.1 Proportion of countries adopting relevant national legislation and adequately resourcing the prevention or control of invasive alien species
15.9 By 2020, integrate ecosystem and biodiversity values into national and local planning, development processes, poverty reduction strategies and accounts
15.9.1 Progress towards national targets established in accordance with Aichi Biodiversity Target 2 of the Strategic Plan for Biodiversity 2011-2020
15.a Mobilize and significantly increase financial resources from all sources to conserve and sustainably use biodiversity and ecosystems
15.a.1 Official development assistance and public expenditure on conservation and sustainable use of biodiversity and ecosystems
15.b Mobilize significant resources from all sources and at all levels to finance sustainable forest management and provide adequate incentives to developing countries to advance such management, including for conservation and reforestation
15.b.1 Official development assistance and public expenditure on conservation and sustainable use of biodiversity and ecosystems
15.c Enhance global support for efforts to combat poaching and trafficking of protected species, including by increasing the capacity of local communities to pursue sustainable livelihood opportunities
15.c.1 Proportion of traded wildlife that was poached or illicitly trafficked
16.1.1 Number of victims of intentional homicide per 100,000 population, by sex and age16.1.2 Conflict-related deaths per 100,000 population, by sex, age and cause16.1.3 Proportion of population subjected to physical, psychological or sexual violence in the previous 12 months16.1.4 Proportion of population that feel safe walking alone around the area they live16.2.1 Proportion of children aged 1-17 years who experienced any physical punishment and/or psychological aggression by caregivers in the past month16.2.2 Number of victims of human trafficking per 100,000 population, by sex, age and form of exploitation16.2.3 Proportion of young women and men aged 18-29 years who experienced sexual violence by age 1816.3.1 Proportion of victims of violence in the previous 12 months who reported their victimization to competent authorities or other officially recognized conflict resolution mechanisms16.3.2 Unsentenced detainees as a proportion of overall prison population16.4.1 Total value of inward and outward illicit financial flows (in current United States dollars)16.4.2 Proportion of seized small arms and light weapons that are recorded and traced, in accordance with international standards and legal instruments16.5.1 Proportion of persons who had at least one contact with a public official and who paid a bribe to a public official, or were asked for a bribe by those public officials, during the previous 12 months16.5.2 Proportion of businesses that had at least one contact with a public official and that paid a bribe to a public official, or were asked for a bribe by those public officials during the previous 12 months16.6.1 Primary government expenditures as a proportion of original approved budget, by sector (or by budget codes or similar)
16.2 End abuse, exploitation, trafficking and all forms of violence against and torture of children
16.3 Promote the rule of law at the national and international levels and ensure equal access to justice for all
16.4 By 2030, significantly reduce illicit financial and arms flows, strengthen the recovery and return of stolen assets and combat all forms of organized crime
16.5 Substantially reduce corruption and bribery in all their forms
16.6 Develop effective, accountable and transparent institutions at all levels
Goal 15. Protect, restore and promote sustainable use of terrestrial ecosystems, sustainably manage forests, combat desertification, and halt and reverse land degradation and halt biodiversity loss15.1 By 2020, ensure the conservation, restoration and sustainable use of terrestrial and inland freshwater ecosystems and their services, in particular forests, wetlands, mountains and drylands, in line with obligations under international agreements
15.4 By 2030, ensure the conservation of mountain ecosystems, including their biodiversity, in order to enhance their capacity to provide benefits that are essential for sustainable development
Goal 16. Promote peaceful and inclusive societies for sustainable development, provide access to justice for all and build effective, accountable and inclusive institutions at all levels
16.1 Significantly reduce all forms of violence and related death rates everywhere
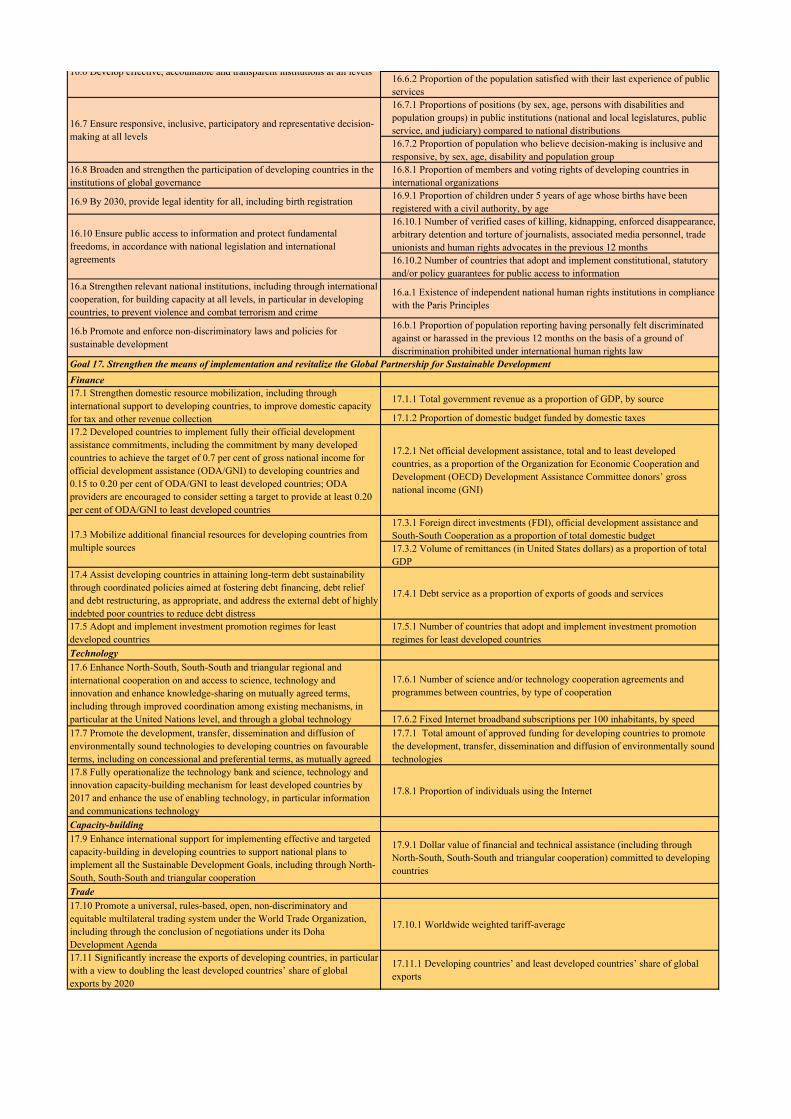
16.6.2 Proportion of the population satisfied with their last experience of public services16.7.1 Proportions of positions (by sex, age, persons with disabilities and population groups) in public institutions (national and local legislatures, public service, and judiciary) compared to national distributions16.7.2 Proportion of population who believe decision-making is inclusive and responsive, by sex, age, disability and population group
16.8 Broaden and strengthen the participation of developing countries in the institutions of global governance
16.8.1 Proportion of members and voting rights of developing countries in international organizations
16.9 By 2030, provide legal identity for all, including birth registration 16.9.1 Proportion of children under 5 years of age whose births have been registered with a civil authority, by age16.10.1 Number of verified cases of killing, kidnapping, enforced disappearance, arbitrary detention and torture of journalists, associated media personnel, trade unionists and human rights advocates in the previous 12 months16.10.2 Number of countries that adopt and implement constitutional, statutory and/or policy guarantees for public access to information
16.a Strengthen relevant national institutions, including through international cooperation, for building capacity at all levels, in particular in developing countries, to prevent violence and combat terrorism and crime
16.a.1 Existence of independent national human rights institutions in compliance with the Paris Principles
16.b Promote and enforce non-discriminatory laws and policies for sustainable development
16.b.1 Proportion of population reporting having personally felt discriminated against or harassed in the previous 12 months on the basis of a ground of discrimination prohibited under international human rights law
Finance
17.1.1 Total government revenue as a proportion of GDP, by source
17.1.2 Proportion of domestic budget funded by domestic taxes17.2 Developed countries to implement fully their official development assistance commitments, including the commitment by many developed countries to achieve the target of 0.7 per cent of gross national income for official development assistance (ODA/GNI) to developing countries and 0.15 to 0.20 per cent of ODA/GNI to least developed countries; ODA providers are encouraged to consider setting a target to provide at least 0.20 per cent of ODA/GNI to least developed countries
17.2.1 Net official development assistance, total and to least developed countries, as a proportion of the Organization for Economic Cooperation and Development (OECD) Development Assistance Committee donors’ gross national income (GNI)
17.3.1 Foreign direct investments (FDI), official development assistance and South-South Cooperation as a proportion of total domestic budget17.3.2 Volume of remittances (in United States dollars) as a proportion of total GDP
17.4 Assist developing countries in attaining long-term debt sustainability through coordinated policies aimed at fostering debt financing, debt relief and debt restructuring, as appropriate, and address the external debt of highly indebted poor countries to reduce debt distress
17.4.1 Debt service as a proportion of exports of goods and services
17.5 Adopt and implement investment promotion regimes for least developed countries
17.5.1 Number of countries that adopt and implement investment promotion regimes for least developed countries
Technology
17.6.1 Number of science and/or technology cooperation agreements and programmes between countries, by type of cooperation
17.6.2 Fixed Internet broadband subscriptions per 100 inhabitants, by speed17.7 Promote the development, transfer, dissemination and diffusion of environmentally sound technologies to developing countries on favourable terms, including on concessional and preferential terms, as mutually agreed
17.7.1 Total amount of approved funding for developing countries to promote the development, transfer, dissemination and diffusion of environmentally sound technologies
17.8 Fully operationalize the technology bank and science, technology and innovation capacity-building mechanism for least developed countries by 2017 and enhance the use of enabling technology, in particular information and communications technology
17.8.1 Proportion of individuals using the Internet
Capacity-building17.9 Enhance international support for implementing effective and targeted capacity-building in developing countries to support national plans to implement all the Sustainable Development Goals, including through North-South, South-South and triangular cooperation
17.9.1 Dollar value of financial and technical assistance (including through North-South, South-South and triangular cooperation) committed to developing countries
Trade17.10 Promote a universal, rules-based, open, non-discriminatory and equitable multilateral trading system under the World Trade Organization, including through the conclusion of negotiations under its Doha Development Agenda
17.10.1 Worldwide weighted tariff-average
17.11 Significantly increase the exports of developing countries, in particular with a view to doubling the least developed countries’ share of global exports by 2020
17.11.1 Developing countries’ and least developed countries’ share of global exports
17.6 Enhance North-South, South-South and triangular regional and international cooperation on and access to science, technology and innovation and enhance knowledge-sharing on mutually agreed terms, including through improved coordination among existing mechanisms, in particular at the United Nations level, and through a global technology
16.7 Ensure responsive, inclusive, participatory and representative decision-making at all levels
16.10 Ensure public access to information and protect fundamental freedoms, in accordance with national legislation and international agreements
Goal 17. Strengthen the means of implementation and revitalize the Global Partnership for Sustainable Development
17.1 Strengthen domestic resource mobilization, including through international support to developing countries, to improve domestic capacity for tax and other revenue collection
17.3 Mobilize additional financial resources for developing countries from multiple sources
16.6 Develop effective, accountable and transparent institutions at all levels
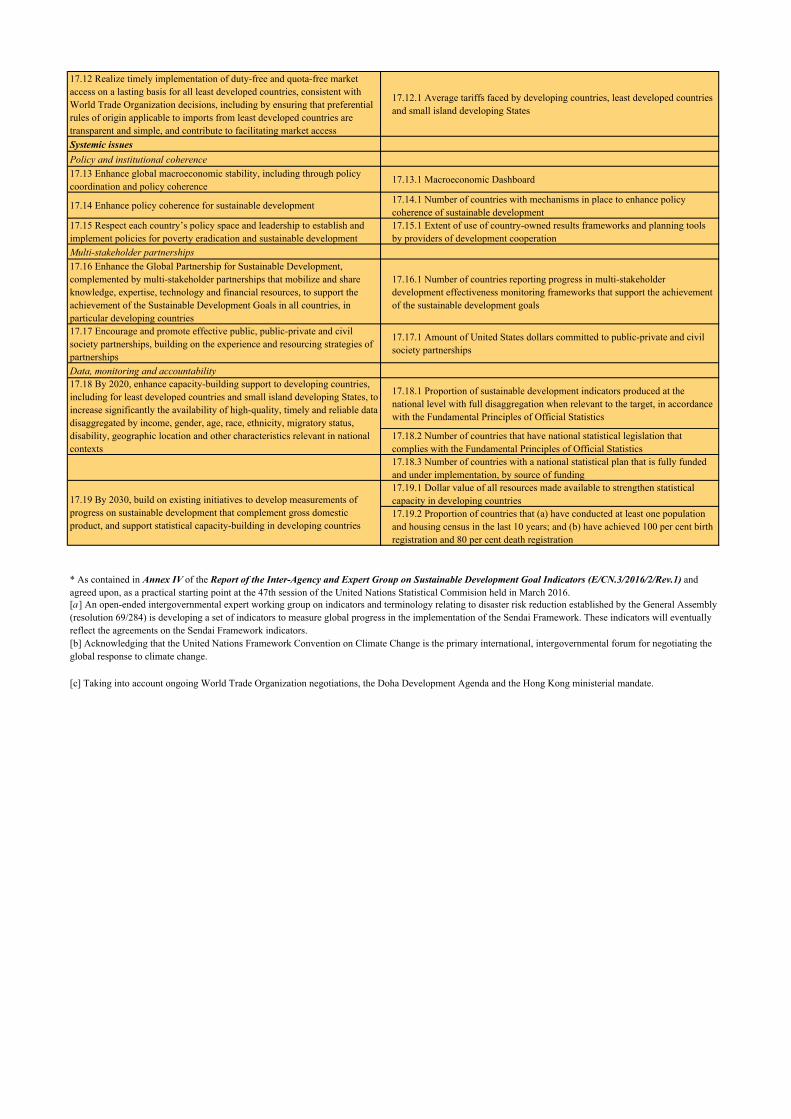
17.12 Realize timely implementation of duty-free and quota-free market access on a lasting basis for all least developed countries, consistent with World Trade Organization decisions, including by ensuring that preferential rules of origin applicable to imports from least developed countries are transparent and simple, and contribute to facilitating market access
17.12.1 Average tariffs faced by developing countries, least developed countries and small island developing States
Systemic issuesPolicy and institutional coherence17.13 Enhance global macroeconomic stability, including through policy coordination and policy coherence
17.13.1 Macroeconomic Dashboard
17.14 Enhance policy coherence for sustainable development 17.14.1 Number of countries with mechanisms in place to enhance policy coherence of sustainable development
17.15 Respect each country’s policy space and leadership to establish and implement policies for poverty eradication and sustainable development
17.15.1 Extent of use of country-owned results frameworks and planning tools by providers of development cooperation
Multi-stakeholder partnerships17.16 Enhance the Global Partnership for Sustainable Development, complemented by multi-stakeholder partnerships that mobilize and share knowledge, expertise, technology and financial resources, to support the achievement of the Sustainable Development Goals in all countries, in particular developing countries
17.16.1 Number of countries reporting progress in multi-stakeholder development effectiveness monitoring frameworks that support the achievement of the sustainable development goals
17.17 Encourage and promote effective public, public-private and civil society partnerships, building on the experience and resourcing strategies of partnerships
17.17.1 Amount of United States dollars committed to public-private and civil society partnerships
Data, monitoring and accountability
17.18.1 Proportion of sustainable development indicators produced at the national level with full disaggregation when relevant to the target, in accordance with the Fundamental Principles of Official Statistics
17.18.2 Number of countries that have national statistical legislation that complies with the Fundamental Principles of Official Statistics17.18.3 Number of countries with a national statistical plan that is fully funded and under implementation, by source of funding17.19.1 Dollar value of all resources made available to strengthen statistical capacity in developing countries17.19.2 Proportion of countries that (a) have conducted at least one population and housing census in the last 10 years; and (b) have achieved 100 per cent birth registration and 80 per cent death registration
[b] Acknowledging that the United Nations Framework Convention on Climate Change is the primary international, intergovernmental forum for negotiating the global response to climate change.
[c] Taking into account ongoing World Trade Organization negotiations, the Doha Development Agenda and the Hong Kong ministerial mandate.
17.18 By 2020, enhance capacity-building support to developing countries, including for least developed countries and small island developing States, to increase significantly the availability of high-quality, timely and reliable data disaggregated by income, gender, age, race, ethnicity, migratory status, disability, geographic location and other characteristics relevant in national contexts
17.19 By 2030, build on existing initiatives to develop measurements of progress on sustainable development that complement gross domestic product, and support statistical capacity-building in developing countries
* As contained in Annex IV of the Report of the Inter-Agency and Expert Group on Sustainable Development Goal Indicators (E/CN.3/2016/2/Rev.1) and agreed upon, as a practical starting point at the 47th session of the United Nations Statistical Commision held in March 2016.[a ] An open-ended intergovernmental expert working group on indicators and terminology relating to disaster risk reduction established by the General Assembly (resolution 69/284) is developing a set of indicators to measure global progress in the implementation of the Sendai Framework. These indicators will eventually reflect the agreements on the Sendai Framework indicators.
Related Documents