"An expert is a person who has made all the mistakes that can be made in a very narrow field." Niels Bohr 3 SCREENING AND IDENTIFICATION OF FUNGI AND OPTIMIZATION OF PROCESS PARAMETERS FOR DECOLOURIZATION AND DETOXIFICATION OF DISTILLERY MILL EFFLUENT

Welcome message from author
This document is posted to help you gain knowledge. Please leave a comment to let me know what you think about it! Share it to your friends and learn new things together.
Transcript

"An expert is a person who has made all the mistakes that can be made in a very narrow field."
Niels Bohr
3 SCREENING AND IDENTIFICATION OF FUNGI AND
OPTIMIZATION OF PROCESS PARAMETERS FOR
DECOLOURIZATION AND DETOXIFICATION OF
DISTILLERY MILL EFFLUENT
3. Screening and identification of fungi and optimization of process
parameters for decolourization and detoxification of distillery mill
emuent
3.1. Introduction
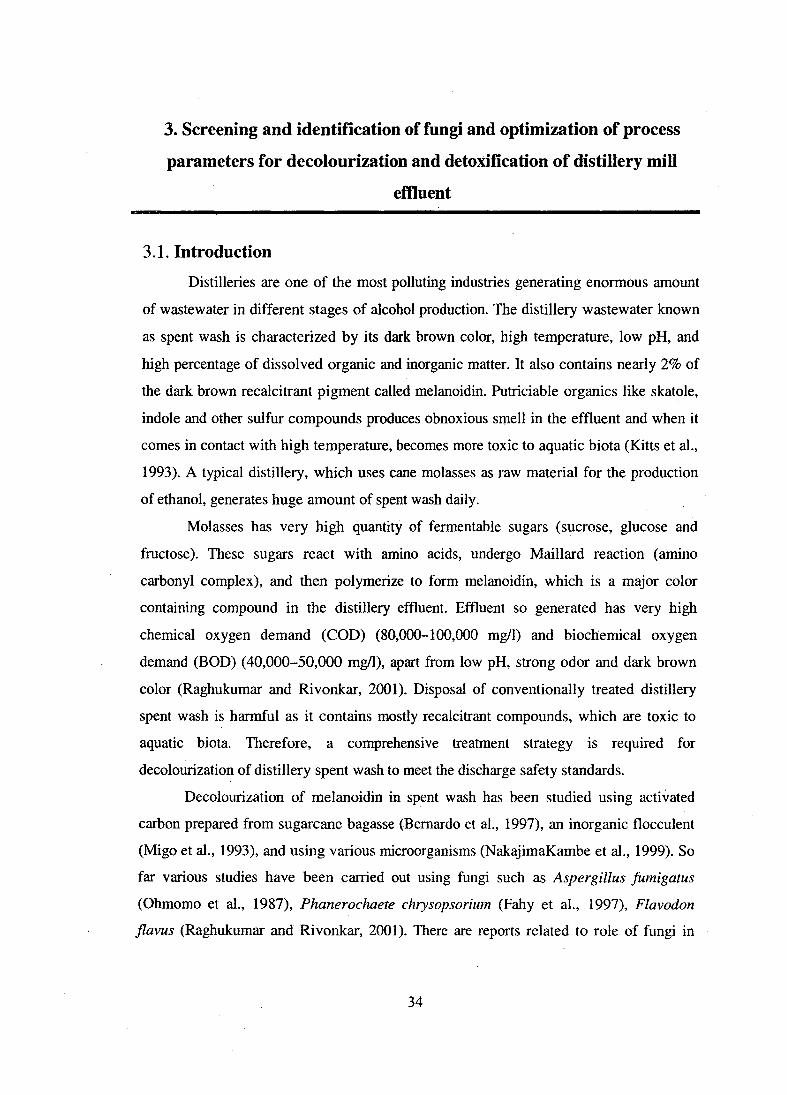
Distilleries are one of the most pollutin.g industries generating enormous amount
of wastewater in different stages of alcohol production. The distillery wastewater known
as spent wash is characterized by its dark brown color, high temperature, low pH, and
high percentage of dissolved organic and inorganic matter. It also contains nearly 2% of
the dark brown recalcitrant pigment called melanoidin. Putriciable organics like skatole,
indole and other sulfur compounds produces obnoxious smell in the effluent and when it
comes in contact with high temperature, becomes more toxic to aquatic biota (Kitts et al.,
1993). A typical distillery, which uses cane molasses as raw material for the production
of ethanol, generates huge amount of spent wash daily.
Molasses has very high quantity of fermentable sugars (sucrose, glucose and
fructose). These sugars react with amino acids, undergo Maillard reaction (amino
carbonyl complex), and then polymerize to form melanoidin, which is a major color
containing compound in the distillery effluent. Effluent so generated has very high
chemical oxygen demand (COD) (80,000-100,000 mg/1) and biochemical oxygen
demand (BOD) (40,000-50,000 mg/1), apart from low pH, strong odor and dark brown
color (Raghukumar and Rivonkar, 2001). Disposal of conventionally treated distillery
spent wash is harmful as it contains mostly recalcitrant compounds, which are toxic to
aquatic biota. Therefore, a comprehensive treatment strategy is required for
decolourization of distillery spent wash to meet the discharge safety standards.
Decolourization of melanoidin in spent wash has been studied using activated
carbon prepared from sugarcane bagasse (Bernardo et aJ., 1997), an inorganic flocculent
(Migo et al., 1993), and using various microorganisms (NakajimaKambe et al., 1999). So
far various studies have been carried out using fungi such as Aspergillus fumigatus
(Ohmomo et al., 1987), Phanerochaete chrysopsorium (Fahy et al., 1997), Flavodon
jlavus (Raghukumar and Rivonkar, 2001 ). There are reports related to role of fungi in
34
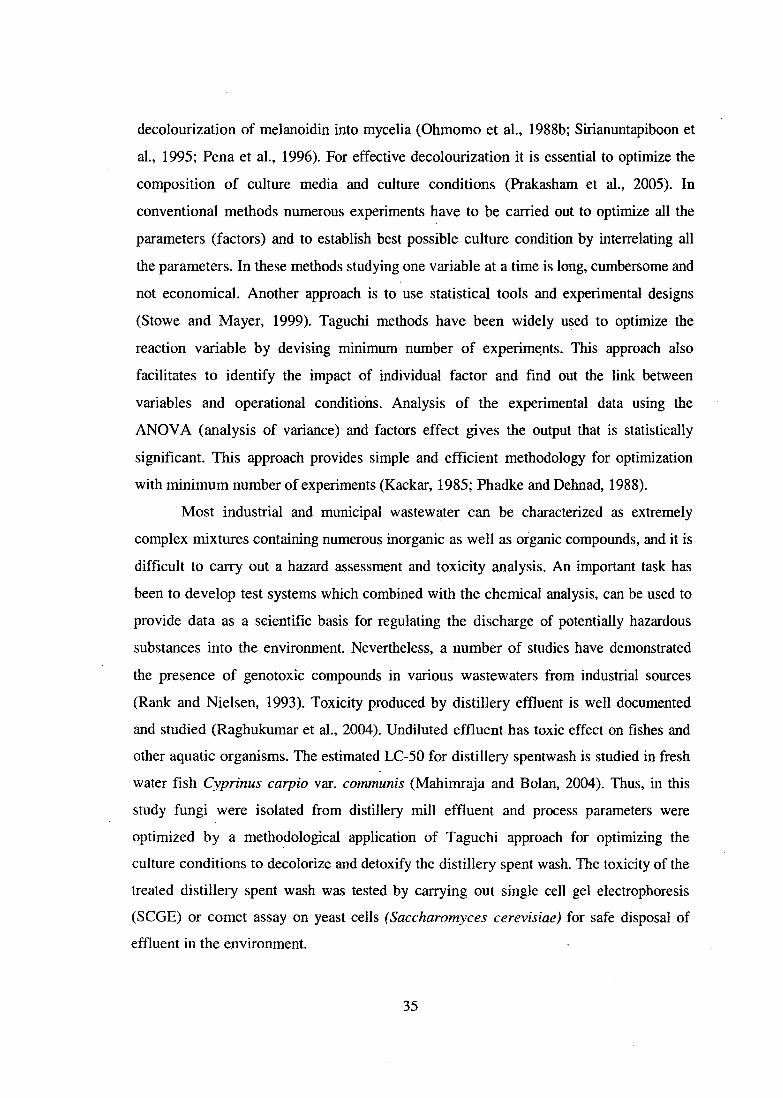
decolourization of melanoidin into mycelia (Ohmomo et al., 1988b; Sirianuntapiboon et
al., 1995; Pena et al., 1996). For effective decolourization it is essential to optimize the
composition of culture media and culture conditions (Prakasham et al., 2005). In
conventional methods numerous experiments have to be carried out to optimize all the
parameters (factors) and to establish best possible culture condition by interrelating all
the parameters. In these methods studying one variable at a time is long, cumbersome and
not economical. Another approach is to use statistical tools and experimental designs
(Stowe and Mayer, 1999). Taguchi methods have been widely used to optimize the
reaction variable by devising minimum number of experim~nts. This approach also
facilitates to identify the impact of individual factor and find out the link between
variables and operational conditions. Analysis of the experimental data using the
ANOVA (analysis of variance) and factors effect gives the output that is statistically
significant. This approach provides simple and efficient methodology for optimization
with minimum number of experiments (Kackar, 1985; Phadke and Dehnad, 1988).
Most industrial and municipal wastewater can be characterized as extremely
complex mixtures containing numerous inorganic as well as organic compounds, and it is
difficult to carry out a hazard assessment and toxicity analysis. An important task has
been to develop test systems which combined with the chemical analysis, can be used to
provide data as a scientific basis for regulating the discharge of potentially hazardous
substances into the environment. Nevertheless, a number of studies have demonstrated
the presence of genotoxic compounds in various wastewaters from industrial sources
(Rank and Nielsen, 1993). Toxicity produced by distillery effluent is well documented
and studied (Raghukumar et al., 2004). Undiluted effluent has toxic effect on fishes and
other aquatic organisms. The estimated LC-50 for distillery spentwash is studied in fresh
water fish Cyprinus carpio var. communis (Mahimraja and Bolan, 2004). Thus, in this
study fungi were isolated from distillery mill effluent and process parameters were
optimized by a methodological application of Taguchi approach for optimizing the
culture conditions to decolorize and detoxify the distillery spent wash. The toxicity of the
treated distillery spent wash was tested by carrying out single cell gel electrophoresis
(SCGE) or comet assay on yeast cells (Saccharomyces cerevisiae) for safe disposal of
effluent in the environment.
35
3.2. Materials and methods
3.2.1. Sampling site
For isolation of fungal strains, sludge and effluent was collected from Modi
distilleries, Modinagar, Uttar Pradesh, India in October, 2006. The sediments were
collected in clean plastic containers, immediately brought to the- laboratory and stored at
4°C until further use. The effluent was used for treatment studies
3.2.2. Isolation of fungi from the sediments
For isolation of fungi capable of decolorizing distillery effluent, sludge and
effluent were mixed and serially diluted in the order of 10"3, 10"4, 10"5 by using
autoclaved double distilled water. Diluted samples (100~1) were spread on potato
dextrose agar (PDA) plates, and kept at 30 oc for 4 days. Fungal colonies that appeared
on PDA plates were isolated and purified by repeated culturing (Thakur, 2004).
3.2.3. Morphological and anatomical study
The fungal isolates were identified based on morphological structures as color,
texture of the mycelia, spore formation using a microscope, Olympus and Magnus MLX
TR, at 40X and 1 OOX.
3.2.4. Characterization of effluent
The effluent was characterized for various physio-chemical parameters. pH was
estimated using pH Meter (Cyberscan 51), color by 2120 C Cobalt-platinate method,
COD by 5220 B open reflux method, anions i.e. nitrate, phosphate and sulphate were
estimated by ion chromatohraphy using ICS-90 IC system DIONEX. The eluent used was
2.7mM sodium carbonate (NaC03) and 0.3mM sodium bicarbonate (NaHC03).
Conductivity after chemical suppression was ca.l4~S/cm. The flow rate maintained
during the analysis was 1 mllmin. The anions were eluted out- in order of nitrate,
phosphate and sulphate. Standards were prepared using Dionex anion standards (Kumar
et al., 2009). Cations included estimation of sodium and potassium by Flame photometer
and heavy metals including copper, zinc and nickel by AAS, 3030 G acid digestion
method (APHA, 2005).
3.2.5. Culture condition and decolourization of distillery effluent
Five fungal strains isolated above were screened for decolourization in minimal
salt medium (MSM containing (g/1): Na2HP04.2H20, 7.8; KH2P04, 6.8; MgS04, 0.2; Fe
36
(CH3C00)3 NH4, 0.05; Ca(N03)2 4H20, 0.05; NaN03 • 0.085; 10% distillery spent wash,
at 3 pH and incubated at 30°C (Thakur, 2004). Decolourization of effluent was estimated
on 1, 3, 7, 10 and 15 days. Each experiment was performed in three replicates. Two
strains (DF3 and DF4) showed maximum color reductions were further identified by 18S
rDNA sequence analysis.
3.2.6. Amplified Ribosomal DNA Restriction Analysis (ARDRA)
ARDRA profile was generated of amplified ITS fragments of the two best
isolated fungal strains (DF3, DF4). The PCR product (5fll) was digested by restriction
enzymes (5U) BamH I (G1GATC1C), Hae III (GG11CC) and Msp I (CC1
1GG) (New
England Lab. Casework Co., Inc.) in 20111 reaction mixture containing suitable buffer and
incubated at 37°C for 12 h. Loading in 2% agarose gel separated the digested products,
and electrophoresis was carried out at 60V for 2.5 hours. TBE buffer was used as running
buffer for electrophoresis.
3.2.7. Identification of fungal strains
For identification of fungi, genomic DNA was isolated from pure fungal mycelia
grown in PDB at 30°C for seven days with modifications of procedure as described by
Karakousis et al. (2006). In this method, one mg of freshly grown mycelium was frozen
in liquid nitrogen and ground to fine powder using pre-frozen pestle and mortar (pre
sterilized by baking at 200°C, overnight). Extraction buffer (5 ml, O.lM Tris-Cl, 1.4M
NaCl, 0.02M EDTA, 2% CTAB) preheated at 60°C was added along with ~
mercaptoethanol (0.2% ). It was mixed gently and incubated at 60°C for 1hr with periodic
stirring. An equal volume of chloroform: isoamyl alcohol (24:1) was added to the crude
extract and mixed at room temperature for few minutes. The content was centrifuged at
10,000 rpm for 10 min and supernatant was carefully decanted. Isopropanol (0.61h volume
of ice cold) was added and solution was mixed and then kept at -20°C for 1 hr. The
mixture was centrifuged at 10,000 rpm for 10 min and the recovered pellet was washed
with equal volume ethanol (70% chilled). Finally the pellet was air dried to remove all
traces of ethanol and dissolved in TE (lOOfll). Internal transcribed spacer (ITS) region of
the fungi were amplified using primers ITS 1 having sequence 5'
TCCGTAGGTGAACCTGCGG 3' and ITS4 having sequence 5'
TCCTCCGCTTATTGATATGC 3' (Hortal et al., 2006). The reaction mix (25fll)
37
consisted of buffer containing MgCh-2.5 J!l (2.5mM), dNTP-2.0 J.ll (1mM each), ITS1
(forward)-0.7 J!l (lOmM), ITS4 (reverse)-0.7 J.ll (lOmM), Taq polymerase-0.5 J!l (5U/f!l),
DNA-20-50 ng and volume was made up by water. The thermocycler program include an
initial denaturation of 94°C for 5 min, followed by 35 cycles of amplification at 94°C for
1 min, 55°C for 1 min and 72°C for 1 min and a final extension of 7 min at 72°C.
Amplified products were resolved on 0.7% agarose gels containing ethidiurn bromide
(1 J!g/ml). The amplified products were sequenced. The resulting sequence was entered
into the BLAST nucleotide search program of the National Center for Biotechnology
Information to obtain closely related phylogenetic sequences. Pairwise alignments giving
the closest match were chosen. The megablast algorythm was used and the phylogeny
tree--was constructed using Mega 3.1 software (Yang et al., 2007).
18S
ITS 1 ____..,. I. ITSl 15.8S I ITS21 28S .,.__._
ITS.4
I
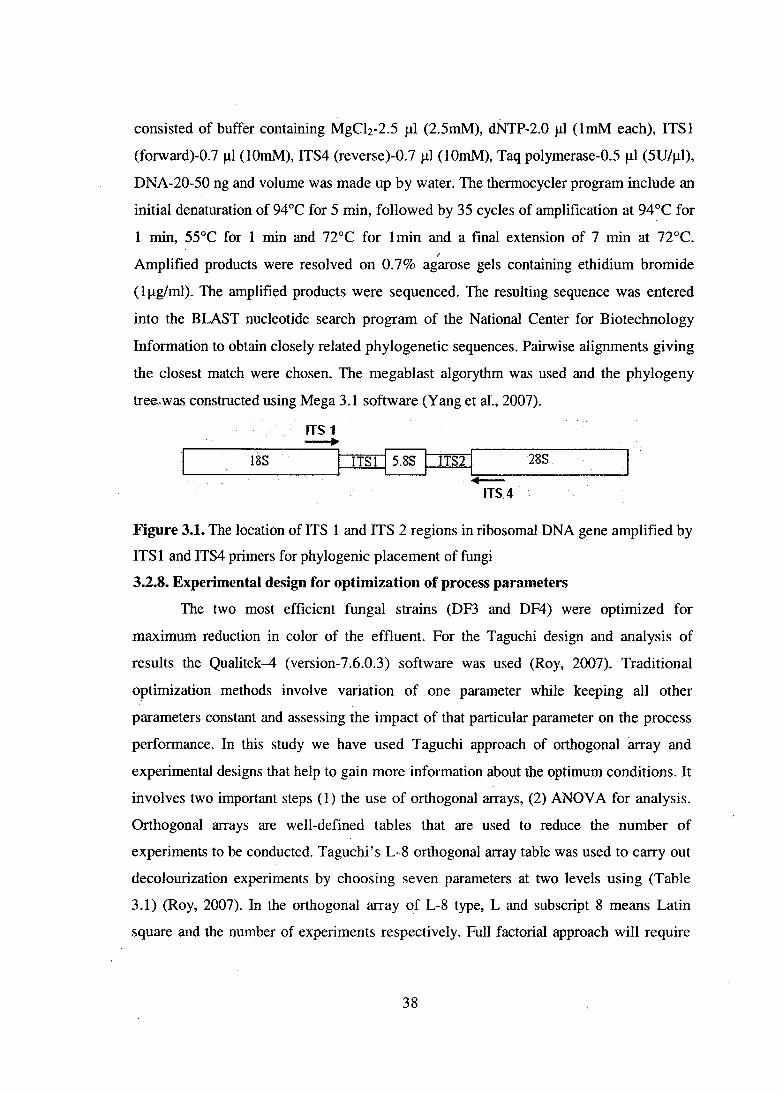
Figure 3.1. The location of ITS 1 and ITS 2 regions in ribosomal DNA gene amplified by
ITS 1 and ITS4 primers for phylogenie placement of fungi
3.2.8. Experimental design for optimization of process parameters
The two most efficient fungal strains (DF3 and DF4) were optimized for
maximum reduction in color of the effluent. For the Taguchi design and analysis of
results the Qualitek-4 (version-7.6.0.3) software was used (Roy, 2007). Traditional
optimization methods involve variation of one parameter while keeping all other
parameters constant and assessing the impact of that particular parameter on the process
performance. In this study we have used Taguchi approach of orthogonal array and
experimental designs that help to gain more information about the optimum conditions. It
involves two important steps (1) the use of orthogonal arrays, (2) ANOVA for analysis.
Orthogonal arrays are well-defined tables that are used to reduce the number of
experiments to be conducted. Taguchi' s L-8 orthogonal array table was used to carry out
decolourization experiments by choosing seven parameters at two levels using (Table
3.1) (Roy, 2007). In the orthogonal array of L-8 type, L and subscript 8 means Latin
square and the number of experiments respectively. Full factorial approach will require
38
128 experiments to be conducted for optimizing a process while in fractional factorial
using L-8 orthogonal array the number of experiments reduces to eight (Bakhtiari et al.,
2006). After designing, the analysis of experimental data was done using ANOV A.
Taguchi approach used ANOV A to evaluate which parameters were statistically
significant in finding the optimum levels (Phadke and Dehnad, 1988).
3.2.9. Screening experiments for decolourization of distillery spent wash
Screening experiments were performed to select most suitable carbon and
nitrogen sources. Various carbon sources were used at an initial concentration 0.05%
(w/v). MSM having distillery spent wash (5000-6000 C.U.) was taken as control. Batch
study was conducted in an Erlenmeyer flasks containing 200ml MSM along with 10%
distillery spent wash, 5% (w/v) inoculum supplemented with different carbon sources
(0.05%). Reduction in color was analyzed after five days. After selecting the most
suitable carbon source, various nitrogen sources were screened at a concentration of
0.05% (w/v). Change in color was analyzed after five days. Same sets of experiments
were carried out for both fungi.
3.2.10. Optimization of growth conditions by Taguchi approach
Once carbon and nitrogen sources were selected, the growth media was optimized
for the optimum concentration of selected carbon and nitrogen sources i.e. carbon (%)
and nitrogen (% ). Other process parameters such as pH, inoculum size, temperature,
RPM and duration were also optimized using their lower and higher levels which were
coded as 1 and 2 respectively (Table 3.1). All the experiments were done in triplicate.
Table 3.1. Seven process parameters and their two levels for optimizing decolourization
of distillery mill effluent by fungal strains
Parameters Levell Level2
Temperature 30°C 35°C
RPM 125 150
pH 3 5
Duration 2 days 3 days
Inoculum size (w/v) 10% 15%
Carbon ( w /v) 0.05% 0.2%
Nitrogen (w/v) 0.025% 0.05%
39

Analysis of the data
The data obtained after the 8 experiments was processed in the Qualitek-4
software with quality characteristics for deriving the optimum level for each parameter
and ultimately arriving at optimal culture conditions. Besides, the contribution of each
individual factor in total decolourization and the interactions among various parameters
was also studied.
Validation
In order to validate the methodology used in optimization, the culture conditions
obtained after optimization was tested and compared with the values predicted by the
model. Experiment was repeated three times. Qualitek-4 software (Nutek Inc.,~MI) for
automatic design of experiments using Taguchi approach was used in this study. This
software is equipped to use L-4 to L-64 orthogonal arrays along with selection of 2 to 63
factors (parameters) with two, three or four levels. The automatic design option in the
software allows selecting the array used and assigning factors to the appropriate columns.
In this study L-8 orthogonal array was used with seven parameters at two levels (Dasu et
al., 2003).
3.2.11. Estimation of enzymes for decolourization
To measure the activities of enzymes, the culture supernatant was obtained by
centrifugation at 8000 x g for 10 min. Four different enzymes; Lignin peroxidase (LiP),
Manganese peroxidase (MnP), Laccase (Lac) and Glucose oxidase (GO) were estimated.
LiP was measured through the oxidation of veratryl alcohol (VA) to veratryl aldehyde at
310 nm using Varian Carry 100 Bio Spectrophotometer (Tien and Kirk, 1988). The
reaction mixture consisted of 2 mM VA, 35 mM sodium tartrate buffer (pH-3.0), and
enzyme. 1 U/ml of enzyme activity is defined as 1 Jlmol of veratryl alcohol oxidized to
veratraldehyde per min. The reaction starts with the addition of 0.36 mM H20 2• MnP
activity was measured through the oxidation of Mn (II) to Mn (Ill) at 270 nm as
described by Wariishi et al. (1992). The reaction mixture consists of 0.5 mM
MnS04.H20, 45 mM sodium malonate buffer (pH-4.5) and enzyme. The reaction started
with the addition of 0.1 mM H20 2• One U/ml of MnP activity was defined as 1 Jlmol of
Mn(II) oxidized to Mn(Ill) per min. Laccase activity was measured by the oxidation of 2,
40
2' -azinodi-3-ethyl-benzothiazoline-6-sulfuric acid (ABTS) at 436 nm (Niku-Paavola et
al., 1988). The reaction mixture contains 10 mM ABTS, 85 mM sodium tartrate buffer
(pH- 3.0) and enzyme. One unit (U/ml) of enzyme activity was defined as the amount of
enzyme required to oxidize 1 J..Lmol substrates per min at 25°C. Glucose oxidase activity
was measured by decrease in reducing sugars at 575 nm (Kona et al., 2001). In this case
0.2 ml of reducing sugar solution was incubated. with 0.2 ml enzyme and citrate
phosphate buffer (1 ml, pH- 5.6).
3.2.12. Detoxification studies
To check the toxicity of treated effluent single cell gel electrophoresis (SCGE) or
comet assay was performed using Saccharomyces cerevisiae MTCC 36 as described by
(Miloshev et al., 2002). Yeast cells were cultured in MYPG media at 30°C. The cells in
log phase of growth were treated with the effluent for 12 h. Then the cells were collected
by centrifugation washed with water and resuspended in S-buffer ( 1 M sorbitol, 25mM
KH2P04, pH 6.5) mixed with low melting agarose having lyticase (2mg/ml) and spread
over the slide. The slides were incubated at 30°C for 20 min to disintegrate the yeast cell
wall and sphaeroblasts were obtained. Slides were incubated in lysis solution (30 mM
NaOH, 1 M NaCl, 0.1% laurylsarcosine, 50 mM EDTA), at pH 12.3 for 1 h to lyse the·
sphaeroblats. The slides were then incubated in buffer (30 mM NaOH, 10 mM EDT A,
pH 12.4), and electrophoresis was performed for 20 min at 0.5 V/cm, 24 rnA. After
electrophoresis the gels were neutralized in 10 mM Tris-HCl pH 7.5 for 10 min. Finally,
the slides were stained with ethidium bromide (lmg/ml). Comets were analyzed using the
fluorescence microscope with an excitation filter of 355 nm and a barrier filter of 460 nm
and connected to a personal computer-based image analysis system. Fifty comets were
analyzed per sample. The fluorescence microscope was fitted with 1 OOOX oil immersion
lens. Cells with damaged DNA appeared like comets. The percentage of DNA in tail was
calculated using the software TriTek Comet ScoreTM Freeware vl.5.2.6 (Miyamae et al.,
1998).
Software
It is a Windows based software for analyzing comets formed during toxicity
analysis by comet assay method. This software has been made by TriTek Corp., U.S.A.
41

3.3. Results
3.3.1. Characterization of effluent
The effluent collected from Modi distilleries, Modinagar, Uttar Pradesh had the
following physico-chemical characteristics.
Table 3.2. Physico-chemical characteristics of distillery spent wash
Parameter Distillery spent wash Color Dark brown pH 3.8-4.0 COD(mgr1
) 80,000-100,000 TDS (mg r 1
) 95,000-110,000 TOC (mg r 1
) ··-· . 50,000-55,000
TSS (mg r 1) 30,000-40,000
Ammonical N (mg r1) 10,000-12,000
Chloride (mg r 1) 5000-8000
Sulphates (mg r 1) 4000--tiOOO
Nitrate (N03-)(mg r 1) 6071
Phosphate (PO/-)(mg r 1) 364
BOD (mgr 1) 40,000-50,000
Nickel ions (ppm) BDL Copper ions (ppm) BDL Zinc ions (ppm) BDL Sodium (ppm) 1180 Potassium (ppm) 870
3.3.2. Isolation and screening of fungal strains for decolourization
Five different types of fungal strains (DF1-DF5) appeared on the plates were
isolated based on morphological differentiation of individual colonies. They were
observed under a microscope, Olympus and Magnus MLX-TR, at 40x and IOOx, attached
with a camera. Fungal myceli~m, spores and the spore attachment were observed (Table
3.3). They were further purified using PDA by repeated culturing and screened on the
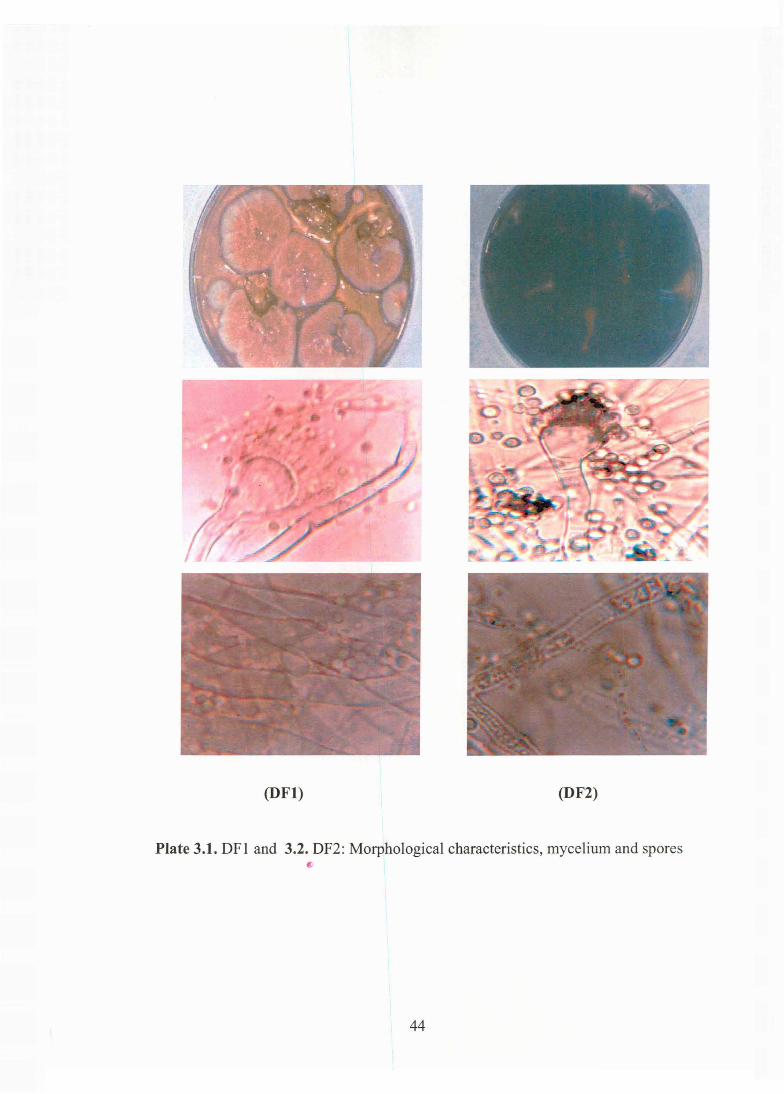
basis of their decolourization potential. The decolourization was measured after 1, 3, 7,
10 and 15 days (Figure 3.2). Maximum reduction in color was observed on lOth day by
DF3 (38%), followed by DF4 (31%), DF5 (23%), DFI (9%) and minimum by DF2 (7%).
The best performing fungal isolates were DF3 and DF4 acclimatized for 3 months at pH
42
3 with 10% distillery spent wash. After acclimatization the time required for
decolourization reduced from 10 days to 3 days.
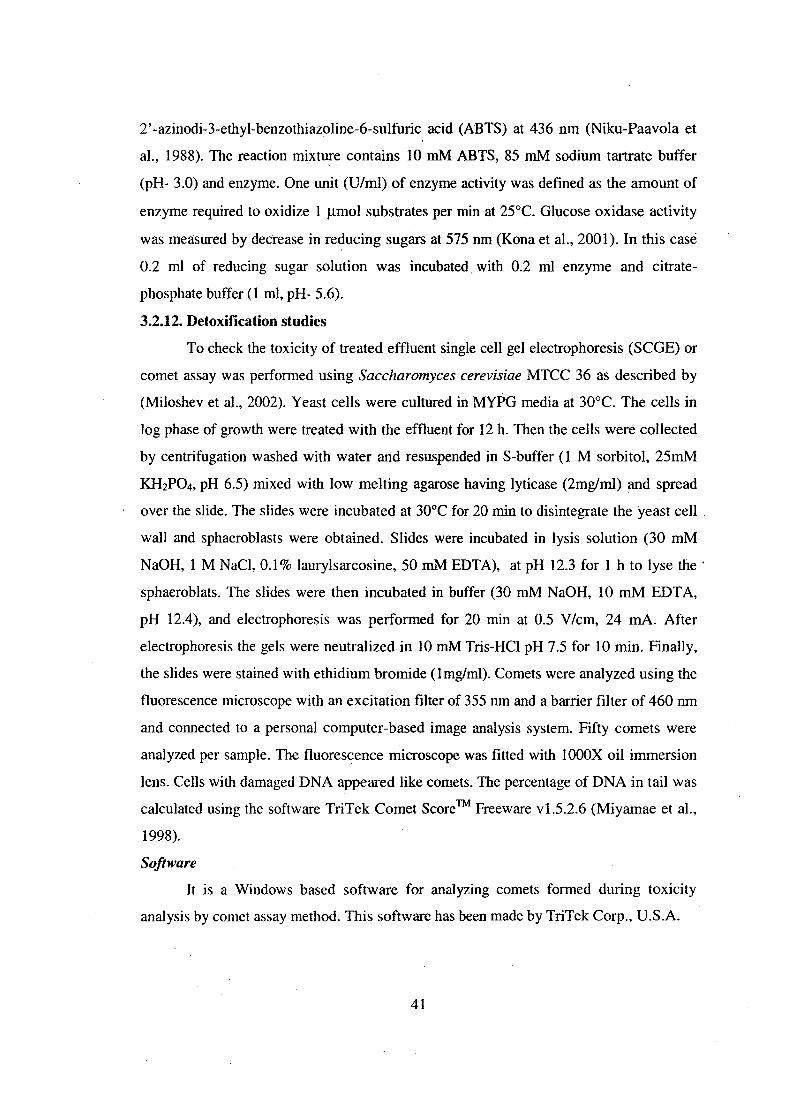
Table 3.3. Morphological identification of fungal strains isolated from distillery effluent
and sludge
Fungal Growth Surface View Reverse View Microscopic Isolate Characteristics DFl Medium Yellow to light Yellow, media Mycelium with white
brown also becomes spores dark yellow
DF2 Fast Sea green White Septate, branched, green mycelia
DF3 Slow White-brown Brownish-red Septate, branched, Red spores
DF4 Fast Sea green White Septate, branched, green spores
DF5 Fast Sea green White Green cottony mycelia
43
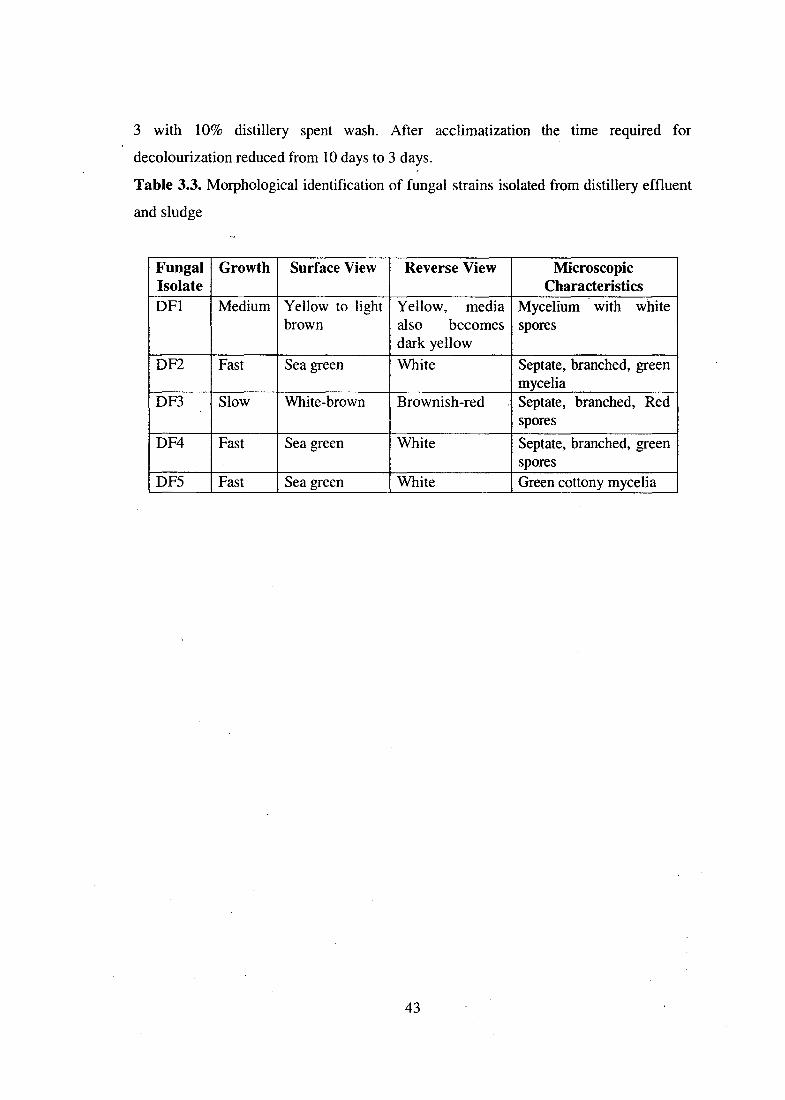
(DFl) (DF2)
Plate 3.1. DFI and 3.2. DF2: Morphological characteristics, mycelium and spores g
44

(DF3) (DF4)
Plate 3.3. DF3 and 3.4. DF4: Morphological characteristics, mycelium and spores
45
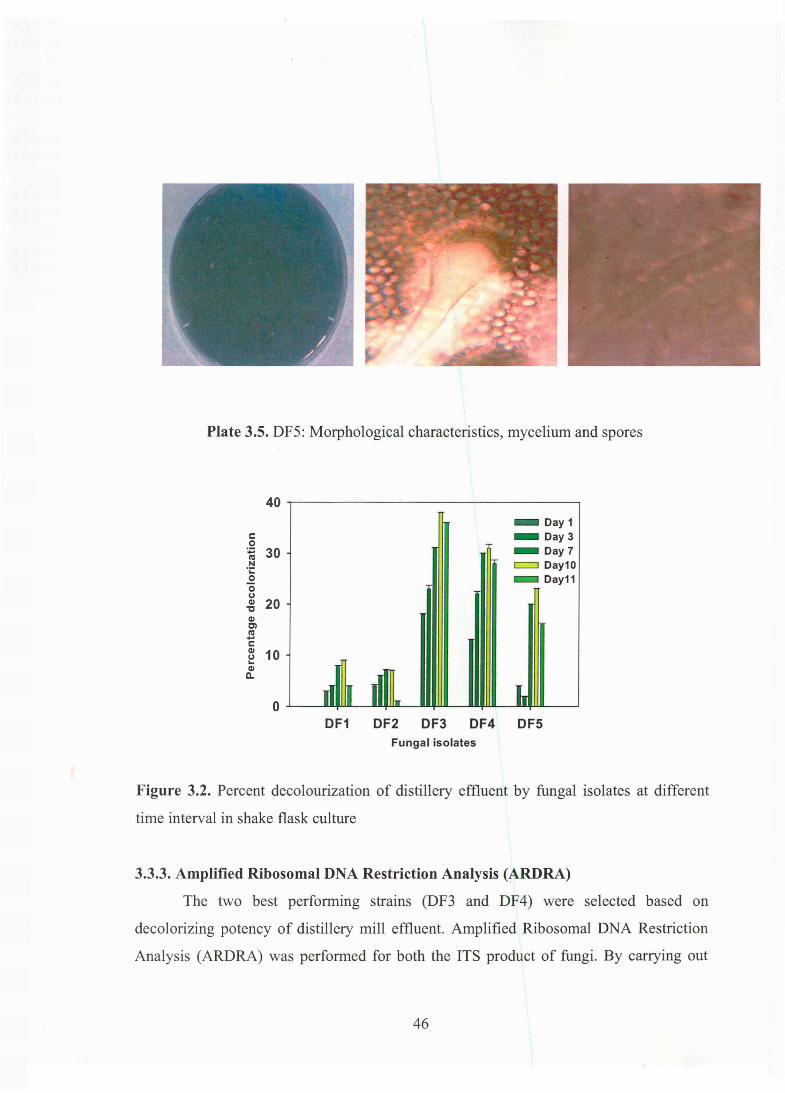
Plate 3.5. DF5: Morphological characteristics, mycelium and spores
40
- Day1 c - Day3 -~ 30 - Day7 cu N c=::J Day10 ·;: 0 - Day11 0 (.) Q) 20 , Q)
Cl nl -c Q) 10 (.) ... Q)
a..
0 DF1 DF2 DF3 DF4 DFS
Fungal isolates
Figure 3.2. Percent decolourization of distillery effluent by fungal isolates at different
time interval in shake flask culture
3.3.3. Amplified Ribosomal DNA Restriction Analysis (ARDRA)
The two best performing strains (DF3 and DF4) were selected based on
decolorizing potency of distillery mill effluent. Amplified Ribosomal DNA Restriction
Analysis (ARDRA) was performed for both the ITS product of fungi. By carrying out
46

restriction fragment analysis (ARDRA), two different patterns were observed on the gel
for both the strains (Figure 3.3). This was further confirmed by subjecting the amplified
ITS products to DNA sequencing.
>200
bp
1100
1000
900
Boo
700
6oo
1100
400
300
200
M 3 4 5 6 M
Figure 3.3. ARDRA profile ofDF3 by mspl (lane 1) and by Haelll (lane 2) and its PCR
amplicon of 18S rDNA (lane 3) and ARDRA profile ofDF4 by mspl (lane 4), by Bam HI
(lane 6) and its PCR amplicon of 18S rDNA (lane 5).
3.3.4. Identification and characterization of fungal strains
The isolates were identified by 18S rDNA sequencing. The ITS sequence of DF3
(Accession no. EU741 056) is as follows:
CGCACCACGTCTTACGAGTGCGGGCTGCCTCCGGGCGTCCTACTCCCCCCGTGACTACC TAACACTGTTGCTTCGGc GGGGAGCCCCCTAGGGGCGAGCCGCCGGGGACCACTGAACT TCATGCCTGAGAGTGATGCAGTCTGAGCCTGAATACAAATCAGTCAAAACTTTCAACAA TGGATCTCTTGGTTCCGGCATCGATGAAGAACGCAGCGAACTGCGATAAGTAATGTGAA TTGCAAAATTCAGTGAATCATACAGTCTTTGAACCCACATTGCGCCCCCTGGGATTCCG GGGGGCATCGCTGTCTTTTTTTTCTATGCCGGCATCAAGAGATGCTTGTGTGAAACTTT GAGTGACTTGTATTAAACTCACACTGCGCCACTCTCCCGCCCAAAATCAGTGGTCCCCG GCGGCCCTTTAAAAGGGTCAATCCCGGATACCCCGACCAGGAGGGAACCCCAATCCTGC
This sequence of the amplified region i.e. ITSI, 5.8S and ITS 4 of DF3 was
blasted using NCBI and the phylogeny tree was constructed using Mega 3.1 software.
Figure 3.4 shows the phylogeny tree of DF3. The fungal strain was close to Emericella
nidulans var. lata (DF3) having 98% homology.
47

.-----..,.-------------------'"'·U741056
Emericella nidulans var.lata
1----.Emericella striata
Emericella rugulosa strain SRRC
Emericella quadrilineata strain ATCC 16816
Emericella nidiJians
Emericella nidulans environmental isolate Emericella quadrilineata
Emericella sublata
Emericella montenegroi
·Emericella acristata ·
Emericella riJgulosa
Emericella parvathecia
Emericella miyajii
Aspergillus caespitosus isolate MTCC 6326
r---Emericella corrugata
Emericella similis
1----Emericella omanensis
Emericella violacea
Emericella fruticulosa
Aspergillus flavus AHS-513-254
Emericella dentata
mericella cleistominuta
Emericella foveolata
H ·o.oo1
Figure 3.4. Phylogenetic placement of DF3, Emericella nidulans var. lata, based on 18 S
rDNA analysis
Similarly DF4 sequence (Accession no. EU741055) was identified as Neurospora
intermedia (Figure 3.5). However, this is the first report presenting the role of
Neurospora intermedia (DF4) in decolourization studies.
48

TAGCTCAGGGTGGTATTCCTACCTGATCCGAGGTACACTTAGAAATGGGGGGTTTTACG GCAAGAACCCGCCGCACGACCATAGCGATGTAGAGTTACTACGCTCGGTGTGACTAGCG AGCCCGCCACTGATTTTGAGGGACCGCGGACAGCCGCGGATCCCCAACGCAAGCAGAGC TTGATGGTTGAAATGACGCTCGAACAGGCATGCTCGCCAGAATACTGGCGAGCGCAATG TGCGTTCAAAGATTCGATGATTCACTGAATTCTGCAATTCACATTACTTATCGCATTTC GCTGCGTTCTTCATCGATGCCAGAACCAAGAGATCCGTTGTTGAAAGTTTTGACTTATT TAAAAGTTTACTCAGAGAGACATAAAATATCAAGAGTTTAGTTTCGGCACTCCGGCGGG CAGCCTCCCGCGAGCGGGAGACCCGAGGGTCCGGGAGGGCCCGAGGGCCTTTCCGGACC GCCAGCGCCGAGGCAACCGTACGGGTAAGATTCGCGATGGTTTGTGGGAGTTTTGCAAC TCTGTAATGATCCCTCCGCAGTTTCCACTTACGA
Neurospora crassa
Neurospora tetrasperma
Neurospora sitophila isolate FGSC 1135
L----'-----__:_:=----Neurospora discreta isolate FGSC 6794
Gelasinospora cratophora
Gelasinospora brevispora
.___'----~Gelasinospora bonaerensis
Neurospora africana
'-----1 Neurospora dodgei isolate FGSC 1692 ·
.-----,-------"Gelasinospora hapsidophora L---------------~
'------- Gelasinospora santi-florii
Sordai-ia tomento-alba
Asordaria conoidea
Asordaria prolifica
Neurospora dictyophora
Neurospora cerealis
'--------~~Asordaria tenerifae
.__ __ Sordaria fimicola
Sordaria superba
Sordaria lappae
Asordaria sibutii
._____.,...sordaria arctica
1-----l 0.001
Figure 3.5. Phylogenetic placement of DF4, Neurospora intermedia, based on 18 S
rDNA analysis
49
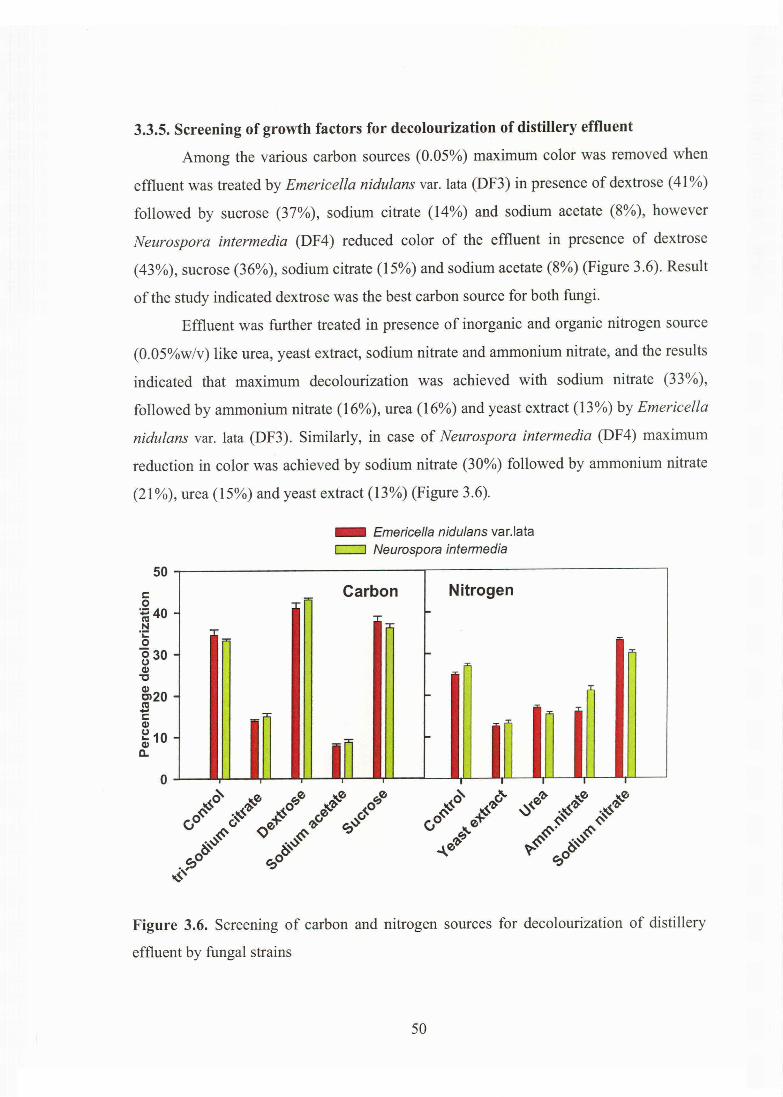
3.3.5. Screening of growth factors for decolourization of distillery effluent
Among the various carbon sources (0.05%) maximum color was removed when
effluent was treated by Emericella nidulans var. lata (DF3) in presence of dextrose ( 41%)
followed by sucrose (37%), sodium citrate (14%) and sodium acetate (8%), however
Neurospora intermedia (DF4) reduced color of the effluent in presence of dextrose
(43%), sucrose (36%), sodium citrate (15%) and sodium acetate (8%) (Figure 3.6). Result
of the study indicated dextrose was the best carbon source for both fungi.
Effluent was further treated in presence of inorganic and organic nitrogen source
(0.05%w/v) like urea, yeast extract, sodium nitrate and ammonium nitrate, and the results
indicated that maximum decolourization was achieved with sodium nitrate (33%),
followed by ammonium nitrate (16%), urea (16%) and yeast extract (13%) by Emericella
nidulans var. lata (DF3). Similarly, in case of Neurospora intermedia (DF4) maximum
reduction in color was achieved by sodium nitrate (30%) followed by ammonium nitrate
(21 %), urea (15%) and yeast extract (13%) (Figure 3.6).
c: 0
50
~40 N
·;: 0 030 0 Q)
"C
~20 .s c: Q)
~10 Q)
c..
0
?'
- Emericella nidulans var.lata c::::=J Neurospora intermedia
Carbon Nitrogen -
;r
~
I 1 ~
Figure 3.6. Screening of carbon and nitrogen sources for decolourization of distillery
effluent by fungal strains
50

3.3.6. Determination of optimum conditions using Taguchi method
Experiments were conducted on optimization for increased decolourization
according to the L-8 orthogonal array. Total eight experiments were conducted. Same
sets of experiments (Table 3.4) were carried out with both fungi. Results showed that
maximum decolourization achieved by Emericella nidulans var. lata (DF3)(62%) when
experiment conditions were as follows: temperature 30°C, pH 3, agitation 125rpm,
duration 3 days, inoculum size 10% (w/v), carbon (dextrose) 0.05% (w/v), nitrogen
(sodium nitrate) (0.025%)(w/v). For Neurospora intennedia (DF4) the optimum
conditions for maximum decolourization (64%) were: temperature 30°C, pH 3, agitation
125rpm, duration 2 days, inoculum size 10% (w/v), carbon (dextrose) 0.05% (w/v),
nitrogen (sodium nitrate) (0.025%)(w/v).
Table 3.4 shows the results obtained after performing the experiments. The
effective influence of a Taguchi L-8 orthogonal array designed experimental conditioned
on maximum decolourization could be viewed and the data revealed variation in
percentage decolourization of distillery spent wash (Table 3.4). The observed variation
certainly indicated the imperative role of optimization of all factors in achieving the best
possible results.
51
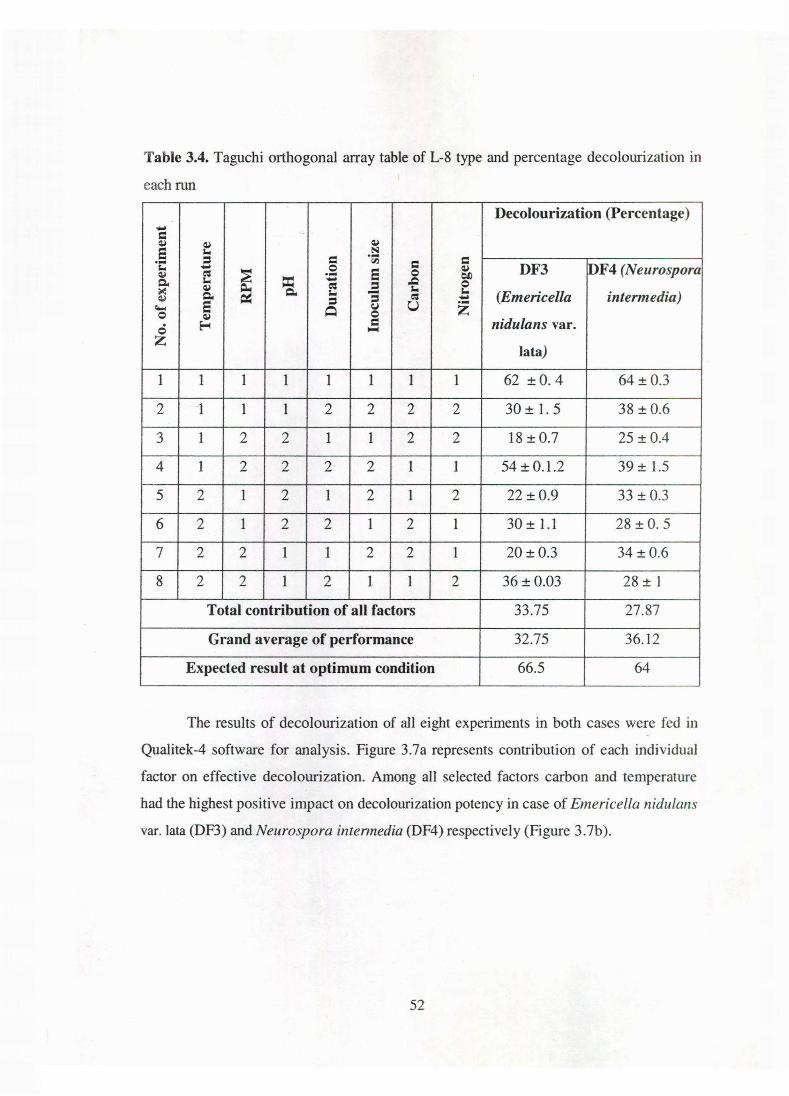
Table 3.4. Taguchi orthogonal array table of L-8 type and percentage decolourization in
each run
Decolourization (Percentage) -= a,) a,) a,)
s t... N
= = ·- = ·- fll c DF4(!Veurospora t... - 0 s a,) DF3 a,) c: :E ·- 0 on Q., t... = ..... ,Q
~ c: = 0 >< a,) Q., t... - t... t... a,) Q., ~ = = c: - (Emericella intermedia)
eo.. s Q ~ u z 0 a,) 0
0 ~ c nidulans var. ~
z lata)
1 1 1 1 1 1 1 1 62 ±0. 4 64 ± 0.3
2 1 1 1 2 2 2 2 30 ± 1. 5 38 ± 0.6
3 1 2 2 1 1 2 2 18 ± 0.7 25 ± 0.4
4 1 2 2 2 2 1 1 54±0.1.2 39 ± 1.5
5 2 1 2 1 2 1 2 22 ± 0.9 33 ± 0.3
6 2 1 2 2 1 2 1 30 ± 1.1 28 ± 0. 5
7 2 2 1 1 2 2 1 20 ± 0.3 34 ± 0.6
8 2 2 1 2 1 1 2 36 ± 0.03 28 ± 1
Total contribution of all factors 33.75 27.87
Grand average of performance 32.75 36.12
Expected result at optimum condition 66.5 64
The results of decolourization of all eight experiments in both cases were fed in
Qualitek-4 software for analysis. Figure 3.7a represents contribution of each individual
factor on effective decolourization. Among all selected factors carbon and temperature
had the highest positive impact on decolourization potency in case of Emericella nidulans
var. Jata (DF3) and Neurospora intennedia (DF4) respectively (Figure 3.7b).
52

DF3
- Temperature RPM
= pH - Duration
DF4
- Inoculum size - Nitrogen - Carbon
(a)
DF3
Avg 2 3 4 5 6 7 8Total
- Avg Col 2 - Carbon
= Col 3 -Temperature - Col 4 - Nitrogen - Coi5-RPM - Col 6 - Duration - Co17-pH - Col 8 - Inoculum Size (b)
DF4
Avg 2 3 4 5 6 7 8Total
- Avg Col 2 -Temperature
= Col 3 - Carbon - Col 4 - Nitrogen - Col5-pH - Co16-RPM - Col 7 -Duration - Col 8 - Inoculum Size
Figure 3.7. (a) Percent contribution of different factors. (b) The individual contribution
of each factor in effluent treatment (color reduction) at optimized conditions
The optimization software provided an opportunity to study the multi interaction
effect of the factors. The contribution of individual factor is the key to control the
biological processes. For each factor there is an optimum level. Figure 3.8 shows the
increase or decrease in decolourization for each factor at different levels. The optimum
level of dextrose, most suitable carbon source, was 0.05 % w/v i.e. level one. Increasing
the dextrose concentration 0.2 % (level 2) reduced the decolourization drastically in both
cases (Figure 3.8). The percent of decolourization was increased in case of Emericella
nidulans var. lata (DF3) when the factor duration was taken from level 1 (two days) to
level 2 (three days). However, reverse effects were seen in case Neurospora intermedia
(DF4).
53

__._Initial decolorization ···0·· Effect of different factors
Em ericel/a nidulans var. lata Neurospora in term edia 42 a 4 2 - 0 Carbon Carbon 3 8 -
3 8 -3 4 - • • • • 30 - 34
26 0 - .b 30
42 a Nitrogen 4 2 - 0 Nitrogen 38
3 8 -34 • • • • . 30 - 3 4 -
26 a - b 30
42 - . 42 . . Inoculum Size Inoculum Size
U) 38 38 -- 34 ~-- .. 0 0 ()
····-~ G) 34 -= 30 -G)
26 - 30 -c 42 . co Duration 42 - Duration E 38 -
0 - 34 .. a 38 0 • • • • U) 30 o· 34 - ·a ~ c. 26 30 -co 42 '-en pH 42 -
0 pH ..! 38 -c. 34 - 0 .. 38
E • • • • 30 - ··a 34 :::s
:liE 26 a 30 -
42
RPM 42 -RPM 38 0
0 38 -34 - • • • •
30 - ·a 34 a
26 30 -42 c._ .
42 -Tern perature 0 Tern perature 38 -
38 -34 - • • • • 30 - 34 -
26 - 30 - ·a b
Level1 Level2 Level1 Level 2
Figure 3.8. Individual factor performance at different levels in decolourization of
distillery mill effluent by fungi. In figure, ~is initial decolourization and
· .. o ... effect of different factors
54
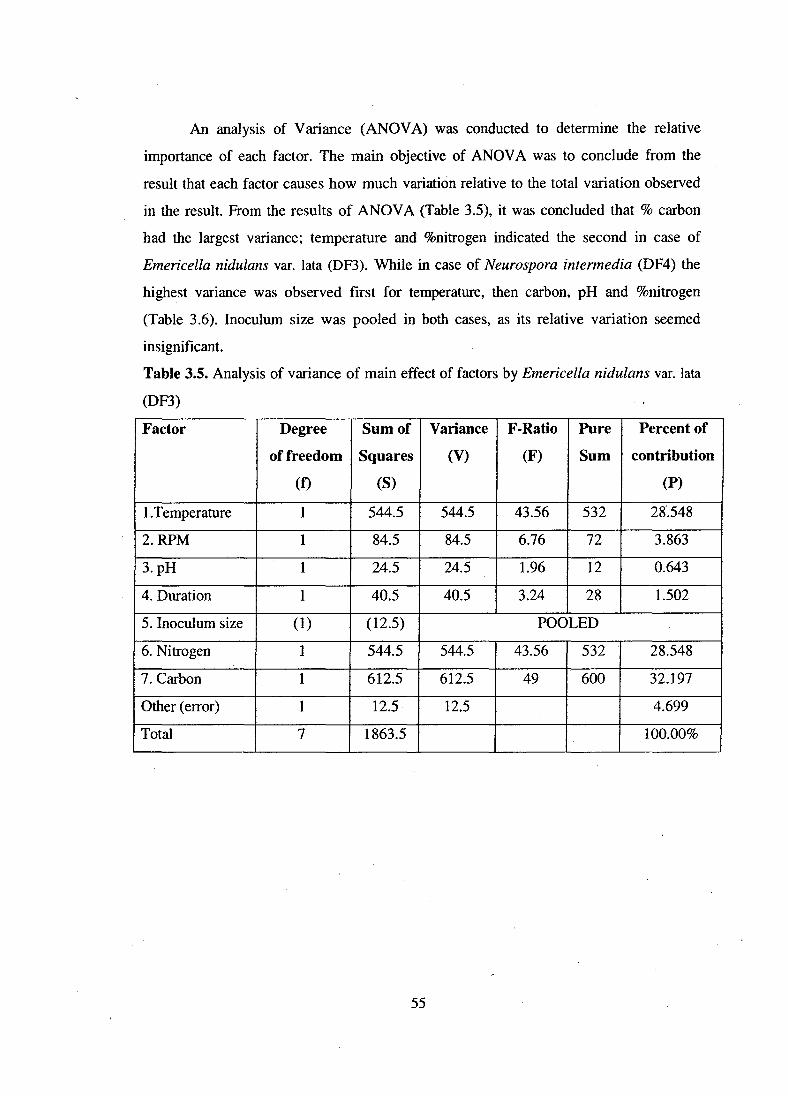
An analysis of Variance (ANOV A) was conducted to determine the relative
importance of each factor. The main objective of ANOV A was to conclude from the
result that each factor causes how much variation relative to the total variation observed
in the result. From the results of ANOV A (Table 3.5), it was concluded that % carbon
had the largest variance; temperature and %nitrogen indicated the second in case of
Emericella nidulans var. lata (DF3). While in case of Neurospora intermedia (DF4) the
highest variance was observed first for temperature, then carbon, pH and %nitrogen
(Table 3.6). Inoculum size was pooled in both cases, as its relative variation seemed
insignificant.
Table 3.5. Analysis of variance of main effect of factors by Emericella nidulans var. lata
(DF3)
Factor Degree Sum of Variance F-Ratio Pure Percent of
of freedom Squares (V) (F) Sum contribution
(f) (S) (P)
1. Temperature 1 544.5 544.5 43.56 532 28'.548
2.RPM 1 84.5 84.5 6.76 72 3.863
3.pH 1 24.5 24.5 1.96 12 0.643
4. Duration 1 40.5 40.5 3.24 28 1.502
5. Inoculum size (1) (12.5) POOLED
6. Nitrogen 1 544.5 544.5 43.56 532 28.548
7. Carbon 1 612.5 612.5 49 600 32.197
Other (error) 1 12.5 12.5 4.699
Total 7 1863.5 100.00%
55
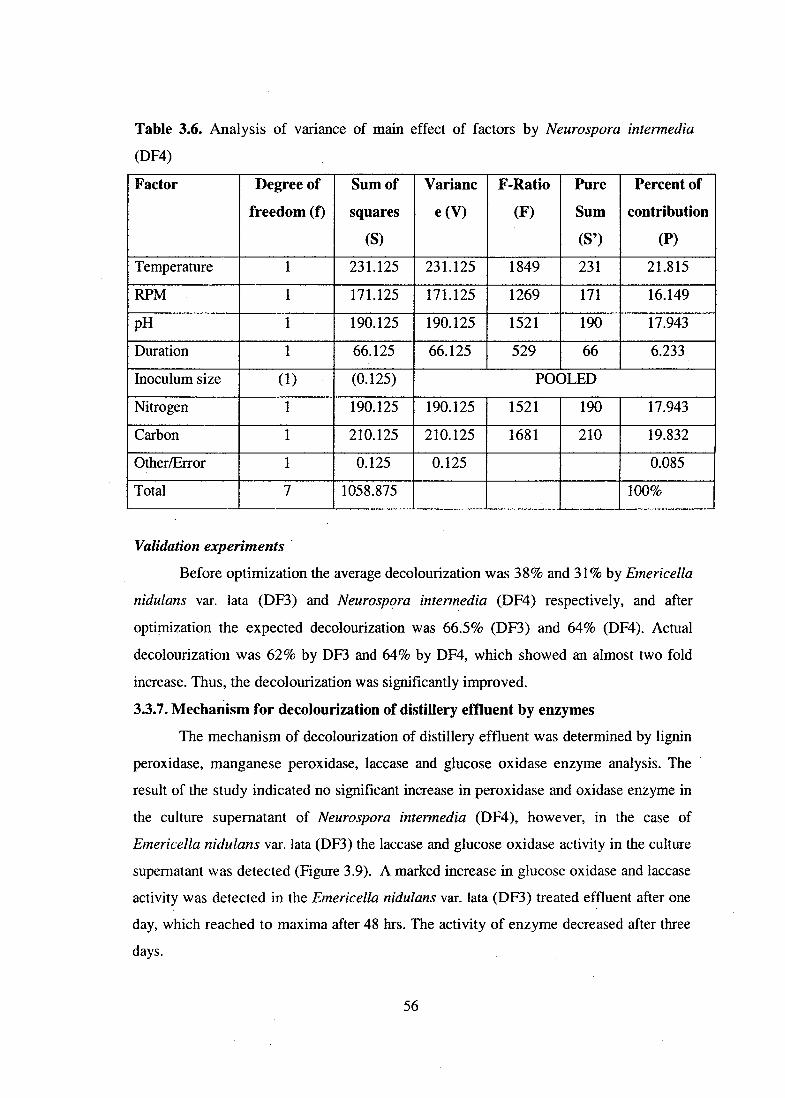
Table 3.6. Analysis of variance of main effect of factors by Neurospora intennedia
(DF4)
Factor Degree of Sum of Varianc F-Ratio Pure Percent of
freedom (f) squares e(V) (F) Sum contribution
(S) (S') (P)
Temperature 1 231.125 231.125 1849 231 21.815
RPM 1 171.125 171.125 1269 171 16.149
pH 1 190.125 190.125 1521 190 17.943
Duration 1 66.125 66.125 529 66 6.233
Inoculum size (1) (0.125) POOLED
Nitrogen 1 190.125 190.125 1521 190 17.943
Carbon 1 210.125 210.125 1681 210 19.832
Other/Error 1 0.125 0.125 0.085
Total 7 1058.875 100%
Validation experiments ·
Before optimization the average decolourization was 38% and 31% by Emericella
nidulans var. lata (DF3) and Neurospqra intennedia (DF4) respectively, and after
optimization the expected decolourization was 66;5% (DF3) and 64% (DF4). Actual
decolourization was 62% by DF3 and 64% by DF4, which showed an almost two fold
increase. Thus, the decolourization was significantly improved.
3.3.7. Mechanism for decolourization of distillery effluent by enzymes
The mechanism of decolourization of distillery effluent was determined by lignin
peroxidase, manganese peroxidase, laccase and glucose oxidase enzyme analysis. The
result of the study indicated no significant increase in peroxidase and oxidase enzyme in
the culture supernatant of Neurospora intennedia (DF4), however, in the case of
Emericella nidulans var. lata (DF3) the laccase and glucose oxidase activity in the culture
supernatant was detected (Figure 3.9). A marked increase in glucose oxidase and laccase
activity was detected in the Emericella nidulans var. lata (DF3) treated effluent after one
day, which reached to maxima after 48 hrs. The activity of enzyme decreased after three
days.
56

- Emericella nidulans var.lata - Neurospora intermedia
80 Glucose Oxidase
0 I • I i li I •
Laccase
0 'I II I I Iii 0 1 2 3 4 5
DAYS Figure 3.9. Estimation of enzyme activity of Glucose oxidase and Laccase in Emericella
nidulans var. lata (DF3) and Neurospora intermedia (DF4) in presence of 10% distillery
effluent
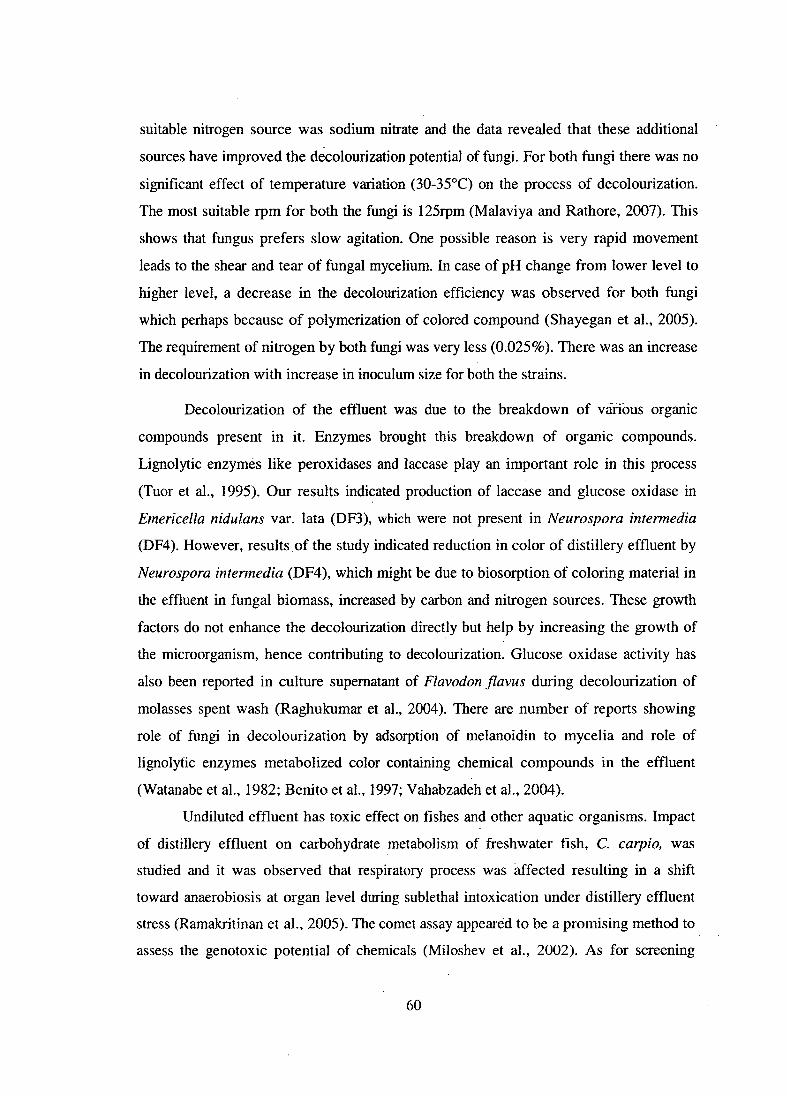
3.3.8. Analysis of detoxification of distillery effluent
In Comet assay, Saccharomyces cerevisiae MTCC 36 was treated by distilled
water, homogenous mixture of distillery spent wash, and effluent treated by fungi (DF3,
DF4). The cells of Saccharomyces cerevisiae MTCC 36 were lysed and alkaline single
cell gel electrophoresis was performed (Figure 3.1 Oa-d). The alkaline buffer was used for
the unwinding and electrophoresis. No Comets were observed in distilled water treated
cells (Figure 3.10a), while almost all cells were converted to comet after treatment with
distillery spent wash (Figure 3.10b). A clear reversibility was observed in the
fluorescence microscope in the cells of Saccharomyces cerevisiae MTCC 36 when
effluent treated by fungi Emericella nidulans var. lata (Figure 3.10c) and Neurospora
intermedia (Figure 3.1 Od). The comets were further analyzed by comet score software to
quantify the toxicity effect. Percent DNA in tail was evaluated. Higher the amount of
57
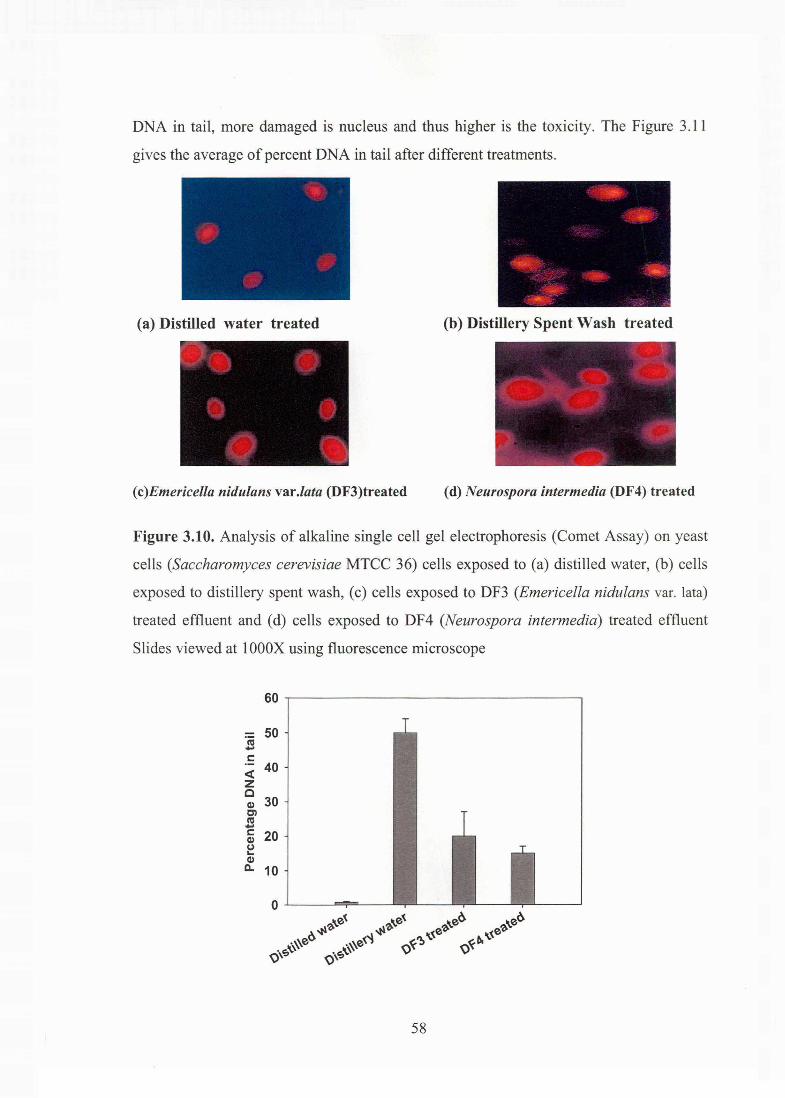
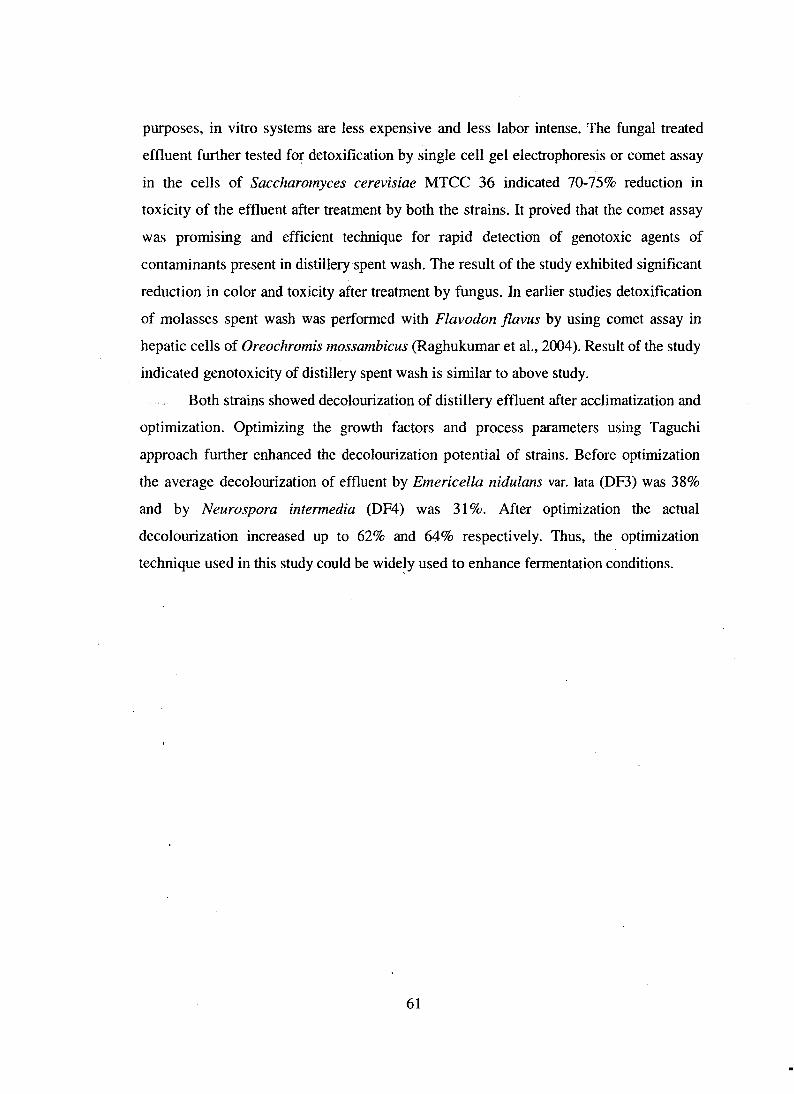
DNA in tail, more damaged is nucleus and thus higher is the toxicity. The Figure 3.11
gives the average of percent DNA in tail after different treatments.
(a) Distilled water treated (b) Distillery Spent Wash treated
(c)Emericella nidulans var.lata (DF3)treated (d) Neurospora intermedia (DF4) treated
Figure 3.10. Analysis of alkaline single cell gel electrophoresis (Comet Assay) on yeast
cells (Saccharomyces cerevisiae MTCC 36) cells exposed to (a) distilled water, (b) cells
exposed to distillery spent wash, (c) cells exposed to DF3 (Emericella nidulans var. lata)
treated effluent and (d) cells exposed to DF4 (Neurospora intermedia) treated effluent
Slides viewed at 1 OOOX using fluorescence microscope
nl -c::
50
<( 40 z c G,) 30 Cl nl -~ 20 ~ G,)
c. 10
58
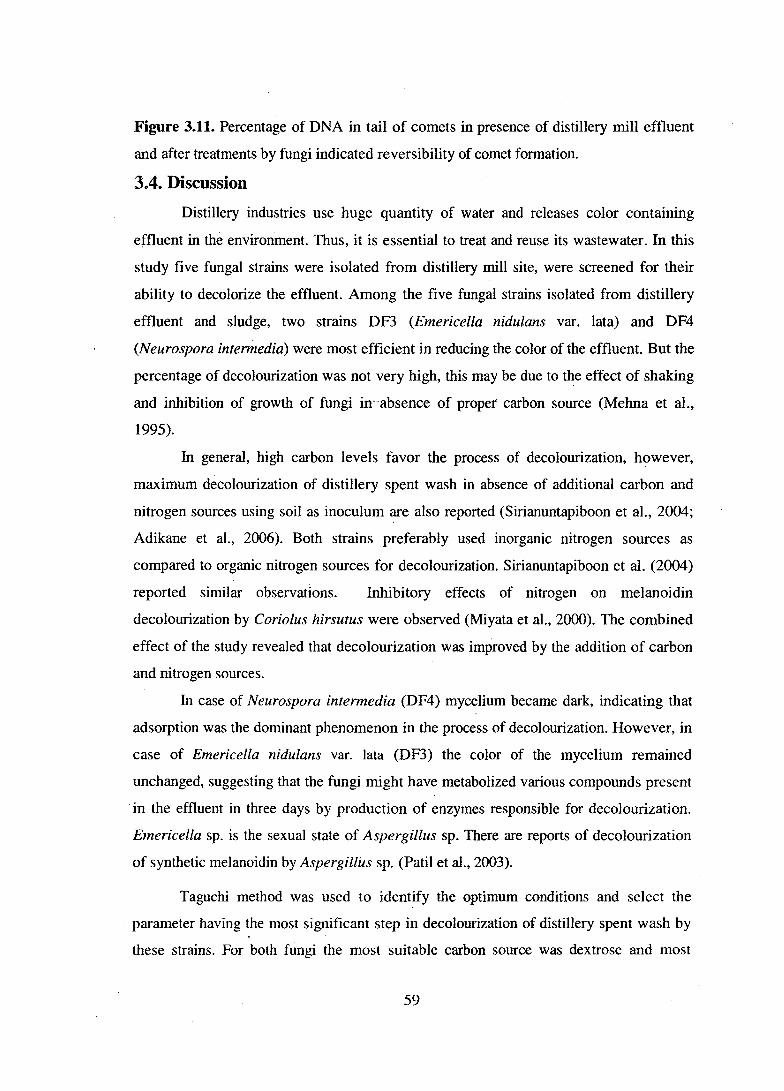
Figure 3.11. Percentage of DNA in tail of comets in presence of distillery mill effluent
and after treatments by fungi indicated reversibility of comet formation.
3.4. Discussion
Distillery industries use huge quantity of water and releases color containing
effluent in the environment. Thus, it is essential to treat and reuse its wastewater. In this
study five fungal strains were isolated from distillery mill site, were screened for their
ability to decolorize the effluent. Among the five fungal strains isolated from distillery
effluent and sludge, two strains DF3 (Emericella nidulans var. lata) and DF4
(Neurospora intennedia) were most efficient in reducing the color of the effluent. But the
percentage of decolourization was not very high, this may be due to the effect of shaking
and inhibition of growth of fungi in -absence of proper carbon source (Mehna et al.,
1995).
In general, high carbon levels favor the process of decolourization, however,
maximum decolourization of distillery spent wash in absence of additional carbon and
nitrogen sources using soil as inoculum are also reported (Sirianuntapiboon et al., 2004;
Adikane et al., 2006). Both strains preferably used inorganic nitrogen sources as
compared to organic nitrogen sources for decolourization. Sirianuntapiboon et al. (2004)
reported similar observations. Inhibitory effects of nitrogen on melanoidin
decolourization by Coriolus hirsutus were observed (Miyata et al., 2000). The combined
effect of the study revealed that decolourization was improved by the addition of carbon
and nitrogen sources.
In case of Neurospora intermedia (DF4) mycelium became dark, indicating that
adsorption was the dominant phenomenon in the process of decolourization. However, in
case of Emericella nidulans var. lata (DF3) the color of the mycelium remained
unchanged, suggesting that the fungi might have metabolized various compounds present
in the effluent in three days by production of enzymes responsible for decolourization.
Emericella sp. is the sexual state of Aspergillus sp. There are reports of decolourization
of synthetic melanoidin by Aspergillus sp. (Patil et al., 2003).
Taguchi method was used to identify the optimum conditions and select the
parameter having the most significant step in decolourization of distillery spent wash by
these strains. For both fungi the most suitable carbon source was dextrose and most
59
suitable nitrogen source was sodium nitrate and the data revealed that these additional
sources have improved the decolourization potential of fungi. For both fungi there was no
significant effect of temperature variation (30-35°C) on the process of decolourization.
The most suitable rpm for both the fungi is 125rpm (Malaviya and Rathore, 2007). This
shows that fungus prefers slow agitation. One possible reason is very rapid movement
leads to the shear and tear of fungal mycelium. In case of pH change from lower level to
higher level, a decrease in the decolourization efficiency was observed for both fungi
which perhaps because of polymerization of colored compound (Shayegan et al., 2005).
The requirement of nitrogen by both fungi was very less (0.025% ). There was an increase
in decolourization with increase in inoculum size for both the strains.
Decolourization of the effluent was due to the breakdown of various organic
compounds present in it. Enzymes brought this breakdown of organic compounds.
Lignolytic enzymes like peroxidases and laccase play an important role in this process
(Tuor et al., 1995). Our results indicated production of laccase and glucose oxidase in
Emericella nidulans var. lata (DF3), which were not present in Neurospora intermedia
(DF4). However, results of the study indicated reduction in color of distillery effluent by
Neurospora intermedia (DF4), which might be due to biosorption of coloring material in
the effluent in fungal biomass, increased by carbon and nitrogen sources. These growth
factors do not enhance the decolourization directly but help by increasing the growth of
the microorganism, hence contributing to decolourization. Glucose oxidase activity has
also been reported in culture supernatant of Flavodon flavus during decolourization of
molasses spent wash (Raghukumar et al., 2004). There are number of reports showing
role of fungi in decolourization by adsorption of melanoidin to mycelia and role of
lignolytic enzymes metabolized color containing chemical compounds in the effluent
(Watanabe et al., 1982; Benito et al., 1997; Vahabzadeh et al., 2004).
Undiluted effluent has toxic effect on fishes and other aquatic organisms. Impact
of distillery effluent on carbohydrate metabolism of freshwater fish, C. carpio, was
studied and it was observed that respiratory process was affected resulting in a shift
toward anaerobiosis at organ level during sublethal intoxication under distillery effluent
stress (Ramakritinan et al., 2005). The comet assay appeared to be a promising method to
assess the genotoxic potential of chemicals (Miloshev et al., 2002). As for screening
60
purposes, in vitro systems are less expensive and less labor intense. The fungal treated
effluent further tested for detoxification by single cell gel electrophoresis or comet assay
in the cells of Saccharomyces cerevisiae MTCC 36 indicated 70-75% reduction in
toxicity of the effluent after treatment by both the strains. It proved that the comet assay
was promising and efficient technique for rapid detection of genotoxic agents of
contaminants present in distillery spent wash. The result of the study exhibited significant
reduction in color and toxicity after treatment by fungus. In earlier studies detoxification
of molasses spent wash was performed with Flavodon flavus by using comet assay in
hepatic cells of Oreochromis mossambicus (Raghukumar et al., 2004). Result of the study
indicated genotoxicity of distillery spent wash is similar to above study.
Both strains showed decolourization of distillery effluent after acclimatization and
optimization. Optimizing the growth factors and process parameters using Taguchi
approach further enhanced the decolourization potential of strains. Before optimization
the average decolourization of effluent by Emericella nidulans var. lata (DF3) was 38%
and by Neurospora intermedia (DF4) was 31%. After optimization the actual
decolourization increased up to 62% and 64% respectively. Thus, the optimization
technique used in this study could be wide~y used to enhance fermentation conditions.
61
Related Documents