Screening analysis of Climate Scenarios Jayantha Obeysekera , Jenifer Barnes, Moysey Ostrovsky Hydrologic & Environmental Systems Modeling Predicting Ecological Change in the Florida Everglades in a Future Climate Change Scenario Florida Atlantic University February 14-15, 2013

Welcome message from author
This document is posted to help you gain knowledge. Please leave a comment to let me know what you think about it! Share it to your friends and learn new things together.
Transcript
Screening analysis of Climate Scenarios Jayantha Obeysekera , Jenifer Barnes, Moysey Ostrovsky Hydrologic & Environmental Systems Modeling
Predicting Ecological Change in the Florida Everglades in a Future Climate Change Scenario Florida Atlantic University February 14-15, 2013
HYDROLOGIC & ENVIRONMENTAL SYSTEMS MODELING
Outline
Rationale for scenario selection • Temperature • Precipitation • Sea Level Rise
Scenario simulation using SFWMM (a.k.a. 2x2 model) • Peek at results
HYDROLOGIC & ENVIRONMENTAL SYSTEMS MODELING
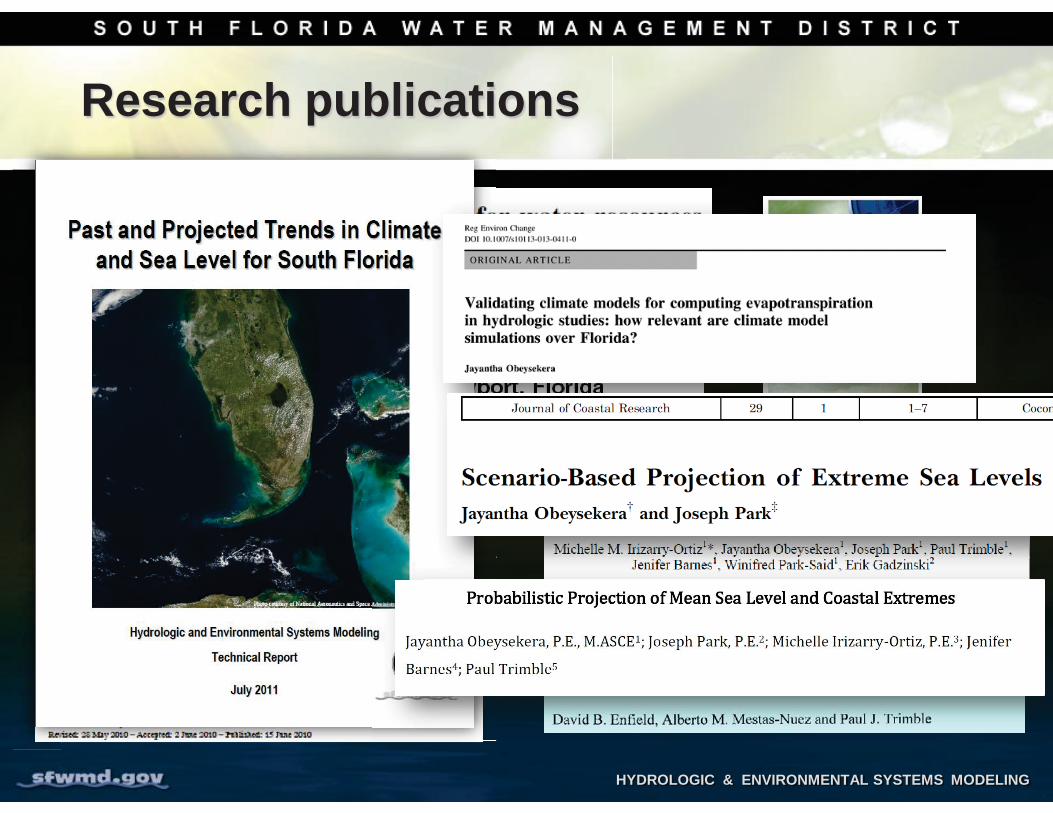
Research publications
HYDROLOGIC & ENVIRONMENTAL SYSTEMS MODELING
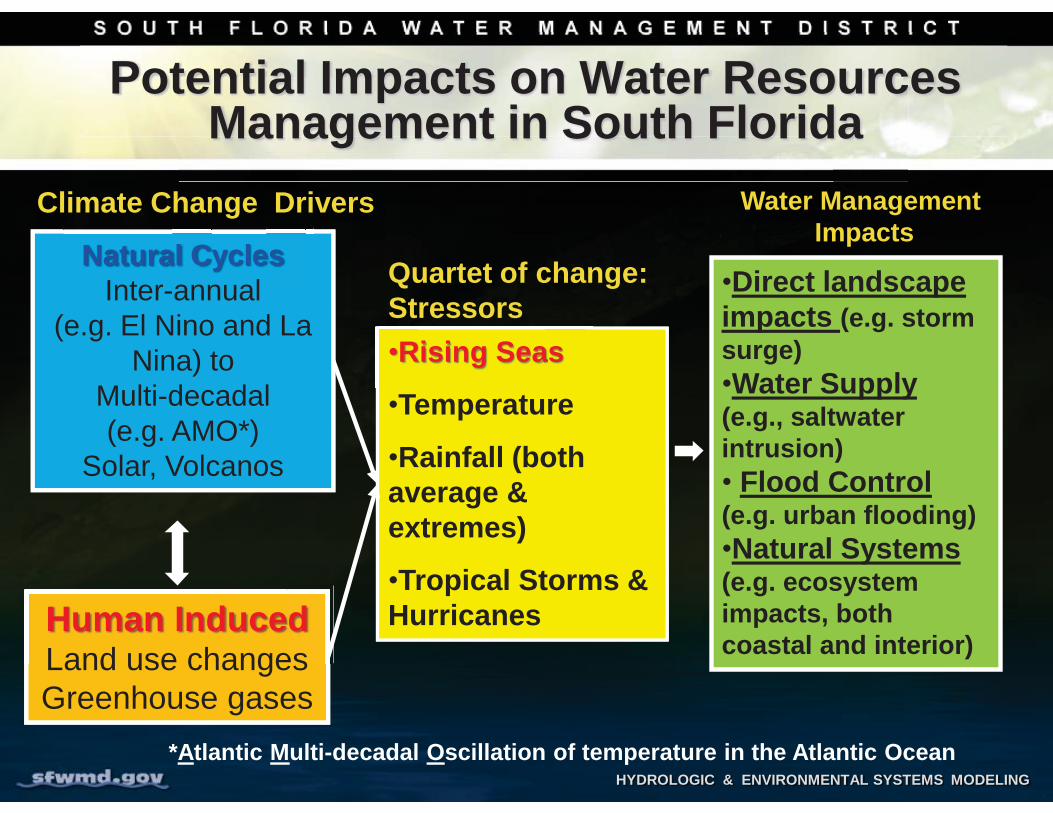
Potential Impacts on Water Resources Management in South Florida
Natural Cycles Inter-annual
(e.g. El Nino and La Nina) to
Multi-decadal (e.g. AMO*)
Solar, Volcanos
Human Induced Land use changes Greenhouse gases
Climate Change Drivers
Quartet of change: Stressors •Rising Seas
•Temperature
•Rainfall (both average & extremes)
•Tropical Storms & Hurricanes
Water Management Impacts
•Direct landscape impacts (e.g. storm surge) •Water Supply (e.g., saltwater intrusion) • Flood Control (e.g. urban flooding) •Natural Systems (e.g. ecosystem impacts, both coastal and interior)
*Atlantic Multi-decadal Oscillation of temperature in the Atlantic Ocean
HYDROLOGIC & ENVIRONMENTAL SYSTEMS MODELING
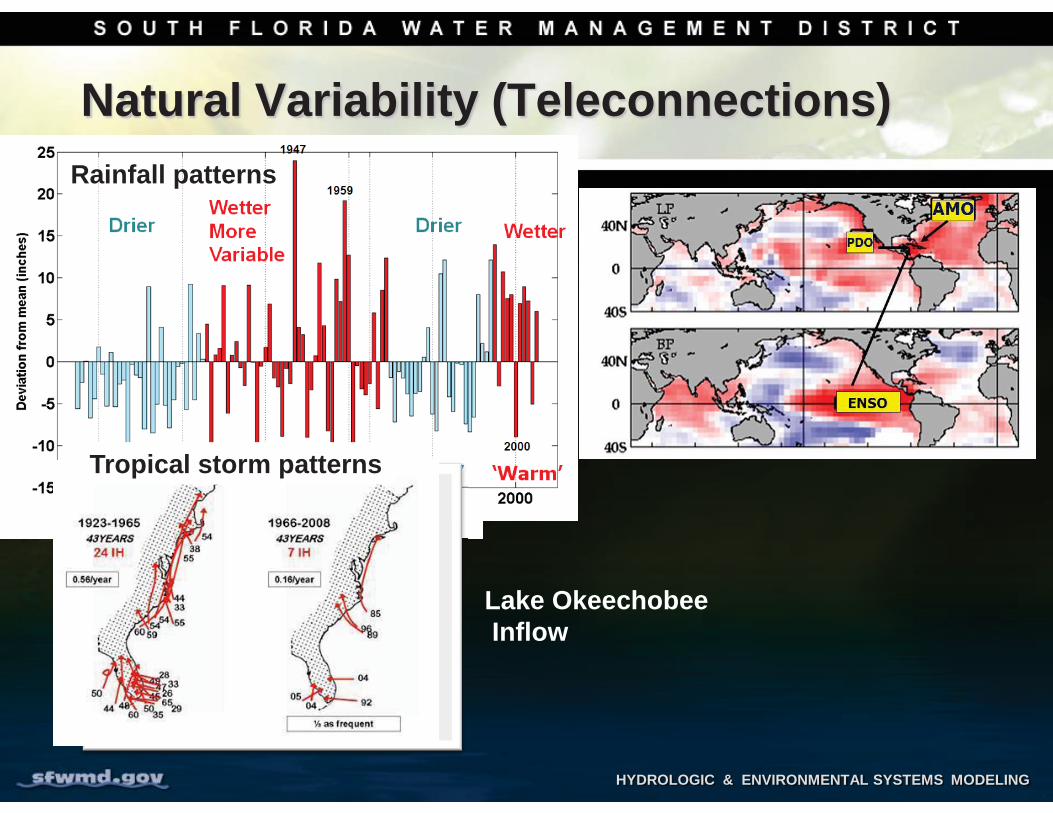
Natural Variability (Teleconnections) Rainfall vs. El Nino & La Nina Rainfall patterns
Lake Okeechobee Inflow
Tropical storm patterns
HYDROLOGIC & ENVIRONMENTAL SYSTEMS MODELING
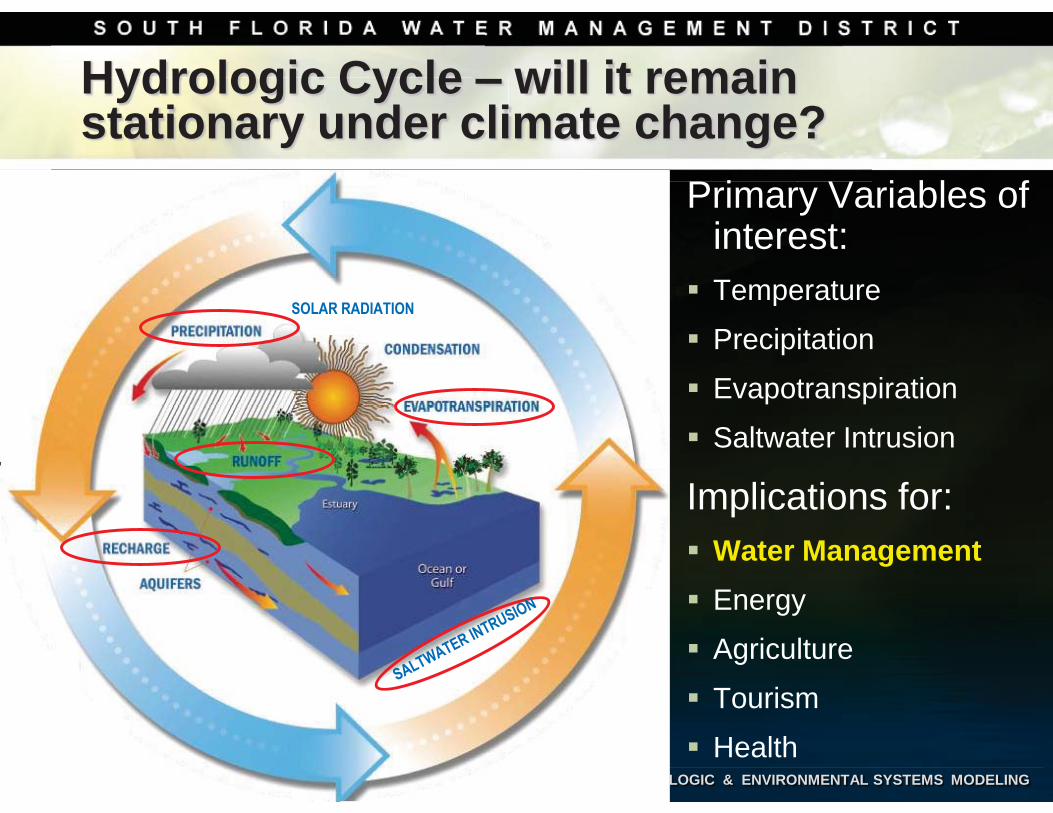
Hydrologic Cycle – will it remain stationary under climate change?
Primary Variables of interest: Temperature
Precipitation
Evapotranspiration
Saltwater Intrusion
Implications for: Water Management Energy
Agriculture
Tourism
Health
SOLAR RADIATION
HYDROLOGIC & ENVIRONMENTAL SYSTEMS MODELING
Jan
Feb Mar
Apr
May
Jun
Jul
Aug
Sep
Oct
Nov
Dec
0
5
10
15
20
25
g
5 nnJuJunn
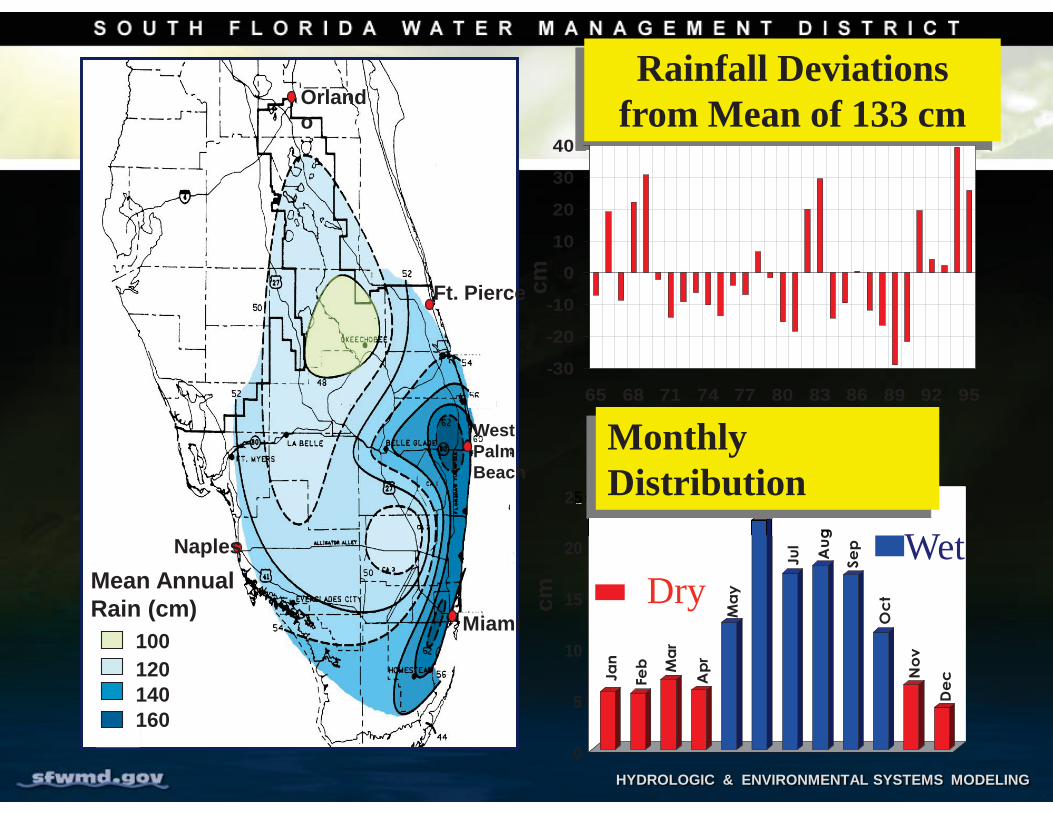
Monthly Distribution
Wet Dry cm
Rainfall Deviations from Mean of 133 cm
-30
-20
-10
0
10
20
30
40
65 68 71 74 77 80 83 86 89 92 95
cm
Mean Annual Rain (cm)
100 120 140 160
Orlando
Ft. Pierce
West Palm Beach
Miami
Naples
HYDROLOGIC & ENVIRONMENTAL SYSTEMS MODELING 8
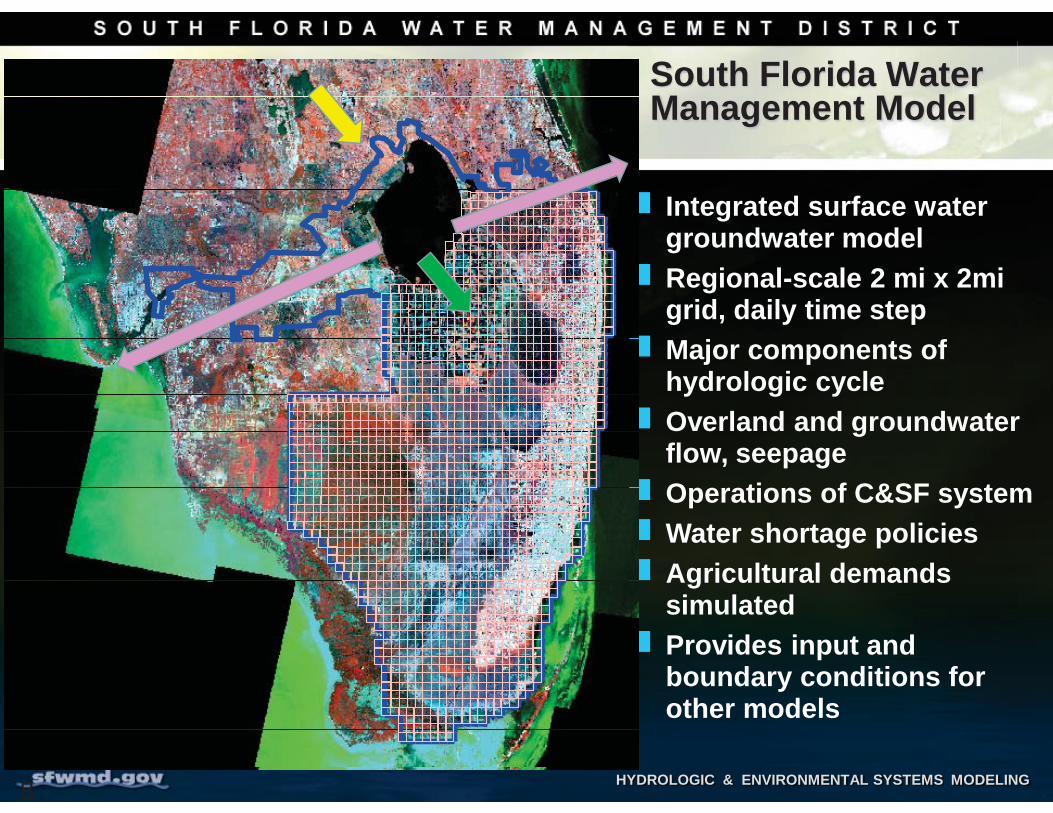
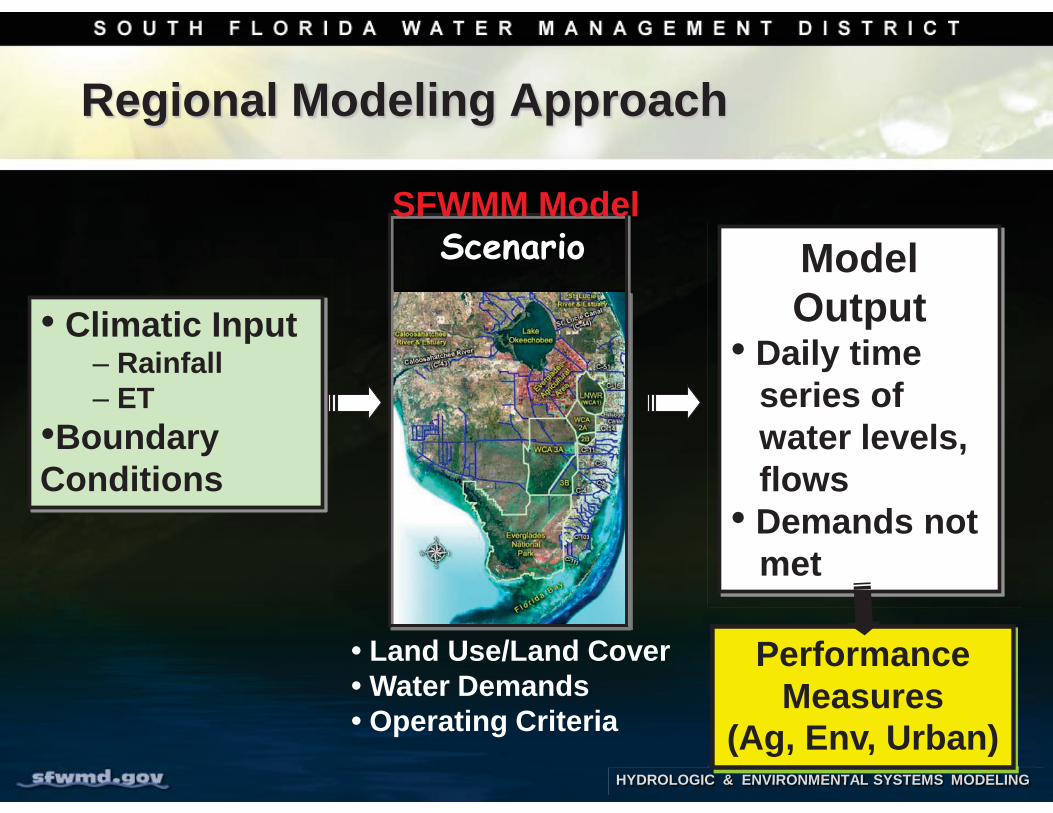
South Florida Water Management Model
Integrated surface water groundwater model Regional-scale 2 mi x 2mi grid, daily time step Major components of hydrologic cycle Overland and groundwater flow, seepage Operations of C&SF system Water shortage policiesAgricultural demands simulated Provides input and boundary conditions for other models
HYDROLOGIC & ENVIRONMENTAL SYSTEMS MODELING
SFWMM Model Model Output
• Daily time series of water levels, flows • Demands not met
• Land Use/Land Cover • Water Demands • Operating Criteria
• Climatic Input – Rainfall – ET
•Boundary Conditions
C & ENVIRONMENTAL SYSTEMS MODELING
Performance Measures
(Ag, Env, Urban)
Scenario
Regional Modeling Approach
HYDROLOGIC & ENVIRONMENTAL SYSTEMS MODELING
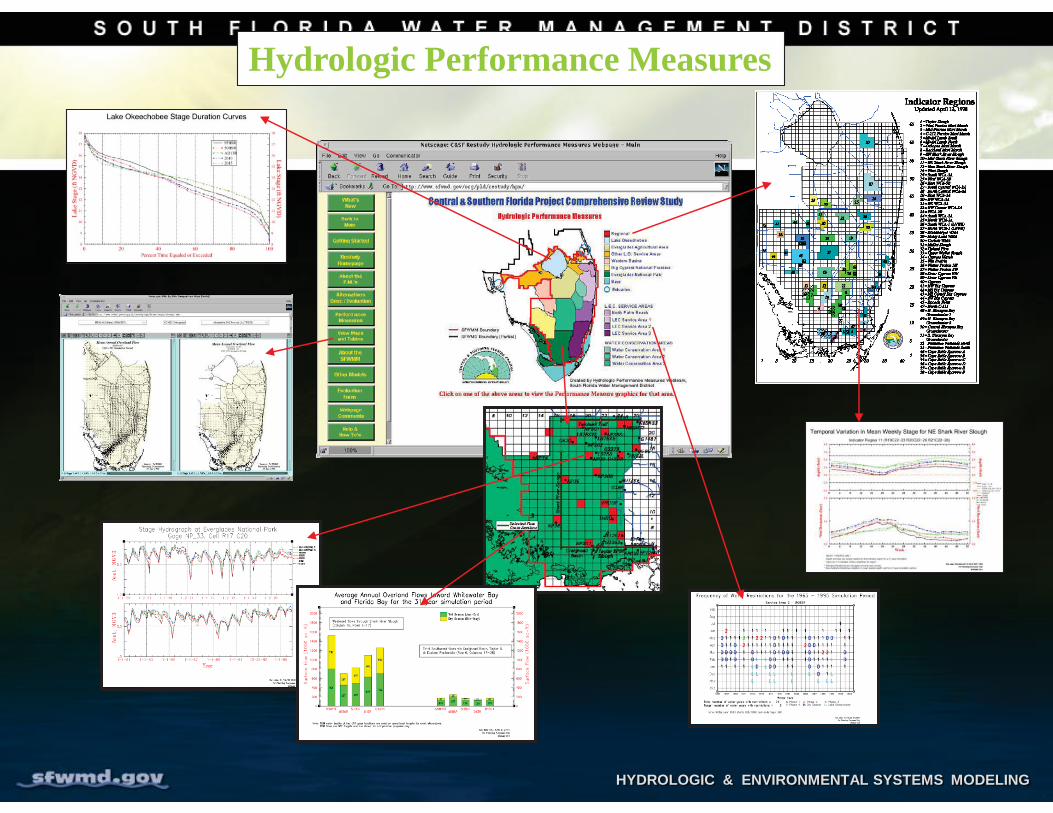
Hydrologic Performance Measures
HYDROLOGIC & ENVIRONMENTAL SYSTEMS MODELING
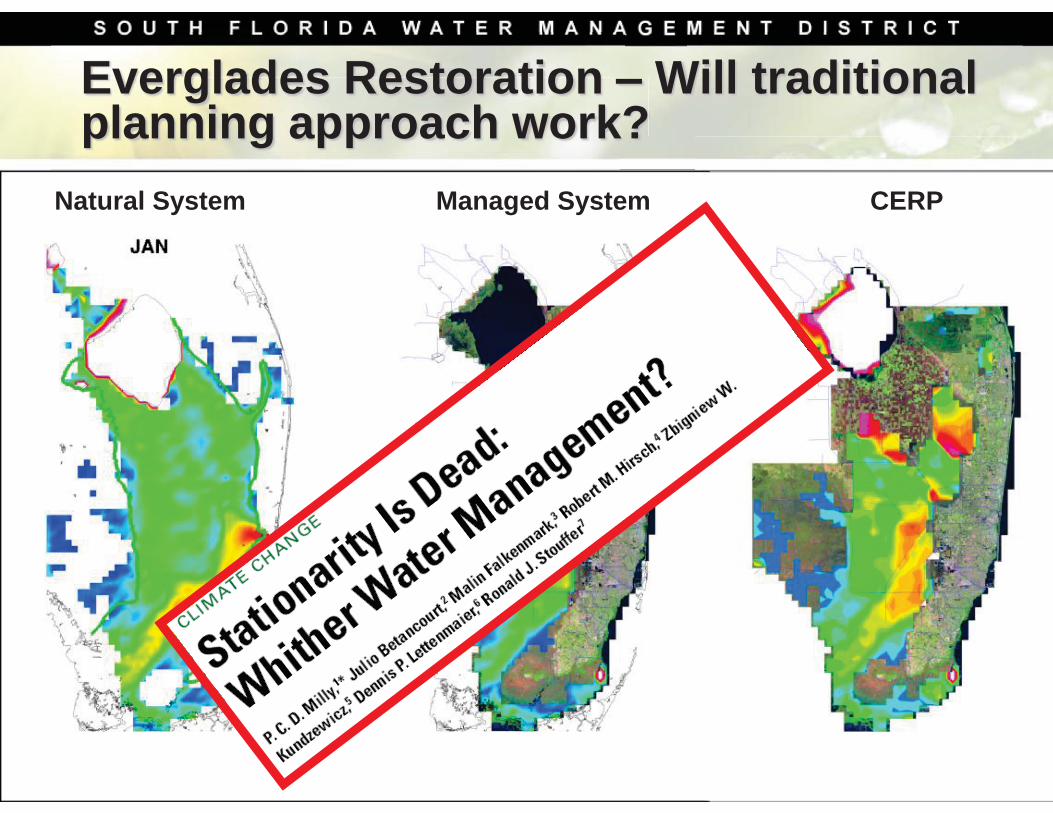
Everglades Restoration – Will traditional planning approach work?
Natural System Managed System CERP
HYDROLOGIC & ENVIRONMENTAL SYSTEMS MODELING 12
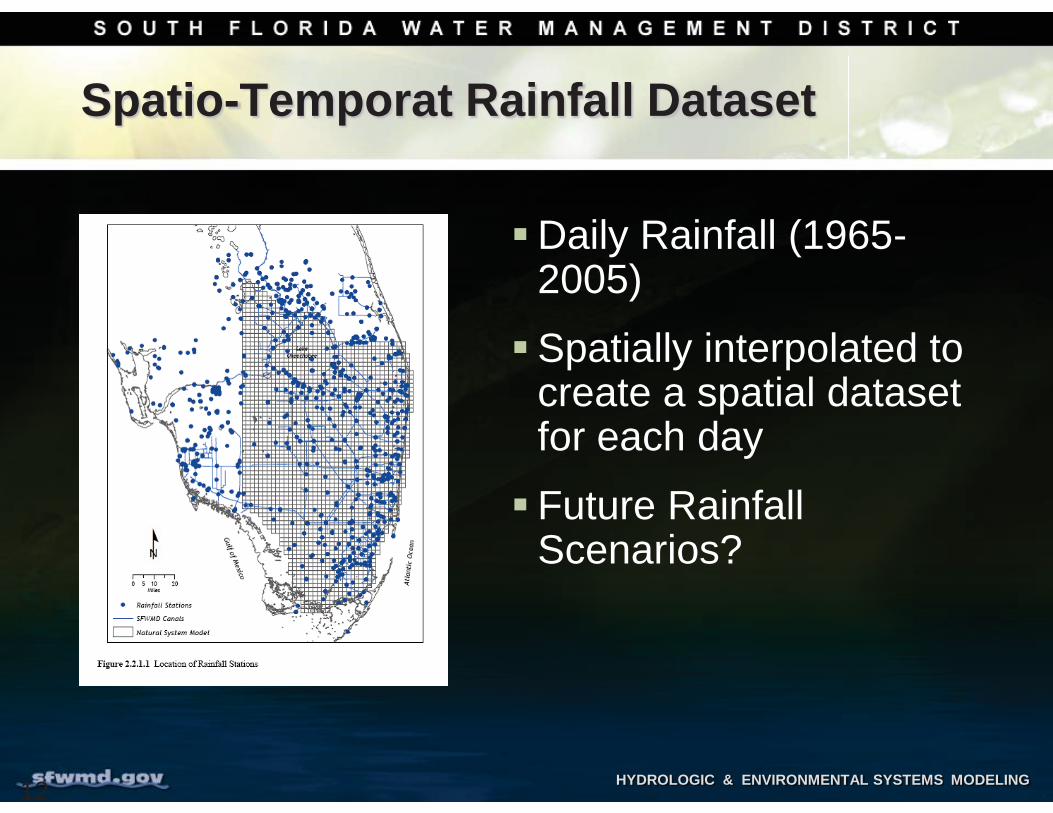
Spatio-Temporat Rainfall Dataset
Daily Rainfall (1965-2005)
Spatially interpolated to create a spatial dataset for each day
Future Rainfall Scenarios?
HYDROLOGIC & ENVIRONMENTAL SYSTEMS MODELING
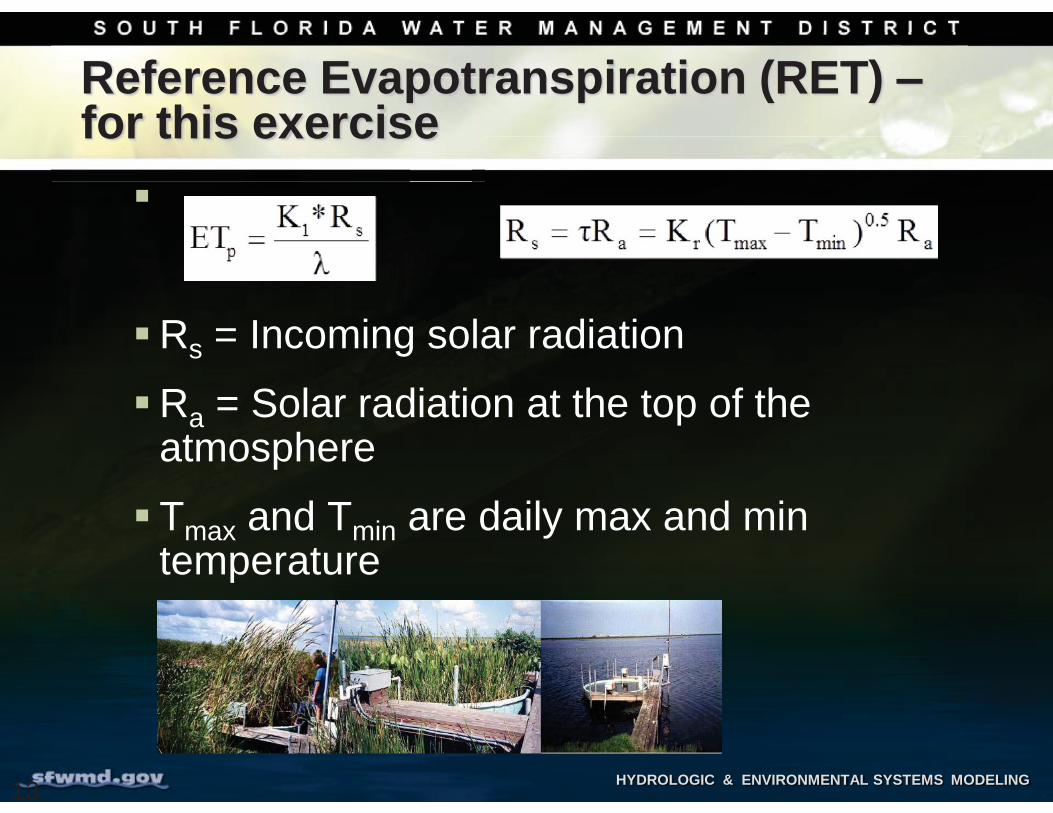
Reference Evapotranspiration (RET) – for this exercise
Rs = Incoming solar radiation
Ra = Solar radiation at the top of the atmosphere
Tmax and Tmin are daily max and min temperature
13
HYDROLOGIC & ENVIRONMENTAL SYSTEMS MODELING
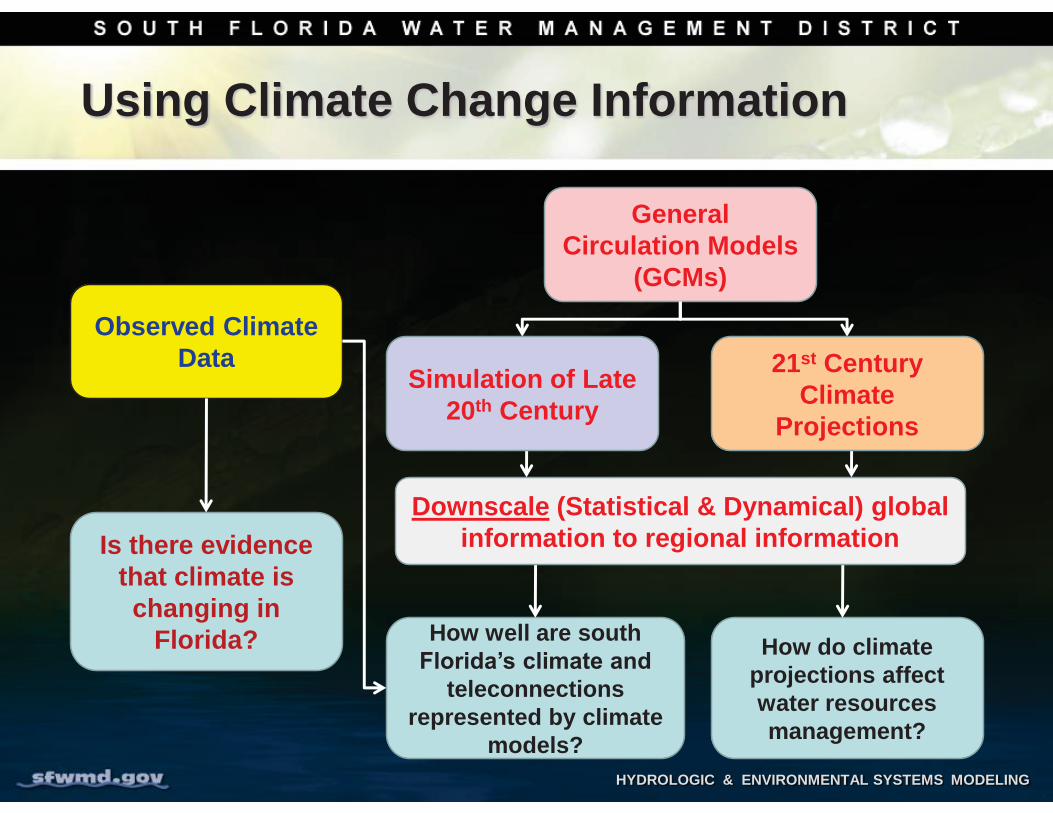
General Circulation Models
(GCMs)
Observed Climate Data
Is there evidence that climate is changing in
Florida? How well are south Florida’s climate and
teleconnections represented by climate
models?
How do climate projections affect water resources management?
Simulation of Late 20th Century
21st Century Climate
Projections
Downscale (Statistical & Dynamical) global information to regional information
Using Climate Change Information
HYDROLOGIC & ENVIRONMENTAL SYSTEMS MODELING HYHYHYDRRDRROLOLLOLOGOGOGOGICICICIC && & EEENVNVIRIRROOOOONONOONOOOOOOONO MEEMMEMENNTNTNTALALAL SSYSSYSSTTTETEEMSMSMSMS MMOMOMODDDEDEDELIIINNNNNNN
Book of Climate Output
HYDROLOGIC & ENVIRONMENTAL SYSTEMS MODELING
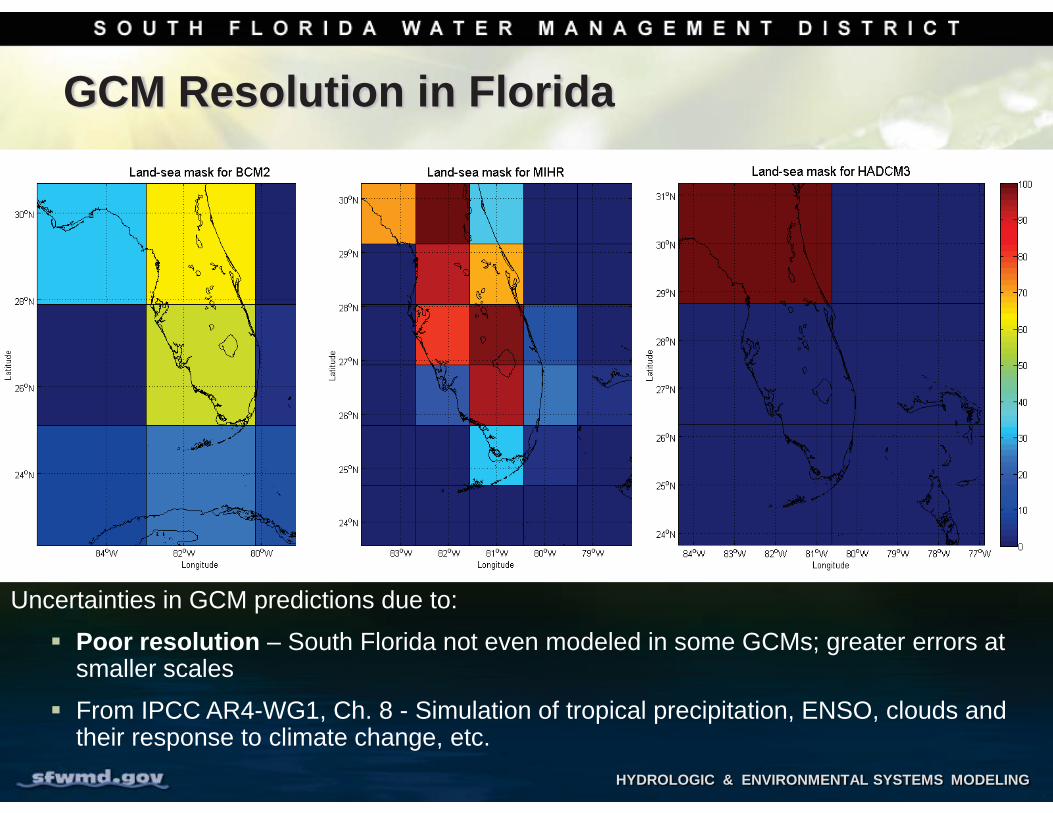
GCM Resolution in Florida
Uncertainties in GCM predictions due to:
Poor resolution – South Florida not even modeled in some GCMs; greater errors at smaller scales
From IPCC AR4-WG1, Ch. 8 - Simulation of tropical precipitation, ENSO, clouds and their response to climate change, etc.
HYDROLOGIC & ENVIRONMENTAL SYSTEMS MODELING
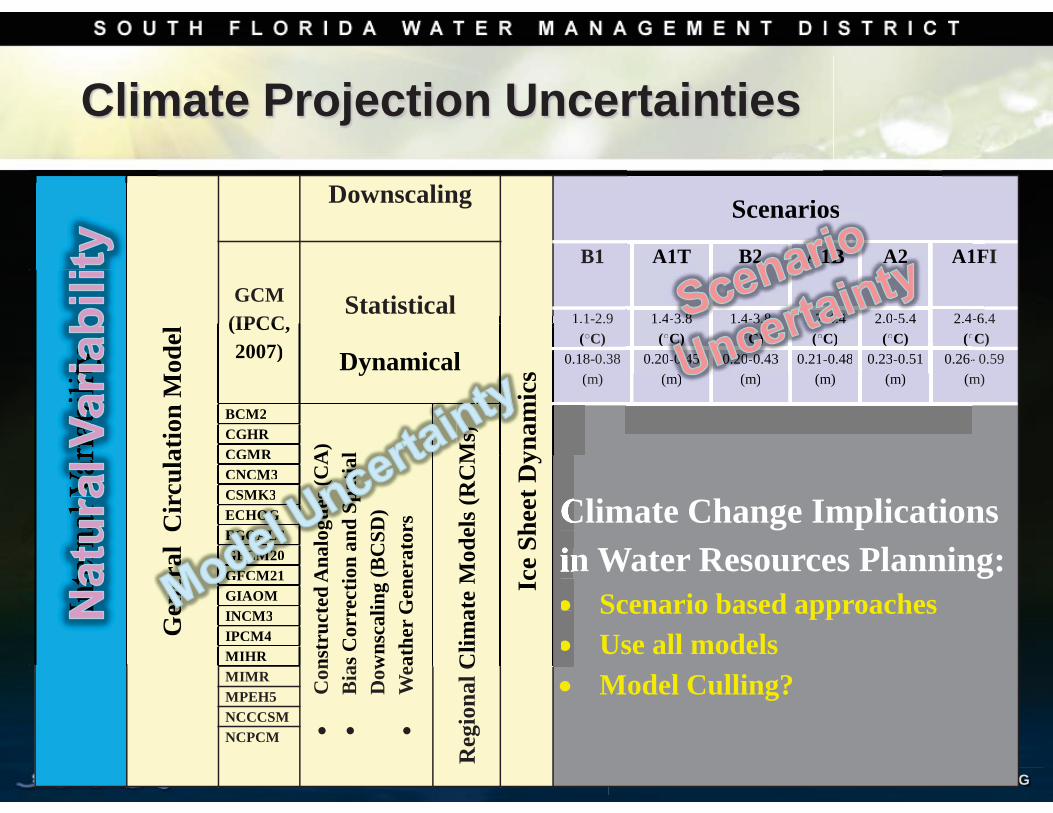
Climate Projection Uncertainties In
tern
al V
aria
bilit
y
Gen
eral
Cir
cula
tion
Mod
el
Downscaling
Ice
Shee
t Dyn
amic
s
Scenarios
GCM(IPCC, 2007)
Statistical
Dynamical
B1 A1T B2 A1B A2 A1FI
1.1-2.9 (○C)
1.4-3.8 (○C)
1.4-3.8 (○C)
1.7-4.4 (○C)
2.0-5.4 (○C)
2.4-6.4 (○C)
0.18-0.38 (m)
0.20-0.45 (m)
0.20-0.43 (m)
0.21-0.48 (m)
0.23-0.51 (m)
0.26- 0.59 (m)
BCM2
Con
stru
cted
Ana
logu
es (C
A)
Bia
s Cor
rect
ion
and
Spat
ial
Dow
nsca
ling
(BC
SD)
Wea
ther
Gen
erat
ors
Reg
iona
l Clim
ate
Mod
els (
RC
Ms)
Climate Change Implications in Water Resources Planning:
Scenario based approaches Use all models Model Culling?
CGHR CGMR CNCM3 CSMK3 ECHOG FGOALS GFCM20 GFCM21 GIAOM INCM3 IPCM4 MIHR MIMR MPEH5 NCCCSM NCPCM
Ice
Shee
t Dy
Gen
eral
Cir
cula
tion
Mod
el (IPCC, 2007) Dynamical
BCM2
nstr
ucte
d A
nalo
gues
(CA
)as
Cor
rect
ion
and
Spat
ial
wns
calin
g (B
CSD
)at
her G
ener
ator
s
Clim
ate
Mod
els (
RC
MCGHRCGMRCNCM3CSMK3ECHOGFGOALSGFCM20GFCM21GIAOMINCM3IPCM4MIHR
1.1(
.18(
ynam
icsl 0.
Ms)
Scenarioos
(
(m) (m) (m) (m)0.26-
(m
Scenario
A1T B2 A1
1.4-3.8(○C)
1.4-3.8(○C)
1.7-4.4(○C) ( C)
0.20-0.45 0.20-0.43 0.21-0.48 0.23-0.51
os
1B 1F
-6○C
A1
2.4(○
2.0-5.4(○C)
A2
HYDROLOGIC & ENVIRONMENTAL SYSTEMS MODELING
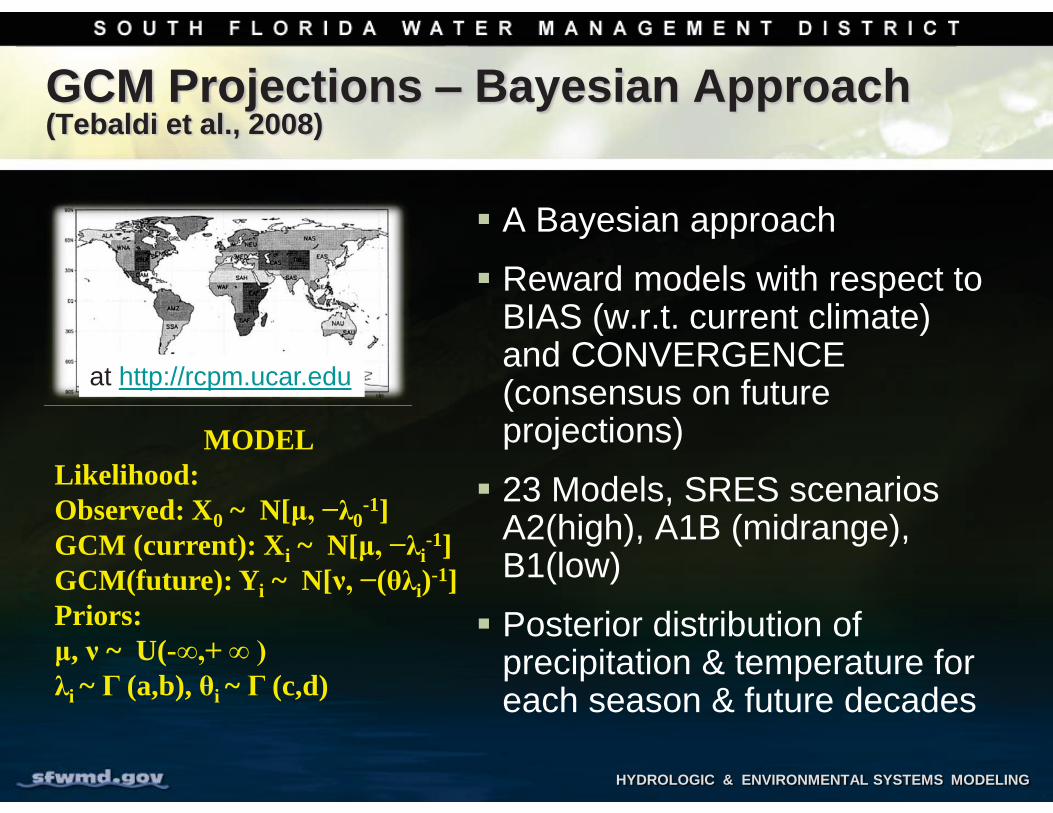
at http://rcpm.ucar.edu
GCM Projections – Bayesian Approach (Tebaldi et al., 2008)
A Bayesian approach
Reward models with respect to BIAS (w.r.t. current climate) and CONVERGENCE (consensus on future projections)
23 Models, SRES scenarios A2(high), A1B (midrange), B1(low)
Posterior distribution of precipitation & temperature for each season & future decades
MODEL Likelihood: Observed: X0 ~ N[μ, −λ0
-1] GCM (current): Xi ~ N[μ, −λi
-1] GCM(future): Yi ~ N[ν, −(θλi)-1] Priors: μ, ν ~ U(-∞,+ ∞ ) λi ~ Γ (a,b), θi ~ Γ (c,d)
HYDROLOGIC & ENVIRONMENTAL SYSTEMS MODELING
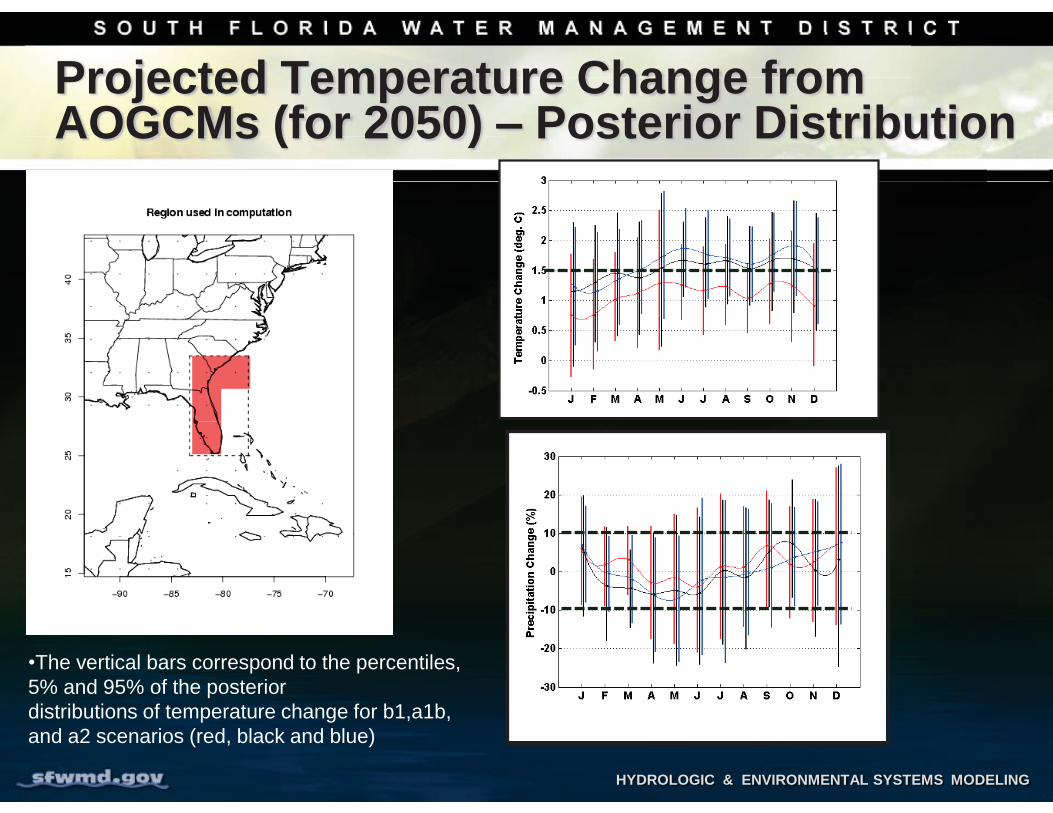
Projected Temperature Change from AOGCMs (for 2050) – Posterior Distribution
•The vertical bars correspond to the percentiles, 5% and 95% of the posterior distributions of temperature change for b1,a1b, and a2 scenarios (red, black and blue)
HYDROLOGIC & ENVIRONMENTAL SYSTEMS MODELING
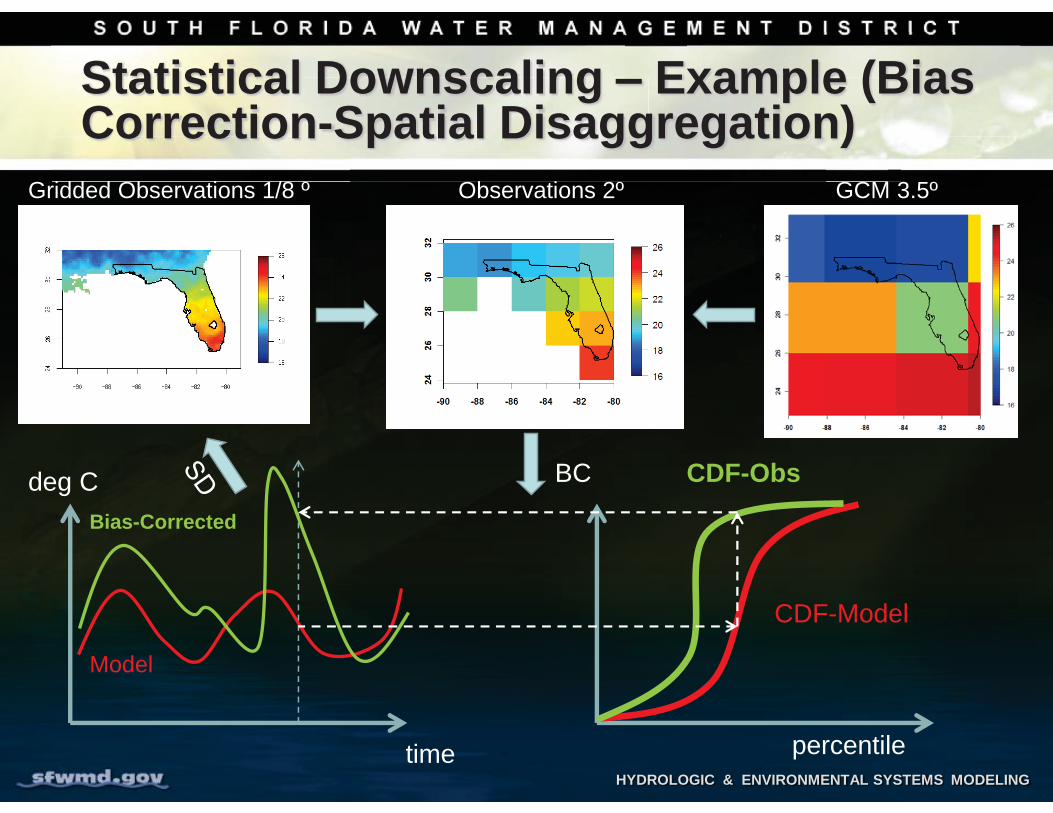
Statistical Downscaling – Example (Bias Correction-Spatial Disaggregation)
Gridded Observations 1/8 º Observations 2º GCM 3.5º
CDF-Model
CDF-Obs
Model
time
deg C
percentile
BC
Bias-Corrected
HYDROLOGIC & ENVIRONMENTAL SYSTEMS MODELING
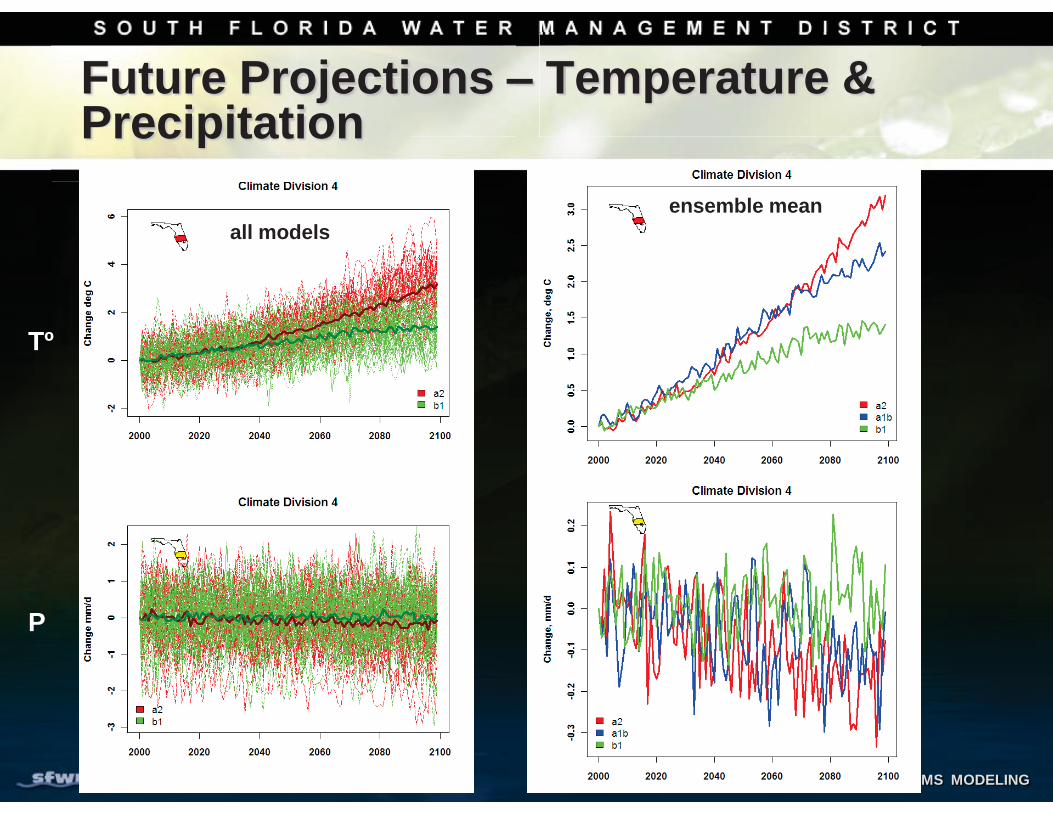
Future Projections – Temperature & Precipitation
all models ensemble mean
Tº
P
HYDROLOGIC & ENVIRONMENTAL SYSTEMS MODELING
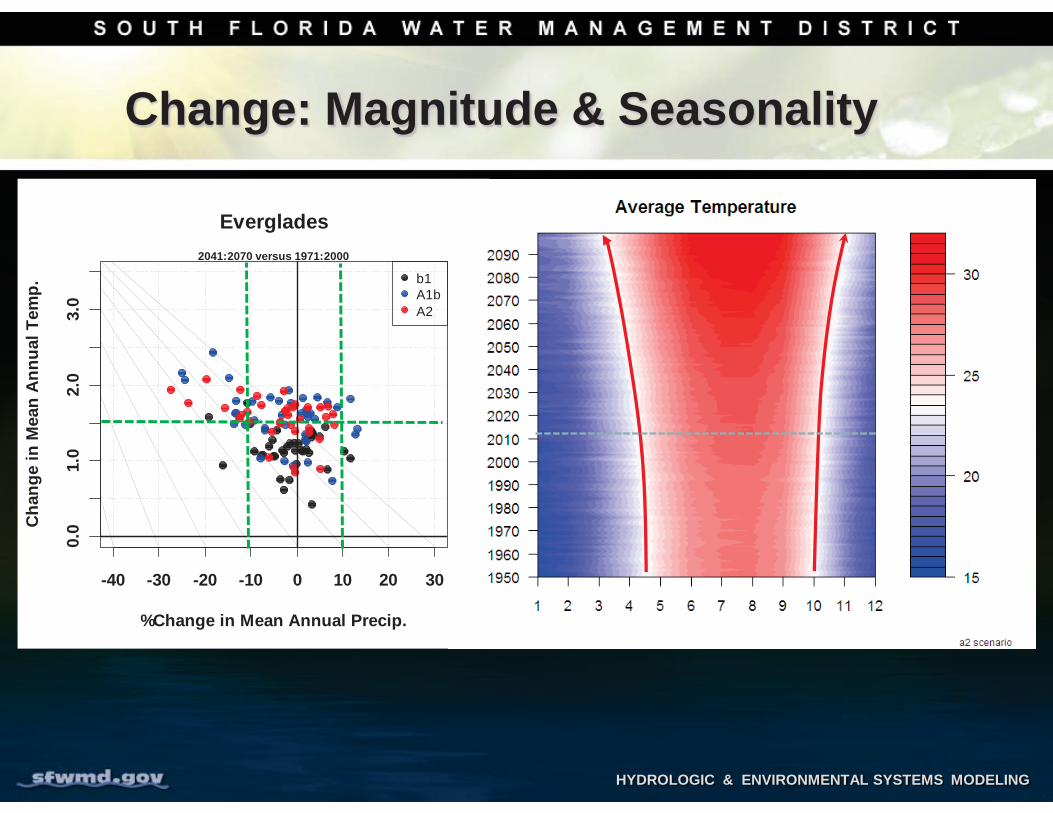
Change: Magnitude & Seasonality
-40 -30 -20 -10 0 10 20 30
0.0
1.0
2.0
3.0
Everglades
%Change in Mean Annual Precip.
Cha
nge
in M
ean
Ann
ual T
emp.
2041:2070 versus 1971:2000
b1A1bA2
HYDROLOGIC & ENVIRONMENTAL SYSTEMS MODELING
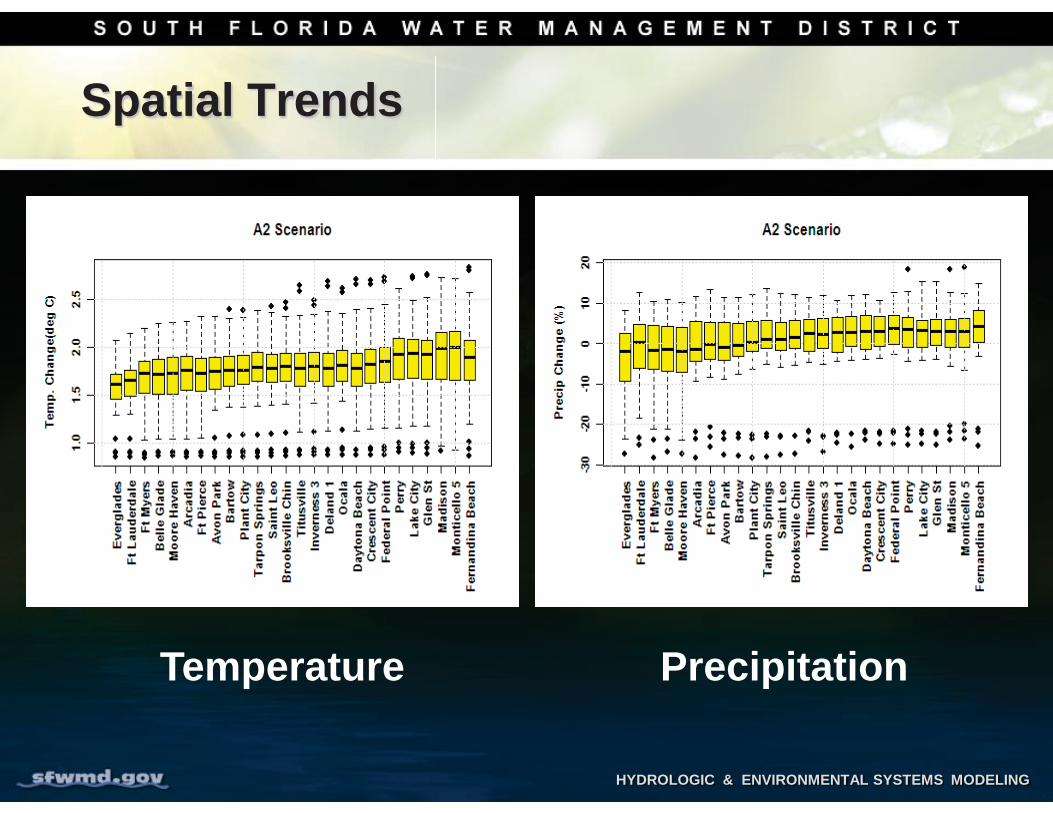
Spatial Trends
Temperature Precipitation
HYDROLOGIC & ENVIRONMENTAL SYSTEMS MODELING
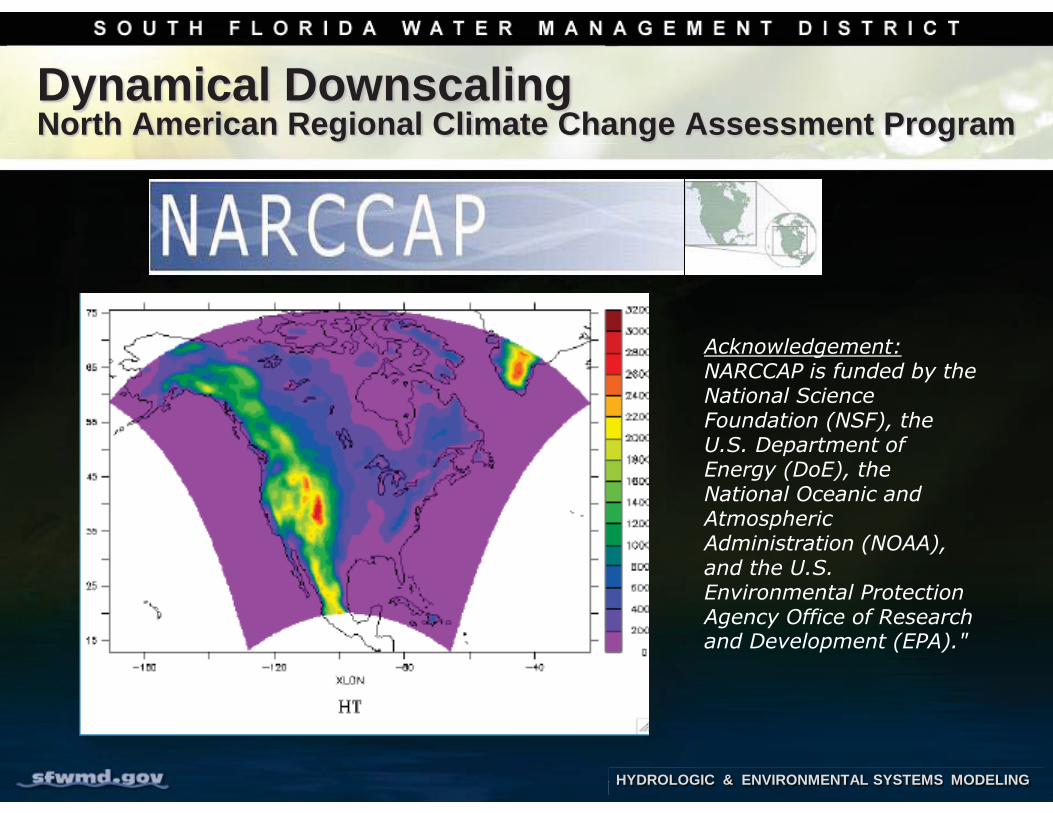
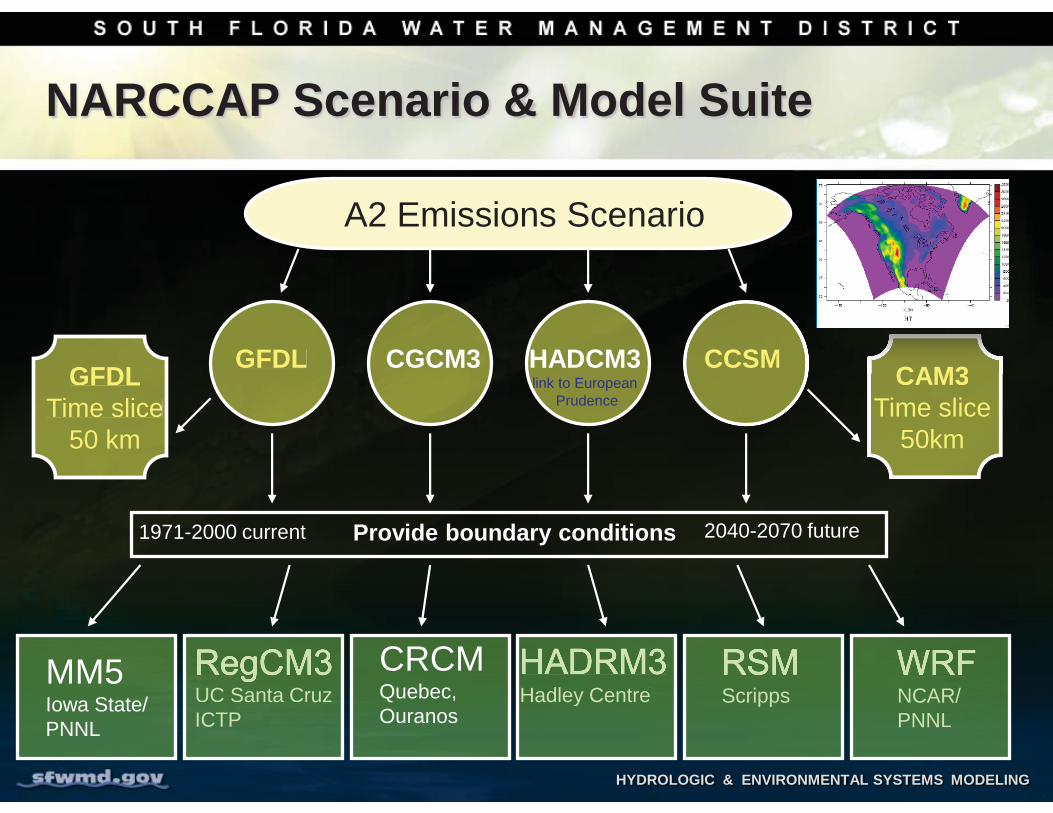
Dynamical Downscaling North American Regional Climate Change Assessment Program
HYHYDRDROOLOG
Acknowledgement: NARCCAP is funded by the National Science Foundation (NSF), the U.S. Department of Energy (DoE), the National Oceanic and Atmospheric Administration (NOAA), and the U.S. Environmental Protection Agency Office of Research and Development (EPA)."
HYDROLOGIC & ENVIRONMENTAL SYSTEMS MODELING
A2 Emissions Scenario
GFDL CCSM HADCM3link to European
Prudence
CGCM3 CCSMGFDL
1971-2000 current 2040-2070 future Provide boundary conditions
MM5 Iowa State/ PNNL
RegCM3 UC Santa Cruz ICTP
CRCM Quebec, Ouranos
HADRM3 Hadley Centre
RSM Scripps
WRF NCAR/ PNNL
UC Santa CruzICTP
Hadley Centre Scripps NCAR/PNNL
CAM3 Time slice
50km
CAM3Time slice
50km
GFDL Time slice
50 km
GFDLTime slice
50 km
CAM3
NARCCAP Scenario & Model Suite
HYDROLOGIC & ENVIRONMENTAL SYSTEMS MODELING
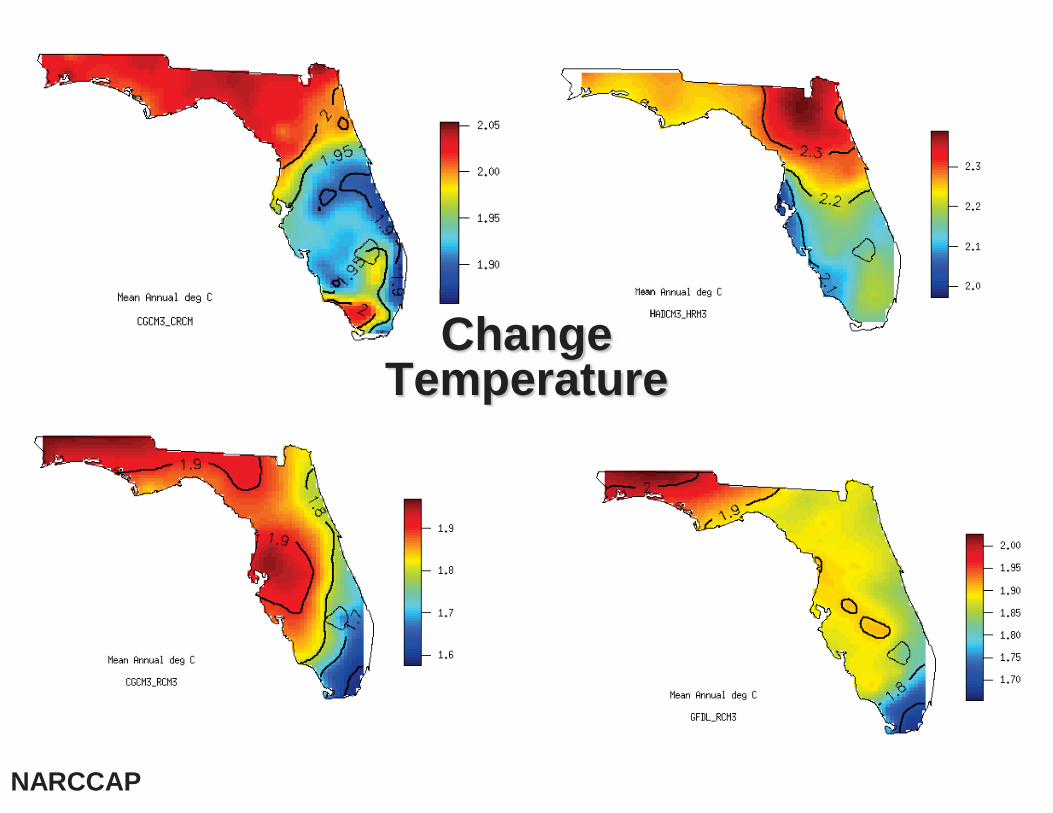
Change Temperature
NARCCAP
HYDROLOGIC & ENVIRONMENTAL SYSTEMS MODELING
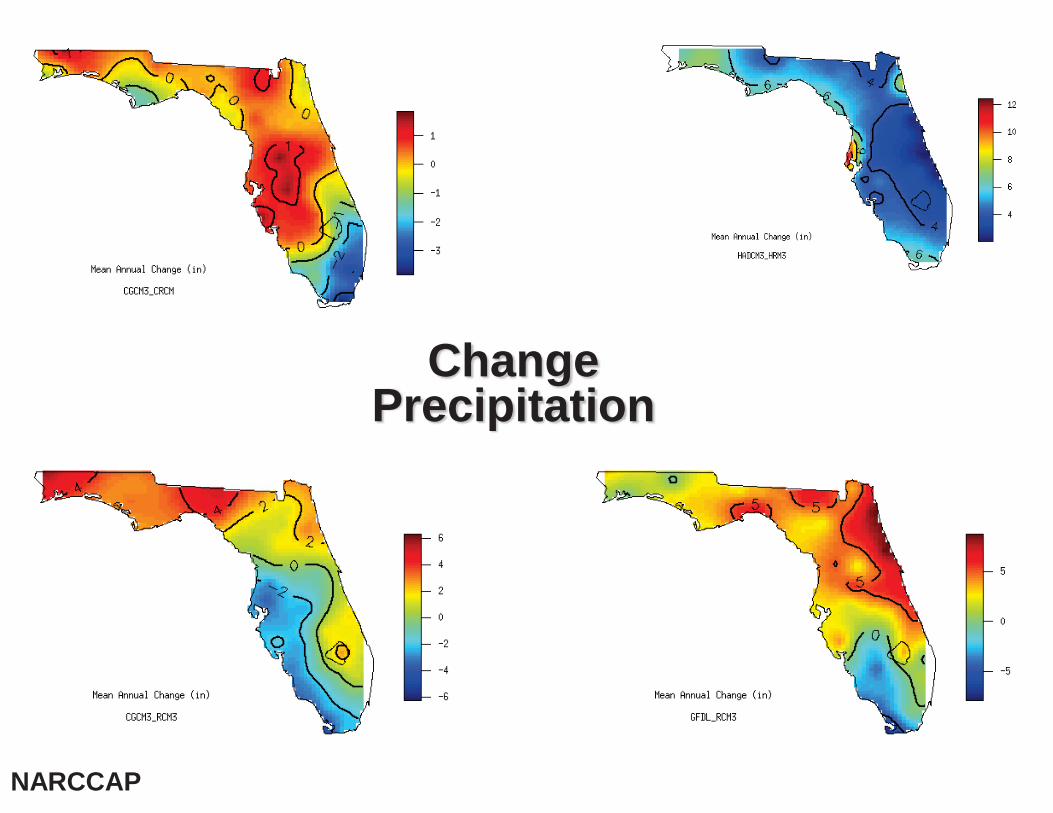
Change Precipitation
NARCCAP
HYDROLOGIC & ENVIRONMENTAL SYSTEMS MODELING
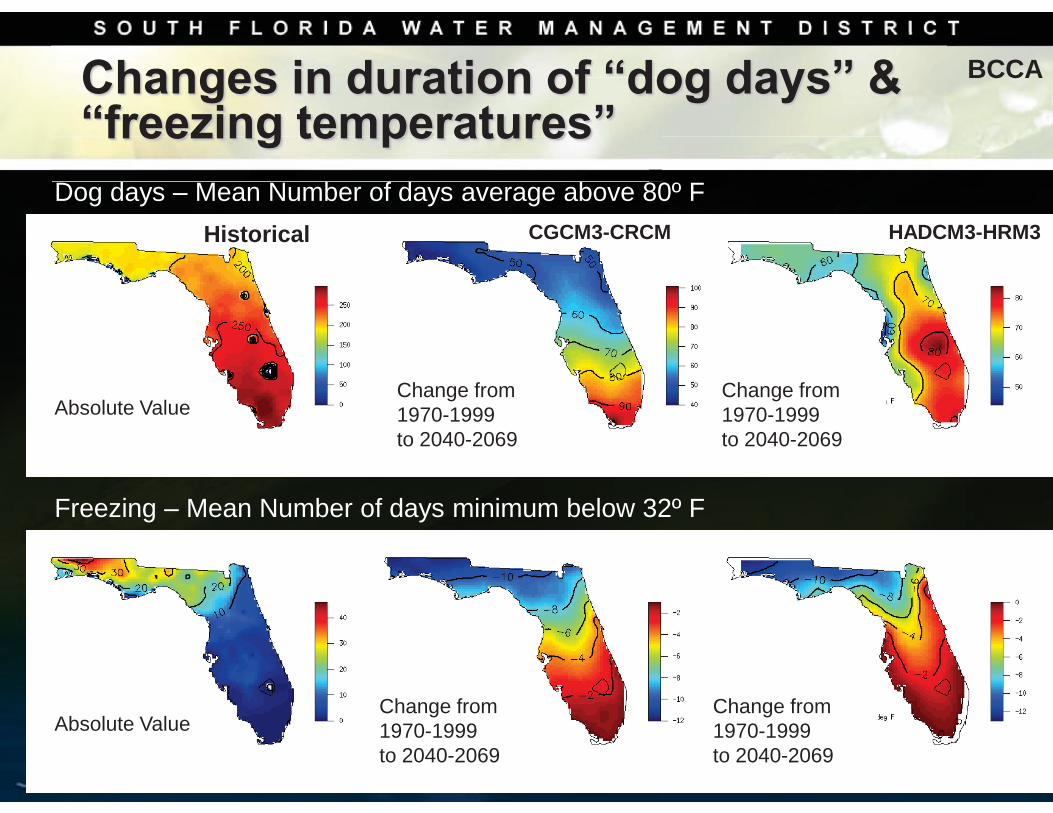
Changes in duration of “dog days” & “freezing temperatures”
Dog days – Mean Number of days average above 80º F Historical
Change from 1970-1999 to 2040-2069
CGCM3-CRCM HADCM3-HRM3
Absolute Value Change from 1970-1999 to 2040-2069
Freezing – Mean Number of days minimum below 32º F
Absolute Value Change from 1970-1999 to 2040-2069
Change from 1970-1999 to 2040-2069
BCCA
HYDROLOGIC & ENVIRONMENTAL SYSTEMS MODELING
Sea Level Rise
HYDROLOGIC & ENVIRONMENTAL SYSTEMS MODELING
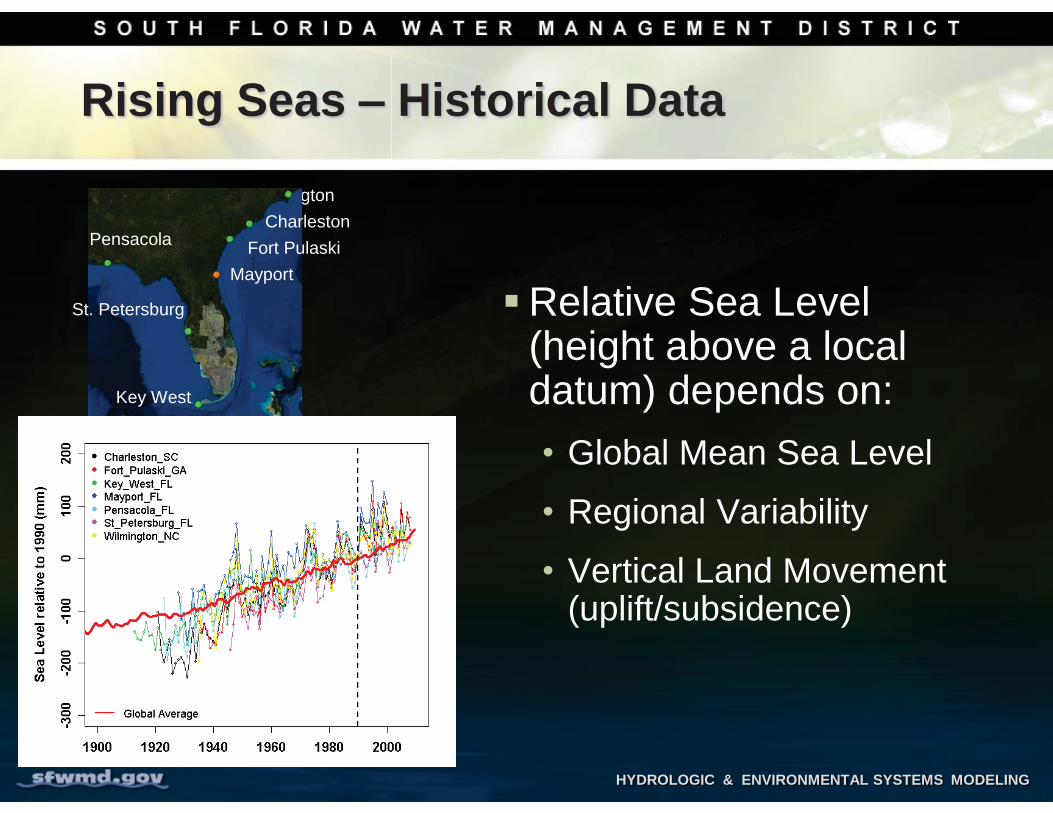
Rising Seas – Historical Data
Wilmington Charleston
Fort Pulaski Mayport
Key West
St. Petersburg
Pensacola
Relative Sea Level (height above a local datum) depends on: • Global Mean Sea Level
• Regional Variability
• Vertical Land Movement (uplift/subsidence)
HYDROLOGIC & ENVIRONMENTAL SYSTEMS MODELING HYDROLOGIC & ENVIRONMENTAL SYSTEMS MODELING
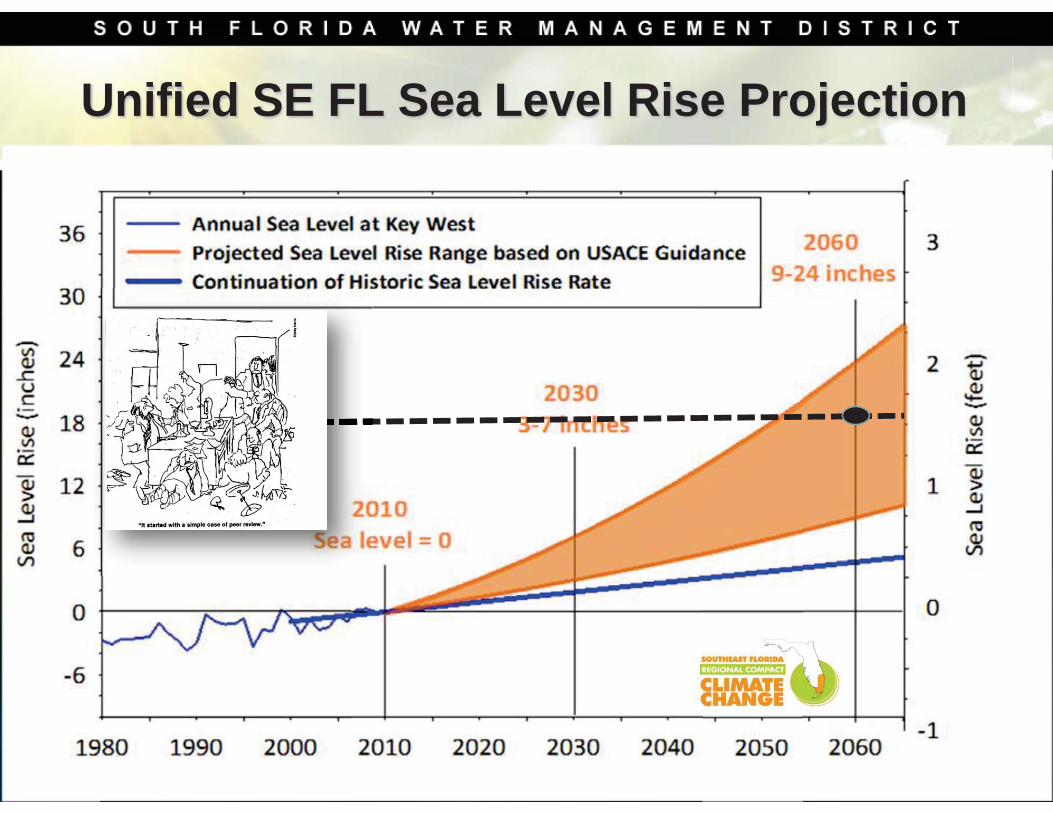
Unified SE FL Sea Level Rise Projection
HYDROLOGIC & ENVIRONMENTAL SYSTEMS MODELING
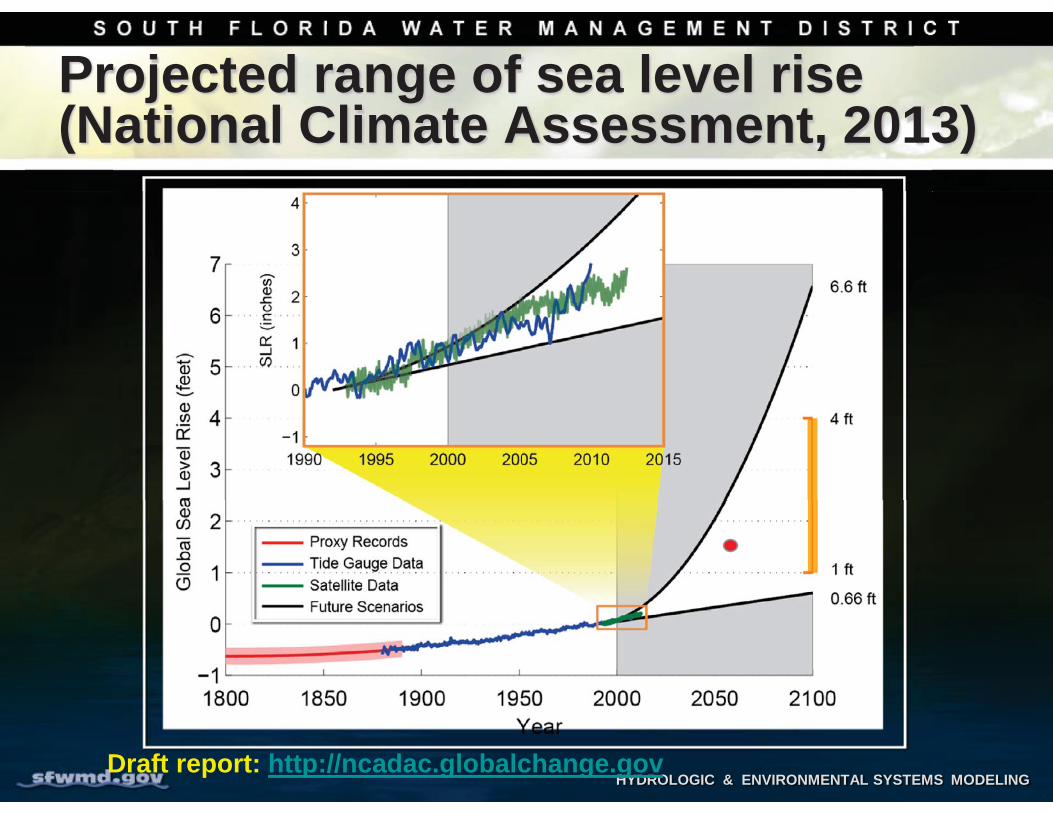
Projected range of sea level rise (National Climate Assessment, 2013)
Draft report: http://ncadac.globalchange.gov
HYDROLOGIC & ENVIRONMENTAL SYSTEMS MODELING
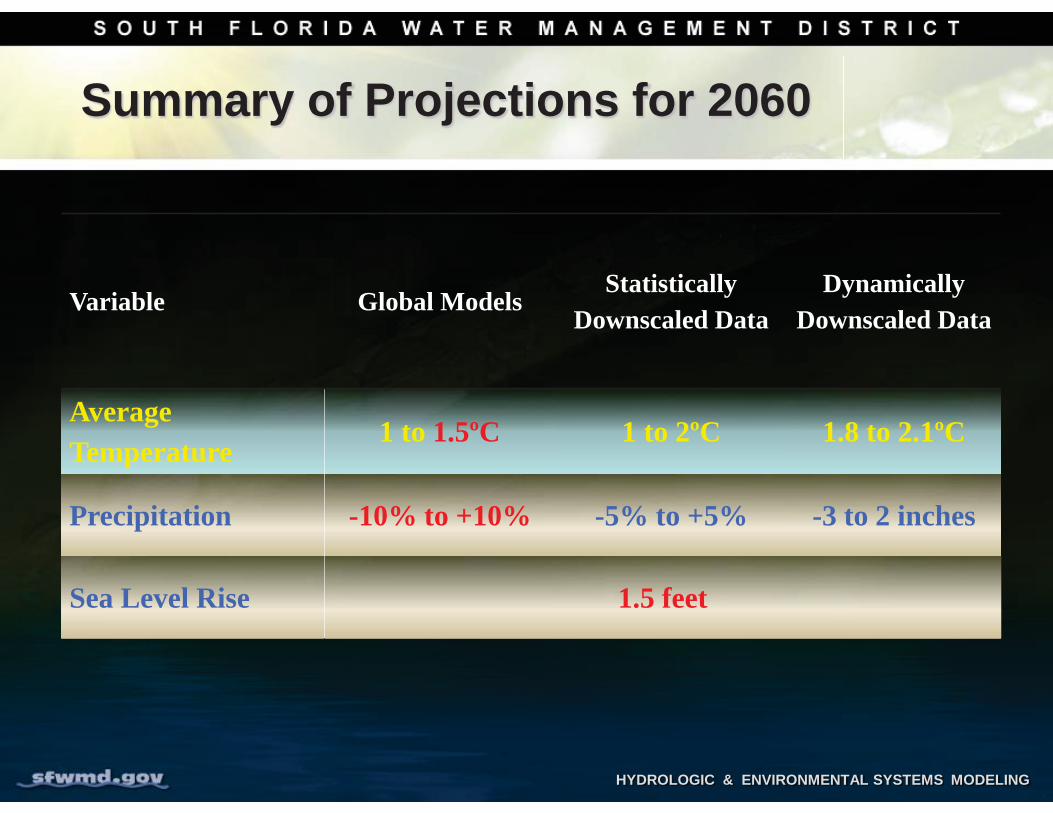
Summary of Projections for 2060
Variable Global Models Statistically
Downscaled Data Dynamically
Downscaled Data
Average Temperature
1 to 1.5ºC 1 to 2ºC 1.8 to 2.1ºC
Precipitation -10% to +10% -5% to +5% -3 to 2 inches
Sea Level Rise 1.5 feet
HYDROLOGIC & ENVIRONMENTAL SYSTEMS MODELING
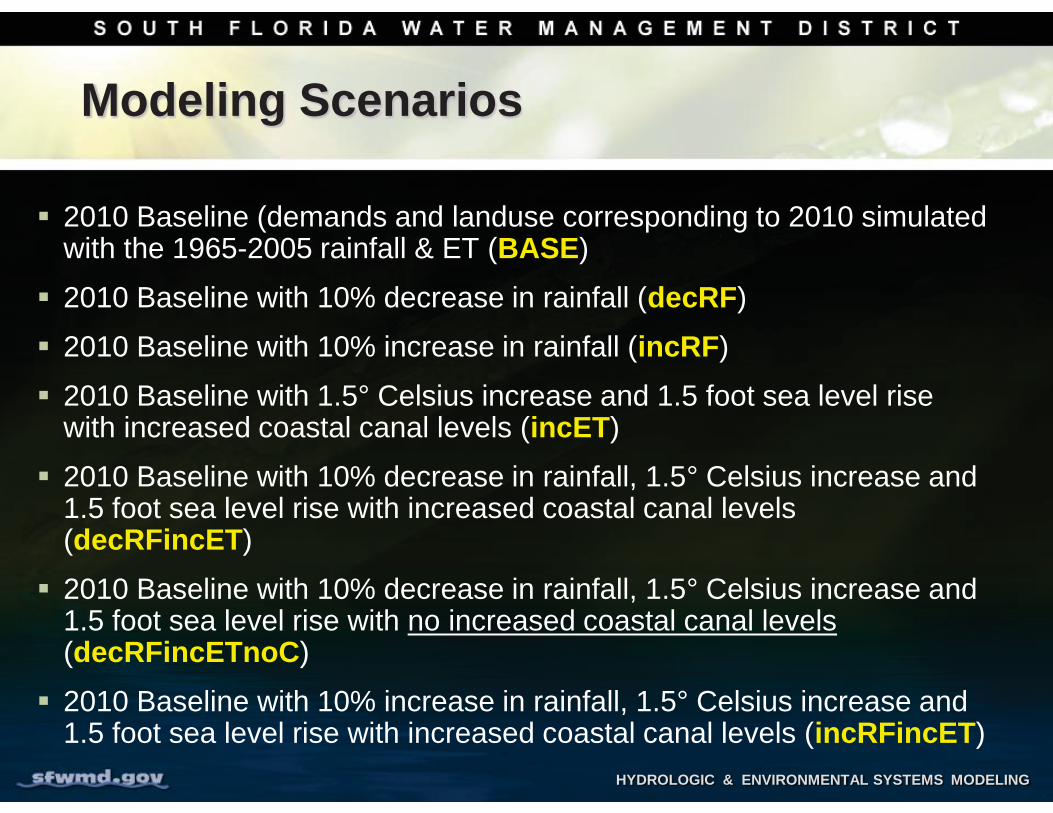
Modeling Scenarios
2010 Baseline (demands and landuse corresponding to 2010 simulated with the 1965-2005 rainfall & ET (BASE)
2010 Baseline with 10% decrease in rainfall (decRF)
2010 Baseline with 10% increase in rainfall (incRF)
2010 Baseline with 1.5° Celsius increase and 1.5 foot sea level rise with increased coastal canal levels (incET)
2010 Baseline with 10% decrease in rainfall, 1.5° Celsius increase and 1.5 foot sea level rise with increased coastal canal levels (decRFincET)
2010 Baseline with 10% decrease in rainfall, 1.5° Celsius increase and 1.5 foot sea level rise with no increased coastal canal levels (decRFincETnoC)
2010 Baseline with 10% increase in rainfall, 1.5° Celsius increase and 1.5 foot sea level rise with increased coastal canal levels (incRFincET)
HYDROLOGIC & ENVIRONMENTAL SYSTEMS MODELING
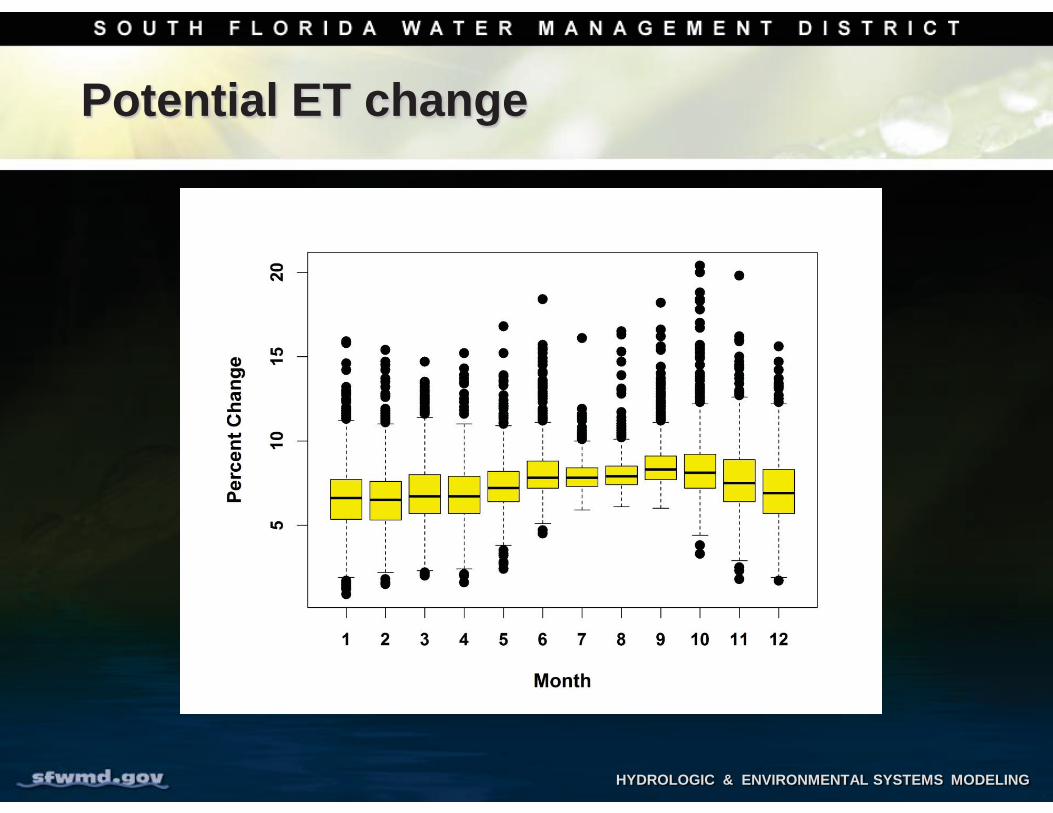
Potential ET change
HYDROLOGIC & ENVIRONMENTAL SYSTEMS MODELING
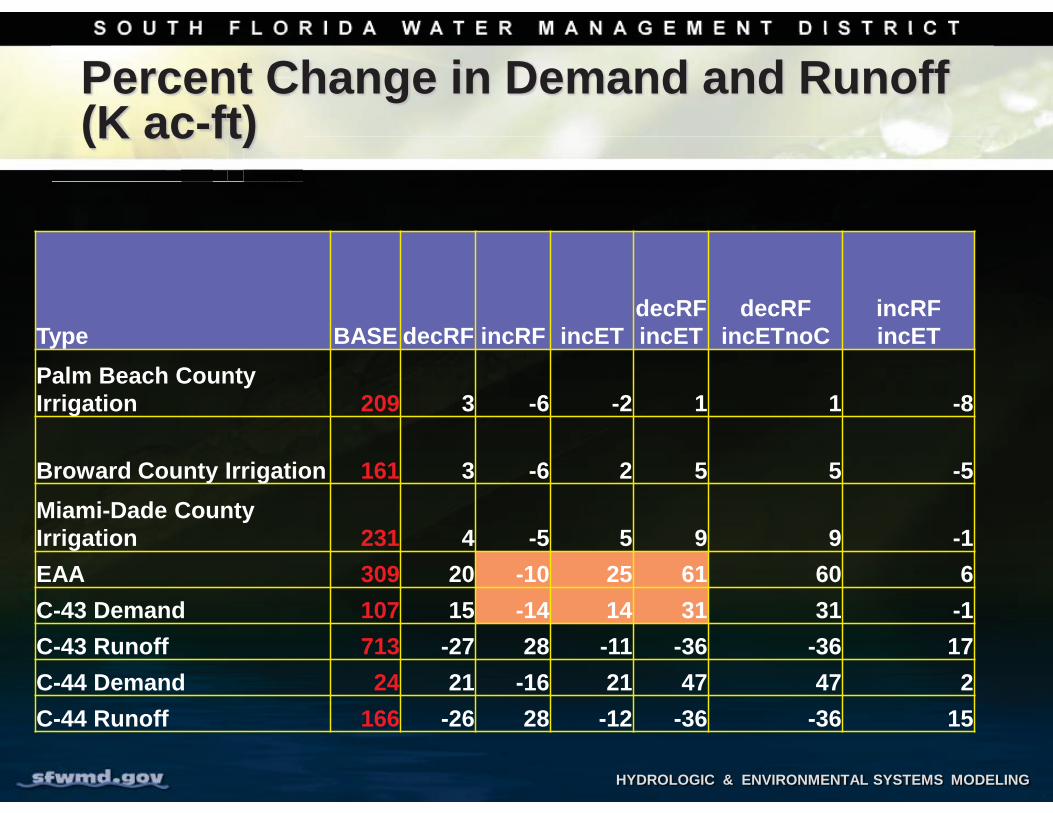
Percent Change in Demand and Runoff (K ac-ft)
Type BASE decRF incRF incET decRFincET
decRF incETnoC
incRF incET
Palm Beach County Irrigation 209 3 -6 -2 1 1 -8
Broward County Irrigation 161 3 -6 2 5 5 -5
Miami-Dade County Irrigation 231 4 -5 5 9 9 -1 EAA 309 20 -10 25 61 60 6 C-43 Demand 107 15 -14 14 31 31 -1 C-43 Runoff 713 -27 28 -11 -36 -36 17 C-44 Demand 24 21 -16 21 47 47 2 C-44 Runoff 166 -26 28 -12 -36 -36 15
HYDROLOGIC & ENVIRONMENTAL SYSTEMS MODELING
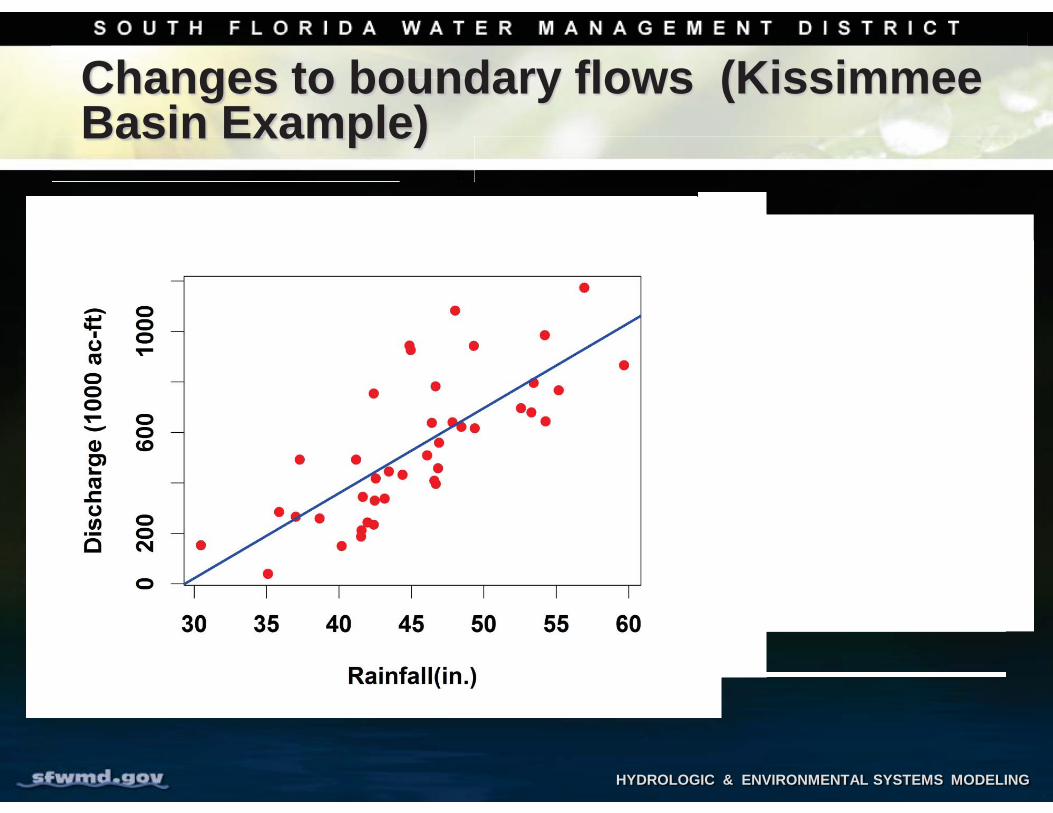
Changes to boundary flows (Kissimmee Basin Example)
Related Documents