PNNL-20805 Prepared for the U.S. Department of Energy under Contract DE-AC05-76RL01830 Screening Analysis for the Environmental Risk Evaluation System Task 2.1.1.2: Evaluating Effects of Stressors Fiscal Year 2011 Progress Report Environmental Effects of Marine and Hydrokinetic Energy AE Copping LC Zdanski KM Blake GA Gill RM Anderson JA Ward September 2011

Welcome message from author
This document is posted to help you gain knowledge. Please leave a comment to let me know what you think about it! Share it to your friends and learn new things together.
Transcript
PNNL-20805
Prepared for the U.S. Department of Energy under Contract DE-AC05-76RL01830
Screening Analysis for the Environmental Risk Evaluation System Task 2.1.1.2: Evaluating Effects of Stressors Fiscal Year 2011 Progress Report Environmental Effects of Marine and Hydrokinetic Energy AE Copping LC Zdanski KM Blake GA Gill RM Anderson JA Ward September 2011
PNNL-20805
Screening Analysis for the Environmental Risk Evaluation System Task 2.1.1.2: Evaluating Effects of Stressors Fiscal Year 2011 Progress Report Environmental Effects of Marine and Hydrokinetic Energy AE Copping LC Zdanski KM Blake GA Gill RM Anderson JA Ward September 2011 Prepared for the U.S. Department of Energy under Contract DE-AC05-76RL01830 Pacific Northwest National Laboratory Richland, Washington 99352
iii
Summary
Potential environmental effects of marine and hydrokinetic (MHK) energy development are not well understood, and yet regulatory agencies are required to make decisions in spite of substantial uncertainty about environmental impacts and their long-term consequences. An understanding of risks associated with interactions between MHK installations and aquatic receptors, including animals, habitats, and ecosystems, can help define key uncertainties and focus regulatory actions and scientific studies on interactions of most concern. As a first step in developing the Pacific Northwest National Laboratory (PNNL) Environmental Risk Evaluation System (ERES), PNNL scientists conducted a preliminary risk screening analysis on three initial MHK cases. During FY 2011, two additional cases were added: a tidal project in the Gulf of Maine using Ocean Renewable Power Company TidGenTM turbines and a wave project planned for the coast of Oregon using Aquamarine Oyster surge devices.
Through an iterative process, the screening analysis revealed that top-tier stressors in the two FY 2011 cases were the dynamic effects of the device (e.g., strike), accidents/disasters, and effects of the static physical presence of the device (e.g., habitat alteration). Receptor interactions with these stressors at the highest tiers of risk were dominated by threatened and endangered animals. Risk to the physical environment from changes in flow regime also ranked high. Peer review of this process and results will be conducted in early FY 2012.
The ERES screening analysis provides an analysis of vulnerability of environmental receptors to stressors associated with MHK installations. “Risk” has two components: (1) The likelihood, or “probability”, of the occurrence of a given interaction or event, and (2) the potential “consequence” if that interaction or event were to occur. During FY 2011, the ERES screening analysis focused primarily on the second component of risk, “consequence”, with focused probability analysis for interactions where data was sufficient for probability modeling. Consequence analysis provides an assessment of vulnerability of environmental receptors to stressors associated with MHK installations. Probability analysis is needed to determine specific risk levels to receptors and requires significant data inputs to drive risk models. During FY 2011, two stressor-receptor interactions were examined for the probability of occurrence. The two interactions (spill probability due to an encounter between a surface vessel and an MHK device; and toxicity from anti-biofouling paints on MHK devices) were seen to present relatively low risks to marine and freshwater receptors of greatest concern in siting and permitting MHK devices. A third probability analysis was scoped and initial steps taken to understand the risk of encounter between marine animals and rotating turbine blades. This analysis will be completed in FY 2012.

v
Project Overview
Energy generated from the world’s oceans and rivers offers the potential to make substantial contri-butions to the domestic and global renewable energy supply. The U.S. Department of Energy (DOE) Office of Energy Efficiency and Renewable Energy (EERE) Wind and Water Power Program supports the emerging marine and hydrokinetic (MHK) energy industry. As part of an emerging industry, MHK project developers face challenges related to siting, permitting, construction, and operation of pilot- and commercial-scale facilities, as well as the need to develop robust technologies, secure financing, and gain public acceptance.
Although potential effects of MHK energy generation on the aquatic environment have been catalogued (e.g., EERE 2009 http://www1.eere.energy.gov/windandhydro/pdfs/doe_eisa_633b.pdf), the conditions under which those effects could occur and their relative significance have not been firmly established. This lack of certainty affects siting and operations decisions, the regulatory process, and the level and nature of stakeholder concerns, all of which limit the pace and scale of MHK deployment.
To unravel and address the complexity of environmental issues associated with MHK energy, Pacific Northwest National Laboratory (PNNL) is developing a program of research and development that draws on the knowledge of the industry, regulators, and stakeholders and builds on investments made by the EERE Wind and Water Power Program. The PNNL program of research and development—together with complementary efforts of other national laboratories, national marine renewable energy centers, universities, and industry—supports DOE’s market acceleration activities through focused research and development on environmental effects and siting issues.
Research areas addressed include
• Categorizing and evaluating effects of stressors – Information on the environmental risks from MHK devices, including data obtained from in situ testing and laboratory experiments (see other tasks below) will be compiled in a knowledge management system known as Tethys to facilitate the creation, annotation, and exchange of information on environmental effects of MHK technologies. Tethys will support the Environmental Risk Evaluation System (ERES) that can be used by developers, regulators, and other stakeholders to assess relative risks associated with MHK technologies, site characteristics, waterbody characteristics, and receptors (i.e., habitat, marine mammals, and fish). Development of Tethys and the ERES will require focused input from various stakeholders to ensure accuracy and alignment with other needs.
• Effects on physical systems – Computational numerical modeling will be used to understand the effects of energy removal on water bodies from the short- and long-term operation of MHK devices and arrays. Initially, PNNL’s three-dimensional coastal circulation and transport model of Puget Sound will be adapted to test and optimize simulated tidal technologies that resemble those currently in proposal, laboratory trial, or pilot study test stages. This task includes assessing changes to the physical environment (currents, waves, sediments, and water quality) and the potential effects of these changes on the aquatic food webs) resulting from operation of MHK devices at both pilot- and commercial-scale in river and ocean settings.
• Effects on aquatic organisms – Testing protocols and laboratory exposure experiments will be developed and implemented to evaluate the potential for adverse effects from operation of MHK

vi
devices in the aquatic environment. Initial studies will focus on electromagnetic field effects, noise associated with construction and operation of MHK devices, and assessment of the potential risk of physical interaction of aquatic organisms with devices. A variety of fish species and invertebrates will be used as test animals, chosen due to their proximity to and potential susceptibility to MHK devices.
• Permitting and planning – Structured stakeholder communication and outreach activities will provide critical information to the project team to support execution of other project tasks. Input from MHK technology and project developers, regulators and natural resource management agencies, environmental groups, and other stakeholder groups will be used to develop the user interface of Tethys, populate the database, define the risk attributes of the ERES, and communicate results of numerical modeling and laboratory studies of exposure of test animals to MHK stressors. This task will also include activities to promote consideration of renewable ocean energy in national and local Coastal and Marine Spatial Planning activities.
The team for the Environmental Effects of Marine and Hydrokinetic Energy Development project is made up of staff, faculty, and students from
• Pacific Northwest National Laboratory
– Marine Sciences Laboratory (Sequim and Seattle, Washington)
– Risk and Decision Sciences (Richland, Washington)
– Knowledge Systems (Richland, Washington)
• Oak Ridge National Laboratory (Oak Ridge, Tennessee)
• Sandia National Laboratories (Albuquerque, New Mexico; Carlsbad, California)
• Oregon State University, Northwest National Marine Renewable Energy Center (Newport, Oregon)
• University of Washington, Northwest National Marine Renewable Energy Center (Seattle, Washington)
• Pacific Energy Ventures (Portland, Oregon).
vii
Acronyms and Abbreviations
AF antifouling AIS Automatic Identification System BCF Biological Concentration Factor DOE U.S. Department of Energy EERE DOE Office of Energy Efficiency and Renewable Energy EMF electromagnetic field ERES Environmental Risk Evaluation System FERC Federal Energy Regulatory Commission FFP Free Flow Power Corporation MHK marine and hydrokinetic NOAA National Oceanographic and Atmospheric Administration ORPC Ocean Renewable Power Company OPT Ocean Power Technology PNNL Pacific Northwest National Laboratory S–R stressor–receptor SnoPUD Snohomish County Public Utility District SQUIRT NOAA screening quick reference tables SRKW Southern Resident Killer Whales SST Sound & Sea Technology Engineering Solutions T&E threatened and endangered TSS Traffic Separation Scheme (Puget Sound) USCG U.S. Coast Guard VTS Vessel Traffic Service

ix
Contents
Summary ............................................................................................................................................... iii Project Overview ................................................................................................................................... v Acronyms and Abbreviations ................................................................................................................ vii 1.0 Introduction ................................................................................................................................... 1.1
1.1 Environmental Risk Evaluation System ............................................................................... 1.1 2.0 Methods ........................................................................................................................................ 2.1
2.1 ERES Analysis for Consequence ......................................................................................... 2.1 2.1.1 Identification of Cases ............................................................................................... 2.1 2.1.2 Identification of Risk-Relevant Stressors and Receptors and Description of
Impact Scenarios ....................................................................................................... 2.2 2.1.3 Ranking Highest-Priority Consequences for Each Case ........................................... 2.4
2.2 Probability Analysis for Selected Risks ............................................................................... 2.7 2.2.1 Spill Risk from Surface Vessel Collision .................................................................. 2.7 2.2.2 Toxicity Risk from Anti-Biofouling Paints ............................................................... 2.8 2.2.3 Risk of Encounter Between Tidal Turbine Blades and Marine Animals .................. 2.9
3.0 Results ........................................................................................................................................... 3.1 3.1 Screening Analysis Results for Two Cases .......................................................................... 3.1
3.1.1 Results of Biophysical Risk Factors for Consequence Analysis ............................... 3.1 3.1.2 Results of Regulatory Risk Factor Analysis for Consequence Analysis ................... 3.3
3.2 Probability Analysis Results ................................................................................................ 3.8 3.2.1 Results of Spill Risk from Surface Vessel Collision ................................................. 3.8 3.2.3 Risk of Encounter Between Tidal Turbine Blades and Marine Animals .................. 3.9
4.0 Discussion ..................................................................................................................................... 4.1 4.1 Consequence Analysis for FY 2011 Case Studies ............................................................... 4.1 4.2 Probability Analyses Undertaken in FY 2011 ...................................................................... 4.2
4.2.1 Probability Analysis for Spills from Surface Vessel Collision ................................. 4.3 4.2.2 Risk of Toxicity from Anti-Biofouling Paints .......................................................... 4.3 4.2.3 Risk of Encounter Between Tidal Turbine Blades and Marine Animals .................. 4.4
5.0 Next Steps in ERES Risk Assessment .......................................................................................... 5.1 6.0 References ..................................................................................................................................... A.1 Appendix A – Details of the Consequence Ranking Process and Intermediate Results Tables ........... A.7 Appendix B – Risk of Encounter Between Tidal Turbine Blades and Marine Animals ...................... B.1
x
Figures
Figure 1.1. Elements of Risk Management ............................................................................ 1.1 Figure 1.2. Description of Risk ............................................................................................... 1.2 Figure 1.3. Risk-Informed Analytical Process ....................................................................... 1.3 Figure 3.1. Conceptual Model of SRKW Diving Behavior in Admiralty Inlet, Showing
Relationship of the Input Variables to the Number of 50-m Dives ......................................... 3.9 Figure 3.2. Average Dives per Hour for SRKWs in the Waters Surrounding Admiralty Inlet .... 3.10
Tables
Table 2.1. Criteria for Choosing MHK Projects as Cases for Initial Screening Analysis During FY 2011. ...................................................................................................................... 2.2
Table 2.2. Stressors Associated with MHK Technology ................................................................ 2.3 Table 2.3. Environmental Receptors Potentially Vulnerable to MHK Technology ....................... 2.3 Table 2.4. Biophysical Risk Factors ............................................................................................... 2.5 Table 2.5. Tiered Regulatory Risk Factors Applied After Biophysical Risk Factors
(Table 2.4) to Break Ties ......................................................................................................... 2.6 Table 2.6. Vulnerable Receptor Groups and the Species or Habitats Used as Representative
Examples for Risk Analysis for Each Case ............................................................................. 2.7 Table 3.1. Relative Rank for Consequence of the Tidal (TidGenTM) Case S–R Pairs for
Biophysical Risk Factors ......................................................................................................... 3.2 Table 3.2. Relative Rank for Consequence of the Wave (Oyster) Case S–R Pairs for
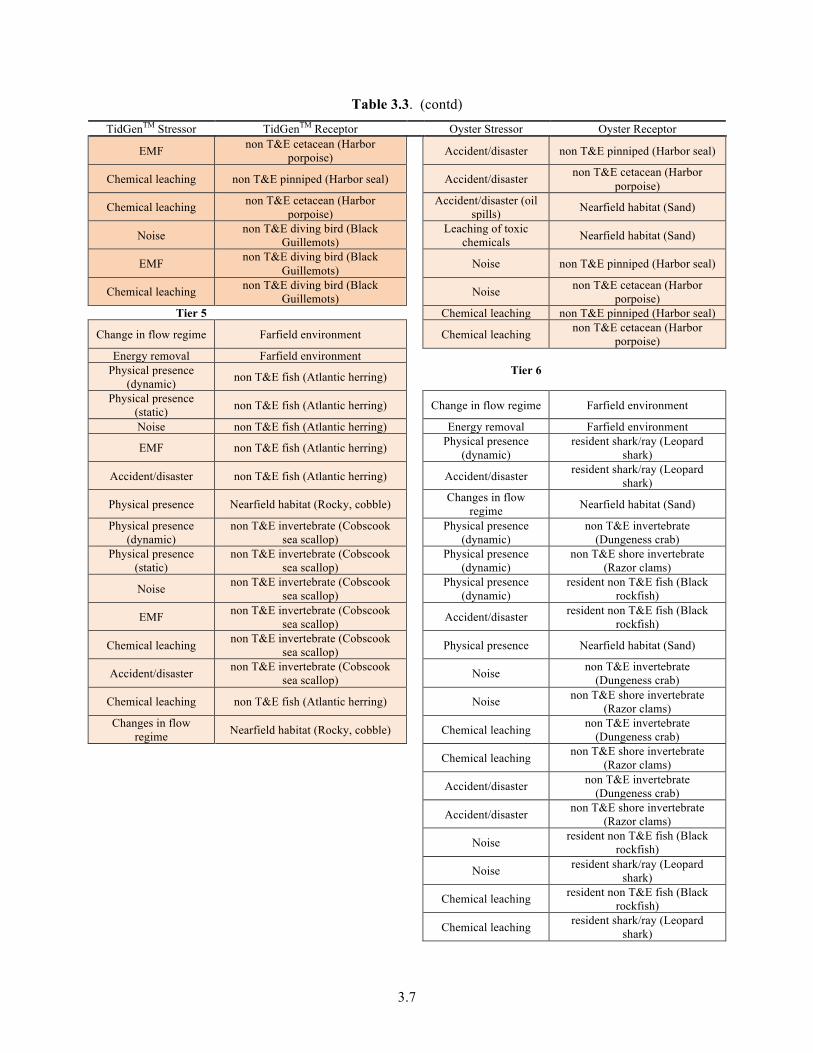
Biophysical Risk Factors ......................................................................................................... 3.4 Table 3.3. Top Tiers of Environmental Consequence for S–R Pairs for the Two Cases as
Modified by Regulatory Risk Factors. Color gradation signifies consequence rank of S–R pairs (darker = higher consequence). ....................................................................................... 3.6
1.1
1.0 Introduction
Deployment of marine and hydrokinetic (MHK) energy devices in the marine and riverine waters of the United States requires that all federal, state, and local environmental protection laws be met. Because the technology is new, the environmental impacts of MHK devices are not well known. The regulatory pathways are under development and have not yet been sufficiently tested to determine whether they will prove workable and support the needs of the emerging U.S.-based MHK industry. The Pacific Northwest National Laboratory (PNNL) has been tasked by the U.S. Department of Energy (DOE) to help set appropriate regulatory priorities for responsible deployment of MHK devices, and to recommend the most pertinent and useful research that supports those priorities.
A key step in setting regulatory and research priorities is the assignment of risk to interactions between MHK installations and aquatic receptors, including animals, habitats, and ecosystem processes in the marine waters and rivers where MHK development is feasible. Risk is defined as the likelihood of a prescribed adverse outcome from an action or set of actions. Risk assessment is the process of evaluating scientific information to estimate the probability of occurrence of the action and the severity of the effect (EPA 2011; Suter 1993).
1.1 Environmental Risk Evaluation System
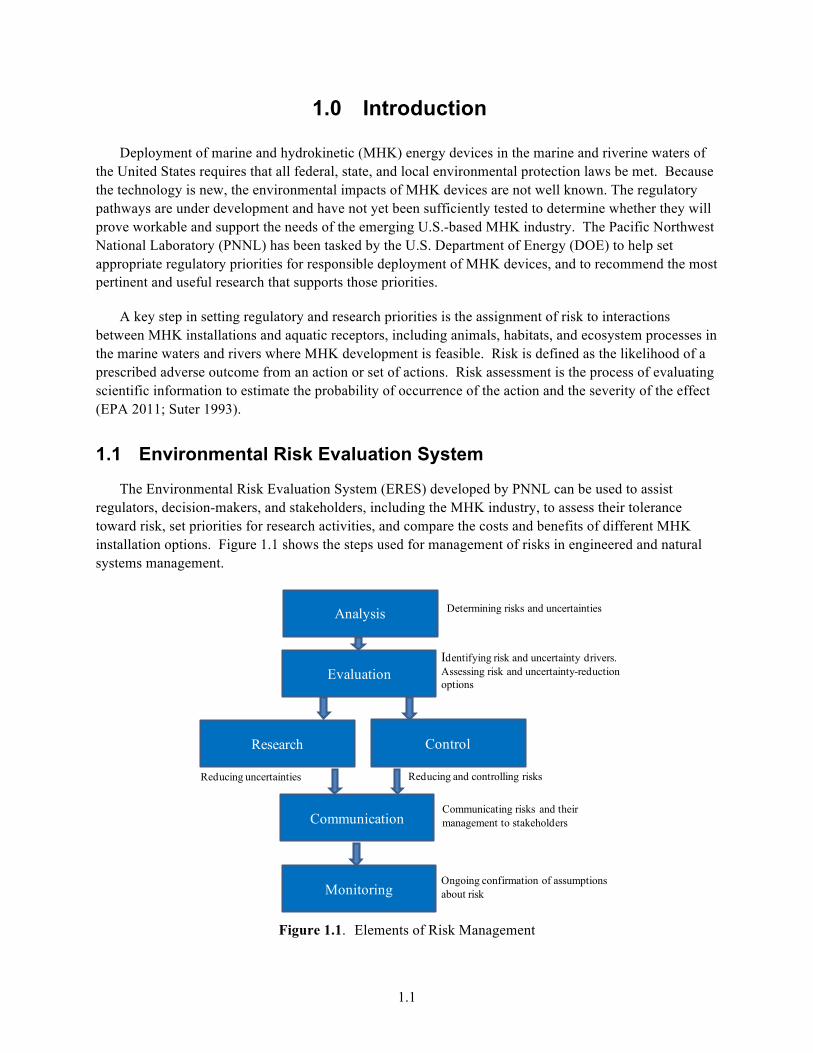
The Environmental Risk Evaluation System (ERES) developed by PNNL can be used to assist regulators, decision-makers, and stakeholders, including the MHK industry, to assess their tolerance toward risk, set priorities for research activities, and compare the costs and benefits of different MHK installation options. Figure 1.1 shows the steps used for management of risks in engineered and natural systems management.
Figure 1.1. Elements of Risk Management
Analysis
Evaluation
Control
Communication
Research
Monitoring
Determining risks and uncertainties
Identifying risk and uncertainty drivers. Assessing risk and uncertainty-reduction options
Reducing uncertainties Reducing and controlling risks
Communicating risks and their management to stakeholders
Ongoing confirmation of assumptions about risk
1.2
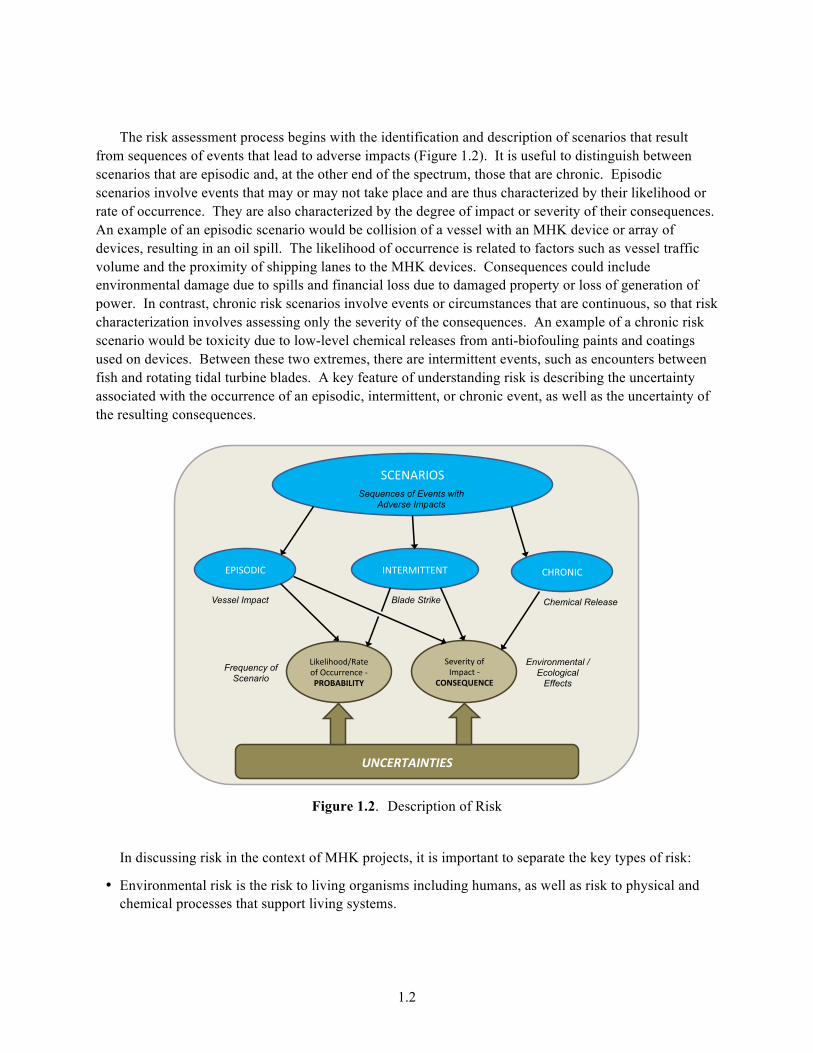
The risk assessment process begins with the identification and description of scenarios that result from sequences of events that lead to adverse impacts (Figure 1.2). It is useful to distinguish between scenarios that are episodic and, at the other end of the spectrum, those that are chronic. Episodic scenarios involve events that may or may not take place and are thus characterized by their likelihood or rate of occurrence. They are also characterized by the degree of impact or severity of their consequences. An example of an episodic scenario would be collision of a vessel with an MHK device or array of devices, resulting in an oil spill. The likelihood of occurrence is related to factors such as vessel traffic volume and the proximity of shipping lanes to the MHK devices. Consequences could include environmental damage due to spills and financial loss due to damaged property or loss of generation of power. In contrast, chronic risk scenarios involve events or circumstances that are continuous, so that risk characterization involves assessing only the severity of the consequences. An example of a chronic risk scenario would be toxicity due to low-level chemical releases from anti-biofouling paints and coatings used on devices. Between these two extremes, there are intermittent events, such as encounters between fish and rotating tidal turbine blades. A key feature of understanding risk is describing the uncertainty associated with the occurrence of an episodic, intermittent, or chronic event, as well as the uncertainty of the resulting consequences.
Figure 1.2. Description of Risk
In discussing risk in the context of MHK projects, it is important to separate the key types of risk:
• Environmental risk is the risk to living organisms including humans, as well as risk to physical and chemical processes that support living systems.
!"#$%&'(!)
#*'!(+'")
,-./0-12234&56/)27)(889::/;8/)<))!"#$%$&'&()*
!"#$%&'("&($)*
!/=/:-6>)27)'?@586)<))
+#,-./0.,+.*
Vessel Impact Chemical Release
Sequences of Events with Adverse Impacts
Environmental / Ecological
Effects
Frequency of Scenario
"A&($'")'$B#&C'BB#$B)
Blade Strike
1
1.3
• Regulatory risk is the risk to MHK permitting and approvals due to regulations or their implementation.
• Investment risk is the risk to capital investment due to regulatory, legal, or market forces.
ERES was created to address environmental risk because environmental risk also drives regulatory and investment risk. In licensing MHK projects in the United States, multiple federal and state environmental protection laws and regulations mandate studies to assess the risk or potential harm to aspects of the natural environment, and will affect the permitting process. In particular, the National Environmental Policy Act of 1969 will apply to the development of all MHK projects in waters of the United States. Although the National Environmental Policy Act of 1969 is procedural, unlike many other standard- or threshold-driven applicable environmental laws and regulations, it has the potential to stop or significantly slow a permitting process.
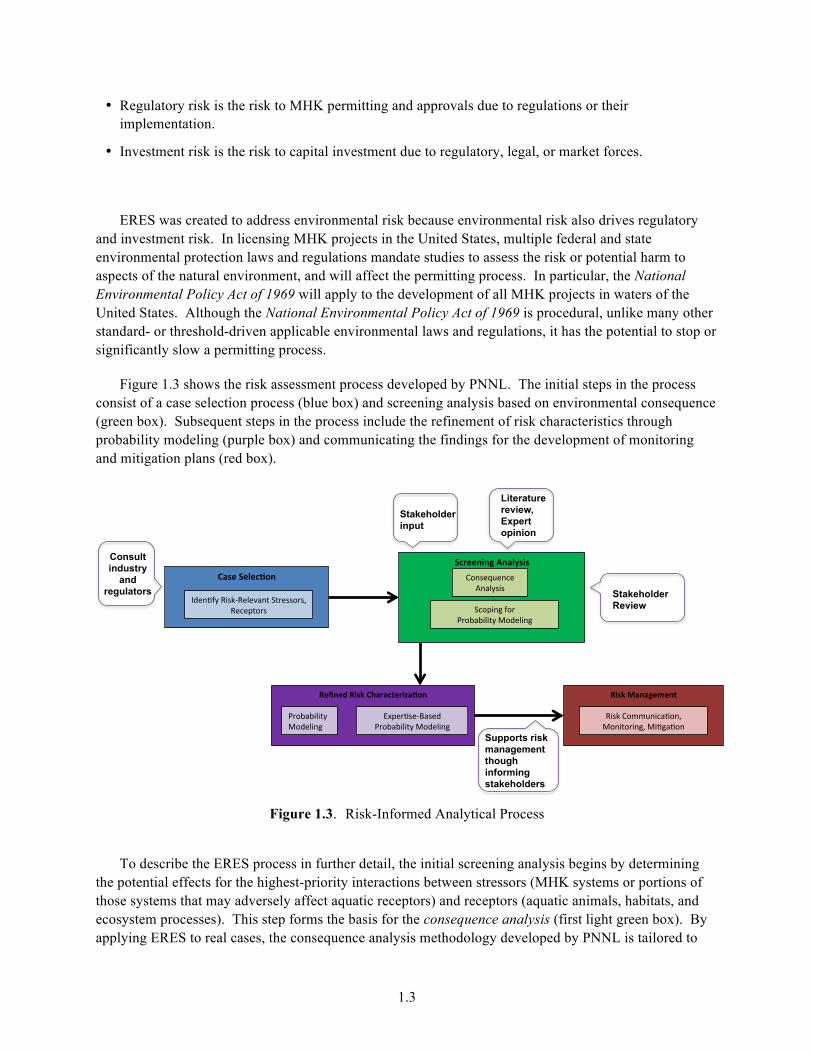
Figure 1.3 shows the risk assessment process developed by PNNL. The initial steps in the process consist of a case selection process (blue box) and screening analysis based on environmental consequence (green box). Subsequent steps in the process include the refinement of risk characteristics through probability modeling (purple box) and communicating the findings for the development of monitoring and mitigation plans (red box).
Figure 1.3. Risk-Informed Analytical Process
To describe the ERES process in further detail, the initial screening analysis begins by determining
the potential effects for the highest-priority interactions between stressors (MHK systems or portions of those systems that may adversely affect aquatic receptors) and receptors (aquatic animals, habitats, and ecosystem processes). This step forms the basis for the consequence analysis (first light green box). By applying ERES to real cases, the consequence analysis methodology developed by PNNL is tailored to
!"#$"%&!'()&*+,-,./"-'0,12$&!!!!
"#$%&%'(')*!+$,-('./!
012-#34-56&4-,!"#$%&%'(')*!+$,-('./!
!'()&3,$,4"5"$/&!!!!
7'48!9$::;.'<&3$.=!+$.')$#'./=!+'3/&3$.!
6.-""$'$4&7$,89('(&!!!!
9$.4->;-.<-!?.&(*4'4!
@<$2'./!A$#!!"#$%&%'(')*!+$,-('./!
*,("&6"8".12$&!!!!
B,-.3A*!7'4857-(-C&.)!@)#-44$#4=!7-<-2)$#4!
Consult industry
and regulators
Stakeholder input
Literature review, Expert opinion
Stakeholder Review
Supports risk management though informing stakeholders
1.4
the unique needs of a multivariate set of interactions that may occur among many different types of stressors and a diverse group of receptors. Standardized risk assessment methodologies that require large known data sets are not well suited to assess or set priorities for MHK development; interactions involving MHK devices are not well known and require additional research. Interactions such as the impact of electromagnetic field (EMF) stress on sea turtles, the potential for blade strike on marine mammals, or the potential effect of energy removal on nearshore features are posited but not confirmed. The consequence screening analysis step in ERES helps narrow the focus of potential impacts of MHK devices to the impacts of highest priority. In FY 2010, three initial cases were selected and screened for environmental consequence: one tidal, one wave, and one river. In FY 2011 two additional cases were selected and screened for environmental consequence: a second tidal and a second wave case.
Once environmental consequences have been analyzed, the screening analysis proceeds to scoping for probability modeling (second light green box). Refined characterization of priority risks identified through consequence analysis will be further evaluated (purple box) through probability modeling (first light purple box) in cases for which environmental data are available and expertise-based evaluation (second light purple box) in cases for which data are not yet available. Probability modeling will be preferentially conducted on top-ranked stressor/receptor interactions that appear to be most highly affected by the probability of occurrence (i.e. most probability-dependent interactions).
Building on the knowledge from FY2010, probability analyses were carried out in FY2011 for two stressor-receptor interactions for which sufficient data exist: 1) the risk of a spill of oil or other hazardous materials due to a tidal turbine encounter with a surface vessel on a broad variety of marine receptors was chosen because it is a scenario with low probability and high potential consequences; and 2) toxicity from anti-biofouling paints into the marine environment was chosen because it is a scenario of extremely high probability and low potential consequences. In preparation for further exploration in FY2012, a third probability analysis focused on the encounter of a marine receptor with a very high potential consequence of harm from an encounter with tidal turbine blades. This aspect of a tidal case was organized to lay the groundwork for expertise-based probability modeling in future ERES investigations.
With input and review from academics, federal and state environmental regulators, and industry representatives, the outcome of the screening analysis and refined risk characterization will be refined through peer review and to establish a rigorous process of evaluating risk based on real MHK development cases. ERES has been developed to ensure that new and more robust data will be incorporated into the risk modeling as they become available.
This report details the consequence analysis for the two cases chosen for FY2011, the scoping for probability analysis, the results of two probability analyses, and initial steps in a third probability analysis. The methods used to conduct the screening analysis and initial risk modeling are detailed in Section 2. Results of the consequence analysis and initial probability modeling efforts are presented in Section 3. The outcomes are presented in Section 4. Section 5 presents a summary of next steps in the risk assessment. References cited are listed in Section 6. Appendices provide additional details on the ranking process used in the consequence analysis, as well as the background for risk modeling efforts.
2.1
2.0 Methods
Methods for Consequence Analysis consist of identification and screening analyses; these are detailed in Section 2.1. Additional backup materials can be viewed in the appendices. The three steps are
• identification and description of the two cases chosen for FY 2011 (Section 2.1.1)
• identification of risk-relevant stressors and receptors and description of impact scenarios (Section 2.1.2)
• ranking of highest-priority risks for each case, taking only consequences into account (Section 2.1.3).
There are two important assumptions that underlie the development of ERES: that all S–R interactions are independent of one another, and that the most severe yet reasonable consequences are assigned to each interaction.
Methods for probability modeling addressed in FY 2011 are detailed in Section 2.2, including probability of a spill due to interaction with a surface vessel (Section 2.2.1); probability of toxicity from anti-biofouling paints (Section 2.2.2); and risk of encounter between tidal blades and marine animals (Section 2.2.3).
2.1 ERES Analysis for Consequence
2.1.1 Case Selection
Case information was collected from proposed MHK projects to provide an integrated profile of the collective risk posed by a specific MHK system (i.e., the device, moorings, anchors, surface floats, and cables) deployed in a specific body of water that supports a specific set of aquatic animals, habitats, and ecosystems. A variety of cases were selected in order to develop a sufficiently diverse knowledge base of S-R interactions. The collection of all S–R pairs for a given location and MHK installation constitutes an impact scenario that a project developer would expect to have to address to resolve regulatory and permitting requirements before deployment or operation of an MHK installation. These impact scenarios will inform discussion between the project developer and regulators to define the necessary set of monitoring and effects data collection for the project site.
The method for identifying cases in FY 2011 followed that used in FY 2010 (Copping et al. 2011). Cases were drawn from proposed MHK projects, focusing on those that are progressing through the permitting and development process, using criteria that have been discussed with members of the DOE Water Power Team, other national laboratories, MHK project developers, regulators, environmental organizations, and other stakeholders (Table 2.1). The criteria shown in Table 2.1 were evaluated in sequential order for each case. Cases that received Yes or Sufficient for a criterion were passed on to the next criterion for consideration. Cases that received No or Insufficient for certain criteria were removed from consideration for FY 2011 but will be reconsidered at a later date. The cases identified in FY 2010 were chosen from among projects classified as pilot or commercial projects under the Federal Energy Regulatory Commission’s (FERC) regulatory framework. The FY 2010 cases (Snohomish County Public Utility District tidal project in Admiralty Inlet, Puget Sound, Washington [SnoPUD]; Ocean Power Technology wave installation off Reedsport, Oregon [OPT]; and Free Flow Power [FFP] river installation
2.2
in the Mississippi River, Louisiana) represented MHK projects engaged in the FERC licensing process. Since FY 2010, two of the projects (OPT and FFP) have placed devices in the water.
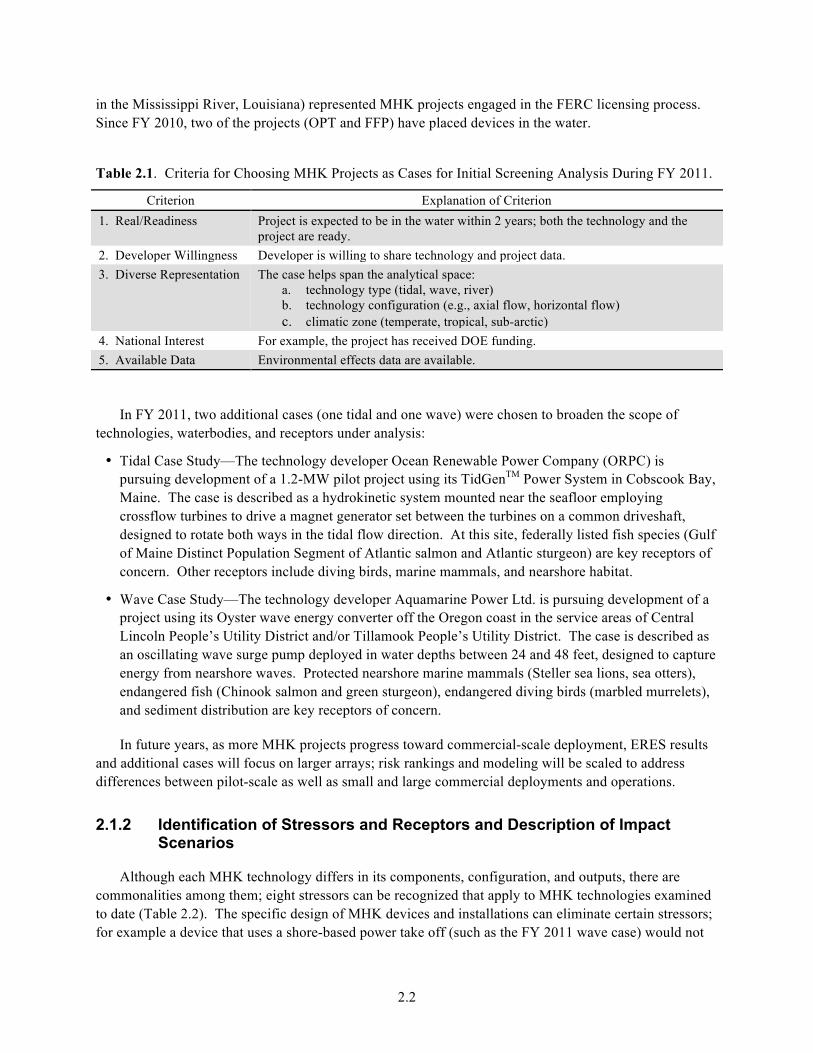
Table 2.1. Criteria for Choosing MHK Projects as Cases for Initial Screening Analysis During FY 2011.
Criterion Explanation of Criterion 1. Real/Readiness Project is expected to be in the water within 2 years; both the technology and the
project are ready. 2. Developer Willingness Developer is willing to share technology and project data. 3. Diverse Representation The case helps span the analytical space:
a. technology type (tidal, wave, river) b. technology configuration (e.g., axial flow, horizontal flow) c. climatic zone (temperate, tropical, sub-arctic)
4. National Interest For example, the project has received DOE funding. 5. Available Data Environmental effects data are available.
In FY 2011, two additional cases (one tidal and one wave) were chosen to broaden the scope of technologies, waterbodies, and receptors under analysis:
• Tidal Case Study—The technology developer Ocean Renewable Power Company (ORPC) is pursuing development of a 1.2-MW pilot project using its TidGenTM Power System in Cobscook Bay, Maine. The case is described as a hydrokinetic system mounted near the seafloor employing crossflow turbines to drive a magnet generator set between the turbines on a common driveshaft, designed to rotate both ways in the tidal flow direction. At this site, federally listed fish species (Gulf of Maine Distinct Population Segment of Atlantic salmon and Atlantic sturgeon) are key receptors of concern. Other receptors include diving birds, marine mammals, and nearshore habitat.
• Wave Case Study—The technology developer Aquamarine Power Ltd. is pursuing development of a project using its Oyster wave energy converter off the Oregon coast in the service areas of Central Lincoln People’s Utility District and/or Tillamook People’s Utility District. The case is described as an oscillating wave surge pump deployed in water depths between 24 and 48 feet, designed to capture energy from nearshore waves. Protected nearshore marine mammals (Steller sea lions, sea otters), endangered fish (Chinook salmon and green sturgeon), endangered diving birds (marbled murrelets), and sediment distribution are key receptors of concern.
In future years, as more MHK projects progress toward commercial-scale deployment, ERES results and additional cases will focus on larger arrays; risk rankings and modeling will be scaled to address differences between pilot-scale as well as small and large commercial deployments and operations.
2.1.2 Identification of Stressors and Receptors and Description of Impact Scenarios
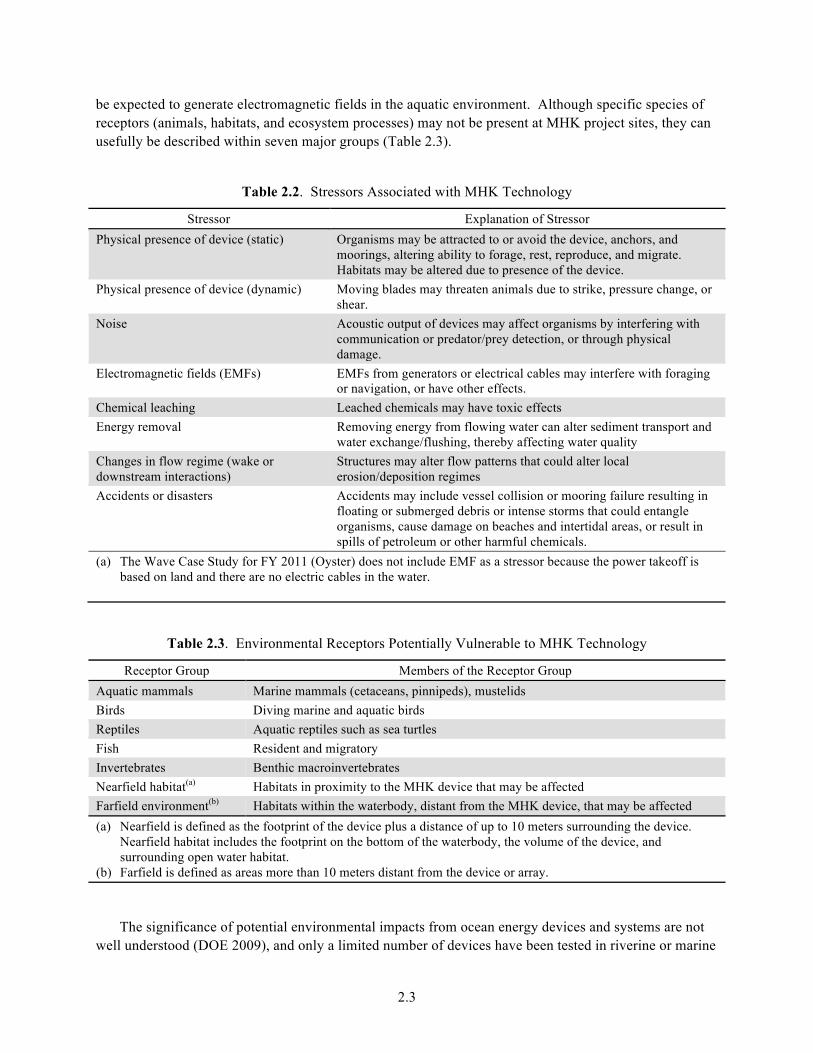
Although each MHK technology differs in its components, configuration, and outputs, there are commonalities among them; eight stressors can be recognized that apply to MHK technologies examined to date (Table 2.2). The specific design of MHK devices and installations can eliminate certain stressors; for example a device that uses a shore-based power take off (such as the FY 2011 wave case) would not
2.3
be expected to generate electromagnetic fields in the aquatic environment. Although specific species of receptors (animals, habitats, and ecosystem processes) may not be present at MHK project sites, they can usefully be described within seven major groups (Table 2.3).
Table 2.2. Stressors Associated with MHK Technology
Stressor Explanation of Stressor Physical presence of device (static) Organisms may be attracted to or avoid the device, anchors, and
moorings, altering ability to forage, rest, reproduce, and migrate. Habitats may be altered due to presence of the device.
Physical presence of device (dynamic) Moving blades may threaten animals due to strike, pressure change, or shear.
Noise Acoustic output of devices may affect organisms by interfering with communication or predator/prey detection, or through physical damage.
Electromagnetic fields (EMFs) EMFs from generators or electrical cables may interfere with foraging or navigation, or have other effects.
Chemical leaching Leached chemicals may have toxic effects Energy removal Removing energy from flowing water can alter sediment transport and
water exchange/flushing, thereby affecting water quality Changes in flow regime (wake or downstream interactions)
Structures may alter flow patterns that could alter local erosion/deposition regimes
Accidents or disasters Accidents may include vessel collision or mooring failure resulting in floating or submerged debris or intense storms that could entangle organisms, cause damage on beaches and intertidal areas, or result in spills of petroleum or other harmful chemicals.
(a) The Wave Case Study for FY 2011 (Oyster) does not include EMF as a stressor because the power takeoff is based on land and there are no electric cables in the water.
Table 2.3. Environmental Receptors Potentially Vulnerable to MHK Technology
Receptor Group Members of the Receptor Group Aquatic mammals Marine mammals (cetaceans, pinnipeds), mustelids Birds Diving marine and aquatic birds Reptiles Aquatic reptiles such as sea turtles Fish Resident and migratory Invertebrates Benthic macroinvertebrates Nearfield habitat(a) Habitats in proximity to the MHK device that may be affected Farfield environment(b) Habitats within the waterbody, distant from the MHK device, that may be affected (a) Nearfield is defined as the footprint of the device plus a distance of up to 10 meters surrounding the device.
Nearfield habitat includes the footprint on the bottom of the waterbody, the volume of the device, and surrounding open water habitat.
(b) Farfield is defined as areas more than 10 meters distant from the device or array.
The significance of potential environmental impacts from ocean energy devices and systems are not well understood (DOE 2009), and only a limited number of devices have been tested in riverine or marine
2.4
environments; the industry has yet to settle on a clear preferred technology for any waterbody type. As a result, the U.S. MHK industry is building on lessons learned from Europe, where MHK deployments are more advanced, from the limited number of U.S. MHK deployments to date, and from U.S.-based conventional hydropower and the domestic wind industry. There are some similarities between MHK and more mature technologies such as conventional hydropower, offshore oil and gas, and offshore wind; consequently, environmental impact and monitoring literature for these industries (e.g., Ligon et al. 1995; Carstensen et al. 2006; Poff et al. 2007; Nunneri et al. 2008) was evaluated to help develop impact scenarios for specific S-R pairs.
Recent reviews of the potential impacts of MHK technologies (e.g., Gill 2005; Devine Tarbell and Associates 2006; Michel et al. 2007; MMS 2007; Wilson et al. 2007; DOE 2009; Mangi Environmental Group 2010) were used in this study to evaluate consequences of S–R interactions. Reports from two recent scientific workshops on the environmental effects of wave energy (Boehlert et al. 2008) and tidal energy (Polagye et al. 2011) were also consulted. For the FY 2011 case studies, project- or site-specific information was gathered from environmental scoping reports (Lewis Wave Power Limited 2011; Vickery and Center for Ecological Research 2011), U.S. regulatory filings (FERC Online Elibrary), publications (Cameron et al. 2011; van der Voo 2011), industry websites, and discussions with project staff. In some cases, it was valuable to consult subject-specific references in addition to these synthesis reviews, including
• device components, including cable installation by directional drilling (Polagye and Previsic 2010)
• impact of device presence on fish behavior and abundance (Blyth et al. 2004)
• impact of wave devices on birds (Grecian et al. 2010)
• impacts to animal movement/migration, including fish and turtle aggregating behavior (Arenas and Hall 1992)
• vulnerability of marine mammals to strike, entanglement (Wilson et al. 2007; Fraenkel 2006)
• removal of hydrokinetic energy (von Arx et al. 1974; Bryden et al. 2004; Garrett and Cummins 2008; Karsten et al. 2008; Polagye et al. 2008) and change in sediment transport (Neill et al. 2009)
• effects from EMFs (Kirschvink et al. 2001; NRC 1997, Gill et al. 2005; Michel et al. 2007; Normandeau Associates, Inc. et al. 2011)
• potential acoustic impacts to marine/aquatic animals (Michel et al. 2007; NRC 2000; Southall et al. 2007).
2.1.3 Ranking Highest-Priority Consequences for Each Case
Risk is defined by both consequence of impact and probability of that impact occurring (Figure 1.2). Assigning relative risk based on consequence to each interaction between the stressors and receptors and prioritizing risks for detailed probability analysis is the essence of the screening analysis step. The process for ranking S–R pairs based on environmental consequence is outlined here. Ranked S–R pairs and interactions identified for priority probability analysis are presented in a later section. Further details on the analysis steps and risk factors, as well as tables of intermediate analysis steps, are contained in Appendix A.
2.5
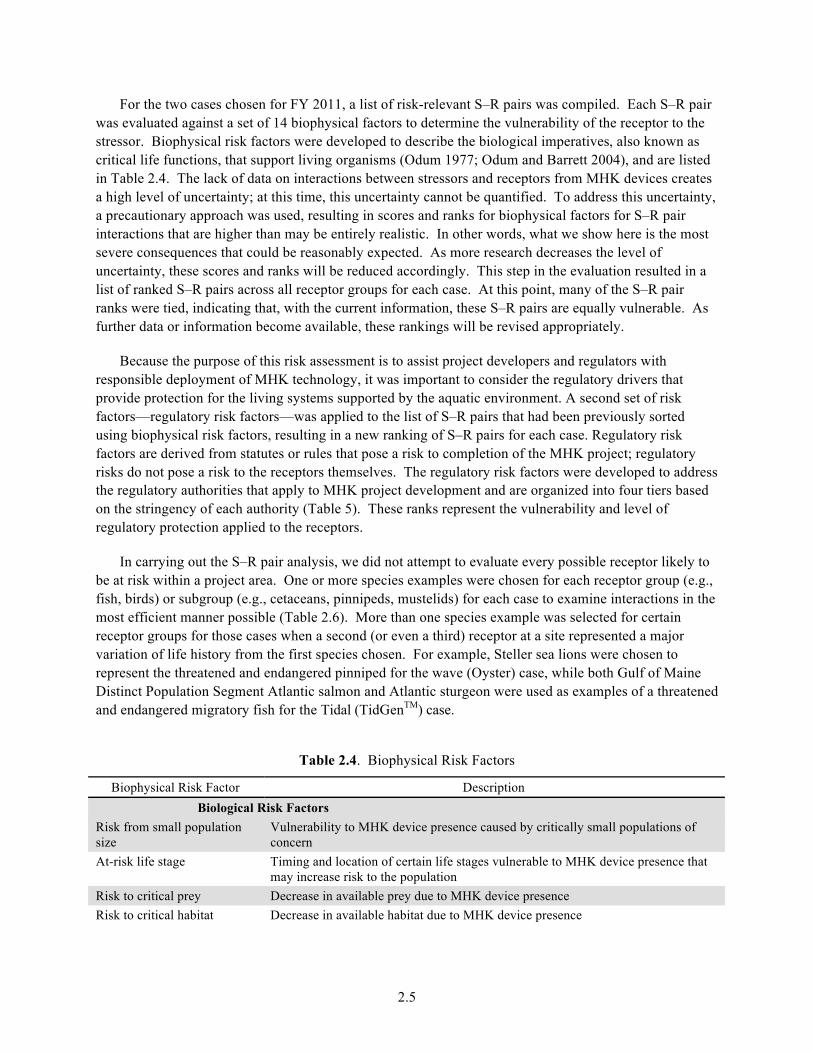
For the two cases chosen for FY 2011, a list of risk-relevant S–R pairs was compiled. Each S–R pair was evaluated against a set of 14 biophysical factors to determine the vulnerability of the receptor to the stressor. Biophysical risk factors were developed to describe the biological imperatives, also known as critical life functions, that support living organisms (Odum 1977; Odum and Barrett 2004), and are listed in Table 2.4. The lack of data on interactions between stressors and receptors from MHK devices creates a high level of uncertainty; at this time, this uncertainty cannot be quantified. To address this uncertainty, a precautionary approach was used, resulting in scores and ranks for biophysical factors for S–R pair interactions that are higher than may be entirely realistic. In other words, what we show here is the most severe consequences that could be reasonably expected. As more research decreases the level of uncertainty, these scores and ranks will be reduced accordingly. This step in the evaluation resulted in a list of ranked S–R pairs across all receptor groups for each case. At this point, many of the S–R pair ranks were tied, indicating that, with the current information, these S–R pairs are equally vulnerable. As further data or information become available, these rankings will be revised appropriately.
Because the purpose of this risk assessment is to assist project developers and regulators with responsible deployment of MHK technology, it was important to consider the regulatory drivers that provide protection for the living systems supported by the aquatic environment. A second set of risk factors—regulatory risk factors—was applied to the list of S–R pairs that had been previously sorted using biophysical risk factors, resulting in a new ranking of S–R pairs for each case. Regulatory risk factors are derived from statutes or rules that pose a risk to completion of the MHK project; regulatory risks do not pose a risk to the receptors themselves. The regulatory risk factors were developed to address the regulatory authorities that apply to MHK project development and are organized into four tiers based on the stringency of each authority (Table 5). These ranks represent the vulnerability and level of regulatory protection applied to the receptors.
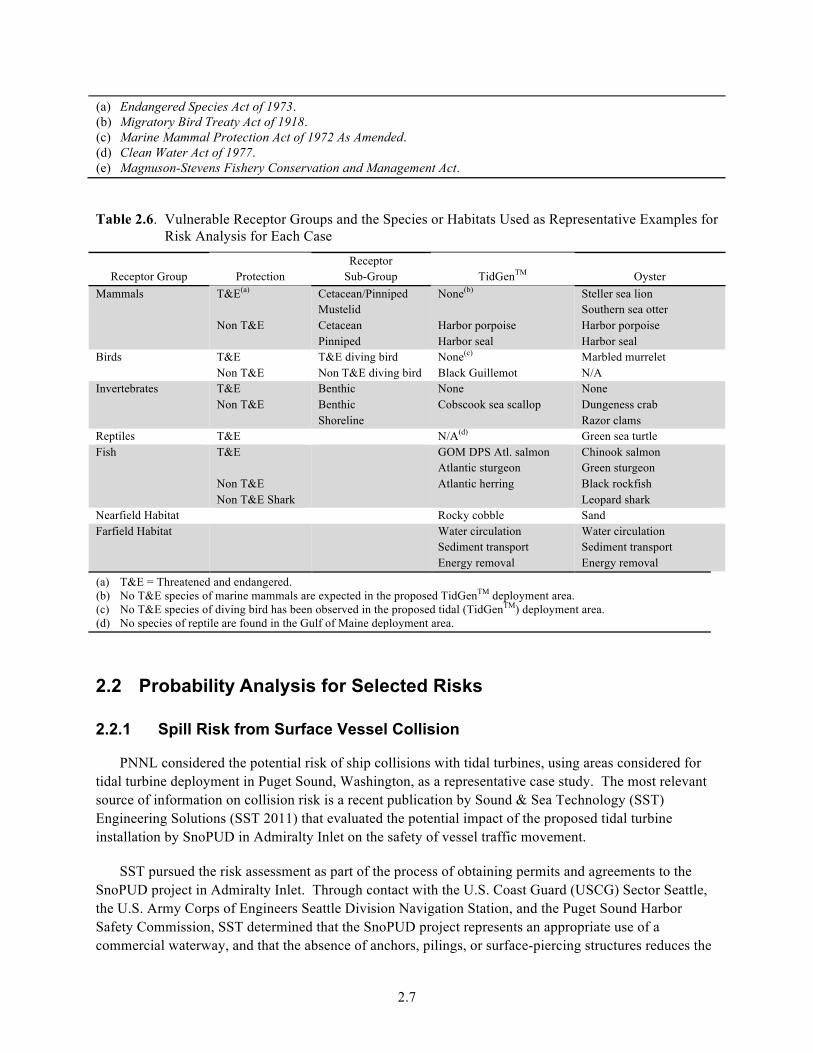
In carrying out the S–R pair analysis, we did not attempt to evaluate every possible receptor likely to be at risk within a project area. One or more species examples were chosen for each receptor group (e.g., fish, birds) or subgroup (e.g., cetaceans, pinnipeds, mustelids) for each case to examine interactions in the most efficient manner possible (Table 2.6). More than one species example was selected for certain receptor groups for those cases when a second (or even a third) receptor at a site represented a major variation of life history from the first species chosen. For example, Steller sea lions were chosen to represent the threatened and endangered pinniped for the wave (Oyster) case, while both Gulf of Maine Distinct Population Segment Atlantic salmon and Atlantic sturgeon were used as examples of a threatened and endangered migratory fish for the Tidal (TidGenTM) case.
Table 2.4. Biophysical Risk Factors
Biophysical Risk Factor Description Biological Risk Factors Risk from small population size
Vulnerability to MHK device presence caused by critically small populations of concern
At-risk life stage Timing and location of certain life stages vulnerable to MHK device presence that may increase risk to the population
Risk to critical prey Decrease in available prey due to MHK device presence Risk to critical habitat Decrease in available habitat due to MHK device presence
2.6
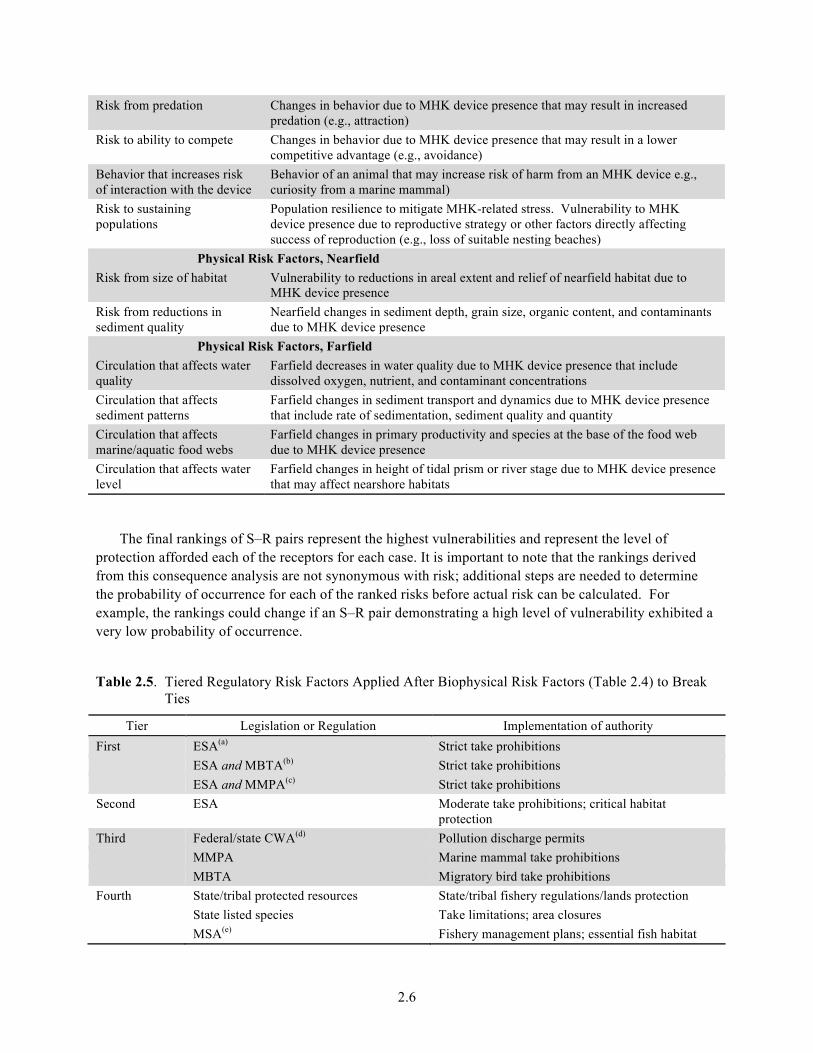
Risk from predation Changes in behavior due to MHK device presence that may result in increased predation (e.g., attraction)
Risk to ability to compete Changes in behavior due to MHK device presence that may result in a lower competitive advantage (e.g., avoidance)
Behavior that increases risk of interaction with the device
Behavior of an animal that may increase risk of harm from an MHK device e.g., curiosity from a marine mammal)
Risk to sustaining populations
Population resilience to mitigate MHK-related stress. Vulnerability to MHK device presence due to reproductive strategy or other factors directly affecting success of reproduction (e.g., loss of suitable nesting beaches)
Physical Risk Factors, Nearfield Risk from size of habitat Vulnerability to reductions in areal extent and relief of nearfield habitat due to
MHK device presence Risk from reductions in sediment quality
Nearfield changes in sediment depth, grain size, organic content, and contaminants due to MHK device presence
Physical Risk Factors, Farfield Circulation that affects water quality
Farfield decreases in water quality due to MHK device presence that include dissolved oxygen, nutrient, and contaminant concentrations
Circulation that affects sediment patterns
Farfield changes in sediment transport and dynamics due to MHK device presence that include rate of sedimentation, sediment quality and quantity
Circulation that affects marine/aquatic food webs
Farfield changes in primary productivity and species at the base of the food web due to MHK device presence
Circulation that affects water level
Farfield changes in height of tidal prism or river stage due to MHK device presence that may affect nearshore habitats
The final rankings of S–R pairs represent the highest vulnerabilities and represent the level of protection afforded each of the receptors for each case. It is important to note that the rankings derived from this consequence analysis are not synonymous with risk; additional steps are needed to determine the probability of occurrence for each of the ranked risks before actual risk can be calculated. For example, the rankings could change if an S–R pair demonstrating a high level of vulnerability exhibited a very low probability of occurrence.
Table 2.5. Tiered Regulatory Risk Factors Applied After Biophysical Risk Factors (Table 2.4) to Break Ties
Tier Legislation or Regulation Implementation of authority First ESA(a) Strict take prohibitions ESA and MBTA(b) Strict take prohibitions ESA and MMPA(c) Strict take prohibitions Second ESA Moderate take prohibitions; critical habitat
protection Third Federal/state CWA(d) Pollution discharge permits MMPA Marine mammal take prohibitions MBTA Migratory bird take prohibitions Fourth State/tribal protected resources State/tribal fishery regulations/lands protection State listed species Take limitations; area closures MSA(e) Fishery management plans; essential fish habitat
2.7
(a) Endangered Species Act of 1973. (b) Migratory Bird Treaty Act of 1918. (c) Marine Mammal Protection Act of 1972 As Amended. (d) Clean Water Act of 1977. (e) Magnuson-Stevens Fishery Conservation and Management Act.
Table 2.6. Vulnerable Receptor Groups and the Species or Habitats Used as Representative Examples for Risk Analysis for Each Case
Receptor Group Protection Receptor
Sub-Group TidGenTM Oyster Mammals T&E(a)
Non T&E
Cetacean/Pinniped Mustelid Cetacean Pinniped
None(b)
Harbor porpoise Harbor seal
Steller sea lion Southern sea otter Harbor porpoise Harbor seal
Birds T&E Non T&E
T&E diving bird Non T&E diving bird
None(c)
Black Guillemot Marbled murrelet N/A
Invertebrates T&E Non T&E
Benthic Benthic Shoreline
None Cobscook sea scallop
None Dungeness crab Razor clams
Reptiles T&E N/A(d) Green sea turtle Fish T&E
Non T&E Non T&E Shark
GOM DPS Atl. salmon Atlantic sturgeon Atlantic herring
Chinook salmon Green sturgeon Black rockfish Leopard shark
Nearfield Habitat Rocky cobble Sand Farfield Habitat Water circulation
Sediment transport Energy removal
Water circulation Sediment transport Energy removal
(a) T&E = Threatened and endangered. (b) No T&E species of marine mammals are expected in the proposed TidGenTM deployment area. (c) No T&E species of diving bird has been observed in the proposed tidal (TidGenTM) deployment area. (d) No species of reptile are found in the Gulf of Maine deployment area.
2.2 Probability Analysis for Selected Risks
2.2.1 Spill Risk from Surface Vessel Collision
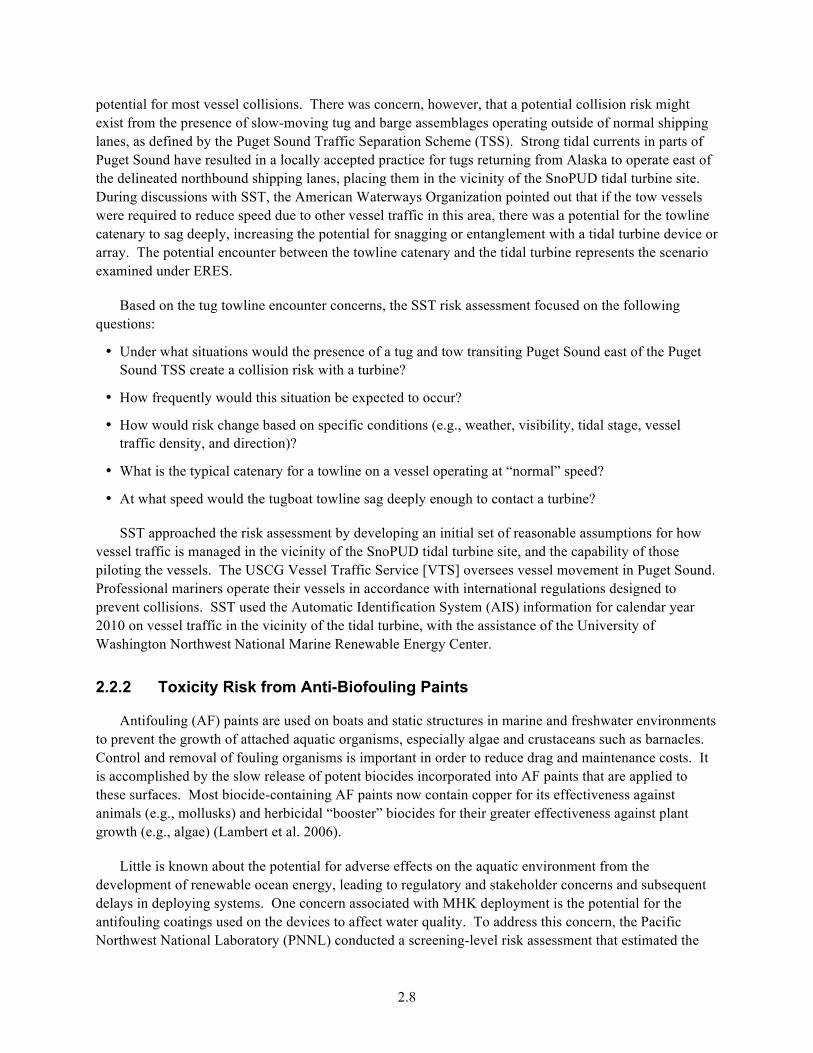
PNNL considered the potential risk of ship collisions with tidal turbines, using areas considered for tidal turbine deployment in Puget Sound, Washington, as a representative case study. The most relevant source of information on collision risk is a recent publication by Sound & Sea Technology (SST) Engineering Solutions (SST 2011) that evaluated the potential impact of the proposed tidal turbine installation by SnoPUD in Admiralty Inlet on the safety of vessel traffic movement.
SST pursued the risk assessment as part of the process of obtaining permits and agreements to the SnoPUD project in Admiralty Inlet. Through contact with the U.S. Coast Guard (USCG) Sector Seattle, the U.S. Army Corps of Engineers Seattle Division Navigation Station, and the Puget Sound Harbor Safety Commission, SST determined that the SnoPUD project represents an appropriate use of a commercial waterway, and that the absence of anchors, pilings, or surface-piercing structures reduces the
2.8
potential for most vessel collisions. There was concern, however, that a potential collision risk might exist from the presence of slow-moving tug and barge assemblages operating outside of normal shipping lanes, as defined by the Puget Sound Traffic Separation Scheme (TSS). Strong tidal currents in parts of Puget Sound have resulted in a locally accepted practice for tugs returning from Alaska to operate east of the delineated northbound shipping lanes, placing them in the vicinity of the SnoPUD tidal turbine site. During discussions with SST, the American Waterways Organization pointed out that if the tow vessels were required to reduce speed due to other vessel traffic in this area, there was a potential for the towline catenary to sag deeply, increasing the potential for snagging or entanglement with a tidal turbine device or array. The potential encounter between the towline catenary and the tidal turbine represents the scenario examined under ERES.
Based on the tug towline encounter concerns, the SST risk assessment focused on the following questions:
• Under what situations would the presence of a tug and tow transiting Puget Sound east of the Puget Sound TSS create a collision risk with a turbine?
• How frequently would this situation be expected to occur?
• How would risk change based on specific conditions (e.g., weather, visibility, tidal stage, vessel traffic density, and direction)?
• What is the typical catenary for a towline on a vessel operating at “normal” speed?
• At what speed would the tugboat towline sag deeply enough to contact a turbine?
SST approached the risk assessment by developing an initial set of reasonable assumptions for how vessel traffic is managed in the vicinity of the SnoPUD tidal turbine site, and the capability of those piloting the vessels. The USCG Vessel Traffic Service [VTS] oversees vessel movement in Puget Sound. Professional mariners operate their vessels in accordance with international regulations designed to prevent collisions. SST used the Automatic Identification System (AIS) information for calendar year 2010 on vessel traffic in the vicinity of the tidal turbine, with the assistance of the University of Washington Northwest National Marine Renewable Energy Center.
2.2.2 Toxicity Risk from Anti-Biofouling Paints
Antifouling (AF) paints are used on boats and static structures in marine and freshwater environments to prevent the growth of attached aquatic organisms, especially algae and crustaceans such as barnacles. Control and removal of fouling organisms is important in order to reduce drag and maintenance costs. It is accomplished by the slow release of potent biocides incorporated into AF paints that are applied to these surfaces. Most biocide-containing AF paints now contain copper for its effectiveness against animals (e.g., mollusks) and herbicidal “booster” biocides for their greater effectiveness against plant growth (e.g., algae) (Lambert et al. 2006).
Little is known about the potential for adverse effects on the aquatic environment from the development of renewable ocean energy, leading to regulatory and stakeholder concerns and subsequent delays in deploying systems. One concern associated with MHK deployment is the potential for the antifouling coatings used on the devices to affect water quality. To address this concern, the Pacific Northwest National Laboratory (PNNL) conducted a screening-level risk assessment that estimated the
2.9
increase in ambient sediment and water concentrations of antifouling compounds potentially resulting from MHK device deployment and compared the concentrations to existing regulatory or conservative toxicological benchmarks intended to be protective of aquatic life.
The screening-level assessment focused on two metals (copper and zinc) and two booster biocides (diuron and ingarol) commonly found in antifouling paints and coatings. Two case studies were included in the assessment: the Snohomish County Public Utility District No. 1 (SnoPUD) tidal turbine energy project in Admiralty Inlet, Puget Sound, Washington, and the Ocean Power Technologies (OPT) wave buoy project at Reedsport, Oregon. Because these case studies include two different types of MHK devices deployed in estuary and ocean environmental settings, they provide a representative overview of the potential effects of anti-biofouling coatings on aquatic resources.
Although copper and zinc are both used as antifouling biocides, they are also natural constituents of marine waters and sediments, and are introduced into the environment through other human activities and sources, such as domestic water pipe erosion and runoff carrying brake pad wear debris. The results of the SnoPUD case study show copper and zinc biocide risk to aquatic biota is well below levels of potential concern; MHK devices contributed less than one part in one thousand to the overall risk profile from all sources of biocides in the Puget Sound environment. Copper and zinc contributions to sediment and water from MHK devices were predicted to range from one part per billion to ten parts per trillion. Contributions of the booster biocides were similarly below levels of concern when compared to benchmarks derived from scientific literature. A similar conclusion was reached for the OPT project at Reedsport, where MHK devices were expected to contribute less than one part per million to existing background concentrations for copper and zinc, the only two biocides expected to be used at this location. These results suggest minimal risk to aquatic biota from antifouling coatings used on MHK devices deployed in large estuaries or open ocean environments.
The full analysis for toxicity of anti-biofouling coatings can be found in the PNNL report Assessment of Toxicity to Aquatic Resources from Antifouling Coatings Used on Marine and Hydrokinetic Devices (PNNL 21260 2012).
2.2.3 Risk of Encounter Between Tidal Turbine Blades and Marine Animals
Endangered Southern Resident Killer Whales (SRKW) return to the inland marine waters of Washington (US) and British Columbia (CAN) annually to forage for their preferred prey, Chinook salmon. SRKWs are a species of regulatory concern to the MHK industry, due both to their listing under the Endangered Species Act and the Marine Mammal Protection Act, as well as their iconic status. Understanding the probability of a collision between an SRKW and a tidal power turbine allows regulators and project developers to focus discussions on appropriate mitigation measures.
2.10
For this preliminary probability analysis, SRKW behavior was parsed into four categories: foraging, socializing, resting, and traveling. SRKWs are known to make dives deeper than 50 m while foraging, although variables that either increase or decrease the proportion of time spent foraging also change the frequency of deep dives. Scientific literature shows that vessel presence causes whales to significantly reduce the amount of time spent foraging to favor traveling behavior (Lusseau et al. 2009; Williams et al. 2006). Because Admiralty Inlet is the ingress/egress to Puget Sound, high volumes of vessel traffic are present, potentially resulting in SRKW evasive behavior. There is some suggestion that other environmental elements such as tidal variation, seasonality, pod identity, and age have significant effects on SRKW diving behavior and movement (Baird et al. 2005; Hauser 2006; Lusseau et al. 2009; McCluskey 2006), but these variables were not considered during this study.
Data from the literature were compiled to define the relationships between variables, calculate the frequency of deep dives a SRKW makes while foraging, and determine the proportion of time the SRKWs spend foraging while in Admiralty Inlet. This model defines quantitatively how the variables influence SRKW movement in the water column.
3.1
3.0 Results
Results for screening analysis of the two FY 2011 cases are presented in Section 3.1; results of probability analyses are described in Section 3.2.
3.1 Screening Analysis Results for Two Cases
Results of the consequence ranking process are presented below, showing relative ranks of S–R pairs for biophysical risk factors only and as modified by regulatory risk factors. Risk factors are presented within tiers that represent factors that are essentially tied. These tied factors must be further elucidated through examination of the probability of the occurrence of each S–R interaction, in order to reach an estimate of risk.
3.1.1 Biophysical Risk Factors for Consequence Analysis
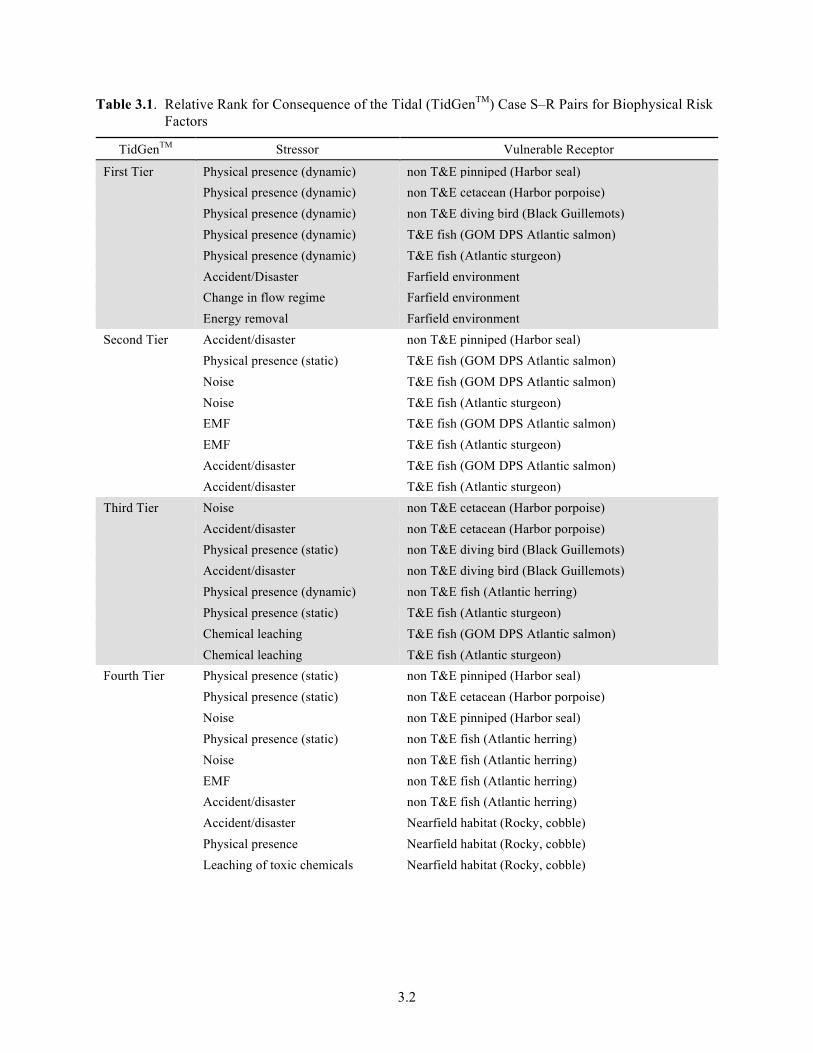
Tables 3.1 and 3.2 present relative biophysical rank for S–R pairs for Tidal (TidGenTM) and Wave (Oyster) cases, respectively. These relative ranks reflect environmental consequence only (and not probability of occurrence). In each table, the relative ranks, or tiers, show the top issues based on scores of biophysical risk factors.
Animal receptors with small populations tended to rank high for biophysical risk factors because injury or mortality to even a single individual could threaten the survival of the population. Although these receptors are listed under the Endangered Species Act of 1973 as threatened and endangered (T&E) species, it should be noted that the high consequence ranking of these animals results from the threat to their ability to successfully reproduce and maintain the population, not due to regulatory protection. Marine mammals also tended to rank high because they are curious and may approach MHK devices, thereby increasing their risk of injury or mortality.
The farfield environment ranked high in biophysical risk; this is largely an artifact of the risk assignment process and may not adequately reflect the actual consequences that may be expected due to the presence of MHK devices on nearfield and farfield habitats. This was particularly apparent in the case study of the Oyster technology on the Oregon coast; the substrate in that region is predominantly sand (as opposed to rock or gravel), and the effects of the nearshore wave device on sediment transport, circulation, and nearshore habitat are uncertain and pose a risk of potential negative consequence.
Among stressors, physical presence (dynamic) and accidents/disasters ranked high across the receptors.
3.2
Table 3.1. Relative Rank for Consequence of the Tidal (TidGenTM) Case S–R Pairs for Biophysical Risk Factors
TidGenTM Stressor Vulnerable Receptor
First Tier Physical presence (dynamic) non T&E pinniped (Harbor seal) Physical presence (dynamic) non T&E cetacean (Harbor porpoise) Physical presence (dynamic) non T&E diving bird (Black Guillemots) Physical presence (dynamic) T&E fish (GOM DPS Atlantic salmon) Physical presence (dynamic) T&E fish (Atlantic sturgeon) Accident/Disaster Farfield environment Change in flow regime Farfield environment Energy removal Farfield environment Second Tier Accident/disaster non T&E pinniped (Harbor seal) Physical presence (static) T&E fish (GOM DPS Atlantic salmon) Noise T&E fish (GOM DPS Atlantic salmon) Noise T&E fish (Atlantic sturgeon) EMF T&E fish (GOM DPS Atlantic salmon) EMF T&E fish (Atlantic sturgeon) Accident/disaster T&E fish (GOM DPS Atlantic salmon) Accident/disaster T&E fish (Atlantic sturgeon) Third Tier Noise non T&E cetacean (Harbor porpoise) Accident/disaster non T&E cetacean (Harbor porpoise) Physical presence (static) non T&E diving bird (Black Guillemots) Accident/disaster non T&E diving bird (Black Guillemots) Physical presence (dynamic) non T&E fish (Atlantic herring) Physical presence (static) T&E fish (Atlantic sturgeon) Chemical leaching T&E fish (GOM DPS Atlantic salmon) Chemical leaching T&E fish (Atlantic sturgeon) Fourth Tier Physical presence (static) non T&E pinniped (Harbor seal) Physical presence (static) non T&E cetacean (Harbor porpoise) Noise non T&E pinniped (Harbor seal) Physical presence (static) non T&E fish (Atlantic herring) Noise non T&E fish (Atlantic herring) EMF non T&E fish (Atlantic herring) Accident/disaster non T&E fish (Atlantic herring) Accident/disaster Nearfield habitat (Rocky, cobble) Physical presence Nearfield habitat (Rocky, cobble) Leaching of toxic chemicals Nearfield habitat (Rocky, cobble)
3.3
Table 3.1. (contd)
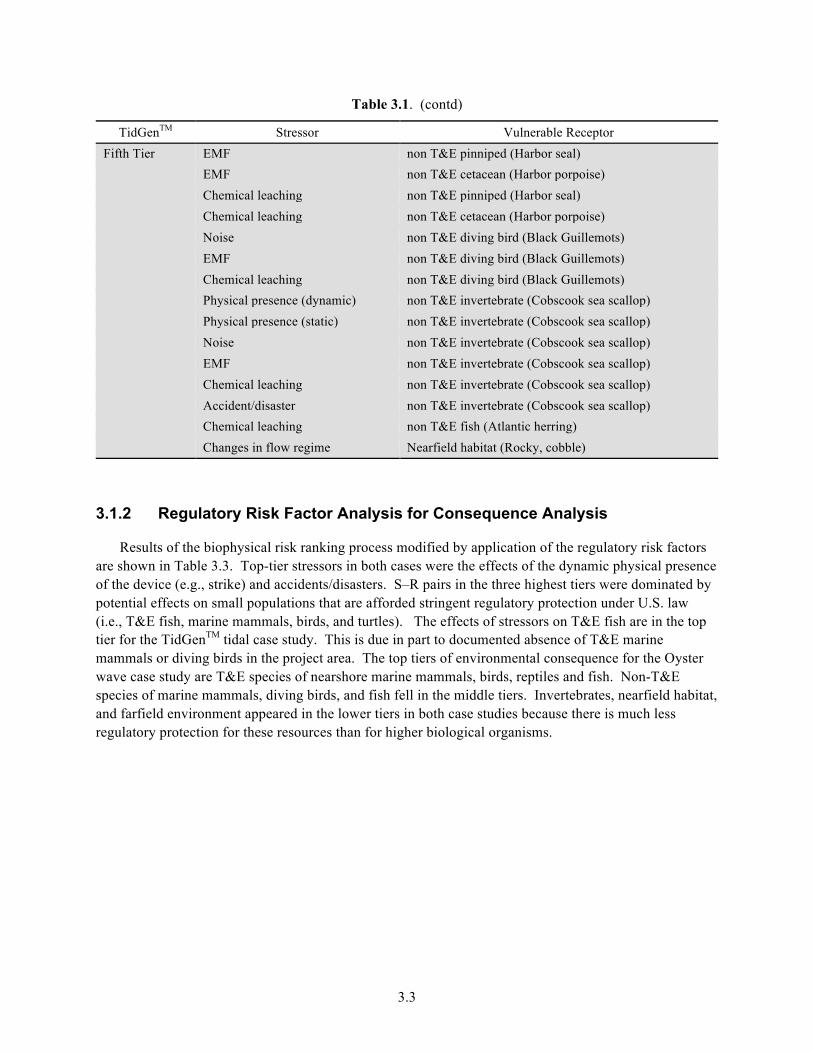
TidGenTM Stressor Vulnerable Receptor Fifth Tier EMF non T&E pinniped (Harbor seal) EMF non T&E cetacean (Harbor porpoise) Chemical leaching non T&E pinniped (Harbor seal) Chemical leaching non T&E cetacean (Harbor porpoise) Noise non T&E diving bird (Black Guillemots) EMF non T&E diving bird (Black Guillemots) Chemical leaching non T&E diving bird (Black Guillemots) Physical presence (dynamic) non T&E invertebrate (Cobscook sea scallop) Physical presence (static) non T&E invertebrate (Cobscook sea scallop) Noise non T&E invertebrate (Cobscook sea scallop) EMF non T&E invertebrate (Cobscook sea scallop) Chemical leaching non T&E invertebrate (Cobscook sea scallop) Accident/disaster non T&E invertebrate (Cobscook sea scallop) Chemical leaching non T&E fish (Atlantic herring) Changes in flow regime Nearfield habitat (Rocky, cobble)
3.1.2 Regulatory Risk Factor Analysis for Consequence Analysis
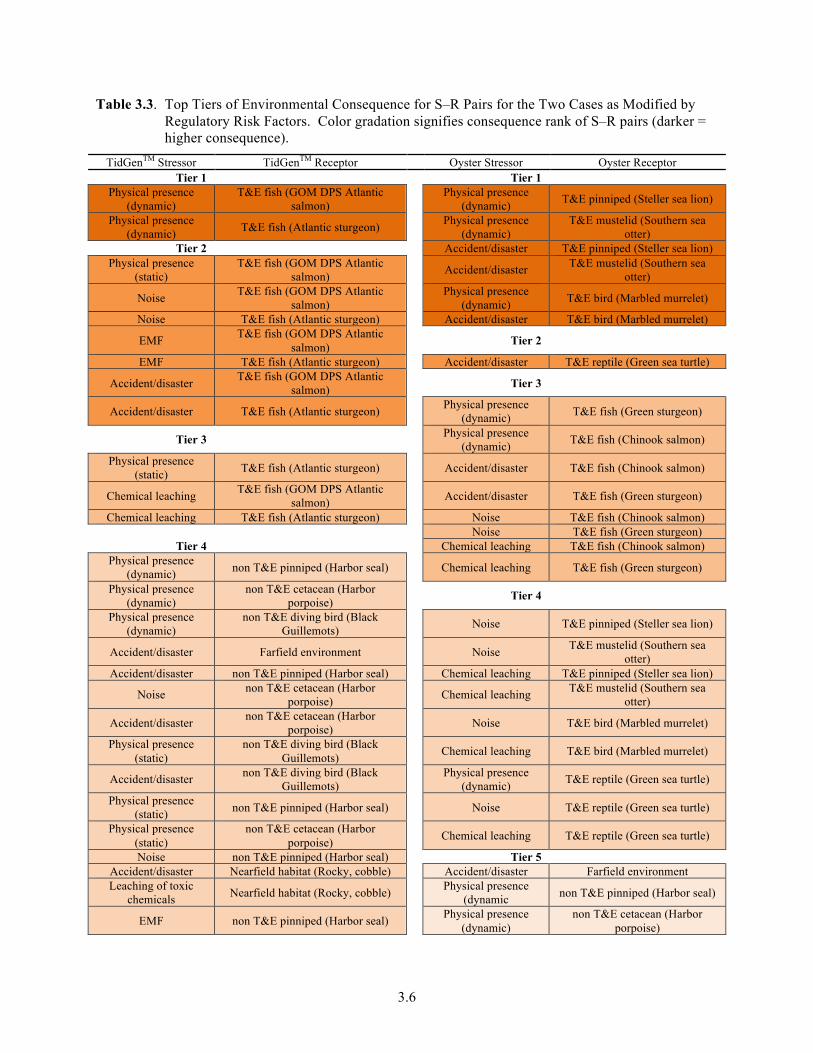
Results of the biophysical risk ranking process modified by application of the regulatory risk factors are shown in Table 3.3. Top-tier stressors in both cases were the effects of the dynamic physical presence of the device (e.g., strike) and accidents/disasters. S–R pairs in the three highest tiers were dominated by potential effects on small populations that are afforded stringent regulatory protection under U.S. law (i.e., T&E fish, marine mammals, birds, and turtles). The effects of stressors on T&E fish are in the top tier for the TidGenTM tidal case study. This is due in part to documented absence of T&E marine mammals or diving birds in the project area. The top tiers of environmental consequence for the Oyster wave case study are T&E species of nearshore marine mammals, birds, reptiles and fish. Non-T&E species of marine mammals, diving birds, and fish fell in the middle tiers. Invertebrates, nearfield habitat, and farfield environment appeared in the lower tiers in both case studies because there is much less regulatory protection for these resources than for higher biological organisms.
3.4
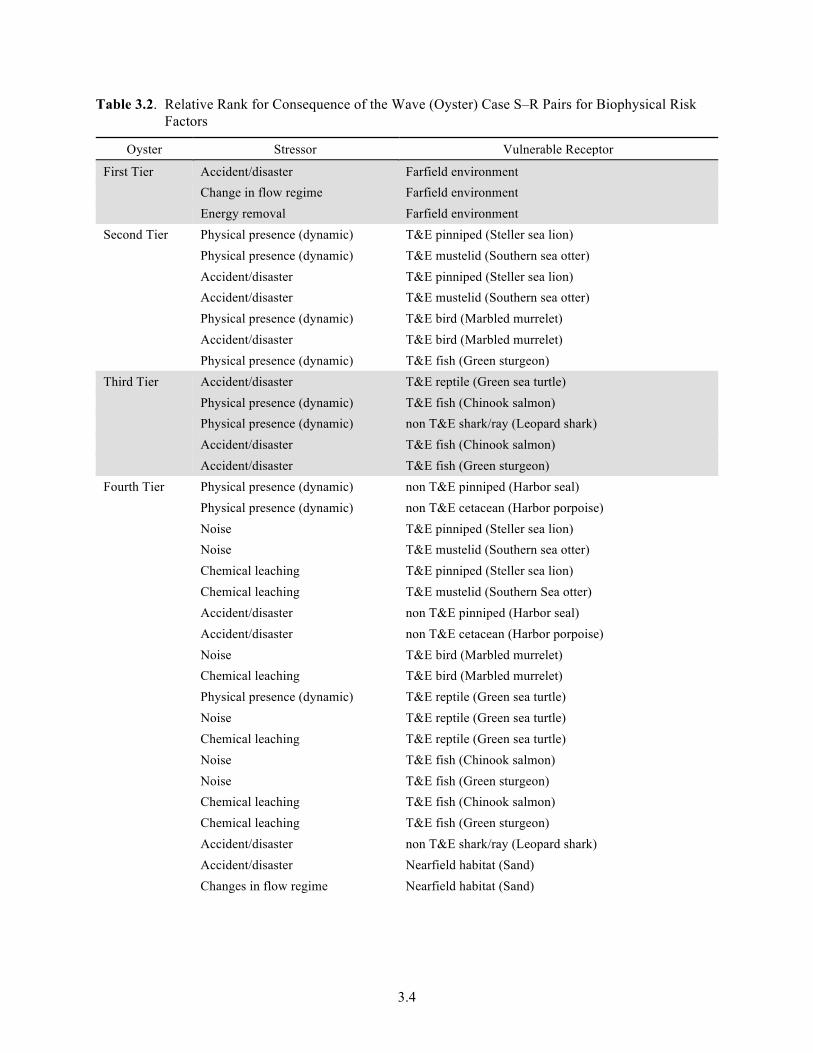
Table 3.2. Relative Rank for Consequence of the Wave (Oyster) Case S–R Pairs for Biophysical Risk Factors
Oyster Stressor Vulnerable Receptor
First Tier Accident/disaster Farfield environment Change in flow regime Farfield environment Energy removal Farfield environment Second Tier Physical presence (dynamic) T&E pinniped (Steller sea lion) Physical presence (dynamic) T&E mustelid (Southern sea otter) Accident/disaster T&E pinniped (Steller sea lion) Accident/disaster T&E mustelid (Southern sea otter) Physical presence (dynamic) T&E bird (Marbled murrelet) Accident/disaster T&E bird (Marbled murrelet) Physical presence (dynamic) T&E fish (Green sturgeon) Third Tier Accident/disaster T&E reptile (Green sea turtle) Physical presence (dynamic) T&E fish (Chinook salmon) Physical presence (dynamic) non T&E shark/ray (Leopard shark) Accident/disaster T&E fish (Chinook salmon) Accident/disaster T&E fish (Green sturgeon) Fourth Tier Physical presence (dynamic) non T&E pinniped (Harbor seal) Physical presence (dynamic) non T&E cetacean (Harbor porpoise) Noise T&E pinniped (Steller sea lion) Noise T&E mustelid (Southern sea otter) Chemical leaching T&E pinniped (Steller sea lion) Chemical leaching T&E mustelid (Southern Sea otter) Accident/disaster non T&E pinniped (Harbor seal) Accident/disaster non T&E cetacean (Harbor porpoise) Noise T&E bird (Marbled murrelet) Chemical leaching T&E bird (Marbled murrelet) Physical presence (dynamic) T&E reptile (Green sea turtle) Noise T&E reptile (Green sea turtle) Chemical leaching T&E reptile (Green sea turtle) Noise T&E fish (Chinook salmon) Noise T&E fish (Green sturgeon) Chemical leaching T&E fish (Chinook salmon) Chemical leaching T&E fish (Green sturgeon) Accident/disaster non T&E shark/ray (Leopard shark) Accident/disaster Nearfield habitat (Sand) Changes in flow regime Nearfield habitat (Sand)
3.5
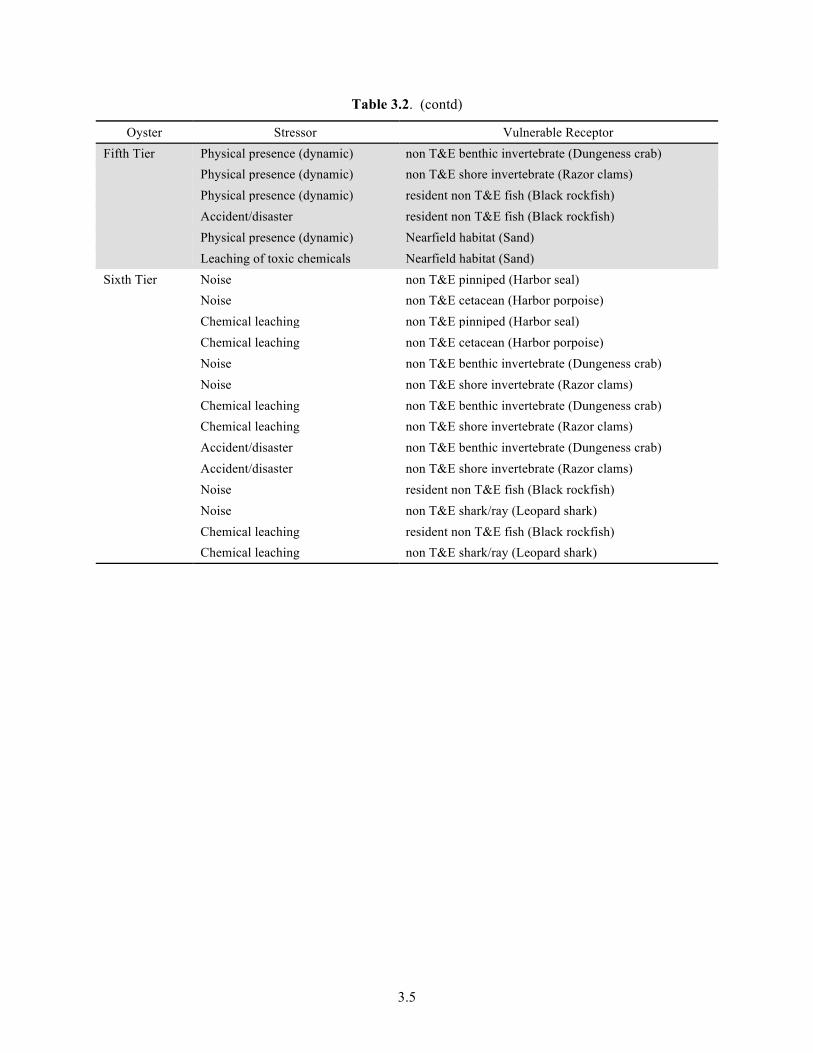
Table 3.2. (contd)
Oyster Stressor Vulnerable Receptor Fifth Tier Physical presence (dynamic) non T&E benthic invertebrate (Dungeness crab) Physical presence (dynamic) non T&E shore invertebrate (Razor clams) Physical presence (dynamic) resident non T&E fish (Black rockfish) Accident/disaster resident non T&E fish (Black rockfish) Physical presence (dynamic) Nearfield habitat (Sand) Leaching of toxic chemicals Nearfield habitat (Sand) Sixth Tier Noise non T&E pinniped (Harbor seal) Noise non T&E cetacean (Harbor porpoise) Chemical leaching non T&E pinniped (Harbor seal) Chemical leaching non T&E cetacean (Harbor porpoise) Noise non T&E benthic invertebrate (Dungeness crab) Noise non T&E shore invertebrate (Razor clams) Chemical leaching non T&E benthic invertebrate (Dungeness crab) Chemical leaching non T&E shore invertebrate (Razor clams) Accident/disaster non T&E benthic invertebrate (Dungeness crab) Accident/disaster non T&E shore invertebrate (Razor clams) Noise resident non T&E fish (Black rockfish) Noise non T&E shark/ray (Leopard shark) Chemical leaching resident non T&E fish (Black rockfish) Chemical leaching non T&E shark/ray (Leopard shark)
3.6
Table 3.3. Top Tiers of Environmental Consequence for S–R Pairs for the Two Cases as Modified by Regulatory Risk Factors. Color gradation signifies consequence rank of S–R pairs (darker = higher consequence).
TidGenTM Stressor TidGenTM Receptor Oyster Stressor Oyster Receptor Tier 1 Tier 1
Physical presence (dynamic)
T&E fish (GOM DPS Atlantic salmon) Physical presence
(dynamic) T&E pinniped (Steller sea lion)
Physical presence (dynamic) T&E fish (Atlantic sturgeon) Physical presence
(dynamic) T&E mustelid (Southern sea
otter) Tier 2 Accident/disaster T&E pinniped (Steller sea lion)
Physical presence (static)
T&E fish (GOM DPS Atlantic salmon) Accident/disaster T&E mustelid (Southern sea
otter)
Noise T&E fish (GOM DPS Atlantic salmon)
Physical presence (dynamic) T&E bird (Marbled murrelet)
Noise T&E fish (Atlantic sturgeon) Accident/disaster T&E bird (Marbled murrelet)
EMF T&E fish (GOM DPS Atlantic salmon) Tier 2
EMF T&E fish (Atlantic sturgeon) Accident/disaster T&E reptile (Green sea turtle)
Accident/disaster T&E fish (GOM DPS Atlantic salmon) Tier 3
Accident/disaster T&E fish (Atlantic sturgeon) Physical presence
(dynamic) T&E fish (Green sturgeon)
Tier 3 Physical presence
(dynamic) T&E fish (Chinook salmon)
Physical presence (static) T&E fish (Atlantic sturgeon) Accident/disaster T&E fish (Chinook salmon)
Chemical leaching T&E fish (GOM DPS Atlantic salmon) Accident/disaster T&E fish (Green sturgeon)
Chemical leaching T&E fish (Atlantic sturgeon) Noise T&E fish (Chinook salmon) Noise T&E fish (Green sturgeon)
Tier 4 Chemical leaching T&E fish (Chinook salmon) Physical presence
(dynamic) non T&E pinniped (Harbor seal) Chemical leaching T&E fish (Green sturgeon)
Physical presence (dynamic)
non T&E cetacean (Harbor porpoise) Tier 4
Physical presence (dynamic)
non T&E diving bird (Black Guillemots) Noise T&E pinniped (Steller sea lion)
Accident/disaster Farfield environment Noise T&E mustelid (Southern sea otter)
Accident/disaster non T&E pinniped (Harbor seal) Chemical leaching T&E pinniped (Steller sea lion)
Noise non T&E cetacean (Harbor porpoise) Chemical leaching T&E mustelid (Southern sea
otter)
Accident/disaster non T&E cetacean (Harbor porpoise) Noise T&E bird (Marbled murrelet)
Physical presence (static)
non T&E diving bird (Black Guillemots) Chemical leaching T&E bird (Marbled murrelet)
Accident/disaster non T&E diving bird (Black Guillemots)
Physical presence (dynamic) T&E reptile (Green sea turtle)
Physical presence (static) non T&E pinniped (Harbor seal) Noise T&E reptile (Green sea turtle)
Physical presence (static)
non T&E cetacean (Harbor porpoise) Chemical leaching T&E reptile (Green sea turtle)
Noise non T&E pinniped (Harbor seal) Tier 5 Accident/disaster Nearfield habitat (Rocky, cobble) Accident/disaster Farfield environment Leaching of toxic
chemicals Nearfield habitat (Rocky, cobble) Physical presence
(dynamic non T&E pinniped (Harbor seal)
EMF non T&E pinniped (Harbor seal) Physical presence
(dynamic) non T&E cetacean (Harbor
porpoise)
3.7
Table 3.3. (contd)
TidGenTM Stressor TidGenTM Receptor Oyster Stressor Oyster Receptor
EMF non T&E cetacean (Harbor porpoise) Accident/disaster non T&E pinniped (Harbor seal)
Chemical leaching non T&E pinniped (Harbor seal) Accident/disaster non T&E cetacean (Harbor porpoise)
Chemical leaching non T&E cetacean (Harbor porpoise)
Accident/disaster (oil spills) Nearfield habitat (Sand)
Noise non T&E diving bird (Black Guillemots)
Leaching of toxic chemicals Nearfield habitat (Sand)
EMF non T&E diving bird (Black Guillemots) Noise non T&E pinniped (Harbor seal)
Chemical leaching non T&E diving bird (Black Guillemots) Noise non T&E cetacean (Harbor
porpoise) Tier 5 Chemical leaching non T&E pinniped (Harbor seal)
Change in flow regime Farfield environment Chemical leaching non T&E cetacean (Harbor porpoise)
Energy removal Farfield environment Physical presence
(dynamic) non T&E fish (Atlantic herring) Tier 6
Physical presence
(static) non T&E fish (Atlantic herring) Change in flow regime Farfield environment
Noise non T&E fish (Atlantic herring) Energy removal Farfield environment
EMF non T&E fish (Atlantic herring) Physical presence
(dynamic) resident shark/ray (Leopard
shark)
Accident/disaster non T&E fish (Atlantic herring) Accident/disaster resident shark/ray (Leopard shark)
Physical presence Nearfield habitat (Rocky, cobble) Changes in flow
regime Nearfield habitat (Sand)
Physical presence (dynamic)
non T&E invertebrate (Cobscook sea scallop)
Physical presence (dynamic)
non T&E invertebrate (Dungeness crab)
Physical presence (static)
non T&E invertebrate (Cobscook sea scallop)
Physical presence (dynamic)
non T&E shore invertebrate (Razor clams)
Noise non T&E invertebrate (Cobscook sea scallop)
Physical presence (dynamic)
resident non T&E fish (Black rockfish)
EMF non T&E invertebrate (Cobscook sea scallop) Accident/disaster resident non T&E fish (Black
rockfish)
Chemical leaching non T&E invertebrate (Cobscook sea scallop) Physical presence Nearfield habitat (Sand)
Accident/disaster non T&E invertebrate (Cobscook sea scallop) Noise non T&E invertebrate
(Dungeness crab)
Chemical leaching non T&E fish (Atlantic herring) Noise non T&E shore invertebrate (Razor clams)
Changes in flow regime Nearfield habitat (Rocky, cobble) Chemical leaching non T&E invertebrate
(Dungeness crab)
Chemical leaching non T&E shore invertebrate (Razor clams)
Accident/disaster non T&E invertebrate (Dungeness crab)
Accident/disaster non T&E shore invertebrate (Razor clams)
Noise resident non T&E fish (Black rockfish)
Noise resident shark/ray (Leopard shark)
Chemical leaching resident non T&E fish (Black rockfish)
Chemical leaching resident shark/ray (Leopard shark)
3.8
3.2 Probability Analysis Results
Probabilistic analysis results for spill risk from surface vessel collisions and for anti-biofouling paints are presented below.
3.2.1 Spill Risk from Surface Vessel Collision
The AIS data collected by SST indicate that approximately 113 vessels per year transit the area within a 200-m radius of the SnoPUD project site. Using this information, SST focused its risk analysis on the probability of tug and tow vessel encounters near the turbine site under specific circumstances or activities that could lead to an adverse outcome (e.g., tow cables or chains striking a tidal turbine). The “activity of interest” with respect to the SnoPUD turbine site was related to the presence of southbound tugs returning from Alaska east of the northbound shipping lanes, which places them near the tidal turbine site. Contributing factors to risk such as additional vessel traffic, the potential for head-to-head encounters with vessels traveling in the opposite direction, and weather and tide variation were also factored into the analysis. As noted in SST (2011), barges operating in the vicinity of the SnoPUD turbine site are, in some instances, carrying hazardous chemicals, and tidal stage and other vessel traffic in the area can significantly slow southbound progress, decreasing maneuverability and increasing the potential risk of collision or entanglement with turbines. Risk-related factors addressed in the SST assessment include
• situations where a southbound tug and tow encounters a northbound tug and tow in the vicinity of the turbine site, with an additional risk factor associated with the presence of a car ferry operating across Admiralty Inlet between Coupeville and Port Townsend
• the presence of northbound vessel traffic in the TSS lanes, resulting in restricted maneuvering room for tug and tow vessels
• the presence of strong tidal currents affecting vessel maneuverability
• reduced visibility due to inclement weather or darkness.
Consultation with the American Waterways Organization and Western Tug and Barge indicated that the most critical element of these risk factors was the potential for a head-to-head meeting between two vessels restricted in their ability to maneuver. The subsequent risk analyses assessed a variety of situational categories related to vessel traffic near the tidal turbine site, potential safety issues that could contribute to an adverse outcome, the potential severity of the outcome, and a review of hazards associated with tug and tow operations. This process led to a “what if” analysis that included the following components:
1. definition of the functions or events included in the analysis, and bounding assumptions
2. delineation of known or potential hazards that may contribute to accidents
3. examination of the potential consequences of accidents occurring
4. identification of appropriate safeguards that already exist to reduce hazard
5. development of specific recommendations to reduce hazards.
3.9
Based on the risk analyses, the frequency of head-to-head meetings between two towing vessels near the SnoPUD tidal turbine site is expected to be less than one occurrence per month. As stated in the SST report,
Given the presence in Puget Sound of USCG’s VTS, a unit with an exceptional record of safety, it is difficult to envision a scenario in which advance coordination between VTS and towing vessels moving through the test site could not easily accomplish a safe passage with sea room to spare.
The probability of an adverse outcome is further reduced, given the expected sag in the cable under slow-speed conditions of approximately 23 m compared to the designed overhead clearance between the top of the SnoPUD tidal turbine and the water surface under lowest astronomical tide conditions of 43 m. This provides a reasonable margin of safety even if the tug and barge trajectory resulted in a course directly over a tidal turbine. SST (2011) stated a further margin of safety could be achieved through the identification of a Regulated Navigation Area by the USCG that would ensure tug and tow arrays were safely routed away from the tidal turbine site.
3.2.2 Risk of Encounter Between Tidal Turbine Blades and Marine Animals
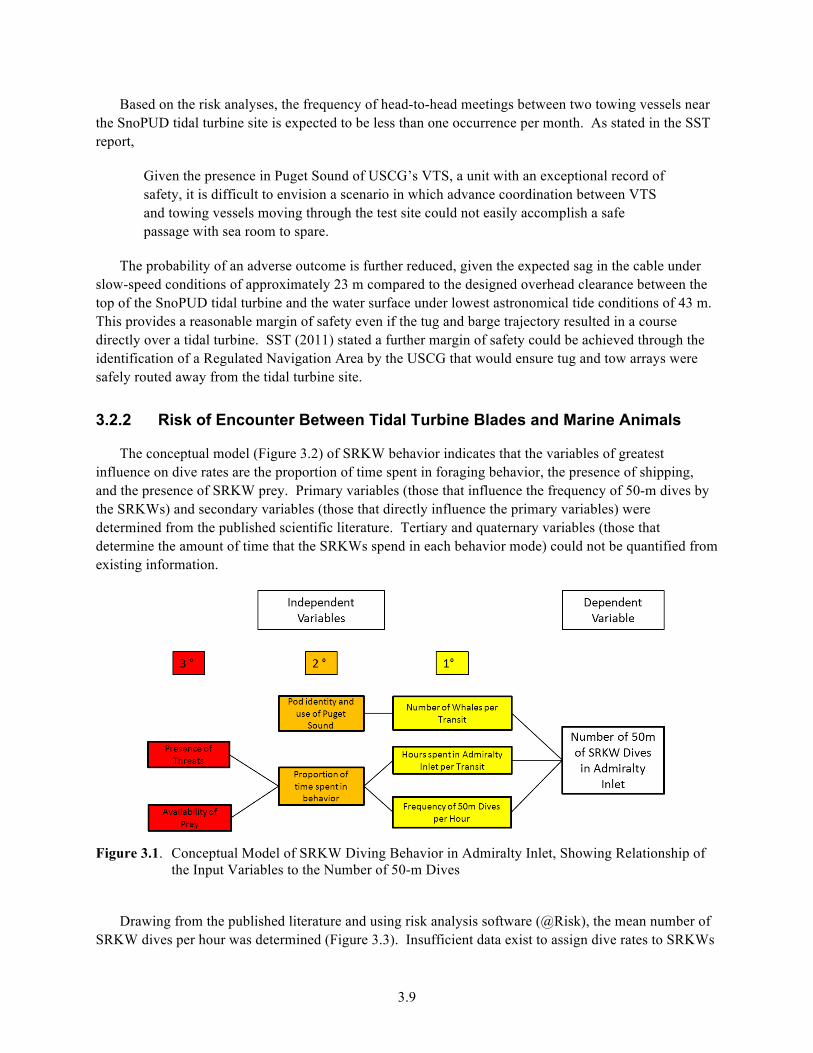
The conceptual model (Figure 3.2) of SRKW behavior indicates that the variables of greatest influence on dive rates are the proportion of time spent in foraging behavior, the presence of shipping, and the presence of SRKW prey. Primary variables (those that influence the frequency of 50-m dives by the SRKWs) and secondary variables (those that directly influence the primary variables) were determined from the published scientific literature. Tertiary and quaternary variables (those that determine the amount of time that the SRKWs spend in each behavior mode) could not be quantified from existing information.
Figure 3.1. Conceptual Model of SRKW Diving Behavior in Admiralty Inlet, Showing Relationship of
the Input Variables to the Number of 50-m Dives
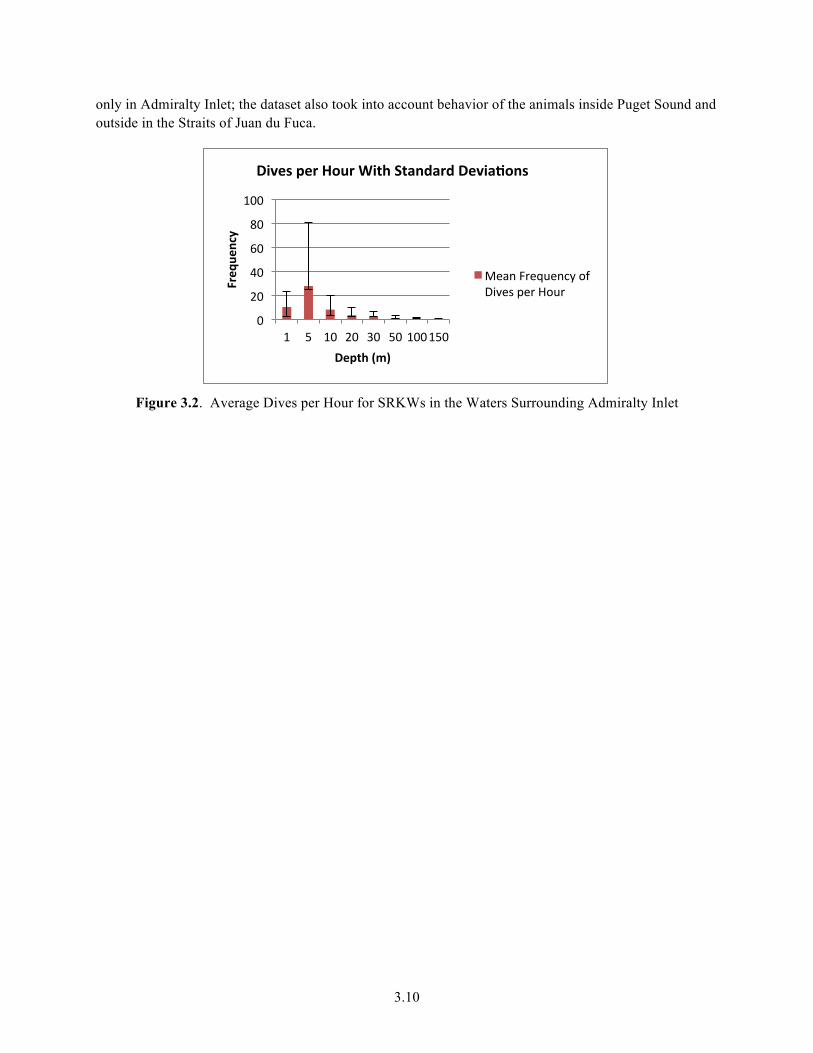
Drawing from the published literature and using risk analysis software (@Risk), the mean number of
SRKW dives per hour was determined (Figure 3.3). Insufficient data exist to assign dive rates to SRKWs
3.10
only in Admiralty Inlet; the dataset also took into account behavior of the animals inside Puget Sound and outside in the Straits of Juan du Fuca.
Figure 3.2. Average Dives per Hour for SRKWs in the Waters Surrounding Admiralty Inlet
0
20
40
60
80
100
1 5 10 20 30 50 100 150
Freq
uency
Depth (m)
Dives per Hour With Standard Devia:ons
Mean Frequency of Dives per Hour
4.1
4.0 Discussion
Responsible deployment of MHK devices requires compliance with all applicable laws and regulations; at the same time, the regulatory burden should not overwhelm the beneficial value of providing carbon-free renewable energy to meet the needs of the nation. By determining the highest-priority risks for stressors from MHK devices and associated installations with vulnerable receptors in the marine and freshwater environment, project proponents, regulators, and stakeholders can engage in the most efficient and effective siting and permitting pathways.
4.1 Consequence Analysis for FY 2011 Case Studies
S-R interactions for the proposed MHK projects that ended up ranked in the top tiers of this analysis did so for one of two reasons: either the interaction is a true impact to the receptor in question, or so little is known about the interaction that the resulting uncertainty—assuming a precautionary approach—raises the apparent risk level. Tables 3.1 and 3.2 rank the S–R pairs for each case study based on biophysical factors; Table 3.3 ranks the most important S–R interactions for both case studies, reflecting consequences of highest priority for a project developer from both the biophysical and U.S. regulatory environments.
For the tidal case study, the biophysical risk analysis (Table 3.1) shows that interactions with the dynamic physical presence (i.e., blade strike) with marine mammals, diving birds, and threatened or endangered fish are relatively the highest concern for the project, along with effects of the tidal turbine to the farfield environment (including effects stemming from an accident or disaster, change in flow regime, or energy removal from the system). All of these potential consequences have a high degree of uncertainty and are issues requiring additional scientific study. After regulatory risk factors were applied (Table 3.3), the highest ranked (Tier 1) issues narrow to include the impact dynamic physical presence of the device with threatened or endangered fish, followed by (Tier 2) other environmental stressors on threatened or endangered fish. This second layering underscores that at this point in time, the project developer, OPRC must address the potential interactions of the TidGenTM device on threatened or endangered fish species in the deployment area in order to satisfy the legal mandates imposed on environmental regulators in the permitting process. The permitting pathway that ORPC is following in the Gulf of Maine (Cobscook Bay) is underscored by the finding of this consequence analysis.
For the wave case study, the biophysical risk analysis (Table 3.2) shows the potential consequences to the physical environment (changes in flow regime, energy removal, and the impact of an accident or disaster) as the highest relative risk, followed by the potential consequence of the dynamic physical presence of the device or an accident/disaster on T&E species of nearshore marine mammals, birds, reptiles, and fish. Effects on the physical environment rank particularly high in this wave case study because of the uncertainties about the siting of this nearshore project on a predominantly soft bottom substrate. Threatened and endangered receptors also rank high on the biophysical risk analysis because of the impact that a potential consequence may have on species with small population sizes. These S–R pairs in these top relative biophysical tiers are all issues needing additional scientific study. Combining biophysical and regulatory risk factors (Table 3.3), the highest relative ranks (Tiers 1 and 2) include the potential consequence of the dynamic physical presence or an accident/disaster on T&E species of nearshore marine mammals, birds, reptiles, and fish. This second analysis shows that Aquamarine needs to first address the potential impacts of the wave device on all T&E species in the deployment region in
4.2
order to advance the deployment of a device in Oregon waters. The MHK projects represented by each case require that the probability of occurrence of the potential risk be evaluated, including the real potential for T&E species to occur in the vicinity of the devices. The need to evaluate the presence of animals of concern is perhaps most acute in the Oyster case. Results from European deployments of the Oyster show no signs of animals being directly affected by the devices; potential deployment in the United States may hinge on rapidly identifying the presence of T&E animals at risk. While the nature of this analysis does not assign high rank to changes in sediment transport and soft bottom habitat from the action of the Oyster, it is likely that if T&E species are not found to frequent the depths and location of the project, movement of sediment due to device operation will emerge as the most likely concern for regulators and stakeholders.
As additional information about S–R interactions becomes available through research studies and monitoring of MHK projects, S–R interactions that are in the top tiers based on uncertainty may drop farther down the ranked list. Alternatively, consequences to marine organisms and the physical environment may be lowered by changes in engineering or operational design or alternative siting; these S–R interactions will also drop down the ranked list. Eventually the remaining top-tier interactions will form the basis for post-installation monitoring and mitigation.
The U.S. regulatory system and the environmental protections afforded to key species is a genuine hurdle for any project developer in U.S. waters. The regulatory power of the Endangered Species Act of 1973 “no take” provision, especially if combined with the Marine Mammal Protection Act of 1972 As Amended or the Migratory Bird Treaty Act of 1918, ensures that all threatened and endangered turtles, marine mammals, and migratory birds will rank as the greatest risk from a regulatory perspective, regardless of whether they are the most vulnerable biological receptors to each specific stressor. The FY 2011 tidal case study (TidGenTM) shows that animals not listed under the Endangered Species Act of 1973 or those Endangered Species Act of 1973-listed species where limited take is allowed (i.e., GOM DPS Atlantic salmon and Atlantic sturgeon) become top-tier concerns after scientific research shows that other highly protected species are not present in the deployment area or at significant risk.
The two FY 2011 case studies are early-stage MHK developments, considered as pilots or demonstration projects under FERC’s regulatory framework. The small number of devices proposed for deployment may present certain risks to receptors from specific device–receptor interactions. As larger arrays of MHK devices are deployed, these direct-proximity risks may increase in some fashion, and cumulative impacts of devices operating over long time-frames may create effects not visible at the pilot level. This consequence analysis is the first step in the ERES risk assessment process. Analysis of the probability of top-tier S–R interactions will take place in the next phase.
4.2 Probability Analyses Undertaken in FY 2011
During FY 2010, two areas of encounter between MHK stressors and marine stressors were identified as likely candidates for probability analysis, based on stressor information directly applicable from other industrial interactions in the marine environment: 1) the likelihood of a collision between a surface vessel and a bottom-mounted tidal turbine; and 2) the likelihood of harm caused to the receptors of concern from MHK devices due to leaching of chemicals applied to the devices to retard biofouling.
4.3
The probability analysis for collision between a tidal device and a surface vessel was undertaken by SST at the request of SnoPUD. PNNL staff examined this interaction in the context of the probability aspect of risk from a tidal device (Section 4.2.1). PNNL staff carried out a probability modeling analysis for the toxicity from anti-biofouling paints on key marine receptors; based on bounding case analyses for single-unit deployments, significant harm to biota is highly unlikely at any distance from the source through water-column exposures. The potential for sediment accumulation and its associated exposure pathway has not yet been evaluated.
Although appropriate analogues were not found to exist for other industries, PNNL determined that the encounter of tidal turbine blades with endangered marine mammals was of sufficient importance to getting tidal projects (SnoPUD in particular) in the water to warrant undertaking the initial steps in an expert-driven probability analysis. Discussion of the results is in Section 4.2.3; the full report is in Appendix C.
4.2.1 Probability Analysis for Spills from Surface Vessel Collision
Although the SST analysis could not provide a probability outcome of high fidelity, the results of the USCG-approved analysis strongly indicates that vessel encounters with tidal turbine arrays at depths similar to those of the SnoPUD project are unlikely for vessels operating within the Puget Sound USCG VTS. The SST report did conclude, however, that interactions of recreational vessels trolling fishing gear with tidal turbines was more possible and would be less likely to be detected by the VTS. SST concludes that marine radio broadcasts by the VTS at regular intervals would significantly contribute to public safety.
PNNL staff has evaluated the SST report and determined that the analysis is sound and indicates the potential for harm from such an encounter to be unquantified but extremely small. Although the SST analysis is explicit to shipping through Admiralty Inlet in Puget Sound, similar analyses in areas of moderate to heavy shipping are likely to yield similar results. This assumption is based in large part on the depths at which tidal devices are located (with a significant overhead clearance to allow for shipping and boating), the specific and unusual circumstances under which portions of a surface vessel (e.g., a tow vessel catenary) are likely to encounter a tidal device, and the unlikely occurrence of a cable hooking a tidal device; the latter likelihood was not addressed in the SST report.
Other MHK projects such as wave farms will require a similar analysis for encounter with surface vessels to similarly determine the likelihood of such encounters occurring, leading to an adverse outcome. Surface-mounted wave energy converters increase the probability of an adverse outcome with a surface vessel encounter as compared to a subsurface tidal device. However, USCG vessel traffic measures, exclusion zones, Notes to Mariners, and other preventive measures will greatly reduce the potential adverse outcomes in the same manner that navigation buoys and ocean observation buoys are seldom the cause of surface vessel impacts and spills.
4.2.2 Risk of Toxicity from Anti-Biofouling Paints
Through the application of two risk modeling approaches to examining toxicity of AF paints to marine and riverine organisms from MHK devices, a picture begins to emerge that, while there are insufficient data to predict effects on the animals of greatest concern in the case study systems, the levels
4.4
of toxicity from AF paints are very low close to the devices and are further diluted at a distance from the installations. Based on chemical leaching alone, there appears to be little cause for concern from exposure to AF paints on higher-level organisms such as marine mammals, birds, and fish. Lower-level organisms, particularly early developmental phases, are at higher risk; however, the high-energy environments in which MHK devices are placed preclude the persistence of embryos and planktonic developmental forms in the zone of maximum toxicity for extended periods, thereby reducing their exposure.
The choice of AF paint for MHK devices and foundations should take into account the specific biocide in use, as well as the aquatic receptors of concern in the immediate environment. Should organic biocides be used in the vicinity of aquatic invertebrates that are afforded special protection, or in situations where higher-level organisms of concern can accumulate toxins from a benthic food source in proximity to MHK devices, additional studies may be needed to determine the exposure and effects of the biocide.
4.2.3 Risk of Encounter Between Tidal Turbine Blades and Marine Animals
SRKW feed almost exclusively on one species of fish, and have been shown to favor certain areas for foraging, which is the behavior identified to have the most risk of tidal turbine interactions. The results of this study show that insufficient data exist in the scientific literature to parameterize a quantitative behavioral model for SRKW in Admiralty Inlet. Although the data available can support a conceptual model of diving behavior, they lack the information needed to clearly define the relationships between these variables and the event of a 50-m dive. Drawing from the available data, it is clear that the time spent by SRKWs in the deep waters are limited to between 2 and 3% of their time in Admiralty Inlet, posing a very limited risk of encounter with the two tidal turbines placed on the bottom of the inlet.
The analysis undertaken by PNNL to determine the behavior of SRKWs in Admiralty Inlet is very specific to one highly endangered species, in one location, with a single MHK technology; whether the analytical results will be useful for other scenarios is unknown. The probability analysis undertaken for the SRKWs in Puget Sound through expert input is far from complete. This analysis was undertaken to shed light on a potential S–R encounter that is of extremely high regulatory and stakeholder concern for the SnoPUD project; in addition, we hope that this analysis may prove useful for evaluating other S–R encounters of concern for which sufficient data do not exist.
5.1
5.0 Next Steps in ERES Risk Assessment
The consequence analysis for the two cases undertaken in FY 2011 was developed through review of the scientific literature and reports and with input from a number of subject matter experts. However, we intend to further gauge the validity of the ERES approach for the two cases through a peer review process that will take place early in FY 2012.
The results of risk analysis for encounter of SRKW in Puget Sound with tidal turbine blades, as represented by the proposed OpenHydro devices planned for deployment by SnoPUD in Admiralty Inlet, will be pursued in FY 2012. Peer review will be sought on the results of the conceptual model and associated data for SRKW behavior. The results of the reviewed analysis will be taken to a group of experts, convened with assistance from NOAA Fisheries, to carry out an expert elicitation. The purpose of the elicitation is to bring expert opinion together in a consensus-driven highly structured process, with the desired outcome being a probabilistic model of SRKW encounter with tidal turbine blades.
6.0 References
Arenas P and M Hall. 1992. “The association of sea turtles and other pelagic fauna with floating objects in the eastern tropical Pacific Ocean.” In Proceedings of the Eleventh Annual Workshop on Sea Turtle Biology and Conservation, M Salmon and J Wyneken (compilers), pp. 7–10. NOAA Technical Memorandum NMFS-SEFSC-302, National Marine Fisheries Service, Southeast Fisheries Center, Miami Laboratory, Miami, Florida.
Anderson, R.M., S.D. Unwin, and F.B. Van Cleve. 2010. Identification and prioritization of analysis cases for marine and hydrokinetic energy risk screening. PNNL-19535, Pacific Northwest National Laboratory, Richland, Washington.
Babson, A. L., M. Kawase and P. MacCready (2006). Seasonal and Interannual Variability in the Circulation of Puget Sound, Washington: A Box Model Study. Atmosphere-Ocean, 44(1): 29-45.
Baird RW, MB Hanson, and LM Dill. 2005. “Factors influencing the diving behaviour of fish-eating killer whales: sex differences and diel and interannual variation in diving rates.” Canadian Journal of Zoology 83:257–267.
Bard, J., A. Pedersen, and E. Tiberg. 1994. Scientific documentation and research; KEMI National Chemicals Inspectorate, Solna, Sweden.
Bedford, T. and R. Cooke. 2001. Probabilistic risk analysis: Foundations and methods. Cambridge University Press.
Blyth RE, MJ Kaiser, G Edwards-Jones, and PJB Hart. 2004. “Implications of a zoned fishery management system for marine benthic communities.” Journal of Applied Ecology 41:951–961.
Boehlert GW, GR McMurray, and CE Tortorici (eds). 2008. Ecological Effects of Wave Energy Development in the Pacific Northwest. NOAA Technical Memorandum NMFS-F/SPO-92, Northwest Fisheries Science Center, National Marine Fisheries Service, National Oceanic and Aeronautic Administration, Seattle, Washington.
Bryden IG, T Grinstead, and GT Melville. 2004. “Assessing the potential of a simple tidal channel to deliver useful energy.” Applied Ocean Research 26:198–204.
Cameron L, R Doherty, A Henry, K Doherty, J Van’t Hoff, D Kaye, D Naylor, S Bourdier, and T Whittaker. 2010. “Design of the Next Generation of the Oyster Wave Energy Converter.” 3rd International Conference on Ocean Energy, Aquamarine Power Ltd., Edinburgh, United Kingdom. Available from http://www.aquamarinepower.com/resource-library/ (September 2, 2011).
Carstensen J, OD Henrikson, and J Teimann. 2006. “Impacts of offshore wind farm construction on harbor porpoises: acoustic monitoring of echolocation activity using propose detectors (T-PODs).” Marine Ecology Progress Series 321:295–308.
Chapra, S.C. 1997. Surface water-quality modeling. McGraw-Hill.
Clean Water Act of 1977. 1977. Public Law 95-217, as amended, 33 USC 1251 et seq.
Copping, A.E., F.B. Van Cleve, and R.M. Anderson. 2011. Screening analysis for the Environmental Risk Evaluation System Task 2.1.1: Evaluating effects of stressors. PNNL-20196. Pacific Northwest National Laboratory, Richland, Washington.
Devine Tarbell and Associates, Inc. 2006. Instream Tidal Power in North America: Environmental and Permitting Issues. EPRI-TP-007-NA, Electric Power Research Institute, Palo Alto, California.
DOE – U.S. Department of Energy. 2009. Report to Congress on the Potential Environmental Effects of Marine and Hydrokinetic Energy Technologies: Prepared in Response to the Energy Independence and Security Act of 2007, Section 633(B). Wind and Hydropower Technologies Program, Office of Energy Efficiency and Renewable Energy, Washington, D.C.
Ebbesmeyer, C.C., G.A. Cannon, B.J. Nairn, M. Kawase and W.P. Fox, 2002. Puget Sound physical oceanography related to the Triple Junction region. Final Report for King County Department of Natural Resources and Parks, November 2002. 167 pp, appendices A-L, CD appendices A-E. Report available at: http://your.kingcounty.gov/dnrp/library/2002/kcr2052/Report.pdf
Endangered Species Act of 1973. 1973. Public Law 93-205, as amended, 16 USC 1531 et seq.
EPA—U.S. Environmental Protection Agency. 1998. Guidelines for ecological risk assessment. EPA/630/R-95/002F, Washington D.C.
EPA – U.S. Environmental Protection Agency. 2011. Integrated Risk Information System (IRIS). Washington, D.C. Available from http://www.epa.gov/iris/index.html (January 25, 2011).
Finnie, A.A. 2006. “Improved estimates of environmental copper release rates from antifouling products.” Biofouling 22: 279-291.
Fraenkel PL. 2006. “Tidal current energy technologies.” Ibis 148:145–151.
Garrett C and P Cummins. 2008. “Limits to tidal current power.” Renewable Energy 33:2485–2490.
Gill AB. 2005. “Offshore renewable energy: ecological implications of generating electricity in the coastal zone.” Journal of Applied Ecology 42(4):605–615.
Gill, A.B.; Gloyne-Phillips, I.; Neal, K.J.; Kimber. J.A. 2005. The potential effects of electromagnetic fields generated by sub-sea power cables associated with offshore wind farm developments on electrically and magnetically sensitive marine organisms-a review. COWRIE.
Gulf of Maine Aquarium. 2001. Coastal Fishery Research Priorities: Sea Scallops(Plactopecten magellanicus). Maine Department of Marine Resources, Maine. Available from http://www.maine.gov/dmr/research/sea_scallops.htm (September 2, 2011).
Grecian WJ, R Inger, MJ Attrill, S Bearhop, B Goodley, MJ Witt, and SC Votier. 2010. “Potential impacts of wave-powered marine renewable energy installations on marine birds.” Ibis 152:683–697.
Hauser DDW. 2006. “Summer space use of Southern Resident killer whales (Orcinus orca) within Washington and British Columbia.” Master of Science, School of Aquatic and Fishery Science, University of Washington, Seattle.
Karsten R, M McMillan, M Lickley, and R Haynes. 2008. “Assessment of tidal current energy in the Minas Passage, Bay of Fundy.” Proceedings of the Institution of Mechanical Engineers, Part: Journal of Power and Energy 22(5):493–507. Kirschvink, J.L., Walker, M.M., Diebel, C.E. 2001. Magnetite-based magnetoreception. Current Opinion in Neurobiology 11: 462-467.
Konstantinou, I. K. and T. A. Albanis. 2004. “Worldwide occurrence and effects of antifouling paint booster biocides in the aquatic environment: a review.” Environment International 30(2): 235-248.
Lambert, S.J., K.V. Thomas, and A.J. Davy. 2006. “Assessment of the risk posed by antifouling booster biocides Irgarol 1051 and diuron to freshwater macrophytes.” Chemosphere 63: 734-743.
Langton R, IM Davies, and BE Scott. 2011. “Seabird conservation and tidal stream and wave power generation: Information needs for predicting and managing potential impacts.” Marine Policy 35(2011):623–630. Lavelle, J.W., E.D. Cokelet, and G.A. Cannon. 1991. “A model study of density intrusions into and circulation within a deep, silled estuary: Puget Sound.” Journal of Geophysical Research. 96(C9): 16779-16800.
Lewis Wave Power Limited. 2011. Lewis Wave Power Environmental Scoping Report, 40MW Oyster Wave Array, West Coast Lewis, UK. Report Reference Number: LWP-SD.PR.EU.UK.LEW.06-REP-001. Available from http://www.aquamarinepower.com/resource-library/ (September 2, 2011).
Ligon FK, WE Dietrich, and WJ Trush. 1995. “Downstream ecological effects of dams.” Bioscience 45:183–192.
Lusseau D, DE Bain, R Williams, and JC Smith. 2009. “Vessel traffic disrupts the foraging behavior of southern resident killer whales Orcinus orca.” Endangered Species Research 6:221–221.
Magnuson-Stevens Fishery Conservation and Management Act. 16 U.S.C. 1801-1882, April 13, 1976, as amended 1978-1980, 1982-1984, 1986-1990, 1992-1994, and 1996.
Mangi Environmental Group. 2010. Updated Summary of Knowledge: Selected Areas of the Pacific Coast. BOEMRE 2010-014, Bureau of Ocean Energy, Regulation and Enforcement, U.S. Department of the Interior, Herndon, Virginia.
Marine Mammal Protection Act of 1972 as Amended. 2007. 16 USC 1361 et seq.
McCluskey SM. 2006. “Space Use Patterns and Population Trends of Southern Resident Killer Whales (Orcinus orca) in Relation to Distribution and Abundance of Pacific Salmon (Oncorhynchus spp.) in the Inland Marine Waters of Washington State and British Columbia.” School of Aquatic and Fishery Science, Masters of Science, University of Washington, Seattle.
Michel J, H Dunagan, C Boring, E Healy, W Evans, JM Dean, A McGillis, and J Hain. 2007. Worldwide Synthesis and Analysis of Existing Information Regarding Environmental Effects of Alternative Energy
Uses on the Outer Continental Shelf. MMS OCS Report 2007-038, Minerals Management Service, U.S. Department of the Interior, Herndon, Virginia.
Migratory Bird Treaty Act of 1918. 1918. 40 Stat. 755, as amended, 16 USC 710.
MMS – Minerals Management Service. 2007. Programmatic Environmental Impact Statement for Alternative Energy Development and Production and Alternate Use of Facilities on the Outer Continental Shelf. OCS EIS/EA MMS 2007-046, U.S. Department of the Interior, Herndon, Virginia.
Mochida, K., and K. Fujii. 2009. Toxicity in plankton and fish. In: Takaomi, A., H. Harino, O. Madoka, and W.J. Langson, editors. Ecotoxicology of antifouling biocides. Tokyo: Springer, pp. 365-393.
National Environmental Policy Act of 1969. 1969. Public Law 91-190, as amended, 42 USC 4321 et seq.
National Marine Fisheries Service. 2010. Letter to HDR|DTA providing list of Rare, Threatened, and Endangered Species near the Project Area. Accession Number: 20110518-5003. November 2010. Available from FERC Online Elibrary: http://www.FERC.gov/docs-filing/elibrary.asp (September 19, 2011).
Normandeau Associates, Inc., Exponent, Inc., T Tricas, and A Gill. 2011. Effects of EMFs from Undersea Power Cables on Elasmobranchs and Other Marine Species. OCS Study BOEMRE 2011-09, U.S. Department of the Interior, Bureau of Ocean Energy Management, Regulation, and Enforcement, Pacific OCS Region, Camarillo, California.
NRC – National Research Council. 1997. Possible Health Effects of Exposure to Residential Electric and Magnetic Fields. The National Academies Press, Washington, D.C.
NRC – National Research Council. 2000. Marine Mammals and Low Frequency Sound. The National Academies Press, Washington, D.C.
Neill SP, EJ Litt, SJ Couch, and AG Davies. 2009. “The impacts of tidal stream turbines on large-scale sediment dynamics.” Renewable Energy 34(12):2803–2812.
Nunneri C, HJ Lenhart, B Burkhard, and W Windhorst. 2008. “Ecological risk as a tool for evaluating the effects of offshore wind farm construction in the North Sea.” Regional Environmental Change 8(1):31–43.
Odum EP. 1977. “The emergence of ecology as a new integrative discipline.” Science 195:1289–1293.
Odum EP and GW Barrett. 2004. Fundamentals of Ecology. 5th edition. Brooks/Cole Publishing, Cengage Learning, Stamford, Connecticut.
ORPC Maine, LLC. 2011. FERC public filing: Responses to Requests for Additional Information. Cobscook Bay Tidal Energy Project, FERC Project No. 12711. Accession Number: 20110518-5003. Ocean Renewable Power Company, LLC, Portland, Maine. Available from FERC Online Elibrary: http://www.FERC.gov/docs-filing/elibrary.asp (September 19, 2011).
ORPC Maine, LLC. 2011. FERC public filing: Appendix A: ORPC Cobscook Bay and western Passage bird and marine mammal species checklist. Accession Number: 20110518-5003. Ocean Renewable Power Company, LLC, Portland, Maine. Available from FERC Online Elibrary: http://www.FERC.gov/docs-filing/elibrary.asp (September 19, 2011). [
Poff NL, JD Olden, DM Merritt, and DM Pepin. 2007. “Homogenization of regional river dynamics by dams and global diversity implications.” Proceedings of the National Academy of Sciences of the United States of America 104: 5732–5737.
Polagye B and M Previsic. 2010. Scenario Based Analysis of Environmental and Navigation Impacts: Tidal Energy Scenarios. RE Vision DE-002, RE Vision Consulting, LLC, Sacramento, California. Available from http://www.re-vision.net/index.html (February 15, 2011).
Polagye B, P Malte, M Kawase, and D Durran. 2008. “Effect of large-scale kinetic power extraction on time–dependent estuaries.” Proceedings of the Institution of Mechanical Engineers, Part A: Journal of Power and Energy 222(5):471–484.
Polagye B, FB Van Cleve, A Copping, and K Kirkendall (eds). 2011. Environmental Effects of Tidal Energy Development: Proceedings of a Scientific Workshop, March 22–25, 2010. National Marine Fisheries Service, National Oceanic and Atmospheric Administration, Portland, Oregon.
Schiff K., D. Diehl, A. Valkirs. 2004. “Copper emission from antifouling paint on recreational vessels.” Marine Pollution Bulletin, 48: 371-377.
Shields MA, DK Woolf, EPM Grist, SA Kerr, AC Jackson, RE Harris, MC Bell, R Beharie, A Want, E Osalusi, SW Gibb, J Side. 2010. “Marine renewable energy: The ecological implications of altering the hydrodynamics of the marine environment.” Ocean & Costal Management 54(2011):2–9. Simmonds MP, and VC Brown. 2010. Is there a conflict between cetacean conservation and marine renewable-energy developments? Wildlife Research 37: 688-694.
Southhall, B.R., A.E. Bowles, W.T. Wllison, J.J. Finneran, R.L. Gentry, C.R. Greene Jr., D. Kastak, D.R. Ketten, J.H. Miller, P.E. Nachtigall, W.J. Richardson, J.A. Thomas, & P.R. Tyack. 2007. “Marine Mammal Noise Exposure Criteria: Initial Scientific Recommendations.” Aquatic Mammals 33(4): 411-521.
SST – Sound & Sea Technology Engineering Solutions. 2011. Assessment of Potential Puget Sound Marine Safety Risk Resulting from Installation of the Admiralty Inlet Tidal Energy Project: Defining a Risk Management Strategy for the Admiralty Inlet Tidal Energy Project. Prepared for Snohomish Public Utility District #1.
Suter, GW. 1993. Ecological Risk Assessment. Lewis Publishers, Boca Raton.
Thouvenin, M., J.J. Pron, C. Charreteur, P. Guerin, J.Y Langlois, and J Vallee-Rehel. 2002. “A study of the biocide release from antifouling paints.” Progress in Organic Coatings. 44: 75-83.
Thomas, K.V., S. Brooks. 2010. “MINI Review: The environmental fate and effects of antifouling paint biocides.” Biofouling. 26(1): 73-88.
Toth, S., K. Becker-van Slooten, L. Spack, L.F. de alencastro, and J. Tarradellas. 1996. “Irgarol 1051, an antifouling compound in freshwater, sediment, and biota of Lake Geneva.” Bulletin of Environmental Contamination and Technology 57(3): 426-433.
U.S. Fish and Wildlife Service. 2009. FERC public filing: ORPC tidal power, Western Passage, Eastport, Maine. Accession Number: 20110518-5003. U.S. Fish and Wildlife Service Maine field office, Orono, Maine. Available from FERC Online Elibrary: http://www.FERC.gov/docs-filing/elibrary.asp (September 19, 2011).
Valkirs, A.O., P.F. Seligman, E. Haslbeck. 2003. “Measurement of copper relase rates from antifouling paint under laboratory and in situ conditions: implications for loading estimation to marine water bodies.” Marine Pollution Bulletin 46(6): 763-779.
van der Voo L. 2011 . Waiting for Wave Energy. Oregon Business: 1-5. Available from http://www.oregonbusiness.com/articles/99-may-2011/5162-waiting-for-wave-energy (September 19, 2011).
Vickery P. 2010. Survey Protocol for Censusing Seabirds in Cobscook Bay. The Center for Ecological Research, Richmond, Maine.
Vickery PD and Center for Ecological Research. 2011. First Interim Report to ORPC on Bird Studies in Cobscook Bay, Maine Period of Investigation. Accession Number: 20110518-5003, Ocean Renewable Power Company, LLC, Portland, Maine. Available from FERC Online Elibrary: http://www.FERC.gov/docs-filing/elibrary.asp (September 19, 2011).
von Arx WS, HB Stewart Jr, and JR Apel. 1974. “The Florida current as a potential source of useable energy.” In Proceedings of the MacArthur Workshop on the Feasibility of Extracting Useable Energy from the Florida Current, HB Stewart (ed.), February 27–March 1, 1974, Palm Beach Shores, Florida.
Williams R, D Lusseau, and PS Hammond. 2006. “Estimating relative energetic costs of human disturbance to killer whales (Orcinus orca).” Biological Conservation 133:301–311.
Wilson B, RS Batty, F Daunt, and C Carter. 2007. Collision Risks Between Marine Renewable Energy Devices and Mammals, Fish and Diving Birds. Report to the Scottish Executive, Scottish Association for Marine Science, Oban, Scotland.
Yebra, D.M., S. Kiil, C.E. Weinell, and K. Dam-Johansen. 2006. “Dissolution rate measurements of sea water soluble pigments for antifouling paints: ZnO.” Progress in Organic Coatings 56: 327-337.
Ytreberg, E., J. Karlsson, B. Eklund. 2010. “Comparison of toxicity and release rates of Cu and Zn from anti-fouling paints leached in natural and artificial brackish seawater.” Science of the Total Environment 408(12): 2459-2466.

Appendix A
Details of the Consequence Ranking Process and Intermediate Results Tables
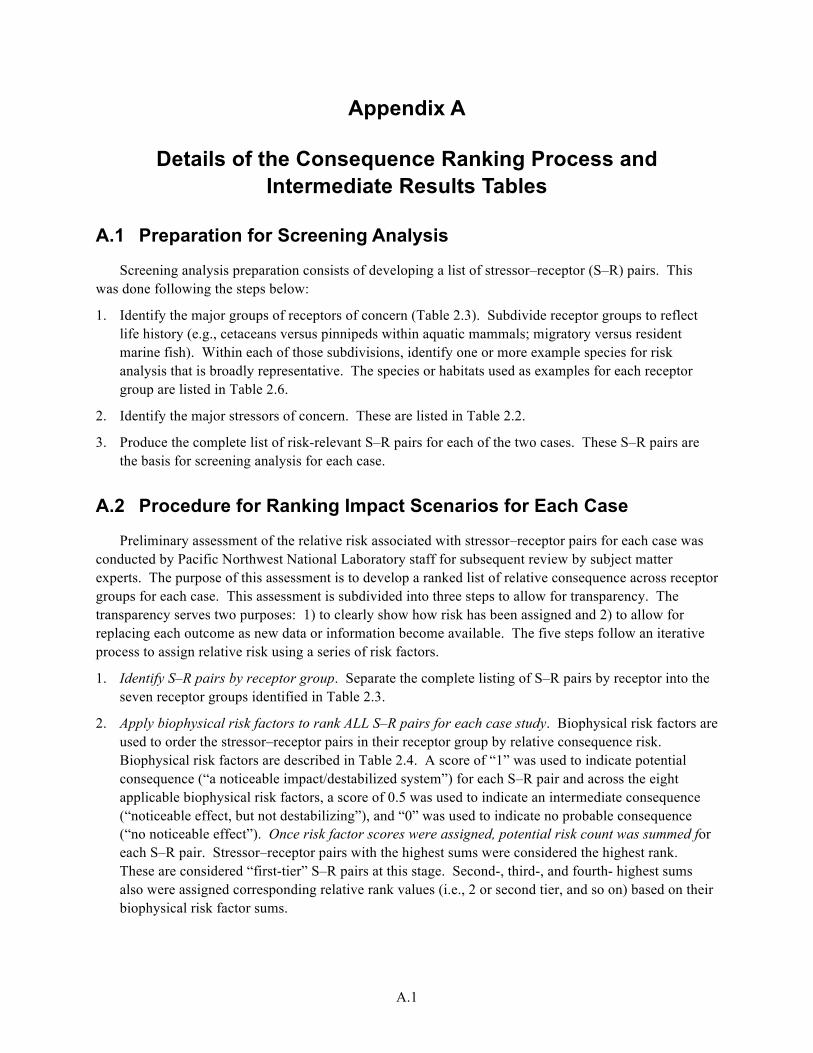
A.1
Appendix A
Details of the Consequence Ranking Process and Intermediate Results Tables
A.1 Preparation for Screening Analysis
Screening analysis preparation consists of developing a list of stressor–receptor (S–R) pairs. This was done following the steps below:
1. Identify the major groups of receptors of concern (Table 2.3). Subdivide receptor groups to reflect life history (e.g., cetaceans versus pinnipeds within aquatic mammals; migratory versus resident marine fish). Within each of those subdivisions, identify one or more example species for risk analysis that is broadly representative. The species or habitats used as examples for each receptor group are listed in Table 2.6.
2. Identify the major stressors of concern. These are listed in Table 2.2.
3. Produce the complete list of risk-relevant S–R pairs for each of the two cases. These S–R pairs are the basis for screening analysis for each case.
A.2 Procedure for Ranking Impact Scenarios for Each Case
Preliminary assessment of the relative risk associated with stressor–receptor pairs for each case was conducted by Pacific Northwest National Laboratory staff for subsequent review by subject matter experts. The purpose of this assessment is to develop a ranked list of relative consequence across receptor groups for each case. This assessment is subdivided into three steps to allow for transparency. The transparency serves two purposes: 1) to clearly show how risk has been assigned and 2) to allow for replacing each outcome as new data or information become available. The five steps follow an iterative process to assign relative risk using a series of risk factors.
1. Identify S–R pairs by receptor group. Separate the complete listing of S–R pairs by receptor into the seven receptor groups identified in Table 2.3.
2. Apply biophysical risk factors to rank ALL S–R pairs for each case study. Biophysical risk factors are used to order the stressor–receptor pairs in their receptor group by relative consequence risk. Biophysical risk factors are described in Table 2.4. A score of “1” was used to indicate potential consequence (“a noticeable impact/destabilized system”) for each S–R pair and across the eight applicable biophysical risk factors, a score of 0.5 was used to indicate an intermediate consequence (“noticeable effect, but not destabilizing”), and “0” was used to indicate no probable consequence (“no noticeable effect”). Once risk factor scores were assigned, potential risk count was summed for each S–R pair. Stressor–receptor pairs with the highest sums were considered the highest rank. These are considered “first-tier” S–R pairs at this stage. Second-, third-, and fourth- highest sums also were assigned corresponding relative rank values (i.e., 2 or second tier, and so on) based on their biophysical risk factor sums.
A.2
This step resulted in a master list for each case comprised of all the S-R interactions broken down into tiers derived from the application of biophysical risk factor scores (Table 3.1 and 3.2). Table A.1 shows the biophysical risk factor score for each ranked S–R pair.
3. For each case, apply regulatory risk factors to S–R pairs, starting with tier 1 S–R pairs. A second set of risk factors, regulatory risk factors, is used to rank S–R pairs within tiers based on their regulatory consequence. Regulatory risk factors are described in Table 2.5 and divided into four levels to reflect the level of protection provided by the law or combination of laws. Level 1 law combinations that apply to S–R pairs are assigned a score of 1 to signify the highest risk. Level 2 laws are assigned a score of 2, and level 3 a score of 3, etc.
S–R pairs that were considered to be tier 1 in step 2 are re-ranked into new tiers based on regulatory risk factors. This was done by applying regulatory risk scores to tier 1 S–R pairs and then re-sorting the tier 1 S–R pairs by regulatory risk factor. The output of this step is a new, shorter list of tier-1 S–R pairs that collectively have the highest risk for biophysical and regulatory risk factors. This short list of tier-1 S–R pairs is set aside while remaining S–R pairs receive further risk screening with the second-tier S–R pairs from step 3 (i.e., second tier S–R pairs for biophysical risk factors).
Regulatory risk factors risk factors are sequentially applied to biophysical risk tier 2 S–R pairs and then re-ranked. Top-tier S–R pairs are set aside while remaining S–R pairs receive further risk screening with the third-tier S–R pairs from step 3. This process is repeated until the top risks from each of the tiers are determined for each of the three cases. Table 3.3 shows the final relative ranking for each tier of risk for each case. Regulatory risks assigned to each S–R pair are shown in Table A.2.
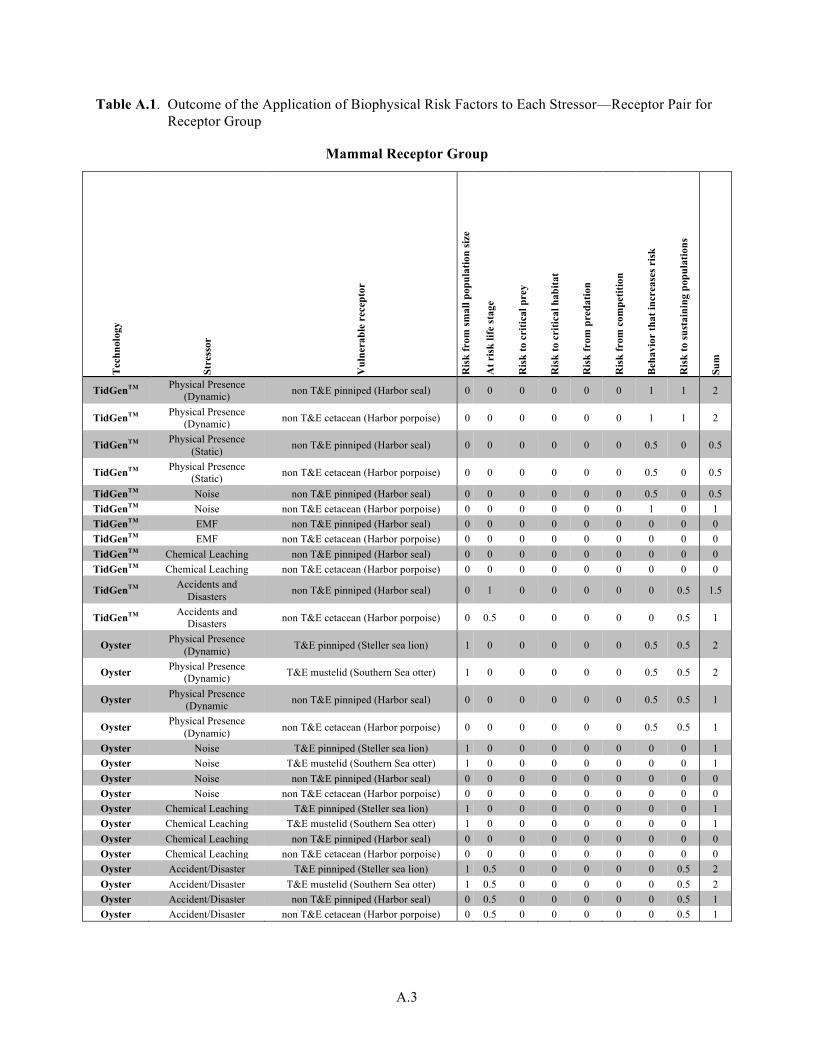
A.3
Table A.1. Outcome of the Application of Biophysical Risk Factors to Each Stressor—Receptor Pair for Receptor Group
Mammal Receptor Group
Tec
hnol
ogy
Stre
ssor
Vul
nera
ble
rece
ptor
Ris
k fr
om sm
all p
opul
atio
n si
ze
At r
isk
life
stag
e
Ris
k to
cri
tical
pre
y
Ris
k to
cri
tical
hab
itat
Ris
k fr
om p
reda
tion
Ris
k fr
om c
ompe
titio
n
Beh
avio
r th
at in
crea
ses r
isk
Ris
k to
sust
aini
ng p
opul
atio
ns
Sum
TidGenTM Physical Presence (Dynamic) non T&E pinniped (Harbor seal) 0 0 0 0 0 0 1 1 2
TidGenTM Physical Presence (Dynamic) non T&E cetacean (Harbor porpoise) 0 0 0 0 0 0 1 1 2
TidGenTM Physical Presence (Static) non T&E pinniped (Harbor seal) 0 0 0 0 0 0 0.5 0 0.5
TidGenTM Physical Presence (Static) non T&E cetacean (Harbor porpoise) 0 0 0 0 0 0 0.5 0 0.5
TidGenTM Noise non T&E pinniped (Harbor seal) 0 0 0 0 0 0 0.5 0 0.5 TidGenTM Noise non T&E cetacean (Harbor porpoise) 0 0 0 0 0 0 1 0 1 TidGenTM EMF non T&E pinniped (Harbor seal) 0 0 0 0 0 0 0 0 0 TidGenTM EMF non T&E cetacean (Harbor porpoise) 0 0 0 0 0 0 0 0 0 TidGenTM Chemical Leaching non T&E pinniped (Harbor seal) 0 0 0 0 0 0 0 0 0 TidGenTM Chemical Leaching non T&E cetacean (Harbor porpoise) 0 0 0 0 0 0 0 0 0
TidGenTM Accidents and Disasters non T&E pinniped (Harbor seal) 0 1 0 0 0 0 0 0.5 1.5
TidGenTM Accidents and Disasters non T&E cetacean (Harbor porpoise) 0 0.5 0 0 0 0 0 0.5 1
Oyster Physical Presence (Dynamic) T&E pinniped (Steller sea lion) 1 0 0 0 0 0 0.5 0.5 2
Oyster Physical Presence (Dynamic) T&E mustelid (Southern Sea otter) 1 0 0 0 0 0 0.5 0.5 2
Oyster Physical Presence (Dynamic non T&E pinniped (Harbor seal) 0 0 0 0 0 0 0.5 0.5 1
Oyster Physical Presence (Dynamic) non T&E cetacean (Harbor porpoise) 0 0 0 0 0 0 0.5 0.5 1
Oyster Noise T&E pinniped (Steller sea lion) 1 0 0 0 0 0 0 0 1 Oyster Noise T&E mustelid (Southern Sea otter) 1 0 0 0 0 0 0 0 1 Oyster Noise non T&E pinniped (Harbor seal) 0 0 0 0 0 0 0 0 0 Oyster Noise non T&E cetacean (Harbor porpoise) 0 0 0 0 0 0 0 0 0 Oyster Chemical Leaching T&E pinniped (Steller sea lion) 1 0 0 0 0 0 0 0 1 Oyster Chemical Leaching T&E mustelid (Southern Sea otter) 1 0 0 0 0 0 0 0 1 Oyster Chemical Leaching non T&E pinniped (Harbor seal) 0 0 0 0 0 0 0 0 0 Oyster Chemical Leaching non T&E cetacean (Harbor porpoise) 0 0 0 0 0 0 0 0 0 Oyster Accident/Disaster T&E pinniped (Steller sea lion) 1 0.5 0 0 0 0 0 0.5 2 Oyster Accident/Disaster T&E mustelid (Southern Sea otter) 1 0.5 0 0 0 0 0 0.5 2 Oyster Accident/Disaster non T&E pinniped (Harbor seal) 0 0.5 0 0 0 0 0 0.5 1 Oyster Accident/Disaster non T&E cetacean (Harbor porpoise) 0 0.5 0 0 0 0 0 0.5 1
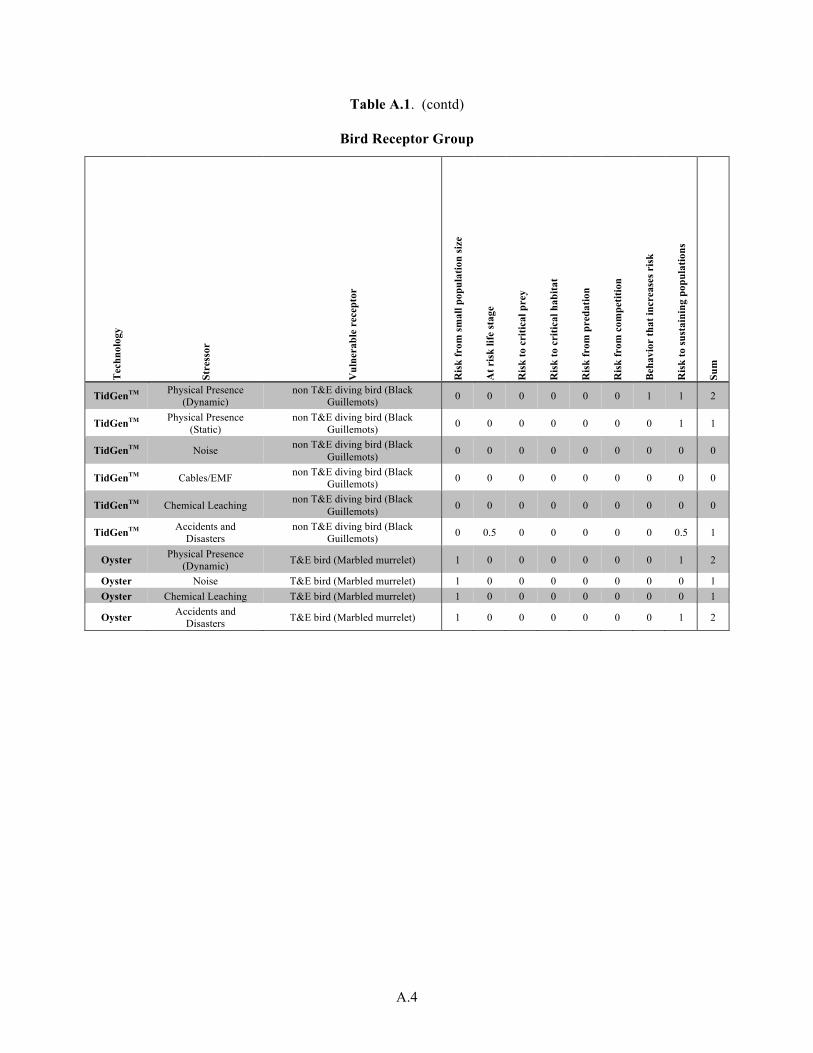
A.4
Table A.1. (contd)
Bird Receptor Group T
echn
olog
y
Stre
ssor
Vul
nera
ble
rece
ptor
Ris
k fr
om sm
all p
opul
atio
n si
ze
At r
isk
life
stag
e
Ris
k to
cri
tical
pre
y
Ris
k to
cri
tical
hab
itat
Ris
k fr
om p
reda
tion
Ris
k fr
om c
ompe
titio
n
Beh
avio
r th
at in
crea
ses r
isk
Ris
k to
sust
aini
ng p
opul
atio
ns
Sum
TidGenTM Physical Presence (Dynamic)
non T&E diving bird (Black Guillemots) 0 0 0 0 0 0 1 1 2
TidGenTM Physical Presence (Static)
non T&E diving bird (Black Guillemots) 0 0 0 0 0 0 0 1 1
TidGenTM Noise non T&E diving bird (Black Guillemots) 0 0 0 0 0 0 0 0 0
TidGenTM Cables/EMF non T&E diving bird (Black Guillemots) 0 0 0 0 0 0 0 0 0
TidGenTM Chemical Leaching non T&E diving bird (Black Guillemots) 0 0 0 0 0 0 0 0 0
TidGenTM Accidents and Disasters
non T&E diving bird (Black Guillemots) 0 0.5 0 0 0 0 0 0.5 1
Oyster Physical Presence (Dynamic) T&E bird (Marbled murrelet) 1 0 0 0 0 0 0 1 2
Oyster Noise T&E bird (Marbled murrelet) 1 0 0 0 0 0 0 0 1 Oyster Chemical Leaching T&E bird (Marbled murrelet) 1 0 0 0 0 0 0 0 1
Oyster Accidents and Disasters T&E bird (Marbled murrelet) 1 0 0 0 0 0 0 1 2
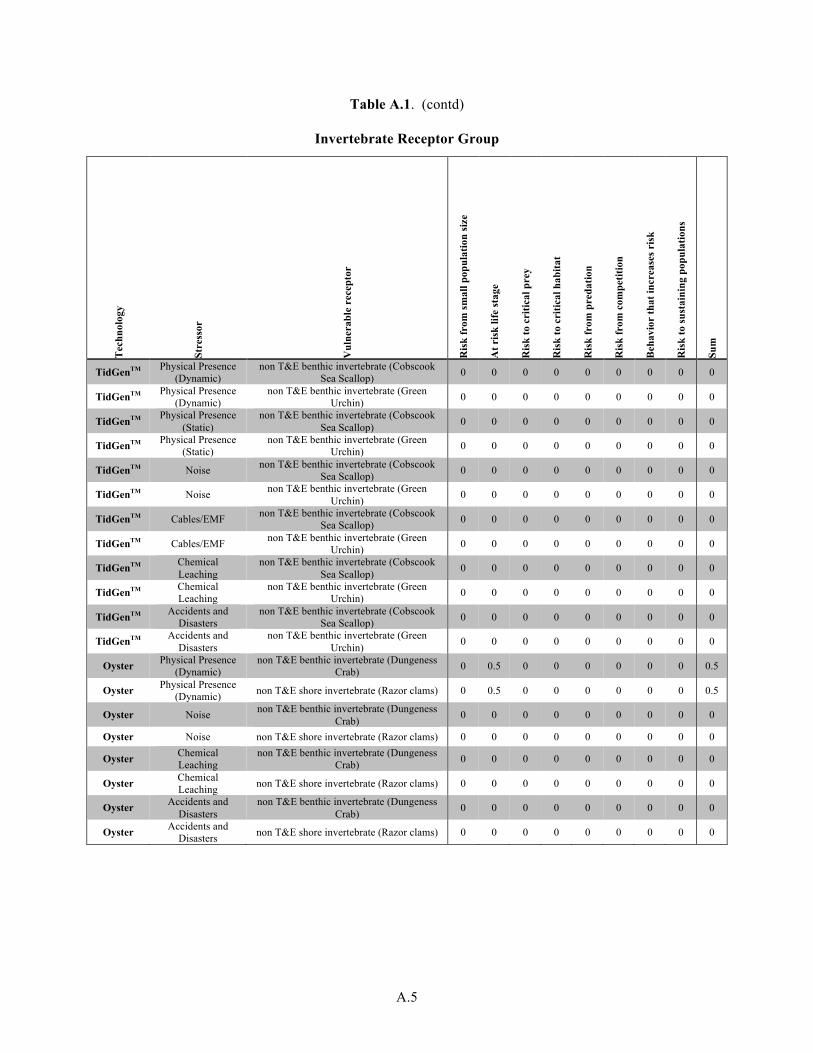
A.5
Table A.1. (contd)
Invertebrate Receptor Group T
echn
olog
y
Stre
ssor
Vul
nera
ble
rece
ptor
Ris
k fr
om sm
all p
opul
atio
n si
ze
At r
isk
life
stag
e
Ris
k to
cri
tical
pre
y
Ris
k to
cri
tical
hab
itat
Ris
k fr
om p
reda
tion
Ris
k fr
om c
ompe
titio
n
Beh
avio
r th
at in
crea
ses r
isk
Ris
k to
sust
aini
ng p
opul
atio
ns
Sum
TidGenTM Physical Presence (Dynamic)
non T&E benthic invertebrate (Cobscook Sea Scallop) 0 0 0 0 0 0 0 0 0
TidGenTM Physical Presence (Dynamic)
non T&E benthic invertebrate (Green Urchin) 0 0 0 0 0 0 0 0 0
TidGenTM Physical Presence (Static)
non T&E benthic invertebrate (Cobscook Sea Scallop) 0 0 0 0 0 0 0 0 0
TidGenTM Physical Presence (Static)
non T&E benthic invertebrate (Green Urchin) 0 0 0 0 0 0 0 0 0
TidGenTM Noise non T&E benthic invertebrate (Cobscook Sea Scallop) 0 0 0 0 0 0 0 0 0
TidGenTM Noise non T&E benthic invertebrate (Green Urchin) 0 0 0 0 0 0 0 0 0
TidGenTM Cables/EMF non T&E benthic invertebrate (Cobscook Sea Scallop) 0 0 0 0 0 0 0 0 0
TidGenTM Cables/EMF non T&E benthic invertebrate (Green Urchin) 0 0 0 0 0 0 0 0 0
TidGenTM Chemical Leaching
non T&E benthic invertebrate (Cobscook Sea Scallop) 0 0 0 0 0 0 0 0 0
TidGenTM Chemical Leaching
non T&E benthic invertebrate (Green Urchin) 0 0 0 0 0 0 0 0 0
TidGenTM Accidents and Disasters
non T&E benthic invertebrate (Cobscook Sea Scallop) 0 0 0 0 0 0 0 0 0
TidGenTM Accidents and Disasters
non T&E benthic invertebrate (Green Urchin) 0 0 0 0 0 0 0 0 0
Oyster Physical Presence (Dynamic)
non T&E benthic invertebrate (Dungeness Crab) 0 0.5 0 0 0 0 0 0 0.5
Oyster Physical Presence (Dynamic) non T&E shore invertebrate (Razor clams) 0 0.5 0 0 0 0 0 0 0.5
Oyster Noise non T&E benthic invertebrate (Dungeness Crab) 0 0 0 0 0 0 0 0 0
Oyster Noise non T&E shore invertebrate (Razor clams) 0 0 0 0 0 0 0 0 0
Oyster Chemical Leaching
non T&E benthic invertebrate (Dungeness Crab) 0 0 0 0 0 0 0 0 0
Oyster Chemical Leaching non T&E shore invertebrate (Razor clams) 0 0 0 0 0 0 0 0 0
Oyster Accidents and Disasters
non T&E benthic invertebrate (Dungeness Crab) 0 0 0 0 0 0 0 0 0
Oyster Accidents and Disasters non T&E shore invertebrate (Razor clams) 0 0 0 0 0 0 0 0 0
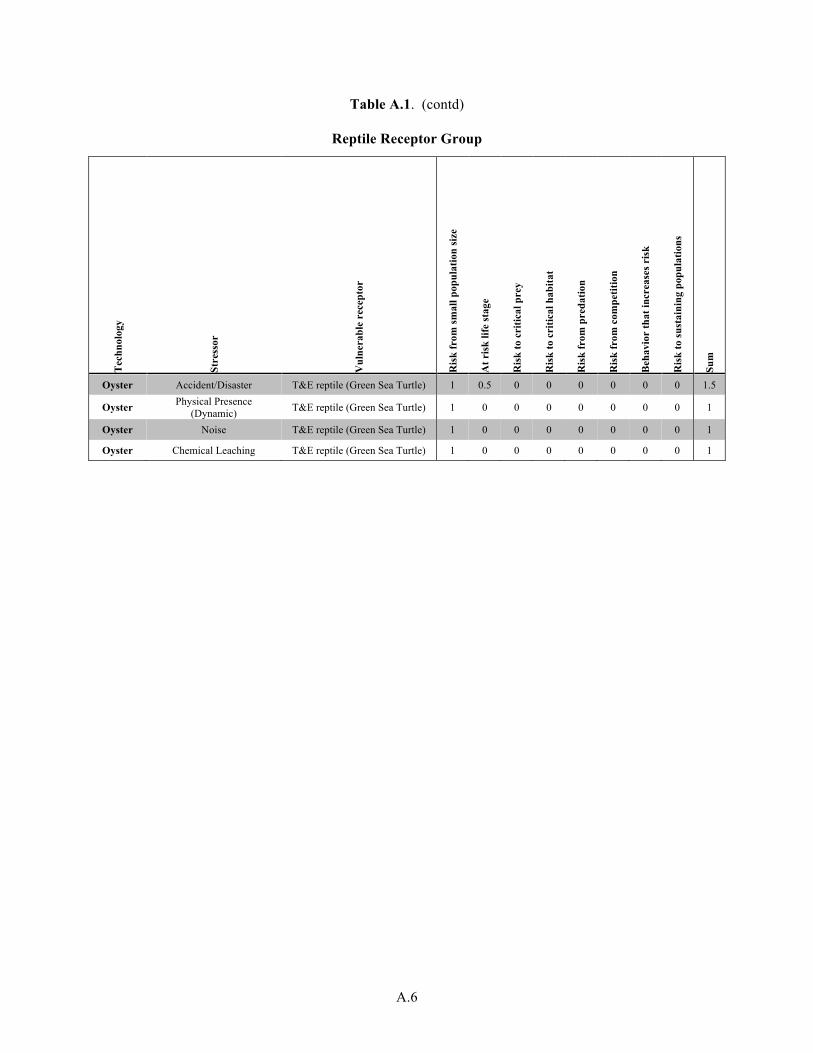
A.6
Table A.1. (contd)
Reptile Receptor Group T
echn
olog
y
Stre
ssor
Vul
nera
ble
rece
ptor
Ris
k fr
om sm
all p
opul
atio
n si
ze
At r
isk
life
stag
e
Ris
k to
cri
tical
pre
y
Ris
k to
cri
tical
hab
itat
Ris
k fr
om p
reda
tion
Ris
k fr
om c
ompe
titio
n
Beh
avio
r th
at in
crea
ses r
isk
Ris
k to
sust
aini
ng p
opul
atio
ns
Sum
Oyster Accident/Disaster T&E reptile (Green Sea Turtle) 1 0.5 0 0 0 0 0 0 1.5
Oyster Physical Presence (Dynamic) T&E reptile (Green Sea Turtle) 1 0 0 0 0 0 0 0 1
Oyster Noise T&E reptile (Green Sea Turtle) 1 0 0 0 0 0 0 0 1
Oyster Chemical Leaching T&E reptile (Green Sea Turtle) 1 0 0 0 0 0 0 0 1
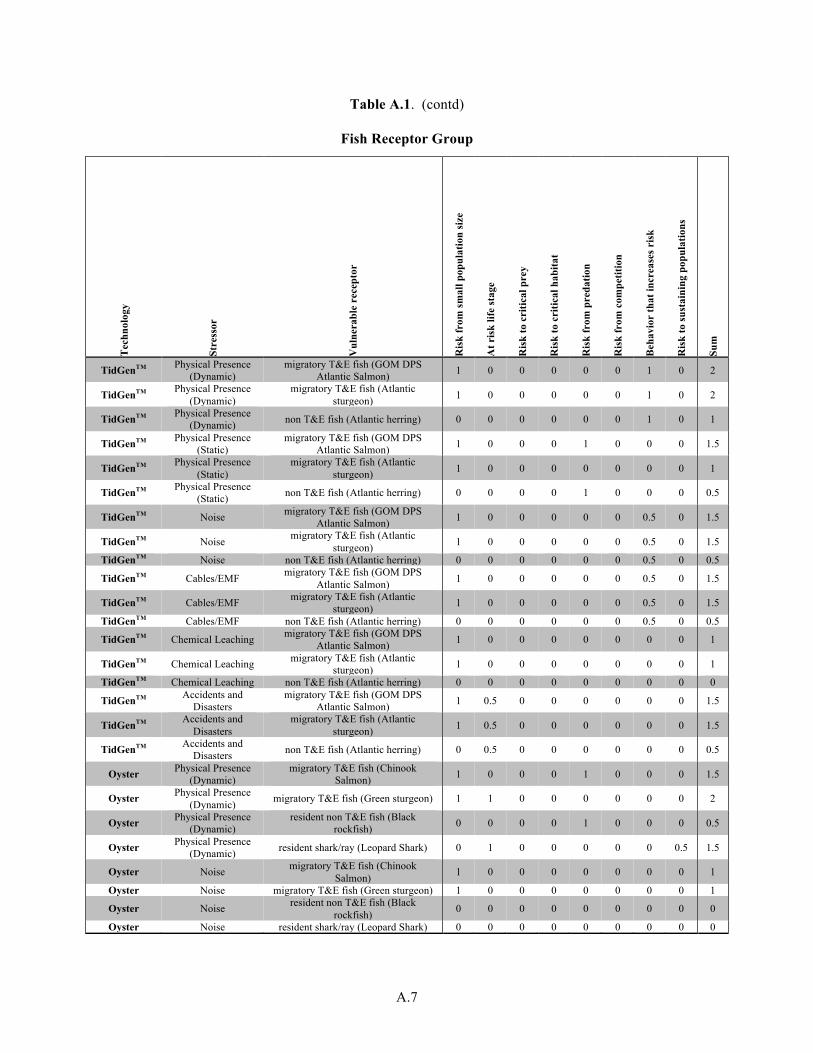
A.7
Table A.1. (contd)
Fish Receptor Group T
echn
olog
y
Stre
ssor
Vul
nera
ble
rece
ptor
Ris
k fr
om sm
all p
opul
atio
n si
ze
At r
isk
life
stag
e
Ris
k to
cri
tical
pre
y
Ris
k to
cri
tical
hab
itat
Ris
k fr
om p
reda
tion
Ris
k fr
om c
ompe
titio
n
Beh
avio
r th
at in
crea
ses r
isk
Ris
k to
sust
aini
ng p
opul
atio
ns
Sum
TidGenTM Physical Presence (Dynamic)
migratory T&E fish (GOM DPS Atlantic Salmon) 1 0 0 0 0 0 1 0 2
TidGenTM Physical Presence (Dynamic)
migratory T&E fish (Atlantic sturgeon) 1 0 0 0 0 0 1 0 2
TidGenTM Physical Presence (Dynamic) non T&E fish (Atlantic herring) 0 0 0 0 0 0 1 0 1
TidGenTM Physical Presence (Static)
migratory T&E fish (GOM DPS Atlantic Salmon) 1 0 0 0 1 0 0 0 1.5
TidGenTM Physical Presence (Static)
migratory T&E fish (Atlantic sturgeon) 1 0 0 0 0 0 0 0 1
TidGenTM Physical Presence (Static) non T&E fish (Atlantic herring) 0 0 0 0 1 0 0 0 0.5
TidGenTM Noise migratory T&E fish (GOM DPS Atlantic Salmon) 1 0 0 0 0 0 0.5 0 1.5
TidGenTM Noise migratory T&E fish (Atlantic sturgeon) 1 0 0 0 0 0 0.5 0 1.5
TidGenTM Noise non T&E fish (Atlantic herring) 0 0 0 0 0 0 0.5 0 0.5
TidGenTM Cables/EMF migratory T&E fish (GOM DPS Atlantic Salmon) 1 0 0 0 0 0 0.5 0 1.5
TidGenTM Cables/EMF migratory T&E fish (Atlantic sturgeon) 1 0 0 0 0 0 0.5 0 1.5
TidGenTM Cables/EMF non T&E fish (Atlantic herring) 0 0 0 0 0 0 0.5 0 0.5
TidGenTM Chemical Leaching migratory T&E fish (GOM DPS Atlantic Salmon) 1 0 0 0 0 0 0 0 1
TidGenTM Chemical Leaching migratory T&E fish (Atlantic sturgeon) 1 0 0 0 0 0 0 0 1
TidGenTM Chemical Leaching non T&E fish (Atlantic herring) 0 0 0 0 0 0 0 0 0
TidGenTM Accidents and Disasters
migratory T&E fish (GOM DPS Atlantic Salmon) 1 0.5 0 0 0 0 0 0 1.5
TidGenTM Accidents and Disasters
migratory T&E fish (Atlantic sturgeon) 1 0.5 0 0 0 0 0 0 1.5
TidGenTM Accidents and Disasters non T&E fish (Atlantic herring) 0 0.5 0 0 0 0 0 0 0.5
Oyster Physical Presence (Dynamic)
migratory T&E fish (Chinook Salmon) 1 0 0 0 1 0 0 0 1.5
Oyster Physical Presence (Dynamic) migratory T&E fish (Green sturgeon) 1 1 0 0 0 0 0 0 2
Oyster Physical Presence (Dynamic)
resident non T&E fish (Black rockfish) 0 0 0 0 1 0 0 0 0.5
Oyster Physical Presence (Dynamic) resident shark/ray (Leopard Shark) 0 1 0 0 0 0 0 0.5 1.5
Oyster Noise migratory T&E fish (Chinook Salmon) 1 0 0 0 0 0 0 0 1
Oyster Noise migratory T&E fish (Green sturgeon) 1 0 0 0 0 0 0 0 1
Oyster Noise resident non T&E fish (Black rockfish) 0 0 0 0 0 0 0 0 0
Oyster Noise resident shark/ray (Leopard Shark) 0 0 0 0 0 0 0 0 0
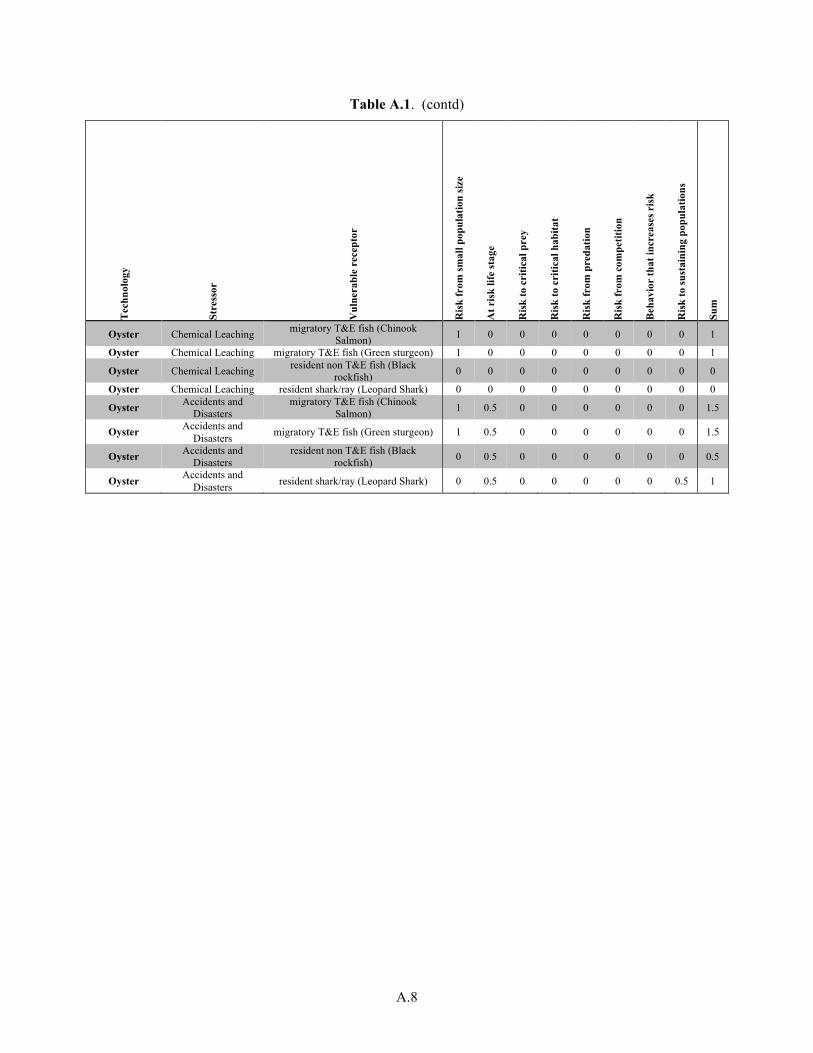
A.8
Table A.1. (contd) T
echn
olog
y
Stre
ssor
Vul
nera
ble
rece
ptor
Ris
k fr
om sm
all p
opul
atio
n si
ze
At r
isk
life
stag
e
Ris
k to
cri
tical
pre
y
Ris
k to
cri
tical
hab
itat
Ris
k fr
om p
reda
tion
Ris
k fr
om c
ompe
titio
n
Beh
avio
r th
at in
crea
ses r
isk
Ris
k to
sust
aini
ng p
opul
atio
ns
Sum
Oyster Chemical Leaching migratory T&E fish (Chinook Salmon) 1 0 0 0 0 0 0 0 1
Oyster Chemical Leaching migratory T&E fish (Green sturgeon) 1 0 0 0 0 0 0 0 1
Oyster Chemical Leaching resident non T&E fish (Black rockfish) 0 0 0 0 0 0 0 0 0
Oyster Chemical Leaching resident shark/ray (Leopard Shark) 0 0 0 0 0 0 0 0 0
Oyster Accidents and Disasters
migratory T&E fish (Chinook Salmon) 1 0.5 0 0 0 0 0 0 1.5
Oyster Accidents and Disasters migratory T&E fish (Green sturgeon) 1 0.5 0 0 0 0 0 0 1.5
Oyster Accidents and Disasters
resident non T&E fish (Black rockfish) 0 0.5 0 0 0 0 0 0 0.5
Oyster Accidents and Disasters resident shark/ray (Leopard Shark) 0 0.5 0 0 0 0 0 0.5 1
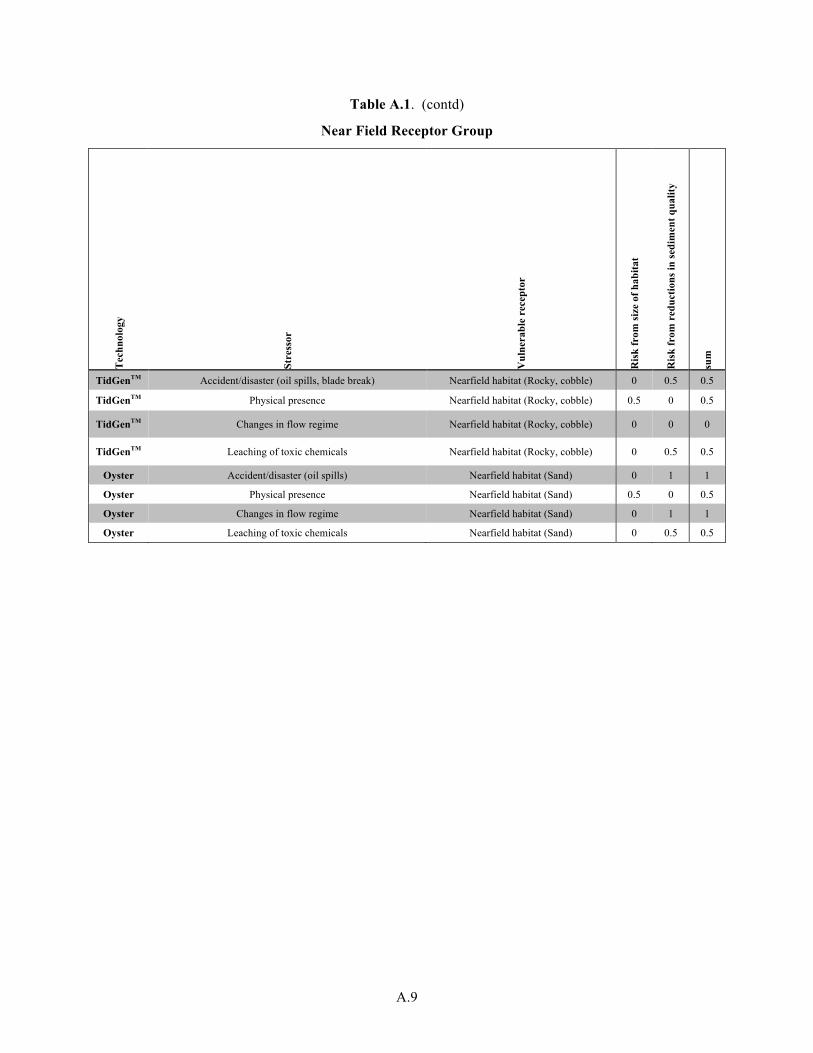
A.9
Table A.1. (contd)
Near Field Receptor Group T
echn
olog
y
Stre
ssor
Vul
nera
ble
rece
ptor
Ris
k fr
om si
ze o
f hab
itat
Ris
k fr
om r
educ
tions
in se
dim
ent q
ualit
y
sum
TidGenTM Accident/disaster (oil spills, blade break) Nearfield habitat (Rocky, cobble) 0 0.5 0.5
TidGenTM Physical presence Nearfield habitat (Rocky, cobble) 0.5 0 0.5
TidGenTM Changes in flow regime Nearfield habitat (Rocky, cobble) 0 0 0
TidGenTM Leaching of toxic chemicals Nearfield habitat (Rocky, cobble) 0 0.5 0.5
Oyster Accident/disaster (oil spills) Nearfield habitat (Sand) 0 1 1
Oyster Physical presence Nearfield habitat (Sand) 0.5 0 0.5
Oyster Changes in flow regime Nearfield habitat (Sand) 0 1 1
Oyster Leaching of toxic chemicals Nearfield habitat (Sand) 0 0.5 0.5
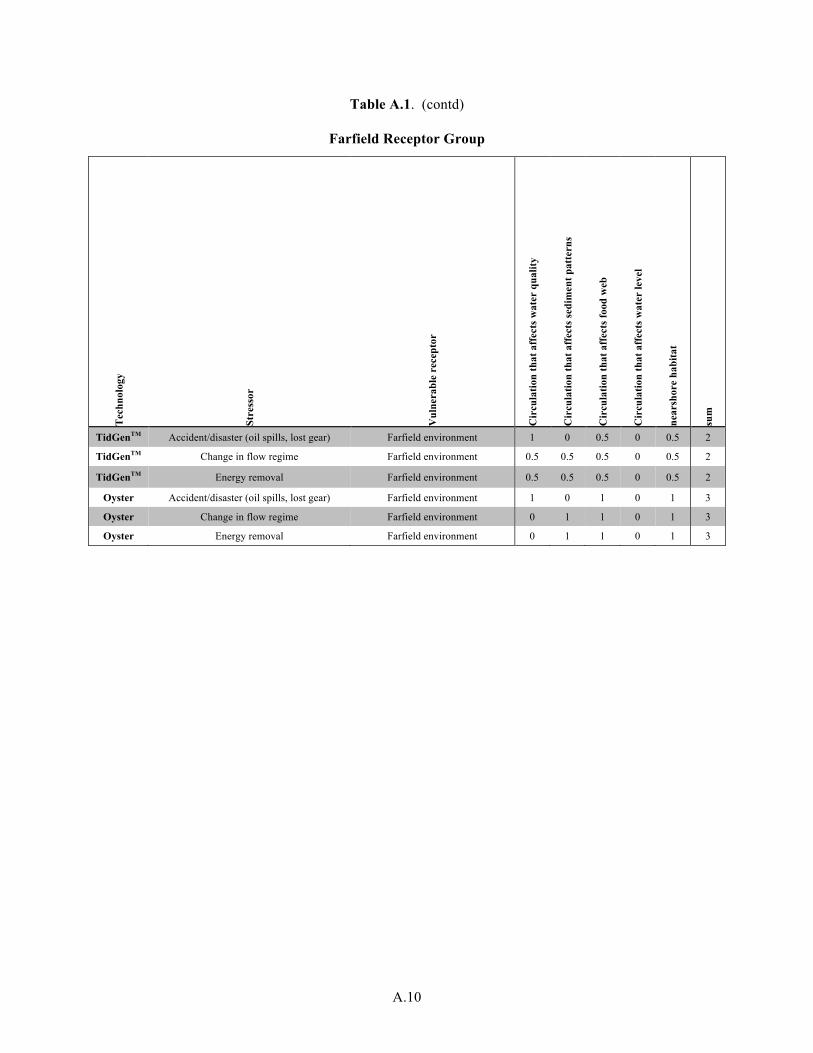
A.10
Table A.1. (contd)
Farfield Receptor Group T
echn
olog
y
Stre
ssor
Vul
nera
ble
rece
ptor
Cir
cula
tion
that
aff
ects
wat
er q
ualit
y
Cir
cula
tion
that
aff
ects
sedi
men
t pat
tern
s
Cir
cula
tion
that
aff
ects
food
web
Cir
cula
tion
that
aff
ects
wat
er le
vel
near
shor
e ha
bita
t
sum
TidGenTM Accident/disaster (oil spills, lost gear) Farfield environment 1 0 0.5 0 0.5 2
TidGenTM Change in flow regime Farfield environment 0.5 0.5 0.5 0 0.5 2
TidGenTM Energy removal Farfield environment 0.5 0.5 0.5 0 0.5 2
Oyster Accident/disaster (oil spills, lost gear) Farfield environment 1 0 1 0 1 3
Oyster Change in flow regime Farfield environment 0 1 1 0 1 3
Oyster Energy removal Farfield environment 0 1 1 0 1 3
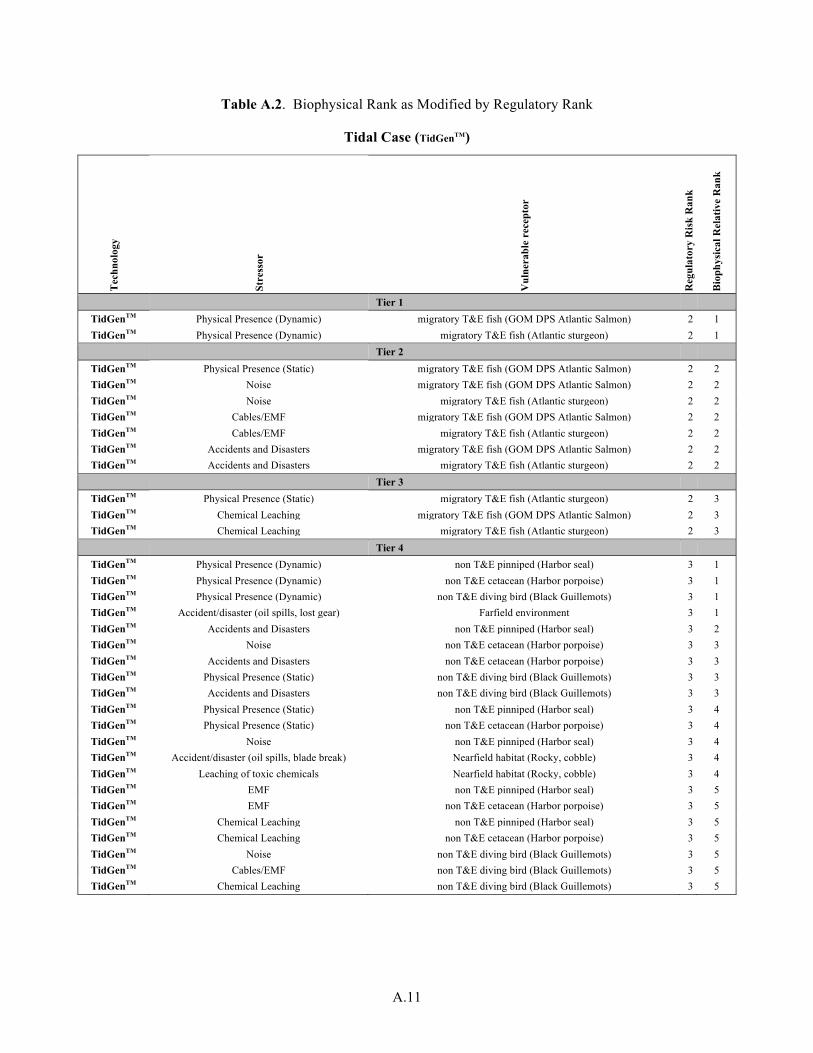
A.11
Table A.2. Biophysical Rank as Modified by Regulatory Rank
Tidal Case (TidGenTM)
Tec
hnol
ogy
Stre
ssor
Vul
nera
ble
rece
ptor
Reg
ulat
ory
Ris
k R
ank
Bio
phys
ical
Rel
ativ
e R
ank
Tier 1
TidGenTM Physical Presence (Dynamic) migratory T&E fish (GOM DPS Atlantic Salmon) 2 1 TidGenTM Physical Presence (Dynamic) migratory T&E fish (Atlantic sturgeon) 2 1
Tier 2 TidGenTM Physical Presence (Static) migratory T&E fish (GOM DPS Atlantic Salmon) 2 2 TidGenTM Noise migratory T&E fish (GOM DPS Atlantic Salmon) 2 2 TidGenTM Noise migratory T&E fish (Atlantic sturgeon) 2 2 TidGenTM Cables/EMF migratory T&E fish (GOM DPS Atlantic Salmon) 2 2 TidGenTM Cables/EMF migratory T&E fish (Atlantic sturgeon) 2 2 TidGenTM Accidents and Disasters migratory T&E fish (GOM DPS Atlantic Salmon) 2 2 TidGenTM Accidents and Disasters migratory T&E fish (Atlantic sturgeon) 2 2
Tier 3 TidGenTM Physical Presence (Static) migratory T&E fish (Atlantic sturgeon) 2 3 TidGenTM Chemical Leaching migratory T&E fish (GOM DPS Atlantic Salmon) 2 3 TidGenTM Chemical Leaching migratory T&E fish (Atlantic sturgeon) 2 3
Tier 4 TidGenTM Physical Presence (Dynamic) non T&E pinniped (Harbor seal) 3 1 TidGenTM Physical Presence (Dynamic) non T&E cetacean (Harbor porpoise) 3 1 TidGenTM Physical Presence (Dynamic) non T&E diving bird (Black Guillemots) 3 1 TidGenTM Accident/disaster (oil spills, lost gear) Farfield environment 3 1 TidGenTM Accidents and Disasters non T&E pinniped (Harbor seal) 3 2 TidGenTM Noise non T&E cetacean (Harbor porpoise) 3 3 TidGenTM Accidents and Disasters non T&E cetacean (Harbor porpoise) 3 3 TidGenTM Physical Presence (Static) non T&E diving bird (Black Guillemots) 3 3 TidGenTM Accidents and Disasters non T&E diving bird (Black Guillemots) 3 3 TidGenTM Physical Presence (Static) non T&E pinniped (Harbor seal) 3 4 TidGenTM Physical Presence (Static) non T&E cetacean (Harbor porpoise) 3 4 TidGenTM Noise non T&E pinniped (Harbor seal) 3 4 TidGenTM Accident/disaster (oil spills, blade break) Nearfield habitat (Rocky, cobble) 3 4 TidGenTM Leaching of toxic chemicals Nearfield habitat (Rocky, cobble) 3 4 TidGenTM EMF non T&E pinniped (Harbor seal) 3 5 TidGenTM EMF non T&E cetacean (Harbor porpoise) 3 5 TidGenTM Chemical Leaching non T&E pinniped (Harbor seal) 3 5 TidGenTM Chemical Leaching non T&E cetacean (Harbor porpoise) 3 5 TidGenTM Noise non T&E diving bird (Black Guillemots) 3 5 TidGenTM Cables/EMF non T&E diving bird (Black Guillemots) 3 5 TidGenTM Chemical Leaching non T&E diving bird (Black Guillemots) 3 5
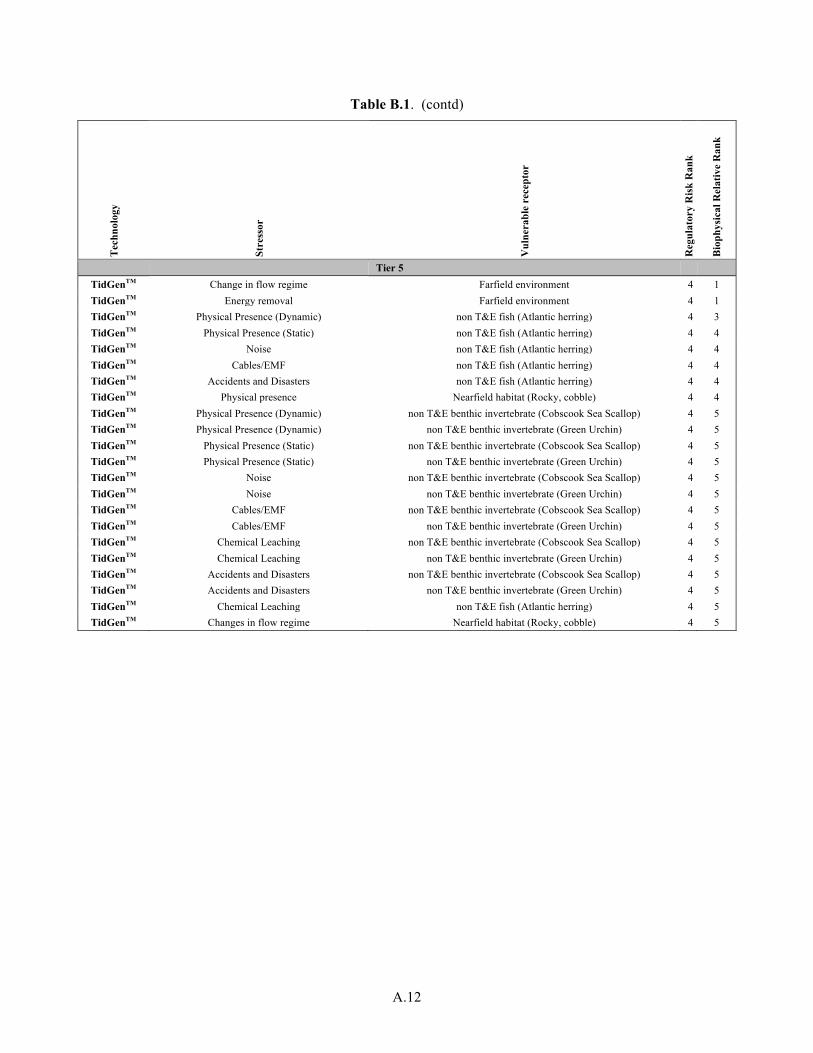
A.12
Table B.1. (contd) T
echn
olog
y
Stre
ssor
Vul
nera
ble
rece
ptor
Reg
ulat
ory
Ris
k R
ank
Bio
phys
ical
Rel
ativ
e R
ank
Tier 5 TidGenTM Change in flow regime Farfield environment 4 1 TidGenTM Energy removal Farfield environment 4 1 TidGenTM Physical Presence (Dynamic) non T&E fish (Atlantic herring) 4 3 TidGenTM Physical Presence (Static) non T&E fish (Atlantic herring) 4 4 TidGenTM Noise non T&E fish (Atlantic herring) 4 4 TidGenTM Cables/EMF non T&E fish (Atlantic herring) 4 4 TidGenTM Accidents and Disasters non T&E fish (Atlantic herring) 4 4 TidGenTM Physical presence Nearfield habitat (Rocky, cobble) 4 4 TidGenTM Physical Presence (Dynamic) non T&E benthic invertebrate (Cobscook Sea Scallop) 4 5 TidGenTM Physical Presence (Dynamic) non T&E benthic invertebrate (Green Urchin) 4 5 TidGenTM Physical Presence (Static) non T&E benthic invertebrate (Cobscook Sea Scallop) 4 5 TidGenTM Physical Presence (Static) non T&E benthic invertebrate (Green Urchin) 4 5 TidGenTM Noise non T&E benthic invertebrate (Cobscook Sea Scallop) 4 5 TidGenTM Noise non T&E benthic invertebrate (Green Urchin) 4 5 TidGenTM Cables/EMF non T&E benthic invertebrate (Cobscook Sea Scallop) 4 5 TidGenTM Cables/EMF non T&E benthic invertebrate (Green Urchin) 4 5 TidGenTM Chemical Leaching non T&E benthic invertebrate (Cobscook Sea Scallop) 4 5 TidGenTM Chemical Leaching non T&E benthic invertebrate (Green Urchin) 4 5 TidGenTM Accidents and Disasters non T&E benthic invertebrate (Cobscook Sea Scallop) 4 5 TidGenTM Accidents and Disasters non T&E benthic invertebrate (Green Urchin) 4 5 TidGenTM Chemical Leaching non T&E fish (Atlantic herring) 4 5 TidGenTM Changes in flow regime Nearfield habitat (Rocky, cobble) 4 5
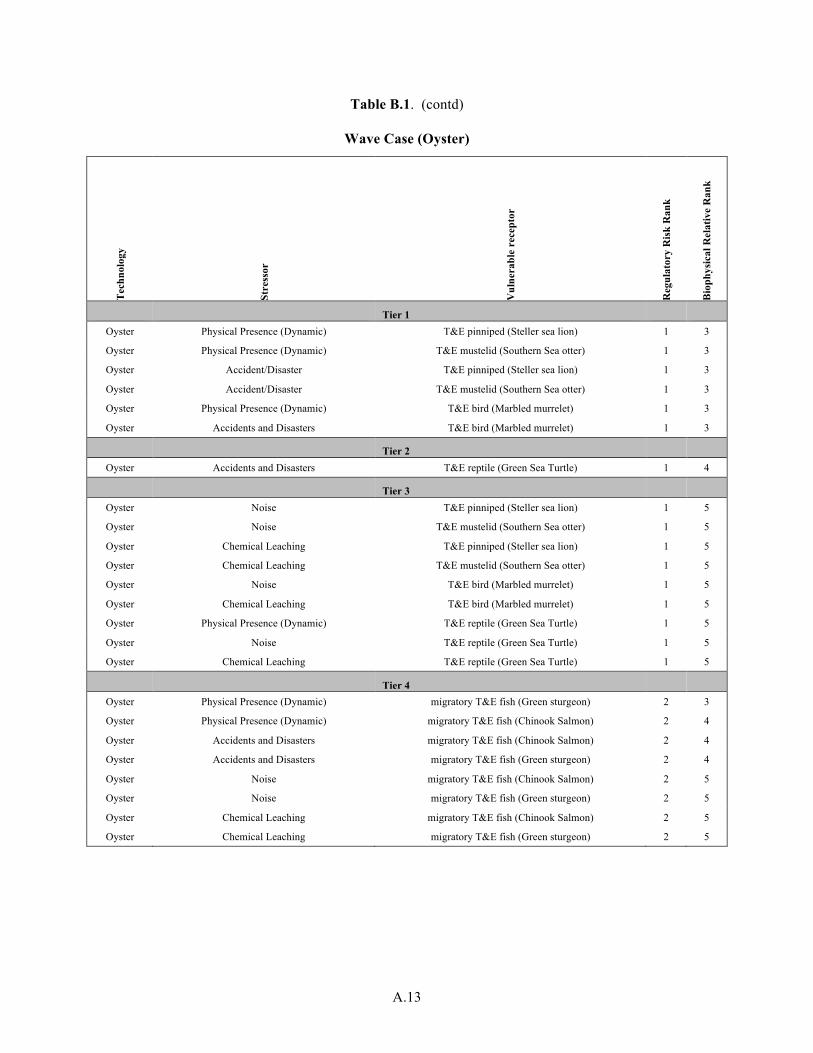
A.13
Table B.1. (contd)
Wave Case (Oyster) T
echn
olog
y
Stre
ssor
Vul
nera
ble
rece
ptor
Reg
ulat
ory
Ris
k R
ank
Bio
phys
ical
Rel
ativ
e R
ank
Tier 1 Oyster Physical Presence (Dynamic) T&E pinniped (Steller sea lion) 1 3
Oyster Physical Presence (Dynamic) T&E mustelid (Southern Sea otter) 1 3
Oyster Accident/Disaster T&E pinniped (Steller sea lion) 1 3
Oyster Accident/Disaster T&E mustelid (Southern Sea otter) 1 3
Oyster Physical Presence (Dynamic) T&E bird (Marbled murrelet) 1 3
Oyster Accidents and Disasters T&E bird (Marbled murrelet) 1 3
Tier 2 Oyster Accidents and Disasters T&E reptile (Green Sea Turtle) 1 4
Tier 3 Oyster Noise T&E pinniped (Steller sea lion) 1 5
Oyster Noise T&E mustelid (Southern Sea otter) 1 5
Oyster Chemical Leaching T&E pinniped (Steller sea lion) 1 5
Oyster Chemical Leaching T&E mustelid (Southern Sea otter) 1 5
Oyster Noise T&E bird (Marbled murrelet) 1 5
Oyster Chemical Leaching T&E bird (Marbled murrelet) 1 5
Oyster Physical Presence (Dynamic) T&E reptile (Green Sea Turtle) 1 5
Oyster Noise T&E reptile (Green Sea Turtle) 1 5
Oyster Chemical Leaching T&E reptile (Green Sea Turtle) 1 5
Tier 4 Oyster Physical Presence (Dynamic) migratory T&E fish (Green sturgeon) 2 3
Oyster Physical Presence (Dynamic) migratory T&E fish (Chinook Salmon) 2 4
Oyster Accidents and Disasters migratory T&E fish (Chinook Salmon) 2 4
Oyster Accidents and Disasters migratory T&E fish (Green sturgeon) 2 4
Oyster Noise migratory T&E fish (Chinook Salmon) 2 5
Oyster Noise migratory T&E fish (Green sturgeon) 2 5
Oyster Chemical Leaching migratory T&E fish (Chinook Salmon) 2 5
Oyster Chemical Leaching migratory T&E fish (Green sturgeon) 2 5
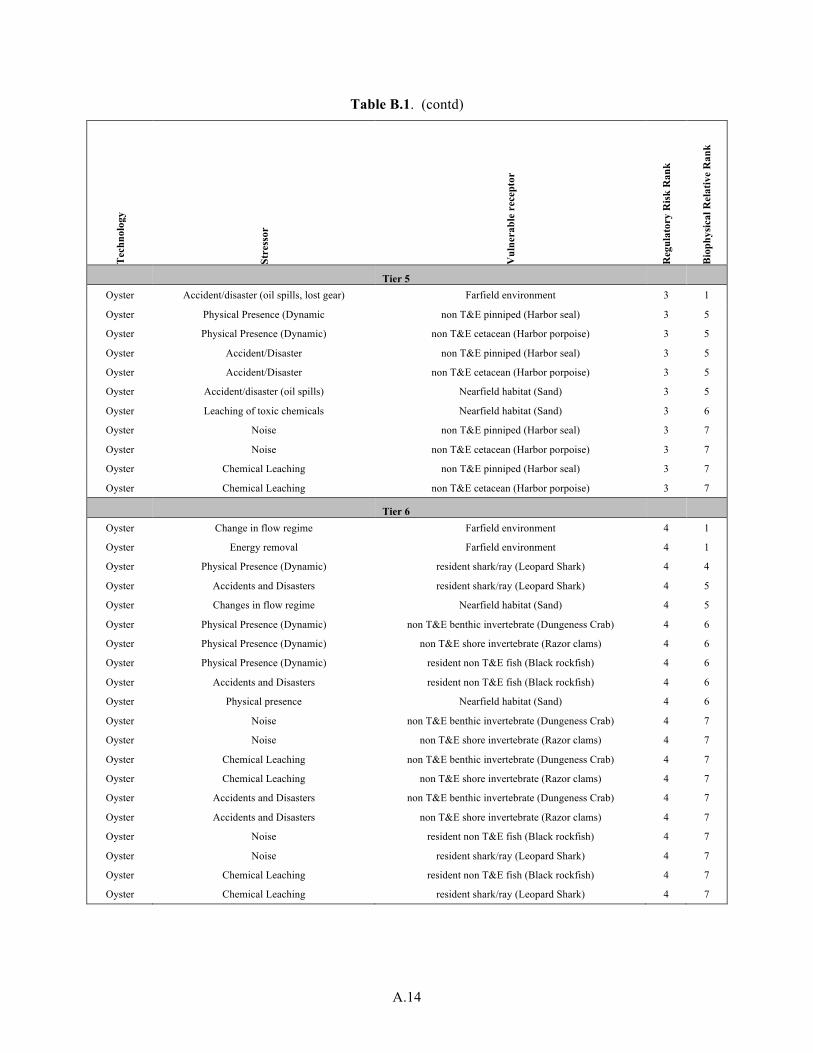
A.14
Table B.1. (contd) T
echn
olog
y
Stre
ssor
Vul
nera
ble
rece
ptor
Reg
ulat
ory
Ris
k R
ank
Bio
phys
ical
Rel
ativ
e R
ank
Tier 5 Oyster Accident/disaster (oil spills, lost gear) Farfield environment 3 1
Oyster Physical Presence (Dynamic non T&E pinniped (Harbor seal) 3 5
Oyster Physical Presence (Dynamic) non T&E cetacean (Harbor porpoise) 3 5
Oyster Accident/Disaster non T&E pinniped (Harbor seal) 3 5
Oyster Accident/Disaster non T&E cetacean (Harbor porpoise) 3 5
Oyster Accident/disaster (oil spills) Nearfield habitat (Sand) 3 5
Oyster Leaching of toxic chemicals Nearfield habitat (Sand) 3 6
Oyster Noise non T&E pinniped (Harbor seal) 3 7
Oyster Noise non T&E cetacean (Harbor porpoise) 3 7
Oyster Chemical Leaching non T&E pinniped (Harbor seal) 3 7
Oyster Chemical Leaching non T&E cetacean (Harbor porpoise) 3 7
Tier 6 Oyster Change in flow regime Farfield environment 4 1
Oyster Energy removal Farfield environment 4 1
Oyster Physical Presence (Dynamic) resident shark/ray (Leopard Shark) 4 4
Oyster Accidents and Disasters resident shark/ray (Leopard Shark) 4 5
Oyster Changes in flow regime Nearfield habitat (Sand) 4 5
Oyster Physical Presence (Dynamic) non T&E benthic invertebrate (Dungeness Crab) 4 6
Oyster Physical Presence (Dynamic) non T&E shore invertebrate (Razor clams) 4 6
Oyster Physical Presence (Dynamic) resident non T&E fish (Black rockfish) 4 6
Oyster Accidents and Disasters resident non T&E fish (Black rockfish) 4 6
Oyster Physical presence Nearfield habitat (Sand) 4 6
Oyster Noise non T&E benthic invertebrate (Dungeness Crab) 4 7
Oyster Noise non T&E shore invertebrate (Razor clams) 4 7
Oyster Chemical Leaching non T&E benthic invertebrate (Dungeness Crab) 4 7
Oyster Chemical Leaching non T&E shore invertebrate (Razor clams) 4 7
Oyster Accidents and Disasters non T&E benthic invertebrate (Dungeness Crab) 4 7
Oyster Accidents and Disasters non T&E shore invertebrate (Razor clams) 4 7
Oyster Noise resident non T&E fish (Black rockfish) 4 7
Oyster Noise resident shark/ray (Leopard Shark) 4 7
Oyster Chemical Leaching resident non T&E fish (Black rockfish) 4 7
Oyster Chemical Leaching resident shark/ray (Leopard Shark) 4 7

A.1
Appendix B
Risk of Encounter Between Tidal Turbine Blades and Marine Animals

B.1


Related Documents