Scrap loss reduction using the 5-whys analysis Uthiyakumar Murugaiah OpEx Engineering Consultancy, Selangor, Malaysia, and Samuel Jebaraj Benjamin, M. Srikamaladevi Marathamuthu and Saravanan Muthaiyah Faculty of Management, Multimedia University, Selangor, Malaysia Abstract Purpose – This paper seeks to document an approach to reduce scrap losses using the root cause analysis technique in a lean manufacturing environment. Design/methodology/approach – The study uses lean manufacturing root cause problem solving (RCPS) technique. The study starts with the collection phase, followed by the analysis phase and ends with the solution phase. Supporting data are presented using a Pareto chart to prioritise wastage in order to be more focused for improvement. The Toyota Production System’s 5-whys analysis is performed to analyse the cause of wastages, to formulate and implement corrective actions. Findings – The application of the 5-whys analysis in a manufacturing industry (XYZ Corporation) provides a fact-based and structured approach to problem identification and correction that not only reduces, but also totally eliminates defects. Corrective action has permanently eliminated the top defect, which is the “last piece material scratch” and this results in zero scrap thereafter. In this study it was also proven that with sound understanding of manufacturing coupled with possible solutions using the 5-whys analysis the authors were not only able to eliminate waste, but also to do it with zero-cost. Originality/value – The approach documented in the paper can be extended to other areas in the manufacturing industry to help improve overall equipment efficiency, breakdown, time loss, customer complaints, etc. Keywords Lean production, Error analysis, Pareto analysis, Quality, Scrap rates/improvement Paper type Research paper 1. Introduction Lean manufacturing philosophy is at the forefront in today’s operations management and quality improvement practices. It is characterised by its goal of maximising productivity (Brown et al., 2008). Its primary focus is to minimise wastage, reduce variation in standards and to improve production quality (Nave, 2002). It also reduces cycle time, increases flexibility, and improves productivity (Hobbs, 2004). Essentially, knowledge is distributed in lean manufacturing because reduction in waste is regarded as common responsibility for all employees in the organisation. It covers aspects of just-in-time (JIT) (Brown et al., 2008; Zhu and Meredith, 1995), workflow management, culture of minimum waste as well as continuous improvement. The driving force of lean manufacturing is the process of continuous improvement through the elimination of waste or non-value adding activities (Burton and Boeder, 2003). Eight types of waste categories that include defects were introduced in Burton’s study. The scope of defects encompasses generating scrap, rework or paperwork errors. The thrust to eliminate The current issue and full text archive of this journal is available at www.emeraldinsight.com/0265-671X.htm Scrap loss reduction 527 Received January 2009 Revised October 2009 Accepted November 2009 International Journal of Quality & Reliability Management Vol. 27 No. 5, 2010 pp. 527-540 q Emerald Group Publishing Limited 0265-671X DOI 10.1108/02656711011043517

Welcome message from author
This document is posted to help you gain knowledge. Please leave a comment to let me know what you think about it! Share it to your friends and learn new things together.
Transcript
Scrap loss reduction using the5-whys analysis
Uthiyakumar MurugaiahOpEx Engineering Consultancy, Selangor, Malaysia, and
Samuel Jebaraj Benjamin, M. Srikamaladevi Marathamuthu andSaravanan Muthaiyah
Faculty of Management, Multimedia University, Selangor, Malaysia
Abstract
Purpose – This paper seeks to document an approach to reduce scrap losses using the root causeanalysis technique in a lean manufacturing environment.
Design/methodology/approach – The study uses lean manufacturing root cause problem solving(RCPS) technique. The study starts with the collection phase, followed by the analysis phase and endswith the solution phase. Supporting data are presented using a Pareto chart to prioritise wastage inorder to be more focused for improvement. The Toyota Production System’s 5-whys analysis isperformed to analyse the cause of wastages, to formulate and implement corrective actions.
Findings – The application of the 5-whys analysis in a manufacturing industry (XYZ Corporation)provides a fact-based and structured approach to problem identification and correction that not onlyreduces, but also totally eliminates defects. Corrective action has permanently eliminated the topdefect, which is the “last piece material scratch” and this results in zero scrap thereafter. In this study itwas also proven that with sound understanding of manufacturing coupled with possible solutionsusing the 5-whys analysis the authors were not only able to eliminate waste, but also to do it withzero-cost.
Originality/value – The approach documented in the paper can be extended to other areas in themanufacturing industry to help improve overall equipment efficiency, breakdown, time loss, customercomplaints, etc.
Keywords Lean production, Error analysis, Pareto analysis, Quality, Scrap rates/improvement
Paper type Research paper
1. IntroductionLean manufacturing philosophy is at the forefront in today’s operations managementand quality improvement practices. It is characterised by its goal of maximisingproductivity (Brown et al., 2008). Its primary focus is to minimise wastage, reducevariation in standards and to improve production quality (Nave, 2002). It also reducescycle time, increases flexibility, and improves productivity (Hobbs, 2004). Essentially,knowledge is distributed in lean manufacturing because reduction in waste is regardedas common responsibility for all employees in the organisation. It covers aspects ofjust-in-time (JIT) (Brown et al., 2008; Zhu and Meredith, 1995), workflow management,culture of minimum waste as well as continuous improvement. The driving force of leanmanufacturing is the process of continuous improvement through the elimination ofwaste or non-value adding activities (Burton and Boeder, 2003). Eight types of wastecategories that include defects were introduced in Burton’s study. The scope of defectsencompasses generating scrap, rework or paperwork errors. The thrust to eliminate
The current issue and full text archive of this journal is available at
www.emeraldinsight.com/0265-671X.htm
Scrap lossreduction
527
Received January 2009Revised October 2009
Accepted November 2009
International Journal of Quality &Reliability Management
Vol. 27 No. 5, 2010pp. 527-540
q Emerald Group Publishing Limited0265-671X
DOI 10.1108/02656711011043517

waste especially defects is therefore at the heart of lean manufacturing; described by(Womack and Jones, 1996) as one of his five principles of lean manufacturing’sphilosophy, namely the fifth principle, which requires companies to strive for perfectionby constantly removing layers of waste. In order to eliminate wastage problems or scraplosses, one must first recognise the root cause of the problem and attempt to solve theproblem in a systematic way. In this regard root cause problem solving (RCPS) can beconsidered as a structured problem solving approach using simple standardised tools toidentify and resolve critical problems encountered in manufacturing operations. The useof this approach leads to the improved factory efficiency, improved quality, lower scrap,superior customer service, and an improved work environment. Professionals often useRCPS to solve quality problems. RCPS analysis tools commonly used arecause-and-effect (CED) diagram, interrelationship diagram (ID), current reality tree(CRT) (Ishikawa, 1982; Mizuno, 1988; Goldratt, 1994; Doggett, 2005) and the 5-whysanalysis (Pylipow and Royall, 2001; Nelsen, 2003; Pinsky, 2003).
RCPS is a four-step process involving data collection, causal factor charting, rootcause identification and recommendation generation and implementation (Rooney andVanden Heuvel, 2004). The root cause failure analysis (RCFA), which is similar to theRCPS begins with the collection phase, followed by the analysis phase and ends withthe solution phase (Ransom, 2008). This study has applied all the steps of RCPS toarrive at the solution obtained consequently.
Quality professionals naturally implement root cause analysis with corrective actionsas remedial actions when faced with manufacturing problems in world-class organisations(Pylipow and Royall, 2001). The 5-why analysis is commonly used in lean manufacturing.In essence lean manufacturing is an extension of the ideas of JIT. Taiichi Ohno the father ofToyota Production System (TPS) was an avid proponent of the 5-whys analysis tool of rootcause problem solving (Alukal, 2007). The 5-whys analysis emerged as a result of TaiichiOhno’s observation in his days in Toyota that when mistakes happen in the production ormanufacturing environment people would always blame one another. He realised thatmistakes are inevitable and the best approach towards mistakes is to identify the rootcauses of the mistakes and act upon it (Ohno, 1988). His favourite tool to resolve problemsat the manufacturing floor is the 5-whys analysis. Ohno’s (1988) infamous example forillustrating his 5-whys analysis is as follows:
Question 1: Why did the robot stop?
Answer: The circuit is overloaded, causing a fuse to blow.
Question 2: Why is the circuit overloaded?
Answer: There was insufficient lubrication on the bearings, so they locked up.
Question 3: Why was there insufficient lubrication on the bearings?
Answer: The oil pump on the robot is not circulating sufficient oil.
Question 4: Why is the pump not circulating sufficient oil?
Answer: The pump intake is clogged with metal shavings.
Question 5: Why is the intake clogged with metal shavings?
Answer: Because there is no filter on the pump.
IJQRM27,5
528

The solution action for the scenario above (Ohno, 1988), would be to install the filter onthe pump. However, in practice, the answer to all manufacturing related problems arenot always simple, straightforward and self-explanatory as Ohno’s example above.
Correctly performed 5-whys analysis usually has a lot of depth and breadth. Indeedreal root causes are normally deep and corrective actions at those deep levels arebroadly based and long lasting. This is why a truly well performed 5-whys analysis isbased on corrective action and could actually be viewed as both corrective as well aspreventive action.
2. MethodologyVilfredo Pareto’s (1842-1923), 80:20 rule was used in this study to analyse the maincauses of scrap in XYZ’s (not its original name) barrel production. The techniqueemerged as a result of Pareto’s observation of the distribution of wealth in nineteenthcentury in Italy which showed that 80 per cent of the country’s wealth was owned by20 per cent of the population. This observed trend was later found to be representativeof the distribution of other data populations (Pylipow and Royall, 2001). Among somecommon scenarios where this trend could be observed are:
. 80 per cent of the total number of quality related problems are caused by 20 percents of sources;
. 80 per cent of the total sales of a company are originated from 20 per cent of itscustomers; and
. 80 per cent of the numbers of absenteeism are caused by 20 per cent of theworkforce.
The Pareto chart is useful for non-numeric data, such as “cause”, “type” or“classification” and is useful to prioritise where action and process changes should befocused and is commonly used for identifying the downtime and other wastages (Hallet al., 2000). The Pareto charts uses bar graphs to sort problems according to severity,frequency, nature, or source and displays them in order of size to show which problemsare the most important. It is one of the most often-used statistical analysis tools withinToyota, which is simple, yet powerful. Upon identification of the main causes of scrap,the 5-why analysis was used to find out the root causes of scrap loss. In this regard, theclassic as well as lean manufacturing approach to root cause analysis is to question“Why?” for five times, hence the 5-whys analysis. Prompt addressing of problemsbefore asking enough why questions are often short-lived and will generally recur. Theroot cause of a particular problem, in this study, scrap loss, is usually deep and needscorrective as well as preventive action. In this study the 5-whys analysis is used toanalyse the root causes of the scrap to identify the right solution to adopt.
2.1. Study settingThe study setting involves a barrel manufacturing company supplying its products tovarious industries in oil and gas, cosmetic, chemical and etc. XYZ (not its real name), isone of the biggest barrel manufacturing industries in the ASEAN region. The successfactor of XYZ is due to the ability of the operation team to work on continuousimprovement projects based on lean manufacturing methodology. XYZ’s operationteam practices various lean manufacturing tools such as RCPS, single minute exchangedie (SMED), reduction of eight wastages, etc.
Scrap lossreduction
529
One of the biggest challenges for XYZ in the current competitive manufacturingenvironment is to maintain and further reduce it’s manufacturing cost. Some of theareas that were being focused are scrap loss, process change over time-loss andmachine breakdown time-loss. It was at this juncture the authors worked together withthe operation team to reduce the top scrap defect loss using RCPS. The objective of thisstudy was to reduce the top defect loss in the barrel manufacturing operations.
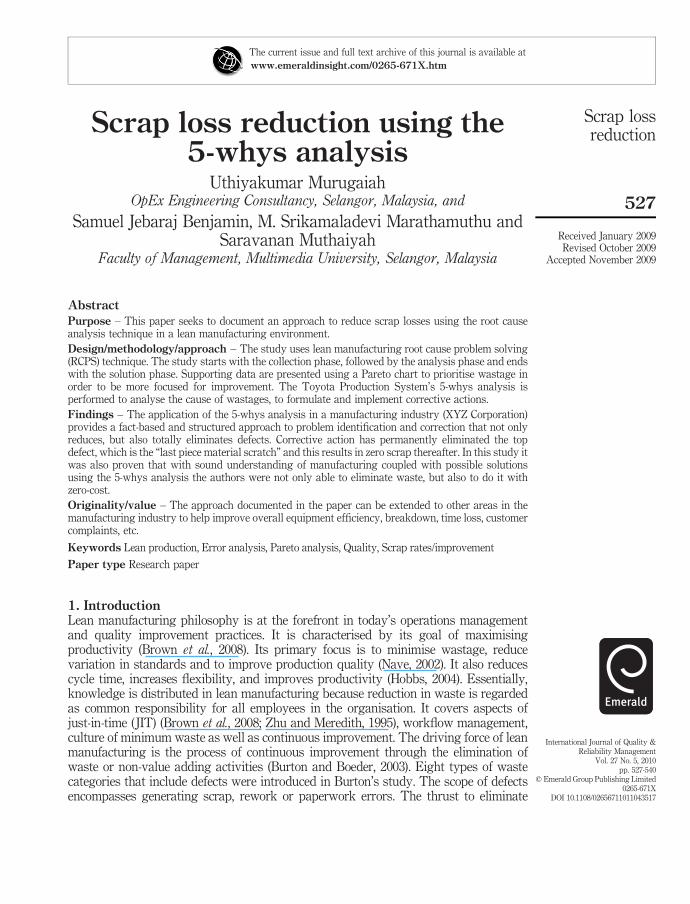
2.2 Pareto analysisThe Pareto chart was prepared to determine the top 10 scrap defects for a seven-monthperiod starting from November, 2007-May, 2008 for XYZ. The chart is shown inFigure 1.
The Pareto chart plotted in Figure 1 shows the top ten causes of scrap defects andscrap is measured based on the total weight (in kg) of scrap loss. The Pareto chart canindeed also be plotted based on scrap loss in dollar value or the quantity (units) ofbarrels being scrapped but the former value will not reflect the actual loss of themanufacturing process accurately. The scrap loss in dollar value will also incorporatethe gain or losses due to the fluctuations in the trend of global market price of steel. Thequantity of barrels being scrapped is also not significant as each barrel may weighdifferently based on the customer’s customised requirement for barrel thickness.
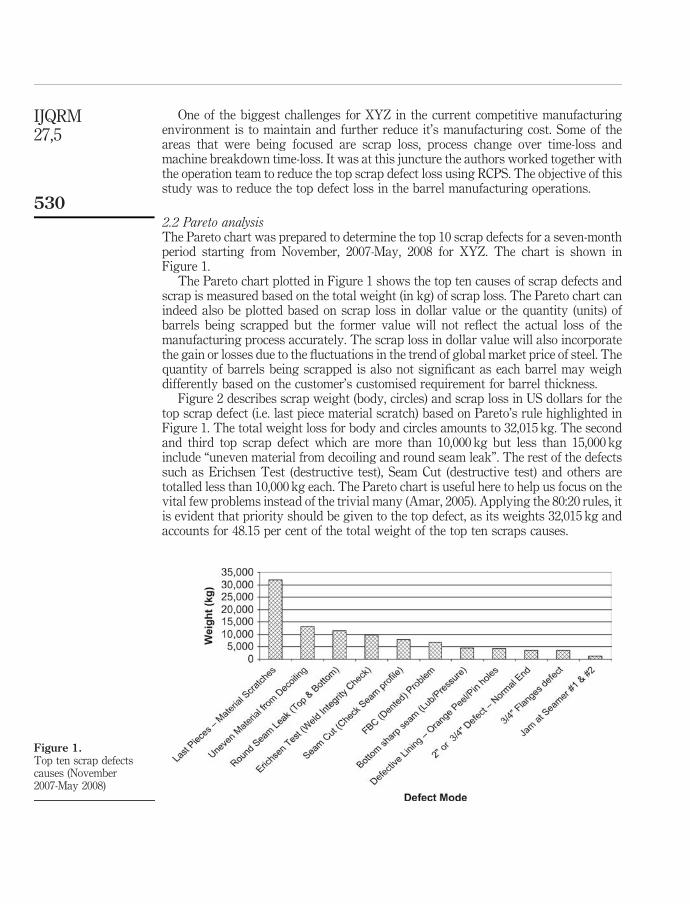
Figure 2 describes scrap weight (body, circles) and scrap loss in US dollars for thetop scrap defect (i.e. last piece material scratch) based on Pareto’s rule highlighted inFigure 1. The total weight loss for body and circles amounts to 32,015 kg. The secondand third top scrap defect which are more than 10,000 kg but less than 15,000 kginclude “uneven material from decoiling and round seam leak”. The rest of the defectssuch as Erichsen Test (destructive test), Seam Cut (destructive test) and others aretotalled less than 10,000 kg each. The Pareto chart is useful here to help us focus on thevital few problems instead of the trivial many (Amar, 2005). Applying the 80:20 rules, itis evident that priority should be given to the top defect, as its weights 32,015 kg andaccounts for 48.15 per cent of the total weight of the top ten scraps causes.
Figure 1.Top ten scrap defectscauses (November2007-May 2008)
IJQRM27,5
530
A second level of Pareto chart was prepared to analyse the categories or break down oflast piece material scratch scrap loss and the scrap impact on a monthly basis. Thechart was plotted based on scrap weight (kg) and scrap loss (US$) is as per below:
Based on the detailed analysis in Figure 2, it is evident that there are two categoriesof last piece material scratch defect; i.e. on bodies and on circles. The scrap loss in (US$)shown in the line chart of Figure 2 is based on the following equation:
Scrap loss ¼ Wt½ � £ A2 Bð Þ� �
where:
Wt refers to the scrap weight of bodies and circles.
A refers to buying price of cold roll steel.
B refers to selling price of scrap material.
The total scrap loss (US$) will not fluctuate in direct proportion with the weight ofscrap loss in (kg) as the buying price of steel and selling price of scrap steel fluctuatesbased on global steel prices. As shown in Figure 2, the scrap loss in the month of Apriland May is lower than the month of December though the scrap weight is much greaterin April and May compared to December. In order to proceed to the next step of findingout the root cause and hence solutions, one must first have an overview of the barrelmaking production process.
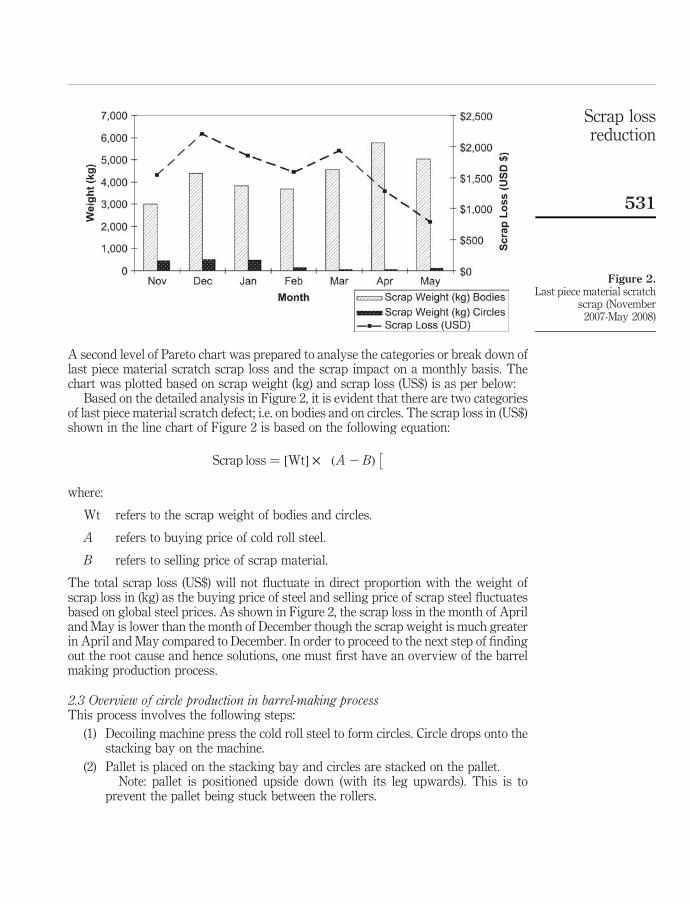
2.3 Overview of circle production in barrel-making processThis process involves the following steps:
(1) Decoiling machine press the cold roll steel to form circles. Circle drops onto thestacking bay on the machine.
(2) Pallet is placed on the stacking bay and circles are stacked on the pallet.Note: pallet is positioned upside down (with its leg upwards). This is to
prevent the pallet being stuck between the rollers.
Figure 2.Last piece material scratch
scrap (November2007-May 2008)
Scrap lossreduction
531
(3) The pallet is moved from the decoiling machine by roller conveyer.
(4) Decoiling operator uses forklift to carry the pallet with the bundle of circles tothe stock area.
(5) Ends line operator carries the bundle of circles from pallet at the stock area tothe machine (direct contact of forklift arm and last piece of circle). Circles areplaced on roller conveyer. Roller conveyer rotates and moves the circles to themachine’s scissor table to process it to become top/bottom ends.
Almost every last piece of the circle in the bundle is being scrapped due to scratchesfound on its bottom (Figure 3).
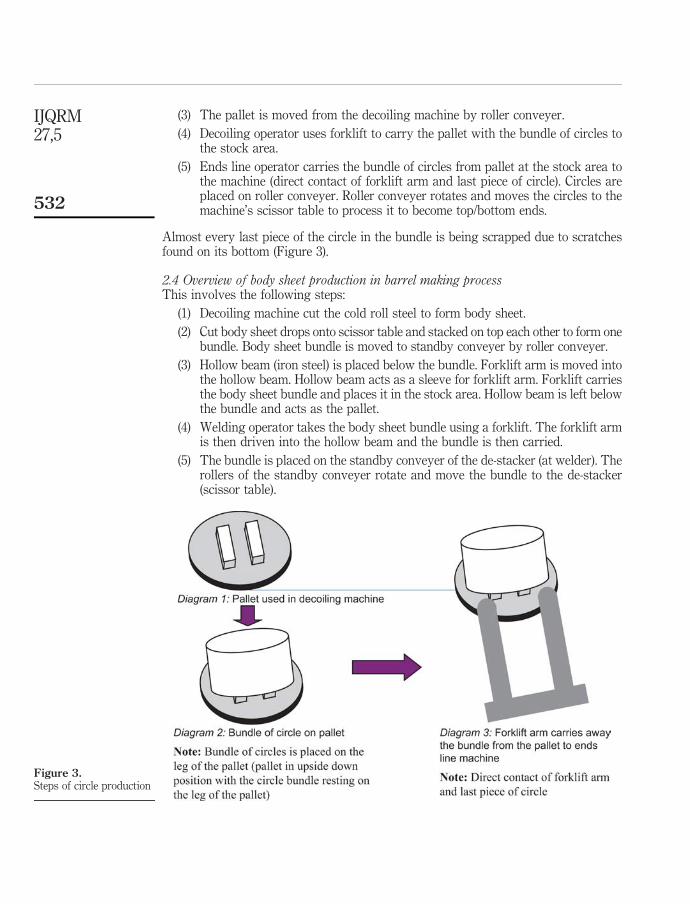
2.4 Overview of body sheet production in barrel making processThis involves the following steps:
(1) Decoiling machine cut the cold roll steel to form body sheet.
(2) Cut body sheet drops onto scissor table and stacked on top each other to form onebundle. Body sheet bundle is moved to standby conveyer by roller conveyer.
(3) Hollow beam (iron steel) is placed below the bundle. Forklift arm is moved intothe hollow beam. Hollow beam acts as a sleeve for forklift arm. Forklift carriesthe body sheet bundle and places it in the stock area. Hollow beam is left belowthe bundle and acts as the pallet.
(4) Welding operator takes the body sheet bundle using a forklift. The forklift armis then driven into the hollow beam and the bundle is then carried.
(5) The bundle is placed on the standby conveyer of the de-stacker (at welder). Therollers of the standby conveyer rotate and move the bundle to the de-stacker(scissor table).
Figure 3.Steps of circle production
IJQRM27,5
532

Almost every last piece of body sheet from the bundle is being scrapped due toscratches found on its bottom (Figure 4).
2.5 Root cause problem solving – 5-whys analysisXYZ is a lean-based manufacturing company and hence the approach chosen to reducethe scratches defect on the “last piece material scratch” is the RCPS method of 5-whysanalysis.
The 5-whys analysis was conducted for both the circles and body sheet individuallyas shown in Figures 5 and 6.
2.6. Remedial actionsIn general, lean manufacturing RCPS tools tend to require less quantitative analysisthan six sigma tools. Toyota for example believed in simple tools and solutionswhenever possible and placed great emphasis on root-cause problem solving aimed atpermanent solution using the 5-whys analysis (Alukal, 2007). Some authors even arguethat the 5-whys technique does not even involve data segmentation, hypothesis testing,regression or other advanced statistical tools and can lead to the root cause of aproblem by repeatedly asking the question “why” at least five times (Dolcemascolo,2006). In fact criticism has been levelled at lean manufacturing that it does not valuestatistical analysis (Nave, 2002). However this study will emphasise the point thattangible and useful results could still be obtained and implemented successfullywithout the use of statistical analysis.
In our study although the traditional 5-whys analysis requires the “why” questionto be asked five times, in the analysis above the why questions was only asked fourtimes for both the circle and body sheet. The reason for doing so was because the5-whys figure above clearly identifies friction as the first level root cause for both thecircle and body sheet. The asking of the “Why” could be stopped if common sense tellus that no more “Why” questions are needed to solve the problem (Pylipow and Royall,2001).
Figure 4.Body sheet production
Scrap lossreduction
533
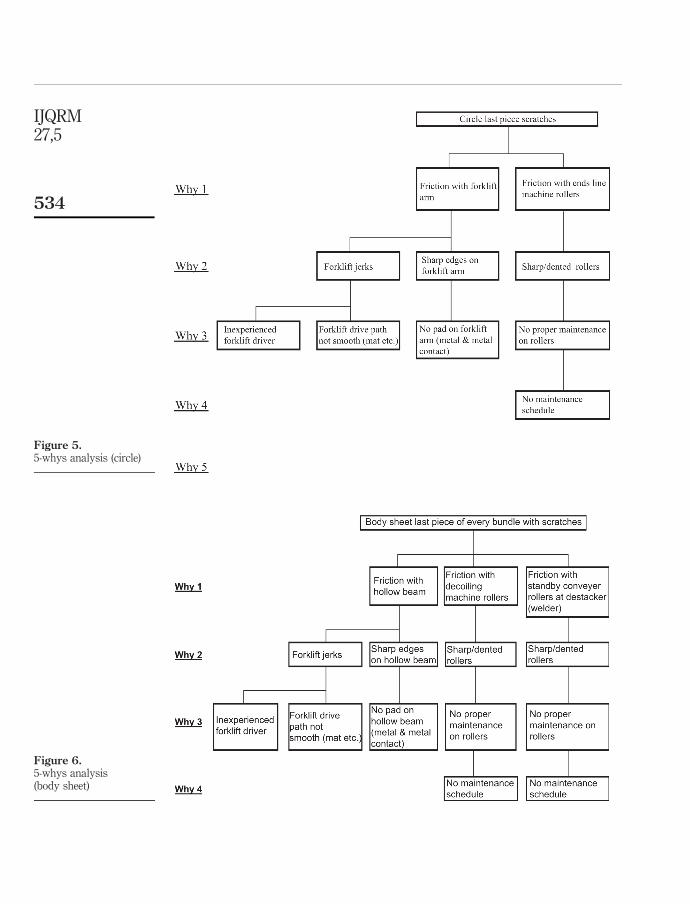
Figure 5.5-whys analysis (circle)
Figure 6.5-whys analysis(body sheet)
IJQRM27,5
534
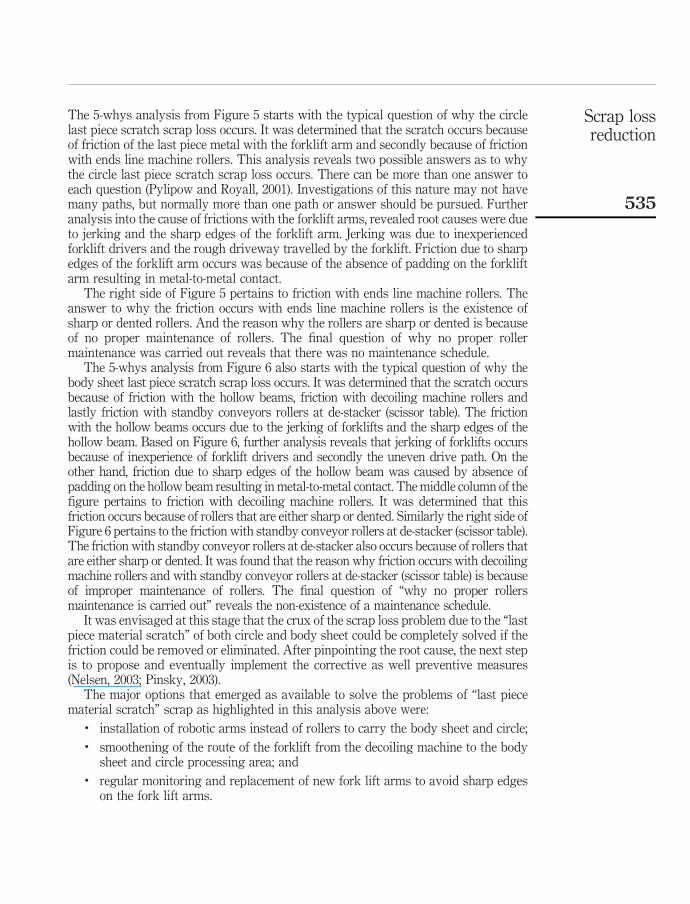
The 5-whys analysis from Figure 5 starts with the typical question of why the circlelast piece scratch scrap loss occurs. It was determined that the scratch occurs becauseof friction of the last piece metal with the forklift arm and secondly because of frictionwith ends line machine rollers. This analysis reveals two possible answers as to whythe circle last piece scratch scrap loss occurs. There can be more than one answer toeach question (Pylipow and Royall, 2001). Investigations of this nature may not havemany paths, but normally more than one path or answer should be pursued. Furtheranalysis into the cause of frictions with the forklift arms, revealed root causes were dueto jerking and the sharp edges of the forklift arm. Jerking was due to inexperiencedforklift drivers and the rough driveway travelled by the forklift. Friction due to sharpedges of the forklift arm occurs was because of the absence of padding on the forkliftarm resulting in metal-to-metal contact.
The right side of Figure 5 pertains to friction with ends line machine rollers. Theanswer to why the friction occurs with ends line machine rollers is the existence ofsharp or dented rollers. And the reason why the rollers are sharp or dented is becauseof no proper maintenance of rollers. The final question of why no proper rollermaintenance was carried out reveals that there was no maintenance schedule.
The 5-whys analysis from Figure 6 also starts with the typical question of why thebody sheet last piece scratch scrap loss occurs. It was determined that the scratch occursbecause of friction with the hollow beams, friction with decoiling machine rollers andlastly friction with standby conveyors rollers at de-stacker (scissor table). The frictionwith the hollow beams occurs due to the jerking of forklifts and the sharp edges of thehollow beam. Based on Figure 6, further analysis reveals that jerking of forklifts occursbecause of inexperience of forklift drivers and secondly the uneven drive path. On theother hand, friction due to sharp edges of the hollow beam was caused by absence ofpadding on the hollow beam resulting in metal-to-metal contact. The middle column of thefigure pertains to friction with decoiling machine rollers. It was determined that thisfriction occurs because of rollers that are either sharp or dented. Similarly the right side ofFigure 6 pertains to the friction with standby conveyor rollers at de-stacker (scissor table).The friction with standby conveyor rollers at de-stacker also occurs because of rollers thatare either sharp or dented. It was found that the reason why friction occurs with decoilingmachine rollers and with standby conveyor rollers at de-stacker (scissor table) is becauseof improper maintenance of rollers. The final question of “why no proper rollersmaintenance is carried out” reveals the non-existence of a maintenance schedule.
It was envisaged at this stage that the crux of the scrap loss problem due to the “lastpiece material scratch” of both circle and body sheet could be completely solved if thefriction could be removed or eliminated. After pinpointing the root cause, the next stepis to propose and eventually implement the corrective as well preventive measures(Nelsen, 2003; Pinsky, 2003).
The major options that emerged as available to solve the problems of “last piecematerial scratch” scrap as highlighted in this analysis above were:
. installation of robotic arms instead of rollers to carry the body sheet and circle;
. smoothening of the route of the forklift from the decoiling machine to the bodysheet and circle processing area; and
. regular monitoring and replacement of new fork lift arms to avoid sharp edgeson the fork lift arms.
Scrap lossreduction
535
However, although the methods (from (1) to (3) above could possibly reduce theproblem encountered in XYZ, they do require high investments. Since leanmanufacturing philosophy emphasises simple, uncomplicated and little or zeroinvestment approaches to eliminate waste, the methods identified above are lessdesirable. The appropriate solution to reduce the scrap problem therefore requires deepthought and thorough consideration of all the possible solutions. Normally a team isgathered and brainstorming is carried out to find out as many solutions as possible(Nelsen, 2003; Pinsky, 2003). Subsequently, after much brain-storming, a simple yettaken-for-granted layman’s approach surfaced, i.e. to place dummy sheets below thelast piece of the each bundle to prevent friction between the last piece of the material inthe bundle and factors identified in the 5-why analysis. The preventive cum correctiveaction implemented were as follows:
(1) Overall preventive cum corrective action – preventive action is morepermanent in nature and will prevent and thus eliminate defects. Therefore,the central “why” question essential to be answered by this study was “how toeliminate the friction to the circle last piece material and body sheet last piecematerial?” The following preventive actions are implemented to eliminate thedefect by eliminating the friction between the body sheet last piece material andthe circle last piece material with a hollow beam, decoiling machine rollers,standby conveyer rollers and forklift arm:. Dummy sheets are to be placed on bottom of body sheet bundle at decoiling
line to protect the last piece. All friction between last piece and rollers/forkliftarm will only damage the dummy piece. Dummy piece to be removed at endsline/welder’s de-stacker and recycled.
. Pallets are to be used for stacking of circle (from decoiling to ends line) toavoid direct contact with forklift arm and rollers; 1 inch solid wood palletsare to be used as transportation for pallet.
The dummy sheets to be used are obtained from existing scrapped sheetsfrom the last piece material scratch scrap and other scrap causes like unevenmaterial from decoiling, round seam leak, Erichsen Test (destructive test)and Seam Cut (destructive test) as shown earlier. As a result of it, thecorrective action implemented did not cost any additional investment at all, aremarkable feat in root cause problem solving. Another remarkableachievement of this study was although the initial aim of this study was toreduce the scrap loss, the solution above permanently eliminates theoccurrence of last piece material scratch defect whereby there would be zeroscrap thereafter and the dummy pieces are recycled after every bundle iscompletely processed.
The other corrective and preventive actions were also implemented forthe why questions asked in Figures 5 and 6.
(2) Overall corrective action based on the 5-why analysis implemented to reducethe defect are:. Update the autonomous maintenance schedule to include inspection on
rollers at decoiling line and standby conveyer at welder and ends line.Autonomous maintenance refers to activities designed to involve operatorsin maintaining their own equipment, independent of the maintenance
IJQRM27,5
536

department. Adequately briefed and trained operators are required toperform this task.
. Forklift drivers are briefed and trained to drive on the available smooth path.Appropriate lessons are given to them to create sensitiveness on theirdriving method to avoid jerks.
2.7 Post-implementation resultsThe last piece scratches for both body sheet and circles have been eliminated (100 percent) on implementation of the above-stated preventive actions. Even in Aisin Seiki, aToyota Group company that manufactures mattresses, one of their remarkableachievements in reducing waste was a project which redesigned the way edging tapewas attached to the mattresses, thereby reducing defect rate by 90 per cent (Bowen andSpear, 1999). There was zero scrap resulting from the Last Piece Material Scratchdefect in the months of June, July, August and September 2008 resulting in zero loss indollar value. The result of four months data on implementation is shown in the ParetoAnalysis in Figure 7.
In a continuous improvement environment, there is no end to efforts ofimprovements and thus requires one to pay attention to the next nine defects causesor the “trivial causes” after solving the top defect (Amar, 2005). The thrust of theoperation team in XYZ after this success would be to apply the same techniques usedto eliminate the top defect to reduce if not eliminate the rest of the defects too.
ConclusionThe application of the 5-whys analysis provides a fact based and structured approachto problem identification and correction that focuses on not only reducing defects butalso in eliminating them. In practice, most lean-based manufacturing firms aim toreduce the various wastes in their operations rather than to eliminate them. This studyproves that sound understanding of the manufacturing operations and extensiveexplorations of all possible solutions reduces non-value-adding activities or wasteusing the 5-whys analysis. Permanent solutions that eliminate rather than reduce
Figure 7.Last piece material scratch
(November 2007-May2008)
Scrap lossreduction
537

waste could be discovered and implemented successfully as well. In addition, it wasalso evident that inexpensive or zero cost solutions could be implemented to eliminatewaste or defects. This approach can be extended to other areas in manufacturingindustry to help improve the overall equipment efficiency, breakdown, time-loss,customer complaints, etc. The 5-why analysis approach is indeed a powerful tool thathave enabled many companies to reduce their manufacturing cost such as illustrated inthis study. Companies that employ TPS’s lean-based manufacturing techniques likethe 5-why analysis have benefited among others in reduced lead times, just-in-timemanagement, decreased costs, levelled production, continuous flow production,increased job satisfaction for employees, higher productivity, lower inventories andhigher quality levels (Kasul and Motwani, 1997). This study is also a response to thestudy by Tracy and Knight (2008) who observed the apparent gap between theory andpractice of lean operations management. In particular their observation is thatacademic faculties are pre-occupied with teaching, and research largely unrelated tolean management practice and typically not trained in lean management was partly thedrive that inspired two of the co-authors of this study to work together with apractitioner to solve a practical lean management problem.
References
Alukal, G. (2007), “Lean kaizen in the 21st century”, Quality Progress, Vol. 40 No. 8, pp. 69-70.
Amar, R.T. (2005), “Quality improvement of complex systems”, ASQ World Conference onQuality and Improvement Proceedings, ABI/INFORM Global, Vol. 59, pp. 487-93.
Bowen, H.K. and Spear, S. (1999), “Decoding the DNA of the Toyota production system”,Harvard Business Review, September-October, pp. 96-106.
Brown, A., Eatock, J., Dixon, D., Meenan, B.J. and Anderson, J. (2008), “Quality and continuousimprovement in medical device manufacturing”, The TQM Magazine, Vol. 20 No. 6,pp. 541-55.
Burton, T. and Boeder, S. (2003), The Lean Extended Enterprise: Moving beyond the FourWalls toValue Stream Excellence, J. Ross Publishing, Bacon Raton, LA.
Doggett, A.M. (2005), “Root cause analysis: a framework for tool selection”, The QualityManagement Journal, Vol. 12 No. 4, pp. 34-45.
Dolcemascolo, D. (2006), Problem Solving Tools Fishbone Diagram Five Whys Why’s, EMSConsulting Group, February 1, available at: www.emsstrategies.com/dd020106article.html(accessed 31 October 2008).
Goldratt, E.M. (1994), It’s Not Luck, North River Press, Great Barrington, MA.
Hall, R., Knights, P. and Daneshmend, L.K. (2000), “Pareto analysis and condition-basedmaintenance of underground mining equipment”, Trans. IMM, Section A: MiningIndustry, Vol. 109, pp. A14-A22.
Hobbs, D.P. (2004), Lean Manufacturing Implementation, 1st ed., Ross Publishing, Boca Raton,FL.
Ishikawa, K. (1982), Guide to Quality Control, 2nd rev. ed., Asian Productivity Organization,Tokyo.
Kasul, R.A. and Motwani, J.G. (1997), “Successful implementation of TPS in a manufacturingsetting: a case study”, Industrial Management & Data Systems, Vol. 97 No. 7, pp. 274-9.
Mizuno, S. (1988), Management for Quality Improvement: The Seven New QC Tools, ProductionPress, Cambridge, MA.
IJQRM27,5
538
Nave, D. (2002), “How to compare six sigma, lean and the theory of constraints”, QualityProgress, Vol. 35 No. 3, p. 73.
Nelsen, D. (2003), “To find the root cause, that’s why”, Quality Progress, Vol. 36 No. 9, p. 104.
Ohno, T. (1988), Toyota Production System: Beyond Large-scale Production, Productivity Press,Cambridge, MA, p. 3.
Pinsky, D. (2003), “Failure analysis of electronics assemblies”, Electronic Packaging &Production, Vol. 43 No. 2, pp. 26-9.
Pylipow, P.E. and Royall, W.E. (2001), “Root cause analysis in a world-class manufacturingoperation”, Quality, Vol. 40 No. 10, pp. 66-70.
Ransom, D.L. (2008), Root Cause Failure Analysis: The Human Factor, TurbomachineryInternational, May/June, available at: www.turbomachinerymag.com (accessed 21 October2008).
Rooney, J.J. and Vanden Heuvel, L.N. (2004), “Root cause analysis for beginners”, QualityProgress, Vol. 37 No. 7, pp. 45-53.
Tracy, D.L. and Knight, J.E. (2008), “Lean operations management: identifying and bridging thegap between theory and practice”, The Journal of American Academy of Business, Vol. 12No. 2, pp. 8-14.
Womack, J. and Jones, D. (1996), Lean Thinking: Banish Waste and Create Wealth in YourCooperation, Simon and Schuster, New York, NY.
Zhu, Z. and Meredith, P.H. (1995), “Defining critical elements in JIT implementation: a survey”,Industrial Management & Data Systems, Vol. 95 No. 8, pp. 21-8.
Further reading
Bingham, T. (2005), “System reliability through fault tree analysis”, ASQ World Conference onQuality and Improvement Proceedings. ABI/INFORM Global, Vol. 59, pp. 361-70.
Lau, R.S.M. and Anderson, C.A. (1998), “A three-dimensional perspective of total qualitymanagment”, International Journal of Quality & Reliability Management, Vol. 15 No. 1,pp. 85-98.
Tan, C.M. and Raghavan, N. (2007), “Root cause analysis based maintenance policy”,International Journal of Quality & Reliability Management, Vol. 24 No. 2, pp. 203-26.
Zeng, K., Stierman, R., Abbott, D. and Murtuza, M. (2006), “The root cause of black pad failure ofsolder joints with electroless Ni/immersion gold plating”, Journal of OperationManagement, Vol. 58 No. 6, pp. 75-9.
About the authorsUthiyakumar Murugaiah holds a Bachelor of Engineering (Aerospace) Honours degree fromUniversity Putra Malaysia and a Master of Engineering in Manufacturing Management fromUniversity of South Australia. He has served as Manufacturing Process Engineer in SGS ONSemiconductor (previously known as Motorola) and later as a Quality Engineering Manager inUMS Semiconductor Pte Ltd. Currently he is working as an Engineering Consultant with AIAutomation Sdn Bhd. He has been trained in various quality and process improvementmethodologies in six sigma, lean manufacturing, ISO 9000:2000, and QS 9000, etc. He hassuccessfully implemented many quality and process improvement projects both during hisprevious employment and his current consulting clients’ operations resulting in significant costand efficiency improvement. Uthiyakumar Murugaiah is the corresponding author and can becontacted at: [email protected]
Scrap lossreduction
539

Samuel Jebaraj Benjamin is a Lecturer at the Faculty of Management, Multimedia University.He is an accounting and management lecturer at the Faculty of Management, MultimediaUniversity, Cyberjaya Campus, Cyberjaya, and State of Selangor, Malaysia. He holds a Diplomain Accounting from the Malaysian Polytechnic, Bachelor of Science in Applied Accounting(Honours) from the Oxford Brookes University, Masters in Business Administration fromUniversity of East London and is currently pursuing his PhD at the Multimedia University. He isalso member of the Association of Chartered Certified Accountants (UK). He has served in twointernational companies: the first Shell Shared Services Sdn Bhd and Panasonic Malaysia SdnBhd, a top Japanese manufacturer of electronic and electrical company, prior to his tenure inMultimedia University.
M. Srikamaladevi Marathamuthu is a Lecturer at the Faculty of Management, MultimediaUniversity. She is an accounting information systems and management lecturer at the Faculty ofManagement, Multimedia University, Cyberjaya Campus, Cyberjaya, State of Selangor,Malaysia. She holds a Diploma in Computer Science and Advanced Diploma in Computer Sciencefrom the University of Coventry, Bachelor of Computer and Information Science from theUniversity of South Australia, Australia, and Master of Information Technology from theCharles Sturt University, Australia, and is currently pursuing her PhD at the MultimediaUniversity. She has served at Help International College of Malaysia for ten years in variousportfolios prior to her tenure in Multimedia University.
Saravanan Muthaiyah is the Assistant Head, IT Management Unit and Deputy Dean at theFaculty of Management, Multimedia University. He is senior lecturer in Information Systems atFaculty of Management, Multimedia University, Cyberjaya Campus, Cyberjaya, and State ofSelangor, Malaysia. He holds a PhD from George Mason University. His areas of interest inresearch are management accounting, semantic web services, semantic web architecture,semantic matching algorithms, SOA, secure wen services, SWRL, semantic web rule language,ontology mapping, enterprise architecture, knowledge management, systems engineering,accounting information systems design and controls.
IJQRM27,5
540
To purchase reprints of this article please e-mail: [email protected] visit our web site for further details: www.emeraldinsight.com/reprints
Related Documents