transport.gov.scot Scottish Transport Statistics No. 39 2020 edition A National Statistics Publication for Scotland

Welcome message from author
This document is posted to help you gain knowledge. Please leave a comment to let me know what you think about it! Share it to your friends and learn new things together.
Transcript
transport.gov.scot
Scottish Transport Statistics
No. 39 2020 edition
A National Statistics Publication for Scotland

Scottish Transport Statistics
No 39
2020 Edition
A National Statistics publication for Scotland
1
Brief extracts from this publication may be reproduced, provided that Scottish Transport Statistics is fully acknowledged as the source.
Proposals for larger extracts should be addressed to the enquiries address below.
Conventions
Symbols used: The following symbols are used throughout:
.. not available
- or 0 nil or less than half the final digit shown (NB: these are used interchangeably)
break in series
Rounding: In some tables, where figures have been rounded independently, the sum of constituent items may not always appear to agree exactly with the total shown.
Enquiries and suggestions
Enquiries about the statistics in this publication should generally be made to the relevant producer body as indicated in the Notes, Definitions and Sources sections of the publication.
Other enquiries (such as about the availability of other editions) should be made to:
Mr Andrew Knight
Transport Analytical Services
Transport Scotland
Victoria Quay
EDINBURGH EH6 6QQ
Telephone: 0131 244 7256
E-mail: [email protected]
Feedback on the usefulness of this publication including suggestions for improvement be addressed to the above address.
Web version of the publication
Transport Scotland Statistics publications and Excel spreadsheet versions of the tables may be found on the Transport Scotland Website. Go to: https://www.transport.gov.scot/our-approach/statistics#42763
Updated versions of some of the tables and charts in this edition will be made available, in due course.
2
CONTENTS Page
Preface 5
Detailed list of statistical tables 6
Summary Transport Statistics including Historical Series 14
Commentary and statistical tables:
1. Road transport vehicles 36
2. Bus and coach travel 58
3. Road freight 72
4. Road network 80
5. Road traffic 88
6. Injury road accidents 104
7. Rail services 110
8. Air transport 128
9. Water transport 144
10. Finance 174
11. Personal and cross-modal travel 184
12. International comparisons 206
13. Environment 216
Notes and definitions 233
Annex 1: Mid-year population estimates for 2019 322
Annex 2: Areas covered by Operating Companies 323
Errors in the previous edition 324
Recent Social and Economic Research Reports 325
Index to tables in Chapters 1 to 13 330
Transport Scotland Statistics publications 335
National Statistics publication information 338
3

4
PREFACE Introduction
This is the 2020 edition of Scottish Transport Statistics, and is the thirty ninth publication in the series. The publication presents a comprehensive statistical picture of transport activity and covers a wide range of topics.
This is a National Statistics publication.
This publication presents a range of both National Statistics and Official Statistics. National Statistics are certified as meeting the high professional standards within the UK Statistics Authority’s Code of Practice for Official Statistics: http://www.statisticsauthority.gov.uk/assessment/code-of-practice/index.html.
Official Statistics follow the Code of Practice as closely as possible but have not been certified as Code compliant. They are fit for purpose and are of sufficient quality to meet user needs. This publication also includes statistics produced out with the Scottish Government. Such statistics are marked by the relevant source. Users should be aware that although we did not directly produce these, we believe them to be a good source hence their inclusion within the publication.
The Structure of the Publication
The Summary section provides a compact view of the key findings and trends over the past 10 years and includes some comparisons with the figures for Great Britain (or the UK) and some longer-term trends. Longer-term trends are included in tables on the Transport Scotland website.
This is followed by 13 chapters, each with a graphical summary page, statistical commentary and corresponding tables.
A Notes, Definitions and Sources section then provides information users should be aware of when using the statistics, descriptions of specific terms used and a note on the sources of statistics used when compiling the publication.
Chapter 12 looks at International Comparisons, comparing Scotland with some EU countries.
Finally, there are some other short sections covering:
recent transport research projects; other Transport Statistics publications; and the Transport Scotland website - where updated versions of some of this edition's tables
and charts can be found.
We would welcome comments from users on the publication and/or suggestions for new data sources that could be included in future publications. Comments can be provided to us at the address below:
Transport Analytical Services
Transport Scotland
Victoria Quay
Edinburgh
EH6 6QQ
Tel: 0131 244 7256
5
DETAILED LIST OF STATISTICAL TABLES AND MAPS
Note: Most tables provide a time series of figures which are identified in the table headings rather than in the title of the table. Where a table relates to a single year, the relevant year is included in the title. Tables providing main figures for a single year, with a few figures of earlier years appear as single year tables in this list.
Tables of figures, and whole chapters, which are outwith the scope of National Statistics are identified by (*).
Table Page
Road transport vehicles
1.1 New registrations by taxation group, body type and method of propulsion. 42
1.2 Vehicles licensed at 31 December, by taxation group, body type and method of propulsion.
42
1.3 Vehicles licensed at 31 December 2019, by Council and taxation group. 44
1.4 Taxi and private hire cars and drivers licensed by local authority area, 2019. (*) 45
1.5 Vehicles licensed at 31 December 2019, by taxation group, and by year of first registration.
46
1.6 Average age of vehicles licensed at 31 December, by taxation group. 46
1.7 Private and light goods vehicles licensed at 31 December, by cylinder size. 47
1.8 Heavy goods vehicles licensed at 31 December, by gross weight. 47
1.9 Public transport vehicles licensed at 31 December: by seating capacity. 47
1.10 Goods vehicle operators by licence type and number of vehicles specified. on the licence, 2019. (*)
48
1.11 The 20 most popular new cars sold in Scotland, 2019. (*) 48
1.12 Road vehicle testing scheme (MOT). (*) 49
1.13 Driving licence tests, DVLA receipts. (*) 49
1.14 Practical Driving Test - Pass Rate at Test Centres 2019-20. (*) 50
1.16 People who hold a full car driving licence by age and sex, annual net. household income and urban/rural classification, 2019.
51
1.17 People who hold a full driving licence by sex and age. 52
1.19 Households with a car available for private use by number of cars. 53
1.20 Households with a car available for private use by household type, annual net household income, urban/rural classification and number of vehicles, 2019.
53
1.21 Number of Blue Badges on issue at 31 March. (*) 54
1.22 Motor vehicle offences recorded by the police by type of offence. 55
1.23 Households with a car or van available for private use by gender, 2011. 56
1.24 Households with a car or van available for private use, 2011. 56
1.25 Households with a car or van available for private use by disability and ethnicity, 2011.
56
6
Bus and coach travel
2.1a Public Service Vehicle Characteristics (local operators). 64
2.1b Number of disability accessible or low-floor buses used as Public Service. Vehicles in Scotland (Local Operators).
64
2.2 Passenger journeys (a) on local bus services (b) by region for local bus services.
65
2.3 Vehicle kilometres on local bus services by (a) type of service (b) per head of population (c) by region for local bus services.
66
2.4 Staff employed. 67
2.5 Local bus fare indices. 67
2.6 Operating costs per vehicle kilometre for local bus services. 67
2.7 Operating costs per passenger journey for local bus services. 67
2.8 Passenger revenue on local bus services. 68
2.9 Government support on local bus services by type of support. 68
2.10 Bus use the previous day (adults) by characteristic. 69
2.11 Users views on local bus services. 70
2.12 Possession of concessionary fare pass for all adults aged 16+. 70
2.13 Concessionary fare passes issued to older and disabled people. 71
2.14 Concessionary fare passes issued to older and disabled people, Nov 2020. 71
Road freight
3.1 Goods lifted by UK HGVs, by origin and destination of journey. 76
3.2 Goods lifted by UK HGVs, in Scotland, with destinations within the UK, by length of haul, 2019.
76
3.3 Goods moved by UK HGVs by destination, and the economy's road freight intensity.
76
3.4 Goods lifted or moved by UK HGVs, entering or leaving Scotland, to or from rest of UK, by origins and destinations of journeys, 2019.
77
3.5 Goods lifted or moved by UK HGVs, for journeys within the UK with a Scottish origin or destination, by commodity, 2019.
78
3.6 Goods lifted or moved by UK HGVs, entering or leaving Scotland, to or from outwith UK, by origins and destinations of journeys, 2019.
79
3.7 Goods lifted or moved by UK HGVs, for journeys entering or leaving the UK, by commodity, 2019.
79
3.8 Average freight lifted by UK HGVs per year (2015-2019): Journeys with UK origins and destinations which either started or ended in Scotland.
79
Road network (*)
4.1 Public road lengths (as at 1 April) by class, type and speed limit. 82
7
4.2 Public road lengths (as at 1 April) by Council and class, 2019-20. 83
4.3 Trunk road constructed/re-surfaced etc. 84
4.4 Trunk road constructed/re-surfaced etc, by unit: (a) 2018-19, and (b) 2019-20. 84
4.5 Trunk road network: residual life (years). 85
4.6 Local authority road network condition, 2019-20. 86
Road traffic
5.1 Traffic by road class and type. (*) 93
5.2 Traffic on major roads (by class/type) and minor roads (by type) by vehicle type, 2019. (*)
94
5.3 Traffic on major roads, minor roads and all roads by vehicle type 94
5.4 Traffic on major roads (by class / type) and on minor roads, by Council, 2019. (*) 95
5.5 Traffic on trunk roads, local authority roads, and all roads by Council area. (*) 96
5.6 Average daily traffic flows at selected automated traffic classifier sites, by month, 2019. (*)
99
5.7a Average daily traffic flows for selected key points: (a) average daily flows, peak hourly flows and percentages of HGVs, 2019 and (b) average daily traffic flows for selected key points. (*)
100
5.8 Car drivers journeys – whether delayed by traffic congestion and, if so, how much time was lost: 2017-19.
102
5.9 Congestion delays experienced by drivers and delays experienced by bus passengers.
103
5.10 Petrol and diesel consumption of road vehicles. (*) 103
Injury road accidents
6.1 Accidents by type of road and severity. 107
6.2 Accidents by police division and local authority area. 107
6.3 Vehicles involved by type of vehicle. 108
6.4 Child casualties and all casualties, by severity; and the slight casualty rate. 108
6.5 Casualties by mode of transport and age group, 2019. 108
6.6 Costs of injury accidents by type of road, and of damage only accidents. 108
Rail services (*)
7.1 ScotRail passenger services, journeys and distance. 116
7.2 Passenger traffic originating in Scotland: journeys and revenue. 116
7.3 Cross-border passenger traffic originating outwith Scotland: journeys and revenue. 117
7.4 Passenger journeys using national rail tickets to, from or within Scotland, 2018-19.
117
8
7.5 Distances travelled by passengers to Aberdeen, Edinburgh and Glasgow, 2018-19.
117
7.6a Cross border rail passenger journeys starting or ending in Scotland. 118
7.6b
7.6c
Rail passenger journeys within Scotland.
Rail passenger journeys wholly within Scotland, using national rail tickets by local authority areas, of origin and destination, 2019-20.
118
119
7.7 Passenger journeys, to or from the main stations in Scotland, 2019-20. 120
7.8 Passenger journeys, to or from stations in Scotland which have opened (or re-opened) since 1970.
121
7.9 Rail punctuality: Public Performance Measures – for all services. 123
7.10 ScotRail services: arrival times at final destinations. 123
7.11 Rail passenger satisfaction : National Passenger Survey. 124
7.12 Freight traffic lifted in Scotland by destination and by commodity. 125
7.13 Freight traffic with a destination in Scotland by origin (where lifted) and by commodity.
125
7.14 Lines open for traffic. 126
7.15 Number of stations. 126
7.16 Number of passenger stations by local authority, 2018-19. 126
7.17 Strathclyde Passenger Transport Executive – Glasgow Subway. 126
7.18 Railway accidents. 127
7.19
7.20
Railway fatalities by local authority and category, 2019.
Views on train services of those who used them in the last month, 2016.
127
127
Air transport (*)
8.1 Summary of air transport. 131
8.2 Passengers on selected domestic routes, to/from certain Scottish airports. 132
8.3 International Air Passenger Traffic to and from the main Scottish international airports.
136
8.4 Passenger traffic on selected international routes, to and from Scotland’s main airports, 2019.
137
8.5 The 10 international airports with the largest numbers of passenger journeys for flights directly to and from Scotland’s main airports, 2019.
138
8.6 Terminal passenger traffic by origin/destination, 2019. 138
8.7 Terminal air passengers by airport, international/domestic and type of service, 2019.
138
8.8 Punctuality of flights at Edinburgh and Glasgow airports. 139
8.9 Aircraft movements, by airport and type of movement, 2019. 140
8.10 Air transport movements by airport, type of service and operator, 2019. 140
8.11 Air transport movements. 141
9
8.12 Total aircraft movements, by airport. 141
8.13 Freight carried by airport. 142
8.14 Characteristics of terminal passengers, 2018. 143
8.15 Mode of surface transport used to arrive at the airport. 143
8.16 Origins/destinations of terminating passengers, 2018. 143
Water transport
9.1 Waterborne freight lifted, discharged and moved, by type of traffic. 149
9.2 Foreign and domestic freight traffic at Major Scottish ports. 151
9.3 Foreign and domestic freight traffic by port: inwards and outwards. 152
9.4 Foreign and domestic freight traffic by port: bulk fuel and other traffic. 153
9.5 Foreign and domestic traffic by port and mode of appearance (major ports only) 154
9.6 Foreign and domestic freight traffic at the major ports by type of traffic (a) 2018 (b) 2019.
155
9.7 All traffic at the major ports by mode of appearance and commodity, 2019. 156
9.8 Major ports traffic by cargo category and country of loading and unloading, 2019.
158
9.9 Foreign and coastwise container and roll-on traffic by type. 160
9.10 Inland waterway freight traffic lifted and moved. 160
9.11 Inland waterway freight traffic lifted and moved by mode of appearance. 160
9.12 Total passengers and vehicles carried by operator. 162
9.13 Vehicle and passenger traffic between (a) Scotland and Northern Ireland and (b) Scotland and Europe.
164
9.14 Shipping services (a) Operators on subsidised routes and (b) local authority operators. (*)
166
9.15 Traffic on subsidised ferry services. (*) 167
9.16 Traffic on other major ferry routes. (*) 169
9.17 Reliability and punctuality of lifeline ferry services. (*) 172
9.18 HM Coastguard statistics: Search and rescue operations (Scotland). (*) 172
Finance
10.1 Expenditure on transport within the Scottish Ministers’ responsibility and expenditure on transport controlled by local authorities. (*)
178
10.2 Net expenditure on management and maintenance of motorways and trunk roads, by Operating Companies, 2018-19. (*)
179
10.3 Net revenue expenditure on roads and transport (excluding loan charges) by Councils, by type, 2019-20.
179
10.4 Service breakdown of local authority gross capital expenditure 2019-20. 180
10
10.5 Gross capital account expenditure on local authority roads and transport by Councils and Boards, by type, 2019-20.
180
10.6 Petrol and diesel prices and duties per litre (June), GB. 181
10.7 Transport components of the Retail Prices Index (2008=100), UK. 182
10.8 Average weekly household expenditure in Scotland on transport and vehicles.
182
Personal and cross-modal travel
11.10 Frequency of driving for people aged 17+, 2019. 191
11.11 Frequency of walking in the previous seven days (people aged 16+), 2019. 192
11.12 Frequency of driving for people aged 17+. 193
11.13 Frequency of walking in the previous seven days (people aged 16+). 193
11.14 Usual means of travel to usual place of work (in Autumn). 194
11.15 Average time taken to travel to usual place of work (in Autumn). 194
11.16 Usual means of travel to work (in Spring). 194
11.17 Employed adults (16+) – place of work: 2019. 194
11.18 Employed adults (16+) not working from home – usual method of travel to work: 2019.
196
11.19 Usual main method of travel to school, 2019. 197
11.21 Employed adults (16+) – place of work. 198
11.22 Employed adults (16+) not working from home – usual method of travel to work.
198
11.23 Usual main method of travel to school.. 198
11.24 Scottish residents’ visits abroad by means of leaving the UK and purpose of visit, 2019.
199
11.25 Scottish residents’ visits abroad by means of leaving the UK and area visited, 2019.
199
11.26 Scottish residents’ visits abroad by means of leaving the UK, purpose of visit and area visited.
200
11.27 Transport Model for Scotland: inter-zonal trips. 201
11.29 Passenger journeys made under concessionary fare schemes. 202
11.30 Traveline Scotland: telephone calls and website hits. (*) 204
11.31 Employed adults (16+) distance to place of work: 2011. 205
11.32 Employed adults (16+) mode of transport to place of work: 2011. 205
11.33 Employed adults (16+) distance to place of work by car/van availability: 2011. 205
11.34 All people aged 4 and over studying, distance to place of study by age: 2011. 205
11.35 All people aged 4 and over studying, mode of transport to place of study by distance: 2011.
205
11
12 International comparisons 210
Environment
13.1a Emissions of air pollutants by type of transport allocated to Scotland. (*) 221
13.1b Atmospheric concentrations of selected pollutants recorded at Air Quality Monitoring Stations. (*)
222
13.1c Number of active Air Quality Management Areas by pollutant and local authority. (*)
223
13.2 Emissions of greenhouse gases by type of transport allocated to Scotland. (*) 224
13.3 Emissions of greenhouse gases by Transport allocated to Scotland. (*) 224
13.4 Comparison of transport greenhouse gas emissions from Scotland and UK as a whole. (*)
224
13.5 UK Carbon Dioxide emissions: grams per passenger-kilometre: 2019. 225
13.6a Cars registered for the first time by CO2 emissions band. 226
13.6b Licensed cars by CO2 emissions band. 227
13.7 Ultra-low emission vehicles registered for the first time, quarterly. 228
13.8 Ultra-low emission vehicles licensed at the end of year, quarterly. 228
13.9 Number of new registrations by body type and propulsion type 2019. 229
13.10 Number of licensed vehicles by body type and propulsion type as at 31 December 2019.
229
13.11 ChargePlace Scotland: Total electric vehicle charge points by local authority boundary, 2017 to 2020.
230
13.12 ChargePlace Scotland: Monthly charging events and kWh drawn 2020 231
Figure Maps
3.1 Goods lifted by road; entering/leaving Scotland to / from rest of GB 2019. 75
5.1 Trunk roads : Network management. 92
5.2 Selected points to show average daily traffic flows, peak hourly flows and percentages of HGVs.
98
8.1 Terminal air passenger traffic, 2009 and 2019. 134
9.1 Foreign and domestic freight traffic by port. 150
9.2 Scottish ferry routes National Overview. 157
9.3 Scottish ferry routes South Western Scotland. 161
9.4 Scottish ferry routes Western Isles. 163
9.5 Scottish ferry routes Orkney and Shetland Islands. 165
Local Authorities as of 1 April 1996. 321
(*) this table, or this chapter, consists of figures which are outwith the scope of National Statistics
12
SUMMARY
Summary
TRANSPORT
Statistics
including
Historical
Series
13
SUMMARY
SUMMARY TRANSPORT STATISTICS
1. Introduction
This chapter highlights some of the main findings from Scottish Transport Statistics , and includes summary tables which provide longer term trends than those included in the individual chapters. This publication covers data up until 2019-20. As a result, the main effects of the COVID-19 pandemic and associated travel restrictions are not reflected in the data.
Throughout the pandemic, Transport Scotland has published weekly reports on transport trends across all main modes, which are available on the Transport Scotland website. Data which covers the pandemic will be published in future iterations of Scottish Transport Statistics.
2. The content of this chapter
This chapter covers the following topics: 3. Overview of travel in Scotland 4. Motor vehicles, traffic and road casualties 5. Public transport: bus, rail, air and ferry 6. Personal travel (e.g. driving, walking and cycling; travel to work and school) 7. Freight 8. Cross-border transport 9. Environment and emissions The tables, which appear at the end of the chapter, provide information on long-term trends in Scottish transport, including comparisons between Scotland and Great Britain.
3. Overview of travel in Scotland
In 2019-20, 502 million public transport journeys were made by bus, rail, air and ferry. This is a decrease on 517 million public transport journeys in 2018-19. Of these journeys, 73% were by bus, 19% by rail, 6% by air and 2% by ferry.
Two thirds of commuters said that they travelled to work by car or van in 2019, 12 per cent walked, 10 per cent went by bus, 5 per cent took a train and 3 per cent cycled.
Over the last five years, there have been increases in car traffic, and in air, rail and ferry passenger numbers. Conversely, the number of bus passengers decreased over the same time period. Over the same period, Scotland’s population increased by 2 per cent.
2014-15 2019-20 Change over 1 year
Change over 5 years
Car Traffic (m/veh km) on all roads 34,491 36,747 1.0% 6.5%
ScotRail Passengers (millions) 92.7 96.4 -1.4% 4.0%
Bus Passengers (millions) 414 366 -3.2% -11.6%
Air Passengers (millions) 24.1 28.9 -1.9% 19.9%
Ferry Passengers (millions) 9.7 10.4 1.4% 7.7%
Source: STS 2020, Table S1 except Traffic estimates from table 5.3.
14
SUMMARY
4. Motor vehicles, traffic and road casualties 4.1 Motor vehicles
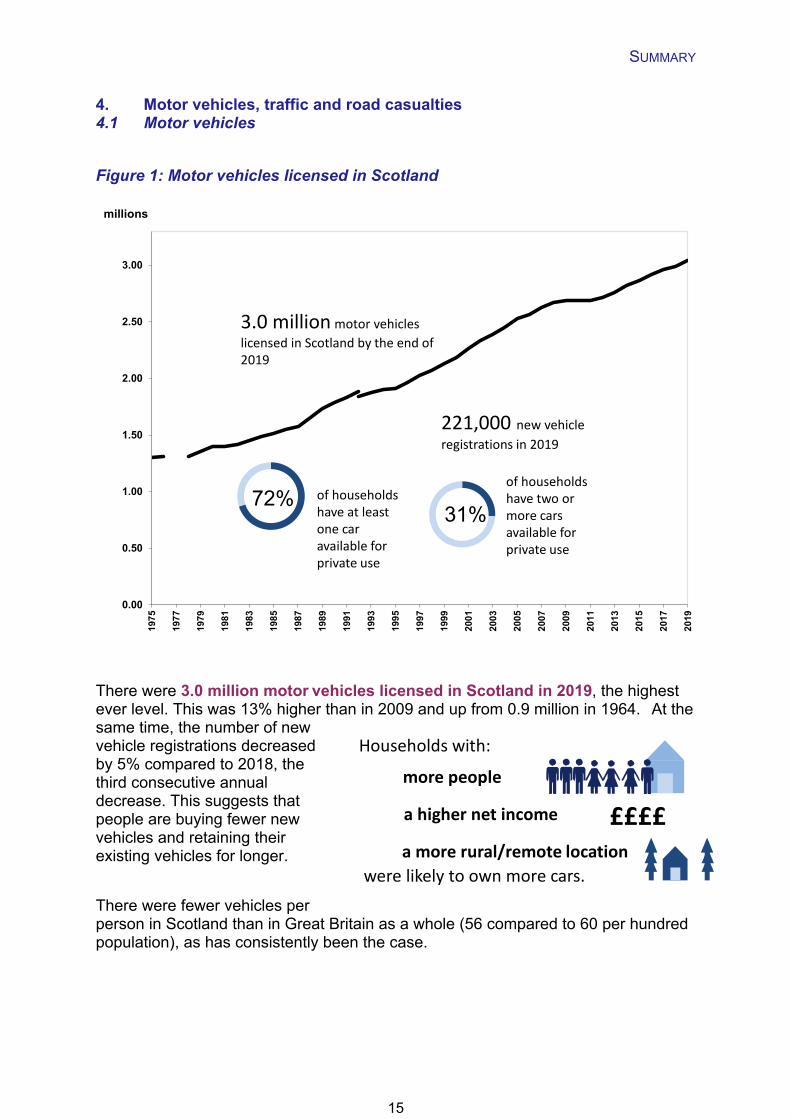
Figure 1: Motor vehicles licensed in Scotland
There were 3.0 million motor vehicles licensed in Scotland in 2019, the highest ever level. This was 13% higher than in 2009 and up from 0.9 million in 1964. At the same time, the number of new vehicle registrations decreased by 5% compared to 2018, the third consecutive annual decrease. This suggests that people are buying fewer new vehicles and retaining their existing vehicles for longer.
There were fewer vehicles per person in Scotland than in Great Britain as a whole (56 compared to 60 per hundred population), as has consistently been the case.
of households have at least
one car available for private use
0.00
0.50
1.00
1.50
2.00
2.50
3.00
1975
1977
1979
1981
1983
1985
1987
1989
1991
1993
1995
1997
1999
2001
2003
2005
2007
2009
2011
2013
2015
2017
2019
millions
3.0 million motor vehicles
licensed in Scotland by the end of 2019
221,000 new vehicle
registrations in 2019
of households have two or more cars available for private use
72% 31%
of householdshave at leastone caravailable for private use
Households with:
more people
a higher net income
a more rural/remote locationwere likely to own more cars.
££££
15
SUMMARY
4.2 The road network
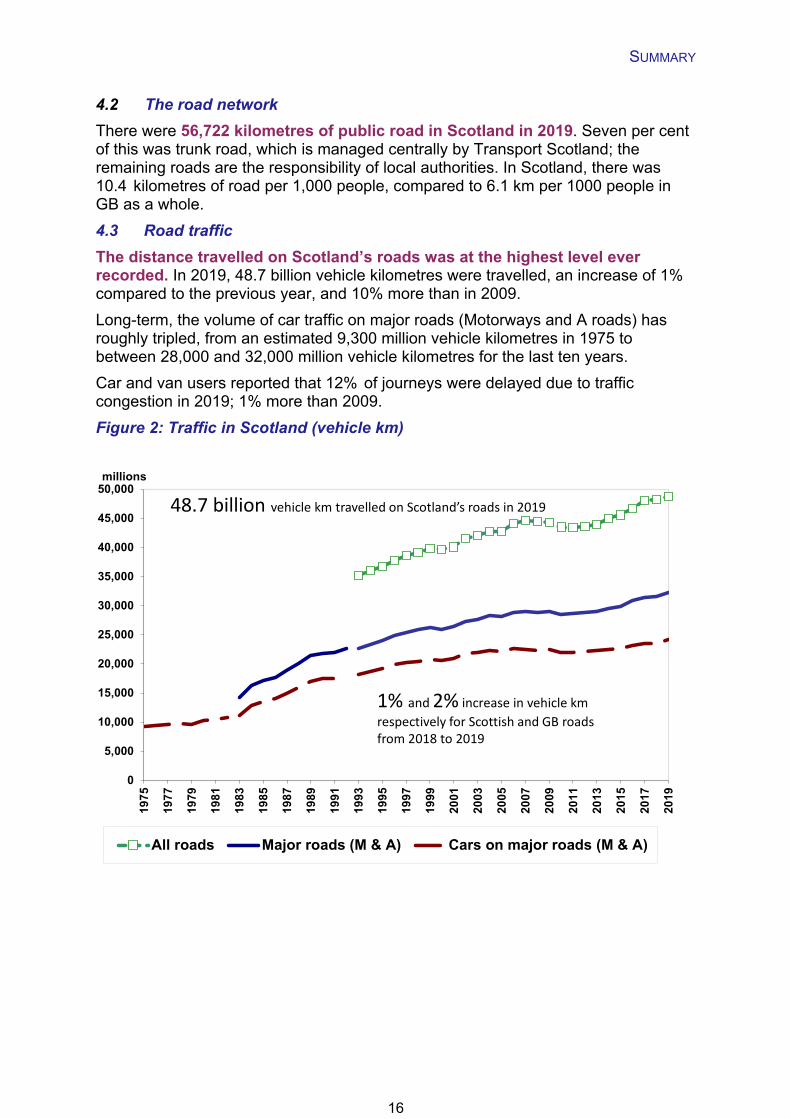
There were 56,722 kilometres of public road in Scotland in 2019. Seven per cent of this was trunk road, which is managed centrally by Transport Scotland; the remaining roads are the responsibility of local authorities. In Scotland, there was 10.4 kilometres of road per 1,000 people, compared to 6.1 km per 1000 people in GB as a whole.
4.3 Road traffic
The distance travelled on Scotland’s roads was at the highest level ever recorded. In 2019, 48.7 billion vehicle kilometres were travelled, an increase of 1% compared to the previous year, and 10% more than in 2009.
Long-term, the volume of car traffic on major roads (Motorways and A roads) has roughly tripled, from an estimated 9,300 million vehicle kilometres in 1975 to between 28,000 and 32,000 million vehicle kilometres for the last ten years.
Car and van users reported that 12% of journeys were delayed due to traffic congestion in 2019; 1% more than 2009.
Figure 2: Traffic in Scotland (vehicle km)
0
5,000
10,000
15,000
20,000
25,000
30,000
35,000
40,000
45,000
50,000
1975
1977
1979
1981
1983
1985
1987
1989
1991
1993
1995
1997
1999
2001
2003
2005
2007
2009
2011
2013
2015
2017
2019
millions
All roads Major roads (M & A) Cars on major roads (M & A)
48.7 billion vehicle km travelled on Scotland’s roads in 2019
1% and 2% increase in vehicle km
respectively for Scottish and GB roads from 2018 to 2019
16
SUMMARY
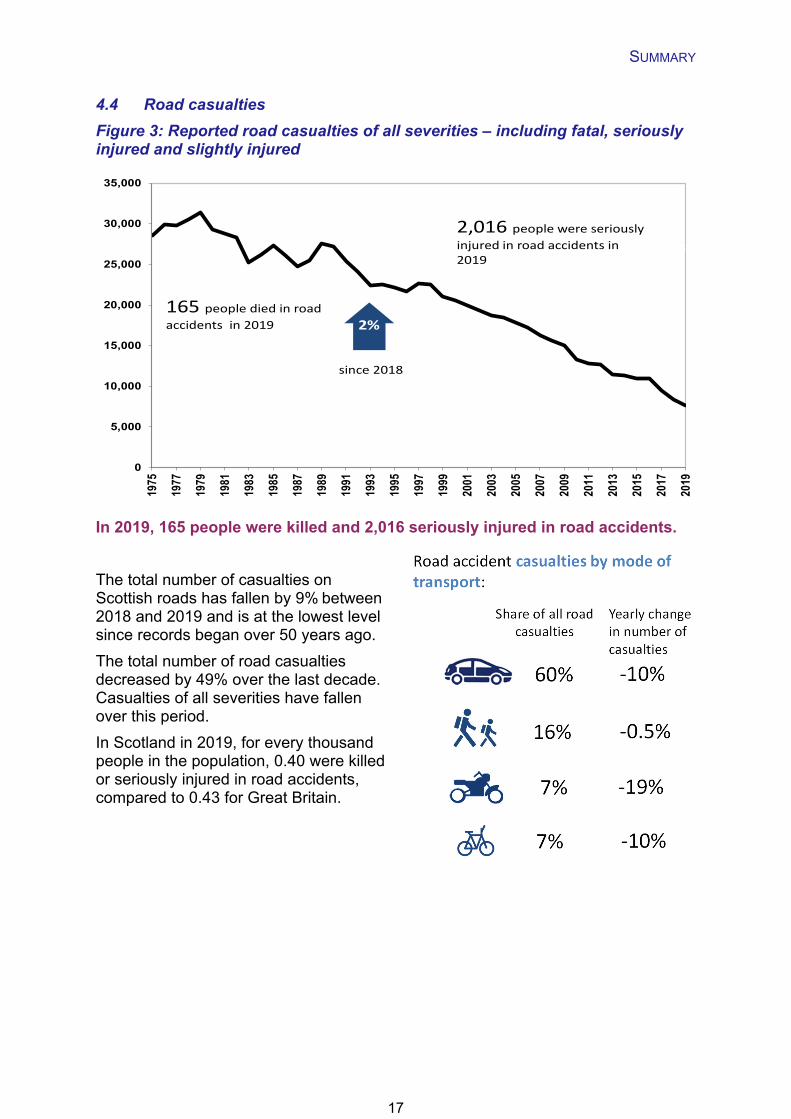
4.4 Road casualties
Figure 3: Reported road casualties of all severities – including fatal, seriously injured and slightly injured
In 2019, 165 people were killed and 2,016 seriously injured in road accidents.
The total number of casualties on Scottish roads has fallen by 9% between 2018 and 2019 and is at the lowest level since records began over 50 years ago.
The total number of road casualties decreased by 49% over the last decade. Casualties of all severities have fallen over this period.
In Scotland in 2019, for every thousand people in the population, 0.40 were killed or seriously injured in road accidents, compared to 0.43 for Great Britain.
0
5,000
10,000
15,000
20,000
25,000
30,000
35,000
1975
1977
1979
1981
1983
1985
1987
1989
1991
1993
1995
1997
1999
2001
2003
2005
2007
2009
2011
2013
2015
2017
2019
since 2018
165 people died in road accidents in 2019
2,016 people were seriously injured in road accidents in 2019
2%
0.8%
17
SUMMARY
5. Public transport: bus, rail, air and ferry
5.1 Local bus and rail services
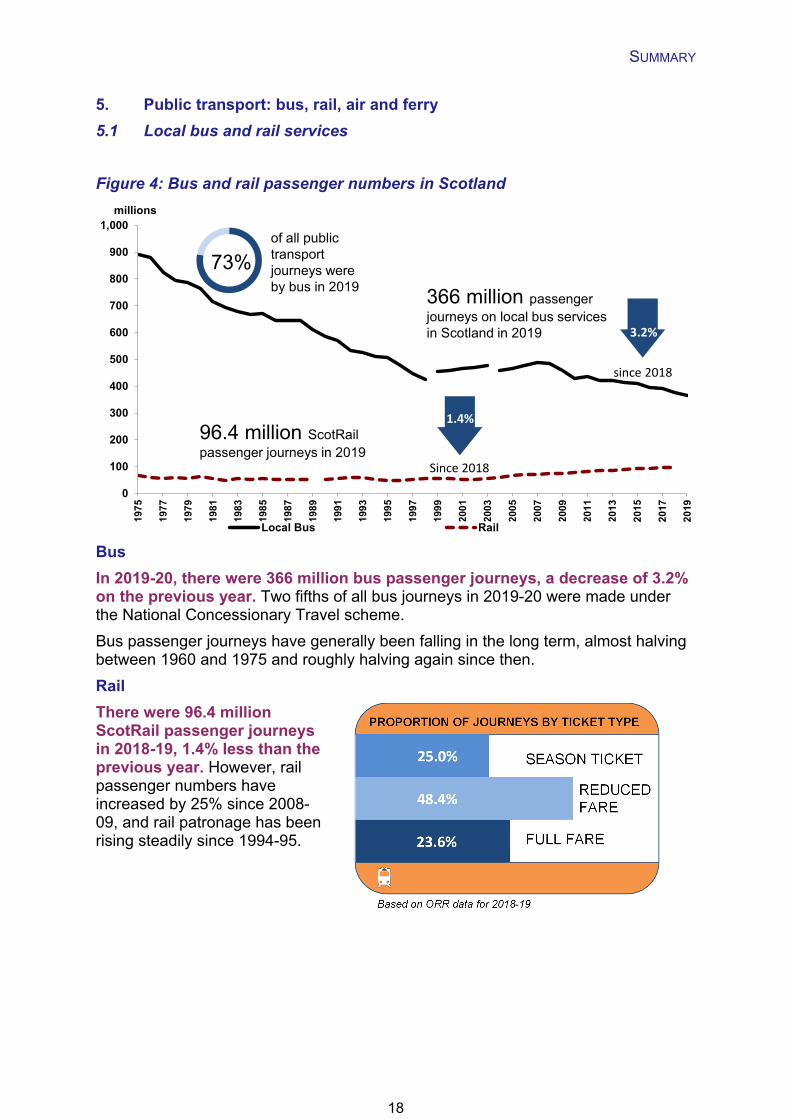
Figure 4: Bus and rail passenger numbers in Scotland
Bus
In 2019-20, there were 366 million bus passenger journeys, a decrease of 3.2% on the previous year. Two fifths of all bus journeys in 2019-20 were made under the National Concessionary Travel scheme.
Bus passenger journeys have generally been falling in the long term, almost halving between 1960 and 1975 and roughly halving again since then.
Rail
There were 96.4 million ScotRail passenger journeys in 2018-19, 1.4% less than the previous year. However, rail passenger numbers have increased by 25% since 2008-09, and rail patronage has been rising steadily since 1994-95.
0
100
200
300
400
500
600
700
800
900
1,000
197
5
197
7
197
9
198
1
198
3
198
5
198
7
198
9
199
1
199
3
199
5
199
7
199
9
200
1
200
3
200
5
200
7
200
9
201
1
201
3
201
5
201
7
201
9
millions
Local Bus Rail
366 million passenger journeys on local bus services in Scotland in 2019
96.4 million ScotRailpassenger journeys in 2019
of all public transport journeys were by bus in 2019
3.2%
73%
since 2018
Since 2018
1.4%
18
SUMMARY
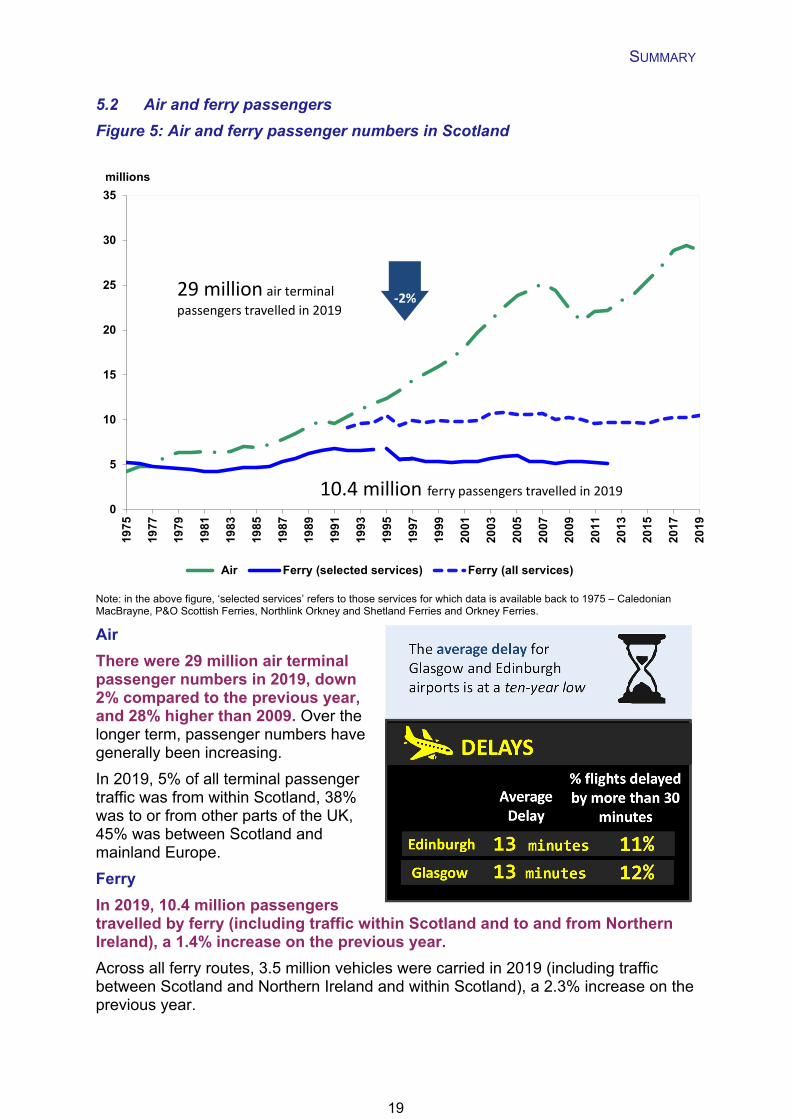
5.2 Air and ferry passengers
Figure 5: Air and ferry passenger numbers in Scotland
Note: in the above figure, ‘selected services’ refers to those services for which data is available back to 1975 – Caledonian MacBrayne, P&O Scottish Ferries, Northlink Orkney and Shetland Ferries and Orkney Ferries.
Air
There were 29 million air terminal passenger numbers in 2019, down 2% compared to the previous year, and 28% higher than 2009. Over the longer term, passenger numbers have generally been increasing.
In 2019, 5% of all terminal passenger traffic was from within Scotland, 38% was to or from other parts of the UK, 45% was between Scotland and mainland Europe.
Ferry
In 2019, 10.4 million passengers travelled by ferry (including traffic within Scotland and to and from Northern Ireland), a 1.4% increase on the previous year.
Across all ferry routes, 3.5 million vehicles were carried in 2019 (including traffic between Scotland and Northern Ireland and within Scotland), a 2.3% increase on the previous year.
0
5
10
15
20
25
30
35
1975
1977
1979
1981
1983
1985
1987
1989
1991
1993
1995
1997
1999
2001
2003
2005
2007
2009
2011
2013
2015
2017
2019
millions
Air Ferry (selected services) Ferry (all services)
29 million air terminal
passengers travelled in 2019-2%
10.4 million ferry passengers travelled in 2019
19
SUMMARY
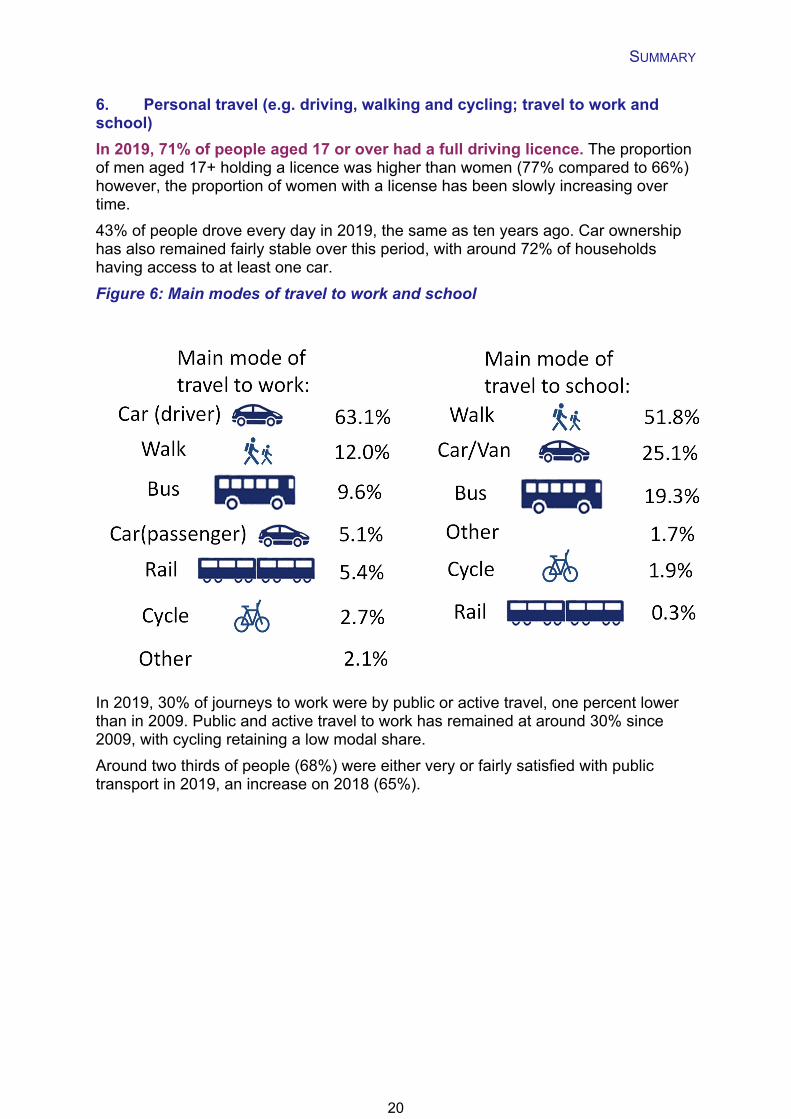
6. Personal travel (e.g. driving, walking and cycling; travel to work and school)
In 2019, 71% of people aged 17 or over had a full driving licence. The proportion of men aged 17+ holding a licence was higher than women (77% compared to 66%) however, the proportion of women with a license has been slowly increasing over time.
43% of people drove every day in 2019, the same as ten years ago. Car ownership has also remained fairly stable over this period, with around 72% of households having access to at least one car.
Figure 6: Main modes of travel to work and school
In 2019, 30% of journeys to work were by public or active travel, one percent lower than in 2009. Public and active travel to work has remained at around 30% since 2009, with cycling retaining a low modal share.
Around two thirds of people (68%) were either very or fairly satisfied with public transport in 2019, an increase on 2018 (65%).
20
SUMMARY
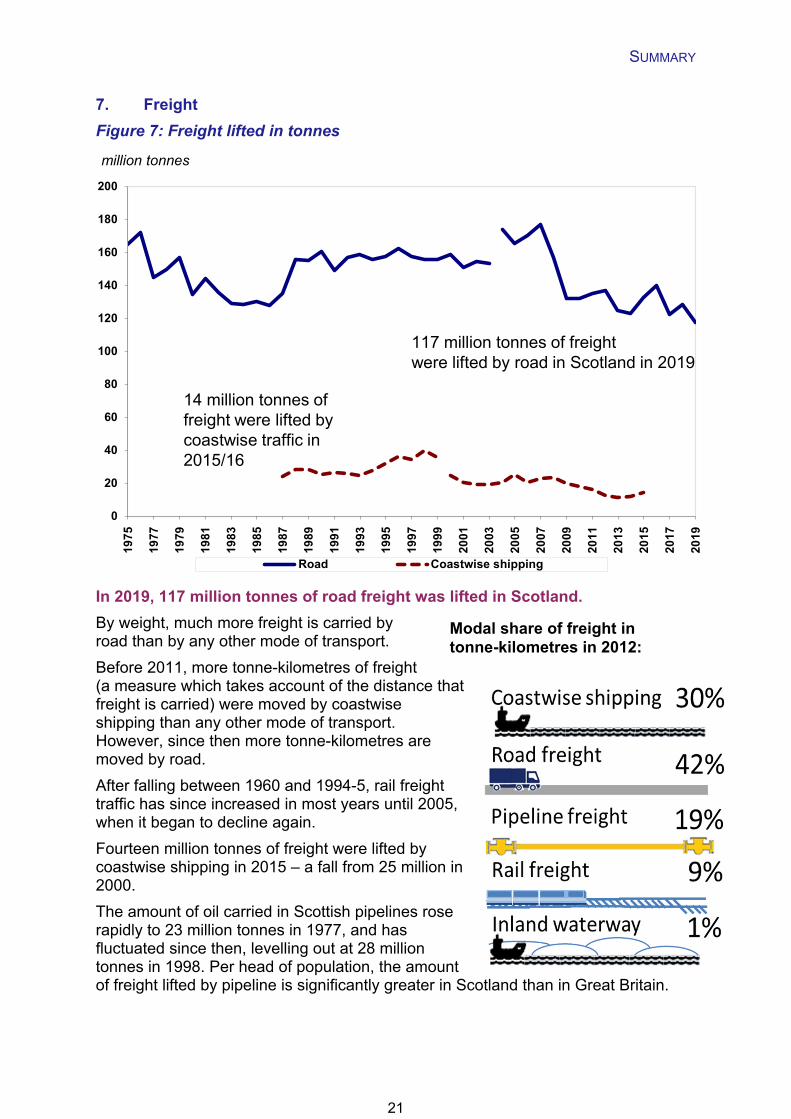
7. Freight
Figure 7: Freight lifted in tonnes
In 2019, 117 million tonnes of road freight was lifted in Scotland.
By weight, much more freight is carried by road than by any other mode of transport.
Before 2011, more tonne-kilometres of freight (a measure which takes account of the distance that freight is carried) were moved by coastwise shipping than any other mode of transport. However, since then more tonne-kilometres are moved by road.
After falling between 1960 and 1994-5, rail freight traffic has since increased in most years until 2005, when it began to decline again.
Fourteen million tonnes of freight were lifted by coastwise shipping in 2015 – a fall from 25 million in 2000.
The amount of oil carried in Scottish pipelines rose rapidly to 23 million tonnes in 1977, and has fluctuated since then, levelling out at 28 million tonnes in 1998. Per head of population, the amount of freight lifted by pipeline is significantly greater in Scotland than in Great Britain.
0
20
40
60
80
100
120
140
160
180
200
1975
1977
1979
1981
1983
1985
1987
1989
1991
1993
1995
1997
1999
2001
2003
2005
2007
2009
2011
2013
2015
2017
2019
million tonnes
Road Coastwise shipping
14 million tonnes of freight were lifted by coastwise traffic in2015/16
117 million tonnes of freight were lifted by road in Scotland in 2019
Modal share of freight in tonne-kilometres in 2012:
21
SUMMARY
8. Cross-border transport
In 2019, there were 12.8 million air and ferry passenger journeys to other parts of the UK, a decrease of 0.4% since 2018. The majority of these journeys were made by air (11.0 million).
The most recently available figures for rail journeys show 9.9 million passenger journeys were made to other parts of the UK in 2018.
In 2019, 16 million passenger journeys were made to and from other countries by air, an increase of 65% since 2009.
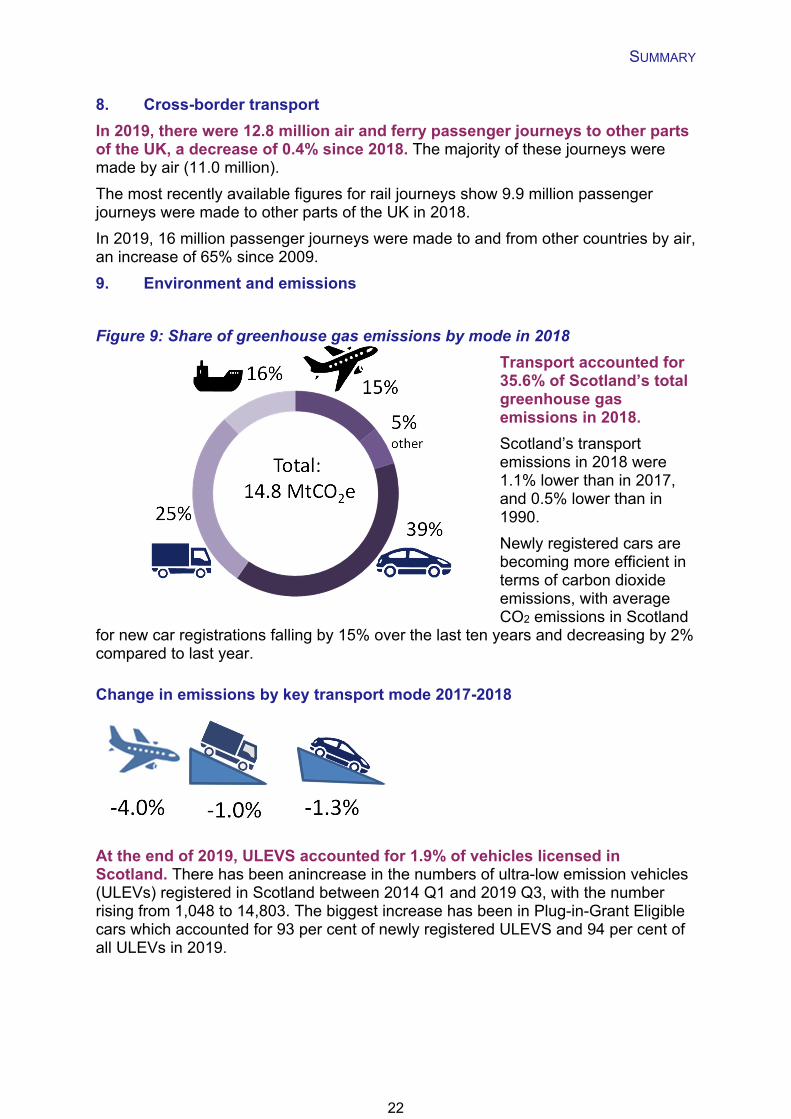
9. Environment and emissions
Figure 9: Share of greenhouse gas emissions by mode in 2018
Transport accounted for 35.6% of Scotland’s total greenhouse gas emissions in 2018.
Scotland’s transport emissions in 2018 were 1.1% lower than in 2017, and 0.5% lower than in 1990.
Newly registered cars are becoming more efficient in terms of carbon dioxide emissions, with average CO2 emissions in Scotland
for new car registrations falling by 15% over the last ten years and decreasing by 2% compared to last year.
Change in emissions by key transport mode 2017-2018
At the end of 2019, ULEVS accounted for 1.9% of vehicles licensed in Scotland. There has been anincrease in the numbers of ultra-low emission vehicles (ULEVs) registered in Scotland between 2014 Q1 and 2019 Q3, with the number rising from 1,048 to 14,803. The biggest increase has been in Plug-in-Grant Eligible cars which accounted for 93 per cent of newly registered ULEVS and 94 per cent of all ULEVs in 2019.
22
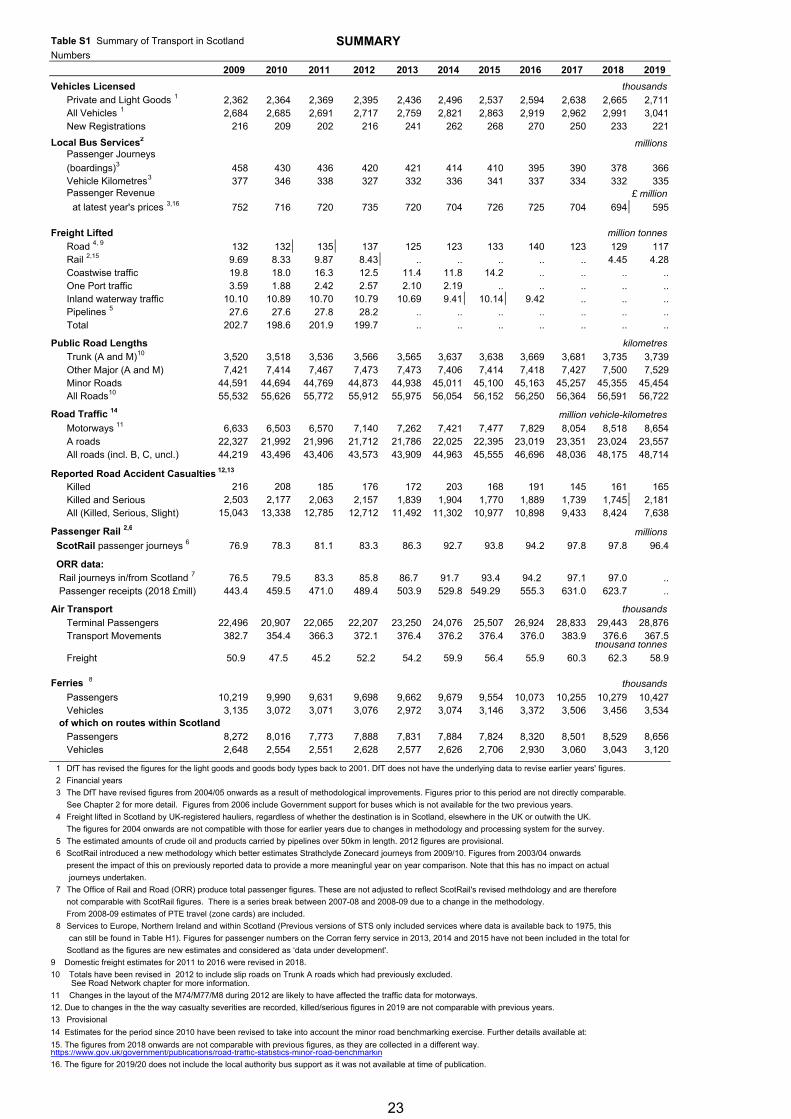
Table S1 Summary of Transport in Scotland SUMMARYNumbers
2009 2010 2011 2012 2013 2014 2015 2016 2017 2018 2019
Vehicles Licensed thousandsPrivate and Light Goods 1 2,362 2,364 2,369 2,395 2,436 2,496 2,537 2,594 2,638 2,665 2,711All Vehicles 1 2,684 2,685 2,691 2,717 2,759 2,821 2,863 2,919 2,962 2,991 3,041New Registrations 216 209 202 216 241 262 268 270 250 233 221
Local Bus Services2 millionsPassenger Journeys
(boardings)3 458 430 436 420 421 414 410 395 390 378 366Vehicle Kilometres3 377 346 338 327 332 336 341 337 334 332 335Passenger Revenue £ million
at latest year's prices 3,16 752 716 720 735 720 704 726 725 704 694 595
Freight Lifted million tonnesRoad 4, 9 132 132 135 137 125 123 133 140 123 129 117Rail 2,15 9.69 8.33 9.87 8.43 .. .. .. .. .. 4.45 4.28Coastwise traffic 19.8 18.0 16.3 12.5 11.4 11.8 14.2 .. .. .. ..One Port traffic 3.59 1.88 2.42 2.57 2.10 2.19 .. .. .. .. ..Inland waterway traffic 10.10 10.89 10.70 10.79 10.69 9.41 10.14 9.42 .. .. ..Pipelines 5 27.6 27.6 27.8 28.2 .. .. .. .. .. .. ..Total 202.7 198.6 201.9 199.7 .. .. .. .. .. .. ..
Public Road Lengths kilometresTrunk (A and M)10 3,520 3,518 3,536 3,566 3,565 3,637 3,638 3,669 3,681 3,735 3,739Other Major (A and M) 7,421 7,414 7,467 7,473 7,473 7,406 7,414 7,418 7,427 7,500 7,529Minor Roads 44,591 44,694 44,769 44,873 44,938 45,011 45,100 45,163 45,257 45,355 45,454All Roads10 55,532 55,626 55,772 55,912 55,975 56,054 56,152 56,250 56,364 56,591 56,722
Road Traffic 14 million vehicle-kilometresMotorways 11 6,633 6,503 6,570 7,140 7,262 7,421 7,477 7,829 8,054 8,518 8,654A roads 22,327 21,992 21,996 21,712 21,786 22,025 22,395 23,019 23,351 23,024 23,557All roads (incl. B, C, uncl.) 44,219 43,496 43,406 43,573 43,909 44,963 45,555 46,696 48,036 48,175 48,714
Reported Road Accident Casualties 12,13
Killed 216 208 185 176 172 203 168 191 145 161 165Killed and Serious 2,503 2,177 2,063 2,157 1,839 1,904 1,770 1,889 1,739 1,745 2,181All (Killed, Serious, Slight) 15,043 13,338 12,785 12,712 11,492 11,302 10,977 10,898 9,433 8,424 7,638
Passenger Rail 2,6 millions
ScotRail passenger journeys 6 76.9 78.3 81.1 83.3 86.3 92.7 93.8 94.2 97.8 97.8 96.4
ORR data: Rail journeys in/from Scotland 7 76.5 79.5 83.3 85.8 86.7 91.7 93.4 94.2 97.1 97.0 .. Passenger receipts (2018 £mill) 443.4 459.5 471.0 489.4 503.9 529.8 549.29 555.3 631.0 623.7 ..
Air Transport thousands
Terminal Passengers 22,496 20,907 22,065 22,207 23,250 24,076 25,507 26,924 28,833 29,443 28,876Transport Movements 382.7 354.4 366.3 372.1 376.4 376.2 376.4 376.0 383.9 376.6 367.5
thousand tonnes
Freight 50.9 47.5 45.2 52.2 54.2 59.9 56.4 55.9 60.3 62.3 58.9
Ferries 8 thousands
Passengers 10,219 9,990 9,631 9,698 9,662 9,679 9,554 10,073 10,255 10,279 10,427Vehicles 3,135 3,072 3,071 3,076 2,972 3,074 3,146 3,372 3,506 3,456 3,534
of which on routes within Scotland
Passengers 8,272 8,016 7,773 7,888 7,831 7,884 7,824 8,320 8,501 8,529 8,656Vehicles 2,648 2,554 2,551 2,628 2,577 2,626 2,706 2,930 3,060 3,043 3,120
1 DfT has revised the figures for the light goods and goods body types back to 2001. DfT does not have the underlying data to revise earlier years' figures.
2 Financial years
3 The DfT have revised figures from 2004/05 onwards as a result of methodological improvements. Figures prior to this period are not directly comparable.
See Chapter 2 for more detail. Figures from 2006 include Government support for buses which is not available for the two previous years.
4 Freight lifted in Scotland by UK-registered hauliers, regardless of whether the destination is in Scotland, elsewhere in the UK or outwith the UK.
The figures for 2004 onwards are not compatible with those for earlier years due to changes in methodology and processing system for the survey.
5 The estimated amounts of crude oil and products carried by pipelines over 50km in length. 2012 figures are provisional.
6 ScotRail introduced a new methodology which better estimates Strathclyde Zonecard journeys from 2009/10. Figures from 2003/04 onwards
present the impact of this on previously reported data to provide a more meaningful year on year comparison. Note that this has no impact on actual
journeys undertaken.
7 The Office of Rail and Road (ORR) produce total passenger figures. These are not adjusted to reflect ScotRail's revised methdology and are therefore
not comparable with ScotRail figures. There is a series break between 2007-08 and 2008-09 due to a change in the methodology.
From 2008-09 estimates of PTE travel (zone cards) are included.
8 Services to Europe, Northern Ireland and within Scotland (Previous versions of STS only included services where data is available back to 1975, this
can still be found in Table H1). Figures for passenger numbers on the Corran ferry service in 2013, 2014 and 2015 have not been included in the total for
Scotland as the figures are new estimates and considered as ‘data under development'.
9 Domestic freight estimates for 2011 to 2016 were revised in 2018.
10 Totals have been revised in 2012 to include slip roads on Trunk A roads which had previously excluded. See Road Network chapter for more information.
11 Changes in the layout of the M74/M77/M8 during 2012 are likely to have affected the traffic data for motorways.
12. Due to changes in the the way casualty severities are recorded, killed/serious figures in 2019 are not comparable with previous years.
13 Provisional
14 Estimates for the period since 2010 have been revised to take into account the minor road benchmarking exercise. Further details available at:
15. The figures from 2018 onwards are not comparable with previous figures, as they are collected in a different way.https://www.gov.uk/government/publications/road-traffic-statistics-minor-road-benchmarkin
16. The figure for 2019/20 does not include the local authority bus support as it was not available at time of publication.
23
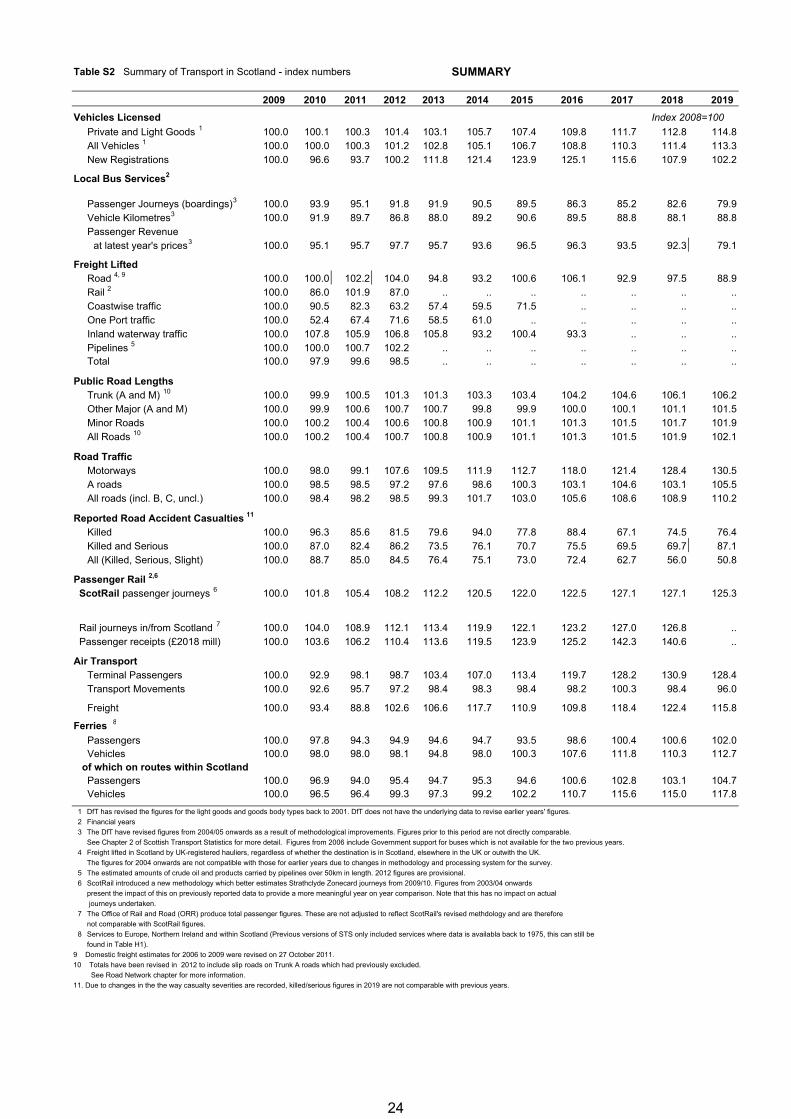
Table S2 Summary of Transport in Scotland - index numbers SUMMARY
2009 2010 2011 2012 2013 2014 2015 2016 2017 2018 2019
Vehicles Licensed Index 2008=100
Private and Light Goods 1 100.0 100.1 100.3 101.4 103.1 105.7 107.4 109.8 111.7 112.8 114.8All Vehicles 1 100.0 100.0 100.3 101.2 102.8 105.1 106.7 108.8 110.3 111.4 113.3New Registrations 100.0 96.6 93.7 100.2 111.8 121.4 123.9 125.1 115.6 107.9 102.2
Local Bus Services2
Passenger Journeys (boardings)3 100.0 93.9 95.1 91.8 91.9 90.5 89.5 86.3 85.2 82.6 79.9Vehicle Kilometres3 100.0 91.9 89.7 86.8 88.0 89.2 90.6 89.5 88.8 88.1 88.8Passenger Revenue
at latest year's prices3 100.0 95.1 95.7 97.7 95.7 93.6 96.5 96.3 93.5 92.3 79.1
Freight LiftedRoad 4, 9 100.0 100.0 102.2 104.0 94.8 93.2 100.6 106.1 92.9 97.5 88.9Rail 2 100.0 86.0 101.9 87.0 .. .. .. .. .. .. ..Coastwise traffic 100.0 90.5 82.3 63.2 57.4 59.5 71.5 .. .. .. ..One Port traffic 100.0 52.4 67.4 71.6 58.5 61.0 .. .. .. .. ..Inland waterway traffic 100.0 107.8 105.9 106.8 105.8 93.2 100.4 93.3 .. .. ..Pipelines 5 100.0 100.0 100.7 102.2 .. .. .. .. .. .. ..Total 100.0 97.9 99.6 98.5 .. .. .. .. .. .. ..
Public Road Lengths Trunk (A and M) 10 100.0 99.9 100.5 101.3 101.3 103.3 103.4 104.2 104.6 106.1 106.2Other Major (A and M) 100.0 99.9 100.6 100.7 100.7 99.8 99.9 100.0 100.1 101.1 101.5Minor Roads 100.0 100.2 100.4 100.6 100.8 100.9 101.1 101.3 101.5 101.7 101.9All Roads 10 100.0 100.2 100.4 100.7 100.8 100.9 101.1 101.3 101.5 101.9 102.1
Road TrafficMotorways 100.0 98.0 99.1 107.6 109.5 111.9 112.7 118.0 121.4 128.4 130.5A roads 100.0 98.5 98.5 97.2 97.6 98.6 100.3 103.1 104.6 103.1 105.5All roads (incl. B, C, uncl.) 100.0 98.4 98.2 98.5 99.3 101.7 103.0 105.6 108.6 108.9 110.2
Reported Road Accident Casualties 11
Killed 100.0 96.3 85.6 81.5 79.6 94.0 77.8 88.4 67.1 74.5 76.4Killed and Serious 100.0 87.0 82.4 86.2 73.5 76.1 70.7 75.5 69.5 69.7 87.1All (Killed, Serious, Slight) 100.0 88.7 85.0 84.5 76.4 75.1 73.0 72.4 62.7 56.0 50.8
Passenger Rail 2,6
ScotRail passenger journeys 6 100.0 101.8 105.4 108.2 112.2 120.5 122.0 122.5 127.1 127.1 125.3
Rail journeys in/from Scotland 7 100.0 104.0 108.9 112.1 113.4 119.9 122.1 123.2 127.0 126.8 .. Passenger receipts (£2018 mill) 100.0 103.6 106.2 110.4 113.6 119.5 123.9 125.2 142.3 140.6 ..
Air TransportTerminal Passengers 100.0 92.9 98.1 98.7 103.4 107.0 113.4 119.7 128.2 130.9 128.4Transport Movements 100.0 92.6 95.7 97.2 98.4 98.3 98.4 98.2 100.3 98.4 96.0
Freight 100.0 93.4 88.8 102.6 106.6 117.7 110.9 109.8 118.4 122.4 115.8
Ferries 8
Passengers 100.0 97.8 94.3 94.9 94.6 94.7 93.5 98.6 100.4 100.6 102.0Vehicles 100.0 98.0 98.0 98.1 94.8 98.0 100.3 107.6 111.8 110.3 112.7
of which on routes within ScotlandPassengers 100.0 96.9 94.0 95.4 94.7 95.3 94.6 100.6 102.8 103.1 104.7Vehicles 100.0 96.5 96.4 99.3 97.3 99.2 102.2 110.7 115.6 115.0 117.8
1 DfT has revised the figures for the light goods and goods body types back to 2001. DfT does not have the underlying data to revise earlier years' figures.
2 Financial years
3 The DfT have revised figures from 2004/05 onwards as a result of methodological improvements. Figures prior to this period are not directly comparable.
See Chapter 2 of Scottish Transport Statistics for more detail. Figures from 2006 include Government support for buses which is not available for the two previous years.
4 Freight lifted in Scotland by UK-registered hauliers, regardless of whether the destination is in Scotland, elsewhere in the UK or outwith the UK.
The figures for 2004 onwards are not compatible with those for earlier years due to changes in methodology and processing system for the survey.
5 The estimated amounts of crude oil and products carried by pipelines over 50km in length. 2012 figures are provisional.
6 ScotRail introduced a new methodology which better estimates Strathclyde Zonecard journeys from 2009/10. Figures from 2003/04 onwards
present the impact of this on previously reported data to provide a more meaningful year on year comparison. Note that this has no impact on actual
journeys undertaken.
7 The Office of Rail and Road (ORR) produce total passenger figures. These are not adjusted to reflect ScotRail's revised methdology and are therefore
not comparable with ScotRail figures.
8 Services to Europe, Northern Ireland and within Scotland (Previous versions of STS only included services where data is availabla back to 1975, this can still be
found in Table H1).
9 Domestic freight estimates for 2006 to 2009 were revised on 27 October 2011.
10 Totals have been revised in 2012 to include slip roads on Trunk A roads which had previously excluded.
See Road Network chapter for more information.
11. Due to changes in the the way casualty severities are recorded, killed/serious figures in 2019 are not comparable with previous years.
24
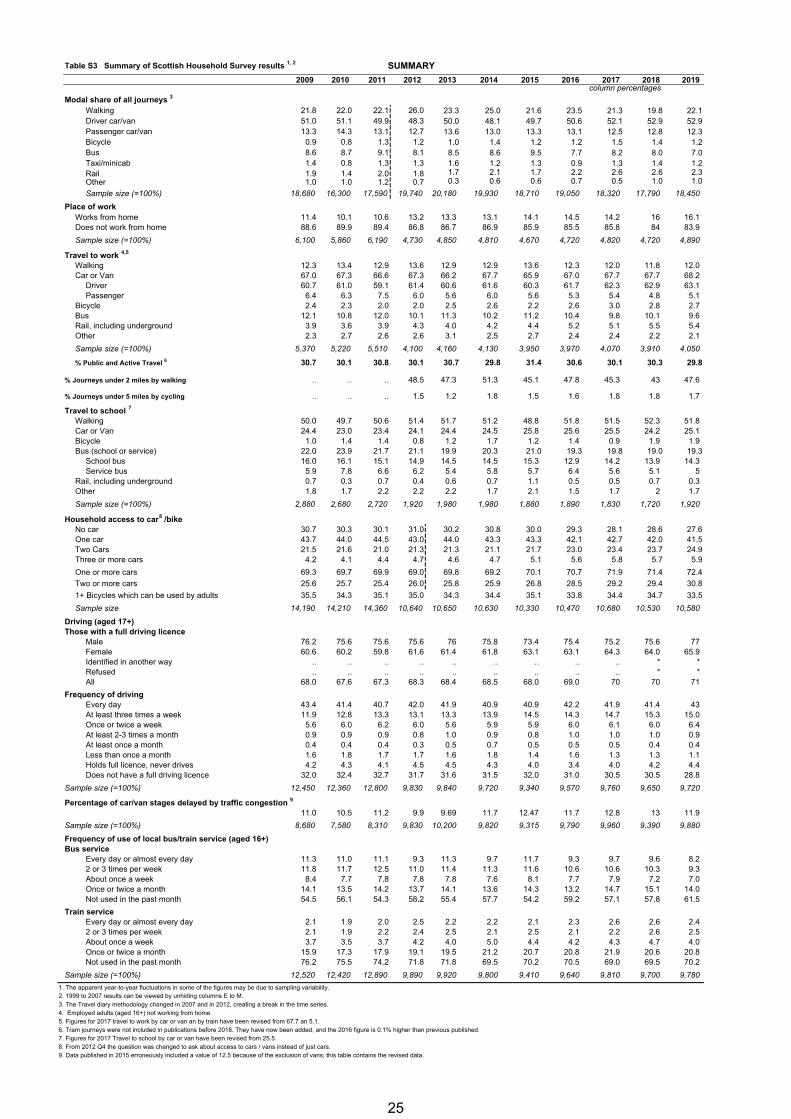
Table S3 Summary of Scottish Household Survey results 1, 2 SUMMARY
2009 2010 2011 2012 2013 2014 2015 2016 2017 2018 2019column percentages
Modal share of all journeys 3
Walking 21.8 22.0 22.1 26.0 23.3 25.0 21.6 23.5 21.3 19.8 22.1Driver car/van 51.0 51.1 49.9 48.3 50.0 48.1 49.7 50.6 52.1 52.9 52.9Passenger car/van 13.3 14.3 13.1 12.7 13.6 13.0 13.3 13.1 12.5 12.8 12.3Bicycle 0.9 0.8 1.3 1.2 1.0 1.4 1.2 1.2 1.5 1.4 1.2Bus 8.6 8.7 9.1 8.1 8.5 8.6 9.5 7.7 8.2 8.0 7.0Taxi/minicab 1.4 0.8 1.3 1.3 1.6 1.2 1.3 0.9 1.3 1.4 1.2Rail 1.9 1.4 2.0 1.8 1.7 2.1 1.7 2.2 2.6 2.6 2.3Other 1.0 1.0 1.2 0.7 0.3 0.6 0.6 0.7 0.5 1.0 1.0
Sample size (=100%) 18,680 16,300 17,590 19,740 20,180 19,930 18,710 19,050 18,320 17,790 18,450
Place of workWorks from home 11.4 10.1 10.6 13.2 13.3 13.1 14.1 14.5 14.2 16 16.1Does not work from home 88.6 89.9 89.4 86.8 86.7 86.9 85.9 85.5 85.8 84 83.9
Sample size (=100%) 6,100 5,860 6,190 4,730 4,850 4,810 4,670 4,720 4,820 4,720 4,890
Travel to work 4,5
Walking 12.3 13.4 12.9 13.6 12.9 12.9 13.6 12.3 12.0 11.8 12.0 Car or Van 67.0 67.3 66.6 67.3 66.2 67.7 65.9 67.0 67.7 67.7 68.2
Driver 60.7 61.0 59.1 61.4 60.6 61.6 60.3 61.7 62.3 62.9 63.1 Passenger 6.4 6.3 7.5 6.0 5.6 6.0 5.6 5.3 5.4 4.8 5.1
Bicycle 2.4 2.3 2.0 2.0 2.5 2.6 2.2 2.6 3.0 2.8 2.7 Bus 12.1 10.8 12.0 10.1 11.3 10.2 11.2 10.4 9.8 10.1 9.6 Rail, including underground 3.9 3.6 3.9 4.3 4.0 4.2 4.4 5.2 5.1 5.5 5.4 Other 2.3 2.7 2.6 2.6 3.1 2.5 2.7 2.4 2.4 2.2 2.1
Sample size (=100%) 5,370 5,220 5,510 4,100 4,160 4,130 3,950 3,970 4,070 3,910 4,050
% Public and Active Travel 6 30.7 30.1 30.8 30.1 30.7 29.8 31.4 30.6 30.1 30.3 29.8
% Journeys under 2 miles by walking .. .. .. 48.5 47.3 51.3 45.1 47.8 45.3 43 47.6
% Journeys under 5 miles by cycling .. .. .. 1.5 1.2 1.8 1.5 1.6 1.8 1.8 1.7
Travel to school 7
Walking 50.0 49.7 50.6 51.4 51.7 51.2 48.8 51.8 51.5 52.3 51.8Car or Van 24.4 23.0 23.4 24.1 24.4 24.5 25.8 25.6 25.5 24.2 25.1Bicycle 1.0 1.4 1.4 0.8 1.2 1.7 1.2 1.4 0.9 1.9 1.9Bus (school or service) 22.0 23.9 21.7 21.1 19.9 20.3 21.0 19.3 19.8 19.0 19.3
School bus 16.0 16.1 15.1 14.9 14.5 14.5 15.3 12.9 14.2 13.9 14.3Service bus 5.9 7.8 6.6 6.2 5.4 5.8 5.7 6.4 5.6 5.1 5
Rail, including underground 0.7 0.3 0.7 0.4 0.6 0.7 1.1 0.5 0.5 0.7 0.3Other 1.8 1.7 2.2 2.2 2.2 1.7 2.1 1.5 1.7 2 1.7
Sample size (=100%) 2,880 2,680 2,720 1,920 1,980 1,980 1,880 1,890 1,830 1,720 1,920
Household access to car8 /bikeNo car 30.7 30.3 30.1 31.0 30.2 30.8 30.0 29.3 28.1 28.6 27.6One car 43.7 44.0 44.5 43.0 44.0 43.3 43.3 42.1 42.7 42.0 41.5Two Cars 21.5 21.6 21.0 21.3 21.3 21.1 21.7 23.0 23.4 23.7 24.9Three or more cars 4.2 4.1 4.4 4.7 4.6 4.7 5.1 5.6 5.8 5.7 5.9
One or more cars 69.3 69.7 69.9 69.0 69.8 69.2 70.1 70.7 71.9 71.4 72.4
Two or more cars 25.6 25.7 25.4 26.0 25.8 25.9 26.8 28.5 29.2 29.4 30.8
1+ Bicycles which can be used by adults 35.5 34.3 35.1 35.0 34.3 34.4 35.1 33.8 34.4 34.7 33.5
Sample size 14,190 14,210 14,360 10,640 10,650 10,630 10,330 10,470 10,680 10,530 10,580
Driving (aged 17+) Those with a full driving licence
Male 76.2 75.6 75.6 75.6 76 75.8 73.4 75.4 75.2 75.6 77Female 60.6 60.2 59.8 61.6 61.4 61.8 63.1 63.1 64.3 64.0 65.9 Identified in another way .. .. .. .. .. .. .. .. .. * *Refused .. .. .. .. .. .. .. .. .. * *All 68.0 67.6 67.3 68.3 68.4 68.5 68.0 69.0 70 70 71
Frequency of driving Every day 43.4 41.4 40.7 42.0 41.9 40.9 40.9 42.2 41.9 41.4 43At least three times a week 11.9 12.8 13.3 13.1 13.3 13.9 14.5 14.3 14.7 15.3 15.0 Once or twice a week 5.6 6.0 6.2 6.0 5.6 5.9 5.9 6.0 6.1 6.0 6.4 At least 2-3 times a month 0.9 0.9 0.9 0.8 1.0 0.9 0.8 1.0 1.0 1.0 0.9 At least once a month 0.4 0.4 0.4 0.3 0.5 0.7 0.5 0.5 0.5 0.4 0.4 Less than once a month 1.6 1.8 1.7 1.7 1.6 1.8 1.4 1.6 1.3 1.3 1.1 Holds full licence, never drives 4.2 4.3 4.1 4.5 4.5 4.3 4.0 3.4 4.0 4.2 4.4 Does not have a full driving licence 32.0 32.4 32.7 31.7 31.6 31.5 32.0 31.0 30.5 30.5 28.8
Sample size (=100%) 12,450 12,360 12,800 9,830 9,840 9,720 9,340 9,570 9,760 9,650 9,720
Percentage of car/van stages delayed by traffic congestion 9
11.0 10.5 11.2 9.9 9.69 11.7 12.47 11.7 12.8 13 11.9
Sample size (=100%) 8,680 7,580 8,310 9,830 10,200 9,820 9,315 9,790 9,960 9,390 9,880
Frequency of use of local bus/train service (aged 16+)Bus service
Every day or almost every day 11.3 11.0 11.1 9.3 11.3 9.7 11.7 9.3 9.7 9.6 8.22 or 3 times per week 11.8 11.7 12.5 11.0 11.4 11.3 11.6 10.6 10.6 10.3 9.3 About once a week 8.4 7.7 7.8 7.8 7.8 7.6 8.1 7.7 7.9 7.2 7.0 Once or twice a month 14.1 13.5 14.2 13.7 14.1 13.6 14.3 13.2 14.7 15.1 14.0 Not used in the past month 54.5 56.1 54.3 58.2 55.4 57.7 54.2 59.2 57.1 57.8 61.5
Train serviceEvery day or almost every day 2.1 1.9 2.0 2.5 2.2 2.2 2.1 2.3 2.6 2.6 2.4 2 or 3 times per week 2.1 1.9 2.2 2.4 2.5 2.1 2.5 2.1 2.2 2.6 2.5 About once a week 3.7 3.5 3.7 4.2 4.0 5.0 4.4 4.2 4.3 4.7 4.0 Once or twice a month 15.9 17.3 17.9 19.1 19.5 21.2 20.7 20.8 21.9 20.6 20.8 Not used in the past month 76.2 75.5 74.2 71.8 71.8 69.5 70.2 70.5 69.0 69.5 70.2
Sample size (=100%) 12,520 12,420 12,890 9,890 9,920 9,800 9,410 9,640 9,810 9,700 9,780
1. The apparent year-to-year fluctuations in some of the figures may be due to sampling variability.
3. The Travel diary methodology changed in 2007 and in 2012, creating a break in the time series.4. Employed adults (aged 16+) not working from home5. Figures for 2017 travel to work by car or van an by train have been revised from 67.7 an 5.1.6. Tram journeys were not included in publications before 2018. They have now been added, and the 2016 figure is 0.1% higher than previous published.7. Figures for 2017 Travel to school by car or van have been revised from 25.5.8. From 2012 Q4 the question was changed to ask about access to cars / vans instead of just cars.9. Data published in 2015 erroneously included a value of 12.5 because of the exclusion of vans; this table contains the revised data.
2. 1999 to 2007 results can be viewed by unhiding columns E to M.
25
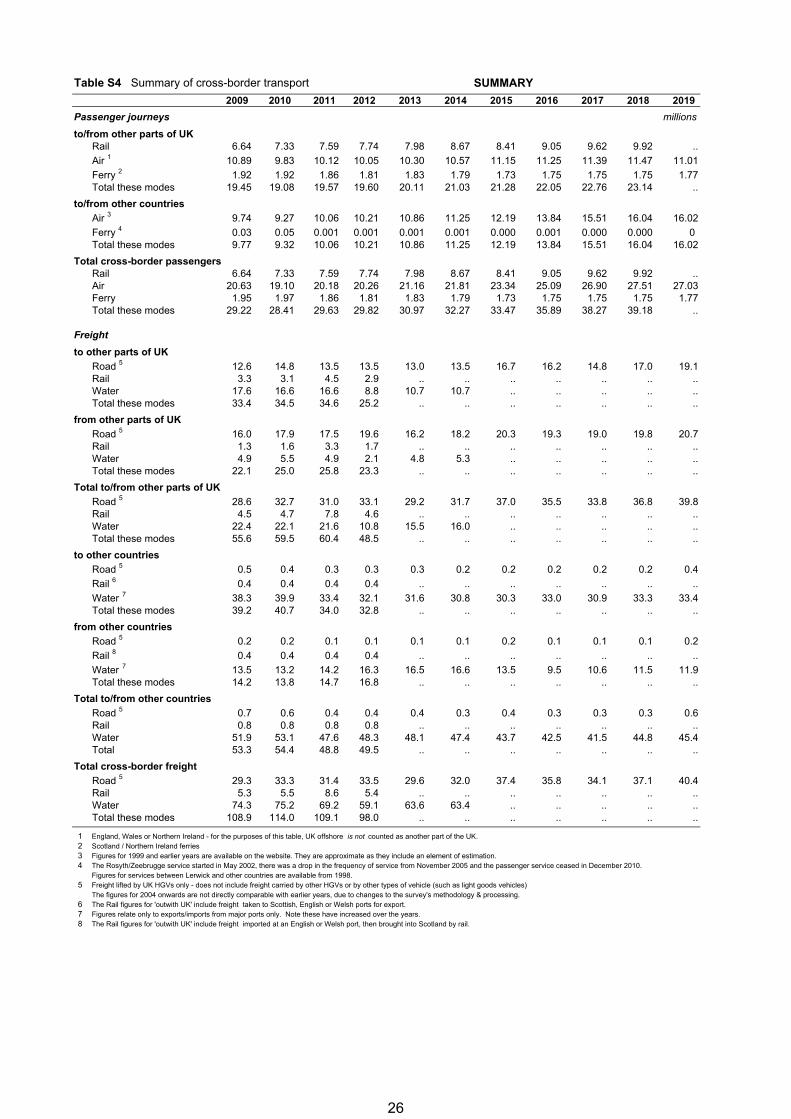
Table S4 Summary of cross-border transport SUMMARY
2009 2010 2011 2012 2013 2014 2015 2016 2017 2018 2019
Passenger journeys millions
to/from other parts of UKRail 6.64 7.33 7.59 7.74 7.98 8.67 8.41 9.05 9.62 9.92 ..
Air 1 10.89 9.83 10.12 10.05 10.30 10.57 11.15 11.25 11.39 11.47 11.01
Ferry 2 1.92 1.92 1.86 1.81 1.83 1.79 1.73 1.75 1.75 1.75 1.77Total these modes 19.45 19.08 19.57 19.60 20.11 21.03 21.28 22.05 22.76 23.14 ..
to/from other countries
Air 3 9.74 9.27 10.06 10.21 10.86 11.25 12.19 13.84 15.51 16.04 16.02
Ferry 4 0.03 0.05 0.001 0.001 0.001 0.001 0.000 0.001 0.000 0.000 0Total these modes 9.77 9.32 10.06 10.21 10.86 11.25 12.19 13.84 15.51 16.04 16.02
Total cross-border passengers Rail 6.64 7.33 7.59 7.74 7.98 8.67 8.41 9.05 9.62 9.92 ..Air 20.63 19.10 20.18 20.26 21.16 21.81 23.34 25.09 26.90 27.51 27.03Ferry 1.95 1.97 1.86 1.81 1.83 1.79 1.73 1.75 1.75 1.75 1.77Total these modes 29.22 28.41 29.63 29.82 30.97 32.27 33.47 35.89 38.27 39.18 ..
Freight
to other parts of UK
Road 5 12.6 14.8 13.5 13.5 13.0 13.5 16.7 16.2 14.8 17.0 19.1Rail 3.3 3.1 4.5 2.9 .. .. .. .. .. .. ..Water 17.6 16.6 16.6 8.8 10.7 10.7 .. .. .. .. ..Total these modes 33.4 34.5 34.6 25.2 .. .. .. .. .. .. ..
from other parts of UK
Road 5 16.0 17.9 17.5 19.6 16.2 18.2 20.3 19.3 19.0 19.8 20.7Rail 1.3 1.6 3.3 1.7 .. .. .. .. .. .. ..Water 4.9 5.5 4.9 2.1 4.8 5.3 .. .. .. .. ..Total these modes 22.1 25.0 25.8 23.3 .. .. .. .. .. .. ..
Total to/from other parts of UK
Road 5 28.6 32.7 31.0 33.1 29.2 31.7 37.0 35.5 33.8 36.8 39.8Rail 4.5 4.7 7.8 4.6 .. .. .. .. .. .. ..Water 22.4 22.1 21.6 10.8 15.5 16.0 .. .. .. .. ..Total these modes 55.6 59.5 60.4 48.5 .. .. .. .. .. .. ..
to other countries
Road 5 0.5 0.4 0.3 0.3 0.3 0.2 0.2 0.2 0.2 0.2 0.4
Rail 6 0.4 0.4 0.4 0.4 .. .. .. .. .. .. ..
Water 7 38.3 39.9 33.4 32.1 31.6 30.8 30.3 33.0 30.9 33.3 33.4Total these modes 39.2 40.7 34.0 32.8 .. .. .. .. .. .. ..
from other countries
Road 5 0.2 0.2 0.1 0.1 0.1 0.1 0.2 0.1 0.1 0.1 0.2
Rail 8 0.4 0.4 0.4 0.4 .. .. .. .. .. .. ..
Water 7 13.5 13.2 14.2 16.3 16.5 16.6 13.5 9.5 10.6 11.5 11.9Total these modes 14.2 13.8 14.7 16.8 .. .. .. .. .. .. ..
Total to/from other countries
Road 5 0.7 0.6 0.4 0.4 0.4 0.3 0.4 0.3 0.3 0.3 0.6Rail 0.8 0.8 0.8 0.8 .. .. .. .. .. .. ..Water 51.9 53.1 47.6 48.3 48.1 47.4 43.7 42.5 41.5 44.8 45.4Total 53.3 54.4 48.8 49.5 .. .. .. .. .. .. ..
Total cross-border freight
Road 5 29.3 33.3 31.4 33.5 29.6 32.0 37.4 35.8 34.1 37.1 40.4Rail 5.3 5.5 8.6 5.4 .. .. .. .. .. .. ..Water 74.3 75.2 69.2 59.1 63.6 63.4 .. .. .. .. ..Total these modes 108.9 114.0 109.1 98.0 .. .. .. .. .. .. ..
1 England, Wales or Northern Ireland - for the purposes of this table, UK offshore is not counted as another part of the UK. 2 Scotland / Northern Ireland ferries3 Figures for 1999 and earlier years are available on the website. They are approximate as they include an element of estimation.4 The Rosyth/Zeebrugge service started in May 2002, there was a drop in the frequency of service from November 2005 and the passenger service ceased in December 2010.
Figures for services between Lerwick and other countries are available from 1998.5 Freight lifted by UK HGVs only - does not include freight carried by other HGVs or by other types of vehicle (such as light goods vehicles)
The figures for 2004 onwards are not directly comparable with earlier years, due to changes to the survey's methodology & processing.6 The Rail figures for 'outwith UK' include freight taken to Scottish, English or Welsh ports for export.7 Figures relate only to exports/imports from major ports only. Note these have increased over the years.8 The Rail figures for 'outwith UK' include freight imported at an English or Welsh port, then brought into Scotland by rail.
26
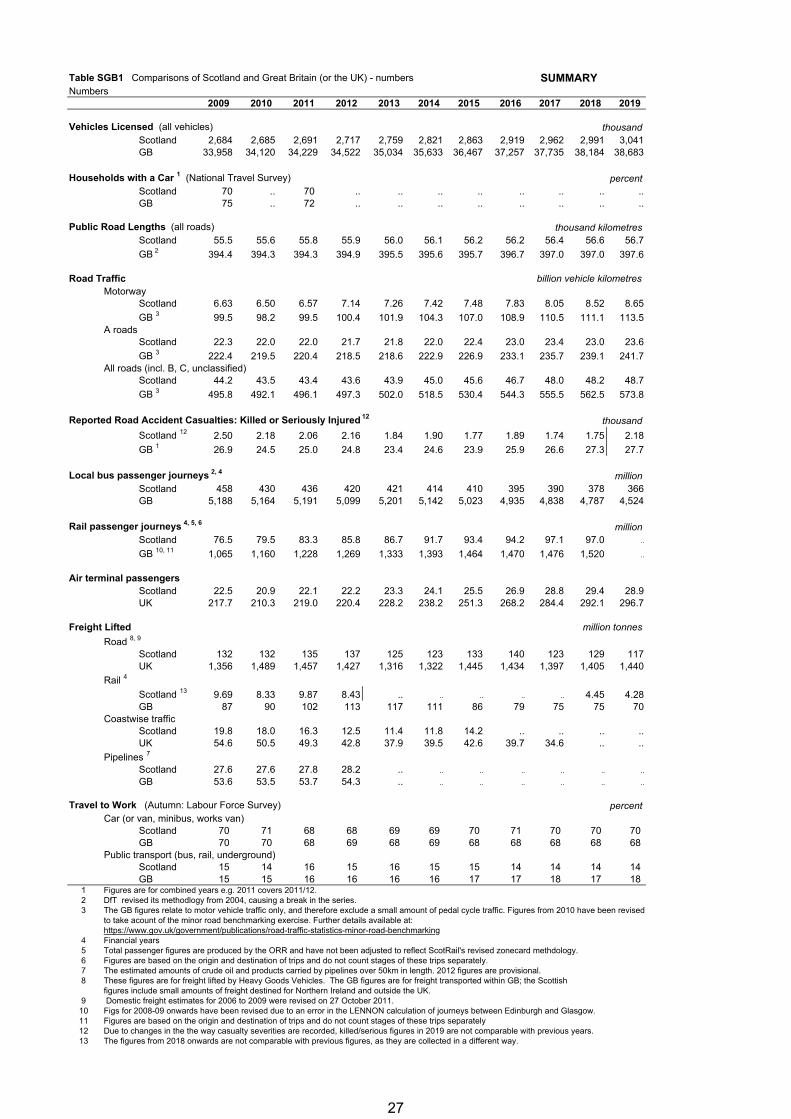
Table SGB1 Comparisons of Scotland and Great Britain (or the UK) - numbers SUMMARYNumbers
2009 2010 2011 2012 2013 2014 2015 2016 2017 2018 2019
Vehicles Licensed (all vehicles) thousandScotland 2,684 2,685 2,691 2,717 2,759 2,821 2,863 2,919 2,962 2,991 3,041GB 33,958 34,120 34,229 34,522 35,034 35,633 36,467 37,257 37,735 38,184 38,683
Households with a Car 1 (National Travel Survey) percentScotland 70 .. 70 .. .. .. .. .. .. .. ..GB 75 .. 72 .. .. .. .. .. .. .. ..
Public Road Lengths (all roads) thousand kilometresScotland 55.5 55.6 55.8 55.9 56.0 56.1 56.2 56.2 56.4 56.6 56.7
GB 2 394.4 394.3 394.3 394.9 395.5 395.6 395.7 396.7 397.0 397.0 397.6
Road Traffic billion vehicle kilometresMotorway
Scotland 6.63 6.50 6.57 7.14 7.26 7.42 7.48 7.83 8.05 8.52 8.65
GB 3 99.5 98.2 99.5 100.4 101.9 104.3 107.0 108.9 110.5 111.1 113.5A roads
Scotland 22.3 22.0 22.0 21.7 21.8 22.0 22.4 23.0 23.4 23.0 23.6
GB 3 222.4 219.5 220.4 218.5 218.6 222.9 226.9 233.1 235.7 239.1 241.7All roads (incl. B, C, unclassified)
Scotland 44.2 43.5 43.4 43.6 43.9 45.0 45.6 46.7 48.0 48.2 48.7
GB 3 495.8 492.1 496.1 497.3 502.0 518.5 530.4 544.3 555.5 562.5 573.8
Reported Road Accident Casualties: Killed or Seriously Injured 12 thousand
Scotland 12 2.50 2.18 2.06 2.16 1.84 1.90 1.77 1.89 1.74 1.75 2.18
GB 1 26.9 24.5 25.0 24.8 23.4 24.6 23.9 25.9 26.6 27.3 27.7
Local bus passenger journeys 2, 4 millionScotland 458 430 436 420 421 414 410 395 390 378 366GB 5,188 5,164 5,191 5,099 5,201 5,142 5,023 4,935 4,838 4,787 4,524
Rail passenger journeys 4, 5, 6 millionScotland 76.5 79.5 83.3 85.8 86.7 91.7 93.4 94.2 97.1 97.0 ..
GB 10, 11 1,065 1,160 1,228 1,269 1,333 1,393 1,464 1,470 1,476 1,520 ..
Air terminal passengers Scotland 22.5 20.9 22.1 22.2 23.3 24.1 25.5 26.9 28.8 29.4 28.9UK 217.7 210.3 219.0 220.4 228.2 238.2 251.3 268.2 284.4 292.1 296.7
Freight Lifted million tonnes
Road 8, 9
Scotland 132 132 135 137 125 123 133 140 123 129 117UK 1,356 1,489 1,457 1,427 1,316 1,322 1,445 1,434 1,397 1,405 1,440
Rail 4
Scotland 13 9.69 8.33 9.87 8.43 .. .. .. .. .. 4.45 4.28GB 87 90 102 113 117 111 86 79 75 75 70
Coastwise trafficScotland 19.8 18.0 16.3 12.5 11.4 11.8 14.2 .. .. .. ..UK 54.6 50.5 49.3 42.8 37.9 39.5 42.6 39.7 34.6 .. ..
Pipelines 7
Scotland 27.6 27.6 27.8 28.2 .. .. .. .. .. .. ..
GB 53.6 53.5 53.7 54.3 .. .. .. .. .. .. ..
Travel to Work (Autumn: Labour Force Survey) percentCar (or van, minibus, works van)
Scotland 70 71 68 68 69 69 70 71 70 70 70 GB 70 70 68 69 68 69 68 68 68 68 68
Public transport (bus, rail, underground)Scotland 15 14 16 15 16 15 15 14 14 14 14 GB 15 15 16 16 16 16 17 17 18 17 18
1 Figures are for combined years e.g. 2011 covers 2011/12. 2 DfT revised its methodlogy from 2004, causing a break in the series.3 The GB figures relate to motor vehicle traffic only, and therefore exclude a small amount of pedal cycle traffic. Figures from 2010 have been revised
to take acount of the minor road benchmarking exercise. Further details available at: https://www.gov.uk/government/publications/road-traffic-statistics-minor-road-benchmarking
4 Financial years5 Total passenger figures are produced by the ORR and have not been adjusted to reflect ScotRail's revised zonecard methdology. 6 Figures are based on the origin and destination of trips and do not count stages of these trips separately. 7 The estimated amounts of crude oil and products carried by pipelines over 50km in length. 2012 figures are provisional. 8 These figures are for freight lifted by Heavy Goods Vehicles. The GB figures are for freight transported within GB; the Scottish
figures include small amounts of freight destined for Northern Ireland and outside the UK. 9 Domestic freight estimates for 2006 to 2009 were revised on 27 October 2011.10 Figs for 2008-09 onwards have been revised due to an error in the LENNON calculation of journeys between Edinburgh and Glasgow. 11 Figures are based on the origin and destination of trips and do not count stages of these trips separately12 Due to changes in the the way casualty severities are recorded, killed/serious figures in 2019 are not comparable with previous years.13 The figures from 2018 onwards are not comparable with previous figures, as they are collected in a different way.
27
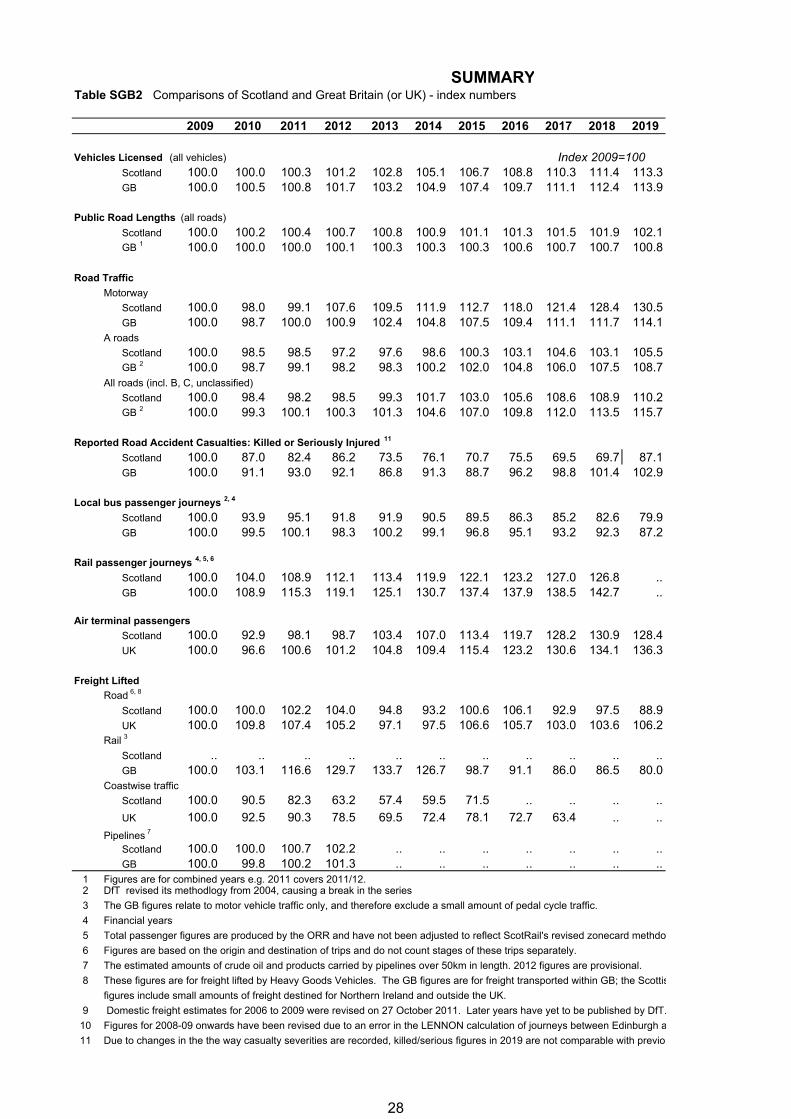
SUMMARYTable SGB2 Comparisons of Scotland and Great Britain (or UK) - index numbers
2009 2010 2011 2012 2013 2014 2015 2016 2017 2018 2019
Vehicles Licensed (all vehicles) Index 2009=100Scotland 100.0 100.0 100.3 101.2 102.8 105.1 106.7 108.8 110.3 111.4 113.3GB 100.0 100.5 100.8 101.7 103.2 104.9 107.4 109.7 111.1 112.4 113.9
Public Road Lengths (all roads)
Scotland 100.0 100.2 100.4 100.7 100.8 100.9 101.1 101.3 101.5 101.9 102.1GB 1 100.0 100.0 100.0 100.1 100.3 100.3 100.3 100.6 100.7 100.7 100.8
Road Traffic
Motorway
Scotland 100.0 98.0 99.1 107.6 109.5 111.9 112.7 118.0 121.4 128.4 130.5GB 100.0 98.7 100.0 100.9 102.4 104.8 107.5 109.4 111.1 111.7 114.1
A roads
Scotland 100.0 98.5 98.5 97.2 97.6 98.6 100.3 103.1 104.6 103.1 105.5GB 2 100.0 98.7 99.1 98.2 98.3 100.2 102.0 104.8 106.0 107.5 108.7
All roads (incl. B, C, unclassified)
Scotland 100.0 98.4 98.2 98.5 99.3 101.7 103.0 105.6 108.6 108.9 110.2GB 2 100.0 99.3 100.1 100.3 101.3 104.6 107.0 109.8 112.0 113.5 115.7
Reported Road Accident Casualties: Killed or Seriously Injured 11
Scotland 100.0 87.0 82.4 86.2 73.5 76.1 70.7 75.5 69.5 69.7 87.1GB 100.0 91.1 93.0 92.1 86.8 91.3 88.7 96.2 98.8 101.4 102.9
Local bus passenger journeys 2, 4
Scotland 100.0 93.9 95.1 91.8 91.9 90.5 89.5 86.3 85.2 82.6 79.9GB 100.0 99.5 100.1 98.3 100.2 99.1 96.8 95.1 93.2 92.3 87.2
Rail passenger journeys 4, 5, 6
Scotland 100.0 104.0 108.9 112.1 113.4 119.9 122.1 123.2 127.0 126.8 ..GB 100.0 108.9 115.3 119.1 125.1 130.7 137.4 137.9 138.5 142.7 ..
Air terminal passengers
Scotland 100.0 92.9 98.1 98.7 103.4 107.0 113.4 119.7 128.2 130.9 128.4UK 100.0 96.6 100.6 101.2 104.8 109.4 115.4 123.2 130.6 134.1 136.3
Freight Lifted
Road 6, 8
Scotland 100.0 100.0 102.2 104.0 94.8 93.2 100.6 106.1 92.9 97.5 88.9UK 100.0 109.8 107.4 105.2 97.1 97.5 106.6 105.7 103.0 103.6 106.2
Rail 3
Scotland .. .. .. .. .. .. .. .. .. .. ..GB 100.0 103.1 116.6 129.7 133.7 126.7 98.7 91.1 86.0 86.5 80.0
Coastwise traffic
Scotland 100.0 90.5 82.3 63.2 57.4 59.5 71.5 .. .. .. ..
UK 100.0 92.5 90.3 78.5 69.5 72.4 78.1 72.7 63.4 .. ..
Pipelines 7
Scotland 100.0 100.0 100.7 102.2 .. .. .. .. .. .. ..GB 100.0 99.8 100.2 101.3 .. .. .. .. .. .. ..
1 Figures are for combined years e.g. 2011 covers 2011/12. 2 DfT revised its methodlogy from 2004, causing a break in the series
3 The GB figures relate to motor vehicle traffic only, and therefore exclude a small amount of pedal cycle traffic.
4 Financial years
5 Total passenger figures are produced by the ORR and have not been adjusted to reflect ScotRail's revised zonecard methdo
6 Figures are based on the origin and destination of trips and do not count stages of these trips separately.
7 The estimated amounts of crude oil and products carried by pipelines over 50km in length. 2012 figures are provisional.
8 These figures are for freight lifted by Heavy Goods Vehicles. The GB figures are for freight transported within GB; the Scottis
figures include small amounts of freight destined for Northern Ireland and outside the UK.
9 Domestic freight estimates for 2006 to 2009 were revised on 27 October 2011. Later years have yet to be published by DfT.
10 Figures for 2008-09 onwards have been revised due to an error in the LENNON calculation of journeys between Edinburgh a
11 Due to changes in the the way casualty severities are recorded, killed/serious figures in 2019 are not comparable with previo
28
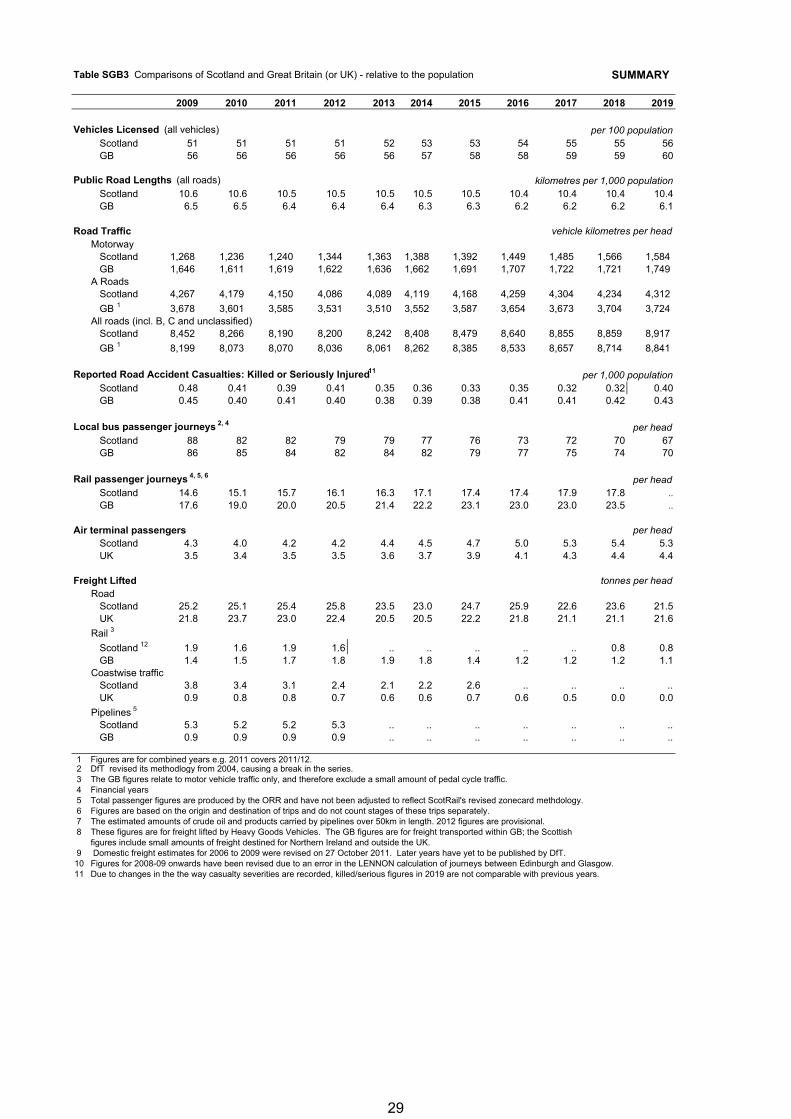
Table SGB3 Comparisons of Scotland and Great Britain (or UK) - relative to the population SUMMARY
2009 2010 2011 2012 2013 2014 2015 2016 2017 2018 2019
Vehicles Licensed (all vehicles) per 100 population
Scotland 51 51 51 51 52 53 53 54 55 55 56GB 56 56 56 56 56 57 58 58 59 59 60
Public Road Lengths (all roads) kilometres per 1,000 populationScotland 10.6 10.6 10.5 10.5 10.5 10.5 10.5 10.4 10.4 10.4 10.4GB 6.5 6.5 6.4 6.4 6.4 6.3 6.3 6.2 6.2 6.2 6.1
Road Traffic vehicle kilometres per headMotorway
Scotland 1,268 1,236 1,240 1,344 1,363 1,388 1,392 1,449 1,485 1,566 1,584 GB 1,646 1,611 1,619 1,622 1,636 1,662 1,691 1,707 1,722 1,721 1,749
A RoadsScotland 4,267 4,179 4,150 4,086 4,089 4,119 4,168 4,259 4,304 4,234 4,312
GB 1 3,678 3,601 3,585 3,531 3,510 3,552 3,587 3,654 3,673 3,704 3,724 All roads (incl. B, C and unclassified)
Scotland 8,452 8,266 8,190 8,200 8,242 8,408 8,479 8,640 8,855 8,859 8,917
GB 1 8,199 8,073 8,070 8,036 8,061 8,262 8,385 8,533 8,657 8,714 8,841
Reported Road Accident Casualties: Killed or Seriously Injured 11 per 1,000 populationScotland 0.48 0.41 0.39 0.41 0.35 0.36 0.33 0.35 0.32 0.32 0.40GB 0.45 0.40 0.41 0.40 0.38 0.39 0.38 0.41 0.41 0.42 0.43
Local bus passenger journeys 2, 4 per headScotland 88 82 82 79 79 77 76 73 72 70 67GB 86 85 84 82 84 82 79 77 75 74 70
Rail passenger journeys 4, 5, 6 per headScotland 14.6 15.1 15.7 16.1 16.3 17.1 17.4 17.4 17.9 17.8 ..
GB 17.6 19.0 20.0 20.5 21.4 22.2 23.1 23.0 23.0 23.5 ..
Air terminal passengers per headScotland 4.3 4.0 4.2 4.2 4.4 4.5 4.7 5.0 5.3 5.4 5.3UK 3.5 3.4 3.5 3.5 3.6 3.7 3.9 4.1 4.3 4.4 4.4
Freight Lifted tonnes per headRoad
Scotland 25.2 25.1 25.4 25.8 23.5 23.0 24.7 25.9 22.6 23.6 21.5UK 21.8 23.7 23.0 22.4 20.5 20.5 22.2 21.8 21.1 21.1 21.6
Rail 3
Scotland 12 1.9 1.6 1.9 1.6 .. .. .. .. .. 0.8 0.8GB 1.4 1.5 1.7 1.8 1.9 1.8 1.4 1.2 1.2 1.2 1.1
Coastwise trafficScotland 3.8 3.4 3.1 2.4 2.1 2.2 2.6 .. .. .. ..UK 0.9 0.8 0.8 0.7 0.6 0.6 0.7 0.6 0.5 0.0 0.0
Pipelines 5
Scotland 5.3 5.2 5.2 5.3 .. .. .. .. .. .. ..GB 0.9 0.9 0.9 0.9 .. .. .. .. .. .. ..
1 Figures are for combined years e.g. 2011 covers 2011/12. 2 DfT revised its methodlogy from 2004, causing a break in the series.3 The GB figures relate to motor vehicle traffic only, and therefore exclude a small amount of pedal cycle traffic.4 Financial years5 Total passenger figures are produced by the ORR and have not been adjusted to reflect ScotRail's revised zonecard methdology. 6 Figures are based on the origin and destination of trips and do not count stages of these trips separately. 7 The estimated amounts of crude oil and products carried by pipelines over 50km in length. 2012 figures are provisional. 8 These figures are for freight lifted by Heavy Goods Vehicles. The GB figures are for freight transported within GB; the Scottish
figures include small amounts of freight destined for Northern Ireland and outside the UK. 9 Domestic freight estimates for 2006 to 2009 were revised on 27 October 2011. Later years have yet to be published by DfT.10 Figures for 2008-09 onwards have been revised due to an error in the LENNON calculation of journeys between Edinburgh and Glasgow. 11 Due to changes in the the way casualty severities are recorded, killed/serious figures in 2019 are not comparable with previous years.
29
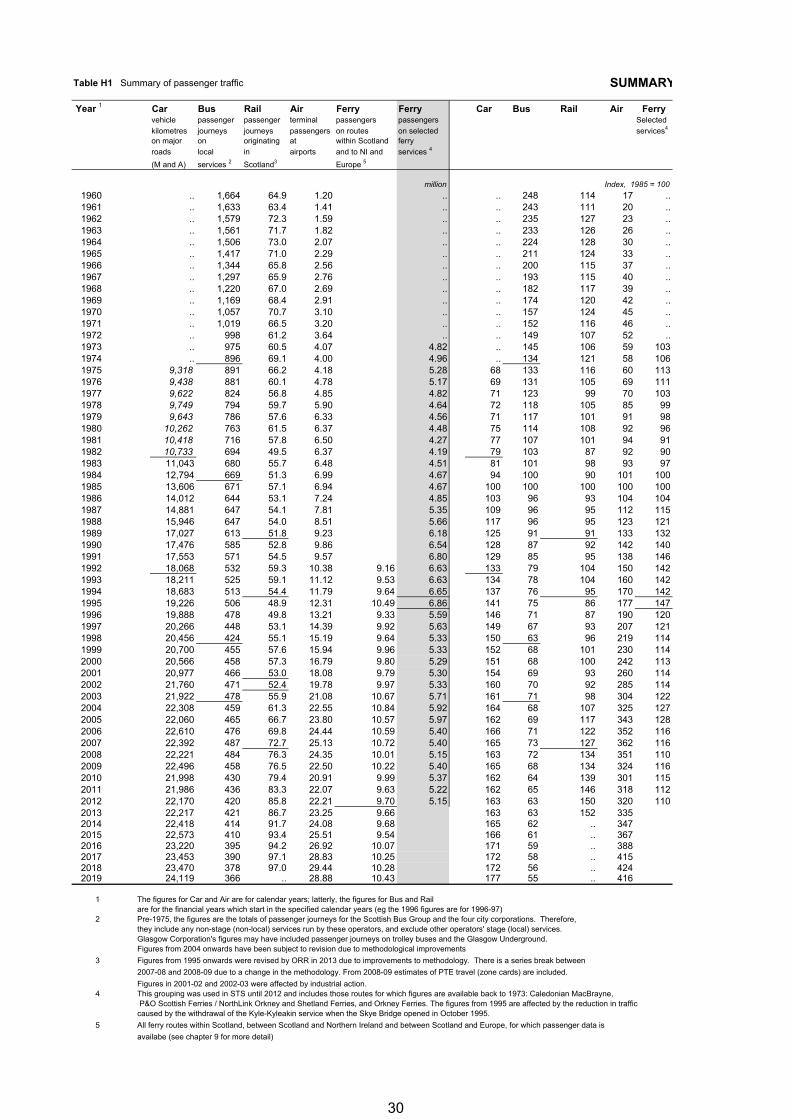
Table H1 Summary of passenger traffic SUMMARY
Year 1 Car Bus Rail Air Ferry Ferry Car Bus Rail Air Ferryvehicle passenger passenger terminal passengers passengers Selected
kilometres journeys journeys passengers on routes on selected services4
on major on originating at within Scotland ferry
roads local in airports and to NI and services 4
(M and A) services 2 Scotland3 Europe 5
million Index, 1985 = 100
1960 .. 1,664 64.9 1.20 .. .. 248 114 17 ..1961 .. 1,633 63.4 1.41 .. .. 243 111 20 ..1962 .. 1,579 72.3 1.59 .. .. 235 127 23 ..1963 .. 1,561 71.7 1.82 .. .. 233 126 26 ..1964 .. 1,506 73.0 2.07 .. .. 224 128 30 ..1965 .. 1,417 71.0 2.29 .. .. 211 124 33 ..1966 .. 1,344 65.8 2.56 .. .. 200 115 37 ..1967 .. 1,297 65.9 2.76 .. .. 193 115 40 ..1968 .. 1,220 67.0 2.69 .. .. 182 117 39 ..1969 .. 1,169 68.4 2.91 .. .. 174 120 42 ..1970 .. 1,057 70.7 3.10 .. .. 157 124 45 ..1971 .. 1,019 66.5 3.20 .. .. 152 116 46 ..1972 .. 998 61.2 3.64 .. .. 149 107 52 ..1973 .. 975 60.5 4.07 4.82 .. 145 106 59 1031974 .. 896 69.1 4.00 4.96 .. 134 121 58 1061975 9,318 891 66.2 4.18 5.28 68 133 116 60 1131976 9,438 881 60.1 4.78 5.17 69 131 105 69 1111977 9,622 824 56.8 4.85 4.82 71 123 99 70 1031978 9,749 794 59.7 5.90 4.64 72 118 105 85 991979 9,643 786 57.6 6.33 4.56 71 117 101 91 981980 10,262 763 61.5 6.37 4.48 75 114 108 92 961981 10,418 716 57.8 6.50 4.27 77 107 101 94 911982 10,733 694 49.5 6.37 4.19 79 103 87 92 901983 11,043 680 55.7 6.48 4.51 81 101 98 93 971984 12,794 669 51.3 6.99 4.67 94 100 90 101 1001985 13,606 671 57.1 6.94 4.67 100 100 100 100 1001986 14,012 644 53.1 7.24 4.85 103 96 93 104 1041987 14,881 647 54.1 7.81 5.35 109 96 95 112 1151988 15,946 647 54.0 8.51 5.66 117 96 95 123 1211989 17,027 613 51.8 9.23 6.18 125 91 91 133 1321990 17,476 585 52.8 9.86 6.54 128 87 92 142 1401991 17,553 571 54.5 9.57 6.80 129 85 95 138 1461992 18,068 532 59.3 10.38 9.16 6.63 133 79 104 150 1421993 18,211 525 59.1 11.12 9.53 6.63 134 78 104 160 1421994 18,683 513 54.4 11.79 9.64 6.65 137 76 95 170 1421995 19,226 506 48.9 12.31 10.49 6.86 141 75 86 177 1471996 19,888 478 49.8 13.21 9.33 5.59 146 71 87 190 1201997 20,266 448 53.1 14.39 9.92 5.63 149 67 93 207 1211998 20,456 424 55.1 15.19 9.64 5.33 150 63 96 219 1141999 20,700 455 57.6 15.94 9.96 5.33 152 68 101 230 1142000 20,566 458 57.3 16.79 9.80 5.29 151 68 100 242 1132001 20,977 466 53.0 18.08 9.79 5.30 154 69 93 260 1142002 21,760 471 52.4 19.78 9.97 5.33 160 70 92 285 1142003 21,922 478 55.9 21.08 10.67 5.71 161 71 98 304 1222004 22,308 459 61.3 22.55 10.84 5.92 164 68 107 325 1272005 22,060 465 66.7 23.80 10.57 5.97 162 69 117 343 1282006 22,610 476 69.8 24.44 10.59 5.40 166 71 122 352 1162007 22,392 487 72.7 25.13 10.72 5.40 165 73 127 362 1162008 22,221 484 76.3 24.35 10.01 5.15 163 72 134 351 1102009 22,496 458 76.5 22.50 10.22 5.40 165 68 134 324 1162010 21,998 430 79.4 20.91 9.99 5.37 162 64 139 301 1152011 21,986 436 83.3 22.07 9.63 5.22 162 65 146 318 1122012 22,170 420 85.8 22.21 9.70 5.15 163 63 150 320 1102013 22,217 421 86.7 23.25 9.66 163 63 152 3352014 22,418 414 91.7 24.08 9.68 165 62 .. 3472015 22,573 410 93.4 25.51 9.54 166 61 .. 3672016 23,220 395 94.2 26.92 10.07 171 59 .. 3882017 23,453 390 97.1 28.83 10.25 172 58 .. 4152018 23,470 378 97.0 29.44 10.28 172 56 .. 4242019 24,119 366 .. 28.88 10.43 177 55 .. 416
1 The figures for Car and Air are for calendar years; latterly, the figures for Bus and Railare for the financial years which start in the specified calendar years (eg the 1996 figures are for 1996-97)
2 Pre-1975, the figures are the totals of passenger journeys for the Scottish Bus Group and the four city corporations. Therefore, they include any non-stage (non-local) services run by these operators, and exclude other operators' stage (local) services.Glasgow Corporation's figures may have included passenger journeys on trolley buses and the Glasgow Underground.Figures from 2004 onwards have been subject to revision due to methodological improvements
3 Figures from 1995 onwards were revised by ORR in 2013 due to improvements to methodology. There is a series break between
2007-08 and 2008-09 due to a change in the methodology. From 2008-09 estimates of PTE travel (zone cards) are included.
Figures in 2001-02 and 2002-03 were affected by industrial action.4 This grouping was used in STS until 2012 and includes those routes for which figures are available back to 1973: Caledonian MacBrayne,
P&O Scottish Ferries / NorthLink Orkney and Shetland Ferries, and Orkney Ferries. The figures from 1995 are affected by the reduction in traffic caused by the withdrawal of the Kyle-Kyleakin service when the Skye Bridge opened in October 1995.
5 All ferry routes within Scotland, between Scotland and Northern Ireland and between Scotland and Europe, for which passenger data is
availabe (see chapter 9 for more detail)
30
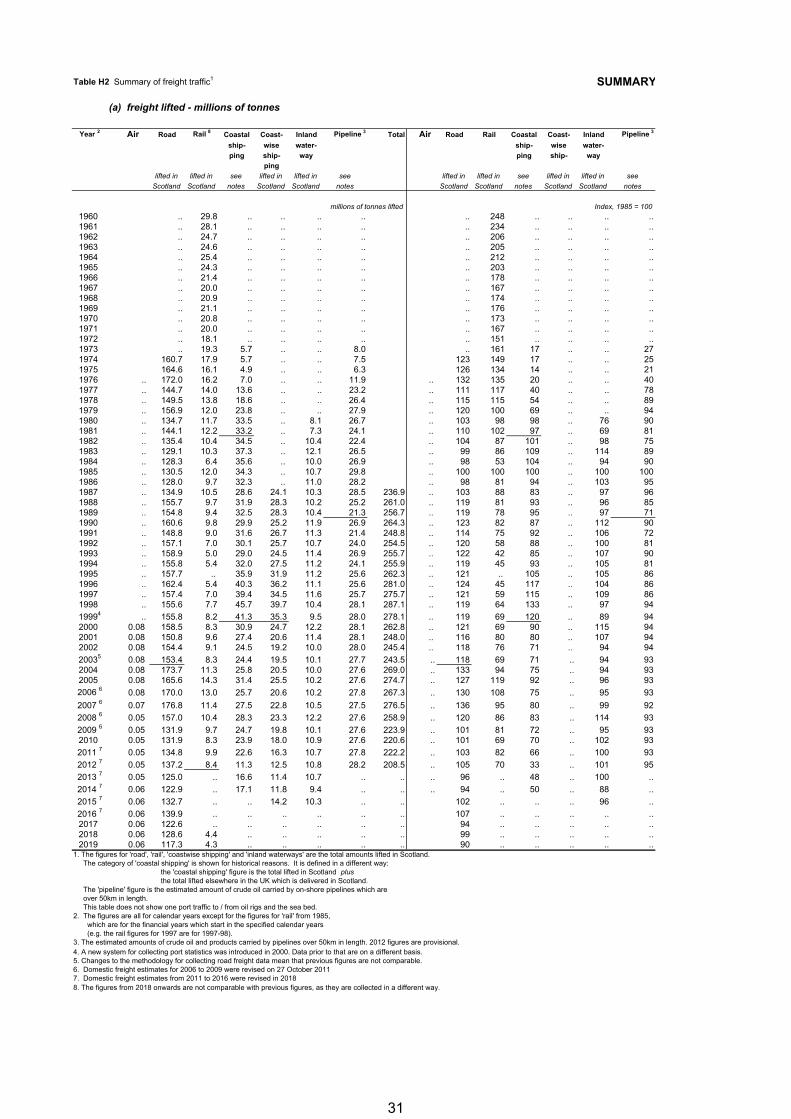
Table H2 Summary of freight traffic1 SUMMARY
(a) freight lifted - millions of tonnes
Year 2 Air Road Rail 8 Coastal Coast- Inland Pipeline 3 Total Air Road Rail Coastal Coast- Inland Pipeline 3
ship- wise water- ship- wise water-
ping ship- way ping ship- way
ping
lifted in lifted in see lifted in lifted in see lifted in lifted in see lifted in lifted in see
Scotland Scotland notes Scotland Scotland notes Scotland Scotland notes Scotland Scotland notes
millions of tonnes lifted Index, 1985 = 100
1960 .. 29.8 .. .. .. .. .. 248 .. .. .. ..1961 .. 28.1 .. .. .. .. .. 234 .. .. .. ..1962 .. 24.7 .. .. .. .. .. 206 .. .. .. ..1963 .. 24.6 .. .. .. .. .. 205 .. .. .. ..1964 .. 25.4 .. .. .. .. .. 212 .. .. .. ..1965 .. 24.3 .. .. .. .. .. 203 .. .. .. ..1966 .. 21.4 .. .. .. .. .. 178 .. .. .. ..1967 .. 20.0 .. .. .. .. .. 167 .. .. .. ..1968 .. 20.9 .. .. .. .. .. 174 .. .. .. ..1969 .. 21.1 .. .. .. .. .. 176 .. .. .. ..1970 .. 20.8 .. .. .. .. .. 173 .. .. .. ..1971 .. 20.0 .. .. .. .. .. 167 .. .. .. ..1972 .. 18.1 .. .. .. .. .. 151 .. .. .. ..1973 .. 19.3 5.7 .. .. 8.0 .. 161 17 .. .. 271974 160.7 17.9 5.7 .. .. 7.5 123 149 17 .. .. 251975 164.6 16.1 4.9 .. .. 6.3 126 134 14 .. .. 211976 .. 172.0 16.2 7.0 .. .. 11.9 .. 132 135 20 .. .. 401977 .. 144.7 14.0 13.6 .. .. 23.2 .. 111 117 40 .. .. 781978 .. 149.5 13.8 18.6 .. .. 26.4 .. 115 115 54 .. .. 891979 .. 156.9 12.0 23.8 .. .. 27.9 .. 120 100 69 .. .. 941980 .. 134.7 11.7 33.5 .. 8.1 26.7 .. 103 98 98 .. 76 901981 .. 144.1 12.2 33.2 .. 7.3 24.1 .. 110 102 97 .. 69 811982 .. 135.4 10.4 34.5 .. 10.4 22.4 .. 104 87 101 .. 98 751983 .. 129.1 10.3 37.3 .. 12.1 26.5 .. 99 86 109 .. 114 891984 .. 128.3 6.4 35.6 .. 10.0 26.9 .. 98 53 104 .. 94 901985 .. 130.5 12.0 34.3 .. 10.7 29.8 .. 100 100 100 .. 100 1001986 .. 128.0 9.7 32.3 .. 11.0 28.2 .. 98 81 94 .. 103 951987 .. 134.9 10.5 28.6 24.1 10.3 28.5 236.9 .. 103 88 83 .. 97 961988 .. 155.7 9.7 31.9 28.3 10.2 25.2 261.0 .. 119 81 93 .. 96 851989 .. 154.8 9.4 32.5 28.3 10.4 21.3 256.7 .. 119 78 95 .. 97 711990 .. 160.6 9.8 29.9 25.2 11.9 26.9 264.3 .. 123 82 87 .. 112 901991 .. 148.8 9.0 31.6 26.7 11.3 21.4 248.8 .. 114 75 92 .. 106 721992 .. 157.1 7.0 30.1 25.7 10.7 24.0 254.5 .. 120 58 88 .. 100 811993 .. 158.9 5.0 29.0 24.5 11.4 26.9 255.7 .. 122 42 85 .. 107 901994 .. 155.8 5.4 32.0 27.5 11.2 24.1 255.9 .. 119 45 93 .. 105 811995 .. 157.7 .. 35.9 31.9 11.2 25.6 262.3 .. 121 .. 105 .. 105 861996 .. 162.4 5.4 40.3 36.2 11.1 25.6 281.0 .. 124 45 117 .. 104 861997 .. 157.4 7.0 39.4 34.5 11.6 25.7 275.7 .. 121 59 115 .. 109 861998 .. 155.6 7.7 45.7 39.7 10.4 28.1 287.1 .. 119 64 133 .. 97 94
19994 .. 155.8 8.2 41.3 35.3 9.5 28.0 278.1 .. 119 69 120 .. 89 942000 0.08 158.5 8.3 30.9 24.7 12.2 28.1 262.8 .. 121 69 90 .. 115 942001 0.08 150.8 9.6 27.4 20.6 11.4 28.1 248.0 .. 116 80 80 .. 107 942002 0.08 154.4 9.1 24.5 19.2 10.0 28.0 245.4 .. 118 76 71 .. 94 94
20035 0.08 153.4 8.3 24.4 19.5 10.1 27.7 243.5 .. 118 69 71 .. 94 932004 0.08 173.7 11.3 25.8 20.5 10.0 27.6 269.0 .. 133 94 75 .. 94 932005 0.08 165.6 14.3 31.4 25.5 10.2 27.6 274.7 .. 127 119 92 .. 96 93
2006 6 0.08 170.0 13.0 25.7 20.6 10.2 27.8 267.3 .. 130 108 75 .. 95 93
2007 6 0.07 176.8 11.4 27.5 22.8 10.5 27.5 276.5 .. 136 95 80 .. 99 92
2008 6 0.05 157.0 10.4 28.3 23.3 12.2 27.6 258.9 .. 120 86 83 .. 114 93
2009 6 0.05 131.9 9.7 24.7 19.8 10.1 27.6 223.9 .. 101 81 72 .. 95 932010 0.05 131.9 8.3 23.9 18.0 10.9 27.6 220.6 .. 101 69 70 .. 102 93
2011 7 0.05 134.8 9.9 22.6 16.3 10.7 27.8 222.2 .. 103 82 66 .. 100 93
2012 7 0.05 137.2 8.4 11.3 12.5 10.8 28.2 208.5 .. 105 70 33 .. 101 95
2013 7 0.05 125.0 .. 16.6 11.4 10.7 .. .. .. 96 .. 48 .. 100 ..
2014 7 0.06 122.9 .. 17.1 11.8 9.4 .. .. .. 94 .. 50 .. 88 ..
2015 7 0.06 132.7 .. .. 14.2 10.3 .. .. 102 .. .. .. 96 ..
2016 7 0.06 139.9 .. .. .. .. .. .. 107 .. .. .. .. ..2017 0.06 122.6 .. .. .. .. .. .. 94 .. .. .. .. ..2018 0.06 128.6 4.4 .. .. .. .. .. 99 .. .. .. .. ..2019 0.06 117.3 4.3 .. .. .. .. .. 90 .. .. .. .. ..
1. The figures for 'road', 'rail', 'coastwise shipping' and 'inland waterways' are the total amounts lifted in Scotland. The category of 'coastal shipping' is shown for historical reasons. It is defined in a different way:
the 'coastal shipping' figure is the total lifted in Scotland plus the total lifted elsewhere in the UK which is delivered in Scotland.
The 'pipeline' figure is the estimated amount of crude oil carried by on-shore pipelines which are over 50km in length. This table does not show one port traffic to / from oil rigs and the sea bed.2. The figures are all for calendar years except for the figures for 'rail' from 1985, which are for the financial years which start in the specified calendar years (e.g. the rail figures for 1997 are for 1997-98).3. The estimated amounts of crude oil and products carried by pipelines over 50km in length. 2012 figures are provisional. 4. A new system for collecting port statistics was introduced in 2000. Data prior to that are on a different basis.5. Changes to the methodology for collecting road freight data mean that previous figures are not comparable.6. Domestic freight estimates for 2006 to 2009 were revised on 27 October 20117. Domestic freight estimates from 2011 to 2016 were revised in 20188. The figures from 2018 onwards are not comparable with previous figures, as they are collected in a different way.
31
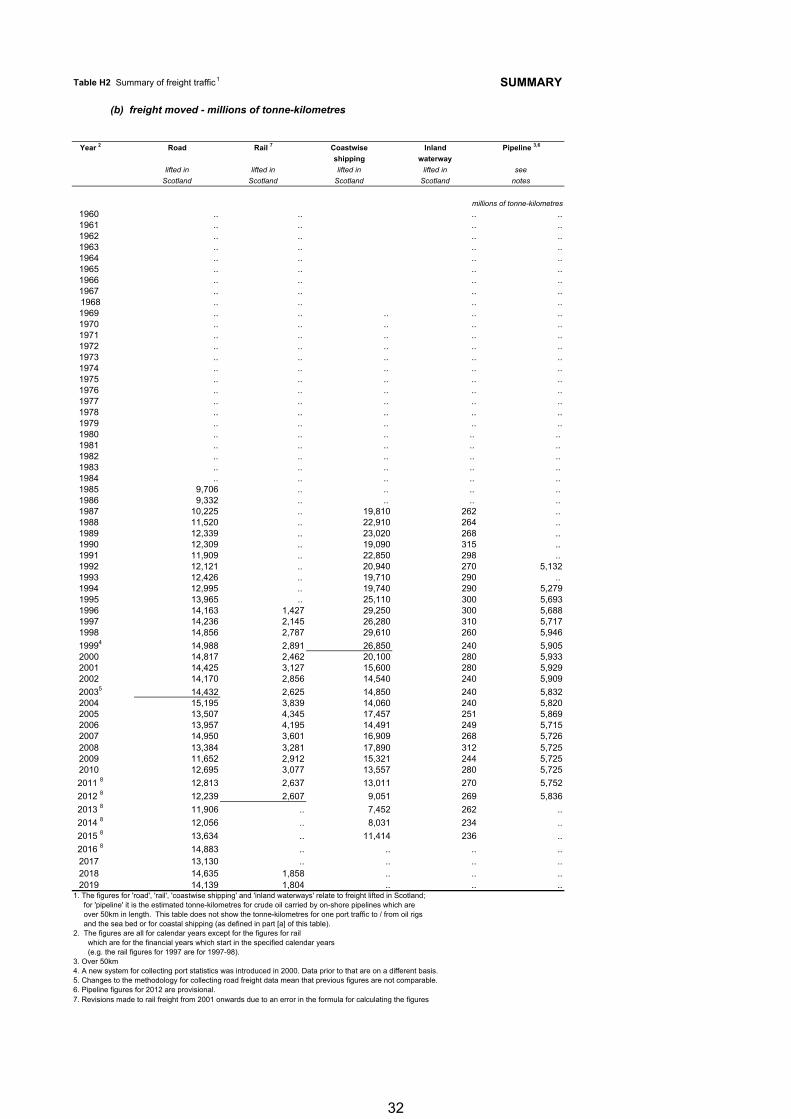
Table H2 Summary of freight traffic1 SUMMARY
(b) freight moved - millions of tonne-kilometres
Year 2 Road Rail 7 Coastwise Inland Pipeline 3,6
shipping waterway
lifted in lifted in lifted in lifted in see
Scotland Scotland Scotland Scotland notes
millions of tonne-kilometres
1960 .. .. .. ..1961 .. .. .. ..1962 .. .. .. ..1963 .. .. .. ..1964 .. .. .. ..1965 .. .. .. ..1966 .. .. .. ..1967 .. .. .. ..1968 .. .. .. ..1969 .. .. .. .. ..1970 .. .. .. .. ..1971 .. .. .. .. ..1972 .. .. .. .. ..1973 .. .. .. .. ..1974 .. .. .. .. ..1975 .. .. .. .. ..1976 .. .. .. .. ..1977 .. .. .. .. ..1978 .. .. .. .. ..1979 .. .. .. .. ..1980 .. .. .. .. ..1981 .. .. .. .. ..1982 .. .. .. .. ..1983 .. .. .. .. ..1984 .. .. .. .. ..1985 9,706 .. .. .. ..1986 9,332 .. .. .. ..1987 10,225 .. 19,810 262 ..1988 11,520 .. 22,910 264 ..1989 12,339 .. 23,020 268 ..1990 12,309 .. 19,090 315 ..1991 11,909 .. 22,850 298 ..1992 12,121 .. 20,940 270 5,1321993 12,426 .. 19,710 290 ..1994 12,995 .. 19,740 290 5,2791995 13,965 .. 25,110 300 5,6931996 14,163 1,427 29,250 300 5,6881997 14,236 2,145 26,280 310 5,7171998 14,856 2,787 29,610 260 5,946
19994 14,988 2,891 26,850 240 5,9052000 14,817 2,462 20,100 280 5,9332001 14,425 3,127 15,600 280 5,9292002 14,170 2,856 14,540 240 5,909
20035 14,432 2,625 14,850 240 5,8322004 15,195 3,839 14,060 240 5,8202005 13,507 4,345 17,457 251 5,8692006 13,957 4,195 14,491 249 5,7152007 14,950 3,601 16,909 268 5,7262008 13,384 3,281 17,890 312 5,7252009 11,652 2,912 15,321 244 5,7252010 12,695 3,077 13,557 280 5,725
2011 8 12,813 2,637 13,011 270 5,752
2012 8 12,239 2,607 9,051 269 5,836
2013 8 11,906 .. 7,452 262 ..
2014 8 12,056 .. 8,031 234 ..
2015 8 13,634 .. 11,414 236 ..
2016 8 14,883 .. .. .. ..2017 13,130 .. .. .. ..2018 14,635 1,858 .. .. ..2019 14,139 1,804 .. .. ..
1. The figures for 'road', 'rail', 'coastwise shipping' and 'inland waterways' relate to freight lifted in Scotland; for 'pipeline' it is the estimated tonne-kilometres for crude oil carried by on-shore pipelines which are over 50km in length. This table does not show the tonne-kilometres for one port traffic to / from oil rigs and the sea bed or for coastal shipping (as defined in part [a] of this table).2. The figures are all for calendar years except for the figures for rail which are for the financial years which start in the specified calendar years (e.g. the rail figures for 1997 are for 1997-98).3. Over 50km4. A new system for collecting port statistics was introduced in 2000. Data prior to that are on a different basis.5. Changes to the methodology for collecting road freight data mean that previous figures are not comparable.6. Pipeline figures for 2012 are provisional.7. Revisions made to rail freight from 2001 onwards due to an error in the formula for calculating the figures
32
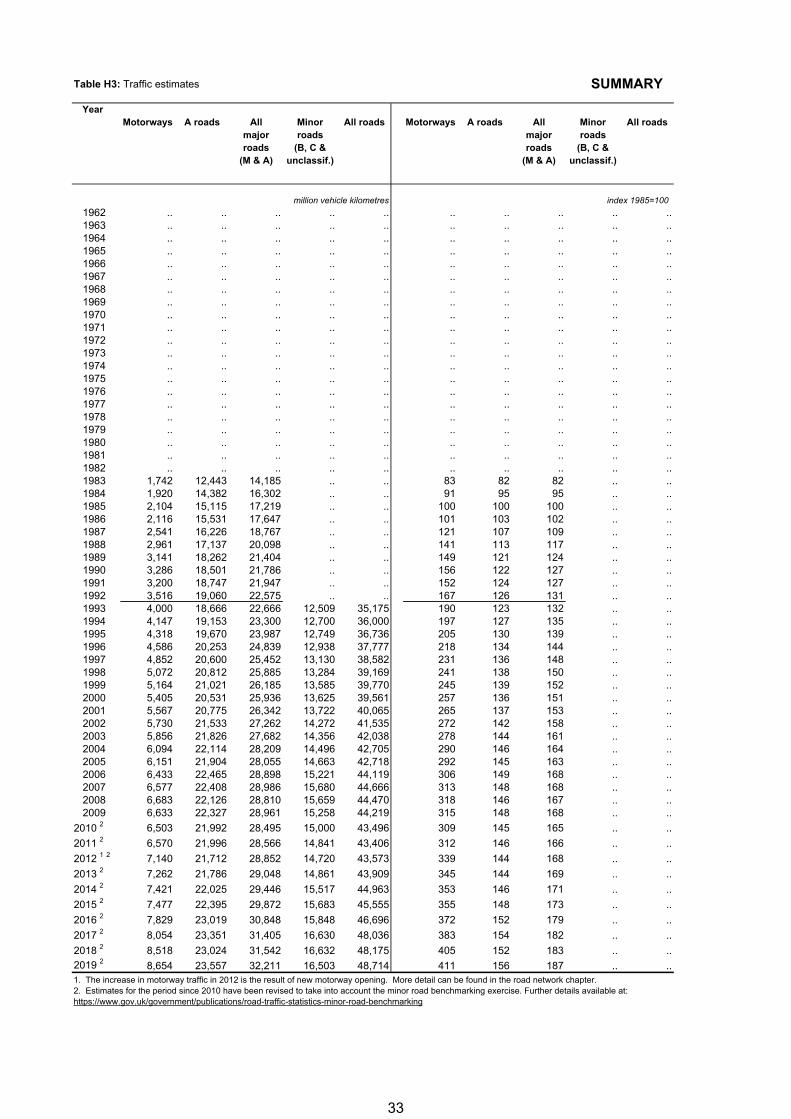
Table H3: Traffic estimates SUMMARY
Year Motorways A roads All Minor All roads Motorways A roads All Minor All roads
major roads major roadsroads (B, C & roads (B, C &
(M & A) unclassif.) (M & A) unclassif.)
million vehicle kilometres index 1985=100
1962 .. .. .. .. .. .. .. .. .. ..1963 .. .. .. .. .. .. .. .. .. ..1964 .. .. .. .. .. .. .. .. .. ..1965 .. .. .. .. .. .. .. .. .. ..1966 .. .. .. .. .. .. .. .. .. ..1967 .. .. .. .. .. .. .. .. .. ..1968 .. .. .. .. .. .. .. .. .. ..1969 .. .. .. .. .. .. .. .. .. ..1970 .. .. .. .. .. .. .. .. .. ..1971 .. .. .. .. .. .. .. .. .. ..1972 .. .. .. .. .. .. .. .. .. ..1973 .. .. .. .. .. .. .. .. .. ..1974 .. .. .. .. .. .. .. .. .. ..1975 .. .. .. .. .. .. .. .. .. ..1976 .. .. .. .. .. .. .. .. .. ..1977 .. .. .. .. .. .. .. .. .. ..1978 .. .. .. .. .. .. .. .. .. ..1979 .. .. .. .. .. .. .. .. .. ..1980 .. .. .. .. .. .. .. .. .. ..1981 .. .. .. .. .. .. .. .. .. ..1982 .. .. .. .. .. .. .. .. .. ..1983 1,742 12,443 14,185 .. .. 83 82 82 .. ..1984 1,920 14,382 16,302 .. .. 91 95 95 .. ..1985 2,104 15,115 17,219 .. .. 100 100 100 .. ..1986 2,116 15,531 17,647 .. .. 101 103 102 .. ..1987 2,541 16,226 18,767 .. .. 121 107 109 .. ..1988 2,961 17,137 20,098 .. .. 141 113 117 .. ..1989 3,141 18,262 21,404 .. .. 149 121 124 .. ..1990 3,286 18,501 21,786 .. .. 156 122 127 .. ..1991 3,200 18,747 21,947 .. .. 152 124 127 .. ..1992 3,516 19,060 22,575 .. .. 167 126 131 .. ..1993 4,000 18,666 22,666 12,509 35,175 190 123 132 .. ..1994 4,147 19,153 23,300 12,700 36,000 197 127 135 .. ..1995 4,318 19,670 23,987 12,749 36,736 205 130 139 .. ..1996 4,586 20,253 24,839 12,938 37,777 218 134 144 .. ..1997 4,852 20,600 25,452 13,130 38,582 231 136 148 .. ..1998 5,072 20,812 25,885 13,284 39,169 241 138 150 .. ..1999 5,164 21,021 26,185 13,585 39,770 245 139 152 .. ..2000 5,405 20,531 25,936 13,625 39,561 257 136 151 .. ..2001 5,567 20,775 26,342 13,722 40,065 265 137 153 .. ..2002 5,730 21,533 27,262 14,272 41,535 272 142 158 .. ..2003 5,856 21,826 27,682 14,356 42,038 278 144 161 .. ..2004 6,094 22,114 28,209 14,496 42,705 290 146 164 .. ..2005 6,151 21,904 28,055 14,663 42,718 292 145 163 .. ..2006 6,433 22,465 28,898 15,221 44,119 306 149 168 .. ..2007 6,577 22,408 28,986 15,680 44,666 313 148 168 .. ..2008 6,683 22,126 28,810 15,659 44,470 318 146 167 .. ..2009 6,633 22,327 28,961 15,258 44,219 315 148 168 .. ..
2010 2 6,503 21,992 28,495 15,000 43,496 309 145 165 .. ..
2011 2 6,570 21,996 28,566 14,841 43,406 312 146 166 .. ..
2012 1 2 7,140 21,712 28,852 14,720 43,573 339 144 168 .. ..
2013 2 7,262 21,786 29,048 14,861 43,909 345 144 169 .. ..
2014 2 7,421 22,025 29,446 15,517 44,963 353 146 171 .. ..
2015 2 7,477 22,395 29,872 15,683 45,555 355 148 173 .. ..
2016 2 7,829 23,019 30,848 15,848 46,696 372 152 179 .. ..
2017 2 8,054 23,351 31,405 16,630 48,036 383 154 182 .. ..
2018 2 8,518 23,024 31,542 16,632 48,175 405 152 183 .. ..
2019 2 8,654 23,557 32,211 16,503 48,714 411 156 187 .. ..1. The increase in motorway traffic in 2012 is the result of new motorway opening. More detail can be found in the road network chapter.2. Estimates for the period since 2010 have been revised to take into account the minor road benchmarking exercise. Further details available at: https://www.gov.uk/government/publications/road-traffic-statistics-minor-road-benchmarking
33
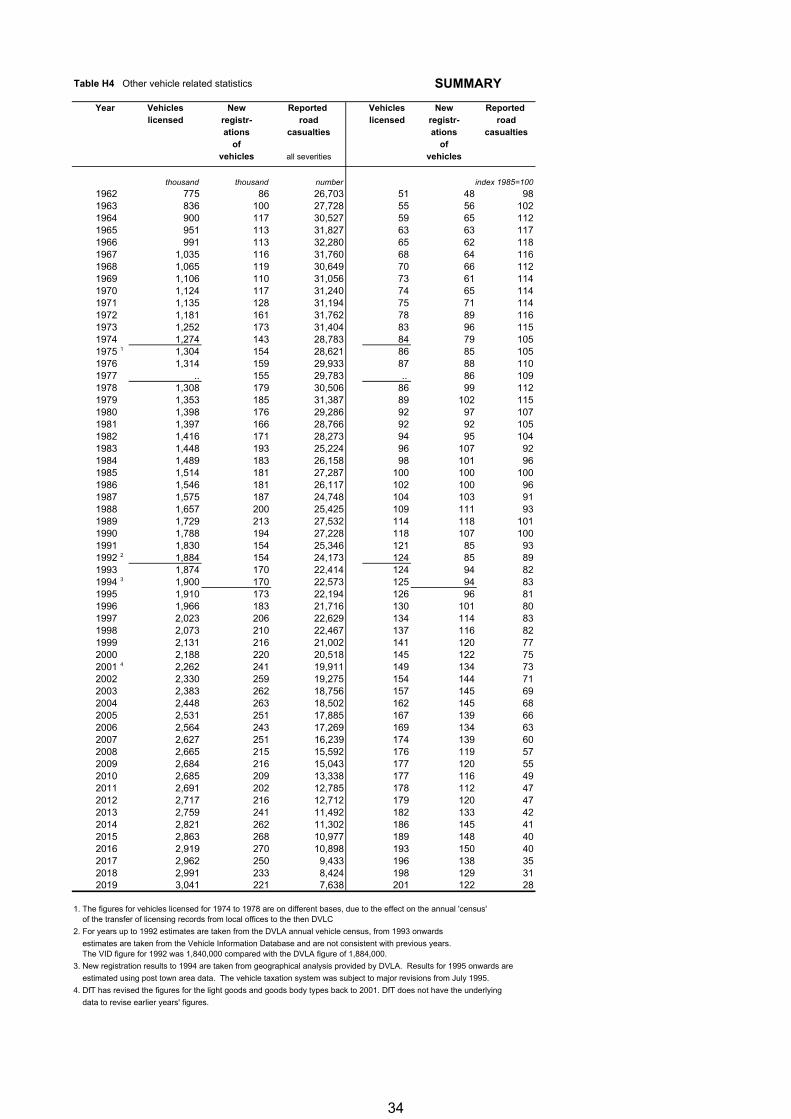
Table H4 Other vehicle related statistics SUMMARY
Year Vehicles New Reported Vehicles New Reported licensed registr- road licensed registr- road
ations casualties ations casualtiesof of
vehicles all severities vehicles
thousand thousand number index 1985=100
1962 775 86 26,703 51 48 981963 836 100 27,728 55 56 1021964 900 117 30,527 59 65 1121965 951 113 31,827 63 63 1171966 991 113 32,280 65 62 1181967 1,035 116 31,760 68 64 1161968 1,065 119 30,649 70 66 1121969 1,106 110 31,056 73 61 1141970 1,124 117 31,240 74 65 1141971 1,135 128 31,194 75 71 1141972 1,181 161 31,762 78 89 1161973 1,252 173 31,404 83 96 1151974 1,274 143 28,783 84 79 1051975 1 1,304 154 28,621 86 85 1051976 1,314 159 29,933 87 88 1101977 .. 155 29,783 .. 86 1091978 1,308 179 30,506 86 99 1121979 1,353 185 31,387 89 102 1151980 1,398 176 29,286 92 97 1071981 1,397 166 28,766 92 92 1051982 1,416 171 28,273 94 95 1041983 1,448 193 25,224 96 107 921984 1,489 183 26,158 98 101 961985 1,514 181 27,287 100 100 1001986 1,546 181 26,117 102 100 961987 1,575 187 24,748 104 103 911988 1,657 200 25,425 109 111 931989 1,729 213 27,532 114 118 1011990 1,788 194 27,228 118 107 1001991 1,830 154 25,346 121 85 931992 2 1,884 154 24,173 124 85 891993 1,874 170 22,414 124 94 821994 3 1,900 170 22,573 125 94 831995 1,910 173 22,194 126 96 811996 1,966 183 21,716 130 101 801997 2,023 206 22,629 134 114 831998 2,073 210 22,467 137 116 821999 2,131 216 21,002 141 120 772000 2,188 220 20,518 145 122 752001 4 2,262 241 19,911 149 134 732002 2,330 259 19,275 154 144 712003 2,383 262 18,756 157 145 692004 2,448 263 18,502 162 145 682005 2,531 251 17,885 167 139 662006 2,564 243 17,269 169 134 632007 2,627 251 16,239 174 139 602008 2,665 215 15,592 176 119 572009 2,684 216 15,043 177 120 552010 2,685 209 13,338 177 116 492011 2,691 202 12,785 178 112 472012 2,717 216 12,712 179 120 472013 2,759 241 11,492 182 133 422014 2,821 262 11,302 186 145 412015 2,863 268 10,977 189 148 402016 2,919 270 10,898 193 150 402017 2,962 250 9,433 196 138 352018 2,991 233 8,424 198 129 312019 3,041 221 7,638 201 122 28
1. The figures for vehicles licensed for 1974 to 1978 are on different bases, due to the effect on the annual 'census' of the transfer of licensing records from local offices to the then DVLC
2. For years up to 1992 estimates are taken from the DVLA annual vehicle census, from 1993 onwards
estimates are taken from the Vehicle Information Database and are not consistent with previous years. The VID figure for 1992 was 1,840,000 compared with the DVLA figure of 1,884,000.
3. New registration results to 1994 are taken from geographical analysis provided by DVLA. Results for 1995 onwards are
estimated using post town area data. The vehicle taxation system was subject to major revisions from July 1995.
4. DfT has revised the figures for the light goods and goods body types back to 2001. DfT does not have the underlying
data to revise earlier years' figures.
34

35
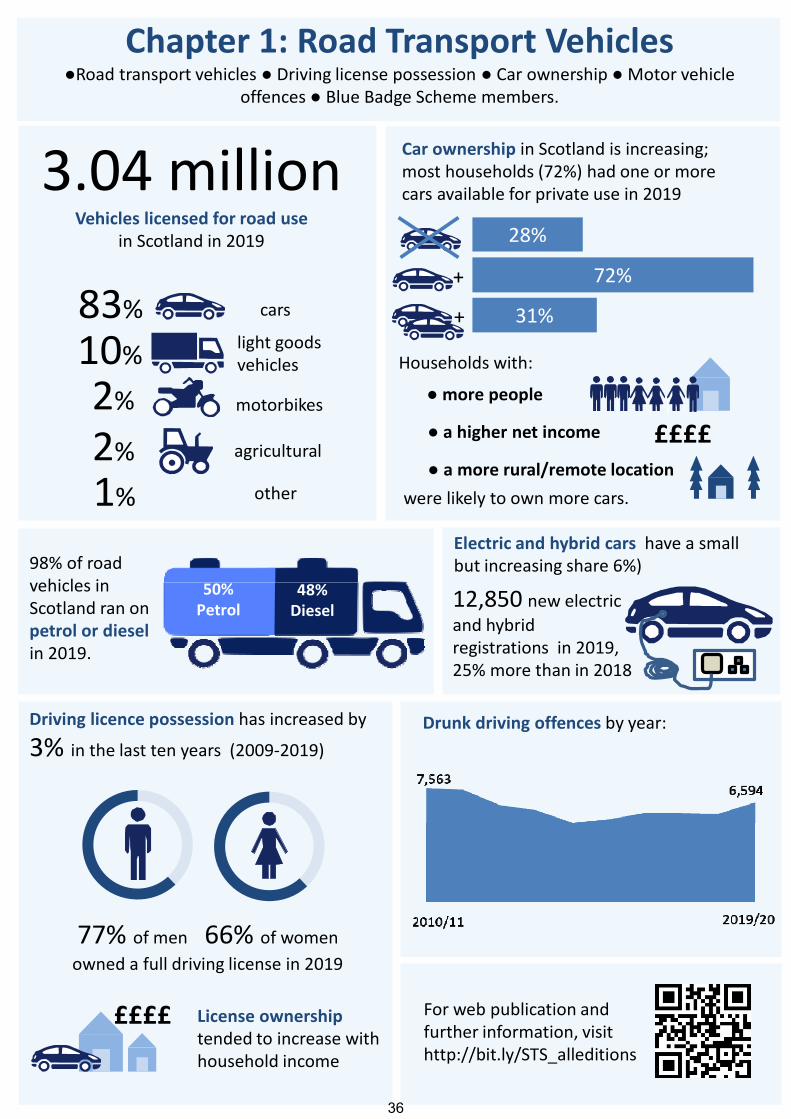
ROAD TRANSPORT VEHICLES
License ownership tended to increase with household income
Driving licence possession has increased by 3% in the last ten years (2009‐2019)
77% of men 66% of women
owned a full driving license in 2019
Chapter 1: Road Transport Vehicles●Road transport vehicles ● Driving license possession ● Car ownership ●Motor vehicle
offences ● Blue Badge Scheme members.
31%
72%
28%
Households with:
+
+
● more people
● a higher net income
● a more rural/remote location
Car ownership in Scotland is increasing; most households (72%) had one or more cars available for private use in 2019
££££
98% of road vehicles in Scotland ran on petrol or diesel in 2019.
Electric and hybrid cars have a small but increasing share 6%)
££££
3.04 millionVehicles licensed for road use
in Scotland in 2019
83% 10%
cars
light goods vehicles
2% 2%
motorbikes
agricultural
1% other
For web publication and further information, visithttp://bit.ly/STS_alleditions
Drunk driving offences by year:
12,850 new electric
and hybrid registrations in 2019,25% more than in 2018
were likely to own more cars.
50%Petrol
48%Diesel
36
ROAD TRANSPORT VEHICLES
ROAD TRANSPORT VEHICLES 1. Introduction This chapter provides information about the numbers of road transport vehicles, such as new registrations, numbers licensed by taxation group and council area, ages, cylinder sizes, methods of propulsion, gross weights of Heavy Goods Vehicles, seating capacity of public transport vehicles, licensing figures for taxi and private hire cars and their drivers and numbers of wheelchair accessible taxis. It also provides statistics of the most popular cars, results of the road vehicle testing scheme (MOT), driving tests, driving licence holders, households with the regular use of a car (from the Scottish Household Survey), the number of Blue Badges issued and information about motor vehicle offences recorded by the Police. Key Points
There were 3.04 million vehicles licensed for use on the roads in Scotland in 2019, of which 83 per cent were cars.
Over two thirds (71%) of the adult population (17+) held a full driving licence in 2019.
Seventy two per cent of households had access to one or more cars or vans in 2019; almost one third (31%) of households had access to two or more cars or vans.
2. Main Points Vehicles Licensed 2.1 The total number of new motor vehicles registrations in 2019 was around 220,746, 5% less than in 2018 and 2% more than 2009. (Table 1.1) 2.2 New registrations of cars in 2019 accounted for around 177,746 of these, around 10,000 (5%) less than in 2018, and 8,000 5%) less than 2009. Of all new registered vehicles in 2019, 127,726 (58%) were petrol-propelled, and 80,104 (36%) were diesel-propelled. The remaining new vehicles registered in 2019 were mostly electric or hybrid-electric vehicles, both these groups have seen steady increases in new registrations in recent years. In the last 10 years, only 2011, 2013, 2014, 2015 and 2016 saw more new diesel vehicles registered than petrol vehicles. More detailed data on vehicles registered in 2019 by body type and propulsion is included in Chapter 13. (Table 1.1) 2.3 The total number of vehicles licensed was 3.04 million in 2019, 2 per cent higher than 2018 and 13% higher than in 2009. The number of private and light goods vehicles in 2019 was 2.7 million, 2% more than 2018 and 15% higher than 2009. (Table 1.2) 2.4 Glasgow had the largest number of vehicles licensed as at the end of 2018 (237,961), followed by Fife (213,483) and Edinburgh (202,259) - based on the postcode of the registered keeper. Per head of population (aged 17+), Dundee had the third lowest figure behind Edinburgh and Glasgow. Dundee had 525 vehicles for every 1,000 people aged 17+, Glasgow was lowest at 452. Vehicle ownership per head was much higher in rural areas – Renfrewshire had 988 vehicles per 1,000 people aged 17+ , Orkney had 945 and Shetland had 922, the three areas in Scotland with the highest vehicle ownership by population. The Scotland average was 678 per thousand. The pattern for car registrations was similar with Glasgow lowest, but Renfrewshire had the highest figure per thousand population at 848, followed by Stirling at 762. The effect of the registration of company car fleets can be seen: Renfrewshire accounted for 26 per
37
ROAD TRANSPORT VEHICLES
cent (46,177) of all the company cars registered in Scotland, compared to 5 per cent of all cars. (Table 1.3) 2.5 There were 9,928 taxis and 14,177 private hire cars licensed in Scotland based on figures provided by Scottish local licensing authorities during October-November 2020. These show that licensed taxis have fallen by 225 and private hire cars have fallen by 94 compared with figures for 2019. Latest figures show that of the 9,928 licensed taxis, 4,951 (50%) are wheelchair accessible, slightly higher proportion and slight increase in the total number of accessible vehicles from the previous year. The proportion of wheelchair accessible vehicles varies across different authority areas. (Table 1.4) 2.6 The average age of private and light goods vehicles in 2019 was 6.8 years, slightly higher than last year, and continuing a trend of increasing average age since 2007. The average age of private and light goods vehicles continued to be lower in Scotland than for Great Britain as a whole. In 2019 the average age of these vehicles in Great Britain was 8.0 years. (Table 1.6) 2.7 There were 5,606 licensed operators of heavy goods vehicles in Scotland in December 2020 and 744 public service vehicle licence holders. Most HGV operators had few (if any) vehicles specified on the licence: 3,606 had 0-2 vehicles, 964 had 3-5 vehicles and 467 had 6-10 vehicles. Only 69 operators had between 51 and 100 vehicles specified on the licence as at December 2020. (Table 1.10) 2.8 The most popular new car sold in Scotland in 2019 was the Ford Fiesta with a market share of 3.9%. The top 5 most popular models had a total market share of 14% and the top 10, 22%. (Table 1.11) MOTs and Driving Tests 2.9 In 2019/20, about 34% of cars tested in the road vehicle testing scheme (MOT) were unsatisfactory, as were 14% of motor cycles. About 13% of cars tested had unsatisfactory suspension, 12% had unsatisfactory lamps, reflectors and electrical equipment and 12% had unsatisfactory brakes (a vehicle with more than one type of fault is counted against each of them). Seven per cent of motorcycles tested had unsatisfactory lamps and reflectors, 3% had unsatisfactory brakes and 3% had unsatisfactory structure and attachments. (Table 1.12) 2.10 There were 122,000 driving licence practical tests conducted in 2019, a decrease of 1% on 2018. The pass rate was 1% lower at 59%. The test centre at the Isle of Mull had the highest pass rate (88%), though only 17 tests were conducted, Pitlochry had the highest pass rate for centres where at least 100 tests were conducted (81%), while the lowest was at Glasgow (Anniesland) (38%). (Tables 1.13 & 1.14) 2.11 The Scottish Household Survey results for 2019 showed that 71% of adults over the age of 17 held a full driving license. Although men were more likely to hold a full driving licence than women in all age groups except 17-19, the difference between the proportions increased with age. For the 17-19 age group in 2019, the difference was 7 percentage points more for women. For 70-79 year olds there was a difference of 23 percentage points (men: 83%, women: 60%), which increased to 33 percentage points for those aged 80+ (men: 62%; women: 29%). (Tables 1.16 and 1.17) 2.12 SHS results also showed that the percentage of people holding a full driving licence tended to increase with household income. In 2019, 91% of adults aged 17+ living in households which had an annual net income of over £50,000 held a full driving
38
ROAD TRANSPORT VEHICLES
licence. In contrast, only 50% of adults who lived in households with an annual net income of up to £10,000 held a full driving licence. 2.13 License possession was also more likely in rural areas. In 2019, 63% of adults aged 17+ living in large urban areas held a full driving licence compared with 84% of those living in ‘Remote Rural’ areas (the Scottish Government urban/rural classification system used in the Survey is described in the Notes and Definitions section, page 225). (Table 1.16) Car Availability 2.14 The Scottish Household Survey shows that 72 per cent of households had access to one or more cars in 2019, a proportion that has remained relatively stable over the last five years. Nearly one third (31%) of households had access to two or more cars. (Table 1.19) These estimates were similar to results from the Scotland Census 2011, which suggested that 69% of households have access to one or more cars, with 27% having two or more cars. The Census also showed that slightly fewer men (21 per cent) than women (26 per cent) aged 16 and over lived in households with no cars or vans available. (Table 1.23) 2.15 The Scottish Household Survey also shows how the percentage of households with a car available for private use varies between different household types, income bands and type of area. In 2018, family (small or large) and large adult households were most likely to have access to at least one car (large family: 90%, small family: 91%, large adult: 91%). (note definitions of family types are included in the Notes and Definitions section, page 225) Least likely to have access to a car were single pensioner households (48%). The SHS also showed that 32% of large adult and 18% of large family households had 3 or more cars available for private use in 2019. (Table 1.20) The 2011 Census showed that married or cohabiting families with dependent children were most likely to have access to a car, at 92%, and single pensioner households were the least likely, at 36%. (Table 1.24) 2.16 Only 40% of households whose net annual income was up to £10,000 had one or more cars available for private use, compared with at least 80% of households whose annual net income were above £25,000. Sixty two per cent of households in large urban areas had cars, compared with 87-90% of those in rural areas. (Table 1.20) 2.17 The car ownership statistics from the SHS can be supplemented with information on equalities from the 2011 Census. This shows that the proportion of households with no car or van available was generally higher for those where the Household Reference Person (HRP)1 was from a minority ethnic group; within this group it was highest for households where the HRP was from the ‘African’ (60 per cent) or ‘Caribbean or Black’ (49 per cent) ethnic groups. Additionally, of the 473,000 people in households who had a long-term health problem or disability that limited their day-to-day activities a lot, 46 per cent lived in households with no cars or vans available. The corresponding proportion was 34 per cent for the 523,000 people whose day-day activities were limited a little and 19 per cent for the 4.2 million people who had no limiting long-term health problem. (Table 1.25) 2.18 There were 248,073 Blue Badges on issue in Scotland at the end of March 2020. 115,104 were issued to recipients of allowances or grants which provide an automatic entitlement to a Blue Badge, 130,344 were issued on a discretionary basis to other
1 The ‘Household Reference Person’, or HRP, was introduced in the 2001 Census to replace the concept of the ‘head of the household’. This allows a household to be further characterised using the properties of the HRP. The HRP is taken as the adult in the household with the highest economic activity – if the two people have the same economic activity then the oldest becomes the HRP.
39
ROAD TRANSPORT VEHICLES
people with a permanent or substantial disability, and 2,625 were issued to institutions. (Table 1.21) Motor Vehicle Offences 2.19 The numbers of motor vehicle offences recorded by the police include offences in respect of which either the police or the procurator fiscal made a conditional offer of a fixed penalty (mainly moving vehicle offences). They do not include stationary vehicle offences which are dealt with by the police or traffic wardens by means of fixed penalty notices (mainly parking offences). 2.20 Following the establishment of Police Scotland, data for 2013-14 onwards are returned from one central unit within Police Scotland using their management information system. Prior to 2013-14, data were returned by the eight legacy police force areas. An extensive quality assurance exercise was carried out by the Scottish Government to ensure that the dataset produced from the new system is consistent with data returned from the legacy police forces. 2.21 This exercise identified a number of anomalies affecting comparability of the time series resulting in breaks in the series. Further information about these discontinuities can be found in the Technical report, entitled Recorded Crime: Comparability of Police Scotland and Legacy Force Data, available from http://www.gov.scot/Topics/Statistics/Browse/Crime-Justice/PubRecordedCrime/ TechnicalReport. 2.22 The total number of motor vehicle offences recorded in 2019-20 was 121,907 (Table 1.22). 2.23 This year’s figures include two new offences: driving or being in charge of a motor vehicle with concentration of a specified controlled drug above a specified limit. These were introduced due to changes to the Road Traffic Act 1988 which came into force on 21st October 2019. 616 of these new offences were recorded in 2019-20. While offences of driving or being in charge of a motor vehicle while impaired through alcohol or drugs already existed, evidence of impaired driving is not required for the new offences. This may have resulted in additional offences being recorded in relation to drug driving. 2.24 The total number of motor vehicle offences recorded increased by 4% between 2018-19 and 2019-20; changes in these figures may arise because of changes in the level of enforcement or police deployment. The largest decreases were for mobile phone offences (15% decrease from 2,895 to 2,450, lighting offences (19% decrease from 1,553 to 1,256) and traffic direction offences (6% decrease from 4,133 to 3,870). The largest increases were for Other speeding offences (9% increase from 17,194 to 18,784) and No test certificate (7% increase from 14,020 to 14,987 (Table 1.22).
40
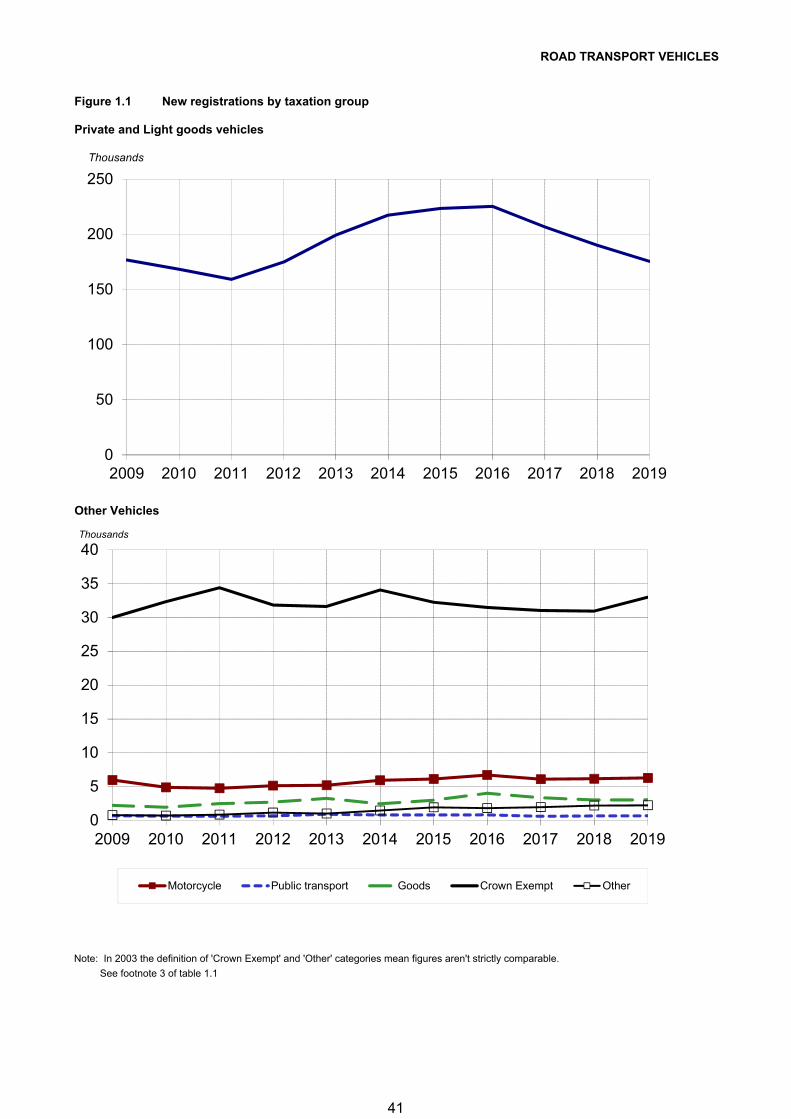
ROAD TRANSPORT VEHICLES
Figure 1.1 New registrations by taxation group
Private and Light goods vehicles
Other Vehicles
Note: In 2003 the definition of 'Crown Exempt' and 'Other' categories mean figures aren't strictly comparable.
See footnote 3 of table 1.1
0
50
100
150
200
250
2009 2010 2011 2012 2013 2014 2015 2016 2017 2018 2019
0
5
10
15
20
25
30
35
40
2009 2010 2011 2012 2013 2014 2015 2016 2017 2018 2019
Motorcycle Public transport Goods Crown Exempt Other
Thousands
Thousands
41
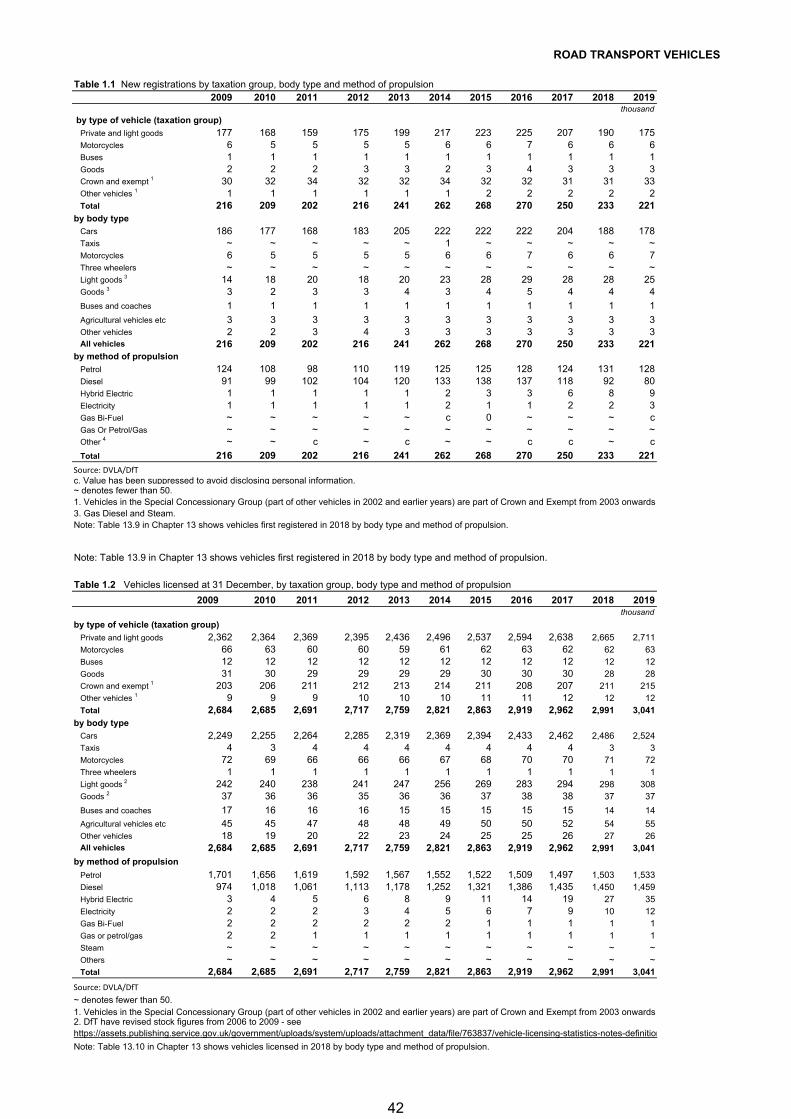
ROAD TRANSPORT VEHICLES
Table 1.1 New registrations by taxation group, body type and method of propulsion 2009 2010 2011 2012 2013 2014 2015 2016 2017 2018 2019
thousand
by type of vehicle (taxation group)
Private and light goods 177 168 159 175 199 217 223 225 207 190 175Motorcycles 6 5 5 5 5 6 6 7 6 6 6Buses 1 1 1 1 1 1 1 1 1 1 1Goods 2 2 2 3 3 2 3 4 3 3 3Crown and exempt 1 30 32 34 32 32 34 32 32 31 31 33Other vehicles 1 1 1 1 1 1 1 2 2 2 2 2Total 216 209 202 216 241 262 268 270 250 233 221
by body type
Cars 186 177 168 183 205 222 222 222 204 188 178Taxis ~ ~ ~ ~ ~ 1 ~ ~ ~ ~ ~Motorcycles 6 5 5 5 5 6 6 7 6 6 7Three wheelers ~ ~ ~ ~ ~ ~ ~ ~ ~ ~ ~Light goods 3 14 18 20 18 20 23 28 29 28 28 25Goods 3 3 2 3 3 4 3 4 5 4 4 4
Buses and coaches 1 1 1 1 1 1 1 1 1 1 1
Agricultural vehicles etc 3 3 3 3 3 3 3 3 3 3 3Other vehicles 2 2 3 4 3 3 3 3 3 3 3All vehicles 216 209 202 216 241 262 268 270 250 233 221
by method of propulsion
Petrol 124 108 98 110 119 125 125 128 124 131 128Diesel 91 99 102 104 120 133 138 137 118 92 80Hybrid Electric 1 1 1 1 1 2 3 3 6 8 9Electricity 1 1 1 1 1 2 1 1 2 2 3Gas Bi-Fuel ~ ~ ~ ~ ~ c 0 ~ ~ ~ cGas Or Petrol/Gas ~ ~ ~ ~ ~ ~ ~ ~ ~ ~ ~Other 4 ~ ~ c ~ c ~ ~ c c ~ c
Total 216 209 202 216 241 262 268 270 250 233 221
Source: DVLA/DfTc. Value has been suppressed to avoid disclosing personal information.~ denotes fewer than 50.1. Vehicles in the Special Concessionary Group (part of other vehicles in 2002 and earlier years) are part of Crown and Exempt from 2003 onwards 3. Gas Diesel and Steam.Note: Table 13.9 in Chapter 13 shows vehicles first registered in 2018 by body type and method of propulsion.
Note: Table 13.9 in Chapter 13 shows vehicles first registered in 2018 by body type and method of propulsion.
Table 1.2 Vehicles licensed at 31 December, by taxation group, body type and method of propulsion
2009 2010 2011 2012 2013 2014 2015 2016 2017 2018 2019thousand
by type of vehicle (taxation group)
Private and light goods 2,362 2,364 2,369 2,395 2,436 2,496 2,537 2,594 2,638 2,665 2,711Motorcycles 66 63 60 60 59 61 62 63 62 62 63Buses 12 12 12 12 12 12 12 12 12 12 12Goods 31 30 29 29 29 29 30 30 30 28 28Crown and exempt 1 203 206 211 212 213 214 211 208 207 211 215Other vehicles 1 9 9 9 10 10 10 11 11 12 12 12Total 2,684 2,685 2,691 2,717 2,759 2,821 2,863 2,919 2,962 2,991 3,041
by body type
Cars 2,249 2,255 2,264 2,285 2,319 2,369 2,394 2,433 2,462 2,486 2,524Taxis 4 3 4 4 4 4 4 4 4 3 3Motorcycles 72 69 66 66 66 67 68 70 70 71 72Three wheelers 1 1 1 1 1 1 1 1 1 1 1Light goods 2 242 240 238 241 247 256 269 283 294 298 308Goods 2 37 36 36 35 36 36 37 38 38 37 37
Buses and coaches 17 16 16 16 15 15 15 15 15 14 14
Agricultural vehicles etc 45 45 47 48 48 49 50 50 52 54 55Other vehicles 18 19 20 22 23 24 25 25 26 27 26All vehicles 2,684 2,685 2,691 2,717 2,759 2,821 2,863 2,919 2,962 2,991 3,041
by method of propulsion
Petrol 1,701 1,656 1,619 1,592 1,567 1,552 1,522 1,509 1,497 1,503 1,533Diesel 974 1,018 1,061 1,113 1,178 1,252 1,321 1,386 1,435 1,450 1,459Hybrid Electric 3 4 5 6 8 9 11 14 19 27 35Electricity 2 2 2 3 4 5 6 7 9 10 12Gas Bi-Fuel 2 2 2 2 2 2 1 1 1 1 1Gas or petrol/gas 2 2 1 1 1 1 1 1 1 1 1Steam ~ ~ ~ ~ ~ ~ ~ ~ ~ ~ ~Others ~ ~ ~ ~ ~ ~ ~ ~ ~ ~ ~Total 2,684 2,685 2,691 2,717 2,759 2,821 2,863 2,919 2,962 2,991 3,041
Source: DVLA/DfT
~ denotes fewer than 50.1. Vehicles in the Special Concessionary Group (part of other vehicles in 2002 and earlier years) are part of Crown and Exempt from 2003 onwards 2. DfT have revised stock figures from 2006 to 2009 - seehttps://assets.publishing.service.gov.uk/government/uploads/system/uploads/attachment_data/file/763837/vehicle-licensing-statistics-notes-definition
Note: Table 13.10 in Chapter 13 shows vehicles licensed in 2018 by body type and method of propulsion.
42
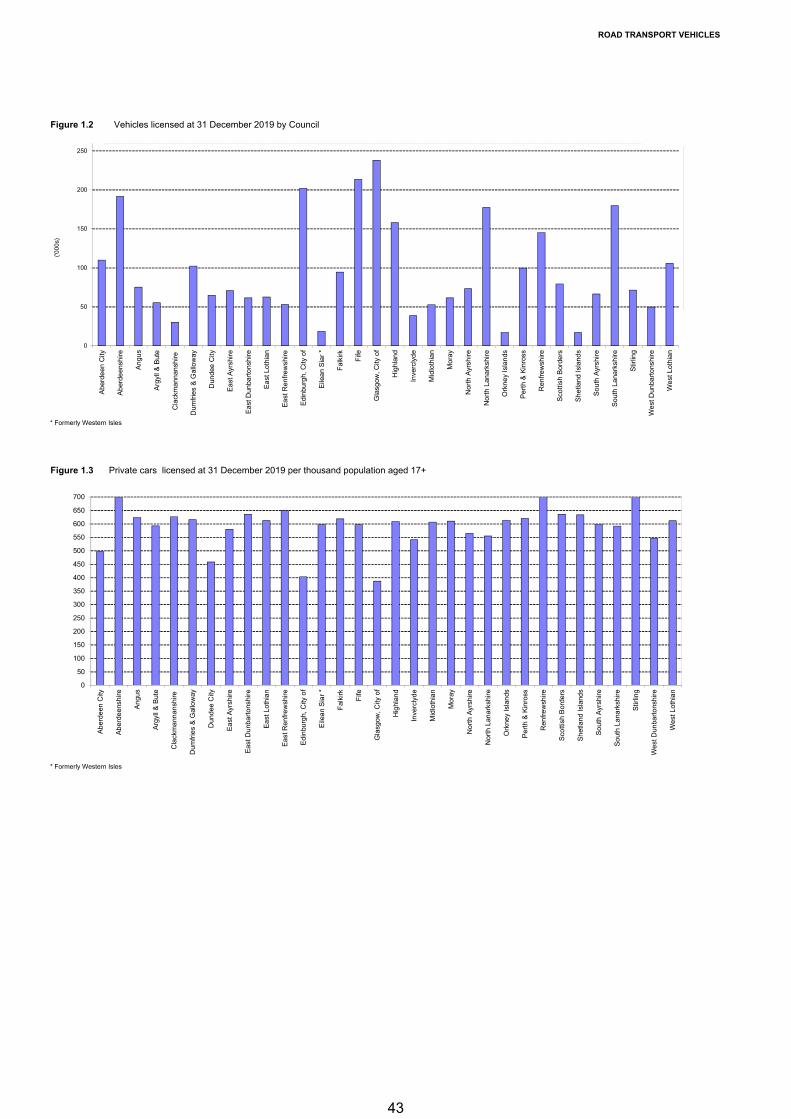
ROAD TRANSPORT VEHICLES
Figure 1.2 Vehicles licensed at 31 December 2019 by Council
* Formerly Western Isles
Figure 1.3 Private cars licensed at 31 December 2019 per thousand population aged 17+
1. i.e. "body type cars" excluding "company cars".* formerly "Western Isles"
* Formerly Western Isles
0
50
100
150
200
250
300
350
400
450
500
550
600
650
700
Ab
erde
en C
ity
Ab
erde
ensh
ire
An
gus
Arg
yll &
But
e
Cla
ckm
ann
ansh
ire
Dum
frie
s &
Gal
low
ay
Dun
dee
City
Ea
st A
yrsh
ire
Ea
st D
unba
rto
nsh
ire
Ea
st L
oth
ian
Ea
st R
enfr
ew
shire
Ed
inbu
rgh,
City
of
Eile
an
Sia
r *
Fal
kirk
Fife
Gla
sgow
, City
of
Hig
hlan
d
Inve
rcly
de
Mid
loth
ian
Mor
ay
Nor
th A
yrsh
ire
Nor
th L
anar
kshi
re
Ork
ney
Isla
nds
Pe
rth
& K
inro
ss
Ren
fre
wsh
ire
Sco
ttish
Bor
ders
Sh
etla
nd I
slan
ds
So
uth
Ayr
shir
e
So
uth
La
nark
shire
Stir
ling
We
st D
unba
rto
nsh
ire
We
st L
oth
ian
0
50
100
150
200
250
Ab
erde
en C
ity
Ab
erde
ensh
ire
An
gus
Arg
yll &
But
e
Cla
ckm
ann
ansh
ire
Dum
frie
s &
Gal
low
ay
Dun
dee
City
Ea
st A
yrsh
ire
Ea
st D
unba
rto
nsh
ire
Ea
st L
oth
ian
Ea
st R
enfr
ew
shire
Ed
inbu
rgh,
City
of
Eile
an
Sia
r *
Fal
kirk
Fife
Gla
sgow
, City
of
Hig
hlan
d
Inve
rcly
de
Mid
loth
ian
Mor
ay
Nor
th A
yrsh
ire
Nor
th L
anar
kshi
re
Ork
ney
Isla
nds
Pe
rth
& K
inro
ss
Ren
fre
wsh
ire
Sco
ttish
Bor
ders
Sh
etla
nd I
slan
ds
So
uth
Ayr
shir
e
So
uth
La
nark
shire
Stir
ling
We
st D
unba
rto
nsh
ire
We
st L
oth
ian
('00
0s)
43
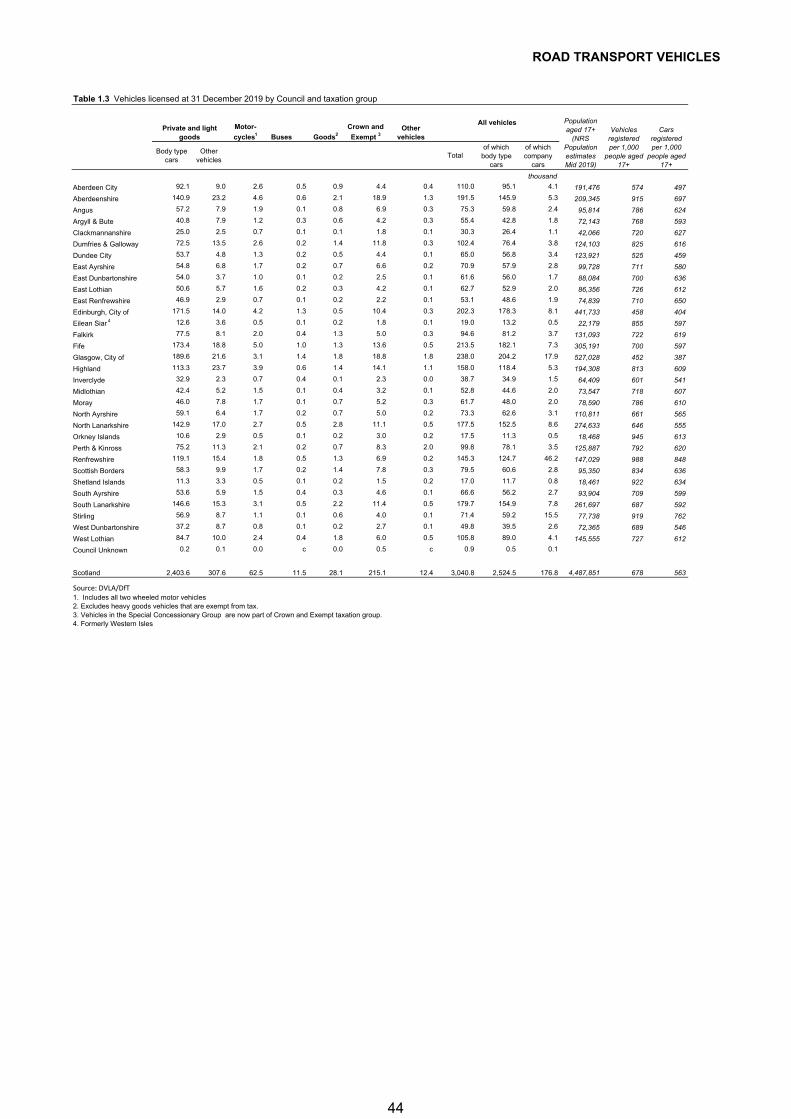
ROAD TRANSPORT VEHICLES
Table 1.3 Vehicles licensed at 31 December 2019 by Council and taxation group
Private and light goods
Motor-
cycles1 Buses Goods2
Crown and
Exempt 3Other
vehicles
Body type cars
Other vehicles
Totalof which
body type cars
of which company
cars
thousand
Aberdeen City 92.1 9.0 2.6 0.5 0.9 4.4 0.4 110.0 95.1 4.1 191,476 574 497
Aberdeenshire 140.9 23.2 4.6 0.6 2.1 18.9 1.3 191.5 145.9 5.3 209,345 915 697
Angus 57.2 7.9 1.9 0.1 0.8 6.9 0.3 75.3 59.8 2.4 95,814 786 624
Argyll & Bute 40.8 7.9 1.2 0.3 0.6 4.2 0.3 55.4 42.8 1.8 72,143 768 593
Clackmannanshire 25.0 2.5 0.7 0.1 0.1 1.8 0.1 30.3 26.4 1.1 42,066 720 627
Dumfries & Galloway 72.5 13.5 2.6 0.2 1.4 11.8 0.3 102.4 76.4 3.8 124,103 825 616
Dundee City 53.7 4.8 1.3 0.2 0.5 4.4 0.1 65.0 56.8 3.4 123,921 525 459
East Ayrshire 54.8 6.8 1.7 0.2 0.7 6.6 0.2 70.9 57.9 2.8 99,728 711 580
East Dunbartonshire 54.0 3.7 1.0 0.1 0.2 2.5 0.1 61.6 56.0 1.7 88,084 700 636
East Lothian 50.6 5.7 1.6 0.2 0.3 4.2 0.1 62.7 52.9 2.0 86,356 726 612
East Renfrewshire 46.9 2.9 0.7 0.1 0.2 2.2 0.1 53.1 48.6 1.9 74,839 710 650
Edinburgh, City of 171.5 14.0 4.2 1.3 0.5 10.4 0.3 202.3 178.3 8.1 441,733 458 404
Eilean Siar 4 12.6 3.6 0.5 0.1 0.2 1.8 0.1 19.0 13.2 0.5 22,179 855 597
Falkirk 77.5 8.1 2.0 0.4 1.3 5.0 0.3 94.6 81.2 3.7 131,093 722 619
Fife 173.4 18.8 5.0 1.0 1.3 13.6 0.5 213.5 182.1 7.3 305,191 700 597
Glasgow, City of 189.6 21.6 3.1 1.4 1.8 18.8 1.8 238.0 204.2 17.9 527,028 452 387
Highland 113.3 23.7 3.9 0.6 1.4 14.1 1.1 158.0 118.4 5.3 194,308 813 609
Inverclyde 32.9 2.3 0.7 0.4 0.1 2.3 0.0 38.7 34.9 1.5 64,409 601 541
Midlothian 42.4 5.2 1.5 0.1 0.4 3.2 0.1 52.8 44.6 2.0 73,547 718 607
Moray 46.0 7.8 1.7 0.1 0.7 5.2 0.3 61.7 48.0 2.0 78,590 786 610
North Ayrshire 59.1 6.4 1.7 0.2 0.7 5.0 0.2 73.3 62.6 3.1 110,811 661 565
North Lanarkshire 142.9 17.0 2.7 0.5 2.8 11.1 0.5 177.5 152.5 8.6 274,633 646 555
Orkney Islands 10.6 2.9 0.5 0.1 0.2 3.0 0.2 17.5 11.3 0.5 18,468 945 613
Perth & Kinross 75.2 11.3 2.1 0.2 0.7 8.3 2.0 99.8 78.1 3.5 125,887 792 620
Renfrewshire 119.1 15.4 1.8 0.5 1.3 6.9 0.2 145.3 124.7 46.2 147,029 988 848
Scottish Borders 58.3 9.9 1.7 0.2 1.4 7.8 0.3 79.5 60.6 2.8 95,350 834 636
Shetland Islands 11.3 3.3 0.5 0.1 0.2 1.5 0.2 17.0 11.7 0.8 18,461 922 634
South Ayrshire 53.6 5.9 1.5 0.4 0.3 4.6 0.1 66.6 56.2 2.7 93,904 709 599
South Lanarkshire 146.6 15.3 3.1 0.5 2.2 11.4 0.5 179.7 154.9 7.8 261,697 687 592
Stirling 56.9 8.7 1.1 0.1 0.6 4.0 0.1 71.4 59.2 15.5 77,738 919 762
West Dunbartonshire 37.2 8.7 0.8 0.1 0.2 2.7 0.1 49.8 39.5 2.6 72,365 689 546
West Lothian 84.7 10.0 2.4 0.4 1.8 6.0 0.5 105.8 89.0 4.1 145,555 727 612
Council Unknown 0.2 0.1 0.0 c 0.0 0.5 c 0.9 0.5 0.1
Scotland 2,403.6 307.6 62.5 11.5 28.1 215.1 12.4 3,040.8 2,524.5 176.8 4,487,851 678 563
Source: DVLA/DfT1. Includes all two wheeled motor vehicles2. Excludes heavy goods vehicles that are exempt from tax.3. Vehicles in the Special Concessionary Group are now part of Crown and Exempt taxation group. 4. Formerly Western Isles
All vehiclesVehicles
registered per 1,000
people aged 17+
Cars registered per 1,000
people aged 17+
Population aged 17+
(NRS Population estimates Mid 2019)
44
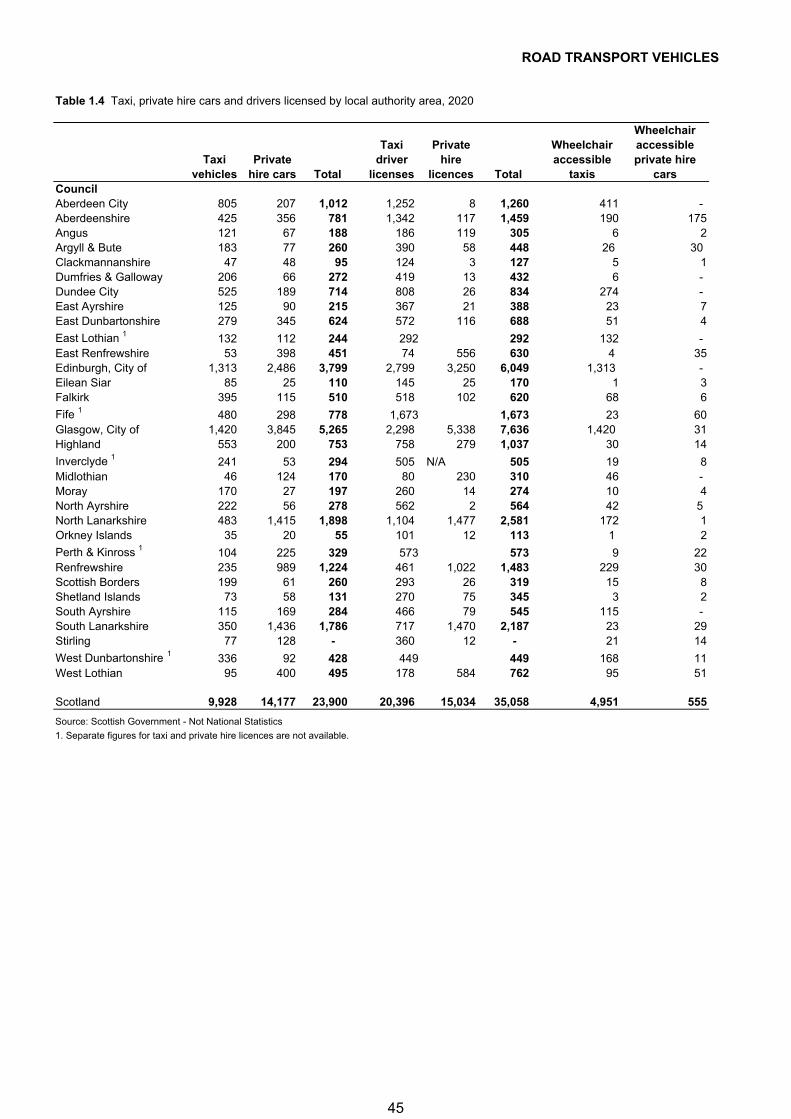
ROAD TRANSPORT VEHICLES
Table 1.4 Taxi, private hire cars and drivers licensed by local authority area, 2020
CouncilAberdeen City 805 207 1,012 1,252 8 1,260 411 - Aberdeenshire 425 356 781 1,342 117 1,459 190 175Angus 121 67 188 186 119 305 6 2Argyll & Bute 183 77 260 390 58 448 26 30 Clackmannanshire 47 48 95 124 3 127 5 1Dumfries & Galloway 206 66 272 419 13 432 6 - Dundee City 525 189 714 808 26 834 274 - East Ayrshire 125 90 215 367 21 388 23 7East Dunbartonshire 279 345 624 572 116 688 51 4
East Lothian 1 132 112 244 292 292 132 - East Renfrewshire 53 398 451 74 556 630 4 35Edinburgh, City of 1,313 2,486 3,799 2,799 3,250 6,049 1,313 - Eilean Siar 85 25 110 145 25 170 1 3Falkirk 395 115 510 518 102 620 68 6
Fife 1 480 298 778 1,673 1,673 23 60Glasgow, City of 1,420 3,845 5,265 2,298 5,338 7,636 1,420 31Highland 553 200 753 758 279 1,037 30 14
Inverclyde 1 241 53 294 505 N/A 505 19 8Midlothian 46 124 170 80 230 310 46 - Moray 170 27 197 260 14 274 10 4North Ayrshire 222 56 278 562 2 564 42 5 North Lanarkshire 483 1,415 1,898 1,104 1,477 2,581 172 1Orkney Islands 35 20 55 101 12 113 1 2
Perth & Kinross 1 104 225 329 573 573 9 22Renfrewshire 235 989 1,224 461 1,022 1,483 229 30Scottish Borders 199 61 260 293 26 319 15 8Shetland Islands 73 58 131 270 75 345 3 2South Ayrshire 115 169 284 466 79 545 115 - South Lanarkshire 350 1,436 1,786 717 1,470 2,187 23 29Stirling 77 128 - 360 12 - 21 14
West Dunbartonshire 1 336 92 428 449 449 168 11West Lothian 95 400 495 178 584 762 95 51
Scotland 9,928 14,177 23,900 20,396 15,034 35,058 4,951 555
Source: Scottish Government - Not National Statistics
1. Separate figures for taxi and private hire licences are not available.
Taxi vehicles
Wheelchair accessible
taxis
Wheelchair accessible private hire
carsTotal Private
hire cars Total
Taxi driver
licenses
Private hire
licences
45
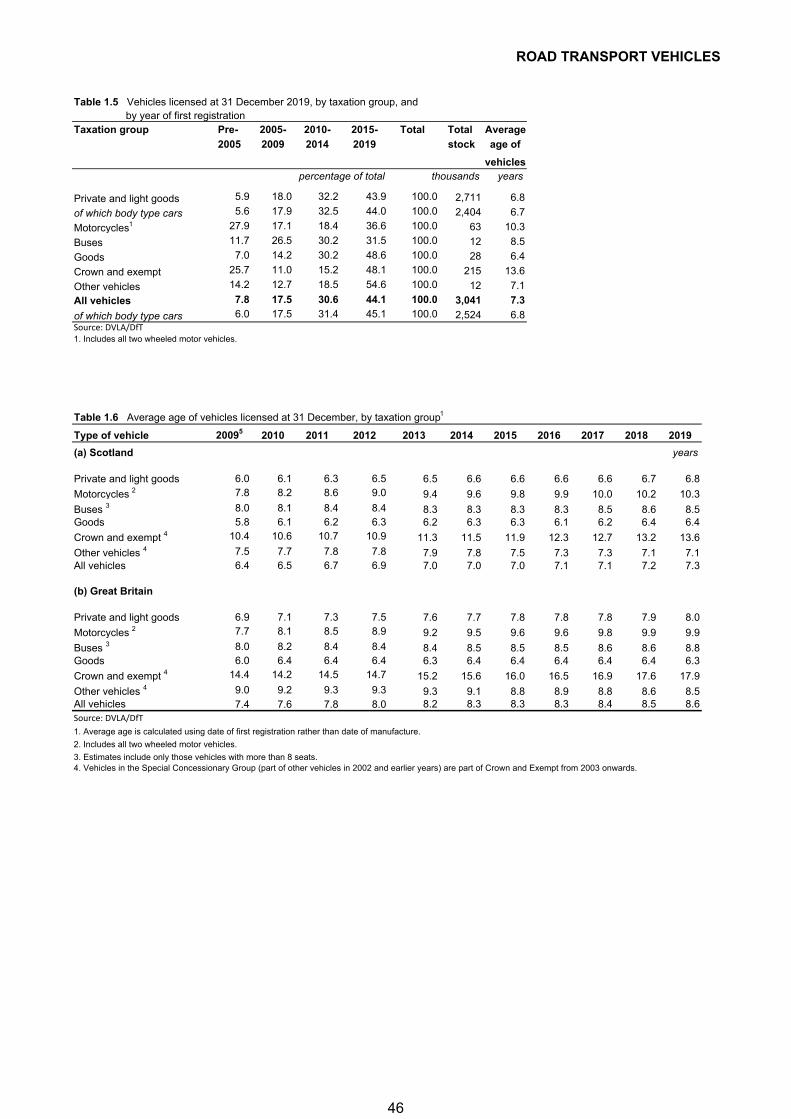
ROAD TRANSPORT VEHICLES
Table 1.5 Vehicles licensed at 31 December 2019, by taxation group, and by year of first registrationTaxation group Pre- 2005- 2010- 2015- Total Total Average
2005 2009 2014 2019 stock age of
vehiclespercentage of total thousands years
Private and light goods 5.9 18.0 32.2 43.9 100.0 2,711 6.8
of which body type cars 5.6 17.9 32.5 44.0 100.0 2,404 6.7
Motorcycles1 27.9 17.1 18.4 36.6 100.0 63 10.3
Buses 11.7 26.5 30.2 31.5 100.0 12 8.5
Goods 7.0 14.2 30.2 48.6 100.0 28 6.4
Crown and exempt 25.7 11.0 15.2 48.1 100.0 215 13.6
Other vehicles 14.2 12.7 18.5 54.6 100.0 12 7.1
All vehicles 7.8 17.5 30.6 44.1 100.0 3,041 7.3
of which body type cars 6.0 17.5 31.4 45.1 100.0 2,524 6.8Source: DVLA/DfT1. Includes all two wheeled motor vehicles.
Table 1.6 Average age of vehicles licensed at 31 December, by taxation group1
Type of vehicle 20095 2010 2011 2012 2013 2014 2015 2016 2017 2018 2019
(a) Scotland years
Private and light goods 6.0 6.1 6.3 6.5 6.5 6.6 6.6 6.6 6.6 6.7 6.8
Motorcycles 2 7.8 8.2 8.6 9.0 9.4 9.6 9.8 9.9 10.0 10.2 10.3
Buses 3 8.0 8.1 8.4 8.4 8.3 8.3 8.3 8.3 8.5 8.6 8.5Goods 5.8 6.1 6.2 6.3 6.2 6.3 6.3 6.1 6.2 6.4 6.4
Crown and exempt 4 10.4 10.6 10.7 10.9 11.3 11.5 11.9 12.3 12.7 13.2 13.6
Other vehicles 4 7.5 7.7 7.8 7.8 7.9 7.8 7.5 7.3 7.3 7.1 7.1All vehicles 6.4 6.5 6.7 6.9 7.0 7.0 7.0 7.1 7.1 7.2 7.3
(b) Great Britain
Private and light goods 6.9 7.1 7.3 7.5 7.6 7.7 7.8 7.8 7.8 7.9 8.0
Motorcycles 2 7.7 8.1 8.5 8.9 9.2 9.5 9.6 9.6 9.8 9.9 9.9
Buses 3 8.0 8.2 8.4 8.4 8.4 8.5 8.5 8.5 8.6 8.6 8.8Goods 6.0 6.4 6.4 6.4 6.3 6.4 6.4 6.4 6.4 6.4 6.3
Crown and exempt 4 14.4 14.2 14.5 14.7 15.2 15.6 16.0 16.5 16.9 17.6 17.9
Other vehicles 4 9.0 9.2 9.3 9.3 9.3 9.1 8.8 8.9 8.8 8.6 8.5All vehicles 7.4 7.6 7.8 8.0 8.2 8.3 8.3 8.3 8.4 8.5 8.6Source: DVLA/DfT
1. Average age is calculated using date of first registration rather than date of manufacture.
2. Includes all two wheeled motor vehicles.
3. Estimates include only those vehicles with more than 8 seats. 4. Vehicles in the Special Concessionary Group (part of other vehicles in 2002 and earlier years) are part of Crown and Exempt from 2003 onwards.
46
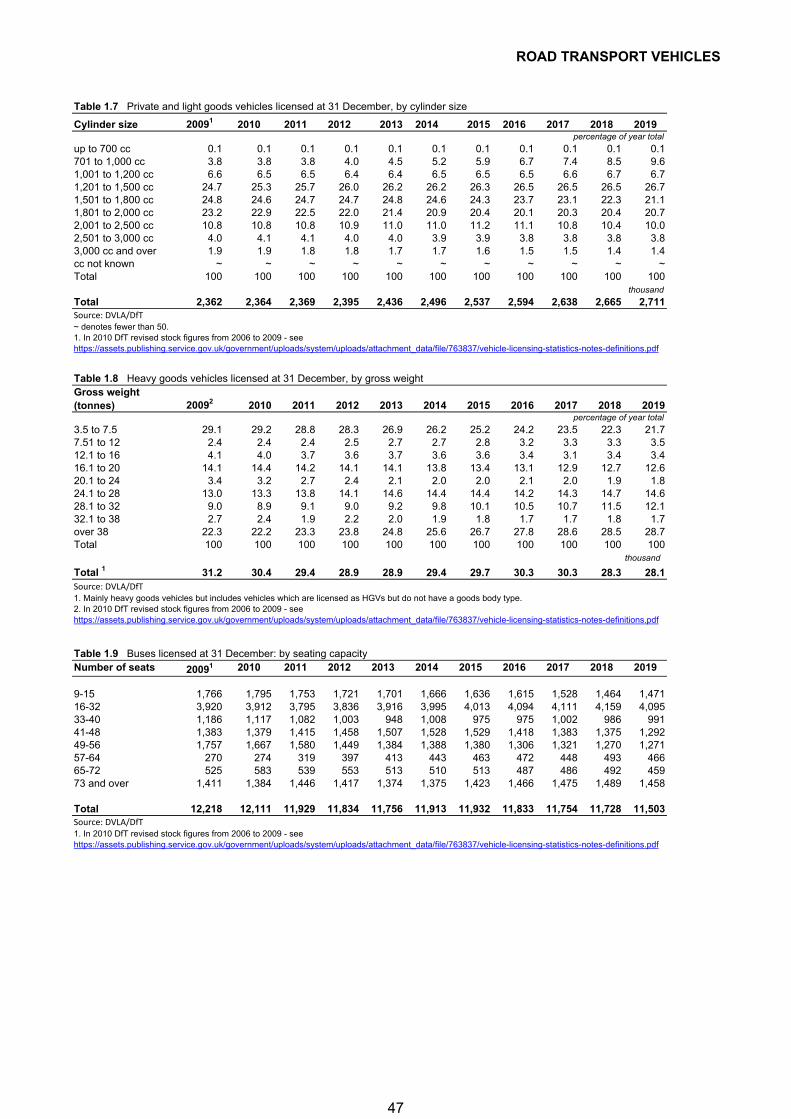
ROAD TRANSPORT VEHICLES
Table 1.7 Private and light goods vehicles licensed at 31 December, by cylinder size
Cylinder size 20091 2010 2011 2012 2013 2014 2015 2016 2017 2018 2019percentage of year total
up to 700 cc 0.1 0.1 0.1 0.1 0.1 0.1 0.1 0.1 0.1 0.1 0.1701 to 1,000 cc 3.8 3.8 3.8 4.0 4.5 5.2 5.9 6.7 7.4 8.5 9.61,001 to 1,200 cc 6.6 6.5 6.5 6.4 6.4 6.5 6.5 6.5 6.6 6.7 6.71,201 to 1,500 cc 24.7 25.3 25.7 26.0 26.2 26.2 26.3 26.5 26.5 26.5 26.71,501 to 1,800 cc 24.8 24.6 24.7 24.7 24.8 24.6 24.3 23.7 23.1 22.3 21.11,801 to 2,000 cc 23.2 22.9 22.5 22.0 21.4 20.9 20.4 20.1 20.3 20.4 20.72,001 to 2,500 cc 10.8 10.8 10.8 10.9 11.0 11.0 11.2 11.1 10.8 10.4 10.02,501 to 3,000 cc 4.0 4.1 4.1 4.0 4.0 3.9 3.9 3.8 3.8 3.8 3.83,000 cc and over 1.9 1.9 1.8 1.8 1.7 1.7 1.6 1.5 1.5 1.4 1.4cc not known ~ ~ ~ ~ ~ ~ ~ ~ ~ ~ ~Total 100 100 100 100 100 100 100 100 100 100 100
thousand
Total 2,362 2,364 2,369 2,395 2,436 2,496 2,537 2,594 2,638 2,665 2,711Source: DVLA/DfT~ denotes fewer than 50.1. In 2010 DfT revised stock figures from 2006 to 2009 - seehttps://assets.publishing.service.gov.uk/government/uploads/system/uploads/attachment_data/file/763837/vehicle-licensing-statistics-notes-definitions.pdf
Table 1.8 Heavy goods vehicles licensed at 31 December, by gross weightGross weight (tonnes) 20092 2010 2011 2012 2013 2014 2015 2016 2017 2018 2019
percentage of year total
3.5 to 7.5 29.1 29.2 28.8 28.3 26.9 26.2 25.2 24.2 23.5 22.3 21.77.51 to 12 2.4 2.4 2.4 2.5 2.7 2.7 2.8 3.2 3.3 3.3 3.512.1 to 16 4.1 4.0 3.7 3.6 3.7 3.6 3.6 3.4 3.1 3.4 3.416.1 to 20 14.1 14.4 14.2 14.1 14.1 13.8 13.4 13.1 12.9 12.7 12.620.1 to 24 3.4 3.2 2.7 2.4 2.1 2.0 2.0 2.1 2.0 1.9 1.824.1 to 28 13.0 13.3 13.8 14.1 14.6 14.4 14.4 14.2 14.3 14.7 14.628.1 to 32 9.0 8.9 9.1 9.0 9.2 9.8 10.1 10.5 10.7 11.5 12.132.1 to 38 2.7 2.4 1.9 2.2 2.0 1.9 1.8 1.7 1.7 1.8 1.7over 38 22.3 22.2 23.3 23.8 24.8 25.6 26.7 27.8 28.6 28.5 28.7Total 100 100 100 100 100 100 100 100 100 100 100
thousand
Total 1 31.2 30.4 29.4 28.9 28.9 29.4 29.7 30.3 30.3 28.3 28.1Source: DVLA/DfT1. Mainly heavy goods vehicles but includes vehicles which are licensed as HGVs but do not have a goods body type. 2. In 2010 DfT revised stock figures from 2006 to 2009 - see https://assets.publishing.service.gov.uk/government/uploads/system/uploads/attachment_data/file/763837/vehicle-licensing-statistics-notes-definitions.pdf
Table 1.9 Buses licensed at 31 December: by seating capacityNumber of seats 20091 2010 2011 2012 2013 2014 2015 2016 2017 2018 2019
9-15 1,766 1,795 1,753 1,721 1,701 1,666 1,636 1,615 1,528 1,464 1,47116-32 3,920 3,912 3,795 3,836 3,916 3,995 4,013 4,094 4,111 4,159 4,09533-40 1,186 1,117 1,082 1,003 948 1,008 975 975 1,002 986 99141-48 1,383 1,379 1,415 1,458 1,507 1,528 1,529 1,418 1,383 1,375 1,29249-56 1,757 1,667 1,580 1,449 1,384 1,388 1,380 1,306 1,321 1,270 1,27157-64 270 274 319 397 413 443 463 472 448 493 46665-72 525 583 539 553 513 510 513 487 486 492 45973 and over 1,411 1,384 1,446 1,417 1,374 1,375 1,423 1,466 1,475 1,489 1,458
Total 12,218 12,111 11,929 11,834 11,756 11,913 11,932 11,833 11,754 11,728 11,503Source: DVLA/DfT1. In 2010 DfT revised stock figures from 2006 to 2009 - see https://assets.publishing.service.gov.uk/government/uploads/system/uploads/attachment_data/file/763837/vehicle-licensing-statistics-notes-definitions.pdf
47
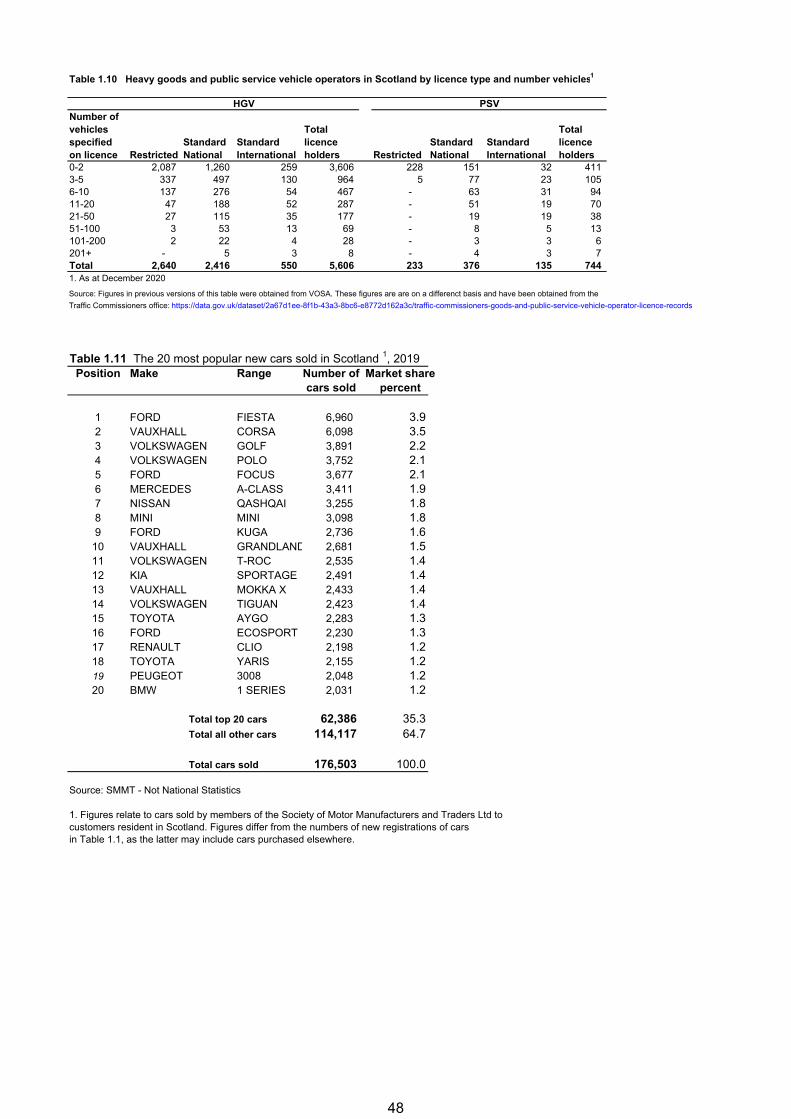
Table 1.10 Heavy goods and public service vehicle operators in Scotland by licence type and number vehicles1
HGV PSVNumber of vehicles specified on licence Restricted
Standard National
Standard International
Total licence holders Restricted
Standard National
Standard International
Total licence holders
0-2 2,087 1,260 259 3,606 228 151 32 411 3-5 337 497 130 964 5 77 23 105 6-10 137 276 54 467 - 63 31 94 11-20 47 188 52 287 - 51 19 70 21-50 27 115 35 177 - 19 19 38 51-100 3 53 13 69 - 8 5 13 101-200 2 22 4 28 - 3 3 6 201+ - 5 3 8 - 4 3 7 Total 2,640 2,416 550 5,606 233 376 135 744 1. As at December 2020
Source: Figures in previous versions of this table were obtained from VOSA. These figures are are on a differenct basis and have been obtained from the
Traffic Commissioners office: https://data.gov.uk/dataset/2a67d1ee-8f1b-43a3-8bc6-e8772d162a3c/traffic-commissioners-goods-and-public-service-vehicle-operator-licence-records
Table 1.11 The 20 most popular new cars sold in Scotland 1, 2019Position Make Range Number of Market share
cars sold percent
1 FORD FIESTA 6,960 3.92 VAUXHALL CORSA 6,098 3.53 VOLKSWAGEN GOLF 3,891 2.24 VOLKSWAGEN POLO 3,752 2.15 FORD FOCUS 3,677 2.16 MERCEDES A-CLASS 3,411 1.97 NISSAN QASHQAI 3,255 1.88 MINI MINI 3,098 1.89 FORD KUGA 2,736 1.6
10 VAUXHALL GRANDLAND 2,681 1.511 VOLKSWAGEN T-ROC 2,535 1.412 KIA SPORTAGE 2,491 1.413 VAUXHALL MOKKA X 2,433 1.414 VOLKSWAGEN TIGUAN 2,423 1.415 TOYOTA AYGO 2,283 1.316 FORD ECOSPORT 2,230 1.317 RENAULT CLIO 2,198 1.218 TOYOTA YARIS 2,155 1.219 PEUGEOT 3008 2,048 1.220 BMW 1 SERIES 2,031 1.2
Total top 20 cars 62,386 35.3 Total all other cars 114,117 64.7
Total cars sold 176,503 100.0
Source: SMMT - Not National Statistics
1. Figures relate to cars sold by members of the Society of Motor Manufacturers and Traders Ltd tocustomers resident in Scotland. Figures differ from the numbers of new registrations of carsin Table 1.1, as the latter may include cars purchased elsewhere.
48
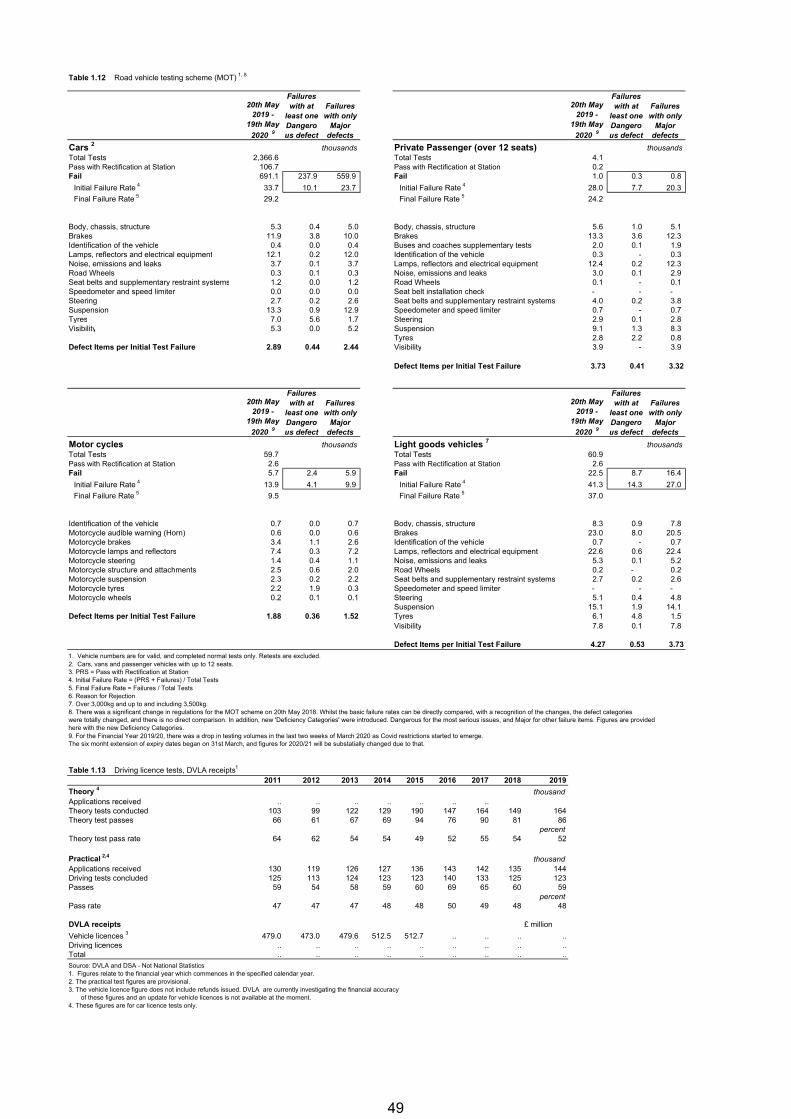
Table 1.12 Road vehicle testing scheme (MOT) 1, 8
20th May 2019 -
19th May
2020 9
Failures with at
least one Dangerous defect
Failures with only
Major defects
20th May 2019 -
19th May
2020 9
Failures with at
least one Dangerous defect
Failures with only
Major defects
Cars 2 thousands Private Passenger (over 12 seats) thousandsTotal Tests 2,366.6 Total Tests 4.1 Pass with Rectification at Station 106.7 Pass with Rectification at Station 0.2 Fail 691.1 237.9 559.9 Fail 1.0 0.3 0.8
Initial Failure Rate 4 33.7 10.1 23.7 Initial Failure Rate 4 28.0 7.7 20.3
Final Failure Rate 5 29.2 Final Failure Rate 5 24.2
Body, chassis, structure 5.3 0.4 5.0 Body, chassis, structure 5.6 1.0 5.1 Brakes 11.9 3.8 10.0 Brakes 13.3 3.6 12.3 Identification of the vehicle 0.4 0.0 0.4 Buses and coaches supplementary tests 2.0 0.1 1.9 Lamps, reflectors and electrical equipment 12.1 0.2 12.0 Identification of the vehicle 0.3 - 0.3 Noise, emissions and leaks 3.7 0.1 3.7 Lamps, reflectors and electrical equipment 12.4 0.2 12.3 Road Wheels 0.3 0.1 0.3 Noise, emissions and leaks 3.0 0.1 2.9 Seat belts and supplementary restraint systems 1.2 0.0 1.2 Road Wheels 0.1 - 0.1 Speedometer and speed limiter 0.0 0.0 0.0 Seat belt installation check - - - Steering 2.7 0.2 2.6 Seat belts and supplementary restraint systems 4.0 0.2 3.8 Suspension 13.3 0.9 12.9 Speedometer and speed limiter 0.7 - 0.7 Tyres 7.0 5.6 1.7 Steering 2.9 0.1 2.8 Visibility 5.3 0.0 5.2 Suspension 9.1 1.3 8.3
Tyres 2.8 2.2 0.8 Defect Items per Initial Test Failure 2.89 0.44 2.44 Visibility 3.9 - 3.9
Defect Items per Initial Test Failure 3.73 0.41 3.32
20th May 2019 -
19th May
2020 9
Failures with at
least one Dangerous defect
Failures with only
Major defects
20th May 2019 -
19th May
2020 9
Failures with at
least one Dangerous defect
Failures with only
Major defects
Motor cycles thousands Light goods vehicles 7 thousandsTotal Tests 59.7 Total Tests 60.9 Pass with Rectification at Station 2.6 Pass with Rectification at Station 2.6 Fail 5.7 2.4 5.9 Fail 22.5 8.7 16.4
Initial Failure Rate 4 13.9 4.1 9.9 Initial Failure Rate 4 41.3 14.3 27.0
Final Failure Rate 5 9.5 Final Failure Rate 5 37.0
Identification of the vehicle 0.7 0.0 0.7 Body, chassis, structure 8.3 0.9 7.8 Motorcycle audible warning (Horn) 0.6 0.0 0.6 Brakes 23.0 8.0 20.5 Motorcycle brakes 3.4 1.1 2.6 Identification of the vehicle 0.7 - 0.7 Motorcycle lamps and reflectors 7.4 0.3 7.2 Lamps, reflectors and electrical equipment 22.6 0.6 22.4 Motorcycle steering 1.4 0.4 1.1 Noise, emissions and leaks 5.3 0.1 5.2 Motorcycle structure and attachments 2.5 0.6 2.0 Road Wheels 0.2 - 0.2 Motorcycle suspension 2.3 0.2 2.2 Seat belts and supplementary restraint systems 2.7 0.2 2.6 Motorcycle tyres 2.2 1.9 0.3 Speedometer and speed limiter - - - Motorcycle wheels 0.2 0.1 0.1 Steering 5.1 0.4 4.8
Suspension 15.1 1.9 14.1 Defect Items per Initial Test Failure 1.88 0.36 1.52 Tyres 6.1 4.8 1.5
Visibility 7.8 0.1 7.8
Defect Items per Initial Test Failure 4.27 0.53 3.73
1. Vehicle numbers are for valid, and completed normal tests only. Retests are excluded.2. Cars, vans and passenger vehicles with up to 12 seats.3. PRS = Pass with Rectification at Station4. Initial Failure Rate = (PRS + Failures) / Total Tests5. Final Failure Rate = Failures / Total Tests6. Reason for Rejection7. Over 3,000kg and up to and including 3,500kg.8. There was a significant change in regulations for the MOT scheme on 20th May 2018. Whilst the basic failure rates can be directly compared, with a recognition of the changes, the defect categories were totally changed, and there is no direct comparison. In addition, new 'Deficiency Categories' were introduced. Dangerous for the most serious issues, and Major for other failure items. Figures are provided here with the new Deficiency Categories.9. For the Financial Year 2019/20, there was a drop in testing volumes in the last two weeks of March 2020 as Covid restrictions started to emerge. The six monht extension of expiry dates began on 31st March, and figures for 2020/21 will be substatially changed due to that.
Table 1.13 Driving licence tests, DVLA receipts1
2011 2012 2013 2014 2015 2016 2017 2018 2019
Theory 4 thousandApplications received .. .. .. .. .. .. ..Theory tests conducted 103 99 122 129 190 147 164 149 164Theory test passes 66 61 67 69 94 76 90 81 86
percentTheory test pass rate 64 62 54 54 49 52 55 54 52
Practical 2,4 thousandApplications received 130 119 126 127 136 143 142 135 144Driving tests concluded 125 113 124 123 123 140 133 125 123Passes 59 54 58 59 60 69 65 60 59
percentPass rate 47 47 47 48 48 50 49 48 48
DVLA receipts £ million
Vehicle licences 3 479.0 473.0 479.6 512.5 512.7 .. .. .. ..Driving licences .. .. .. .. .. .. .. .. ..Total .. .. .. .. .. .. .. .. ..
Source: DVLA and DSA - Not National Statistics1. Figures relate to the financial year which commences in the specified calendar year.2. The practical test figures are provisional.3. The vehicle licence figure does not include refunds issued. DVLA are currently investigating the financial accuracy of these figures and an update for vehicle licences is not available at the moment.4. These figures are for car licence tests only.
49
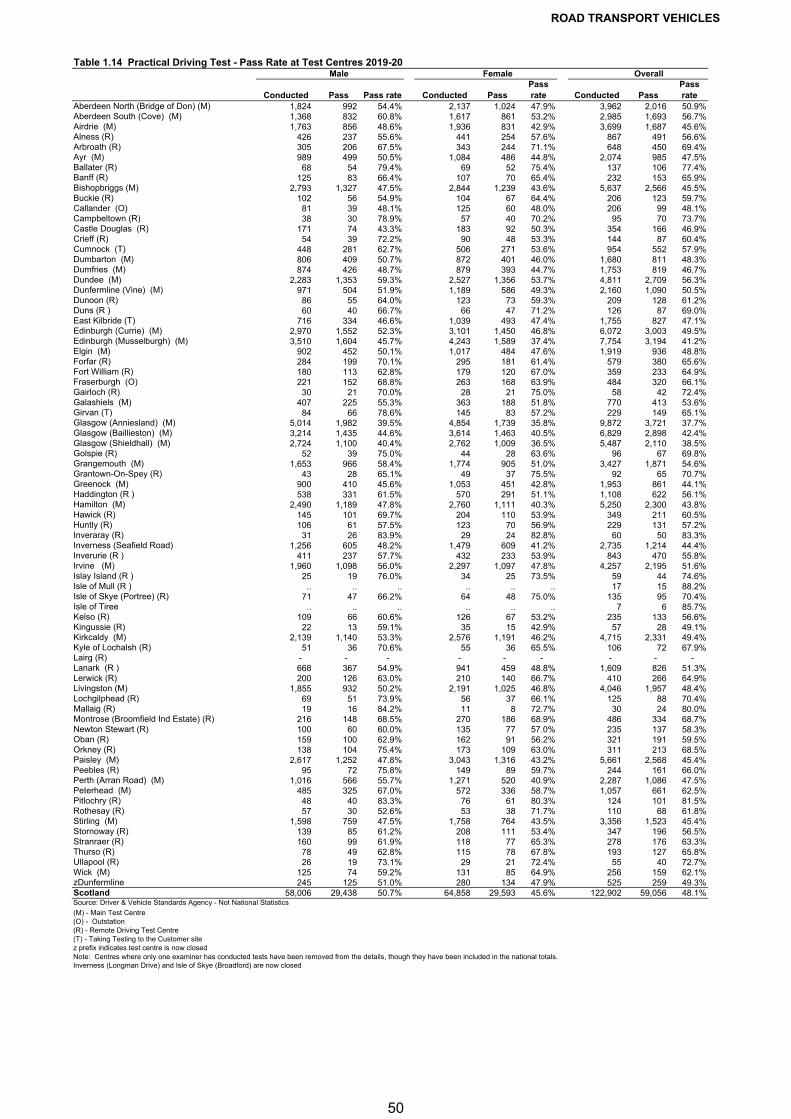
ROAD TRANSPORT VEHICLES
Table 1.14 Practical Driving Test - Pass Rate at Test Centres 2019-20 Male Female Overall
Conducted Pass Pass rate Conducted PassPass rate Conducted Pass
Pass rate
Aberdeen North (Bridge of Don) (M) 1,824 992 54.4% 2,137 1,024 47.9% 3,962 2,016 50.9%Aberdeen South (Cove) (M) 1,368 832 60.8% 1,617 861 53.2% 2,985 1,693 56.7%Airdrie (M) 1,763 856 48.6% 1,936 831 42.9% 3,699 1,687 45.6%Alness (R) 426 237 55.6% 441 254 57.6% 867 491 56.6%Arbroath (R) 305 206 67.5% 343 244 71.1% 648 450 69.4%Ayr (M) 989 499 50.5% 1,084 486 44.8% 2,074 985 47.5%Ballater (R) 68 54 79.4% 69 52 75.4% 137 106 77.4%Banff (R) 125 83 66.4% 107 70 65.4% 232 153 65.9%Bishopbriggs (M) 2,793 1,327 47.5% 2,844 1,239 43.6% 5,637 2,566 45.5%Buckie (R) 102 56 54.9% 104 67 64.4% 206 123 59.7%Callander (O) 81 39 48.1% 125 60 48.0% 206 99 48.1%Campbeltown (R) 38 30 78.9% 57 40 70.2% 95 70 73.7%Castle Douglas (R) 171 74 43.3% 183 92 50.3% 354 166 46.9%Crieff (R) 54 39 72.2% 90 48 53.3% 144 87 60.4%Cumnock (T) 448 281 62.7% 506 271 53.6% 954 552 57.9%Dumbarton (M) 806 409 50.7% 872 401 46.0% 1,680 811 48.3%Dumfries (M) 874 426 48.7% 879 393 44.7% 1,753 819 46.7%Dundee (M) 2,283 1,353 59.3% 2,527 1,356 53.7% 4,811 2,709 56.3%Dunfermline (Vine) (M) 971 504 51.9% 1,189 586 49.3% 2,160 1,090 50.5%Dunoon (R) 86 55 64.0% 123 73 59.3% 209 128 61.2%Duns (R ) 60 40 66.7% 66 47 71.2% 126 87 69.0%East Kilbride (T) 716 334 46.6% 1,039 493 47.4% 1,755 827 47.1%Edinburgh (Currie) (M) 2,970 1,552 52.3% 3,101 1,450 46.8% 6,072 3,003 49.5%Edinburgh (Musselburgh) (M) 3,510 1,604 45.7% 4,243 1,589 37.4% 7,754 3,194 41.2%Elgin (M) 902 452 50.1% 1,017 484 47.6% 1,919 936 48.8%Forfar (R) 284 199 70.1% 295 181 61.4% 579 380 65.6%Fort William (R) 180 113 62.8% 179 120 67.0% 359 233 64.9%Fraserburgh (O) 221 152 68.8% 263 168 63.9% 484 320 66.1%Gairloch (R) 30 21 70.0% 28 21 75.0% 58 42 72.4%Galashiels (M) 407 225 55.3% 363 188 51.8% 770 413 53.6%Girvan (T) 84 66 78.6% 145 83 57.2% 229 149 65.1%Glasgow (Anniesland) (M) 5,014 1,982 39.5% 4,854 1,739 35.8% 9,872 3,721 37.7%Glasgow (Baillieston) (M) 3,214 1,435 44.6% 3,614 1,463 40.5% 6,829 2,898 42.4%Glasgow (Shieldhall) (M) 2,724 1,100 40.4% 2,762 1,009 36.5% 5,487 2,110 38.5%Golspie (R) 52 39 75.0% 44 28 63.6% 96 67 69.8%Grangemouth (M) 1,653 966 58.4% 1,774 905 51.0% 3,427 1,871 54.6%Grantown-On-Spey (R) 43 28 65.1% 49 37 75.5% 92 65 70.7%Greenock (M) 900 410 45.6% 1,053 451 42.8% 1,953 861 44.1%Haddington (R ) 538 331 61.5% 570 291 51.1% 1,108 622 56.1%Hamilton (M) 2,490 1,189 47.8% 2,760 1,111 40.3% 5,250 2,300 43.8%Hawick (R) 145 101 69.7% 204 110 53.9% 349 211 60.5%Huntly (R) 106 61 57.5% 123 70 56.9% 229 131 57.2%Inveraray (R) 31 26 83.9% 29 24 82.8% 60 50 83.3%Inverness (Seafield Road) 1,256 605 48.2% 1,479 609 41.2% 2,735 1,214 44.4%Inverurie (R ) 411 237 57.7% 432 233 53.9% 843 470 55.8%Irvine (M) 1,960 1,098 56.0% 2,297 1,097 47.8% 4,257 2,195 51.6%Islay Island (R ) 25 19 76.0% 34 25 73.5% 59 44 74.6%Isle of Mull (R ) .. .. .. .. .. .. 17 15 88.2%Isle of Skye (Portree) (R) 71 47 66.2% 64 48 75.0% 135 95 70.4%Isle of Tiree .. .. .. .. .. .. 7 6 85.7%Kelso (R) 109 66 60.6% 126 67 53.2% 235 133 56.6%Kingussie (R) 22 13 59.1% 35 15 42.9% 57 28 49.1%Kirkcaldy (M) 2,139 1,140 53.3% 2,576 1,191 46.2% 4,715 2,331 49.4%Kyle of Lochalsh (R) 51 36 70.6% 55 36 65.5% 106 72 67.9%Lairg (R) - - - - - - - - - Lanark (R ) 668 367 54.9% 941 459 48.8% 1,609 826 51.3%Lerwick (R) 200 126 63.0% 210 140 66.7% 410 266 64.9%Livingston (M) 1,855 932 50.2% 2,191 1,025 46.8% 4,046 1,957 48.4%Lochgilphead (R) 69 51 73.9% 56 37 66.1% 125 88 70.4%Mallaig (R) 19 16 84.2% 11 8 72.7% 30 24 80.0%Montrose (Broomfield Ind Estate) (R) 216 148 68.5% 270 186 68.9% 486 334 68.7%Newton Stewart (R) 100 60 60.0% 135 77 57.0% 235 137 58.3%Oban (R) 159 100 62.9% 162 91 56.2% 321 191 59.5%Orkney (R) 138 104 75.4% 173 109 63.0% 311 213 68.5%Paisley (M) 2,617 1,252 47.8% 3,043 1,316 43.2% 5,661 2,568 45.4%Peebles (R) 95 72 75.8% 149 89 59.7% 244 161 66.0%Perth (Arran Road) (M) 1,016 566 55.7% 1,271 520 40.9% 2,287 1,086 47.5%Peterhead (M) 485 325 67.0% 572 336 58.7% 1,057 661 62.5%Pitlochry (R) 48 40 83.3% 76 61 80.3% 124 101 81.5%Rothesay (R) 57 30 52.6% 53 38 71.7% 110 68 61.8%Stirling (M) 1,598 759 47.5% 1,758 764 43.5% 3,356 1,523 45.4%Stornoway (R) 139 85 61.2% 208 111 53.4% 347 196 56.5%Stranraer (R) 160 99 61.9% 118 77 65.3% 278 176 63.3%Thurso (R) 78 49 62.8% 115 78 67.8% 193 127 65.8%Ullapool (R) 26 19 73.1% 29 21 72.4% 55 40 72.7%Wick (M) 125 74 59.2% 131 85 64.9% 256 159 62.1%zDunfermline 245 125 51.0% 280 134 47.9% 525 259 49.3%Scotland 58,006 29,438 50.7% 64,858 29,593 45.6% 122,902 59,056 48.1%Source: Driver & Vehicle Standards Agency - Not National Statistics
(M) - Main Test Centre(O) - Outstation(R) - Remote Driving Test Centre(T) - Taking Testing to the Customer sitez prefix indicates test centre is now closedNote: Centres where only one examiner has conducted tests have been removed from the details, though they have been included in the national totals.Inverness (Longman Drive) and Isle of Skye (Broadford) are now closed
50
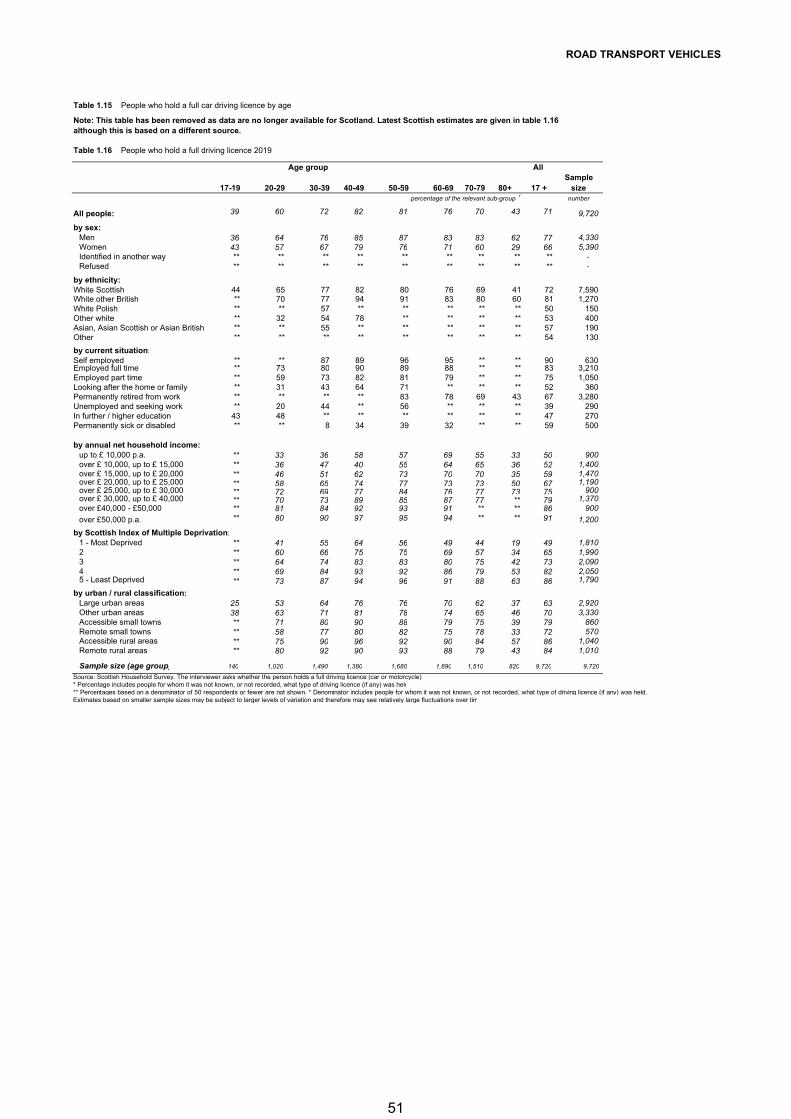
ROAD TRANSPORT VEHICLES
Table 1.15 People who hold a full car driving licence by age
Note: This table has been removed as data are no longer available for Scotland. Latest Scottish estimates are given in table 1.16although this is based on a different source.
Table 1.16 People who hold a full driving licence 2019
Age group All
17-19 20-29 30-39 40-49 50-59 60-69 70-79 80+ 17 +percentage of the relevant sub-group 1 number
All people: 39 60 72 82 81 76 70 43 71 9,720
by sex:Men 36 64 76 85 87 83 83 62 77 4,330 Women 43 57 67 79 76 71 60 29 66 5,390 Identified in another way ** ** ** ** ** ** ** ** ** - Refused ** ** ** ** ** ** ** ** ** -
by ethnicity:White Scottish 44 65 77 82 80 76 69 41 72 7,590 White other British ** 70 77 94 91 83 80 60 81 1,270 White Polish ** ** 57 ** ** ** ** ** 50 150 Other white ** 32 54 78 ** ** ** ** 53 400 Asian, Asian Scottish or Asian British ** ** 55 ** ** ** ** ** 57 190 Other ** ** ** ** ** ** ** ** 54 130
by current situation:Self employed ** ** 87 89 96 95 ** ** 90 630 Employed full time ** 73 80 90 89 88 ** ** 83 3,210 Employed part time ** 59 73 82 81 79 ** ** 75 1,050 Looking after the home or family ** 31 43 64 71 ** ** ** 52 360 Permanently retired from work ** ** ** ** 83 78 69 43 67 3,280 Unemployed and seeking work ** 20 44 ** 56 ** ** ** 39 290 In further / higher education 43 48 ** ** ** ** ** ** 47 270 Permanently sick or disabled ** ** 8 34 39 32 ** ** 59 500
by annual net household income:up to £ 10,000 p.a. ** 33 36 58 57 69 55 33 50 900 over £ 10,000, up to £ 15,000 ** 36 47 40 55 64 65 36 52 1,400 over £ 15,000, up to £ 20,000 ** 46 51 62 73 70 70 35 59 1,470 over £ 20,000, up to £ 25,000 ** 58 65 74 77 73 73 50 67 1,190 over £ 25,000, up to £ 30,000 ** 72 69 77 84 76 77 73 75 900 over £ 30,000, up to £ 40,000 ** 70 73 89 85 87 77 ** 79 1,370 over £40,000 - £50,000 ** 81 84 92 93 91 ** ** 86 900
over £50,000 p.a. ** 80 90 97 95 94 ** ** 91 1,200
by Scottish Index of Multiple Deprivation:1 - Most Deprived ** 41 55 64 56 49 44 19 49 1,810 2 ** 60 66 75 75 69 57 34 65 1,990 3 ** 64 74 83 83 80 75 42 73 2,090 4 ** 69 84 93 92 86 79 53 82 2,050 5 - Least Deprived ** 73 87 94 96 91 88 63 86 1,790
by urban / rural classification:Large urban areas 25 53 64 76 76 70 62 37 63 2,920 Other urban areas 38 63 71 81 78 74 65 46 70 3,330 Accessible small towns ** 71 80 90 88 79 75 39 79 860 Remote small towns ** 58 77 80 82 75 78 33 72 570 Accessible rural areas ** 75 90 96 92 90 84 57 86 1,040 Remote rural areas ** 80 92 90 93 88 79 43 84 1,010
Sample size (age group) 140 1,020 1,490 1,380 1,680 1,690 1,510 820 9,720 9,720
Source: Scottish Household Survey. The interviewer asks whether the person holds a full driving licence (car or motorcycle).* Percentage includes people for whom it was not known, or not recorded, what type of driving licence (if any) was held
** Percentages based on a denominator of 50 respondents or fewer are not shown. * Denominator includes people for whom it was not known, or not recorded, what type of driving licence (if any) was held.Estimates based on smaller sample sizes may be subject to larger levels of variation and therefore may see relatively large fluctuations over tim
Sample size
51
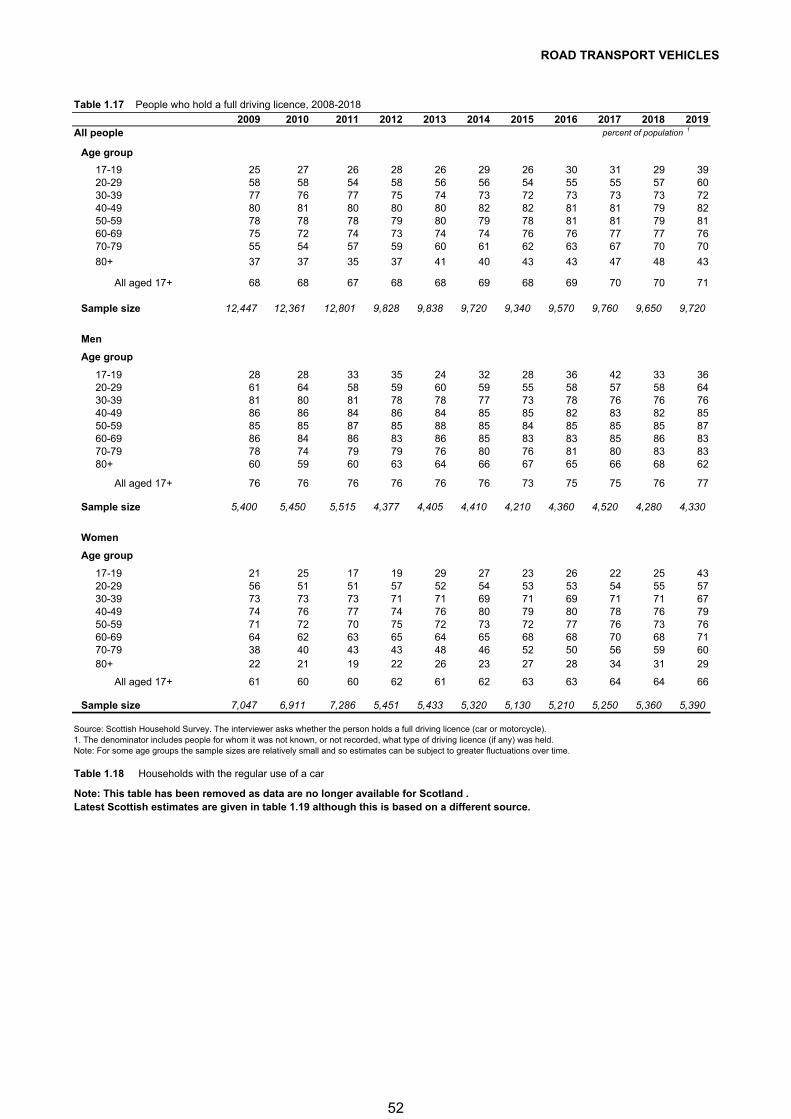
ROAD TRANSPORT VEHICLES
Table 1.17 People who hold a full driving licence, 2008-2018
2009 2010 2011 2012 2013 2014 2015 2016 2017 2018 2019All people percent of population 1
Age group
17-19 25 27 26 28 26 29 26 30 31 29 3920-29 58 58 54 58 56 56 54 55 55 57 6030-39 77 76 77 75 74 73 72 73 73 73 7240-49 80 81 80 80 80 82 82 81 81 79 8250-59 78 78 78 79 80 79 78 81 81 79 8160-69 75 72 74 73 74 74 76 76 77 77 7670-79 55 54 57 59 60 61 62 63 67 70 70
80+ 37 37 35 37 41 40 43 43 47 48 43
All aged 17+ 68 68 67 68 68 69 68 69 70 70 71
Sample size 12,447 12,361 12,801 9,828 9,838 9,720 9,340 9,570 9,760 9,650 9,720
Men
Age group
17-19 28 28 33 35 24 32 28 36 42 33 3620-29 61 64 58 59 60 59 55 58 57 58 6430-39 81 80 81 78 78 77 73 78 76 76 7640-49 86 86 84 86 84 85 85 82 83 82 8550-59 85 85 87 85 88 85 84 85 85 85 8760-69 86 84 86 83 86 85 83 83 85 86 8370-79 78 74 79 79 76 80 76 81 80 83 8380+ 60 59 60 63 64 66 67 65 66 68 62
All aged 17+ 76 76 76 76 76 76 73 75 75 76 77
Sample size 5,400 5,450 5,515 4,377 4,405 4,410 4,210 4,360 4,520 4,280 4,330
Women
Age group
17-19 21 25 17 19 29 27 23 26 22 25 4320-29 56 51 51 57 52 54 53 53 54 55 5730-39 73 73 73 71 71 69 71 69 71 71 6740-49 74 76 77 74 76 80 79 80 78 76 7950-59 71 72 70 75 72 73 72 77 76 73 7660-69 64 62 63 65 64 65 68 68 70 68 7170-79 38 40 43 43 48 46 52 50 56 59 6080+ 22 21 19 22 26 23 27 28 34 31 29
All aged 17+ 61 60 60 62 61 62 63 63 64 64 66
Sample size 7,047 6,911 7,286 5,451 5,433 5,320 5,130 5,210 5,250 5,360 5,390
Source: Scottish Household Survey. The interviewer asks whether the person holds a full driving licence (car or motorcycle). 1. The denominator includes people for whom it was not known, or not recorded, what type of driving licence (if any) was held. Note: For some age groups the sample sizes are relatively small and so estimates can be subject to greater fluctuations over time.
Table 1.18 Households with the regular use of a car
Note: This table has been removed as data are no longer available for Scotland . Latest Scottish estimates are given in table 1.19 although this is based on a different source.
52
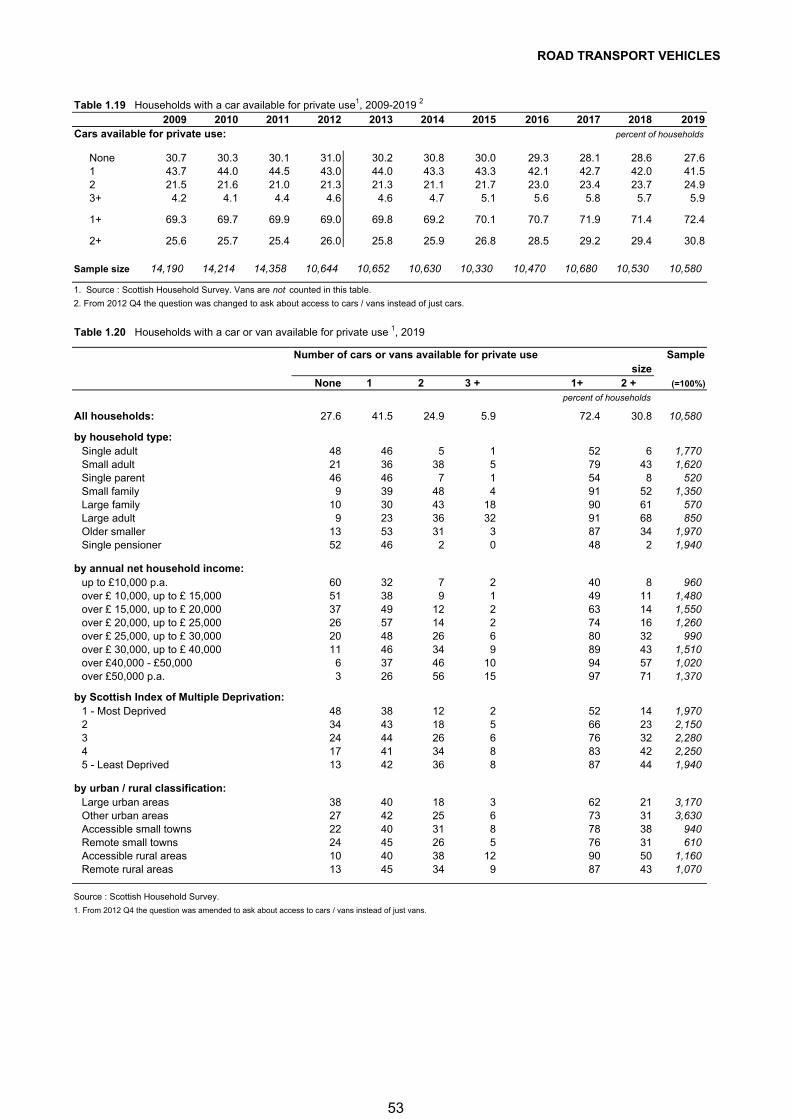
ROAD TRANSPORT VEHICLES
Table 1.19 Households with a car available for private use1, 2009-2019 2
2009 2010 2011 2012 2013 2014 2015 2016 2017 2018 2019Cars available for private use: percent of households
None 30.7 30.3 30.1 31.0 30.2 30.8 30.0 29.3 28.1 28.6 27.61 43.7 44.0 44.5 43.0 44.0 43.3 43.3 42.1 42.7 42.0 41.52 21.5 21.6 21.0 21.3 21.3 21.1 21.7 23.0 23.4 23.7 24.93+ 4.2 4.1 4.4 4.6 4.6 4.7 5.1 5.6 5.8 5.7 5.9
1+ 69.3 69.7 69.9 69.0 69.8 69.2 70.1 70.7 71.9 71.4 72.4
2+ 25.6 25.7 25.4 26.0 25.8 25.9 26.8 28.5 29.2 29.4 30.8
Sample size 14,190 14,214 14,358 10,644 10,652 10,630 10,330 10,470 10,680 10,530 10,580
1. Source : Scottish Household Survey. Vans are not counted in this table.
2. From 2012 Q4 the question was changed to ask about access to cars / vans instead of just cars.
Table 1.20 Households with a car or van available for private use 1, 2019
Number of cars or vans available for private use Samplesize
None 1 2 3 + 1+ 2 + (=100%)
percent of households
All households: 27.6 41.5 24.9 5.9 72.4 30.8 10,580
by household type:Single adult 48 46 5 1 52 6 1,770 Small adult 21 36 38 5 79 43 1,620 Single parent 46 46 7 1 54 8 520 Small family 9 39 48 4 91 52 1,350 Large family 10 30 43 18 90 61 570 Large adult 9 23 36 32 91 68 850 Older smaller 13 53 31 3 87 34 1,970 Single pensioner 52 46 2 0 48 2 1,940
by annual net household income:up to £10,000 p.a. 60 32 7 2 40 8 960 over £ 10,000, up to £ 15,000 51 38 9 1 49 11 1,480 over £ 15,000, up to £ 20,000 37 49 12 2 63 14 1,550 over £ 20,000, up to £ 25,000 26 57 14 2 74 16 1,260 over £ 25,000, up to £ 30,000 20 48 26 6 80 32 990 over £ 30,000, up to £ 40,000 11 46 34 9 89 43 1,510 over £40,000 - £50,000 6 37 46 10 94 57 1,020 over £50,000 p.a. 3 26 56 15 97 71 1,370
by Scottish Index of Multiple Deprivation:1 - Most Deprived 48 38 12 2 52 14 1,970 2 34 43 18 5 66 23 2,150 3 24 44 26 6 76 32 2,280 4 17 41 34 8 83 42 2,250 5 - Least Deprived 13 42 36 8 87 44 1,940
by urban / rural classification:Large urban areas 38 40 18 3 62 21 3,170 Other urban areas 27 42 25 6 73 31 3,630 Accessible small towns 22 40 31 8 78 38 940 Remote small towns 24 45 26 5 76 31 610 Accessible rural areas 10 40 38 12 90 50 1,160 Remote rural areas 13 45 34 9 87 43 1,070
Source : Scottish Household Survey.
1. From 2012 Q4 the question was amended to ask about access to cars / vans instead of just vans.
53
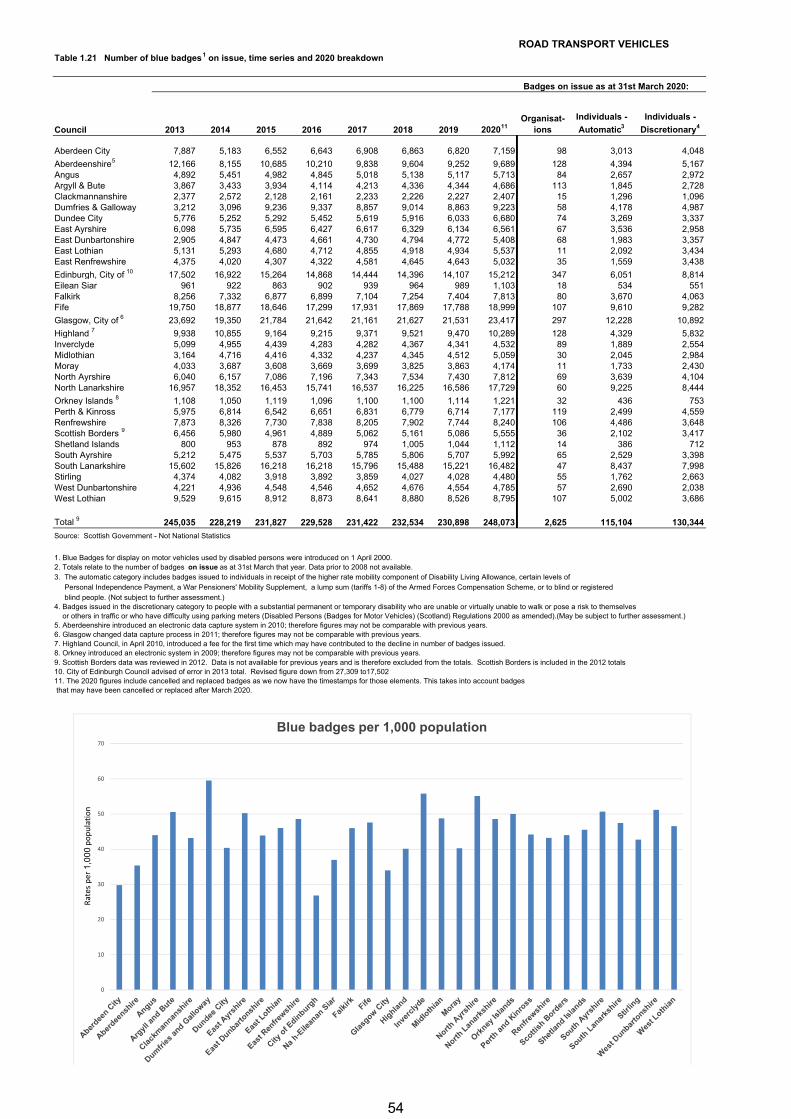
ROAD TRANSPORT VEHICLESTable 1.21 Number of blue badges1 on issue, time series and 2020 breakdown
Council 2013 2014 2015 2016 2017 2018 2019 202011Organisat-
ions
Individuals -
Automatic3
Individuals -
Discretionary4
Aberdeen City 7,887 5,183 6,552 6,643 6,908 6,863 6,820 7,159 98 3,013 4,048
Aberdeenshire5 12,166 8,155 10,685 10,210 9,838 9,604 9,252 9,689 128 4,394 5,167Angus 4,892 5,451 4,982 4,845 5,018 5,138 5,117 5,713 84 2,657 2,972Argyll & Bute 3,867 3,433 3,934 4,114 4,213 4,336 4,344 4,686 113 1,845 2,728Clackmannanshire 2,377 2,572 2,128 2,161 2,233 2,226 2,227 2,407 15 1,296 1,096Dumfries & Galloway 3,212 3,096 9,236 9,337 8,857 9,014 8,863 9,223 58 4,178 4,987Dundee City 5,776 5,252 5,292 5,452 5,619 5,916 6,033 6,680 74 3,269 3,337East Ayrshire 6,098 5,735 6,595 6,427 6,617 6,329 6,134 6,561 67 3,536 2,958East Dunbartonshire 2,905 4,847 4,473 4,661 4,730 4,794 4,772 5,408 68 1,983 3,357East Lothian 5,131 5,293 4,680 4,712 4,855 4,918 4,934 5,537 11 2,092 3,434East Renfrewshire 4,375 4,020 4,307 4,322 4,581 4,645 4,643 5,032 35 1,559 3,438
Edinburgh, City of 10 17,502 16,922 15,264 14,868 14,444 14,396 14,107 15,212 347 6,051 8,814Eilean Siar 961 922 863 902 939 964 989 1,103 18 534 551Falkirk 8,256 7,332 6,877 6,899 7,104 7,254 7,404 7,813 80 3,670 4,063Fife 19,750 18,877 18,646 17,299 17,931 17,869 17,788 18,999 107 9,610 9,282
Glasgow, City of 6 23,692 19,350 21,784 21,642 21,161 21,627 21,531 23,417 297 12,228 10,892
Highland 7 9,938 10,855 9,164 9,215 9,371 9,521 9,470 10,289 128 4,329 5,832Inverclyde 5,099 4,955 4,439 4,283 4,282 4,367 4,341 4,532 89 1,889 2,554Midlothian 3,164 4,716 4,416 4,332 4,237 4,345 4,512 5,059 30 2,045 2,984Moray 4,033 3,687 3,608 3,669 3,699 3,825 3,863 4,174 11 1,733 2,430North Ayrshire 6,040 6,157 7,086 7,196 7,343 7,534 7,430 7,812 69 3,639 4,104North Lanarkshire 16,957 18,352 16,453 15,741 16,537 16,225 16,586 17,729 60 9,225 8,444
Orkney Islands 8 1,108 1,050 1,119 1,096 1,100 1,100 1,114 1,221 32 436 753Perth & Kinross 5,975 6,814 6,542 6,651 6,831 6,779 6,714 7,177 119 2,499 4,559Renfrewshire 7,873 8,326 7,730 7,838 8,205 7,902 7,744 8,240 106 4,486 3,648Scottish Borders 9 6,456 5,980 4,961 4,889 5,062 5,161 5,086 5,555 36 2,102 3,417Shetland Islands 800 953 878 892 974 1,005 1,044 1,112 14 386 712South Ayrshire 5,212 5,475 5,537 5,703 5,785 5,806 5,707 5,992 65 2,529 3,398South Lanarkshire 15,602 15,826 16,218 16,218 15,796 15,488 15,221 16,482 47 8,437 7,998Stirling 4,374 4,082 3,918 3,892 3,859 4,027 4,028 4,480 55 1,762 2,663West Dunbartonshire 4,221 4,936 4,548 4,546 4,652 4,676 4,554 4,785 57 2,690 2,038West Lothian 9,529 9,615 8,912 8,873 8,641 8,880 8,526 8,795 107 5,002 3,686
Total 9 245,035 228,219 231,827 229,528 231,422 232,534 230,898 248,073 2,625 115,104 130,344
Source: Scottish Government - Not National Statistics
1. Blue Badges for display on motor vehicles used by disabled persons were introduced on 1 April 2000.2. Totals relate to the number of badges on issue as at 31st March that year. Data prior to 2008 not available. 3. The automatic category includes badges issued to individuals in receipt of the higher rate mobility component of Disability Living Allowance, certain levels of Personal Independence Payment, a War Pensioners' Mobility Supplement, a lump sum (tariffs 1-8) of the Armed Forces Compensation Scheme, or to blind or registered blind people. (Not subject to further assessment.)4. Badges issued in the discretionary category to people with a substantial permanent or temporary disability who are unable or virtually unable to walk or pose a risk to themselves or others in traffic or who have difficulty using parking meters (Disabled Persons (Badges for Motor Vehicles) (Scotland) Regulations 2000 as amended).(May be subject to further assessment.)5. Aberdeenshire introduced an electronic data capture system in 2010; therefore figures may not be comparable with previous years.6. Glasgow changed data capture process in 2011; therefore figures may not be comparable with previous years.7. Highland Council, in April 2010, introduced a fee for the first time which may have contributed to the decline in number of badges issued.8. Orkney introduced an electronic system in 2009; therefore figures may not be comparable with previous years.9. Scottish Borders data was reviewed in 2012. Data is not available for previous years and is therefore excluded from the totals. Scottish Borders is included in the 2012 totals10. City of Edinburgh Council advised of error in 2013 total. Revised figure down from 27,309 to17,50211. The 2020 figures include cancelled and replaced badges as we now have the timestamps for those elements. This takes into account badges that may have been cancelled or replaced after March 2020.
Badges on issue as at 31st March 2020:
0
10
20
30
40
50
60
70
Blue badges per 1,000 population
Rates per 1
,00
0population
54
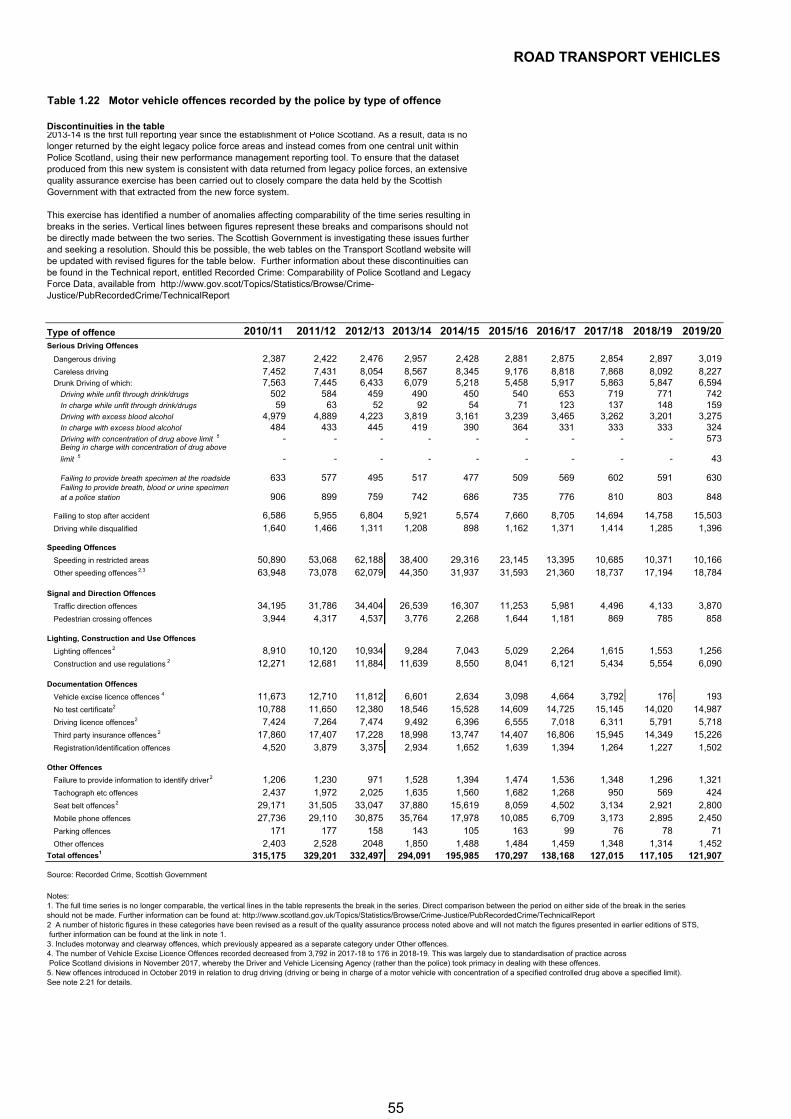
ROAD TRANSPORT VEHICLES
Table 1.22 Motor vehicle offences recorded by the police by type of offence
Discontinuities in the table
Type of offence 2010/11 2011/12 2012/13 2013/14 2014/15 2015/16 2016/17 2017/18 2018/19 2019/20Serious Driving Offences
Dangerous driving 2,387 2,422 2,476 2,957 2,428 2,881 2,875 2,854 2,897 3,019Careless driving 7,452 7,431 8,054 8,567 8,345 9,176 8,818 7,868 8,092 8,227Drunk Driving of which: 7,563 7,445 6,433 6,079 5,218 5,458 5,917 5,863 5,847 6,594
Driving while unfit through drink/drugs 502 584 459 490 450 540 653 719 771 742In charge while unfit through drink/drugs 59 63 52 92 54 71 123 137 148 159Driving with excess blood alcohol 4,979 4,889 4,223 3,819 3,161 3,239 3,465 3,262 3,201 3,275In charge with excess blood alcohol 484 433 445 419 390 364 331 333 333 324Driving with concentration of drug above limit 5 - - - - - - - - - 573Being in charge with concentration of drug above
limit 5 - - - - - - - - - 43
Failing to provide breath specimen at the roadside 633 577 495 517 477 509 569 602 591 630Failing to provide breath, blood or urine specimen at a police station 906 899 759 742 686 735 776 810 803 848
Failing to stop after accident 6,586 5,955 6,804 5,921 5,574 7,660 8,705 14,694 14,758 15,503Driving while disqualified 1,640 1,466 1,311 1,208 898 1,162 1,371 1,414 1,285 1,396
Speeding Offences
Speeding in restricted areas 50,890 53,068 62,188 38,400 29,316 23,145 13,395 10,685 10,371 10,166Other speeding offences 2,3 63,948 73,078 62,079 44,350 31,937 31,593 21,360 18,737 17,194 18,784
Signal and Direction Offences
Traffic direction offences 34,195 31,786 34,404 26,539 16,307 11,253 5,981 4,496 4,133 3,870Pedestrian crossing offences 3,944 4,317 4,537 3,776 2,268 1,644 1,181 869 785 858
Lighting, Construction and Use Offences
Lighting offences2 8,910 10,120 10,934 9,284 7,043 5,029 2,264 1,615 1,553 1,256Construction and use regulations 2 12,271 12,681 11,884 11,639 8,550 8,041 6,121 5,434 5,554 6,090
Documentation Offences
Vehicle excise licence offences 4 11,673 12,710 11,812 6,601 2,634 3,098 4,664 3,792 176 193No test certificate2 10,788 11,650 12,380 18,546 15,528 14,609 14,725 15,145 14,020 14,987Driving licence offences2 7,424 7,264 7,474 9,492 6,396 6,555 7,018 6,311 5,791 5,718Third party insurance offences 2 17,860 17,407 17,228 18,998 13,747 14,407 16,806 15,945 14,349 15,226Registration/identification offences 4,520 3,879 3,375 2,934 1,652 1,639 1,394 1,264 1,227 1,502
Other Offences
Failure to provide information to identify driver2 1,206 1,230 971 1,528 1,394 1,474 1,536 1,348 1,296 1,321Tachograph etc offences 2,437 1,972 2,025 1,635 1,560 1,682 1,268 950 569 424Seat belt offences2 29,171 31,505 33,047 37,880 15,619 8,059 4,502 3,134 2,921 2,800Mobile phone offences 27,736 29,110 30,875 35,764 17,978 10,085 6,709 3,173 2,895 2,450Parking offences 171 177 158 143 105 163 99 76 78 71Other offences 2,403 2,528 2048 1,850 1,488 1,484 1,459 1,348 1,314 1,452
Total offences1 315,175 329,201 332,497 294,091 195,985 170,297 138,168 127,015 117,105 121,907
Source: Recorded Crime, Scottish Government
Notes:1. The full time series is no longer comparable, the vertical lines in the table represents the break in the series. Direct comparison between the period on either side of the break in the seriesshould not be made. Further information can be found at: http://www.scotland.gov.uk/Topics/Statistics/Browse/Crime-Justice/PubRecordedCrime/TechnicalReport2 A number of historic figures in these categories have been revised as a result of the quality assurance process noted above and will not match the figures presented in earlier editions of STS, further information can be found at the link in note 1.3. Includes motorway and clearway offences, which previously appeared as a separate category under Other offences.4. The number of Vehicle Excise Licence Offences recorded decreased from 3,792 in 2017-18 to 176 in 2018-19. This was largely due to standardisation of practice across Police Scotland divisions in November 2017, whereby the Driver and Vehicle Licensing Agency (rather than the police) took primacy in dealing with these offences.5. New offences introduced in October 2019 in relation to drug driving (driving or being in charge of a motor vehicle with concentration of a specified controlled drug above a specified limit). See note 2.21 for details.
2013-14 is the first full reporting year since the establishment of Police Scotland. As a result, data is no longer returned by the eight legacy police force areas and instead comes from one central unit within Police Scotland, using their new performance management reporting tool. To ensure that the dataset produced from this new system is consistent with data returned from legacy police forces, an extensive quality assurance exercise has been carried out to closely compare the data held by the Scottish Government with that extracted from the new force system.
This exercise has identified a number of anomalies affecting comparability of the time series resulting in breaks in the series. Vertical lines between figures represent these breaks and comparisons should not be directly made between the two series. The Scottish Government is investigating these issues further and seeking a resolution. Should this be possible, the web tables on the Transport Scotland website will be updated with revised figures for the table below. Further information about these discontinuities can be found in the Technical report, entitled Recorded Crime: Comparability of Police Scotland and Legacy Force Data, available from http://www.gov.scot/Topics/Statistics/Browse/Crime-Justice/PubRecordedCrime/TechnicalReport
55
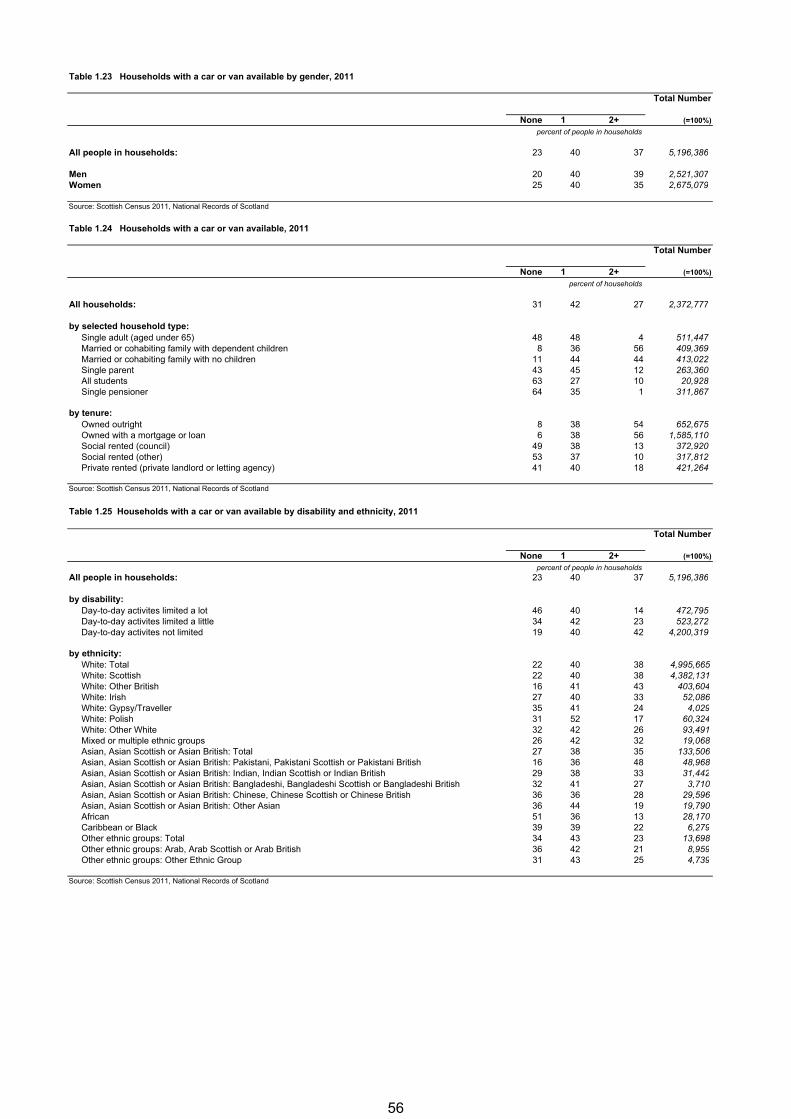
Table 1.23 Households with a car or van available by gender, 2011
Total Number
None 1 2+ (=100%)
percent of people in households
All people in households: 23 40 37 5,196,386
Men 20 40 39 2,521,307 Women 25 40 35 2,675,079
Source: Scottish Census 2011, National Records of Scotland
Table 1.24 Households with a car or van available, 2011
Total Number
None 1 2+ (=100%)
percent of households
All households: 31 42 27 2,372,777
by selected household type: Single adult (aged under 65) 48 48 4 511,447 Married or cohabiting family with dependent children 8 36 56 409,369 Married or cohabiting family with no children 11 44 44 413,022 Single parent 43 45 12 263,360 All students 63 27 10 20,928 Single pensioner 64 35 1 311,867
by tenure: Owned outright 8 38 54 652,675 Owned with a mortgage or loan 6 38 56 1,585,110 Social rented (council) 49 38 13 372,920 Social rented (other) 53 37 10 317,812 Private rented (private landlord or letting agency) 41 40 18 421,264
Source: Scottish Census 2011, National Records of Scotland
Total Number
None 1 2+ (=100%)
percent of people in householdsAll people in households: 23 40 37 5,196,386
by disability: Day-to-day activites limited a lot 46 40 14 472,795 Day-to-day activites limited a little 34 42 23 523,272 Day-to-day activites not limited 19 40 42 4,200,319
by ethnicity: White: Total 22 40 38 4,995,665 White: Scottish 22 40 38 4,382,131 White: Other British 16 41 43 403,604 White: Irish 27 40 33 52,086 White: Gypsy/Traveller 35 41 24 4,029 White: Polish 31 52 17 60,324 White: Other White 32 42 26 93,491 Mixed or multiple ethnic groups 26 42 32 19,068 Asian, Asian Scottish or Asian British: Total 27 38 35 133,506 Asian, Asian Scottish or Asian British: Pakistani, Pakistani Scottish or Pakistani British 16 36 48 48,968 Asian, Asian Scottish or Asian British: Indian, Indian Scottish or Indian British 29 38 33 31,442 Asian, Asian Scottish or Asian British: Bangladeshi, Bangladeshi Scottish or Bangladeshi British 32 41 27 3,710 Asian, Asian Scottish or Asian British: Chinese, Chinese Scottish or Chinese British 36 36 28 29,596 Asian, Asian Scottish or Asian British: Other Asian 36 44 19 19,790 African 51 36 13 28,170 Caribbean or Black 39 39 22 6,279 Other ethnic groups: Total 34 43 23 13,698 Other ethnic groups: Arab, Arab Scottish or Arab British 36 42 21 8,959 Other ethnic groups: Other Ethnic Group 31 43 25 4,739
Source: Scottish Census 2011, National Records of Scotland
Table 1.25 Households with a car or van available by disability and ethnicity, 2011
56

57
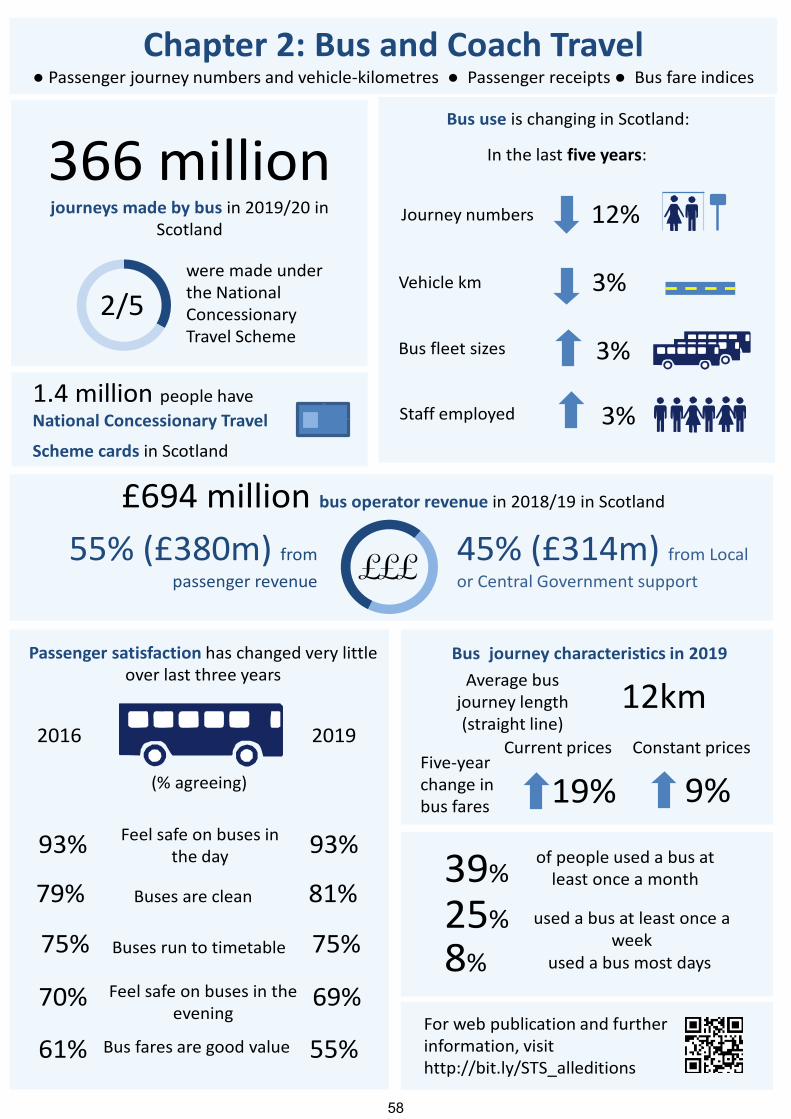
Bus journey characteristics in 2019
Chapter 2: Bus and Coach Travel● Passenger journey numbers and vehicle‐kilometres ● Passenger receipts ● Bus fare indices
366 millionjourneys made by bus in 2019/20 in
Scotland
2/5
were made under the National Concessionary Travel Scheme
Bus use is changing in Scotland:
Passenger satisfaction has changed very little over last three years
1.4 million people have National Concessionary Travel Scheme cards in Scotland
In the last five years:
Journey numbers
Vehicle km
Bus fleet sizes
Staff employed
12%
3%
3%
3%
£694 million bus operator revenue in 2018/19 in Scotland
45% (£314m) from Local
or Central Government support
55% (£380m) from
passenger revenue
2016 2019
Buses run to timetable
Bus fares are good value
Buses are clean
Feel safe on buses in the evening
75% 75%
61% 55%
79% 81%
93% 93%
70% 69%
Feel safe on buses in the day
(% agreeing)
£££
12kmAverage bus journey length(straight line)
Five‐year change in bus fares
Current prices Constant prices
9%19%
For web publication and further information, visithttp://bit.ly/STS_alleditions
39% of people used a bus at least once a month
used a bus at least once a week
used a bus most days
25% 8%
58
BUS AND COACH TRAVEL
1. Introduction 1.1 This chapter provides information on bus and coach travel, such as the numbers of passenger journeys and vehicle-kilometres, passenger receipts and local bus fare indices, the numbers of vehicles of various types and the numbers of staff employed. 1.2 Estimates of passenger numbers, receipts and fares are based on a survey by the DfT and are therefore subject to sampling error. Figures from 2004-05 onwards are based on an improved methodology and may not be directly comparable with previous years. See the Notes and Definitions section, page 225. Key points
366 million journeys were made by bus in 2019-20. Almost two fifths of these were made under the National Concessionary Travel Scheme.
There were 1.4 million people with National Concessionary Travel cards in Scotland in 2020.
The bus industry received £314 million in funding from local or central government in 2018-19. Passenger revenue in 2019-20 stood at £341 million in Scotland.
2. Main Points Vehicles and Passengers 2.1 Around 366 million passenger journeys were made by bus in Scotland in 2019-20. This is a decrease of 3.2 per cent on 2018-19 and a 25 per cent fall from a peak in 2007-08. Journeys under the National Concessionary Travel Scheme make up almost two fifths of this figure (38%). (Table 2.2a)
2.2 Although vehicle kilometres have risen by 1 per cent over the last year, the distance covered fell in eight of the last twelve years. (Table 2.3a) 2.3 The number of buses in operators’ fleets increased by 3 per cent since 2014-15 and there was a 5 per cent increase in the number of staff employed in the industry over the same period. (Table 2.1a and 2.4) 2.4 Both Great Britain as a whole, and Scotland have seen passenger journeys fall by 12% over the past five years. Great Britain vehicle kilometres fell by 10% compared to no change for Scotland. (Table 2.2a and 2.3a) 2.5 The picture of bus use in Scotland also contrasts with train travel in Scotland, which accounts for only a quarter of the passenger journeys made by bus but has seen steady increases in passenger numbers over the past few years. (Table SGB1)
59
BUS AND COACH TRAVEL
2.6 Bus travel in the Southwest and Strathclyde and South East (corresponding to the Regional Transport Partnership areas of SPT, SWestrans (Dumfries and Galloway) and SEStran) accounts for 84 per cent of bus journeys in Scotland. (Table 2.2b) 2.7 Bus use is higher in urban areas and lower in rural areas. The Scottish Household Survey travel diary shows 53 per cent of those who used the bus the previous day lived in large urban areas compared to three per cent of users living in remote rural areas. (This compares to population estimates of 35% living in large urban areas and 6% living in remote rural areas.) These figures are supported by the results of the more general question on bus use included in the Transport and Travel in Scotland publication which shows 54 per cent of respondents in large urban areas had used the bus in the last month compared to 20 per cent of those in remote rural areas. (Table 2.10) Operator revenue
2.8 Bus operators in Scotland received £694 million in revenue in 2018-19, an increase of 1 per cent on the previous year and a 5 per cent increase over the last 5 years. Adjusting for the effects of inflation total passenger revenue was 4 per cent less than 5 years ago. (Table 2.8) 2.9 Almost half (£314 million, 45%) of operator revenue came from local or central government: through concessionary travel reimbursement, Bus Service Operators Grant (BSOG) or supported services. Passenger revenue (i.e. ticket sales to non-concessionary passengers) accounted for around 55 per cent of operators’ revenue (£380 million). Additional non-revenue support is excluded from these figures, specifically the Scottish Green Bus Fund and the Bus Investment Fund. (Table 2.8) 2.10 In real terms (adjusting for the effects of inflation), funding from local and national government is now 4 per cent lower than five years ago and overall passenger revenue is 3 percent less than 5 years ago. When looking at these figures it is necessary to consider the passenger number figures in Table 2.2a and the fares data in Table 2.5. Passenger revenue over the last five years has not increased due to a 10 per cent decrease in passengers, although fares have increased by 9 per cent above general inflation over the same period. (Table 2.8, 2.2a and 2.5) Fares
2.11 Bus fares in Scotland have increased by 9 per cent in real terms (adjusting for the effects of inflation) over the past five years, while the increase for Great Britain was 4 per cent. In current prices, i.e. viewing fare increases in the way that a consumer would, fares have risen by almost 19 per cent over the past five years. The increase in current prices is higher than in Great Britain as a whole which has seen an increase of 13 per cent over the last five years. (Table 2.5) Operator costs
2.12 Although operating costs for bus operators rose to a peak in 2011-12 they then fell over the next few years. However, they have started to rise again and over the past five years operating costs per vehicle km have increased by 3 per cent in real terms. Operating costs per journey over the same 5 year period have risen by
60
BUS AND COACH TRAVEL
15 per cent from £1.60 per passenger journey to £1.84. Although the operating costs per vehicle km is lower than for the rest of GB (excluding London), operating costs per passenger journey remain higher in GB (£1.84 in Scotland, compared to £1.63 for GB excluding London). See also ‘Other sources of data’, as more detailed costs data is available from the Confederation of Passenger Transport. (Table 2.6 and 2.7) Passenger Satisfaction 2.13 People were satisfied with most aspects of bus services that the Scottish Household Survey asked them about. (Table 2.11) 2.14 At least three quarters of respondents were satisfied with the extent to which buses ran to timetable; the cleanliness of buses; bus service is stable and not regularly changing; the ease of finding out route and timetable information; feel safe/secure on bus during day; and the simplicity of deciding which ticket they need. 2.15 Respondents gave lower satisfaction scores for the extent to which buses were environmentally friendly (56%) and whether the fares were good value (55%). 2.16 Additionally there was a noticeable difference in those who felt safe on the bus during the day and in the evening. Ninety-three per cent of respondents agreed that they felt safe using the bus during the day compared to 69 per cent in the evening. Concessionary Travel 2.17 The National Concessionary Travel Scheme for older and disabled people was rolled out across Scotland in April 2006. The scheme enables individuals aged 60+ or those with a disability (who meet certain criteria) to travel free on buses across Scotland. In some local authorities the card can be used on trains and ferries. There is also a scheme for young people, The Young Scot Card. Those aged 16-18, or full-time volunteers aged under 26 can use the card to get a third off adult single fares on bus services in Scotland, a third off rail travel and two free journeys to the mainland for islanders. 147,000 young people were eligible to access the travel concessions available through their Young Scot card in 2020. The young persons scheme is excluded from the analysis in paragraph 2.19 and 2.20 but is included in table 11.29. (Table 2.13) 2.18 Eighty nine per cent of young people (16-18) had a concessionary fare pass under the Scheme in 2020, and 92 per cent of those aged 60 or over had a pass. These proportions have changed little over the period since the introduction of the national scheme, though there has been a steady increase in pass holder numbers over the period. (Table 2.12 and 2.13) 2.19 The majority of pass holders (91%) in the older and disabled persons scheme hold a pass on the basis of age. Of those who have a pass for the disabled or visually impaired, 73% have a companion card which allows someone to travel with them on the bus. Card holder numbers by local authority are shown in Table 2.14. (Table 2.13)
61
BUS AND COACH TRAVEL
2.20 Details of trips made on buses under the National Concessionary Travel Scheme are included in Table 2.2a. Further details of journeys made on all modes of transport under the National Schemes and current and previous local schemes are shown in table 11.29. Bus journeys account for almost all (95%) of journeys made under the concessionary travel scheme. See the notes in Chapter 11 for more detail around what is included in this table. Other sources of data (not National Statistics) 2.21 Some industry data are available, though as they are not produced by Government they are not National Statistics and do not comply with the Code of Practice for Official Statistics. They are included here as an alternative information source which may be of interest to readers.
2.22 The Confederation of Passenger Transport (CPT) publish a Cost Index on their website. This shows that wages, staffing and labour accounted for around 60% of operating costs, with fuel accounting for 16%. Total costs have been above inflation for the last few years. 2.23 The Office of the Traffic Commissioner are responsible for the licensing of the operators of buses and coaches and the registration of local bus services (routes). Statistics are published in the Traffic Commissioners’ Annual Reports. There were 27 cases of action taken at public inquiry for non-compliance (under the Public Passenger Vehicles Act 1981) in Scotland in 2017-18, sixteen more than in 2016-17.
62
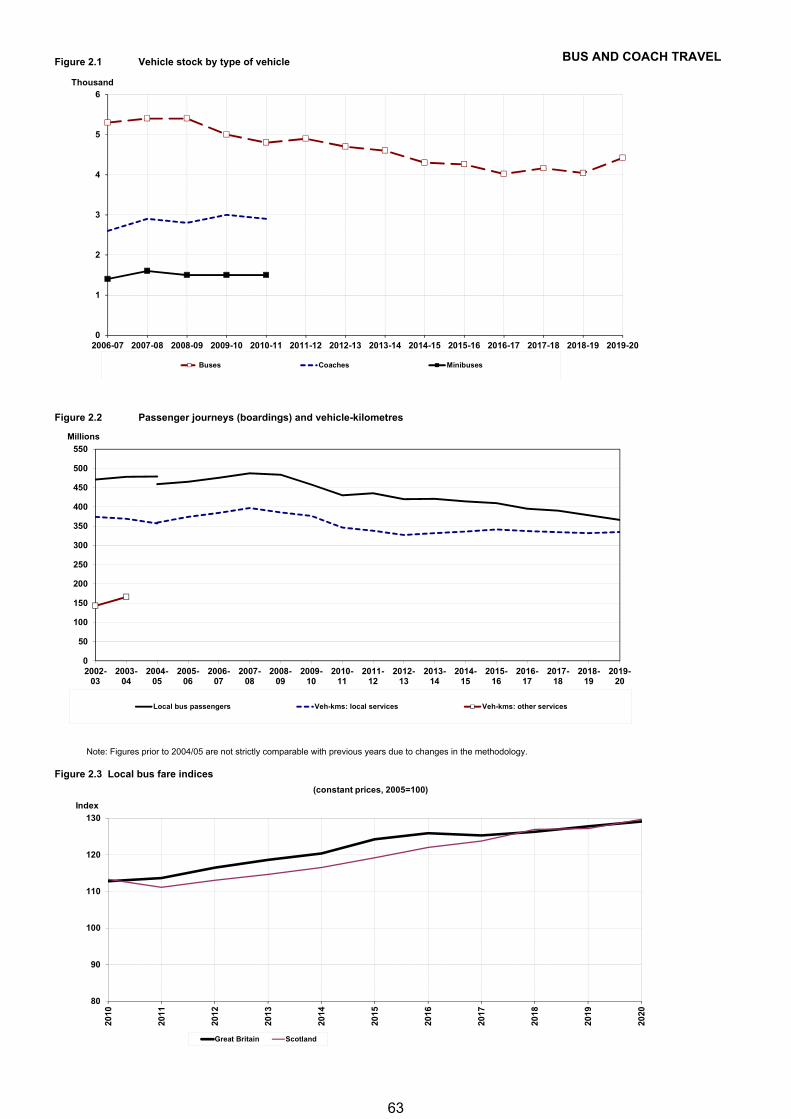
BUS AND COACH TRAVELFigure 2.1 Vehicle stock by type of vehicle
Figure 2.2 Passenger journeys (boardings) and vehicle-kilometres
Note: Figures prior to 2004/05 are not strictly comparable with previous years due to changes in the methodology.
Figure 2.3 Local bus fare indices
0
1
2
3
4
5
6
2006-07 2007-08 2008-09 2009-10 2010-11 2011-12 2012-13 2013-14 2014-15 2015-16 2016-17 2017-18 2018-19 2019-20
Buses Coaches Minibuses
Thousand
0
50
100
150
200
250
300
350
400
450
500
550
2002-03
2003-04
2004-05
2005-06
2006-07
2007-08
2008-09
2009-10
2010-11
2011-12
2012-13
2013-14
2014-15
2015-16
2016-17
2017-18
2018-19
2019-20
Millions
Local bus passengers Veh-kms: local services Veh-kms: other services
80
90
100
110
120
130
2010
2011
2012
2013
2014
2015
2016
2017
2018
2019
2020
Index
(constant prices, 2005=100)
Great Britain Scotland
63
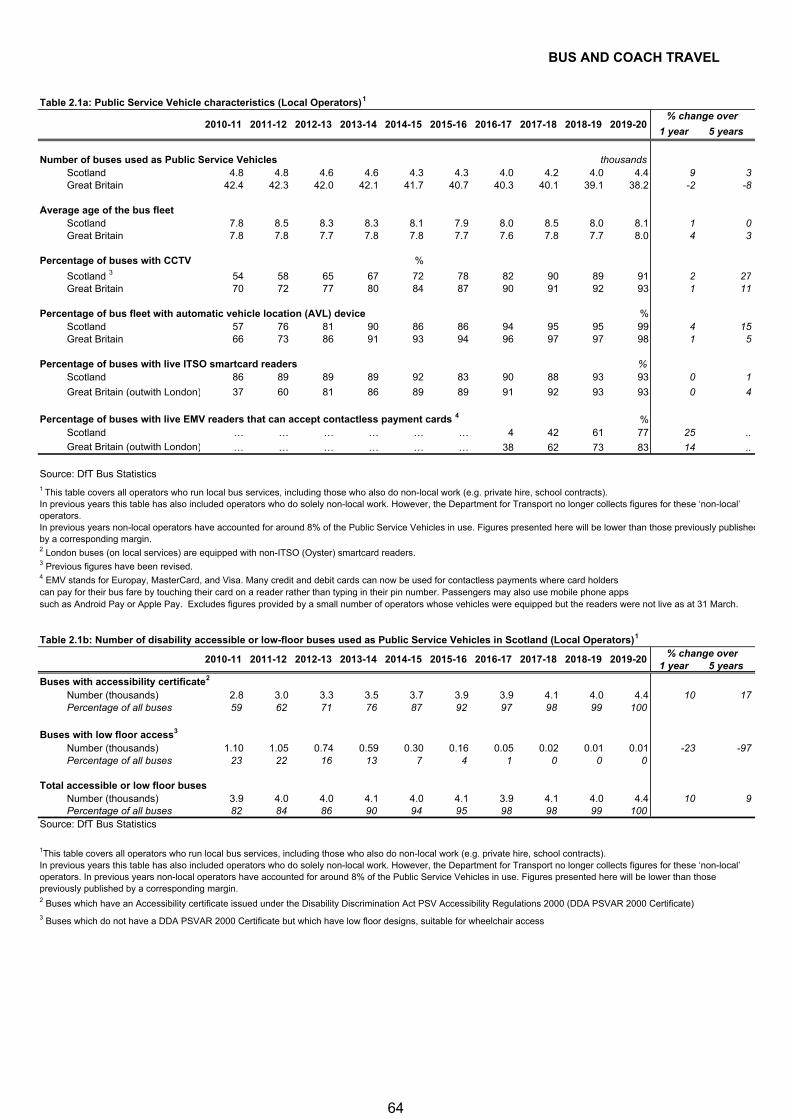
BUS AND COACH TRAVEL
Table 2.1a: Public Service Vehicle characteristics (Local Operators)1
1 year 5 years
Number of buses used as Public Service Vehicles thousandsScotland 4.8 4.8 4.6 4.6 4.3 4.3 4.0 4.2 4.0 4.4 9 3Great Britain 42.4 42.3 42.0 42.1 41.7 40.7 40.3 40.1 39.1 38.2 -2 -8
Average age of the bus fleetScotland 7.8 8.5 8.3 8.3 8.1 7.9 8.0 8.5 8.0 8.1 1 0Great Britain 7.8 7.8 7.7 7.8 7.8 7.7 7.6 7.8 7.7 8.0 4 3
Percentage of buses with CCTV %
Scotland 3 54 58 65 67 72 78 82 90 89 91 2 27Great Britain 70 72 77 80 84 87 90 91 92 93 1 11
Percentage of bus fleet with automatic vehicle location (AVL) device %Scotland 57 76 81 90 86 86 94 95 95 99 4 15Great Britain 66 73 86 91 93 94 96 97 97 98 1 5
Percentage of buses with live ITSO smartcard readers %Scotland 86 89 89 89 92 83 90 88 93 93 0 1
Great Britain (outwith London) 37 60 81 86 89 89 91 92 93 93 0 4
Percentage of buses with live EMV readers that can accept contactless payment cards 4 %Scotland … … … … … … 4 42 61 77 25 ..
Great Britain (outwith London) … … … … … … 38 62 73 83 14 ..
Source: DfT Bus Statistics
2 London buses (on local services) are equipped with non-ITSO (Oyster) smartcard readers.3 Previous figures have been revised.4 EMV stands for Europay, MasterCard, and Visa. Many credit and debit cards can now be used for contactless payments where card holders can pay for their bus fare by touching their card on a reader rather than typing in their pin number. Passengers may also use mobile phone apps such as Android Pay or Apple Pay. Excludes figures provided by a small number of operators whose vehicles were equipped but the readers were not live as at 31 March.
Table 2.1b: Number of disability accessible or low-floor buses used as Public Service Vehicles in Scotland (Local Operators)1
% change over1 year 5 years
Buses with accessibility certificate2
Number (thousands) 2.8 3.0 3.3 3.5 3.7 3.9 3.9 4.1 4.0 4.4 10 17Percentage of all buses 59 62 71 76 87 92 97 98 99 100
Buses with low floor access3
Number (thousands) 1.10 1.05 0.74 0.59 0.30 0.16 0.05 0.02 0.01 0.01 -23 -97Percentage of all buses 23 22 16 13 7 4 1 0 0 0
Total accessible or low floor busesNumber (thousands) 3.9 4.0 4.0 4.1 4.0 4.1 3.9 4.1 4.0 4.4 10 9Percentage of all buses 82 84 86 90 94 95 98 98 99 100
Source: DfT Bus Statistics
3 Buses which do not have a DDA PSVAR 2000 Certificate but which have low floor designs, suitable for wheelchair access
2018-19
2018-192015-162010-11
2013-142010-11
2017-182012-13
2015-16 2016-17% change over
2016-17
2014-15
2013-14
2017-18
1This table covers all operators who run local bus services, including those who also do non-local work (e.g. private hire, school contracts).In previous years this table has also included operators who do solely non-local work. However, the Department for Transport no longer collects figures for these ‘non-local’ operators. In previous years non-local operators have accounted for around 8% of the Public Service Vehicles in use. Figures presented here will be lower than those previously published by a corresponding margin.
2019-20
2019-20
2 Buses which have an Accessibility certificate issued under the Disability Discrimination Act PSV Accessibility Regulations 2000 (DDA PSVAR 2000 Certificate)
2011-12
2014-15
2012-13
2011-12
1 This table covers all operators who run local bus services, including those who also do non-local work (e.g. private hire, school contracts).In previous years this table has also included operators who do solely non-local work. However, the Department for Transport no longer collects figures for these ‘non-local’ operators.In previous years non-local operators have accounted for around 8% of the Public Service Vehicles in use. Figures presented here will be lower than those previously publishedby a corresponding margin.
64
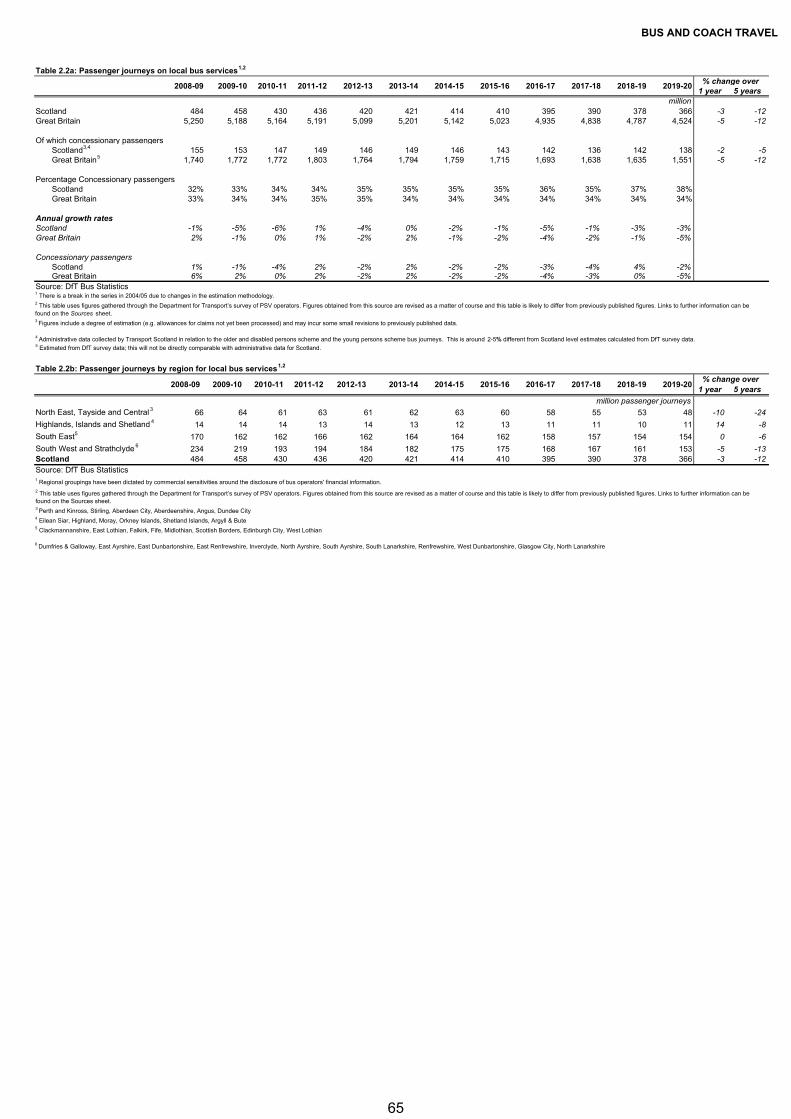
BUS AND COACH TRAVEL
Table 2.2a: Passenger journeys on local bus services1,2
% change over1 year 5 years
millionScotland 484 458 430 436 420 421 414 410 395 390 378 366 -3 -12Great Britain 5,250 5,188 5,164 5,191 5,099 5,201 5,142 5,023 4,935 4,838 4,787 4,524 -5 -12
Of which concessionary passengersScotland3,4 155 153 147 149 146 149 146 143 142 136 142 138 -2 -5Great Britain5 1,740 1,772 1,772 1,803 1,764 1,794 1,759 1,715 1,693 1,638 1,635 1,551 -5 -12
Percentage Concessionary passengersScotland 32% 33% 34% 34% 35% 35% 35% 35% 36% 35% 37% 38%Great Britain 33% 34% 34% 35% 35% 34% 34% 34% 34% 34% 34% 34%
Annual growth ratesScotland -1% -5% -6% 1% -4% 0% -2% -1% -5% -1% -3% -3%Great Britain 2% -1% 0% 1% -2% 2% -1% -2% -4% -2% -1% -5%
Concessionary passengersScotland 1% -1% -4% 2% -2% 2% -2% -2% -3% -4% 4% -2%Great Britain 6% 2% 0% 2% -2% 2% -2% -2% -4% -3% 0% -5%
Source: DfT Bus Statistics1 There is a break in the series in 2004/05 due to changes in the estimation methodology.
5 Estimated from DfT survey data; this will not be directly comparable with administrative data for Scotland.
Table 2.2b: Passenger journeys by region for local bus services1,2
% change over1 year 5 years
million passenger journeys
North East, Tayside and Central 3 66 64 61 63 61 62 63 60 58 55 53 48 -10 -24
Highlands, Islands and Shetland 4 14 14 14 13 14 13 12 13 11 11 10 11 14 -8
South East5 170 162 162 166 162 164 164 162 158 157 154 154 0 -6
South West and Strathclyde 6 234 219 193 194 184 182 175 175 168 167 161 153 -5 -13Scotland 484 458 430 436 420 421 414 410 395 390 378 366 -3 -12Source: DfT Bus Statistics
2014-15
5 Clackmannanshire, East Lothian, Falkirk, Fife, Midlothian, Scottish Borders, Edinburgh City, West Lothian
2012-13 2016-17
2016-172009-10
2015-16
6 Dumfries & Galloway, East Ayrshire, East Dunbartonshire, East Renfrewshire, Inverclyde, North Ayrshire, South Ayrshire, South Lanarkshire, Renfrewshire, West Dunbartonshire, Glasgow City, North Lanarkshire
2010-11
2012-13
2011-12 2013-14 2017-18
3 Figures include a degree of estimation (e.g. allowances for claims not yet been processed) and may incur some small revisions to previously published data.
2013-14
4 Administrative data collected by Transport Scotland in relation to the older and disabled persons scheme and the young persons scheme bus journeys. This is around 2-5% different from Scotland level estimates calculated from DfT survey data.
2018-19
2014-15 2015-162011-122010-11
2008-09
2008-09
4 Eilean Siar, Highland, Moray, Orkney Islands, Shetland Islands, Argyll & Bute
2009-10
3 Perth and Kinross, Stirling, Aberdeen City, Aberdeenshire, Angus, Dundee City
2 This table uses figures gathered through the Department for Transport’s survey of PSV operators. Figures obtained from this source are revised as a matter of course and this table is likely to differ from previously published figures. Links to further information can be found on the Sources sheet.
2 This table uses figures gathered through the Department for Transport’s survey of PSV operators. Figures obtained from this source are revised as a matter of course and this table is likely to differ from previously published figures. Links to further information can be found on the Sources sheet.
2019-20
2019-20
1 Regional groupings have been dictated by commercial sensitivities around the disclosure of bus operators' financial information.
2018-192017-18
65
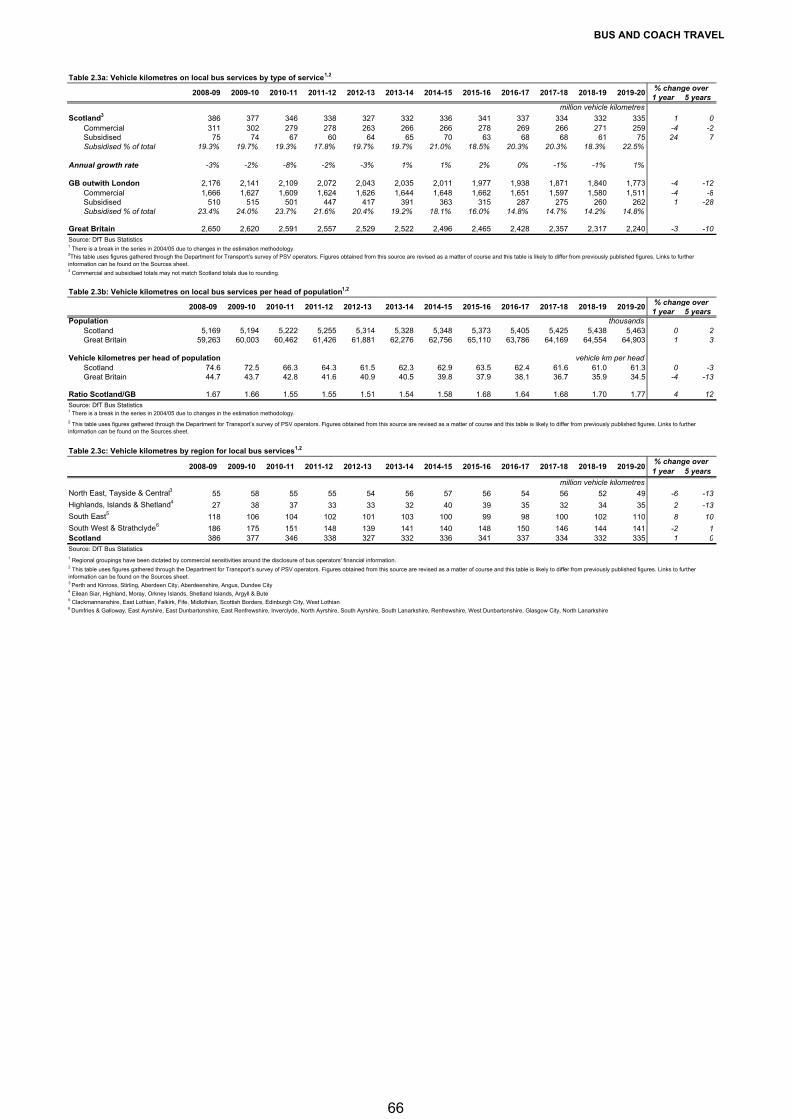
BUS AND COACH TRAVEL
Table 2.3a: Vehicle kilometres on local bus services by type of service1,2
% change over1 year 5 years
million vehicle kilometres
Scotland3 386 377 346 338 327 332 336 341 337 334 332 335 1 0Commercial 311 302 279 278 263 266 266 278 269 266 271 259 -4 -2Subsidised 75 74 67 60 64 65 70 63 68 68 61 75 24 7Subsidised % of total 19.3% 19.7% 19.3% 17.8% 19.7% 19.7% 21.0% 18.5% 20.3% 20.3% 18.3% 22.5%
Annual growth rate -3% -2% -8% -2% -3% 1% 1% 2% 0% -1% -1% 1%
GB outwith London 2,176 2,141 2,109 2,072 2,043 2,035 2,011 1,977 1,938 1,871 1,840 1,773 -4 -12Commercial 1,666 1,627 1,609 1,624 1,626 1,644 1,648 1,662 1,651 1,597 1,580 1,511 -4 -8Subsidised 510 515 501 447 417 391 363 315 287 275 260 262 1 -28Subsidised % of total 23.4% 24.0% 23.7% 21.6% 20.4% 19.2% 18.1% 16.0% 14.8% 14.7% 14.2% 14.8%
Great Britain 2,650 2,620 2,591 2,557 2,529 2,522 2,496 2,465 2,428 2,357 2,317 2,240 -3 -10Source: DfT Bus Statistics1 There is a break in the series in 2004/05 due to changes in the estimation methodology.
3 Commercial and subsidised totals may not match Scotland totals due to rounding.
Table 2.3b: Vehicle kilometres on local bus services per head of population1,2
% change over1 year 5 years
Population thousandsScotland 5,169 5,194 5,222 5,255 5,314 5,328 5,348 5,373 5,405 5,425 5,438 5,463 0 2Great Britain 59,263 60,003 60,462 61,426 61,881 62,276 62,756 65,110 63,786 64,169 64,554 64,903 1 3
Vehicle kilometres per head of population vehicle km per headScotland 74.6 72.5 66.3 64.3 61.5 62.3 62.9 63.5 62.4 61.6 61.0 61.3 0 -3Great Britain 44.7 43.7 42.8 41.6 40.9 40.5 39.8 37.9 38.1 36.7 35.9 34.5 -4 -13
Ratio Scotland/GB 1.67 1.66 1.55 1.55 1.51 1.54 1.58 1.68 1.64 1.68 1.70 1.77 4 12Source: DfT Bus Statistics1 There is a break in the series in 2004/05 due to changes in the estimation methodology.
Table 2.3c: Vehicle kilometres by region for local bus services1,2
% change over1 year 5 years
million vehicle kilometres
North East, Tayside & Central3 55 58 55 55 54 56 57 56 54 56 52 49 -6 -13
Highlands, Islands & Shetland427 38 37 33 33 32 40 39 35 32 34 35 2 -13
South East5 118 106 104 102 101 103 100 99 98 100 102 110 8 10
South West & Strathclyde6186 175 151 148 139 141 140 148 150 146 144 141 -2 1
Scotland 386 377 346 338 327 332 336 341 337 334 332 335 1 0Source: DfT Bus Statistics
2017-18
2017-18
2014-15
2013-14
2012-132011-12
2016-17
2016-17
2016-17
2010-11 2013-142012-132009-10 2011-12
2008-09
4 Eilean Siar, Highland, Moray, Orkney Islands, Shetland Islands, Argyll & Bute
2009-10
3 Perth and Kinross, Stirling, Aberdeen City, Aberdeenshire, Angus, Dundee City
2014-152009-10
2011-12
2013-14
2 This table uses figures gathered through the Department for Transport’s survey of PSV operators. Figures obtained from this source are revised as a matter of course and this table is likely to differ from previously published figures. Links to further information can be found on the Sources sheet.
2008-09
2008-09
6 Dumfries & Galloway, East Ayrshire, East Dunbartonshire, East Renfrewshire, Inverclyde, North Ayrshire, South Ayrshire, South Lanarkshire, Renfrewshire, West Dunbartonshire, Glasgow City, North Lanarkshire
2This table uses figures gathered through the Department for Transport’s survey of PSV operators. Figures obtained from this source are revised as a matter of course and this table is likely to differ from previously published figures. Links to further information can be found on the Sources sheet.
2 This table uses figures gathered through the Department for Transport’s survey of PSV operators. Figures obtained from this source are revised as a matter of course and this table is likely to differ from previously published figures. Links to further information can be found on the Sources sheet.
2012-13
1 Regional groupings have been dictated by commercial sensitivities around the disclosure of bus operators' financial information.
5 Clackmannanshire, East Lothian, Falkirk, Fife, Midlothian, Scottish Borders, Edinburgh City, West Lothian
2010-11
2010-11 2014-15
2019-20
2019-20
2019-20
2015-16
2015-16
2015-16
2018-19
2018-19
2018-19
2017-18
66
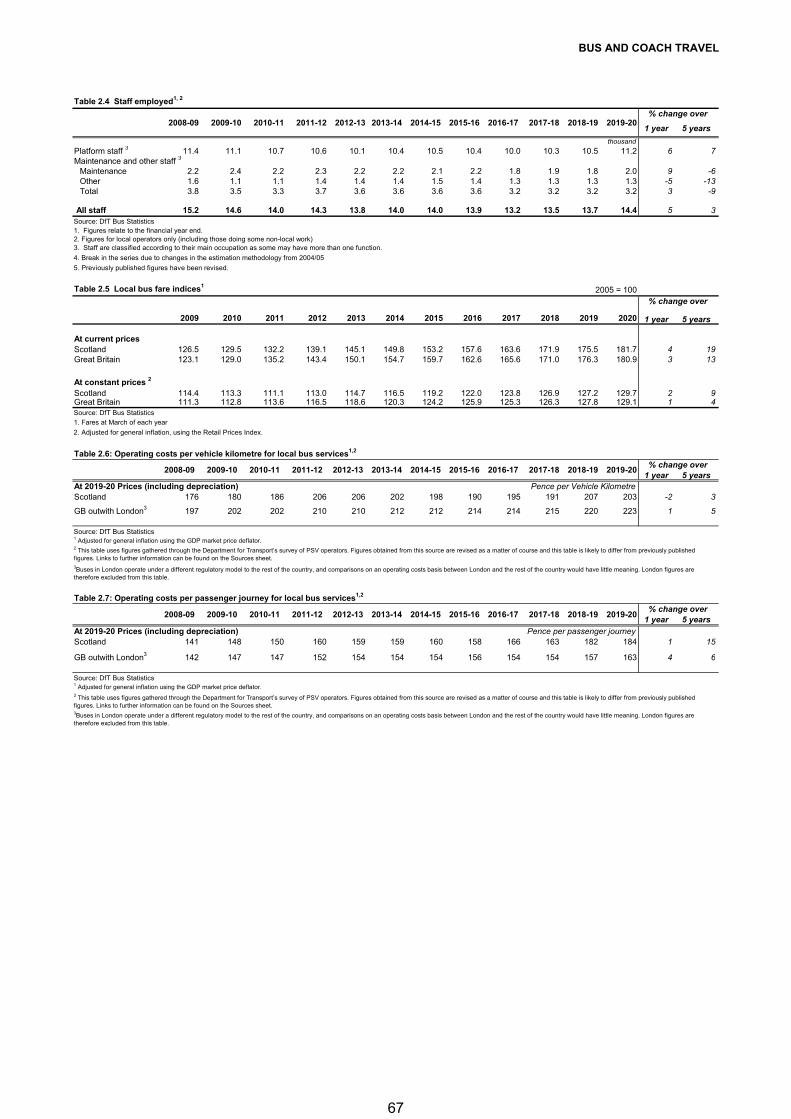
BUS AND COACH TRAVEL
Table 2.4 Staff employed1, 2
1 year 5 years
thousand
Platform staff 3 11.4 11.1 10.7 10.6 10.1 10.4 10.5 10.4 10.0 10.3 10.5 11.2 6 7Maintenance and other staff 3
Maintenance 2.2 2.4 2.2 2.3 2.2 2.2 2.1 2.2 1.8 1.9 1.8 2.0 9 -6Other 1.6 1.1 1.1 1.4 1.4 1.4 1.5 1.4 1.3 1.3 1.3 1.3 -5 -13Total 3.8 3.5 3.3 3.7 3.6 3.6 3.6 3.6 3.2 3.2 3.2 3.2 3 -9
All staff 15.2 14.6 14.0 14.3 13.8 14.0 14.0 13.9 13.2 13.5 13.7 14.4 5 3Source: DfT Bus Statistics1. Figures relate to the financial year end.2. Figures for local operators only (including those doing some non-local work)3. Staff are classified according to their main occupation as some may have more than one function.
4. Break in the series due to changes in the estimation methodology from 2004/05
5. Previously published figures have been revised.
Table 2.5 Local bus fare indices12005 = 100
2009 2010 2011 2012 2013 2014 2015 2016 2017 2018 2019 2020 1 year 5 years
At current pricesScotland 126.5 129.5 132.2 139.1 145.1 149.8 153.2 157.6 163.6 171.9 175.5 181.7 4 19Great Britain 123.1 129.0 135.2 143.4 150.1 154.7 159.7 162.6 165.6 171.0 176.3 180.9 3 13
At constant prices 2
Scotland 114.4 113.3 111.1 113.0 114.7 116.5 119.2 122.0 123.8 126.9 127.2 129.7 2 9Great Britain 111.3 112.8 113.6 116.5 118.6 120.3 124.2 125.9 125.3 126.3 127.8 129.1 1 4Source: DfT Bus Statistics
1. Fares at March of each year
2. Adjusted for general inflation, using the Retail Prices Index.
Table 2.6: Operating costs per vehicle kilometre for local bus services1,2
1 year 5 yearsAt 2019-20 Prices (including depreciation) Pence per Vehicle KilometreScotland 176 180 186 206 206 202 198 190 195 191 207 203 -2 3
GB outwith London3 197 202 202 210 210 212 212 214 214 215 220 223 1 5
Source: DfT Bus Statistics1 Adjusted for general inflation using the GDP market price deflator.
Table 2.7: Operating costs per passenger journey for local bus services1,2
1 year 5 years
At 2019-20 Prices (including depreciation) Pence per passenger journeyScotland 141 148 150 160 159 159 160 158 166 163 182 184 1 15
GB outwith London3 142 147 147 152 154 154 154 156 154 154 157 163 4 6
Source: DfT Bus Statistics1 Adjusted for general inflation using the GDP market price deflator.
% change over
% change over
2019-20
% change over
% change over
3Buses in London operate under a different regulatory model to the rest of the country, and comparisons on an operating costs basis between London and the rest of the country would have little meaning. London figures are therefore excluded from this table.
2009-102008-09 2012-13
2017-18 2018-19
2 This table uses figures gathered through the Department for Transport’s survey of PSV operators. Figures obtained from this source are revised as a matter of course and this table is likely to differ from previously published figures. Links to further information can be found on the Sources sheet.3Buses in London operate under a different regulatory model to the rest of the country, and comparisons on an operating costs basis between London and the rest of the country would have little meaning. London figures are therefore excluded from this table.
2013-142008-09 2014-152010-11 2011-12 2012-13
2 This table uses figures gathered through the Department for Transport’s survey of PSV operators. Figures obtained from this source are revised as a matter of course and this table is likely to differ from previously published figures. Links to further information can be found on the Sources sheet.
2010-11 2011-12
2008-09
2009-10
2012-13 2018-19 2019-20
2019-20
2015-16
2015-16
2013-14 2014-15 2017-18
2017-18 2018-19
2011-122009-10
2015-16
2016-17
2016-17
2016-17
2010-11
2013-14 2014-15
67
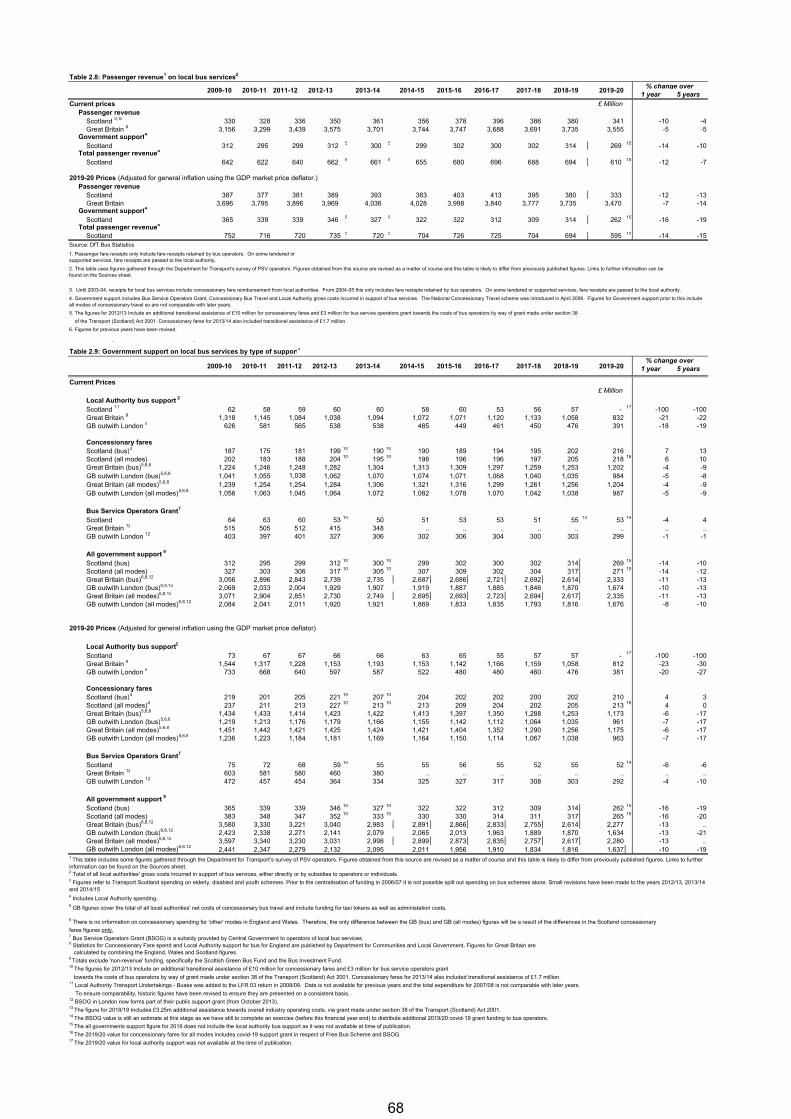
Table 2.8: Passenger revenue1 on local bus services2
% change over1 year 5 years
Current prices £ MillionPassenger revenue
Scotland 3, 6 330 328 336 350 361 356 378 396 386 380 341 -10 -4Great Britain 6 3,156 3,299 3,439 3,575 3,701 3,744 3,747 3,688 3,691 3,735 3,555 -5 -5
Government support4
Scotland 312 295 299 312 5 300 5 299 302 300 302 314 269 15 -14 -10Total passenger revenue4
Scotland 642 622 640 662 5 661 5 655 680 696 688 694 610 15 -12 -7
2019-20 Prices (Adjusted for general inflation using the GDP market price deflator.)Passenger revenue
Scotland 387 377 381 389 393 383 403 413 395 380 333 -12 -13Great Britain 3,696 3,795 3,896 3,969 4,036 4,028 3,998 3,840 3,777 3,735 3,470 -7 -14
Government support4
Scotland 365 339 339 346 5 327 5 322 322 312 309 314 262 15 -16 -19Total passenger revenue4
Scotland 752 716 720 735 5 720 5 704 726 725 704 694 595 15 -14 -15Source: DfT Bus Statistics
5. The figures for 2012/13 Include an additional transitional assistance of £10 million for concessionary fares and £3 million for bus service operators grant towards the costs of bus operators by way of grant made under section 38
of the Transport (Scotland) Act 2001. Concessionary fares for 2013/14 also included transitional assistance of £1.7 million.
6. Figures for previous years have been revised.
( )
Table 2.9: Government support on local bus services by type of support1
% change over1 year 5 years
Current Prices£ Million
Local Authority bus support 2
Scotland 11 62 58 59 60 60 58 60 53 56 57 - 17 -100 -100Great Britain 8 1,318 1,145 1,084 1,038 1,094 1,072 1,071 1,120 1,133 1,058 832 -21 -22GB outwith London 8 626 581 565 538 538 485 449 461 450 476 391 -18 -19
Concessionary faresScotland (bus)3 187 175 181 199 10 190 10 190 189 194 195 202 216 7 13Scotland (all modes) 202 183 188 204 10 195 10 198 196 196 197 205 218 16 6 10Great Britain (bus)5,6,8 1,224 1,246 1,248 1,282 1,304 1,313 1,309 1,297 1,259 1,253 1,202 -4 -9GB outwith London (bus)5,6,8 1,041 1,055 1,038 1,062 1,070 1,074 1,071 1,068 1,040 1,035 984 -5 -8Great Britain (all modes)5,6,8 1,239 1,254 1,254 1,284 1,306 1,321 1,316 1,299 1,261 1,256 1,204 -4 -9GB outwith London (all modes)5,6,8 1,056 1,063 1,045 1,064 1,072 1,082 1,078 1,070 1,042 1,038 987 -5 -9
Bus Service Operators Grant7
Scotland 64 63 60 53 10 50 51 53 53 51 55 13 53 14 -4 4Great Britain 12 515 505 512 415 348 .. .. .. .. .. .. .. ..GB outwith London 12 403 397 401 327 306 302 306 304 300 303 299 -1 -1
All government support 9
Scotland (bus) 312 295 299 312 10 300 10 299 302 300 302 314 269 15 -14 -10Scotland (all modes) 327 303 306 317 10 305 10 307 309 302 304 317 271 15 -14 -12Great Britain (bus)6,8,12 3,056 2,896 2,843 2,739 2,735 2,687 2,686 2,721 2,692 2,614 2,333 -11 -13GB outwith London (bus)6,8,12 2,069 2,033 2,004 1,929 1,907 1,919 1,887 1,885 1,846 1,870 1,674 -10 -13Great Britain (all modes)6,8,12 3,071 2,904 2,851 2,730 2,749 2,695 2,693 2,723 2,694 2,617 2,335 -11 -13GB outwith London (all modes)6,8,12 2,084 2,041 2,011 1,920 1,921 1,869 1,833 1,835 1,793 1,816 1,676 -8 -10
2019-20 Prices (Adjusted for general inflation using the GDP market price deflator)
Local Authority bus support2
Scotland 73 67 67 66 66 63 65 55 57 57 - 17 -100 -100Great Britain 8 1,544 1,317 1,228 1,153 1,193 1,153 1,142 1,166 1,159 1,058 812 -23 -30GB outwith London 8 733 668 640 597 587 522 480 480 460 476 381 -20 -27
Concessionary faresScotland (bus)3 219 201 205 221 10 207 10 204 202 202 200 202 210 4 3Scotland (all modes)4 237 211 213 227 10 213 10 213 209 204 202 205 213 16 4 0Great Britain (bus)5,6,8 1,434 1,433 1,414 1,423 1,422 1,413 1,397 1,350 1,288 1,253 1,173 -6 -17GB outwith London (bus)5,6,8 1,219 1,213 1,176 1,179 1,166 1,155 1,142 1,112 1,064 1,035 961 -7 -17Great Britain (all modes)5,6,8 1,451 1,442 1,421 1,425 1,424 1,421 1,404 1,352 1,290 1,256 1,175 -6 -17GB outwith London (all modes)5,6,8 1,236 1,223 1,184 1,181 1,169 1,164 1,150 1,114 1,067 1,038 963 -7 -17
Bus Service Operators Grant7
Scotland 75 72 68 59 10 55 55 56 55 52 55 52 14 -6 -6Great Britain 12 603 581 580 460 380 .. .. .. .. .. .. .. ..GB outwith London 12 472 457 454 364 334 325 327 317 308 303 292 -4 -10
All government support 9
Scotland (bus) 365 339 339 346 10 327 10 322 322 312 309 314 262 15 -16 -19Scotland (all modes) 383 348 347 352 10 333 10 330 330 314 311 317 265 15 -16 -20Great Britain (bus)6,8,12 3,580 3,330 3,221 3,040 2,983 2,891 2,866 2,833 2,755 2,614 2,277 -13 ..GB outwith London (bus)6,8,12 2,423 2,338 2,271 2,141 2,079 2,065 2,013 1,963 1,889 1,870 1,634 -13 -21Great Britain (all modes)6,8,12 3,597 3,340 3,230 3,031 2,998 2,899 2,873 2,835 2,757 2,617 2,280 -13 ..GB outwith London (all modes)6,8,12
2,441 2,347 2,279 2,132 2,095 2,011 1,956 1,910 1,834 1,816 1,637 -10 -19
fares figures only.7 Bus Service Operators Grant (BSOG) is a subsidy provided by Central Government to operators of local bus services.
calculated by combining the England, Wales and Scotland figures. 9 Totals exclude 'non-revenue' funding, specifically the Scottish Green Bus Fund and the Bus Investment Fund.10 The figures for 2012/13 Include an additional transitional assistance of £10 million for concessionary fares and £3 million for bus service operators grant
towards the costs of bus operators by way of grant made under section 38 of the Transport (Scotland) Act 2001. Concessionary fares for 2013/14 also included transitional assistance of £1.7 million. 11 Local Authority Transport Undertakings - Buses was added to the LFR 03 return in 2008/09. Data is not available for previous years and the total expenditure for 2007/08 is not comparable with later years.
To ensure comparability, historic figures have been revised to ensure they are presented on a consistent basis.12 BSOG in London now forms part of their public support grant (from October 2013).13 The figure for 2018/19 Includes £3.25m additional assistance towards overall industry operating costs, via grant made under section 38 of the Transport (Scotland) Act 2001.14 The BSOG value is still an estimate at this stage as we have still to complete an exercise (before this financial year end) to distribute additional 2019/20 covid-19 grant funding to bus operators.15 The all governments support figure for 2019 does not include the local authority bus support as it was not available at time of publication.16 The 2019/20 value for concessionary fares for all modes includes covid-19 support grant in respect of Free Bus Scheme and BSOG17 The 2019/20 value for local authority support was not available at the time of publication.
2019-20
2019-20
1. Passenger fare receipts only include fare receipts retained by bus operators. On some tendered or supported services, fare receipts are passed to the local authority.
2011-122010-11 2016-172013-14 2014-15 2015-162012-13
6 There is no information on concessionary spending for 'other' modes in England and Wales. Therefore, the only difference between the GB (bus) and GB (all modes) figures will be a result of the differences in the Scotland concessionary
8 Statistics for Concessionary Fare spend and Local Authority support for bus for England are published by Department for Communities and Local Government. Figures for Great Britain are
2013-14 2014-15 2015-16
1 This table includes some figures gathered through the Department for Transport’s survey of PSV operators. Figures obtained from this source are revised as a matter of course and this table is likely to differ from previously published figures. Links to further information can be found on the Sources sheet.2 Total of all local authorities' gross costs incurred in support of bus services, either directly or by subsidies to operators or individuals.3 Figures refer to Transport Scotland spending on elderly, disabled and youth schemes. Prior to the centralisation of funding in 2006/07 it is not possible split out spending on bus schemes alone. Small revisions have been made to the years 2012/13, 2013/14 and 2014/15
5 GB figures cover the total of all local authorities' net costs of concessionary bus travel and include funding for taxi tokens as well as administation costs.
4. Government support includes Bus Service Operators Grant, Concessionary Bus Travel and Local Authority gross costs incurred in support of bus services. The National Concessionary Travel scheme was introduced in April 2006. Figures for Government support prior to this include all modes of concessionary travel so are not comparable with later years.
2009-10 2010-11 2011-12 2012-13 2016-17
2018-19
2018-19
2017-18
2017-18
4 Includes Local Authority spending.
2. This table uses figures gathered through the Department for Transport’s survey of PSV operators. Figures obtained from this source are revised as a matter of course and this table is likely to differ from previously published figures. Links to further information can be found on the Sources sheet.
3. Until 2003-04, receipts for local bus services include concessionary fare reimbursement from local authorities. From 2004-05 this only includes fare reciepts retained by bus operators. On some tendered or supported services, fare receipts are passed to the local authority.
2009-10
68
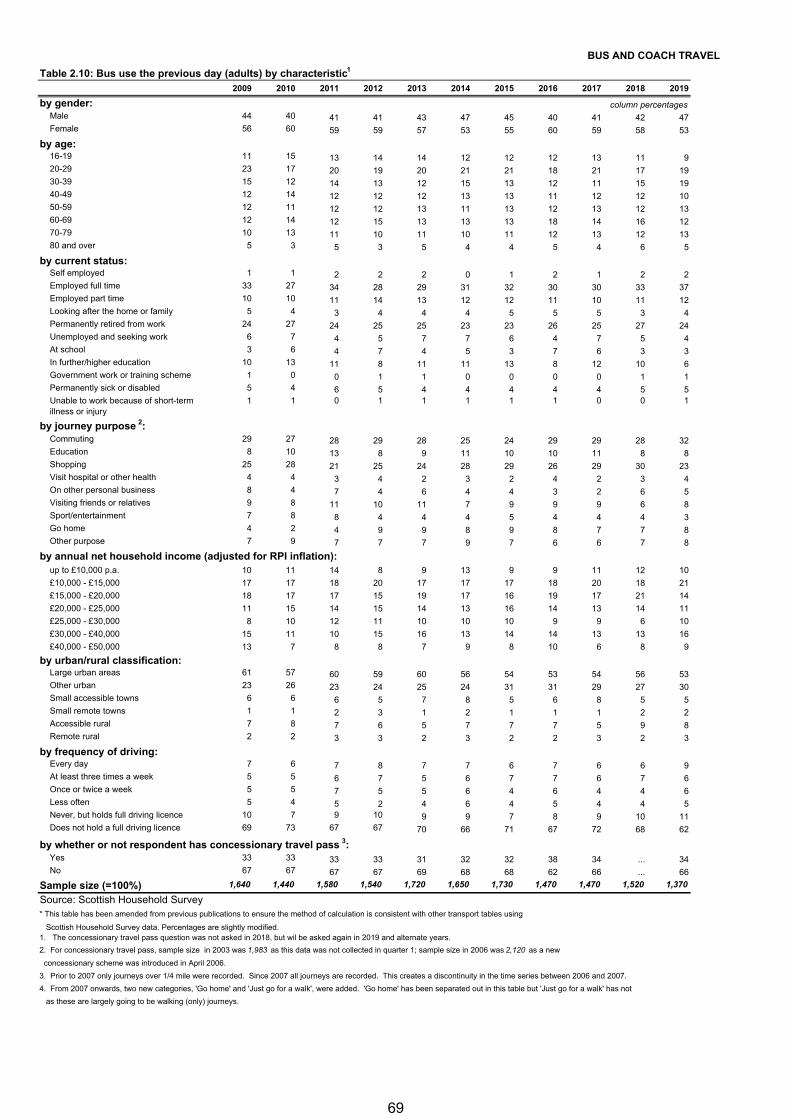
BUS AND COACH TRAVEL
Table 2.10: Bus use the previous day (adults) by characteristic1
2009 2010 2011 2012 2013 2014 2015 2016 2017 2018 2019
by gender: column percentagesMale 44 40 41 41 43 47 45 40 41 42 47Female 56 60 59 59 57 53 55 60 59 58 53
by age:16-19 11 15 13 14 14 12 12 12 13 11 920-29 23 17 20 19 20 21 21 18 21 17 1930-39 15 12 14 13 12 15 13 12 11 15 1940-49 12 14 12 12 12 13 13 11 12 12 1050-59 12 11 12 12 13 11 13 12 13 12 1360-69 12 14 12 15 13 13 13 18 14 16 1270-79 10 13 11 10 11 10 11 12 13 12 1380 and over 5 3 5 3 5 4 4 5 4 6 5
by current status:Self employed 1 1 2 2 2 0 1 2 1 2 2Employed full time 33 27 34 28 29 31 32 30 30 33 37Employed part time 10 10 11 14 13 12 12 11 10 11 12Looking after the home or family 5 4 3 4 4 4 5 5 5 3 4Permanently retired from work 24 27 24 25 25 23 23 26 25 27 24Unemployed and seeking work 6 7 4 5 7 7 6 4 7 5 4At school 3 6 4 7 4 5 3 7 6 3 3In further/higher education 10 13 11 8 11 11 13 8 12 10 6Government work or training scheme 1 0 0 1 1 0 0 0 0 1 1Permanently sick or disabled 5 4 6 5 4 4 4 4 4 5 5Unable to work because of short-term illness or injury
1 1 0 1 1 1 1 1 0 0 1
by journey purpose 2:Commuting 29 27 28 29 28 25 24 29 29 28 32Education 8 10 13 8 9 11 10 10 11 8 8Shopping 25 28 21 25 24 28 29 26 29 30 23Visit hospital or other health 4 4 3 4 2 3 2 4 2 3 4On other personal business 8 4 7 4 6 4 4 3 2 6 5Visiting friends or relatives 9 8 11 10 11 7 9 9 9 6 8Sport/entertainment 7 8 8 4 4 4 5 4 4 4 3Go home 4 2 4 9 9 8 9 8 7 7 8Other purpose 7 9 7 7 7 9 7 6 6 7 8
by annual net household income (adjusted for RPI inflation):up to £10,000 p.a. 10 11 14 8 9 13 9 9 11 12 10
£10,000 - £15,000 17 17 18 20 17 17 17 18 20 18 21
£15,000 - £20,000 18 17 17 15 19 17 16 19 17 21 14
£20,000 - £25,000 11 15 14 15 14 13 16 14 13 14 11
£25,000 - £30,000 8 10 12 11 10 10 10 9 9 6 10
£30,000 - £40,000 15 11 10 15 16 13 14 14 13 13 16
£40,000 - £50,000 13 7 8 8 7 9 8 10 6 8 9
by urban/rural classification:Large urban areas 61 57 60 59 60 56 54 53 54 56 53Other urban 23 26 23 24 25 24 31 31 29 27 30Small accessible towns 6 6 6 5 7 8 5 6 8 5 5Small remote towns 1 1 2 3 1 2 1 1 1 2 2Accessible rural 7 8 7 6 5 7 7 7 5 9 8Remote rural 2 2 3 3 2 3 2 2 3 2 3
by frequency of driving:Every day 7 6 7 8 7 7 6 7 6 6 9At least three times a week 5 5 6 7 5 6 7 7 6 7 6Once or twice a week 5 5 7 5 5 6 4 6 4 4 6Less often 5 4 5 2 4 6 4 5 4 4 5Never, but holds full driving licence 10 7 9 10 9 9 7 8 9 10 11Does not hold a full driving licence 69 73 67 67 70 66 71 67 72 68 62
by whether or not respondent has concessionary travel pass 3:Yes 33 33 33 33 31 32 32 38 34 ... 34No 67 67 67 67 69 68 68 62 66 ... 66
Sample size (=100%) 1,640 1,440 1,580 1,540 1,720 1,650 1,730 1,470 1,470 1,520 1,370
Source: Scottish Household Survey* This table has been amended from previous publications to ensure the method of calculation is consistent with other transport tables using
Scottish Household Survey data. Percentages are slightly modified.1. The concessionary travel pass question was not asked in 2018, but wil be asked again in 2019 and alternate years.
2. For concessionary travel pass, sample size in 2003 was 1,983 as this data was not collected in quarter 1; sample size in 2006 was 2,120 as a new
concessionary scheme was introduced in April 2006.
3. Prior to 2007 only journeys over 1/4 mile were recorded. Since 2007 all journeys are recorded. This creates a discontinuity in the time series between 2006 and 2007.
4. From 2007 onwards, two new categories, 'Go home' and 'Just go for a walk', were added. 'Go home' has been separated out in this table but 'Just go for a walk' has not
as these are largely going to be walking (only) journeys.
69
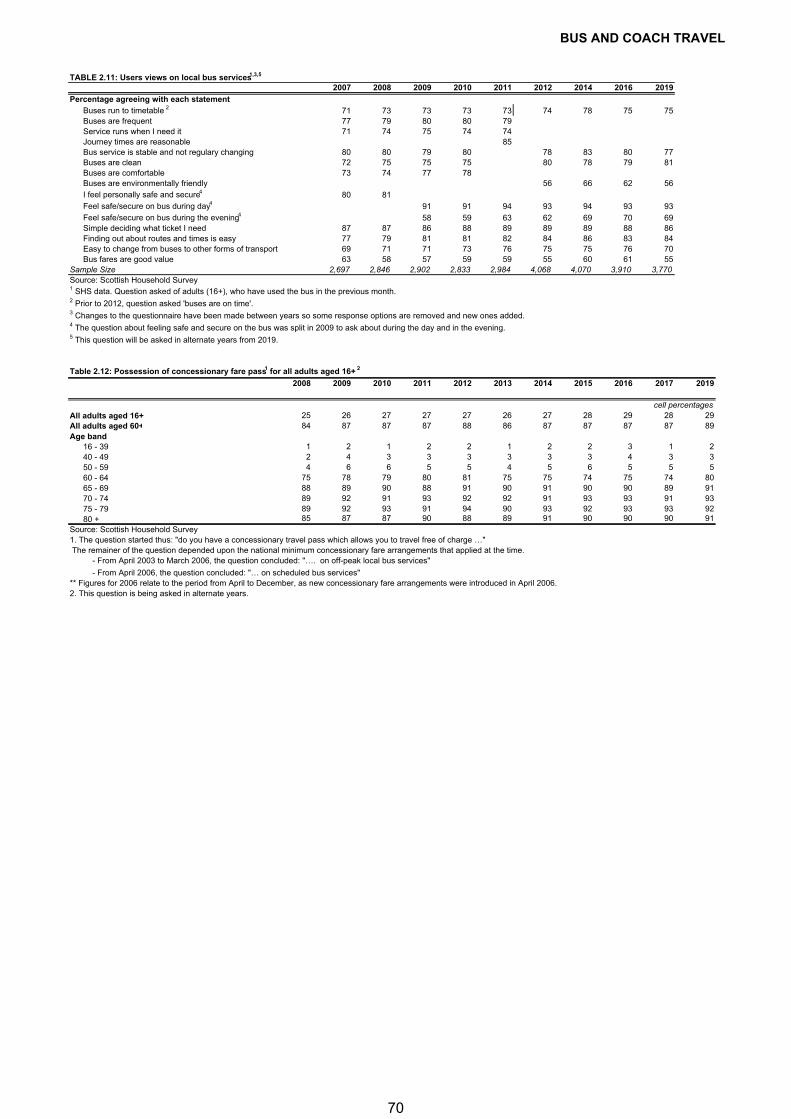
BUS AND COACH TRAVEL
TABLE 2.11: Users views on local bus services1,3,5
2007 2008 2009 2010 2011 2012 2014 2016 2019
Percentage agreeing with each statementBuses run to timetable 2 71 73 73 73 73 74 78 75 75Buses are frequent 77 79 80 80 79Service runs when I need it 71 74 75 74 74Journey times are reasonable 85Bus service is stable and not regulary changing 80 80 79 80 78 83 80 77Buses are clean 72 75 75 75 80 78 79 81Buses are comfortable 73 74 77 78Buses are environmentally friendly 56 66 62 56I feel personally safe and secure4 80 81Feel safe/secure on bus during day4 91 91 94 93 94 93 93Feel safe/secure on bus during the evening4 58 59 63 62 69 70 69Simple deciding what ticket I need 87 87 86 88 89 89 89 88 86Finding out about routes and times is easy 77 79 81 81 82 84 86 83 84Easy to change from buses to other forms of transport 69 71 71 73 76 75 75 76 70Bus fares are good value 63 58 57 59 59 55 60 61 55
Sample Size 2,697 2,846 2,902 2,833 2,984 4,068 4,070 3,910 3,770Source: Scottish Household Survey1 SHS data. Question asked of adults (16+), who have used the bus in the previous month.2 Prior to 2012, question asked 'buses are on time'.3 Changes to the questionnaire have been made between years so some response options are removed and new ones added.4 The question about feeling safe and secure on the bus was split in 2009 to ask about during the day and in the evening.5 This question will be asked in alternate years from 2019.
Table 2.12: Possession of concessionary fare pass1 for all adults aged 16+ 2
2008 2009 2010 2011 2012 2013 2014 2015 2016 2017 2019
cell percentagesAll adults aged 16+ 25 26 27 27 27 26 27 28 29 28 29All adults aged 60+ 84 87 87 87 88 86 87 87 87 87 89Age band
16 - 39 1 2 1 2 2 1 2 2 3 1 240 - 49 2 4 3 3 3 3 3 3 4 3 350 - 59 4 6 6 5 5 4 5 6 5 5 560 - 64 75 78 79 80 81 75 75 74 75 74 8065 - 69 88 89 90 88 91 90 91 90 90 89 9170 - 74 89 92 91 93 92 92 91 93 93 91 9375 - 79 89 92 93 91 94 90 93 92 93 93 9280 + 85 87 87 90 88 89 91 90 90 90 91
Source: Scottish Household Survey1. The question started thus: "do you have a concessionary travel pass which allows you to travel free of charge …" The remainer of the question depended upon the national minimum concessionary fare arrangements that applied at the time. - From April 2003 to March 2006, the question concluded: "…. on off-peak local bus services"
- From April 2006, the question concluded: "… on scheduled bus services"** Figures for 2006 relate to the period from April to December, as new concessionary fare arrangements were introduced in April 2006. 2. This question is being asked in alternate years.
70
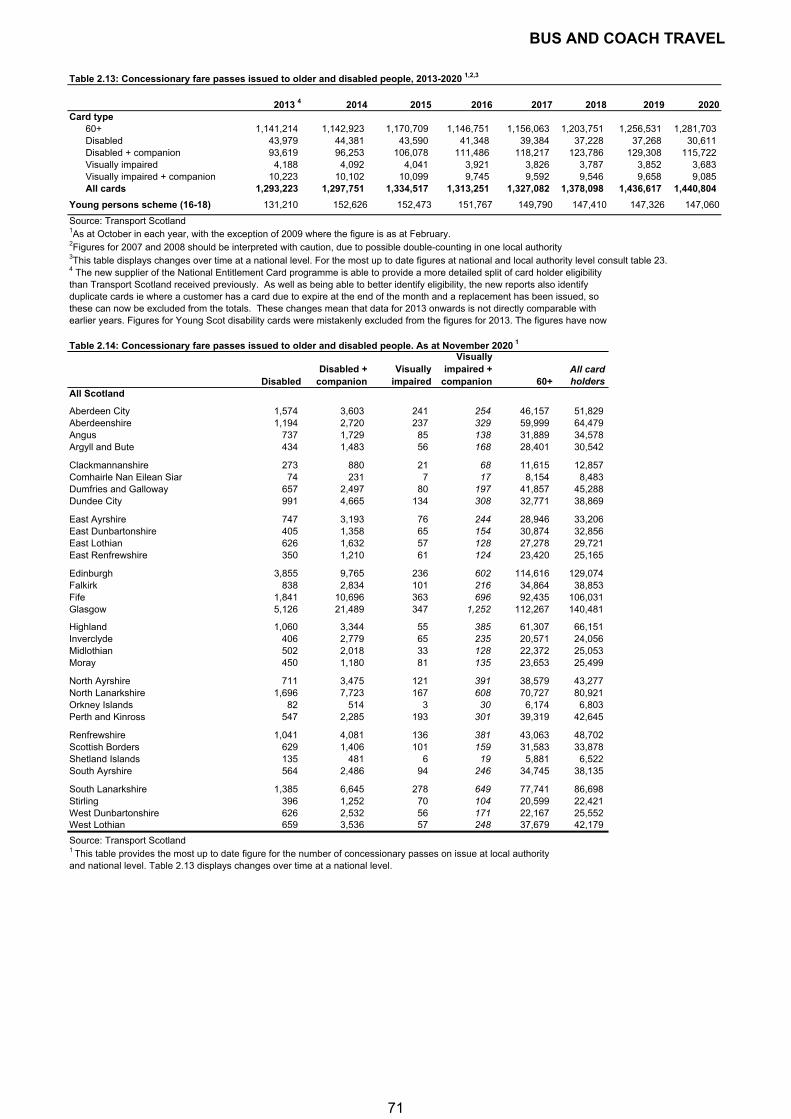
BUS AND COACH TRAVEL
Table 2.13: Concessionary fare passes issued to older and disabled people, 2013-2020 1,2,3
2013 4 2014 2015 2016 2017 2018 2019 2020Card type
60+ 1,141,214 1,142,923 1,170,709 1,146,751 1,156,063 1,203,751 1,256,531 1,281,703 Disabled 43,979 44,381 43,590 41,348 39,384 37,228 37,268 30,611 Disabled + companion 93,619 96,253 106,078 111,486 118,217 123,786 129,308 115,722 Visually impaired 4,188 4,092 4,041 3,921 3,826 3,787 3,852 3,683 Visually impaired + companion 10,223 10,102 10,099 9,745 9,592 9,546 9,658 9,085 All cards 1,293,223 1,297,751 1,334,517 1,313,251 1,327,082 1,378,098 1,436,617 1,440,804
Young persons scheme (16-18) 131,210 152,626 152,473 151,767 149,790 147,410 147,326 147,060
Source: Transport Scotland1As at October in each year, with the exception of 2009 where the figure is as at February.2Figures for 2007 and 2008 should be interpreted with caution, due to possible double-counting in one local authority3This table displays changes over time at a national level. For the most up to date figures at national and local authority level consult table 23.
Table 2.14: Concessionary fare passes issued to older and disabled people. As at November 2020 1
DisabledDisabled +
companionVisually
impaired
Visually impaired +
companion 60+All card holders
All Scotland
Aberdeen City 1,574 3,603 241 254 46,157 51,829 Aberdeenshire 1,194 2,720 237 329 59,999 64,479 Angus 737 1,729 85 138 31,889 34,578 Argyll and Bute 434 1,483 56 168 28,401 30,542
Clackmannanshire 273 880 21 68 11,615 12,857 Comhairle Nan Eilean Siar 74 231 7 17 8,154 8,483 Dumfries and Galloway 657 2,497 80 197 41,857 45,288 Dundee City 991 4,665 134 308 32,771 38,869
East Ayrshire 747 3,193 76 244 28,946 33,206 East Dunbartonshire 405 1,358 65 154 30,874 32,856 East Lothian 626 1,632 57 128 27,278 29,721 East Renfrewshire 350 1,210 61 124 23,420 25,165
Edinburgh 3,855 9,765 236 602 114,616 129,074 Falkirk 838 2,834 101 216 34,864 38,853 Fife 1,841 10,696 363 696 92,435 106,031 Glasgow 5,126 21,489 347 1,252 112,267 140,481
Highland 1,060 3,344 55 385 61,307 66,151 Inverclyde 406 2,779 65 235 20,571 24,056 Midlothian 502 2,018 33 128 22,372 25,053 Moray 450 1,180 81 135 23,653 25,499
North Ayrshire 711 3,475 121 391 38,579 43,277 North Lanarkshire 1,696 7,723 167 608 70,727 80,921 Orkney Islands 82 514 3 30 6,174 6,803 Perth and Kinross 547 2,285 193 301 39,319 42,645
Renfrewshire 1,041 4,081 136 381 43,063 48,702 Scottish Borders 629 1,406 101 159 31,583 33,878 Shetland Islands 135 481 6 19 5,881 6,522 South Ayrshire 564 2,486 94 246 34,745 38,135
South Lanarkshire 1,385 6,645 278 649 77,741 86,698 Stirling 396 1,252 70 104 20,599 22,421 West Dunbartonshire 626 2,532 56 171 22,167 25,552 West Lothian 659 3,536 57 248 37,679 42,179
Source: Transport Scotland1 This table provides the most up to date figure for the number of concessionary passes on issue at local authority and national level. Table 2.13 displays changes over time at a national level.
4 The new supplier of the National Entitlement Card programme is able to provide a more detailed split of card holder eligibility than Transport Scotland received previously. As well as being able to better identify eligibility, the new reports also identify duplicate cards ie where a customer has a card due to expire at the end of the month and a replacement has been issued, so these can now be excluded from the totals. These changes mean that data for 2013 onwards is not directly comparable with earlier years. Figures for Young Scot disability cards were mistakenly excluded from the figures for 2013. The figures have now
71
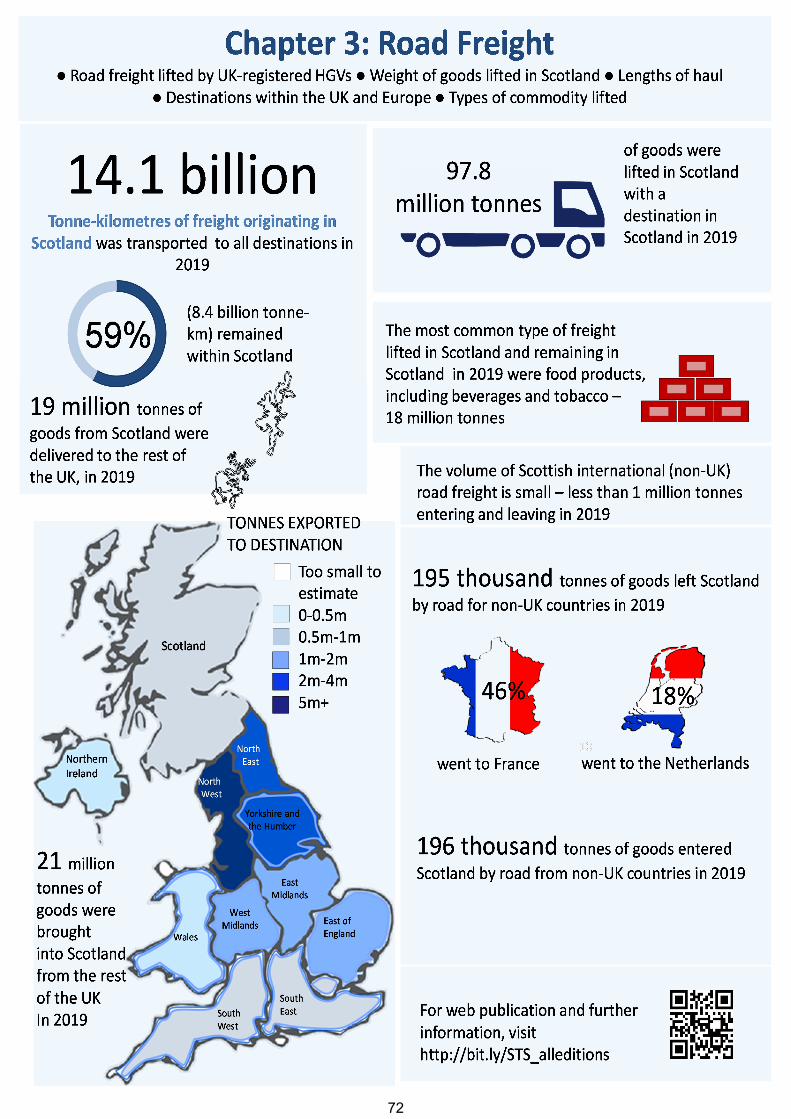
72
ROAD FREIGHT 1. Introduction 1.1 This chapter provides information about road freight lifted by UK-registered heavy goods vehicles (HGVs: over 3.5 tonnes gross weight), such as the weight of goods lifted in Scotland by origin and destination, the lengths of haul, the destinations within the UK and Europe, and the types of commodity lifted. 1.2 A change in methodology by the Department for Transport (DfT) in 2003 Continuous Survey of Road Goods Transport has resulted in a discontinuity in the series. Therefore road freight transported within the UK from 2004 onwards is not comparable with earlier years. Revisions have also been made to figures for the years 2011 to 2016. 2. Main Points Good Lifted and Distance 2.1 In 2019, an estimated 97.8 million tonnes of goods were lifted within Scotland by UK HGVs and transported to destinations within Scotland. About 19.1 million tonnes of goods from Scotland were delivered to destinations elsewhere in the UK, and around 20.7 million tonnes were brought into Scotland from elsewhere in the UK. In comparison, the volume of international road freight by UK HGVs travelling to and from Scotland is very small: less than 1 million tonnes in 2019. (Table 3.1) 2.2 Most road freight journeys are 100 kilometres or less in length: 21% of tonnes lifted by road in Scotland in 2019 were carried a distance of no more than 25 kilometres, and 24% travelled over 50 km but no more than 100 km. The average journey distance, which is calculated by dividing the total tonne-kilometres by the total tonnes lifted, was 118 km. (Table 3.2) Originating in Scotland 2.3 Goods moved on journeys originating in Scotland with a destination in Scotland accounted for around 8.4 billion tonne-kilometres in 2019. The overall total, including journeys with destinations elsewhere in the UK and abroad, was around 14.1 billion tonne-kms, a decrease of 3% on 2018. (Table 3.3) Entering Scotland 2.4 In 2019, 21 million tonnes of goods entered Scotland on UK HGVs from the rest of the UK. 97% of these came from England. Around 70 per cent of the goods entering came from the North West (33%), Yorkshire and Humber (16%) and North East (14%) regions of England. Fewer goods leave Scotland for other UK countries (19 million tonnes) than enter from them but the proportions going to and coming from different areas are similar (Table 3.6). 2.5 In 2019, ‘food products including beverages and tobacco’ was the largest single category of goods lifted in Scotland, which remained in Scotland, accounting for 17.7 million tonnes out of the total of 97.8 million tonnes. (Table 3.4)
73
ROAD FREIGHT
Destination 2.6 In 2019, UK-registered HGVs carried an estimated 391 thousand tonnes of goods from Scotland to countries outwith the UK, and 196 thousand tonnes from foreign countries into Scotland. Of goods leaving Scotland for abroad, carried by UK road hauliers, 46% went to France and 18% to the Netherlands. (Table 3.7) 2.7 In 2019, around 4% of goods leaving the UK lifted by UK HGVs originated in Scotland. (Table 3.5) 2.8 Generally in the period from 2015 to 2019, goods transported by UK-registered HGVs within Scotland were on journeys that started and finished within the same region. The Strathclyde Partnership for Transport (SPT) was the most active in terms of tonnage entering and leaving. There were 77 million tonnes on journeys within Scotland and 24 million of these were on journeys beginning in the SPT area (Table 3.8).
74
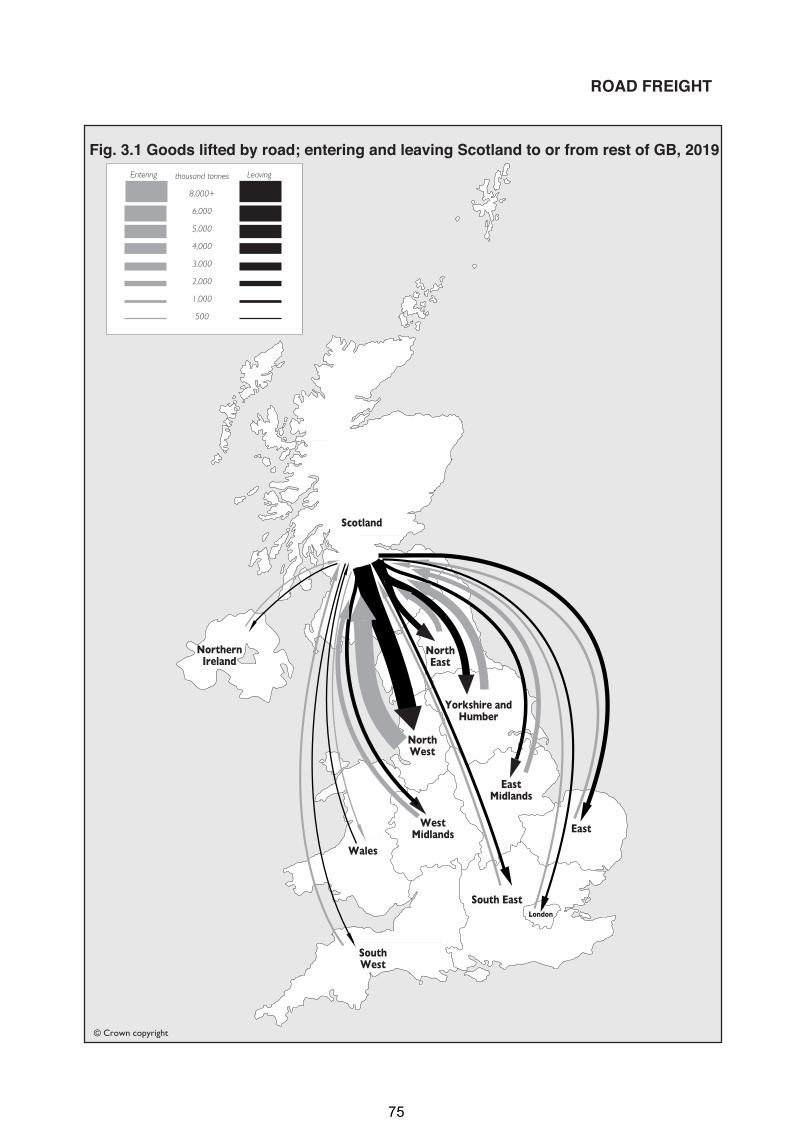
Fig. 3.1 Goods lifted by road; entering and leaving Scotland to or from rest of GB, 2019thousand tonnes
8,000+
6,000
5,000
4,000
3,000
2,000
1.000
500
NorthEast
Yorkshire andHumber
Scotland
NorthWest
EastMidlands
WestMidlands
Wales
SouthWest
East
South EastLondon
LeavingEntering
ROAD FREIGHT
© Crown copyright
NorthernIreland
75
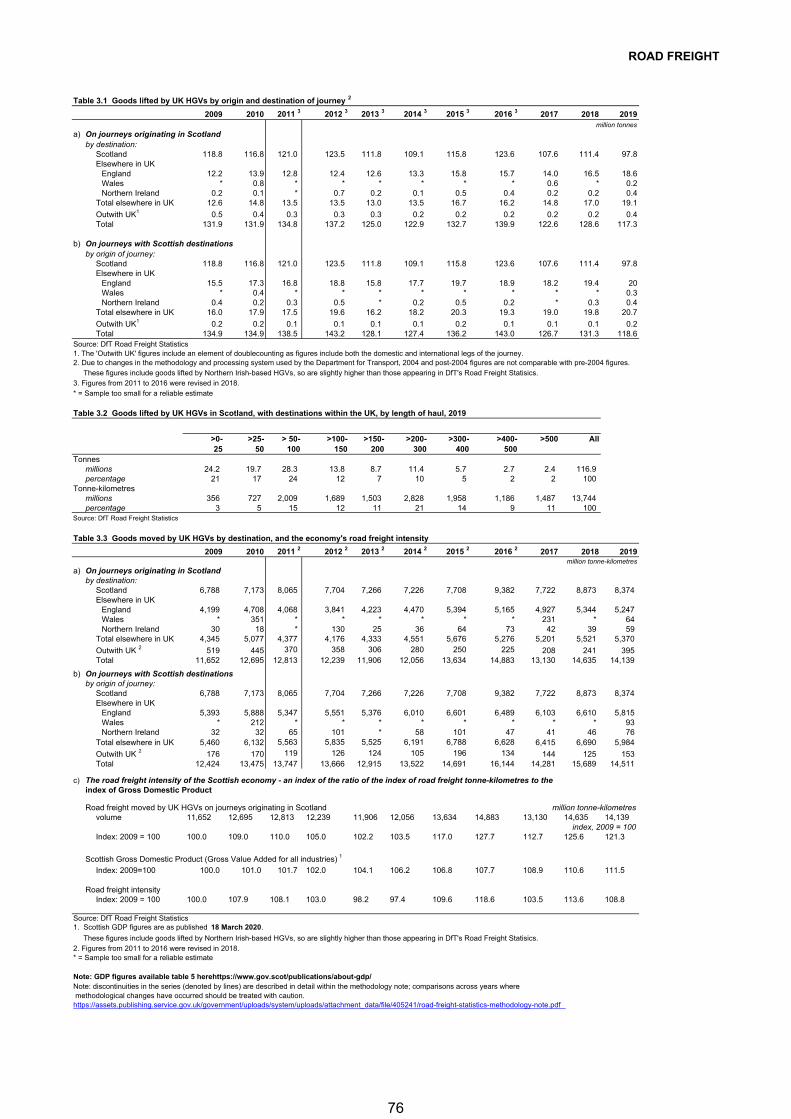
ROAD FREIGHT
Table 3.1 Goods lifted by UK HGVs by origin and destination of journey 2
2009 2010 2011 3 2012 3 2013 3 2014 3 2015 3 2016 3 2017 2018 2019million tonnes
a) On journeys originating in Scotlandby destination:
Scotland 118.8 116.8 121.0 123.5 111.8 109.1 115.8 123.6 107.6 111.4 97.8Elsewhere in UK
England 12.2 13.9 12.8 12.4 12.6 13.3 15.8 15.7 14.0 16.5 18.6Wales * 0.8 * * * * * * 0.6 * 0.2Northern Ireland 0.2 0.1 * 0.7 0.2 0.1 0.5 0.4 0.2 0.2 0.4
Total elsewhere in UK 12.6 14.8 13.5 13.5 13.0 13.5 16.7 16.2 14.8 17.0 19.1
Outwith UK1 0.5 0.4 0.3 0.3 0.3 0.2 0.2 0.2 0.2 0.2 0.4Total 131.9 131.9 134.8 137.2 125.0 122.9 132.7 139.9 122.6 128.6 117.3
b) On journeys with Scottish destinationsby origin of journey:
Scotland 118.8 116.8 121.0 123.5 111.8 109.1 115.8 123.6 107.6 111.4 97.8Elsewhere in UK
England 15.5 17.3 16.8 18.8 15.8 17.7 19.7 18.9 18.2 19.4 20Wales * 0.4 * * * * * * * * 0.3Northern Ireland 0.4 0.2 0.3 0.5 * 0.2 0.5 0.2 * 0.3 0.4
Total elsewhere in UK 16.0 17.9 17.5 19.6 16.2 18.2 20.3 19.3 19.0 19.8 20.7
Outwith UK1 0.2 0.2 0.1 0.1 0.1 0.1 0.2 0.1 0.1 0.1 0.2Total 134.9 134.9 138.5 143.2 128.1 127.4 136.2 143.0 126.7 131.3 118.6
Source: DfT Road Freight Statistics1. The 'Outwith UK' figures include an element of doublecounting as figures include both the domestic and international legs of the journey.2. Due to changes in the methodology and processing system used by the Department for Transport, 2004 and post-2004 figures are not comparable with pre-2004 figures.
These figures include goods lifted by Northern Irish-based HGVs, so are slightly higher than those appearing in DfT's Road Freight Statisics.3. Figures from 2011 to 2016 were revised in 2018.* = Sample too small for a reliable estimate
Table 3.2 Goods lifted by UK HGVs in Scotland, with destinations within the UK, by length of haul, 2019
>0- >25- > 50- >100- >150- >200- >300- >400- >500 All25 50 100 150 200 300 400 500
Tonnesmillions 24.2 19.7 28.3 13.8 8.7 11.4 5.7 2.7 2.4 116.9 percentage 21 17 24 12 7 10 5 2 2 100
Tonne-kilometresmillions 356 727 2,009 1,689 1,503 2,828 1,958 1,186 1,487 13,744 percentage 3 5 15 12 11 21 14 9 11 100
Source: DfT Road Freight Statistics
Table 3.3 Goods moved by UK HGVs by destination, and the economy's road freight intensity
2009 2010 2011 2 2012 2 2013 2 2014 2 2015 2 2016 2 2017 2018 2019million tonne-kilometres
a) On journeys originating in Scotlandby destination:
Scotland 6,788 7,173 8,065 7,704 7,266 7,226 7,708 9,382 7,722 8,873 8,374 Elsewhere in UK
England 4,199 4,708 4,068 3,841 4,223 4,470 5,394 5,165 4,927 5,344 5,247 Wales * 351 * * * * * * 231 * 64 Northern Ireland 30 18 * 130 25 36 64 73 42 39 59
Total elsewhere in UK 4,345 5,077 4,377 4,176 4,333 4,551 5,676 5,276 5,201 5,521 5,370
Outwith UK 2 519 445 370 358 306 280 250 225 208 241 395 Total 11,652 12,695 12,813 12,239 11,906 12,056 13,634 14,883 13,130 14,635 14,139
b) On journeys with Scottish destinationsby origin of journey:
Scotland 6,788 7,173 8,065 7,704 7,266 7,226 7,708 9,382 7,722 8,873 8,374 Elsewhere in UK
England 5,393 5,888 5,347 5,551 5,376 6,010 6,601 6,489 6,103 6,610 5,815 Wales * 212 * * * * * * * * 93 Northern Ireland 32 32 65 101 * 58 101 47 41 46 76
Total elsewhere in UK 5,460 6,132 5,563 5,835 5,525 6,191 6,788 6,628 6,415 6,690 5,984
Outwith UK 2 176 170 119 126 124 105 196 134 144 125 153 Total 12,424 13,475 13,747 13,666 12,915 13,522 14,691 16,144 14,281 15,689 14,511
c) The road freight intensity of the Scottish economy - an index of the ratio of the index of road freight tonne-kilometres to the index of Gross Domestic Product
Road freight moved by UK HGVs on journeys originating in Scotland million tonne-kilometresvolume 11,652 12,695 12,813 12,239 11,906 12,056 13,634 14,883 13,130 14,635 14,139
index, 2009 = 100Index: 2009 = 100 100.0 109.0 110.0 105.0 102.2 103.5 117.0 127.7 112.7 125.6 121.3
Scottish Gross Domestic Product (Gross Value Added for all industries) 1
Index: 2009=100 100.0 101.0 101.7 102.0 104.1 106.2 106.8 107.7 108.9 110.6 111.5
Road freight intensityIndex: 2009 = 100 100.0 107.9 108.1 103.0 98.2 97.4 109.6 118.6 103.5 113.6 108.8
Source: DfT Road Freight Statistics1. Scottish GDP figures are as published 18 March 2020.
These figures include goods lifted by Northern Irish-based HGVs, so are slightly higher than those appearing in DfT's Road Freight Statisics.2. Figures from 2011 to 2016 were revised in 2018.* = Sample too small for a reliable estimate
Note: GDP figures available table 5 herehttps://www.gov.scot/publications/about-gdp/Note: discontinuities in the series (denoted by lines) are described in detail within the methodology note; comparisons across years where methodological changes have occurred should be treated with caution.https://assets.publishing.service.gov.uk/government/uploads/system/uploads/attachment_data/file/405241/road-freight-statistics-methodology-note.pdf
76
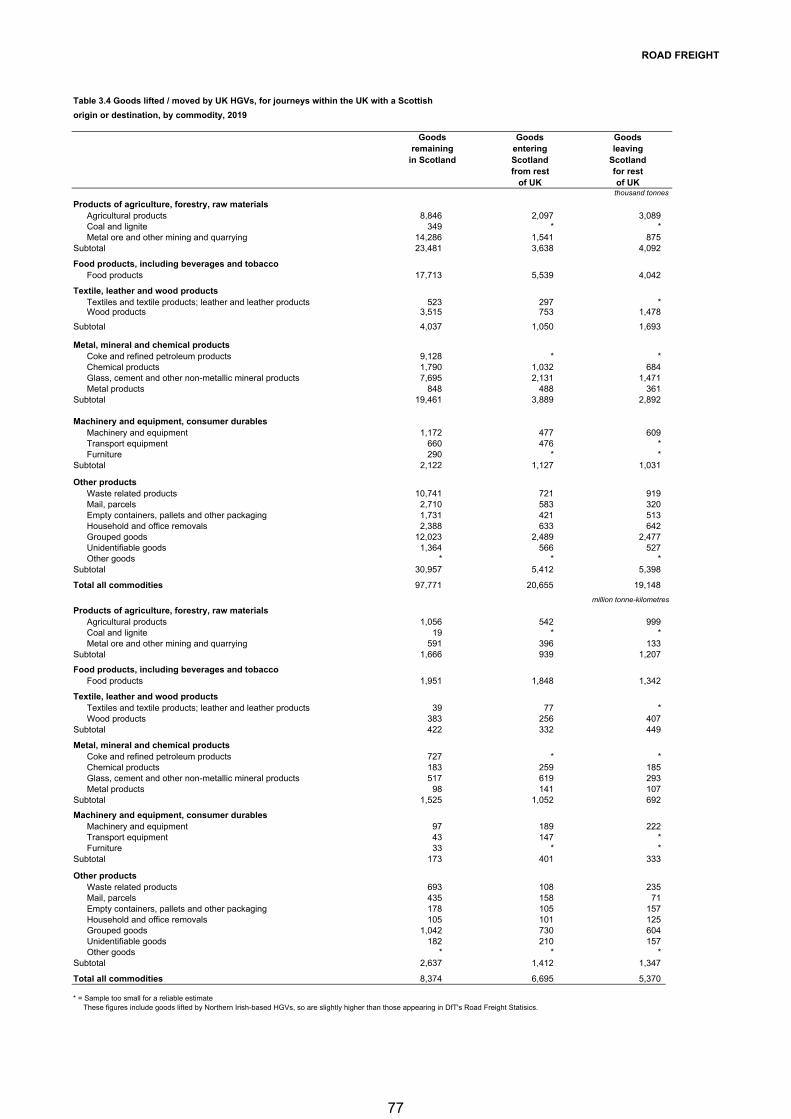
ROAD FREIGHT
Table 3.4 Goods lifted / moved by UK HGVs, for journeys within the UK with a Scottish
origin or destination, by commodity, 2019
Goods Goods Goodsremaining entering leaving
in Scotland Scotland Scotlandfrom rest for rest
of UK of UKthousand tonnes
Products of agriculture, forestry, raw materialsAgricultural products 8,846 2,097 3,089 Coal and lignite 349 * *Metal ore and other mining and quarrying 14,286 1,541 875
Subtotal 23,481 3,638 4,092
Food products, including beverages and tobaccoFood products 17,713 5,539 4,042
Textile, leather and wood productsTextiles and textile products; leather and leather products 523 297 *Wood products 3,515 753 1,478
Subtotal 4,037 1,050 1,693
Metal, mineral and chemical products
Coke and refined petroleum products 9,128 * *Chemical products 1,790 1,032 684 Glass, cement and other non-metallic mineral products 7,695 2,131 1,471 Metal products 848 488 361
Subtotal 19,461 3,889 2,892
Machinery and equipment, consumer durablesMachinery and equipment 1,172 477 609 Transport equipment 660 476 *Furniture 290 * *
Subtotal 2,122 1,127 1,031
Other productsWaste related products 10,741 721 919 Mail, parcels 2,710 583 320 Empty containers, pallets and other packaging 1,731 421 513 Household and office removals 2,388 633 642 Grouped goods 12,023 2,489 2,477 Unidentifiable goods 1,364 566 527 Other goods * * *
Subtotal 30,957 5,412 5,398
Total all commodities 97,771 20,655 19,148
million tonne-kilometres
Products of agriculture, forestry, raw materialsAgricultural products 1,056 542 999 Coal and lignite 19 * *Metal ore and other mining and quarrying 591 396 133
Subtotal 1,666 939 1,207
Food products, including beverages and tobaccoFood products 1,951 1,848 1,342
Textile, leather and wood productsTextiles and textile products; leather and leather products 39 77 *Wood products 383 256 407
Subtotal 422 332 449
Metal, mineral and chemical productsCoke and refined petroleum products 727 * *Chemical products 183 259 185 Glass, cement and other non-metallic mineral products 517 619 293 Metal products 98 141 107
Subtotal 1,525 1,052 692
Machinery and equipment, consumer durablesMachinery and equipment 97 189 222 Transport equipment 43 147 *Furniture 33 * *
Subtotal 173 401 333
Other productsWaste related products 693 108 235 Mail, parcels 435 158 71 Empty containers, pallets and other packaging 178 105 157 Household and office removals 105 101 125 Grouped goods 1,042 730 604 Unidentifiable goods 182 210 157 Other goods * * *
Subtotal 2,637 1,412 1,347
Total all commodities 8,374 6,695 5,370
* = Sample too small for a reliable estimate These figures include goods lifted by Northern Irish-based HGVs, so are slightly higher than those appearing in DfT's Road Freight Statisics.
77
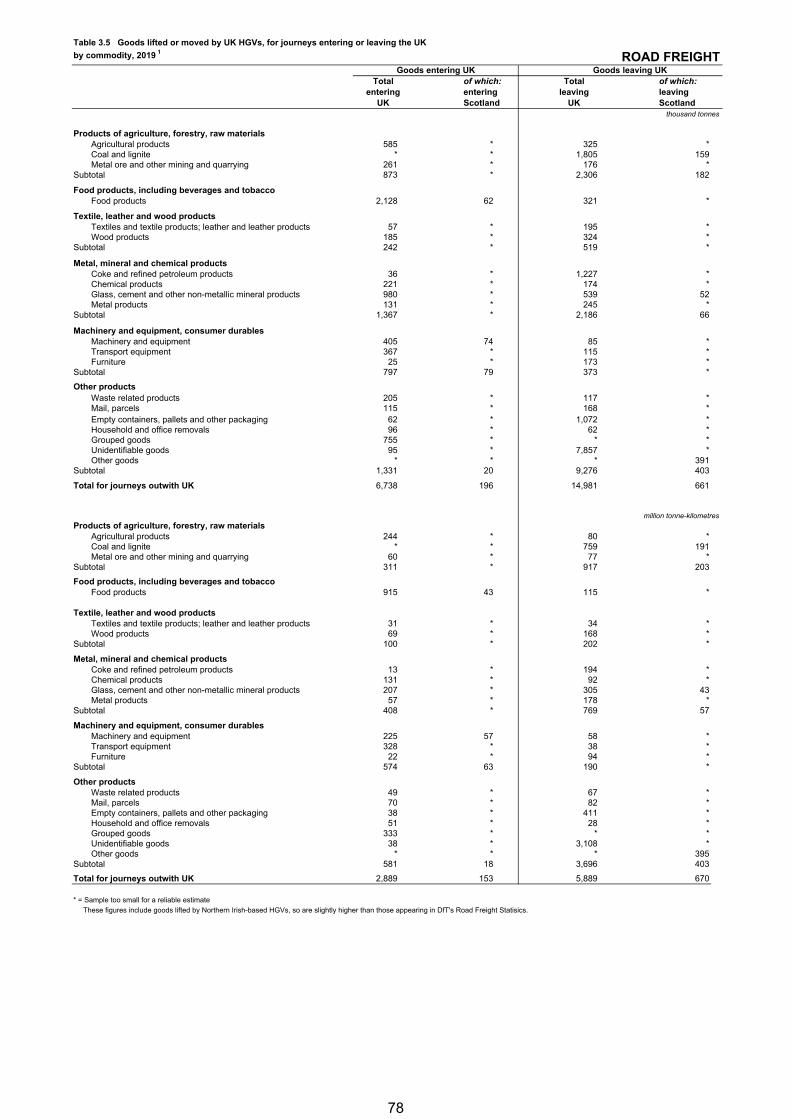
ROAD FREIGHTTable 3.5 Goods lifted or moved by UK HGVs, for journeys entering or leaving the UK
by commodity, 2019 1
Total of which: Total of which:
entering entering leaving leavingUK Scotland UK Scotland
thousand tonnes
Products of agriculture, forestry, raw materialsAgricultural products 585 * 325 *Coal and lignite * * 1,805 159Metal ore and other mining and quarrying 261 * 176 *
Subtotal 873 * 2,306 182
Food products, including beverages and tobaccoFood products 2,128 62 321 *
Textile, leather and wood productsTextiles and textile products; leather and leather products 57 * 195 *Wood products 185 * 324 *
Subtotal 242 * 519 *
Metal, mineral and chemical productsCoke and refined petroleum products 36 * 1,227 *Chemical products 221 * 174 *Glass, cement and other non-metallic mineral products 980 * 539 52Metal products 131 * 245 *
Subtotal 1,367 * 2,186 66
Machinery and equipment, consumer durablesMachinery and equipment 405 74 85 *Transport equipment 367 * 115 *Furniture 25 * 173 *
Subtotal 797 79 373 *
Other productsWaste related products 205 * 117 *Mail, parcels 115 * 168 *Empty containers, pallets and other packaging 62 * 1,072 *Household and office removals 96 * 62 *Grouped goods 755 * * *Unidentifiable goods 95 * 7,857 *Other goods * * * 391
Subtotal 1,331 20 9,276 403
Total for journeys outwith UK 6,738 196 14,981 661
million tonne-kilometres
Products of agriculture, forestry, raw materialsAgricultural products 244 * 80 *Coal and lignite * * 759 191Metal ore and other mining and quarrying 60 * 77 *
Subtotal 311 * 917 203
Food products, including beverages and tobaccoFood products 915 43 115 *
Textile, leather and wood productsTextiles and textile products; leather and leather products 31 * 34 *Wood products 69 * 168 *
Subtotal 100 * 202 *
Metal, mineral and chemical productsCoke and refined petroleum products 13 * 194 *Chemical products 131 * 92 *Glass, cement and other non-metallic mineral products 207 * 305 43Metal products 57 * 178 *
Subtotal 408 * 769 57
Machinery and equipment, consumer durablesMachinery and equipment 225 57 58 *Transport equipment 328 * 38 *Furniture 22 * 94 *
Subtotal 574 63 190 *
Other productsWaste related products 49 * 67 *Mail, parcels 70 * 82 *Empty containers, pallets and other packaging 38 * 411 *Household and office removals 51 * 28 *Grouped goods 333 * * *Unidentifiable goods 38 * 3,108 *Other goods * * * 395
Subtotal 581 18 3,696 403
Total for journeys outwith UK 2,889 153 5,889 670
* = Sample too small for a reliable estimate
These figures include goods lifted by Northern Irish-based HGVs, so are slightly higher than those appearing in DfT's Road Freight Statisics.
Goods entering UK Goods leaving UK
78
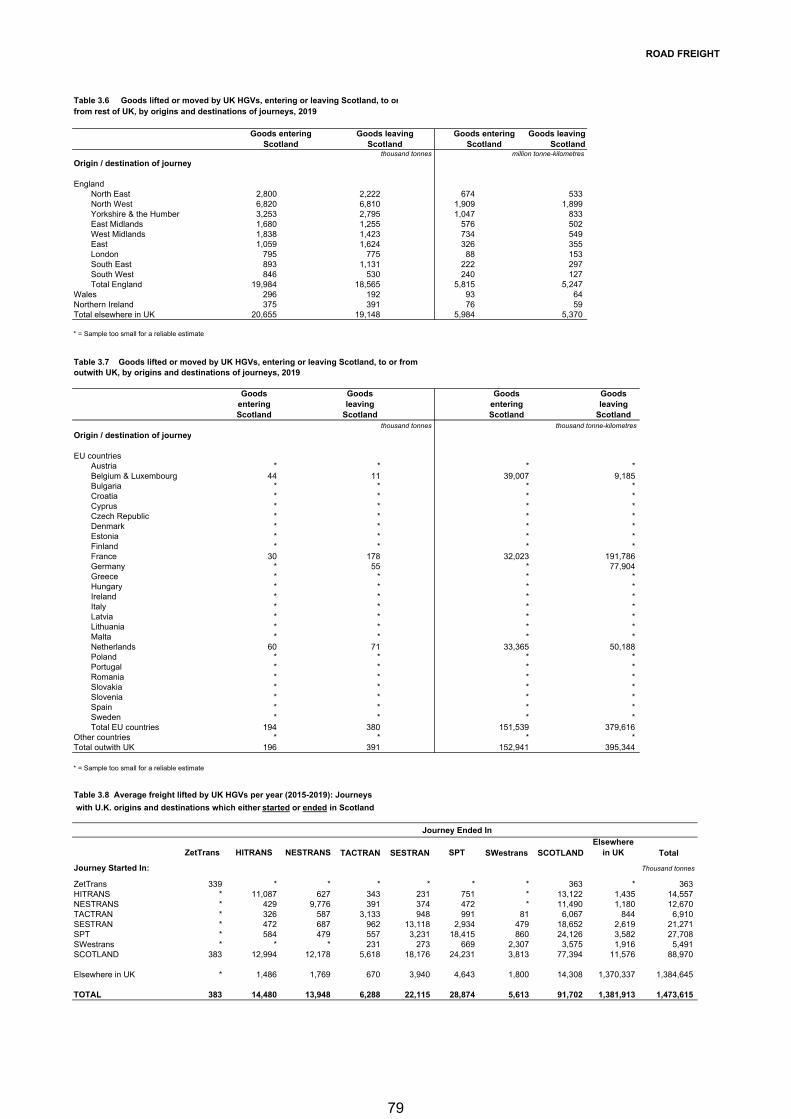
ROAD FREIGHT
Table 3.6 Goods lifted or moved by UK HGVs, entering or leaving Scotland, to or
Goods entering Goods leaving Goods entering Goods leavingScotland Scotland Scotland Scotland
thousand tonnes million tonne-kilometres
Origin / destination of journey
EnglandNorth East 2,800 2,222 674 533 North West 6,820 6,810 1,909 1,899 Yorkshire & the Humber 3,253 2,795 1,047 833 East Midlands 1,680 1,255 576 502 West Midlands 1,838 1,423 734 549 East 1,059 1,624 326 355 London 795 775 88 153 South East 893 1,131 222 297 South West 846 530 240 127 Total England 19,984 18,565 5,815 5,247
Wales 296 192 93 64 Northern Ireland 375 391 76 59 Total elsewhere in UK 20,655 19,148 5,984 5,370
* = Sample too small for a reliable estimate
Table 3.7 Goods lifted or moved by UK HGVs, entering or leaving Scotland, to or from outwith UK, by origins and destinations of journeys, 2019
Goods Goods Goods Goodsentering leaving entering leavingScotland Scotland Scotland Scotland
thousand tonnes thousand tonne-kilometres
Origin / destination of journey
EU countriesAustria * * * *Belgium & Luxembourg 44 11 39,007 9,185 Bulgaria * * * *Croatia * * * *Cyprus * * * *Czech Republic * * * *Denmark * * * *Estonia * * * *Finland * * * *France 30 178 32,023 191,786 Germany * 55 * 77,904 Greece * * * *Hungary * * * *Ireland * * * *Italy * * * *Latvia * * * *Lithuania * * * *Malta * * * *Netherlands 60 71 33,365 50,188 Poland * * * *Portugal * * * *Romania * * * *Slovakia * * * *Slovenia * * * *Spain * * * *Sweden * * * *Total EU countries 194 380 151,539 379,616
Other countries * * * *Total outwith UK 196 391 152,941 395,344
* = Sample too small for a reliable estimate
Table 3.8 Average freight lifted by UK HGVs per year (2015-2019): Journeys
with U.K. origins and destinations which either started or ended in Scotland
Journey Ended In
ZetTrans HITRANS NESTRANS TACTRAN SESTRAN SPT SWestrans SCOTLANDElsewhere
in UK Total
Journey Started In: Thousand tonnes
ZetTrans 339 * * * * * * 363 * 363 HITRANS * 11,087 627 343 231 751 * 13,122 1,435 14,557 NESTRANS * 429 9,776 391 374 472 * 11,490 1,180 12,670 TACTRAN * 326 587 3,133 948 991 81 6,067 844 6,910 SESTRAN * 472 687 962 13,118 2,934 479 18,652 2,619 21,271 SPT * 584 479 557 3,231 18,415 860 24,126 3,582 27,708 SWestrans * * * 231 273 669 2,307 3,575 1,916 5,491 SCOTLAND 383 12,994 12,178 5,618 18,176 24,231 3,813 77,394 11,576 88,970
Elsewhere in UK * 1,486 1,769 670 3,940 4,643 1,800 14,308 1,370,337 1,384,645
TOTAL 383 14,480 13,948 6,288 22,115 28,874 5,613 91,702 1,381,913 1,473,615
from rest of UK, by origins and destinations of journeys, 2019
79
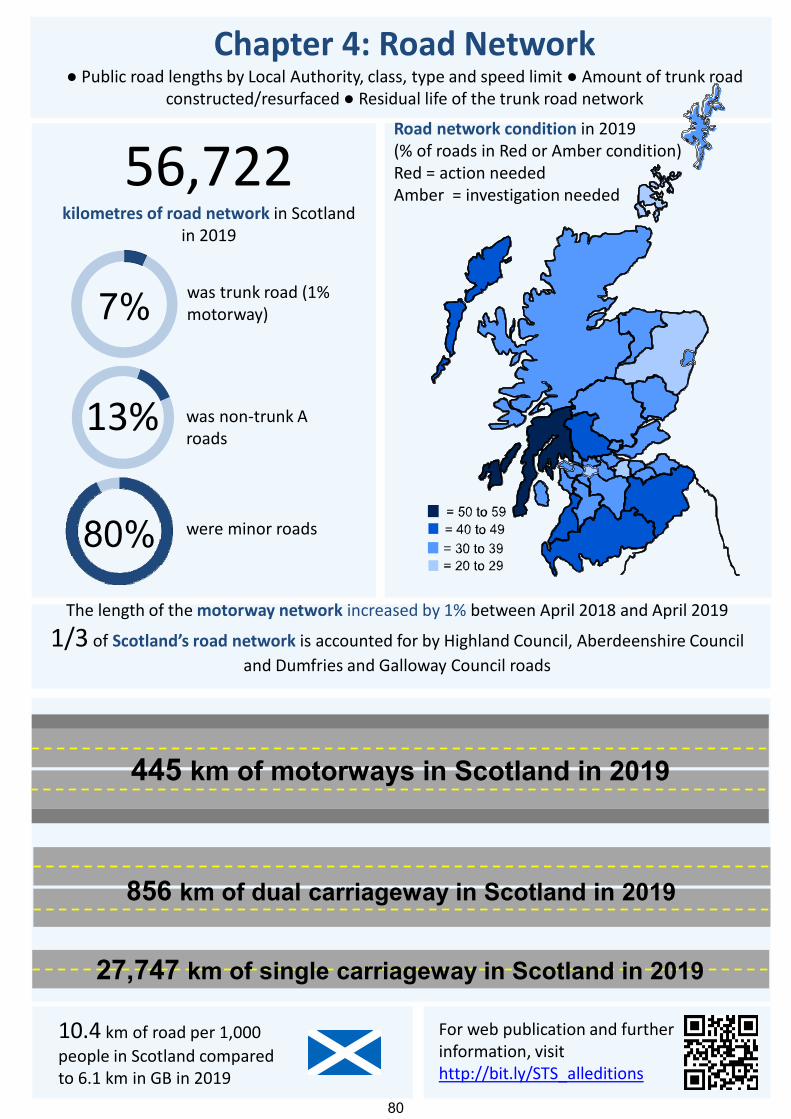
Chapter 4: Road Network● Public road lengths by Local Authority, class, type and speed limit ● Amount of trunk road
constructed/resurfaced ● Residual life of the trunk road network
56,722kilometres of road network in Scotland
in 2019
was trunk road (1% motorway)
13% was non‐trunk A roads
445 km of motorways in Scotland in 2019
856 km of dual carriageway in Scotland in 2019
27,747 km of single carriageway in Scotland in 2019
were minor roads
10.4 km of road per 1,000
people in Scotland compared to 6.1 km in GB in 2019
The length of the motorway network increased by 1% between April 2018 and April 2019 1/3 of Scotland’s road network is accounted for by Highland Council, Aberdeenshire Council
and Dumfries and Galloway Council roads
Road network condition in 2019 (% of roads in Red or Amber condition)Red = action neededAmber = investigation needed
For web publication and further information, visithttp://bit.ly/STS_alleditions
80%
7%
80
ROAD NETWORK 1. Introduction 1.1 This chapter provides information about public road lengths by local authority, road class, type and speed limit. It also includes statistics on the amount of trunk road constructed/re-surfaced and information on the residual life of the trunk road network. 1.2. Unusual year - to - year changes in the reported road lengths may be due to the gradual introduction of Geographical Information Systems (GIS) to calculate road lengths by the data providers - see Notes and Definitions section, page 247. Key Points
Scotland has 56,722 km of road network. Seven per cent is trunk road (1% is motorway). Scotland has 10.4 km of road per 1,000 people compared to 6.1 km in
GB. 2. Main Points Road length 2.1 There were 56,722 kilometres of public road in Scotland at 31 March 2019. The trunk road network accounted for 7% of the total. Other (non-trunk) A roads represented 13% of the total. Minor roads (B and C roads, and unclassified roads) accounted for the remaining 80% of roads. (Table 4.1) 2.2 The length of the motorway network increased by 1% between April 2018 and April 2019. (Table 4.1) 2.3 Over a quarter of the total trunk road network, and about one-eighth of the Scottish road network, is within the area of the Highland Council. Around 10% of the Scottish road network is within the Aberdeenshire Council area and a further 8% is within the Dumfries and Galloway Council area. These three local authorities account for almost a third of Scotland’s road network. (Table 4.2) Road Maintenance 2.4 Overall there was an decrease of 16% in the amount of trunk road that was newly constructed, reconstructed, strengthened or surface dressed in 2019-20 compared to the previous year. (Table 4.3) 2.5 In 2019-20, 15.7% of the motorway network, 10.6% of the dual carriageway and 10.1% of the single carriageway trunk road network required close monitoring of the state of the road surface. (Table 4.5 (b)) 2.6 In 2019-20 the National Road Condition Indicator (RCI) showed 31% of the local authority A road network may, following more detailed examination, require some kind of maintenance (see the Notes and Definitions section, page 247). For the whole of the local authority network (all road categories), about 36% may similarly require some kind of maintenance. (Table 4.6)
81
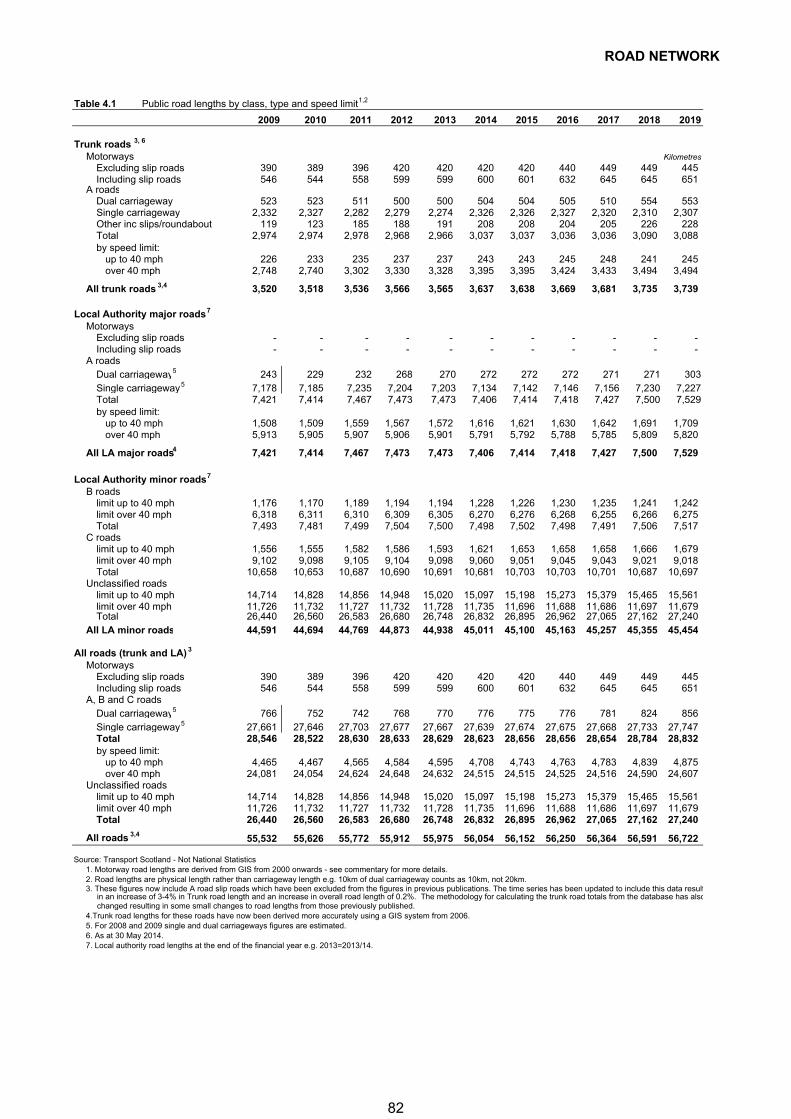
ROAD NETWORK
Table 4.1 Public road lengths by class, type and speed limit 1,2
2009 2010 2011 2012 2013 2014 2015 2016 2017 2018 2019
Trunk roads 3, 6
Motorways Kilometres
Excluding slip roads 390 389 396 420 420 420 420 440 449 449 445Including slip roads 546 544 558 599 599 600 601 632 645 645 651
A roadsDual carriageway 523 523 511 500 500 504 504 505 510 554 553Single carriageway 2,332 2,327 2,282 2,279 2,274 2,326 2,326 2,327 2,320 2,310 2,307Other inc slips/roundabout 119 123 185 188 191 208 208 204 205 226 228Total 2,974 2,974 2,978 2,968 2,966 3,037 3,037 3,036 3,036 3,090 3,088by speed limit:
up to 40 mph 226 233 235 237 237 243 243 245 248 241 245over 40 mph 2,748 2,740 3,302 3,330 3,328 3,395 3,395 3,424 3,433 3,494 3,494
All trunk roads 3,4 3,520 3,518 3,536 3,566 3,565 3,637 3,638 3,669 3,681 3,735 3,739
Local Authority major roads 7
MotorwaysExcluding slip roads - - - - - - - - - - - Including slip roads - - - - - - - - - - -
A roadsDual carriageway 5 243 229 232 268 270 272 272 272 271 271 303Single carriageway 5 7,178 7,185 7,235 7,204 7,203 7,134 7,142 7,146 7,156 7,230 7,227Total 7,421 7,414 7,467 7,473 7,473 7,406 7,414 7,418 7,427 7,500 7,529by speed limit:
up to 40 mph 1,508 1,509 1,559 1,567 1,572 1,616 1,621 1,630 1,642 1,691 1,709over 40 mph 5,913 5,905 5,907 5,906 5,901 5,791 5,792 5,788 5,785 5,809 5,820
All LA major roads4 7,421 7,414 7,467 7,473 7,473 7,406 7,414 7,418 7,427 7,500 7,529
Local Authority minor roads 7
B roadslimit up to 40 mph 1,176 1,170 1,189 1,194 1,194 1,228 1,226 1,230 1,235 1,241 1,242limit over 40 mph 6,318 6,311 6,310 6,309 6,305 6,270 6,276 6,268 6,255 6,266 6,275Total 7,493 7,481 7,499 7,504 7,500 7,498 7,502 7,498 7,491 7,506 7,517
C roadslimit up to 40 mph 1,556 1,555 1,582 1,586 1,593 1,621 1,653 1,658 1,658 1,666 1,679limit over 40 mph 9,102 9,098 9,105 9,104 9,098 9,060 9,051 9,045 9,043 9,021 9,018Total 10,658 10,653 10,687 10,690 10,691 10,681 10,703 10,703 10,701 10,687 10,697
Unclassified roadslimit up to 40 mph 14,714 14,828 14,856 14,948 15,020 15,097 15,198 15,273 15,379 15,465 15,561limit over 40 mph 11,726 11,732 11,727 11,732 11,728 11,735 11,696 11,688 11,686 11,697 11,679Total 26,440 26,560 26,583 26,680 26,748 26,832 26,895 26,962 27,065 27,162 27,240
All LA minor roads 44,591 44,694 44,769 44,873 44,938 45,011 45,100 45,163 45,257 45,355 45,454
All roads (trunk and LA) 3
MotorwaysExcluding slip roads 390 389 396 420 420 420 420 440 449 449 445Including slip roads 546 544 558 599 599 600 601 632 645 645 651
A, B and C roadsDual carriageway 5 766 752 742 768 770 776 775 776 781 824 856Single carriageway 5 27,661 27,646 27,703 27,677 27,667 27,639 27,674 27,675 27,668 27,733 27,747Total 28,546 28,522 28,630 28,633 28,629 28,623 28,656 28,656 28,654 28,784 28,832by speed limit:
up to 40 mph 4,465 4,467 4,565 4,584 4,595 4,708 4,743 4,763 4,783 4,839 4,875over 40 mph 24,081 24,054 24,624 24,648 24,632 24,515 24,515 24,525 24,516 24,590 24,607
Unclassified roadslimit up to 40 mph 14,714 14,828 14,856 14,948 15,020 15,097 15,198 15,273 15,379 15,465 15,561limit over 40 mph 11,726 11,732 11,727 11,732 11,728 11,735 11,696 11,688 11,686 11,697 11,679Total 26,440 26,560 26,583 26,680 26,748 26,832 26,895 26,962 27,065 27,162 27,240
All roads 3,4 55,532 55,626 55,772 55,912 55,975 56,054 56,152 56,250 56,364 56,591 56,722
Source: Transport Scotland - Not National Statistics1. Motorway road lengths are derived from GIS from 2000 onwards - see commentary for more details.2. Road lengths are physical length rather than carriageway length e.g. 10km of dual carriageway counts as 10km, not 20km.3. These figures now include A road slip roads which have been excluded from the figures in previous publications. The time series has been updated to include this data result in an increase of 3-4% in Trunk road length and an increase in overall road length of 0.2%. The methodology for calculating the trunk road totals from the database has also changed resulting in some small changes to road lengths from those previously published.4.Trunk road lengths for these roads have now been derived more accurately using a GIS system from 2006.5. For 2008 and 2009 single and dual carriageways figures are estimated.6. As at 30 May 2014.7. Local authority road lengths at the end of the financial year e.g. 2013=2013/14.
82
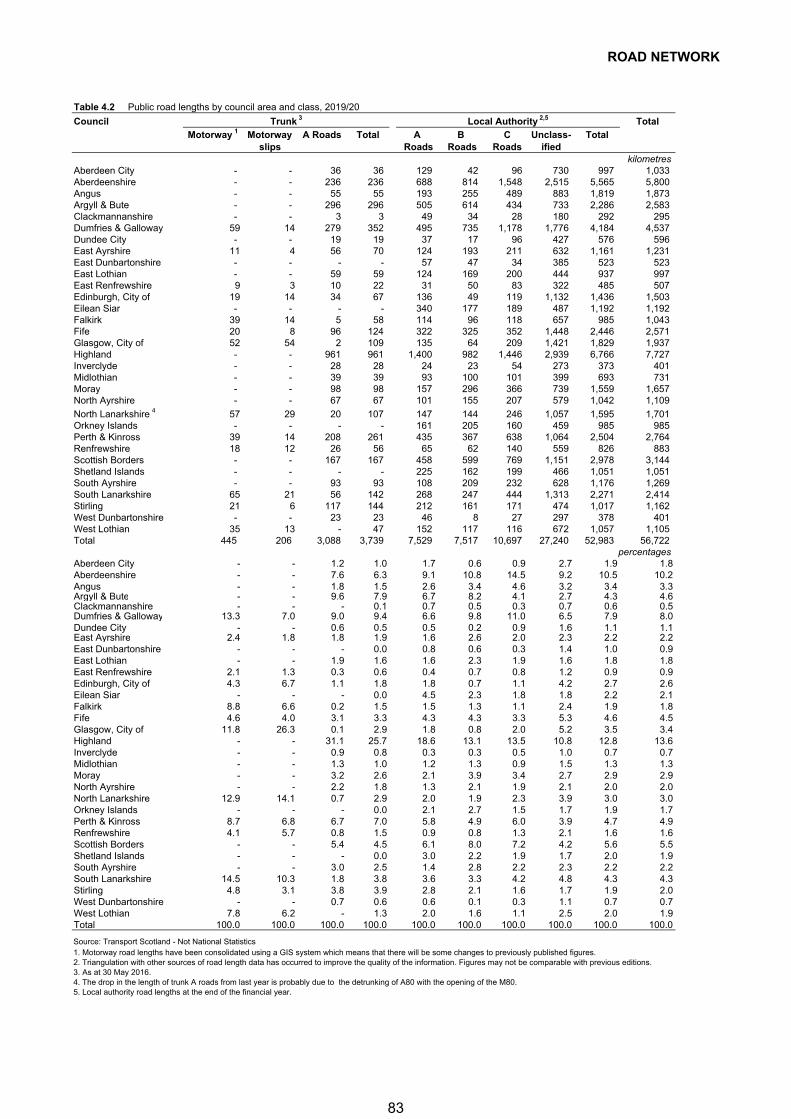
ROAD NETWORK
Table 4.2 Public road lengths by council area and class, 2019/20
Council Trunk 3 Local Authority 2,5 Total
Motorway 1 Motorway A Roads Total A B C Unclass- Totalslips Roads Roads Roads ified
kilometresAberdeen City - - 36 36 129 42 96 730 997 1,033 Aberdeenshire - - 236 236 688 814 1,548 2,515 5,565 5,800 Angus - - 55 55 193 255 489 883 1,819 1,873 Argyll & Bute - - 296 296 505 614 434 733 2,286 2,583 Clackmannanshire - - 3 3 49 34 28 180 292 295 Dumfries & Galloway 59 14 279 352 495 735 1,178 1,776 4,184 4,537 Dundee City - - 19 19 37 17 96 427 576 596 East Ayrshire 11 4 56 70 124 193 211 632 1,161 1,231 East Dunbartonshire - - - - 57 47 34 385 523 523 East Lothian - - 59 59 124 169 200 444 937 997 East Renfrewshire 9 3 10 22 31 50 83 322 485 507 Edinburgh, City of 19 14 34 67 136 49 119 1,132 1,436 1,503 Eilean Siar - - - - 340 177 189 487 1,192 1,192 Falkirk 39 14 5 58 114 96 118 657 985 1,043 Fife 20 8 96 124 322 325 352 1,448 2,446 2,571 Glasgow, City of 52 54 2 109 135 64 209 1,421 1,829 1,937 Highland - - 961 961 1,400 982 1,446 2,939 6,766 7,727 Inverclyde - - 28 28 24 23 54 273 373 401 Midlothian - - 39 39 93 100 101 399 693 731 Moray - - 98 98 157 296 366 739 1,559 1,657 North Ayrshire - - 67 67 101 155 207 579 1,042 1,109
North Lanarkshire 4 57 29 20 107 147 144 246 1,057 1,595 1,701 Orkney Islands - - - - 161 205 160 459 985 985 Perth & Kinross 39 14 208 261 435 367 638 1,064 2,504 2,764 Renfrewshire 18 12 26 56 65 62 140 559 826 883 Scottish Borders - - 167 167 458 599 769 1,151 2,978 3,144 Shetland Islands - - - - 225 162 199 466 1,051 1,051 South Ayrshire - - 93 93 108 209 232 628 1,176 1,269 South Lanarkshire 65 21 56 142 268 247 444 1,313 2,271 2,414 Stirling 21 6 117 144 212 161 171 474 1,017 1,162 West Dunbartonshire - - 23 23 46 8 27 297 378 401 West Lothian 35 13 - 47 152 117 116 672 1,057 1,105 Total 445 206 3,088 3,739 7,529 7,517 10,697 27,240 52,983 56,722
percentagesAberdeen City - - 1.2 1.0 1.7 0.6 0.9 2.7 1.9 1.8Aberdeenshire - - 7.6 6.3 9.1 10.8 14.5 9.2 10.5 10.2Angus - - 1.8 1.5 2.6 3.4 4.6 3.2 3.4 3.3Argyll & Bute - - 9.6 7.9 6.7 8.2 4.1 2.7 4.3 4.6Clackmannanshire - - - 0.1 0.7 0.5 0.3 0.7 0.6 0.5Dumfries & Galloway 13.3 7.0 9.0 9.4 6.6 9.8 11.0 6.5 7.9 8.0Dundee City - - 0.6 0.5 0.5 0.2 0.9 1.6 1.1 1.1East Ayrshire 2.4 1.8 1.8 1.9 1.6 2.6 2.0 2.3 2.2 2.2East Dunbartonshire - - - 0.0 0.8 0.6 0.3 1.4 1.0 0.9East Lothian - - 1.9 1.6 1.6 2.3 1.9 1.6 1.8 1.8East Renfrewshire 2.1 1.3 0.3 0.6 0.4 0.7 0.8 1.2 0.9 0.9Edinburgh, City of 4.3 6.7 1.1 1.8 1.8 0.7 1.1 4.2 2.7 2.6Eilean Siar - - - 0.0 4.5 2.3 1.8 1.8 2.2 2.1Falkirk 8.8 6.6 0.2 1.5 1.5 1.3 1.1 2.4 1.9 1.8Fife 4.6 4.0 3.1 3.3 4.3 4.3 3.3 5.3 4.6 4.5Glasgow, City of 11.8 26.3 0.1 2.9 1.8 0.8 2.0 5.2 3.5 3.4Highland - - 31.1 25.7 18.6 13.1 13.5 10.8 12.8 13.6Inverclyde - - 0.9 0.8 0.3 0.3 0.5 1.0 0.7 0.7Midlothian - - 1.3 1.0 1.2 1.3 0.9 1.5 1.3 1.3Moray - - 3.2 2.6 2.1 3.9 3.4 2.7 2.9 2.9North Ayrshire - - 2.2 1.8 1.3 2.1 1.9 2.1 2.0 2.0North Lanarkshire 12.9 14.1 0.7 2.9 2.0 1.9 2.3 3.9 3.0 3.0Orkney Islands - - - 0.0 2.1 2.7 1.5 1.7 1.9 1.7Perth & Kinross 8.7 6.8 6.7 7.0 5.8 4.9 6.0 3.9 4.7 4.9Renfrewshire 4.1 5.7 0.8 1.5 0.9 0.8 1.3 2.1 1.6 1.6Scottish Borders - - 5.4 4.5 6.1 8.0 7.2 4.2 5.6 5.5Shetland Islands - - - 0.0 3.0 2.2 1.9 1.7 2.0 1.9South Ayrshire - - 3.0 2.5 1.4 2.8 2.2 2.3 2.2 2.2South Lanarkshire 14.5 10.3 1.8 3.8 3.6 3.3 4.2 4.8 4.3 4.3Stirling 4.8 3.1 3.8 3.9 2.8 2.1 1.6 1.7 1.9 2.0West Dunbartonshire - - 0.7 0.6 0.6 0.1 0.3 1.1 0.7 0.7West Lothian 7.8 6.2 - 1.3 2.0 1.6 1.1 2.5 2.0 1.9Total 100.0 100.0 100.0 100.0 100.0 100.0 100.0 100.0 100.0 100.0
Source: Transport Scotland - Not National Statistics1. Motorway road lengths have been consolidated using a GIS system which means that there will be some changes to previously published figures.2. Triangulation with other sources of road length data has occurred to improve the quality of the information. Figures may not be comparable with previous editions.3. As at 30 May 2016.4. The drop in the length of trunk A roads from last year is probably due to the detrunking of A80 with the opening of the M80.5. Local authority road lengths at the end of the financial year.
83
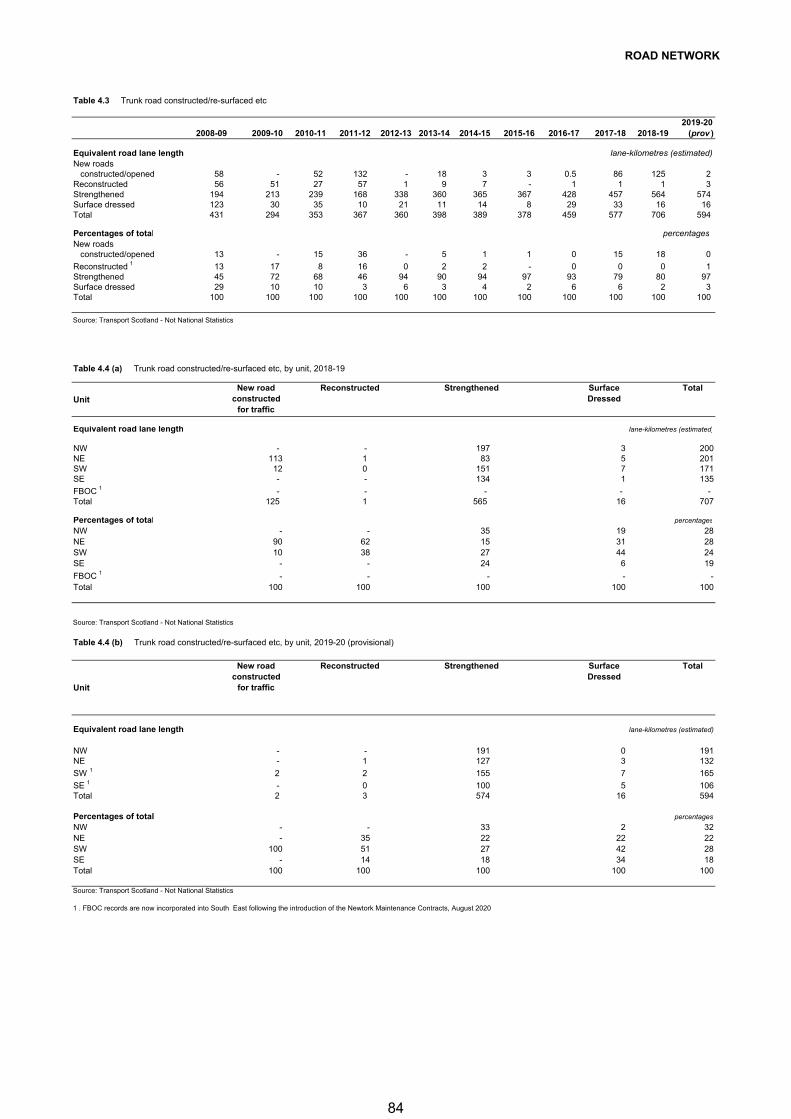
ROAD NETWORK
Table 4.3 Trunk road constructed/re-surfaced etc
2008-09 2009-10 2010-11 2011-12 2012-13 2013-14 2014-15 2015-16 2016-17 2017-18 2018-19 2019-20
(prov )
Equivalent road lane length lane-kilometres (estimated)New roads constructed/opened 58 - 52 132 - 18 3 3 0.5 86 125 2 Reconstructed 56 51 27 57 1 9 7 - 1 1 1 3 Strengthened 194 213 239 168 338 360 365 367 428 457 564 574 Surface dressed 123 30 35 10 21 11 14 8 29 33 16 16 Total 431 294 353 367 360 398 389 378 459 577 706 594
Percentages of total percentagesNew roads constructed/opened 13 - 15 36 - 5 1 1 0 15 18 0
Reconstructed 1 13 17 8 16 0 2 2 - 0 0 0 1 Strengthened 45 72 68 46 94 90 94 97 93 79 80 97 Surface dressed 29 10 10 3 6 3 4 2 6 6 2 3 Total 100 100 100 100 100 100 100 100 100 100 100 100
Source: Transport Scotland - Not National Statistics
Table 4.4 (a) Trunk road constructed/re-surfaced etc, by unit, 2018-19
Unit
New road constructed
for traffic
Reconstructed Strengthened Surface Dressed
Total
Equivalent road lane length lane-kilometres (estimated)
NW - - 197 3 200NE 113 1 83 5 201SW 12 0 151 7 171SE - - 134 1 135
FBOC 1 - - - - - Total 125 1 565 16 707
Percentages of total percentages
NW - - 35 19 28NE 90 62 15 31 28SW 10 38 27 44 24SE - - 24 6 19
FBOC 1 - - - - -Total 100 100 100 100 100
Source: Transport Scotland - Not National Statistics
Table 4.4 (b) Trunk road constructed/re-surfaced etc, by unit, 2019-20 (provisional)
Unit
New road constructed
for traffic
Reconstructed Strengthened Surface Dressed
Total
Equivalent road lane length lane-kilometres (estimated)
NW - - 191 0 191NE - 1 127 3 132
SW 1 2 2 155 7 165
SE 1 - 0 100 5 106Total 2 3 574 16 594
Percentages of total percentages
NW - - 33 2 32NE - 35 22 22 22SW 100 51 27 42 28SE - 14 18 34 18Total 100 100 100 100 100
Source: Transport Scotland - Not National Statistics
1 . FBOC records are now incorporated into South East following the introduction of the Newtork Maintenance Contracts, August 2020
84
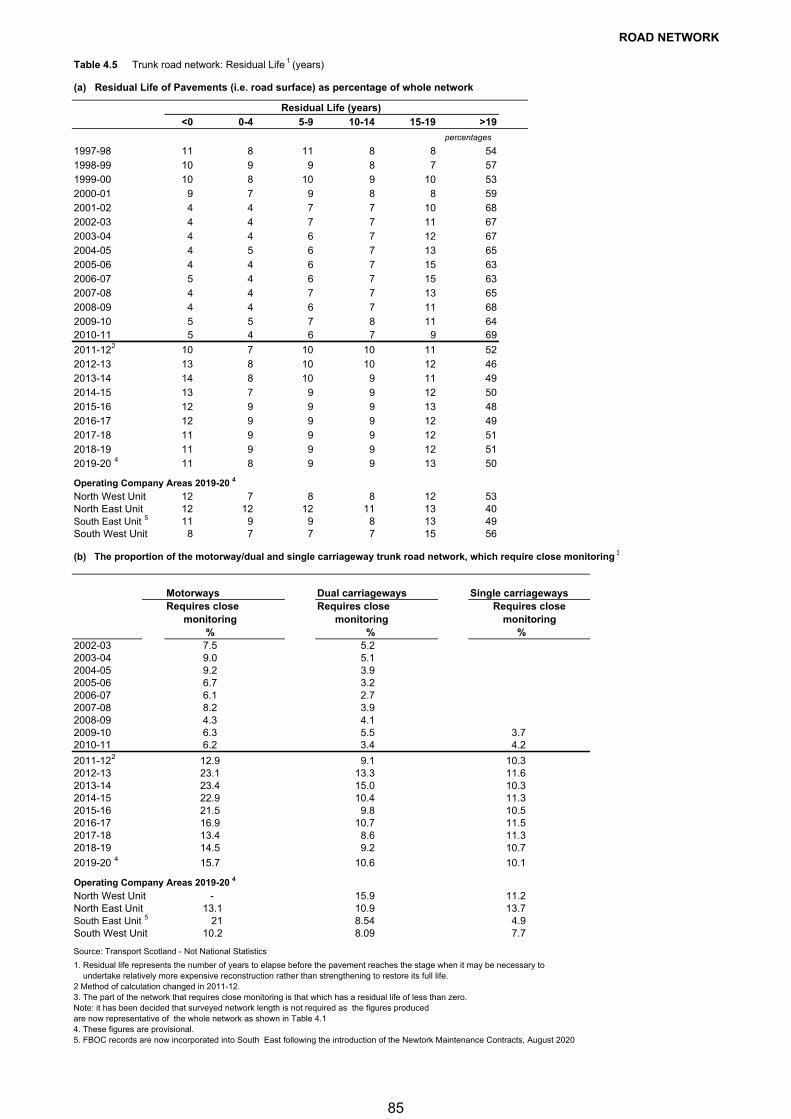
ROAD NETWORK
Table 4.5 Trunk road network: Residual Life 1 (years)
(a) Residual Life of Pavements (i.e. road surface) as percentage of whole network
Residual Life (years)<0 0-4 5-9 10-14 15-19 >19
percentages
1997-98 11 8 11 8 8 541998-99 10 9 9 8 7 571999-00 10 8 10 9 10 532000-01 9 7 9 8 8 592001-02 4 4 7 7 10 682002-03 4 4 7 7 11 672003-04 4 4 6 7 12 672004-05 4 5 6 7 13 652005-06 4 4 6 7 15 632006-07 5 4 6 7 15 632007-08 4 4 7 7 13 652008-09 4 4 6 7 11 682009-10 5 5 7 8 11 642010-11 5 4 6 7 9 69
2011-122 10 7 10 10 11 522012-13 13 8 10 10 12 462013-14 14 8 10 9 11 492014-15 13 7 9 9 12 502015-16 12 9 9 9 13 482016-17 12 9 9 9 12 492017-18 11 9 9 9 12 512018-19 11 9 9 9 12 512019-20 4 11 8 9 9 13 50
Operating Company Areas 2019-20 4
North West Unit 12 7 8 8 12 53North East Unit 12 12 12 11 13 40South East Unit 5 11 9 9 8 13 49South West Unit 8 7 7 7 15 56
(b) The proportion of the motorway/dual and single carriageway trunk road network, which require close monitoring 3
Motorways Dual carriageways Single carriagewaysRequires close Requires close
% % %2002-03 7.5 5.22003-04 9.0 5.12004-05 9.2 3.92005-06 6.7 3.22006-07 6.1 2.72007-08 8.2 3.92008-09 4.3 4.12009-10 6.3 5.5 3.72010-11 6.2 3.4 4.2
2011-122 12.9 9.1 10.32012-13 23.1 13.3 11.62013-14 23.4 15.0 10.32014-15 22.9 10.4 11.32015-16 21.5 9.8 10.52016-17 16.9 10.7 11.52017-18 13.4 8.6 11.32018-19 14.5 9.2 10.7
2019-20 4 15.7 10.6 10.1
Operating Company Areas 2019-20 4
North West Unit - 15.9 11.2North East Unit 13.1 10.9 13.7South East Unit 5 21 8.54 4.9South West Unit 10.2 8.09 7.7
Source: Transport Scotland - Not National Statistics
1. Residual life represents the number of years to elapse before the pavement reaches the stage when it may be necessary to undertake relatively more expensive reconstruction rather than strengthening to restore its full life.2 Method of calculation changed in 2011-12.3. The part of the network that requires close monitoring is that which has a residual life of less than zero. Note: it has been decided that surveyed network length is not required as the figures produced are now representative of the whole network as shown in Table 4.14. These figures are provisional. 5. FBOC records are now incorporated into South East following the introduction of the Newtork Maintenance Contracts, August 2020
monitoringmonitoringmonitoringRequires close
85
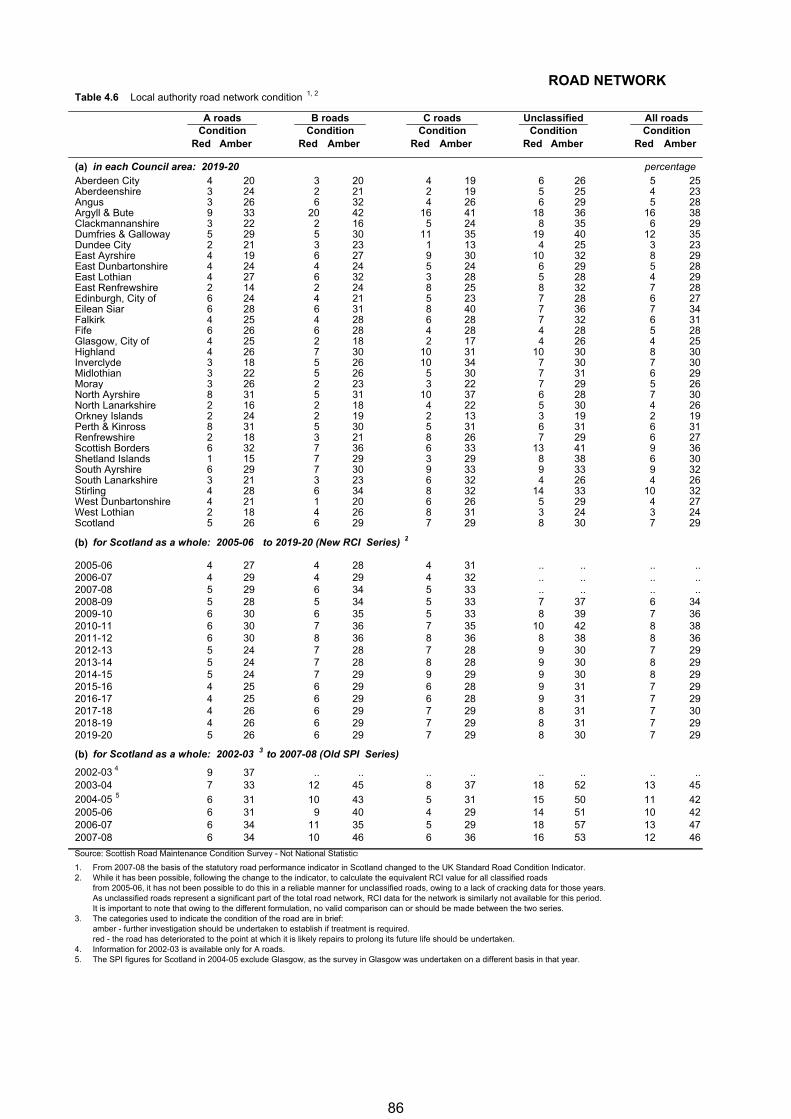
ROAD NETWORKTable 4.6 Local authority road network condition 1, 2
A roads B roads C roads Unclassified All roadsCondition Condition Condition Condition Condition
Red Amber Red Amber Red Amber Red Amber Red Amber
(a) in each Council area: 2019-20 percentage Aberdeen City 4 20 3 20 4 19 6 26 5 25Aberdeenshire 3 24 2 21 2 19 5 25 4 23Angus 3 26 6 32 4 26 6 29 5 28Argyll & Bute 9 33 20 42 16 41 18 36 16 38Clackmannanshire 3 22 2 16 5 24 8 35 6 29Dumfries & Galloway 5 29 5 30 11 35 19 40 12 35Dundee City 2 21 3 23 1 13 4 25 3 23East Ayrshire 4 19 6 27 9 30 10 32 8 29East Dunbartonshire 4 24 4 24 5 24 6 29 5 28East Lothian 4 27 6 32 3 28 5 28 4 29East Renfrewshire 2 14 2 24 8 25 8 32 7 28Edinburgh, City of 6 24 4 21 5 23 7 28 6 27Eilean Siar 6 28 6 31 8 40 7 36 7 34Falkirk 4 25 4 28 6 28 7 32 6 31Fife 6 26 6 28 4 28 4 28 5 28Glasgow, City of 4 25 2 18 2 17 4 26 4 25Highland 4 26 7 30 10 31 10 30 8 30Inverclyde 3 18 5 26 10 34 7 30 7 30Midlothian 3 22 5 26 5 30 7 31 6 29Moray 3 26 2 23 3 22 7 29 5 26North Ayrshire 8 31 5 31 10 37 6 28 7 30North Lanarkshire 2 16 2 18 4 22 5 30 4 26Orkney Islands 2 24 2 19 2 13 3 19 2 19Perth & Kinross 8 31 5 30 5 31 6 31 6 31Renfrewshire 2 18 3 21 8 26 7 29 6 27Scottish Borders 6 32 7 36 6 33 13 41 9 36Shetland Islands 1 15 7 29 3 29 8 38 6 30South Ayrshire 6 29 7 30 9 33 9 33 9 32South Lanarkshire 3 21 3 23 6 32 4 26 4 26Stirling 4 28 6 34 8 32 14 33 10 32West Dunbartonshire 4 21 1 20 6 26 5 29 4 27West Lothian 2 18 4 26 8 31 3 24 3 24Scotland 5 26 6 29 7 29 8 30 7 29
(b) for Scotland as a whole: 2005-06 to 2019-20 (New RCI Series) 2
2005-06 4 27 4 28 4 31 .. .. .. ..2006-07 4 29 4 29 4 32 .. .. .. ..2007-08 5 29 6 34 5 33 .. .. .. ..2008-09 5 28 5 34 5 33 7 37 6 342009-10 6 30 6 35 5 33 8 39 7 362010-11 6 30 7 36 7 35 10 42 8 382011-12 6 30 8 36 8 36 8 38 8 362012-13 5 24 7 28 7 28 9 30 7 292013-14 5 24 7 28 8 28 9 30 8 292014-15 5 24 7 29 9 29 9 30 8 292015-16 4 25 6 29 6 28 9 31 7 292016-17 4 25 6 29 6 28 9 31 7 292017-18 4 26 6 29 7 29 8 31 7 302018-19 4 26 6 29 7 29 8 31 7 292019-20 5 26 6 29 7 29 8 30 7 29
(b) for Scotland as a whole: 2002-03 3 to 2007-08 (Old SPI Series)
2002-03 4 9 37 .. .. .. .. .. .. .. ..2003-04 7 33 12 45 8 37 18 52 13 452004-05 5 6 31 10 43 5 31 15 50 11 422005-06 6 31 9 40 4 29 14 51 10 422006-07 6 34 11 35 5 29 18 57 13 472007-08 6 34 10 46 6 36 16 53 12 46
1.2.
3.
4.5. The SPI figures for Scotland in 2004-05 exclude Glasgow, as the survey in Glasgow was undertaken on a different basis in that year.
From 2007-08 the basis of the statutory road performance indicator in Scotland changed to the UK Standard Road Condition Indicator.While it has been possible, following the change to the indicator, to calculate the equivalent RCI value for all classified roads from 2005-06, it has not been possible to do this in a reliable manner for unclassified roads, owing to a lack of cracking data for those years.As unclassified roads represent a significant part of the total road network, RCI data for the network is similarly not available for this period.It is important to note that owing to the different formulation, no valid comparison can or should be made between the two series.
Source: Scottish Road Maintenance Condition Survey - Not National Statistics
The categories used to indicate the condition of the road are in brief:amber - further investigation should be undertaken to establish if treatment is required.red - the road has deteriorated to the point at which it is likely repairs to prolong its future life should be undertaken.Information for 2002-03 is available only for A roads.
86

87
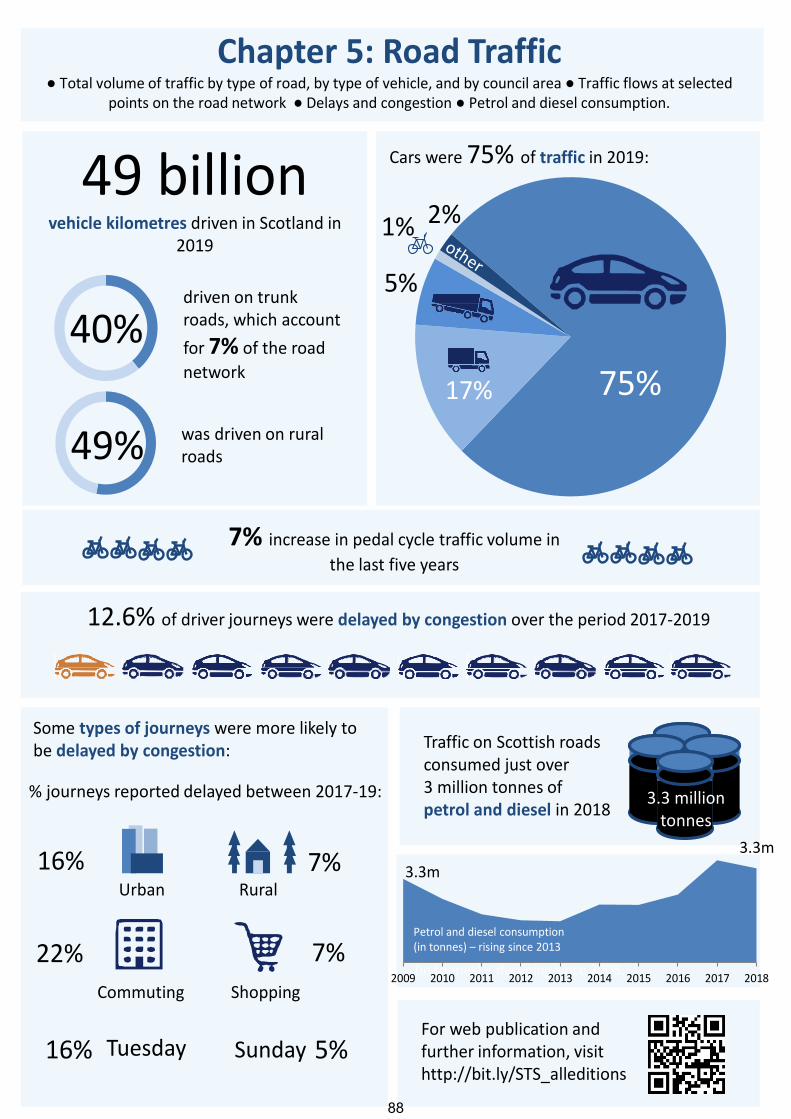
Chapter 5: Road Traffic● Total volume of traffic by type of road, by type of vehicle, and by council area ● Traffic flows at selected
points on the road network ● Delays and congestion ● Petrol and diesel consumption.
49 billionvehicle kilometres driven in Scotland in
2019
driven on trunk roads, which account
for 7% of the road
network
was driven on rural roads
7% increase in pedal cycle traffic volume in
the last five years
12.6% of driver journeys were delayed by congestion over the period 2017‐2019
75%17%
5%
1%
Cars were 75% of traffic in 2019:
Some types of journeys were more likely to be delayed by congestion:
Urban Rural
Commuting Shopping
% journeys reported delayed between 2017‐19:
Tuesday Sunday
16% 7%
22% 7%
16% 5%
Traffic on Scottish roads consumed just over 3 million tonnes of petrol and diesel in 2018
40%
49%
For web publication and further information, visithttp://bit.ly/STS_alleditions
3.3 milliontonnes
2%
Petrol and diesel consumption (in tonnes) – declining since 2007. Petrol and diesel consumption (in tonnes) – declining since 2008.
2009 2010 2011 2012 2013 2014 2015 2016 2017 2018
3.3m
Petrol and diesel consumption (in tonnes) – rising since 2013
3.3m
88
ROAD TRAFFIC 1 Introduction 1.1 This chapter provides information about road traffic, such as the total volume of traffic by type of road, by type of vehicle, and by council area. It also provides some figures on traffic flows at selected points on the road network, some statistics on delays and congestion and information about petrol and diesel consumption. 1.2 Traffic estimates, indicate only the broad level of traffic, so year - on - year comparisons should be made with care as they are based on a very small cross-section of the roads in Scotland: 12 hours in one day traffic counts taken at around 750 sites per year and data from automatic traffic counters at about two dozen sites in Scotland (then combined with data from automatic counters at similar sites in England and Wales). See Sources section. Key Points
49 billion vehicle km were driven in 2019 40% of distance travelled is on Trunk roads, which account for only 7% of
the road network. 12.6% of driver journeys were delayed by congestion between 2017 and
2019. 2 Main Points Major and Minor Roads 2.1 The estimated volume of traffic on Scotland's roads in 2019 was around 49 billion (thousand million) vehicle km: 1% more than 2018. There have been slight increases in the last eight years, following the steady downward trend seen between 2007 and 2011. (Table 5.1) 2.2 The total volume of traffic on major roads (Motorways and A roads) in 2019 was estimated to be 32 billion vehicle-km. Traffic on Motorways accounted for 8.7 billion vehicle km (18% of all traffic). This was less than the estimated 10.8 billion vehicle km on trunk A roads (22% of the total), and the 12.7 billion on non-trunk A roads (26%). Seventy per cent of A road traffic was in rural areas: 16 billion out of the A roads total of 24 billion vehicle km. (Table 5.1) 2.3 Minor roads (B, C and unclassified roads) accounted for the remaining 34% of traffic in 2019: an estimated 16.5 billion vehicle km (Table 5.1) 2.5 The total volume of traffic on major roads (Motorways and A roads) in 2019 was 2% higher than in the previous year (Motorways increased by 1.6%). Minor road traffic was about 0.8% lower than in 2018. Traffic levels are around 10 per cent higher than in 2009. (Table 5.1) Trends 2.6 DfT estimates suggest a rising trend in traffic volumes on major roads in Scotland, reaching a peak in 2007 when numbers levelled off, 5 per cent higher than they had been in 2003. Traffic volumes then fell back slightly but after increases since 2011 are now 9% higher than they were in 2007. Motorway traffic saw a 14 per cent rise between 2003 and 2008, fell slightly over the next two years and has started to rise again over the last seven years; now 30% higher than the earlier peak in 2008. (Table 5.1)
89
ROAD TRAFFIC
2.7 Traffic on minor roads is estimated to have risen by 9% between 2003 and 2007, falling by 6% between then and 2012, before rising again. The total volume of traffic on all roads in Scotland was also estimated to have risen by 6% between 2003 and 2007, falling by 2% between then and 2011, before rising again. (Table 5.1) 2.8 Cars account for over three quarters (75%) of the total volume of traffic on the roads (i.e. of the total for major roads and minor roads combined), light goods vehicles for 17% and heavy goods vehicles for 5%. Pedal cycle traffic increased by 17% in 2019. However, with pedal cycle traffic volumes increasing by 28% since 2009, pedal cycles still account for less than one percent of estimated traffic volume. (Table 5.2 & 5.3) 2.9 In 2019, the volume of car traffic was 7 per cent higher than in 2009, light goods vehicle traffic 35 per cent higher, but bus vehicle traffic 11% lower. (Table 5.3) Local Area volumes 2.10 Nearly a fifth of motorway traffic was within the City of Glasgow, whereas Highland had the highest volume (26%) of trunk A road traffic. The five local authorities with the highest traffic volumes (Glasgow, North Lanarkshire, Edinburgh, Fife and Aberdeenshire) account for 34% of all traffic on Scotland’s roads. (Table 5.4) 2.11 The monthly average daily traffic flows recorded at a selection of Automated Traffic Classifier (ATC) sites are given in Table 5.6. A map showing the location of the traffic counters and detailed information can be found here https://ntds.trafficscotland.org/ The average flow (both directions) at the M8 Harthill site was 56,312 vehicles per day. In contrast, the average daily flow at the A83 Ardrishaig site was around 2,165 vehicles. Traffic levels also vary considerably depending on the month: e.g. the A82 Spean Bridge site in March averaged around 651 vehicles per day – compared to 6,542 in August. (Table 5.6 & 5.7) 2.12 Some trunk road traffic flows are given in Table 5.7. The M8 Harthill was the busiest site from this sample, with an annual average of 56,312 vehicles per day in 2019. Its Monday-Friday average was 52,236 vehicles per day. The M8 Harthill had the highest Monday-Friday peak hourly flows at 3,579 vehicles in the morning and 4,180 vehicles in the evening. At the opposite end of the scale, the A83 Ardrishaig averaged 2,165 vehicles per day over the year as a whole and its Monday-Friday peak hourly flows were 258 in the morning and 285 in the afternoon. Both the M74 Junction 9 and the A75 Carsluith had the highest percentage of heavy goods vehicle traffic in 2019 at 23% for the week, followed by the A82 Spean Bridge (20%). (Table 5.7) Delays and Congestion 2.13 In previous editions of STS Table 5.8 estimated the time lost by traffic due to delays on trunk road routes monitored by Transport Scotland. This table is no longer being updated due to number of factors, including major changes to the network which would have required a substantial rework to the methodology. 2.14 The Scottish Household Survey provides estimates of delays attributed to congestion experienced by drivers (on the previous day). Between 2017 and 2019, 12.6% of journeys made as the driver of a car were said to be delayed due to traffic congestion. This figure is broadly comparable to congestion level peak in 2007 of around 14%. Short delays were more common than longer ones - 4% of car drivers’ journeys were delayed by around 5 minutes compared to 2% by 15 minutes and 3% by
90
ROAD TRAFFIC
20 minutes or longer. Weekday journeys were most likely to suffer congestion delays between 7 and 9 am and 4 and 6 pm (24-26% and 24-27% respectively). Fewer delays (7%) were experienced by people residing in remote small towns than those in accessible small towns (12%). (Tables 5.8 and 5.9) 2.15 These statistics no longer feature in Scotland’s National Indicator on driver congestion in their old form. More information on National Indicators can be found on the Scotland Performs website: http://www.gov.scot/About/Performance/scotPerforms/indicator/congestion 2.16 Delays experienced by bus users have fallen since 2008, though changes in recent years are not significant due to small sample sizes. (Table 5.9) Fuel Consumption 2.17 DECC estimates suggest that the traffic on Scotland's roads consumed just over 3 million tonnes of petrol and diesel in 2018. This figure includes fuel purchased outwith Scotland which is consumed in Scotland, and excludes fuel purchased in Scotland which is used outwith Scotland. It is estimated using information about average fuel consumption, vehicle emissions and traffic volumes - see Notes and Definitions section, page 252. 2.18 Petrol and diesel consumption has been rising since 2013. There has been a steady fall in petrol consumption in cars over the period and an increase in diesel cars, reflecting trends in vehicle propulsion shown in Chapter 1 i.e. increases in the proportion of diesel powered vehicles on the roads and reductions in petrol powered vehicles. (Table 5.10)
91
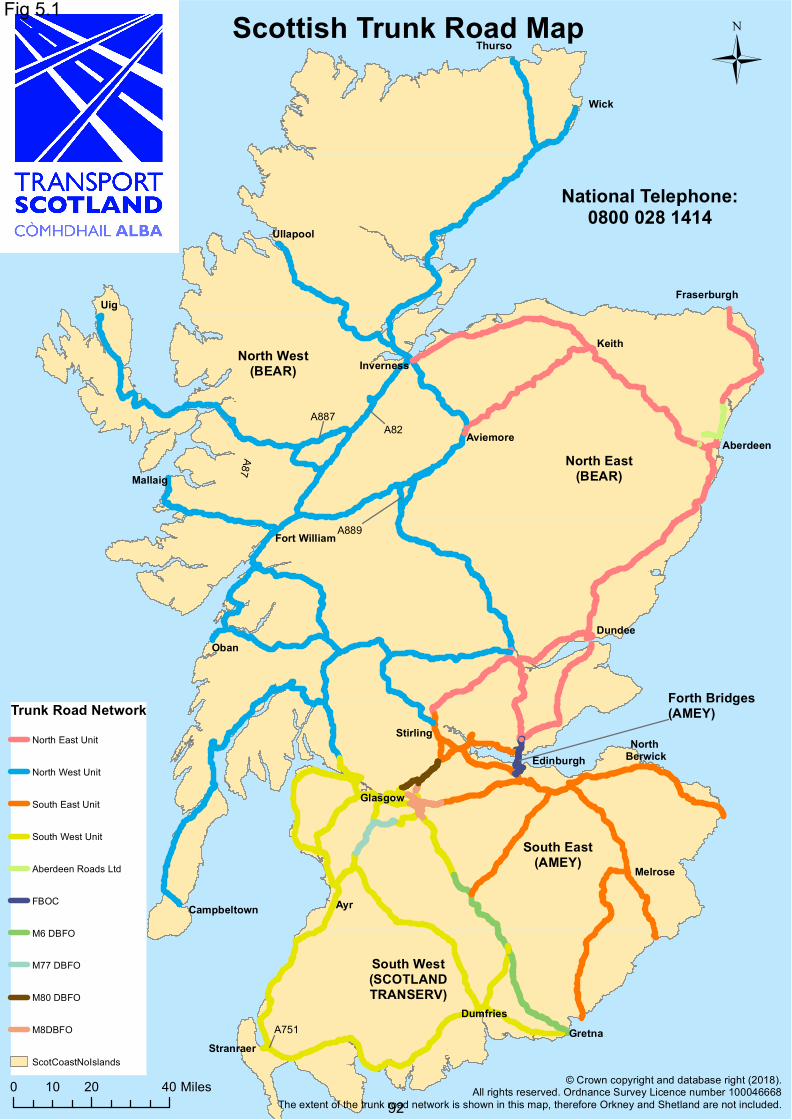
Wick
Ullapool
UigFraserburgh
Thurso
Oban
Mallaig
A87A889
A82
National Telephone:0800 028 1414
A751
A887
Forth Bridges(AMEY)
Aberdeen
Dundee
Fort William
Campbeltown
North Berwick
StranraerGretna
Ayr
Glasgow
Edinburgh
InvernessKeith
Aviemore
Dumfries
Stirling
Melrose
0 20 4010 Miles
Trunk Road NetworkNorth East Unit
North West Unit
South East Unit
South West Unit
Aberdeen Roads Ltd
FBOC
M6 DBFO
M77 DBFO
M80 DBFO
M8DBFO
ScotCoastNoIslands
Ü
North East(BEAR)
South West(SCOTLANDTRANSERV)
South East(AMEY)
North West(BEAR)
Scottish Trunk Road Map
© Crown copyright and database right (2018).All rights reserved. Ordnance Survey Licence number 100046668
The extent of the trunk road network is shown in this map, therefore Orkney and Shetland are not included.
Fig 5.1
92
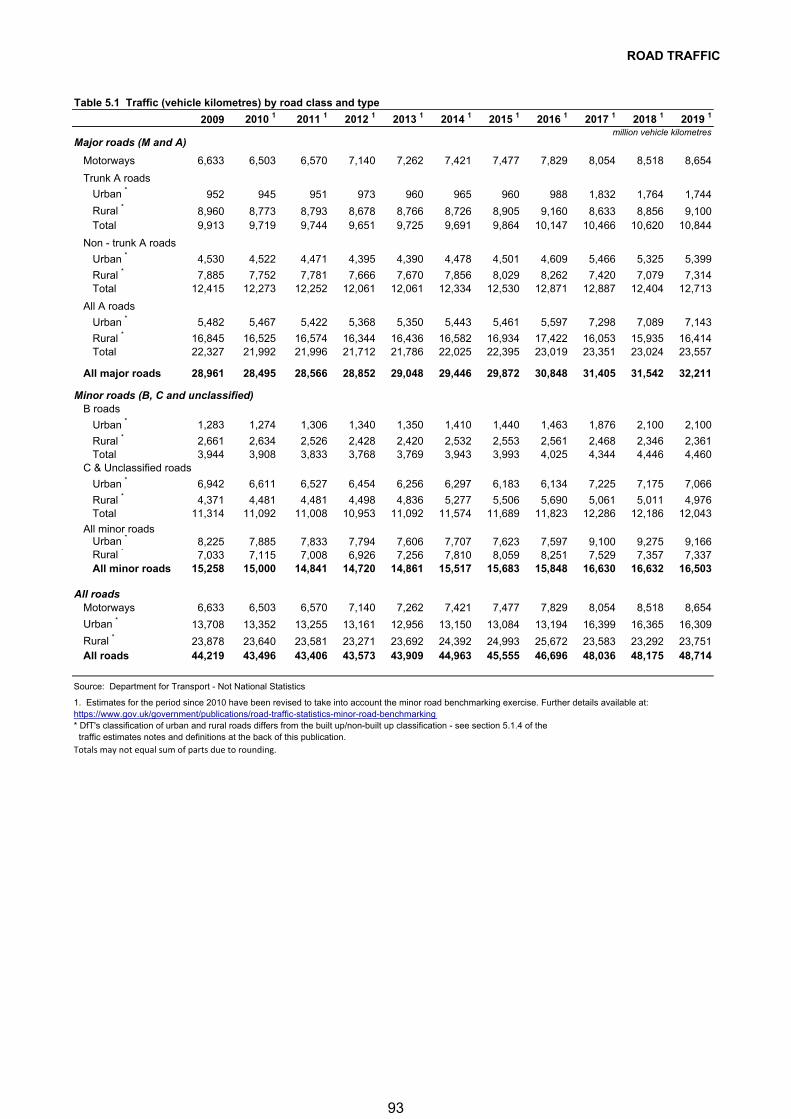
ROAD TRAFFIC
Table 5.1 Traffic (vehicle kilometres) by road class and type
2009 2010 1 2011 1 2012 1 2013 1 2014 1 2015 1 2016 1 2017 1 2018 1 2019 1
million vehicle kilometresMajor roads (M and A)
Motorways 6,633 6,503 6,570 7,140 7,262 7,421 7,477 7,829 8,054 8,518 8,654
Trunk A roads
Urban * 952 945 951 973 960 965 960 988 1,832 1,764 1,744
Rural * 8,960 8,773 8,793 8,678 8,766 8,726 8,905 9,160 8,633 8,856 9,100Total 9,913 9,719 9,744 9,651 9,725 9,691 9,864 10,147 10,466 10,620 10,844
Non - trunk A roads
Urban * 4,530 4,522 4,471 4,395 4,390 4,478 4,501 4,609 5,466 5,325 5,399
Rural * 7,885 7,752 7,781 7,666 7,670 7,856 8,029 8,262 7,420 7,079 7,314Total 12,415 12,273 12,252 12,061 12,061 12,334 12,530 12,871 12,887 12,404 12,713
All A roads
Urban * 5,482 5,467 5,422 5,368 5,350 5,443 5,461 5,597 7,298 7,089 7,143
Rural * 16,845 16,525 16,574 16,344 16,436 16,582 16,934 17,422 16,053 15,935 16,414Total 22,327 21,992 21,996 21,712 21,786 22,025 22,395 23,019 23,351 23,024 23,557
All major roads 28,961 28,495 28,566 28,852 29,048 29,446 29,872 30,848 31,405 31,542 32,211
Minor roads (B, C and unclassified)B roads
Urban * 1,283 1,274 1,306 1,340 1,350 1,410 1,440 1,463 1,876 2,100 2,100
Rural * 2,661 2,634 2,526 2,428 2,420 2,532 2,553 2,561 2,468 2,346 2,361Total 3,944 3,908 3,833 3,768 3,769 3,943 3,993 4,025 4,344 4,446 4,460
C & Unclassified roads
Urban * 6,942 6,611 6,527 6,454 6,256 6,297 6,183 6,134 7,225 7,175 7,066
Rural * 4,371 4,481 4,481 4,498 4,836 5,277 5,506 5,690 5,061 5,011 4,976Total 11,314 11,092 11,008 10,953 11,092 11,574 11,689 11,823 12,286 12,186 12,043
All minor roadsUrban * 8,225 7,885 7,833 7,794 7,606 7,707 7,623 7,597 9,100 9,275 9,166Rural * 7,033 7,115 7,008 6,926 7,256 7,810 8,059 8,251 7,529 7,357 7,337All minor roads 15,258 15,000 14,841 14,720 14,861 15,517 15,683 15,848 16,630 16,632 16,503
All roadsMotorways 6,633 6,503 6,570 7,140 7,262 7,421 7,477 7,829 8,054 8,518 8,654
Urban * 13,708 13,352 13,255 13,161 12,956 13,150 13,084 13,194 16,399 16,365 16,309
Rural * 23,878 23,640 23,581 23,271 23,692 24,392 24,993 25,672 23,583 23,292 23,751All roads 44,219 43,496 43,406 43,573 43,909 44,963 45,555 46,696 48,036 48,175 48,714
Source: Department for Transport - Not National Statistics
1. Estimates for the period since 2010 have been revised to take into account the minor road benchmarking exercise. Further details available at: https://www.gov.uk/government/publications/road-traffic-statistics-minor-road-benchmarking* DfT's classification of urban and rural roads differs from the built up/non-built up classification - see section 5.1.4 of the traffic estimates notes and definitions at the back of this publication.
Totals may not equal sum of parts due to rounding.
93
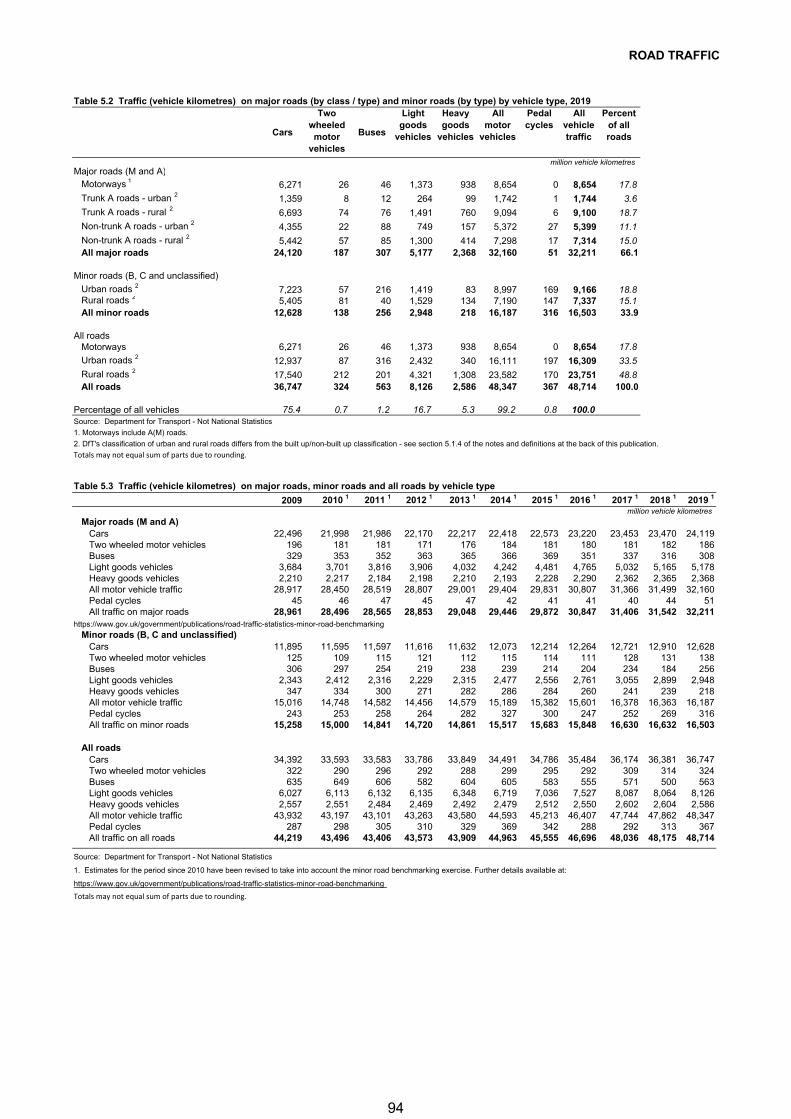
ROAD TRAFFIC
Table 5.2 Traffic (vehicle kilometres) on major roads (by class / type) and minor roads (by type) by vehicle type, 2019
Cars
Two wheeled motor
vehicles
Buses
Light goods
vehicles
Heavy goods
vehicles
All motor
vehicles
Pedal cycles
All vehicle traffic
Percent of all roads
million vehicle kilometresMajor roads (M and A)
Motorways 1 6,271 26 46 1,373 938 8,654 0 8,654 17.8
Trunk A roads - urban 2 1,359 8 12 264 99 1,742 1 1,744 3.6
Trunk A roads - rural 2 6,693 74 76 1,491 760 9,094 6 9,100 18.7
Non-trunk A roads - urban 2 4,355 22 88 749 157 5,372 27 5,399 11.1
Non-trunk A roads - rural 2 5,442 57 85 1,300 414 7,298 17 7,314 15.0All major roads 24,120 187 307 5,177 2,368 32,160 51 32,211 66.1
Minor roads (B, C and unclassified)
Urban roads 2 7,223 57 216 1,419 83 8,997 169 9,166 18.8Rural roads 2 5,405 81 40 1,529 134 7,190 147 7,337 15.1All minor roads 12,628 138 256 2,948 218 16,187 316 16,503 33.9
All roadsMotorways 6,271 26 46 1,373 938 8,654 0 8,654 17.8
Urban roads 2 12,937 87 316 2,432 340 16,111 197 16,309 33.5
Rural roads 2 17,540 212 201 4,321 1,308 23,582 170 23,751 48.8All roads 36,747 324 563 8,126 2,586 48,347 367 48,714 100.0
Percentage of all vehicles 75.4 0.7 1.2 16.7 5.3 99.2 0.8 100.0Source: Department for Transport - Not National Statistics
1. Motorways include A(M) roads.
2. DfT's classification of urban and rural roads differs from the built up/non-built up classification - see section 5.1.4 of the notes and definitions at the back of this publication.
Totals may not equal sum of parts due to rounding.
Table 5.3 Traffic (vehicle kilometres) on major roads, minor roads and all roads by vehicle type
2009 2010 1 2011 1 2012 1 2013 1 2014 1 2015 1 2016 1 2017 1 2018 1 2019 1
million vehicle kilometres
Major roads (M and A)Cars 22,496 21,998 21,986 22,170 22,217 22,418 22,573 23,220 23,453 23,470 24,119Two wheeled motor vehicles 196 181 181 171 176 184 181 180 181 182 186Buses 329 353 352 363 365 366 369 351 337 316 308Light goods vehicles 3,684 3,701 3,816 3,906 4,032 4,242 4,481 4,765 5,032 5,165 5,178Heavy goods vehicles 2,210 2,217 2,184 2,198 2,210 2,193 2,228 2,290 2,362 2,365 2,368All motor vehicle traffic 28,917 28,450 28,519 28,807 29,001 29,404 29,831 30,807 31,366 31,499 32,160Pedal cycles 45 46 47 45 47 42 41 41 40 44 51All traffic on major roads 28,961 28,496 28,565 28,853 29,048 29,446 29,872 30,847 31,406 31,542 32,211
https://www.gov.uk/government/publications/road-traffic-statistics-minor-road-benchmarking
Minor roads (B, C and unclassified)Cars 11,895 11,595 11,597 11,616 11,632 12,073 12,214 12,264 12,721 12,910 12,628Two wheeled motor vehicles 125 109 115 121 112 115 114 111 128 131 138Buses 306 297 254 219 238 239 214 204 234 184 256Light goods vehicles 2,343 2,412 2,316 2,229 2,315 2,477 2,556 2,761 3,055 2,899 2,948Heavy goods vehicles 347 334 300 271 282 286 284 260 241 239 218All motor vehicle traffic 15,016 14,748 14,582 14,456 14,579 15,189 15,382 15,601 16,378 16,363 16,187Pedal cycles 243 253 258 264 282 327 300 247 252 269 316All traffic on minor roads 15,258 15,000 14,841 14,720 14,861 15,517 15,683 15,848 16,630 16,632 16,503
All roadsCars 34,392 33,593 33,583 33,786 33,849 34,491 34,786 35,484 36,174 36,381 36,747Two wheeled motor vehicles 322 290 296 292 288 299 295 292 309 314 324Buses 635 649 606 582 604 605 583 555 571 500 563Light goods vehicles 6,027 6,113 6,132 6,135 6,348 6,719 7,036 7,527 8,087 8,064 8,126Heavy goods vehicles 2,557 2,551 2,484 2,469 2,492 2,479 2,512 2,550 2,602 2,604 2,586All motor vehicle traffic 43,932 43,197 43,101 43,263 43,580 44,593 45,213 46,407 47,744 47,862 48,347Pedal cycles 287 298 305 310 329 369 342 288 292 313 367All traffic on all roads 44,219 43,496 43,406 43,573 43,909 44,963 45,555 46,696 48,036 48,175 48,714
Source: Department for Transport - Not National Statistics
1. Estimates for the period since 2010 have been revised to take into account the minor road benchmarking exercise. Further details available at:
https://www.gov.uk/government/publications/road-traffic-statistics-minor-road-benchmarking
Totals may not equal sum of parts due to rounding.
94
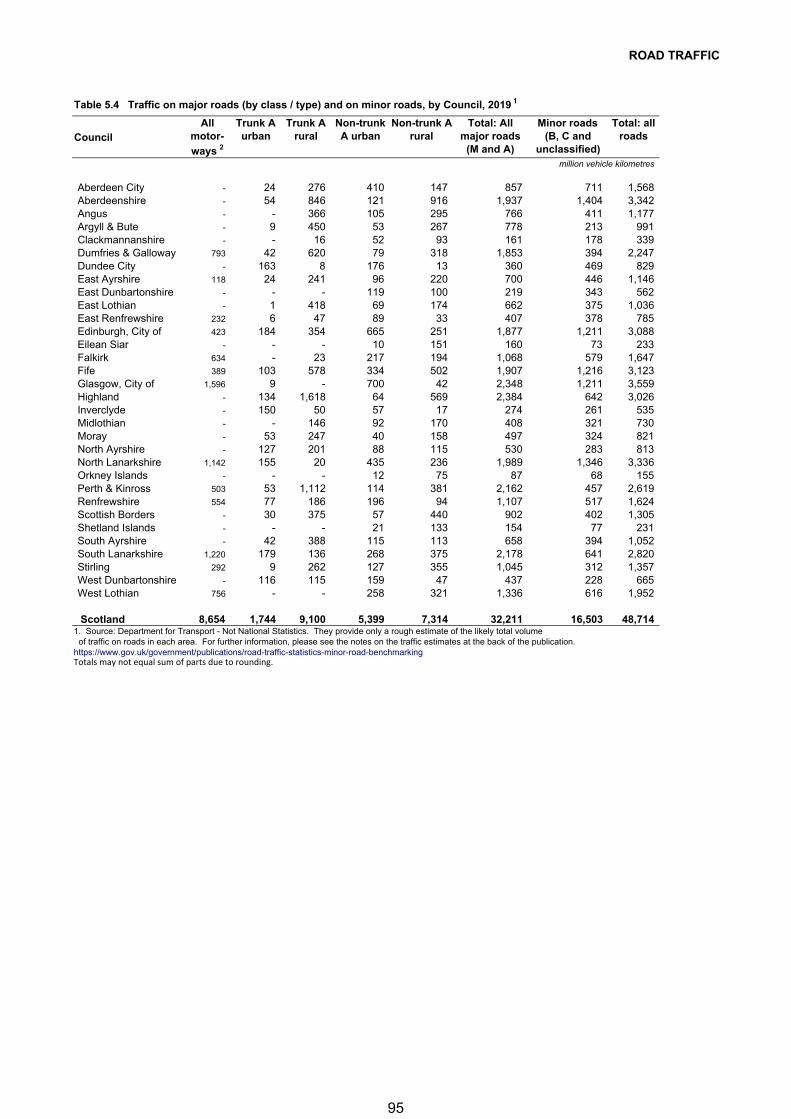
ROAD TRAFFIC
Table 5.4 Traffic on major roads (by class / type) and on minor roads, by Council, 2019 1
CouncilAll
motor-
ways 2
Trunk A urban
Trunk A rural
Non-trunk A urban
Non-trunk A rural
Total: All major roads
(M and A)
Minor roads (B, C and
unclassified)
Total: all roads
million vehicle kilometres
Aberdeen City - 24 276 410 147 857 711 1,568 Aberdeenshire - 54 846 121 916 1,937 1,404 3,342 Angus - - 366 105 295 766 411 1,177 Argyll & Bute - 9 450 53 267 778 213 991 Clackmannanshire - - 16 52 93 161 178 339 Dumfries & Galloway 793 42 620 79 318 1,853 394 2,247 Dundee City - 163 8 176 13 360 469 829 East Ayrshire 118 24 241 96 220 700 446 1,146 East Dunbartonshire - - - 119 100 219 343 562 East Lothian - 1 418 69 174 662 375 1,036 East Renfrewshire 232 6 47 89 33 407 378 785 Edinburgh, City of 423 184 354 665 251 1,877 1,211 3,088 Eilean Siar - - - 10 151 160 73 233 Falkirk 634 - 23 217 194 1,068 579 1,647 Fife 389 103 578 334 502 1,907 1,216 3,123 Glasgow, City of 1,596 9 - 700 42 2,348 1,211 3,559 Highland - 134 1,618 64 569 2,384 642 3,026 Inverclyde - 150 50 57 17 274 261 535 Midlothian - - 146 92 170 408 321 730 Moray - 53 247 40 158 497 324 821 North Ayrshire - 127 201 88 115 530 283 813 North Lanarkshire 1,142 155 20 435 236 1,989 1,346 3,336 Orkney Islands - - - 12 75 87 68 155 Perth & Kinross 503 53 1,112 114 381 2,162 457 2,619 Renfrewshire 554 77 186 196 94 1,107 517 1,624 Scottish Borders - 30 375 57 440 902 402 1,305 Shetland Islands - - - 21 133 154 77 231 South Ayrshire - 42 388 115 113 658 394 1,052 South Lanarkshire 1,220 179 136 268 375 2,178 641 2,820 Stirling 292 9 262 127 355 1,045 312 1,357 West Dunbartonshire - 116 115 159 47 437 228 665 West Lothian 756 - - 258 321 1,336 616 1,952
Scotland 8,654 1,744 9,100 5,399 7,314 32,211 16,503 48,714 1. Source: Department for Transport - Not National Statistics. They provide only a rough estimate of the likely total volume of traffic on roads in each area. For further information, please see the notes on the traffic estimates at the back of the publication.https://www.gov.uk/government/publications/road-traffic-statistics-minor-road-benchmarkingTotals may not equal sum of parts due to rounding.
95
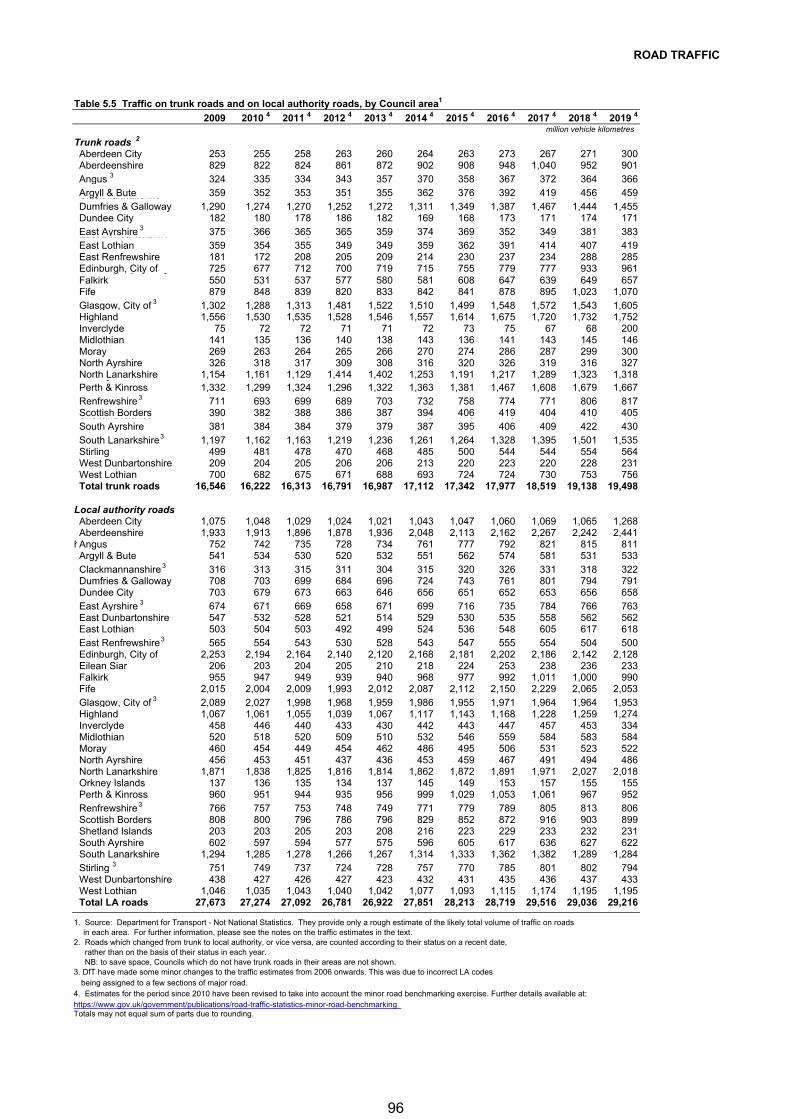
ROAD TRAFFIC
Table 5.5 Traffic on trunk roads and on local authority roads, by Council area 1
2009 2010 4 2011 4 2012 4 2013 4 2014 4 2015 4 2016 4 2017 4 2018 4 2019 4
million vehicle kilometres
Trunk roads 2
Aberdeen City 253 255 258 263 260 264 263 273 267 271 300Aberdeenshire 829 822 824 861 872 902 908 948 1,040 952 901Angus 3 324 335 334 343 357 370 358 367 372 364 366Argyll & Bute 359 352 353 351 355 362 376 392 419 456 459Clackmannanshire 0 0 0 0 0 0 0 0 16 16Dumfries & Galloway 1,290 1,274 1,270 1,252 1,272 1,311 1,349 1,387 1,467 1,444 1,455Dundee City 182 180 178 186 182 169 168 173 171 174 171East Ayrshire 3 375 366 365 365 359 374 369 352 349 381 383East Dunbartonshire 0 0 0 0 0 0 0 0 0 0East Lothian 359 354 355 349 349 359 362 391 414 407 419East Renfrewshire 181 172 208 205 209 214 230 237 234 288 285Edinburgh, City of 725 677 712 700 719 715 755 779 777 933 961( yFalkirk 550 531 537 577 580 581 608 647 639 649 657Fife 879 848 839 820 833 842 841 878 895 1,023 1,070Glasgow, City of 3 1,302 1,288 1,313 1,481 1,522 1,510 1,499 1,548 1,572 1,543 1,605Highland 1,556 1,530 1,535 1,528 1,546 1,557 1,614 1,675 1,720 1,732 1,752Inverclyde 75 72 72 71 71 72 73 75 67 68 200Midlothian 141 135 136 140 138 143 136 141 143 145 146Moray 269 263 264 265 266 270 274 286 287 299 300North Ayrshire 326 318 317 309 308 316 320 326 319 316 327North Lanarkshire 1,154 1,161 1,129 1,414 1,402 1,253 1,191 1,217 1,289 1,323 1,318yPerth & Kinross 1,332 1,299 1,324 1,296 1,322 1,363 1,381 1,467 1,608 1,679 1,667Renfrewshire 3 711 693 699 689 703 732 758 774 771 806 817Scottish Borders 390 382 388 386 387 394 406 419 404 410 405Shetland Islands 0 0 0 0 0 0 0 0 0 0South Ayrshire 381 384 384 379 379 387 395 406 409 422 430South Lanarkshire 3 1,197 1,162 1,163 1,219 1,236 1,261 1,264 1,328 1,395 1,501 1,535Stirling 499 481 478 470 468 485 500 544 544 554 564West Dunbartonshire 209 204 205 206 206 213 220 223 220 228 231West Lothian 700 682 675 671 688 693 724 724 730 753 756Total trunk roads 16,546 16,222 16,313 16,791 16,987 17,112 17,342 17,977 18,519 19,138 19,498
Local authority roadsAberdeen City 1,075 1,048 1,029 1,024 1,021 1,043 1,047 1,060 1,069 1,065 1,268Aberdeenshire 1,933 1,913 1,896 1,878 1,936 2,048 2,113 2,162 2,267 2,242 2,441
hAngus 752 742 735 728 734 761 777 792 821 815 811Argyll & Bute 541 534 530 520 532 551 562 574 581 531 533Clackmannanshire 3 316 313 315 311 304 315 320 326 331 318 322Dumfries & Galloway 708 703 699 684 696 724 743 761 801 794 791Dundee City 703 679 673 663 646 656 651 652 653 656 658East Ayrshire 3 674 671 669 658 671 699 716 735 784 766 763East Dunbartonshire 547 532 528 521 514 529 530 535 558 562 562East Lothian 503 504 503 492 499 524 536 548 605 617 618East Renfrewshire 3 565 554 543 530 528 543 547 555 554 504 500Edinburgh, City of 2,253 2,194 2,164 2,140 2,120 2,168 2,181 2,202 2,186 2,142 2,128Eilean Siar 206 203 204 205 210 218 224 253 238 236 233Falkirk 955 947 949 939 940 968 977 992 1,011 1,000 990Fife 2,015 2,004 2,009 1,993 2,012 2,087 2,112 2,150 2,229 2,065 2,053Glasgow, City of 3 2,089 2,027 1,998 1,968 1,959 1,986 1,955 1,971 1,964 1,964 1,953Highland 1,067 1,061 1,055 1,039 1,067 1,117 1,143 1,168 1,228 1,259 1,274Inverclyde 458 446 440 433 430 442 443 447 457 453 334Midlothian 520 518 520 509 510 532 546 559 584 583 584Moray 460 454 449 454 462 486 495 506 531 523 522North Ayrshire 456 453 451 437 436 453 459 467 491 494 486North Lanarkshire 1,871 1,838 1,825 1,816 1,814 1,862 1,872 1,891 1,971 2,027 2,018Orkney Islands 137 136 135 134 137 145 149 153 157 155 155Perth & Kinross 960 951 944 935 956 999 1,029 1,053 1,061 967 952Renfrewshire 3 766 757 753 748 749 771 779 789 805 813 806Scottish Borders 808 800 796 786 796 829 852 872 916 903 899Shetland Islands 203 203 205 203 208 216 223 229 233 232 231South Ayrshire 602 597 594 577 575 596 605 617 636 627 622South Lanarkshire 1,294 1,285 1,278 1,266 1,267 1,314 1,333 1,362 1,382 1,289 1,284Stirling 3 751 749 737 724 728 757 770 785 801 802 794West Dunbartonshire 438 427 426 427 423 432 431 435 436 437 433West Lothian 1,046 1,035 1,043 1,040 1,042 1,077 1,093 1,115 1,174 1,195 1,195Total LA roads 27,673 27,274 27,092 26,781 26,922 27,851 28,213 28,719 29,516 29,036 29,216
1. Source: Department for Transport - Not National Statistics. They provide only a rough estimate of the likely total volume of traffic on roads in each area. For further information, please see the notes on the traffic estimates in the text.
2. Roads which changed from trunk to local authority, or vice versa, are counted according to their status on a recent date, rather than on the basis of their status in each year. NB: to save space, Councils which do not have trunk roads in their areas are not shown.3. DfT have made some minor changes to the traffic estimates from 2006 onwards. This was due to incorrect LA codes
being assigned to a few sections of major road.4. Estimates for the period since 2010 have been revised to take into account the minor road benchmarking exercise. Further details available at: https://www.gov.uk/government/publications/road-traffic-statistics-minor-road-benchmarkingTotals may not equal sum of parts due to rounding.
96
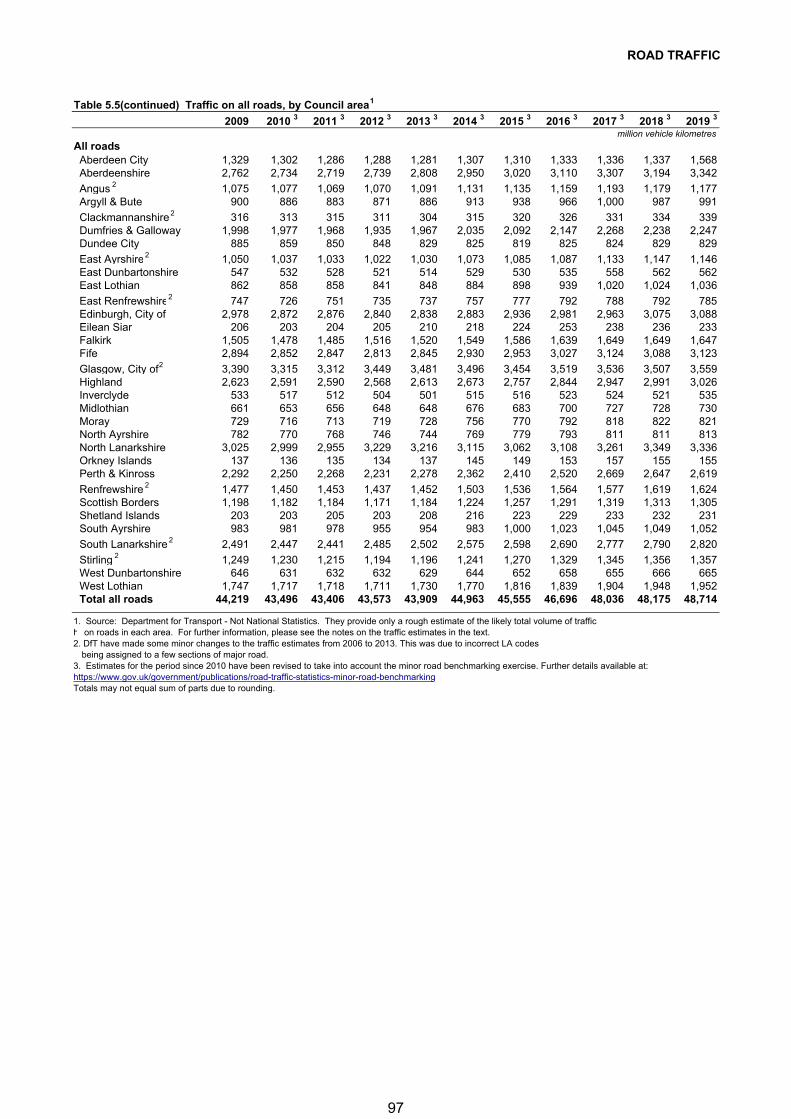
ROAD TRAFFIC
Table 5.5(continued) Traffic on all roads, by Council area 1
2009 2010 3 2011 3 2012 3 2013 3 2014 3 2015 3 2016 3 2017 3 2018 3 2019 3
million vehicle kilometres
All roadsAberdeen City 1,329 1,302 1,286 1,288 1,281 1,307 1,310 1,333 1,336 1,337 1,568Aberdeenshire 2,762 2,734 2,719 2,739 2,808 2,950 3,020 3,110 3,307 3,194 3,342
Angus 2 1,075 1,077 1,069 1,070 1,091 1,131 1,135 1,159 1,193 1,179 1,177Argyll & Bute 900 886 883 871 886 913 938 966 1,000 987 991
Clackmannanshire 2 316 313 315 311 304 315 320 326 331 334 339Dumfries & Galloway 1,998 1,977 1,968 1,935 1,967 2,035 2,092 2,147 2,268 2,238 2,247Dundee City 885 859 850 848 829 825 819 825 824 829 829
East Ayrshire 2 1,050 1,037 1,033 1,022 1,030 1,073 1,085 1,087 1,133 1,147 1,146East Dunbartonshire 547 532 528 521 514 529 530 535 558 562 562East Lothian 862 858 858 841 848 884 898 939 1,020 1,024 1,036
East Renfrewshire 2 747 726 751 735 737 757 777 792 788 792 785Edinburgh, City of 2,978 2,872 2,876 2,840 2,838 2,883 2,936 2,981 2,963 3,075 3,088Eilean Siar 206 203 204 205 210 218 224 253 238 236 233Falkirk 1,505 1,478 1,485 1,516 1,520 1,549 1,586 1,639 1,649 1,649 1,647Fife 2,894 2,852 2,847 2,813 2,845 2,930 2,953 3,027 3,124 3,088 3,123
Glasgow, City of 2 3,390 3,315 3,312 3,449 3,481 3,496 3,454 3,519 3,536 3,507 3,559Highland 2,623 2,591 2,590 2,568 2,613 2,673 2,757 2,844 2,947 2,991 3,026Inverclyde 533 517 512 504 501 515 516 523 524 521 535Midlothian 661 653 656 648 648 676 683 700 727 728 730Moray 729 716 713 719 728 756 770 792 818 822 821North Ayrshire 782 770 768 746 744 769 779 793 811 811 813North Lanarkshire 3,025 2,999 2,955 3,229 3,216 3,115 3,062 3,108 3,261 3,349 3,336Orkney Islands 137 136 135 134 137 145 149 153 157 155 155Perth & Kinross 2,292 2,250 2,268 2,231 2,278 2,362 2,410 2,520 2,669 2,647 2,619
Renfrewshire 2 1,477 1,450 1,453 1,437 1,452 1,503 1,536 1,564 1,577 1,619 1,624Scottish Borders 1,198 1,182 1,184 1,171 1,184 1,224 1,257 1,291 1,319 1,313 1,305Shetland Islands 203 203 205 203 208 216 223 229 233 232 231South Ayrshire 983 981 978 955 954 983 1,000 1,023 1,045 1,049 1,052
South Lanarkshire 2 2,491 2,447 2,441 2,485 2,502 2,575 2,598 2,690 2,777 2,790 2,820
Stirling 2 1,249 1,230 1,215 1,194 1,196 1,241 1,270 1,329 1,345 1,356 1,357West Dunbartonshire 646 631 632 632 629 644 652 658 655 666 665West Lothian 1,747 1,717 1,718 1,711 1,730 1,770 1,816 1,839 1,904 1,948 1,952Total all roads 44,219 43,496 43,406 43,573 43,909 44,963 45,555 46,696 48,036 48,175 48,714
1. Source: Department for Transport - Not National Statistics. They provide only a rough estimate of the likely total volume of traffich on roads in each area. For further information, please see the notes on the traffic estimates in the text.2. DfT have made some minor changes to the traffic estimates from 2006 to 2013. This was due to incorrect LA codes
being assigned to a few sections of major road.3. Estimates for the period since 2010 have been revised to take into account the minor road benchmarking exercise. Further details available at: https://www.gov.uk/government/publications/road-traffic-statistics-minor-road-benchmarkingTotals may not equal sum of parts due to rounding.
97
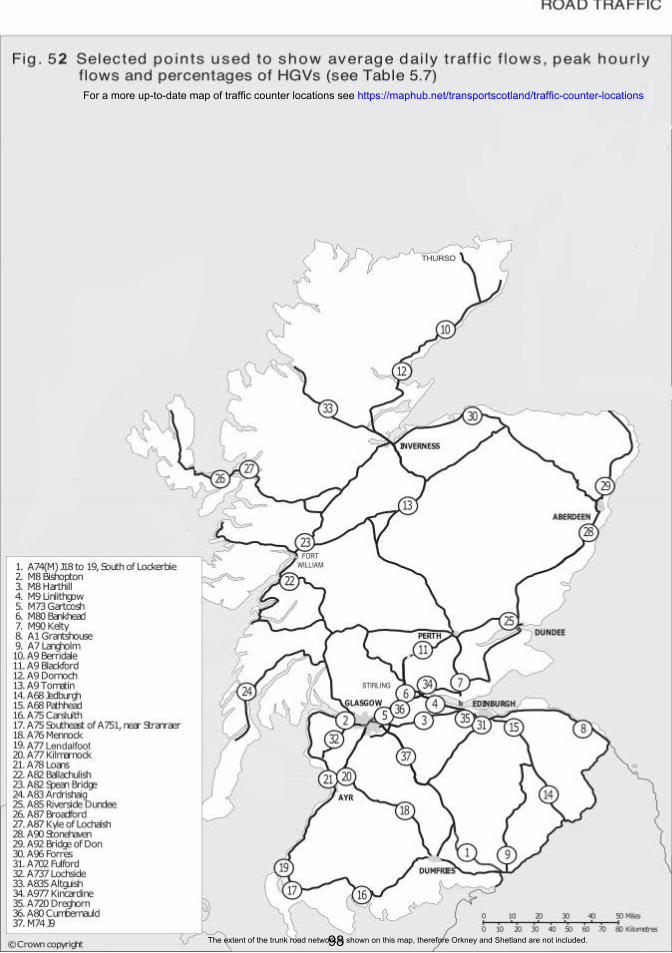
The extent of the trunk road network is shown on this map, therefore Orkney and Shetland are not included.
For a more up-to-date map of traffic counter locations see https://maphub.net/transportscotland/traffic-counter-locations
98
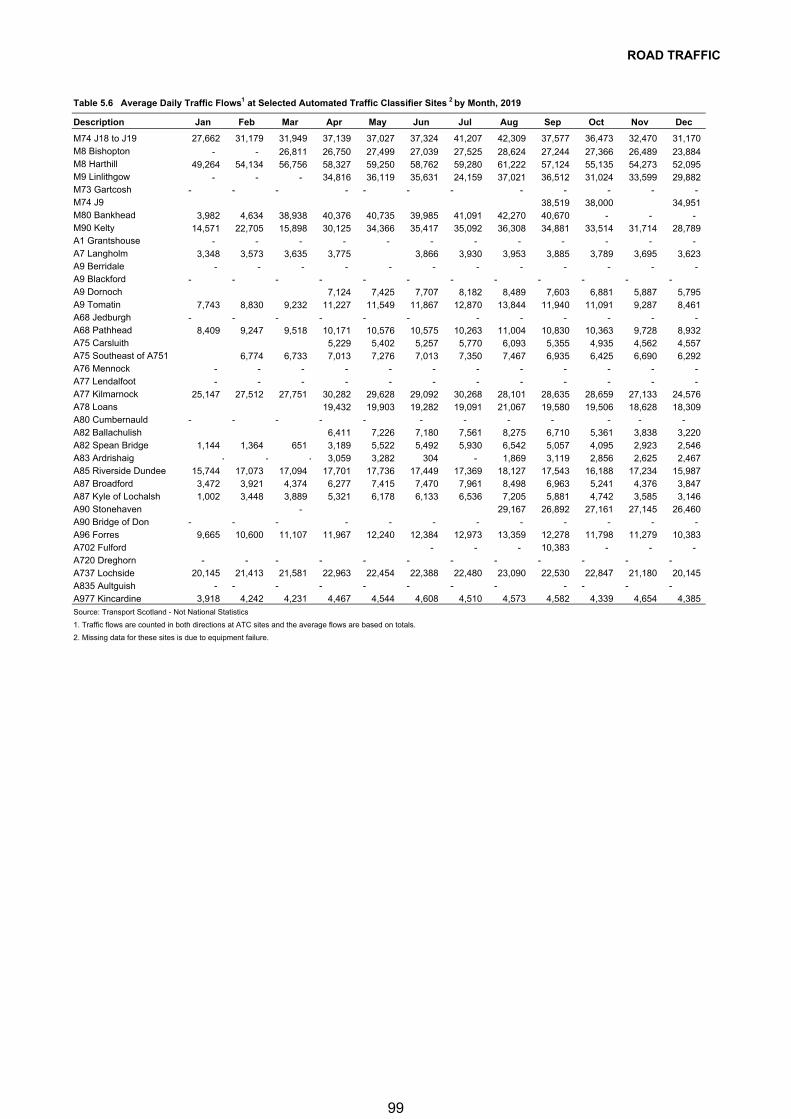
ROAD TRAFFIC
Table 5.6 Average Daily Traffic Flows1 at Selected Automated Traffic Classifier Sites 2 by Month, 2019
Description Jan Feb Mar Apr May Jun Jul Aug Sep Oct Nov Dec
27,662 31,179 31,949 37,139 37,027 37,324 41,207 42,309 37,577 36,473 32,470 31,170
- - 26,811 26,750 27,499 27,039 27,525 28,624 27,244 27,366 26,489 23,884 49,264 54,134 56,756 58,327 59,250 58,762 59,280 61,222 57,124 55,135 54,273 52,095
- - - 34,816 36,119 35,631 24,159 37,021 36,512 31,024 33,599 29,882 - - - - - - - - - - - -
38,519 38,000 34,951 3,982 4,634 38,938 40,376 40,735 39,985 41,091 42,270 40,670 - - -
14,571 22,705 15,898 30,125 34,366 35,417 35,092 36,308 34,881 33,514 31,714 28,789 - - - - - - - - - - - -
3,348 3,573 3,635 3,775 3,866 3,930 3,953 3,885 3,789 3,695 3,623 - - - - - - - - - - - -
- - - - - - - - - - - - 7,124 7,425 7,707 8,182 8,489 7,603 6,881 5,887 5,795
7,743 8,830 9,232 11,227 11,549 11,867 12,870 13,844 11,940 11,091 9,287 8,461 - - - - - - - - - - - -
8,409 9,247 9,518 10,171 10,576 10,575 10,263 11,004 10,830 10,363 9,728 8,932 5,229 5,402 5,257 5,770 6,093 5,355 4,935 4,562 4,557
6,774 6,733 7,013 7,276 7,013 7,350 7,467 6,935 6,425 6,690 6,292 - - - - - - - - - - - - - - - - - - - - - - - -
25,147 27,512 27,751 30,282 29,628 29,092 30,268 28,101 28,635 28,659 27,133 24,576 19,432 19,903 19,282 19,091 21,067 19,580 19,506 18,628 18,309
- - - - - - - - - - - - 6,411 7,226 7,180 7,561 8,275 6,710 5,361 3,838 3,220
1,144 1,364 651 3,189 5,522 5,492 5,930 6,542 5,057 4,095 2,923 2,546 - - - 3,059 3,282 304 - 1,869 3,119 2,856 2,625 2,467
15,744 17,073 17,094 17,701 17,736 17,449 17,369 18,127 17,543 16,188 17,234 15,987 3,472 3,921 4,374 6,277 7,415 7,470 7,961 8,498 6,963 5,241 4,376 3,847 1,002 3,448 3,889 5,321 6,178 6,133 6,536 7,205 5,881 4,742 3,585 3,146
- 29,167 26,892 27,161 27,145 26,460 - - - - - - - - - - - -
9,665 10,600 11,107 11,967 12,240 12,384 12,973 13,359 12,278 11,798 11,279 10,383 - - - 10,383 - - -
- - - - - - - - - - - - 20,145 21,413 21,581 22,963 22,454 22,388 22,480 23,090 22,530 22,847 21,180 20,145
- - - - - - - - - - - -
M74 J18 to J19M8 BishoptonM8 Harthill M9 LinlithgowM73 GartcoshM74 J9M80 BankheadM90 KeltyA1 GrantshouseA7 LangholmA9 BerridaleA9 BlackfordA9 DornochA9 TomatinA68 JedburghA68 Pathhead A75 CarsluithA75 Southeast of A751 A76 MennockA77 LendalfootA77 KilmarnockA78 LoansA80 Cumbernauld A82 BallachulishA82 Spean Bridge A83 ArdrishaigA85 Riverside Dundee A87 BroadfordA87 Kyle of Lochalsh A90 StonehavenA90 Bridge of Don A96 ForresA702 FulfordA720 DreghornA737 Lochside A835 AultguishA977 Kincardine 3,918 4,242 4,231 4,467 4,544 4,608 4,510 4,573 4,582 4,339 4,654 4,385 Source: Transport Scotland - Not National Statistics
1. Traffic flows are counted in both directions at ATC sites and the average flows are based on totals.
2. Missing data for these sites is due to equipment failure.
99
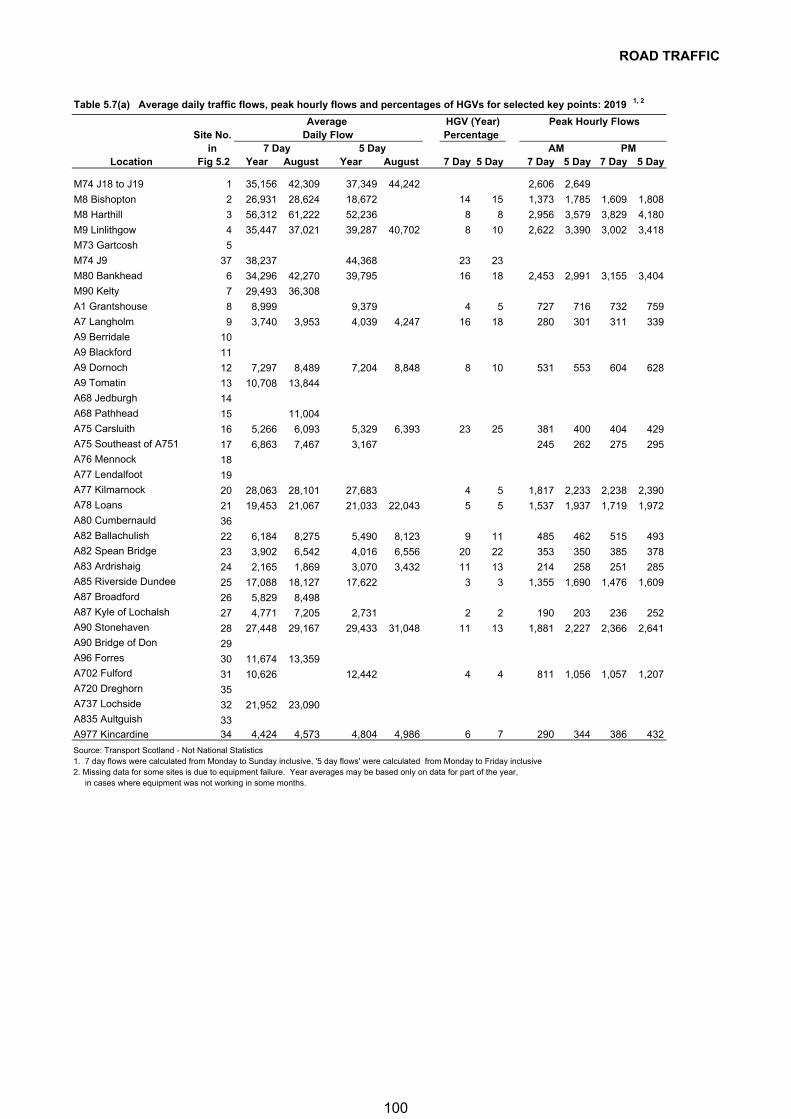
ROAD TRAFFIC
Table 5.7(a) Average daily traffic flows, peak hourly flows and percentages of HGVs for selected key points: 2019 1, 2
Site No.in
Location Fig 5.2 Year August Year August 7 Day 5 Day 7 Day 5 Day 7 Day 5 Day
1 35,156 42,309 37,349 44,242 2,606 2,649
2 26,931 28,624 18,672 14 15 1,373 1,785 1,609 1,808
3 56,312 61,222 52,236 8 8 2,956 3,579 3,829 4,180
4 35,447 37,021 39,287 40,702 8 10 2,622 3,390 3,002 3,418
5
37 38,237 44,368 23 23
6 34,296 42,270 39,795 16 18 2,453 2,991 3,155 3,404
7 29,493 36,308
8 8,999 9,379 4 5 727 716 732 759
9 3,740 3,953 4,039 4,247 16 18 280 301 311 339
10
11
12 7,297 8,489 7,204 8,848 8 10 531 553 604 628
13 10,708 13,844
14
15 11,004
16 5,266 6,093 5,329 6,393 23 25 381 400 404 429
17 6,863 7,467 3,167 245 262 275 295
18
19
20 28,063 28,101 27,683 4 5 1,817 2,233 2,238 2,390
21 19,453 21,067 21,033 22,043 5 5 1,537 1,937 1,719 1,972
36
22 6,184 8,275 5,490 8,123 9 11 485 462 515 493
23 3,902 6,542 4,016 6,556 20 22 353 350 385 378
24 2,165 1,869 3,070 3,432 11 13 214 258 251 285
25 17,088 18,127 17,622 3 3 1,355 1,690 1,476 1,609
26 5,829 8,498
27 4,771 7,205 2,731 2 2 190 203 236 252
28 27,448 29,167 29,433 31,048 11 13 1,881 2,227 2,366 2,641
29
30 11,674 13,359
31 10,626 12,442 4 4 811 1,056 1,057 1,207
35
32 21,952 23,090
33
M74 J18 to J19
M8 Bishopton
M8 Harthill
M9 Linlithgow
M73 Gartcosh
M74 J9
M80 Bankhead
M90 Kelty
A1 Grantshouse
A7 Langholm
A9 Berridale
A9 Blackford
A9 Dornoch
A9 Tomatin
A68 Jedburgh
A68 Pathhead
A75 Carsluith
A75 Southeast of A751 A76 Mennock
A77 Lendalfoot
A77 Kilmarnock
A78 Loans
A80 Cumbernauld
A82 Ballachulish
A82 Spean Bridge
A83 Ardrishaig
A85 Riverside Dundee A87 Broadford
A87 Kyle of Lochalsh A90 Stonehaven
A90 Bridge of Don
A96 Forres
A702 Fulford
A720 Dreghorn
A737 Lochside A835 Aultguish
A977 Kincardine 34 4,424 4,573 4,804 4,986 6 7 290 344 386 432
Source: Transport Scotland - Not National Statistics1. 7 day flows were calculated from Monday to Sunday inclusive, '5 day flows' were calculated from Monday to Friday inclusive2. Missing data for some sites is due to equipment failure. Year averages may be based only on data for part of the year,
in cases where equipment was not working in some months.
AM PM
Peak Hourly Flows
7 Day 5 Day
Average Daily Flow
HGV (Year)Percentage
100
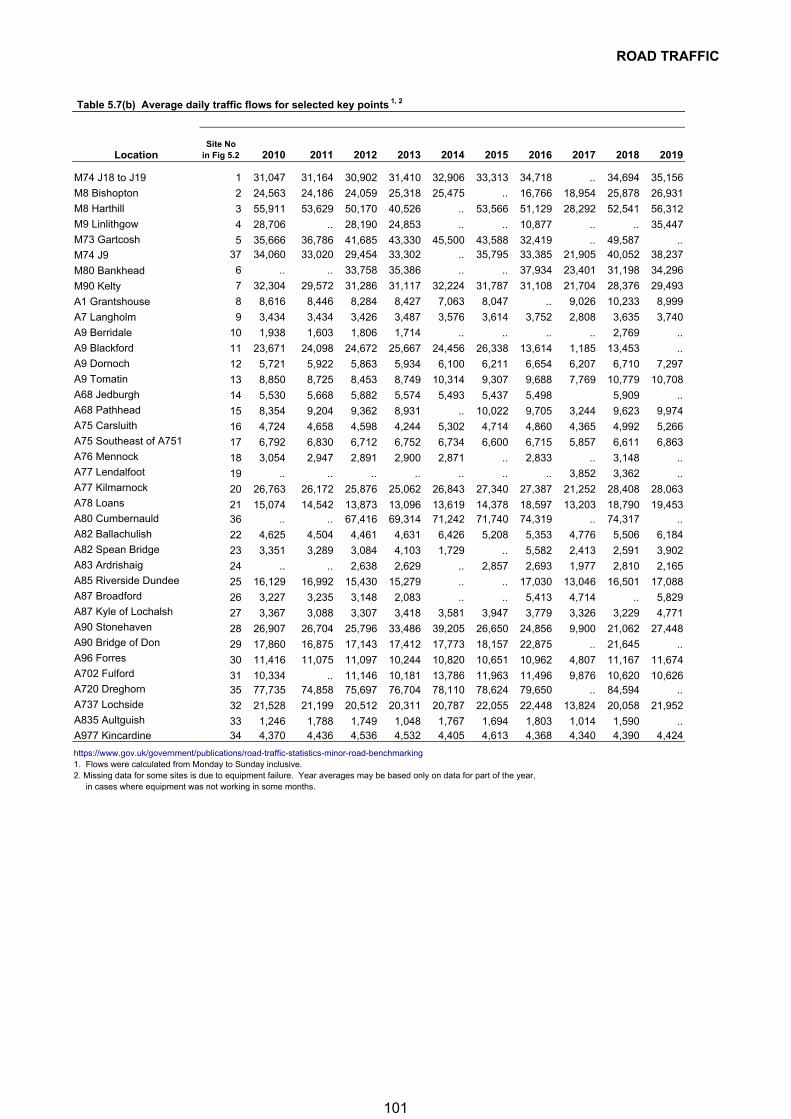
ROAD TRAFFIC
Table 5.7(b) Average daily traffic flows for selected key points 1, 2
LocationSite No
in Fig 5.2 2010 2011 2012 2013 2014 2015 2016 2017 2018 2019
1 31,047 31,164 30,902 31,410 32,906 33,313 34,718 .. 34,694 35,156
2 24,563 24,186 24,059 25,318 25,475 .. 16,766 18,954 25,878 26,931
3 55,911 53,629 50,170 40,526 .. 53,566 51,129 28,292 52,541 56,312
4 28,706 .. 28,190 24,853 .. .. 10,877 .. .. 35,447
5 35,666 36,786 41,685 43,330 45,500 43,588 32,419 .. 49,587 ..37 34,060 33,020 29,454 33,302 .. 35,795 33,385 21,905 40,052 38,237
6 .. .. 33,758 35,386 .. .. 37,934 23,401 31,198 34,296
7 32,304 29,572 31,286 31,117 32,224 31,787 31,108 21,704 28,376 29,493
8 8,616 8,446 8,284 8,427 7,063 8,047 .. 9,026 10,233 8,999
9 3,434 3,434 3,426 3,487 3,576 3,614 3,752 2,808 3,635 3,740
10 1,938 1,603 1,806 1,714 .. .. .. .. 2,769 ..
11 23,671 24,098 24,672 25,667 24,456 26,338 13,614 1,185 13,453 ..
12 5,721 5,922 5,863 5,934 6,100 6,211 6,654 6,207 6,710 7,297
13 8,850 8,725 8,453 8,749 10,314 9,307 9,688 7,769 10,779 10,708
14 5,530 5,668 5,882 5,574 5,493 5,437 5,498 5,909 ..
15 8,354 9,204 9,362 8,931 .. 10,022 9,705 3,244 9,623 9,974
16 4,724 4,658 4,598 4,244 5,302 4,714 4,860 4,365 4,992 5,266
17 6,792 6,830 6,712 6,752 6,734 6,600 6,715 5,857 6,611 6,863
18 3,054 2,947 2,891 2,900 2,871 .. 2,833 .. 3,148 ..
19 .. .. .. .. .. .. .. 3,852 3,362 ..
20 26,763 26,172 25,876 25,062 26,843 27,340 27,387 21,252 28,408 28,063
21 15,074 14,542 13,873 13,096 13,619 14,378 18,597 13,203 18,790 19,45336 .. .. 67,416 69,314 71,242 71,740 74,319 .. 74,317 ..
22 4,625 4,504 4,461 4,631 6,426 5,208 5,353 4,776 5,506 6,184
23 3,351 3,289 3,084 4,103 1,729 .. 5,582 2,413 2,591 3,902
24 .. .. 2,638 2,629 .. 2,857 2,693 1,977 2,810 2,165
25 16,129 16,992 15,430 15,279 .. .. 17,030 13,046 16,501 17,088
26 3,227 3,235 3,148 2,083 .. .. 5,413 4,714 .. 5,829
27 3,367 3,088 3,307 3,418 3,581 3,947 3,779 3,326 3,229 4,771
28 26,907 26,704 25,796 33,486 39,205 26,650 24,856 9,900 21,062 27,448
29 17,860 16,875 17,143 17,412 17,773 18,157 22,875 .. 21,645 ..
30 11,416 11,075 11,097 10,244 10,820 10,651 10,962 4,807 11,167 11,674
31 10,334 .. 11,146 10,181 13,786 11,963 11,496 9,876 10,620 10,62635 77,735 74,858 75,697 76,704 78,110 78,624 79,650 .. 84,594 ..
32 21,528 21,199 20,512 20,311 20,787 22,055 22,448 13,824 20,058 21,952
33 1,246 1,788 1,749 1,048 1,767 1,694 1,803 1,014 1,590 ..
M74 J18 to J19 M8 Bishopton
M8 Harthill
M9 Linlithgow
M73 Gartcosh
M74 J9
M80 Bankhead
M90 Kelty
A1 Grantshouse
A7 Langholm
A9 Berridale
A9 Blackford
A9 Dornoch
A9 Tomatin
A68 Jedburgh
A68 Pathhead
A75 Carsluith
A75 Southeast of A751 A76 Mennock
A77 Lendalfoot
A77 Kilmarnock
A78 Loans
A80 Cumbernauld A82 Ballachulish
A82 Spean Bridge A83 Ardrishaig
A85 Riverside Dundee A87 Broadford
A87 Kyle of Lochalsh A90 Stonehaven
A90 Bridge of Don A96 Forres
A702 Fulford
A720 Dreghorn
A737 Lochside
A835 Aultguish
A977 Kincardine 34 4,370 4,436 4,536 4,532 4,405 4,613 4,368 4,340 4,390 4,424
https://www.gov.uk/government/publications/road-traffic-statistics-minor-road-benchmarking1. Flows were calculated from Monday to Sunday inclusive.2. Missing data for some sites is due to equipment failure. Year averages may be based only on data for part of the year,
in cases where equipment was not working in some months.
101
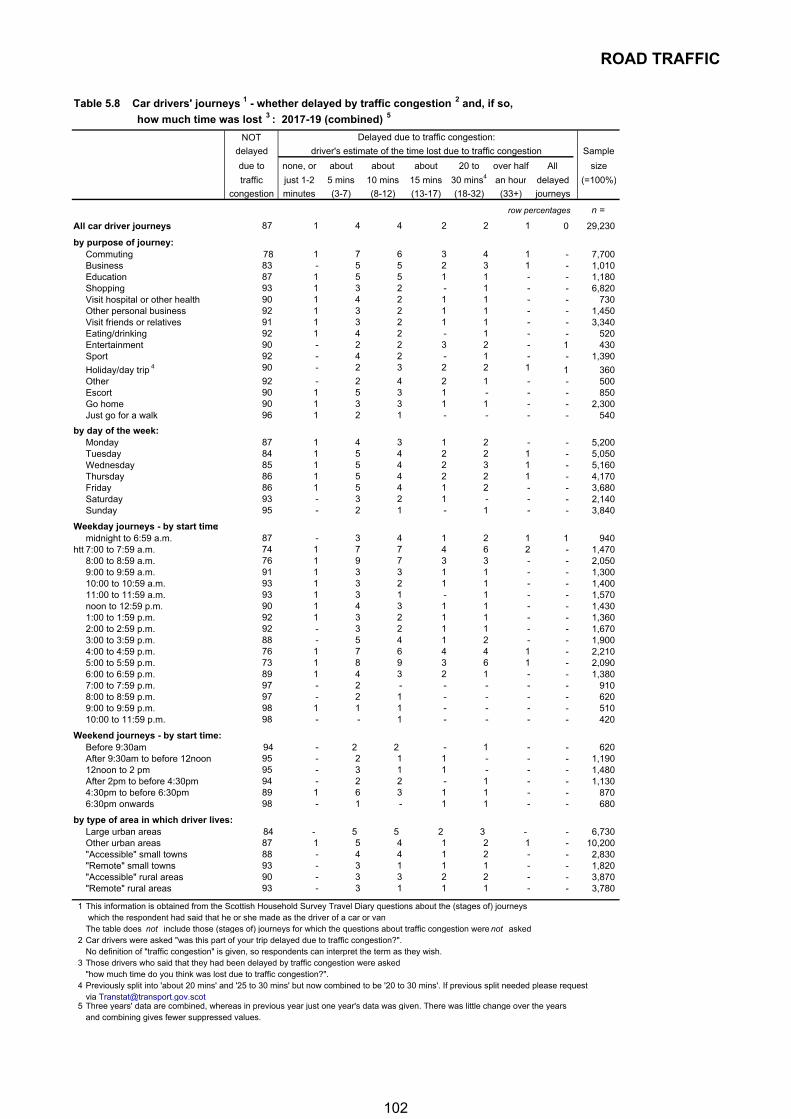
ROAD TRAFFIC
Table 5.8 Car drivers' journeys 1 - whether delayed by traffic congestion 2 and, if so,
how much time was lost 3 : 2017-19 (combined) 5
NOT
delayed Sample
due to none, or about about about 20 to over half All size
traffic just 1-2 5 mins 10 mins 15 mins 30 mins4 an hour delayed (=100%)
congestion minutes (3-7) (8-12) (13-17) (18-32) (33+) journeys
row percentages n =
All car driver journeys 87 1 4 4 2 2 1 0 29,230
by purpose of journey:Commuting 78 1 7 6 3 4 1 - 7,700 Business 83 - 5 5 2 3 1 - 1,010 Education 87 1 5 5 1 1 - - 1,180 Shopping 93 1 3 2 - 1 - - 6,820 Visit hospital or other health 90 1 4 2 1 1 - - 730 Other personal business 92 1 3 2 1 1 - - 1,450 Visit friends or relatives 91 1 3 2 1 1 - - 3,340 Eating/drinking 92 1 4 2 - 1 - - 520 Entertainment 90 - 2 2 3 2 - 1 430 Sport 92 - 4 2 - 1 - - 1,390
Holiday/day trip 4 90 - 2 3 2 2 1 1 360 Other 92 - 2 4 2 1 - - 500 Escort 90 1 5 3 1 - - - 850 Go home 90 1 3 3 1 1 - - 2,300 Just go for a walk 96 1 2 1 - - - - 540
by day of the week:Monday 87 1 4 3 1 2 - - 5,200 Tuesday 84 1 5 4 2 2 1 - 5,050 Wednesday 85 1 5 4 2 3 1 - 5,160 Thursday 86 1 5 4 2 2 1 - 4,170 Friday 86 1 5 4 1 2 - - 3,680 Saturday 93 - 3 2 1 - - - 2,140 Sunday 95 - 2 1 - 1 - - 3,840
Weekday journeys - by start time:midnight to 6:59 a.m. 87 - 3 4 1 2 1 1 940
htt 7:00 to 7:59 a.m. 74 1 7 7 4 6 2 - 1,470 8:00 to 8:59 a.m. 76 1 9 7 3 3 - - 2,050 9:00 to 9:59 a.m. 91 1 3 3 1 1 - - 1,300 10:00 to 10:59 a.m. 93 1 3 2 1 1 - - 1,400 11:00 to 11:59 a.m. 93 1 3 1 - 1 - - 1,570 noon to 12:59 p.m. 90 1 4 3 1 1 - - 1,430 1:00 to 1:59 p.m. 92 1 3 2 1 1 - - 1,360 2:00 to 2:59 p.m. 92 - 3 2 1 1 - - 1,670 3:00 to 3:59 p.m. 88 - 5 4 1 2 - - 1,900 4:00 to 4:59 p.m. 76 1 7 6 4 4 1 - 2,210 5:00 to 5:59 p.m. 73 1 8 9 3 6 1 - 2,090 6:00 to 6:59 p.m. 89 1 4 3 2 1 - - 1,380 7:00 to 7:59 p.m. 97 - 2 - - - - - 910 8:00 to 8:59 p.m. 97 - 2 1 - - - - 620 9:00 to 9:59 p.m. 98 1 1 1 - - - - 510 10:00 to 11:59 p.m. 98 - - 1 - - - - 420
Weekend journeys - by start time:Before 9:30am 94 - 2 2 - 1 - - 620 After 9:30am to before 12noon 95 - 2 1 1 - - - 1,190 12noon to 2 pm 95 - 3 1 1 - - - 1,480 After 2pm to before 4:30pm 94 - 2 2 - 1 - - 1,130 4:30pm to before 6:30pm 89 1 6 3 1 1 - - 870 6:30pm onwards 98 - 1 - 1 1 - - 680
by type of area in which driver lives:Large urban areas 84 - 5 5 2 3 - - 6,730 Other urban areas 87 1 5 4 1 2 1 - 10,200 "Accessible" small towns 88 - 4 4 1 2 - - 2,830 "Remote" small towns 93 - 3 1 1 1 - - 1,820 "Accessible" rural areas 90 - 3 3 2 2 - - 3,870 "Remote" rural areas 93 - 3 1 1 1 - - 3,780
1 This information is obtained from the Scottish Household Survey Travel Diary questions about the (stages of) journeys which the respondent had said that he or she made as the driver of a car or vanThe table does not include those (stages of) journeys for which the questions about traffic congestion were not asked
2 Car drivers were asked "was this part of your trip delayed due to traffic congestion?". No definition of "traffic congestion" is given, so respondents can interpret the term as they wish.
3 Those drivers who said that they had been delayed by traffic congestion were asked "how much time do you think was lost due to traffic congestion?".
4 Previously split into 'about 20 mins' and '25 to 30 mins' but now combined to be '20 to 30 mins'. If previous split needed please requestvia [email protected]
5 Three years' data are combined, whereas in previous year just one year's data was given. There was little change over the yearsand combining gives fewer suppressed values.
Delayed due to traffic congestion:
driver's estimate of the time lost due to traffic congestion
102
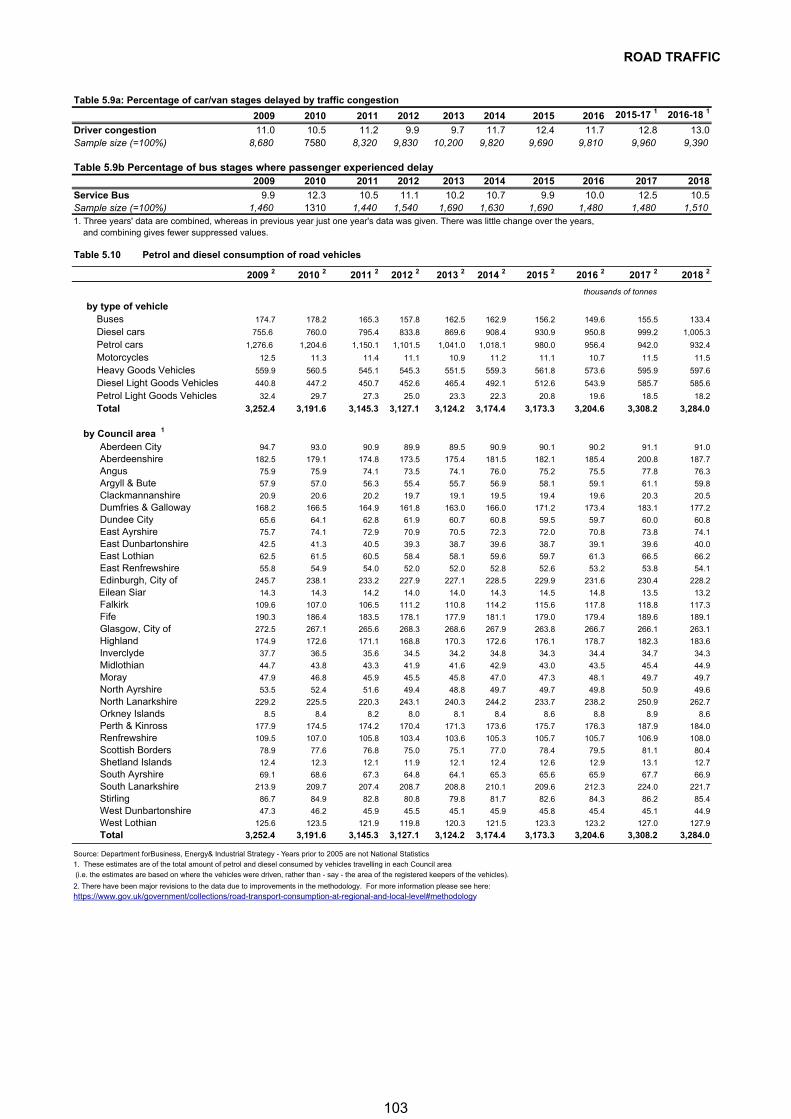
ROAD TRAFFIC
Table 5.9a: Percentage of car/van stages delayed by traffic congestion
2009 2010 2011 2012 2013 2014 2015 2016 2015-17 1 2016-18 1
Driver congestion 11.0 10.5 11.2 9.9 9.7 11.7 12.4 11.7 12.8 13.0Sample size (=100%) 8,680 7580 8,320 9,830 10,200 9,820 9,690 9,810 9,960 9,390
Table 5.9b Percentage of bus stages where passenger experienced delay2009 2010 2011 2012 2013 2014 2015 2016 2017 2018
Service Bus 9.9 12.3 10.5 11.1 10.2 10.7 9.9 10.0 12.5 10.5Sample size (=100%) 1,460 1310 1,440 1,540 1,690 1,630 1,690 1,480 1,480 1,5101. Three years' data are combined, whereas in previous year just one year's data was given. There was little change over the years,
and combining gives fewer suppressed values.
Table 5.10 Petrol and diesel consumption of road vehicles
2009 2 2010 2 2011 2 2012 2 2013 2 2014 2 2015 2 2016 2 2017 2 2018 2
thousands of tonnes
by type of vehicleBuses 174.7 178.2 165.3 157.8 162.5 162.9 156.2 149.6 155.5 133.4
Diesel cars 755.6 760.0 795.4 833.8 869.6 908.4 930.9 950.8 999.2 1,005.3
Petrol cars 1,276.6 1,204.6 1,150.1 1,101.5 1,041.0 1,018.1 980.0 956.4 942.0 932.4
Motorcycles 12.5 11.3 11.4 11.1 10.9 11.2 11.1 10.7 11.5 11.5
Heavy Goods Vehicles 559.9 560.5 545.1 545.3 551.5 559.3 561.8 573.6 595.9 597.6
Diesel Light Goods Vehicles 440.8 447.2 450.7 452.6 465.4 492.1 512.6 543.9 585.7 585.6
Petrol Light Goods Vehicles 32.4 29.7 27.3 25.0 23.3 22.3 20.8 19.6 18.5 18.2
Total 3,252.4 3,191.6 3,145.3 3,127.1 3,124.2 3,174.4 3,173.3 3,204.6 3,308.2 3,284.0
by Council area 1
Aberdeen City 94.7 93.0 90.9 89.9 89.5 90.9 90.1 90.2 91.1 91.0
Aberdeenshire 182.5 179.1 174.8 173.5 175.4 181.5 182.1 185.4 200.8 187.7
Angus 75.9 75.9 74.1 73.5 74.1 76.0 75.2 75.5 77.8 76.3
Argyll & Bute 57.9 57.0 56.3 55.4 55.7 56.9 58.1 59.1 61.1 59.8
Clackmannanshire 20.9 20.6 20.2 19.7 19.1 19.5 19.4 19.6 20.3 20.5
Dumfries & Galloway 168.2 166.5 164.9 161.8 163.0 166.0 171.2 173.4 183.1 177.2
Dundee City 65.6 64.1 62.8 61.9 60.7 60.8 59.5 59.7 60.0 60.8
East Ayrshire 75.7 74.1 72.9 70.9 70.5 72.3 72.0 70.8 73.8 74.1
East Dunbartonshire 42.5 41.3 40.5 39.3 38.7 39.6 38.7 39.1 39.6 40.0
East Lothian 62.5 61.5 60.5 58.4 58.1 59.6 59.7 61.3 66.5 66.2
East Renfrewshire 55.8 54.9 54.0 52.0 52.0 52.8 52.6 53.2 53.8 54.1
Edinburgh, City of 245.7 238.1 233.2 227.9 227.1 228.5 229.9 231.6 230.4 228.2
Eilean Siar 14.3 14.3 14.2 14.0 14.0 14.3 14.5 14.8 13.5 13.2
Falkirk 109.6 107.0 106.5 111.2 110.8 114.2 115.6 117.8 118.8 117.3
Fife 190.3 186.4 183.5 178.1 177.9 181.1 179.0 179.4 189.6 189.1
Glasgow, City of 272.5 267.1 265.6 268.3 268.6 267.9 263.8 266.7 266.1 263.1
Highland 174.9 172.6 171.1 168.8 170.3 172.6 176.1 178.7 182.3 183.6
Inverclyde 37.7 36.5 35.6 34.5 34.2 34.8 34.3 34.4 34.7 34.3
Midlothian 44.7 43.8 43.3 41.9 41.6 42.9 43.0 43.5 45.4 44.9
Moray 47.9 46.8 45.9 45.5 45.8 47.0 47.3 48.1 49.7 49.7
North Ayrshire 53.5 52.4 51.6 49.4 48.8 49.7 49.7 49.8 50.9 49.6
North Lanarkshire 229.2 225.5 220.3 243.1 240.3 244.2 233.7 238.2 250.9 262.7
Orkney Islands 8.5 8.4 8.2 8.0 8.1 8.4 8.6 8.8 8.9 8.6
Perth & Kinross 177.9 174.5 174.2 170.4 171.3 173.6 175.7 176.3 187.9 184.0
Renfrewshire 109.5 107.0 105.8 103.4 103.6 105.3 105.7 105.7 106.9 108.0
Scottish Borders 78.9 77.6 76.8 75.0 75.1 77.0 78.4 79.5 81.1 80.4
Shetland Islands 12.4 12.3 12.1 11.9 12.1 12.4 12.6 12.9 13.1 12.7
South Ayrshire 69.1 68.6 67.3 64.8 64.1 65.3 65.6 65.9 67.7 66.9
South Lanarkshire 213.9 209.7 207.4 208.7 208.8 210.1 209.6 212.3 224.0 221.7
Stirling 86.7 84.9 82.8 80.8 79.8 81.7 82.6 84.3 86.2 85.4
West Dunbartonshire 47.3 46.2 45.9 45.5 45.1 45.9 45.8 45.4 45.1 44.9
West Lothian 125.6 123.5 121.9 119.8 120.3 121.5 123.3 123.2 127.0 127.9
Total 3,252.4 3,191.6 3,145.3 3,127.1 3,124.2 3,174.4 3,173.3 3,204.6 3,308.2 3,284.0
Source: Department forBusiness, Energy& Industrial Strategy - Years prior to 2005 are not National Statistics
1. These estimates are of the total amount of petrol and diesel consumed by vehicles travelling in each Council area
(i.e. the estimates are based on where the vehicles were driven, rather than - say - the area of the registered keepers of the vehicles).
2. There have been major revisions to the data due to improvements in the methodology. For more information please see here:
https://www.gov.uk/government/collections/road-transport-consumption-at-regional-and-local-level#methodology
103
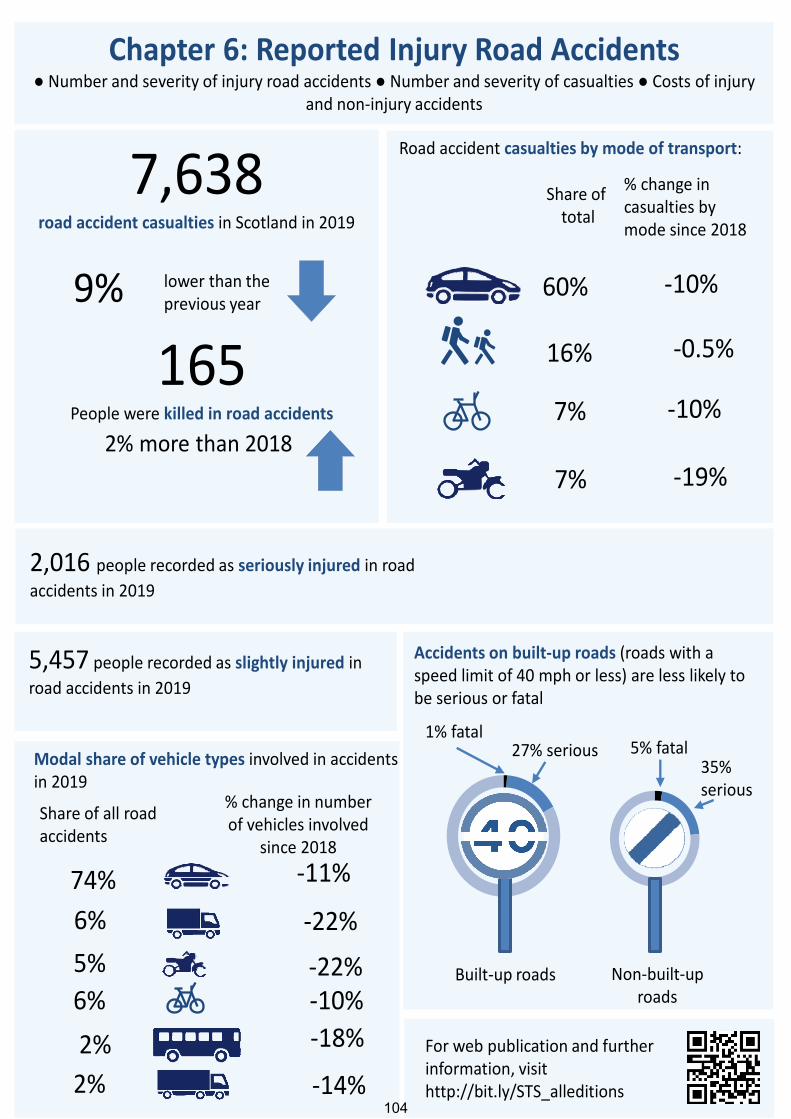
REPORTED INJURY ROAD ACCIDENTS
Chapter 6: Reported Injury Road Accidents● Number and severity of injury road accidents ● Number and severity of casualties ● Costs of injury
and non‐injury accidents
7,638road accident casualties in Scotland in 2019
9% lower than the previous year
2% more than 2018
2,016 people recorded as seriously injured in road accidents in 2019
Accidents on built-up roads (roads with a speed limit of 40 mph or less) are less likely to be serious or fatal
1% fatal27% serious 5% fatal
35% serious
Modal share of vehicle types involved in accidents in 2019
Share of all road accidents
% change in number of vehicles involved
since 2018
74%
2%
6%
2%
6%
5%
‐11%
‐18%
‐22%
‐14%
‐22%‐10%
Road accident casualties by mode of transport:
60%
16%
7%
7%
Share of total
% change in casualties by mode since 2018
‐10%
‐0.5%
‐19%
‐10%
5,457 people recorded as slightly injured in road accidents in 2019
165People were killed in road accidents
Built‐up roads Non‐built‐up roads
For web publication and further information, visithttp://bit.ly/STS_alleditions
104
REPORTED INJURY ROAD ACCIDENTS
REPORTED INJURY ROAD ACCIDENTS 1. Introduction 1.1 This chapter provides information on injury road accidents which were reported to the police, such as the number and severity of accidents, the police force area in which the accidents occurred, the types of vehicle involved, the number and severity of casualties resulting from the accidents, and the costs of injury and non-injury accidents. 1.2 During 2019 Police Scotland has started to use a new accident recording system. The introduction of this new system has changed the way casualty severity is recorded and, as a result, comparisons of the number of serious and slight casualties to earlier years should be made with caution. More information can be found in the Transport Scotland National Statistics publication Reported Road Casualties Scotland: http://bit.ly/2hi2pou. Key points
There were 165 people killed in road accidents in 2019, 4 (2%) more than the previous year.
There were 2,016 people recorded as seriously injured in road accidents in 2019.
Three quarters of casualties in 2019 were car users or pedestrians. Sixty per cent of casualties were car users and 16 per cent were pedestrians. Pedal cycles accounted for 8 per cent and Motorcycles for 7 per cent.
2. Main Points Accidents 2.1 There were 5,722 injury road accidents reported in 2019, 710 (11%) fewer than in 2018. The number of reported accidents has been falling over the past ten years, and in 2019 was 50% lower than in 2009; the lowest figure since current records began in 1970. There were 158 fatal accidents in 2019: 8 (5%) more than in 2018. The reported number of accidents in which someone was seriously injured, but no-one died was 1,729 and the number of reported slight accidents was 3,835. (Table 6.1) 2.2 In 2019, over one third of all reported injury road accidents (2,107: 37%) were on non-built up roads (speed limit of more than 40 m.p.h. - see Notes and Definitions section, page 225). However, such roads accounted for a higher proportion of fatal accidents (106: 67%), partly because speeds tend to be higher on non built-up roads than on built up roads. There was a smaller decrease in accidents on built-up roads (down by 10%) between 2018 and 2019 compared to a decrease in accidents on non built-up roads of 12%. (Table 6.1) 2.3 The long term trends in the number of injury road accidents reported between 2009 and 2019 varied between the Police Force divisions across Scotland, ranging from a 15% fall (Orkney Islands) to a 74% fall (Aberdeen City). The figures for an area may fluctuate from year to year, especially in smaller areas, although the trends appear to be downwards. (Table 6.2) 2.4 There were 10,071 vehicles involved in reported injury road accidents in 2019. Over three-quarters of them were cars (7,415: 74%); light goods vehicles were the next vehicle type most often involved in accidents (594: 6%), though pedal cycles are a similar proportion. (Table 6.3) Up until 2010, the number of motorcycles involved was
105
REPORTED INJURY ROAD ACCIDENTS
higher than the number of pedal cycles but since then there has been an increase in pedal cycle traffic. The number of vehicles involved in accidents should always be considered alongside the traffic estimates in Chapter 5. Casualties 2.5 165 people were killed in road accidents in 2019, 4 (2%) more than the previous year. This was 43% less than the 2004-08 average, the time period used as the baseline for Scotland’s Road Safety Framework to 2020. (Table 6.4) Further analysis of progress against the Road Safety Framework Targets can be found in article 1 of Reported Road Casualties Scotland 2018. 2.6 There were 2,016 people recorded as seriously injured in road accidents in 2019. 5,457 people were recorded as slightly injured in 2019. There were a total of 7,638 casualties in 2019, 786 (9%) lower than in 2018. (Table 6.4) 2.7 In the context of the total volume of traffic on the roads in Scotland, the 7,638 total casualties recorded represented 15.67 casualties per 100 million vehicle kilometres. The Road Safety Framework also monitors the numbers of slight injuries per 100 million vehicle kilometres. The 5,457 people who were recorded as slightly injured in 2019 represented 11.20 casualties per 100 million vehicle-kilometres. (Table 6.4) Child casualties 2.8 There were 763 reported child casualties in 2019, representing 10% of the total number of casualties of all ages. There were two child fatalities, 198 children were seriously injured, and 563 were classified as slightly injured. Due to the relatively small number of child fatalities, these are monitored using a three year average to remove the effect of year on year fluctuations. In the three years to 2019, there was an average of 2 child fatalities. (Table 6.4) Casualty Rates & Costs 2.9 Table 6.5 provides road casualty rates per thousand population by age group and mode of transport. Overall, there were 1.40 casualties per thousand population in 2019. The casualty rate for children (0-15 years) was 0.83 per thousand population. However, the child and young adult pedestrian casualty rates (0.36 and 0.27 per thousand population respectively) were much higher than the pedestrian casualty rate for adults (0.18). The total young persons' (16-24 years) casualty rate in 2019 was 2.24 per thousand population, just under twice the rate for all ages. The young persons' casualty rate in cars (1.57 per thousand population) was almost double the rate for adults aged 25-59 (which was 0.98 per thousand population). Further information about the mid-year population estimates used to calculate these rates can be found at the National Records of Scotland, here http://www.nrscotland.gov.uk/statistics-and-data/statistics/statistics-by-theme/population/population-estimates/mid-year-population-estimates (Table 6.5) 2.10 The cost of all road accidents (including damage only non-injury accidents) in 2019 is estimated at £1,127 million at 2019 prices. (Table 6.6)
106
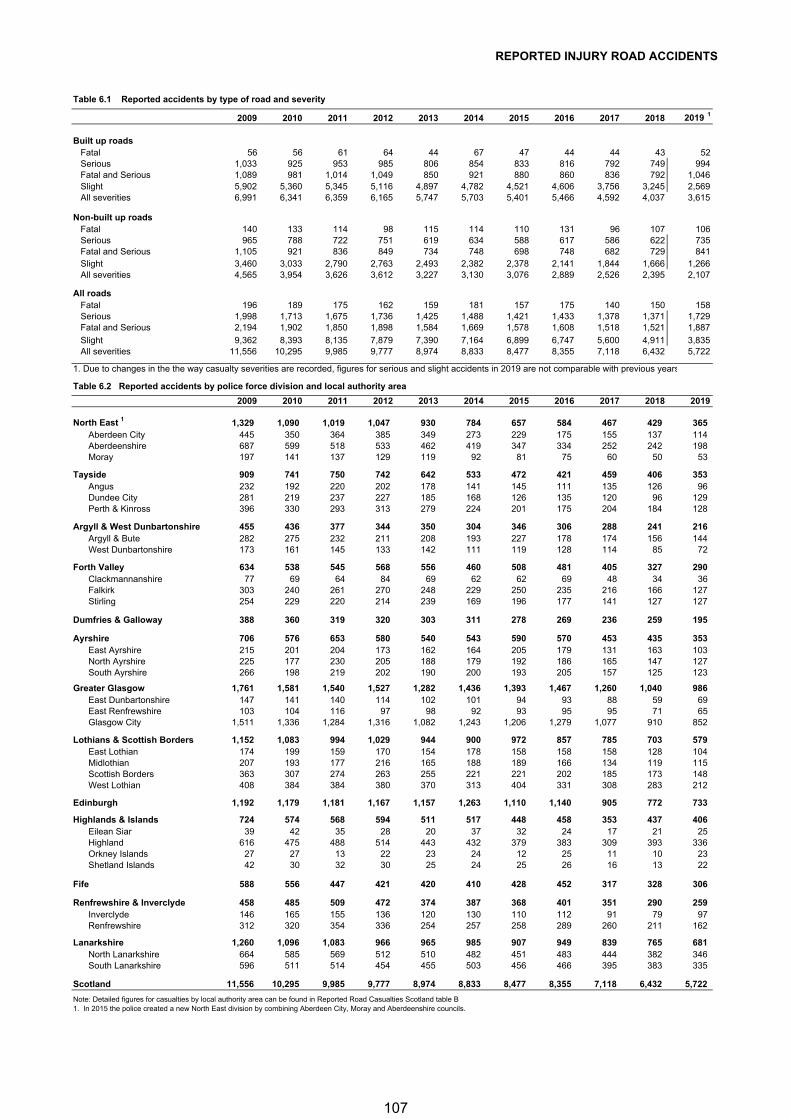
REPORTED INJURY ROAD ACCIDENTS
Table 6.1 Reported accidents by type of road and severity
2009 2010 2011 2012 2013 2014 2015 2016 2017 2018 2019 1
Built up roads Fatal 56 56 61 64 44 67 47 44 44 43 52 Serious 1,033 925 953 985 806 854 833 816 792 749 994 Fatal and Serious 1,089 981 1,014 1,049 850 921 880 860 836 792 1,046 Slight 5,902 5,360 5,345 5,116 4,897 4,782 4,521 4,606 3,756 3,245 2,569 All severities 6,991 6,341 6,359 6,165 5,747 5,703 5,401 5,466 4,592 4,037 3,615
Non-built up roads Fatal 140 133 114 98 115 114 110 131 96 107 106 Serious 965 788 722 751 619 634 588 617 586 622 735 Fatal and Serious 1,105 921 836 849 734 748 698 748 682 729 841 Slight 3,460 3,033 2,790 2,763 2,493 2,382 2,378 2,141 1,844 1,666 1,266 All severities 4,565 3,954 3,626 3,612 3,227 3,130 3,076 2,889 2,526 2,395 2,107
All roads Fatal 196 189 175 162 159 181 157 175 140 150 158 Serious 1,998 1,713 1,675 1,736 1,425 1,488 1,421 1,433 1,378 1,371 1,729 Fatal and Serious 2,194 1,902 1,850 1,898 1,584 1,669 1,578 1,608 1,518 1,521 1,887
Slight 9,362 8,393 8,135 7,879 7,390 7,164 6,899 6,747 5,600 4,911 3,835 All severities 11,556 10,295 9,985 9,777 8,974 8,833 8,477 8,355 7,118 6,432 5,722
1. Due to changes in the the way casualty severities are recorded, figures for serious and slight accidents in 2019 are not comparable with previous years
Table 6.2 Reported accidents by police force division and local authority area
2009 2010 2011 2012 2013 2014 2015 2016 2017 2018 2019
North East 1 1,329 1,090 1,019 1,047 930 784 657 584 467 429 365 Aberdeen City 445 350 364 385 349 273 229 175 155 137 114 Aberdeenshire 687 599 518 533 462 419 347 334 252 242 198 Moray 197 141 137 129 119 92 81 75 60 50 53
Tayside 909 741 750 742 642 533 472 421 459 406 353 Angus 232 192 220 202 178 141 145 111 135 126 96 Dundee City 281 219 237 227 185 168 126 135 120 96 129 Perth & Kinross 396 330 293 313 279 224 201 175 204 184 128
Argyll & West Dunbartonshire 455 436 377 344 350 304 346 306 288 241 216 Argyll & Bute 282 275 232 211 208 193 227 178 174 156 144 West Dunbartonshire 173 161 145 133 142 111 119 128 114 85 72
Forth Valley 634 538 545 568 556 460 508 481 405 327 290 Clackmannanshire 77 69 64 84 69 62 62 69 48 34 36 Falkirk 303 240 261 270 248 229 250 235 216 166 127 Stirling 254 229 220 214 239 169 196 177 141 127 127
Dumfries & Galloway 388 360 319 320 303 311 278 269 236 259 195
Ayrshire 706 576 653 580 540 543 590 570 453 435 353 East Ayrshire 215 201 204 173 162 164 205 179 131 163 103 North Ayrshire 225 177 230 205 188 179 192 186 165 147 127 South Ayrshire 266 198 219 202 190 200 193 205 157 125 123
Greater Glasgow 1,761 1,581 1,540 1,527 1,282 1,436 1,393 1,467 1,260 1,040 986 East Dunbartonshire 147 141 140 114 102 101 94 93 88 59 69 East Renfrewshire 103 104 116 97 98 92 93 95 95 71 65 Glasgow City 1,511 1,336 1,284 1,316 1,082 1,243 1,206 1,279 1,077 910 852
Lothians & Scottish Borders 1,152 1,083 994 1,029 944 900 972 857 785 703 579 East Lothian 174 199 159 170 154 178 158 158 158 128 104 Midlothian 207 193 177 216 165 188 189 166 134 119 115 Scottish Borders 363 307 274 263 255 221 221 202 185 173 148 West Lothian 408 384 384 380 370 313 404 331 308 283 212
Edinburgh 1,192 1,179 1,181 1,167 1,157 1,263 1,110 1,140 905 772 733
Highlands & Islands 724 574 568 594 511 517 448 458 353 437 406 Eilean Siar 39 42 35 28 20 37 32 24 17 21 25 Highland 616 475 488 514 443 432 379 383 309 393 336 Orkney Islands 27 27 13 22 23 24 12 25 11 10 23 Shetland Islands 42 30 32 30 25 24 25 26 16 13 22
Fife 588 556 447 421 420 410 428 452 317 328 306
Renfrewshire & Inverclyde 458 485 509 472 374 387 368 401 351 290 259 Inverclyde 146 165 155 136 120 130 110 112 91 79 97 Renfrewshire 312 320 354 336 254 257 258 289 260 211 162
Lanarkshire 1,260 1,096 1,083 966 965 985 907 949 839 765 681 North Lanarkshire 664 585 569 512 510 482 451 483 444 382 346 South Lanarkshire 596 511 514 454 455 503 456 466 395 383 335
Scotland 11,556 10,295 9,985 9,777 8,974 8,833 8,477 8,355 7,118 6,432 5,722
Note: Detailed figures for casualties by local authority area can be found in Reported Road Casualties Scotland table B1. In 2015 the police created a new North East division by combining Aberdeen City, Moray and Aberdeenshire councils.
107
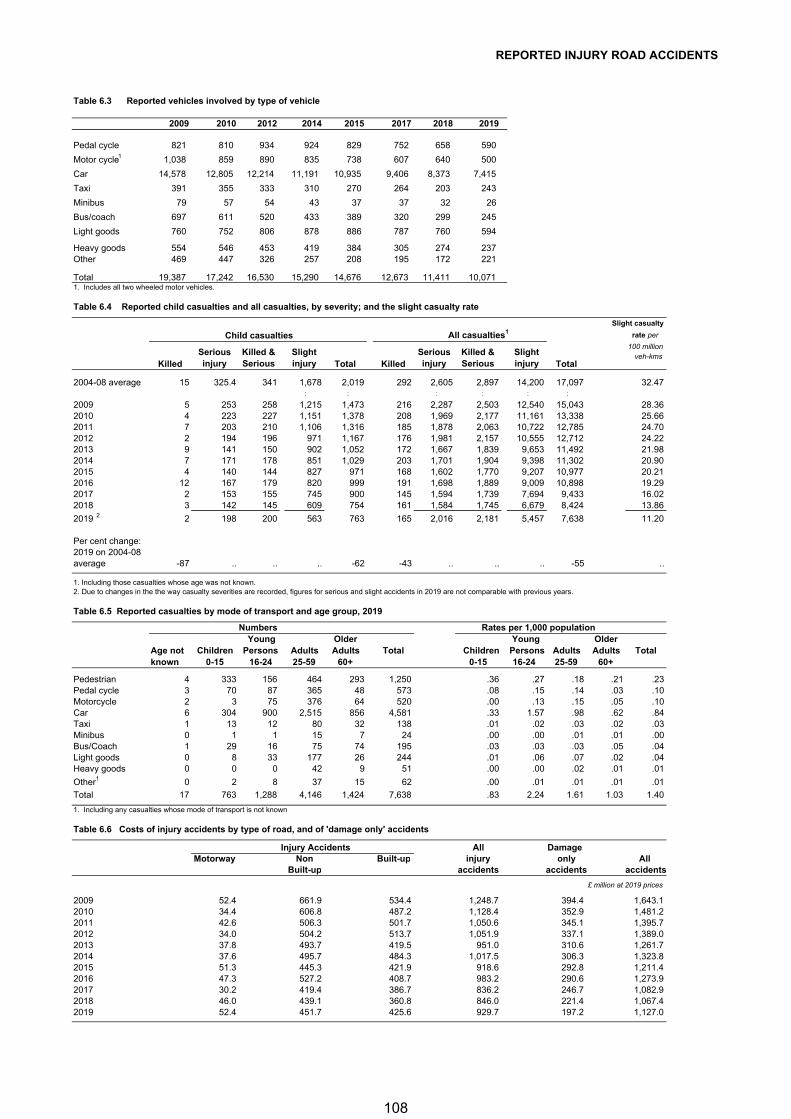
REPORTED INJURY ROAD ACCIDENTS
Table 6.3 Reported vehicles involved by type of vehicle
2009 2010 2012 2014 2015 2017 2018 2019
Pedal cycle 821 810 934 924 829 752 658 590
Motor cycle1 1,038 859 890 835 738 607 640 500
Car 14,578 12,805 12,214 11,191 10,935 9,406 8,373 7,415
Taxi 391 355 333 310 270 264 203 243
Minibus 79 57 54 43 37 37 32 26
Bus/coach 697 611 520 433 389 320 299 245
Light goods 760 752 806 878 886 787 760 594
Heavy goods 554 546 453 419 384 305 274 237 Other 469 447 326 257 208 195 172 221
Total 19,387 17,242 16,530 15,290 14,676 12,673 11,411 10,071 1. Includes all two wheeled motor vehicles.
Table 6.4 Reported child casualties and all casualties, by severity; and the slight casualty rate
Slight casualty
Child casualties All casualties1 rate per
KilledSerious injury
Killed & Serious
Slight injury Total Killed
Serious injury
Killed & Serious
Slight injury Total
100 million veh-kms
2004-08 average 15 325.4 341 1,678 2,019 292 2,605 2,897 14,200 17,097 32.47, , , , , ,, , , , , ,
2009 5 253 258 1,215 1,473 216 2,287 2,503 12,540 15,043 28.362010 4 223 227 1,151 1,378 208 1,969 2,177 11,161 13,338 25.662011 7 203 210 1,106 1,316 185 1,878 2,063 10,722 12,785 24.702012 2 194 196 971 1,167 176 1,981 2,157 10,555 12,712 24.222013 9 141 150 902 1,052 172 1,667 1,839 9,653 11,492 21.982014 7 171 178 851 1,029 203 1,701 1,904 9,398 11,302 20.902015 4 140 144 827 971 168 1,602 1,770 9,207 10,977 20.212016 12 167 179 820 999 191 1,698 1,889 9,009 10,898 19.292017 2 153 155 745 900 145 1,594 1,739 7,694 9,433 16.022018 3 142 145 609 754 161 1,584 1,745 6,679 8,424 13.86
2019 2 2 198 200 563 763 165 2,016 2,181 5,457 7,638 11.20
Per cent change:2019 on 2004-08average -87 .. .. .. -62 -43 .. .. .. -55 ..
1. Including those casualties whose age was not known.2. Due to changes in the the way casualty severities are recorded, figures for serious and slight accidents in 2019 are not comparable with previous years.
Table 6.5 Reported casualties by mode of transport and age group, 2019
Numbers Rates per 1,000 populationYoung Older Young Older
Age not Children Persons Adults Adults Total Children Persons Adults Adults Totalknown 0-15 16-24 25-59 60+ 0-15 16-24 25-59 60+
Pedestrian 4 333 156 464 293 1,250 .36 .27 .18 .21 .23Pedal cycle 3 70 87 365 48 573 .08 .15 .14 .03 .10Motorcycle 2 3 75 376 64 520 .00 .13 .15 .05 .10Car 6 304 900 2,515 856 4,581 .33 1.57 .98 .62 .84Taxi 1 13 12 80 32 138 .01 .02 .03 .02 .03Minibus 0 1 1 15 7 24 .00 .00 .01 .01 .00Bus/Coach 1 29 16 75 74 195 .03 .03 .03 .05 .04Light goods 0 8 33 177 26 244 .01 .06 .07 .02 .04Heavy goods 0 0 0 42 9 51 .00 .00 .02 .01 .01
Other1 0 2 8 37 15 62 .00 .01 .01 .01 .01
Total 17 763 1,288 4,146 1,424 7,638 .83 2.24 1.61 1.03 1.40
1. Including any casualties whose mode of transport is not known
Table 6.6 Costs of injury accidents by type of road, and of 'damage only' accidents
Injury Accidents All Damage Motorway Non Built-up injury only All
Built-up accidents accidents accidents
£ million at 2019 prices
2009 52.4 661.9 534.4 1,248.7 394.4 1,643.12010 34.4 606.8 487.2 1,128.4 352.9 1,481.22011 42.6 506.3 501.7 1,050.6 345.1 1,395.72012 34.0 504.2 513.7 1,051.9 337.1 1,389.02013 37.8 493.7 419.5 951.0 310.6 1,261.72014 37.6 495.7 484.3 1,017.5 306.3 1,323.82015 51.3 445.3 421.9 918.6 292.8 1,211.42016 47.3 527.2 408.7 983.2 290.6 1,273.92017 30.2 419.4 386.7 836.2 246.7 1,082.92018 46.0 439.1 360.8 846.0 221.4 1,067.42019 52.4 451.7 425.6 929.7 197.2 1,127.0
108

109
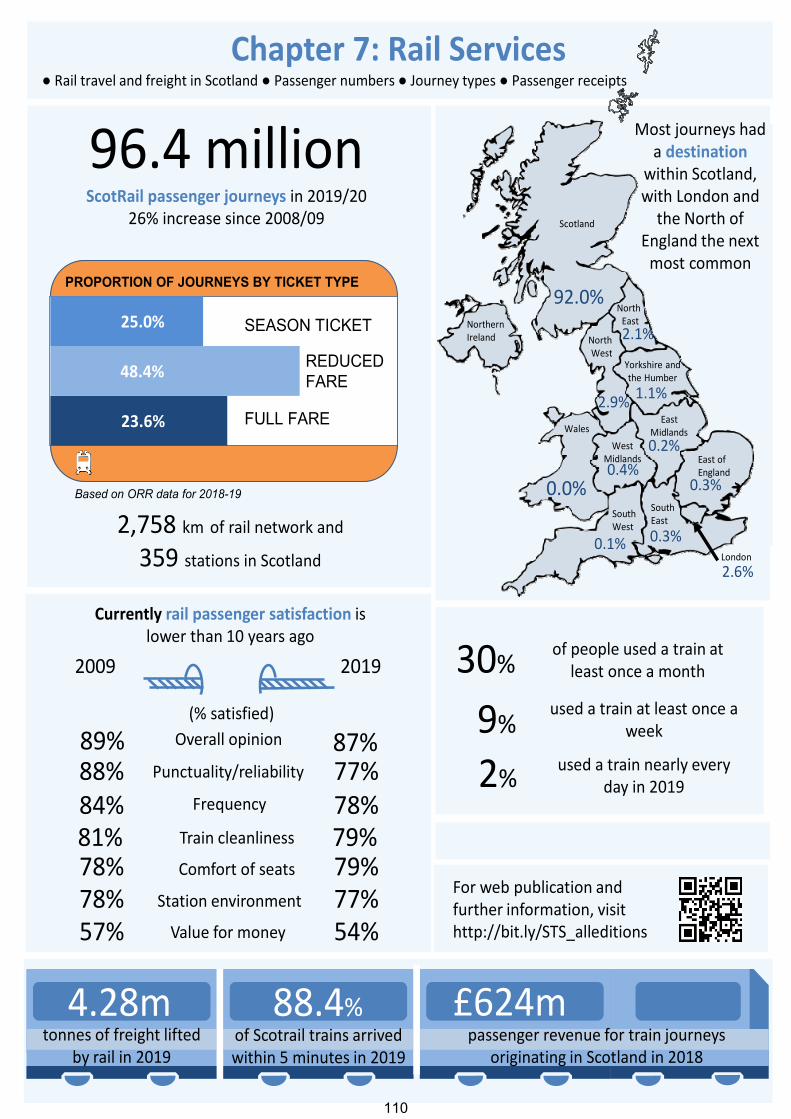
RAIL SERVICES
92.0%
0.0%
2.6%
2.9%
2.1%
0.3%
0.1%
0.4%
0.2%
1.1%
0.3%
Chapter 7: Rail Services● Rail travel and freight in Scotland ● Passenger numbers ● Journey types ● Passenger receipts
96.4 millionScotRail passenger journeys in 2019/20
26% increase since 2008/09
88.4% of Scotrail trains arrived within 5 minutes in 2019
Most journeys had a destination
within Scotland, with London and the North of
England the next most common
30% of people used a train at least once a month
4.28mtonnes of freight lifted
by rail in 2019
Currently rail passenger satisfaction is lower than 10 years ago
2009 2019
Overall opinion
Value for money
Station environment
Punctuality/reliability
Frequency
Train cleanliness
Comfort of seats
89% 87%
57% 54%78% 77%
88% 77%84% 78%81% 79%78% 79%
(% satisfied)
2,758 km of rail network and
359 stations in Scotland
used a train at least once a week
used a train nearly every day in 2019
9%
2%
passenger revenue for train journeys originating in Scotland in 2018
£624m
For web publication and further information, visithttp://bit.ly/STS_alleditions
Scotland
NorthEast
NorthWest
Yorkshire and the Humber
East MidlandsWales
Northern Ireland
West Midlands East of
England
South East
South West
London
FULL FARE
REDUCED FARE
SEASON TICKET
PROPORTION OF JOURNEYS BY TICKET TYPE
Based on ORR data for 2018-19
23.6%
48.4%
25.0%
110
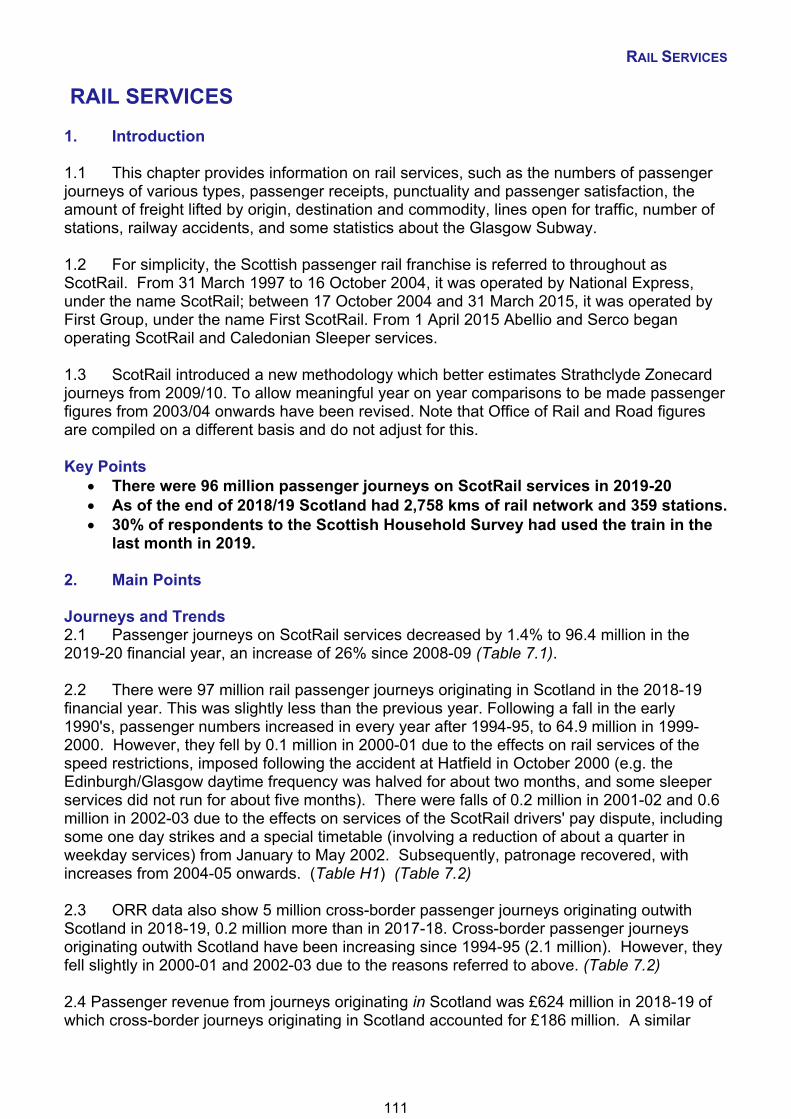
RAIL SERVICES
RAIL SERVICES 1. Introduction 1.1 This chapter provides information on rail services, such as the numbers of passenger journeys of various types, passenger receipts, punctuality and passenger satisfaction, the amount of freight lifted by origin, destination and commodity, lines open for traffic, number of stations, railway accidents, and some statistics about the Glasgow Subway. 1.2 For simplicity, the Scottish passenger rail franchise is referred to throughout as ScotRail. From 31 March 1997 to 16 October 2004, it was operated by National Express, under the name ScotRail; between 17 October 2004 and 31 March 2015, it was operated by First Group, under the name First ScotRail. From 1 April 2015 Abellio and Serco began operating ScotRail and Caledonian Sleeper services. 1.3 ScotRail introduced a new methodology which better estimates Strathclyde Zonecard journeys from 2009/10. To allow meaningful year on year comparisons to be made passenger figures from 2003/04 onwards have been revised. Note that Office of Rail and Road figures are compiled on a different basis and do not adjust for this. Key Points
There were 96 million passenger journeys on ScotRail services in 2019-20 As of the end of 2018/19 Scotland had 2,758 kms of rail network and 359 stations. 30% of respondents to the Scottish Household Survey had used the train in the
last month in 2019. 2. Main Points Journeys and Trends 2.1 Passenger journeys on ScotRail services decreased by 1.4% to 96.4 million in the 2019-20 financial year, an increase of 26% since 2008-09 (Table 7.1). 2.2 There were 97 million rail passenger journeys originating in Scotland in the 2018-19 financial year. This was slightly less than the previous year. Following a fall in the early 1990's, passenger numbers increased in every year after 1994-95, to 64.9 million in 1999-2000. However, they fell by 0.1 million in 2000-01 due to the effects on rail services of the speed restrictions, imposed following the accident at Hatfield in October 2000 (e.g. the Edinburgh/Glasgow daytime frequency was halved for about two months, and some sleeper services did not run for about five months). There were falls of 0.2 million in 2001-02 and 0.6 million in 2002-03 due to the effects on services of the ScotRail drivers' pay dispute, including some one day strikes and a special timetable (involving a reduction of about a quarter in weekday services) from January to May 2002. Subsequently, patronage recovered, with increases from 2004-05 onwards. (Table H1) (Table 7.2) 2.3 ORR data also show 5 million cross-border passenger journeys originating outwith Scotland in 2018-19, 0.2 million more than in 2017-18. Cross-border passenger journeys originating outwith Scotland have been increasing since 1994-95 (2.1 million). However, they fell slightly in 2000-01 and 2002-03 due to the reasons referred to above. (Table 7.2) 2.4 Passenger revenue from journeys originating in Scotland was £624 million in 2018-19 of which cross-border journeys originating in Scotland accounted for £186 million. A similar
111
RAIL SERVICES
amount (£186 million) of passenger revenue was generated from passenger journeys originating outwith Scotland and ending in Scotland. (Table 7.2) Journey Stages and Distances 2.5 Tables 7.4 to 7.8 show passenger journeys as recorded by ORR. Of the 102 million passenger journeys to/from/within Scotland and England in 2018-19, 90% were solely within Scotland. London, the North West and North East of England were the main origins/destinations of cross-border passenger journeys with around 2-3 million journeys each (Table 7.4). 2.6 In 2018-19, there were 92.3 million passenger journeys, wholly within Scotland. Forty per cent of start and end points were in Glasgow and 11% were in Edinburgh. There were almost 10 million cross border journeys starting or finishing in Scotland. Of these, 51% started or finished in Edinburgh and 27 per cent started or finished in Glasgow. (Table 7.6a and 7.6c) 2.7 Table 7.6c shows travel between Local Authorities in 2018-19. Of the journeys wholly within Scotland, 15 million (17%) start and finish in Glasgow. Almost seven million are made between Glasgow and North and South Lanarkshire. (Table 7.6c) Stations 2.8 In 2019-20, Glasgow Central was the busiest national rail station in Scotland, with 32 million passenger journeys. Edinburgh Waverley was used by 23 million passengers, Glasgow Queen Street by 17 million, Paisley Gilmour Street by 4 million, Haymarket by 3.0 million, Partick by 2.9 million, Aberdeen and Stirling by 2.5 million, Charing Cross by 2.2 million, Exhibition Centre Glasgow by 2.0 million and Dundee by 1.9 million. Including those already listed, there were 77 stations for which more than half a million passenger journeys each were recorded in the national ticketing system. (Table 7.7) 2.9 Of the stations in Scotland which have opened (or re-opened) since 1970, Exhibition Centre (1,959,600), Argyle Street (1,311,800), Bathgate (1,209,800), Livingston North (1,179,100), Edinburgh Park (905,200), Bridgeton (814,200), Anderston (715,100), Uphall (577,800) and Paisley Canal (478,200) had the largest passenger volumes in 2019-20. (Table 7.8) Punctuality and Service 2.10 In 2019-20, 88.4% of ScotRail services, 77.1% of London North Eastern Railway, 82.8% of Cross Country, 78.2% of Avanti West Coast and 80.6% of Caledonian Sleeper trains arrived on time. For all GB long-distance operators it was 81.4% and for all GB regional operators it was 84.1%. (Table 7.9) 2.11 In 2019-20, 94.8% of ScotRail trains arrived within 10 minutes of the scheduled arrival time, 1.6% arrived 20 or more minutes late, and 2.0% were cancelled. (Table 7.10) 2.12 In 2019, 87% of ScotRail passengers were either satisfied or said good when asked their opinion of their overall journey. The equivalent figure was 89% for non-ScotRail passengers whose journeys started in Scotland and 82% for all GB regional operators and 85% for all GB long-distance operators. The table shows ScotRail passengers’ ratings of 13 aspects of service: in 2019, there were 6 for which at least 75% of those surveyed were satisfied, or said good and 5 above 80%. (Table 7.11)
112
RAIL SERVICES
2.13 The Scottish Household Survey also collects data from Scottish households on satisfaction with rail services. In 2019, around 74-89% were satisfied with train services offered, their timeliness, cleanliness and frequency and ability to find out about tickets and routes. There were noticeable differences in those who felt safe on the train during the day and in the evening (day: 95%, evening: 76%). ‘Fares are good value’ had the lowest agreement rate for trains with 48% of respondents doing so. The question will be asked in alternate years from 2019. (Table 7.20) Rail Freight 2.14 In 2019-20, 4.3 million tonnes of freight was lifted in Scotland by rail, 4% less than the previous year. (Table 7.12) Railway Network 2.17 The total route length of the railway network in Scotland is 2,758 kilometres, of which 893 kilometres is electrified. These figures do not represent the total length of railway track: a kilometre of single-track and a kilometre of double-track both count as one kilometre of route length. (Table 7.14) 2.18 The number of passenger stations has increased from 340 in 2003-04 to 359 in 2018-19. (Table 7.15) 2.19 The local authorities which had the largest numbers of stations located in their areas in 2018-19 were Glasgow (61) and Highland (59). Since the completion of the Borders Railway Project in 2015 there are now 4 stations in the Midlothian and 3 in the Scottish Borders council areas, see here for more information http://bit.ly/2soymEn (Table 7.16) Subway 2.20 On the Glasgow Subway, the number of passenger journeys decreased by 3 per cent between 2018-19 and 2019-20. Passenger receipts (excluding other revenue) were £20.2 million in 2019-20, 1% more in cash terms, but 1% less in real terms, than in the previous year. (Table 7.17) Accidents 2.21 The number of railway accidents decreased from 46 to 32 in 2019. Injuries from accidents on trains increased from 230 to 324 between 2018 and 2019. Injuries from train accidents in stations increased from 465 in 2018 to 609 in 2019. The total number of deaths fell from 23 to 19 between 2018 and 2019. The overall number of injuries relating to railways rose from 908 in 2018 to 1,145 in 2019. (Table 7.18) 2.22 There was 1 death attributed to a trespasser and 16 to suicides in 2019. (Table 7.19)
113

114
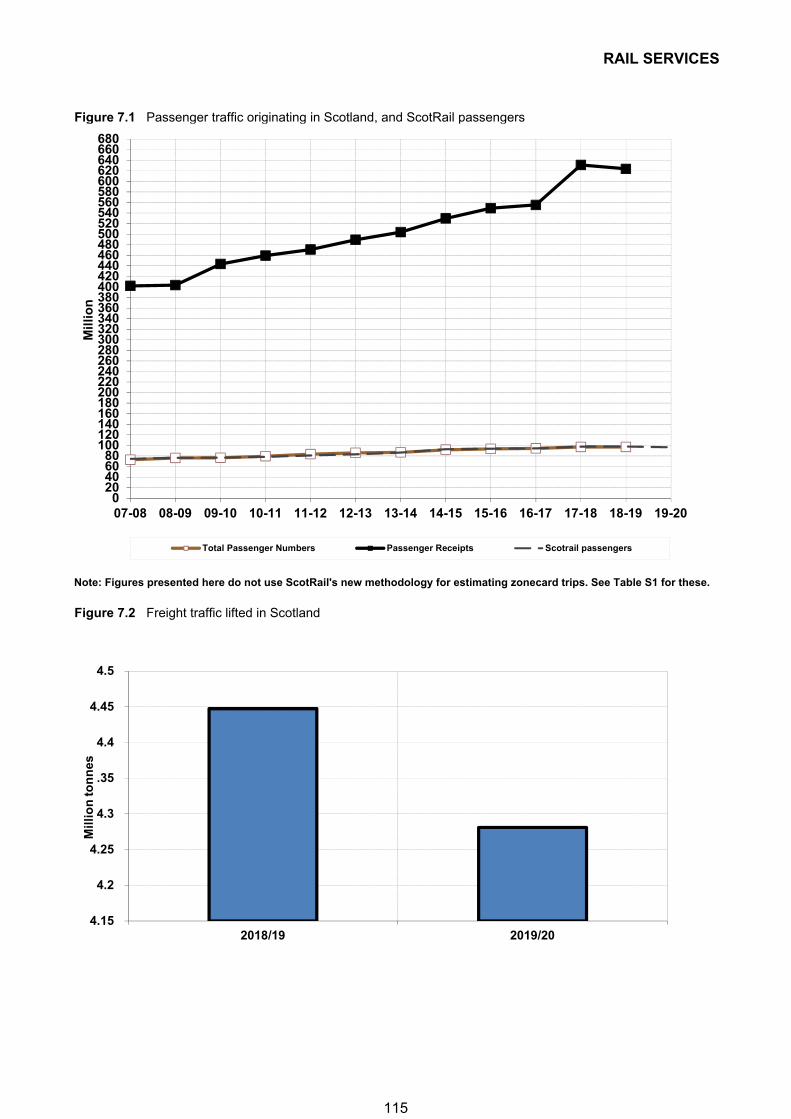
RAIL SERVICES
Figure 7.1 Passenger traffic originating in Scotland, and ScotRail passengers
Note: Figures presented here do not use ScotRail's new methodology for estimating zonecard trips. See Table S1 for these.
Figure 7.2 Freight traffic lifted in Scotland
020406080
100120140160180200220240260280300320340360380400420440460480500520540560580600620640660680
07-08 08-09 09-10 10-11 11-12 12-13 13-14 14-15 15-16 16-17 17-18 18-19 19-20
Mil
lio
n
Total Passenger Numbers Passenger Receipts Scotrail passengers
4.15
4.2
4.25
4.3
4.35
4.4
4.45
4.5
2018/19 2019/20
Mil
lio
n t
on
nes
115
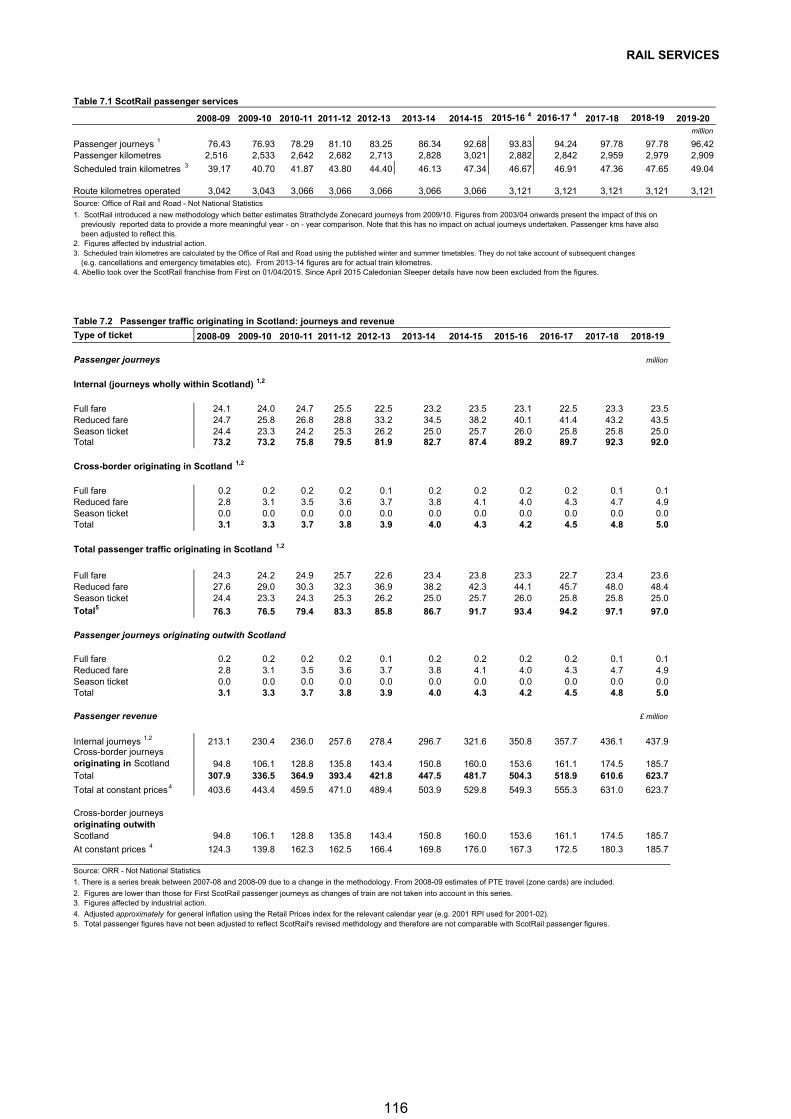
RAIL SERVICES
Table 7.1 ScotRail passenger services
2008-09 2009-10 2010-11 2011-12 2012-13 2013-14 2014-15 2015-16 4 2016-17 42017-18 2018-19 2019-20
million
Passenger journeys 1 76.43 76.93 78.29 81.10 83.25 86.34 92.68 93.83 94.24 97.78 97.78 96.42Passenger kilometres 2,516 2,533 2,642 2,682 2,713 2,828 3,021 2,882 2,842 2,959 2,979 2,909
Scheduled train kilometres 3 39.17 40.70 41.87 43.80 44.40 46.13 47.34 46.67 46.91 47.36 47.65 49.04
Route kilometres operated 3,042 3,043 3,066 3,066 3,066 3,066 3,066 3,121 3,121 3,121 3,121 3,121Source: Office of Rail and Road - Not National Statistics
1. ScotRail introduced a new methodology which better estimates Strathclyde Zonecard journeys from 2009/10. Figures from 2003/04 onwards present the impact of this on previously reported data to provide a more meaningful year - on - year comparison. Note that this has no impact on actual journeys undertaken. Passenger kms have alsobeen adjusted to reflect this.
2. Figures affected by industrial action.3. Scheduled train kilometres are calculated by the Office of Rail and Road using the published winter and summer timetables. They do not take account of subsequent changes
(e.g. cancellations and emergency timetables etc). From 2013-14 figures are for actual train kilometres.4. Abellio took over the ScotRail franchise from First on 01/04/2015. Since April 2015 Caledonian Sleeper details have now been excluded from the figures.
Table 7.2 Passenger traffic originating in Scotland: journeys and revenue
Type of ticket 2008-09 2009-10 2010-11 2011-12 2012-13 2013-14 2014-15 2015-16 2016-17 2017-18 2018-19
Passenger journeys million
Internal (journeys wholly within Scotland) 1,2
Full fare 24.1 24.0 24.7 25.5 22.5 23.2 23.5 23.1 22.5 23.3 23.5Reduced fare 24.7 25.8 26.8 28.8 33.2 34.5 38.2 40.1 41.4 43.2 43.5Season ticket 24.4 23.3 24.2 25.3 26.2 25.0 25.7 26.0 25.8 25.8 25.0Total 73.2 73.2 75.8 79.5 81.9 82.7 87.4 89.2 89.7 92.3 92.0
Cross-border originating in Scotland 1,2
Full fare 0.2 0.2 0.2 0.2 0.1 0.2 0.2 0.2 0.2 0.1 0.1Reduced fare 2.8 3.1 3.5 3.6 3.7 3.8 4.1 4.0 4.3 4.7 4.9Season ticket 0.0 0.0 0.0 0.0 0.0 0.0 0.0 0.0 0.0 0.0 0.0Total 3.1 3.3 3.7 3.8 3.9 4.0 4.3 4.2 4.5 4.8 5.0
Total passenger traffic originating in Scotland 1,2
Full fare 24.3 24.2 24.9 25.7 22.6 23.4 23.8 23.3 22.7 23.4 23.6Reduced fare 27.6 29.0 30.3 32.3 36.9 38.2 42.3 44.1 45.7 48.0 48.4Season ticket 24.4 23.3 24.3 25.3 26.2 25.0 25.7 26.0 25.8 25.8 25.0
Total5 76.3 76.5 79.4 83.3 85.8 86.7 91.7 93.4 94.2 97.1 97.0
Passenger journeys originating outwith Scotland
Full fare 0.2 0.2 0.2 0.2 0.1 0.2 0.2 0.2 0.2 0.1 0.1Reduced fare 2.8 3.1 3.5 3.6 3.7 3.8 4.1 4.0 4.3 4.7 4.9Season ticket 0.0 0.0 0.0 0.0 0.0 0.0 0.0 0.0 0.0 0.0 0.0Total 3.1 3.3 3.7 3.8 3.9 4.0 4.3 4.2 4.5 4.8 5.0
Passenger revenue £ million
Internal journeys 1,2 213.1 230.4 236.0 257.6 278.4 296.7 321.6 350.8 357.7 436.1 437.9Cross-border journeys originating in Scotland 94.8 106.1 128.8 135.8 143.4 150.8 160.0 153.6 161.1 174.5 185.7Total 307.9 336.5 364.9 393.4 421.8 447.5 481.7 504.3 518.9 610.6 623.7
Total at constant prices 4 403.6 443.4 459.5 471.0 489.4 503.9 529.8 549.3 555.3 631.0 623.7
Cross-border journeys originating outwith Scotland 94.8 106.1 128.8 135.8 143.4 150.8 160.0 153.6 161.1 174.5 185.7
At constant prices 4 124.3 139.8 162.3 162.5 166.4 169.8 176.0 167.3 172.5 180.3 185.7
Source: ORR - Not National Statistics
1. There is a series break between 2007-08 and 2008-09 due to a change in the methodology. From 2008-09 estimates of PTE travel (zone cards) are included.
2. Figures are lower than those for First ScotRail passenger journeys as changes of train are not taken into account in this series.3. Figures affected by industrial action.
4. Adjusted approximately for general inflation using the Retail Prices index for the relevant calendar year (e.g. 2001 RPI used for 2001-02). 5. Total passenger figures have not been adjusted to reflect ScotRail's revised methdology and therefore are not comparable with ScotRail passenger figures.
116
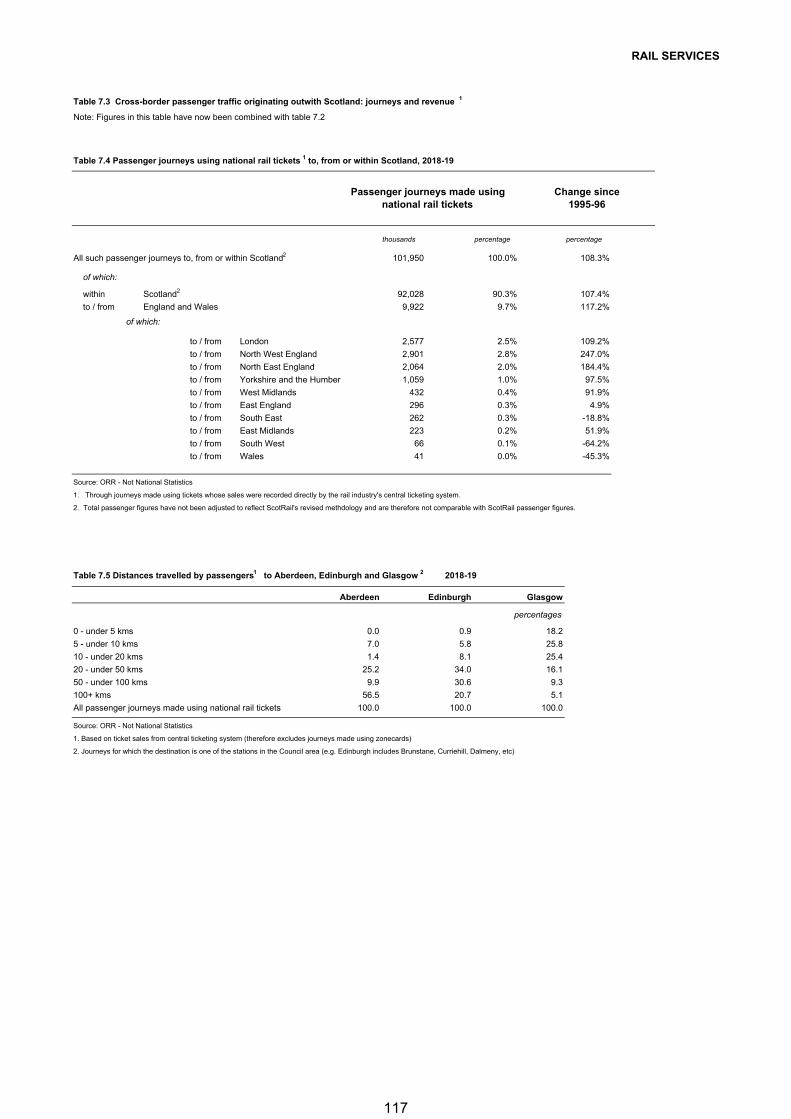
RAIL SERVICES
Table 7.3 Cross-border passenger traffic originating outwith Scotland: journeys and revenue 1
Note: Figures in this table have now been combined with table 7.2
Table 7.4 Passenger journeys using national rail tickets 1 to, from or within Scotland, 2018-19
thousands percentage percentage
All such passenger journeys to, from or within Scotland2 101,950 100.0% 108.3%
of which:
within Scotland2 92,028 90.3% 107.4%
to / from England and Wales 9,922 9.7% 117.2%
of which:
to / from London 2,577 2.5% 109.2%
to / from North West England 2,901 2.8% 247.0%
to / from North East England 2,064 2.0% 184.4%
to / from Yorkshire and the Humber 1,059 1.0% 97.5%
to / from West Midlands 432 0.4% 91.9%
to / from East England 296 0.3% 4.9%
to / from South East 262 0.3% -18.8%
to / from East Midlands 223 0.2% 51.9%
to / from South West 66 0.1% -64.2%
to / from Wales 41 0.0% -45.3%
Source: ORR - Not National Statistics
1. Through journeys made using tickets whose sales were recorded directly by the rail industry's central ticketing system.
2. Total passenger figures have not been adjusted to reflect ScotRail's revised methdology and are therefore not comparable with ScotRail passenger figures.
Table 7.5 Distances travelled by passengers1 to Aberdeen, Edinburgh and Glasgow 2 2018-19
Aberdeen Edinburgh Glasgow
percentages
0 - under 5 kms 0.0 0.9 18.2
5 - under 10 kms 7.0 5.8 25.8
10 - under 20 kms 1.4 8.1 25.4
20 - under 50 kms 25.2 34.0 16.1
50 - under 100 kms 9.9 30.6 9.3
100+ kms 56.5 20.7 5.1
All passenger journeys made using national rail tickets 100.0 100.0 100.0
Source: ORR - Not National Statistics
1. Based on ticket sales from central ticketing system (therefore excludes journeys made using zonecards)
2. Journeys for which the destination is one of the stations in the Council area (e.g. Edinburgh includes Brunstane, Curriehill, Dalmeny, etc)
Change since 1995-96
Passenger journeys made using national rail tickets
117
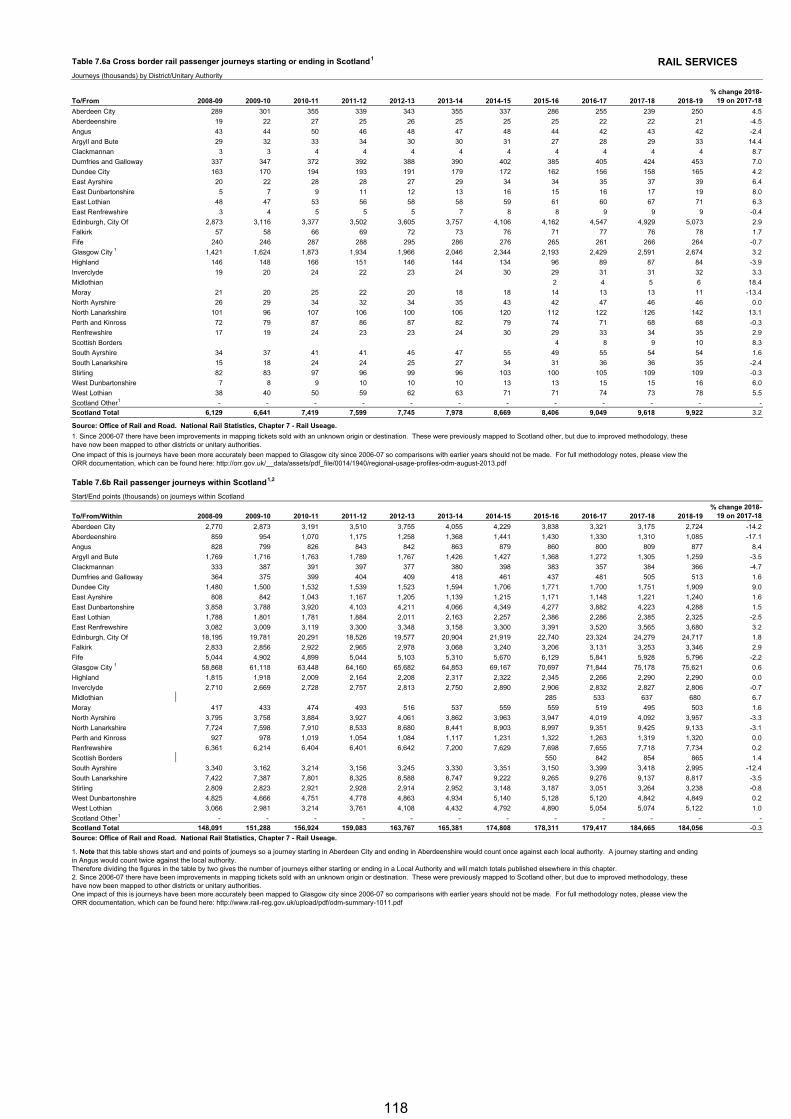
Table 7.6a Cross border rail passenger journeys starting or ending in Scotland1 RAIL SERVICESJourneys (thousands) by District/Unitary Authority
To/From 2008-09 2009-10 2010-11 2011-12 2012-13 2013-14 2014-15 2015-16 2016-17 2017-18 2018-19% change 2018-
19 on 2017-18
Aberdeen City 289 301 355 339 343 355 337 286 255 239 250 4.5
Aberdeenshire 19 22 27 25 26 25 25 25 22 22 21 -4.5
Angus 43 44 50 46 48 47 48 44 42 43 42 -2.4
Argyll and Bute 29 32 33 34 30 30 31 27 28 29 33 14.4
Clackmannan 3 3 4 4 4 4 4 4 4 4 4 8.7
Dumfries and Galloway 337 347 372 392 388 390 402 385 405 424 453 7.0
Dundee City 163 170 194 193 191 179 172 162 156 158 165 4.2
East Ayrshire 20 22 28 28 27 29 34 34 35 37 39 6.4
East Dunbartonshire 5 7 9 11 12 13 16 15 16 17 19 8.0
East Lothian 48 47 53 56 58 58 59 61 60 67 71 6.3
East Renfrewshire 3 4 5 5 5 7 8 8 9 9 9 -0.4
Edinburgh, City Of 2,873 3,116 3,377 3,502 3,605 3,757 4,106 4,162 4,547 4,929 5,073 2.9
Falkirk 57 58 66 69 72 73 76 71 77 76 78 1.7
Fife 240 246 287 288 295 286 276 265 261 266 264 -0.7
Glasgow City 1 1,421 1,624 1,873 1,934 1,966 2,046 2,344 2,193 2,429 2,591 2,674 3.2
Highland 146 148 166 151 146 144 134 96 89 87 84 -3.9
Inverclyde 19 20 24 22 23 24 30 29 31 31 32 3.3
Midlothian 2 4 5 6 18.4
Moray 21 20 25 22 20 18 18 14 13 13 11 -13.4
North Ayrshire 26 29 34 32 34 35 43 42 47 46 46 0.0
North Lanarkshire 101 96 107 106 100 106 120 112 122 126 142 13.1
Perth and Kinross 72 79 87 86 87 82 79 74 71 68 68 -0.3
Renfrewshire 17 19 24 23 23 24 30 29 33 34 35 2.9
Scottish Borders 4 8 9 10 8.3
South Ayrshire 34 37 41 41 45 47 55 49 55 54 54 1.6
South Lanarkshire 15 18 24 24 25 27 34 31 36 36 35 -2.4
Stirling 82 83 97 96 99 96 103 100 105 109 109 -0.3
West Dunbartonshire 7 8 9 10 10 10 13 13 15 15 16 6.0
West Lothian 38 40 50 59 62 63 71 71 74 73 78 5.5
Scotland Other1 - - - - - - - - - - - -
Scotland Total 6,129 6,641 7,419 7,599 7,745 7,978 8,669 8,406 9,049 9,618 9,922 3.2
Source: Office of Rail and Road. National Rail Statistics, Chapter 7 - Rail Useage.
Table 7.6b Rail passenger journeys within Scotland1,2
Start/End points (thousands) on journeys within Scotland
To/From/Within 2008-09 2009-10 2010-11 2011-12 2012-13 2013-14 2014-15 2015-16 2016-17 2017-18 2018-19% change 2018-
19 on 2017-18
Aberdeen City 2,770 2,873 3,191 3,510 3,755 4,055 4,229 3,838 3,321 3,175 2,724 -14.2
Aberdeenshire 859 954 1,070 1,175 1,258 1,368 1,441 1,430 1,330 1,310 1,085 -17.1
Angus 828 799 826 843 842 863 879 860 800 809 877 8.4
Argyll and Bute 1,769 1,716 1,763 1,789 1,767 1,426 1,427 1,368 1,272 1,305 1,259 -3.5
Clackmannan 333 387 391 397 377 380 398 383 357 384 366 -4.7
Dumfries and Galloway 364 375 399 404 409 418 461 437 481 505 513 1.6
Dundee City 1,480 1,500 1,532 1,539 1,523 1,594 1,706 1,771 1,700 1,751 1,909 9.0
East Ayrshire 808 842 1,043 1,167 1,205 1,139 1,215 1,171 1,148 1,221 1,240 1.6
East Dunbartonshire 3,858 3,788 3,920 4,103 4,211 4,066 4,349 4,277 3,882 4,223 4,288 1.5
East Lothian 1,788 1,801 1,781 1,884 2,011 2,163 2,257 2,386 2,286 2,385 2,325 -2.5
East Renfrewshire 3,082 3,009 3,119 3,300 3,348 3,158 3,300 3,391 3,520 3,565 3,680 3.2
Edinburgh, City Of 18,195 19,781 20,291 18,526 19,577 20,904 21,919 22,740 23,324 24,279 24,717 1.8
Falkirk 2,833 2,856 2,922 2,965 2,978 3,068 3,240 3,206 3,131 3,253 3,346 2.9
Fife 5,044 4,902 4,899 5,044 5,103 5,310 5,670 6,129 5,841 5,928 5,796 -2.2
Glasgow City 1 58,868 61,118 63,448 64,160 65,682 64,853 69,167 70,697 71,844 75,178 75,621 0.6
Highland 1,815 1,918 2,009 2,164 2,208 2,317 2,322 2,345 2,266 2,290 2,290 0.0
Inverclyde 2,710 2,669 2,728 2,757 2,813 2,750 2,890 2,906 2,832 2,827 2,806 -0.7
Midlothian 285 533 637 680 6.7
Moray 417 433 474 493 516 537 559 559 519 495 503 1.6
North Ayrshire 3,795 3,758 3,884 3,927 4,061 3,862 3,963 3,947 4,019 4,092 3,957 -3.3
North Lanarkshire 7,724 7,598 7,910 8,533 8,680 8,441 8,903 8,997 9,351 9,425 9,133 -3.1
Perth and Kinross 927 978 1,019 1,054 1,084 1,117 1,231 1,322 1,263 1,319 1,320 0.0
Renfrewshire 6,361 6,214 6,404 6,401 6,642 7,200 7,629 7,698 7,655 7,718 7,734 0.2
Scottish Borders 550 842 854 865 1.4
South Ayrshire 3,340 3,162 3,214 3,156 3,245 3,330 3,351 3,150 3,399 3,418 2,995 -12.4
South Lanarkshire 7,422 7,387 7,801 8,325 8,588 8,747 9,222 9,265 9,276 9,137 8,817 -3.5
Stirling 2,809 2,823 2,921 2,928 2,914 2,952 3,148 3,187 3,051 3,264 3,238 -0.8
West Dunbartonshire 4,825 4,666 4,751 4,778 4,863 4,934 5,140 5,128 5,120 4,842 4,849 0.2
West Lothian 3,066 2,981 3,214 3,761 4,108 4,432 4,792 4,890 5,054 5,074 5,122 1.0
Scotland Other1 - - - - - - - - - - - -
Scotland Total 148,091 151,288 156,924 159,083 163,767 165,381 174,808 178,311 179,417 184,665 184,056 -0.3
Source: Office of Rail and Road. National Rail Statistics, Chapter 7 - Rail Useage.
One impact of this is journeys have been more accurately been mapped to Glasgow city since 2006-07 so comparisons with earlier years should not be made. For full methodology notes, please view the ORR documentation, which can be found here: http://www.rail-reg.gov.uk/upload/pdf/odm-summary-1011.pdf
Therefore dividing the figures in the table by two gives the number of journeys either starting or ending in a Local Authority and will match totals published elsewhere in this chapter.
1. Note that this table shows start and end points of journeys so a journey starting in Aberdeen City and ending in Aberdeenshire would count once against each local authority. A journey starting and ending in Angus would count twice against the local authority.
1. Since 2006-07 there have been improvements in mapping tickets sold with an unknown origin or destination. These were previously mapped to Scotland other, but due to improved methodology, these have now been mapped to other districts or unitary authorities.
One impact of this is journeys have been more accurately been mapped to Glasgow city since 2006-07 so comparisons with earlier years should not be made. For full methodology notes, please view the ORR documentation, which can be found here: http://orr.gov.uk/__data/assets/pdf_file/0014/1940/regional-usage-profiles-odm-august-2013.pdf
2. Since 2006-07 there have been improvements in mapping tickets sold with an unknown origin or destination. These were previously mapped to Scotland other, but due to improved methodology, these have now been mapped to other districts or unitary authorities.
118
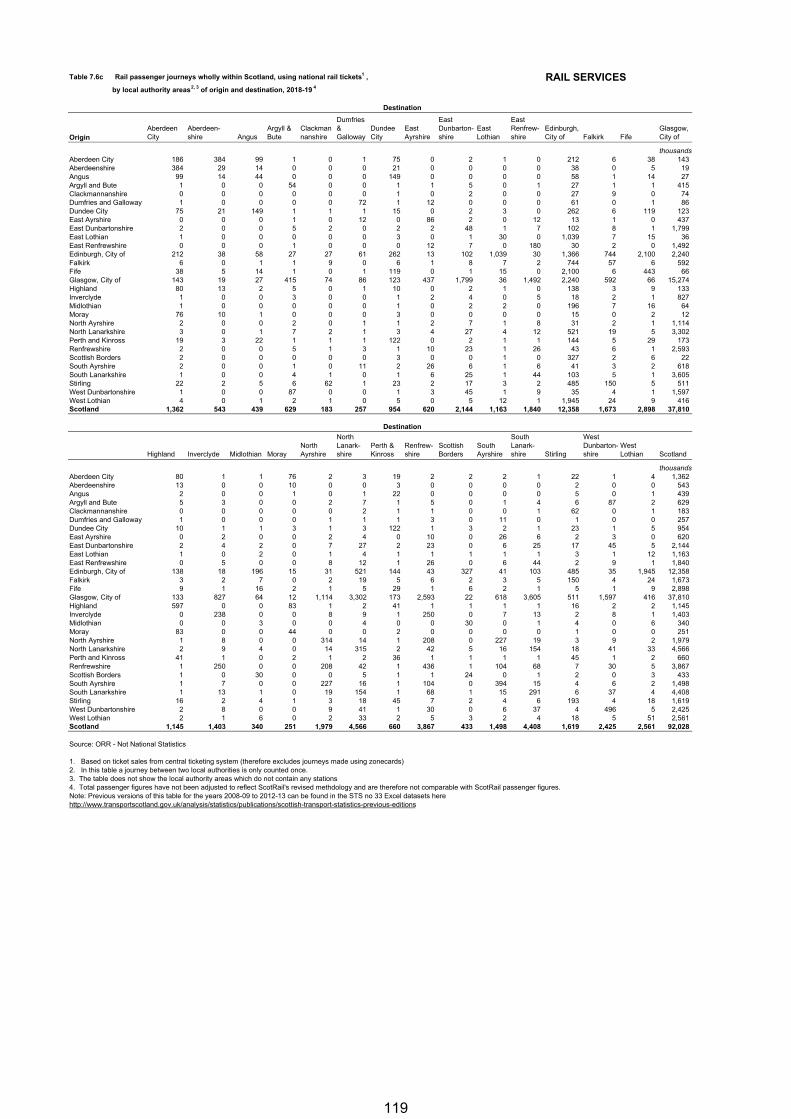
Table 7.6c Rail passenger journeys wholly within Scotland, using national rail tickets 1 , RAIL SERVICES by local authority areas 2, 3 of origin and destination, 2018-19 4
Destination
OriginAberdeen City
Aberdeen-shire Angus
Argyll & Bute
Clackmannanshire
Dumfries & Galloway
Dundee City
East Ayrshire
East Dunbarton-shire
East Lothian
East Renfrew-shire
Edinburgh, City of Falkirk Fife
Glasgow, City of
thousandsAberdeen City 186 384 99 1 0 1 75 0 2 1 0 212 6 38 143Aberdeenshire 384 29 14 0 0 0 21 0 0 0 0 38 0 5 19Angus 99 14 44 0 0 0 149 0 0 0 0 58 1 14 27Argyll and Bute 1 0 0 54 0 0 1 1 5 0 1 27 1 1 415Clackmannanshire 0 0 0 0 0 0 1 0 2 0 0 27 9 0 74Dumfries and Galloway 1 0 0 0 0 72 1 12 0 0 0 61 0 1 86Dundee City 75 21 149 1 1 1 15 0 2 3 0 262 6 119 123East Ayrshire 0 0 0 1 0 12 0 86 2 0 12 13 1 0 437East Dunbartonshire 2 0 0 5 2 0 2 2 48 1 7 102 8 1 1,799East Lothian 1 0 0 0 0 0 3 0 1 30 0 1,039 7 15 36East Renfrewshire 0 0 0 1 0 0 0 12 7 0 180 30 2 0 1,492Edinburgh, City of 212 38 58 27 27 61 262 13 102 1,039 30 1,366 744 2,100 2,240Falkirk 6 0 1 1 9 0 6 1 8 7 2 744 57 6 592Fife 38 5 14 1 0 1 119 0 1 15 0 2,100 6 443 66Glasgow, City of 143 19 27 415 74 86 123 437 1,799 36 1,492 2,240 592 66 15,274Highland 80 13 2 5 0 1 10 0 2 1 0 138 3 9 133Inverclyde 1 0 0 3 0 0 1 2 4 0 5 18 2 1 827Midlothian 1 0 0 0 0 0 1 0 2 2 0 196 7 16 64Moray 76 10 1 0 0 0 3 0 0 0 0 15 0 2 12North Ayrshire 2 0 0 2 0 1 1 2 7 1 8 31 2 1 1,114North Lanarkshire 3 0 1 7 2 1 3 4 27 4 12 521 19 5 3,302Perth and Kinross 19 3 22 1 1 1 122 0 2 1 1 144 5 29 173Renfrewshire 2 0 0 5 1 3 1 10 23 1 26 43 6 1 2,593Scottish Borders 2 0 0 0 0 0 3 0 0 1 0 327 2 6 22South Ayrshire 2 0 0 1 0 11 2 26 6 1 6 41 3 2 618South Lanarkshire 1 0 0 4 1 0 1 6 25 1 44 103 5 1 3,605Stirling 22 2 5 6 62 1 23 2 17 3 2 485 150 5 511West Dunbartonshire 1 0 0 87 0 0 1 3 45 1 9 35 4 1 1,597West Lothian 4 0 1 2 1 0 5 0 5 12 1 1,945 24 9 416Scotland 1,362 543 439 629 183 257 954 620 2,144 1,163 1,840 12,358 1,673 2,898 37,810
Destination
Highland Inverclyde Midlothian MorayNorth Ayrshire
North Lanark-shire
Perth & Kinross
Renfrew-shire
Scottish Borders
South Ayrshire
South Lanark-shire Stirling
West Dunbarton-shire
West Lothian Scotland
thousandsAberdeen City 80 1 1 76 2 3 19 2 2 2 1 22 1 4 1,362Aberdeenshire 13 0 0 10 0 0 3 0 0 0 0 2 0 0 543Angus 2 0 0 1 0 1 22 0 0 0 0 5 0 1 439Argyll and Bute 5 3 0 0 2 7 1 5 0 1 4 6 87 2 629Clackmannanshire 0 0 0 0 0 2 1 1 0 0 1 62 0 1 183Dumfries and Galloway 1 0 0 0 1 1 1 3 0 11 0 1 0 0 257Dundee City 10 1 1 3 1 3 122 1 3 2 1 23 1 5 954East Ayrshire 0 2 0 0 2 4 0 10 0 26 6 2 3 0 620East Dunbartonshire 2 4 2 0 7 27 2 23 0 6 25 17 45 5 2,144East Lothian 1 0 2 0 1 4 1 1 1 1 1 3 1 12 1,163East Renfrewshire 0 5 0 0 8 12 1 26 0 6 44 2 9 1 1,840Edinburgh, City of 138 18 196 15 31 521 144 43 327 41 103 485 35 1,945 12,358Falkirk 3 2 7 0 2 19 5 6 2 3 5 150 4 24 1,673Fife 9 1 16 2 1 5 29 1 6 2 1 5 1 9 2,898Glasgow, City of 133 827 64 12 1,114 3,302 173 2,593 22 618 3,605 511 1,597 416 37,810Highland 597 0 0 83 1 2 41 1 1 1 1 16 2 2 1,145Inverclyde 0 238 0 0 8 9 1 250 0 7 13 2 8 1 1,403Midlothian 0 0 3 0 0 4 0 0 30 0 1 4 0 6 340Moray 83 0 0 44 0 0 2 0 0 0 0 1 0 0 251North Ayrshire 1 8 0 0 314 14 1 208 0 227 19 3 9 2 1,979North Lanarkshire 2 9 4 0 14 315 2 42 5 16 154 18 41 33 4,566Perth and Kinross 41 1 0 2 1 2 36 1 1 1 1 45 1 2 660Renfrewshire 1 250 0 0 208 42 1 436 1 104 68 7 30 5 3,867Scottish Borders 1 0 30 0 0 5 1 1 24 0 1 2 0 3 433South Ayrshire 1 7 0 0 227 16 1 104 0 394 15 4 6 2 1,498South Lanarkshire 1 13 1 0 19 154 1 68 1 15 291 6 37 4 4,408Stirling 16 2 4 1 3 18 45 7 2 4 6 193 4 18 1,619West Dunbartonshire 2 8 0 0 9 41 1 30 0 6 37 4 496 5 2,425West Lothian 2 1 6 0 2 33 2 5 3 2 4 18 5 51 2,561Scotland 1,145 1,403 340 251 1,979 4,566 660 3,867 433 1,498 4,408 1,619 2,425 2,561 92,028
Source: ORR - Not National Statistics
1. Based on ticket sales from central ticketing system (therefore excludes journeys made using zonecards) 2. In this table a journey between two local authorities is only counted once.3. The table does not show the local authority areas which do not contain any stations 4. Total passenger figures have not been adjusted to reflect ScotRail's revised methdology and are therefore not comparable with ScotRail passenger figures.Note: Previous versions of this table for the years 2008-09 to 2012-13 can be found in the STS no 33 Excel datasets here http://www.transportscotland.gov.uk/analysis/statistics/publications/scottish-transport-statistics-previous-editions
119
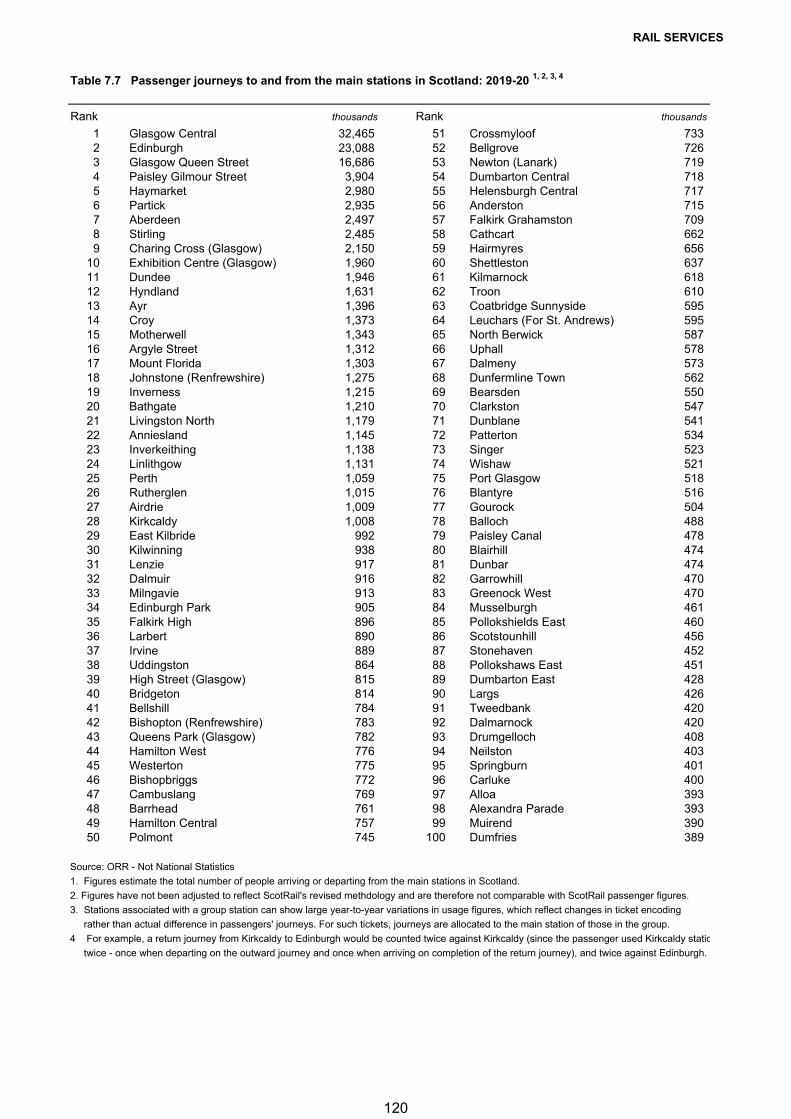
RAIL SERVICES
Table 7.7 Passenger journeys to and from the main stations in Scotland: 2019-20 1, 2, 3, 4
Rank thousands Rank thousands
1 Glasgow Central 32,465 51 Crossmyloof 733 2 Edinburgh 23,088 52 Bellgrove 726 3 Glasgow Queen Street 16,686 53 Newton (Lanark) 719 4 Paisley Gilmour Street 3,904 54 Dumbarton Central 718 5 Haymarket 2,980 55 Helensburgh Central 717 6 Partick 2,935 56 Anderston 715 7 Aberdeen 2,497 57 Falkirk Grahamston 709 8 Stirling 2,485 58 Cathcart 662 9 Charing Cross (Glasgow) 2,150 59 Hairmyres 656
10 Exhibition Centre (Glasgow) 1,960 60 Shettleston 637 11 Dundee 1,946 61 Kilmarnock 618 12 Hyndland 1,631 62 Troon 610 13 Ayr 1,396 63 Coatbridge Sunnyside 595 14 Croy 1,373 64 Leuchars (For St. Andrews) 595 15 Motherwell 1,343 65 North Berwick 587 16 Argyle Street 1,312 66 Uphall 578 17 Mount Florida 1,303 67 Dalmeny 573 18 Johnstone (Renfrewshire) 1,275 68 Dunfermline Town 562 19 Inverness 1,215 69 Bearsden 550 20 Bathgate 1,210 70 Clarkston 547 21 Livingston North 1,179 71 Dunblane 541 22 Anniesland 1,145 72 Patterton 534 23 Inverkeithing 1,138 73 Singer 523 24 Linlithgow 1,131 74 Wishaw 521 25 Perth 1,059 75 Port Glasgow 518 26 Rutherglen 1,015 76 Blantyre 516 27 Airdrie 1,009 77 Gourock 504 28 Kirkcaldy 1,008 78 Balloch 488 29 East Kilbride 992 79 Paisley Canal 478 30 Kilwinning 938 80 Blairhill 474 31 Lenzie 917 81 Dunbar 474 32 Dalmuir 916 82 Garrowhill 470 33 Milngavie 913 83 Greenock West 470 34 Edinburgh Park 905 84 Musselburgh 461 35 Falkirk High 896 85 Pollokshields East 460 36 Larbert 890 86 Scotstounhill 456 37 Irvine 889 87 Stonehaven 452 38 Uddingston 864 88 Pollokshaws East 451 39 High Street (Glasgow) 815 89 Dumbarton East 428 40 Bridgeton 814 90 Largs 426 41 Bellshill 784 91 Tweedbank 420 42 Bishopton (Renfrewshire) 783 92 Dalmarnock 420 43 Queens Park (Glasgow) 782 93 Drumgelloch 408 44 Hamilton West 776 94 Neilston 403 45 Westerton 775 95 Springburn 401 46 Bishopbriggs 772 96 Carluke 400 47 Cambuslang 769 97 Alloa 393 48 Barrhead 761 98 Alexandra Parade 393 49 Hamilton Central 757 99 Muirend 390 50 Polmont 745 100 Dumfries 389
Source: ORR - Not National Statistics
1. Figures estimate the total number of people arriving or departing from the main stations in Scotland.
2. Figures have not been adjusted to reflect ScotRail's revised methdology and are therefore not comparable with ScotRail passenger figures.
3. Stations associated with a group station can show large year-to-year variations in usage figures, which reflect changes in ticket encoding
rather than actual difference in passengers' journeys. For such tickets, journeys are allocated to the main station of those in the group.
4 For example, a return journey from Kirkcaldy to Edinburgh would be counted twice against Kirkcaldy (since the passenger used Kirkcaldy statio
twice - once when departing on the outward journey and once when arriving on completion of the return journey), and twice against Edinburgh.
120
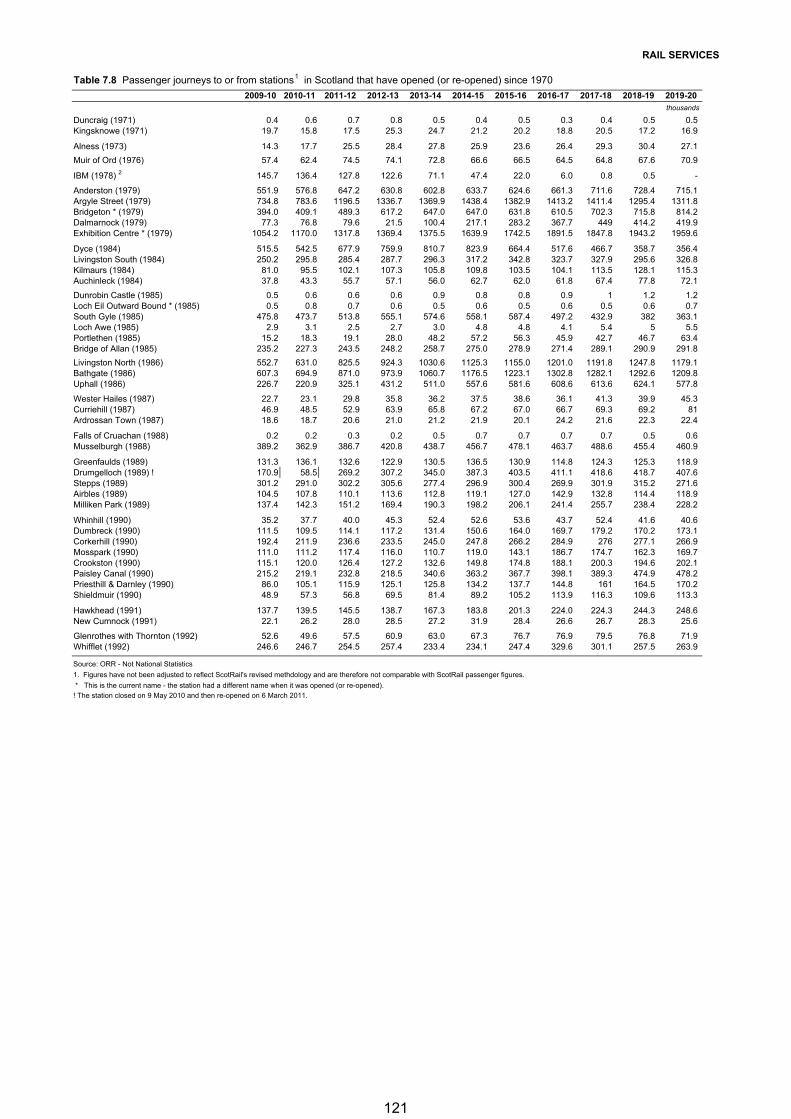
RAIL SERVICES
Table 7.8 Passenger journeys to or from stations1 in Scotland that have opened (or re-opened) since 1970 2009-10 2010-11 2011-12 2012-13 2013-14 2014-15 2015-16 2016-17 2017-18 2018-19 2019-20
thousands
Duncraig (1971) 0.4 0.6 0.7 0.8 0.5 0.4 0.5 0.3 0.4 0.5 0.5Kingsknowe (1971) 19.7 15.8 17.5 25.3 24.7 21.2 20.2 18.8 20.5 17.2 16.9
Alness (1973) 14.3 17.7 25.5 28.4 27.8 25.9 23.6 26.4 29.3 30.4 27.1
Muir of Ord (1976) 57.4 62.4 74.5 74.1 72.8 66.6 66.5 64.5 64.8 67.6 70.9
IBM (1978) 2 145.7 136.4 127.8 122.6 71.1 47.4 22.0 6.0 0.8 0.5 -
Anderston (1979) 551.9 576.8 647.2 630.8 602.8 633.7 624.6 661.3 711.6 728.4 715.1Argyle Street (1979) 734.8 783.6 1196.5 1336.7 1369.9 1438.4 1382.9 1413.2 1411.4 1295.4 1311.8Bridgeton * (1979) 394.0 409.1 489.3 617.2 647.0 647.0 631.8 610.5 702.3 715.8 814.2Dalmarnock (1979) 77.3 76.8 79.6 21.5 100.4 217.1 283.2 367.7 449 414.2 419.9Exhibition Centre * (1979) 1054.2 1170.0 1317.8 1369.4 1375.5 1639.9 1742.5 1891.5 1847.8 1943.2 1959.6
Dyce (1984) 515.5 542.5 677.9 759.9 810.7 823.9 664.4 517.6 466.7 358.7 356.4Livingston South (1984) 250.2 295.8 285.4 287.7 296.3 317.2 342.8 323.7 327.9 295.6 326.8Kilmaurs (1984) 81.0 95.5 102.1 107.3 105.8 109.8 103.5 104.1 113.5 128.1 115.3Auchinleck (1984) 37.8 43.3 55.7 57.1 56.0 62.7 62.0 61.8 67.4 77.8 72.1
Dunrobin Castle (1985) 0.5 0.6 0.6 0.6 0.9 0.8 0.8 0.9 1 1.2 1.2Loch Eil Outward Bound * (1985) 0.5 0.8 0.7 0.6 0.5 0.6 0.5 0.6 0.5 0.6 0.7South Gyle (1985) 475.8 473.7 513.8 555.1 574.6 558.1 587.4 497.2 432.9 382 363.1Loch Awe (1985) 2.9 3.1 2.5 2.7 3.0 4.8 4.8 4.1 5.4 5 5.5Portlethen (1985) 15.2 18.3 19.1 28.0 48.2 57.2 56.3 45.9 42.7 46.7 63.4Bridge of Allan (1985) 235.2 227.3 243.5 248.2 258.7 275.0 278.9 271.4 289.1 290.9 291.8
Livingston North (1986) 552.7 631.0 825.5 924.3 1030.6 1125.3 1155.0 1201.0 1191.8 1247.8 1179.1Bathgate (1986) 607.3 694.9 871.0 973.9 1060.7 1176.5 1223.1 1302.8 1282.1 1292.6 1209.8Uphall (1986) 226.7 220.9 325.1 431.2 511.0 557.6 581.6 608.6 613.6 624.1 577.8
Wester Hailes (1987) 22.7 23.1 29.8 35.8 36.2 37.5 38.6 36.1 41.3 39.9 45.3Curriehill (1987) 46.9 48.5 52.9 63.9 65.8 67.2 67.0 66.7 69.3 69.2 81Ardrossan Town (1987) 18.6 18.7 20.6 21.0 21.2 21.9 20.1 24.2 21.6 22.3 22.4
Falls of Cruachan (1988) 0.2 0.2 0.3 0.2 0.5 0.7 0.7 0.7 0.7 0.5 0.6Musselburgh (1988) 389.2 362.9 386.7 420.8 438.7 456.7 478.1 463.7 488.6 455.4 460.9
Greenfaulds (1989) 131.3 136.1 132.6 122.9 130.5 136.5 130.9 114.8 124.3 125.3 118.9Drumgelloch (1989) ! 170.9 58.5 269.2 307.2 345.0 387.3 403.5 411.1 418.6 418.7 407.6Stepps (1989) 301.2 291.0 302.2 305.6 277.4 296.9 300.4 269.9 301.9 315.2 271.6Airbles (1989) 104.5 107.8 110.1 113.6 112.8 119.1 127.0 142.9 132.8 114.4 118.9Milliken Park (1989) 137.4 142.3 151.2 169.4 190.3 198.2 206.1 241.4 255.7 238.4 228.2
Whinhill (1990) 35.2 37.7 40.0 45.3 52.4 52.6 53.6 43.7 52.4 41.6 40.6Dumbreck (1990) 111.5 109.5 114.1 117.2 131.4 150.6 164.0 169.7 179.2 170.2 173.1Corkerhill (1990) 192.4 211.9 236.6 233.5 245.0 247.8 266.2 284.9 276 277.1 266.9Mosspark (1990) 111.0 111.2 117.4 116.0 110.7 119.0 143.1 186.7 174.7 162.3 169.7Crookston (1990) 115.1 120.0 126.4 127.2 132.6 149.8 174.8 188.1 200.3 194.6 202.1Paisley Canal (1990) 215.2 219.1 232.8 218.5 340.6 363.2 367.7 398.1 389.3 474.9 478.2Priesthill & Darnley (1990) 86.0 105.1 115.9 125.1 125.8 134.2 137.7 144.8 161 164.5 170.2Shieldmuir (1990) 48.9 57.3 56.8 69.5 81.4 89.2 105.2 113.9 116.3 109.6 113.3
Hawkhead (1991) 137.7 139.5 145.5 138.7 167.3 183.8 201.3 224.0 224.3 244.3 248.6New Cumnock (1991) 22.1 26.2 28.0 28.5 27.2 31.9 28.4 26.6 26.7 28.3 25.6
Glenrothes with Thornton (1992) 52.6 49.6 57.5 60.9 63.0 67.3 76.7 76.9 79.5 76.8 71.9Whifflet (1992) 246.6 246.7 254.5 257.4 233.4 234.1 247.4 329.6 301.1 257.5 263.9
Source: ORR - Not National Statistics
1. Figures have not been adjusted to reflect ScotRail's revised methdology and are therefore not comparable with ScotRail passenger figures.
* This is the current name - the station had a different name when it was opened (or re-opened).
! The station closed on 9 May 2010 and then re-opened on 6 March 2011.
121
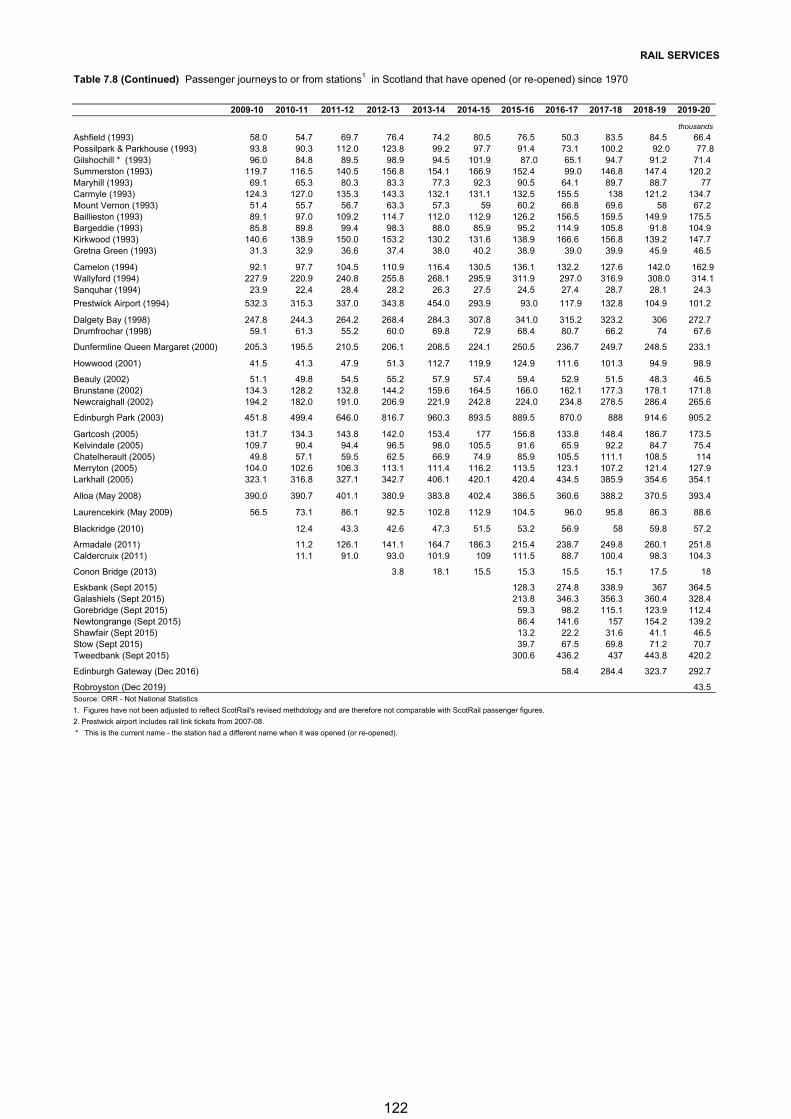
RAIL SERVICES
Table 7.8 (Continued) Passenger journeys to or from stations1 in Scotland that have opened (or re-opened) since 1970
2009-10 2010-11 2011-12 2012-13 2013-14 2014-15 2015-16 2016-17 2017-18 2018-19 2019-20
thousands
Ashfield (1993) 58.0 54.7 69.7 76.4 74.2 80.5 76.5 50.3 83.5 84.5 66.4Possilpark & Parkhouse (1993) 93.8 90.3 112.0 123.8 99.2 97.7 91.4 73.1 100.2 92.0 77.8Gilshochill * (1993) 96.0 84.8 89.5 98.9 94.5 101.9 87.0 65.1 94.7 91.2 71.4Summerston (1993) 119.7 116.5 140.5 156.8 154.1 166.9 152.4 99.0 146.8 147.4 120.2Maryhill (1993) 69.1 65.3 80.3 83.3 77.3 92.3 90.5 64.1 89.7 88.7 77Carmyle (1993) 124.3 127.0 135.3 143.3 132.1 131.1 132.5 155.5 138 121.2 134.7Mount Vernon (1993) 51.4 55.7 56.7 63.3 57.3 59 60.2 66.8 69.6 58 67.2Baillieston (1993) 89.1 97.0 109.2 114.7 112.0 112.9 126.2 156.5 159.5 149.9 175.5Bargeddie (1993) 85.8 89.8 99.4 98.3 88.0 85.9 95.2 114.9 105.8 91.8 104.9Kirkwood (1993) 140.6 138.9 150.0 153.2 130.2 131.6 138.9 166.6 156.8 139.2 147.7Gretna Green (1993) 31.3 32.9 36.6 37.4 38.0 40.2 38.9 39.0 39.9 45.9 46.5
Camelon (1994) 92.1 97.7 104.5 110.9 116.4 130.5 136.1 132.2 127.6 142.0 162.9Wallyford (1994) 227.9 220.9 240.8 255.8 268.1 295.9 311.9 297.0 316.9 308.0 314.1Sanquhar (1994) 23.9 22.4 28.4 28.2 26.3 27.5 24.5 27.4 28.7 28.1 24.3
Prestwick Airport (1994) 532.3 315.3 337.0 343.8 454.0 293.9 93.0 117.9 132.8 104.9 101.2
Dalgety Bay (1998) 247.8 244.3 264.2 268.4 284.3 307.8 341.0 315.2 323.2 306 272.7Drumfrochar (1998) 59.1 61.3 55.2 60.0 69.8 72.9 68.4 80.7 66.2 74 67.6
Dunfermline Queen Margaret (2000) 205.3 195.5 210.5 206.1 208.5 224.1 250.5 236.7 249.7 248.5 233.1
Howwood (2001) 41.5 41.3 47.9 51.3 112.7 119.9 124.9 111.6 101.3 94.9 98.9
Beauly (2002) 51.1 49.8 54.5 55.2 57.9 57.4 59.4 52.9 51.5 48.3 46.5Brunstane (2002) 134.3 128.2 132.8 144.2 159.6 164.5 166.0 162.1 177.3 178.1 171.8Newcraighall (2002) 194.2 182.0 191.0 206.9 221.9 242.8 224.0 234.8 278.5 286.4 265.6
Edinburgh Park (2003) 451.8 499.4 646.0 816.7 960.3 893.5 889.5 870.0 888 914.6 905.2
Gartcosh (2005) 131.7 134.3 143.8 142.0 153.4 177 156.8 133.8 148.4 186.7 173.5Kelvindale (2005) 109.7 90.4 94.4 96.5 98.0 105.5 91.6 65.9 92.2 84.7 75.4Chatelherault (2005) 49.8 57.1 59.5 62.5 66.9 74.9 85.9 105.5 111.1 108.5 114Merryton (2005) 104.0 102.6 106.3 113.1 111.4 116.2 113.5 123.1 107.2 121.4 127.9Larkhall (2005) 323.1 316.8 327.1 342.7 406.1 420.1 420.4 434.5 385.9 354.6 354.1
Alloa (May 2008) 390.0 390.7 401.1 380.9 383.8 402.4 386.5 360.6 388.2 370.5 393.4
Laurencekirk (May 2009) 56.5 73.1 86.1 92.5 102.8 112.9 104.5 96.0 95.8 86.3 88.6
Blackridge (2010) 12.4 43.3 42.6 47.3 51.5 53.2 56.9 58 59.8 57.2
Armadale (2011) 11.2 126.1 141.1 164.7 186.3 215.4 238.7 249.8 260.1 251.8Caldercruix (2011) 11.1 91.0 93.0 101.9 109 111.5 88.7 100.4 98.3 104.3
Conon Bridge (2013) 3.8 18.1 15.5 15.3 15.5 15.1 17.5 18
Eskbank (Sept 2015) 128.3 274.8 338.9 367 364.5Galashiels (Sept 2015) 213.8 346.3 356.3 360.4 328.4Gorebridge (Sept 2015) 59.3 98.2 115.1 123.9 112.4Newtongrange (Sept 2015) 86.4 141.6 157 154.2 139.2Shawfair (Sept 2015) 13.2 22.2 31.6 41.1 46.5Stow (Sept 2015) 39.7 67.5 69.8 71.2 70.7Tweedbank (Sept 2015) 300.6 436.2 437 443.8 420.2
Edinburgh Gateway (Dec 2016) 58.4 284.4 323.7 292.7
Robroyston (Dec 2019) 43.5Source: ORR - Not National Statistics
1. Figures have not been adjusted to reflect ScotRail's revised methdology and are therefore not comparable with ScotRail passenger figures.
2. Prestwick airport includes rail link tickets from 2007-08.
* This is the current name - the station had a different name when it was opened (or re-opened).
122
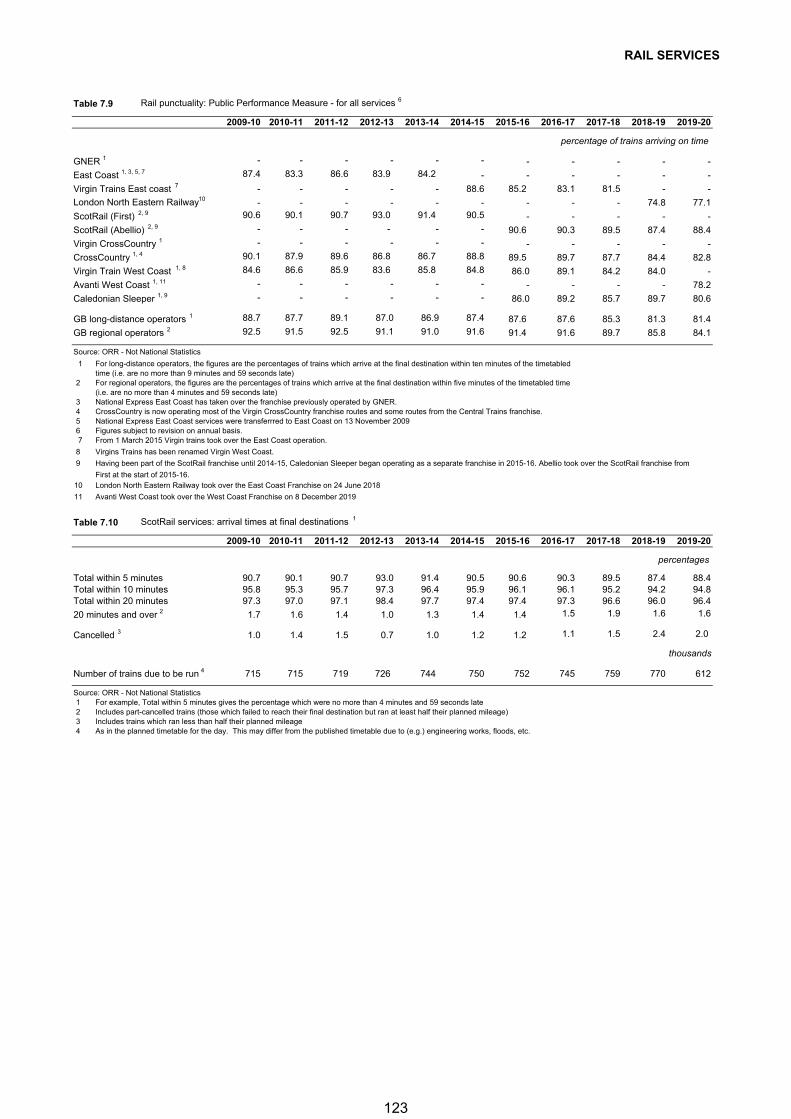
RAIL SERVICES
Table 7.9 Rail punctuality: Public Performance Measure - for all services 6
2009-10 2010-11 2011-12 2012-13 2013-14 2014-15 2015-16 2016-17 2017-18 2018-19 2019-20
percentage of trains arriving on time
GNER 1 - - - - - - - - - - -
East Coast 1, 3, 5, 7 87.4 83.3 86.6 83.9 84.2 - - - - - -
Virgin Trains East coast 7 - - - - - 88.6 85.2 83.1 81.5 - -
London North Eastern Railway10 - - - - - - - - - 74.8 77.1
ScotRail (First) 2, 9 90.6 90.1 90.7 93.0 91.4 90.5 - - - - -
ScotRail (Abellio) 2, 9 - - - - - - 90.6 90.3 89.5 87.4 88.4
Virgin CrossCountry 1 - - - - - - - - - - -
CrossCountry 1, 4 90.1 87.9 89.6 86.8 86.7 88.8 89.5 89.7 87.7 84.4 82.8
Virgin Train West Coast 1, 8 84.6 86.6 85.9 83.6 85.8 84.8 86.0 89.1 84.2 84.0 -
Avanti West Coast 1, 11 - - - - - - - - - - 78.2
Caledonian Sleeper 1, 9 - - - - - - 86.0 89.2 85.7 89.7 80.6
GB long-distance operators 1 88.7 87.7 89.1 87.0 86.9 87.4 87.6 87.6 85.3 81.3 81.4
GB regional operators 2 92.5 91.5 92.5 91.1 91.0 91.6 91.4 91.6 89.7 85.8 84.1
Source: ORR - Not National Statistics
1 For long-distance operators, the figures are the percentages of trains which arrive at the final destination within ten minutes of the timetabled time (i.e. are no more than 9 minutes and 59 seconds late)
2 For regional operators, the figures are the percentages of trains which arrive at the final destination within five minutes of the timetabled time(i.e. are no more than 4 minutes and 59 seconds late)
3 National Express East Coast has taken over the franchise previously operated by GNER.4 CrossCountry is now operating most of the Virgin CrossCountry franchise routes and some routes from the Central Trains franchise.5 National Express East Coast services were transferrred to East Coast on 13 November 20096 Figures subject to revision on annual basis.7 From 1 March 2015 Virgin trains took over the East Coast operation.
8 Virgins Trains has been renamed Virgin West Coast.
9 Having been part of the ScotRail franchise until 2014-15, Caledonian Sleeper began operating as a separate franchise in 2015-16. Abellio took over the ScotRail franchise from
First at the start of 2015-16.10 London North Eastern Railway took over the East Coast Franchise on 24 June 2018
11 Avanti West Coast took over the West Coast Franchise on 8 December 2019
Table 7.10 ScotRail services: arrival times at final destinations 1
2009-10 2010-11 2011-12 2012-13 2013-14 2014-15 2015-16 2016-17 2017-18 2018-19 2019-20
percentages
Total within 5 minutes 90.7 90.1 90.7 93.0 91.4 90.5 90.6 90.3 89.5 87.4 88.4Total within 10 minutes 95.8 95.3 95.7 97.3 96.4 95.9 96.1 96.1 95.2 94.2 94.8Total within 20 minutes 97.3 97.0 97.1 98.4 97.7 97.4 97.4 97.3 96.6 96.0 96.4
20 minutes and over 2 1.7 1.6 1.4 1.0 1.3 1.4 1.4 1.5 1.9 1.6 1.6
Cancelled 3 1.0 1.4 1.5 0.7 1.0 1.2 1.2 1.1 1.5 2.4 2.0
thousands
Number of trains due to be run 4 715 715 719 726 744 750 752 745 759 770 612
Source: ORR - Not National Statistics1 For example, Total within 5 minutes gives the percentage which were no more than 4 minutes and 59 seconds late2 Includes part-cancelled trains (those which failed to reach their final destination but ran at least half their planned mileage)3 Includes trains which ran less than half their planned mileage4 As in the planned timetable for the day. This may differ from the published timetable due to (e.g.) engineering works, floods, etc.
123
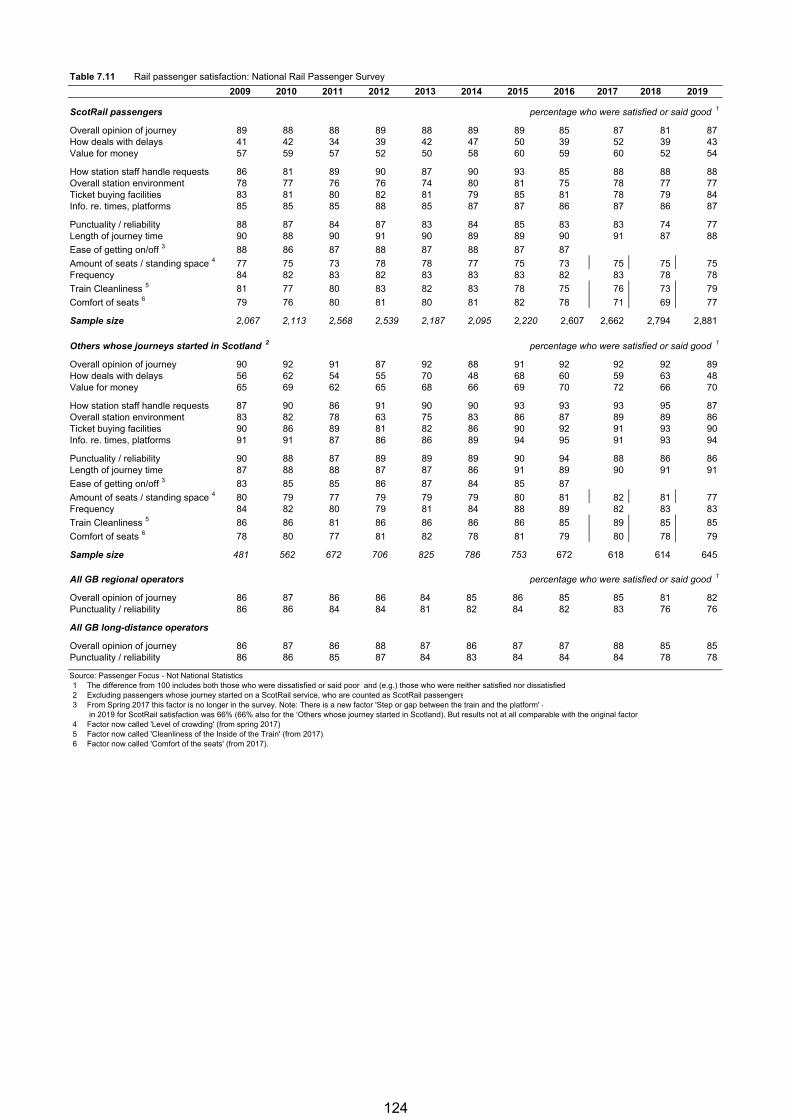
Table 7.11 Rail passenger satisfaction: National Rail Passenger Survey
2009 2010 2011 2012 2013 2014 2015 2016 2017 2018 2019
ScotRail passengers percentage who were satisfied or said good 1
Overall opinion of journey 89 88 88 89 88 89 89 85 87 81 87How deals with delays 41 42 34 39 42 47 50 39 52 39 43Value for money 57 59 57 52 50 58 60 59 60 52 54
How station staff handle requests 86 81 89 90 87 90 93 85 88 88 88Overall station environment 78 77 76 76 74 80 81 75 78 77 77Ticket buying facilities 83 81 80 82 81 79 85 81 78 79 84Info. re. times, platforms 85 85 85 88 85 87 87 86 87 86 87
Punctuality / reliability 88 87 84 87 83 84 85 83 83 74 77Length of journey time 90 88 90 91 90 89 89 90 91 87 88
Ease of getting on/off 3 88 86 87 88 87 88 87 87
Amount of seats / standing space 4 77 75 73 78 78 77 75 73 75 75 75Frequency 84 82 83 82 83 83 83 82 83 78 78
Train Cleanliness 5 81 77 80 83 82 83 78 75 76 73 79
Comfort of seats 6 79 76 80 81 80 81 82 78 71 69 77
Sample size 2,067 2,113 2,568 2,539 2,187 2,095 2,220 2,607 2,662 2,794 2,881
Others whose journeys started in Scotland 2 percentage who were satisfied or said good 1
Overall opinion of journey 90 92 91 87 92 88 91 92 92 92 89How deals with delays 56 62 54 55 70 48 68 60 59 63 48Value for money 65 69 62 65 68 66 69 70 72 66 70
How station staff handle requests 87 90 86 91 90 90 93 93 93 95 87Overall station environment 83 82 78 63 75 83 86 87 89 89 86Ticket buying facilities 90 86 89 81 82 86 90 92 91 93 90Info. re. times, platforms 91 91 87 86 86 89 94 95 91 93 94
Punctuality / reliability 90 88 87 89 89 89 90 94 88 86 86Length of journey time 87 88 88 87 87 86 91 89 90 91 91
Ease of getting on/off 3 83 85 85 86 87 84 85 87
Amount of seats / standing space 4 80 79 77 79 79 79 80 81 82 81 77Frequency 84 82 80 79 81 84 88 89 82 83 83
Train Cleanliness 5 86 86 81 86 86 86 86 85 89 85 85
Comfort of seats 6 78 80 77 81 82 78 81 79 80 78 79
Sample size 481 562 672 706 825 786 753 672 618 614 645
All GB regional operators percentage who were satisfied or said good 1
Overall opinion of journey 86 87 86 86 84 85 86 85 85 81 82Punctuality / reliability 86 86 84 84 81 82 84 82 83 76 76
All GB long-distance operators
Overall opinion of journey 86 87 86 88 87 86 87 87 88 85 85Punctuality / reliability 86 86 85 87 84 83 84 84 84 78 78
Source: Passenger Focus - Not National Statistics1 The difference from 100 includes both those who were dissatisfied or said poor and (e.g.) those who were neither satisfied nor dissatisfied2 Excluding passengers whose journey started on a ScotRail service, who are counted as ScotRail passengers3 From Spring 2017 this factor is no longer in the survey. Note: There is a new factor 'Step or gap between the train and the platform' -
in 2019 for ScotRail satisfaction was 66% (66% also for the ‘Others whose journey started in Scotland). But results not at all comparable with the original factor4 Factor now called 'Level of crowding' (from spring 2017).5 Factor now called 'Cleanliness of the Inside of the Train' (from 2017).6 Factor now called 'Comfort of the seats' (from 2017).
124
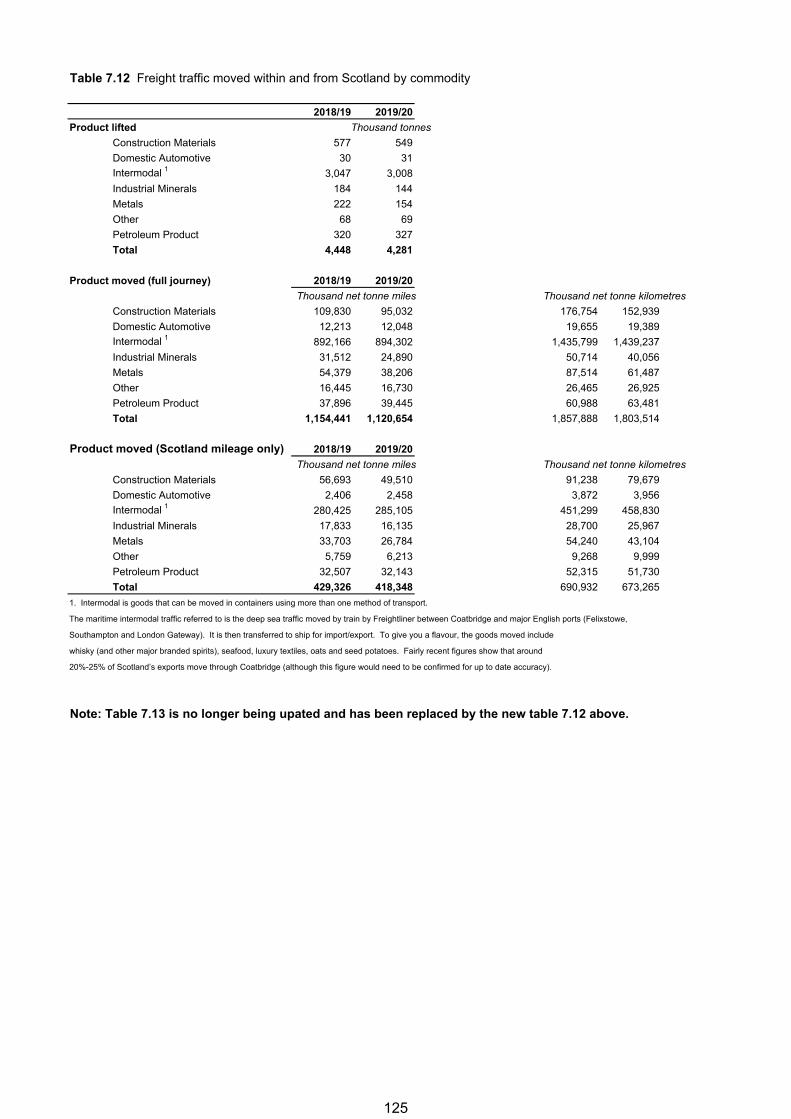
Table 7.12 Freight traffic moved within and from Scotland by commodity
2018/19 2019/20
Product lifted Thousand tonnes
Construction Materials 577 549
Domestic Automotive 30 31
Intermodal 1 3,047 3,008
Industrial Minerals 184 144
Metals 222 154
Other 68 69
Petroleum Product 320 327
Total 4,448 4,281
Product moved (full journey) 2018/19 2019/20
Thousand net tonne miles Thousand net tonne kilometres
Construction Materials 109,830 95,032 176,754 152,939
Domestic Automotive 12,213 12,048 19,655 19,389
Intermodal 1 892,166 894,302 1,435,799 1,439,237
Industrial Minerals 31,512 24,890 50,714 40,056
Metals 54,379 38,206 87,514 61,487
Other 16,445 16,730 26,465 26,925
Petroleum Product 37,896 39,445 60,988 63,481
Total 1,154,441 1,120,654 1,857,888 1,803,514
Product moved (Scotland mileage only) 2018/19 2019/20
Thousand net tonne miles Thousand net tonne kilometres
Construction Materials 56,693 49,510 91,238 79,679
Domestic Automotive 2,406 2,458 3,872 3,956
Intermodal 1 280,425 285,105 451,299 458,830
Industrial Minerals 17,833 16,135 28,700 25,967
Metals 33,703 26,784 54,240 43,104
Other 5,759 6,213 9,268 9,999
Petroleum Product 32,507 32,143 52,315 51,730
Total 429,326 418,348 690,932 673,265
1. Intermodal is goods that can be moved in containers using more than one method of transport.
The maritime intermodal traffic referred to is the deep sea traffic moved by train by Freightliner between Coatbridge and major English ports (Felixstowe,
Southampton and London Gateway). It is then transferred to ship for import/export. To give you a flavour, the goods moved include
whisky (and other major branded spirits), seafood, luxury textiles, oats and seed potatoes. Fairly recent figures show that around
20%-25% of Scotland’s exports move through Coatbridge (although this figure would need to be confirmed for up to date accuracy).
Note: Table 7.13 is no longer being upated and has been replaced by the new table 7.12 above.
125
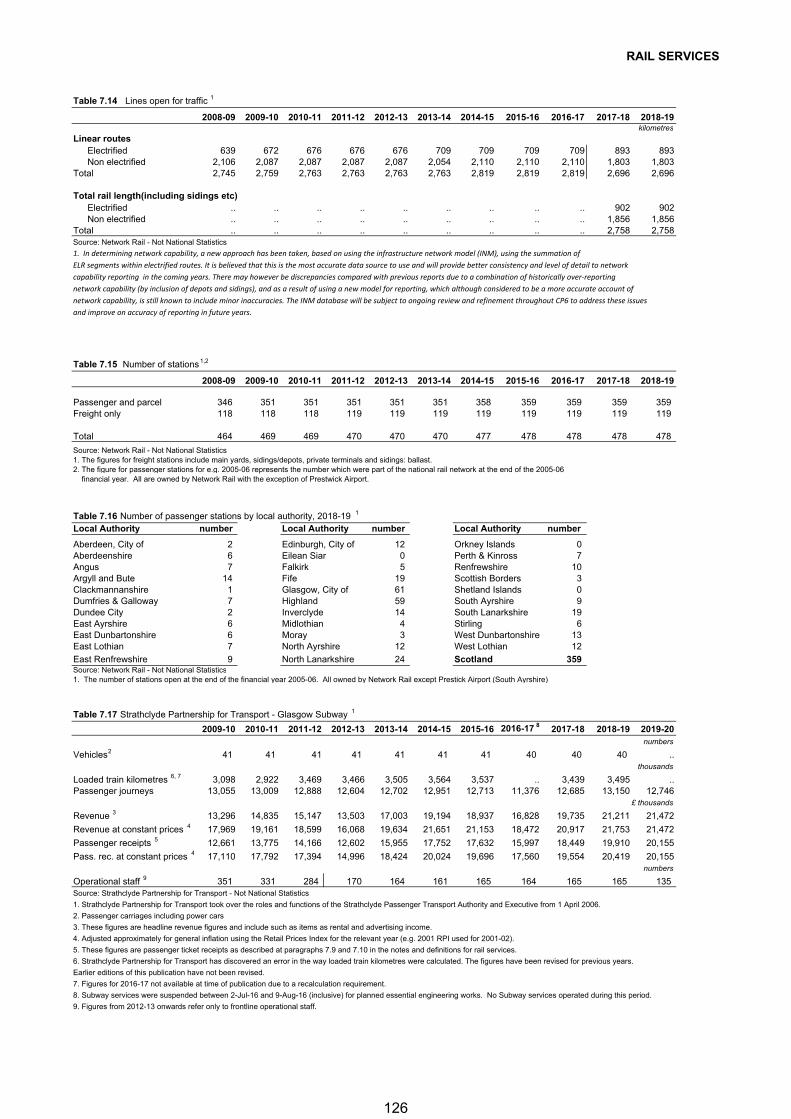
RAIL SERVICES
Table 7.14 Lines open for traffic 1
2008-09 2009-10 2010-11 2011-12 2012-13 2013-14 2014-15 2015-16 2016-17 2017-18 2018-19 kilometres
Linear routesElectrified 639 672 676 676 676 709 709 709 709 893 893Non electrified 2,106 2,087 2,087 2,087 2,087 2,054 2,110 2,110 2,110 1,803 1,803
Total 2,745 2,759 2,763 2,763 2,763 2,763 2,819 2,819 2,819 2,696 2,696
Total rail length(including sidings etc)Electrified .. .. .. .. .. .. .. .. .. 902 902Non electrified .. .. .. .. .. .. .. .. .. 1,856 1,856
Total .. .. .. .. .. .. .. .. .. 2,758 2,758Source: Network Rail - Not National Statistics
1. In determining network capability, a new approach has been taken, based on using the infrastructure network model (INM), using the summation ofELR segments within electrified routes. It is believed that this is the most accurate data source to use and will provide better consistency and level of detail to network capability reporting in the coming years. There may however be discrepancies compared with previous reports due to a combination of historically over-reportingnetwork capability (by inclusion of depots and sidings), and as a result of using a new model for reporting, which although considered to be a more accurate account of network capability, is still known to include minor inaccuracies. The INM database will be subject to ongoing review and refinement throughout CP6 to address these issuesand improve on accuracy of reporting in future years.
Table 7.15 Number of stations1,2
2008-09 2009-10 2010-11 2011-12 2012-13 2013-14 2014-15 2015-16 2016-17 2017-18 2018-19
Passenger and parcel 346 351 351 351 351 351 358 359 359 359 359Freight only 118 118 118 119 119 119 119 119 119 119 119
Total 464 469 469 470 470 470 477 478 478 478 478
Source: Network Rail - Not National Statistics1. The figures for freight stations include main yards, sidings/depots, private terminals and sidings: ballast. 2. The figure for passenger stations for e.g. 2005-06 represents the number which were part of the national rail network at the end of the 2005-06 financial year. All are owned by Network Rail with the exception of Prestwick Airport.
Table 7.16 Number of passenger stations by local authority, 2018-19 1
Local Authority number Local Authority number Local Authority number
Aberdeen, City of 2 Edinburgh, City of 12 Orkney Islands 0Aberdeenshire 6 Eilean Siar 0 Perth & Kinross 7Angus 7 Falkirk 5 Renfrewshire 10Argyll and Bute 14 Fife 19 Scottish Borders 3Clackmannanshire 1 Glasgow, City of 61 Shetland Islands 0Dumfries & Galloway 7 Highland 59 South Ayrshire 9Dundee City 2 Inverclyde 14 South Lanarkshire 19East Ayrshire 6 Midlothian 4 Stirling 6East Dunbartonshire 6 Moray 3 West Dunbartonshire 13East Lothian 7 North Ayrshire 12 West Lothian 12
East Renfrewshire 9 North Lanarkshire 24 Scotland 359Source: Network Rail - Not National Statistics1. The number of stations open at the end of the financial year 2005-06. All owned by Network Rail except Prestick Airport (South Ayrshire)
Table 7.17 Strathclyde Partnership for Transport - Glasgow Subway 1
2009-10 2010-11 2011-12 2012-13 2013-14 2014-15 2015-16 2016-17 82017-18 2018-19 2019-20
numbers
Vehicles2 41 41 41 41 41 41 41 40 40 40 ..thousands
Loaded train kilometres 6, 7 3,098 2,922 3,469 3,466 3,505 3,564 3,537 .. 3,439 3,495 ..Passenger journeys 13,055 13,009 12,888 12,604 12,702 12,951 12,713 11,376 12,685 13,150 12,746
£ thousands
Revenue 3 13,296 14,835 15,147 13,503 17,003 19,194 18,937 16,828 19,735 21,211 21,472
Revenue at constant prices 4 17,969 19,161 18,599 16,068 19,634 21,651 21,153 18,472 20,917 21,753 21,472
Passenger receipts 5 12,661 13,775 14,166 12,602 15,955 17,752 17,632 15,997 18,449 19,910 20,155
Pass. rec. at constant prices 4 17,110 17,792 17,394 14,996 18,424 20,024 19,696 17,560 19,554 20,419 20,155numbers
Operational staff 9 351 331 284 170 164 161 165 164 165 165 135Source: Strathclyde Partnership for Transport - Not National Statistics
1. Strathclyde Partnership for Transport took over the roles and functions of the Strathclyde Passenger Transport Authority and Executive from 1 April 2006.
2. Passenger carriages including power cars
3. These figures are headline revenue figures and include such as items as rental and advertising income.
4. Adjusted approximately for general inflation using the Retail Prices Index for the relevant year (e.g. 2001 RPI used for 2001-02).
5. These figures are passenger ticket receipts as described at paragraphs 7.9 and 7.10 in the notes and definitions for rail services.
6. Strathclyde Partnership for Transport has discovered an error in the way loaded train kilometres were calculated. The figures have been revised for previous years.
Earlier editions of this publication have not been revised.
7. Figures for 2016-17 not available at time of publication due to a recalculation requirement.
8. Subway services were suspended between 2-Jul-16 and 9-Aug-16 (inclusive) for planned essential engineering works. No Subway services operated during this period.
9. Figures from 2012-13 onwards refer only to frontline operational staff.
126
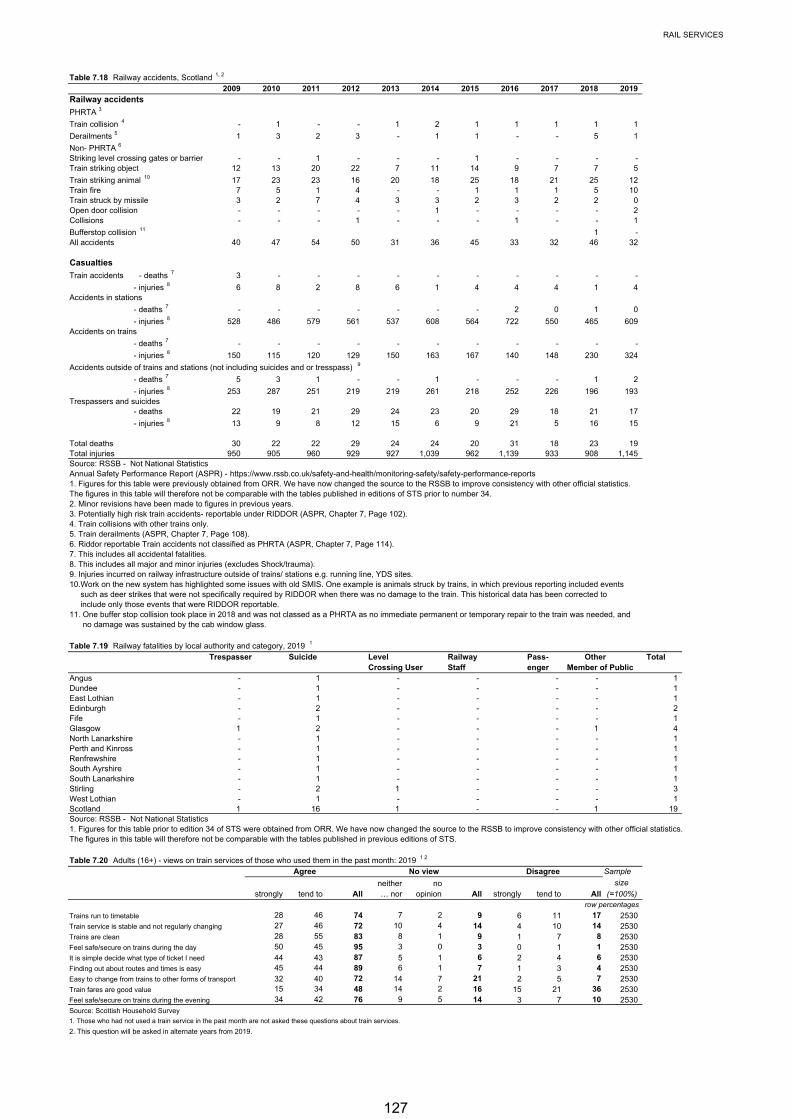
RAIL SERVICES
Table 7.18 Railway accidents, Scotland 1, 2
2009 2010 2011 2012 2013 2014 2015 2016 2017 2018 2019Railway accidents
PHRTA 3
Train collision 4 - 1 - - 1 2 1 1 1 1 1
Derailments 5 1 3 2 3 - 1 1 - - 5 1
Non- PHRTA 6
Striking level crossing gates or barrier - - 1 - - - 1 - - - - Train striking object 12 13 20 22 7 11 14 9 7 7 5
Train striking animal 10 17 23 23 16 20 18 25 18 21 25 12Train fire 7 5 1 4 - - 1 1 1 5 10Train struck by missile 3 2 7 4 3 3 2 3 2 2 0Open door collision - - - - - 1 - - - - 2 Collisions - - - 1 - - - 1 - - 1
Bufferstop collision 11 1 - All accidents 40 47 54 50 31 36 45 33 32 46 32
Casualties
Train accidents - deaths 7 3 - - - - - - - - - -
- injuries 8 6 8 2 8 6 1 4 4 4 1 4Accidents in stations
- deaths 7 - - - - - - - 2 0 1 0
- injuries 8 528 486 579 561 537 608 564 722 550 465 609Accidents on trains
- deaths 7 - - - - - - - - - - -
- injuries 8 150 115 120 129 150 163 167 140 148 230 324
Accidents outside of trains and stations (not including suicides and or tresspass) 9
- deaths 7 5 3 1 - - 1 - - - 1 2
- injuries 8 253 287 251 219 219 261 218 252 226 196 193Trespassers and suicides - deaths 22 19 21 29 24 23 20 29 18 21 17
- injuries 8 13 9 8 12 15 6 9 21 5 16 15
Total deaths 30 22 22 29 24 24 20 31 18 23 19Total injuries 950 905 960 929 927 1,039 962 1,139 933 908 1,145 Source: RSSB - Not National StatisticsAnnual Safety Performance Report (ASPR) - https://www.rssb.co.uk/safety-and-health/monitoring-safety/safety-performance-reports1. Figures for this table were previously obtained from ORR. We have now changed the source to the RSSB to improve consistency with other official statistics.The figures in this table will therefore not be comparable with the tables published in editions of STS prior to number 34.2. Minor revisions have been made to figures in previous years.3. Potentially high risk train accidents- reportable under RIDDOR (ASPR, Chapter 7, Page 102).4. Train collisions with other trains only.5. Train derailments (ASPR, Chapter 7, Page 108).6. Riddor reportable Train accidents not classified as PHRTA (ASPR, Chapter 7, Page 114).7. This includes all accidental fatalities. 8. This includes all major and minor injuries (excludes Shock/trauma).9. Injuries incurred on railway infrastructure outside of trains/ stations e.g. running line, YDS sites.10.Work on the new system has highlighted some issues with old SMIS. One example is animals struck by trains, in which previous reporting included events such as deer strikes that were not specifically required by RIDDOR when there was no damage to the train. This historical data has been corrected to include only those events that were RIDDOR reportable.11. One buffer stop collision took place in 2018 and was not classed as a PHRTA as no immediate permanent or temporary repair to the train was needed, and no damage was sustained by the cab window glass.
Table 7.19 Railway fatalities by local authority and category, 2019 1
Trespasser Suicide Level Railway Pass- Other TotalCrossing User Staff enger Member of Public
Angus - 1 - - - - 1 Dundee - 1 - - - - 1 East Lothian - 1 - - - - 1 Edinburgh - 2 - - - - 2 Fife - 1 - - - - 1 Glasgow 1 2 - - - 1 4 North Lanarkshire - 1 - - - - 1 Perth and Kinross - 1 - - - - 1 Renfrewshire - 1 - - - - 1 South Ayrshire - 1 - - - - 1 South Lanarkshire - 1 - - - - 1 Stirling - 2 1 - - - 3 West Lothian - 1 - - - - 1 Scotland 1 16 1 - - 1 19 Source: RSSB - Not National Statistics1. Figures for this table prior to edition 34 of STS were obtained from ORR. We have now changed the source to the RSSB to improve consistency with other official statistics.The figures in this table will therefore not be comparable with the tables published in previous editions of STS.
Table 7.20 Adults (16+) - views on train services of those who used them in the past month: 2019 1 2
Agree No view Disagree Sample
neither no size
strongly tend to All … nor opinion All strongly tend to All (=100%) row percentages
Trains run to timetable 28 46 74 7 2 9 6 11 17 2530Train service is stable and not regularly changing 27 46 72 10 4 14 4 10 14 2530Trains are clean 28 55 83 8 1 9 1 7 8 2530Feel safe/secure on trains during the day 50 45 95 3 0 3 0 1 1 2530It is simple decide what type of ticket I need 44 43 87 5 1 6 2 4 6 2530Finding out about routes and times is easy 45 44 89 6 1 7 1 3 4 2530Easy to change from trains to other forms of transport 32 40 72 14 7 21 2 5 7 2530Train fares are good value 15 34 48 14 2 16 15 21 36 2530Feel safe/secure on trains during the evening 34 42 76 9 5 14 3 7 10 2530Source: Scottish Household Survey
1. Those who had not used a train service in the past month are not asked these questions about train services.
2. This question will be asked in alternate years from 2019.
127
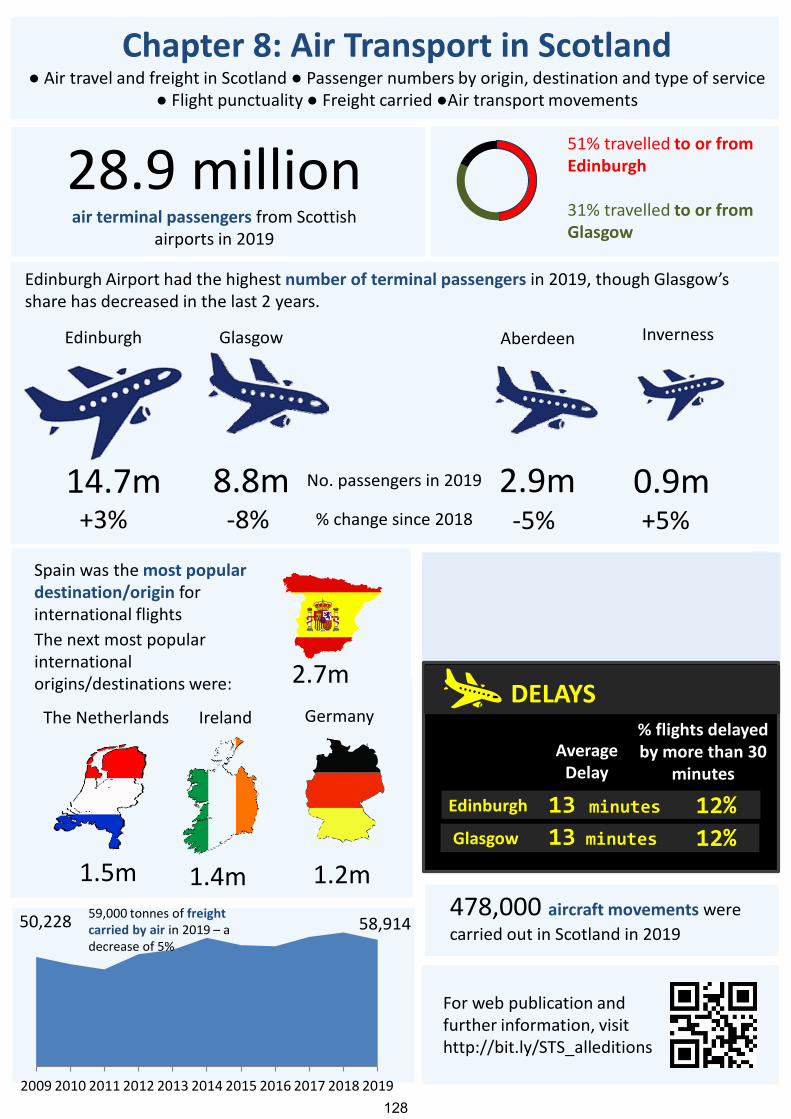
Chapter 8: Air Transport in Scotland● Air travel and freight in Scotland ● Passenger numbers by origin, destination and type of service
● Flight punctuality ● Freight carried ●Air transport movements
28.9 millionair terminal passengers from Scottish
airports in 2019
51% travelled to or from Edinburgh
31% travelled to or from Glasgow
Edinburgh Airport had the highest number of terminal passengers in 2019, though Glasgow’s share has decreased in the last 2 years.
Spain was the most popular destination/origin for international flights
2.7m
The next most popular international origins/destinations were:
1.4m
IrelandThe Netherlands
1.5m
Average Delay
% flights delayed by more than 30
minutes
For web publication and further information, visithttp://bit.ly/STS_alleditions
Germany
1.2m478,000 aircraft movements were carried out in Scotland in 2019
Edinburgh
14.7m+3%
Glasgow
8.8m‐8%
Aberdeen
2.9m‐5%
Inverness
0.9m+5%% change since 2018
No. passengers in 2019
Edinburgh
Glasgow
DELAYS
Average Delay
% flights delayed by more than 30
minutes
13 minutes
13 minutes
12%
12%
2009 2010 2011 2012 2013 2014 2015 2016 2017 2018 2019
58,91459,000 tonnes of freight carried by air in 2019 – a decrease of 5%
50,228
128
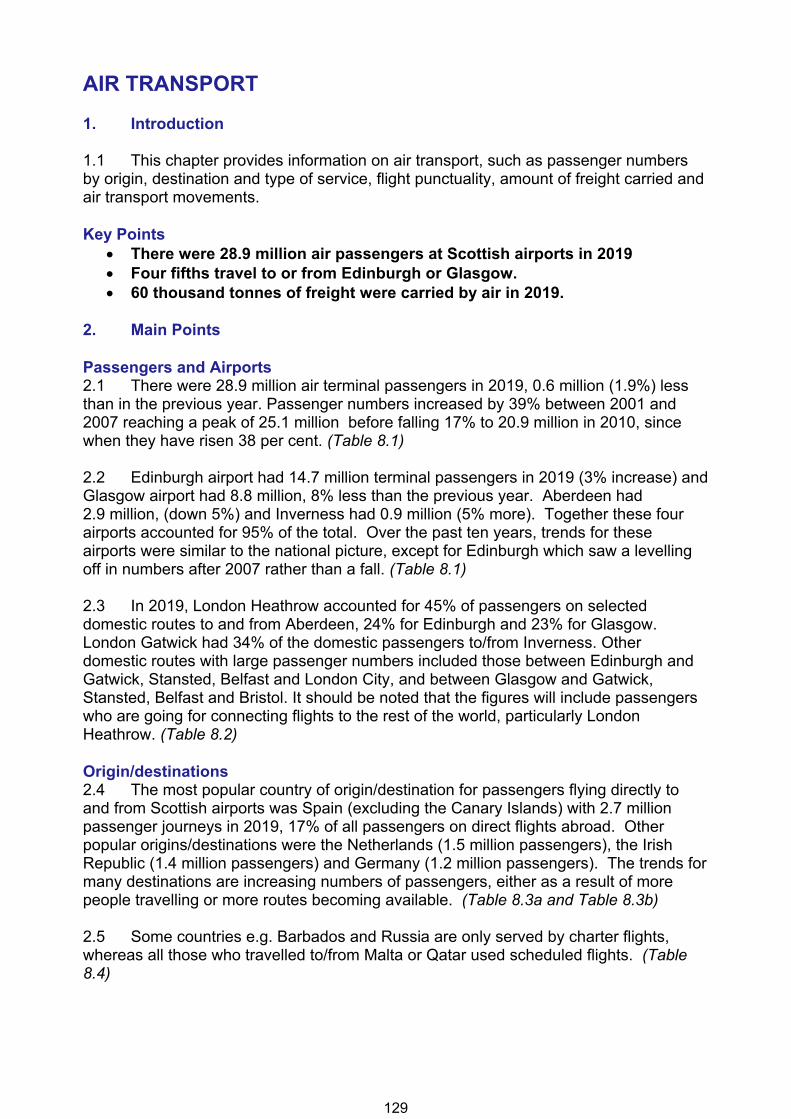
AIR TRANSPORT 1. Introduction 1.1 This chapter provides information on air transport, such as passenger numbers by origin, destination and type of service, flight punctuality, amount of freight carried and air transport movements. Key Points
There were 28.9 million air passengers at Scottish airports in 2019 Four fifths travel to or from Edinburgh or Glasgow. 60 thousand tonnes of freight were carried by air in 2019.
2. Main Points Passengers and Airports 2.1 There were 28.9 million air terminal passengers in 2019, 0.6 million (1.9%) less than in the previous year. Passenger numbers increased by 39% between 2001 and 2007 reaching a peak of 25.1 million before falling 17% to 20.9 million in 2010, since when they have risen 38 per cent. (Table 8.1) 2.2 Edinburgh airport had 14.7 million terminal passengers in 2019 (3% increase) and Glasgow airport had 8.8 million, 8% less than the previous year. Aberdeen had 2.9 million, (down 5%) and Inverness had 0.9 million (5% more). Together these four airports accounted for 95% of the total. Over the past ten years, trends for these airports were similar to the national picture, except for Edinburgh which saw a levelling off in numbers after 2007 rather than a fall. (Table 8.1) 2.3 In 2019, London Heathrow accounted for 45% of passengers on selected domestic routes to and from Aberdeen, 24% for Edinburgh and 23% for Glasgow. London Gatwick had 34% of the domestic passengers to/from Inverness. Other domestic routes with large passenger numbers included those between Edinburgh and Gatwick, Stansted, Belfast and London City, and between Glasgow and Gatwick, Stansted, Belfast and Bristol. It should be noted that the figures will include passengers who are going for connecting flights to the rest of the world, particularly London Heathrow. (Table 8.2) Origin/destinations 2.4 The most popular country of origin/destination for passengers flying directly to and from Scottish airports was Spain (excluding the Canary Islands) with 2.7 million passenger journeys in 2019, 17% of all passengers on direct flights abroad. Other popular origins/destinations were the Netherlands (1.5 million passengers), the Irish Republic (1.4 million passengers) and Germany (1.2 million passengers). The trends for many destinations are increasing numbers of passengers, either as a result of more people travelling or more routes becoming available. (Table 8.3a and Table 8.3b) 2.5 Some countries e.g. Barbados and Russia are only served by charter flights, whereas all those who travelled to/from Malta or Qatar used scheduled flights. (Table 8.4)
129
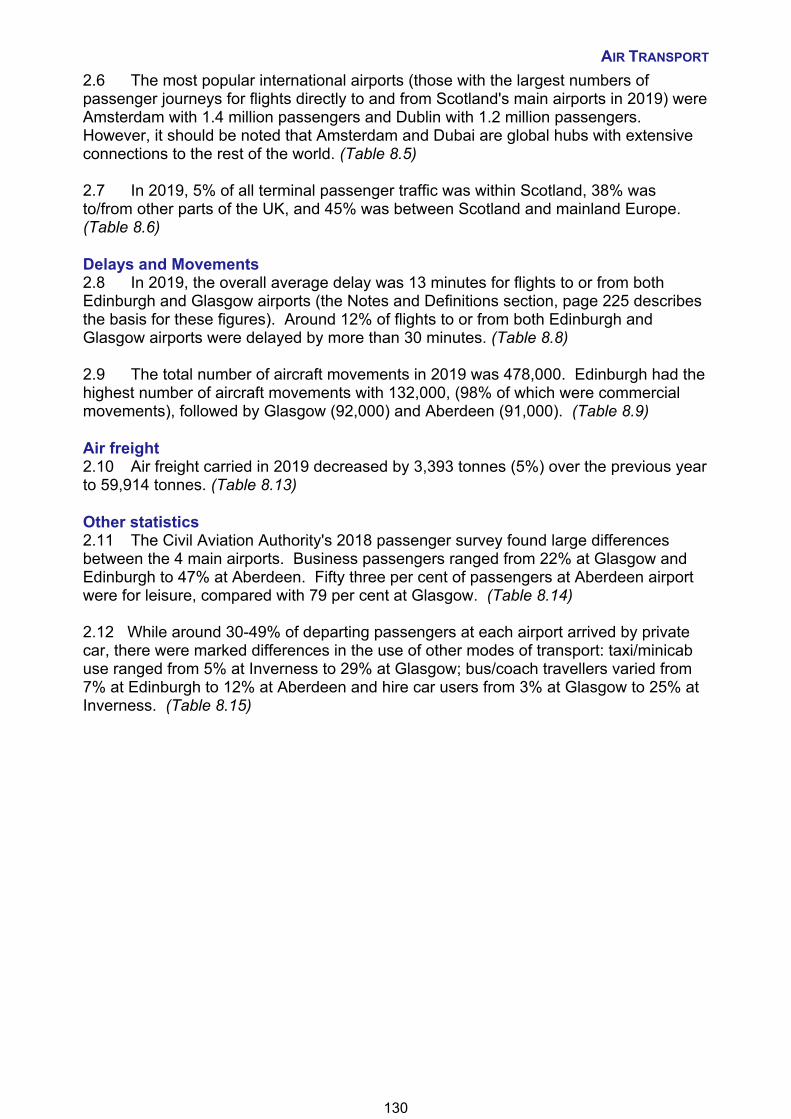
AIR TRANSPORT
2.6 The most popular international airports (those with the largest numbers of passenger journeys for flights directly to and from Scotland's main airports in 2019) were Amsterdam with 1.4 million passengers and Dublin with 1.2 million passengers. However, it should be noted that Amsterdam and Dubai are global hubs with extensive connections to the rest of the world. (Table 8.5) 2.7 In 2019, 5% of all terminal passenger traffic was within Scotland, 38% was to/from other parts of the UK, and 45% was between Scotland and mainland Europe. (Table 8.6) Delays and Movements 2.8 In 2019, the overall average delay was 13 minutes for flights to or from both Edinburgh and Glasgow airports (the Notes and Definitions section, page 225 describes the basis for these figures). Around 12% of flights to or from both Edinburgh and Glasgow airports were delayed by more than 30 minutes. (Table 8.8) 2.9 The total number of aircraft movements in 2019 was 478,000. Edinburgh had the highest number of aircraft movements with 132,000, (98% of which were commercial movements), followed by Glasgow (92,000) and Aberdeen (91,000). (Table 8.9) Air freight 2.10 Air freight carried in 2019 decreased by 3,393 tonnes (5%) over the previous year to 59,914 tonnes. (Table 8.13) Other statistics 2.11 The Civil Aviation Authority's 2018 passenger survey found large differences between the 4 main airports. Business passengers ranged from 22% at Glasgow and Edinburgh to 47% at Aberdeen. Fifty three per cent of passengers at Aberdeen airport were for leisure, compared with 79 per cent at Glasgow. (Table 8.14) 2.12 While around 30-49% of departing passengers at each airport arrived by private car, there were marked differences in the use of other modes of transport: taxi/minicab use ranged from 5% at Inverness to 29% at Glasgow; bus/coach travellers varied from 7% at Edinburgh to 12% at Aberdeen and hire car users from 3% at Glasgow to 25% at Inverness. (Table 8.15)
130
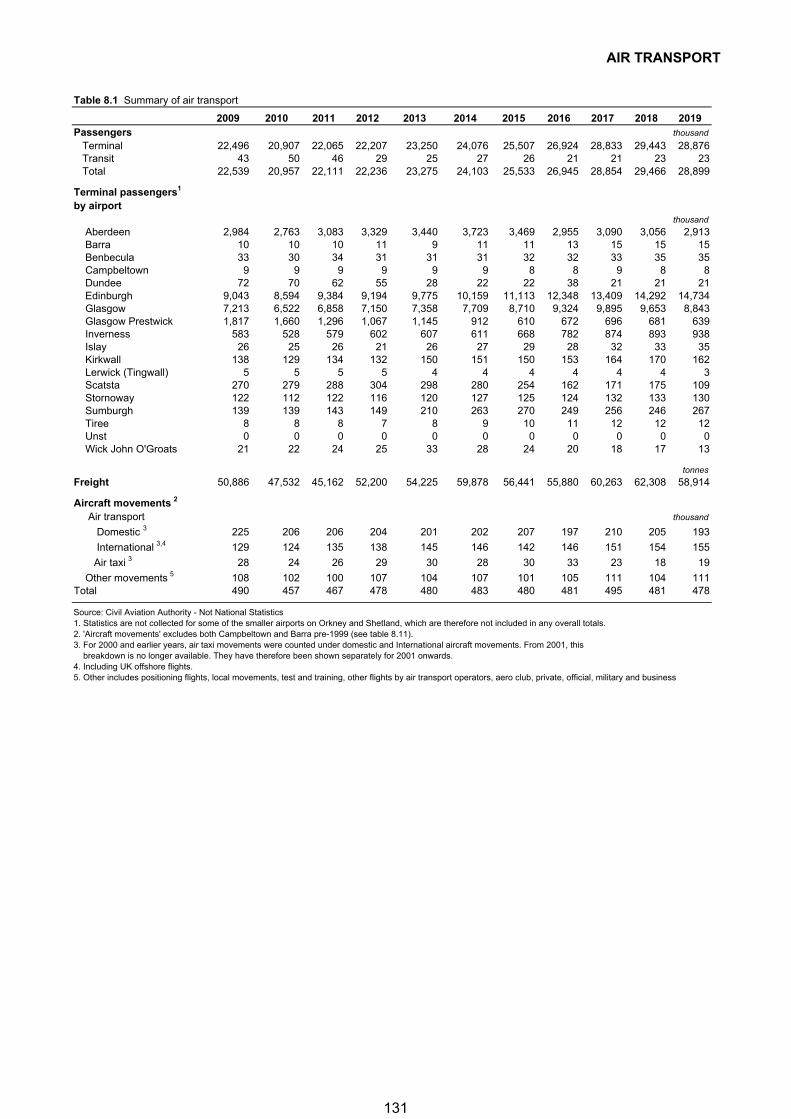
AIR TRANSPORT
Table 8.1 Summary of air transport
2009 2010 2011 2012 2013 2014 2015 2016 2017 2018 2019Passengers thousand
Terminal 22,496 20,907 22,065 22,207 23,250 24,076 25,507 26,924 28,833 29,443 28,876 Transit 43 50 46 29 25 27 26 21 21 23 23 Total 22,539 20,957 22,111 22,236 23,275 24,103 25,533 26,945 28,854 29,466 28,899
Terminal passengers1
by airportthousand
Aberdeen 2,984 2,763 3,083 3,329 3,440 3,723 3,469 2,955 3,090 3,056 2,913 Barra 10 10 10 11 9 11 11 13 15 15 15 Benbecula 33 30 34 31 31 31 32 32 33 35 35 Campbeltown 9 9 9 9 9 9 8 8 9 8 8 Dundee 72 70 62 55 28 22 22 38 21 21 21 Edinburgh 9,043 8,594 9,384 9,194 9,775 10,159 11,113 12,348 13,409 14,292 14,734 Glasgow 7,213 6,522 6,858 7,150 7,358 7,709 8,710 9,324 9,895 9,653 8,843 Glasgow Prestwick 1,817 1,660 1,296 1,067 1,145 912 610 672 696 681 639 Inverness 583 528 579 602 607 611 668 782 874 893 938 Islay 26 25 26 21 26 27 29 28 32 33 35 Kirkwall 138 129 134 132 150 151 150 153 164 170 162 Lerwick (Tingwall) 5 5 5 5 4 4 4 4 4 4 3 Scatsta 270 279 288 304 298 280 254 162 171 175 109 Stornoway 122 112 122 116 120 127 125 124 132 133 130 Sumburgh 139 139 143 149 210 263 270 249 256 246 267 Tiree 8 8 8 7 8 9 10 11 12 12 12 Unst 0 0 0 0 0 0 0 0 0 0 0 Wick John O'Groats 21 22 24 25 33 28 24 20 18 17 13
tonnes
Freight 50,886 47,532 45,162 52,200 54,225 59,878 56,441 55,880 60,263 62,308 58,914
Aircraft movements 2
Air transport thousand
Domestic 3 225 206 206 204 201 202 207 197 210 205 193
International 3,4 129 124 135 138 145 146 142 146 151 154 155
Air taxi 3 28 24 26 29 30 28 30 33 23 18 19
Other movements 5 108 102 100 107 104 107 101 105 111 104 111Total 490 457 467 478 480 483 480 481 495 481 478
Source: Civil Aviation Authority - Not National Statistics1. Statistics are not collected for some of the smaller airports on Orkney and Shetland, which are therefore not included in any overall totals.2. 'Aircraft movements' excludes both Campbeltown and Barra pre-1999 (see table 8.11). 3. For 2000 and earlier years, air taxi movements were counted under domestic and International aircraft movements. From 2001, this breakdown is no longer available. They have therefore been shown separately for 2001 onwards.4. Including UK offshore flights.5. Other includes positioning flights, local movements, test and training, other flights by air transport operators, aero club, private, official, military and business
131
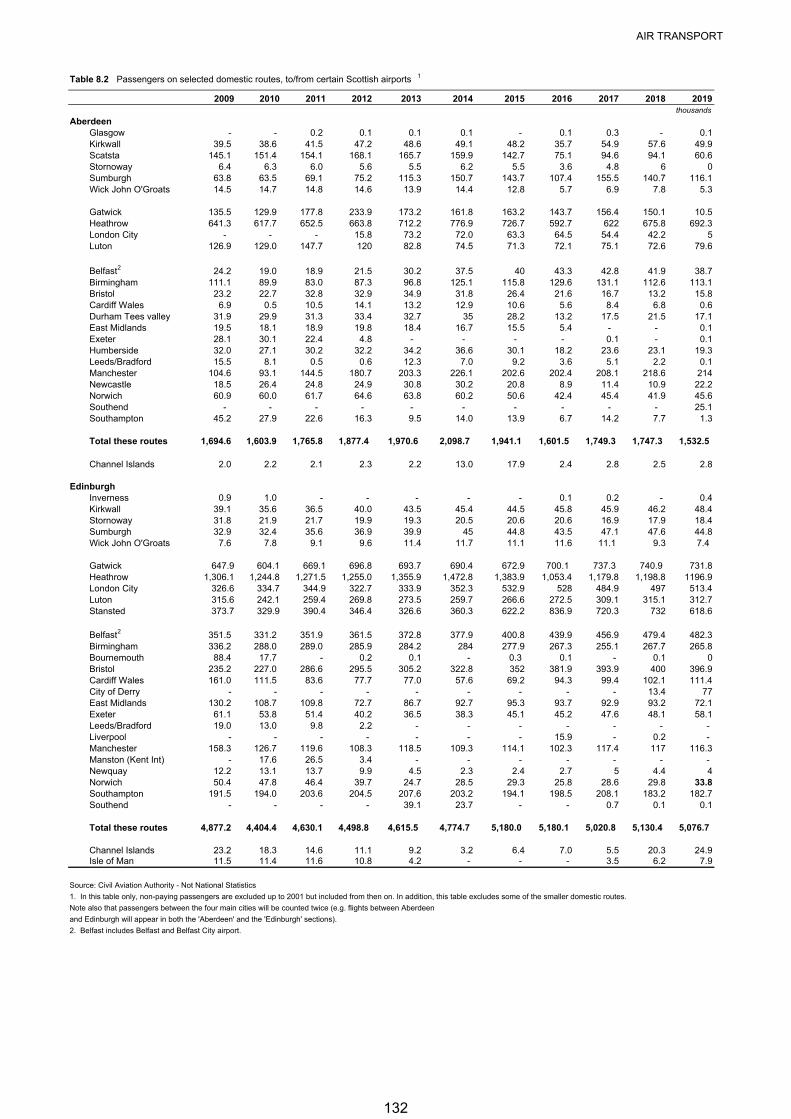
AIR TRANSPORT
Table 8.2 Passengers on selected domestic routes, to/from certain Scottish airports 1
2009 2010 2011 2012 2013 2014 2015 2016 2017 2018 2019thousands
AberdeenGlasgow - - 0.2 0.1 0.1 0.1 - 0.1 0.3 - 0.1Kirkwall 39.5 38.6 41.5 47.2 48.6 49.1 48.2 35.7 54.9 57.6 49.9Scatsta 145.1 151.4 154.1 168.1 165.7 159.9 142.7 75.1 94.6 94.1 60.6Stornoway 6.4 6.3 6.0 5.6 5.5 6.2 5.5 3.6 4.8 6 0Sumburgh 63.8 63.5 69.1 75.2 115.3 150.7 143.7 107.4 155.5 140.7 116.1Wick John O'Groats 14.5 14.7 14.8 14.6 13.9 14.4 12.8 5.7 6.9 7.8 5.3
Gatwick 135.5 129.9 177.8 233.9 173.2 161.8 163.2 143.7 156.4 150.1 10.5Heathrow 641.3 617.7 652.5 663.8 712.2 776.9 726.7 592.7 622 675.8 692.3London City - - - 15.8 73.2 72.0 63.3 64.5 54.4 42.2 5Luton 126.9 129.0 147.7 120 82.8 74.5 71.3 72.1 75.1 72.6 79.6
Belfast2 24.2 19.0 18.9 21.5 30.2 37.5 40 43.3 42.8 41.9 38.7Birmingham 111.1 89.9 83.0 87.3 96.8 125.1 115.8 129.6 131.1 112.6 113.1Bristol 23.2 22.7 32.8 32.9 34.9 31.8 26.4 21.6 16.7 13.2 15.8Cardiff Wales 6.9 0.5 10.5 14.1 13.2 12.9 10.6 5.6 8.4 6.8 0.6Durham Tees valley 31.9 29.9 31.3 33.4 32.7 35 28.2 13.2 17.5 21.5 17.1East Midlands 19.5 18.1 18.9 19.8 18.4 16.7 15.5 5.4 - - 0.1Exeter 28.1 30.1 22.4 4.8 - - - - 0.1 - 0.1Humberside 32.0 27.1 30.2 32.2 34.2 36.6 30.1 18.2 23.6 23.1 19.3Leeds/Bradford 15.5 8.1 0.5 0.6 12.3 7.0 9.2 3.6 5.1 2.2 0.1Manchester 104.6 93.1 144.5 180.7 203.3 226.1 202.6 202.4 208.1 218.6 214Newcastle 18.5 26.4 24.8 24.9 30.8 30.2 20.8 8.9 11.4 10.9 22.2Norwich 60.9 60.0 61.7 64.6 63.8 60.2 50.6 42.4 45.4 41.9 45.6Southend - - - - - - - - - - 25.1Southampton 45.2 27.9 22.6 16.3 9.5 14.0 13.9 6.7 14.2 7.7 1.3
Total these routes 1,694.6 1,603.9 1,765.8 1,877.4 1,970.6 2,098.7 1,941.1 1,601.5 1,749.3 1,747.3 1,532.5
Channel Islands 2.0 2.2 2.1 2.3 2.2 13.0 17.9 2.4 2.8 2.5 2.8
EdinburghInverness 0.9 1.0 - - - - - 0.1 0.2 - 0.4Kirkwall 39.1 35.6 36.5 40.0 43.5 45.4 44.5 45.8 45.9 46.2 48.4Stornoway 31.8 21.9 21.7 19.9 19.3 20.5 20.6 20.6 16.9 17.9 18.4Sumburgh 32.9 32.4 35.6 36.9 39.9 45 44.8 43.5 47.1 47.6 44.8Wick John O'Groats 7.6 7.8 9.1 9.6 11.4 11.7 11.1 11.6 11.1 9.3 7.4
Gatwick 647.9 604.1 669.1 696.8 693.7 690.4 672.9 700.1 737.3 740.9 731.8Heathrow 1,306.1 1,244.8 1,271.5 1,255.0 1,355.9 1,472.8 1,383.9 1,053.4 1,179.8 1,198.8 1196.9London City 326.6 334.7 344.9 322.7 333.9 352.3 532.9 528 484.9 497 513.4Luton 315.6 242.1 259.4 269.8 273.5 259.7 266.6 272.5 309.1 315.1 312.7Stansted 373.7 329.9 390.4 346.4 326.6 360.3 622.2 836.9 720.3 732 618.6
Belfast2 351.5 331.2 351.9 361.5 372.8 377.9 400.8 439.9 456.9 479.4 482.3Birmingham 336.2 288.0 289.0 285.9 284.2 284 277.9 267.3 255.1 267.7 265.8Bournemouth 88.4 17.7 - 0.2 0.1 - 0.3 0.1 - 0.1 0Bristol 235.2 227.0 286.6 295.5 305.2 322.8 352 381.9 393.9 400 396.9Cardiff Wales 161.0 111.5 83.6 77.7 77.0 57.6 69.2 94.3 99.4 102.1 111.4City of Derry - - - - - - - - - 13.4 77East Midlands 130.2 108.7 109.8 72.7 86.7 92.7 95.3 93.7 92.9 93.2 72.1Exeter 61.1 53.8 51.4 40.2 36.5 38.3 45.1 45.2 47.6 48.1 58.1Leeds/Bradford 19.0 13.0 9.8 2.2 - - - - - - - Liverpool - - - - - - - 15.9 - 0.2 - Manchester 158.3 126.7 119.6 108.3 118.5 109.3 114.1 102.3 117.4 117 116.3Manston (Kent Int) - 17.6 26.5 3.4 - - - - - - - Newquay 12.2 13.1 13.7 9.9 4.5 2.3 2.4 2.7 5 4.4 4Norwich 50.4 47.8 46.4 39.7 24.7 28.5 29.3 25.8 28.6 29.8 33.8Southampton 191.5 194.0 203.6 204.5 207.6 203.2 194.1 198.5 208.1 183.2 182.7Southend - - - - 39.1 23.7 - - 0.7 0.1 0.1
Total these routes 4,877.2 4,404.4 4,630.1 4,498.8 4,615.5 4,774.7 5,180.0 5,180.1 5,020.8 5,130.4 5,076.7
Channel Islands 23.2 18.3 14.6 11.1 9.2 3.2 6.4 7.0 5.5 20.3 24.9Isle of Man 11.5 11.4 11.6 10.8 4.2 - - - 3.5 6.2 7.9
Source: Civil Aviation Authority - Not National Statistics
1. In this table only, non-paying passengers are excluded up to 2001 but included from then on. In addition, this table excludes some of the smaller domestic routes.
Note also that passengers between the four main cities will be counted twice (e.g. flights between Aberdeen
and Edinburgh will appear in both the 'Aberdeen' and the 'Edinburgh' sections).
2. Belfast includes Belfast and Belfast City airport.
132
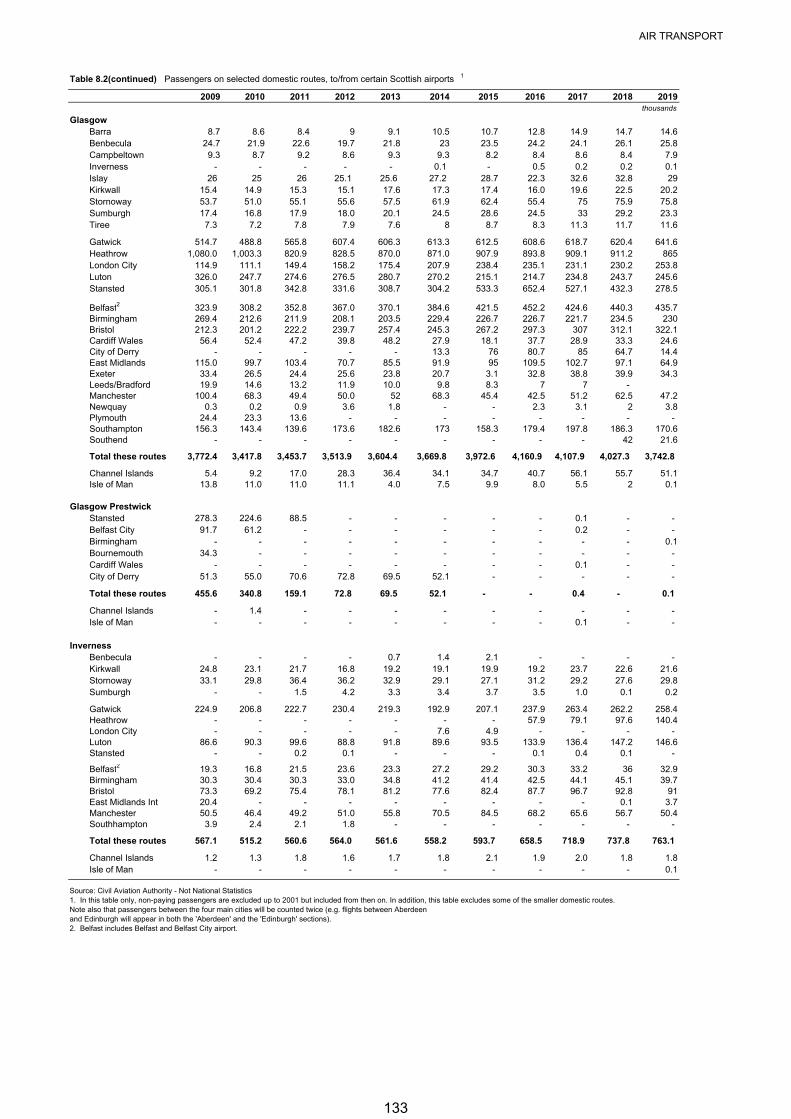
AIR TRANSPORT
Table 8.2(continued) Passengers on selected domestic routes, to/from certain Scottish airports 1
2009 2010 2011 2012 2013 2014 2015 2016 2017 2018 2019thousands
GlasgowBarra 8.7 8.6 8.4 9 9.1 10.5 10.7 12.8 14.9 14.7 14.6Benbecula 24.7 21.9 22.6 19.7 21.8 23 23.5 24.2 24.1 26.1 25.8Campbeltown 9.3 8.7 9.2 8.6 9.3 9.3 8.2 8.4 8.6 8.4 7.9Inverness - - - - - 0.1 - 0.5 0.2 0.2 0.1Islay 26 25 26 25.1 25.6 27.2 28.7 22.3 32.6 32.8 29Kirkwall 15.4 14.9 15.3 15.1 17.6 17.3 17.4 16.0 19.6 22.5 20.2Stornoway 53.7 51.0 55.1 55.6 57.5 61.9 62.4 55.4 75 75.9 75.8Sumburgh 17.4 16.8 17.9 18.0 20.1 24.5 28.6 24.5 33 29.2 23.3Tiree 7.3 7.2 7.8 7.9 7.6 8 8.7 8.3 11.3 11.7 11.6
Gatwick 514.7 488.8 565.8 607.4 606.3 613.3 612.5 608.6 618.7 620.4 641.6Heathrow 1,080.0 1,003.3 820.9 828.5 870.0 871.0 907.9 893.8 909.1 911.2 865London City 114.9 111.1 149.4 158.2 175.4 207.9 238.4 235.1 231.1 230.2 253.8Luton 326.0 247.7 274.6 276.5 280.7 270.2 215.1 214.7 234.8 243.7 245.6Stansted 305.1 301.8 342.8 331.6 308.7 304.2 533.3 652.4 527.1 432.3 278.5
Belfast2 323.9 308.2 352.8 367.0 370.1 384.6 421.5 452.2 424.6 440.3 435.7Birmingham 269.4 212.6 211.9 208.1 203.5 229.4 226.7 226.7 221.7 234.5 230Bristol 212.3 201.2 222.2 239.7 257.4 245.3 267.2 297.3 307 312.1 322.1Cardiff Wales 56.4 52.4 47.2 39.8 48.2 27.9 18.1 37.7 28.9 33.3 24.6City of Derry - - - - - 13.3 76 80.7 85 64.7 14.4East Midlands 115.0 99.7 103.4 70.7 85.5 91.9 95 109.5 102.7 97.1 64.9Exeter 33.4 26.5 24.4 25.6 23.8 20.7 3.1 32.8 38.8 39.9 34.3Leeds/Bradford 19.9 14.6 13.2 11.9 10.0 9.8 8.3 7 7 - Manchester 100.4 68.3 49.4 50.0 52 68.3 45.4 42.5 51.2 62.5 47.2Newquay 0.3 0.2 0.9 3.6 1.8 - - 2.3 3.1 2 3.8Plymouth 24.4 23.3 13.6 - - - - - - - - Southampton 156.3 143.4 139.6 173.6 182.6 173 158.3 179.4 197.8 186.3 170.6Southend - - - - - - - - - 42 21.6
Total these routes 3,772.4 3,417.8 3,453.7 3,513.9 3,604.4 3,669.8 3,972.6 4,160.9 4,107.9 4,027.3 3,742.8
Channel Islands 5.4 9.2 17.0 28.3 36.4 34.1 34.7 40.7 56.1 55.7 51.1Isle of Man 13.8 11.0 11.0 11.1 4.0 7.5 9.9 8.0 5.5 2 0.1
Glasgow PrestwickStansted 278.3 224.6 88.5 - - - - - 0.1 - - Belfast City 91.7 61.2 - - - - - - 0.2 - - Birmingham - - - - - - - - - - 0.1Bournemouth 34.3 - - - - - - - - - - Cardiff Wales - - - - - - - - 0.1 - - City of Derry 51.3 55.0 70.6 72.8 69.5 52.1 - - - - -
Total these routes 455.6 340.8 159.1 72.8 69.5 52.1 - - 0.4 - 0.1
Channel Islands - 1.4 - - - - - - - - - Isle of Man - - - - - - - - 0.1 - -
InvernessBenbecula - - - - 0.7 1.4 2.1 - - - - Kirkwall 24.8 23.1 21.7 16.8 19.2 19.1 19.9 19.2 23.7 22.6 21.6Stornoway 33.1 29.8 36.4 36.2 32.9 29.1 27.1 31.2 29.2 27.6 29.8Sumburgh - - 1.5 4.2 3.3 3.4 3.7 3.5 1.0 0.1 0.2
Gatwick 224.9 206.8 222.7 230.4 219.3 192.9 207.1 237.9 263.4 262.2 258.4Heathrow - - - - - - - 57.9 79.1 97.6 140.4London City - - - - - 7.6 4.9 - - - - Luton 86.6 90.3 99.6 88.8 91.8 89.6 93.5 133.9 136.4 147.2 146.6Stansted - - 0.2 0.1 - - - 0.1 0.4 0.1 -
Belfast2 19.3 16.8 21.5 23.6 23.3 27.2 29.2 30.3 33.2 36 32.9Birmingham 30.3 30.4 30.3 33.0 34.8 41.2 41.4 42.5 44.1 45.1 39.7Bristol 73.3 69.2 75.4 78.1 81.2 77.6 82.4 87.7 96.7 92.8 91East Midlands Int 20.4 - - - - - - - - 0.1 3.7Manchester 50.5 46.4 49.2 51.0 55.8 70.5 84.5 68.2 65.6 56.7 50.4Southhampton 3.9 2.4 2.1 1.8 - - - - - - -
Total these routes 567.1 515.2 560.6 564.0 561.6 558.2 593.7 658.5 718.9 737.8 763.1
Channel Islands 1.2 1.3 1.8 1.6 1.7 1.8 2.1 1.9 2.0 1.8 1.8Isle of Man - - - - - - - - - - 0.1
Source: Civil Aviation Authority - Not National Statistics1. In this table only, non-paying passengers are excluded up to 2001 but included from then on. In addition, this table excludes some of the smaller domestic routes. Note also that passengers between the four main cities will be counted twice (e.g. flights between Aberdeen and Edinburgh will appear in both the 'Aberdeen' and the 'Edinburgh' sections).2. Belfast includes Belfast and Belfast City airport.
133
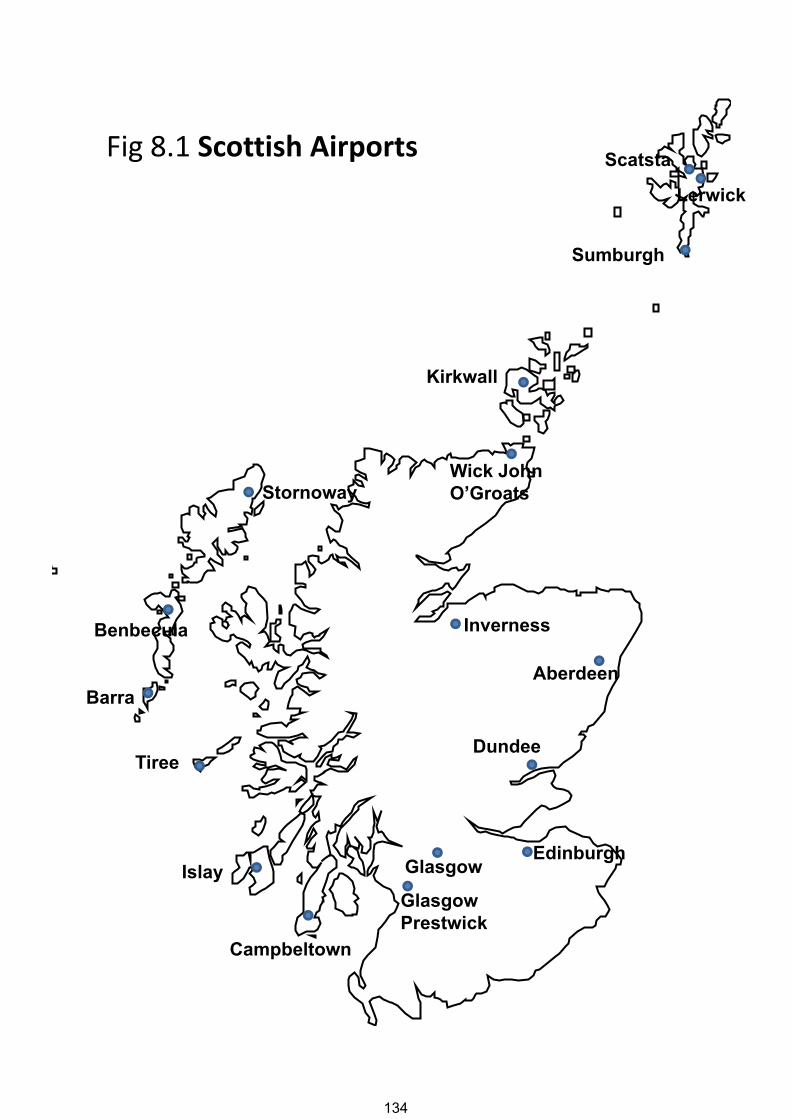
Inverness
Aberdeen
EdinburghGlasgow
GlasgowPrestwick
Stornoway
Benbecula
Barra
Wick John O’Groats
Fig 8.1 Scottish Airports
Sumburgh
Lerwick
Scatsta
DundeeTiree
Islay
Campbeltown
Kirkwall
134
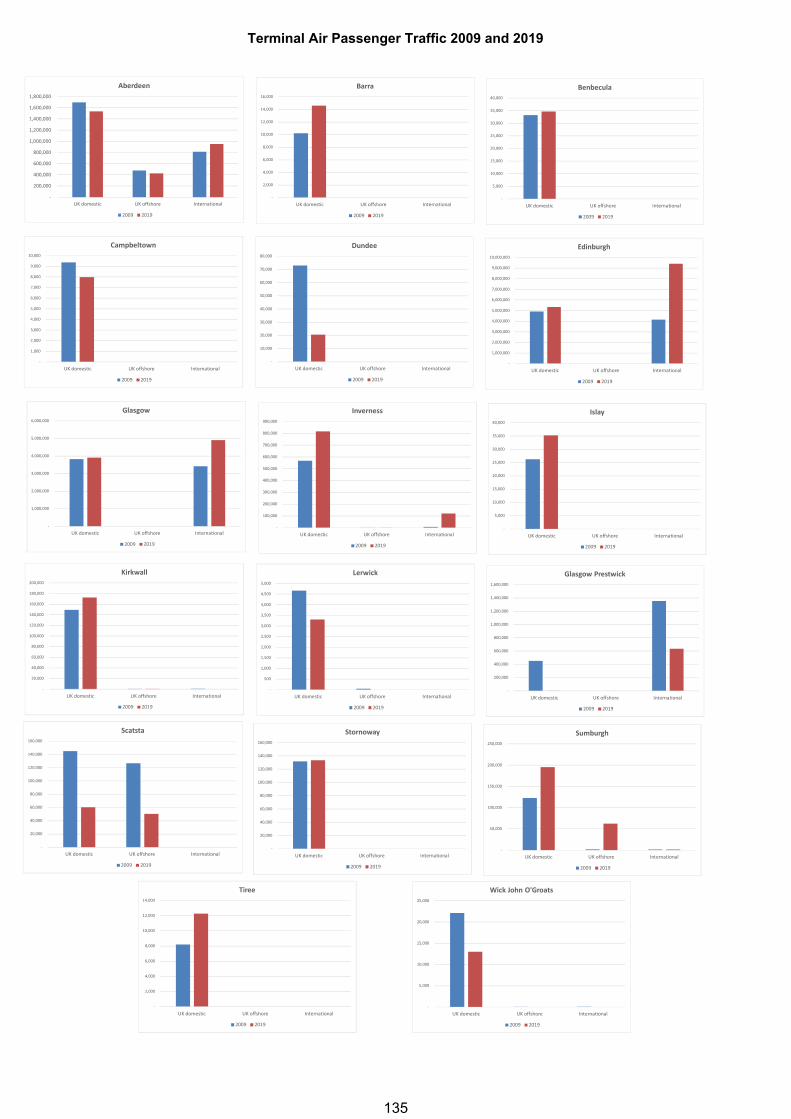
Terminal Air Passenger Traffic 2009 and 2019
‐
1,000
2,000
3,000
4,000
5,000
6,000
7,000
8,000
9,000
10,000
UK domestic UK offshore International
Campbeltown
2009 2019
‐
10,000
20,000
30,000
40,000
50,000
60,000
70,000
80,000
UK domestic UK offshore International
Dundee
2009 2019
‐
1,000,000
2,000,000
3,000,000
4,000,000
5,000,000
6,000,000
7,000,000
8,000,000
9,000,000
10,000,000
UK domestic UK offshore International
Edinburgh
2009 2019
‐
1,000,000
2,000,000
3,000,000
4,000,000
5,000,000
6,000,000
UK domestic UK offshore International
Glasgow
2009 2019
‐
100,000
200,000
300,000
400,000
500,000
600,000
700,000
800,000
900,000
UK domestic UK offshore International
Inverness
2009 2019
‐
5,000
10,000
15,000
20,000
25,000
30,000
35,000
40,000
UK domestic UK offshore International
Islay
2009 2019
‐
20,000
40,000
60,000
80,000
100,000
120,000
140,000
160,000
180,000
200,000
UK domestic UK offshore International
Kirkwall
2009 2019
‐
500
1,000
1,500
2,000
2,500
3,000
3,500
4,000
4,500
5,000
UK domestic UK offshore International
Lerwick
2009 2019
‐
200,000
400,000
600,000
800,000
1,000,000
1,200,000
1,400,000
1,600,000
UK domestic UK offshore International
Glasgow Prestwick
2009 2019
‐
20,000
40,000
60,000
80,000
100,000
120,000
140,000
160,000
UK domestic UK offshore International
Scatsta
2009 2019
‐
20,000
40,000
60,000
80,000
100,000
120,000
140,000
160,000
UK domestic UK offshore International
Stornoway
2009 2019
‐
50,000
100,000
150,000
200,000
250,000
UK domestic UK offshore International
Sumburgh
2009 2019
‐
2,000
4,000
6,000
8,000
10,000
12,000
14,000
UK domestic UK offshore International
Tiree
2009 2019
‐
5,000
10,000
15,000
20,000
25,000
UK domestic UK offshore International
Wick John O'Groats
2009 2019
‐
200,000
400,000
600,000
800,000
1,000,000
1,200,000
1,400,000
1,600,000
1,800,000
UK domestic UK offshore International
Aberdeen
2009 2019
‐
2,000
4,000
6,000
8,000
10,000
12,000
14,000
16,000
UK domestic UK offshore International
Barra
2009 2019
‐
5,000
10,000
15,000
20,000
25,000
30,000
35,000
40,000
UK domestic UK offshore International
Benbecula
2009 2019
135
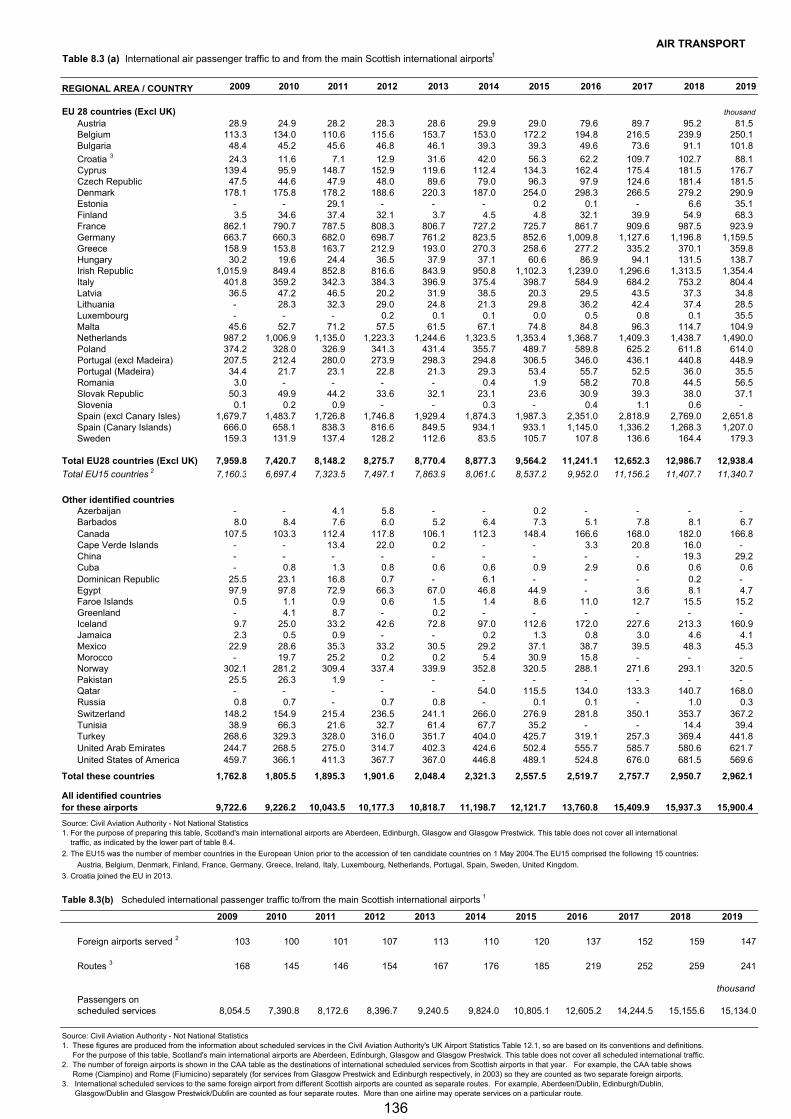
AIR TRANSPORTTable 8.3 (a) International air passenger traffic to and from the main Scottish international airports 1
REGIONAL AREA / COUNTRY 2009 2010 2011 2012 2013 2014 2015 2016 2017 2018 2019
EU 28 countries (Excl UK) thousand
Austria 28.9 24.9 28.2 28.3 28.6 29.9 29.0 79.6 89.7 95.2 81.5 Belgium 113.3 134.0 110.6 115.6 153.7 153.0 172.2 194.8 216.5 239.9 250.1 Bulgaria 48.4 45.2 45.6 46.8 46.1 39.3 39.3 49.6 73.6 91.1 101.8
Croatia 3 24.3 11.6 7.1 12.9 31.6 42.0 56.3 62.2 109.7 102.7 88.1 Cyprus 139.4 95.9 148.7 152.9 119.6 112.4 134.3 162.4 175.4 181.5 176.7 Czech Republic 47.5 44.6 47.9 48.0 89.6 79.0 96.3 97.9 124.6 181.4 181.5 Denmark 178.1 175.8 178.2 188.6 220.3 187.0 254.0 298.3 266.5 279.2 290.9 Estonia - - 29.1 - - - 0.2 0.1 - 6.6 35.1 Finland 3.5 34.6 37.4 32.1 3.7 4.5 4.8 32.1 39.9 54.9 68.3 France 862.1 790.7 787.5 808.3 806.7 727.2 725.7 861.7 909.6 987.5 923.9 Germany 663.7 660.3 682.0 698.7 761.2 823.5 852.6 1,009.8 1,127.6 1,196.8 1,159.5 Greece 158.9 153.8 163.7 212.9 193.0 270.3 258.6 277.2 335.2 370.1 359.8 Hungary 30.2 19.6 24.4 36.5 37.9 37.1 60.6 86.9 94.1 131.5 138.7 Irish Republic 1,015.9 849.4 852.8 816.6 843.9 950.8 1,102.3 1,239.0 1,296.6 1,313.5 1,354.4 Italy 401.8 359.2 342.3 384.3 396.9 375.4 398.7 584.9 684.2 753.2 804.4 Latvia 36.5 47.2 46.5 20.2 31.9 38.5 20.3 29.5 43.5 37.3 34.8 Lithuania - 28.3 32.3 29.0 24.8 21.3 29.8 36.2 42.4 37.4 28.5 Luxembourg - - - 0.2 0.1 0.1 0.0 0.5 0.8 0.1 35.5 Malta 45.6 52.7 71.2 57.5 61.5 67.1 74.8 84.8 96.3 114.7 104.9 Netherlands 987.2 1,006.9 1,135.0 1,223.3 1,244.6 1,323.5 1,353.4 1,368.7 1,409.3 1,438.7 1,490.0 Poland 374.2 328.0 326.9 341.3 431.4 355.7 489.7 589.8 625.2 611.8 614.0 Portugal (excl Madeira) 207.5 212.4 280.0 273.9 298.3 294.8 306.5 346.0 436.1 440.8 448.9 Portugal (Madeira) 34.4 21.7 23.1 22.8 21.3 29.3 53.4 55.7 52.5 36.0 35.5 Romania 3.0 - - - - 0.4 1.9 58.2 70.8 44.5 56.5 Slovak Republic 50.3 49.9 44.2 33.6 32.1 23.1 23.6 30.9 39.3 38.0 37.1 Slovenia 0.1 0.2 0.9 - - 0.3 - 0.4 1.1 0.6 - Spain (excl Canary Isles) 1,679.7 1,483.7 1,726.8 1,746.8 1,929.4 1,874.3 1,987.3 2,351.0 2,818.9 2,769.0 2,651.8 Spain (Canary Islands) 666.0 658.1 838.3 816.6 849.5 934.1 933.1 1,145.0 1,336.2 1,268.3 1,207.0 Sweden 159.3 131.9 137.4 128.2 112.6 83.5 105.7 107.8 136.6 164.4 179.3
Total EU28 countries (Excl UK) 7,959.8 7,420.7 8,148.2 8,275.7 8,770.4 8,877.3 9,564.2 11,241.1 12,652.3 12,986.7 12,938.4
Total EU15 countries 2 7,160.3 6,697.4 7,323.5 7,497.1 7,863.9 8,061.0 8,537.2 9,952.0 11,156.2 11,407.7 11,340.7
Other identified countriesAzerbaijan - - 4.1 5.8 - - 0.2 - - - - Barbados 8.0 8.4 7.6 6.0 5.2 6.4 7.3 5.1 7.8 8.1 6.7 Canada 107.5 103.3 112.4 117.8 106.1 112.3 148.4 166.6 168.0 182.0 166.8 Cape Verde Islands - - 13.4 22.0 0.2 - - 3.3 20.8 16.0 - China - - - - - - - - - 19.3 29.2 Cuba - 0.8 1.3 0.8 0.6 0.6 0.9 2.9 0.6 0.6 0.6 Dominican Republic 25.5 23.1 16.8 0.7 - 6.1 - - - 0.2 - Egypt 97.9 97.8 72.9 66.3 67.0 46.8 44.9 - 3.6 8.1 4.7 Faroe Islands 0.5 1.1 0.9 0.6 1.5 1.4 8.6 11.0 12.7 15.5 15.2 Greenland - 4.1 8.7 - 0.2 - - - - - - Iceland 9.7 25.0 33.2 42.6 72.8 97.0 112.6 172.0 227.6 213.3 160.9 Jamaica 2.3 0.5 0.9 - - 0.2 1.3 0.8 3.0 4.6 4.1 Mexico 22.9 28.6 35.3 33.2 30.5 29.2 37.1 38.7 39.5 48.3 45.3 Morocco - 19.7 25.2 0.2 0.2 5.4 30.9 15.8 - - - Norway 302.1 281.2 309.4 337.4 339.9 352.8 320.5 288.1 271.6 293.1 320.5 Pakistan 25.5 26.3 1.9 - - - - - - - - Qatar - - - - - 54.0 115.5 134.0 133.3 140.7 168.0 Russia 0.8 0.7 - 0.7 0.8 - 0.1 0.1 - 1.0 0.3 Switzerland 148.2 154.9 215.4 236.5 241.1 266.0 276.9 281.8 350.1 353.7 367.2 Tunisia 38.9 66.3 21.6 32.7 61.4 67.7 35.2 - - 14.4 39.4 Turkey 268.6 329.3 328.0 316.0 351.7 404.0 425.7 319.1 257.3 369.4 441.8 United Arab Emirates 244.7 268.5 275.0 314.7 402.3 424.6 502.4 555.7 585.7 580.6 621.7 United States of America 459.7 366.1 411.3 367.7 367.0 446.8 489.1 524.8 676.0 681.5 569.6
Total these countries 1,762.8 1,805.5 1,895.3 1,901.6 2,048.4 2,321.3 2,557.5 2,519.7 2,757.7 2,950.7 2,962.1
All identified countriesfor these airports 9,722.6 9,226.2 10,043.5 10,177.3 10,818.7 11,198.7 12,121.7 13,760.8 15,409.9 15,937.3 15,900.4
Source: Civil Aviation Authority - Not National Statistics1. For the purpose of preparing this table, Scotland's main international airports are Aberdeen, Edinburgh, Glasgow and Glasgow Prestwick. This table does not cover all international traffic, as indicated by the lower part of table 8.4.
2. The EU15 was the number of member countries in the European Union prior to the accession of ten candidate countries on 1 May 2004.The EU15 comprised the following 15 countries:
Austria, Belgium, Denmark, Finland, France, Germany, Greece, Ireland, Italy, Luxembourg, Netherlands, Portugal, Spain, Sweden, United Kingdom.
3. Croatia joined the EU in 2013.
Table 8.3(b) Scheduled international passenger traffic to/from the main Scottish international airports 1
2009 2010 2011 2012 2013 2014 2015 2016 2017 2018 2019
Foreign airports served 2 103 100 101 107 113 110 120 137 152 159 147
Routes 3 168 145 146 154 167 176 185 219 252 259 241
thousandPassengers on scheduled services 8,054.5 7,390.8 8,172.6 8,396.7 9,240.5 9,824.0 10,805.1 12,605.2 14,244.5 15,155.6 15,134.0
Source: Civil Aviation Authority - Not National Statistics1. These figures are produced from the information about scheduled services in the Civil Aviation Authority's UK Airport Statistics Table 12.1, so are based on its conventions and definitions. For the purpose of this table, Scotland's main international airports are Aberdeen, Edinburgh, Glasgow and Glasgow Prestwick. This table does not cover all scheduled international traffic.2. The number of foreign airports is shown in the CAA table as the destinations of international scheduled services from Scottish airports in that year. For example, the CAA table shows Rome (Ciampino) and Rome (Fiumicino) separately (for services from Glasgow Prestwick and Edinburgh respectively, in 2003) so they are counted as two separate foreign airports.3. International scheduled services to the same foreign airport from different Scottish airports are counted as separate routes. For example, Aberdeen/Dublin, Edinburgh/Dublin, Glasgow/Dublin and Glasgow Prestwick/Dublin are counted as four separate routes. More than one airline may operate services on a particular route.
136
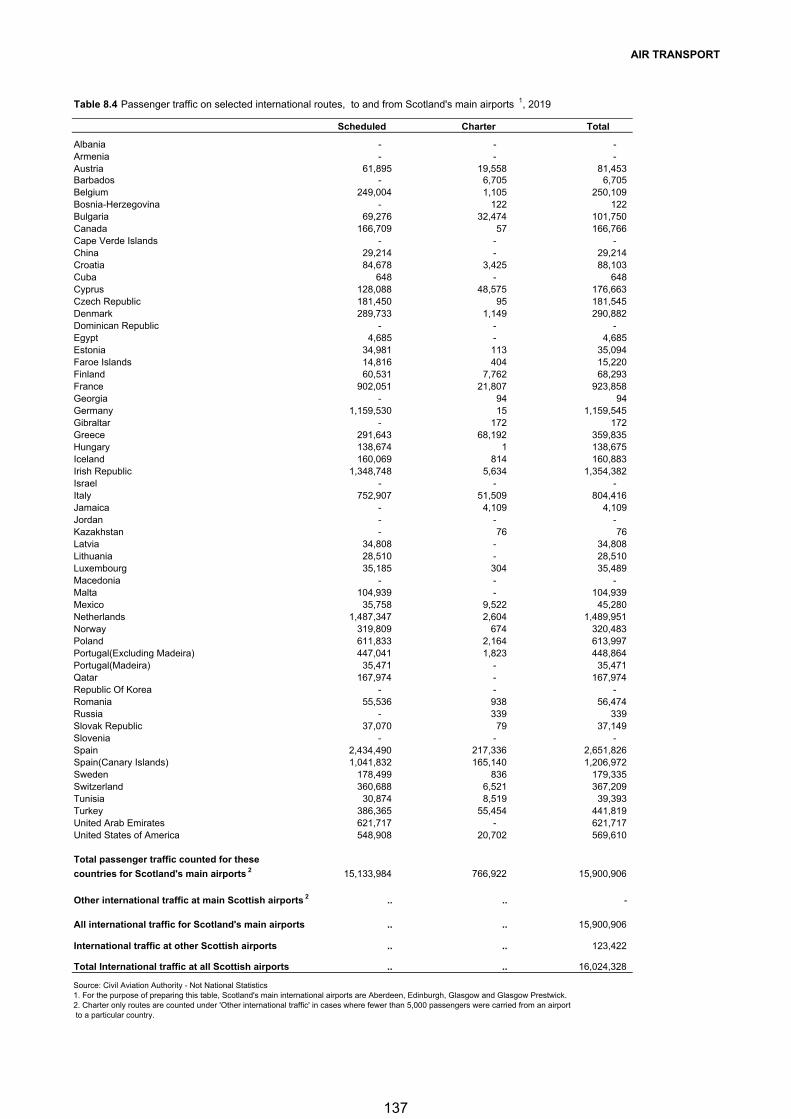
AIR TRANSPORT
Table 8.4 Passenger traffic on selected international routes, to and from Scotland's main airports 1, 2019
Scheduled Charter Total
Albania - - - Armenia - - - Austria 61,895 19,558 81,453 Barbados - 6,705 6,705 Belgium 249,004 1,105 250,109 Bosnia-Herzegovina - 122 122 Bulgaria 69,276 32,474 101,750 Canada 166,709 57 166,766 Cape Verde Islands - - - China 29,214 - 29,214 Croatia 84,678 3,425 88,103 Cuba 648 - 648 Cyprus 128,088 48,575 176,663 Czech Republic 181,450 95 181,545 Denmark 289,733 1,149 290,882 Dominican Republic - - - Egypt 4,685 - 4,685 Estonia 34,981 113 35,094 Faroe Islands 14,816 404 15,220 Finland 60,531 7,762 68,293 France 902,051 21,807 923,858 Georgia - 94 94 Germany 1,159,530 15 1,159,545 Gibraltar - 172 172 Greece 291,643 68,192 359,835 Hungary 138,674 1 138,675 Iceland 160,069 814 160,883 Irish Republic 1,348,748 5,634 1,354,382 Israel - - - Italy 752,907 51,509 804,416 Jamaica - 4,109 4,109 Jordan - - - Kazakhstan - 76 76 Latvia 34,808 - 34,808 Lithuania 28,510 - 28,510 Luxembourg 35,185 304 35,489 Macedonia - - - Malta 104,939 - 104,939 Mexico 35,758 9,522 45,280 Netherlands 1,487,347 2,604 1,489,951 Norway 319,809 674 320,483 Poland 611,833 2,164 613,997 Portugal(Excluding Madeira) 447,041 1,823 448,864 Portugal(Madeira) 35,471 - 35,471 Qatar 167,974 - 167,974 Republic Of Korea - - - Romania 55,536 938 56,474 Russia - 339 339 Slovak Republic 37,070 79 37,149 Slovenia - - - Spain 2,434,490 217,336 2,651,826 Spain(Canary Islands) 1,041,832 165,140 1,206,972 Sweden 178,499 836 179,335 Switzerland 360,688 6,521 367,209 Tunisia 30,874 8,519 39,393 Turkey 386,365 55,454 441,819 United Arab Emirates 621,717 - 621,717 United States of America 548,908 20,702 569,610
Total passenger traffic counted for these
countries for Scotland's main airports 2 15,133,984 766,922 15,900,906
Other international traffic at main Scottish airports 2 .. .. -
All international traffic for Scotland's main airports .. .. 15,900,906
International traffic at other Scottish airports .. .. 123,422
Total International traffic at all Scottish airports .. .. 16,024,328
Source: Civil Aviation Authority - Not National Statistics1. For the purpose of preparing this table, Scotland's main international airports are Aberdeen, Edinburgh, Glasgow and Glasgow Prestwick.2. Charter only routes are counted under 'Other international traffic' in cases where fewer than 5,000 passengers were carried from an airport to a particular country.
137
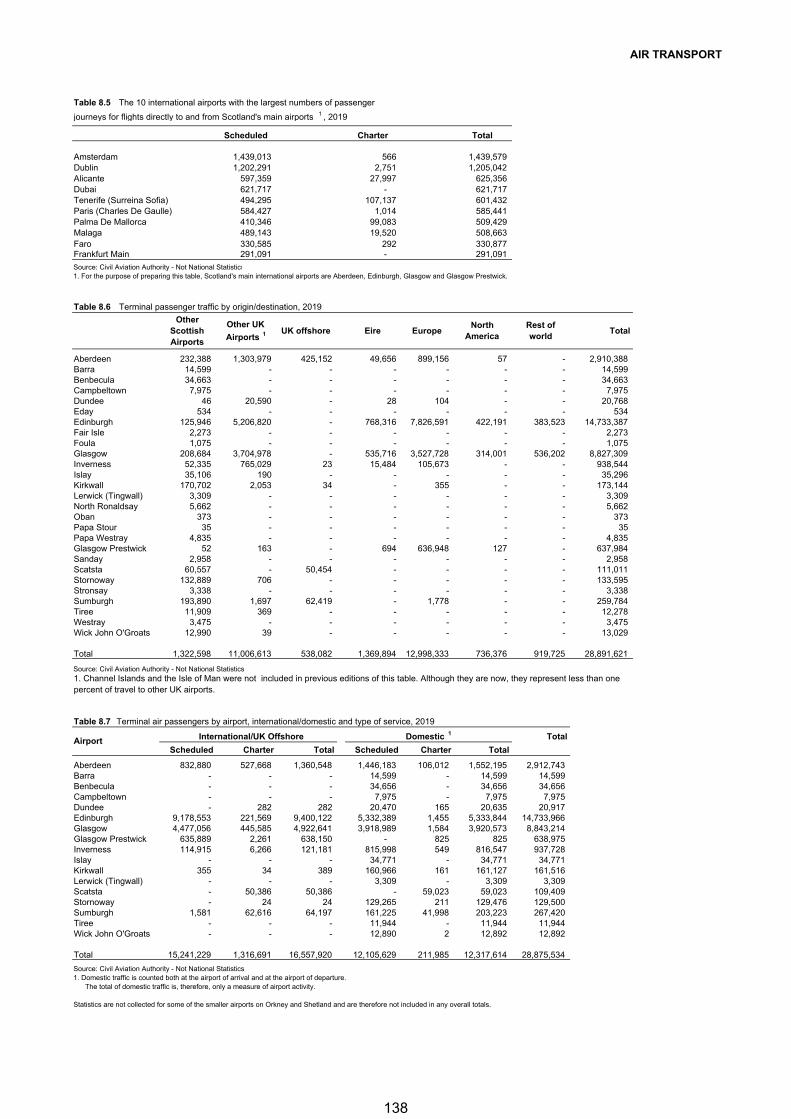
AIR TRANSPORT
Table 8.5 The 10 international airports with the largest numbers of passenger journeys for flights directly to and from Scotland's main airports 1 , 2019
Scheduled Charter Total
Amsterdam 1,439,013 566 1,439,579 Dublin 1,202,291 2,751 1,205,042 Alicante 597,359 27,997 625,356 Dubai 621,717 - 621,717 Tenerife (Surreina Sofia) 494,295 107,137 601,432 Paris (Charles De Gaulle) 584,427 1,014 585,441 Palma De Mallorca 410,346 99,083 509,429 Malaga 489,143 19,520 508,663 Faro 330,585 292 330,877 Frankfurt Main 291,091 - 291,091
Source: Civil Aviation Authority - Not National Statistics1. For the purpose of preparing this table, Scotland's main international airports are Aberdeen, Edinburgh, Glasgow and Glasgow Prestwick.
Table 8.6 Terminal passenger traffic by origin/destination, 2019
Other Scottish Airports
Other UK
Airports 1 UK offshore Eire EuropeNorth
AmericaRest of world
Total
Aberdeen 232,388 1,303,979 425,152 49,656 899,156 57 - 2,910,388 Barra 14,599 - - - - - - 14,599 Benbecula 34,663 - - - - - - 34,663 Campbeltown 7,975 - - - - - - 7,975 Dundee 46 20,590 - 28 104 - - 20,768 Eday 534 - - - - - - 534 Edinburgh 125,946 5,206,820 - 768,316 7,826,591 422,191 383,523 14,733,387 Fair Isle 2,273 - - - - - - 2,273 Foula 1,075 - - - - - - 1,075 Glasgow 208,684 3,704,978 - 535,716 3,527,728 314,001 536,202 8,827,309 Inverness 52,335 765,029 23 15,484 105,673 - - 938,544 Islay 35,106 190 - - - - - 35,296 Kirkwall 170,702 2,053 34 - 355 - - 173,144 Lerwick (Tingwall) 3,309 - - - - - - 3,309 North Ronaldsay 5,662 - - - - - - 5,662 Oban 373 - - - - - - 373 Papa Stour 35 - - - - - - 35 Papa Westray 4,835 - - - - - - 4,835 Glasgow Prestwick 52 163 - 694 636,948 127 - 637,984 Sanday 2,958 - - - - - - 2,958 Scatsta 60,557 - 50,454 - - - - 111,011 Stornoway 132,889 706 - - - - - 133,595 Stronsay 3,338 - - - - - - 3,338 Sumburgh 193,890 1,697 62,419 - 1,778 - - 259,784 Tiree 11,909 369 - - - - - 12,278 Westray 3,475 - - - - - - 3,475 Wick John O'Groats 12,990 39 - - - - - 13,029
Total 1,322,598 11,006,613 538,082 1,369,894 12,998,333 736,376 919,725 28,891,621
Source: Civil Aviation Authority - Not National Statistics
Table 8.7 Terminal air passengers by airport, international/domestic and type of service, 2019
International/UK Offshore Domestic 1 Total
Scheduled Charter Total Scheduled Charter Total
Aberdeen 832,880 527,668 1,360,548 1,446,183 106,012 1,552,195 2,912,743 Barra - - - 14,599 - 14,599 14,599 Benbecula - - - 34,656 - 34,656 34,656 Campbeltown - - - 7,975 - 7,975 7,975 Dundee - 282 282 20,470 165 20,635 20,917 Edinburgh 9,178,553 221,569 9,400,122 5,332,389 1,455 5,333,844 14,733,966 Glasgow 4,477,056 445,585 4,922,641 3,918,989 1,584 3,920,573 8,843,214 Glasgow Prestwick 635,889 2,261 638,150 - 825 825 638,975 Inverness 114,915 6,266 121,181 815,998 549 816,547 937,728 Islay - - - 34,771 - 34,771 34,771 Kirkwall 355 34 389 160,966 161 161,127 161,516 Lerwick (Tingwall) - - - 3,309 - 3,309 3,309 Scatsta - 50,386 50,386 - 59,023 59,023 109,409 Stornoway - 24 24 129,265 211 129,476 129,500 Sumburgh 1,581 62,616 64,197 161,225 41,998 203,223 267,420 Tiree - - - 11,944 - 11,944 11,944 Wick John O'Groats - - - 12,890 2 12,892 12,892
Total 15,241,229 1,316,691 16,557,920 12,105,629 211,985 12,317,614 28,875,534
Source: Civil Aviation Authority - Not National Statistics1. Domestic traffic is counted both at the airport of arrival and at the airport of departure. The total of domestic traffic is, therefore, only a measure of airport activity.
Statistics are not collected for some of the smaller airports on Orkney and Shetland and are therefore not included in any overall totals.
Airport
1. Channel Islands and the Isle of Man were not included in previous editions of this table. Although they are now, they represent less than one percent of travel to other UK airports.
138
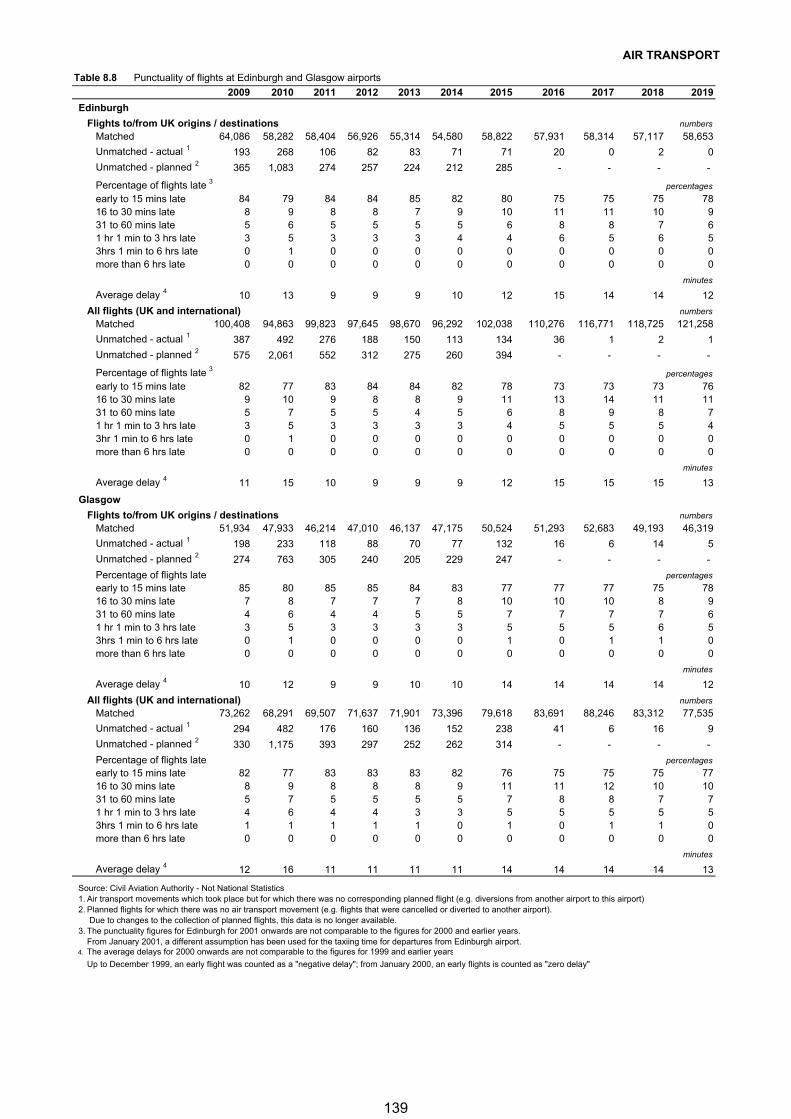
AIR TRANSPORT
Table 8.8 Punctuality of flights at Edinburgh and Glasgow airports
2009 2010 2011 2012 2013 2014 2015 2016 2017 2018 2019
Edinburgh
Flights to/from UK origins / destinations numbers
Matched 64,086 58,282 58,404 56,926 55,314 54,580 58,822 57,931 58,314 57,117 58,653
Unmatched - actual 1 193 268 106 82 83 71 71 20 0 2 0
Unmatched - planned 2 365 1,083 274 257 224 212 285 - - - -
Percentage of flights late 3percentages
early to 15 mins late 84 79 84 84 85 82 80 75 75 75 7816 to 30 mins late 8 9 8 8 7 9 10 11 11 10 931 to 60 mins late 5 6 5 5 5 5 6 8 8 7 61 hr 1 min to 3 hrs late 3 5 3 3 3 4 4 6 5 6 53hrs 1 min to 6 hrs late 0 1 0 0 0 0 0 0 0 0 0more than 6 hrs late 0 0 0 0 0 0 0 0 0 0 0
minutes
Average delay 4 10 13 9 9 9 10 12 15 14 14 12
All flights (UK and international) numbers
Matched 100,408 94,863 99,823 97,645 98,670 96,292 102,038 110,276 116,771 118,725 121,258
Unmatched - actual 1 387 492 276 188 150 113 134 36 1 2 1
Unmatched - planned 2 575 2,061 552 312 275 260 394 - - - -
Percentage of flights late 3percentages
early to 15 mins late 82 77 83 84 84 82 78 73 73 73 7616 to 30 mins late 9 10 9 8 8 9 11 13 14 11 1131 to 60 mins late 5 7 5 5 4 5 6 8 9 8 71 hr 1 min to 3 hrs late 3 5 3 3 3 3 4 5 5 5 43hr 1 min to 6 hrs late 0 1 0 0 0 0 0 0 0 0 0more than 6 hrs late 0 0 0 0 0 0 0 0 0 0 0
minutes
Average delay 4 11 15 10 9 9 9 12 15 15 15 13
Glasgow
Flights to/from UK origins / destinations numbers
Matched 51,934 47,933 46,214 47,010 46,137 47,175 50,524 51,293 52,683 49,193 46,319
Unmatched - actual 1 198 233 118 88 70 77 132 16 6 14 5
Unmatched - planned 2 274 763 305 240 205 229 247 - - - -
Percentage of flights late percentages
early to 15 mins late 85 80 85 85 84 83 77 77 77 75 7816 to 30 mins late 7 8 7 7 7 8 10 10 10 8 931 to 60 mins late 4 6 4 4 5 5 7 7 7 7 61 hr 1 min to 3 hrs late 3 5 3 3 3 3 5 5 5 6 53hrs 1 min to 6 hrs late 0 1 0 0 0 0 1 0 1 1 0more than 6 hrs late 0 0 0 0 0 0 0 0 0 0 0
minutes
Average delay 4 10 12 9 9 10 10 14 14 14 14 12
All flights (UK and international) numbers
Matched 73,262 68,291 69,507 71,637 71,901 73,396 79,618 83,691 88,246 83,312 77,535
Unmatched - actual 1 294 482 176 160 136 152 238 41 6 16 9
Unmatched - planned 2 330 1,175 393 297 252 262 314 - - - -
Percentage of flights late percentages
early to 15 mins late 82 77 83 83 83 82 76 75 75 75 7716 to 30 mins late 8 9 8 8 8 9 11 11 12 10 1031 to 60 mins late 5 7 5 5 5 5 7 8 8 7 71 hr 1 min to 3 hrs late 4 6 4 4 3 3 5 5 5 5 53hrs 1 min to 6 hrs late 1 1 1 1 1 0 1 0 1 1 0more than 6 hrs late 0 0 0 0 0 0 0 0 0 0 0
minutes
Average delay 4 12 16 11 11 11 11 14 14 14 14 13
Source: Civil Aviation Authority - Not National Statistics1. Air transport movements which took place but for which there was no corresponding planned flight (e.g. diversions from another airport to this airport)2. Planned flights for which there was no air transport movement (e.g. flights that were cancelled or diverted to another airport).
Due to changes to the collection of planned flights, this data is no longer available.3. The punctuality figures for Edinburgh for 2001 onwards are not comparable to the figures for 2000 and earlier years.
From January 2001, a different assumption has been used for the taxiing time for departures from Edinburgh airport.4. The average delays for 2000 onwards are not comparable to the figures for 1999 and earlier years
Up to December 1999, an early flight was counted as a "negative delay"; from January 2000, an early flights is counted as "zero delay"
139
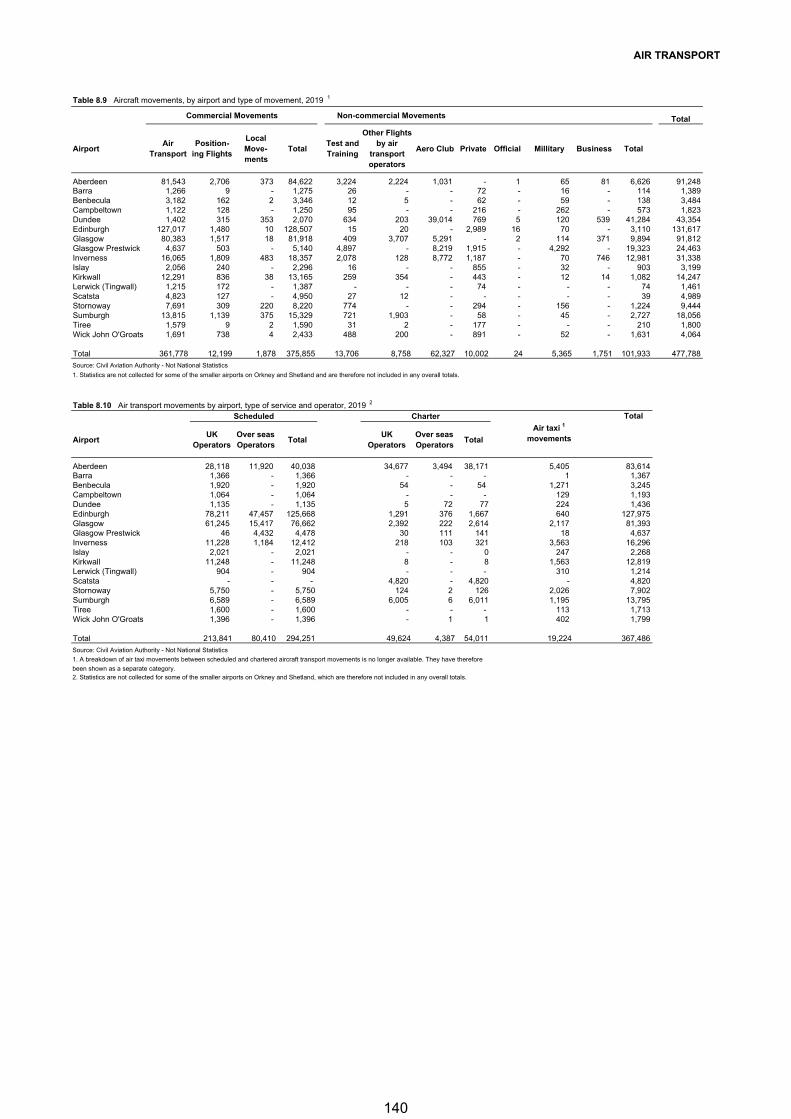
AIR TRANSPORT
Table 8.9 Aircraft movements, by airport and type of movement, 2019 1
Commercial Movements Non-commercial Movements Total
AirportAir
TransportPosition-
ing Flights
Local Move-ments
TotalTest and Training
Other Flights by air
transport operators
Aero Club Private Official Millitary Business Total
Aberdeen 81,543 2,706 373 84,622 3,224 2,224 1,031 - 1 65 81 6,626 91,248Barra 1,266 9 - 1,275 26 - - 72 - 16 - 114 1,389Benbecula 3,182 162 2 3,346 12 5 - 62 - 59 - 138 3,484Campbeltown 1,122 128 - 1,250 95 - - 216 - 262 - 573 1,823Dundee 1,402 315 353 2,070 634 203 39,014 769 5 120 539 41,284 43,354Edinburgh 127,017 1,480 10 128,507 15 20 - 2,989 16 70 - 3,110 131,617Glasgow 80,383 1,517 18 81,918 409 3,707 5,291 - 2 114 371 9,894 91,812Glasgow Prestwick 4,637 503 - 5,140 4,897 - 8,219 1,915 - 4,292 - 19,323 24,463Inverness 16,065 1,809 483 18,357 2,078 128 8,772 1,187 - 70 746 12,981 31,338Islay 2,056 240 - 2,296 16 - - 855 - 32 - 903 3,199Kirkwall 12,291 836 38 13,165 259 354 - 443 - 12 14 1,082 14,247Lerwick (Tingwall) 1,215 172 - 1,387 - - - 74 - - - 74 1,461Scatsta 4,823 127 - 4,950 27 12 - - - - - 39 4,989Stornoway 7,691 309 220 8,220 774 - - 294 - 156 - 1,224 9,444Sumburgh 13,815 1,139 375 15,329 721 1,903 - 58 - 45 - 2,727 18,056Tiree 1,579 9 2 1,590 31 2 - 177 - - - 210 1,800Wick John O'Groats 1,691 738 4 2,433 488 200 - 891 - 52 - 1,631 4,064
Total 361,778 12,199 1,878 375,855 13,706 8,758 62,327 10,002 24 5,365 1,751 101,933 477,788
Source: Civil Aviation Authority - Not National Statistics
1. Statistics are not collected for some of the smaller airports on Orkney and Shetland and are therefore not included in any overall totals.
Table 8.10 Air transport movements by airport, type of service and operator, 2019 2
Scheduled Charter Total
AirportUK
OperatorsOver seas Operators
TotalUK
OperatorsOver seas Operators
Total
Air taxi 1
movements
Aberdeen 28,118 11,920 40,038 34,677 3,494 38,171 5,405 83,614Barra 1,366 - 1,366 - - - 1 1,367Benbecula 1,920 - 1,920 54 - 54 1,271 3,245Campbeltown 1,064 - 1,064 - - - 129 1,193Dundee 1,135 - 1,135 5 72 77 224 1,436Edinburgh 78,211 47,457 125,668 1,291 376 1,667 640 127,975Glasgow 61,245 15,417 76,662 2,392 222 2,614 2,117 81,393Glasgow Prestwick 46 4,432 4,478 30 111 141 18 4,637Inverness 11,228 1,184 12,412 218 103 321 3,563 16,296Islay 2,021 - 2,021 - - 0 247 2,268Kirkwall 11,248 - 11,248 8 - 8 1,563 12,819Lerwick (Tingwall) 904 - 904 - - - 310 1,214Scatsta - - - 4,820 - 4,820 - 4,820Stornoway 5,750 - 5,750 124 2 126 2,026 7,902Sumburgh 6,589 - 6,589 6,005 6 6,011 1,195 13,795Tiree 1,600 - 1,600 - - - 113 1,713Wick John O'Groats 1,396 - 1,396 - 1 1 402 1,799
Total 213,841 80,410 294,251 49,624 4,387 54,011 19,224 367,486
Source: Civil Aviation Authority - Not National Statistics
1. A breakdown of air taxi movements between scheduled and chartered aircraft transport movements is no longer available. They have therefore
been shown as a separate category.2. Statistics are not collected for some of the smaller airports on Orkney and Shetland, which are therefore not included in any overall totals.
140
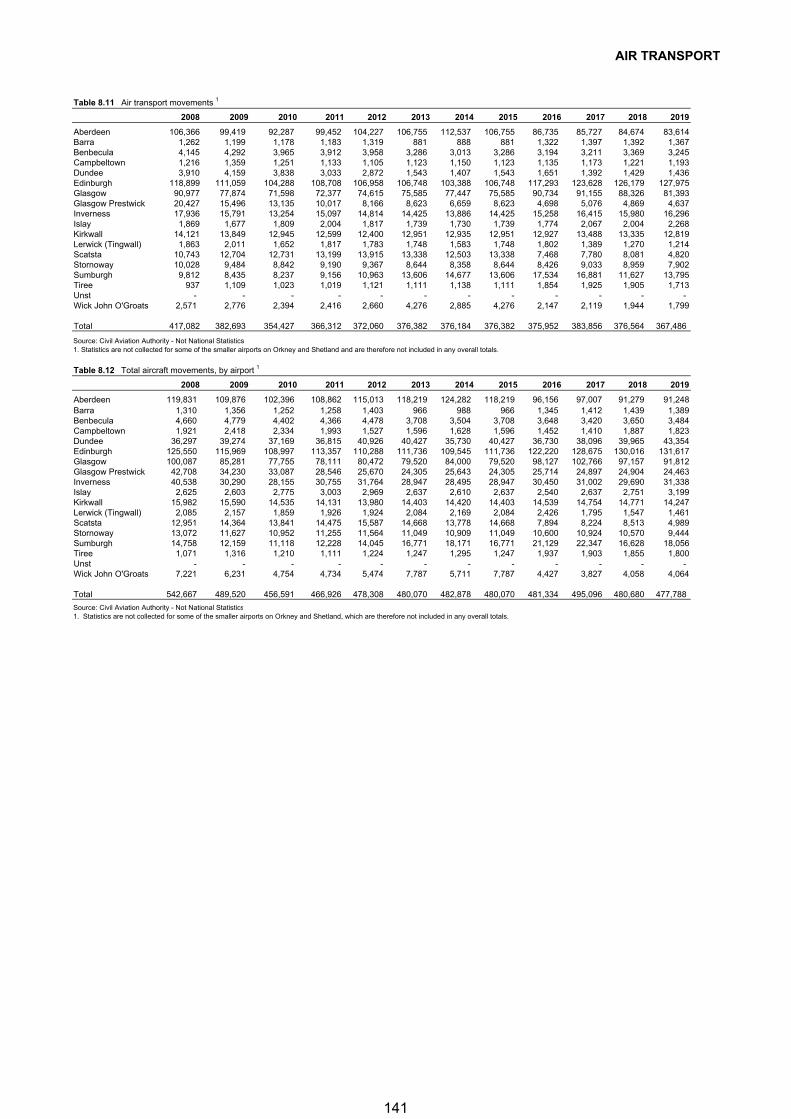
AIR TRANSPORT
Table 8.11 Air transport movements 1
2008 2009 2010 2011 2012 2013 2014 2015 2016 2017 2018 2019
Aberdeen 106,366 99,419 92,287 99,452 104,227 106,755 112,537 106,755 86,735 85,727 84,674 83,614Barra 1,262 1,199 1,178 1,183 1,319 881 888 881 1,322 1,397 1,392 1,367Benbecula 4,145 4,292 3,965 3,912 3,958 3,286 3,013 3,286 3,194 3,211 3,369 3,245Campbeltown 1,216 1,359 1,251 1,133 1,105 1,123 1,150 1,123 1,135 1,173 1,221 1,193Dundee 3,910 4,159 3,838 3,033 2,872 1,543 1,407 1,543 1,651 1,392 1,429 1,436Edinburgh 118,899 111,059 104,288 108,708 106,958 106,748 103,388 106,748 117,293 123,628 126,179 127,975Glasgow 90,977 77,874 71,598 72,377 74,615 75,585 77,447 75,585 90,734 91,155 88,326 81,393Glasgow Prestwick 20,427 15,496 13,135 10,017 8,166 8,623 6,659 8,623 4,698 5,076 4,869 4,637Inverness 17,936 15,791 13,254 15,097 14,814 14,425 13,886 14,425 15,258 16,415 15,980 16,296Islay 1,869 1,677 1,809 2,004 1,817 1,739 1,730 1,739 1,774 2,067 2,004 2,268Kirkwall 14,121 13,849 12,945 12,599 12,400 12,951 12,935 12,951 12,927 13,488 13,335 12,819Lerwick (Tingwall) 1,863 2,011 1,652 1,817 1,783 1,748 1,583 1,748 1,802 1,389 1,270 1,214Scatsta 10,743 12,704 12,731 13,199 13,915 13,338 12,503 13,338 7,468 7,780 8,081 4,820Stornoway 10,028 9,484 8,842 9,190 9,367 8,644 8,358 8,644 8,426 9,033 8,959 7,902Sumburgh 9,812 8,435 8,237 9,156 10,963 13,606 14,677 13,606 17,534 16,881 11,627 13,795Tiree 937 1,109 1,023 1,019 1,121 1,111 1,138 1,111 1,854 1,925 1,905 1,713Unst - - - - - - - - - - - - Wick John O'Groats 2,571 2,776 2,394 2,416 2,660 4,276 2,885 4,276 2,147 2,119 1,944 1,799
Total 417,082 382,693 354,427 366,312 372,060 376,382 376,184 376,382 375,952 383,856 376,564 367,486
Source: Civil Aviation Authority - Not National Statistics1. Statistics are not collected for some of the smaller airports on Orkney and Shetland and are therefore not included in any overall totals.
Table 8.12 Total aircraft movements, by airport 1
2008 2009 2010 2011 2012 2013 2014 2015 2016 2017 2018 2019
Aberdeen 119,831 109,876 102,396 108,862 115,013 118,219 124,282 118,219 96,156 97,007 91,279 91,248Barra 1,310 1,356 1,252 1,258 1,403 966 988 966 1,345 1,412 1,439 1,389Benbecula 4,660 4,779 4,402 4,366 4,478 3,708 3,504 3,708 3,648 3,420 3,650 3,484Campbeltown 1,921 2,418 2,334 1,993 1,527 1,596 1,628 1,596 1,452 1,410 1,887 1,823Dundee 36,297 39,274 37,169 36,815 40,926 40,427 35,730 40,427 36,730 38,096 39,965 43,354Edinburgh 125,550 115,969 108,997 113,357 110,288 111,736 109,545 111,736 122,220 128,675 130,016 131,617Glasgow 100,087 85,281 77,755 78,111 80,472 79,520 84,000 79,520 98,127 102,766 97,157 91,812Glasgow Prestwick 42,708 34,230 33,087 28,546 25,670 24,305 25,643 24,305 25,714 24,897 24,904 24,463Inverness 40,538 30,290 28,155 30,755 31,764 28,947 28,495 28,947 30,450 31,002 29,690 31,338Islay 2,625 2,603 2,775 3,003 2,969 2,637 2,610 2,637 2,540 2,637 2,751 3,199Kirkwall 15,982 15,590 14,535 14,131 13,980 14,403 14,420 14,403 14,539 14,754 14,771 14,247Lerwick (Tingwall) 2,085 2,157 1,859 1,926 1,924 2,084 2,169 2,084 2,426 1,795 1,547 1,461Scatsta 12,951 14,364 13,841 14,475 15,587 14,668 13,778 14,668 7,894 8,224 8,513 4,989Stornoway 13,072 11,627 10,952 11,255 11,564 11,049 10,909 11,049 10,600 10,924 10,570 9,444Sumburgh 14,758 12,159 11,118 12,228 14,045 16,771 18,171 16,771 21,129 22,347 16,628 18,056Tiree 1,071 1,316 1,210 1,111 1,224 1,247 1,295 1,247 1,937 1,903 1,855 1,800Unst - - - - - - - - - - - - Wick John O'Groats 7,221 6,231 4,754 4,734 5,474 7,787 5,711 7,787 4,427 3,827 4,058 4,064
Total 542,667 489,520 456,591 466,926 478,308 480,070 482,878 480,070 481,334 495,096 480,680 477,788
Source: Civil Aviation Authority - Not National Statistics1. Statistics are not collected for some of the smaller airports on Orkney and Shetland, which are therefore not included in any overall totals.
141
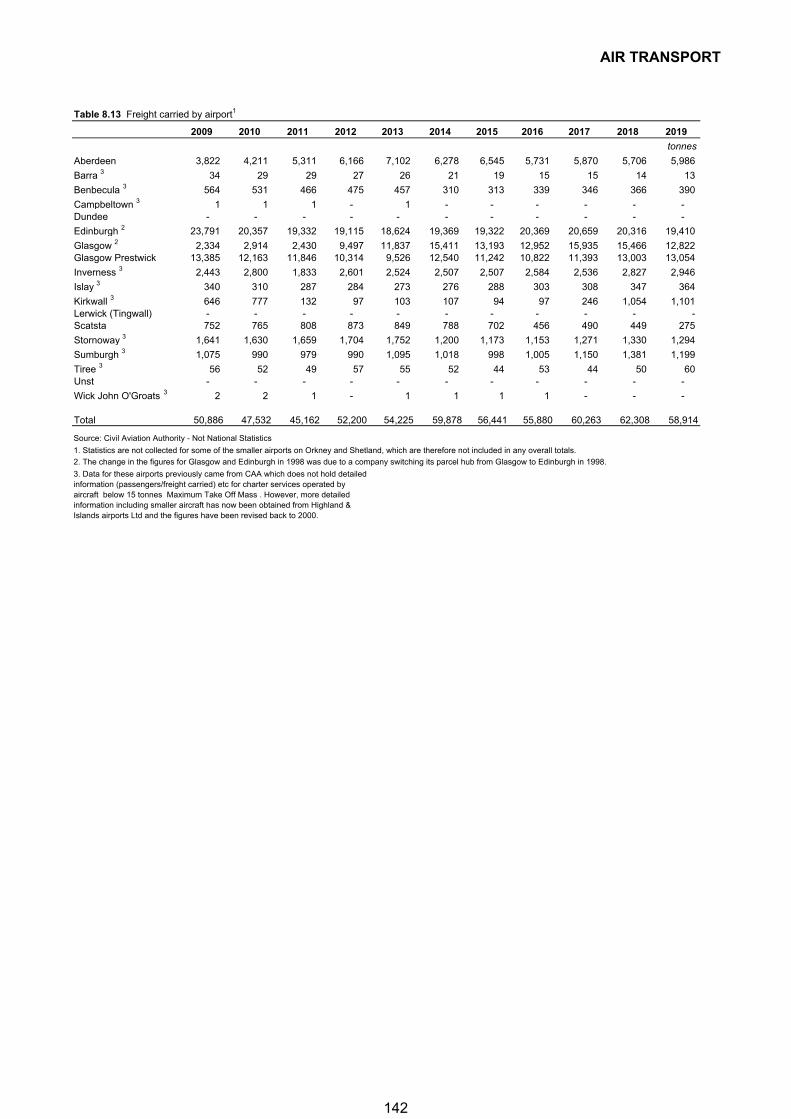
AIR TRANSPORT
Table 8.13 Freight carried by airport1
2009 2010 2011 2012 2013 2014 2015 2016 2017 2018 2019
tonnes
Aberdeen 3,822 4,211 5,311 6,166 7,102 6,278 6,545 5,731 5,870 5,706 5,986
Barra 3 34 29 29 27 26 21 19 15 15 14 13
Benbecula 3 564 531 466 475 457 310 313 339 346 366 390
Campbeltown 3 1 1 1 - 1 - - - - - - Dundee - - - - - - - - - - -
Edinburgh 2 23,791 20,357 19,332 19,115 18,624 19,369 19,322 20,369 20,659 20,316 19,410
Glasgow 2 2,334 2,914 2,430 9,497 11,837 15,411 13,193 12,952 15,935 15,466 12,822 Glasgow Prestwick 13,385 12,163 11,846 10,314 9,526 12,540 11,242 10,822 11,393 13,003 13,054
Inverness 3 2,443 2,800 1,833 2,601 2,524 2,507 2,507 2,584 2,536 2,827 2,946
Islay 3 340 310 287 284 273 276 288 303 308 347 364
Kirkwall 3 646 777 132 97 103 107 94 97 246 1,054 1,101 Lerwick (Tingwall) - - - - - - - - - - - Scatsta 752 765 808 873 849 788 702 456 490 449 275
Stornoway 3 1,641 1,630 1,659 1,704 1,752 1,200 1,173 1,153 1,271 1,330 1,294
Sumburgh 3 1,075 990 979 990 1,095 1,018 998 1,005 1,150 1,381 1,199
Tiree 3 56 52 49 57 55 52 44 53 44 50 60 Unst - - - - - - - - - - -
Wick John O'Groats 3 2 2 1 - 1 1 1 1 - - -
Total 50,886 47,532 45,162 52,200 54,225 59,878 56,441 55,880 60,263 62,308 58,914
Source: Civil Aviation Authority - Not National Statistics
1. Statistics are not collected for some of the smaller airports on Orkney and Shetland, which are therefore not included in any overall totals.
2. The change in the figures for Glasgow and Edinburgh in 1998 was due to a company switching its parcel hub from Glasgow to Edinburgh in 1998.
3. Data for these airports previously came from CAA which does not hold detailed information (passengers/freight carried) etc for charter services operated by aircraft below 15 tonnes Maximum Take Off Mass . However, more detailed information including smaller aircraft has now been obtained from Highland & Islands airports Ltd and the figures have been revised back to 2000.
142
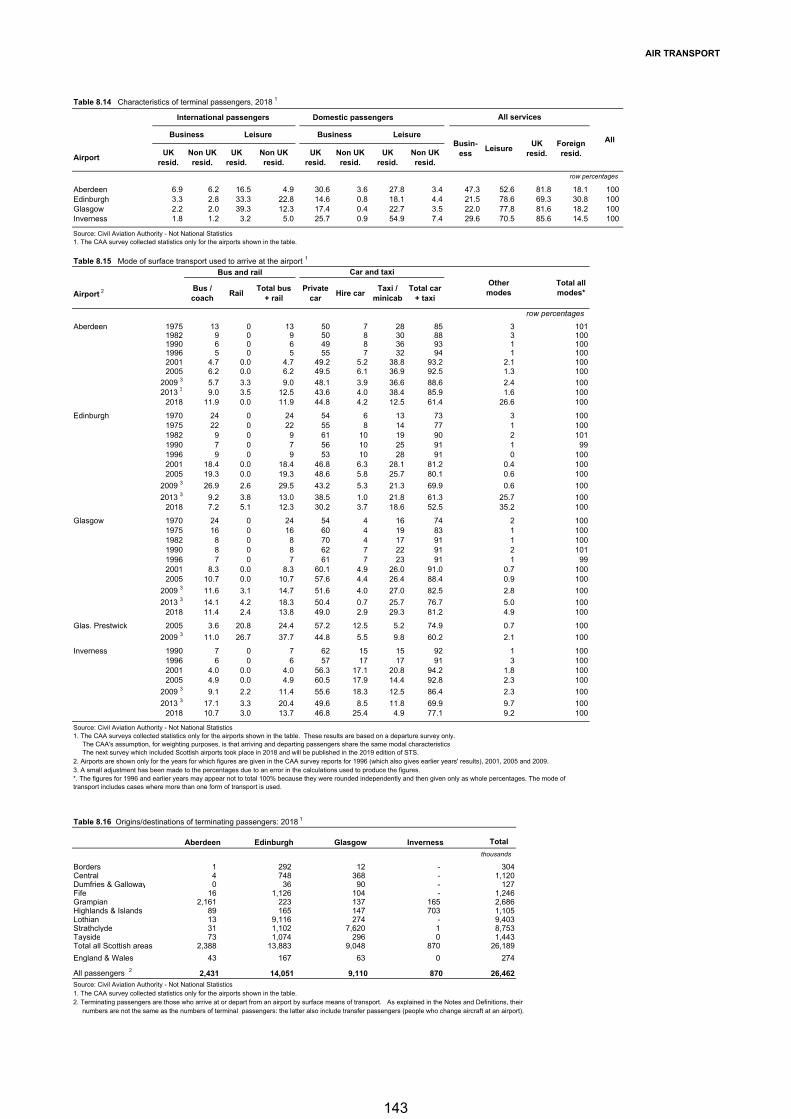
AIR TRANSPORT
Table 8.14 Characteristics of terminal passengers, 2018 1
International passengers Domestic passengers
AirportUK
resid.Non UK resid.
UK resid.
Non UK resid.
UK resid.
Non UK resid.
UK resid.
Non UK resid.
row percentages
Aberdeen 6.9 6.2 16.5 4.9 30.6 3.6 27.8 3.4 47.3 52.6 81.8 18.1 100 Edinburgh 3.3 2.8 33.3 22.8 14.6 0.8 18.1 4.4 21.5 78.6 69.3 30.8 100 Glasgow 2.2 2.0 39.3 12.3 17.4 0.4 22.7 3.5 22.0 77.8 81.6 18.2 100 Inverness 1.8 1.2 3.2 5.0 25.7 0.9 54.9 7.4 29.6 70.5 85.6 14.5 100
Source: Civil Aviation Authority - Not National Statistics1. The CAA survey collected statistics only for the airports shown in the table.
Table 8.15 Mode of surface transport used to arrive at the airport 1
Bus and rail
Airport 2 Bus / coach
RailTotal bus
+ railPrivate
carHire car
Taxi / minicab
Total car + taxi
Other modes
Total all modes*
row percentages
Aberdeen 1975 13 0 13 50 7 28 85 3 1011982 9 0 9 50 8 30 88 3 1001990 6 0 6 49 8 36 93 1 1001996 5 0 5 55 7 32 94 1 1002001 4.7 0.0 4.7 49.2 5.2 38.8 93.2 2.1 1002005 6.2 0.0 6.2 49.5 6.1 36.9 92.5 1.3 100
2009 3 5.7 3.3 9.0 48.1 3.9 36.6 88.6 2.4 1002013 3 9.0 3.5 12.5 43.6 4.0 38.4 85.9 1.6 100
2018 11.9 0.0 11.9 44.8 4.2 12.5 61.4 26.6 100
Edinburgh 1970 24 0 24 54 6 13 73 3 1001975 22 0 22 55 8 14 77 1 1001982 9 0 9 61 10 19 90 2 1011990 7 0 7 56 10 25 91 1 991996 9 0 9 53 10 28 91 0 1002001 18.4 0.0 18.4 46.8 6.3 28.1 81.2 0.4 1002005 19.3 0.0 19.3 48.6 5.8 25.7 80.1 0.6 100
2009 3 26.9 2.6 29.5 43.2 5.3 21.3 69.9 0.6 100
2013 3 9.2 3.8 13.0 38.5 1.0 21.8 61.3 25.7 1002018 7.2 5.1 12.3 30.2 3.7 18.6 52.5 35.2 100
Glasgow 1970 24 0 24 54 4 16 74 2 1001975 16 0 16 60 4 19 83 1 1001982 8 0 8 70 4 17 91 1 1001990 8 0 8 62 7 22 91 2 1011996 7 0 7 61 7 23 91 1 992001 8.3 0.0 8.3 60.1 4.9 26.0 91.0 0.7 1002005 10.7 0.0 10.7 57.6 4.4 26.4 88.4 0.9 100
2009 3 11.6 3.1 14.7 51.6 4.0 27.0 82.5 2.8 100
2013 3 14.1 4.2 18.3 50.4 0.7 25.7 76.7 5.0 1002018 11.4 2.4 13.8 49.0 2.9 29.3 81.2 4.9 100
Glas. Prestwick 2005 3.6 20.8 24.4 57.2 12.5 5.2 74.9 0.7 100
2009 3 11.0 26.7 37.7 44.8 5.5 9.8 60.2 2.1 100
Inverness 1990 7 0 7 62 15 15 92 1 1001996 6 0 6 57 17 17 91 3 1002001 4.0 0.0 4.0 56.3 17.1 20.8 94.2 1.8 1002005 4.9 0.0 4.9 60.5 17.9 14.4 92.8 2.3 100
2009 3 9.1 2.2 11.4 55.6 18.3 12.5 86.4 2.3 100
2013 3 17.1 3.3 20.4 49.6 8.5 11.8 69.9 9.7 1002018 10.7 3.0 13.7 46.8 25.4 4.9 77.1 9.2 100
Source: Civil Aviation Authority - Not National Statistics1. The CAA surveys collected statistics only for the airports shown in the table. These results are based on a departure survey only. The CAA's assumption, for weighting purposes, is that arriving and departing passengers share the same modal characteristics The next survey which included Scottish airports took place in 2018 and will be published in the 2019 edition of STS.2. Airports are shown only for the years for which figures are given in the CAA survey reports for 1996 (which also gives earlier years' results), 2001, 2005 and 2009.3. A small adjustment has been made to the percentages due to an error in the calculations used to produce the figures.
Table 8.16 Origins/destinations of terminating passengers: 2018 1
Aberdeen Edinburgh Glasgow Inverness Total
thousands
Borders 1 292 12 - 304Central 4 748 368 - 1,120Dumfries & Galloway 0 36 90 - 127Fife 16 1,126 104 - 1,246Grampian 2,161 223 137 165 2,686Highlands & Islands 89 165 147 703 1,105Lothian 13 9,116 274 - 9,403Strathclyde 31 1,102 7,620 1 8,753Tayside 73 1,074 296 0 1,443Total all Scottish areas 2,388 13,883 9,048 870 26,189
England & Wales 43 167 63 0 274
All passengers 2 2,431 14,051 9,110 870 26,462Source: Civil Aviation Authority - Not National Statistics1. The CAA survey collected statistics only for the airports shown in the table. 2. Terminating passengers are those who arrive at or depart from an airport by surface means of transport. As explained in the Notes and Definitions, their numbers are not the same as the numbers of terminal passengers: the latter also include transfer passengers (people who change aircraft at an airport).
All
Car and taxi
All services
Busin-ess
LeisureUK
resid.
*. The figures for 1996 and earlier years may appear not to total 100% because they were rounded independently and then given only as whole percentages. The mode of transport includes cases where more than one form of transport is used.
Foreign resid.
Business Leisure Business Leisure
143
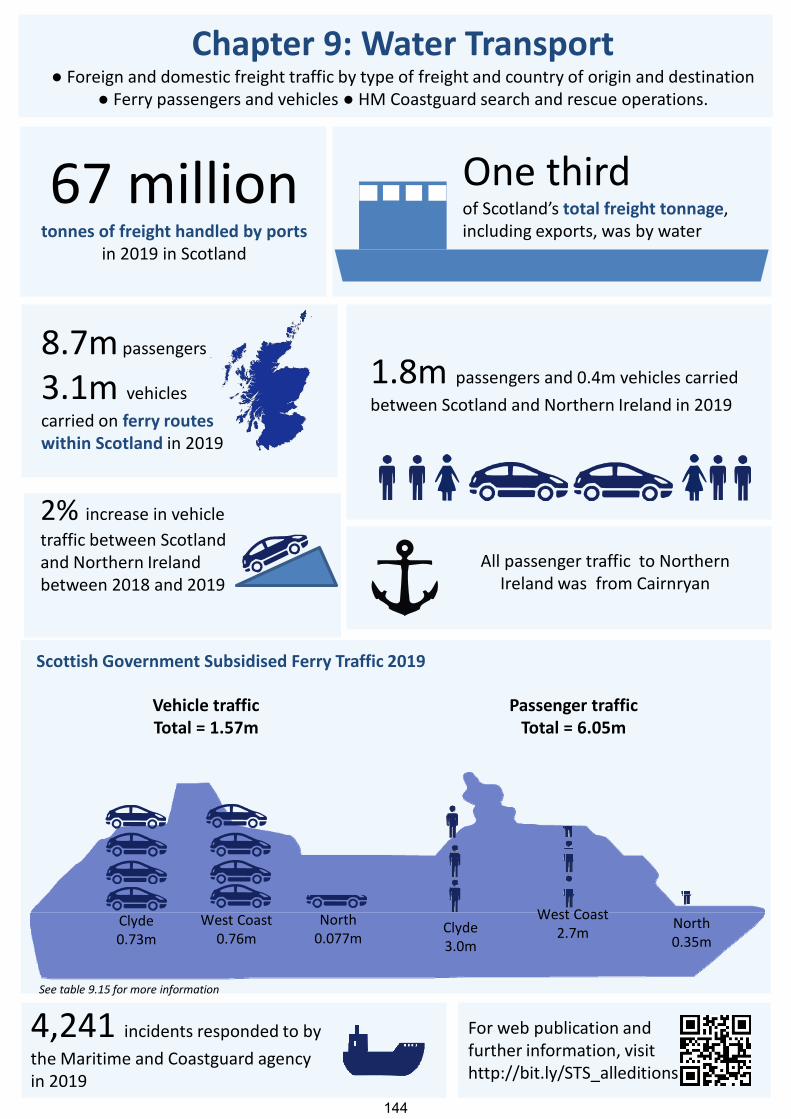
Chapter 9: Water Transport● Foreign and domestic freight traffic by type of freight and country of origin and destination
● Ferry passengers and vehicles ● HM Coastguard search and rescue operations.
67 milliontonnes of freight handled by ports
in 2019 in Scotland
2% increase in vehicle traffic between Scotland and Northern Ireland between 2018 and 2019
All passenger traffic to Northern Ireland was from Cairnryan
8.7mpassengers
3.1m vehicles
carried on ferry routes within Scotland in 2019
1.8m passengers and 0.4m vehicles carried
between Scotland and Northern Ireland in 2019
One thirdof Scotland’s total freight tonnage, including exports, was by water
For web publication and further information, visithttp://bit.ly/STS_alleditions
4,241 incidents responded to by the Maritime and Coastguard agency in 2019
Passenger trafficTotal = 6.05m
Vehicle trafficTotal = 1.57m
Clyde3.0m
West Coast2.7m
Scottish Government Subsidised Ferry Traffic 2019
North0.35m
Clyde0.73m
West Coast0.76m
North0.077m
See table 9.15 for more information
144
WATER TRANSPORT
WATER TRANSPORT
1. Introduction
1.1 This chapter provides information about foreign and domestic freight traffic at Scottish ports and inland waterways by type of freight and country of origin and destination. It also includes statistics on passengers and vehicles carried on ferry routes operating in Scotland and routes between Scotland and Northern Ireland and Europe as well as some statistics on HM Coastguard search and rescue operations.
1.2 Port traffic statistics methodology changed in 2000, to comply with the requirements of a new EC Maritime Statistics Directive. This produced large changes in the figures for one-port and coastwise traffic, and in the split between domestic and foreign traffic, between 1999 and 2000. Details of the method and notes on the effect of the change are given in the Notes and Definitions section, page 225.
1.3 From 2015 DfT no longer publish a Scottish data for coastwise, one port and inland waterway traffic and we are unable to update tables 9.1, 9.9 and 9.11 as fully as we previously did.
Key Points There were 67 million tonnes of freight handled by ports in Scotland in
2019. There was a total of 8.7 million passengers and 3.1 million vehicles
carried on ferry routes within Scotland in 2019. There were 1.8 million passengers and 0.4 million vehicles carried
between Scotland and Northern Ireland.
2. Main Points Freight Tonnage
2.1 Exports through major (see section 9.16.3 page 278) Scottish ports rose from 61 million tonnes in 1997 to 68 million tonnes in 2002 before steadily falling to 33 million tonnes in 2019 (there has been a 13% fall in the last ten years) - eight ports were counted as major ports in 1997 and 1998, there were nine in 1999 and 11 from 2000 onwards. Imports totalled 11.9 million tonnes, considerably less than the volume of exports. (Table 9.2)
2.2 Waterborne freight (both incoming and outgoing) passing through the ports increased by 2.6% in 2019 to 67 million tonnes. This was 22% less than in 2009, continuing a steady fall. In 2019, the eleven major ports accounted for 95% of the total traffic through Scottish ports. Exports accounted for 50% of the total freight through Scottish ports and domestic traffic accounted for 27%. Imports, and incoming domestic freight were much lower, together accounting for 28% of the total freight through Scottish ports. (Table 9.2)
145
WATER TRANSPORT
Ports and Destinations 2.3 Forth (25 million tonnes), Clyde (9 million tonnes) and Glensanda (7 million tonnes) accounted for the highest freight traffic in 2019. Forth traffic is 5.1% lower than 2018, and is 31% below 2009. Clyde’s freight traffic has fluctuated between 2009 and 2019, falling overall from 13 million tonnes to 9 million tonnes in 2019. Again, as these figures are for the total volume of traffic, they are unaffected by the change in the method of compiling the statistics. (Table 9.3) 2.4 Bulk fuel accounted for 40 million tonnes (63%) of the total traffic through major Scottish ports in 2019. (Table 9.4) 2.5 Top exporting ports for foreign traffic were: Forth (19 million tonnes); Sullom Voe (6.2 million tonnes) and Glensanda (3.8 million tonnes). Clyde (5.9 million tonnes) and Forth (4.5 million tonnes) together accounted for almost all the imports from foreign traffic. Glensanda (2.9 million tonnes), Aberdeen (1.8 million tonnes), and Cairnryan (1.5 million tonnes) had most outward domestic traffic; Aberdeen (1.5 million tonnes) was the main port for inwards domestic traffic. (Table 9.6) 2.6 The main types of traffic through the major ports in 2019 were crude oil (29 million tonnes), other dry bulk (10 million tonnes) and oil products (8 million tonnes). (Table 9.7) 2.7 In 2019 most exports were destined for Netherlands (8.3 million tonnes), Asia (10.5 million tonnes), Germany (5.5 million tonnes), Belgium (2.2 million tonnes) and Spain (1.4 million tonnes) while most imports arrived from Norway (2.1 million tonnes and Nigeria (1.9 million tonnes). (Table 9.8) Passenger Services Routes to Northern Ireland and Europe 2.8 In 2019, 1.8 million passengers were carried on ferry services between Scotland and Northern Ireland. There were 415 thousand vehicles carried between Scotland and Northern Ireland in 2019, a 2 per cent increase on 2018. Until it’s closure in 2018 the Rosyth to Zeebrugge freight route was the only ferry route between Scotland and Europe. (Tables 9.13 (a) & (b)) Routes within Scotland 2.9 This section covers all routes within Scotland for which data is available, for example data is not available for Pentland Ferries. These statistics include routes within Scotland that are subsidised by Scottish Government, local authority ferry services and privately run services. More detail is available in the Notes and Definitions section, page 225. 2.10 There were 8.7 million passengers carried on routes within Scotland in 2019, a rise of 1.5 per cent compared to 2018 and 2.2 per cent above the recent peak in numbers in 2007. Caledonian MacBrayne carried 5.4 million of these passengers (62%) and Western Ferries carried a further 15 per cent on the Gourock-Dunoon route. (Table 9.12) 2.11 There were 3.1 million vehicles carried on routes within Scotland in 2019, a 2.5 per cent increase on 2018. Of these vehicles, 50 per cent were carried by
146
WATER TRANSPORT
Caledonian MacBrayne and a further 21 per cent by Western Ferries on the Gourock-Dunoon route. (Table 9.12) Operators on subsidised routes within Scotland 2.12 Caledonian MacBrayne ferries carried 5.4 million passengers in 2019, 134,000 (3%) more than in 2018. There were 1.5 million cars carried, (5%) more than 2018, and 91,000 commercial vehicles and buses, the same as 2018. (Table 9.14) 2.13 Serco Northlink Ferries carried 348,000 passengers in 2019, an 8 per cent increase compared to 2018. There were 77,000 cars carried on these routes in 2019, 7 per cent more than 2018. (Table 9.14) Local authority ferry services 2.14 Shetland Islands Council services carried 777,000 passengers in 2019, two per cent more than 2018. There were 382,000 vehicles carried, a rise of 2 per cent on 2018. 2.15 Orkney Ferries services carried 336,000 passengers in 2019, one per cent less than in 2018. There were 94,000 vehicles carried on these routes, one per cent more than the previous year. (Table 9.14) 2.16 Ferries operated by Argyll and Bute Council carried 141,000 passengers in 2019. Although Highland Council only records passenger numbers for the Camusnagaul - Fort William service operated by Highland Ferries on behalf of Highland Council they have estimated that 598,000 passengers have been carried on the Corran Ferry. (Table 9.14 and 9.16) Ferry routes within and to/from Scotland 2.17 The busiest ferry route within Scotland in terms of passengers and vehicles carried is the service between Gourock and Dunoon, operated by Western Ferries, which carried 1,320,100 passengers in 2019. There were 632,700 cars carried on this route and 29,800 commercial vehicles and buses in 2019. (Table 9.16 and Figure 9.4 and 9.5) 2.18 The second busiest Scottish ferry route over recent years in terms of passenger numbers has been the Cairnryan / Belfast route. This route carried 1.3 million passengers in 2019. (Table 9.13 and Figure 9.4) 2.19 The second busiest route in terms of cars carried is the Corran Ferry from Ardgour to Nether Lochaber operated by Highland Council. This route carried 266 thousand vehicles in 2019. (Table 9.16 and Figure 9.5) 2.20 The busiest subsidised ferry routes are operated by Caledonian MacBrayne. The busiest route in terms of passengers in 2019 was Ardrossan - Brodick, with 849,500 passengers. Ardrossan - Brodick was also the busiest subsidised route for car traffic in 2019 with 207,700 car crossings, a decrease of 4 per cent over the previous year. (Table 9.15)
147
WATER TRANSPORT
2.21 The Road Equivalent Tariff (RET) scheme involves setting ferry fares on the basis of the cost of travelling an equivalent distance by road, more detail on RET can be found in the Notes and Definitions section, page 225. The West Coast routes where Road Equivalent Tariff (RET) has been rolled out carried 2.7 million passengers in 2019 and 762,000 cars. (Table 9.15) Ferry Punctuality 2.22 The level of reliability (the number of timetabled sailings actually operated, see table footnote for more detail) for Caledonian MacBrayne lifeline ferry services was 99.6% in 2019-20 and the level of punctuality (against the published timetable) was 99.7%. For Northlink the level of lifeline ferry services that were both punctual and reliable was 99.8% for Aberdeen routes and 99.9% for the Pentland Firth in 2019-20. (Table 9.17) Coastguard callouts 2.23 Overall there were 4,241 incidents in 2019, 63 less than the previous year. (Table 9.18)
148
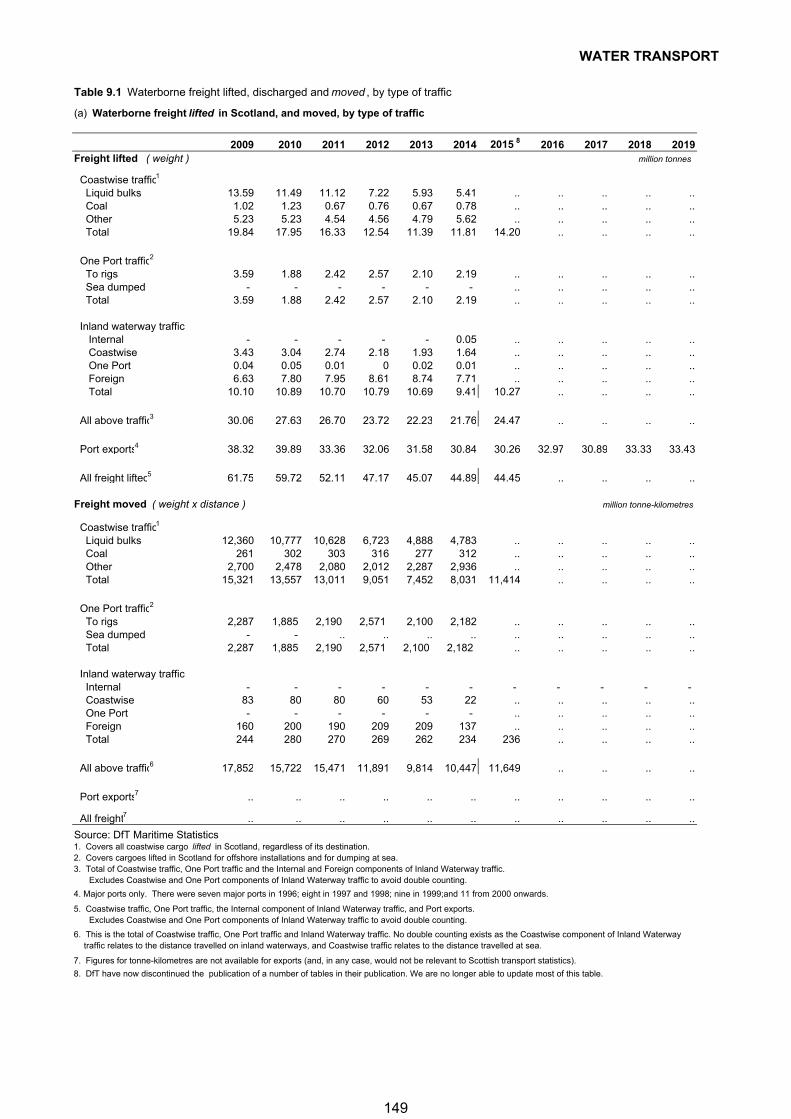
WATER TRANSPORT
Table 9.1 Waterborne freight lifted, discharged and moved , by type of traffic
(a) Waterborne freight lifted in Scotland, and moved, by type of traffic
2009 2010 2011 2012 2013 2014 2015 8 2016 2017 2018 2019Freight lifted ( weight ) million tonnes
Coastwise traffic1
Liquid bulks 13.59 11.49 11.12 7.22 5.93 5.41 .. .. .. .. .. Coal 1.02 1.23 0.67 0.76 0.67 0.78 .. .. .. .. .. Other 5.23 5.23 4.54 4.56 4.79 5.62 .. .. .. .. .. Total 19.84 17.95 16.33 12.54 11.39 11.81 14.20 .. .. .. ..
One Port traffic2
To rigs 3.59 1.88 2.42 2.57 2.10 2.19 .. .. .. .. .. Sea dumped - - - - - - .. .. .. .. .. Total 3.59 1.88 2.42 2.57 2.10 2.19 .. .. .. .. ..
Inland waterway traffic Internal - - - - - 0.05 .. .. .. .. .. Coastwise 3.43 3.04 2.74 2.18 1.93 1.64 .. .. .. .. .. One Port 0.04 0.05 0.01 0 0.02 0.01 .. .. .. .. .. Foreign 6.63 7.80 7.95 8.61 8.74 7.71 .. .. .. .. .. Total 10.10 10.89 10.70 10.79 10.69 9.41 10.27 .. .. .. ..
All above traffic3 30.06 27.63 26.70 23.72 22.23 21.76 24.47 .. .. .. ..
Port exports4 38.32 39.89 33.36 32.06 31.58 30.84 30.26 32.97 30.89 33.33 33.43
All freight lifted5 61.75 59.72 52.11 47.17 45.07 44.89 44.45 .. .. .. ..
Freight moved ( weight x distance ) million tonne-kilometres
Coastwise traffic1
Liquid bulks 12,360 10,777 10,628 6,723 4,888 4,783 .. .. .. .. .. Coal 261 302 303 316 277 312 .. .. .. .. .. Other 2,700 2,478 2,080 2,012 2,287 2,936 .. .. .. .. .. Total 15,321 13,557 13,011 9,051 7,452 8,031 11,414 .. .. .. ..
One Port traffic2
To rigs 2,287 1,885 2,190 2,571 2,100 2,182 .. .. .. .. .. Sea dumped - - .. .. .. .. .. .. .. .. .. Total 2,287 1,885 2,190 2,571 2,100 2,182 .. .. .. .. ..
Inland waterway traffic Internal - - - - - - - - - - - Coastwise 83 80 80 60 53 22 .. .. .. .. .. One Port - - - - - - .. .. .. .. .. Foreign 160 200 190 209 209 137 .. .. .. .. .. Total 244 280 270 269 262 234 236 .. .. .. ..
All above traffic6 17,852 15,722 15,471 11,891 9,814 10,447 11,649 .. .. .. ..
Port exports7 .. .. .. .. .. .. .. .. .. .. ..
All freight7 .. .. .. .. .. .. .. .. .. .. ..
Source: DfT Maritime Statistics1. Covers all coastwise cargo lifted in Scotland, regardless of its destination.2. Covers cargoes lifted in Scotland for offshore installations and for dumping at sea.3. Total of Coastwise traffic, One Port traffic and the Internal and Foreign components of Inland Waterway traffic.
Excludes Coastwise and One Port components of Inland Waterway traffic to avoid double counting.
4. Major ports only. There were seven major ports in 1996; eight in 1997 and 1998; nine in 1999;and 11 from 2000 onwards.
5. Coastwise traffic, One Port traffic, the Internal component of Inland Waterway traffic, and Port exports.Excludes Coastwise and One Port components of Inland Waterway traffic to avoid double counting.
6. This is the total of Coastwise traffic, One Port traffic and Inland Waterway traffic. No double counting exists as the Coastwise component of Inland Waterway traffic relates to the distance travelled on inland waterways, and Coastwise traffic relates to the distance travelled at sea.
7. Figures for tonne-kilometres are not available for exports (and, in any case, would not be relevant to Scottish transport statistics).
8. DfT have now discontinued the publication of a number of tables in their publication. We are no longer able to update most of this table.
149
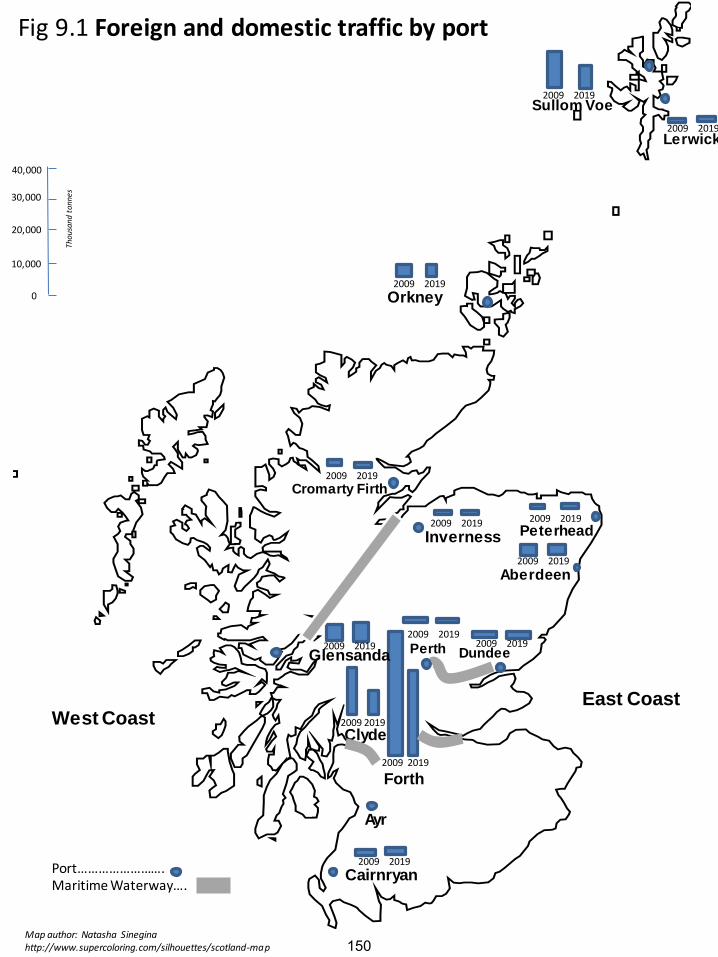
Inverness
Aberdeen
Forth
Ayr
Cromarty Firth
Fig 9.1 Foreign and domestic traffic by port
Lerwick
Sullom Voe
Dundee
West Coast
Cairnryan
Orkney
Clyde
Glensanda
40,000
30,000
20,000
10,000
Thou
sand
ton
nes
2009 2019
2009 2019
2009 2019
2009 2019
Perth2009 2019
2009 2019
2009 2019
2009 2019
East Coast
2009 2019
2009 2019
Peterhead
2009 2019
2009 2019
2009 2019
Port…………………….Maritime Waterway….
0
Map author: Natasha Sineginahttp://www.supercoloring.com/silhouettes/scotland-map 150
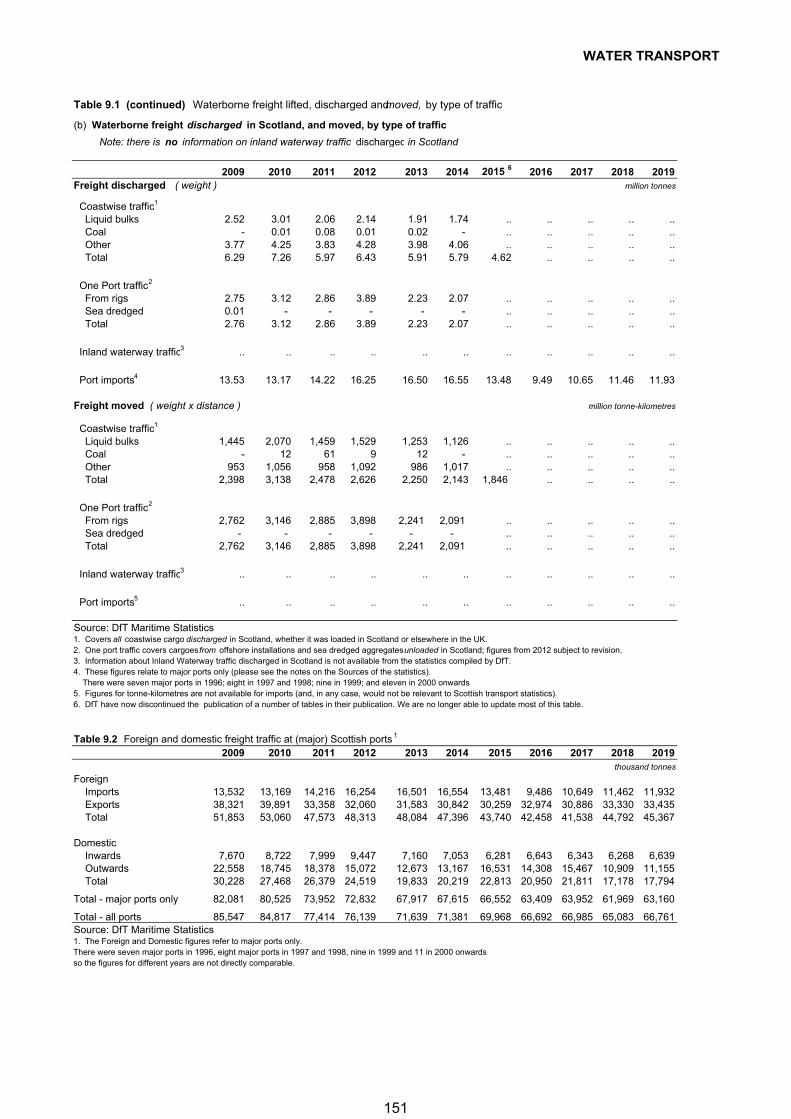
WATER TRANSPORT
Table 9.1 (continued) Waterborne freight lifted, discharged and moved, by type of traffic
(b) Waterborne freight discharged in Scotland, and moved, by type of traffic
Note: there is no information on inland waterway traffic discharged in Scotland
2009 2010 2011 2012 2013 2014 2015 6 2016 2017 2018 2019Freight discharged ( weight ) million tonnes
Coastwise traffic1
Liquid bulks 2.52 3.01 2.06 2.14 1.91 1.74 .. .. .. .. .. Coal - 0.01 0.08 0.01 0.02 - .. .. .. .. .. Other 3.77 4.25 3.83 4.28 3.98 4.06 .. .. .. .. .. Total 6.29 7.26 5.97 6.43 5.91 5.79 4.62 .. .. .. ..
One Port traffic2 From rigs 2.75 3.12 2.86 3.89 2.23 2.07 .. .. .. .. .. Sea dredged 0.01 - - - - - .. .. .. .. .. Total 2.76 3.12 2.86 3.89 2.23 2.07 .. .. .. .. ..
Inland waterway traffic3 .. .. .. .. .. .. .. .. .. .. ..
Port imports4 13.53 13.17 14.22 16.25 16.50 16.55 13.48 9.49 10.65 11.46 11.93
Freight moved ( weight x distance ) million tonne-kilometres
Coastwise traffic1
Liquid bulks 1,445 2,070 1,459 1,529 1,253 1,126 .. .. .. .. .. Coal - 12 61 9 12 - .. .. .. .. .. Other 953 1,056 958 1,092 986 1,017 .. .. .. .. .. Total 2,398 3,138 2,478 2,626 2,250 2,143 1,846 .. .. .. ..
One Port traffic2
From rigs 2,762 3,146 2,885 3,898 2,241 2,091 .. .. .. .. .. Sea dredged - - - - - - .. .. .. .. .. Total 2,762 3,146 2,885 3,898 2,241 2,091 .. .. .. .. ..
Inland waterway traffic3 .. .. .. .. .. .. .. .. .. .. ..
Port imports5 .. .. .. .. .. .. .. .. .. .. ..
Source: DfT Maritime Statistics1. Covers all coastwise cargo discharged in Scotland, whether it was loaded in Scotland or elsewhere in the UK.2. One port traffic covers cargoes from offshore installations and sea dredged aggregates unloaded in Scotland; figures from 2012 subject to revision.3. Information about Inland Waterway traffic discharged in Scotland is not available from the statistics compiled by DfT. 4. These figures relate to major ports only (please see the notes on the Sources of the statistics). There were seven major ports in 1996; eight in 1997 and 1998; nine in 1999; and eleven in 2000 onwards5. Figures for tonne-kilometres are not available for imports (and, in any case, would not be relevant to Scottish transport statistics).6. DfT have now discontinued the publication of a number of tables in their publication. We are no longer able to update most of this table.
Table 9.2 Foreign and domestic freight traffic at (major) Scottish ports 1
2009 2010 2011 2012 2013 2014 2015 2016 2017 2018 2019thousand tonnes
Foreign Imports 13,532 13,169 14,216 16,254 16,501 16,554 13,481 9,486 10,649 11,462 11,932 Exports 38,321 39,891 33,358 32,060 31,583 30,842 30,259 32,974 30,886 33,330 33,435 Total 51,853 53,060 47,573 48,313 48,084 47,396 43,740 42,458 41,538 44,792 45,367
Domestic Inwards 7,670 8,722 7,999 9,447 7,160 7,053 6,281 6,643 6,343 6,268 6,639 Outwards 22,558 18,745 18,378 15,072 12,673 13,167 16,531 14,308 15,467 10,909 11,155 Total 30,228 27,468 26,379 24,519 19,833 20,219 22,813 20,950 21,811 17,178 17,794
Total - major ports only 82,081 80,525 73,952 72,832 67,917 67,615 66,552 63,409 63,952 61,969 63,160
Total - all ports 85,547 84,817 77,414 76,139 71,639 71,381 69,968 66,692 66,985 65,083 66,761Source: DfT Maritime Statistics1. The Foreign and Domestic figures refer to major ports only. There were seven major ports in 1996, eight major ports in 1997 and 1998, nine in 1999 and 11 in 2000 onwardsso the figures for different years are not directly comparable.
151
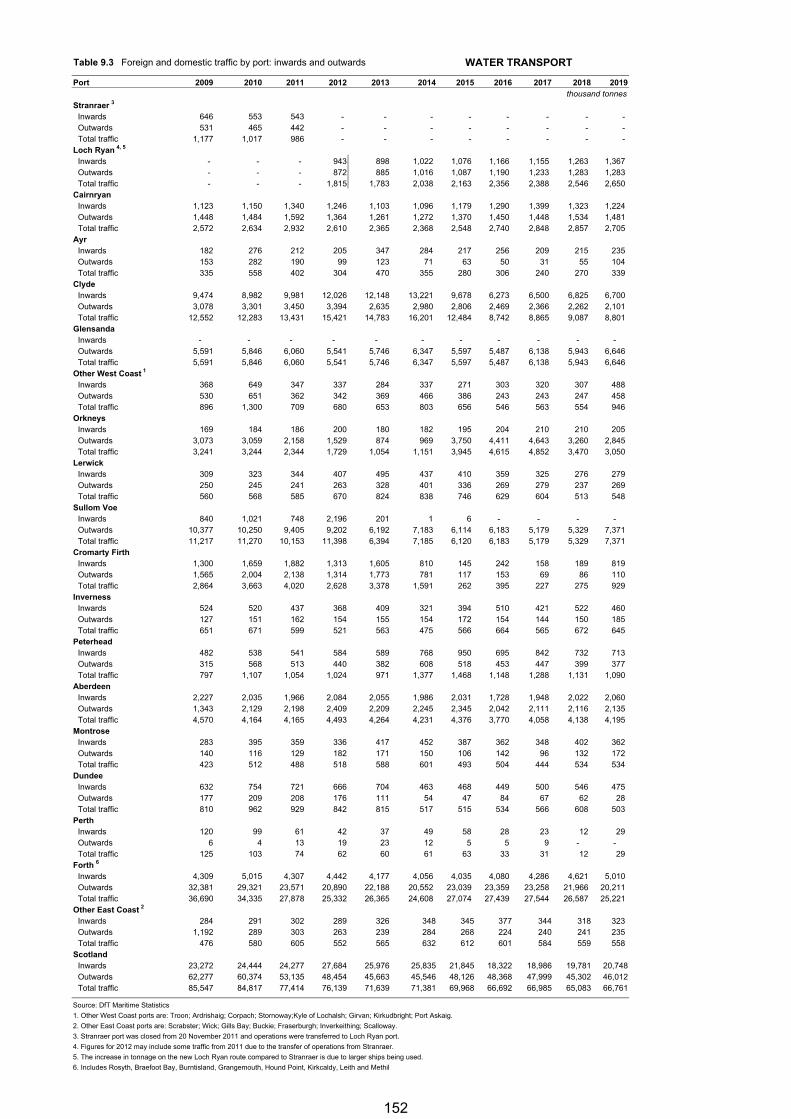
Table 9.3 Foreign and domestic traffic by port: inwards and outwards WATER TRANSPORT
Port 2009 2010 2011 2012 2013 2014 2015 2016 2017 2018 2019thousand tonnes
Stranraer 3
Inwards 646 553 543 - - - - - - - - Outwards 531 465 442 - - - - - - - - Total traffic 1,177 1,017 986 - - - - - - - -
Loch Ryan 4, 5
Inwards - - - 943 898 1,022 1,076 1,166 1,155 1,263 1,367 Outwards - - - 872 885 1,016 1,087 1,190 1,233 1,283 1,283 Total traffic - - - 1,815 1,783 2,038 2,163 2,356 2,388 2,546 2,650
CairnryanInwards 1,123 1,150 1,340 1,246 1,103 1,096 1,179 1,290 1,399 1,323 1,224 Outwards 1,448 1,484 1,592 1,364 1,261 1,272 1,370 1,450 1,448 1,534 1,481 Total traffic 2,572 2,634 2,932 2,610 2,365 2,368 2,548 2,740 2,848 2,857 2,705
AyrInwards 182 276 212 205 347 284 217 256 209 215 235 Outwards 153 282 190 99 123 71 63 50 31 55 104 Total traffic 335 558 402 304 470 355 280 306 240 270 339
ClydeInwards 9,474 8,982 9,981 12,026 12,148 13,221 9,678 6,273 6,500 6,825 6,700 Outwards 3,078 3,301 3,450 3,394 2,635 2,980 2,806 2,469 2,366 2,262 2,101 Total traffic 12,552 12,283 13,431 15,421 14,783 16,201 12,484 8,742 8,865 9,087 8,801
GlensandaInwards - - - - - - - - - - - Outwards 5,591 5,846 6,060 5,541 5,746 6,347 5,597 5,487 6,138 5,943 6,646 Total traffic 5,591 5,846 6,060 5,541 5,746 6,347 5,597 5,487 6,138 5,943 6,646
Other West Coast 1
Inwards 368 649 347 337 284 337 271 303 320 307 488 Outwards 530 651 362 342 369 466 386 243 243 247 458 Total traffic 896 1,300 709 680 653 803 656 546 563 554 946
OrkneysInwards 169 184 186 200 180 182 195 204 210 210 205 Outwards 3,073 3,059 2,158 1,529 874 969 3,750 4,411 4,643 3,260 2,845 Total traffic 3,241 3,244 2,344 1,729 1,054 1,151 3,945 4,615 4,852 3,470 3,050
LerwickInwards 309 323 344 407 495 437 410 359 325 276 279 Outwards 250 245 241 263 328 401 336 269 279 237 269 Total traffic 560 568 585 670 824 838 746 629 604 513 548
Sullom VoeInwards 840 1,021 748 2,196 201 1 6 - - - - Outwards 10,377 10,250 9,405 9,202 6,192 7,183 6,114 6,183 5,179 5,329 7,371 Total traffic 11,217 11,270 10,153 11,398 6,394 7,185 6,120 6,183 5,179 5,329 7,371
Cromarty FirthInwards 1,300 1,659 1,882 1,313 1,605 810 145 242 158 189 819 Outwards 1,565 2,004 2,138 1,314 1,773 781 117 153 69 86 110 Total traffic 2,864 3,663 4,020 2,628 3,378 1,591 262 395 227 275 929
InvernessInwards 524 520 437 368 409 321 394 510 421 522 460 Outwards 127 151 162 154 155 154 172 154 144 150 185 Total traffic 651 671 599 521 563 475 566 664 565 672 645
PeterheadInwards 482 538 541 584 589 768 950 695 842 732 713 Outwards 315 568 513 440 382 608 518 453 447 399 377 Total traffic 797 1,107 1,054 1,024 971 1,377 1,468 1,148 1,288 1,131 1,090
AberdeenInwards 2,227 2,035 1,966 2,084 2,055 1,986 2,031 1,728 1,948 2,022 2,060 Outwards 1,343 2,129 2,198 2,409 2,209 2,245 2,345 2,042 2,111 2,116 2,135 Total traffic 4,570 4,164 4,165 4,493 4,264 4,231 4,376 3,770 4,058 4,138 4,195
MontroseInwards 283 395 359 336 417 452 387 362 348 402 362 Outwards 140 116 129 182 171 150 106 142 96 132 172 Total traffic 423 512 488 518 588 601 493 504 444 534 534
DundeeInwards 632 754 721 666 704 463 468 449 500 546 475 Outwards 177 209 208 176 111 54 47 84 67 62 28 Total traffic 810 962 929 842 815 517 515 534 566 608 503
PerthInwards 120 99 61 42 37 49 58 28 23 12 29 Outwards 6 4 13 19 23 12 5 5 9 - - Total traffic 125 103 74 62 60 61 63 33 31 12 29
Forth 6
Inwards 4,309 5,015 4,307 4,442 4,177 4,056 4,035 4,080 4,286 4,621 5,010 Outwards 32,381 29,321 23,571 20,890 22,188 20,552 23,039 23,359 23,258 21,966 20,211 Total traffic 36,690 34,335 27,878 25,332 26,365 24,608 27,074 27,439 27,544 26,587 25,221
Other East Coast 2
Inwards 284 291 302 289 326 348 345 377 344 318 323 Outwards 1,192 289 303 263 239 284 268 224 240 241 235 Total traffic 476 580 605 552 565 632 612 601 584 559 558
ScotlandInwards 23,272 24,444 24,277 27,684 25,976 25,835 21,845 18,322 18,986 19,781 20,748Outwards 62,277 60,374 53,135 48,454 45,663 45,546 48,126 48,368 47,999 45,302 46,012Total traffic 85,547 84,817 77,414 76,139 71,639 71,381 69,968 66,692 66,985 65,083 66,761
Source: DfT Maritime Statistics
1. Other West Coast ports are: Troon; Ardrishaig; Corpach; Stornoway;Kyle of Lochalsh; Girvan; Kirkudbright; Port Askaig.
2. Other East Coast ports are: Scrabster; Wick; Gills Bay; Buckie; Fraserburgh; Inverkeithing; Scalloway.
3. Stranraer port was closed from 20 November 2011 and operations were transferred to Loch Ryan port.
4. Figures for 2012 may include some traffic from 2011 due to the transfer of operations from Stranraer.
5. The increase in tonnage on the new Loch Ryan route compared to Stranraer is due to larger ships being used.
6. Includes Rosyth, Braefoot Bay, Burntisland, Grangemouth, Hound Point, Kirkcaldy, Leith and Methil
152
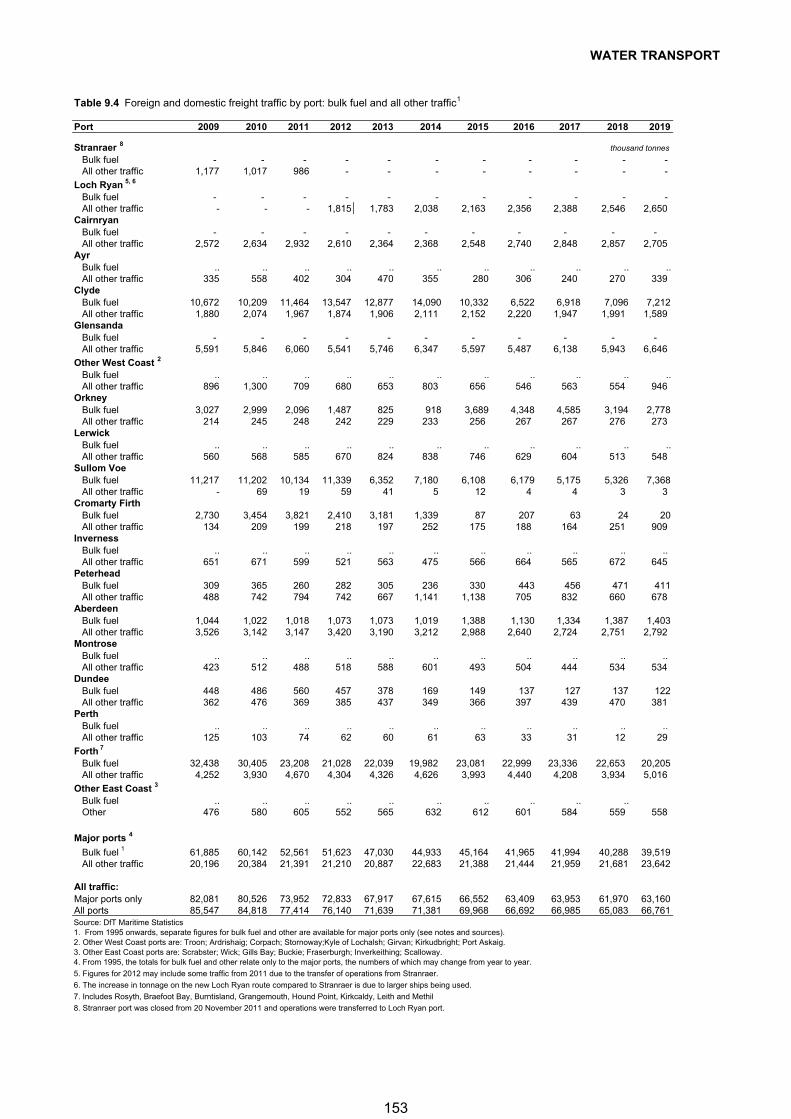
WATER TRANSPORT
Table 9.4 Foreign and domestic freight traffic by port: bulk fuel and all other traffic 1
Port 2009 2010 2011 2012 2013 2014 2015 2016 2017 2018 2019
Stranraer 8thousand tonnes
Bulk fuel - - - - - - - - - - - All other traffic 1,177 1,017 986 - - - - - - - -
Loch Ryan 5, 6
Bulk fuel - - - - - - - - - - - All other traffic - - - 1,815 1,783 2,038 2,163 2,356 2,388 2,546 2,650 Cairnryan Bulk fuel - - - - - - - - - - - All other traffic 2,572 2,634 2,932 2,610 2,364 2,368 2,548 2,740 2,848 2,857 2,705 Ayr Bulk fuel .. .. .. .. .. .. .. .. .. .. .. All other traffic 335 558 402 304 470 355 280 306 240 270 339 Clyde Bulk fuel 10,672 10,209 11,464 13,547 12,877 14,090 10,332 6,522 6,918 7,096 7,212 All other traffic 1,880 2,074 1,967 1,874 1,906 2,111 2,152 2,220 1,947 1,991 1,589 Glensanda Bulk fuel - - - - - - - - - - - All other traffic 5,591 5,846 6,060 5,541 5,746 6,347 5,597 5,487 6,138 5,943 6,646
Other West Coast 2
Bulk fuel .. .. .. .. .. .. .. .. .. .. .. All other traffic 896 1,300 709 680 653 803 656 546 563 554 946 Orkney Bulk fuel 3,027 2,999 2,096 1,487 825 918 3,689 4,348 4,585 3,194 2,778 All other traffic 214 245 248 242 229 233 256 267 267 276 273 Lerwick Bulk fuel .. .. .. .. .. .. .. .. .. .. .. All other traffic 560 568 585 670 824 838 746 629 604 513 548 Sullom Voe Bulk fuel 11,217 11,202 10,134 11,339 6,352 7,180 6,108 6,179 5,175 5,326 7,368 All other traffic - 69 19 59 41 5 12 4 4 3 3 Cromarty Firth Bulk fuel 2,730 3,454 3,821 2,410 3,181 1,339 87 207 63 24 20 All other traffic 134 209 199 218 197 252 175 188 164 251 909 Inverness Bulk fuel .. .. .. .. .. .. .. .. .. .. .. All other traffic 651 671 599 521 563 475 566 664 565 672 645 Peterhead Bulk fuel 309 365 260 282 305 236 330 443 456 471 411 All other traffic 488 742 794 742 667 1,141 1,138 705 832 660 678 Aberdeen Bulk fuel 1,044 1,022 1,018 1,073 1,073 1,019 1,388 1,130 1,334 1,387 1,403 All other traffic 3,526 3,142 3,147 3,420 3,190 3,212 2,988 2,640 2,724 2,751 2,792 Montrose Bulk fuel .. .. .. .. .. .. .. .. .. .. .. All other traffic 423 512 488 518 588 601 493 504 444 534 534 Dundee Bulk fuel 448 486 560 457 378 169 149 137 127 137 122 All other traffic 362 476 369 385 437 349 366 397 439 470 381 Perth Bulk fuel .. .. .. .. .. .. .. .. .. .. .. All other traffic 125 103 74 62 60 61 63 33 31 12 29
Forth 7 Bulk fuel 32,438 30,405 23,208 21,028 22,039 19,982 23,081 22,999 23,336 22,653 20,205 All other traffic 4,252 3,930 4,670 4,304 4,326 4,626 3,993 4,440 4,208 3,934 5,016
Other East Coast 3
Bulk fuel .. .. .. .. .. .. .. .. .. .. Other 476 580 605 552 565 632 612 601 584 559 558
Major ports 4
Bulk fuel 1 61,885 60,142 52,561 51,623 47,030 44,933 45,164 41,965 41,994 40,288 39,519 All other traffic 20,196 20,384 21,391 21,210 20,887 22,683 21,388 21,444 21,959 21,681 23,642
All traffic: Major ports only 82,081 80,526 73,952 72,833 67,917 67,615 66,552 63,409 63,953 61,970 63,160All ports 85,547 84,818 77,414 76,140 71,639 71,381 69,968 66,692 66,985 65,083 66,761Source: DfT Maritime Statistics1. From 1995 onwards, separate figures for bulk fuel and other are available for major ports only (see notes and sources).2. Other West Coast ports are: Troon; Ardrishaig; Corpach; Stornoway;Kyle of Lochalsh; Girvan; Kirkudbright; Port Askaig.3. Other East Coast ports are: Scrabster; Wick; Gills Bay; Buckie; Fraserburgh; Inverkeithing; Scalloway.4. From 1995, the totals for bulk fuel and other relate only to the major ports, the numbers of which may change from year to year.
5. Figures for 2012 may include some traffic from 2011 due to the transfer of operations from Stranraer.
6. The increase in tonnage on the new Loch Ryan route compared to Stranraer is due to larger ships being used.
7. Includes Rosyth, Braefoot Bay, Burntisland, Grangemouth, Hound Point, Kirkcaldy, Leith and Methil
8. Stranraer port was closed from 20 November 2011 and operations were transferred to Loch Ryan port.
153
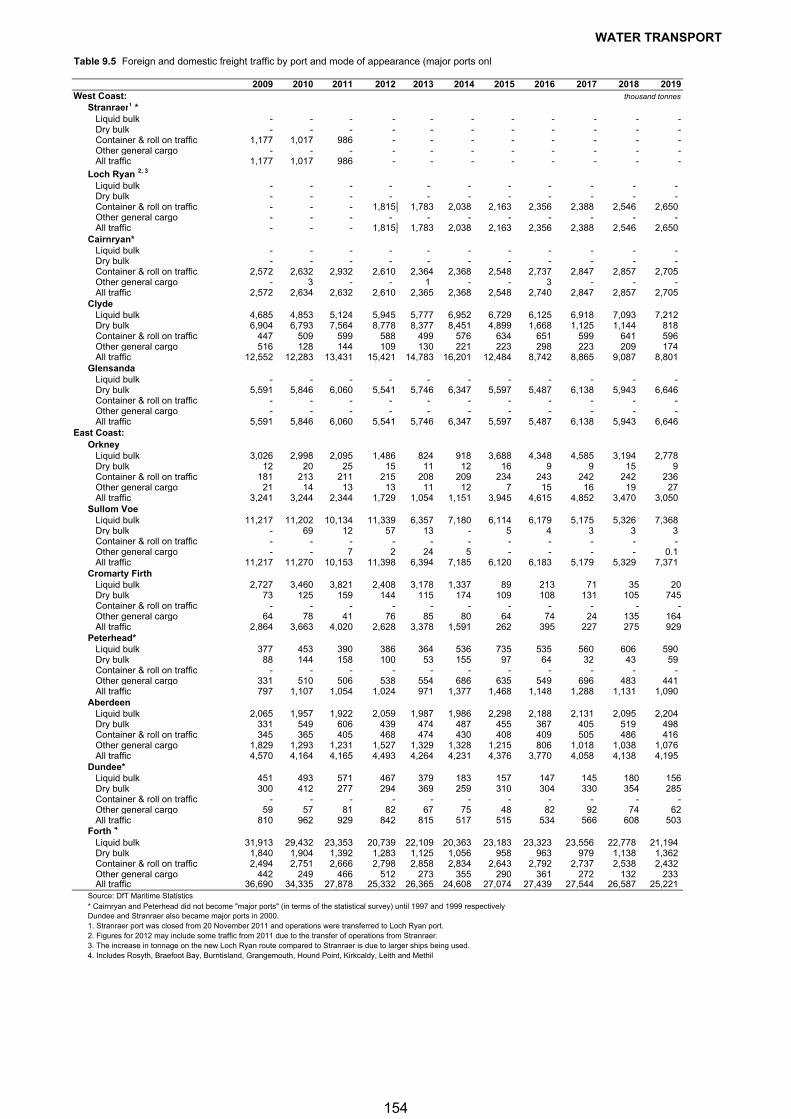
WATER TRANSPORT
Table 9.5 Foreign and domestic freight traffic by port and mode of appearance (major ports only
2009 2010 2011 2012 2013 2014 2015 2016 2017 2018 2019West Coast: thousand tonnes
Stranraer1 * Liquid bulk - - - - - - - - - - - Dry bulk - - - - - - - - - - - Container & roll on traffic 1,177 1,017 986 - - - - - - - - Other general cargo - - - - - - - - - - - All traffic 1,177 1,017 986 - - - - - - - -
Loch Ryan 2, 3
Liquid bulk - - - - - - - - - - - Dry bulk - - - - - - - - - - - Container & roll on traffic - - - 1,815 1,783 2,038 2,163 2,356 2,388 2,546 2,650 Other general cargo - - - - - - - - - - - All traffic - - - 1,815 1,783 2,038 2,163 2,356 2,388 2,546 2,650 Cairnryan* Liquid bulk - - - - - - - - - - - Dry bulk - - - - - - - - - - - Container & roll on traffic 2,572 2,632 2,932 2,610 2,364 2,368 2,548 2,737 2,847 2,857 2,705 Other general cargo - 3 - - 1 - - 3 - - - All traffic 2,572 2,634 2,632 2,610 2,365 2,368 2,548 2,740 2,847 2,857 2,705 Clyde Liquid bulk 4,685 4,853 5,124 5,945 5,777 6,952 6,729 6,125 6,918 7,093 7,212 Dry bulk 6,904 6,793 7,564 8,778 8,377 8,451 4,899 1,668 1,125 1,144 818 Container & roll on traffic 447 509 599 588 499 576 634 651 599 641 596 Other general cargo 516 128 144 109 130 221 223 298 223 209 174 All traffic 12,552 12,283 13,431 15,421 14,783 16,201 12,484 8,742 8,865 9,087 8,801 ,Glensanda Liquid bulk - - - - - - - - - - - Dry bulk 5,591 5,846 6,060 5,541 5,746 6,347 5,597 5,487 6,138 5,943 6,646 Container & roll on traffic - - - - - - - - - - - Other general cargo - - - - - - - - - - - All traffic 5,591 5,846 6,060 5,541 5,746 6,347 5,597 5,487 6,138 5,943 6,646
East Coast:Orkney Liquid bulk 3,026 2,998 2,095 1,486 824 918 3,688 4,348 4,585 3,194 2,778 Dry bulk 12 20 25 15 11 12 16 9 9 15 9 Container & roll on traffic 181 213 211 215 208 209 234 243 242 242 236 Other general cargo 21 14 13 13 11 12 7 15 16 19 27 All traffic 3,241 3,244 2,344 1,729 1,054 1,151 3,945 4,615 4,852 3,470 3,050 Sullom Voe Liquid bulk 11,217 11,202 10,134 11,339 6,357 7,180 6,114 6,179 5,175 5,326 7,368 Dry bulk - 69 12 57 13 - 5 4 3 3 3 Container & roll on traffic - - - - - - - - - - - Other general cargo - - 7 2 24 5 - - - - 0.1 All traffic 11,217 11,270 10,153 11,398 6,394 7,185 6,120 6,183 5,179 5,329 7,371 Cromarty Firth Liquid bulk 2,727 3,460 3,821 2,408 3,178 1,337 89 213 71 35 20 Dry bulk 73 125 159 144 115 174 109 108 131 105 745 Container & roll on traffic - - - - - - - - - - - Other general cargo 64 78 41 76 85 80 64 74 24 135 164 All traffic 2,864 3,663 4,020 2,628 3,378 1,591 262 395 227 275 929Peterhead* Liquid bulk 377 453 390 386 364 536 735 535 560 606 590 Dry bulk 88 144 158 100 53 155 97 64 32 43 59 Container & roll on traffic - - - - - - - - - - - Other general cargo 331 510 506 538 554 686 635 549 696 483 441 All traffic 797 1,107 1,054 1,024 971 1,377 1,468 1,148 1,288 1,131 1,090 Aberdeen Liquid bulk 2,065 1,957 1,922 2,059 1,987 1,986 2,298 2,188 2,131 2,095 2,204 Dry bulk 331 549 606 439 474 487 455 367 405 519 498 Container & roll on traffic 345 365 405 468 474 430 408 409 505 486 416 Other general cargo 1,829 1,293 1,231 1,527 1,329 1,328 1,215 806 1,018 1,038 1,076 All traffic 4,570 4,164 4,165 4,493 4,264 4,231 4,376 3,770 4,058 4,138 4,195 Dundee* Liquid bulk 451 493 571 467 379 183 157 147 145 180 156 Dry bulk 300 412 277 294 369 259 310 304 330 354 285 Container & roll on traffic - - - - - - - - - - - Other general cargo 59 57 81 82 67 75 48 82 92 74 62 All traffic 810 962 929 842 815 517 515 534 566 608 503Forth 4
Liquid bulk 31,913 29,432 23,353 20,739 22,109 20,363 23,183 23,323 23,556 22,778 21,194 Dry bulk 1,840 1,904 1,392 1,283 1,125 1,056 958 963 979 1,138 1,362 Container & roll on traffic 2,494 2,751 2,666 2,798 2,858 2,834 2,643 2,792 2,737 2,538 2,432 Other general cargo 442 249 466 512 273 355 290 361 272 132 233 All traffic 36,690 34,335 27,878 25,332 26,365 24,608 27,074 27,439 27,544 26,587 25,221 Source: DfT Maritime Statistics* Cairnryan and Peterhead did not become "major ports" (in terms of the statistical survey) until 1997 and 1999 respectivelyDundee and Stranraer also became major ports in 2000.1. Stranraer port was closed from 20 November 2011 and operations were transferred to Loch Ryan port.2. Figures for 2012 may include some traffic from 2011 due to the transfer of operations from Stranraer.3. The increase in tonnage on the new Loch Ryan route compared to Stranraer is due to larger ships being used.4. Includes Rosyth, Braefoot Bay, Burntisland, Grangemouth, Hound Point, Kirkcaldy, Leith and Methil
154
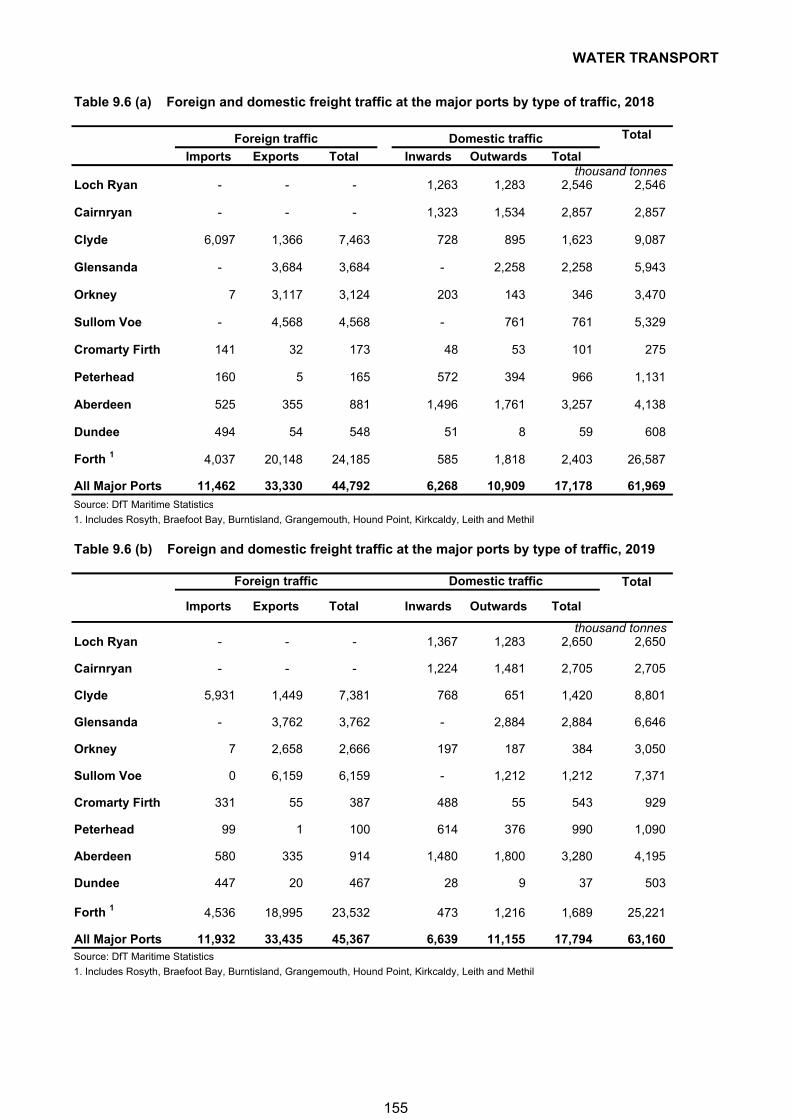
WATER TRANSPORT
Table 9.6 (a) Foreign and domestic freight traffic at the major ports by type of traffic, 2018
Total
Imports Exports Total Inwards Outwards Totalthousand tonnes
Loch Ryan - - - 1,263 1,283 2,546 2,546
Cairnryan - - - 1,323 1,534 2,857 2,857
Clyde 6,097 1,366 7,463 728 895 1,623 9,087
Glensanda - 3,684 3,684 - 2,258 2,258 5,943
Orkney 7 3,117 3,124 203 143 346 3,470
Sullom Voe - 4,568 4,568 - 761 761 5,329
Cromarty Firth 141 32 173 48 53 101 275
Peterhead 160 5 165 572 394 966 1,131
Aberdeen 525 355 881 1,496 1,761 3,257 4,138
Dundee 494 54 548 51 8 59 608
Forth 1 4,037 20,148 24,185 585 1,818 2,403 26,587
All Major Ports 11,462 33,330 44,792 6,268 10,909 17,178 61,969
Source: DfT Maritime Statistics
1. Includes Rosyth, Braefoot Bay, Burntisland, Grangemouth, Hound Point, Kirkcaldy, Leith and Methil
Table 9.6 (b) Foreign and domestic freight traffic at the major ports by type of traffic, 2019
Total
Imports Exports Total Inwards Outwards Total
thousand tonnesLoch Ryan - - - 1,367 1,283 2,650 2,650
Cairnryan - - - 1,224 1,481 2,705 2,705
Clyde 5,931 1,449 7,381 768 651 1,420 8,801
Glensanda - 3,762 3,762 - 2,884 2,884 6,646
Orkney 7 2,658 2,666 197 187 384 3,050
Sullom Voe 0 6,159 6,159 - 1,212 1,212 7,371
Cromarty Firth 331 55 387 488 55 543 929
Peterhead 99 1 100 614 376 990 1,090
Aberdeen 580 335 914 1,480 1,800 3,280 4,195
Dundee 447 20 467 28 9 37 503
Forth 1 4,536 18,995 23,532 473 1,216 1,689 25,221
All Major Ports 11,932 33,435 45,367 6,639 11,155 17,794 63,160 Source: DfT Maritime Statistics
1. Includes Rosyth, Braefoot Bay, Burntisland, Grangemouth, Hound Point, Kirkcaldy, Leith and Methil
Foreign traffic Domestic traffic
Foreign traffic Domestic traffic
155
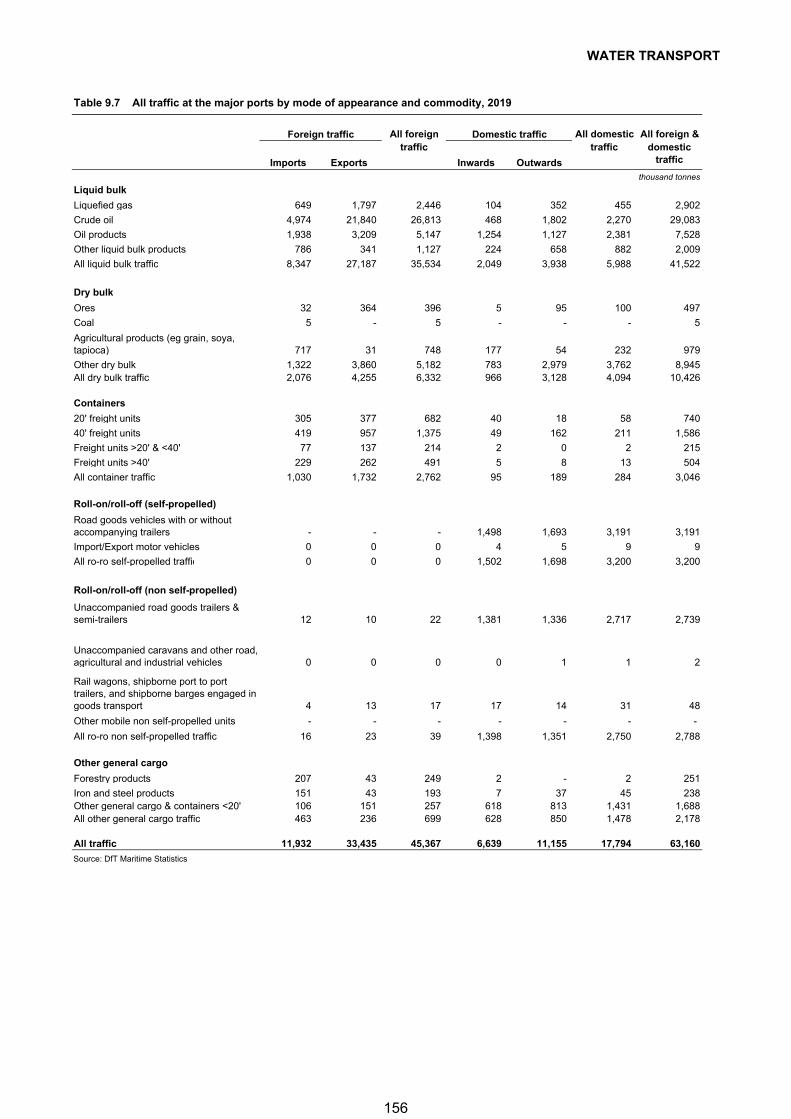
WATER TRANSPORT
Table 9.7 All traffic at the major ports by mode of appearance and commodity, 2019
All foreign All domestic All foreign &
Imports Exports
traffic
Inwards Outwards
traffic domestic traffic
thousand tonnes
Liquid bulk
Liquefied gas 649 1,797 2,446 104 352 455 2,902
Crude oil 4,974 21,840 26,813 468 1,802 2,270 29,083
Oil products 1,938 3,209 5,147 1,254 1,127 2,381 7,528
Other liquid bulk products 786 341 1,127 224 658 882 2,009
All liquid bulk traffic 8,347 27,187 35,534 2,049 3,938 5,988 41,522
Dry bulk
Ores 32 364 396 5 95 100 497
Coal 5 - 5 - - - 5
Agricultural products (eg grain, soya, tapioca) 717 31 748 177 54 232 979
Other dry bulk 1,322 3,860 5,182 783 2,979 3,762 8,945All dry bulk traffic 2,076 4,255 6,332 966 3,128 4,094 10,426
Containers
20' freight units 305 377 682 40 18 58 740
40' freight units 419 957 1,375 49 162 211 1,586
Freight units >20' & <40' 77 137 214 2 0 2 215
Freight units >40' 229 262 491 5 8 13 504
All container traffic 1,030 1,732 2,762 95 189 284 3,046
Roll-on/roll-off (self-propelled)
Road goods vehicles with or without accompanying trailers - - - 1,498 1,693 3,191 3,191
Import/Export motor vehicles 0 0 0 4 5 9 9
All ro-ro self-propelled traffic 0 0 0 1,502 1,698 3,200 3,200
Roll-on/roll-off (non self-propelled)
Unaccompanied road goods trailers & semi-trailers 12 10 22 1,381 1,336 2,717 2,739
Unaccompanied caravans and other road, agricultural and industrial vehicles 0 0 0 0 1 1 2
Rail wagons, shipborne port to port trailers, and shipborne barges engaged in goods transport 4 13 17 17 14 31 48
Other mobile non self-propelled units - - - - - - -
All ro-ro non self-propelled traffic 16 23 39 1,398 1,351 2,750 2,788
Other general cargo
Forestry products 207 43 249 2 - 2 251
Iron and steel products 151 43 193 7 37 45 238Other general cargo & containers <20' 106 151 257 618 813 1,431 1,688All other general cargo traffic 463 236 699 628 850 1,478 2,178
All traffic 11,932 33,435 45,367 6,639 11,155 17,794 63,160
Source: DfT Maritime Statistics
Foreign traffic Domestic traffic
156
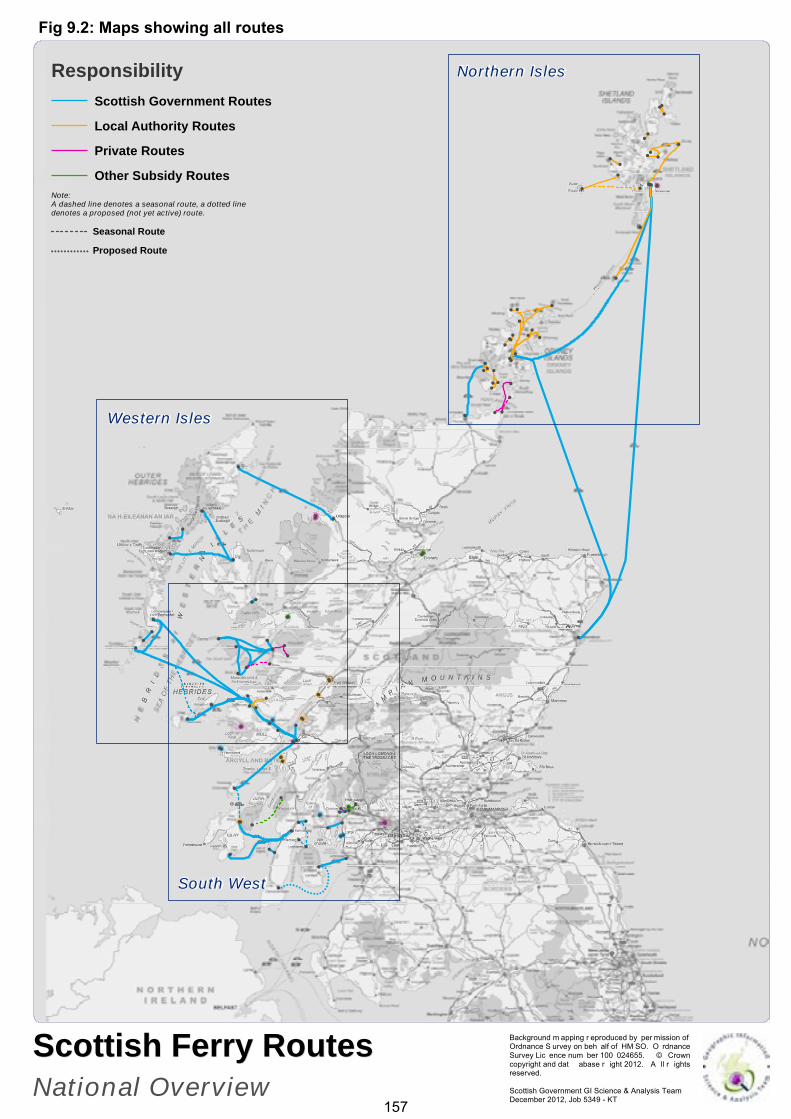
! ! !
!!
!!
!!!
!!!!!!!
!!
!!!!!
!!
!!! ! ! ! ! ! ! !
!
!
!
!
!
!
!
!
!
!
!
!
!
!
!
!
!
!
!
!
!
!!
!
!
!
!
!
!
!
!
!
!
!
!
!
!
!
!
!
!
! !
!!
!
!
!
!
!
!
!
!
!!
!
!
!
!
!
!
!
!!
!!
!!
!!
!
!!
!!
!!
!!
!
!
!!
!!
!!
!!
!!
!
!
!
!
!
!
!
!
!
!
!
!!
!!
!!
!!
!
!
!!
!!
!
!!
!
!
!
!
!
!!
!
!
!!
!
!
!
Scottish Ferry RoutesScottish Ferry RoutesNational Overview
Northern Isles
Western Isles
South West
ResponsibilityScottish Government Routes
Local Authority Routes
Private Routes
Other Subsidy Routes
Background m apping r eproduced by per mission ofOrdnance S urvey on beh alf of HM SO. O rdnanceSurvey Lic ence num ber 100 024655. © Crowncopyright and dat abase r ight 2012. A ll r ightsreserved.
Scottish Government GI Science & Analysis TeamDecember 2012, Job 5349 - KT
Note:A dashed line denotes a seasonal route, a dotted linedenotes a proposed (not yet active) route.
! ! ! ! ! ! ! ! ! ! ! !
Seasonal Route
Proposed Route
Fig 9.2: Maps showing all routes
157
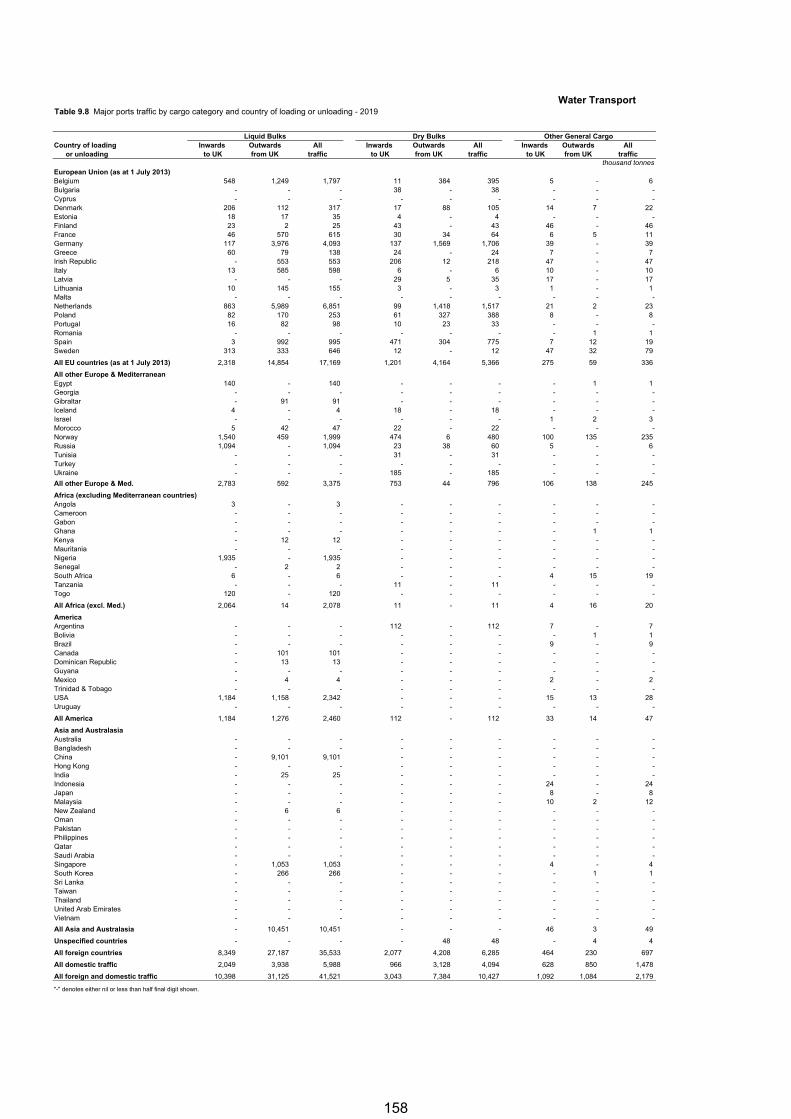
Water TransportTable 9.8 Major ports traffic by cargo category and country of loading or unloading - 2019
Liquid Bulks Dry Bulks Other General CargoCountry of loading Inwards Outwards All Inwards Outwards All Inwards Outwards All or unloading to UK from UK traffic to UK from UK traffic to UK from UK traffic
thousand tonnesEuropean Union (as at 1 July 2013) Belgium 548 1,249 1,797 11 384 395 5 - 6Bulgaria - - - 38 - 38 - - -Cyprus - - - - - - - - -Denmark 206 112 317 17 88 105 14 7 22Estonia 18 17 35 4 - 4 - - -Finland 23 2 25 43 - 43 46 - 46France 46 570 615 30 34 64 6 5 11Germany 117 3,976 4,093 137 1,569 1,706 39 - 39Greece 60 79 138 24 - 24 7 - 7Irish Republic - 553 553 206 12 218 47 - 47 Italy 13 585 598 6 - 6 10 - 10Latvia - - - 29 5 35 17 - 17Lithuania 10 145 155 3 - 3 1 - 1Malta - - - - - - - - -Netherlands 863 5,989 6,851 99 1,418 1,517 21 2 23Poland 82 170 253 61 327 388 8 - 8Portugal 16 82 98 10 23 33 - - -Romania - - - - - - - 1 1Spain 3 992 995 471 304 775 7 12 19Sweden 313 333 646 12 - 12 47 32 79
All EU countries (as at 1 July 2013) 2,318 14,854 17,169 1,201 4,164 5,366 275 59 336
All other Europe & MediterraneanEgypt 140 - 140 - - - - 1 1Georgia - - - - - - - - -Gibraltar - 91 91 - - - - - -Iceland 4 - 4 18 - 18 - - -Israel - - - - - - 1 2 3Morocco 5 42 47 22 - 22 - - -Norway 1,540 459 1,999 474 6 480 100 135 235Russia 1,094 - 1,094 23 38 60 5 - 6Tunisia - - - 31 - 31 - - -Turkey - - - - - - - - -Ukraine - - - 185 - 185 - - -
All other Europe & Med. 2,783 592 3,375 753 44 796 106 138 245
Africa (excluding Mediterranean countries) Angola 3 - 3 - - - - - -Cameroon - - - - - - - - -Gabon - - - - - - - - -Ghana - - - - - - - 1 1Kenya - 12 12 - - - - - -Mauritania - - - - - - - - -Nigeria 1,935 - 1,935 - - - - - -Senegal - 2 2 - - - - - -South Africa 6 - 6 - - - 4 15 19 Tanzania - - - 11 - 11 - - -Togo 120 - 120 - - - - - -
All Africa (excl. Med.) 2,064 14 2,078 11 - 11 4 16 20
America Argentina - - - 112 - 112 7 - 7Bolivia - - - - - - - 1 1Brazil - - - - - - 9 - 9Canada - 101 101 - - - - - -Dominican Republic - 13 13 - - - - - -Guyana - - - - - - - - -Mexico - 4 4 - - - 2 - 2Trinidad & Tobago - - - - - - - - -USA 1,184 1,158 2,342 - - - 15 13 28Uruguay - - - - - - - - -
All America 1,184 1,276 2,460 112 - 112 33 14 47
Asia and AustralasiaAustralia - - - - - - - - -Bangladesh - - - - - - - - -China - 9,101 9,101 - - - - - -Hong Kong - - - - - - - - -India - 25 25 - - - - - -Indonesia - - - - - - 24 - 24Japan - - - - - - 8 - 8Malaysia - - - - - - 10 2 12New Zealand - 6 6 - - - - - -Oman - - - - - - - - -Pakistan - - - - - - - - -Philippines - - - - - - - - -Qatar - - - - - - - - -Saudi Arabia - - - - - - - - -Singapore - 1,053 1,053 - - - 4 - 4South Korea - 266 266 - - - - 1 1 Sri Lanka - - - - - - - - -Taiwan - - - - - - - - -Thailand - - - - - - - - -United Arab Emirates - - - - - - - - -Vietnam - - - - - - - - -
All Asia and Australasia - 10,451 10,451 - - - 46 3 49 Unspecified countries - - - - 48 48 - 4 4 All foreign countries 8,349 27,187 35,533 2,077 4,208 6,285 464 230 697 All domestic traffic 2,049 3,938 5,988 966 3,128 4,094 628 850 1,478
All foreign and domestic traffic 10,398 31,125 41,521 3,043 7,384 10,427 1,092 1,084 2,179
"-" denotes either nil or less than half final digit shown.
158
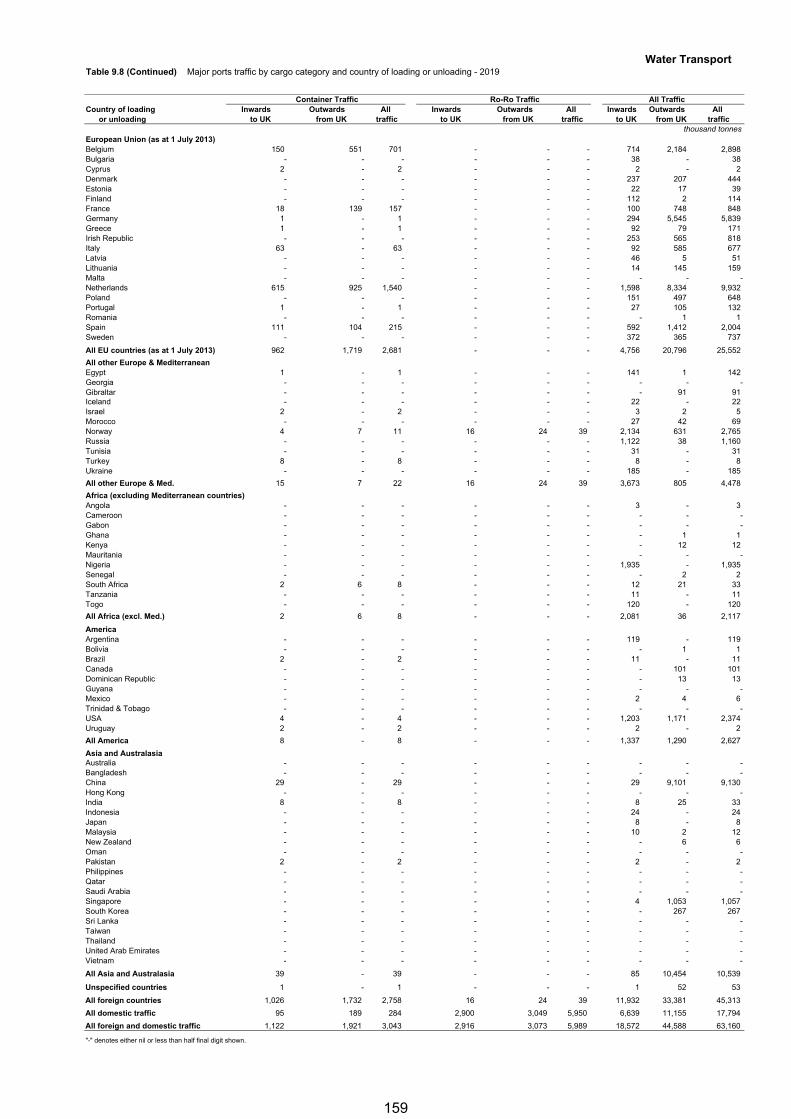
Water TransportTable 9.8 (Continued) Major ports traffic by cargo category and country of loading or unloading - 2019
Container Traffic Ro-Ro Traffic All TrafficCountry of loading Inwards Outwards All Inwards Outwards All Inwards Outwards All or unloading to UK from UK traffic to UK from UK traffic to UK from UK traffic
thousand tonnesEuropean Union (as at 1 July 2013) Belgium 150 551 701 - - - 714 2,184 2,898 Bulgaria - - - - - - 38 - 38 Cyprus 2 - 2 - - - 2 - 2 Denmark - - - - - - 237 207 444 Estonia - - - - - - 22 17 39 Finland - - - - - - 112 2 114 France 18 139 157 - - - 100 748 848 Germany 1 - 1 - - - 294 5,545 5,839 Greece 1 - 1 - - - 92 79 171 Irish Republic - - - - - - 253 565 818 Italy 63 - 63 - - - 92 585 677 Latvia - - - - - - 46 5 51 Lithuania - - - - - - 14 145 159 Malta - - - - - - - - -Netherlands 615 925 1,540 - - - 1,598 8,334 9,932 Poland - - - - - - 151 497 648 Portugal 1 - 1 - - - 27 105 132 Romania - - - - - - - 1 1 Spain 111 104 215 - - - 592 1,412 2,004 Sweden - - - - - - 372 365 737
All EU countries (as at 1 July 2013) 962 1,719 2,681 - - - 4,756 20,796 25,552
All other Europe & MediterraneanEgypt 1 - 1 - - - 141 1 142 Georgia - - - - - - - - -Gibraltar - - - - - - - 91 91 Iceland - - - - - - 22 - 22 Israel 2 - 2 - - - 3 2 5 Morocco - - - - - - 27 42 69 Norway 4 7 11 16 24 39 2,134 631 2,765 Russia - - - - - - 1,122 38 1,160 Tunisia - - - - - - 31 - 31 Turkey 8 - 8 - - - 8 - 8 Ukraine - - - - - - 185 - 185
All other Europe & Med. 15 7 22 16 24 39 3,673 805 4,478
Africa (excluding Mediterranean countries) Angola - - - - - - 3 - 3 Cameroon - - - - - - - - -Gabon - - - - - - - - -Ghana - - - - - - - 1 1 Kenya - - - - - - - 12 12 Mauritania - - - - - - - - -Nigeria - - - - - - 1,935 - 1,935 Senegal - - - - - - - 2 2 South Africa 2 6 8 - - - 12 21 33 Tanzania - - - - - - 11 - 11 Togo - - - - - - 120 - 120
All Africa (excl. Med.) 2 6 8 - - - 2,081 36 2,117
America Argentina - - - - - - 119 - 119 Bolivia - - - - - - - 1 1 Brazil 2 - 2 - - - 11 - 11 Canada - - - - - - - 101 101 Dominican Republic - - - - - - - 13 13 Guyana - - - - - - - - -Mexico - - - - - - 2 4 6 Trinidad & Tobago - - - - - - - - -USA 4 - 4 - - - 1,203 1,171 2,374 Uruguay 2 - 2 - - - 2 - 2
All America 8 - 8 - - - 1,337 1,290 2,627
Asia and AustralasiaAustralia - - - - - - - - -Bangladesh - - - - - - - - -China 29 - 29 - - - 29 9,101 9,130 Hong Kong - - - - - - - - -India 8 - 8 - - - 8 25 33 Indonesia - - - - - - 24 - 24 Japan - - - - - - 8 - 8 Malaysia - - - - - - 10 2 12 New Zealand - - - - - - - 6 6 Oman - - - - - - - - -Pakistan 2 - 2 - - - 2 - 2 Philippines - - - - - - - - -Qatar - - - - - - - - -Saudi Arabia - - - - - - - - -Singapore - - - - - - 4 1,053 1,057 South Korea - - - - - - - 267 267 Sri Lanka - - - - - - - - -Taiwan - - - - - - - - -Thailand - - - - - - - - -United Arab Emirates - - - - - - - - -Vietnam - - - - - - - - -
All Asia and Australasia 39 - 39 - - - 85 10,454 10,539 Unspecified countries 1 - 1 - - - 1 52 53
All foreign countries 1,026 1,732 2,758 16 24 39 11,932 33,381 45,313
All domestic traffic 95 189 284 2,900 3,049 5,950 6,639 11,155 17,794
All foreign and domestic traffic 1,122 1,921 3,043 2,916 3,073 5,989 18,572 44,588 63,160
"-" denotes either nil or less than half final digit shown.
159
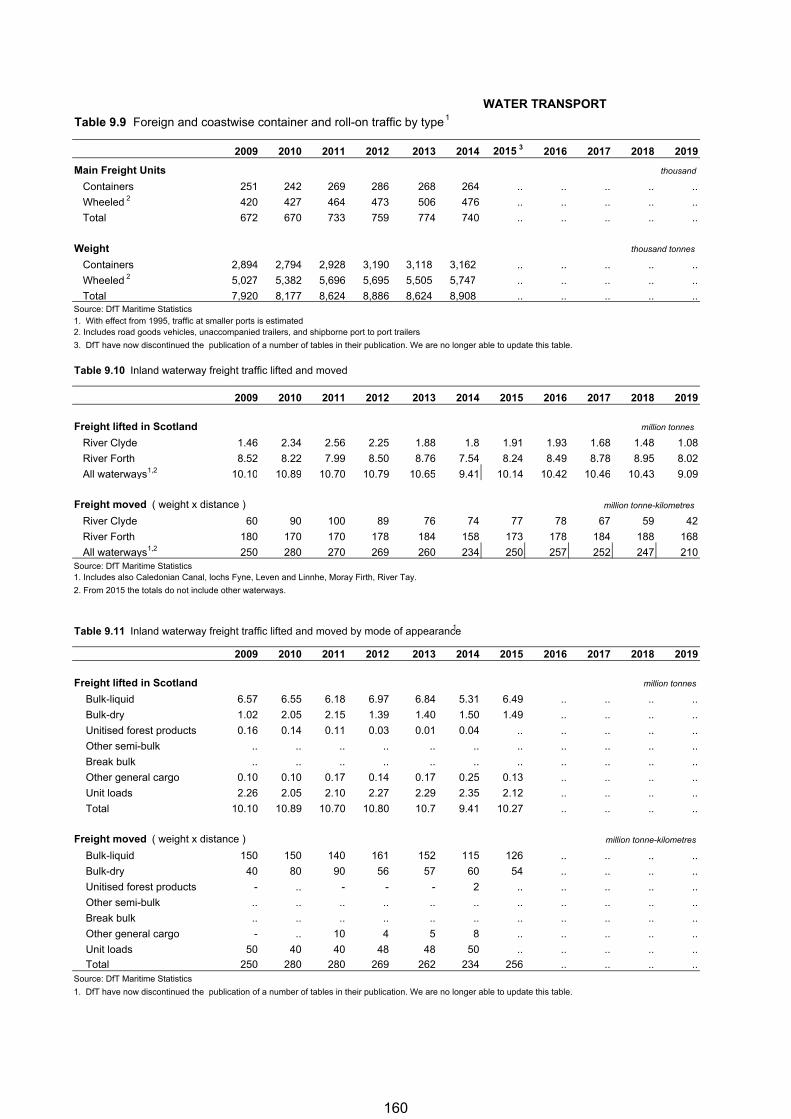
WATER TRANSPORT
Table 9.9 Foreign and coastwise container and roll-on traffic by type1
2009 2010 2011 2012 2013 2014 2015 3 2016 2017 2018 2019
Main Freight Units thousand
Containers 251 242 269 286 268 264 .. .. .. .. ..
Wheeled 2 420 427 464 473 506 476 .. .. .. .. ..
Total 672 670 733 759 774 740 .. .. .. .. ..
Weight thousand tonnes
Containers 2,894 2,794 2,928 3,190 3,118 3,162 .. .. .. .. ..
Wheeled 2 5,027 5,382 5,696 5,695 5,505 5,747 .. .. .. .. ..
Total 7,920 8,177 8,624 8,886 8,624 8,908 .. .. .. .. ..Source: DfT Maritime Statistics1. With effect from 1995, traffic at smaller ports is estimated2. Includes road goods vehicles, unaccompanied trailers, and shipborne port to port trailers
3. DfT have now discontinued the publication of a number of tables in their publication. We are no longer able to update this table.
Table 9.10 Inland waterway freight traffic lifted and moved
2009 2010 2011 2012 2013 2014 2015 2016 2017 2018 2019
Freight lifted in Scotland million tonnes
River Clyde 1.46 2.34 2.56 2.25 1.88 1.8 1.91 1.93 1.68 1.48 1.08
River Forth 8.52 8.22 7.99 8.50 8.76 7.54 8.24 8.49 8.78 8.95 8.02
All waterways 1,2 10.10 10.89 10.70 10.79 10.65 9.41 10.14 10.42 10.46 10.43 9.09
Freight moved ( weight x distance ) million tonne-kilometres
River Clyde 60 90 100 89 76 74 77 78 67 59 42
River Forth 180 170 170 178 184 158 173 178 184 188 168
All waterways 1,2 250 280 270 269 260 234 250 257 252 247 210Source: DfT Maritime Statistics1. Includes also Caledonian Canal, lochs Fyne, Leven and Linnhe, Moray Firth, River Tay.
2. From 2015 the totals do not include other waterways.
Table 9.11 Inland waterway freight traffic lifted and moved by mode of appearance 1
2009 2010 2011 2012 2013 2014 2015 2016 2017 2018 2019
Freight lifted in Scotland million tonnes
Bulk-liquid 6.57 6.55 6.18 6.97 6.84 5.31 6.49 .. .. .. ..
Bulk-dry 1.02 2.05 2.15 1.39 1.40 1.50 1.49 .. .. .. ..
Unitised forest products 0.16 0.14 0.11 0.03 0.01 0.04 .. .. .. .. ..
Other semi-bulk .. .. .. .. .. .. .. .. .. .. ..
Break bulk .. .. .. .. .. .. .. .. .. .. ..
Other general cargo 0.10 0.10 0.17 0.14 0.17 0.25 0.13 .. .. .. ..
Unit loads 2.26 2.05 2.10 2.27 2.29 2.35 2.12 .. .. .. ..
Total 10.10 10.89 10.70 10.80 10.7 9.41 10.27 .. .. .. ..
Freight moved ( weight x distance ) million tonne-kilometres
Bulk-liquid 150 150 140 161 152 115 126 .. .. .. ..
Bulk-dry 40 80 90 56 57 60 54 .. .. .. ..
Unitised forest products - .. - - - 2 .. .. .. .. ..
Other semi-bulk .. .. .. .. .. .. .. .. .. .. ..
Break bulk .. .. .. .. .. .. .. .. .. .. ..
Other general cargo - .. 10 4 5 8 .. .. .. .. ..
Unit loads 50 40 40 48 48 50 .. .. .. .. ..
Total 250 280 280 269 262 234 256 .. .. .. ..Source: DfT Maritime Statistics
1. DfT have now discontinued the publication of a number of tables in their publication. We are no longer able to update this table.
160
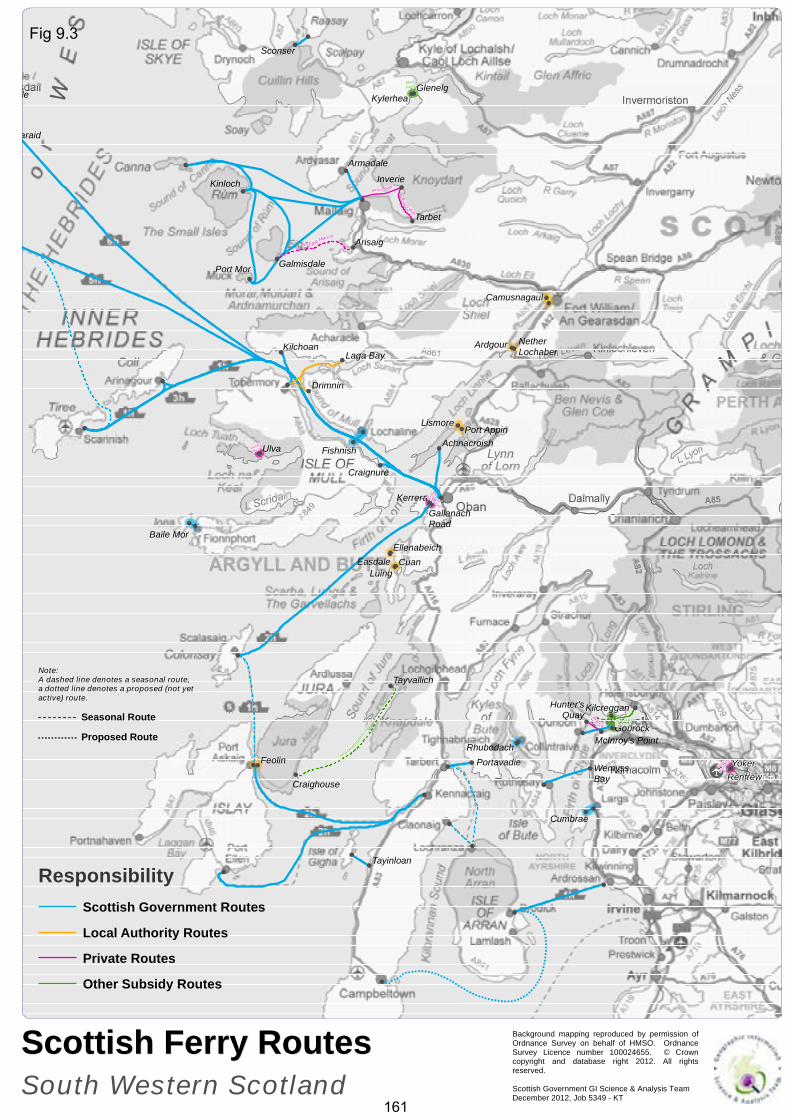
!
!
!
!
!
!
!
!
!
!
!
!
!
!
!
!
!!
!!
!
!
!
!
!
!
!
!
!
!
!
!
!
!
!
!
!
!
!
!!
!
!
!
!
!
!
Gill
Toft
Wyre
Laxo
Ulsta
Rousay
Houton
Lyness Flotta
Moaness
Burwick
Egilsay
BelmontGutcher
Moclett
Rapness
Gungstie
Longhope
Tingwall
Grutness
Scalloway
Symbister
Gill's Bay
Hamars Ness
WestBurrafirth
St. Margaret's Hope
Vidlin
Graemsay
Pentla
n dFe
rrie
sJo
hn O
' Gro
ats
Ferri
es
Scottish Ferry RoutesScottish Ferry RoutesOrkney & Shetland Isles
Aberdeen
Aberdeen
Note: Dashed line denotes seasonal route
Responsibility
Private Routes
Local Authority Routes
Scottish Government Routes
Other Subsidy Routes
Background mapping reproduced by permission ofOrdnance Survey on behalf of HMSO. OrdnanceSurvey Licence number 100024655. © Crowncopyright and database right 2012. All rightsreserved.
Scottish Government GI Science & Analysis TeamNovember 2012, Job 5349 - KT
! ! ! ! ! !!
!!!!!
!!
!!
!!
!!
!!
!!
!!
!!!!!!
!!!!!!!!!!!!!!!!!!
!!
!!!!!!!
!!!
!!!!!!!!!!!!
!!!
!!!
!
! ! ! ! ! ! ! ! ! ! ! ! ! ! ! ! ! ! ! ! ! ! ! ! ! ! ! !!
!
!
!
!
!
!
!
!
!
!
!
!
!
!
!
!
!
!!
!
!
!
!
!
!
!
!
!
!
!
!
!!
!
!!
!!
!!
!!
!
!
!
!
!
!
!
!
!!
!!
!!
!!
!
!
!!
!!
!
!
!
!!
!
Ulva
Cuan
Yoker
Lismore
Luing
Tarbet
Feolin
Arisaig
Renfrew
Kerrera
Drimnin
Easdale
Kinloch Inverie
Glenelg
Ardgour
Sconser
Laga Bay
Port Mor
Kylerhea
Fishnish
Armadale
Kilchoan
Baile Mor
Rhubodach
Tayinloan
Craignure
Tayvallich
Craighouse
Port Appin
Galmisdale
Kilcreggan
Portavadie WemyssBay
Ellenabeich
Camusnagaul
Achnacroish
Cumbrae
Lochboisdale
Hunter'sQuay
GallanachRoad
NetherLochaber
McInroy's Point
Ceann a Gharaid
Gourock
Jura Deve
lopmen
t Tru
st
Arisaig Marine
Bruce Watt
Bruce Watt
WesternFerries
Clyde MarineTransport
DuncanMacEachan
Silvers
Marine U
K
Donald
Munro
SkyeFerry
Scottish Ferry RoutesScottish Ferry RoutesSouth Western Scotland
ResponsibilityScottish Government Routes
Local Authority Routes
Private Routes
Other Subsidy Routes
Background mapping reproduced by permission ofOrdnance Survey on behalf of HMSO. OrdnanceSurvey Licence number 100024655. © Crowncopyright and database right 2012. All rightsreserved.
Scottish Government GI Science & Analysis TeamDecember 2012, Job 5349 - KT
Note:A dashed line denotes a seasonal route,a dotted line denotes a proposed (not yetactive) route.
! ! ! ! ! ! ! ! ! ! ! !
Seasonal Route
Proposed Route
Fig 9.3
161
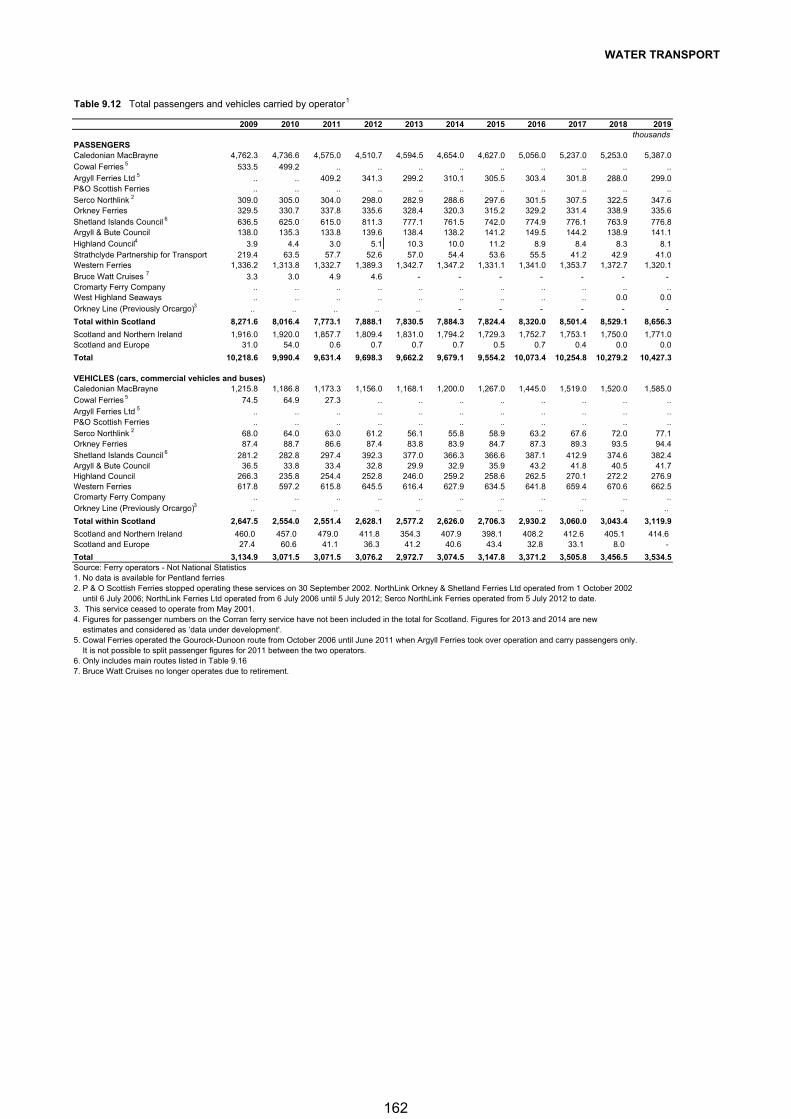
WATER TRANSPORT
Table 9.12 Total passengers and vehicles carried by operator1
2009 2010 2011 2012 2013 2014 2015 2016 2017 2018 2019thousands
PASSENGERSCaledonian MacBrayne 4,762.3 4,736.6 4,575.0 4,510.7 4,594.5 4,654.0 4,627.0 5,056.0 5,237.0 5,253.0 5,387.0Cowal Ferries 5 533.5 499.2 .. .. .. .. .. .. .. .. ..Argyll Ferries Ltd 5 .. .. 409.2 341.3 299.2 310.1 305.5 303.4 301.8 288.0 299.0P&O Scottish Ferries .. .. .. .. .. .. .. .. .. .. ..Serco Northlink 2 309.0 305.0 304.0 298.0 282.9 288.6 297.6 301.5 307.5 322.5 347.6Orkney Ferries 329.5 330.7 337.8 335.6 328.4 320.3 315.2 329.2 331.4 338.9 335.6Shetland Islands Council 6 636.5 625.0 615.0 811.3 777.1 761.5 742.0 774.9 776.1 763.9 776.8Argyll & Bute Council 138.0 135.3 133.8 139.6 138.4 138.2 141.2 149.5 144.2 138.9 141.1Highland Council4 3.9 4.4 3.0 5.1 10.3 10.0 11.2 8.9 8.4 8.3 8.1Strathclyde Partnership for Transport 219.4 63.5 57.7 52.6 57.0 54.4 53.6 55.5 41.2 42.9 41.0Western Ferries 1,336.2 1,313.8 1,332.7 1,389.3 1,342.7 1,347.2 1,331.1 1,341.0 1,353.7 1,372.7 1,320.1Bruce Watt Cruises 7 3.3 3.0 4.9 4.6 - - - - - - - Cromarty Ferry Company .. .. .. .. .. .. .. .. .. .. ..West Highland Seaways .. .. .. .. .. .. .. .. .. 0.0 0.0Orkney Line (Previously Orcargo)3 .. .. .. .. .. - - - - - -
Total within Scotland 8,271.6 8,016.4 7,773.1 7,888.1 7,830.5 7,884.3 7,824.4 8,320.0 8,501.4 8,529.1 8,656.3
Scotland and Northern Ireland 1,916.0 1,920.0 1,857.7 1,809.4 1,831.0 1,794.2 1,729.3 1,752.7 1,753.1 1,750.0 1,771.0Scotland and Europe 31.0 54.0 0.6 0.7 0.7 0.7 0.5 0.7 0.4 0.0 0.0
Total 10,218.6 9,990.4 9,631.4 9,698.3 9,662.2 9,679.1 9,554.2 10,073.4 10,254.8 10,279.2 10,427.3
VEHICLES (cars, commercial vehicles and buses)Caledonian MacBrayne 1,215.8 1,186.8 1,173.3 1,156.0 1,168.1 1,200.0 1,267.0 1,445.0 1,519.0 1,520.0 1,585.0Cowal Ferries 5 74.5 64.9 27.3 .. .. .. .. .. .. .. ..Argyll Ferries Ltd 5 .. .. .. .. .. .. .. .. .. .. ..P&O Scottish Ferries .. .. .. .. .. .. .. .. .. .. ..Serco Northlink 2 68.0 64.0 63.0 61.2 56.1 55.8 58.9 63.2 67.6 72.0 77.1Orkney Ferries 87.4 88.7 86.6 87.4 83.8 83.9 84.7 87.3 89.3 93.5 94.4Shetland Islands Council 6 281.2 282.8 297.4 392.3 377.0 366.3 366.6 387.1 412.9 374.6 382.4Argyll & Bute Council 36.5 33.8 33.4 32.8 29.9 32.9 35.9 43.2 41.8 40.5 41.7Highland Council 266.3 235.8 254.4 252.8 246.0 259.2 258.6 262.5 270.1 272.2 276.9Western Ferries 617.8 597.2 615.8 645.5 616.4 627.9 634.5 641.8 659.4 670.6 662.5Cromarty Ferry Company .. .. .. .. .. .. .. .. .. .. ..Orkney Line (Previously Orcargo)3 .. .. .. .. .. .. .. .. .. .. ..
Total within Scotland 2,647.5 2,554.0 2,551.4 2,628.1 2,577.2 2,626.0 2,706.3 2,930.2 3,060.0 3,043.4 3,119.9
Scotland and Northern Ireland 460.0 457.0 479.0 411.8 354.3 407.9 398.1 408.2 412.6 405.1 414.6 Scotland and Europe 27.4 60.6 41.1 36.3 41.2 40.6 43.4 32.8 33.1 8.0 -
Total 3,134.9 3,071.5 3,071.5 3,076.2 2,972.7 3,074.5 3,147.8 3,371.2 3,505.8 3,456.5 3,534.5Source: Ferry operators - Not National Statistics1. No data is available for Pentland ferries2. P & O Scottish Ferries stopped operating these services on 30 September 2002. NorthLink Orkney & Shetland Ferries Ltd operated from 1 October 2002 until 6 July 2006; NorthLink Ferries Ltd operated from 6 July 2006 until 5 July 2012; Serco NorthLink Ferries operated from 5 July 2012 to date.3. This service ceased to operate from May 2001.4. Figures for passenger numbers on the Corran ferry service have not been included in the total for Scotland. Figures for 2013 and 2014 are new estimates and considered as ‘data under development'.5. Cowal Ferries operated the Gourock-Dunoon route from October 2006 until June 2011 when Argyll Ferries took over operation and carry passengers only. It is not possible to split passenger figures for 2011 between the two operators.6. Only includes main routes listed in Table 9.167. Bruce Watt Cruises no longer operates due to retirement.
162
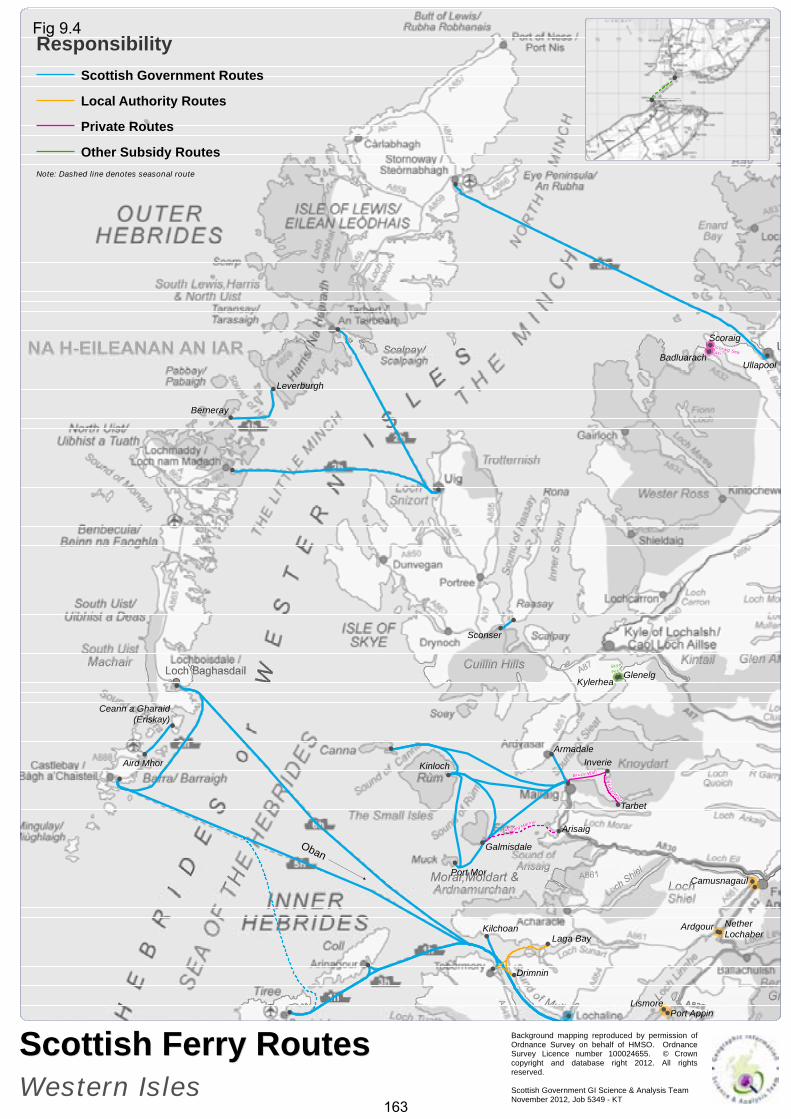
!
!
!
!
!
!
!
!
!
!
!
!
!
!
!
!
!
!
!
!
!
!
!!
!!
!
!
!
!
!
!
!!
!!
!
!
!
!!
!!Ulva
Lismore
Tarbet
Scoraig
Arisaig
Drimnin
Kinloch Inverie
Glenelg
Ardgour
Sconser
Laga Bay
Port Mor
Kylerhea
Berneray
Armadale
Kilchoan
Ullapool
Aird Mhor
Badluarach
Port Appin
Galmisdale
Leverburgh
Camusnagaul
AchnacroishSound of Ulva
NetherLochaber
Ceann a Gharaid(Eriskay)
Arisaig Marine
Bruce Watt
Bruce Watt
Scoraig SeaTaxi
Donald Munro
SkyeFerry
Scottish Ferry RoutesScottish Ferry RoutesWestern Isles
Oban
!
!
Note: Dashed line denotes seasonal route
ResponsibilityScottish Government Routes
Local Authority Routes
Private Routes
Other Subsidy Routes
Background mapping reproduced by permission ofOrdnance Survey on behalf of HMSO. OrdnanceSurvey Licence number 100024655. © Crowncopyright and database right 2012. All rightsreserved.
Scottish Government GI Science & Analysis TeamNovember 2012, Job 5349 - KT
Fig 9.4
163
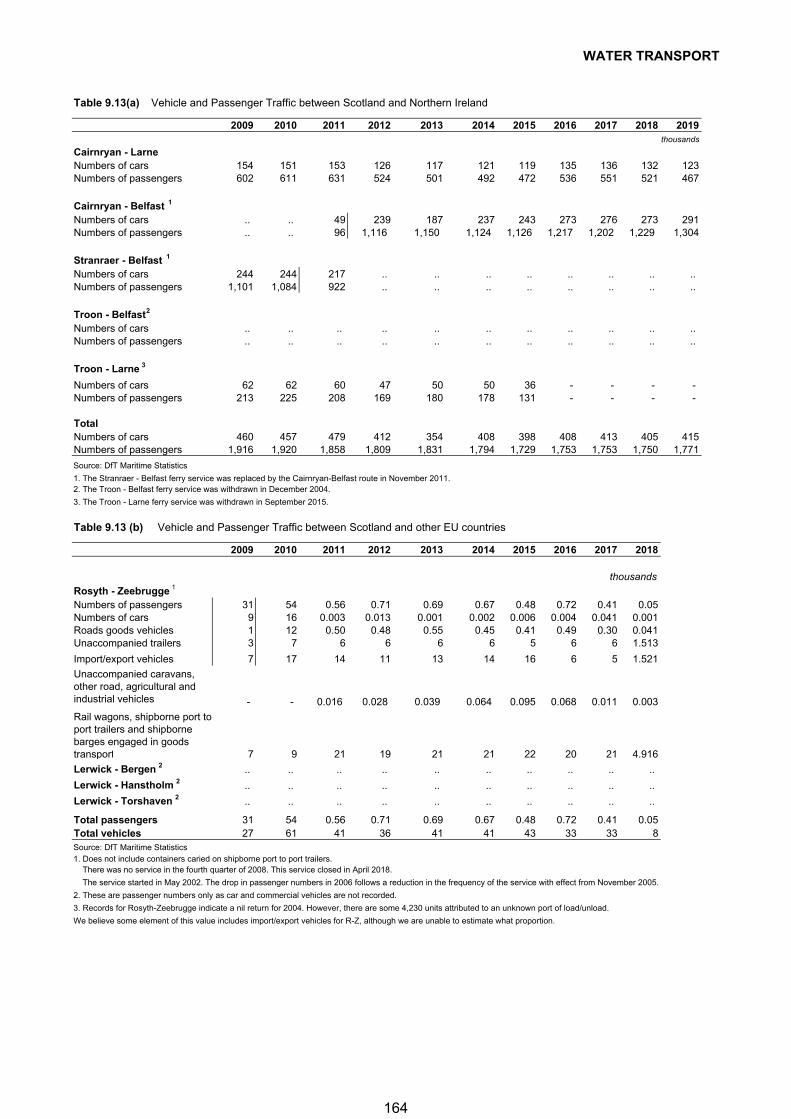
WATER TRANSPORT
Table 9.13(a) Vehicle and Passenger Traffic between Scotland and Northern Ireland
2009 2010 2011 2012 2013 2014 2015 2016 2017 2018 2019thousands
Cairnryan - LarneNumbers of cars 154 151 153 126 117 121 119 135 136 132 123Numbers of passengers 602 611 631 524 501 492 472 536 551 521 467
Cairnryan - Belfast 1
Numbers of cars .. .. 49 239 187 237 243 273 276 273 291Numbers of passengers .. .. 96 1,116 1,150 1,124 1,126 1,217 1,202 1,229 1,304
Stranraer - Belfast 1
Numbers of cars 244 244 217 .. .. .. .. .. .. .. ..Numbers of passengers 1,101 1,084 922 .. .. .. .. .. .. .. ..
Troon - Belfast2
Numbers of cars .. .. .. .. .. .. .. .. .. .. ..Numbers of passengers .. .. .. .. .. .. .. .. .. .. ..
Troon - Larne 3
Numbers of cars 62 62 60 47 50 50 36 - - - - Numbers of passengers 213 225 208 169 180 178 131 - - - -
TotalNumbers of cars 460 457 479 412 354 408 398 408 413 405 415Numbers of passengers 1,916 1,920 1,858 1,809 1,831 1,794 1,729 1,753 1,753 1,750 1,771
Source: DfT Maritime Statistics
1. The Stranraer - Belfast ferry service was replaced by the Cairnryan-Belfast route in November 2011.2. The Troon - Belfast ferry service was withdrawn in December 2004.
3. The Troon - Larne ferry service was withdrawn in September 2015.
Table 9.13 (b) Vehicle and Passenger Traffic between Scotland and other EU countries
2009 2010 2011 2012 2013 2014 2015 2016 2017 2018
thousands
Rosyth - Zeebrugge 1
Numbers of passengers 31 54 0.56 0.71 0.69 0.67 0.48 0.72 0.41 0.05Numbers of cars 9 16 0.003 0.013 0.001 0.002 0.006 0.004 0.041 0.001Roads goods vehicles 1 12 0.50 0.48 0.55 0.45 0.41 0.49 0.30 0.041Unaccompanied trailers 3 7 6 6 6 6 5 6 6 1.513
Import/export vehicles 7 17 14 11 13 14 16 6 5 1.521
Unaccompanied caravans, other road, agricultural and industrial vehicles - - 0.016 0.028 0.039 0.064 0.095 0.068 0.011 0.003
Rail wagons, shipborne port to port trailers and shipborne barges engaged in goods transport 7 9 21 19 21 21 22 20 21 4.916
Lerwick - Bergen 2 .. .. .. .. .. .. .. .. .. ..
Lerwick - Hanstholm 2 .. .. .. .. .. .. .. .. .. ..
Lerwick - Torshaven 2 .. .. .. .. .. .. .. .. .. ..
Total passengers 31 54 0.56 0.71 0.69 0.67 0.48 0.72 0.41 0.05Total vehicles 27 61 41 36 41 41 43 33 33 8Source: DfT Maritime Statistics1. Does not include containers caried on shipborne port to port trailers. There was no service in the fourth quarter of 2008. This service closed in April 2018.
The service started in May 2002. The drop in passenger numbers in 2006 follows a reduction in the frequency of the service with effect from November 2005.
2. These are passenger numbers only as car and commercial vehicles are not recorded.
3. Records for Rosyth-Zeebrugge indicate a nil return for 2004. However, there are some 4,230 units attributed to an unknown port of load/unload.
We believe some element of this value includes import/export vehicles for R-Z, although we are unable to estimate what proportion.
164
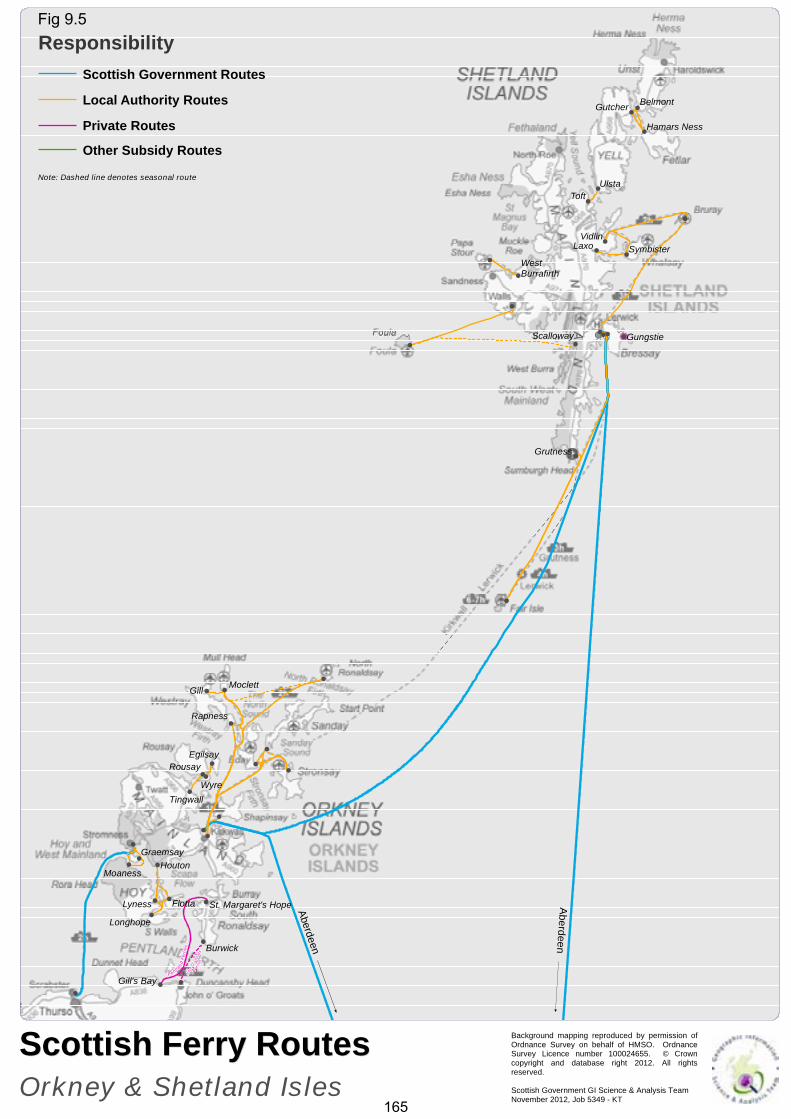
!
!
!
!
!
!
!
!
!
!
!
!
!
!
!
!
!!
!!
!
!
!
!
!
!
!
!
!
!
!
!
!
!
!
!
!
!
!
!!
!
!
!
!
!
!
Gill
Toft
Wyre
Laxo
Ulsta
Rousay
Houton
Lyness Flotta
Moaness
Burwick
Egilsay
BelmontGutcher
Moclett
Rapness
Gungstie
Longhope
Tingwall
Grutness
Scalloway
Symbister
Gill's Bay
Hamars Ness
WestBurrafirth
St. Margaret's Hope
Vidlin
Graemsay
Pentla
n dFe
rrie
sJo
hn O
' Gro
ats
Ferri
es
Scottish Ferry RoutesScottish Ferry RoutesOrkney & Shetland Isles
Aberdeen
Aberdeen
Note: Dashed line denotes seasonal route
Responsibility
Private Routes
Local Authority Routes
Scottish Government Routes
Other Subsidy Routes
Background mapping reproduced by permission ofOrdnance Survey on behalf of HMSO. OrdnanceSurvey Licence number 100024655. © Crowncopyright and database right 2012. All rightsreserved.
Scottish Government GI Science & Analysis TeamNovember 2012, Job 5349 - KT
Fig 9.5
165
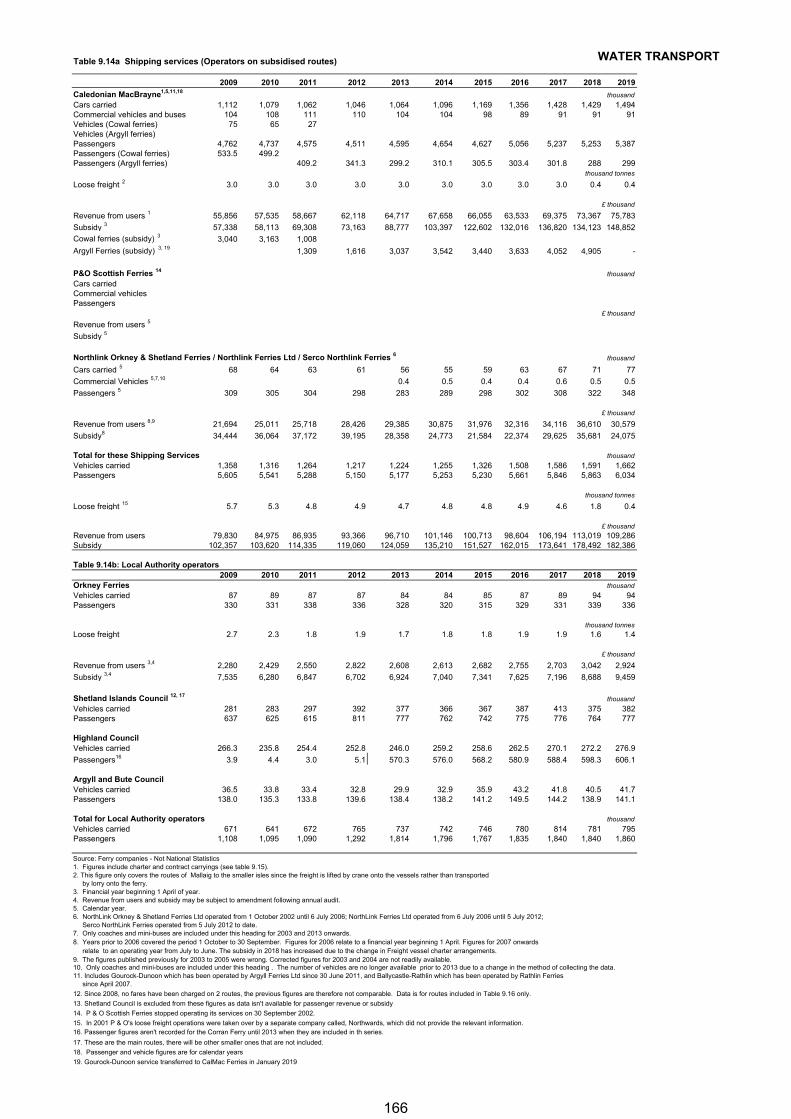
WATER TRANSPORTTable 9.14a Shipping services (Operators on subsidised routes)
2009 2010 2011 2012 2013 2014 2015 2016 2017 2018 2019
Caledonian MacBrayne1,5,11,18 thousand
Cars carried 1,112 1,079 1,062 1,046 1,064 1,096 1,169 1,356 1,428 1,429 1,494Commercial vehicles and buses 104 108 111 110 104 104 98 89 91 91 91Vehicles (Cowal ferries) 75 65 27Vehicles (Argyll ferries)Passengers 4,762 4,737 4,575 4,511 4,595 4,654 4,627 5,056 5,237 5,253 5,387Passengers (Cowal ferries) 533.5 499.2Passengers (Argyll ferries) 409.2 341.3 299.2 310.1 305.5 303.4 301.8 288 299
thousand tonnes
Loose freight 2 3.0 3.0 3.0 3.0 3.0 3.0 3.0 3.0 3.0 0.4 0.4
£ thousand
Revenue from users 1 55,856 57,535 58,667 62,118 64,717 67,658 66,055 63,533 69,375 73,367 75,783
Subsidy 3 57,338 58,113 69,308 73,163 88,777 103,397 122,602 132,016 136,820 134,123 148,852
Cowal ferries (subsidy) 3 3,040 3,163 1,008
Argyll Ferries (subsidy) 3, 19 1,309 1,616 3,037 3,542 3,440 3,633 4,052 4,905 -
P&O Scottish Ferries 14 thousand
Cars carriedCommercial vehiclesPassengers
£ thousand
Revenue from users 5
Subsidy 5
Northlink Orkney & Shetland Ferries / Northlink Ferries Ltd / Serco Northlink Ferries 6 thousand
Cars carried 5 68 64 63 61 56 55 59 63 67 71 77
Commercial Vehicles 5,7,10 0.4 0.5 0.4 0.4 0.6 0.5 0.5
Passengers 5 309 305 304 298 283 289 298 302 308 322 348
£ thousand
Revenue from users 8,9 21,694 25,011 25,718 28,426 29,385 30,875 31,976 32,316 34,116 36,610 30,579
Subsidy8 34,444 36,064 37,172 39,195 28,358 24,773 21,584 22,374 29,625 35,681 24,075
Total for these Shipping Services thousand
Vehicles carried 1,358 1,316 1,264 1,217 1,224 1,255 1,326 1,508 1,586 1,591 1,662Passengers 5,605 5,541 5,288 5,150 5,177 5,253 5,230 5,661 5,846 5,863 6,034
thousand tonnes
Loose freight 15 5.7 5.3 4.8 4.9 4.7 4.8 4.8 4.9 4.6 1.8 0.4
£ thousand
Revenue from users 79,830 84,975 86,935 93,366 96,710 101,146 100,713 98,604 106,194 113,019 109,286Subsidy 102,357 103,620 114,335 119,060 124,059 135,210 151,527 162,015 173,641 178,492 182,386
Table 9.14b: Local Authority operators2009 2010 2011 2012 2013 2014 2015 2016 2017 2018 2019
Orkney Ferries thousand
Vehicles carried 87 89 87 87 84 84 85 87 89 94 94Passengers 330 331 338 336 328 320 315 329 331 339 336
thousand tonnes
Loose freight 2.7 2.3 1.8 1.9 1.7 1.8 1.8 1.9 1.9 1.6 1.4
£ thousand
Revenue from users 3,4 2,280 2,429 2,550 2,822 2,608 2,613 2,682 2,755 2,703 3,042 2,924
Subsidy 3,4 7,535 6,280 6,847 6,702 6,924 7,040 7,341 7,625 7,196 8,688 9,459
Shetland Islands Council 12, 17 thousand
Vehicles carried 281 283 297 392 377 366 367 387 413 375 382Passengers 637 625 615 811 777 762 742 775 776 764 777
Highland CouncilVehicles carried 266.3 235.8 254.4 252.8 246.0 259.2 258.6 262.5 270.1 272.2 276.9
Passengers16 3.9 4.4 3.0 5.1 570.3 576.0 568.2 580.9 588.4 598.3 606.1
Argyll and Bute CouncilVehicles carried 36.5 33.8 33.4 32.8 29.9 32.9 35.9 43.2 41.8 40.5 41.7Passengers 138.0 135.3 133.8 139.6 138.4 138.2 141.2 149.5 144.2 138.9 141.1
Total for Local Authority operators thousand
Vehicles carried 671 641 672 765 737 742 746 780 814 781 795Passengers 1,108 1,095 1,090 1,292 1,814 1,796 1,767 1,835 1,840 1,840 1,860
Source: Ferry companies - Not National Statistics1. Figures include charter and contract carryings (see table 9.15).2. This figure only covers the routes of Mallaig to the smaller isles since the freight is lifted by crane onto the vessels rather than transported by lorry onto the ferry.3. Financial year beginning 1 April of year.4. Revenue from users and subsidy may be subject to amendment following annual audit.5. Calendar year.6. NorthLink Orkney & Shetland Ferries Ltd operated from 1 October 2002 until 6 July 2006; NorthLink Ferries Ltd operated from 6 July 2006 until 5 July 2012; Serco NorthLink Ferries operated from 5 July 2012 to date.7. Only coaches and mini-buses are included under this heading for 2003 and 2013 onwards.8. Years prior to 2006 covered the period 1 October to 30 September. Figures for 2006 relate to a financial year beginning 1 April. Figures for 2007 onwards relate to an operating year from July to June. The subsidy in 2018 has increased due to the change in Freight vessel charter arrangements.9. The figures published previously for 2003 to 2005 were wrong. Corrected figures for 2003 and 2004 are not readily available.10. Only coaches and mini-buses are included under this heading . The number of vehicles are no longer available prior to 2013 due to a change in the method of collecting the data.11. Includes Gourock-Dunoon which has been operated by Argyll Ferries Ltd since 30 June 2011, and Ballycastle-Rathlin which has been operated by Rathlin Ferries since April 2007.
12. Since 2008, no fares have been charged on 2 routes, the previous figures are therefore not comparable. Data is for routes included in Table 9.16 only.
13. Shetland Council is excluded from these figures as data isn't available for passenger revenue or subsidy
14. P & O Scottish Ferries stopped operating its services on 30 September 2002.
15. In 2001 P & O's loose freight operations were taken over by a separate company called, Northwards, which did not provide the relevant information. 16. Passenger figures aren't recorded for the Corran Ferry until 2013 when they are included in th series.
17. These are the main routes, there will be other smaller ones that are not included.
18. Passenger and vehicle figures are for calendar years
19. Gourock-Dunoon service transferred to CalMac Ferries in January 2019
166
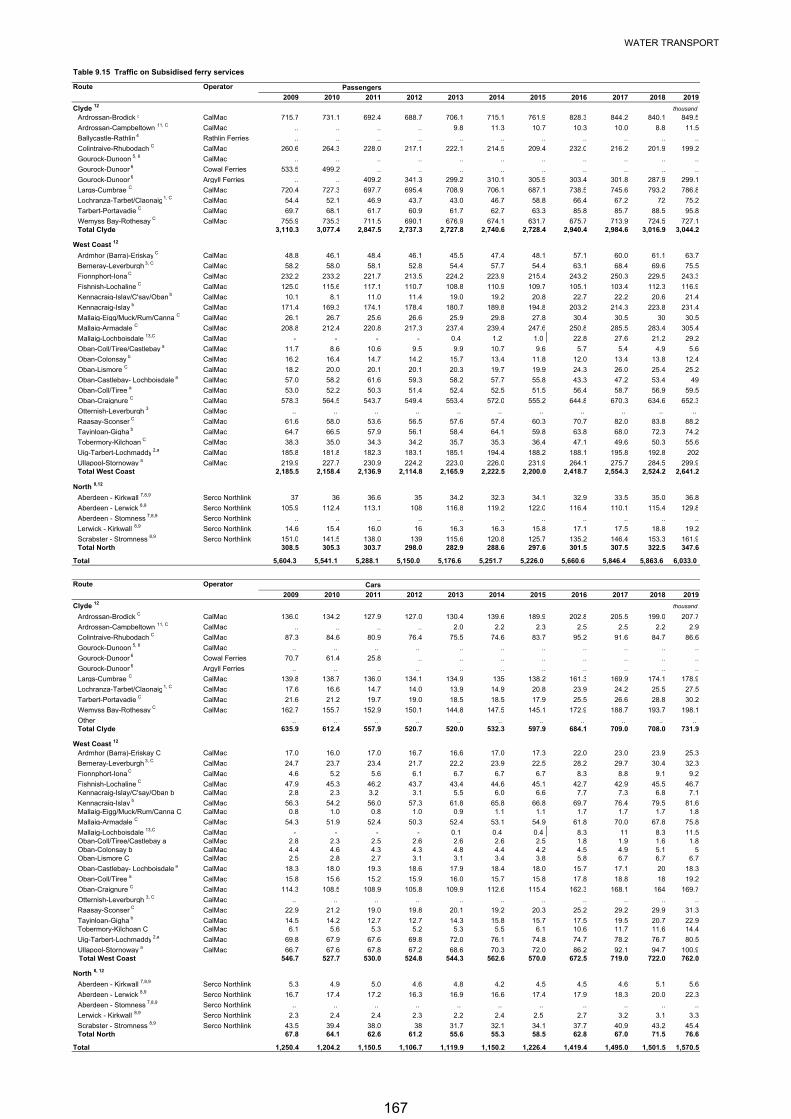
WATER TRANSPORT
Table 9.15 Traffic on Subsidised ferry services
Route Operator Passengers
2009 2010 2011 2012 2013 2014 2015 2016 2017 2018 2019
Clyde 12thousand
Ardrossan-Brodick C CalMac 715.7 731.1 692.4 688.7 706.1 715.1 761.9 828.3 844.2 840.1 849.5
Ardrossan-Campbeltown 11, C CalMac .. .. .. .. 9.8 11.3 10.7 10.3 10.0 8.8 11.5
Ballycastle-Rathlin 4 Rathlin Ferries .. .. .. .. .. .. .. .. .. .. ..
Colintraive-Rhubodach C CalMac 260.6 264.3 228.0 217.1 222.1 214.5 209.4 232.0 216.2 201.9 199.2
Gourock-Dunoon 5, 6 CalMac .. .. .. .. .. .. .. .. .. .. ..
Gourock-Dunoon6 Cowal Ferries 533.5 499.2 .. .. .. .. .. .. .. .. ..
Gourock-Dunoon6 Argyll Ferries .. .. 409.2 341.3 299.2 310.1 305.5 303.4 301.8 287.9 299.1
Largs-Cumbrae C CalMac 720.4 727.3 697.7 695.4 708.9 706.1 687.1 738.5 745.6 793.2 786.8
Lochranza-Tarbet/Claonaig 1, C CalMac 54.4 52.1 46.9 43.7 43.0 46.7 58.8 66.4 67.2 72 75.2
Tarbert-Portavadie C CalMac 69.7 68.1 61.7 60.9 61.7 62.7 63.3 85.8 85.7 88.5 95.8
Wemyss Bay-Rothesay C CalMac 755.9 735.3 711.5 690.1 676.9 674.1 631.7 675.7 713.9 724.5 727.1Total Clyde 3,110.3 3,077.4 2,847.5 2,737.3 2,727.8 2,740.6 2,728.4 2,940.4 2,984.6 3,016.9 3,044.2
West Coast 12
Ardmhor (Barra)-Eriskay C CalMac 48.8 46.1 48.4 46.1 45.5 47.4 48.1 57.1 60.0 61.1 63.7
Berneray-Leverburgh 3, C CalMac 58.2 58.0 58.1 52.8 54.4 57.7 54.4 63.1 68.4 69.6 75.5
Fionnphort-Iona C CalMac 232.2 233.2 221.7 213.5 224.2 223.9 215.4 243.2 250.3 229.5 243.3
Fishnish-Lochaline C CalMac 125.0 115.6 117.1 110.7 108.8 110.9 109.7 105.1 103.4 112.3 116.9
Kennacraig-Islay/C'say/Oban b CalMac 10.1 8.1 11.0 11.4 19.0 19.2 20.8 22.7 22.2 20.6 21.4
Kennacraig-Islay b CalMac 171.4 169.3 174.1 178.4 180.7 189.8 194.8 203.2 214.3 223.8 231.4
Mallaig-Eigg/Muck/Rum/Canna C CalMac 26.1 26.7 25.6 26.6 25.9 29.8 27.8 30.4 30.5 30 30.5
Mallaig-Armadale C CalMac 208.8 212.4 220.8 217.3 237.4 239.4 247.6 250.8 285.5 283.4 305.4
Mallaig-Lochboisdale 13,C CalMac - - - - 0.4 1.2 1.0 22.8 27.6 21.2 29.2
Oban-Coll/Tiree/Castlebay a CalMac 11.7 8.6 10.6 9.5 9.9 10.7 9.6 5.7 5.4 4.9 5.6
Oban-Colonsay b CalMac 16.2 16.4 14.7 14.2 15.7 13.4 11.8 12.0 13.4 13.8 12.4
Oban-Lismore C CalMac 18.2 20.0 20.1 20.1 20.3 19.7 19.9 24.3 26.0 25.4 25.2
Oban-Castlebay- Lochboisdale a CalMac 57.0 58.2 61.6 59.3 58.2 57.7 55.8 43.3 47.2 53.4 49
Oban-Coll/Tiree a CalMac 53.0 52.2 50.3 51.4 52.4 52.5 51.5 56.4 58.7 56.9 59.5
Oban-Craignure C CalMac 578.3 564.5 543.7 549.4 553.4 572.0 555.2 644.8 670.3 634.6 652.3
Otternish-Leverburgh 3 CalMac .. .. .. .. .. .. .. .. .. .. ..
Raasay-Sconser C CalMac 61.6 58.0 53.6 56.5 57.6 57.4 60.3 70.7 82.0 83.8 88.2
Tayinloan-Gigha b CalMac 64.7 66.5 57.9 56.1 58.4 64.1 59.8 63.8 68.0 72.3 74.2
Tobermory-Kilchoan C CalMac 38.3 35.0 34.3 34.2 35.7 35.3 36.4 47.1 49.6 50.3 55.6
Uig-Tarbert-Lochmaddy 2,a CalMac 185.8 181.8 182.3 183.1 185.1 194.4 188.2 188.1 195.8 192.8 202
Ullapool-Stornoway a CalMac 219.9 227.7 230.9 224.2 223.0 226.0 231.9 264.1 275.7 284.5 299.9Total West Coast 2,185.5 2,158.4 2,136.9 2,114.8 2,165.9 2,222.5 2,200.0 2,418.7 2,554.3 2,524.2 2,641.2
North 8,12
Aberdeen - Kirkwall 7,8,9 Serco Northlink 37 36 36.6 35 34.2 32.3 34.1 32.9 33.5 35.0 36.8
Aberdeen - Lerwick 8,9 Serco Northlink 105.9 112.4 113.1 108 116.8 119.2 122.0 116.4 110.1 115.4 129.8
Aberdeen - Stomness 7,8,9 Serco Northlink .. .. .. .. .. .. .. .. .. .. ..
Lerwick - Kirkwall 8,9 Serco Northlink 14.6 15.4 16.0 16 16.3 16.3 15.8 17.1 17.5 18.8 19.2
Scrabster - Stromness 8,9 Serco Northlink 151.0 141.5 138.0 139 115.6 120.8 125.7 135.2 146.4 153.3 161.9Total North 308.5 305.3 303.7 298.0 282.9 288.6 297.6 301.5 307.5 322.5 347.6
Total 5,604.3 5,541.1 5,288.1 5,150.0 5,176.6 5,251.7 5,226.0 5,660.6 5,846.4 5,863.6 6,033.0
Route Operator Cars
2009 2010 2011 2012 2013 2014 2015 2016 2017 2018 2019
Clyde 12thousand
Ardrossan-Brodick C CalMac 136.0 134.2 127.9 127.0 130.4 139.6 189.9 202.8 205.5 199.0 207.7
Ardrossan-Campbeltown 11, C CalMac .. .. .. .. 2.0 2.2 2.3 2.5 2.5 2.2 2.9
Colintraive-Rhubodach C CalMac 87.3 84.6 80.9 76.4 75.5 74.6 83.7 95.2 91.6 84.7 86.6
Gourock-Dunoon 5, 6 CalMac .. .. .. .. .. .. .. .. .. .. ..
Gourock-Dunoon6 Cowal Ferries 70.7 61.4 25.8 .. .. .. .. .. .. .. ..
Gourock-Dunoon6 Argyll Ferries .. .. .. .. .. .. .. .. .. .. ..
Largs-Cumbrae C CalMac 139.8 138.7 136.0 134.1 134.9 135 138.2 161.3 169.9 174.1 178.9
Lochranza-Tarbet/Claonaig 1, C CalMac 17.6 16.6 14.7 14.0 13.9 14.9 20.8 23.9 24.2 25.5 27.5
Tarbert-Portavadie C CalMac 21.6 21.2 19.7 19.0 18.5 18.5 17.9 25.5 26.6 28.8 30.2
Wemyss Bay-Rothesay C CalMac 162.7 155.7 152.9 150.1 144.8 147.5 145.1 172.9 188.7 193.7 198.1
Other .. .. .. .. .. .. .. .. .. .. ..Total Clyde 635.9 612.4 557.9 520.7 520.0 532.3 597.9 684.1 709.0 708.0 731.9
West Coast 12
Ardmhor (Barra)-Eriskay C CalMac 17.0 16.0 17.0 16.7 16.6 17.0 17.3 22.0 23.0 23.9 25.3
Berneray-Leverburgh 3, C CalMac 24.7 23.7 23.4 21.7 22.2 23.9 22.5 28.2 29.7 30.4 32.3
Fionnphort-Iona C CalMac 4.6 5.2 5.6 6.1 6.7 6.7 6.7 8.3 8.8 9.1 9.2
Fishnish-Lochaline C CalMac 47.9 45.3 46.2 43.7 43.4 44.6 45.1 42.7 42.9 45.5 46.7Kennacraig-Islay/C'say/Oban b CalMac 2.8 2.3 3.2 3.1 5.5 6.0 6.6 7.7 7.3 6.8 7.1
Kennacraig-Islay b CalMac 56.3 54.2 56.0 57.3 61.8 65.8 66.8 69.7 76.4 79.5 81.6Mallaig-Eigg/Muck/Rum/Canna C CalMac 0.8 1.0 0.8 1.0 0.9 1.1 1.1 1.7 1.7 1.7 1.8
Mallaig-Armadale C CalMac 54.3 51.9 52.4 50.3 52.4 53.1 54.9 61.8 70.0 67.8 75.8
Mallaig-Lochboisdale 13,C CalMac - - - - 0.1 0.4 0.4 8.3 11 8.3 11.5Oban-Coll/Tiree/Castlebay a CalMac 2.8 2.3 2.5 2.6 2.6 2.6 2.5 1.8 1.9 1.6 1.8Oban-Colonsay b CalMac 4.4 4.6 4.3 4.3 4.8 4.4 4.2 4.5 4.9 5.1 5Oban-Lismore C CalMac 2.5 2.8 2.7 3.1 3.1 3.4 3.8 5.8 6.7 6.7 6.7
Oban-Castlebay- Lochboisdale a CalMac 18.3 18.0 19.3 18.6 17.9 18.4 18.0 15.7 17.1 20 18.3
Oban-Coll/Tiree a CalMac 15.8 15.6 15.2 15.9 16.0 15.7 15.8 17.8 18.8 18 19.2
Oban-Craignure C CalMac 114.3 108.5 108.9 105.8 109.9 112.6 115.4 162.3 168.1 164 169.7
Otternish-Leverburgh 3, C CalMac .. .. .. .. .. .. .. .. .. .. ..
Raasay-Sconser C CalMac 22.9 21.2 19.0 19.8 20.1 19.2 20.3 25.2 29.2 29.9 31.3
Tayinloan-Gigha b CalMac 14.5 14.2 12.7 12.7 14.3 15.8 15.7 17.5 19.5 20.7 22.9Tobermory-Kilchoan C CalMac 6.1 5.6 5.3 5.2 5.3 5.5 6.1 10.6 11.7 11.6 14.4
Uig-Tarbert-Lochmaddy 2,a CalMac 69.8 67.9 67.6 69.8 72.0 76.1 74.8 74.7 78.2 76.7 80.5
Ullapool-Stornoway a CalMac 66.7 67.6 67.8 67.2 68.6 70.3 72.0 86.2 92.1 94.7 100.9 Total West Coast 546.7 527.7 530.0 524.8 544.3 562.6 570.0 672.5 719.0 722.0 762.0
North 8, 12
Aberdeen - Kirkwall 7,8,9 Serco Northlink 5.3 4.9 5.0 4.6 4.8 4.2 4.5 4.5 4.6 5.1 5.6
Aberdeen - Lerwick 8,9 Serco Northlink 16.7 17.4 17.2 16.3 16.9 16.6 17.4 17.9 18.3 20.0 22.3
Aberdeen - Stomness 7,8,9 Serco Northlink .. .. .. .. .. .. .. .. .. .. ..
Lerwick - Kirkwall 8,9 Serco Northlink 2.3 2.4 2.4 2.3 2.2 2.4 2.5 2.7 3.2 3.1 3.3
Scrabster - Stromness 8,9 Serco Northlink 43.5 39.4 38.0 38 31.7 32.1 34.1 37.7 40.9 43.2 45.4Total North 67.8 64.1 62.6 61.2 55.6 55.3 58.5 62.8 67.0 71.5 76.6
Total 1,250.4 1,204.2 1,150.5 1,106.7 1,119.9 1,150.2 1,226.4 1,419.4 1,495.0 1,501.5 1,570.5
167
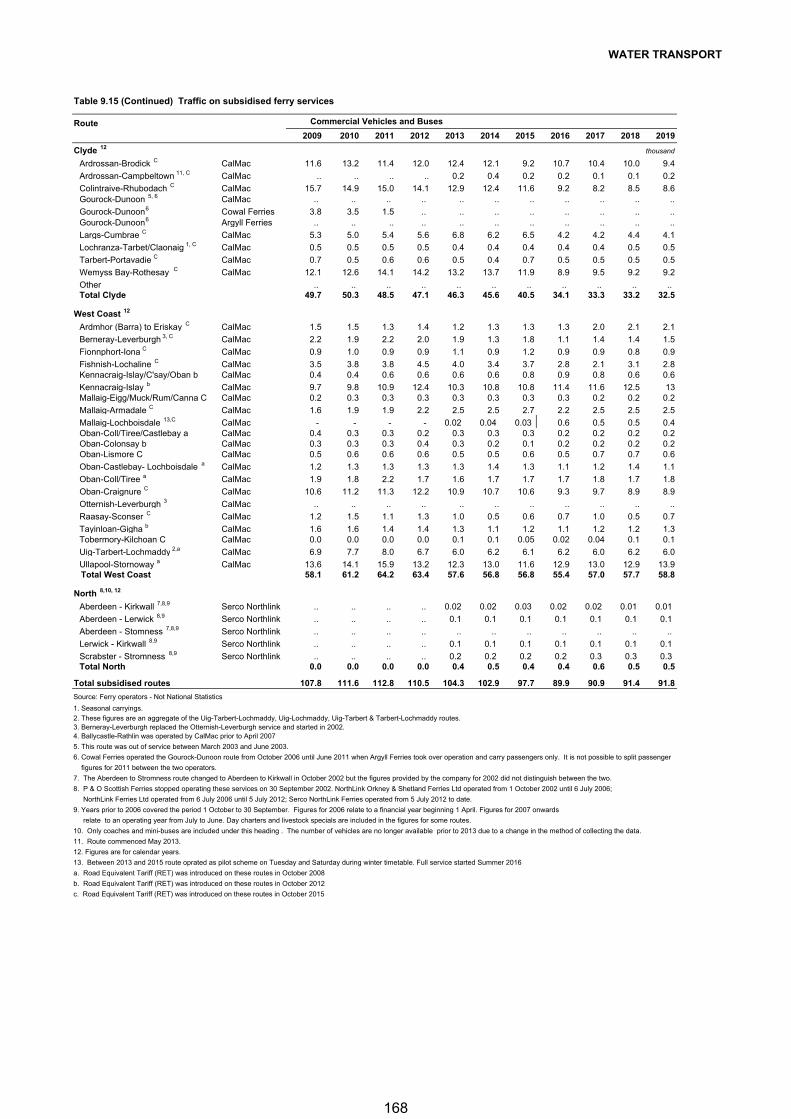
WATER TRANSPORT
Table 9.15 (Continued) Traffic on subsidised ferry services
Route Commercial Vehicles and Buses
2009 2010 2011 2012 2013 2014 2015 2016 2017 2018 2019
Clyde 12thousand
Ardrossan-Brodick C CalMac 11.6 13.2 11.4 12.0 12.4 12.1 9.2 10.7 10.4 10.0 9.4
Ardrossan-Campbeltown 11, C CalMac .. .. .. .. 0.2 0.4 0.2 0.2 0.1 0.1 0.2
Colintraive-Rhubodach C CalMac 15.7 14.9 15.0 14.1 12.9 12.4 11.6 9.2 8.2 8.5 8.6Gourock-Dunoon 5, 6 CalMac .. .. .. .. .. .. .. .. .. .. ..
Gourock-Dunoon6 Cowal Ferries 3.8 3.5 1.5 .. .. .. .. .. .. .. ..Gourock-Dunoon6 Argyll Ferries .. .. .. .. .. .. .. .. .. .. ..
Largs-Cumbrae C CalMac 5.3 5.0 5.4 5.6 6.8 6.2 6.5 4.2 4.2 4.4 4.1
Lochranza-Tarbet/Claonaig 1, C CalMac 0.5 0.5 0.5 0.5 0.4 0.4 0.4 0.4 0.4 0.5 0.5
Tarbert-Portavadie C CalMac 0.7 0.5 0.6 0.6 0.5 0.4 0.7 0.5 0.5 0.5 0.5
Wemyss Bay-Rothesay C CalMac 12.1 12.6 14.1 14.2 13.2 13.7 11.9 8.9 9.5 9.2 9.2
Other .. .. .. .. .. .. .. .. .. .. ..Total Clyde 49.7 50.3 48.5 47.1 46.3 45.6 40.5 34.1 33.3 33.2 32.5
West Coast 12
Ardmhor (Barra) to Eriskay C CalMac 1.5 1.5 1.3 1.4 1.2 1.3 1.3 1.3 2.0 2.1 2.1
Berneray-Leverburgh 3, C CalMac 2.2 1.9 2.2 2.0 1.9 1.3 1.8 1.1 1.4 1.4 1.5
Fionnphort-Iona C CalMac 0.9 1.0 0.9 0.9 1.1 0.9 1.2 0.9 0.9 0.8 0.9
Fishnish-Lochaline C CalMac 3.5 3.8 3.8 4.5 4.0 3.4 3.7 2.8 2.1 3.1 2.8Kennacraig-Islay/C'say/Oban b CalMac 0.4 0.4 0.6 0.6 0.6 0.6 0.8 0.9 0.8 0.6 0.6
Kennacraig-Islay b CalMac 9.7 9.8 10.9 12.4 10.3 10.8 10.8 11.4 11.6 12.5 13Mallaig-Eigg/Muck/Rum/Canna C CalMac 0.2 0.3 0.3 0.3 0.3 0.3 0.3 0.3 0.2 0.2 0.2
Mallaig-Armadale C CalMac 1.6 1.9 1.9 2.2 2.5 2.5 2.7 2.2 2.5 2.5 2.5
Mallaig-Lochboisdale 13,C CalMac - - - - 0.02 0.04 0.03 0.6 0.5 0.5 0.4Oban-Coll/Tiree/Castlebay a CalMac 0.4 0.3 0.3 0.2 0.3 0.3 0.3 0.2 0.2 0.2 0.2Oban-Colonsay b CalMac 0.3 0.3 0.3 0.4 0.3 0.2 0.1 0.2 0.2 0.2 0.2Oban-Lismore C CalMac 0.5 0.6 0.6 0.6 0.5 0.5 0.6 0.5 0.7 0.7 0.6
Oban-Castlebay- Lochboisdale a CalMac 1.2 1.3 1.3 1.3 1.3 1.4 1.3 1.1 1.2 1.4 1.1
Oban-Coll/Tiree a CalMac 1.9 1.8 2.2 1.7 1.6 1.7 1.7 1.7 1.8 1.7 1.8
Oban-Craignure C CalMac 10.6 11.2 11.3 12.2 10.9 10.7 10.6 9.3 9.7 8.9 8.9
Otternish-Leverburgh 3 CalMac .. .. .. .. .. .. .. .. .. .. ..
Raasay-Sconser C CalMac 1.2 1.5 1.1 1.3 1.0 0.5 0.6 0.7 1.0 0.5 0.7
Tayinloan-Gigha b CalMac 1.6 1.6 1.4 1.4 1.3 1.1 1.2 1.1 1.2 1.2 1.3Tobermory-Kilchoan C CalMac 0.0 0.0 0.0 0.0 0.1 0.1 0.05 0.02 0.04 0.1 0.1
Uig-Tarbert-Lochmaddy 2,a CalMac 6.9 7.7 8.0 6.7 6.0 6.2 6.1 6.2 6.0 6.2 6.0
Ullapool-Stornoway a CalMac 13.6 14.1 15.9 13.2 12.3 13.0 11.6 12.9 13.0 12.9 13.9 Total West Coast 58.1 61.2 64.2 63.4 57.6 56.8 56.8 55.4 57.0 57.7 58.8
North 8,10, 12
Aberdeen - Kirkwall 7,8,9 Serco Northlink .. .. .. .. 0.02 0.02 0.03 0.02 0.02 0.01 0.01
Aberdeen - Lerwick 8,9 Serco Northlink .. .. .. .. 0.1 0.1 0.1 0.1 0.1 0.1 0.1
Aberdeen - Stomness 7,8,9 Serco Northlink .. .. .. .. .. .. .. .. .. .. ..
Lerwick - Kirkwall 8,9 Serco Northlink .. .. .. .. 0.1 0.1 0.1 0.1 0.1 0.1 0.1
Scrabster - Stromness 8,9 Serco Northlink .. .. .. .. 0.2 0.2 0.2 0.2 0.3 0.3 0.3 Total North 0.0 0.0 0.0 0.0 0.4 0.5 0.4 0.4 0.6 0.5 0.5
Total subsidised routes 107.8 111.6 112.8 110.5 104.3 102.9 97.7 89.9 90.9 91.4 91.8
Source: Ferry operators - Not National Statistics
1. Seasonal carryings.
2. These figures are an aggregate of the Uig-Tarbert-Lochmaddy, Uig-Lochmaddy, Uig-Tarbert & Tarbert-Lochmaddy routes.3. Berneray-Leverburgh replaced the Otternish-Leverburgh service and started in 2002.4. Ballycastle-Rathlin was operated by CalMac prior to April 2007
5. This route was out of service between March 2003 and June 2003.
6. Cowal Ferries operated the Gourock-Dunoon route from October 2006 until June 2011 when Argyll Ferries took over operation and carry passengers only. It is not possible to split passenger
figures for 2011 between the two operators.
7. The Aberdeen to Stromness route changed to Aberdeen to Kirkwall in October 2002 but the figures provided by the company for 2002 did not distinguish between the two.
8. P & O Scottish Ferries stopped operating these services on 30 September 2002. NorthLink Orkney & Shetland Ferries Ltd operated from 1 October 2002 until 6 July 2006;
NorthLink Ferries Ltd operated from 6 July 2006 until 5 July 2012; Serco NorthLink Ferries operated from 5 July 2012 to date.
9. Years prior to 2006 covered the period 1 October to 30 September. Figures for 2006 relate to a financial year beginning 1 April. Figures for 2007 onwards
relate to an operating year from July to June. Day charters and livestock specials are included in the figures for some routes.
10. Only coaches and mini-buses are included under this heading . The number of vehicles are no longer available prior to 2013 due to a change in the method of collecting the data.
11. Route commenced May 2013.
12. Figures are for calendar years.
13. Between 2013 and 2015 route oprated as pilot scheme on Tuesday and Saturday during winter timetable. Full service started Summer 2016
a. Road Equivalent Tariff (RET) was introduced on these routes in October 2008
b. Road Equivalent Tariff (RET) was introduced on these routes in October 2012
c. Road Equivalent Tariff (RET) was introduced on these routes in October 2015
168
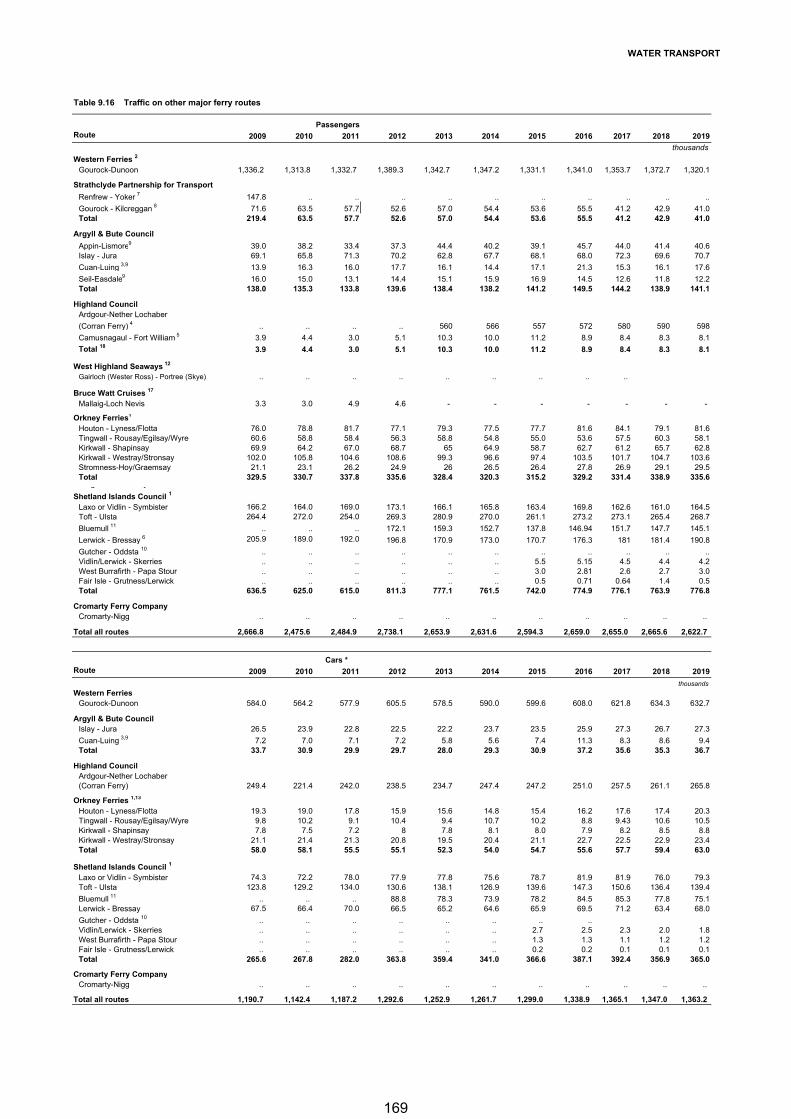
WATER TRANSPORT
Table 9.16 Traffic on other major ferry routes
PassengersRoute 2009 2010 2011 2012 2013 2014 2015 2016 2017 2018 2019
thousands
Western Ferries 2
Gourock-Dunoon 1,336.2 1,313.8 1,332.7 1,389.3 1,342.7 1,347.2 1,331.1 1,341.0 1,353.7 1,372.7 1,320.1
Strathclyde Partnership for Transport
Renfrew - Yoker 7 147.8 .. .. .. .. .. .. .. .. .. ..
Gourock - Kilcreggan 8 71.6 63.5 57.7 52.6 57.0 54.4 53.6 55.5 41.2 42.9 41.0Total 219.4 63.5 57.7 52.6 57.0 54.4 53.6 55.5 41.2 42.9 41.0
Argyll & Bute Council
Appin-Lismore9 39.0 38.2 33.4 37.3 44.4 40.2 39.1 45.7 44.0 41.4 40.6Islay - Jura 69.1 65.8 71.3 70.2 62.8 67.7 68.1 68.0 72.3 69.6 70.7
Cuan-Luing 3,9 13.9 16.3 16.0 17.7 16.1 14.4 17.1 21.3 15.3 16.1 17.6
Seil-Easdale9 16.0 15.0 13.1 14.4 15.1 15.9 16.9 14.5 12.6 11.8 12.2Total 138.0 135.3 133.8 139.6 138.4 138.2 141.2 149.5 144.2 138.9 141.1
Highland CouncilArdgour-Nether Lochaber
(Corran Ferry) 4 .. .. .. .. 560 566 557 572 580 590 598
Camusnagaul - Fort William 5 3.9 4.4 3.0 5.1 10.3 10.0 11.2 8.9 8.4 8.3 8.1
Total 18 3.9 4.4 3.0 5.1 10.3 10.0 11.2 8.9 8.4 8.3 8.1
West Highland Seaways 12
Gairloch (Wester Ross) - Portree (Skye) .. .. .. .. .. .. .. .. ..
Bruce Watt Cruises 17
Mallaig-Loch Nevis 3.3 3.0 4.9 4.6 - - - - - - -
Orkney Ferries1
Houton - Lyness/Flotta 76.0 78.8 81.7 77.1 79.3 77.5 77.7 81.6 84.1 79.1 81.6Tingwall - Rousay/Egilsay/Wyre 60.6 58.8 58.4 56.3 58.8 54.8 55.0 53.6 57.5 60.3 58.1Kirkwall - Shapinsay 69.9 64.2 67.0 68.7 65 64.9 58.7 62.7 61.2 65.7 62.8Kirkwall - Westray/Stronsay 102.0 105.8 104.6 108.6 99.3 96.6 97.4 103.5 101.7 104.7 103.6Stromness-Hoy/Graemsay 21.1 23.1 26.2 24.9 26 26.5 26.4 27.8 26.9 29.1 29.5Total 329.5 330.7 337.8 335.6 328.4 320.3 315.2 329.2 331.4 338.9 335.6
g y
Shetland Islands Council 1
Laxo or Vidlin - Symbister 166.2 164.0 169.0 173.1 166.1 165.8 163.4 169.8 162.6 161.0 164.5Toft - Ulsta 264.4 272.0 254.0 269.3 280.9 270.0 261.1 273.2 273.1 265.4 268.7
Bluemull 11 .. .. .. 172.1 159.3 152.7 137.8 146.94 151.7 147.7 145.1
Lerwick - Bressay 6 205.9 189.0 192.0 196.8 170.9 173.0 170.7 176.3 181 181.4 190.8
Gutcher - Oddsta 10 .. .. .. .. .. .. .. .. .. .. ..Vidlin/Lerwick - Skerries .. .. .. .. .. .. 5.5 5.15 4.5 4.4 4.2West Burrafirth - Papa Stour .. .. .. .. .. .. 3.0 2.81 2.6 2.7 3.0Fair Isle - Grutness/Lerwick .. .. .. .. .. .. 0.5 0.71 0.64 1.4 0.5Total 636.5 625.0 615.0 811.3 777.1 761.5 742.0 774.9 776.1 763.9 776.8
Cromarty Ferry CompanyCromarty-Nigg .. .. .. .. .. .. .. .. .. .. ..
Total all routes 2,666.8 2,475.6 2,484.9 2,738.1 2,653.9 2,631.6 2,594.3 2,659.0 2,655.0 2,665.6 2,622.7
Cars * Route 2009 2010 2011 2012 2013 2014 2015 2016 2017 2018 2019
thousands
Western FerriesGourock-Dunoon 584.0 564.2 577.9 605.5 578.5 590.0 599.6 608.0 621.8 634.3 632.7
Argyll & Bute CouncilIslay - Jura 26.5 23.9 22.8 22.5 22.2 23.7 23.5 25.9 27.3 26.7 27.3
Cuan-Luing 3,9 7.2 7.0 7.1 7.2 5.8 5.6 7.4 11.3 8.3 8.6 9.4Total 33.7 30.9 29.9 29.7 28.0 29.3 30.9 37.2 35.6 35.3 36.7
Highland CouncilArdgour-Nether Lochaber(Corran Ferry) 249.4 221.4 242.0 238.5 234.7 247.4 247.2 251.0 257.5 261.1 265.8
Orkney Ferries 1,13
Houton - Lyness/Flotta 19.3 19.0 17.8 15.9 15.6 14.8 15.4 16.2 17.6 17.4 20.3Tingwall - Rousay/Egilsay/Wyre 9.8 10.2 9.1 10.4 9.4 10.7 10.2 8.8 9.43 10.6 10.5Kirkwall - Shapinsay 7.8 7.5 7.2 8 7.8 8.1 8.0 7.9 8.2 8.5 8.8Kirkwall - Westray/Stronsay 21.1 21.4 21.3 20.8 19.5 20.4 21.1 22.7 22.5 22.9 23.4Total 58.0 58.1 55.5 55.1 52.3 54.0 54.7 55.6 57.7 59.4 63.0
Shetland Islands Council 1
Laxo or Vidlin - Symbister 74.3 72.2 78.0 77.9 77.8 75.6 78.7 81.9 81.9 76.0 79.3Toft - Ulsta 123.8 129.2 134.0 130.6 138.1 126.9 139.6 147.3 150.6 136.4 139.4
Bluemull 11 .. .. .. 88.8 78.3 73.9 78.2 84.5 85.3 77.8 75.1Lerwick - Bressay 67.5 66.4 70.0 66.5 65.2 64.6 65.9 69.5 71.2 63.4 68.0
Gutcher - Oddsta 10 .. .. .. .. .. .. .. ..Vidlin/Lerwick - Skerries .. .. .. .. .. .. 2.7 2.5 2.3 2.0 1.8West Burrafirth - Papa Stour .. .. .. .. .. .. 1.3 1.3 1.1 1.2 1.2Fair Isle - Grutness/Lerwick .. .. .. .. .. .. 0.2 0.2 0.1 0.1 0.1Total 265.6 267.8 282.0 363.8 359.4 341.0 366.6 387.1 392.4 356.9 365.0
Cromarty Ferry CompanyCromarty-Nigg .. .. .. .. .. .. .. .. .. .. ..
Total all routes 1,190.7 1,142.4 1,187.2 1,292.6 1,252.9 1,261.7 1,299.0 1,338.9 1,365.1 1,347.0 1,363.2
169
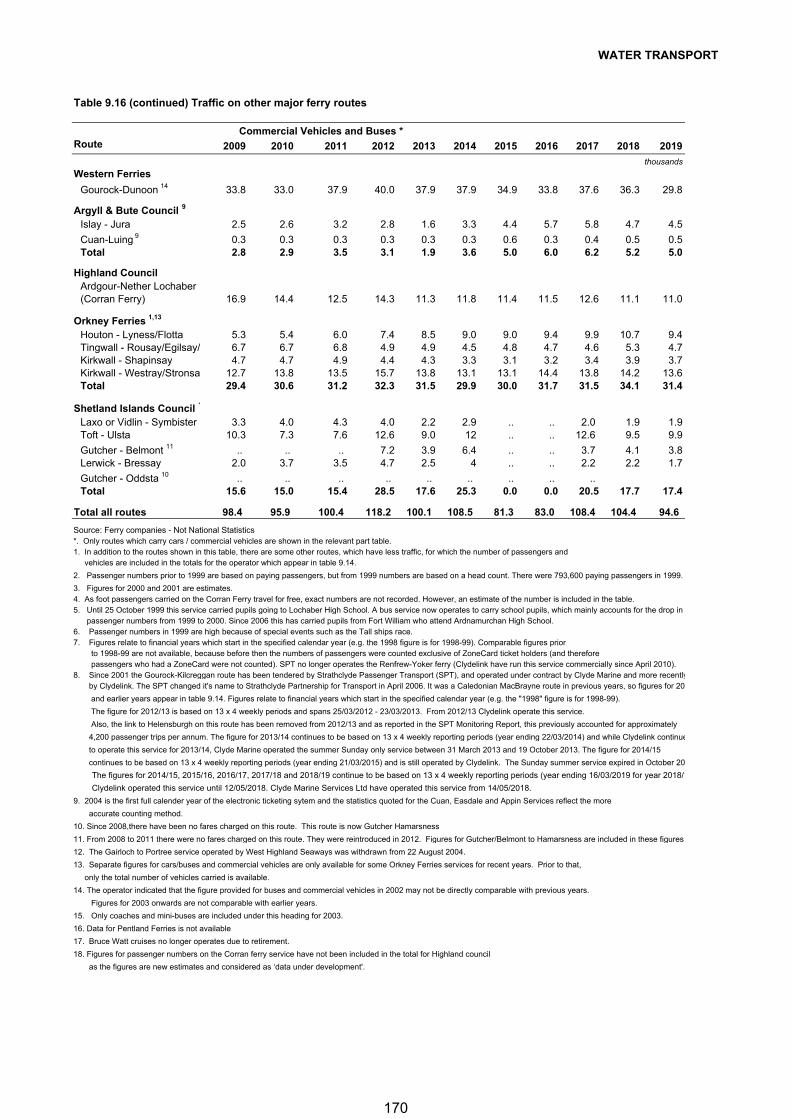
WATER TRANSPORT
Table 9.16 (continued) Traffic on other major ferry routes
Commercial Vehicles and Buses * Route 2009 2010 2011 2012 2013 2014 2015 2016 2017 2018 2019
thousands
Western Ferries
Gourock-Dunoon 14 33.8 33.0 37.9 40.0 37.9 37.9 34.9 33.8 37.6 36.3 29.8
Argyll & Bute Council 9 Islay - Jura 2.5 2.6 3.2 2.8 1.6 3.3 4.4 5.7 5.8 4.7 4.5
Cuan-Luing 9 0.3 0.3 0.3 0.3 0.3 0.3 0.6 0.3 0.4 0.5 0.5Total 2.8 2.9 3.5 3.1 1.9 3.6 5.0 6.0 6.2 5.2 5.0
Highland Council
Ardgour-Nether Lochaber (Corran Ferry) 16.9 14.4 12.5 14.3 11.3 11.8 11.4 11.5 12.6 11.1 11.0
Orkney Ferries 1,13
Houton - Lyness/Flotta 5.3 5.4 6.0 7.4 8.5 9.0 9.0 9.4 9.9 10.7 9.4Tingwall - Rousay/Egilsay/ 6.7 6.7 6.8 4.9 4.9 4.5 4.8 4.7 4.6 5.3 4.7Kirkwall - Shapinsay 4.7 4.7 4.9 4.4 4.3 3.3 3.1 3.2 3.4 3.9 3.7Kirkwall - Westray/Stronsa 12.7 13.8 13.5 15.7 13.8 13.1 13.1 14.4 13.8 14.2 13.6Total 29.4 30.6 31.2 32.3 31.5 29.9 30.0 31.7 31.5 34.1 31.4
Shetland Islands Council 1 Laxo or Vidlin - Symbister 3.3 4.0 4.3 4.0 2.2 2.9 .. .. 2.0 1.9 1.9Toft - Ulsta 10.3 7.3 7.6 12.6 9.0 12 .. .. 12.6 9.5 9.9
Gutcher - Belmont 11 .. .. .. 7.2 3.9 6.4 .. .. 3.7 4.1 3.8Lerwick - Bressay 2.0 3.7 3.5 4.7 2.5 4 .. .. 2.2 2.2 1.7
Gutcher - Oddsta 10 .. .. .. .. .. .. .. .. ..Total 15.6 15.0 15.4 28.5 17.6 25.3 0.0 0.0 20.5 17.7 17.4
Total all routes 98.4 95.9 100.4 118.2 100.1 108.5 81.3 83.0 108.4 104.4 94.6
Source: Ferry companies - Not National Statistics*. Only routes which carry cars / commercial vehicles are shown in the relevant part table.1. In addition to the routes shown in this table, there are some other routes, which have less traffic, for which the number of passengers and vehicles are included in the totals for the operator which appear in table 9.14.
2. Passenger numbers prior to 1999 are based on paying passengers, but from 1999 numbers are based on a head count. There were 793,600 paying passengers in 1999.
3. Figures for 2000 and 2001 are estimates.4. As foot passengers carried on the Corran Ferry travel for free, exact numbers are not recorded. However, an estimate of the number is included in the table. 5. Until 25 October 1999 this service carried pupils going to Lochaber High School. A bus service now operates to carry school pupils, which mainly accounts for the drop in passenger numbers from 1999 to 2000. Since 2006 this has carried pupils from Fort William who attend Ardnamurchan High School.6. Passenger numbers in 1999 are high because of special events such as the Tall ships race.7. Figures relate to financial years which start in the specified calendar year (e.g. the 1998 figure is for 1998-99). Comparable figures prior to 1998-99 are not available, because before then the numbers of passengers were counted exclusive of ZoneCard ticket holders (and therefore passengers who had a ZoneCard were not counted). SPT no longer operates the Renfrew-Yoker ferry (Clydelink have run this service commercially since April 2010).8. Since 2001 the Gourock-Kilcreggan route has been tendered by Strathclyde Passenger Transport (SPT), and operated under contract by Clyde Marine and more recently by Clydelink. The SPT changed it's name to Strathclyde Partnership for Transport in April 2006. It was a Caledonian MacBrayne route in previous years, so figures for 20
and earlier years appear in table 9.14. Figures relate to financial years which start in the specified calendar year (e.g. the "1998" figure is for 1998-99).
The figure for 2012/13 is based on 13 x 4 weekly periods and spans 25/03/2012 - 23/03/2013. From 2012/13 Clydelink operate this service.
Also, the link to Helensburgh on this route has been removed from 2012/13 and as reported in the SPT Monitoring Report, this previously accounted for approximately
4,200 passenger trips per annum. The figure for 2013/14 continues to be based on 13 x 4 weekly reporting periods (year ending 22/03/2014) and while Clydelink continue
to operate this service for 2013/14, Clyde Marine operated the summer Sunday only service between 31 March 2013 and 19 October 2013. The figure for 2014/15
continues to be based on 13 x 4 weekly reporting periods (year ending 21/03/2015) and is still operated by Clydelink. The Sunday summer service expired in October 20
The figures for 2014/15, 2015/16, 2016/17, 2017/18 and 2018/19 continue to be based on 13 x 4 weekly reporting periods (year ending 16/03/2019 for year 2018/1
Clydelink operated this service until 12/05/2018. Clyde Marine Services Ltd have operated this service from 14/05/2018.
9. 2004 is the first full calender year of the electronic ticketing sytem and the statistics quoted for the Cuan, Easdale and Appin Services reflect the more
accurate counting method.
10. Since 2008,there have been no fares charged on this route. This route is now Gutcher Hamarsness
11. From 2008 to 2011 there were no fares charged on this route. They were reintroduced in 2012. Figures for Gutcher/Belmont to Hamarsness are included in these figures
12. The Gairloch to Portree service operated by West Highland Seaways was withdrawn from 22 August 2004.
13. Separate figures for cars/buses and commercial vehicles are only available for some Orkney Ferries services for recent years. Prior to that,
only the total number of vehicles carried is available.
14. The operator indicated that the figure provided for buses and commercial vehicles in 2002 may not be directly comparable with previous years.
Figures for 2003 onwards are not comparable with earlier years.
15. Only coaches and mini-buses are included under this heading for 2003.
16. Data for Pentland Ferries is not available
17. Bruce Watt cruises no longer operates due to retirement.
18. Figures for passenger numbers on the Corran ferry service have not been included in the total for Highland council
as the figures are new estimates and considered as ‘data under development'.
170
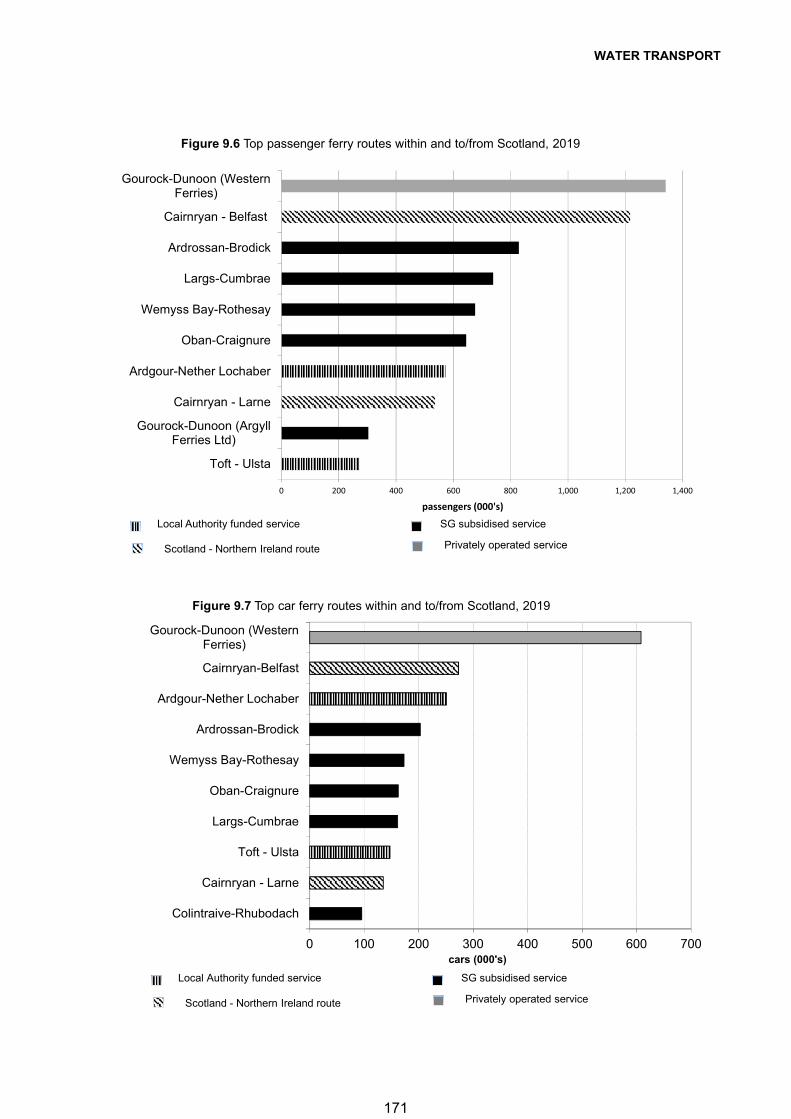
WATER TRANSPORT
0 100 200 300 400 500 600 700
Colintraive-Rhubodach
Cairnryan - Larne
Toft - Ulsta
Largs-Cumbrae
Oban-Craignure
Wemyss Bay-Rothesay
Ardrossan-Brodick
Ardgour-Nether Lochaber
Cairnryan-Belfast
Gourock-Dunoon (WesternFerries)
cars (000's)
Figure 9.7 Top car ferry routes within and to/from Scotland, 2019
Local Authority funded service
Scotland - Northern Ireland route
SG subsidised service
Privately operated service
0 200 400 600 800 1,000 1,200 1,400
Toft - Ulsta
Gourock-Dunoon (ArgyllFerries Ltd)
Cairnryan - Larne
Ardgour-Nether Lochaber
Oban-Craignure
Wemyss Bay-Rothesay
Largs-Cumbrae
Ardrossan-Brodick
Cairnryan - Belfast
Gourock-Dunoon (WesternFerries)
passengers (000's)
Figure 9.6 Top passenger ferry routes within and to/from Scotland, 2019
Local Authority funded service
Scotland - Northern Ireland route
SG subsidised service
Privately operated service
171
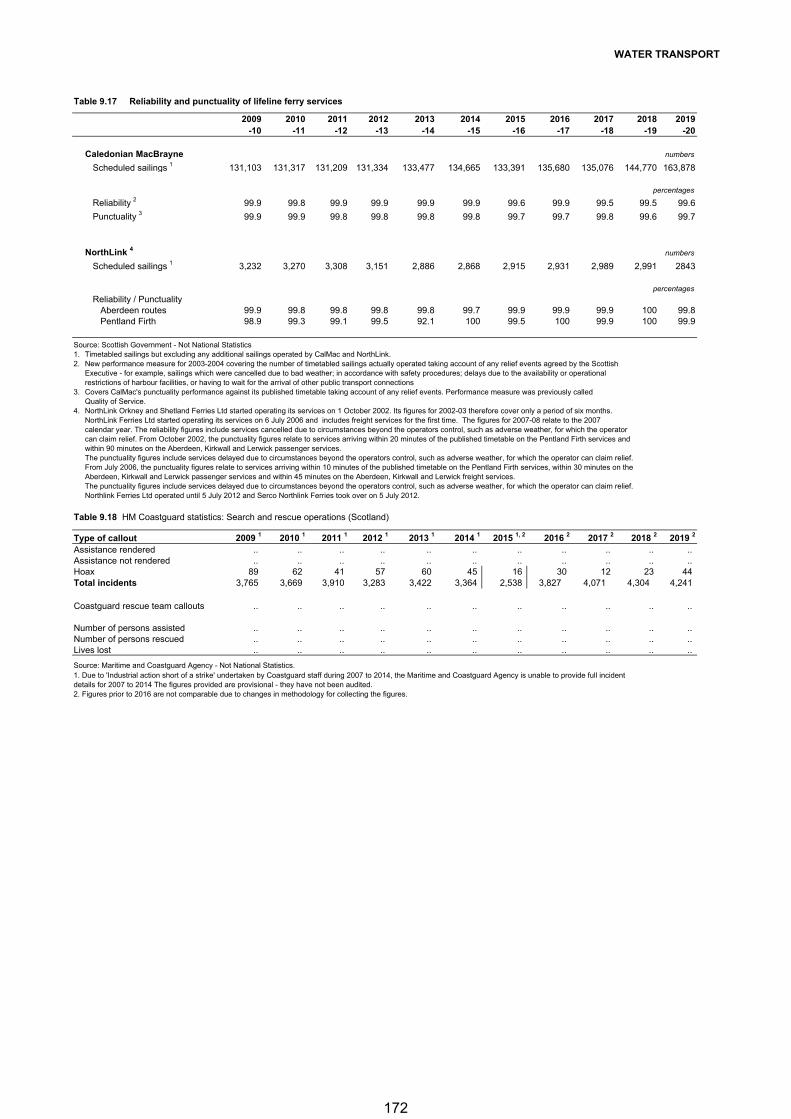
WATER TRANSPORT
Table 9.17 Reliability and punctuality of lifeline ferry services
2009 2010 2011 2012 2013 2014 2015 2016 2017 2018 2019 -10 -11 -12 -13 -14 -15 -16 -17 -18 -19 -20
Caledonian MacBrayne numbers
Scheduled sailings 1 131,103 131,317 131,209 131,334 133,477 134,665 133,391 135,680 135,076 144,770 163,878
percentages
Reliability 2 99.9 99.8 99.9 99.9 99.9 99.9 99.6 99.9 99.5 99.5 99.6
Punctuality 3 99.9 99.9 99.8 99.8 99.8 99.8 99.7 99.7 99.8 99.6 99.7
NorthLink 4 numbers
Scheduled sailings 1 3,232 3,270 3,308 3,151 2,886 2,868 2,915 2,931 2,989 2,991 2843
percentages
Reliability / PunctualityAberdeen routes 99.9 99.8 99.8 99.8 99.8 99.7 99.9 99.9 99.9 100 99.8Pentland Firth 98.9 99.3 99.1 99.5 92.1 100 99.5 100 99.9 100 99.9
Source: Scottish Government - Not National Statistics1. Timetabled sailings but excluding any additional sailings operated by CalMac and NorthLink. 2. New performance measure for 2003-2004 covering the number of timetabled sailings actually operated taking account of any relief events agreed by the Scottish
Executive - for example, sailings which were cancelled due to bad weather; in accordance with safety procedures; delays due to the availability or operational restrictions of harbour facilities, or having to wait for the arrival of other public transport connections
3. Covers CalMac's punctuality performance against its published timetable taking account of any relief events. Performance measure was previously called Quality of Service.
4. NorthLink Orkney and Shetland Ferries Ltd started operating its services on 1 October 2002. Its figures for 2002-03 therefore cover only a period of six months. NorthLink Ferries Ltd started operating its services on 6 July 2006 and includes freight services for the first time. The figures for 2007-08 relate to the 2007calendar year. The reliability figures include services cancelled due to circumstances beyond the operators control, such as adverse weather, for which the operatorcan claim relief. From October 2002, the punctuality figures relate to services arriving within 20 minutes of the published timetable on the Pentland Firth services andwithin 90 minutes on the Aberdeen, Kirkwall and Lerwick passenger services.The punctuality figures include services delayed due to circumstances beyond the operators control, such as adverse weather, for which the operator can claim relief. From July 2006, the punctuality figures relate to services arriving within 10 minutes of the published timetable on the Pentland Firth services, within 30 minutes on the Aberdeen, Kirkwall and Lerwick passenger services and within 45 minutes on the Aberdeen, Kirkwall and Lerwick freight services.The punctuality figures include services delayed due to circumstances beyond the operators control, such as adverse weather, for which the operator can claim relief. Northlink Ferries Ltd operated until 5 July 2012 and Serco Northlink Ferries took over on 5 July 2012.
Table 9.18 HM Coastguard statistics: Search and rescue operations (Scotland)
Type of callout 2009 1 2010 1 2011 1 2012 1 2013 1 2014 1 2015 1, 2 2016 2 2017 2 2018 2 2019 2
Assistance rendered .. .. .. .. .. .. .. .. .. .. ..Assistance not rendered .. .. .. .. .. .. .. .. .. .. ..Hoax 89 62 41 57 60 45 16 30 12 23 44 Total incidents 3,765 3,669 3,910 3,283 3,422 3,364 2,538 3,827 4,071 4,304 4,241
Coastguard rescue team callouts .. .. .. .. .. .. .. .. .. .. ..
Number of persons assisted .. .. .. .. .. .. .. .. .. .. ..Number of persons rescued .. .. .. .. .. .. .. .. .. .. ..Lives lost .. .. .. .. .. .. .. .. .. .. ..
Source: Maritime and Coastguard Agency - Not National Statistics.1. Due to 'Industrial action short of a strike' undertaken by Coastguard staff during 2007 to 2014, the Maritime and Coastguard Agency is unable to provide full incidentdetails for 2007 to 2014 The figures provided are provisional - they have not been audited. 2. Figures prior to 2016 are not comparable due to changes in methodology for collecting the figures.
172

173
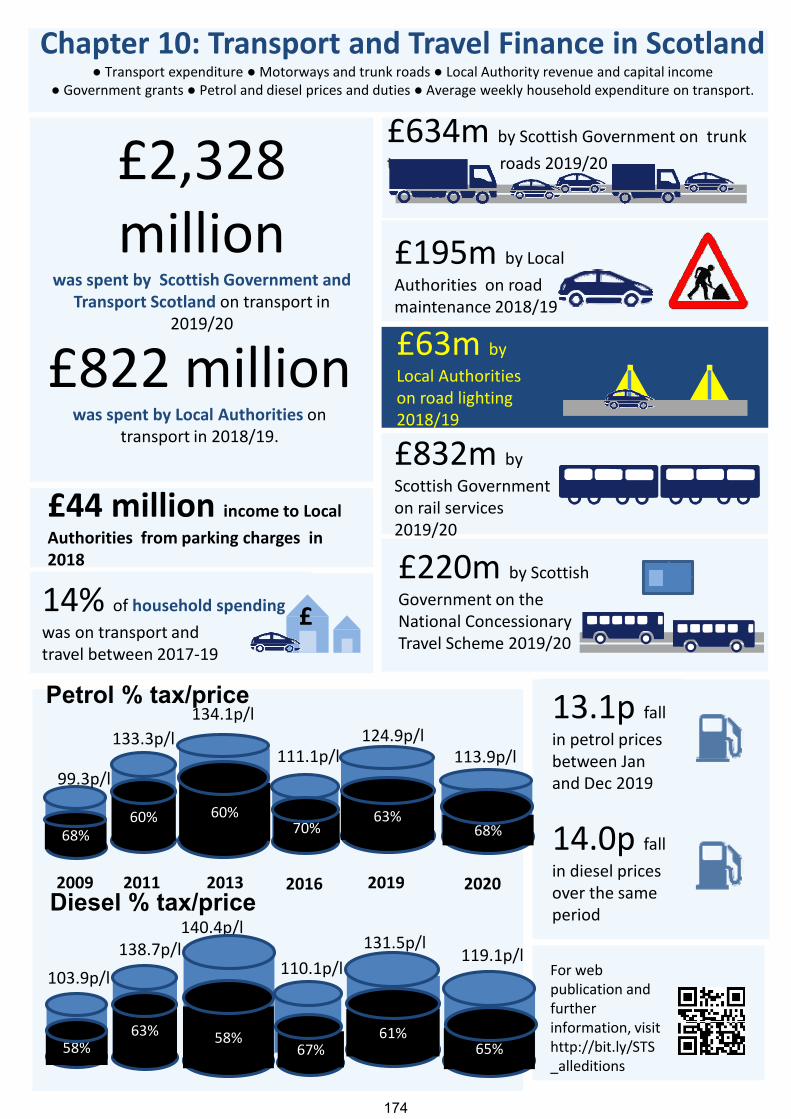
111.1p/l134.1p/l
116.9p/l107.1p/l91.3p/l
60%
134.1p/l
60%
Chapter 10: Transport and Travel Finance in Scotland● Transport expenditure ●Motorways and trunk roads ● Local Authority revenue and capital income
● Government grants ● Petrol and diesel prices and duties ● Average weekly household expenditure on transport.
£2,328 million
was spent by Scottish Government and Transport Scotland on transport in
2019/20
2009 201920162011 2013 2020
£822 millionwas spent by Local Authorities on
transport in 2018/19.
14% of household spending was on transport and travel between 2017‐19
13.1p fall
in petrol prices between Jan and Dec 2019
14.0p fall
in diesel prices over the same period
£634m by Scottish Government on trunk
trunm roads 2019/20
£195m by Local
Authorities on road maintenance 2018/19
£63m by
Local Authorities on road lighting 2018/19
£832m by
Scottish Government on rail services 2019/20
£220m by Scottish
Government on the National Concessionary Travel Scheme 2019/20
£
£44 million income to Local Authorities from parking charges in 2018
Petrol % tax/price
131.5p/l
110.1p/l
140.4p/l138.7p/l
103.9p/l
61%58%67%
63%58%
Diesel % tax/price
For web publication and further information, visithttp://bit.ly/STS_alleditions
119.1p/l
63%70%
60%68%
60%
124.9p/l111.1p/l
134.1p/l
133.3p/l
99.3p/l113.9p/l
68%
65%
174
FINANCE 1. Introduction 1.1 This chapter provides information on finance, such as expenditure on transport within Scottish Ministers’ responsibility and on transport controlled by Local Authorities. It shows capital and current expenditure on motorways and trunk roads, Local Authority revenue and capital income and expenditure on roads and transport, government grants for the construction and improvement of harbour facilities, petrol and diesel prices and duties, and average weekly household expenditure on transport. 1.2 Almost all the figures in this chapter are expressed in what are referred to as current, out-turn or cash prices: no table gives constant price (i.e. deflated) figures. Key points
Scottish Government (including Transport Scotland) spent £2,328 million on transport in 2019/20. Local Authorities spent £822 million in 2018/19.
Personal spend on transport and travel accounted for 14% of household spending between 2017 and 2019.
In 2020 petrol prices started at 127.1 pence per litre in January before falling to 114.1 pence in December. Diesel prices also fell in 2020 from 132.6 in January to 118.7 pence by December.
2. Main Points Motorways & Trunk Roads 2.1 The total of capital and current expenditure on motorways and trunk roads in 2019-20 was estimated at £634 million, £54 million (9%) more than the 2018/19 figure, with less expenditure on the Forth Replacement Crossing. Total expenditure on transport within Scottish Ministers' responsibility in 2019-20 was budgeted at £2,328 million, £232 million (11%) more than in the previous year. (Table 10.1) 2.2 Expenditure on the management and maintenance of the trunk road network totalled £226m in 2018-19. The expenditure is split £22.6 on capitalised maintenance and £203.8m on routine and winter maintenance, network management and network strengthening. (These figures do not include spending on new construction). (Table 10.2) Local Authorities 2.3 In 2018-19, net revenue expenditure on transport controlled by local authorities was £379 million. In cash terms, this was 12 per cent less than in 2017-18. Road maintenance (£195 million in 2018-19) accounted for 51% of the expenditure. The other main categories of expenditure in 2018-19 were:
contributions to passenger transport (excluding concessionary fares) - £109 million; road lighting - £63 million; network and traffic management (excluding school crossing patrols) - £33 million; In 2018-19, the net income from parking charges was £44 million, 7% more than
2017-18. (Table 10.1)
175
FINANCE
2.4 The Local Authorities with the highest net revenue expenditure on roads and transport (excluding loan charges) in 2018-19 were: Highland, (£33.5 million), Fife (£28.4 million), North Lanarkshire (£25.1 million), and South Lanarkshire (£23.6 million). (Table 10.3) The table also shows local authorities’ figures for other types of expenditure in 2018/19:
Road maintenance/Winter maintenance Highland had the highest expenditure on road maintenance (£19.2 million), followed by Fife (£14.3 million). Highland spent the most on winter maintenance (£8.1 million).
Contributions to Public Transport in terms of the total net revenue expenditure on
‘local authority’ and ‘non LA’ public transport, Shetland Islands (£12.9 million) made the largest contributions to passenger transport. Fife spent £9.7 million.
Road Lighting Glasgow spent most on road lighting (£10 million), followed by North
Lanarkshire (£4.8 million).
Parking Edinburgh had the largest net income from parking (£24.1 million) followed by Glasgow at £12.8 million.
Gross Capital Expenditure 2.5 Gross capital account expenditure by councils and boards on local authority roads and transport totalled £462 million in 2018-19, 15% more than the previous year. Of this total £309 million was spent on roads and £79 million on other public transport. (Table 10.4) 2.6 The local authorities with the highest gross capital account expenditure on roads and transport in 2018-19 were: Aberdeenshire (£39.2 million) and Highland (£33.6 million). Highland spent the most on roads (£25.9 million) followed by South Lanarkshire (£25.1 million). (Table 10.5) 2.7 The National Concessionary Travel (NCT) bus scheme was introduced in April 2006 and is administered by Transport Scotland for Scotland as a whole. Previously local authorities administered their own schemes, therefore local expenditure on concessionary travel (and therefore overall totals of spend) shown in Table 10.3 will be greatly reduced from previous years, now only covering rail, subway, ferry and some taxi schemes. Further statistics on concessionary travel can be found in table 11.29. Travel Costs 2.8 Between 2019 and 2020 the average price of unleaded petrol decreased by 10.9 pence, and diesel decreased by 12.3 pence per litre in Great Britain. In 2020, petrol prices decreased by 13.1 pence between January and December and diesel prices decreased by 14.0 pence over the same period. Tax (duty plus VAT) represented 68% of the price for unleaded petrol and 65% of the price for diesel in Great Britain in 2020, the same rates as they were in 2009. (Table 10.6) 2.9 The UK Retail Prices Index (RPI) rose by 31% between 2010 and 2020. Most of the Transport components of the RPI increased more rapidly than this, and therefore rose in real terms. In cash terms, the costs of the maintenance of motor vehicles increased by 31%, and there was a 113% rise in the cost of vehicle tax and insurance. However, the cost of purchasing a motor vehicle fell by 2.8% and the cost of petrol and oil fell by 1.4% in cash terms over the last ten years. As a result, motoring expenditure index fell by 9%, lower than the 31% increase in the RPI and therefore a real term fall between 2010 and 2020. Over the
176
FINANCE
same period, fares and other travel costs rose by 47% in cash terms - rail fares by 39% and bus and coach fares by 65%, increases of 8% and 34% above general inflation. (Table 10.7) 2.10 Average weekly household expenditure in Scotland on transport and vehicles in 2017-19 was £72.80, representing 14.3% of total household expenditure. On average, £24.00 was spent on the purchase of vehicles, £28.80 on the operation of personal transport (including £19.50 on petrol, diesel and other motor oils) and £19.90 on transport services (such as bus and train fares). (Table 10.8)
177
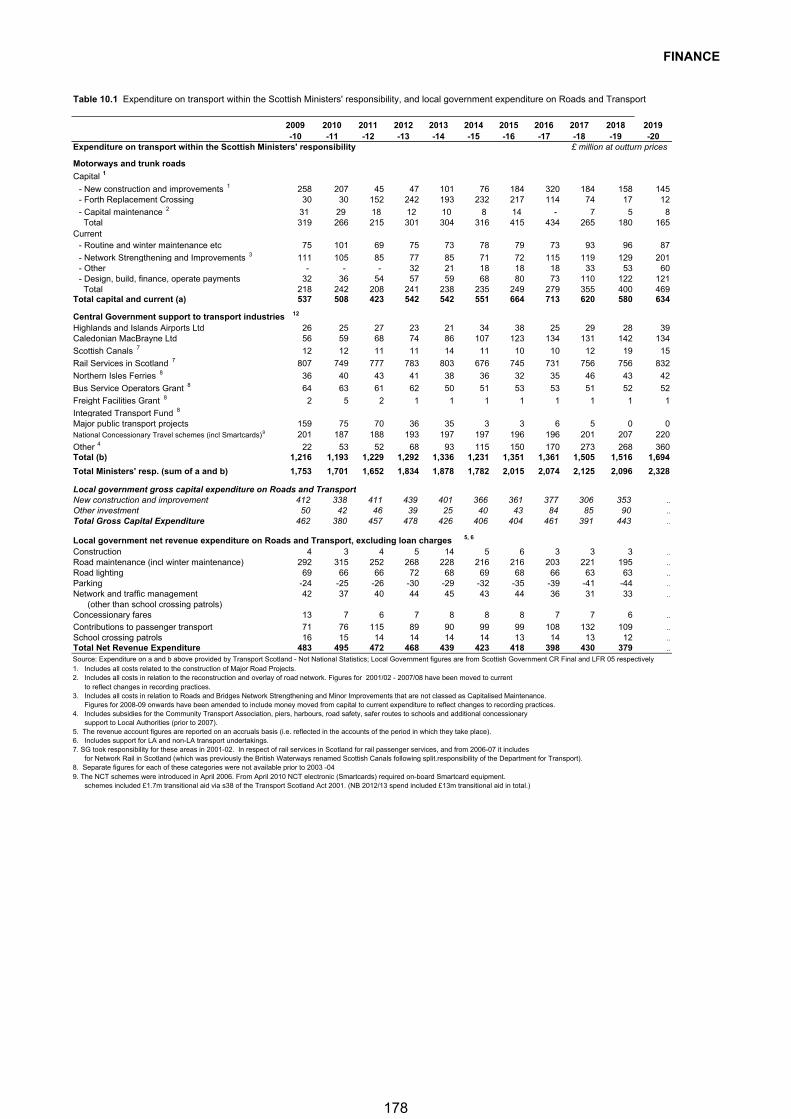
FINANCE
Table 10.1 Expenditure on transport within the Scottish Ministers' responsibility, and local government expenditure on Roads and Transport
2009 2010 2011 2012 2013 2014 2015 2016 2017 2018 2019-10 -11 -12 -13 -14 -15 -16 -17 -18 -19 -20
Expenditure on transport within the Scottish Ministers' responsibility £ million at outturn prices
Motorways and trunk roads
Capital 1
- New construction and improvements 1 258 207 45 47 101 76 184 320 184 158 145- Forth Replacement Crossing 30 30 152 242 193 232 217 114 74 17 12
- Capital maintenance 2 31 29 18 12 10 8 14 - 7 5 8 Total 319 266 215 301 304 316 415 434 265 180 165
Current - Routine and winter maintenance etc 75 101 69 75 73 78 79 73 93 96 87
- Network Strengthening and Improvements 3 111 105 85 77 85 71 72 115 119 129 201- Other - - - 32 21 18 18 18 33 53 60- Design, build, finance, operate payments 32 36 54 57 59 68 80 73 110 122 121 Total 218 242 208 241 238 235 249 279 355 400 469
Total capital and current (a) 537 508 423 542 542 551 664 713 620 580 634
Central Government support to transport industries 12
Highlands and Islands Airports Ltd 26 25 27 23 21 34 38 25 29 28 39Caledonian MacBrayne Ltd 56 59 68 74 86 107 123 134 131 142 134
Scottish Canals 7 12 12 11 11 14 11 10 10 12 19 15
Rail Services in Scotland 7 807 749 777 783 803 676 745 731 756 756 832
Northern Isles Ferries 8 36 40 43 41 38 36 32 35 46 43 42
Bus Service Operators Grant 8 64 63 61 62 50 51 53 53 51 52 52
Freight Facilities Grant 8 2 5 2 1 1 1 1 1 1 1 1
Integrated Transport Fund 8
Major public transport projects 159 75 70 36 35 3 3 6 5 0 0National Concessionary Travel schemes (incl Smartcards) 9 201 187 188 193 197 197 196 196 201 207 220
Other 4 22 53 52 68 93 115 150 170 273 268 360Total (b) 1,216 1,193 1,229 1,292 1,336 1,231 1,351 1,361 1,505 1,516 1,694
Total Ministers' resp. (sum of a and b) 1,753 1,701 1,652 1,834 1,878 1,782 2,015 2,074 2,125 2,096 2,328
Local government gross capital expenditure on Roads and Transport New construction and improvement 412 338 411 439 401 366 361 377 306 353 ..
Other investment 50 42 46 39 25 40 43 84 85 90 ..
Total Gross Capital Expenditure 462 380 457 478 426 406 404 461 391 443 ..
Local government net revenue expenditure on Roads and Transport, excluding loan charges 5, 6
Construction 4 3 4 5 14 5 6 3 3 3 ..
Road maintenance (incl winter maintenance) 292 315 252 268 228 216 216 203 221 195 ..
Road lighting 69 66 66 72 68 69 68 66 63 63 ..
Parking -24 -25 -26 -30 -29 -32 -35 -39 -41 -44 ..
Network and traffic management 42 37 40 44 45 43 44 36 31 33 ..
(other than school crossing patrols)Concessionary fares 13 7 6 7 8 8 8 7 7 6 ..
Contributions to passenger transport 71 76 115 89 90 99 99 108 132 109 ..
School crossing patrols 16 15 14 14 14 14 13 14 13 12 ..
Total Net Revenue Expenditure 483 495 472 468 439 423 418 398 430 379 ..
Source: Expenditure on a and b above provided by Transport Scotland - Not National Statistics; Local Government figures are from Scottish Government CR Final and LFR 05 respectively1. Includes all costs related to the construction of Major Road Projects.
to reflect changes in recording practices.3. Includes all costs in relation to Roads and Bridges Network Strengthening and Minor Improvements that are not classed as Capitalised Maintenance. Figures for 2008-09 onwards have been amended to include money moved from capital to current expenditure to reflect changes to recording practices.
support to Local Authorities (prior to 2007).5. The revenue account figures are reported on an accruals basis (i.e. reflected in the accounts of the period in which they take place).6. Includes support for LA and non-LA transport undertakings.
for Network Rail in Scotland (which was previously the British Waterways renamed Scottish Canals following split.responsibility of the Department for Transport). 8. Separate figures for each of these categories were not available prior to 2003 -04
schemes included £1.7m transitional aid via s38 of the Transport Scotland Act 2001. (NB 2012/13 spend included £13m transitional aid in total.)9. The NCT schemes were introduced in April 2006. From April 2010 NCT electronic (Smartcards) required on-board Smartcard equipment.
7. SG took responsibility for these areas in 2001-02. In respect of rail services in Scotland for rail passenger services, and from 2006-07 it includes
2. Includes all costs in relation to the reconstruction and overlay of road network. Figures for 2001/02 - 2007/08 have been moved to current
4. Includes subsidies for the Community Transport Association, piers, harbours, road safety, safer routes to schools and additional concessionary
178
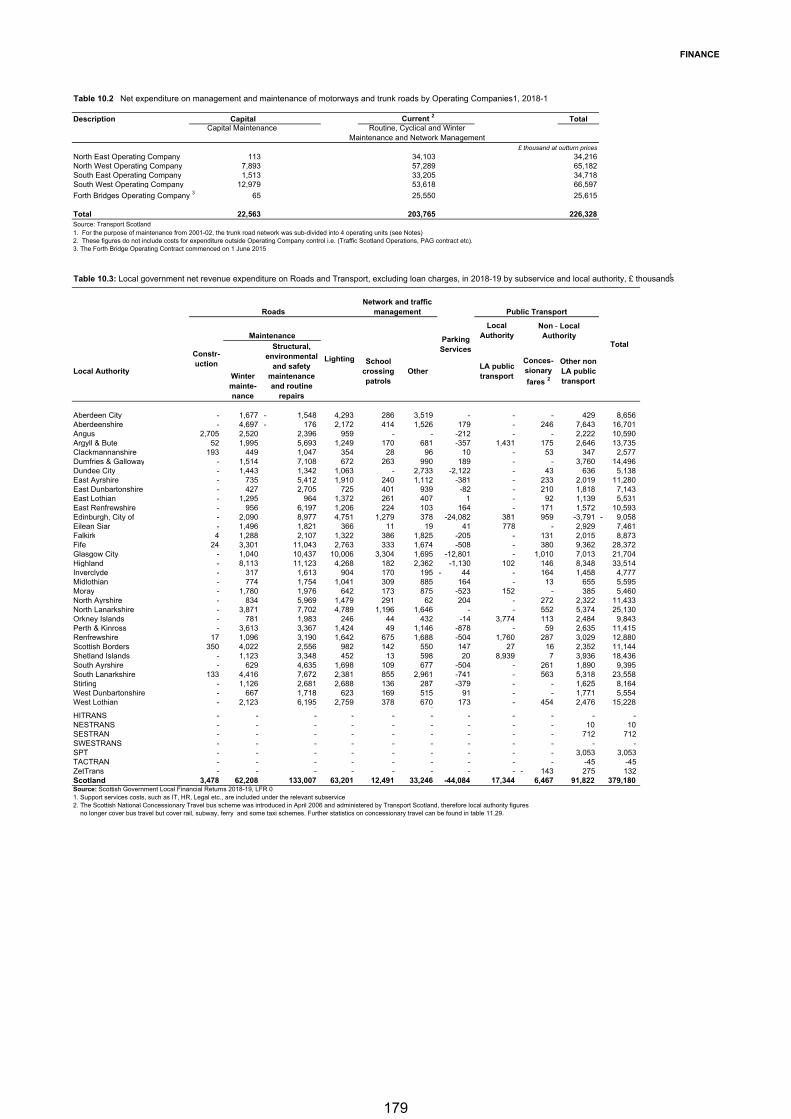
FINANCE
Table 10.2 Net expenditure on management and maintenance of motorways and trunk roads by Operating Companies1, 2018-1
Description Capital Current 2 TotalCapital Maintenance Routine, Cyclical and Winter
Maintenance and Network Management £ thousand at outturn prices
North East Operating Company 113 34,103 34,216North West Operating Company 7,893 57,289 65,182South East Operating Company 1,513 33,205 34,718South West Operating Company 12,979 53,618 66,597
Forth Bridges Operating Company 3 65 25,550 25,615
Total 22,563 203,765 226,328Source: Transport Scotland1. For the purpose of maintenance from 2001-02, the trunk road network was sub-divided into 4 operating units (see Notes)2. These figures do not include costs for expenditure outside Operating Company control i.e. (Traffic Scotland Operations, PAG contract etc).3. The Forth Bridge Operating Contract commenced on 1 June 2015
Table 10.3: Local government net revenue expenditure on Roads and Transport, excluding loan charges, in 2018-19 by subservice and local authority, £ thousands 1
Local Authority
Local AuthorityWinter mainte-nance
Structural, environmental
and safety maintenance and routine
repairs
School crossing patrols
OtherLA public transport
Conces-sionary
fares 2
Other non LA public transport
Aberdeen City - 1,677 1,548- 4,293 286 3,519 - - - 429 8,656 Aberdeenshire - 4,697 176- 2,172 414 1,526 179 - 246 7,643 16,701 Angus 2,705 2,520 2,396 959 - - -212 - - 2,222 10,590 Argyll & Bute 52 1,995 5,693 1,249 170 681 -357 1,431 175 2,646 13,735 Clackmannanshire 193 449 1,047 354 28 96 10 - 53 347 2,577 Dumfries & Galloway - 1,514 7,108 672 263 990 189 - - 3,760 14,496 Dundee City - 1,443 1,342 1,063 - 2,733 -2,122 - 43 636 5,138 East Ayrshire - 735 5,412 1,910 240 1,112 -381 - 233 2,019 11,280 East Dunbartonshire - 427 2,705 725 401 939 -82 - 210 1,818 7,143 East Lothian - 1,295 964 1,372 261 407 1 - 92 1,139 5,531 East Renfrewshire - 956 6,197 1,206 224 103 164 - 171 1,572 10,593 Edinburgh, City of - 2,090 8,977 4,751 1,279 378 -24,082 381 959 -3,791 9,058- Eilean Siar - 1,496 1,821 366 11 19 41 778 - 2,929 7,461 Falkirk 4 1,288 2,107 1,322 386 1,825 -205 - 131 2,015 8,873 Fife 24 3,301 11,043 2,763 333 1,674 -508 - 380 9,362 28,372 Glasgow City - 1,040 10,437 10,006 3,304 1,695 -12,801 - 1,010 7,013 21,704 Highland - 8,113 11,123 4,268 182 2,362 -1,130 102 146 8,348 33,514 Inverclyde - 317 1,613 904 170 195 44- - 164 1,458 4,777 Midlothian - 774 1,754 1,041 309 885 164 - 13 655 5,595 Moray - 1,780 1,976 642 173 875 -523 152 - 385 5,460 North Ayrshire - 834 5,969 1,479 291 62 204 - 272 2,322 11,433 North Lanarkshire - 3,871 7,702 4,789 1,196 1,646 - - 552 5,374 25,130 Orkney Islands - 781 1,983 246 44 432 -14 3,774 113 2,484 9,843 Perth & Kinross - 3,613 3,367 1,424 49 1,146 -878 - 59 2,635 11,415 Renfrewshire 17 1,096 3,190 1,642 675 1,688 -504 1,760 287 3,029 12,880 Scottish Borders 350 4,022 2,556 982 142 550 147 27 16 2,352 11,144 Shetland Islands - 1,123 3,348 452 13 598 20 8,939 7 3,936 18,436 South Ayrshire - 629 4,635 1,698 109 677 -504 - 261 1,890 9,395 South Lanarkshire 133 4,416 7,672 2,381 855 2,961 -741 - 563 5,318 23,558 Stirling - 1,126 2,681 2,688 136 287 -379 - - 1,625 8,164 West Dunbartonshire - 667 1,718 623 169 515 91 - - 1,771 5,554 West Lothian - 2,123 6,195 2,759 378 670 173 - 454 2,476 15,228 - - HITRANS - - - - - - - - - - - NESTRANS - - - - - - - - - 10 10 SESTRAN - - - - - - - - - 712 712SWESTRANS - - - - - - - - - - - SPT - - - - - - - - - 3,053 3,053TACTRAN - - - - - - - - - -45 -45 ZetTrans - - - - - - - - 143- 275 132Scotland 3,478 62,208 133,007 63,201 12,491 33,246 -44,084 17,344 6,467 91,822 379,180Source: Scottish Government Local Financial Returns 2018-19, LFR 01. Support services costs, such as IT, HR, Legal etc., are included under the relevant subservice2. The Scottish National Concessionary Travel bus scheme was introduced in April 2006 and administered by Transport Scotland, therefore local authority figures no longer cover bus travel but cover rail, subway, ferry and some taxi schemes. Further statistics on concessionary travel can be found in table 11.29.
Total
Non - Local Authority
RoadsNetwork and traffic
management Public Transport
Maintenance
Constr-uction
Lighting
Parking Services
179
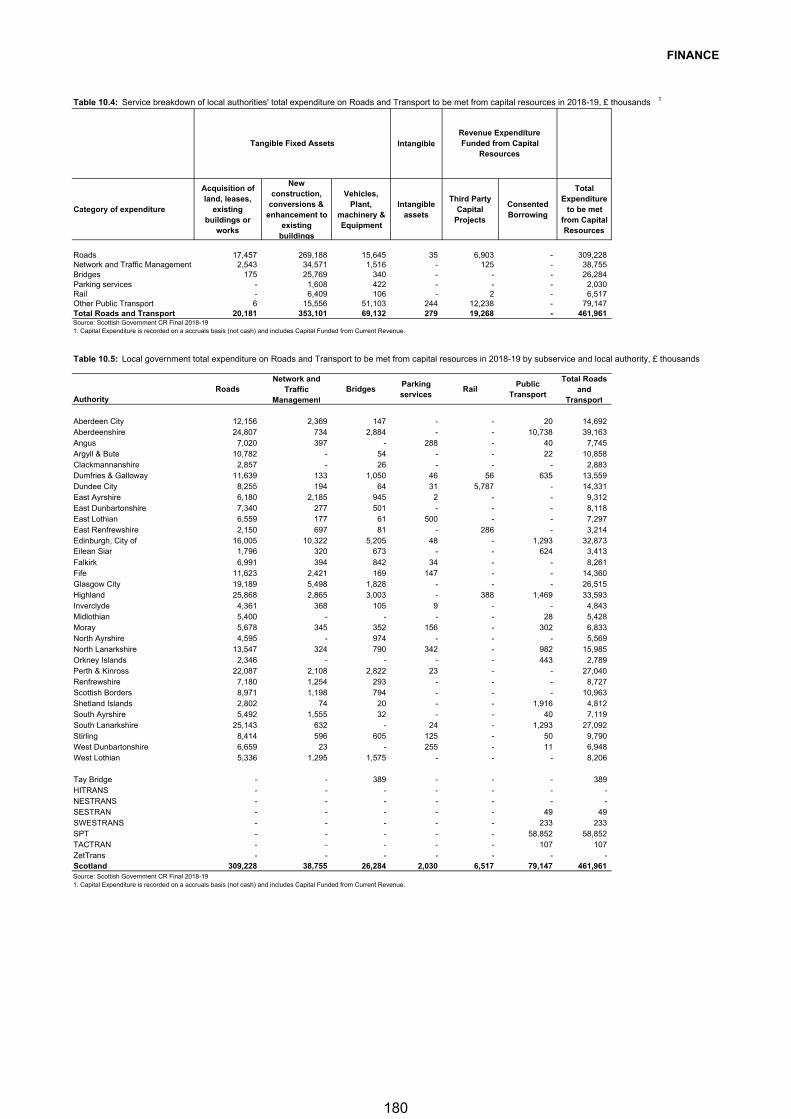
FINANCE
Table 10.4: Service breakdown of local authorities' total expenditure on Roads and Transport to be met from capital resources in 2018-19, £ thousands 1
Intangible
Category of expenditure
Acquisition of land, leases,
existing buildings or
works
New construction,
conversions & enhancement to
existing buildings
Vehicles, Plant,
machinery & Equipment
Intangible assets
Third Party Capital
Projects
Consented Borrowing
Total Expenditure
to be met from Capital Resources
Roads 17,457 269,188 15,645 35 6,903 - 309,228Network and Traffic Management 2,543 34,571 1,516 - 125 - 38,755Bridges 175 25,769 340 - - - 26,284Parking services - 1,608 422 - - - 2,030Rail - 6,409 106 - 2 - 6,517Other Public Transport 6 15,556 51,103 244 12,238 - 79,147Total Roads and Transport 20,181 353,101 69,132 279 19,268 - 461,961Source: Scottish Government CR Final 2018-191. Capital Expenditure is recorded on a accruals basis (not cash) and includes Capital Funded from Current Revenue.
Table 10.5: Local government total expenditure on Roads and Transport to be met from capital resources in 2018-19 by subservice and local authority, £ thousands
AuthorityRoads
Network and Traffic
ManagementBridges
Parking services
RailPublic
Transport
Total Roads and
Transport
Aberdeen City 12,156 2,369 147 - - 20 14,692Aberdeenshire 24,807 734 2,884 - - 10,738 39,163Angus 7,020 397 - 288 - 40 7,745Argyll & Bute 10,782 - 54 - - 22 10,858Clackmannanshire 2,857 - 26 - - - 2,883Dumfries & Galloway 11,639 133 1,050 46 56 635 13,559Dundee City 8,255 194 64 31 5,787 - 14,331East Ayrshire 6,180 2,185 945 2 - - 9,312East Dunbartonshire 7,340 277 501 - - - 8,118East Lothian 6,559 177 61 500 - - 7,297East Renfrewshire 2,150 697 81 - 286 - 3,214Edinburgh, City of 16,005 10,322 5,205 48 - 1,293 32,873Eilean Siar 1,796 320 673 - - 624 3,413
Falkirk 6,991 394 842 34 - - 8,261Fife 11,623 2,421 169 147 - - 14,360Glasgow City 19,189 5,498 1,828 - - - 26,515Highland 25,868 2,865 3,003 - 388 1,469 33,593Inverclyde 4,361 368 105 9 - - 4,843Midlothian 5,400 - - - - 28 5,428Moray 5,678 345 352 156 - 302 6,833North Ayrshire 4,595 - 974 - - - 5,569North Lanarkshire 13,547 324 790 342 - 982 15,985Orkney Islands 2,346 - - - - 443 2,789Perth & Kinross 22,087 2,108 2,822 23 - - 27,040Renfrewshire 7,180 1,254 293 - - - 8,727Scottish Borders 8,971 1,198 794 - - - 10,963Shetland Islands 2,802 74 20 - - 1,916 4,812South Ayrshire 5,492 1,555 32 - - 40 7,119South Lanarkshire 25,143 632 - 24 - 1,293 27,092Stirling 8,414 596 605 125 - 50 9,790West Dunbartonshire 6,659 23 - 255 - 11 6,948West Lothian 5,336 1,295 1,575 - - - 8,206
Tay Bridge - - 389 - - - 389HITRANS - - - - - - - NESTRANS - - - - - - - SESTRAN - - - - - 49 49SWESTRANS - - - - - 233 233SPT - - - - - 58,852 58,852TACTRAN - - - - - 107 107ZetTrans - - - - - - - Scotland 309,228 38,755 26,284 2,030 6,517 79,147 461,961Source: Scottish Government CR Final 2018-191. Capital Expenditure is recorded on a accruals basis (not cash) and includes Capital Funded from Current Revenue.
Tangible Fixed AssetsRevenue Expenditure Funded from Capital
Resources
180
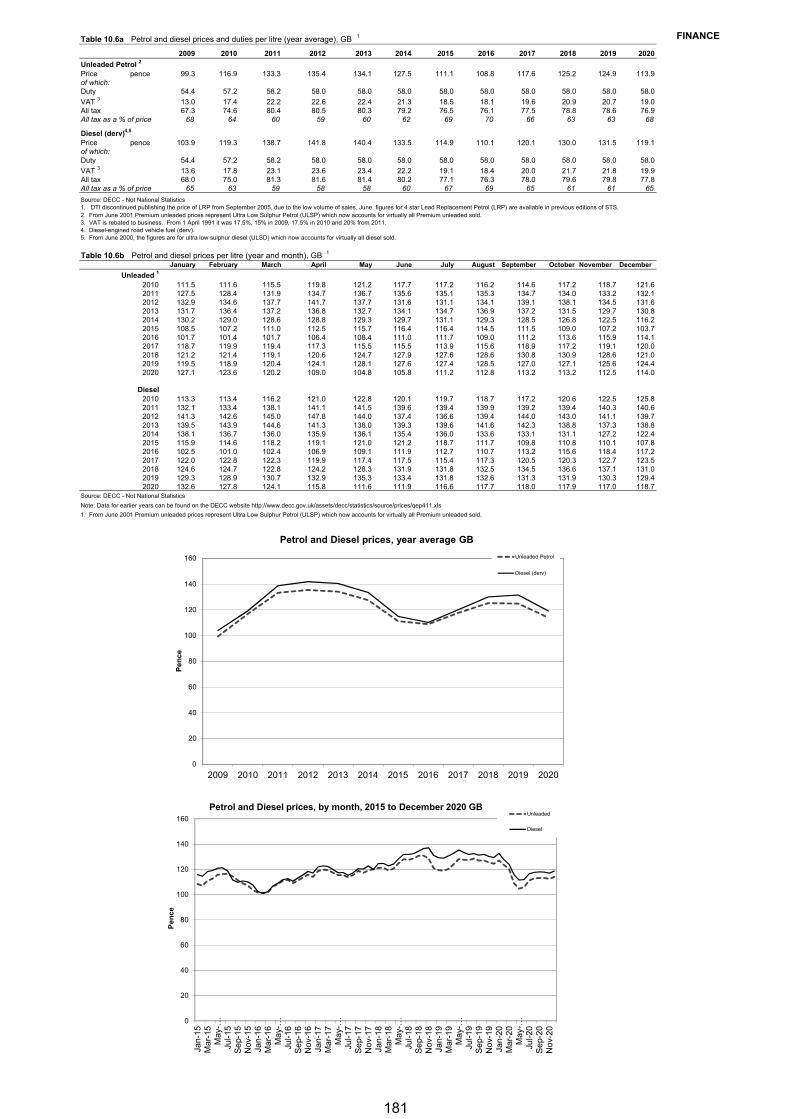
FINANCETable 10.6a Petrol and diesel prices and duties per litre (year average), GB 1
2009 2010 2011 2012 2013 2014 2015 2016 2017 2018 2019 2020
Unleaded Petrol 2
Price pence 99.3 116.9 133.3 135.4 134.1 127.5 111.1 108.8 117.6 125.2 124.9 113.9of which:Duty 54.4 57.2 58.2 58.0 58.0 58.0 58.0 58.0 58.0 58.0 58.0 58.0
VAT 3 13.0 17.4 22.2 22.6 22.4 21.3 18.5 18.1 19.6 20.9 20.7 19.0All tax 67.3 74.6 80.4 80.5 80.3 79.2 76.5 76.1 77.5 78.8 78.6 76.9All tax as a % of price 68 64 60 59 60 62 69 70 66 63 63 68
Diesel (derv)4,5
Price pence 103.9 119.3 138.7 141.8 140.4 133.5 114.9 110.1 120.1 130.0 131.5 119.1of which:Duty 54.4 57.2 58.2 58.0 58.0 58.0 58.0 58.0 58.0 58.0 58.0 58.0
VAT 3 13.6 17.8 23.1 23.6 23.4 22.2 19.1 18.4 20.0 21.7 21.8 19.9All tax 68.0 75.0 81.3 81.6 81.4 80.2 77.1 76.3 78.0 79.6 79.8 77.8All tax as a % of price 65 63 59 58 58 60 67 69 65 61 61 65
Source: DECC - Not National Statistics1. DTI discontinued publishing the price of LRP from September 2005, due to the low volume of sales. June figures for 4 star Lead Replacement Petrol (LRP) are available in previous editions of STS.2. From June 2001 Premium unleaded prices represent Ultra Low Sulphur Petrol (ULSP) which now accounts for virtually all Premium unleaded sold.3. VAT is rebated to business. From 1 April 1991 it was 17.5%, 15% in 2009, 17.5% in 2010 and 20% from 2011.4. Diesel-engined road vehicle fuel (derv).5. From June 2000, the figures are for ultra low sulphur diesel (ULSD) which now accounts for virtually all diesel sold.
Table 10.6b Petrol and diesel prices per litre (year and month), GB 1
January February March April May June July August September October November December
Unleaded 1
2010 111.5 111.6 115.5 119.8 121.2 117.7 117.2 116.2 114.6 117.2 118.7 121.62011 127.5 128.4 131.9 134.7 136.7 135.6 135.1 135.3 134.7 134.0 133.2 132.12012 132.9 134.6 137.7 141.7 137.7 131.6 131.1 134.1 139.1 138.1 134.5 131.62013 131.7 136.4 137.2 136.8 132.7 134.1 134.7 136.9 137.2 131.5 129.7 130.82014 130.2 129.0 128.6 128.8 129.3 129.7 131.1 129.3 128.5 126.8 122.5 116.22015 108.5 107.2 111.0 112.5 115.7 116.4 116.4 114.5 111.5 109.0 107.2 103.72016 101.7 101.4 101.7 106.4 108.4 111.0 111.7 109.0 111.2 113.6 115.9 114.12017 118.7 119.9 119.4 117.3 115.5 115.5 113.9 115.6 118.9 117.2 119.1 120.02018 121.2 121.4 119.1 120.6 124.7 127.9 127.6 128.6 130.8 130.9 128.6 121.02019 119.5 118.9 120.4 124.1 128.1 127.6 127.4 128.5 127.0 127.1 125.6 124.42020 127.1 123.6 120.2 109.0 104.8 105.8 111.2 112.8 113.2 113.2 112.5 114.0
Diesel2010 113.3 113.4 116.2 121.0 122.8 120.1 119.7 118.7 117.2 120.6 122.5 125.82011 132.1 133.4 138.1 141.1 141.5 139.6 139.4 139.9 139.2 139.4 140.3 140.62012 141.3 142.6 145.0 147.8 144.0 137.4 136.6 139.4 144.0 143.0 141.1 139.72013 139.5 143.9 144.6 141.3 138.0 139.3 139.6 141.6 142.3 138.8 137.3 138.82014 138.1 136.7 136.0 135.9 136.1 135.4 136.0 133.6 133.1 131.1 127.2 122.42015 115.9 114.6 118.2 119.1 121.0 121.2 118.7 111.7 109.8 110.8 110.1 107.82016 102.5 101.0 102.4 106.9 109.1 111.9 112.7 110.7 113.2 115.6 118.4 117.22017 122.0 122.8 122.3 119.9 117.4 117.5 115.4 117.3 120.5 120.3 122.7 123.52018 124.6 124.7 122.8 124.2 128.3 131.9 131.8 132.5 134.5 136.6 137.1 131.02019 129.3 128.9 130.7 132.9 135.3 133.4 131.8 132.6 131.3 131.9 130.3 129.42020 132.6 127.8 124.1 115.8 111.6 111.9 116.6 117.7 118.0 117.9 117.0 118.7
Source: DECC - Not National Statistics
Note: Data for earlier years can be found on the DECC website http://www.decc.gov.uk/assets/decc/statistics/source/prices/qep411.xls
1. From June 2001 Premium unleaded prices represent Ultra Low Sulphur Petrol (ULSP) which now accounts for virtually all Premium unleaded sold.
0
20
40
60
80
100
120
140
160
2009 2010 2011 2012 2013 2014 2015 2016 2017 2018 2019 2020
Pe
nc
e
Petrol and Diesel prices, year average GB
Unleaded Petrol
Diesel (derv)
0
20
40
60
80
100
120
140
160
Jan-
15M
ar-1
5M
ay-…
Jul-1
5S
ep-1
5N
ov-1
5Ja
n-16
Mar
-16
May
-…Ju
l-16
Sep
-16
Nov
-16
Jan-
17M
ar-1
7M
ay-…
Jul-1
7S
ep-1
7N
ov-1
7Ja
n-18
Mar
-18
May
-…Ju
l-18
Sep
-18
Nov
-18
Jan-
19M
ar-1
9M
ay-…
Jul-1
9S
ep-1
9N
ov-1
9Ja
n-20
Mar
-20
May
-…Ju
l-20
Sep
-20
Nov
-20
Pe
nc
e
Petrol and Diesel prices, by month, 2015 to December 2020 GBUnleaded
Diesel
181
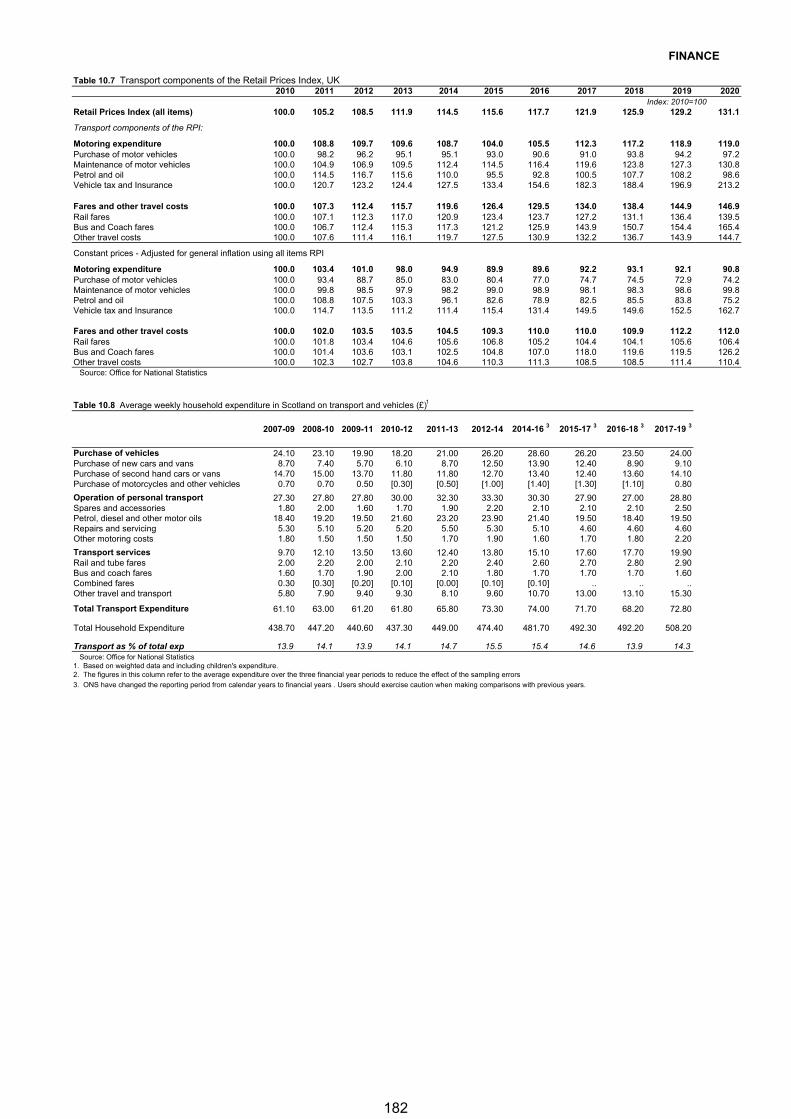
FINANCE
Table 10.7 Transport components of the Retail Prices Index, UK2010 2011 2012 2013 2014 2015 2016 2017 2018 2019 2020
Index: 2010=100Retail Prices Index (all items) 100.0 105.2 108.5 111.9 114.5 115.6 117.7 121.9 125.9 129.2 131.1
Transport components of the RPI:
Motoring expenditure 100.0 108.8 109.7 109.6 108.7 104.0 105.5 112.3 117.2 118.9 119.0Purchase of motor vehicles 100.0 98.2 96.2 95.1 95.1 93.0 90.6 91.0 93.8 94.2 97.2Maintenance of motor vehicles 100.0 104.9 106.9 109.5 112.4 114.5 116.4 119.6 123.8 127.3 130.8Petrol and oil 100.0 114.5 116.7 115.6 110.0 95.5 92.8 100.5 107.7 108.2 98.6Vehicle tax and Insurance 100.0 120.7 123.2 124.4 127.5 133.4 154.6 182.3 188.4 196.9 213.2
Fares and other travel costs 100.0 107.3 112.4 115.7 119.6 126.4 129.5 134.0 138.4 144.9 146.9Rail fares 100.0 107.1 112.3 117.0 120.9 123.4 123.7 127.2 131.1 136.4 139.5Bus and Coach fares 100.0 106.7 112.4 115.3 117.3 121.2 125.9 143.9 150.7 154.4 165.4Other travel costs 100.0 107.6 111.4 116.1 119.7 127.5 130.9 132.2 136.7 143.9 144.7
Constant prices - Adjusted for general inflation using all items RPI
Motoring expenditure 100.0 103.4 101.0 98.0 94.9 89.9 89.6 92.2 93.1 92.1 90.8Purchase of motor vehicles 100.0 93.4 88.7 85.0 83.0 80.4 77.0 74.7 74.5 72.9 74.2Maintenance of motor vehicles 100.0 99.8 98.5 97.9 98.2 99.0 98.9 98.1 98.3 98.6 99.8Petrol and oil 100.0 108.8 107.5 103.3 96.1 82.6 78.9 82.5 85.5 83.8 75.2Vehicle tax and Insurance 100.0 114.7 113.5 111.2 111.4 115.4 131.4 149.5 149.6 152.5 162.7
Fares and other travel costs 100.0 102.0 103.5 103.5 104.5 109.3 110.0 110.0 109.9 112.2 112.0Rail fares 100.0 101.8 103.4 104.6 105.6 106.8 105.2 104.4 104.1 105.6 106.4Bus and Coach fares 100.0 101.4 103.6 103.1 102.5 104.8 107.0 118.0 119.6 119.5 126.2Other travel costs 100.0 102.3 102.7 103.8 104.6 110.3 111.3 108.5 108.5 111.4 110.4
Source: Office for National Statistics
Table 10.8 Average weekly household expenditure in Scotland on transport and vehicles (£)1
2007-09 2008-10 2009-11 2010-12 2011-13 2012-14 2014-16 3 2015-17 3 2016-18 3 2017-19 3
Purchase of vehicles 24.10 23.10 19.90 18.20 21.00 26.20 28.60 26.20 23.50 24.00Purchase of new cars and vans 8.70 7.40 5.70 6.10 8.70 12.50 13.90 12.40 8.90 9.10Purchase of second hand cars or vans 14.70 15.00 13.70 11.80 11.80 12.70 13.40 12.40 13.60 14.10Purchase of motorcycles and other vehicles 0.70 0.70 0.50 [0.30] [0.50] [1.00] [1.40] [1.30] [1.10] 0.80
Operation of personal transport 27.30 27.80 27.80 30.00 32.30 33.30 30.30 27.90 27.00 28.80Spares and accessories 1.80 2.00 1.60 1.70 1.90 2.20 2.10 2.10 2.10 2.50Petrol, diesel and other motor oils 18.40 19.20 19.50 21.60 23.20 23.90 21.40 19.50 18.40 19.50Repairs and servicing 5.30 5.10 5.20 5.20 5.50 5.30 5.10 4.60 4.60 4.60Other motoring costs 1.80 1.50 1.50 1.50 1.70 1.90 1.60 1.70 1.80 2.20
Transport services 9.70 12.10 13.50 13.60 12.40 13.80 15.10 17.60 17.70 19.90Rail and tube fares 2.00 2.20 2.00 2.10 2.20 2.40 2.60 2.70 2.80 2.90Bus and coach fares 1.60 1.70 1.90 2.00 2.10 1.80 1.70 1.70 1.70 1.60Combined fares 0.30 [0.30] [0.20] [0.10] [0.00] [0.10] [0.10] .. .. ..Other travel and transport 5.80 7.90 9.40 9.30 8.10 9.60 10.70 13.00 13.10 15.30
Total Transport Expenditure 61.10 63.00 61.20 61.80 65.80 73.30 74.00 71.70 68.20 72.80
Total Household Expenditure 438.70 447.20 440.60 437.30 449.00 474.40 481.70 492.30 492.20 508.20
Transport as % of total exp 13.9 14.1 13.9 14.1 14.7 15.5 15.4 14.6 13.9 14.3Source: Office for National Statistics
1. Based on weighted data and including children's expenditure.2. The figures in this column refer to the average expenditure over the three financial year periods to reduce the effect of the sampling errors
3. ONS have changed the reporting period from calendar years to financial years . Users should exercise caution when making comparisons with previous years.
182

183
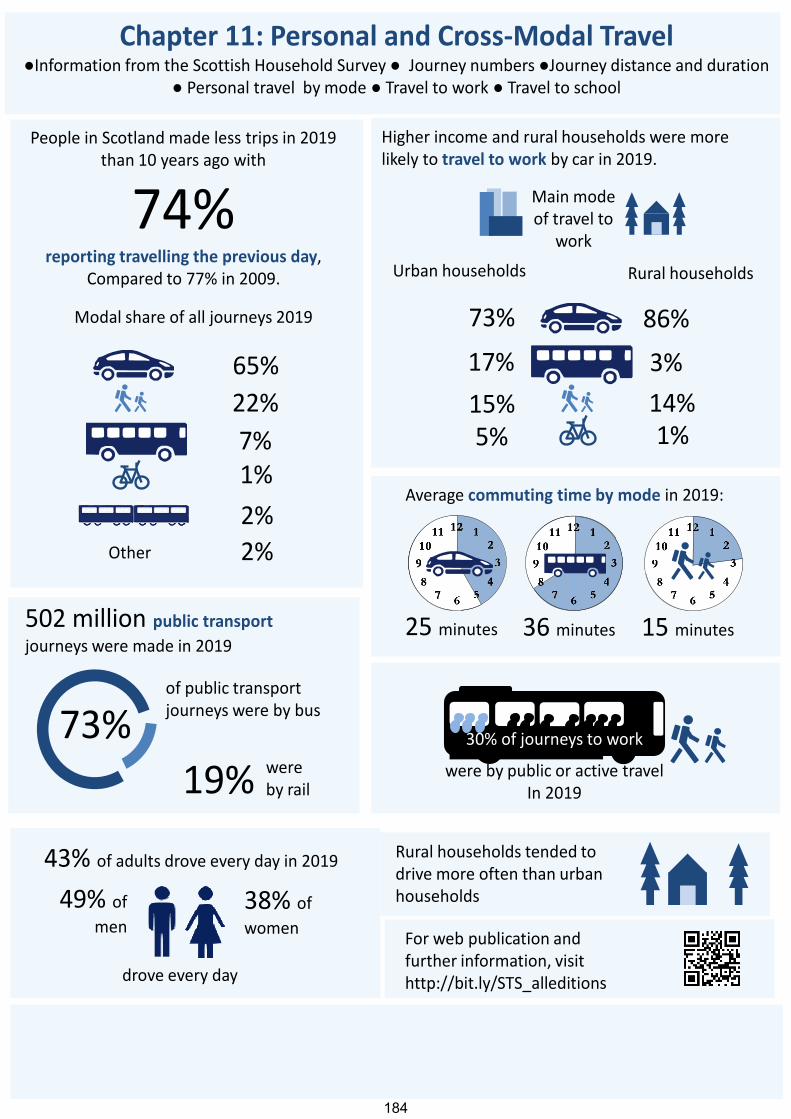
Personal and Cross-Modal Travel
Rural households tended to drive more often than urban households
30% of journeys to work
were by public or active travelIn 2019
73%
19%
502 million public transport journeys were made in 2019
49% of men
38% of women
drove every day
Chapter 11: Personal and Cross-Modal Travel●Information from the Scottish Household Survey ● Journey numbers ●Journey distance and duration
● Personal travel by mode ● Travel to work ● Travel to school
People in Scotland made less trips in 2019 than 10 years ago with
74%reporting travelling the previous day,
Compared to 77% in 2009.
of public transport journeys were by bus
were by rail
Higher income and rural households were more likely to travel to work by car in 2019.
Urban households Rural households
73%
15%
17%
5%14%
3%
86%
Main mode of travel to
work
25 minutes 36 minutes 15 minutes
Average commuting time by mode in 2019:
43% of adults drove every day in 2019
For web publication and further information, visithttp://bit.ly/STS_alleditions
1%
22%
7%
65%
2%
Modal share of all journeys 2019
2%Other
1%
184
Personal and Cross-Modal Travel
PERSONAL AND CROSS-MODAL TRAVEL 1. Introduction 1.1 This chapter previously included information from the National Travel Survey (NTS). However, Scottish data are no longer collected in the NTS, estimates for Scotland from the NTS are available in previous editions of this publication. This chapter now focuses on estimates derived mainly from the Scottish Household Survey (SHS), findings from others sources are marked as such within the text. 1.2 The SHS is a sample survey and provide person-based cross-modal information, in contrast to most of the earlier chapters, which tend to be based on particular modes of transport. The SHS also includes a travel diary that asks respondents for information about the journeys they made on the previous day, including information on the duration, distance, purpose and mode of travel. More information and further tables covering transport findings from the Scottish Household Survey can be found in Transport and Travel in Scotland: http://bit.ly/2qbgypZ 1.3 In this edition of STS we have also presented relevant information on travel behaviours collected from the 2011 census as previously published by the National Records of Scotland. More information about the sources used can be found in the Sources section on page 225. Key points
74% of people had travelled the previous day when asked in 2019, down from 77% in 2009.
Of the 502 million public transport journeys made in 2019, 73 per cent were by bus, 19 per cent were journeys by rail, air accounts for 6 per cent and ferries 2 per cent.
Thirty per cent of journeys to work and 73 per cent of journeys to school are by public and active travel.
2. Main Points Trips 2.1 People in Scotland made less trips in 2019, with 74% reporting having travelled the previous day, down from 77% in 2009. Men were more likely to have travelled the previous day than women (74% compared to 73%) and older people were less likely to have travelled than younger people. 2.2 As in previous years, the car was the most popular mode of transport for journeys made in 2019, with 53% of journeys made as a car driver. This was the same as the previous year. Twelve per cent of journeys were made as a car passenger. Bus travel accounted for 7% and rail travel for 2%. Just over a fifth of journeys were by walking (22%) and cycling accounted for 1% of all journeys. Under three per cent of journeys were multi-stage, involving a change in mode of transport. 2.3 Twenty five per cent of adults used the bus at least once per week in 2019, with 39% using a bus in the past month. Train use appeared to be less frequent;
185
Personal and Cross-Modal Travel
9% of people had used the train at least once a week and 30% of people had used a train in the last month, in 2019. Distance travelled 2.4 In 2019, most journeys tended to be over short distances, with 17% of all journeys being under 1 km long and a further 24% between 1 and 3 km. The average (median) journey distance in 2019 was 4.3 km. 2.5 The average (median) cycling journey was 2.7 km in length and the median walking journey was 1.0 km in length in 2019. Rail and car journeys tended to be over greater distances, with a median car driver journey of 6.8 km and rail journey of 20.8 km. 2.6 In 2019, both shopping (24%) and commuting (23.0%) were the most frequent journey purposes, followed by visiting friends or relatives (10%). These percentages have stayed fairly stable since 2012. Duration travelled 2.7 In terms of time, most journeys in 2019 were short, with 68% lasting for less than 20 minutes. Only 5% of journeys lasted more than an hour. Car access 2.8 Adults in households with more cars were more likely to have travelled the previous day – 61% of adults living in households with no cars normally available travelled the previous day, compared to 81% of adults with two or more cars. Similarly, 8% of adults in households with no cars made more than four journeys the previous day compared to 20% of those in households with two or more cars. Car driving by adults increased with an increase in car availability. Where no car was normally available, 3% of adults’ journeys were as a driver of a car, compared to 56% where one car was available, and 69% where two or more cars were available. Adults in households with no car made 12% of their journeys as a passenger in a car or van, compared to 14% for those in households with one car, and 11% where two or more cars were available. 2.9 Adults in households with no car access made a far higher proportion of their journeys by public and active travel. Bicycle use was highest for adults in households with no cars available: 3% of journeys as opposed to 1% for those in households with one car and 1% for those with two or more cars. Adults in households with no cars available had a much higher proportion of journeys by foot: 50%, compared to 21% for adults in households with one car and 13% for those with two or more cars. The proportion of trips by bus was also considerably higher for adults in households with no car: 24%, compared to 5% for those in households with one car and 3% for adults with access to two or more cars.
186
Personal and Cross-Modal Travel
Driving 2.10 The Scottish Household Survey (SHS) provides information about how often people aged 17 or over drive. In 2019, 49% of men, 38% of women and 43% of all people aged 17+ said that they drove every day. A further 21% stated they drove at least once a week (but not every day), 2% drove less frequently, 4% had a full driving licence but never drove, and 29% did not have a full driving licence. (Table 11.10) 2.11 Since the recent peak in 2007, the percentage who drove every day has fallen from 45.2 per cent to 43.0 per cent, but over the same period the proportion of those who drove at least once a week has risen by 6 percentage points. (Table 11.12) 2.12 The frequency of driving varied with age. In 2019, over half of people aged 40 to 59 said they drove every day. As age rises this falls (to 14% for people aged 80 and over). The frequency of driving also varied with the annual net income of the household. Around three fifths of people aged 17+ living in households with an annual net income of £50,000 or more said they drove every day, compared with a fifth of those living in households with an annual net income of up to £10,000. Around a third (33%) of people aged 17+ in large urban areas drove every day compared to 47% in ‘remote rural’ areas. (Table 11.10) Walking 2.13 In 2019, 67% of adults made a journey of more than a quarter of a mile by foot to go somewhere in the last seven days – the second highest proportion seen in the last decade. Young adults (aged 16-19) were the most likely to have walked to go somewhere (78%), compared with 74% of those aged 30-39, around two thirds of those in their 40s, 50s and 60s, and two fifths of those aged 80 or above (40%). (Tables 11.11 & 11.13) 2.14 In 2019, 62% of adults said that they had walked for pleasure or to keep fit at least once in the last seven days – the highest in recent times. There was some variation with age: the percentage was highest for those aged 40-49 (70%) and lowest for those aged 80 or above (32%). There was less variation with household income, although those with net annual incomes of over £30,000 were more likely than those with lower incomes. (Tables 11.11 & 11.13) Travel to Work (SHS data) 2.15 SHS travel to work statistics no longer feature in Scotland’s National Indicator: “Increase the proportion of journeys to work made by public or active travel” in their old form. More information on National Indicators can be found on the Scotland Performs website: http://www.gov.scot/About/Performance/scotPerforms/indicator/transport 2.16 The SHS shows that 16% of employed adults worked from home in 2019, an increase from 2009 (11%). Seventy percent of self-employed people worked from home, though this is based on a relatively small sample size and therefore may be subject to larger confidence intervals. (Tables 11.17 & 11.21) 2.17 Overall, the SHS found that the majority (68%) of employed adults who did not work from home travelled to work by car or van (as either the driver or as a passenger) in 2019. This percentage tended to increase with age (16-20: 58%, Over 40: around 74%), type of employment (67% of those who work part-time,
187
Personal and Cross-Modal Travel
compared to 68% for full-time) and annual net household income (rising to 74% of those in the £50,000+ band). (Table 11.18) 2.18 Other usual means of travel to work were: walking (12%); bus (10%); rail (5%); bicycle (3%) and other modes (2%). Use of such modes of transport also varied. For example: in general, the greater the income of the household, the less likely a person was to walk or use the bus to travel to work; the percentage who walked to work was highest in remote small towns (28%) and the percentage who commuted by bus was highest in large urban areas (17%). Since 2009, the percentage travelling to work by car or van (as driver or passenger) has remained around two thirds. Within this overall figure, the percentage travelling to work as a car passenger has fallen since 2009 (from 6.4% to 5.1%). Walking journeys have remained relatively stable around 12%, and little change has been seen in the use of other modes of transport. (Tables 11.18 & 11.22) Travel To Work (non-SHS data) 2.19 Other data sources show a similar pattern to the Scottish Household Survey data and also enable comparison with the rest of Great Britain. 2.20 Labour Force Survey results suggest that, between 2009 and 2019, there has been little change in the percentage for whom a car or a van is the usual means of travel to work (70% in both 2009 and 2018). There was little change to walking which was 12% in 2009 and 11% in 2018. People who work at home are excluded from these figures. These figures are similar to the findings from the SHS shown in table 11.18. (Table 11.14) 2.21 There appears to have been little change in recent years in the average times taken to travel to work by the main modes of transport (in 2019: 25 minutes by car; 36 minutes by bus and 15 minutes by foot). (Table 11.15 b) 2.22 The Scottish Census 2011 showed 2.4 million people aged between 16 and 74 in employment, excluding full-time students. 11% of these worked mainly from home. Of the remaining 2.1 million people, 36% had a journey of under 5 km to work, 43% had a journey of between 5 km and 30 km to work and 8% travelled 30 km or more to work. The remaining 12% had no fixed place of work, worked offshore or worked outside the UK. (Table 11.31). 2.23 Information about travel to work has been collected in population censuses since 1966. Excluding those that worked at home, the percentage of the working population using cars to travel to work had increased from 21% in 1966 to 69% in 2011 and the percentage using buses had fallen from 43% in 1966 to 11% in 2011. There had also been a significant fall in the proportion of the working population who walk to work, from 24% in 1966 to 11% in 2011. (Table 11.16) 2.24 The 2011 Census showed that the distance of people’s journey to work tended to vary with their access to cars or vans. Seventy-four per cent of people living in households with no car or van available had a commute of fewer than 10 km, compared with 60 per cent of those in households with one car or van available and 47 per cent of those in households with two or more cars or vans available. Conversely, the proportion of people who travelled 30 km or more to work was higher for people in households with two or more cars or vans available (10 per cent) than for those in households with one car or van available (7 per cent) or with no cars or vans available (4 per cent). (Table 11.33)
188
Personal and Cross-Modal Travel
Travel to School 2.25 In 2019, 52% of children in full-time education at school usually walked to school, 19% usually went by bus, 25% by car or van, 2% cycled. There was little difference between the sexes, but varied greatly with age: 59% of primary school age pupils (those aged up to 11) usually walked to school compared with only 42% of those of secondary school age (those aged 12 and over); 29% of primary pupils went by car or van compared with only 20% of secondary pupils; and only 9% of primary pupils usually travelled by bus compared with 35% of those of secondary age. (Table 11.19) 2.26 Those usually travelling by car/van tended to rise with household income, to around 30% of pupils from households with an annual net income of £30,000 or more, reflecting patterns seen elsewhere in this chapter e.g. travel to work and car use more generally. Walking to school was lowest (27-29%) in rural areas. Estimates for those walking to school have remained relatively stable whilst those traveling by car has risen since 2006. The Sustrans Hands Up Scotland Survey shows similar findings. (Tables 11.19, 11.23 & 11.23a) 2.27 According to the 2011 Scottish Census, 88% of children aged between 4 and 11 travelled less than 5 km to school, including 72% who travelled less than 2 km. 51% of those aged over 18 travelled less than 5 km to their place of study. 430,000 people of any age travelled under 2 km to their place of study, with 73% of these people travelling by foot, 6% travelling by bus and 17% as a passenger in a car or van. Of the 428,000 people who travelled 2 km or more to their place of study, 31 per cent did so as a car driver or passenger, 43 per cent travelled by bus and 7 per cent travelled by train. (Table 11.34 & 11.35) Travel Abroad 2.28 According to the International Passenger Survey (IPS), Scottish residents made an estimated 5.8 million visits abroad in 2019 with 5.5 million visits (95%) being made by air. Edinburgh was the main airport used and accounted for about 2.7 million visits (46% of all visits abroad), followed by Glasgow (1.6 million or 28%), Aberdeen (259,000 or 4%). Around 174,000 visits abroad (3%) were made by sea, and roughly 89,000 (2%) were made using the Channel Tunnel. (Table 11.24) 2.29 Around 69% of Scottish residents' visits abroad were made for holiday purposes. Of these, 2.2 million (39%) were on a package holiday whilst the rest travelled independently. There were 1.2 million (21%) visits abroad to visit friends or relatives and 505,000 visits abroad for business purposes (9%). (Table 11.24) 2.30 Forty seven per cent (3 million) of Scottish residents' visits abroad were made to EU countries and visits to other European areas totalled 27,000 (0.5%). Visits to Canada and the USA together totalled about 429,000 (7%). (Table 11.25) 2.31 The estimated number of visits abroad by Scottish residents rose from 4.2 million in 2004 to a peak of 4.8 million in 2008, a rise of 14%. There were then increases(apart from 2013) in the numbers each year from 2010 until 2019, an increase of 41%. Between 2005 and 2008 there was a decline in the number of package holidays, although since 2009 the trend has been upwards . Those travelling independently has generally increased as well. Other holidays increased by 14% between 2009 and 2019. There was also a large increase in the number of
189
Personal and Cross-Modal Travel
visits to friends and relatives over the same period, with numbers doubling between 2009 and 2018 and falling 23% between 2018 and 2019. Some of the apparent year-to-year changes may be due to sampling variability, however, the general trends reflect patterns described elsewhere in this publication. (Table 11.26) Transport Model for Scotland 2.32 Information on travel between different parts of Scotland is available from the Transport Model for Scotland (TMfS). The base year of TMfS is 2018. 2.33 It is estimated that, on an average weekday in 2018, 6.35 million person-trips were made by car, bus or train across the boundaries of one or more of the zones which are within the area covered by the TMfS. Just over one third (35%) of these trips were within the Clydeplan region, 24% within SESplan region, 6% within TAYplan, and 9% within Aberdeen City & Shire. (Table 11.27) 2.34 Of the 6.35 million inter-zonal person trips per weekday it is estimated that 5.4 million were by car. These accounted for over four-fifths of the total, and the main features of the pattern of trips by car were similar to those described in the previous paragraph. There were also an estimated 900 thousand inter-zonal person-trips by bus or train per weekday. Two fifths of these were within Clydeplan, and just over a quarter were within SESplan. (Table 11.27) 2.35 There was an average of just over 4.6 million journeys per weekday by cars and goods vehicles, with each vehicle containing one or more people. One third were within Clydeplan, and just under a quarter were within SESplan. (Table 11.27) Concessionary Travel 2.36 148 million passenger journeys were made under all types of concessionary fare schemes in 2019-20, 3% less than in 2018-19. Concessionary travel schemes have varied over the years: a national minimum standard of free off-peak local bus travel for elderly and disabled people in Scotland was introduced from 30 September 2002, the scheme was extended to men aged 60-64 from 1 April 2003. In 2006 this was superseded by the introduction of the National Concessionary Travel Scheme for the elderly and disabled which allowed free bus travel across Scotland. Including the young persons’ scheme, concessionary bus travel accounted for 141 million passenger journeys in 2019-20, 95% of concessionary journeys by all modes of transport). (Table 11.29) Traveline Scotland 2.37 In 2019 Traveline Scotland received 108,100 telephone calls which was 41% less than the previous year. Its Web site and smart phone app recorded 32 million hits in 2019, down 4% from the previous year. (Table 11.30).
190
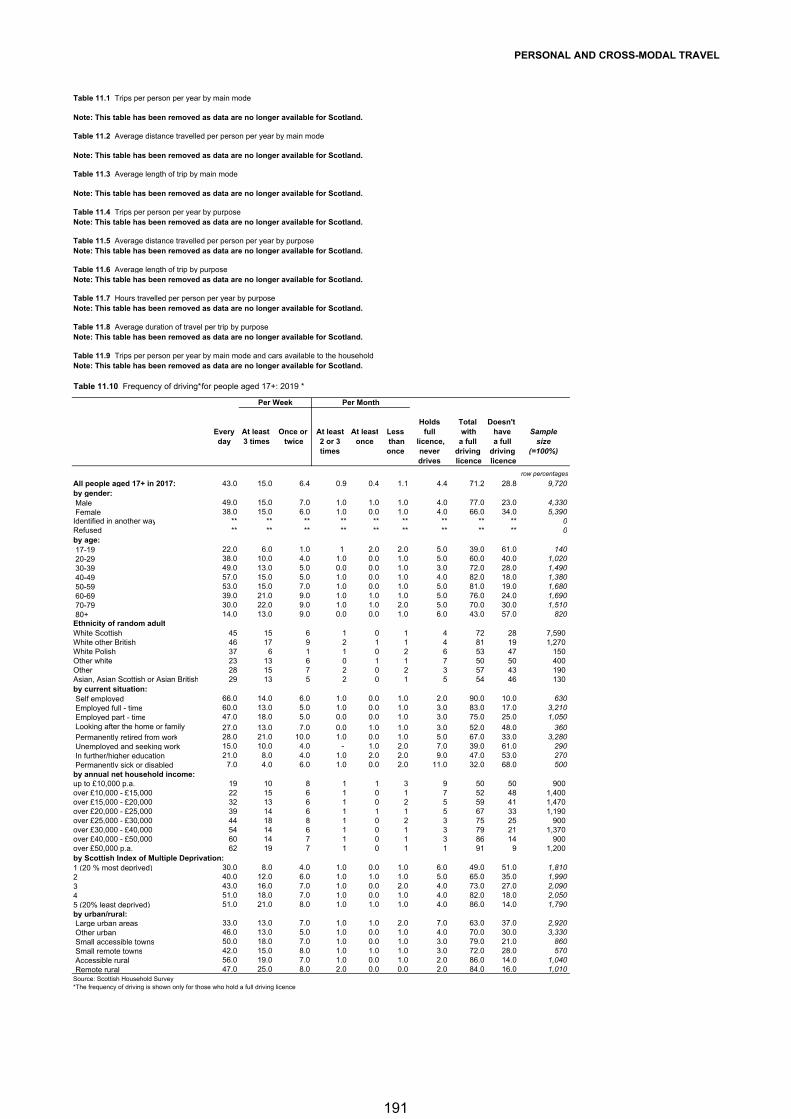
PERSONAL AND CROSS-MODAL TRAVEL
Table 11.1 Trips per person per year by main mode
Note: This table has been removed as data are no longer available for Scotland.
Table 11.2 Average distance travelled per person per year by main mode
Note: This table has been removed as data are no longer available for Scotland.
Table 11.3 Average length of trip by main mode
Note: This table has been removed as data are no longer available for Scotland.
Table 11.4 Trips per person per year by purposeNote: This table has been removed as data are no longer available for Scotland.
Table 11.5 Average distance travelled per person per year by purposeNote: This table has been removed as data are no longer available for Scotland.
Table 11.6 Average length of trip by purpose Note: This table has been removed as data are no longer available for Scotland.
Table 11.7 Hours travelled per person per year by purpose Note: This table has been removed as data are no longer available for Scotland.
Table 11.8 Average duration of travel per trip by purpose Note: This table has been removed as data are no longer available for Scotland.
Table 11.9 Trips per person per year by main mode and cars available to the household Note: This table has been removed as data are no longer available for Scotland.
Table 11.10 Frequency of driving* for people aged 17+: 2019 *
Holds Total Doesn't Every At least Once or At least At least Less full with have Sampleday 3 times twice 2 or 3 once than licence, a full a full size
times once never driving driving (=100%)drives licence licence
All people aged 17+ in 2017: 43.0 15.0 6.4 0.9 0.4 1.1 4.4 71.2 28.8 9,720by gender: Male 49.0 15.0 7.0 1.0 1.0 1.0 4.0 77.0 23.0 4,330 Female 38.0 15.0 6.0 1.0 0.0 1.0 4.0 66.0 34.0 5,390Identified in another way ** ** ** ** ** ** ** ** ** 0Refused ** ** ** ** ** ** ** ** ** 0by age: 17-19 22.0 6.0 1.0 1 2.0 2.0 5.0 39.0 61.0 140 20-29 38.0 10.0 4.0 1.0 0.0 1.0 5.0 60.0 40.0 1,020 30-39 49.0 13.0 5.0 0.0 0.0 1.0 3.0 72.0 28.0 1,490 40-49 57.0 15.0 5.0 1.0 0.0 1.0 4.0 82.0 18.0 1,380 50-59 53.0 15.0 7.0 1.0 0.0 1.0 5.0 81.0 19.0 1,680 60-69 39.0 21.0 9.0 1.0 1.0 1.0 5.0 76.0 24.0 1,690 70-79 30.0 22.0 9.0 1.0 1.0 2.0 5.0 70.0 30.0 1,510 80+ 14.0 13.0 9.0 0.0 0.0 1.0 6.0 43.0 57.0 820Ethnicity of random adultWhite Scottish 45 15 6 1 0 1 4 72 28 7,590 White other British 46 17 9 2 1 1 4 81 19 1,270 White Polish 37 6 1 1 0 2 6 53 47 150 Other white 23 13 6 0 1 1 7 50 50 400 Other 28 15 7 2 0 2 3 57 43 190 Asian, Asian Scottish or Asian British 29 13 5 2 0 1 5 54 46 130 by current situation: Self employed 66.0 14.0 6.0 1.0 0.0 1.0 2.0 90.0 10.0 630 Employed full - time 60.0 13.0 5.0 1.0 0.0 1.0 3.0 83.0 17.0 3,210 Employed part - time 47.0 18.0 5.0 0.0 0.0 1.0 3.0 75.0 25.0 1,050 Looking after the home or family 27.0 13.0 7.0 0.0 1.0 1.0 3.0 52.0 48.0 360 Permanently retired from work 28.0 21.0 10.0 1.0 0.0 1.0 5.0 67.0 33.0 3,280 Unemployed and seeking work 15.0 10.0 4.0 - 1.0 2.0 7.0 39.0 61.0 290 In further/higher education 21.0 8.0 4.0 1.0 2.0 2.0 9.0 47.0 53.0 270 Permanently sick or disabled 7.0 4.0 6.0 1.0 0.0 2.0 11.0 32.0 68.0 500
up to £10,000 p.a. 19 10 8 1 1 3 9 50 50 900 over £10,000 - £15,000 22 15 6 1 0 1 7 52 48 1,400 over £15,000 - £20,000 32 13 6 1 0 2 5 59 41 1,470 over £20,000 - £25,000 39 14 6 1 1 1 5 67 33 1,190 over £25,000 - £30,000 44 18 8 1 0 2 3 75 25 900 over £30,000 - £40,000 54 14 6 1 0 1 3 79 21 1,370 over £40,000 - £50,000 60 14 7 1 0 1 3 86 14 900 over £50,000 p.a. 62 19 7 1 0 1 1 91 9 1,200
1 (20 % most deprived) 30.0 8.0 4.0 1.0 0.0 1.0 6.0 49.0 51.0 1,8102 40.0 12.0 6.0 1.0 1.0 1.0 5.0 65.0 35.0 1,9903 43.0 16.0 7.0 1.0 0.0 2.0 4.0 73.0 27.0 2,0904 51.0 18.0 7.0 1.0 0.0 1.0 4.0 82.0 18.0 2,0505 (20% least deprived) 51.0 21.0 8.0 1.0 1.0 1.0 4.0 86.0 14.0 1,790by urban/rural: Large urban areas 33.0 13.0 7.0 1.0 1.0 2.0 7.0 63.0 37.0 2,920 Other urban 46.0 13.0 5.0 1.0 0.0 1.0 4.0 70.0 30.0 3,330 Small accessible towns 50.0 18.0 7.0 1.0 0.0 1.0 3.0 79.0 21.0 860 Small remote towns 42.0 15.0 8.0 1.0 1.0 1.0 3.0 72.0 28.0 570 Accessible rural 56.0 19.0 7.0 1.0 0.0 1.0 2.0 86.0 14.0 1,040 Remote rural 47.0 25.0 8.0 2.0 0.0 0.0 2.0 84.0 16.0 1,010Source: Scottish Household Survey*The frequency of driving is shown only for those who hold a full driving licence
row percentages
by Scottish Index of Multiple Deprivation:
Per Week Per Month
by annual net household income:
191
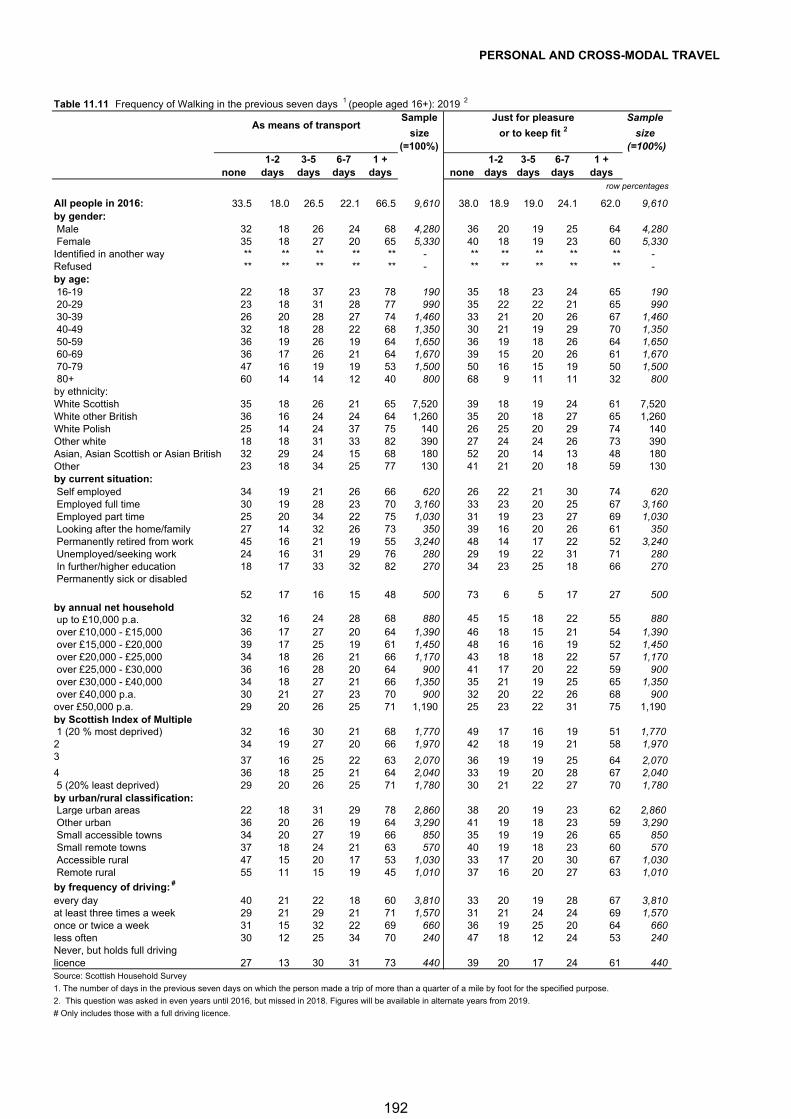
PERSONAL AND CROSS-MODAL TRAVEL
Table 11.11 Frequency of Walking in the previous seven days 1 (people aged 16+): 2019 2
Sample Sample
size size (=100%) (=100%)
1 + 1 +days days
All people in 2016: 33.5 18.0 26.5 22.1 66.5 9,610 38.0 18.9 19.0 24.1 62.0 9,610 by gender: Male 32 18 26 24 68 4,280 36 20 19 25 64 4,280 Female 35 18 27 20 65 5,330 40 18 19 23 60 5,330 Identified in another way ** ** ** ** ** - ** ** ** ** ** - Refused ** ** ** ** ** - ** ** ** ** ** - by age:16-19 22 18 37 23 78 190 35 18 23 24 65 190 20-29 23 18 31 28 77 990 35 22 22 21 65 990 30-39 26 20 28 27 74 1,460 33 21 20 26 67 1,460 40-49 32 18 28 22 68 1,350 30 21 19 29 70 1,350 50-59 36 19 26 19 64 1,650 36 19 18 26 64 1,650 60-69 36 17 26 21 64 1,670 39 15 20 26 61 1,670 70-79 47 16 19 19 53 1,500 50 16 15 19 50 1,500
60 14 14 12 40 800 68 9 11 11 32 800
35 18 26 21 65 7,520 39 18 19 24 61 7,520 36 16 24 24 64 1,260 35 20 18 27 65 1,260 25 14 24 37 75 140 26 25 20 29 74 140 18 18 31 33 82 390 27 24 24 26 73 390 32 29 24 15 68 180 52 20 14 13 48 180 23 18 34 25 77 130 41 21 20 18 59 130
80+by ethnicity:White ScottishWhite other BritishWhite PolishOther whiteAsian, Asian Scottish or Asian British Otherby current situation:Self employed 34 19 21 26 66 620 26 22 21 30 74 620 Employed full time 30 19 28 23 70 3,160 33 23 20 25 67 3,160 Employed part time 25 20 34 22 75 1,030 31 19 23 27 69 1,030 Looking after the home/family 27 14 32 26 73 350 39 16 20 26 61 350 Permanently retired from work 45 16 21 19 55 3,240 48 14 17 22 52 3,240 Unemployed/seeking work 24 16 31 29 76 280 29 19 22 31 71 280 In further/higher education 18 17 33 32 82 270 34 23 25 18 66 270 Permanently sick or disabled
52 17 16 15 48 500 73 6 5 17 27 500 by annual net household up to £10,000 p.a. 32 16 24 28 68 880 45 15 18 22 55 880 over £10,000 - £15,000 36 17 27 20 64 1,390 46 18 15 21 54 1,390 over £15,000 - £20,000 39 17 25 19 61 1,450 48 16 16 19 52 1,450 over £20,000 - £25,000 34 18 26 21 66 1,170 43 18 18 22 57 1,170 over £25,000 - £30,000 36 16 28 20 64 900 41 17 20 22 59 900 over £30,000 - £40,000 34 18 27 21 66 1,350 35 21 19 25 65 1,350 over £40,000 p.a. 30 21 27 23 70 900 32 20 22 26 68 900 over £50,000 p.a. 29 20 26 25 71 1,190 25 23 22 31 75 1,190 by Scottish Index of Multiple 1 (20 % most deprived) 32 16 30 21 68 1,770 49 17 16 19 51 1,770 2 34 19 27 20 66 1,970 42 18 19 21 58 1,970 3 37 16 25 22 63 2,070 36 19 19 25 64 2,070 4 36 18 25 21 64 2,040 33 19 20 28 67 2,040 5 (20% least deprived) 29 20 26 25 71 1,780 30 21 22 27 70 1,780 by urban/rural classification: Large urban areas 22 18 31 29 78 2,860 38 20 19 23 62 2,860 Other urban 36 20 26 19 64 3,290 41 19 18 23 59 3,290 Small accessible towns 34 20 27 19 66 850 35 19 19 26 65 850 Small remote towns 37 18 24 21 63 570 40 19 18 23 60 570 Accessible rural 47 15 20 17 53 1,030 33 17 20 30 67 1,030 Remote rural 55 11 15 19 45 1,010 37 16 20 27 63 1,010
by frequency of driving: #
every day 40 21 22 18 60 3,810 33 20 19 28 67 3,810 at least three times a week 29 21 29 21 71 1,570 31 21 24 24 69 1,570 once or twice a week 31 15 32 22 69 660 36 19 25 20 64 660 less often 30 12 25 34 70 240 47 18 12 24 53 240 Never, but holds full driving licence 27 13 30 31 73 440 39 20 17 24 61 440 Source: Scottish Household Survey
1. The number of days in the previous seven days on which the person made a trip of more than a quarter of a mile by foot for the specified purpose.
2. This question was asked in even years until 2016, but missed in 2018. Figures will be available in alternate years from 2019.
# Only includes those with a full driving licence.
3-5days
6-7days
row percentages
As means of transportJust for pleasure
or to keep fit 2
none1-2
days3-5
days6-7
days none1-2
days
192
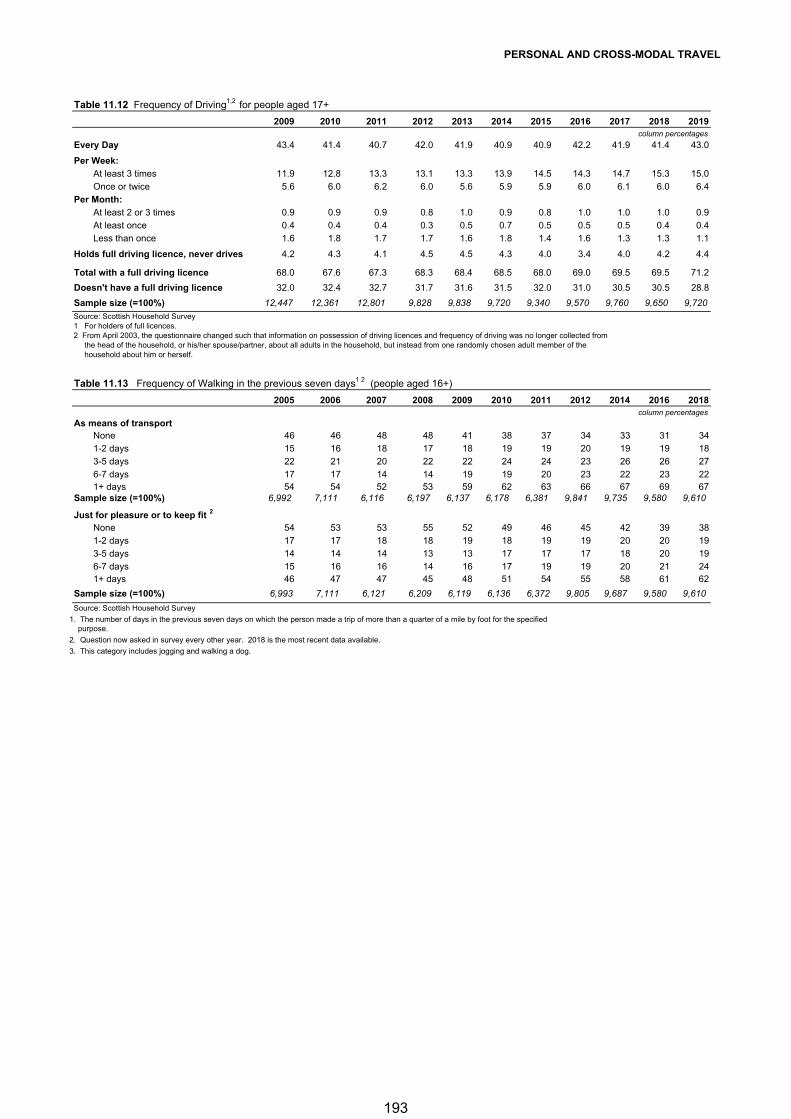
PERSONAL AND CROSS-MODAL TRAVEL
Table 11.12 Frequency of Driving1,2 for people aged 17+
2009 2010 2011 2012 2013 2014 2015 2016 2017 2018 2019column percentages
Every Day 43.4 41.4 40.7 42.0 41.9 40.9 40.9 42.2 41.9 41.4 43.0
Per Week:
At least 3 times 11.9 12.8 13.3 13.1 13.3 13.9 14.5 14.3 14.7 15.3 15.0
Once or twice 5.6 6.0 6.2 6.0 5.6 5.9 5.9 6.0 6.1 6.0 6.4
Per Month:
At least 2 or 3 times 0.9 0.9 0.9 0.8 1.0 0.9 0.8 1.0 1.0 1.0 0.9
At least once 0.4 0.4 0.4 0.3 0.5 0.7 0.5 0.5 0.5 0.4 0.4
Less than once 1.6 1.8 1.7 1.7 1.6 1.8 1.4 1.6 1.3 1.3 1.1
Holds full driving licence, never drives 4.2 4.3 4.1 4.5 4.5 4.3 4.0 3.4 4.0 4.2 4.4
Total with a full driving licence 68.0 67.6 67.3 68.3 68.4 68.5 68.0 69.0 69.5 69.5 71.2
Doesn't have a full driving licence 32.0 32.4 32.7 31.7 31.6 31.5 32.0 31.0 30.5 30.5 28.8Sample size (=100%) 12,447 12,361 12,801 9,828 9,838 9,720 9,340 9,570 9,760 9,650 9,720Source: Scottish Household Survey1 For holders of full licences.2 From April 2003, the questionnaire changed such that information on possession of driving licences and frequency of driving was no longer collected from the head of the household, or his/her spouse/partner, about all adults in the household, but instead from one randomly chosen adult member of the household about him or herself.
Table 11.13 Frequency of Walking in the previous seven days1 2 (people aged 16+)
2005 2006 2007 2008 2009 2010 2011 2012 2014 2016 2018column percentages
As means of transport None 46 46 48 48 41 38 37 34 33 31 341-2 days 15 16 18 17 18 19 19 20 19 19 183-5 days 22 21 20 22 22 24 24 23 26 26 276-7 days 17 17 14 14 19 19 20 23 22 23 221+ days 54 54 52 53 59 62 63 66 67 69 67
Sample size (=100%) 6,992 7,111 6,116 6,197 6,137 6,178 6,381 9,841 9,735 9,580 9,610
Just for pleasure or to keep fit 2
None 54 53 53 55 52 49 46 45 42 39 381-2 days 17 17 18 18 19 18 19 19 20 20 193-5 days 14 14 14 13 13 17 17 17 18 20 196-7 days 15 16 16 14 16 17 19 19 20 21 241+ days 46 47 47 45 48 51 54 55 58 61 62
Sample size (=100%) 6,993 7,111 6,121 6,209 6,119 6,136 6,372 9,805 9,687 9,580 9,610
Source: Scottish Household Survey
1. The number of days in the previous seven days on which the person made a trip of more than a quarter of a mile by foot for the specified purpose.
2. Question now asked in survey every other year. 2018 is the most recent data available.
3. This category includes jogging and walking a dog.
193
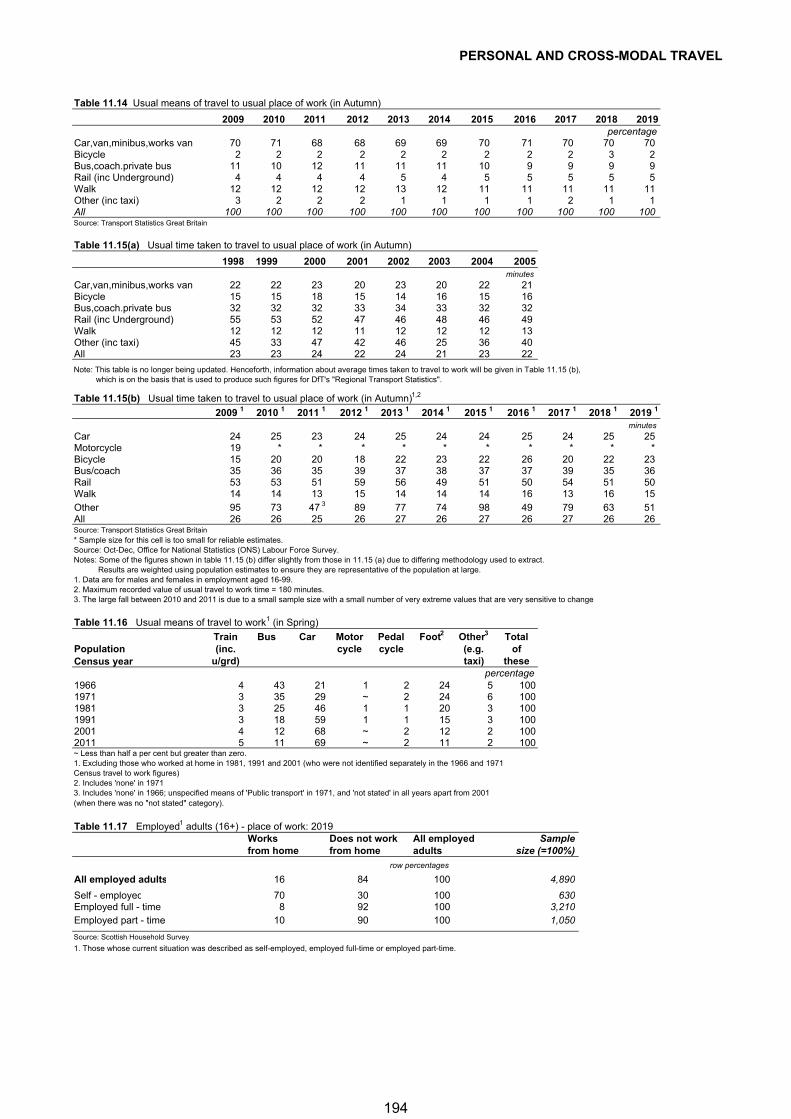
PERSONAL AND CROSS-MODAL TRAVEL
Table 11.14 Usual means of travel to usual place of work (in Autumn)
2009 2010 2011 2012 2013 2014 2015 2016 2017 2018 2019percentage
Car,van,minibus,works van 70 71 68 68 69 69 70 71 70 70 70 Bicycle 2 2 2 2 2 2 2 2 2 3 2 Bus,coach.private bus 11 10 12 11 11 11 10 9 9 9 9 Rail (inc Underground) 4 4 4 4 5 4 5 5 5 5 5 Walk 12 12 12 12 13 12 11 11 11 11 11 Other (inc taxi) 3 2 2 2 1 1 1 1 2 1 1 All 100 100 100 100 100 100 100 100 100 100 100 Source: Transport Statistics Great Britain
Table 11.15(a) Usual time taken to travel to usual place of work (in Autumn)
1998 1999 2000 2001 2002 2003 2004 2005minutes
Car,van,minibus,works van 22 22 23 20 23 20 22 21 Bicycle 15 15 18 15 14 16 15 16 Bus,coach.private bus 32 32 32 33 34 33 32 32 Rail (inc Underground) 55 53 52 47 46 48 46 49 Walk 12 12 12 11 12 12 12 13 Other (inc taxi) 45 33 47 42 46 25 36 40 All 23 23 24 22 24 21 23 22
Note: This table is no longer being updated. Henceforth, information about average times taken to travel to work will be given in Table 11.15 (b), which is on the basis that is used to produce such figures for DfT's "Regional Transport Statistics".
Table 11.15(b) Usual time taken to travel to usual place of work (in Autumn) 1,2
2009 1 2010 1 2011 1 2012 1 2013 1 2014 1 2015 1 2016 1 2017 1 2018 1 2019 1
minutes
Car 24 25 23 24 25 24 24 25 24 25 25 Motorcycle 19 * * * * * * * * * *Bicycle 15 20 20 18 22 23 22 26 20 22 23 Bus/coach 35 36 35 39 37 38 37 37 39 35 36 Rail 53 53 51 59 56 49 51 50 54 51 50 Walk 14 14 13 15 14 14 14 16 13 16 15 Other 95 73 47 3 89 77 74 98 49 79 63 51 All 26 26 25 26 27 26 27 26 27 26 26 Source: Transport Statistics Great Britain* Sample size for this cell is too small for reliable estimates.Source: Oct-Dec, Office for National Statistics (ONS) Labour Force Survey.Notes: Some of the figures shown in table 11.15 (b) differ slightly from those in 11.15 (a) due to differing methodology used to extract. Results are weighted using population estimates to ensure they are representative of the population at large.1. Data are for males and females in employment aged 16-99.2. Maximum recorded value of usual travel to work time = 180 minutes.3. The large fall between 2010 and 2011 is due to a small sample size with a small number of very extreme values that are very sensitive to change
Table 11.16 Usual means of travel to work 1 (in Spring)
Train Bus Car Motor Pedal Foot2 Other3 TotalPopulation (inc. cycle cycle (e.g. ofCensus year u/grd) taxi) these
percentage1966 4 43 21 1 2 24 5 1001971 3 35 29 ~ 2 24 6 1001981 3 25 46 1 1 20 3 1001991 3 18 59 1 1 15 3 1002001 4 12 68 ~ 2 12 2 1002011 5 11 69 ~ 2 11 2 100~ Less than half a per cent but greater than zero.1. Excluding those who worked at home in 1981, 1991 and 2001 (who were not identified separately in the 1966 and 1971Census travel to work figures)2. Includes 'none' in 19713. Includes 'none' in 1966; unspecified means of 'Public transport' in 1971, and 'not stated' in all years apart from 2001(when there was no "not stated" category).
Table 11.17 Employed1 adults (16+) - place of work: 2019Works Does not work All employed Samplefrom home from home adults size (=100%)
row percentages
All employed adults 16 84 100 4,890
Self - employed 70 30 100 630Employed full - time 8 92 100 3,210Employed part - time 10 90 100 1,050
Source: Scottish Household Survey
1. Those whose current situation was described as self-employed, employed full-time or employed part-time.
194
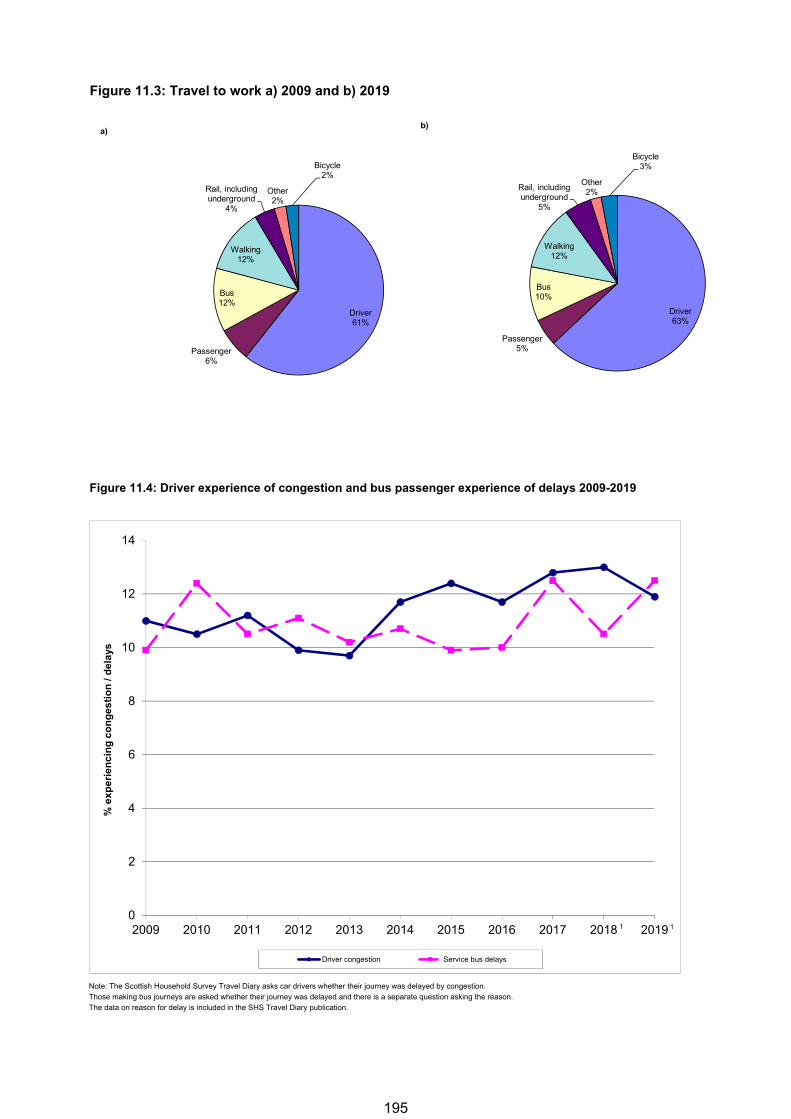
Figure 11.3: Travel to work a) 2009 and b) 2019
Figure 11.4: Driver experience of congestion and bus passenger experience of delays 2009-2019
Note: The Scottish Household Survey Travel Diary asks car drivers whether their journey was delayed by congestion.
Those making bus journeys are asked whether their journey was delayed and there is a separate question asking the reason.
The data on reason for delay is included in the SHS Travel Diary publication.
0
2
4
6
8
10
12
14
2009 2010 2011 2012 2013 2014 2015 2016 2017 2018 2019
% e
xp
eri
en
cin
g c
on
ge
sti
on
/ d
ela
ys
Driver congestion Service bus delays
11
Driver61%
Passenger6%
Bus12%
Walking12%
Rail, including underground
4%
Other2%
Bicycle2%
Driver63%
Passenger5%
Bus10%
Walking12%
Rail, including underground
5%
Other2%
Bicycle3%
b)a)
195
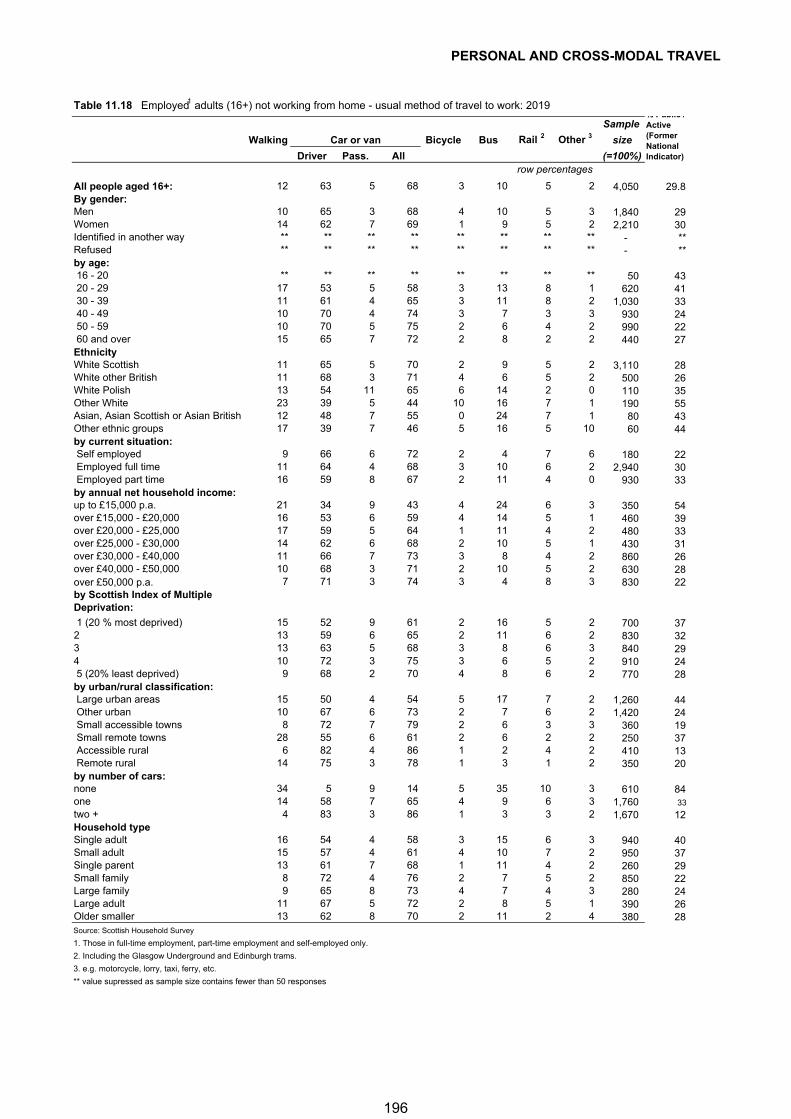
PERSONAL AND CROSS-MODAL TRAVEL
Table 11.18 Employed1 adults (16+) not working from home - usual method of travel to work: 2019 Sample
Walking Car or van Bicycle Bus Rail 2 Other 3 size
Driver Pass. All (=100%)row percentages
All people aged 16+: 12 63 5 68 3 10 5 2 4,050 29.8By gender:Men 10 65 3 68 4 10 5 3 1,840 29Women 14 62 7 69 1 9 5 2 2,210 30Identified in another way ** ** ** ** ** ** ** ** - **Refused ** ** ** ** ** ** ** ** - **by age: 16 - 20 ** ** ** ** ** ** ** ** 50 43 20 - 29 17 53 5 58 3 13 8 1 620 41 30 - 39 11 61 4 65 3 11 8 2 1,030 33 40 - 49 10 70 4 74 3 7 3 3 930 24 50 - 59 10 70 5 75 2 6 4 2 990 22 60 and over 15 65 7 72 2 8 2 2 440 27EthnicityWhite Scottish 11 65 5 70 2 9 5 2 3,110 28White other British 11 68 3 71 4 6 5 2 500 26White Polish 13 54 11 65 6 14 2 0 110 35Other White 23 39 5 44 10 16 7 1 190 55Asian, Asian Scottish or Asian British 12 48 7 55 0 24 7 1 80 43Other ethnic groups 17 39 7 46 5 16 5 10 60 44by current situation: Self employed 9 66 6 72 2 4 7 6 180 22 Employed full time 11 64 4 68 3 10 6 2 2,940 30 Employed part time 16 59 8 67 2 11 4 0 930 33by annual net household income:up to £15,000 p.a. 21 34 9 43 4 24 6 3 350 54over £15,000 - £20,000 16 53 6 59 4 14 5 1 460 39over £20,000 - £25,000 17 59 5 64 1 11 4 2 480 33over £25,000 - £30,000 14 62 6 68 2 10 5 1 430 31over £30,000 - £40,000 11 66 7 73 3 8 4 2 860 26over £40,000 - £50,000 10 68 3 71 2 10 5 2 630 28over £50,000 p.a. 7 71 3 74 3 4 8 3 830 22by Scottish Index of Multiple Deprivation:
1 (20 % most deprived) 15 52 9 61 2 16 5 2 700 372 13 59 6 65 2 11 6 2 830 323 13 63 5 68 3 8 6 3 840 294 10 72 3 75 3 6 5 2 910 24 5 (20% least deprived) 9 68 2 70 4 8 6 2 770 28by urban/rural classification: Large urban areas 15 50 4 54 5 17 7 2 1,260 44 Other urban 10 67 6 73 2 7 6 2 1,420 24 Small accessible towns 8 72 7 79 2 6 3 3 360 19 Small remote towns 28 55 6 61 2 6 2 2 250 37 Accessible rural 6 82 4 86 1 2 4 2 410 13 Remote rural 14 75 3 78 1 3 1 2 350 20by number of cars:none 34 5 9 14 5 35 10 3 610 84one 14 58 7 65 4 9 6 3 1,760 33
two + 4 83 3 86 1 3 3 2 1,670 12Household typeSingle adult 16 54 4 58 3 15 6 3 940 40Small adult 15 57 4 61 4 10 7 2 950 37Single parent 13 61 7 68 1 11 4 2 260 29Small family 8 72 4 76 2 7 5 2 850 22Large family 9 65 8 73 4 7 4 3 280 24Large adult 11 67 5 72 2 8 5 1 390 26Older smaller 13 62 8 70 2 11 2 4 380 28Source: Scottish Household Survey
1. Those in full-time employment, part-time employment and self-employed only.
2. Including the Glasgow Underground and Edinburgh trams.
3. e.g. motorcycle, lorry, taxi, ferry, etc.
** value supressed as sample size contains fewer than 50 responses
% Public / Active (Former National Indicator)
196
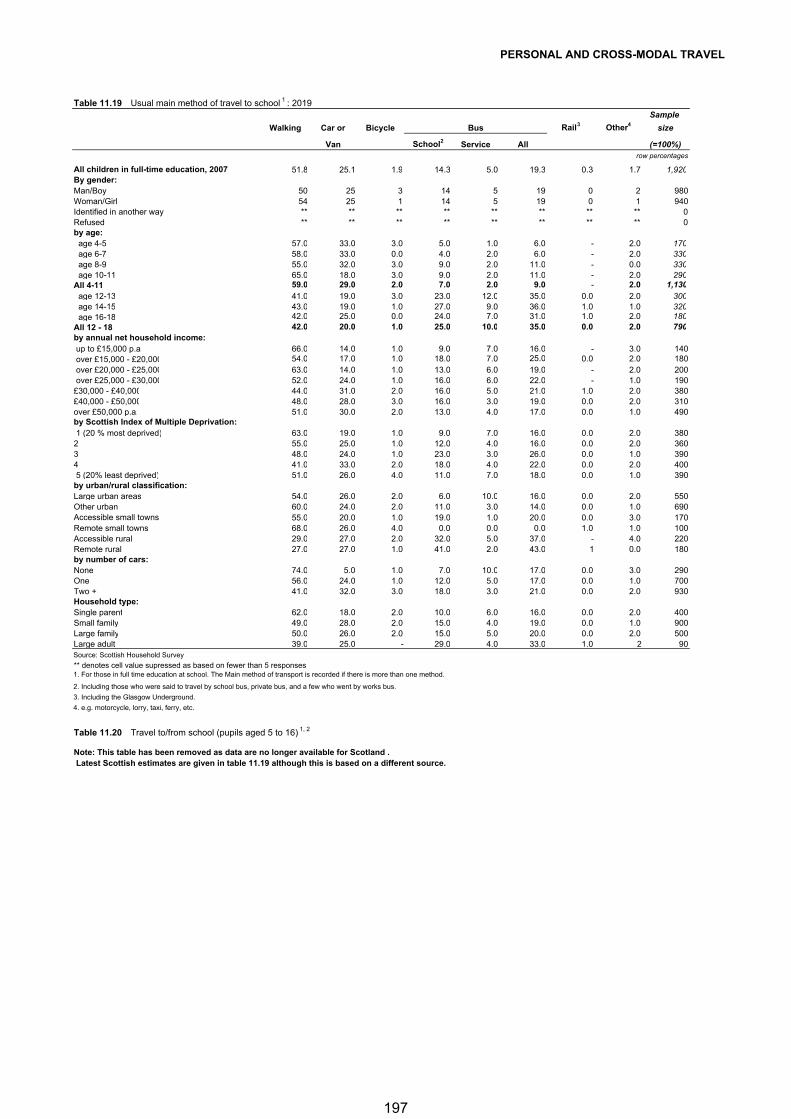
PERSONAL AND CROSS-MODAL TRAVEL
Table 11.19 Usual main method of travel to school 1 : 2019Sample
Walking Car or Bicycle Bus Rail3 Other4 size
Van School2 Service All (=100%)
All children in full-time education, 2007 51.8 25.1 1.9 14.3 5.0 19.3 0.3 1.7 1,920By gender:Man/Boy 50 25 3 14 5 19 0 2 980Woman/Girl 54 25 1 14 5 19 0 1 940Identified in another way ** ** ** ** ** ** ** ** 0Refused ** ** ** ** ** ** ** ** 0by age: age 4-5 57.0 33.0 3.0 5.0 1.0 6.0 - 2.0 170 age 6-7 58.0 33.0 0.0 4.0 2.0 6.0 - 2.0 330 age 8-9 55.0 32.0 3.0 9.0 2.0 11.0 - 0.0 330 age 10-11 65.0 18.0 3.0 9.0 2.0 11.0 - 2.0 290All 4-11 59.0 29.0 2.0 7.0 2.0 9.0 - 2.0 1,130 age 12-13 41.0 19.0 3.0 23.0 12.0 35.0 0.0 2.0 300 age 14-15 43.0 19.0 1.0 27.0 9.0 36.0 1.0 1.0 320 age 16-18 42.0 25.0 0.0 24.0 7.0 31.0 1.0 2.0 180All 12 - 18 42.0 20.0 1.0 25.0 10.0 35.0 0.0 2.0 790
up to £15,000 p.a. 66.0 14.0 1.0 9.0 7.0 16.0 - 3.0 140 over £15,000 - £20,000 54.0 17.0 1.0 18.0 7.0 25.0 0.0 2.0 180 over £20,000 - £25,000 63.0 14.0 1.0 13.0 6.0 19.0 - 2.0 200 over £25,000 - £30,000 52.0 24.0 1.0 16.0 6.0 22.0 - 1.0 190£30,000 - £40,000 44.0 31.0 2.0 16.0 5.0 21.0 1.0 2.0 380£40,000 - £50,000 48.0 28.0 3.0 16.0 3.0 19.0 0.0 2.0 310over £50,000 p.a. 51.0 30.0 2.0 13.0 4.0 17.0 0.0 1.0 490
1 (20 % most deprived) 63.0 19.0 1.0 9.0 7.0 16.0 0.0 2.0 3802 55.0 25.0 1.0 12.0 4.0 16.0 0.0 2.0 3603 48.0 24.0 1.0 23.0 3.0 26.0 0.0 1.0 3904 41.0 33.0 2.0 18.0 4.0 22.0 0.0 2.0 400 5 (20% least deprived) 51.0 26.0 4.0 11.0 7.0 18.0 0.0 1.0 390by urban/rural classification:Large urban areas 54.0 26.0 2.0 6.0 10.0 16.0 0.0 2.0 550Other urban 60.0 24.0 2.0 11.0 3.0 14.0 0.0 1.0 690Accessible small towns 55.0 20.0 1.0 19.0 1.0 20.0 0.0 3.0 170Remote small towns 68.0 26.0 4.0 0.0 0.0 0.0 1.0 1.0 100Accessible rural 29.0 27.0 2.0 32.0 5.0 37.0 - 4.0 220Remote rural 27.0 27.0 1.0 41.0 2.0 43.0 1 0.0 180by number of cars:None 74.0 5.0 1.0 7.0 10.0 17.0 0.0 3.0 290One 56.0 24.0 1.0 12.0 5.0 17.0 0.0 1.0 700Two + 41.0 32.0 3.0 18.0 3.0 21.0 0.0 2.0 930Household type:Single parent 62.0 18.0 2.0 10.0 6.0 16.0 0.0 2.0 400Small family 49.0 28.0 2.0 15.0 4.0 19.0 0.0 1.0 900Large family 50.0 26.0 2.0 15.0 5.0 20.0 0.0 2.0 500Large adult 39.0 25.0 - 29.0 4.0 33.0 1.0 2 90Source: Scottish Household Survey
** denotes cell value supressed as based on fewer than 5 responses
2. Including those who were said to travel by school bus, private bus, and a few who went by works bus.
3. Including the Glasgow Underground.
4. e.g. motorcycle, lorry, taxi, ferry, etc.
Table 11.20 Travel to/from school (pupils aged 5 to 16) 1, 2
Note: This table has been removed as data are no longer available for Scotland . Latest Scottish estimates are given in table 11.19 although this is based on a different source.
by annual net household income:
by Scottish Index of Multiple Deprivation:
1. For those in full time education at school. The Main method of transport is recorded if there is more than one method.
row percentages
197
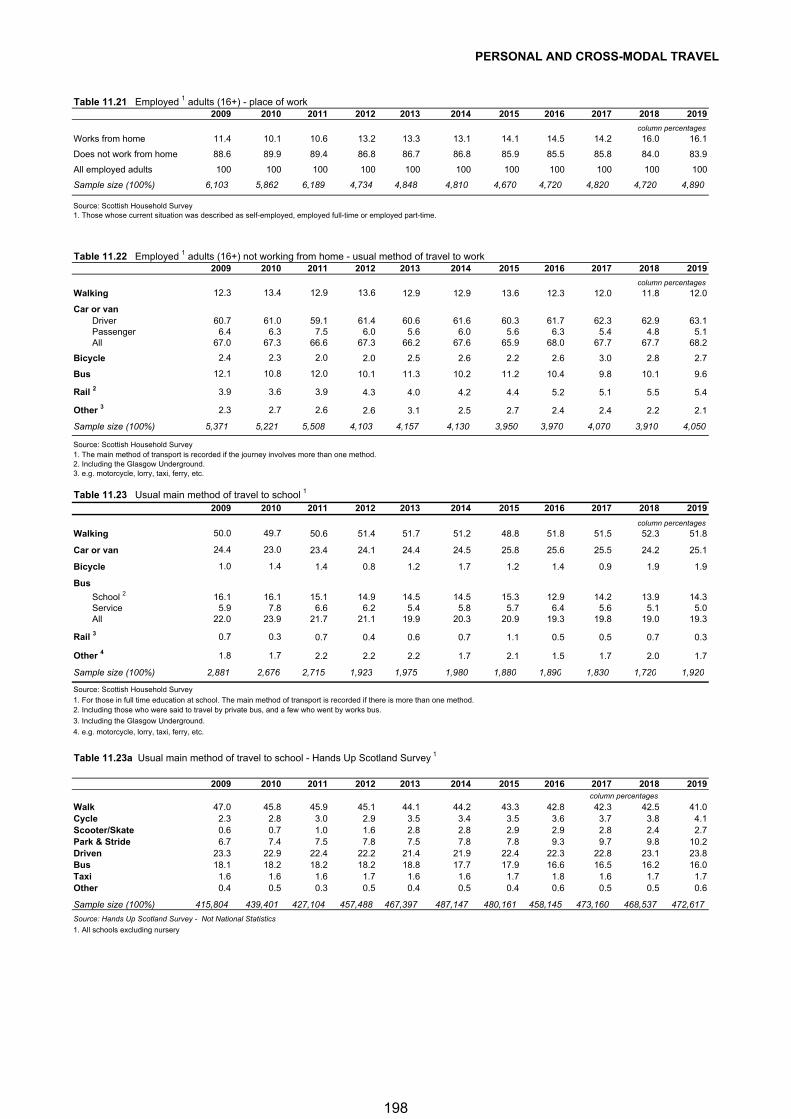
PERSONAL AND CROSS-MODAL TRAVEL
Table 11.21 Employed 1 adults (16+) - place of work 2009 2010 2011 2012 2013 2014 2015 2016 2017 2018 2019
column percentages
Works from home 11.4 10.1 10.6 13.2 13.3 13.1 14.1 14.5 14.2 16.0 16.1
Does not work from home 88.6 89.9 89.4 86.8 86.7 86.8 85.9 85.5 85.8 84.0 83.9
All employed adults 100 100 100 100 100 100 100 100 100 100 100
Sample size (100%) 6,103 5,862 6,189 4,734 4,848 4,810 4,670 4,720 4,820 4,720 4,890
Source: Scottish Household Survey1. Those whose current situation was described as self-employed, employed full-time or employed part-time.
Table 11.22 Employed 1 adults (16+) not working from home - usual method of travel to work2009 2010 2011 2012 2013 2014 2015 2016 2017 2018 2019
column percentages
Walking 12.3 13.4 12.9 13.6 12.9 12.9 13.6 12.3 12.0 11.8 12.0
Car or vanDriver 60.7 61.0 59.1 61.4 60.6 61.6 60.3 61.7 62.3 62.9 63.1Passenger 6.4 6.3 7.5 6.0 5.6 6.0 5.6 6.3 5.4 4.8 5.1All 67.0 67.3 66.6 67.3 66.2 67.6 65.9 68.0 67.7 67.7 68.2
Bicycle 2.4 2.3 2.0 2.0 2.5 2.6 2.2 2.6 3.0 2.8 2.7
Bus 12.1 10.8 12.0 10.1 11.3 10.2 11.2 10.4 9.8 10.1 9.6
Rail 2 3.9 3.6 3.9 4.3 4.0 4.2 4.4 5.2 5.1 5.5 5.4
Other 3 2.3 2.7 2.6 2.6 3.1 2.5 2.7 2.4 2.4 2.2 2.1
Sample size (100%) 5,371 5,221 5,508 4,103 4,157 4,130 3,950 3,970 4,070 3,910 4,050
Source: Scottish Household Survey1. The main method of transport is recorded if the journey involves more than one method.2. Including the Glasgow Underground.3. e.g. motorcycle, lorry, taxi, ferry, etc.
Table 11.23 Usual main method of travel to school 1
2009 2010 2011 2012 2013 2014 2015 2016 2017 2018 2019
column percentages
Walking 50.0 49.7 50.6 51.4 51.7 51.2 48.8 51.8 51.5 52.3 51.8
Car or van 24.4 23.0 23.4 24.1 24.4 24.5 25.8 25.6 25.5 24.2 25.1
Bicycle 1.0 1.4 1.4 0.8 1.2 1.7 1.2 1.4 0.9 1.9 1.9
Bus
School 2 16.1 16.1 15.1 14.9 14.5 14.5 15.3 12.9 14.2 13.9 14.3Service 5.9 7.8 6.6 6.2 5.4 5.8 5.7 6.4 5.6 5.1 5.0All 22.0 23.9 21.7 21.1 19.9 20.3 20.9 19.3 19.8 19.0 19.3
Rail 3 0.7 0.3 0.7 0.4 0.6 0.7 1.1 0.5 0.5 0.7 0.3
Other 4 1.8 1.7 2.2 2.2 2.2 1.7 2.1 1.5 1.7 2.0 1.7
Sample size (100%) 2,881 2,676 2,715 1,923 1,975 1,980 1,880 1,890 1,830 1,720 1,920
Source: Scottish Household Survey1. For those in full time education at school. The main method of transport is recorded if there is more than one method.2. Including those who were said to travel by private bus, and a few who went by works bus.
3. Including the Glasgow Underground.
4. e.g. motorcycle, lorry, taxi, ferry, etc.
Table 11.23a Usual main method of travel to school - Hands Up Scotland Survey 1
2009 2010 2011 2012 2013 2014 2015 2016 2017 2018 2019column percentages
Walk 47.0 45.8 45.9 45.1 44.1 44.2 43.3 42.8 42.3 42.5 41.0Cycle 2.3 2.8 3.0 2.9 3.5 3.4 3.5 3.6 3.7 3.8 4.1Scooter/Skate 0.6 0.7 1.0 1.6 2.8 2.8 2.9 2.9 2.8 2.4 2.7Park & Stride 6.7 7.4 7.5 7.8 7.5 7.8 7.8 9.3 9.7 9.8 10.2Driven 23.3 22.9 22.4 22.2 21.4 21.9 22.4 22.3 22.8 23.1 23.8Bus 18.1 18.2 18.2 18.2 18.8 17.7 17.9 16.6 16.5 16.2 16.0Taxi 1.6 1.6 1.6 1.7 1.6 1.6 1.7 1.8 1.6 1.7 1.7Other 0.4 0.5 0.3 0.5 0.4 0.5 0.4 0.6 0.5 0.5 0.6
Sample size (100%) 415,804 439,401 427,104 457,488 467,397 487,147 480,161 458,145 473,160 468,537 472,617
Source: Hands Up Scotland Survey - Not National Statistics
1. All schools excluding nursery
198
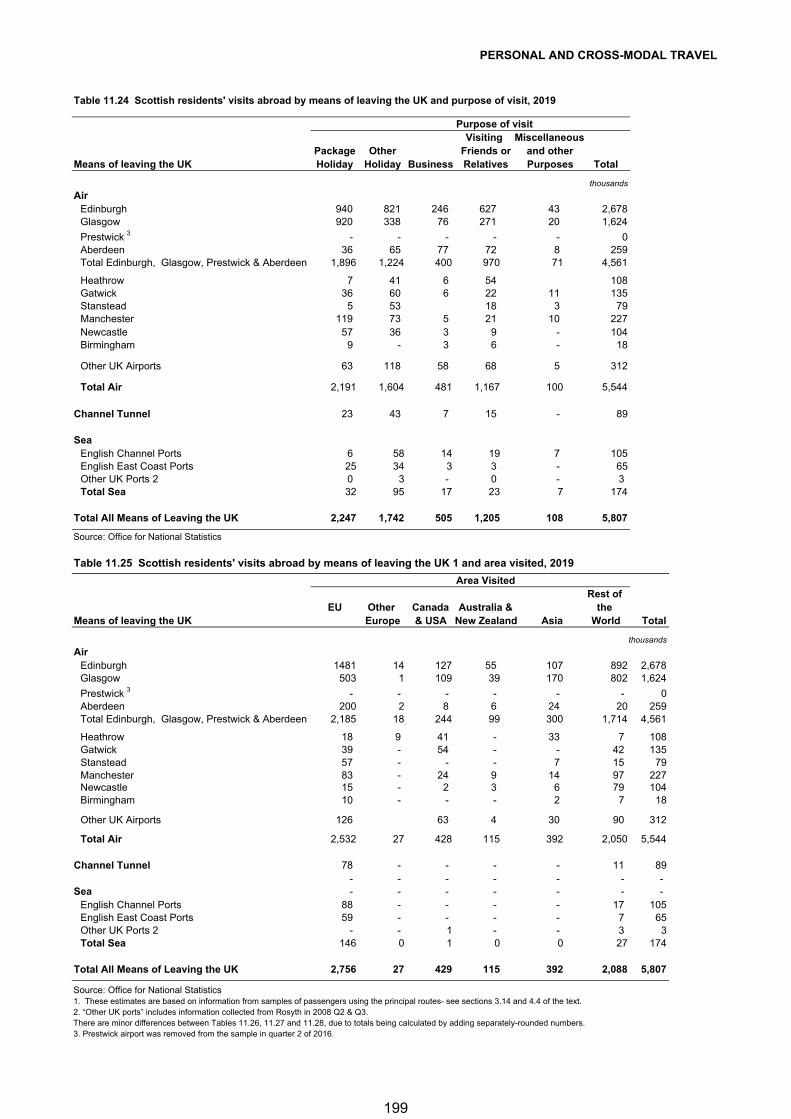
PERSONAL AND CROSS-MODAL TRAVEL
Table 11.24 Scottish residents' visits abroad by means of leaving the UK and purpose of visit, 2019
Purpose of visit Visiting Miscellaneous
Package Other Friends or and otherMeans of leaving the UK Holiday Holiday Business Relatives Purposes Total
thousands
AirEdinburgh 940 821 246 627 43 2,678Glasgow 920 338 76 271 20 1,624
Prestwick 3 - - - - - 0Aberdeen 36 65 77 72 8 259Total Edinburgh, Glasgow, Prestwick & Aberdeen 1,896 1,224 400 970 71 4,561
Heathrow 7 41 6 54 108Gatwick 36 60 6 22 11 135Stanstead 5 53 18 3 79Manchester 119 73 5 21 10 227Newcastle 57 36 3 9 - 104Birmingham 9 - 3 6 - 18
Other UK Airports 63 118 58 68 5 312
Total Air 2,191 1,604 481 1,167 100 5,544
Channel Tunnel 23 43 7 15 - 89
SeaEnglish Channel Ports 6 58 14 19 7 105English East Coast Ports 25 34 3 3 - 65Other UK Ports 2 0 3 - 0 - 3 Total Sea 32 95 17 23 7 174
Total All Means of Leaving the UK 2,247 1,742 505 1,205 108 5,807
Source: Office for National Statistics
Table 11.25 Scottish residents' visits abroad by means of leaving the UK 1 and area visited, 2019 Area Visited
Rest of EU Other Canada Australia & the
Means of leaving the UK Europe & USA New Zealand Asia World Total
thousands
AirEdinburgh 1481 14 127 55 107 892 2,678Glasgow 503 1 109 39 170 802 1,624
Prestwick 3 - - - - - - 0Aberdeen 200 2 8 6 24 20 259Total Edinburgh, Glasgow, Prestwick & Aberdeen 2,185 18 244 99 300 1,714 4,561
Heathrow 18 9 41 - 33 7 108Gatwick 39 - 54 - - 42 135Stanstead 57 - - - 7 15 79Manchester 83 - 24 9 14 97 227Newcastle 15 - 2 3 6 79 104Birmingham 10 - - - 2 7 18
Other UK Airports 126 63 4 30 90 312
Total Air 2,532 27 428 115 392 2,050 5,544
Channel Tunnel 78 - - - - 11 89- - - - - - -
Sea - - - - - - - English Channel Ports 88 - - - - 17 105English East Coast Ports 59 - - - - 7 65Other UK Ports 2 - - 1 - - 3 3Total Sea 146 0 1 0 0 27 174
Total All Means of Leaving the UK 2,756 27 429 115 392 2,088 5,807
Source: Office for National Statistics1. These estimates are based on information from samples of passengers using the principal routes- see sections 3.14 and 4.4 of the text.2. “Other UK ports” includes information collected from Rosyth in 2008 Q2 & Q3. There are minor differences between Tables 11.26, 11.27 and 11.28, due to totals being calculated by adding separately-rounded numbers.3. Prestwick airport was removed from the sample in quarter 2 of 2016.
199
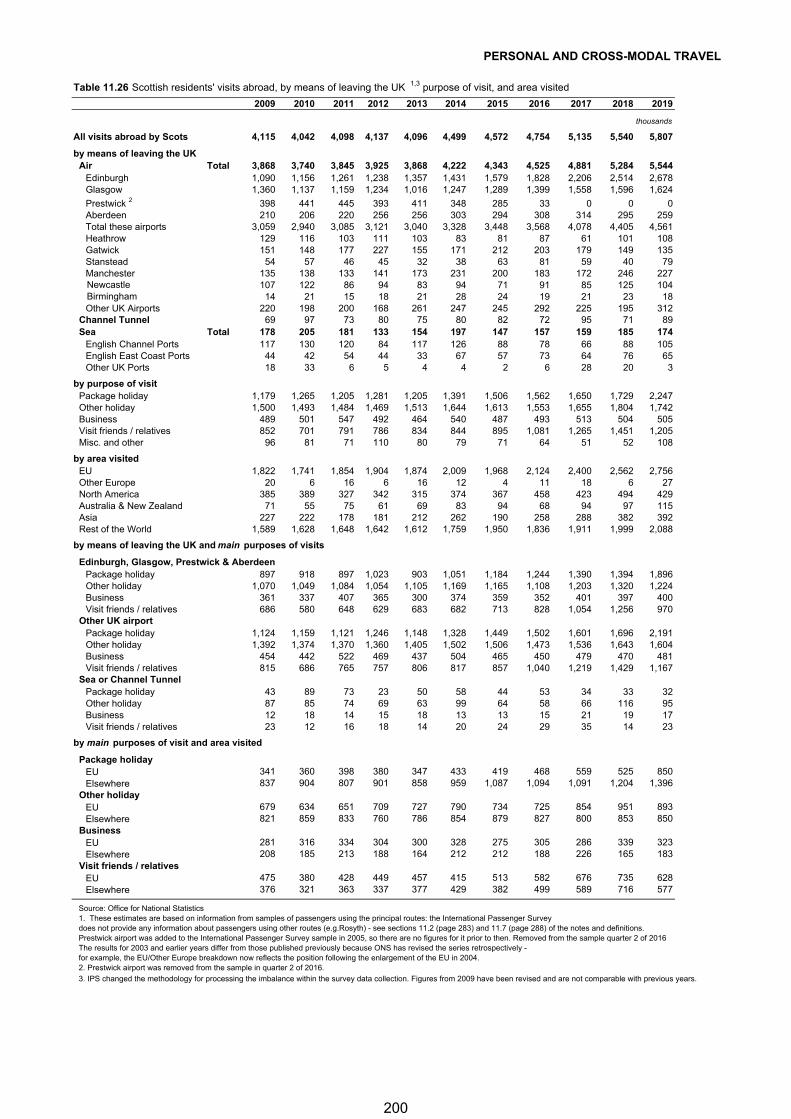
PERSONAL AND CROSS-MODAL TRAVEL
Table 11.26 Scottish residents' visits abroad, by means of leaving the UK 1,3 purpose of visit, and area visited 2009 2010 2011 2012 2013 2014 2015 2016 2017 2018 2019
thousands
All visits abroad by Scots 4,115 4,042 4,098 4,137 4,096 4,499 4,572 4,754 5,135 5,540 5,807
by means of leaving the UKAir Total 3,868 3,740 3,845 3,925 3,868 4,222 4,343 4,525 4,881 5,284 5,544
Edinburgh 1,090 1,156 1,261 1,238 1,357 1,431 1,579 1,828 2,206 2,514 2,678Glasgow 1,360 1,137 1,159 1,234 1,016 1,247 1,289 1,399 1,558 1,596 1,624
Prestwick 2 398 441 445 393 411 348 285 33 0 0 0Aberdeen 210 206 220 256 256 303 294 308 314 295 259Total these airports 3,059 2,940 3,085 3,121 3,040 3,328 3,448 3,568 4,078 4,405 4,561Heathrow 129 116 103 111 103 83 81 87 61 101 108Gatwick 151 148 177 227 155 171 212 203 179 149 135Stanstead 54 57 46 45 32 38 63 81 59 40 79Manchester 135 138 133 141 173 231 200 183 172 246 227
107 122 86 94 83 94 71 91 85 125 10414 21 15 18 21 28 24 19 21 23 18
Other UK Airports 220 198 200 168 261 247 245 292 225 195 312Channel Tunnel 69 97 73 80 75 80 82 72 95 71 89Sea Total 178 205 181 133 154 197 147 157 159 185 174
English Channel Ports 117 130 120 84 117 126 88 78 66 88 105English East Coast Ports 44 42 54 44 33 67 57 73 64 76 65Other UK Ports 18 33 6 5 4 4 2 6 28 20 3
by purpose of visitPackage holiday 1,179 1,265 1,205 1,281 1,205 1,391 1,506 1,562 1,650 1,729 2,247Other holiday 1,500 1,493 1,484 1,469 1,513 1,644 1,613 1,553 1,655 1,804 1,742Business 489 501 547 492 464 540 487 493 513 504 505Visit friends / relatives 852 701 791 786 834 844 895 1,081 1,265 1,451 1,205Misc. and other 96 81 71 110 80 79 71 64 51 52 108
by area visitedEU 1,822 1,741 1,854 1,904 1,874 2,009 1,968 2,124 2,400 2,562 2,756Other Europe 20 6 16 6 16 12 4 11 18 6 27North America 385 389 327 342 315 374 367 458 423 494 429Australia & New Zealand 71 55 75 61 69 83 94 68 94 97 115Asia 227 222 178 181 212 262 190 258 288 382 392Rest of the World 1,589 1,628 1,648 1,642 1,612 1,759 1,950 1,836 1,911 1,999 2,088
by means of leaving the UK and main purposes of visits
Edinburgh, Glasgow, Prestwick & AberdeenPackage holiday 897 918 897 1,023 903 1,051 1,184 1,244 1,390 1,394 1,896Other holiday 1,070 1,049 1,084 1,054 1,105 1,169 1,165 1,108 1,203 1,320 1,224Business 361 337 407 365 300 374 359 352 401 397 400Visit friends / relatives 686 580 648 629 683 682 713 828 1,054 1,256 970
Other UK airportPackage holiday 1,124 1,159 1,121 1,246 1,148 1,328 1,449 1,502 1,601 1,696 2,191Other holiday 1,392 1,374 1,370 1,360 1,405 1,502 1,506 1,473 1,536 1,643 1,604Business 454 442 522 469 437 504 465 450 479 470 481Visit friends / relatives 815 686 765 757 806 817 857 1,040 1,219 1,429 1,167
Sea or Channel TunnelPackage holiday 43 89 73 23 50 58 44 53 34 33 32Other holiday 87 85 74 69 63 99 64 58 66 116 95Business 12 18 14 15 18 13 13 15 21 19 17Visit friends / relatives 23 12 16 18 14 20 24 29 35 14 23
by main purposes of visit and area visited
Package holidayEU 341 360 398 380 347 433 419 468 559 525 850Elsewhere 837 904 807 901 858 959 1,087 1,094 1,091 1,204 1,396
Other holidayEU 679 634 651 709 727 790 734 725 854 951 893Elsewhere 821 859 833 760 786 854 879 827 800 853 850
BusinessEU 281 316 334 304 300 328 275 305 286 339 323Elsewhere 208 185 213 188 164 212 212 188 226 165 183
Visit friends / relativesEU 475 380 428 449 457 415 513 582 676 735 628Elsewhere 376 321 363 337 377 429 382 499 589 716 577
Source: Office for National Statistics1. These estimates are based on information from samples of passengers using the principal routes: the International Passenger Surveydoes not provide any information about passengers using other routes (e.g.Rosyth) - see sections 11.2 (page 283) and 11.7 (page 288) of the notes and definitions.Prestwick airport was added to the International Passenger Survey sample in 2005, so there are no figures for it prior to then. Removed from the sample quarter 2 of 2016The results for 2003 and earlier years differ from those published previously because ONS has revised the series retrospectively -for example, the EU/Other Europe breakdown now reflects the position following the enlargement of the EU in 2004.2. Prestwick airport was removed from the sample in quarter 2 of 2016.
3. IPS changed the methodology for processing the imbalance within the survey data collection. Figures from 2009 have been revised and are not comparable with previous years.
Newcastle Birmingham
200
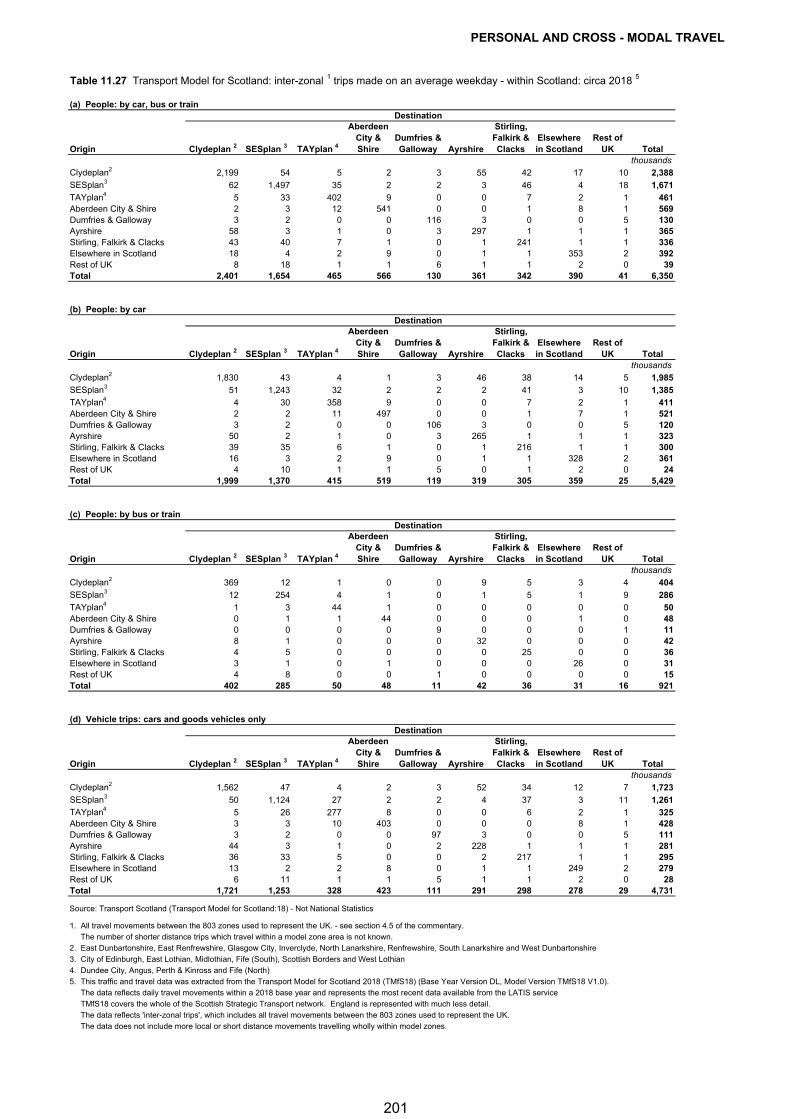
PERSONAL AND CROSS - MODAL TRAVEL
Table 11.27 Transport Model for Scotland: inter-zonal 1 trips made on an average weekday - within Scotland: circa 2018 5
(a) People: by car, bus or train Destination
Origin Clydeplan 2 SESplan 3 TAYplan 4
Aberdeen City & Shire
Dumfries & Galloway Ayrshire
Stirling, Falkirk & Clacks
Elsewhere in Scotland
Rest of UK Total
thousands
Clydeplan2 2,199 54 5 2 3 55 42 17 10 2,388
SESplan3 62 1,497 35 2 2 3 46 4 18 1,671
TAYplan4 5 33 402 9 0 0 7 2 1 461Aberdeen City & Shire 2 3 12 541 0 0 1 8 1 569Dumfries & Galloway 3 2 0 0 116 3 0 0 5 130Ayrshire 58 3 1 0 3 297 1 1 1 365Stirling, Falkirk & Clacks 43 40 7 1 0 1 241 1 1 336Elsewhere in Scotland 18 4 2 9 0 1 1 353 2 392Rest of UK 8 18 1 1 6 1 1 2 0 39Total 2,401 1,654 465 566 130 361 342 390 41 6,350
(b) People: by car Destination
Origin Clydeplan 2 SESplan 3 TAYplan 4
Aberdeen City & Shire
Dumfries & Galloway Ayrshire
Stirling, Falkirk & Clacks
Elsewhere in Scotland
Rest of UK Total
thousands
Clydeplan2 1,830 43 4 1 3 46 38 14 5 1,985
SESplan3 51 1,243 32 2 2 2 41 3 10 1,385
TAYplan4 4 30 358 9 0 0 7 2 1 411Aberdeen City & Shire 2 2 11 497 0 0 1 7 1 521Dumfries & Galloway 3 2 0 0 106 3 0 0 5 120Ayrshire 50 2 1 0 3 265 1 1 1 323Stirling, Falkirk & Clacks 39 35 6 1 0 1 216 1 1 300Elsewhere in Scotland 16 3 2 9 0 1 1 328 2 361Rest of UK 4 10 1 1 5 0 1 2 0 24Total 1,999 1,370 415 519 119 319 305 359 25 5,429
(c) People: by bus or train Destination
Origin Clydeplan 2 SESplan 3 TAYplan 4
Aberdeen City & Shire
Dumfries & Galloway Ayrshire
Stirling, Falkirk & Clacks
Elsewhere in Scotland
Rest of UK Total
thousands
Clydeplan2 369 12 1 0 0 9 5 3 4 404
SESplan3 12 254 4 1 0 1 5 1 9 286
TAYplan4 1 3 44 1 0 0 0 0 0 50Aberdeen City & Shire 0 1 1 44 0 0 0 1 0 48Dumfries & Galloway 0 0 0 0 9 0 0 0 1 11Ayrshire 8 1 0 0 0 32 0 0 0 42Stirling, Falkirk & Clacks 4 5 0 0 0 0 25 0 0 36Elsewhere in Scotland 3 1 0 1 0 0 0 26 0 31Rest of UK 4 8 0 0 1 0 0 0 0 15Total 402 285 50 48 11 42 36 31 16 921
(d) Vehicle trips: cars and goods vehicles onlyDestination
Origin Clydeplan 2 SESplan 3 TAYplan 4
Aberdeen City & Shire
Dumfries & Galloway Ayrshire
Stirling, Falkirk & Clacks
Elsewhere in Scotland
Rest of UK Total
thousands
Clydeplan2 1,562 47 4 2 3 52 34 12 7 1,723
SESplan3 50 1,124 27 2 2 4 37 3 11 1,261
TAYplan4 5 26 277 8 0 0 6 2 1 325Aberdeen City & Shire 3 3 10 403 0 0 0 8 1 428Dumfries & Galloway 3 2 0 0 97 3 0 0 5 111Ayrshire 44 3 1 0 2 228 1 1 1 281Stirling, Falkirk & Clacks 36 33 5 0 0 2 217 1 1 295Elsewhere in Scotland 13 2 2 8 0 1 1 249 2 279Rest of UK 6 11 1 1 5 1 1 2 0 28Total 1,721 1,253 328 423 111 291 298 278 29 4,731
Source: Transport Scotland (Transport Model for Scotland:18) - Not National Statistics
1. All travel movements between the 803 zones used to represent the UK. - see section 4.5 of the commentary.
The number of shorter distance trips which travel within a model zone area is not known.
2. East Dunbartonshire, East Renfrewshire, Glasgow City, Inverclyde, North Lanarkshire, Renfrewshire, South Lanarkshire and West Dunbartonshire
3. City of Edinburgh, East Lothian, Midlothian, Fife (South), Scottish Borders and West Lothian
4. Dundee City, Angus, Perth & Kinross and Fife (North)
5. This traffic and travel data was extracted from the Transport Model for Scotland 2018 (TMfS18) (Base Year Version DL, Model Version TMfS18 V1.0).
The data reflects daily travel movements within a 2018 base year and represents the most recent data available from the LATIS service
TMfS18 covers the whole of the Scottish Strategic Transport network. England is represented with much less detail.
The data reflects 'inter-zonal trips', which includes all travel movements between the 803 zones used to represent the UK.
The data does not include more local or short distance movements travelling wholly within model zones.
201
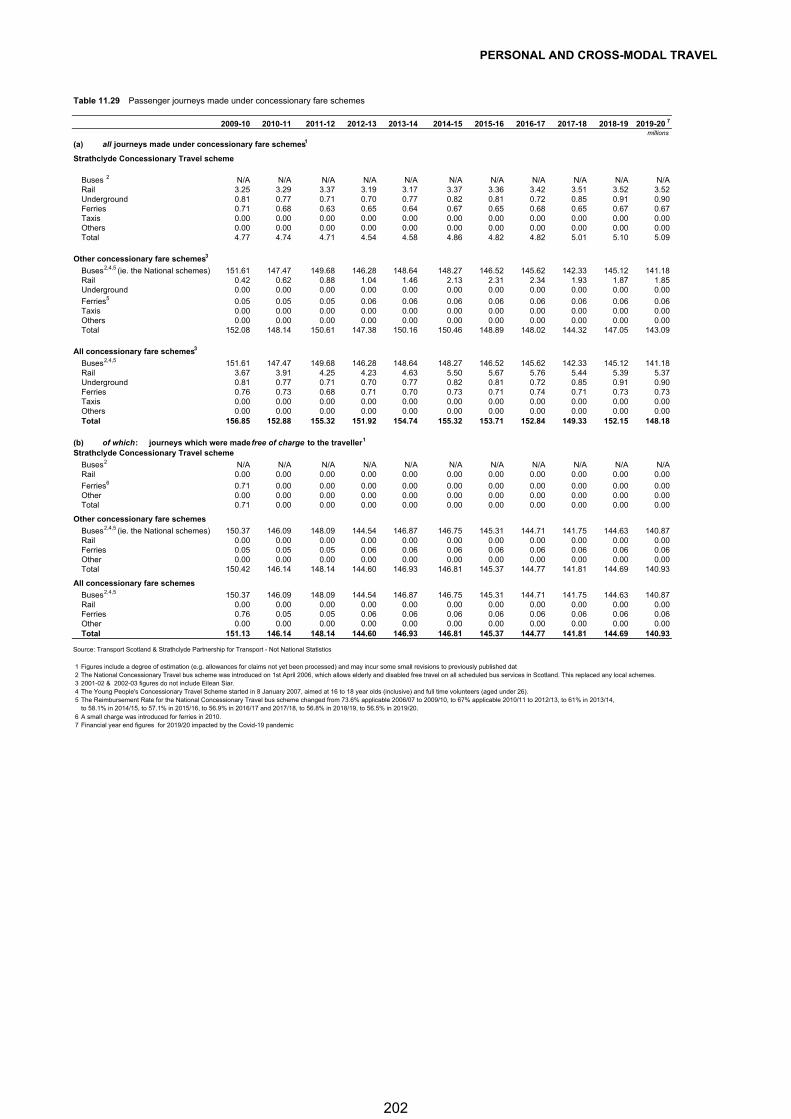
PERSONAL AND CROSS-MODAL TRAVEL
Table 11.29 Passenger journeys made under concessionary fare schemes
2009-10 2010-11 2011-12 2012-13 2013-14 2014-15 2015-16 2016-17 2017-18 2018-19 2019-20 7
millions
(a) all journeys made under concessionary fare schemes1
Strathclyde Concessionary Travel scheme
Buses 2 N/A N/A N/A N/A N/A N/A N/A N/A N/A N/A N/ARail 3.25 3.29 3.37 3.19 3.17 3.37 3.36 3.42 3.51 3.52 3.52Underground 0.81 0.77 0.71 0.70 0.77 0.82 0.81 0.72 0.85 0.91 0.90Ferries 0.71 0.68 0.63 0.65 0.64 0.67 0.65 0.68 0.65 0.67 0.67Taxis 0.00 0.00 0.00 0.00 0.00 0.00 0.00 0.00 0.00 0.00 0.00Others 0.00 0.00 0.00 0.00 0.00 0.00 0.00 0.00 0.00 0.00 0.00Total 4.77 4.74 4.71 4.54 4.58 4.86 4.82 4.82 5.01 5.10 5.09
Other concessionary fare schemes3
Buses2,4,5 (ie. the National schemes) 151.61 147.47 149.68 146.28 148.64 148.27 146.52 145.62 142.33 145.12 141.18Rail 0.42 0.62 0.88 1.04 1.46 2.13 2.31 2.34 1.93 1.87 1.85Underground 0.00 0.00 0.00 0.00 0.00 0.00 0.00 0.00 0.00 0.00 0.00
Ferries5 0.05 0.05 0.05 0.06 0.06 0.06 0.06 0.06 0.06 0.06 0.06Taxis 0.00 0.00 0.00 0.00 0.00 0.00 0.00 0.00 0.00 0.00 0.00Others 0.00 0.00 0.00 0.00 0.00 0.00 0.00 0.00 0.00 0.00 0.00Total 152.08 148.14 150.61 147.38 150.16 150.46 148.89 148.02 144.32 147.05 143.09
All concessionary fare schemes3
Buses2,4,5 151.61 147.47 149.68 146.28 148.64 148.27 146.52 145.62 142.33 145.12 141.18Rail 3.67 3.91 4.25 4.23 4.63 5.50 5.67 5.76 5.44 5.39 5.37Underground 0.81 0.77 0.71 0.70 0.77 0.82 0.81 0.72 0.85 0.91 0.90Ferries 0.76 0.73 0.68 0.71 0.70 0.73 0.71 0.74 0.71 0.73 0.73Taxis 0.00 0.00 0.00 0.00 0.00 0.00 0.00 0.00 0.00 0.00 0.00Others 0.00 0.00 0.00 0.00 0.00 0.00 0.00 0.00 0.00 0.00 0.00Total 156.85 152.88 155.32 151.92 154.74 155.32 153.71 152.84 149.33 152.15 148.18
(b) of which: journeys which were made free of charge to the traveller1
Strathclyde Concessionary Travel scheme
Buses2 N/A N/A N/A N/A N/A N/A N/A N/A N/A N/A N/ARail 0.00 0.00 0.00 0.00 0.00 0.00 0.00 0.00 0.00 0.00 0.00
Ferries6 0.71 0.00 0.00 0.00 0.00 0.00 0.00 0.00 0.00 0.00 0.00Other 0.00 0.00 0.00 0.00 0.00 0.00 0.00 0.00 0.00 0.00 0.00Total 0.71 0.00 0.00 0.00 0.00 0.00 0.00 0.00 0.00 0.00 0.00
Other concessionary fare schemes
Buses2,4,5 (ie. the National schemes) 150.37 146.09 148.09 144.54 146.87 146.75 145.31 144.71 141.75 144.63 140.87Rail 0.00 0.00 0.00 0.00 0.00 0.00 0.00 0.00 0.00 0.00 0.00Ferries 0.05 0.05 0.05 0.06 0.06 0.06 0.06 0.06 0.06 0.06 0.06Other 0.00 0.00 0.00 0.00 0.00 0.00 0.00 0.00 0.00 0.00 0.00Total 150.42 146.14 148.14 144.60 146.93 146.81 145.37 144.77 141.81 144.69 140.93
All concessionary fare schemes
Buses2,4,5 150.37 146.09 148.09 144.54 146.87 146.75 145.31 144.71 141.75 144.63 140.87Rail 0.00 0.00 0.00 0.00 0.00 0.00 0.00 0.00 0.00 0.00 0.00Ferries 0.76 0.05 0.05 0.06 0.06 0.06 0.06 0.06 0.06 0.06 0.06Other 0.00 0.00 0.00 0.00 0.00 0.00 0.00 0.00 0.00 0.00 0.00Total 151.13 146.14 148.14 144.60 146.93 146.81 145.37 144.77 141.81 144.69 140.93
Source: Transport Scotland & Strathclyde Partnership for Transport - Not National Statistics
1 Figures include a degree of estimation (e.g. allowances for claims not yet been processed) and may incur some small revisions to previously published dat2 The National Concessionary Travel bus scheme was introduced on 1st April 2006, which allows elderly and disabled free travel on all scheduled bus services in Scotland. This replaced any local schemes. 3 2001-02 & 2002-03 figures do not include Eilean Siar.4 The Young People's Concessionary Travel Scheme started in 8 January 2007, aimed at 16 to 18 year olds (inclusive) and full time volunteers (aged under 26).5 The Reimbursement Rate for the National Concessionary Travel bus scheme changed from 73.6% applicable 2006/07 to 2009/10, to 67% applicable 2010/11 to 2012/13, to 61% in 2013/14,
to 58.1% in 2014/15, to 57.1% in 2015/16, to 56.9% in 2016/17 and 2017/18, to 56.8% in 2018/19, to 56.5% in 2019/20.6 A small charge was introduced for ferries in 2010.7 Financial year end figures for 2019/20 impacted by the Covid-19 pandemic
202
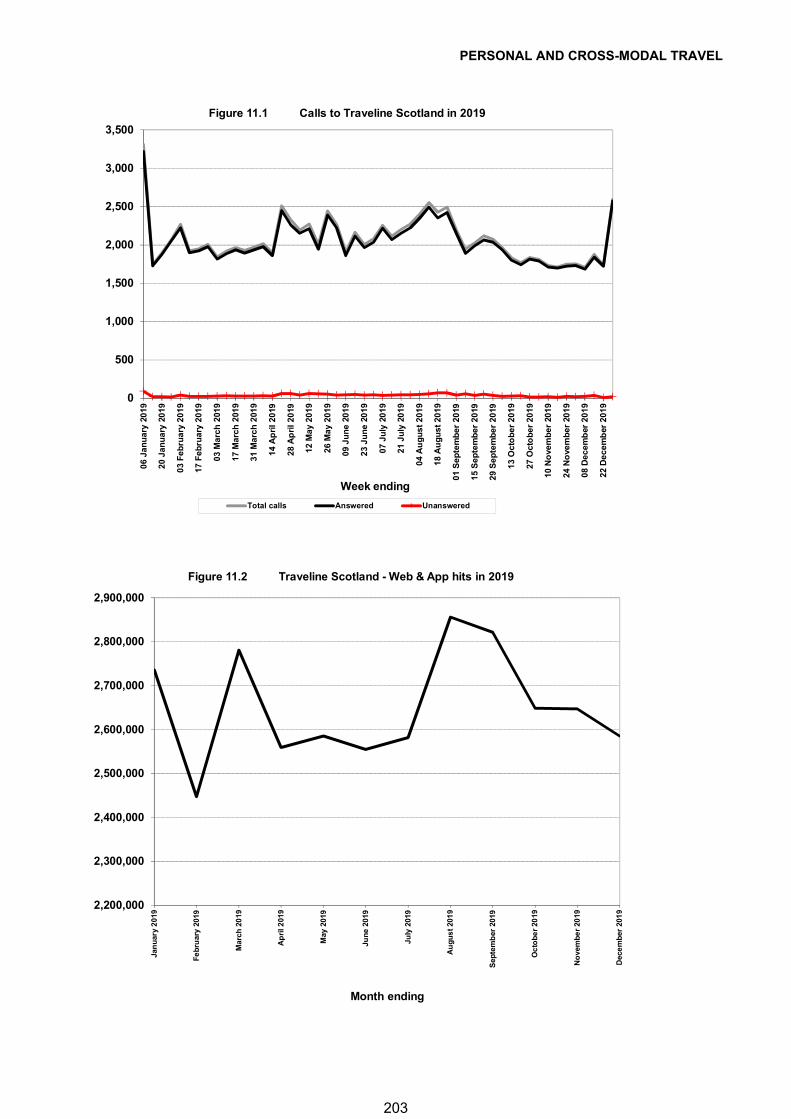
PERSONAL AND CROSS-MODAL TRAVEL
0
500
1,000
1,500
2,000
2,500
3,000
3,50006
Jan
uar
y 20
19
20 J
anu
ary
2019
03 F
ebru
ary
2019
17 F
ebru
ary
2019
03 M
arch
201
9
17 M
arch
201
9
31 M
arch
201
9
14 A
pri
l 201
9
28 A
pri
l 201
9
12 M
ay 2
019
26 M
ay 2
019
09 J
un
e 20
19
23 J
un
e 20
19
07 J
uly
201
9
21 J
uly
201
9
04 A
ug
ust
201
9
18 A
ug
ust
201
9
01 S
epte
mb
er 2
019
15 S
epte
mb
er 2
019
29 S
epte
mb
er 2
019
13 O
cto
ber
201
9
27 O
cto
ber
201
9
10 N
ove
mb
er 2
019
24 N
ove
mb
er 2
019
08 D
ecem
ber
201
9
22 D
ecem
ber
201
9
Week ending
Figure 11.1 Calls to Traveline Scotland in 2019
Total calls Answered Unanswered
2,200,000
2,300,000
2,400,000
2,500,000
2,600,000
2,700,000
2,800,000
2,900,000
Jan
uar
y 2
019
Fe
bru
ary
2019
Mar
ch 2
019
Ap
ril 2
019
May
201
9
Jun
e 20
19
July
201
9
Au
gu
st
201
9
Sep
tem
ber
201
9
Oc
tob
er
2019
No
vem
be
r 20
19
Dec
em
ber
201
9
Month ending
Figure 11.2 Traveline Scotland - Web & App hits in 2019
203
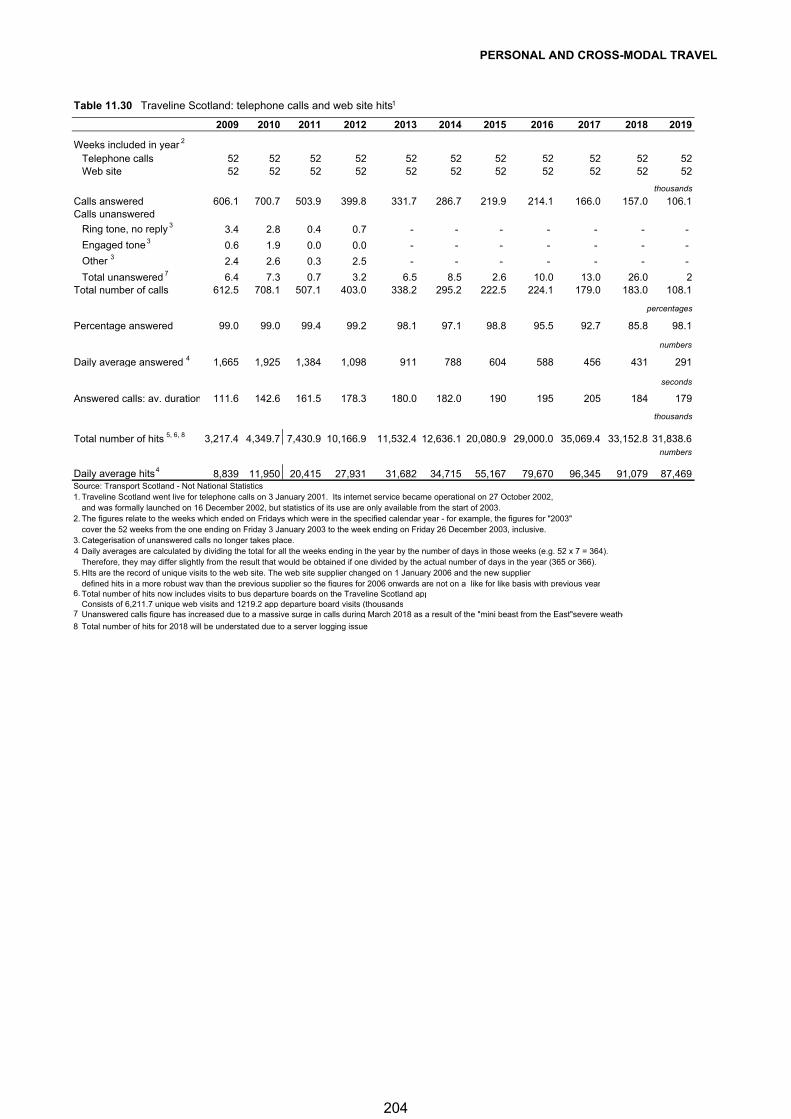
PERSONAL AND CROSS-MODAL TRAVEL
Table 11.30 Traveline Scotland: telephone calls and web site hits 1
2009 2010 2011 2012 2013 2014 2015 2016 2017 2018 2019
Weeks included in year 2
Telephone calls 52 52 52 52 52 52 52 52 52 52 52Web site 52 52 52 52 52 52 52 52 52 52 52
thousands
Calls answered 606.1 700.7 503.9 399.8 331.7 286.7 219.9 214.1 166.0 157.0 106.1Calls unanswered
Ring tone, no reply 3 3.4 2.8 0.4 0.7 - - - - - - -
Engaged tone 3 0.6 1.9 0.0 0.0 - - - - - - -
Other 3 2.4 2.6 0.3 2.5 - - - - - - -
Total unanswered 7 6.4 7.3 0.7 3.2 6.5 8.5 2.6 10.0 13.0 26.0 2Total number of calls 612.5 708.1 507.1 403.0 338.2 295.2 222.5 224.1 179.0 183.0 108.1
percentages
Percentage answered 99.0 99.0 99.4 99.2 98.1 97.1 98.8 95.5 92.7 85.8 98.1
numbers
Daily average answered 4 1,665 1,925 1,384 1,098 911 788 604 588 456 431 291
seconds
Answered calls: av. duration 111.6 142.6 161.5 178.3 180.0 182.0 190 195 205 184 179
thousands
Total number of hits 5, 6, 8 3,217.4 4,349.7 7,430.9 10,166.9 11,532.4 12,636.1 20,080.9 29,000.0 35,069.4 33,152.8 31,838.6numbers
Daily average hits 4 8,839 11,950 20,415 27,931 31,682 34,715 55,167 79,670 96,345 91,079 87,469Source: Transport Scotland - Not National Statistics1. Traveline Scotland went live for telephone calls on 3 January 2001. Its internet service became operational on 27 October 2002,
and was formally launched on 16 December 2002, but statistics of its use are only available from the start of 2003.2. The figures relate to the weeks which ended on Fridays which were in the specified calendar year - for example, the figures for "2003"
cover the 52 weeks from the one ending on Friday 3 January 2003 to the week ending on Friday 26 December 2003, inclusive.3. Categerisation of unanswered calls no longer takes place.4 Daily averages are calculated by dividing the total for all the weeks ending in the year by the number of days in those weeks (e.g. 52 x 7 = 364).
Therefore, they may differ slightly from the result that would be obtained if one divided by the actual number of days in the year (365 or 366).5. HIts are the record of unique visits to the web site. The web site supplier changed on 1 January 2006 and the new supplier
defined hits in a more robust way than the previous supplier so the figures for 2006 onwards are not on a like for like basis with previous year6. Total number of hits now includes visits to bus departure boards on the Traveline Scotland app
Consists of 6,211.7 unique web visits and 1219.2 app departure board visits (thousands7 Unanswered calls figure has increased due to a massive surge in calls during March 2018 as a result of the "mini beast from the East"severe weathe
8 Total number of hits for 2018 will be understated due to a server logging issue
204
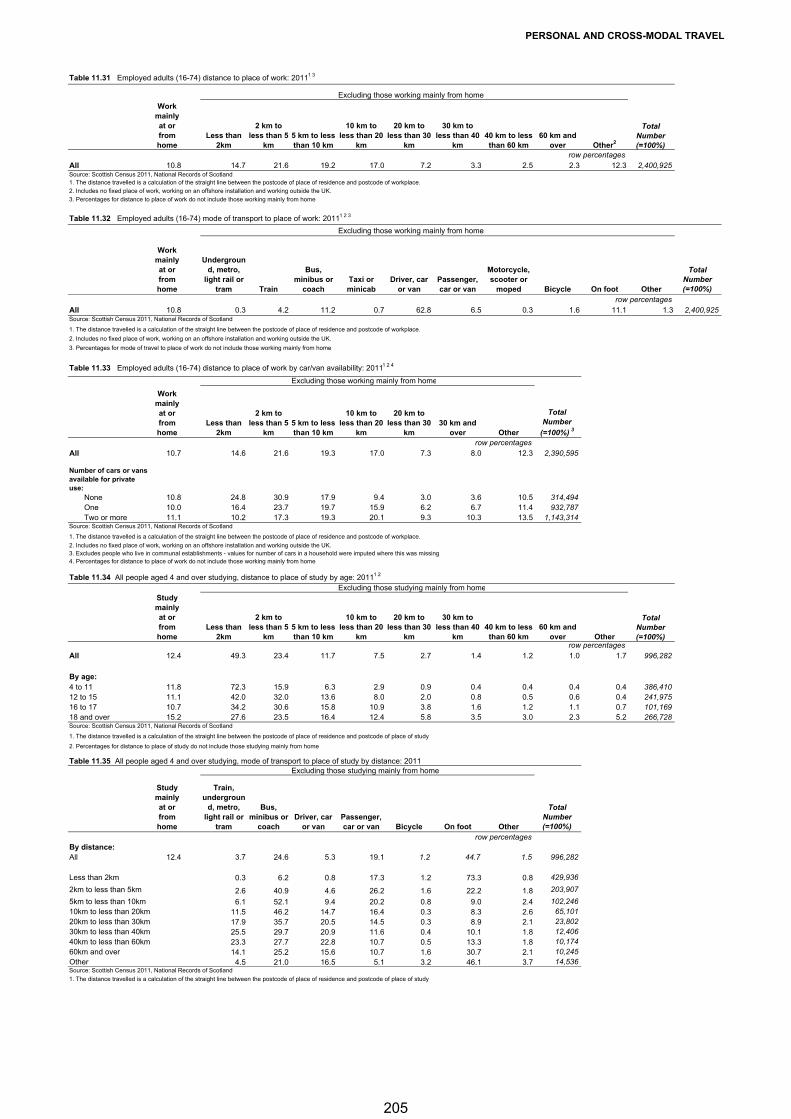
PERSONAL AND CROSS-MODAL TRAVEL
Table 11.31 Employed adults (16-74) distance to place of work: 20111 3
Excluding those working mainly from home
row percentagesAll 10.8 14.7 21.6 19.2 17.0 7.2 3.3 2.5 2.3 12.3 2,400,925Source: Scottish Census 2011, National Records of Scotland1. The distance travelled is a calculation of the straight line between the postcode of place of residence and postcode of workplace.
2. Includes no fixed place of work, working on an offshore installation and working outside the UK.
3. Percentages for distance to place of work do not include those working mainly from home
Table 11.32 Employed adults (16-74) mode of transport to place of work: 20111 2 3
Excluding those working mainly from home
Work mainly at or from home
Underground, metro,
light rail or tram Train
Bus, minibus or
coachTaxi or minicab
Driver, car or van
Passenger, car or van
Motorcycle, scooter or
moped Bicycle On foot Other
Total Number (=100%)
row percentagesAll 10.8 0.3 4.2 11.2 0.7 62.8 6.5 0.3 1.6 11.1 1.3 2,400,925Source: Scottish Census 2011, National Records of Scotland
1. The distance travelled is a calculation of the straight line between the postcode of place of residence and postcode of workplace.
2. Includes no fixed place of work, working on an offshore installation and working outside the UK.
3. Percentages for mode of travel to place of work do not include those working mainly from home
Table 11.33 Employed adults (16-74) distance to place of work by car/van availability: 20111 2 4
Excluding those working mainly from home
row percentagesAll 10.7 14.6 21.6 19.3 17.0 7.3 8.0 12.3 2,390,595
Number of cars or vans available for private use: None 10.8 24.8 30.9 17.9 9.4 3.0 3.6 10.5 314,494 One 10.0 16.4 23.7 19.7 15.9 6.2 6.7 11.4 932,787 Two or more 11.1 10.2 17.3 19.3 20.1 9.3 10.3 13.5 1,143,314Source: Scottish Census 2011, National Records of Scotland
1. The distance travelled is a calculation of the straight line between the postcode of place of residence and postcode of workplace.
2. Includes no fixed place of work, working on an offshore installation and working outside the UK.3. Excludes people who live in communal establishments - values for number of cars in a household were imputed where this was missing4. Percentages for distance to place of work do not include those working mainly from home
Table 11.34 All people aged 4 and over studying, distance to place of study by age: 20111 2
Excluding those studying mainly from home
row percentagesAll 12.4 49.3 23.4 11.7 7.5 2.7 1.4 1.2 1.0 1.7 996,282
By age:4 to 11 11.8 72.3 15.9 6.3 2.9 0.9 0.4 0.4 0.4 0.4 386,41012 to 15 11.1 42.0 32.0 13.6 8.0 2.0 0.8 0.5 0.6 0.4 241,97516 to 17 10.7 34.2 30.6 15.8 10.9 3.8 1.6 1.2 1.1 0.7 101,16918 and over 15.2 27.6 23.5 16.4 12.4 5.8 3.5 3.0 2.3 5.2 266,728Source: Scottish Census 2011, National Records of Scotland
1. The distance travelled is a calculation of the straight line between the postcode of place of residence and postcode of place of study
2. Percentages for distance to place of study do not include those studying mainly from home
Table 11.35 All people aged 4 and over studying, mode of transport to place of study by distance: 2011Excluding those studying mainly from home
Study mainly at or from home
Train, undergroun
d, metro, light rail or
tram
Bus, minibus or
coachDriver, car
or vanPassenger, car or van Bicycle On foot Other
Total Number (=100%)
row percentagesBy distance:All 12.4 3.7 24.6 5.3 19.1 1.2 44.7 1.5 996,282
Less than 2km 0.3 6.2 0.8 17.3 1.2 73.3 0.8 429,936
2km to less than 5km 2.6 40.9 4.6 26.2 1.6 22.2 1.8 203,907
5km to less than 10km 6.1 52.1 9.4 20.2 0.8 9.0 2.4 102,24610km to less than 20km 11.5 46.2 14.7 16.4 0.3 8.3 2.6 65,10120km to less than 30km 17.9 35.7 20.5 14.5 0.3 8.9 2.1 23,80230km to less than 40km 25.5 29.7 20.9 11.6 0.4 10.1 1.8 12,40640km to less than 60km 23.3 27.7 22.8 10.7 0.5 13.3 1.8 10,17460km and over 14.1 25.2 15.6 10.7 1.6 30.7 2.1 10,245Other 4.5 21.0 16.5 5.1 3.2 46.1 3.7 14,536Source: Scottish Census 2011, National Records of Scotland
1. The distance travelled is a calculation of the straight line between the postcode of place of residence and postcode of place of study
60 km and over Other
Total Number (=100%)
60 km and over
Work mainly at or from home
Less than 2km
2 km to less than 5
km Other2
20 km to less than 30
km Other
5 km to less than 10 km
10 km to less than 20
km
20 km to less than 30
km
30 km to less than 40
km40 km to less than 60 km
30 km to less than 40
km40 km to less than 60 km
Total Number (=100%)
Work mainly at or from home
Less than 2km
2 km to less than 5
km 5 km to less than 10 km
10 km to less than 20
km30 km and
over
Total Number
(=100%) 3
Study mainly at or from home
Less than 2km
2 km to less than 5
km 5 km to less than 10 km
10 km to less than 20
km
20 km to less than 30
km
205
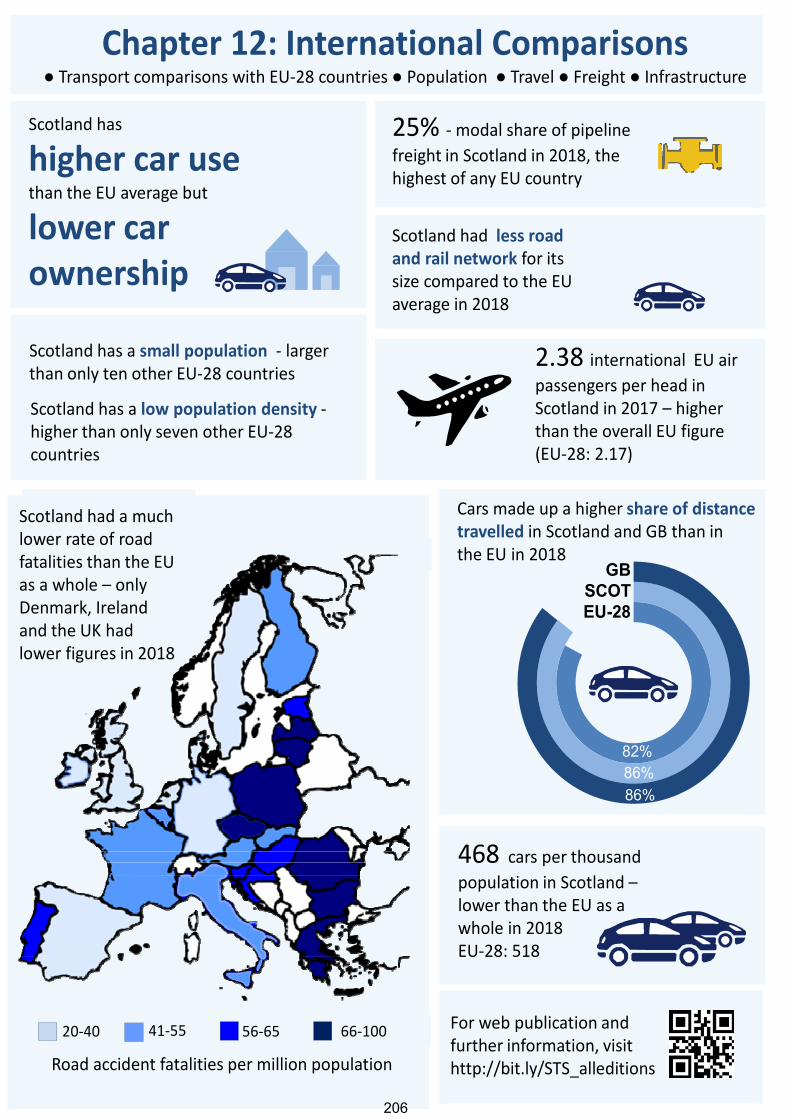
INTERNATIONAL COMPARISONS
Chapter 12: International Comparisons● Transport comparisons with EU‐28 countries ● Population ● Travel ● Freight ● Infrastructure
Scotland has a small population ‐ larger than only ten other EU‐28 countries
Scotland has
higher car use than the EU average but
lower car ownership
Scotland had less road and rail network for its size compared to the EU average in 2018
Scotland has a low population density ‐higher than only seven other EU‐28 countries
468 cars per thousand
population in Scotland –lower than the EU as a whole in 2018EU‐28: 518
2.38 international EU air passengers per head in Scotland in 2017 – higher than the overall EU figure (EU‐28: 2.17)
Cars made up a higher share of distance travelled in Scotland and GB than in the EU in 2018
82%86%
86%
GBSCOTEU-28
For web publication and further information, visithttp://bit.ly/STS_alleditions
25% ‐modal share of pipeline
freight in Scotland in 2018, the highest of any EU country
Road accident fatalities per million population
20‐40 41‐55 56‐65 66‐100
Scotland had a much lower rate of road fatalities than the EU as a whole – only Denmark, Ireland and the UK had lower figures in 2018
206
INTERNATIONAL COMPARISONS
INTERNATIONAL COMPARISONS 1. Introduction 1.1 This chapter compares some statistics for Scotland with the 28 EU member countries over a mixture of years. Due to the increased EU membership over the years overall comparisons with EU-15 and EU-28 countries are made. 1.2 Due to definitional variations across countries comparisons may not be exact (see Sections 3, 4 & 5), especially where noticeable difference exist between the UK figure and the UK/GB calculated on the same basis as the figure for Scotland. 1.4 In some cases, the EU countries' figures do not all relate to the same year. (See the Notes and Definitions section, page 228). Because of such differences, the commentary in Section 2 generally does not reference the year. General trends will tend to be similar over recent years and so the impact of this should be minimal. Key Points
Scotland has less road and rail network by area compared to the EU average. Scotland has higher car use than the EU average but lower car ownership The proportion of freight carried by road is lower than in the rest of the EU
due to the higher proportion carried by pipeline in Scotland. 2. Main points Population 2.1 Scotland has a low population: only ten of the EU-28 (Slovak Republic, Ireland, Croatia, Lithuania, Slovenia, Latvia, Estonia, Cyprus, Luxembourg and Malta) have fewer people. Scotland also has a low population density (70 people per square kilometre) compared with the overall EU average (EU-15: 123; EU-28: 115). Only seven of the EU-28 countries (Bulgaria, Estonia, Finland, Ireland, Lithuania, Latvia and Sweden) have a lower population density than Scotland. Road Network 2.2 For its area, Scotland has a short Motorway network (6.1 km of Motorway per thousand square kilometres), well below the overall EU figure (EU-15: 20.5; EU-28: 17.4). Six of the EU-28 countries (Estonia, Finland, Lithuania, Poland, Romania and Sweden) have a lower figure than Scotland. This does not include Latvia and Malta which have no motorway. 2.3 The total length of the Scottish road network relative to the area of the country is 13 per cent below the EU-28 average when ‘other roads’ and unclassified roads in Scotland are excluded (Scotland: 370 km of road per thousand square kilometres; EU-15: 446; EU-28: 428). 2.4 Scotland has a short rail network for its area (35.4 km of route per thousand square kilometres) compared with the overall EU figure (EU-15: 46.3; EU-28: 48.5). Nine of the 28 EU countries (Estonia, Finland, Greece, Ireland, Latvia, Lithuania, Portugal, Spain and Sweden) have a lower value than Scotland. This does not include Cyprus and Malta which do not have a railway network.
207
INTERNATIONAL COMPARISONS
Vehicles per Population 2.5 Scotland has few cars for the size of its population (468 per thousand population) compared with the EU as a whole (EU-15: 525; EU-28: 518). Nine of the EU-28 countries have lower figures than Scotland. 2.6 Scotland also has few goods vehicles relative to the size of its population (65 per thousand population) compared with the overall EU average (EU-15: 78; EU-28: 77). Of the EU-28, twelve countries have lower figures. 2.7 The number of new vehicle registrations in Scotland was relatively high (33 per thousand population), higher than the EU-28 average – nine of the EU-28 countries had higher rates (France, UK, Sweden, Slovenia, Austria, Denmark, Belgium, Germany, and Luxembourg). Distances travelled 2.8 Walking, cycling and motorcycles are excluded from the calculation of these modal shares, for consistency with the figures in the relevant table of the EU publication. That table shows just four modes (passenger cars, buses/coaches, railways and tram/metro) and gives their shares of the total for those four modes. Passenger cars account for a slightly higher percentage of the total travel by those four modes in Scotland (85.7%) than the EU as a whole (EU-15 86.9%; EU-28: 81.8%). Air travel 2.9 Relative to the size of its population, Scotland has more international air passengers to or from the EU-28 countries (2.38 per head of the population, not counting internal UK traffic) than the overall EU figure (EU-15: 2.46; EU-28: 2.17). Road Fatalities 2.10 Scotland's number of road deaths per million population is well below the overall EU average (Scotland: 30; EU-15: 43; EU-28: 49). Of the EU-28 countries, only Denmark, Ireland and the UK had a lower figures. Freight 2.11 For freight transport, road has a low modal share in Scotland (62.7%) compared with the overall EU figure (EU-15: 73.3%; EU-28: 73.6%). The modal share of pipelines (25.0%) was higher than in any EU country. The modal shares of rail and inland waterways in Scotland are both below the overall figures for the EU-28. 3.1 Table Comparisons Rates (per thousand population or per thousand square km) are based on the
countries' areas and populations presented in EU Energy and Transport in Figures. As figures are rounded to a few decimal places, results won’t be as precise as they using exact figures. Therefore figures should be regarded as broad indicators;
Country figures may not be on exactly the basis due to the availability of data. There
is plenty of scope for differences in interpretation or definition (e.g. should the surface area of inland lochs and lakes be included when calculating a country's area?);
208
INTERNATIONAL COMPARISONS
Scotland figures may differ from those elsewhere in Scottish Transport Statistics in order to provide Scottish figures on the same basis as the GB or UK figures given in the final two columns.
GB and UK figures are on the same basis as the figures for Scotland. The closer that
these figures are to the UK (or GB) figures from EU Energy and Transport in Figures (columns to the left of the EU-15 and EU-28), the closer that the Scottish basis is to the EU countries.
Many of the Scotland figures are derived from GB-wide surveys conducted by the
Department for Transport and UK figures may not be as readily available. As Northern Ireland may account for a small percentage of a UK figure, there is likely to be little difference between figures for GB and UK, particularly for rates.
Some of the Scotland, GB and/or UK figures appear with more significant digits than
the figures for the EU countries, increasing the precision of the rates.
209
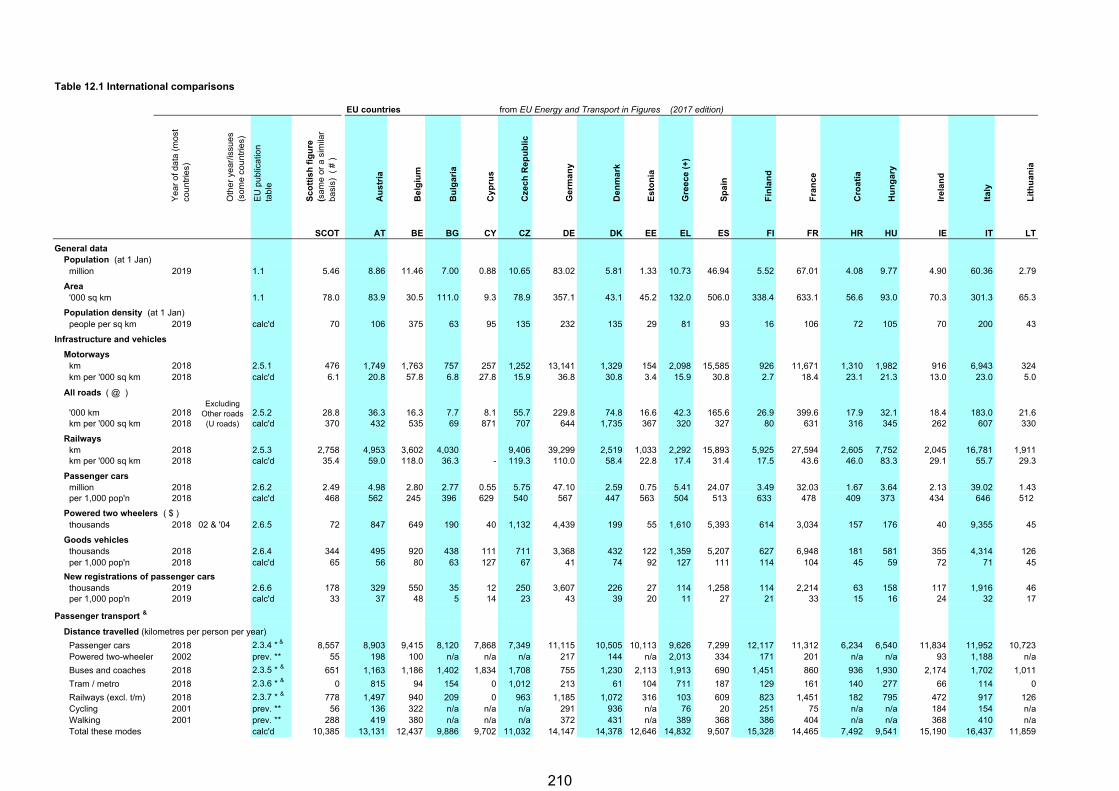
Table 12.1 International comparisons
EU countries from EU Energy and Transport in Figures (2017 edition)
Ye
ar
of d
ata
(m
ost
co
un
trie
s)
Oth
er
yea
r/is
sue
s
(so
me
co
un
trie
s)
EU
pu
blic
atio
n
tab
le
Sc
ott
ish
fig
ure
(s
am
e o
r a
sim
ilar
ba
sis)
( #
)
Au
str
ia
Be
lgiu
m
Bu
lga
ria
Cy
pru
s
Cze
ch
Re
pu
blic
Ge
rma
ny
De
nm
ark
Es
ton
ia
Gre
ec
e (
+)
Sp
ain
Fin
lan
d
Fra
nc
e
Cro
ati
a
Hu
ng
ary
Ire
lan
d
Ita
ly
Lit
hu
an
ia
SCOT AT BE BG CY CZ DE DK EE EL ES FI FR HR HU IE IT LT
General dataPopulation (at 1 Jan)
million 2019 1.1 5.46 8.86 11.46 7.00 0.88 10.65 83.02 5.81 1.33 10.73 46.94 5.52 67.01 4.08 9.77 4.90 60.36 2.79
Area'000 sq km 1.1 78.0 83.9 30.5 111.0 9.3 78.9 357.1 43.1 45.2 132.0 506.0 338.4 633.1 56.6 93.0 70.3 301.3 65.3
Population density (at 1 Jan)people per sq km 2019 calc'd 70 106 375 63 95 135 232 135 29 81 93 16 106 72 105 70 200 43
Infrastructure and vehicles
Motorwayskm 2018 2.5.1 476 1,749 1,763 757 257 1,252 13,141 1,329 154 2,098 15,585 926 11,671 1,310 1,982 916 6,943 324km per '000 sq km 2018 calc'd 6.1 20.8 57.8 6.8 27.8 15.9 36.8 30.8 3.4 15.9 30.8 2.7 18.4 23.1 21.3 13.0 23.0 5.0
All roads ( @ )
'000 km 2018 2.5.2 28.8 36.3 16.3 7.7 8.1 55.7 229.8 74.8 16.6 42.3 165.6 26.9 399.6 17.9 32.1 18.4 183.0 21.6km per '000 sq km 2018 calc'd 370 432 535 69 871 707 644 1,735 367 320 327 80 631 316 345 262 607 330
Railwayskm 2018 2.5.3 2,758 4,953 3,602 4,030 9,406 39,299 2,519 1,033 2,292 15,893 5,925 27,594 2,605 7,752 2,045 16,781 1,911km per '000 sq km 2018 calc'd 35.4 59.0 118.0 36.3 - 119.3 110.0 58.4 22.8 17.4 31.4 17.5 43.6 46.0 83.3 29.1 55.7 29.3
Passenger carsmillion 2018 2.6.2 2.49 4.98 2.80 2.77 0.55 5.75 47.10 2.59 0.75 5.41 24.07 3.49 32.03 1.67 3.64 2.13 39.02 1.43per 1,000 pop'n 2018 calc'd 468 562 245 396 629 540 567 447 563 504 513 633 478 409 373 434 646 512
Powered two wheelers ( $ )thousands 2018 02 & '04 2.6.5 72 847 649 190 40 1,132 4,439 199 55 1,610 5,393 614 3,034 157 176 40 9,355 45
Goods vehiclesthousands 2018 2.6.4 344 495 920 438 111 711 3,368 432 122 1,359 5,207 627 6,948 181 581 355 4,314 126per 1,000 pop'n 2018 calc'd 65 56 80 63 127 67 41 74 92 127 111 114 104 45 59 72 71 45
New registrations of passenger carsthousands 2019 2.6.6 178 329 550 35 12 250 3,607 226 27 114 1,258 114 2,214 63 158 117 1,916 46per 1,000 pop'n 2019 calc'd 33 37 48 5 14 23 43 39 20 11 27 21 33 15 16 24 32 17
Passenger transport &
Distance travelled (kilometres per person per year)
Passenger cars 2018 2.3.4 * & 8,557 8,903 9,415 8,120 7,868 7,349 11,115 10,505 10,113 9,626 7,299 12,117 11,312 6,234 6,540 11,834 11,952 10,723Powered two-wheeler 2002 prev. ** 55 198 100 n/a n/a n/a 217 144 n/a 2,013 334 171 201 n/a n/a 93 1,188 n/a
Buses and coaches 2018 2.3.5 * & 651 1,163 1,186 1,402 1,834 1,708 755 1,230 2,113 1,913 690 1,451 860 936 1,930 2,174 1,702 1,011
Tram / metro 2018 2.3.6 * & 0 815 94 154 0 1,012 213 61 104 711 187 129 161 140 277 66 114 0
Railways (excl. t/m) 2018 2.3.7 * & 778 1,497 940 209 0 963 1,185 1,072 316 103 609 823 1,451 182 795 472 917 126Cycling 2001 prev. ** 56 136 322 n/a n/a n/a 291 936 n/a 76 20 251 75 n/a n/a 184 154 n/aWalking 2001 prev. ** 288 419 380 n/a n/a n/a 372 431 n/a 389 368 386 404 n/a n/a 368 410 n/aTotal these modes calc'd 10,385 13,131 12,437 9,886 9,702 11,032 14,147 14,378 12,646 14,832 9,507 15,328 14,465 7,492 9,541 15,190 16,437 11,859
Excluding Other roads
(U roads)
210
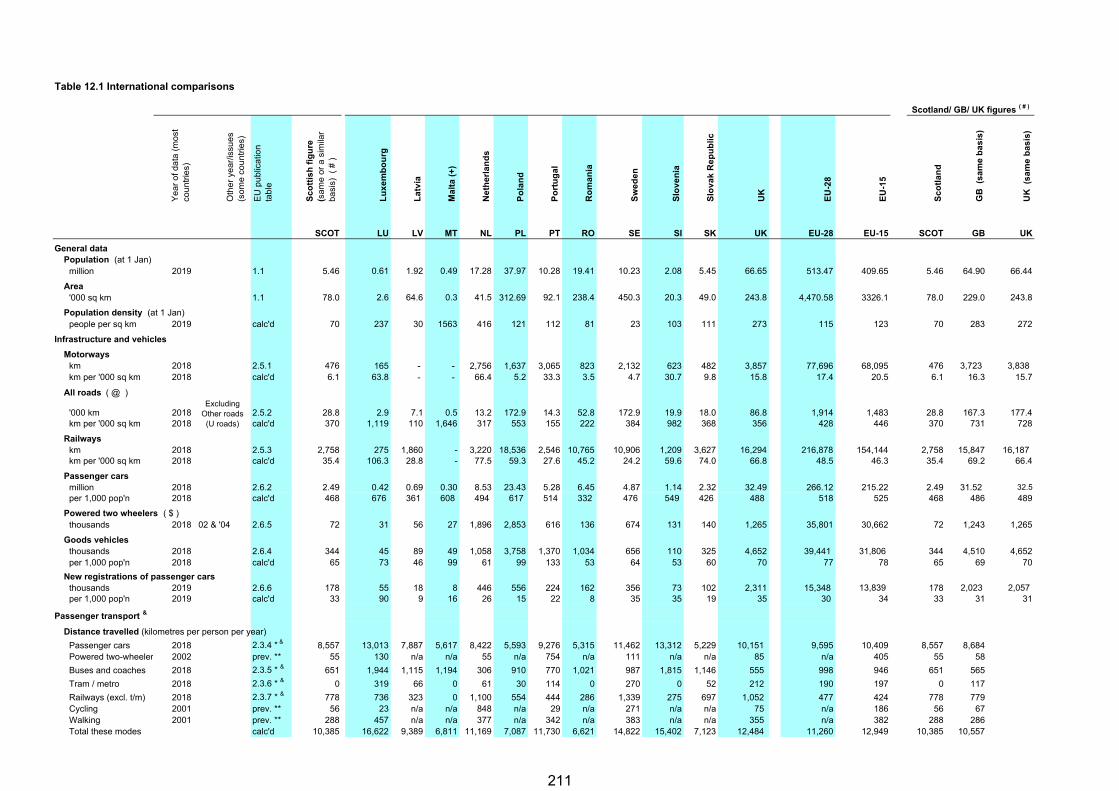
Table 12.1 International comparisons
Ye
ar
of d
ata
(m
ost
co
un
trie
s)
Oth
er
yea
r/is
sue
s
(so
me
co
un
trie
s)
EU
pu
blic
atio
n
tab
le
Sc
ott
ish
fig
ure
(s
am
e o
r a
sim
ilar
ba
sis)
( #
)
SCOT
General dataPopulation (at 1 Jan)
million 2019 1.1 5.46
Area'000 sq km 1.1 78.0
Population density (at 1 Jan)people per sq km 2019 calc'd 70
Infrastructure and vehicles
Motorwayskm 2018 2.5.1 476km per '000 sq km 2018 calc'd 6.1
All roads ( @ )
'000 km 2018 2.5.2 28.8km per '000 sq km 2018 calc'd 370
Railwayskm 2018 2.5.3 2,758km per '000 sq km 2018 calc'd 35.4
Passenger carsmillion 2018 2.6.2 2.49per 1,000 pop'n 2018 calc'd 468
Powered two wheelers ( $ )thousands 2018 02 & '04 2.6.5 72
Goods vehiclesthousands 2018 2.6.4 344per 1,000 pop'n 2018 calc'd 65
New registrations of passenger carsthousands 2019 2.6.6 178per 1,000 pop'n 2019 calc'd 33
Passenger transport &
Distance travelled (kilometres per person per year)
Passenger cars 2018 2.3.4 * & 8,557Powered two-wheeler 2002 prev. ** 55
Buses and coaches 2018 2.3.5 * & 651
Tram / metro 2018 2.3.6 * & 0
Railways (excl. t/m) 2018 2.3.7 * & 778Cycling 2001 prev. ** 56Walking 2001 prev. ** 288Total these modes calc'd 10,385
Excluding Other roads
(U roads)
Lu
xe
mb
ou
rg
La
tvia
Ma
lta
(+
)
Ne
the
rla
nd
s
Po
lan
d
Po
rtu
ga
l
Ro
ma
nia
Sw
ed
en
Slo
ve
nia
Slo
va
k R
ep
ub
lic
UK
EU
-28
EU
-15
Sc
otl
an
d
GB
(s
am
e b
as
is)
UK
(s
am
e b
as
is)
LU LV MT NL PL PT RO SE SI SK UK EU-28 EU-15 SCOT GB UK
0.61 1.92 0.49 17.28 37.97 10.28 19.41 10.23 2.08 5.45 66.65 513.47 409.65 5.46 64.90 66.44
2.6 64.6 0.3 41.5 312.69 92.1 238.4 450.3 20.3 49.0 243.8 4,470.58 3326.1 78.0 229.0 243.8
237 30 1563 416 121 112 81 23 103 111 273 115 123 70 283 272
165 - - 2,756 1,637 3,065 823 2,132 623 482 3,857 77,696 68,095 476 3,723 3,838 63.8 - - 66.4 5.2 33.3 3.5 4.7 30.7 9.8 15.8 17.4 20.5 6.1 16.3 15.7
2.9 7.1 0.5 13.2 172.9 14.3 52.8 172.9 19.9 18.0 86.8 1,914 1,483 28.8 167.3 177.41,119 110 1,646 317 553 155 222 384 982 368 356 428 446 370 731 728
275 1,860 - 3,220 18,536 2,546 10,765 10,906 1,209 3,627 16,294 216,878 154,144 2,758 15,847 16,187 106.3 28.8 - 77.5 59.3 27.6 45.2 24.2 59.6 74.0 66.8 48.5 46.3 35.4 69.2 66.4
0.42 0.69 0.30 8.53 23.43 5.28 6.45 4.87 1.14 2.32 32.49 266.12 215.22 2.49 31.52 32.5
676 361 608 494 617 514 332 476 549 426 488 518 525 468 486 489
31 56 27 1,896 2,853 616 136 674 131 140 1,265 35,801 30,662 72 1,243 1,265
45 89 49 1,058 3,758 1,370 1,034 656 110 325 4,652 39,441 31,806 344 4,510 4,65273 46 99 61 99 133 53 64 53 60 70 77 78 65 69 70
55 18 8 446 556 224 162 356 73 102 2,311 15,348 13,839 178 2,023 2,057 90 9 16 26 15 22 8 35 35 19 35 30 34 33 31 31
13,013 7,887 5,617 8,422 5,593 9,276 5,315 11,462 13,312 5,229 10,151 9,595 10,409 8,557 8,684130 n/a n/a 55 n/a 754 n/a 111 n/a n/a 85 n/a 405 55 58
1,944 1,115 1,194 306 910 770 1,021 987 1,815 1,146 555 998 946 651 565
319 66 0 61 30 114 0 270 0 52 212 190 197 0 117
736 323 0 1,100 554 444 286 1,339 275 697 1,052 477 424 778 77923 n/a n/a 848 n/a 29 n/a 271 n/a n/a 75 n/a 186 56 67
457 n/a n/a 377 n/a 342 n/a 383 n/a n/a 355 n/a 382 288 28616,622 9,389 6,811 11,169 7,087 11,730 6,621 14,822 15,402 7,123 12,484 11,260 12,949 10,385 10,557
Scotland/ GB/ UK figures ( # )
211
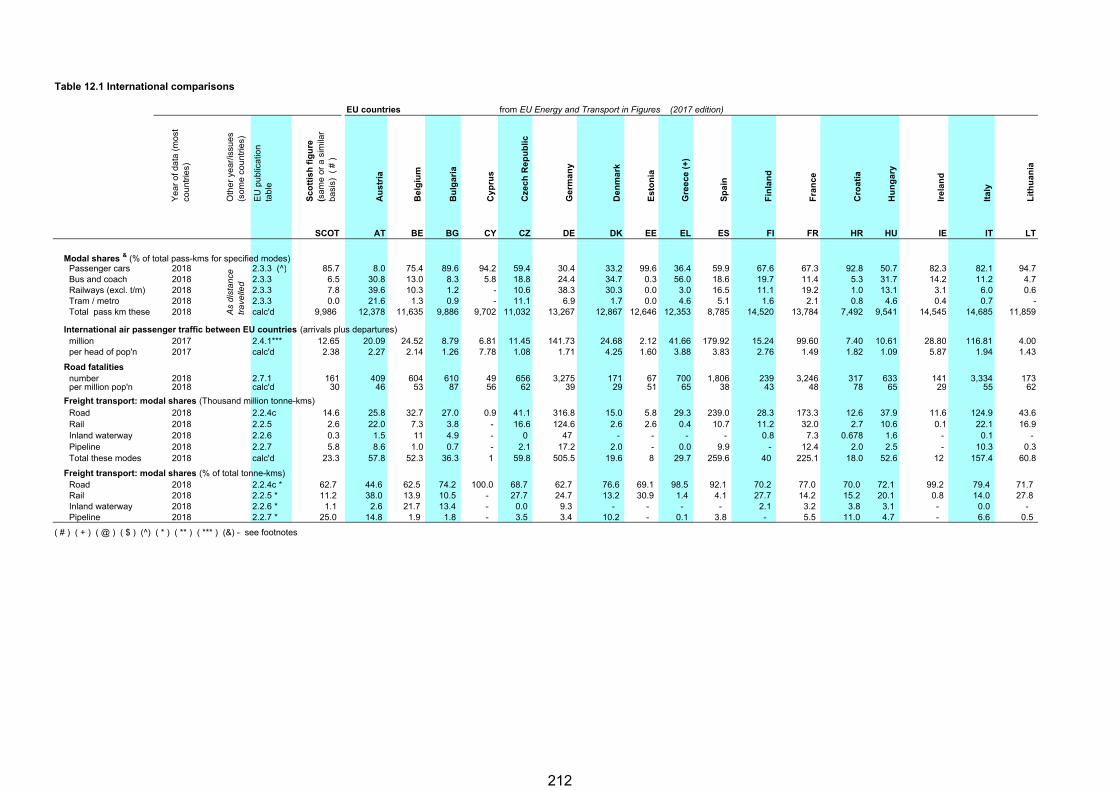
Table 12.1 International comparisons
EU countries from EU Energy and Transport in Figures (2017 edition)
Ye
ar
of d
ata
(m
ost
co
un
trie
s)
Oth
er
yea
r/is
sue
s
(so
me
co
un
trie
s)
EU
pu
blic
atio
n
tab
le
Sc
ott
ish
fig
ure
(s
am
e o
r a
sim
ilar
ba
sis)
( #
)
Au
str
ia
Be
lgiu
m
Bu
lga
ria
Cy
pru
s
Cze
ch
Re
pu
blic
Ge
rma
ny
De
nm
ark
Es
ton
ia
Gre
ec
e (
+)
Sp
ain
Fin
lan
d
Fra
nc
e
Cro
ati
a
Hu
ng
ary
Ire
lan
d
Ita
ly
Lit
hu
an
ia
SCOT AT BE BG CY CZ DE DK EE EL ES FI FR HR HU IE IT LT
Modal shares & (% of total pass-kms for specified modes)Passenger cars 2018 2.3.3 (^) 85.7 8.0 75.4 89.6 94.2 59.4 30.4 33.2 99.6 36.4 59.9 67.6 67.3 92.8 50.7 82.3 82.1 94.7Bus and coach 2018 2.3.3 6.5 30.8 13.0 8.3 5.8 18.8 24.4 34.7 0.3 56.0 18.6 19.7 11.4 5.3 31.7 14.2 11.2 4.7Railways (excl. t/m) 2018 2.3.3 7.8 39.6 10.3 1.2 - 10.6 38.3 30.3 0.0 3.0 16.5 11.1 19.2 1.0 13.1 3.1 6.0 0.6Tram / metro 2018 2.3.3 0.0 21.6 1.3 0.9 - 11.1 6.9 1.7 0.0 4.6 5.1 1.6 2.1 0.8 4.6 0.4 0.7 -Total pass km these m 2018 calc'd 9,986 12,378 11,635 9,886 9,702 11,032 13,267 12,867 12,646 12,353 8,785 14,520 13,784 7,492 9,541 14,545 14,685 11,859
International air passenger traffic between EU countries (arrivals plus departures)million 2017 2.4.1*** 12.65 20.09 24.52 8.79 6.81 11.45 141.73 24.68 2.12 41.66 179.92 15.24 99.60 7.40 10.61 28.80 116.81 4.00per head of pop'n 2017 calc'd 2.38 2.27 2.14 1.26 7.78 1.08 1.71 4.25 1.60 3.88 3.83 2.76 1.49 1.82 1.09 5.87 1.94 1.43
Road fatalitiesnumber 2018 2.7.1 161 409 604 610 49 656 3,275 171 67 700 1,806 239 3,246 317 633 141 3,334 173per million pop'n 2018 calc'd 30 46 53 87 56 62 39 29 51 65 38 43 48 78 65 29 55 62
Freight transport: modal shares (Thousand million tonne-kms)Road 2018 2.2.4c 14.6 25.8 32.7 27.0 0.9 41.1 316.8 15.0 5.8 29.3 239.0 28.3 173.3 12.6 37.9 11.6 124.9 43.6Rail 2018 2.2.5 2.6 22.0 7.3 3.8 - 16.6 124.6 2.6 2.6 0.4 10.7 11.2 32.0 2.7 10.6 0.1 22.1 16.9Inland waterway 2018 2.2.6 0.3 1.5 11 4.9 - 0 47 - - - - 0.8 7.3 0.678 1.6 - 0.1 - Pipeline 2018 2.2.7 5.8 8.6 1.0 0.7 - 2.1 17.2 2.0 - 0.0 9.9 - 12.4 2.0 2.5 - 10.3 0.3Total these modes 2018 calc'd 23.3 57.8 52.3 36.3 1 59.8 505.5 19.6 8 29.7 259.6 40 225.1 18.0 52.6 12 157.4 60.8
Freight transport: modal shares (% of total tonne-kms)Road 2018 2.2.4c * 62.7 44.6 62.5 74.2 100.0 68.7 62.7 76.6 69.1 98.5 92.1 70.2 77.0 70.0 72.1 99.2 79.4 71.7 Rail 2018 2.2.5 * 11.2 38.0 13.9 10.5 - 27.7 24.7 13.2 30.9 1.4 4.1 27.7 14.2 15.2 20.1 0.8 14.0 27.8 Inland waterway 2018 2.2.6 * 1.1 2.6 21.7 13.4 - 0.0 9.3 - - - - 2.1 3.2 3.8 3.1 - 0.0 - Pipeline 2018 2.2.7 * 25.0 14.8 1.9 1.8 - 3.5 3.4 10.2 - 0.1 3.8 - 5.5 11.0 4.7 - 6.6 0.5
( # ) ( + ) ( @ ) ( $ ) (^) ( * ) ( ** ) ( *** ) (&) - see footnotes
As
dis
tan
ce
tra
velle
d
212
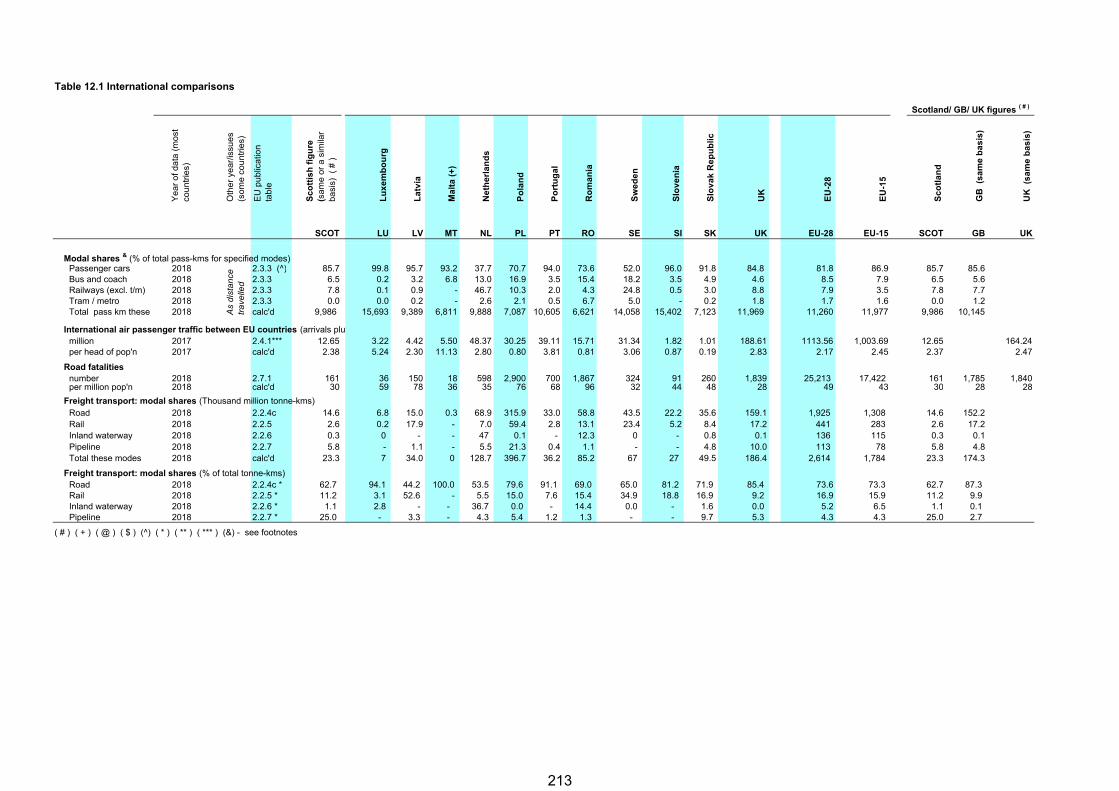
Table 12.1 International comparisons
Ye
ar
of d
ata
(m
ost
co
un
trie
s)
Oth
er
yea
r/is
sue
s
(so
me
co
un
trie
s)
EU
pu
blic
atio
n
tab
le
Sc
ott
ish
fig
ure
(s
am
e o
r a
sim
ilar
ba
sis)
( #
)
SCOT
Modal shares & (% of total pass-kms for specified modes)Passenger cars 2018 2.3.3 (^) 85.7Bus and coach 2018 2.3.3 6.5Railways (excl. t/m) 2018 2.3.3 7.8Tram / metro 2018 2.3.3 0.0Total pass km these m 2018 calc'd 9,986
International air passenger traffic between EU countries (arrivals plumillion 2017 2.4.1*** 12.65per head of pop'n 2017 calc'd 2.38
Road fatalitiesnumber 2018 2.7.1 161per million pop'n 2018 calc'd 30
Freight transport: modal shares (Thousand million tonne-kms)Road 2018 2.2.4c 14.6Rail 2018 2.2.5 2.6Inland waterway 2018 2.2.6 0.3Pipeline 2018 2.2.7 5.8Total these modes 2018 calc'd 23.3
Freight transport: modal shares (% of total tonne-kms)Road 2018 2.2.4c * 62.7 Rail 2018 2.2.5 * 11.2 Inland waterway 2018 2.2.6 * 1.1 Pipeline 2018 2.2.7 * 25.0
( # ) ( + ) ( @ ) ( $ ) (^) ( * ) ( ** ) ( *** ) (&) - see footnotes
As
dis
tan
ce
tra
velle
d
Lu
xe
mb
ou
rg
La
tvia
Ma
lta
(+
)
Ne
the
rla
nd
s
Po
lan
d
Po
rtu
ga
l
Ro
ma
nia
Sw
ed
en
Slo
ve
nia
Slo
va
k R
ep
ub
lic
UK
EU
-28
EU
-15
Sc
otl
an
d
GB
(s
am
e b
as
is)
UK
(s
am
e b
as
is)
LU LV MT NL PL PT RO SE SI SK UK EU-28 EU-15 SCOT GB UK
Scotland/ GB/ UK figures ( # )
99.8 95.7 93.2 37.7 70.7 94.0 73.6 52.0 96.0 91.8 84.8 81.8 86.9 85.7 85.60.2 3.2 6.8 13.0 16.9 3.5 15.4 18.2 3.5 4.9 4.6 8.5 7.9 6.5 5.60.1 0.9 - 46.7 10.3 2.0 4.3 24.8 0.5 3.0 8.8 7.9 3.5 7.8 7.70.0 0.2 - 2.6 2.1 0.5 6.7 5.0 - 0.2 1.8 1.7 1.6 0.0 1.2
15,693 9,389 6,811 9,888 7,087 10,605 6,621 14,058 15,402 7,123 11,969 11,260 11,977 9,986 10,145
3.22 4.42 5.50 48.37 30.25 39.11 15.71 31.34 1.82 1.01 188.61 1113.56 1,003.69 12.65 164.245.24 2.30 11.13 2.80 0.80 3.81 0.81 3.06 0.87 0.19 2.83 2.17 2.45 2.37 2.47
36 150 18 598 2,900 700 1,867 324 91 260 1,839 25,213 17,422 161 1,785 1,84059 78 36 35 76 68 96 32 44 48 28 49 43 30 28 28
6.8 15.0 0.3 68.9 315.9 33.0 58.8 43.5 22.2 35.6 159.1 1,925 1,308 14.6 152.20.2 17.9 - 7.0 59.4 2.8 13.1 23.4 5.2 8.4 17.2 441 283 2.6 17.20 - - 47 0.1 - 12.3 0 - 0.8 0.1 136 115 0.3 0.1- 1.1 - 5.5 21.3 0.4 1.1 - - 4.8 10.0 113 78 5.8 4.87 34.0 0 128.7 396.7 36.2 85.2 67 27 49.5 186.4 2,614 1,784 23.3 174.3
94.1 44.2 100.0 53.5 79.6 91.1 69.0 65.0 81.2 71.9 85.4 73.6 73.3 62.7 87.3 3.1 52.6 - 5.5 15.0 7.6 15.4 34.9 18.8 16.9 9.2 16.9 15.9 11.2 9.9 2.8 - - 36.7 0.0 - 14.4 0.0 - 1.6 0.0 5.2 6.5 1.1 0.1 - 3.3 - 4.3 5.4 1.2 1.3 - - 9.7 5.3 4.3 4.3 25.0 2.7
213
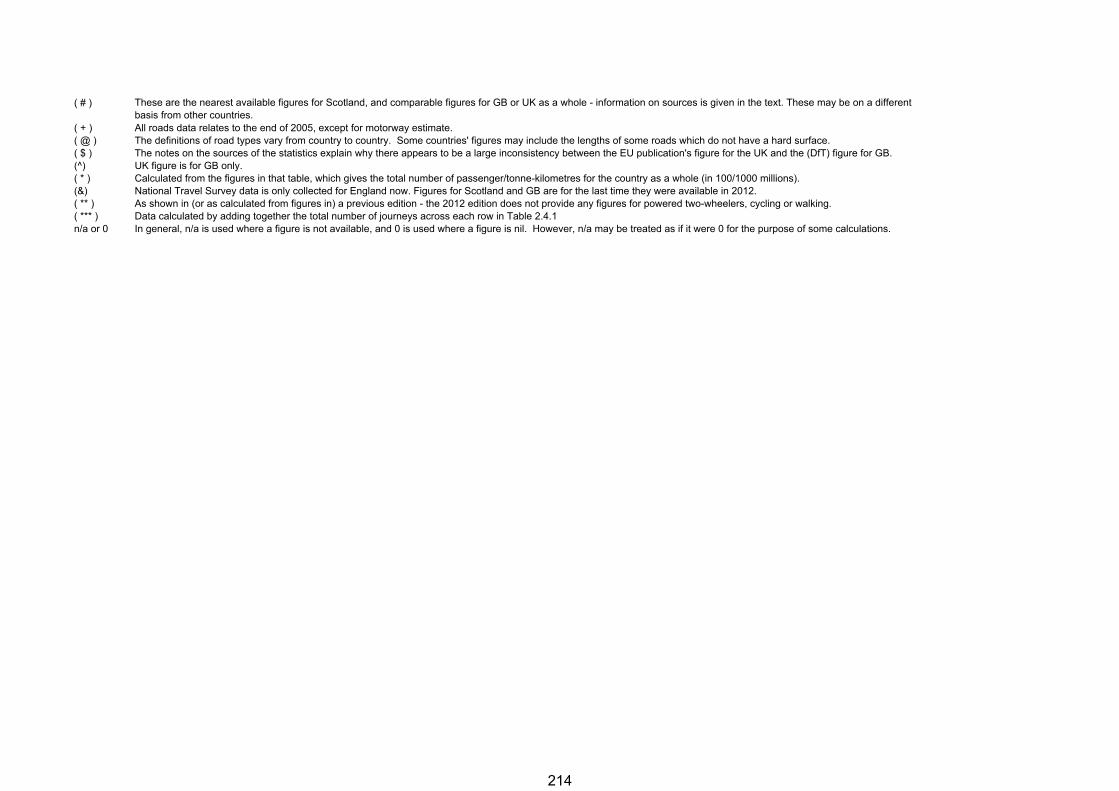
( # ) These are the nearest available figures for Scotland, and comparable figures for GB or UK as a whole - information on sources is given in the text. These may be on a different basis from other countries.
( + ) All roads data relates to the end of 2005, except for motorway estimate.( @ ) The definitions of road types vary from country to country. Some countries' figures may include the lengths of some roads which do not have a hard surface.( $ ) The notes on the sources of the statistics explain why there appears to be a large inconsistency between the EU publication's figure for the UK and the (DfT) figure for GB.(^) UK figure is for GB only.( * ) Calculated from the figures in that table, which gives the total number of passenger/tonne-kilometres for the country as a whole (in 100/1000 millions).(&) National Travel Survey data is only collected for England now. Figures for Scotland and GB are for the last time they were available in 2012.( ** ) As shown in (or as calculated from figures in) a previous edition - the 2012 edition does not provide any figures for powered two-wheelers, cycling or walking.( *** ) Data calculated by adding together the total number of journeys across each row in Table 2.4.1n/a or 0 In general, n/a is used where a figure is not available, and 0 is used where a figure is nil. However, n/a may be treated as if it were 0 for the purpose of some calculations.
214

215
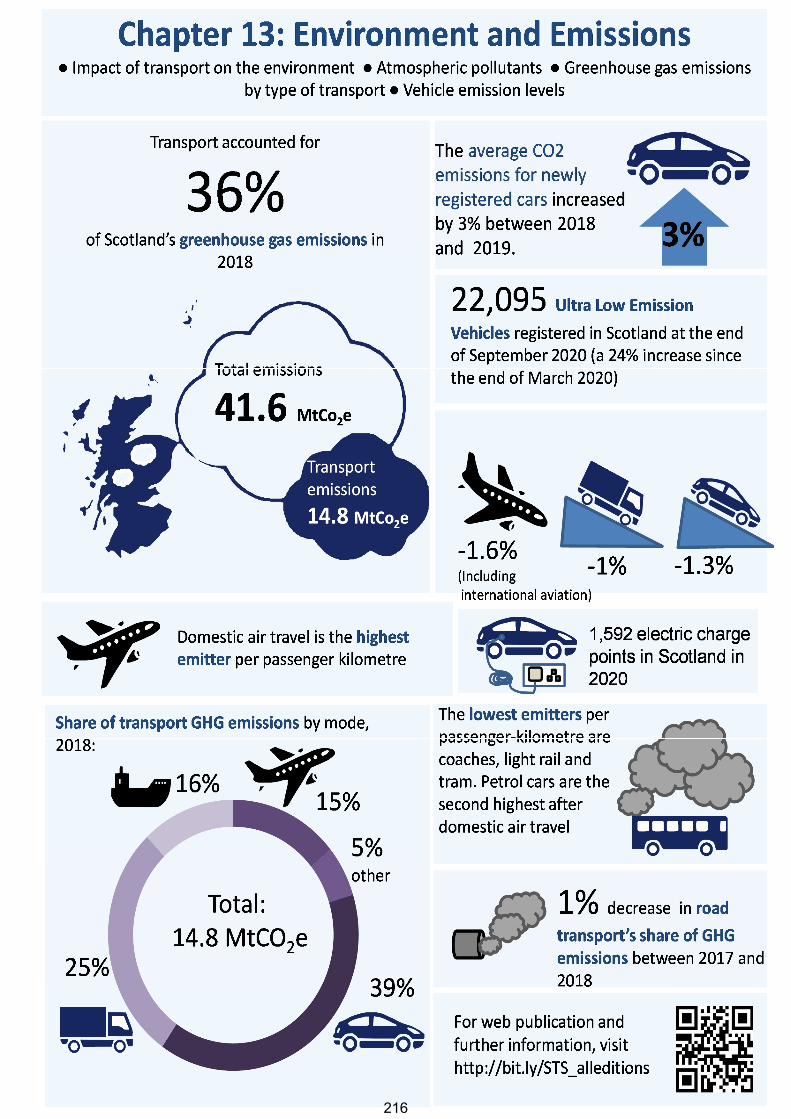
ENVIRONMENT AND EMISSIONS
216
ENVIRONMENT AND EMISSIONS
ENVIRONMENT AND EMISSIONS 1 Introduction 1.1 This chapter provides information about the impact of transport on certain aspects of the environment with a focus on greenhouse gas emissions and air quality. Statistics include atmospheric pollutants and emissions of greenhouse gases by types of transport as well as details of emissions levels of road vehicles. Data from other chapters within Scottish Transport Statistics are referred to in the analysis. 1.2 Three new tables have been added to this chapter providing information on the number of public Electric Vehicle (EV) charge points that are now available in Scotland on the ChargePlace Scotland (CPS) network. Key points
Transport (including international shipping and aviation) accounts for 36% of Scotland’s greenhouse gas emissions under the definition set out in the Climate Change Scotland Act.
Road transport makes up 68% of transport greenhouse gas emissions. Through September of the current year (2020) there were 6,545 Ultra Low
Emission Vehicles registered in Scotland for the first time – 80% up on the corresponding period in 2019.
In 2018, transport accounted for 54% of emissions of oxides of nitrogen, 16% of particulate matter PM10 and 21% of particulate matter PM2.5. As at 15 October 2020, there were 38 active Air Quality Management Areas related to these pollutants.
2 Main Points Air pollutant emissions 2.1 The main pollutants of current concern in Scotland are:
Nitrogen oxides (NOx); Particulate matter (PM10 and PM2.5); Sulphur dioxide (SO2); Non-methane volatile organic compounds (NMVOCs); Ground-level ozone (O3); and Ammonia (NH3).
2.2 Of these pollutants, transport is a significant contributor to emissions of oxides of nitrogen and particulate matter. Transport is also linked to ground level ozone, which is a secondary pollutant produced by chemical reactions involving oxides of nitrogen. 2.3 Historically, transport was also a major contributor to emissions of lead and non-methane volatile organic compounds (NMVOCs). The significant decline in lead emissions (99% since 1990) has been mainly driven by the progressive phasing out of leaded petrol. The lead content of petrol was reduced from around 0.34 g/l to 0.143 g/l in 1986. From 1987, sales of unleaded petrol increased, particularly as a result of the increased use of cars fitted with three-way catalysts. Leaded petrol was phased out from general sale at the end of 1999. For NMVOCs, transport sector emissions declined significantly during the 1990s due to the increased use of catalytic converters and fuel switching from petrol to diesel cars. (Chart 13.1a).
217
ENVIRONMENT AND EMISSIONS
2.4 Emissions of nitrogen oxides (NOx) were estimated to be 92kt in 2018 of which transport accounted for 54%. Since 1990, transport emissions have declined by 67%. Transport emissions have declined due to a number of reasons including the requirement for new petrol cars to be fitted with three-way catalysts since 1989 and, in more recent years, “Euro standards” for new cars have driven a reduction in emissions, although studies show that the diesel Euro 5 cars have not performed as well as expected. Since 2008, there has been a general reduction in the emissions from passenger cars, mainly driven by improvement in catalyst repair rates. In 2018, diesel cars and light goods vehicles (LGVs) accounted for 39% of NOx emissions from transport compared with less than 2% in 1990 (Table 13.1a). 2.5 Emissions of PM10 were estimated to be 15kt in 2018, of which transport accounted for 16%. Since 1990, transport emissions have declined by 65%. For particulate matter, the main source of transport emissions is non-exhaust emissions from tyre and brake wear and road abrasion. In 2018, these accounted for 54% of PM10 emissions from transport compared with 14% in 1990. Since 1990, exhaust emissions from road transport have decreased by 82% due to the penetration of new vehicles meeting tighter PM10 emission regulations ("Euro standards" for diesel vehicles were first introduced in 1992). Over the same period emissions from shipping fell by 81% (Table 13.1a). 2.6. Emissions of PM2.5 were estimated to be 9kt in 2018 of which transport accounted for 21%. Trends in emissions of PM2.5 from transport follow a similar pattern to those for PM10. PM2.5 accounts for all road transport exhaust PM10 emissions and most of such emissions from shipping but only around 55% of PM10 emissions due to road abrasion and tyre and brake wear. Air quality 2.7 Concentrations of air pollutants are sampled at automatic monitoring sites and the information is held in the “Scottish Air Quality Database” on the “Air Quality in Scotland” website (http://www.scottishairquality.co.uk/), The data section of the “Air Quality in Scotland” website provides detailed information on all sites while the publication section of the website includes reports showing trends. Table 13.b in this publication shows concentrations of nitrogen dioxide, ozone and PM10 at a mixture of urban and rural monitoring sites with long time series. Air quality is monitored against standards set as air quality objectives (see Notes and Definitions section, page 225). Nitrogen dioxide (NO2) 2.8 For some of the selected monitoring sites, nitrogen dioxide concentrations show a downward trend. In 2019, 7 of the 11 selected operational sites that recorded nitrogen dioxide concentrations with a data capture rate of over 75% had the lowest concentrations recorded over the period 2009-2019. In 2010, concentrations at nine of the selected sites reached their highest value over the period 2009-2019. Note that this excludes figures for years where the data capture rate was 75% or lower. In 2019, 67 sites in Scotland recorded nitrogen dioxide concentrations with a data capture rate of over 75%, of which 51 were roadside or kerbside locations. Of these 67 sites, 5 had concentrations in excess of the air quality strategy objective of 40 g/m3 as an annual mean. All 5 sites were located at the roadside or kerbside. (Table 13.1b) Ozone (O3) 2.8 Though transport emissions contribute to ozone formation, levels of ozone are generally higher in rural areas due to the long-range transportation of primary pollutants from urban sources. In addition, ozone reacts with nitric oxide, which is more abundant in
218
ENVIRONMENT AND EMISSIONS
urban areas due to traffic emissions, to form nitrogen dioxide; therefore ozone levels are usually lower in urban areas. While at the selected monitoring sites there has been some indication of a downward trend in the number of occurrences of maximum daily concentrations exceeding 100 g/m3, this has since levelled off. There appears to be no trend in average annual concentrations. In 2019, of the 11 sites in Scotland recording ozone with a data capture rate of over 75%, four sites met the air quality objective of no more than 10 occurrences of the maximum daily concentrations exceeding 100 g/m3. (Table 13.1b) Particulate matter (PM10) 2.9 PM10 concentrations show a general downward trend at the selected sites. In 2019, of the 67 sites in Scotland recording PM10 with a data capture rate over 75%, no sites had concentrations greater than the air quality objective of 18 g/m3 as an annual mean. One site (Renfrew Johnstone) exceeded the air quality objective set as 7 occurrences of a daily mean above 50 g/m3. (Table 13.1b) Air Quality Management Areas 2.10 Whenever it appears that one or more of the air quality objectives is unlikely to be met by the required date, the local authority concerned must declare an Air Quality Management Area (AQMA) covering the area of concern. The authority must then prepare and implement an action plan outlining how it intends to tackle the issues identified. Table 13.1c summarises active AQMAs and the pollutants of concern. As at 15 October 2020, there were 38 active AQMAs, all but one of which related to either NO2 or PM10, or both. Greenhouse gases 2.11 In 2018, Transport (including international aviation and shipping) accounted for 14.8 million tonnes of carbon dioxide equivalent (MtCO2e). This represents 35.6% of total net greenhouse gas emissions allocated to Scotland in the Greenhouse Gas Inventories, down from 36.0% in 2017. Total net emissions from all sources increased by 1.5% between 2017 and 2018 rising from 41.0 MtCO2e to 41.6 MtCO2e, before making an adjustment to account for the EU Emissions Trading System with transport total emissions having decreased from 15.0 MtCO2e to 14.8 MtCO2e a fall of 1.1%. Within Transport emissions, Road Transportation accounted for approximately 67.8% of the transport total. Heavy Goods Vehicles and Light Goods Vehicles were the other significant contributors to transport emissions accounting for 12.6% and 12.5%, respectively. International Aviation and Shipping contributed roughly 12.8% and domestic aviation 4.5% of transport’s total emissions. The contribution from rail was 1.1% and domestic shipping, 13.8%. It should be noted that these estimates use a methodology designed to produce internationally-comparable figures so apparent year-to-year fluctuations could be due in part to limitations in or changes to the underlying data or calculations. See Table 13.2 for more detail and emissions from earlier years and Section 4.2 below for more detail on the methodology used. 2.12 Figure 13.2 shows transport emissions over time, by mode. Estimated car emissions have fallen by 7.4% since 2006. Traffic levels (vehicle km) have increased slightly over the last few years so the reduction in emissions seen will be due to the introduction of more fuel efficient vehicles as well as other more fuel efficient driving, particularly in the business fleet. More detail on car emissions is set out from paragraph 2.16 of this chapter while more details on traffic volumes by mode can be found in chapter 5 of STS. Details of personal modal choice can be found in chapter 11.
219
ENVIRONMENT AND EMISSIONS
2.13 The Greenhouse Gas Inventories report the emissions of the six gases that are listed under the Kyoto Protocol. In the case of transport, the quantities of gases involved are relatively small except for carbon dioxide, which accounts for about 99 per cent of transport’s total. (Table 13.3). 2.14 Table 13.4 presents some comparisons between the UK as a whole and Scotland. Overall, Scotland’s transport emissions account for 8.9% of the UK total. At 13.1% Scottish bus emissions are above a proportionate share of the UK total, while domestic aviation, at 20.8%, is significantly above that benchmark. 2.15 Estimates of carbon dioxide emissions per passenger-km for different modes of transport are available only for GB/UK as a whole. The lowest emitting modes of land transport per passenger-km are coaches at 27 gCO2e; and light rail and tram at 30 gCO2e. Air travel tends to be the highest emitter per passenger-kilometre, particularly domestic flights, which account for 244 grams of CO2 per passenger kilometre, inclusive of radiative forcing which accounts for higher levels of greenhouse gases emitted at altitude during the cruise phase (Table 13.5). The basis of these estimates is described in section 13.5 page 302. Car emissions 2.16 Newly registered cars are becoming more fuel efficient and thus emit fewer emissions per kilometre. Figure 13.3 shows the steady downward trend in average CO2 emissions for newly registered cars in Scotland. Average CO2 emissions in Scotland for new car registrations has fallen by 15 per cent over the last ten years. However, the average for 2019 was 2 per cent higher than the previous year. (Table 13.6a) 2.17 More detail of this trend is shown in figure 13.4. The proportion of newly registered cars with emissions of 140g/km or lower has increased from 49 per cent in 2009 to 74 per cent in 2019. Cars with emissions of over 200g/km have decreased from 5 per cent of new cars to 2 per cent. These changes are at least in part the result of changes to vehicle excise duty bandings made by the UK Government in recent years. Ultra low emission vehicles (ULEV) 2.18 The number of ultra-low emission vehicles registered in Scotland for the first time so far in 2020 is 80% up on the corresponding figure in 2019 (January – September). Almost all of these sales have been supported by Plug-in-Grant scheme for cars and vans. At the end of Q3 2020 there are 22,095 ULEVs registered in Scotland (Table 13.7 and 13.8) Registrations by type of vehicle 2.19 The overwhelming majority (98 per cent) of vehicles licensed for use on the roads in Scotland are still powered by either petrol or diesel. Historically petrol powered vehicles have been outsold by diesel vehicles although in recent years petrol vehicles have been outselling diesel. Overall though there are more petrol vehicles on the road than diesel ones. While 29 per cent of all diesel vehicles are body types other than cars only 6 per cent of petrol vehicles were not cars. (Table 13.9 and 13.10) Electric Vehicle (EV) charge points 2.20 The shift to electric vehicles is an important part of responding to the climate emergency and improving air quality in our cities. To help incentivise this shift, we have invested over £32 million in ChargePlace Scotland, Scotland’s public charging network, which now has more than 1500 publicly available charge points. Scotland is leading the way on electric vehicle charging infrastructure. The latest figures show that Scottish electric vehicle drivers benefit from almost 40 public charge points per one hundred thousand people, compared to fewer than 30 in England, just over 20 in Wales and less than 20 in Northern Ireland.
220
ENVIRONMENT AND EMISSIONS
2.21 In 2020, there were 1,592 public EV charge points on the ChargePlace Scotland network (CPS), 890 (127%) more than in 2017. Glasgow had the highest number with 137. 10.48 GWh was provided through the CPS network in 2020. A map showing the locations of the charging points in Scotland is available here https://chargeplacescotland.org/cpmap/ (Table 13.11 and 13.12)
221
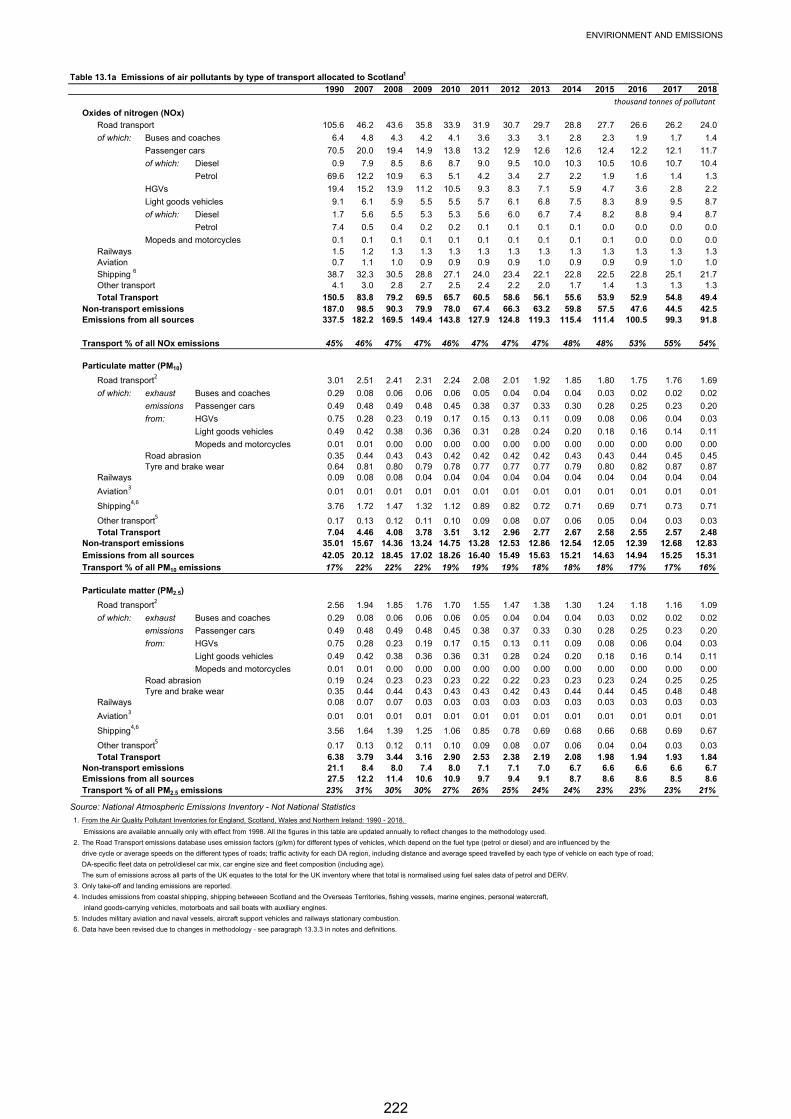
ENVIRIONMENT AND EMISSIONS
Table 13.1a Emissions of air pollutants by type of transport allocated to Scotland1
1990 2007 2008 2009 2010 2011 2012 2013 2014 2015 2016 2017 2018
thousand tonnes of pollutantOxides of nitrogen (NOx)
Road transport 105.6 46.2 43.6 35.8 33.9 31.9 30.7 29.7 28.8 27.7 26.6 26.2 24.0
of which: Buses and coaches 6.4 4.8 4.3 4.2 4.1 3.6 3.3 3.1 2.8 2.3 1.9 1.7 1.4
Passenger cars 70.5 20.0 19.4 14.9 13.8 13.2 12.9 12.6 12.6 12.4 12.2 12.1 11.7
of which: Diesel 0.9 7.9 8.5 8.6 8.7 9.0 9.5 10.0 10.3 10.5 10.6 10.7 10.4
Petrol 69.6 12.2 10.9 6.3 5.1 4.2 3.4 2.7 2.2 1.9 1.6 1.4 1.3
HGVs 19.4 15.2 13.9 11.2 10.5 9.3 8.3 7.1 5.9 4.7 3.6 2.8 2.2
Light goods vehicles 9.1 6.1 5.9 5.5 5.5 5.7 6.1 6.8 7.5 8.3 8.9 9.5 8.7
of which: Diesel 1.7 5.6 5.5 5.3 5.3 5.6 6.0 6.7 7.4 8.2 8.8 9.4 8.7
Petrol 7.4 0.5 0.4 0.2 0.2 0.1 0.1 0.1 0.1 0.0 0.0 0.0 0.0
Mopeds and motorcycles 0.1 0.1 0.1 0.1 0.1 0.1 0.1 0.1 0.1 0.1 0.0 0.0 0.0Railways 1.5 1.2 1.3 1.3 1.3 1.3 1.3 1.3 1.3 1.3 1.3 1.3 1.3Aviation 0.7 1.1 1.0 0.9 0.9 0.9 0.9 1.0 0.9 0.9 0.9 1.0 1.0Shipping 6 38.7 32.3 30.5 28.8 27.1 24.0 23.4 22.1 22.8 22.5 22.8 25.1 21.7Other transport 4.1 3.0 2.8 2.7 2.5 2.4 2.2 2.0 1.7 1.4 1.3 1.3 1.3
Total Transport 150.5 83.8 79.2 69.5 65.7 60.5 58.6 56.1 55.6 53.9 52.9 54.8 49.4Non-transport emissions 187.0 98.5 90.3 79.9 78.0 67.4 66.3 63.2 59.8 57.5 47.6 44.5 42.5Emissions from all sources 337.5 182.2 169.5 149.4 143.8 127.9 124.8 119.3 115.4 111.4 100.5 99.3 91.8
Transport % of all NOx emissions 45% 46% 47% 47% 46% 47% 47% 47% 48% 48% 53% 55% 54%
Particulate matter (PM10)
Road transport2 3.01 2.51 2.41 2.31 2.24 2.08 2.01 1.92 1.85 1.80 1.75 1.76 1.69
of which: exhaust Buses and coaches 0.29 0.08 0.06 0.06 0.06 0.05 0.04 0.04 0.04 0.03 0.02 0.02 0.02
emissions Passenger cars 0.49 0.48 0.49 0.48 0.45 0.38 0.37 0.33 0.30 0.28 0.25 0.23 0.20
from: HGVs 0.75 0.28 0.23 0.19 0.17 0.15 0.13 0.11 0.09 0.08 0.06 0.04 0.03
Light goods vehicles 0.49 0.42 0.38 0.36 0.36 0.31 0.28 0.24 0.20 0.18 0.16 0.14 0.11
Mopeds and motorcycles 0.01 0.01 0.00 0.00 0.00 0.00 0.00 0.00 0.00 0.00 0.00 0.00 0.00Road abrasion 0.35 0.44 0.43 0.43 0.42 0.42 0.42 0.42 0.43 0.43 0.44 0.45 0.45Tyre and brake wear 0.64 0.81 0.80 0.79 0.78 0.77 0.77 0.77 0.79 0.80 0.82 0.87 0.87
Railways 0.09 0.08 0.08 0.04 0.04 0.04 0.04 0.04 0.04 0.04 0.04 0.04 0.04
Aviation30.01 0.01 0.01 0.01 0.01 0.01 0.01 0.01 0.01 0.01 0.01 0.01 0.01
Shipping4,63.76 1.72 1.47 1.32 1.12 0.89 0.82 0.72 0.71 0.69 0.71 0.73 0.71
Other transport5 0.17 0.13 0.12 0.11 0.10 0.09 0.08 0.07 0.06 0.05 0.04 0.03 0.03Total Transport 7.04 4.46 4.08 3.78 3.51 3.12 2.96 2.77 2.67 2.58 2.55 2.57 2.48
Non-transport emissions 35.01 15.67 14.36 13.24 14.75 13.28 12.53 12.86 12.54 12.05 12.39 12.68 12.83
Emissions from all sources 42.05 20.12 18.45 17.02 18.26 16.40 15.49 15.63 15.21 14.63 14.94 15.25 15.31
Transport % of all PM10 emissions 17% 22% 22% 22% 19% 19% 19% 18% 18% 18% 17% 17% 16%
Particulate matter (PM2.5)
Road transport2 2.56 1.94 1.85 1.76 1.70 1.55 1.47 1.38 1.30 1.24 1.18 1.16 1.09
of which: exhaust Buses and coaches 0.29 0.08 0.06 0.06 0.06 0.05 0.04 0.04 0.04 0.03 0.02 0.02 0.02
emissions Passenger cars 0.49 0.48 0.49 0.48 0.45 0.38 0.37 0.33 0.30 0.28 0.25 0.23 0.20
from: HGVs 0.75 0.28 0.23 0.19 0.17 0.15 0.13 0.11 0.09 0.08 0.06 0.04 0.03
Light goods vehicles 0.49 0.42 0.38 0.36 0.36 0.31 0.28 0.24 0.20 0.18 0.16 0.14 0.11
Mopeds and motorcycles 0.01 0.01 0.00 0.00 0.00 0.00 0.00 0.00 0.00 0.00 0.00 0.00 0.00Road abrasion 0.19 0.24 0.23 0.23 0.23 0.22 0.22 0.23 0.23 0.23 0.24 0.25 0.25Tyre and brake wear 0.35 0.44 0.44 0.43 0.43 0.43 0.42 0.43 0.44 0.44 0.45 0.48 0.48
Railways 0.08 0.07 0.07 0.03 0.03 0.03 0.03 0.03 0.03 0.03 0.03 0.03 0.03
Aviation30.01 0.01 0.01 0.01 0.01 0.01 0.01 0.01 0.01 0.01 0.01 0.01 0.01
Shipping4,63.56 1.64 1.39 1.25 1.06 0.85 0.78 0.69 0.68 0.66 0.68 0.69 0.67
Other transport5 0.17 0.13 0.12 0.11 0.10 0.09 0.08 0.07 0.06 0.04 0.04 0.03 0.03Total Transport 6.38 3.79 3.44 3.16 2.90 2.53 2.38 2.19 2.08 1.98 1.94 1.93 1.84
Non-transport emissions 21.1 8.4 8.0 7.4 8.0 7.1 7.1 7.0 6.7 6.6 6.6 6.6 6.7Emissions from all sources 27.5 12.2 11.4 10.6 10.9 9.7 9.4 9.1 8.7 8.6 8.6 8.5 8.6Transport % of all PM2.5 emissions 23% 31% 30% 30% 27% 26% 25% 24% 24% 23% 23% 23% 21%
Source: National Atmospheric Emissions Inventory - Not National Statistics
1. From the Air Quality Pollutant Inventories for England, Scotland, Wales and Northern Ireland: 1990 - 2018.
Emissions are available annually only with effect from 1998. All the figures in this table are updated annually to reflect changes to the methodology used.
2. The Road Transport emissions database uses emission factors (g/km) for different types of vehicles, which depend on the fuel type (petrol or diesel) and are influenced by the
drive cycle or average speeds on the different types of roads; traffic activity for each DA region, including distance and average speed travelled by each type of vehicle on each type of road;
DA-specific fleet data on petrol/diesel car mix, car engine size and fleet composition (including age).
The sum of emissions across all parts of the UK equates to the total for the UK inventory where that total is normalised using fuel sales data of petrol and DERV.
3. Only take-off and landing emissions are reported.
4. Includes emissions from coastal shipping, shipping betweeen Scotland and the Overseas Territories, fishing vessels, marine engines, personal watercraft,
inland goods-carrying vehicles, motorboats and sail boats with auxiliary engines.
5. Includes military aviation and naval vessels, aircraft support vehicles and railways stationary combustion.
6. Data have been revised due to changes in methodology - see paragraph 13.3.3 in notes and definitions.
222
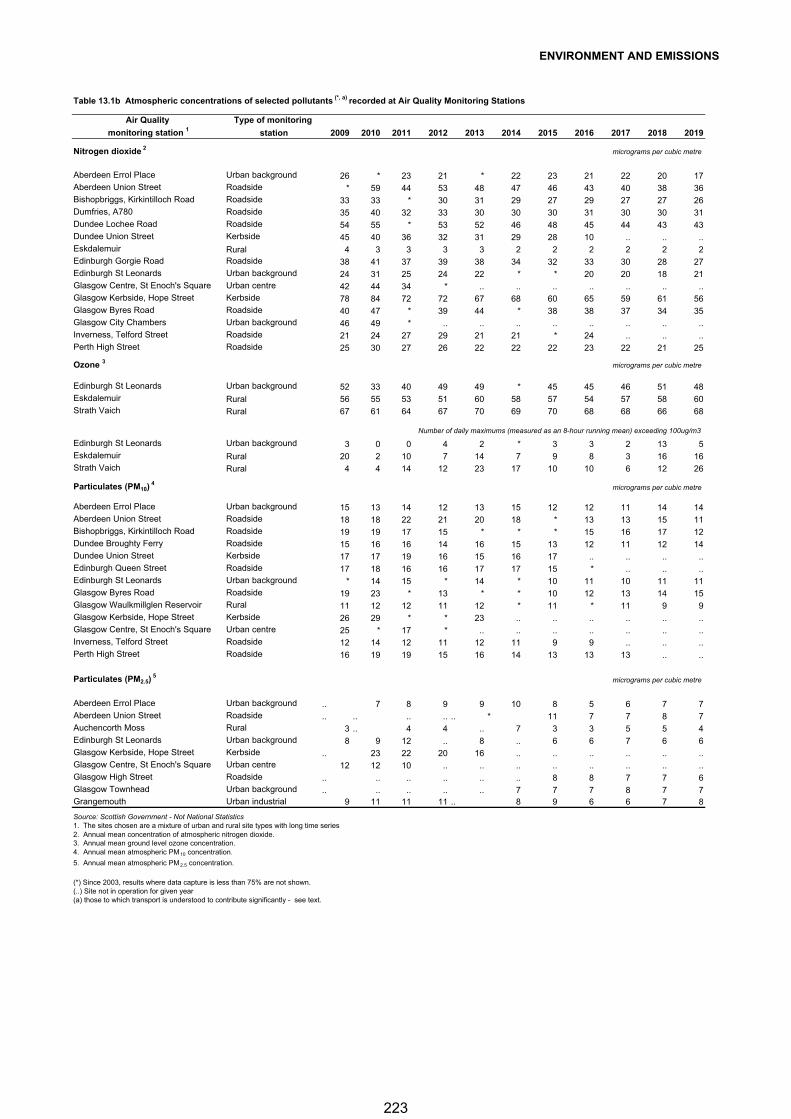
ENVIRONMENT AND EMISSIONS
Table 13.1b Atmospheric concentrations of selected pollutants (*, a) recorded at Air Quality Monitoring Stations
Air Quality Type of monitoring
monitoring station 1 station 2009 2010 2011 2012 2013 2014 2015 2016 2017 2018 2019
Nitrogen dioxide 2micrograms per cubic metre
Aberdeen Errol Place Urban background 26 * 23 21 * 22 23 21 22 20 17Aberdeen Union Street Roadside * 59 44 53 48 47 46 43 40 38 36Bishopbriggs, Kirkintilloch Road Roadside 33 33 * 30 31 29 27 29 27 27 26Dumfries, A780 Roadside 35 40 32 33 30 30 30 31 30 30 31Dundee Lochee Road Roadside 54 55 * 53 52 46 48 45 44 43 43Dundee Union Street Kerbside 45 40 36 32 31 29 28 10 .. .. ..Eskdalemuir Rural 4 3 3 3 3 2 2 2 2 2 2Edinburgh Gorgie Road Roadside 38 41 37 39 38 34 32 33 30 28 27Edinburgh St Leonards Urban background 24 31 25 24 22 * * 20 20 18 21Glasgow Centre, St Enoch's Square Urban centre 42 44 34 * .. .. .. .. .. .. ..Glasgow Kerbside, Hope Street Kerbside 78 84 72 72 67 68 60 65 59 61 56Glasgow Byres Road Roadside 40 47 * 39 44 * 38 38 37 34 35Glasgow City Chambers Urban background 46 49 * .. .. .. .. .. .. .. ..Inverness, Telford Street Roadside 21 24 27 29 21 21 * 24 .. .. ..Perth High Street Roadside 25 30 27 26 22 22 22 23 22 21 25
Ozone 3 micrograms per cubic metre
Edinburgh St Leonards Urban background 52 33 40 49 49 * 45 45 46 51 48Eskdalemuir Rural 56 55 53 51 60 58 57 54 57 58 60Strath Vaich Rural 67 61 64 67 70 69 70 68 68 66 68
Number of daily maximums (measured as an 8-hour running mean) exceeding 100ug/m3
Edinburgh St Leonards Urban background 3 0 0 4 2 * 3 3 2 13 5Eskdalemuir Rural 20 2 10 7 14 7 9 8 3 16 16Strath Vaich Rural 4 4 14 12 23 17 10 10 6 12 26
Particulates (PM10) 4
micrograms per cubic metre
Aberdeen Errol Place Urban background 15 13 14 12 13 15 12 12 11 14 14Aberdeen Union Street Roadside 18 18 22 21 20 18 * 13 13 15 11Bishopbriggs, Kirkintilloch Road Roadside 19 19 17 15 * * * 15 16 17 12Dundee Broughty Ferry Roadside 15 16 16 14 16 15 13 12 11 12 14Dundee Union Street Kerbside 17 17 19 16 15 16 17 .. .. .. ..Edinburgh Queen Street Roadside 17 18 16 16 17 17 15 * .. .. ..Edinburgh St Leonards Urban background * 14 15 * 14 * 10 11 10 11 11Glasgow Byres Road Roadside 19 23 * 13 * * 10 12 13 14 15Glasgow Waulkmillglen Reservoir Rural 11 12 12 11 12 * 11 * 11 9 9Glasgow Kerbside, Hope Street Kerbside 26 29 * * 23 .. .. .. .. .. ..Glasgow Centre, St Enoch's Square Urban centre 25 * 17 * .. .. .. .. .. .. ..Inverness, Telford Street Roadside 12 14 12 11 12 11 9 9 .. .. ..Perth High Street Roadside 16 19 19 15 16 14 13 13 13 .. ..
Particulates (PM2.5) 5
micrograms per cubic metre
Aberdeen Errol Place Urban background .. 7 8 9 9 10 8 5 6 7 7Aberdeen Union Street Roadside .. .. .. .. .. * 11 7 7 8 7Auchencorth Moss Rural 3 .. 4 4 .. 7 3 3 5 5 4Edinburgh St Leonards Urban background 8 9 12 .. 8 .. 6 6 7 6 6Glasgow Kerbside, Hope Street Kerbside .. 23 22 20 16 .. .. .. .. .. ..Glasgow Centre, St Enoch's Square Urban centre 12 12 10 .. .. .. .. .. .. .. ..Glasgow High Street Roadside .. .. .. .. .. .. 8 8 7 7 6Glasgow Townhead Urban background .. .. .. .. .. 7 7 7 8 7 7Grangemouth Urban industrial 9 11 11 11 .. 8 9 6 6 7 8
Source: Scottish Government - Not National Statistics1. The sites chosen are a mixture of urban and rural site types with long time series2. Annual mean concentration of atmospheric nitrogen dioxide.3. Annual mean ground level ozone concentration.4. Annual mean atmospheric PM10 concentration.
5. Annual mean atmospheric PM2.5 concentration.
(*) Since 2003, results where data capture is less than 75% are not shown.(..) Site not in operation for given year(a) those to which transport is understood to contribute significantly - see text.
223
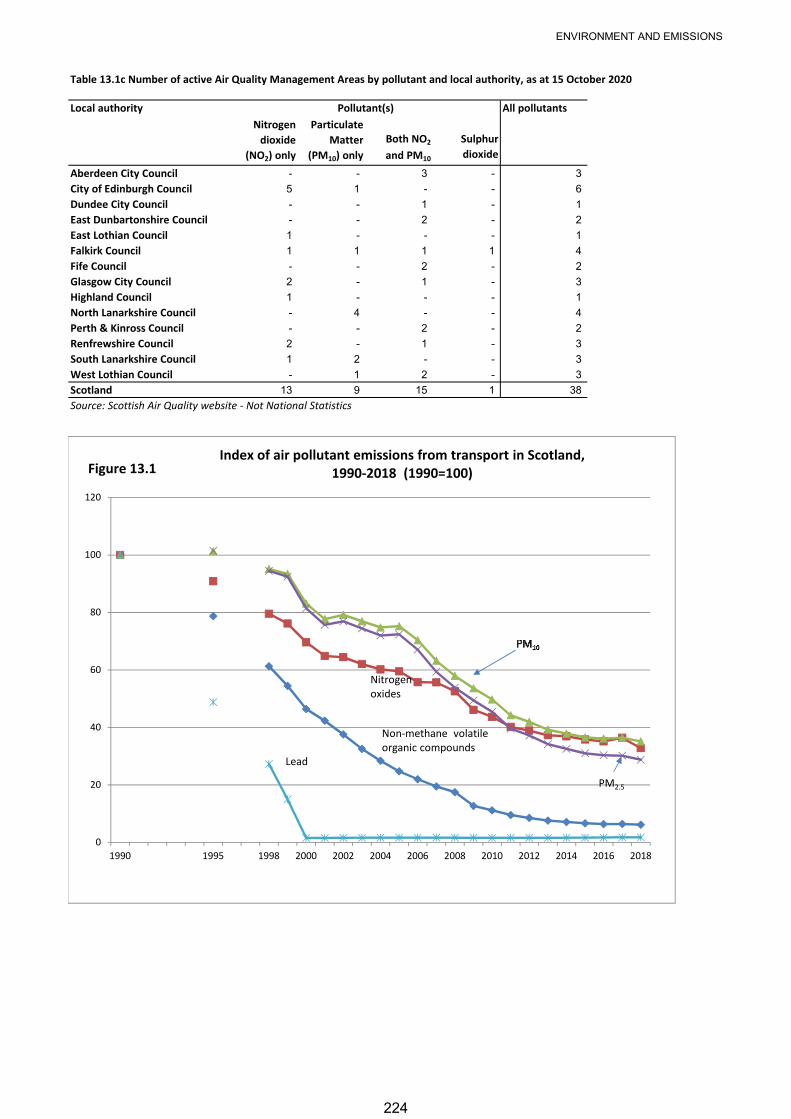
ENVIRONMENT AND EMISSIONS
Table 13.1c Number of active Air Quality Management Areas by pollutant and local authority, as at 15 October 2020
Local authority All pollutantsNitrogen
dioxide (NO2) only
Particulate Matter
(PM10) onlyBoth NO2
and PM10
Sulphur dioxide
Aberdeen City Council - - 3 - 3
City of Edinburgh Council 5 1 - - 6
Dundee City Council - - 1 - 1
East Dunbartonshire Council - - 2 - 2
East Lothian Council 1 - - - 1
Falkirk Council 1 1 1 1 4
Fife Council - - 2 - 2
Glasgow City Council 2 - 1 - 3
Highland Council 1 - - - 1
North Lanarkshire Council - 4 - - 4
Perth & Kinross Council - - 2 - 2
Renfrewshire Council 2 - 1 - 3
South Lanarkshire Council 1 2 - - 3
West Lothian Council - 1 2 - 3
Scotland 13 9 15 1 38
Source: Scottish Air Quality website - Not National Statistics
Pollutant(s)
0
20
40
60
80
100
120
1990 1995 1998 2000 2002 2004 2006 2008 2010 2012 2014 2016 2018
Non‐methane volatile organic compounds
Nitrogenoxides
PM2.5
Index of air pollutant emissions from transport in Scotland, 1990-2018 (1990=100)
Lead
Figure 13.1
224
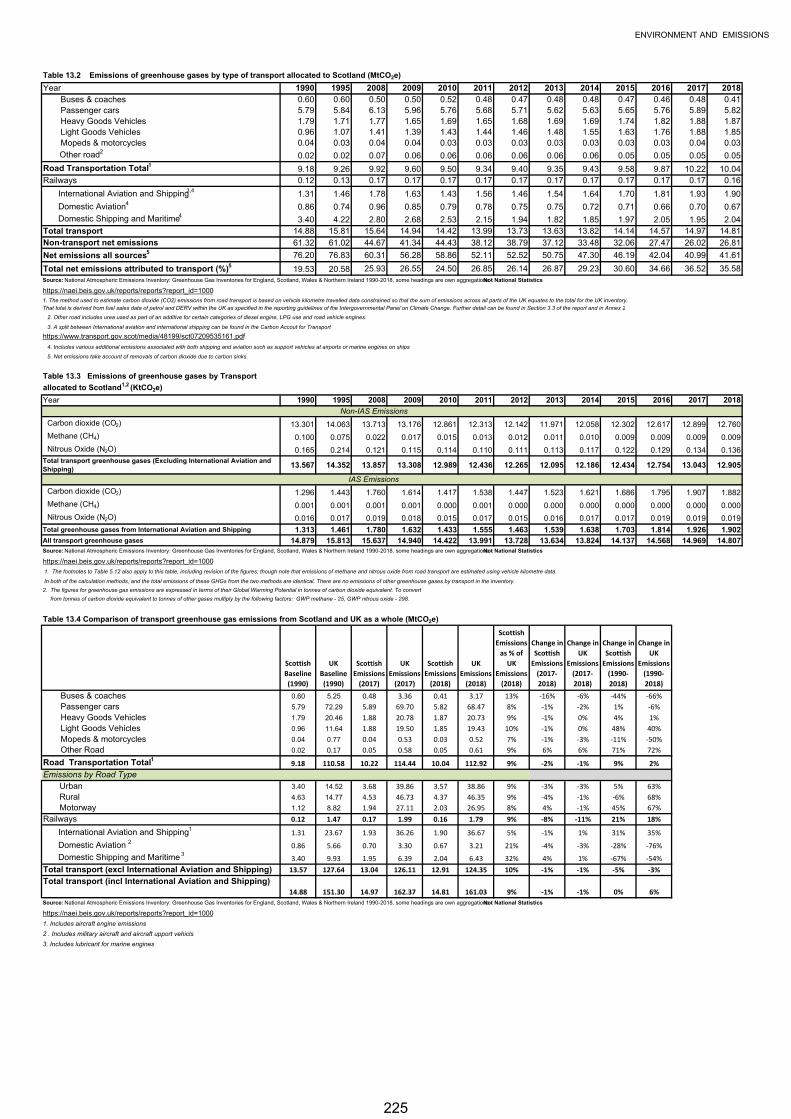
ENVIRONMENT AND EMISSIONS
Table 13.2 Emissions of greenhouse gases by type of transport allocated to Scotland (MtCO2e)
Year 1990 1995 2008 2009 2010 2011 2012 2013 2014 2015 2016 2017 2018 Buses & coaches 0.60 0.60 0.50 0.50 0.52 0.48 0.47 0.48 0.48 0.47 0.46 0.48 0.41 Passenger cars 5.79 5.84 6.13 5.96 5.76 5.68 5.71 5.62 5.63 5.65 5.76 5.89 5.82 Heavy Goods Vehicles 1.79 1.71 1.77 1.65 1.69 1.65 1.68 1.69 1.69 1.74 1.82 1.88 1.87 Light Goods Vehicles 0.96 1.07 1.41 1.39 1.43 1.44 1.46 1.48 1.55 1.63 1.76 1.88 1.85 Mopeds & motorcycles 0.04 0.03 0.04 0.04 0.03 0.03 0.03 0.03 0.03 0.03 0.03 0.04 0.03
Other road20.02 0.02 0.07 0.06 0.06 0.06 0.06 0.06 0.06 0.05 0.05 0.05 0.05
Road Transportation Total1 9.18 9.26 9.92 9.60 9.50 9.34 9.40 9.35 9.43 9.58 9.87 10.22 10.04Railways 0.12 0.13 0.17 0.17 0.17 0.17 0.17 0.17 0.17 0.17 0.17 0.17 0.16
International Aviation and Shipping3,4 1.31 1.46 1.78 1.63 1.43 1.56 1.46 1.54 1.64 1.70 1.81 1.93 1.90
Domestic Aviation4 0.86 0.74 0.96 0.85 0.79 0.78 0.75 0.75 0.72 0.71 0.66 0.70 0.67
Domestic Shipping and Maritime43.40 4.22 2.80 2.68 2.53 2.15 1.94 1.82 1.85 1.97 2.05 1.95 2.04
Total transport 14.88 15.81 15.64 14.94 14.42 13.99 13.73 13.63 13.82 14.14 14.57 14.97 14.81Non-transport net emissions 61.32 61.02 44.67 41.34 44.43 38.12 38.79 37.12 33.48 32.06 27.47 26.02 26.81
Net emissions all sources5 76.20 76.83 60.31 56.28 58.86 52.11 52.52 50.75 47.30 46.19 42.04 40.99 41.61
Total net emissions attributed to transport (%)5 19.53 20.58 25.93 26.55 24.50 26.85 26.14 26.87 29.23 30.60 34.66 36.52 35.58Source: National Atmospheric Emissions Inventory: Greenhouse Gas Inventories for England, Scotland, Wales & Northern Ireland 1990-2018, some headings are own aggregations - Not National Statistics
https://naei.beis.gov.uk/reports/reports?report_id=10001. The method used to estimate carbon dioxide (CO2) emissions from road transport is based on vehicle kilometre travelled data constrained so that the sum of emissions across all parts of the UK equates to the total for the UK inventory.That total is derived from fuel sales data of petrol and DERV within the UK as specified in the reporting guidelines of the Intergovernmental Panel on Climate Change. Further detail can be found in Section 3.3 of the report and in Annex 2
2. Other road includes urea used as part of an additive for certain categories of diesel engine, LPG use and road vehicle engines.
3. A split between International aviation and international shipping can be found in the Carbon Accout for Transport
https://www.transport.gov.scot/media/48199/sct07209535161.pdf
4. Includes various additional emissions associated with both shipping and aviation such as support vehicles at airports or marine engines on ships
5. Net emissions take account of removals of carbon dioxide due to carbon sinks.
Table 13.3 Emissions of greenhouse gases by Transport
allocated to Scotland1,2 (KtCO2e)
Year 1990 1995 2008 2009 2010 2011 2012 2013 2014 2015 2016 2017 2018
Carbon dioxide (CO2) 13.301 14.063 13.713 13.176 12.861 12.313 12.142 11.971 12.058 12.302 12.617 12.899 12.760
Methane (CH4) 0.100 0.075 0.022 0.017 0.015 0.013 0.012 0.011 0.010 0.009 0.009 0.009 0.009
Nitrous Oxide (N2O) 0.165 0.214 0.121 0.115 0.114 0.110 0.111 0.113 0.117 0.122 0.129 0.134 0.136Total transport greenhouse gases (Excluding International Aviation and Shipping)
13.567 14.352 13.857 13.308 12.989 12.436 12.265 12.095 12.186 12.434 12.754 13.043 12.905
Carbon dioxide (CO2) 1.296 1.443 1.760 1.614 1.417 1.538 1.447 1.523 1.621 1.686 1.795 1.907 1.882
Methane (CH4) 0.001 0.001 0.001 0.001 0.000 0.001 0.000 0.000 0.000 0.000 0.000 0.000 0.000
Nitrous Oxide (N2O) 0.016 0.017 0.019 0.018 0.015 0.017 0.015 0.016 0.017 0.017 0.019 0.019 0.019
Total greenhouse gases from International Aviation and Shipping 1.313 1.461 1.780 1.632 1.433 1.555 1.463 1.539 1.638 1.703 1.814 1.926 1.902 All transport greenhouse gases 14.879 15.813 15.637 14.940 14.422 13.991 13.728 13.634 13.824 14.137 14.568 14.969 14.807 Source: National Atmospheric Emissions Inventory: Greenhouse Gas Inventories for England, Scotland, Wales & Northern Ireland 1990-2018, some headings are own aggregations - Not National Statistics
https://naei.beis.gov.uk/reports/reports?report_id=1000 1. The footnotes to Table 5.12 also apply to this table, including revision of the figures; though note that emissions of methane and nitrous oxide from road transport are estimated using vehicle kilometre data.
In both of the calculation methods, and the total emissions of these GHGs from the two methods are identical. There are no emissions of other greenhouse gases by transport in the inventory.
2. The figures for greenhouse gas emissions are expressed in terms of their Global Warming Potential in tonnes of carbon dioxide equivalent. To convert
from tonnes of carbon dioxide equivalent to tonnes of other gases multiply by the following factors: GWP methane - 25, GWP nitrous oxide - 298.
Table 13.4 Comparison of transport greenhouse gas emissions from Scotland and UK as a whole (MtCO2e)
Scottish Baseline (1990)
UK Baseline (1990)
Scottish Emissions
(2017)
UK Emissions
(2017)
Scottish Emissions
(2018)
UK Emissions
(2018)
Scottish Emissions
as % of UK
Emissions (2018)
Change in Scottish
Emissions (2017-2018)
Change in UK
Emissions (2017-2018)
Change in Scottish
Emissions (1990-2018)
Change in UK
Emissions (1990-2018)
Buses & coaches 0.60 5.25 0.48 3.36 0.41 3.17 13% ‐16% ‐6% ‐44% ‐66%
Passenger cars 5.79 72.29 5.89 69.70 5.82 68.47 8% ‐1% ‐2% 1% ‐6%
Heavy Goods Vehicles 1.79 20.46 1.88 20.78 1.87 20.73 9% ‐1% 0% 4% 1%
Light Goods Vehicles 0.96 11.64 1.88 19.50 1.85 19.43 10% ‐1% 0% 48% 40%
Mopeds & motorcycles 0.04 0.77 0.04 0.53 0.03 0.52 7% ‐1% ‐3% ‐11% ‐50%
Other Road 0.02 0.17 0.05 0.58 0.05 0.61 9% 6% 6% 71% 72%
Road Transportation Total1 9.18 110.58 10.22 114.44 10.04 112.92 9% -2% -1% 9% 2%Emissions by Road Type Urban 3.40 14.52 3.68 39.86 3.57 38.86 9% ‐3% ‐3% 5% 63%
Rural 4.63 14.77 4.53 46.73 4.37 46.35 9% ‐4% ‐1% ‐6% 68%
Motorway 1.12 8.82 1.94 27.11 2.03 26.95 8% 4% ‐1% 45% 67%
Railways 0.12 1.47 0.17 1.99 0.16 1.79 9% -8% -11% 21% 18% International Aviation and Shipping 1 1.31 23.67 1.93 36.26 1.90 36.67 5% ‐1% 1% 31% 35%
Domestic Aviation 2 0.86 5.66 0.70 3.30 0.67 3.21 21% ‐4% ‐3% ‐28% ‐76%
Domestic Shipping and Maritime 3 3.40 9.93 1.95 6.39 2.04 6.43 32% 4% 1% ‐67% ‐54%
Total transport (excl International Aviation and Shipping) 13.57 127.64 13.04 126.11 12.91 124.35 10% -1% -1% -5% -3%Total transport (incl International Aviation and Shipping)
14.88 151.30 14.97 162.37 14.81 161.03 9% -1% -1% 0% 6%Source: National Atmospheric Emissions Inventory: Greenhouse Gas Inventories for England, Scotland, Wales & Northern Ireland 1990-2018, some headings are own aggregations - Not National Statistics
https://naei.beis.gov.uk/reports/reports?report_id=1000
1. Includes aircraft engine emissions
2 . Includes military aircraft and aircraft upport vehicls
3. Includes lubricant for marine engines
Non-IAS Emissions
IAS Emissions
225
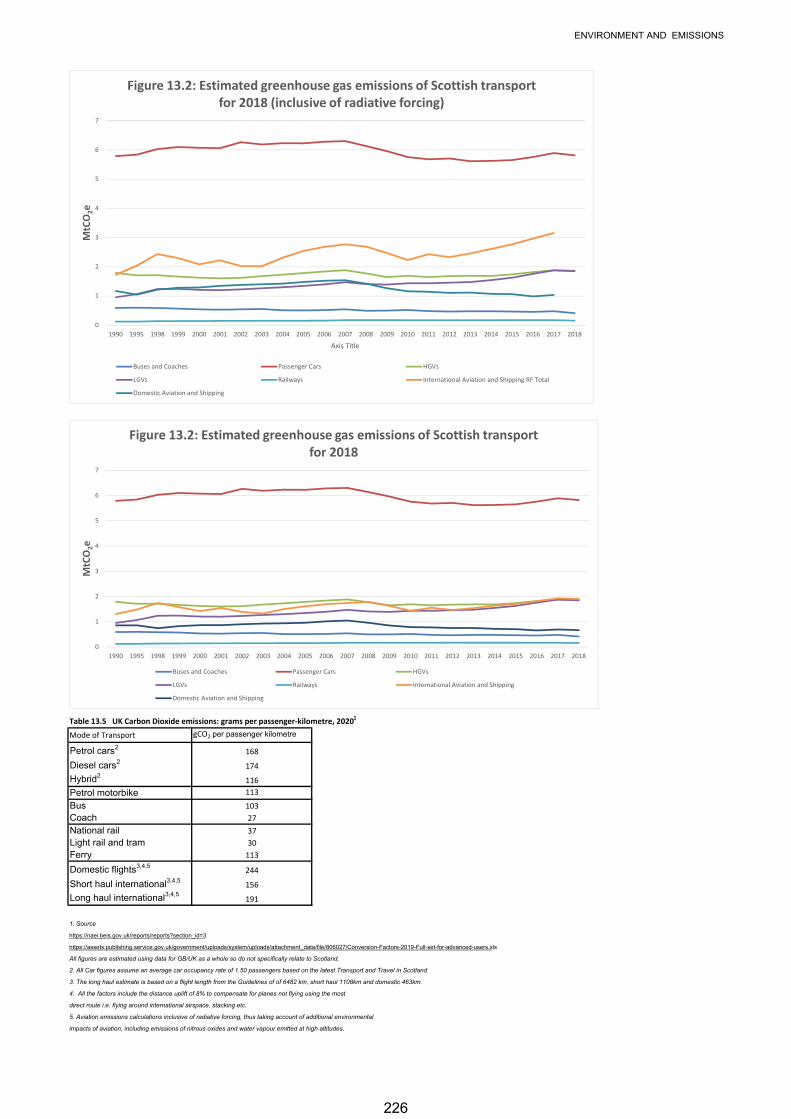
ENVIRONMENT AND EMISSIONS
Table 13.5 UK Carbon Dioxide emissions: grams per passenger-kilometre, 20201
Mode of Transport gCO2 per passenger kilometre
Petrol cars2168
Diesel cars2174
Hybrid2116
Petrol motorbike 113
Bus 103
Coach 27
National rail 37
Light rail and tram 30
Ferry 113
Domestic flights3,4,5244
Short haul international3,4,5156
Long haul international3,4,5191
1. Source
https://naei.beis.gov.uk/reports/reports?section_id=3
https://assets.publishing.service.gov.uk/government/uploads/system/uploads/attachment_data/file/806027/Conversion-Factors-2019-Full-set-for-advanced-users.xls
All figures are estimated using data for GB/UK as a whole so do not specifically relate to Scotland.
2. All Car figures assume an average car occupancy rate of 1.50 passengers based on the latest Transport and Travel in Scotland
3. The long haul estimate is based on a flight length from the Guidelines of of 6482 km, short haul 1108km and domestic 463km.
4. All the factors include the distance uplift of 8% to compensate for planes not flying using the most
direct route i.e. flying around international airspace, stacking etc.
5. Aviation emissions calculations inclusive of radiative forcing, thus taking account of additional environmental
impacts of aviation, including emissions of nitrous oxides and water vapour emitted at high altitudes.
0
1
2
3
4
5
6
7
1990 1995 1998 1999 2000 2001 2002 2003 2004 2005 2006 2007 2008 2009 2010 2011 2012 2013 2014 2015 2016 2017 2018
MtC
O 2e
Axis Title
Figure 13.2: Estimated greenhouse gas emissions of Scottish transport for 2018 (inclusive of radiative forcing)
Buses and Coaches Passenger Cars HGVs
LGVs Railways International Aviation and Shipping RF Total
Domestic Aviation and Shipping
0
1
2
3
4
5
6
7
1990 1995 1998 1999 2000 2001 2002 2003 2004 2005 2006 2007 2008 2009 2010 2011 2012 2013 2014 2015 2016 2017 2018
MtC
O 2e
Figure 13.2: Estimated greenhouse gas emissions of Scottish transport for 2018
Buses and Coaches Passenger Cars HGVs
LGVs Railways International Aviation and Shipping
Domestic Aviation and Shipping
226
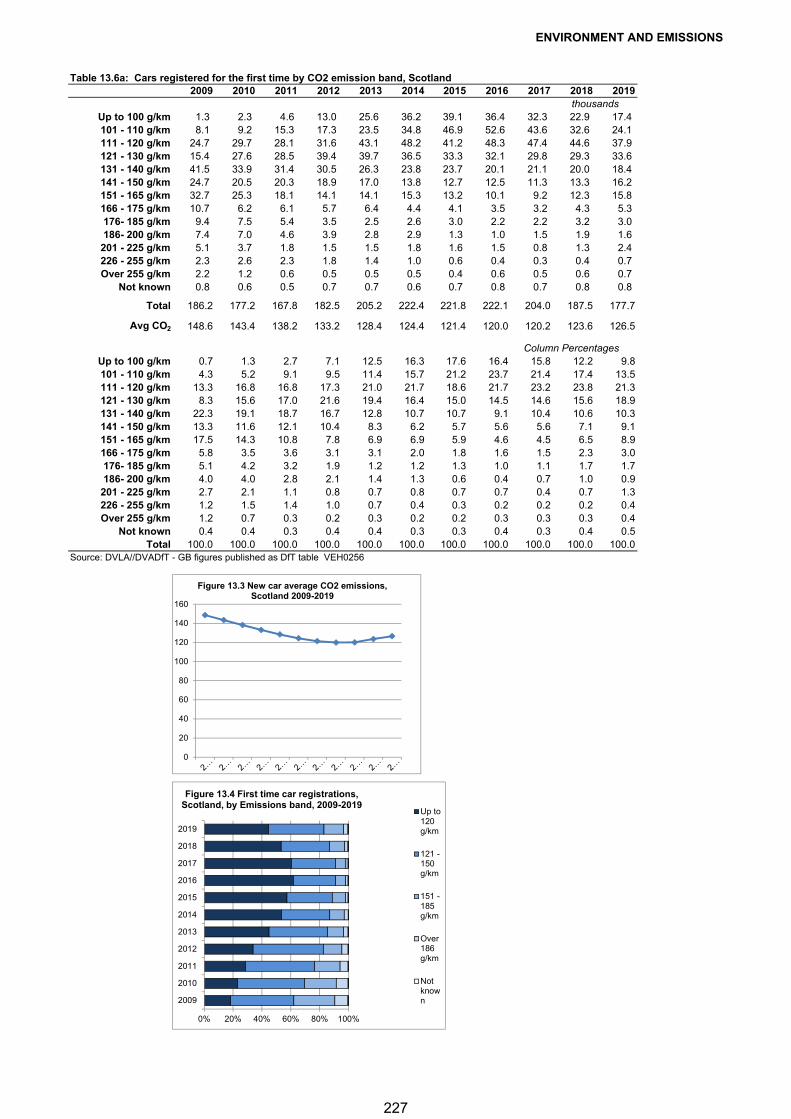
ENVIRONMENT AND EMISSIONS
Table 13.6a: Cars registered for the first time by CO2 emission band, Scotland2009 2010 2011 2012 2013 2014 2015 2016 2017 2018 2019
thousandsUp to 100 g/km 1.3 2.3 4.6 13.0 25.6 36.2 39.1 36.4 32.3 22.9 17.4 101 - 110 g/km 8.1 9.2 15.3 17.3 23.5 34.8 46.9 52.6 43.6 32.6 24.1 111 - 120 g/km 24.7 29.7 28.1 31.6 43.1 48.2 41.2 48.3 47.4 44.6 37.9 121 - 130 g/km 15.4 27.6 28.5 39.4 39.7 36.5 33.3 32.1 29.8 29.3 33.6 131 - 140 g/km 41.5 33.9 31.4 30.5 26.3 23.8 23.7 20.1 21.1 20.0 18.4 141 - 150 g/km 24.7 20.5 20.3 18.9 17.0 13.8 12.7 12.5 11.3 13.3 16.2 151 - 165 g/km 32.7 25.3 18.1 14.1 14.1 15.3 13.2 10.1 9.2 12.3 15.8 166 - 175 g/km 10.7 6.2 6.1 5.7 6.4 4.4 4.1 3.5 3.2 4.3 5.3 176- 185 g/km 9.4 7.5 5.4 3.5 2.5 2.6 3.0 2.2 2.2 3.2 3.0 186- 200 g/km 7.4 7.0 4.6 3.9 2.8 2.9 1.3 1.0 1.5 1.9 1.6
201 - 225 g/km 5.1 3.7 1.8 1.5 1.5 1.8 1.6 1.5 0.8 1.3 2.4 226 - 255 g/km 2.3 2.6 2.3 1.8 1.4 1.0 0.6 0.4 0.3 0.4 0.7 Over 255 g/km 2.2 1.2 0.6 0.5 0.5 0.5 0.4 0.6 0.5 0.6 0.7
Not known 0.8 0.6 0.5 0.7 0.7 0.6 0.7 0.8 0.7 0.8 0.8
Total 186.2 177.2 167.8 182.5 205.2 222.4 221.8 222.1 204.0 187.5 177.7
Avg CO2 148.6 143.4 138.2 133.2 128.4 124.4 121.4 120.0 120.2 123.6 126.5
Column PercentagesUp to 100 g/km 0.7 1.3 2.7 7.1 12.5 16.3 17.6 16.4 15.8 12.2 9.8101 - 110 g/km 4.3 5.2 9.1 9.5 11.4 15.7 21.2 23.7 21.4 17.4 13.5111 - 120 g/km 13.3 16.8 16.8 17.3 21.0 21.7 18.6 21.7 23.2 23.8 21.3121 - 130 g/km 8.3 15.6 17.0 21.6 19.4 16.4 15.0 14.5 14.6 15.6 18.9131 - 140 g/km 22.3 19.1 18.7 16.7 12.8 10.7 10.7 9.1 10.4 10.6 10.3141 - 150 g/km 13.3 11.6 12.1 10.4 8.3 6.2 5.7 5.6 5.6 7.1 9.1151 - 165 g/km 17.5 14.3 10.8 7.8 6.9 6.9 5.9 4.6 4.5 6.5 8.9166 - 175 g/km 5.8 3.5 3.6 3.1 3.1 2.0 1.8 1.6 1.5 2.3 3.0176- 185 g/km 5.1 4.2 3.2 1.9 1.2 1.2 1.3 1.0 1.1 1.7 1.7186- 200 g/km 4.0 4.0 2.8 2.1 1.4 1.3 0.6 0.4 0.7 1.0 0.9
201 - 225 g/km 2.7 2.1 1.1 0.8 0.7 0.8 0.7 0.7 0.4 0.7 1.3226 - 255 g/km 1.2 1.5 1.4 1.0 0.7 0.4 0.3 0.2 0.2 0.2 0.4Over 255 g/km 1.2 0.7 0.3 0.2 0.3 0.2 0.2 0.3 0.3 0.3 0.4
Not known 0.4 0.4 0.3 0.4 0.4 0.3 0.3 0.4 0.3 0.4 0.5Total 100.0 100.0 100.0 100.0 100.0 100.0 100.0 100.0 100.0 100.0 100.0
Source: DVLA//DVADfT - GB figures published as DfT table VEH0256
0
20
40
60
80
100
120
140
160
Figure 13.3 New car average CO2 emissions, Scotland 2009-2019
0% 20% 40% 60% 80% 100%
2009
2010
2011
2012
2013
2014
2015
2016
2017
2018
2019
Figure 13.4 First time car registrations, Scotland, by Emissions band, 2009-2019
Up to120g/km
121 -150g/km
151 -185g/km
Over186g/km
Notknown
227
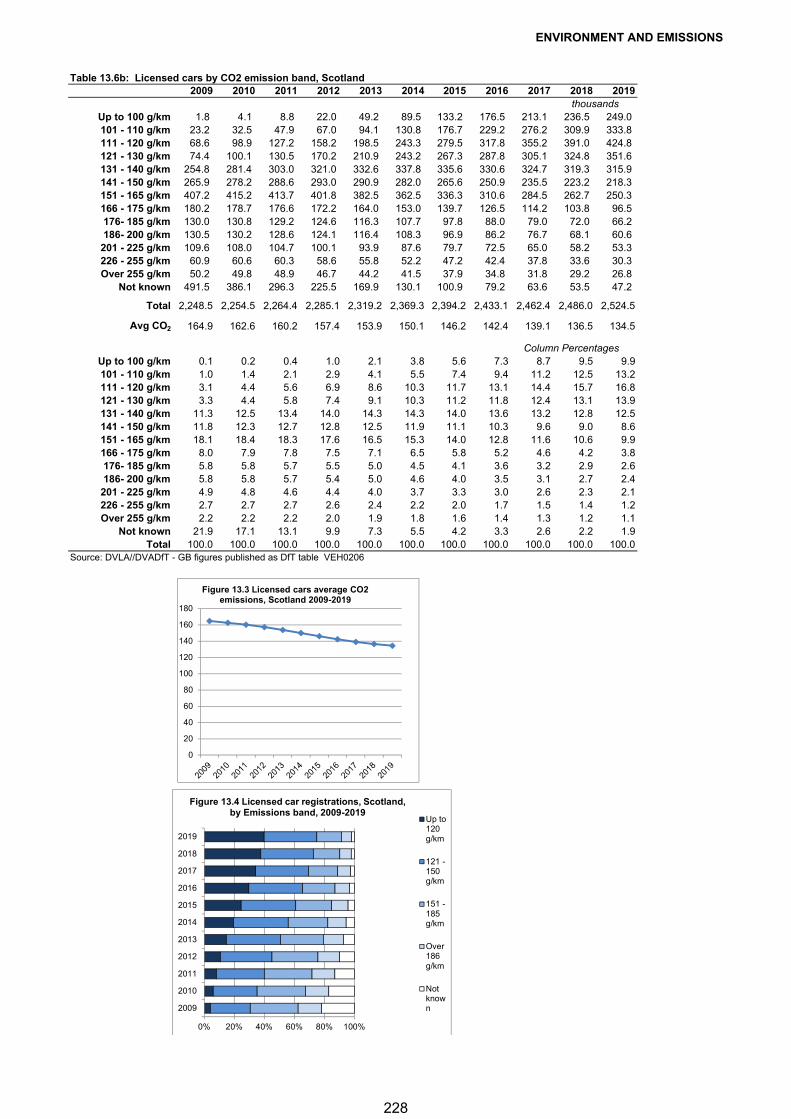
ENVIRONMENT AND EMISSIONS
Table 13.6b: Licensed cars by CO2 emission band, Scotland2009 2010 2011 2012 2013 2014 2015 2016 2017 2018 2019
thousandsUp to 100 g/km 1.8 4.1 8.8 22.0 49.2 89.5 133.2 176.5 213.1 236.5 249.0 101 - 110 g/km 23.2 32.5 47.9 67.0 94.1 130.8 176.7 229.2 276.2 309.9 333.8 111 - 120 g/km 68.6 98.9 127.2 158.2 198.5 243.3 279.5 317.8 355.2 391.0 424.8 121 - 130 g/km 74.4 100.1 130.5 170.2 210.9 243.2 267.3 287.8 305.1 324.8 351.6 131 - 140 g/km 254.8 281.4 303.0 321.0 332.6 337.8 335.6 330.6 324.7 319.3 315.9 141 - 150 g/km 265.9 278.2 288.6 293.0 290.9 282.0 265.6 250.9 235.5 223.2 218.3 151 - 165 g/km 407.2 415.2 413.7 401.8 382.5 362.5 336.3 310.6 284.5 262.7 250.3 166 - 175 g/km 180.2 178.7 176.6 172.2 164.0 153.0 139.7 126.5 114.2 103.8 96.5 176- 185 g/km 130.0 130.8 129.2 124.6 116.3 107.7 97.8 88.0 79.0 72.0 66.2 186- 200 g/km 130.5 130.2 128.6 124.1 116.4 108.3 96.9 86.2 76.7 68.1 60.6
201 - 225 g/km 109.6 108.0 104.7 100.1 93.9 87.6 79.7 72.5 65.0 58.2 53.3 226 - 255 g/km 60.9 60.6 60.3 58.6 55.8 52.2 47.2 42.4 37.8 33.6 30.3 Over 255 g/km 50.2 49.8 48.9 46.7 44.2 41.5 37.9 34.8 31.8 29.2 26.8
Not known 491.5 386.1 296.3 225.5 169.9 130.1 100.9 79.2 63.6 53.5 47.2
Total 2,248.5 2,254.5 2,264.4 2,285.1 2,319.2 2,369.3 2,394.2 2,433.1 2,462.4 2,486.0 2,524.5
Avg CO2 164.9 162.6 160.2 157.4 153.9 150.1 146.2 142.4 139.1 136.5 134.5
Column PercentagesUp to 100 g/km 0.1 0.2 0.4 1.0 2.1 3.8 5.6 7.3 8.7 9.5 9.9101 - 110 g/km 1.0 1.4 2.1 2.9 4.1 5.5 7.4 9.4 11.2 12.5 13.2111 - 120 g/km 3.1 4.4 5.6 6.9 8.6 10.3 11.7 13.1 14.4 15.7 16.8121 - 130 g/km 3.3 4.4 5.8 7.4 9.1 10.3 11.2 11.8 12.4 13.1 13.9131 - 140 g/km 11.3 12.5 13.4 14.0 14.3 14.3 14.0 13.6 13.2 12.8 12.5141 - 150 g/km 11.8 12.3 12.7 12.8 12.5 11.9 11.1 10.3 9.6 9.0 8.6151 - 165 g/km 18.1 18.4 18.3 17.6 16.5 15.3 14.0 12.8 11.6 10.6 9.9166 - 175 g/km 8.0 7.9 7.8 7.5 7.1 6.5 5.8 5.2 4.6 4.2 3.8176- 185 g/km 5.8 5.8 5.7 5.5 5.0 4.5 4.1 3.6 3.2 2.9 2.6186- 200 g/km 5.8 5.8 5.7 5.4 5.0 4.6 4.0 3.5 3.1 2.7 2.4
201 - 225 g/km 4.9 4.8 4.6 4.4 4.0 3.7 3.3 3.0 2.6 2.3 2.1226 - 255 g/km 2.7 2.7 2.7 2.6 2.4 2.2 2.0 1.7 1.5 1.4 1.2Over 255 g/km 2.2 2.2 2.2 2.0 1.9 1.8 1.6 1.4 1.3 1.2 1.1
Not known 21.9 17.1 13.1 9.9 7.3 5.5 4.2 3.3 2.6 2.2 1.9Total 100.0 100.0 100.0 100.0 100.0 100.0 100.0 100.0 100.0 100.0 100.0
Source: DVLA//DVADfT - GB figures published as DfT table VEH0206
0
20
40
60
80
100
120
140
160
180
Figure 13.3 Licensed cars average CO2 emissions, Scotland 2009-2019
0% 20% 40% 60% 80% 100%
2009
2010
2011
2012
2013
2014
2015
2016
2017
2018
2019
Figure 13.4 Licensed car registrations, Scotland, by Emissions band, 2009-2019
Up to120g/km
121 -150g/km
151 -185g/km
Over186g/km
Notknown
228
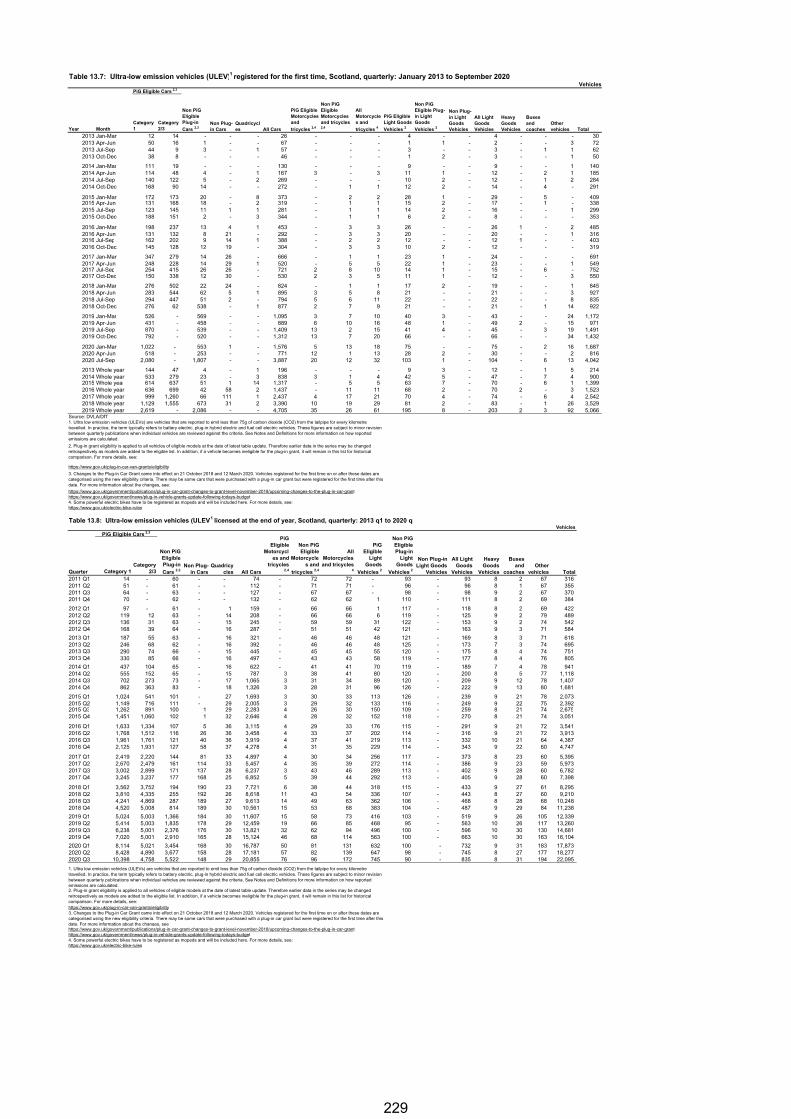
Table 13.7: Ultra-low emission vehicles (ULEV)1 registered for the first time, Scotland, quarterly: January 2013 to September 2020Vehicles
Year MonthCategory 1
Category 2/3
2013 Jan-Mar 12 14 - - - 26 - - - 4 - - 4 - - - 30 2013 Apr-Jun 50 16 1 - - 67 - - - 1 1 - 2 - - 3 72 2013 Jul-Sep 44 9 3 - 1 57 - - - 3 - - 3 - 1 1 62 2013 Oct-Dec 38 8 - - - 46 - - - 1 2 - 3 - - 1 50
2014 Jan-Mar 111 19 - - - 130 - - - 9 - - 9 - - 1 140 2014 Apr-Jun 114 48 4 - 1 167 3 - 3 11 1 - 12 - 2 1 185 2014 Jul-Sep 140 122 5 - 2 269 - - - 10 2 - 12 - 1 2 284 2014 Oct-Dec 168 90 14 - - 272 - 1 1 12 2 - 14 - 4 - 291
2015 Jan-Mar 172 173 20 - 8 373 - 2 2 28 1 - 29 - 5 - 409 2015 Apr-Jun 131 168 18 - 2 319 - 1 1 15 2 - 17 - 1 - 338 2015 Jul-Sep 123 145 11 1 1 281 - 1 1 14 2 - 16 - - 1 299 2015 Oct-Dec 188 151 2 - 3 344 - 1 1 6 2 - 8 - - - 353
2016 Jan-Mar 198 237 13 4 1 453 - 3 3 26 - - 26 1 - 2 485 2016 Apr-Jun 131 132 8 21 - 292 - 3 3 20 - - 20 - - 1 316 2016 Jul-Sep 162 202 9 14 1 388 - 2 2 12 - - 12 1 - - 403 2016 Oct-Dec 145 128 12 19 - 304 - 3 3 10 2 - 12 - - - 319
2017 Jan-Mar 347 279 14 26 - 666 - 1 1 23 1 - 24 - - - 691 2017 Apr-Jun 248 228 14 29 1 520 - 5 5 22 1 - 23 - - 1 549 2017 Jul-Sep 254 415 26 26 - 721 2 8 10 14 1 - 15 - 6 - 752 2017 Oct-Dec 150 338 12 30 - 530 2 3 5 11 1 - 12 - - 3 550
2018 Jan-Mar 276 502 22 24 - 824 - 1 1 17 2 - 19 - - 1 845 2018 Apr-Jun 283 544 62 5 1 895 3 5 8 21 - - 21 - - 3 927 2018 Jul-Sep 294 447 51 2 - 794 5 6 11 22 - - 22 - - 8 835 2018 Oct-Dec 276 62 538 - 1 877 2 7 9 21 - - 21 - 1 14 922
2019 Jan-Mar 526 - 569 - - 1,095 3 7 10 40 3 - 43 - - 24 1,172 2019 Apr-Jun 431 - 458 - - 889 6 10 16 48 1 - 49 2 - 15 971 2019 Jul-Sep 870 - 539 - - 1,409 13 2 15 41 4 - 45 - 3 19 1,491 2019 Oct-Dec 792 - 520 - - 1,312 13 7 20 66 - - 66 - - 34 1,432
2020 Jan-Mar 1,022 - 553 1 - 1,576 5 13 18 75 - - 75 - 2 16 1,687 2020 Apr-Jun 518 - 253 - - 771 12 1 13 28 2 - 30 - - 2 816 2020 Jul-Sep 2,080 - 1,807 - - 3,887 20 12 32 103 1 - 104 - 6 13 4,042
2013 Whole year 144 47 4 - 1 196 - - - 9 3 - 12 - 1 5 214 2014 Whole year 533 279 23 - 3 838 3 1 4 42 5 - 47 - 7 4 900 2015 Whole year 614 637 51 1 14 1,317 - 5 5 63 7 - 70 - 6 1 1,399 2016 Whole year 636 699 42 58 2 1,437 - 11 11 68 2 - 70 2 - 3 1,523 2017 Whole year 999 1,260 66 111 1 2,437 4 17 21 70 4 - 74 - 6 4 2,542 2018 Whole year 1,129 1,555 673 31 2 3,390 10 19 29 81 2 - 83 - 1 26 3,529 2019 Whole year 2,619 - 2,086 - - 4,705 35 26 61 195 8 - 203 2 3 92 5,066
Source: DVLA/DfT
4. Some powerful electric bikes have to be registered as mopeds and will be included here. For more details, see:https://www.gov.uk/electric-bike-rules
Table 13.8: Ultra-low emission vehicles (ULEV)1 licensed at the end of year, Scotland, quarterly: 2013 q1 to 2020 q3Vehicles
Quarter Category 1Category
2/3
2011 Q1 14 - 60 - - 74 - 72 72 - 93 - 93 8 2 67 316 2011 Q2 51 - 61 - - 112 - 71 71 - 96 - 96 8 1 67 355 2011 Q3 64 - 63 - - 127 - 67 67 - 98 - 98 9 2 67 370 2011 Q4 70 - 62 - - 132 - 62 62 1 110 - 111 8 2 69 384
2012 Q1 97 - 61 - 1 159 - 66 66 1 117 - 118 8 2 69 422 2012 Q2 119 12 63 - 14 208 - 66 66 6 119 - 125 9 2 79 489 2012 Q3 136 31 63 - 15 245 - 59 59 31 122 - 153 9 2 74 542 2012 Q4 168 39 64 - 16 287 - 51 51 42 121 - 163 9 3 71 584
2013 Q1 187 55 63 - 16 321 - 46 46 48 121 - 169 8 3 71 618 2013 Q2 246 68 62 - 16 392 - 46 46 48 125 - 173 7 3 74 695 2013 Q3 290 74 66 - 15 445 - 45 45 55 120 - 175 8 4 74 751 2013 Q4 330 85 66 - 16 497 - 43 43 58 119 - 177 8 4 76 805
2014 Q1 437 104 65 - 16 622 - 41 41 70 119 - 189 7 4 78 941 2014 Q2 555 152 65 - 15 787 3 38 41 80 120 - 200 8 5 77 1,118 2014 Q3 702 273 73 - 17 1,065 3 31 34 89 120 - 209 9 12 78 1,407 2014 Q4 862 363 83 - 18 1,326 3 28 31 96 126 - 222 9 13 80 1,681
2015 Q1 1,024 541 101 - 27 1,693 3 30 33 113 126 - 239 9 21 78 2,073 2015 Q2 1,149 716 111 - 29 2,005 3 29 32 133 116 - 249 9 22 75 2,392 2015 Q3 1,262 891 100 1 29 2,283 4 26 30 150 109 - 259 8 21 74 2,675 2015 Q4 1,451 1,060 102 1 32 2,646 4 28 32 152 118 - 270 8 21 74 3,051
2016 Q1 1,633 1,334 107 5 36 3,115 4 29 33 176 115 - 291 9 21 72 3,541 2016 Q2 1,768 1,512 116 26 36 3,458 4 33 37 202 114 - 316 9 21 72 3,913 2016 Q3 1,961 1,761 121 40 36 3,919 4 37 41 219 113 - 332 10 21 64 4,387 2016 Q4 2,125 1,931 127 58 37 4,278 4 31 35 229 114 - 343 9 22 60 4,747
2017 Q1 2,419 2,220 144 81 33 4,897 4 30 34 256 117 - 373 8 23 60 5,395 2017 Q2 2,670 2,479 161 114 33 5,457 4 35 39 272 114 - 386 9 23 59 5,973 2017 Q3 3,002 2,899 171 137 28 6,237 3 43 46 289 113 - 402 9 28 60 6,782 2017 Q4 3,245 3,237 177 168 25 6,852 5 39 44 292 113 - 405 9 28 60 7,398
2018 Q1 3,562 3,752 194 190 23 7,721 6 38 44 318 115 - 433 9 27 61 8,295 2018 Q2 3,810 4,335 255 192 26 8,618 11 43 54 336 107 - 443 8 27 60 9,210 2018 Q3 4,241 4,869 287 189 27 9,613 14 49 63 362 106 - 468 8 28 68 10,248 2018 Q4 4,520 5,008 814 189 30 10,561 15 53 68 383 104 - 487 9 29 84 11,238
2019 Q1 5,024 5,003 1,366 184 30 11,607 15 58 73 416 103 - 519 9 26 105 12,339 2019 Q2 5,414 5,003 1,835 178 29 12,459 19 66 85 468 95 - 563 10 26 117 13,260 2019 Q3 6,238 5,001 2,376 176 30 13,821 32 62 94 496 100 - 596 10 30 130 14,681 2019 Q4 7,020 5,001 2,910 165 28 15,124 46 68 114 563 100 - 663 10 30 163 16,104
2020 Q1 8,114 5,021 3,454 168 30 16,787 50 81 131 632 100 - 732 9 31 183 17,873 2020 Q2 8,428 4,890 3,677 158 28 17,181 57 82 139 647 98 - 745 8 27 177 18,277 2020 Q3 10,398 4,758 5,522 148 29 20,855 76 96 172 745 90 - 835 8 31 194 22,095
4. Some powerful electric bikes have to be registered as mopeds and will be included here. For more details, see:https://www.gov.uk/electric-bike-rules
https://www.gov.uk/government/news/plug-in-vehicle-grants-update-following-todays-budget
3. Changes to the Plug-in Car Grant came into effect on 21 October 2018 and 12 March 2020. Vehicles registered for the first time on or after these dates are categorised using the new eligibility criteria. There may be some cars that were purchased with a plug-in car grant but were registered for the first time after this date. For more information about the changes, see:https://www.gov.uk/government/publications/plug-in-car-grant-changes-to-grant-level-november-2018/upcoming-changes-to-the-plug-in-car-grant
2. Plug-in grant eligibility is applied to all vehicles of eligible models at the date of latest table update. Therefore earlier data in the series may be changed retrospectively as models are added to the eligible list. In addition, if a vehicle becomes ineligible for the plug-in grant, it will remain in this list for historical comparison. For more details, see:
1. Ultra low emission vehicles (ULEVs) are vehicles that are reported to emit less than 75g of carbon dioxide (CO2) from the tailpipe for every kilometre travelled. In practice, the term typically refers to battery electric, plug-in hybrid electric and fuel cell electric vehicles. These figures are subject to minor revision between quarterly publications when individual vehicles are reviewed against the criteria. See Notes and Definitions for more information on how reported emissions are calculated.
https://www.gov.uk/plug-in-car-van-grants/eligibility
3. Changes to the Plug-in Car Grant came into effect on 21 October 2018 and 12 March 2020. Vehicles registered for the first time on or after these dates are categorised using the new eligibility criteria. There may be some cars that were purchased with a plug-in car grant but were registered for the first time after this date. For more information about the changes, see:
https://www.gov.uk/government/publications/plug-in-car-grant-changes-to-grant-level-november-2018/upcoming-changes-to-the-plug-in-car-granthttps://www.gov.uk/government/news/plug-in-vehicle-grants-update-following-todays-budget
PiG Eligible
Motorcycles and
tricycles 2,4
Non PiG Eligible
Motorcycles and
tricycles 2,4
All Motorcycles and tricycles
4
PiG Eligible
Light Goods
Vehicles 2
PiG Eligible Cars 2,3
Non PiG Eligible Plug-in
Cars 2,3Non Plug-
in Cars
Other vehicles Total
PiG Eligible Cars 2,3
Non PiG Eligible Plug-in
Cars 2,3Non Plug-in Cars
Quadricycles All Cars
PiG Eligible Motorcycles and
tricycles 2,4
Non PiG Eligible Motorcycles and tricycles 2,4
All Motorcycles and
tricycles 4
PiG Eligible Light Goods
Vehicles 2
Non PiG Eligible Plug-in Light Goods
Vehicles 2
Non Plug-in Light Goods Vehicles
All Light Goods Vehicles
Heavy Goods Vehicles
Buses and coaches
1. Ultra low emission vehicles (ULEVs) are vehicles that are reported to emit less than 75g of carbon dioxide (CO2) from the tailpipe for every kilometre travelled. In practice, the term typically refers to battery electric, plug-in hybrid electric and fuel cell electric vehicles. These figures are subject to minor revision between quarterly publications when individual vehicles are reviewed against the criteria. See Notes and Definitions for more information on how reported emissions are calculated.2. Plug-in grant eligibility is applied to all vehicles of eligible models at the date of latest table update. Therefore earlier data in the series may be changed retrospectively as models are added to the eligible list. In addition, if a vehicle becomes ineligible for the plug-in grant, it will remain in this list for historical comparison. For more details, see:https://www.gov.uk/plug-in-car-van-grants/eligibility
Total
Non PiG Eligible Plug-in
Light Goods
Vehicles 2
Non Plug-in Light Goods
Vehicles
All Light Goods
Vehicles
Heavy Goods
Vehicles
Buses and
coachesQuadricy
cles All CarsOther
vehicles
229
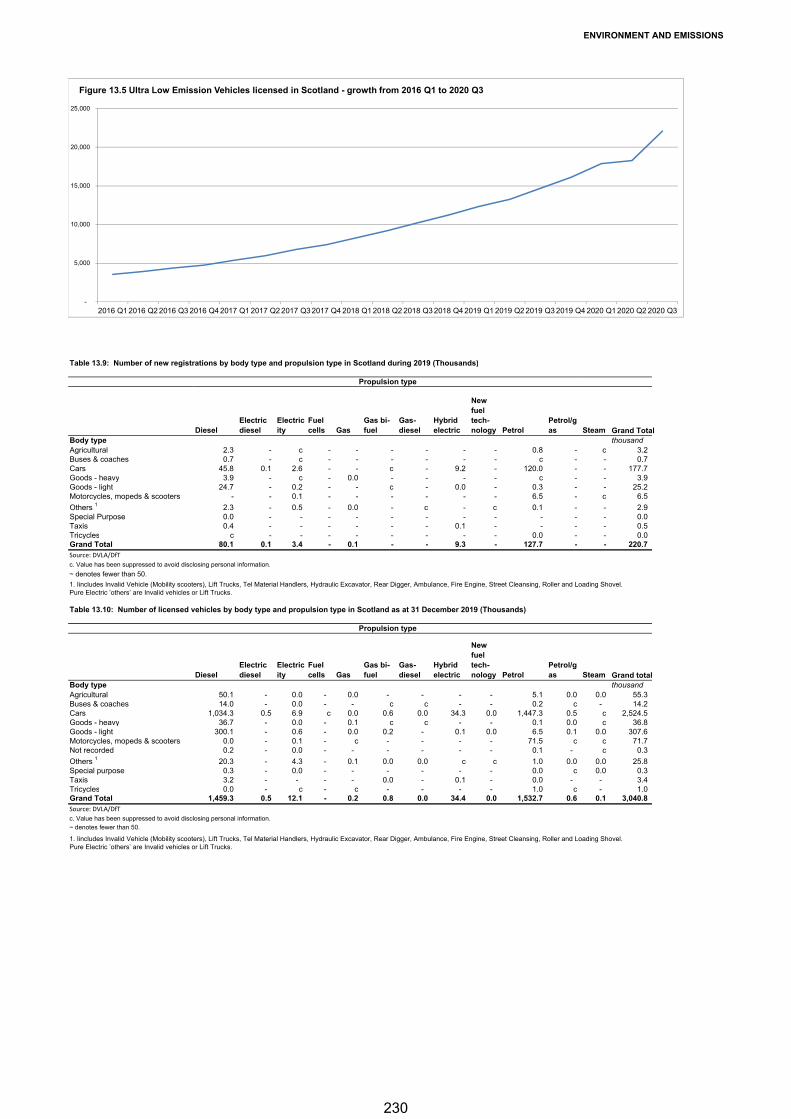
ENVIRONMENT AND EMISSIONS
Table 13.9: Number of new registrations by body type and propulsion type in Scotland during 2019 (Thousands)
DieselElectric diesel
Electricity
Fuel cells Gas
Gas bi-fuel
Gas-diesel
Hybrid electric
New fuel tech-nology Petrol
Petrol/gas Steam Grand Total
Body type thousandAgricultural 2.3 - c - - - - - - 0.8 - c 3.2 Buses & coaches 0.7 - c - - - - - - c - - 0.7 Cars 45.8 0.1 2.6 - - c - 9.2 - 120.0 - - 177.7 Goods - heavy 3.9 - c - 0.0 - - - - c - - 3.9 Goods - light 24.7 - 0.2 - - c - 0.0 - 0.3 - - 25.2 Motorcycles, mopeds & scooters - - 0.1 - - - - - - 6.5 - c 6.5
Others 1 2.3 - 0.5 - 0.0 - c - c 0.1 - - 2.9 Special Purpose 0.0 - - - - - - - - - - - 0.0 Taxis 0.4 - - - - - - 0.1 - - - - 0.5 Tricycles c - - - - - - - - 0.0 - - 0.0 Grand Total 80.1 0.1 3.4 - 0.1 - - 9.3 - 127.7 - - 220.7 Source: DVLA/DfT
c. Value has been suppressed to avoid disclosing personal information.
~ denotes fewer than 50.
1. Iincludes Invalid Vehicle (Mobility scooters), Lift Trucks, Tel Material Handlers, Hydraulic Excavator, Rear Digger, Ambulance, Fire Engine, Street Cleansing, Roller and Loading Shovel.Pure Electric ’others’ are Invalid vehicles or Lift Trucks.
Table 13.10: Number of licensed vehicles by body type and propulsion type in Scotland as at 31 December 2019 (Thousands)
DieselElectric diesel
Electricity
Fuel cells Gas
Gas bi-fuel
Gas-diesel
Hybrid electric
New fuel tech-nology Petrol
Petrol/gas Steam Grand total
Body type thousandAgricultural 50.1 - 0.0 - 0.0 - - - - 5.1 0.0 0.0 55.3 Buses & coaches 14.0 - 0.0 - - c c - - 0.2 c - 14.2 Cars 1,034.3 0.5 6.9 c 0.0 0.6 0.0 34.3 0.0 1,447.3 0.5 c 2,524.5 Goods - heavy 36.7 - 0.0 - 0.1 c c - - 0.1 0.0 c 36.8 Goods - light 300.1 - 0.6 - 0.0 0.2 - 0.1 0.0 6.5 0.1 0.0 307.6 Motorcycles, mopeds & scooters 0.0 - 0.1 - c - - - - 71.5 c c 71.7 Not recorded 0.2 - 0.0 - - - - - - 0.1 - c 0.3
Others 1 20.3 - 4.3 - 0.1 0.0 0.0 c c 1.0 0.0 0.0 25.8 Special purpose 0.3 - 0.0 - - - - - - 0.0 c 0.0 0.3 Taxis 3.2 - - - - 0.0 - 0.1 - 0.0 - - 3.4 Tricycles 0.0 - c - c - - - - 1.0 c - 1.0 Grand Total 1,459.3 0.5 12.1 - 0.2 0.8 0.0 34.4 0.0 1,532.7 0.6 0.1 3,040.8 Source: DVLA/DfT
c. Value has been suppressed to avoid disclosing personal information.~ denotes fewer than 50.
1. Iincludes Invalid Vehicle (Mobility scooters), Lift Trucks, Tel Material Handlers, Hydraulic Excavator, Rear Digger, Ambulance, Fire Engine, Street Cleansing, Roller and Loading Shovel.Pure Electric ’others’ are Invalid vehicles or Lift Trucks.
Propulsion type
Propulsion type
-
5,000
10,000
15,000
20,000
25,000
2016 Q1 2016 Q2 2016 Q3 2016 Q4 2017 Q1 2017 Q2 2017 Q3 2017 Q4 2018 Q1 2018 Q2 2018 Q3 2018 Q4 2019 Q1 2019 Q2 2019 Q3 2019 Q4 2020 Q1 2020 Q2 2020 Q3
Figure 13.5 Ultra Low Emission Vehicles licensed in Scotland - growth from 2016 Q1 to 2020 Q3
230
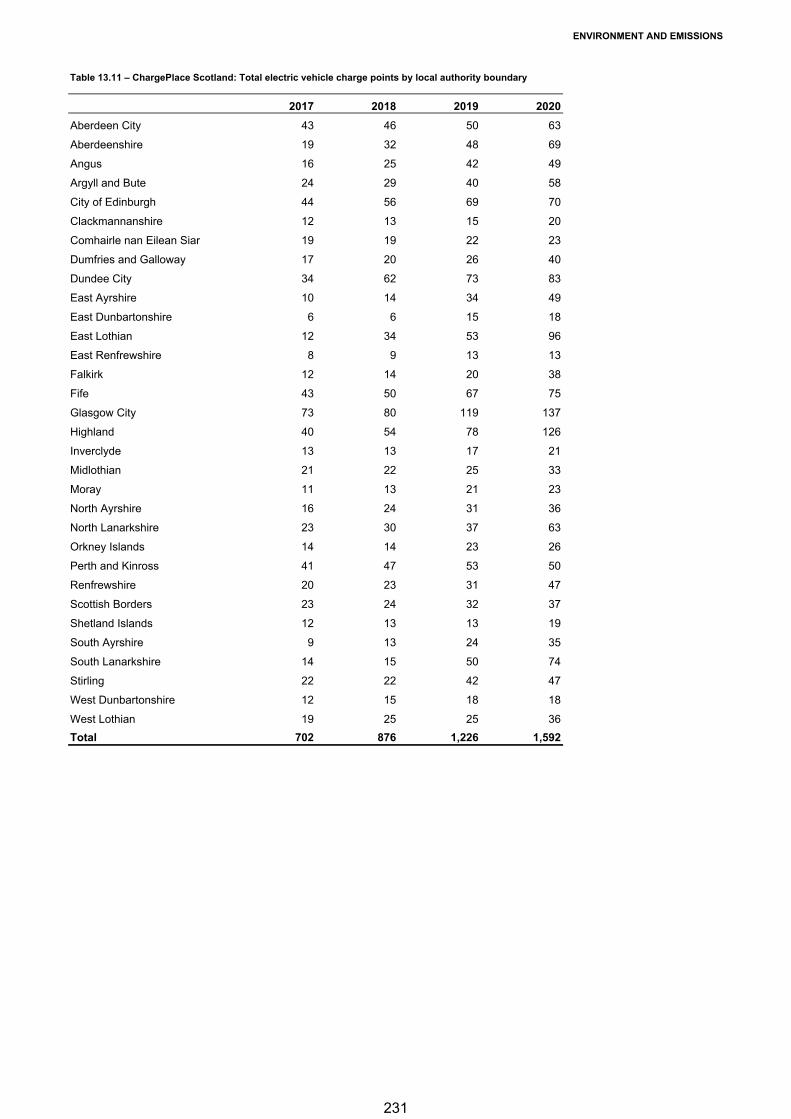
ENVIRONMENT AND EMISSIONS
Table 13.11 – ChargePlace Scotland: Total electric vehicle charge points by local authority boundary
2017 2018 2019 2020
Aberdeen City 43 46 50 63
Aberdeenshire 19 32 48 69
Angus 16 25 42 49
Argyll and Bute 24 29 40 58
City of Edinburgh 44 56 69 70
Clackmannanshire 12 13 15 20
Comhairle nan Eilean Siar 19 19 22 23
Dumfries and Galloway 17 20 26 40
Dundee City 34 62 73 83
East Ayrshire 10 14 34 49
East Dunbartonshire 6 6 15 18
East Lothian 12 34 53 96
East Renfrewshire 8 9 13 13
Falkirk 12 14 20 38
Fife 43 50 67 75
Glasgow City 73 80 119 137
Highland 40 54 78 126
Inverclyde 13 13 17 21
Midlothian 21 22 25 33
Moray 11 13 21 23
North Ayrshire 16 24 31 36
North Lanarkshire 23 30 37 63
Orkney Islands 14 14 23 26
Perth and Kinross 41 47 53 50
Renfrewshire 20 23 31 47
Scottish Borders 23 24 32 37
Shetland Islands 12 13 13 19
South Ayrshire 9 13 24 35
South Lanarkshire 14 15 50 74
Stirling 22 22 42 47
West Dunbartonshire 12 15 18 18
West Lothian 19 25 25 36
Total 702 876 1,226 1,592
231
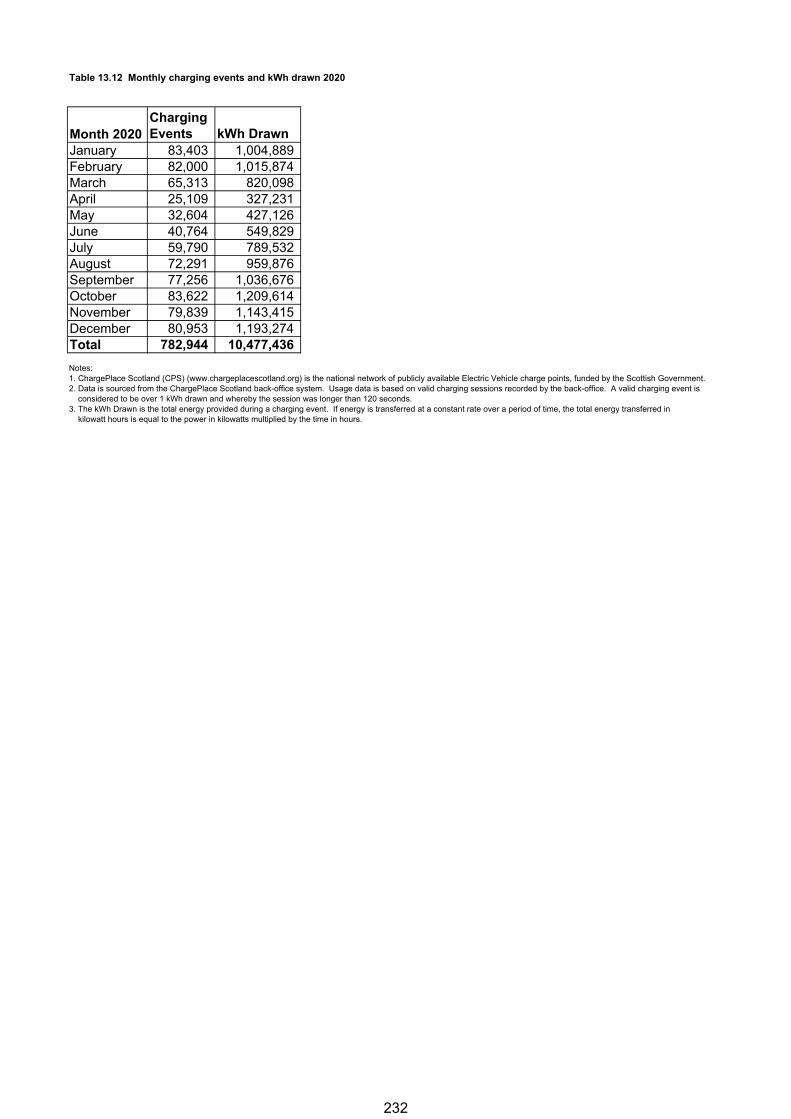
Table 13.12 Monthly charging events and kWh drawn 2020
Month 2020Charging Events kWh Drawn
January 83,403 1,004,889 February 82,000 1,015,874 March 65,313 820,098 April 25,109 327,231 May 32,604 427,126 June 40,764 549,829 July 59,790 789,532 August 72,291 959,876 September 77,256 1,036,676 October 83,622 1,209,614 November 79,839 1,143,415 December 80,953 1,193,274 Total 782,944 10,477,436
Notes:1. ChargePlace Scotland (CPS) (www.chargeplacescotland.org) is the national network of publicly available Electric Vehicle charge points, funded by the Scottish Government.2. Data is sourced from the ChargePlace Scotland back-office system. Usage data is based on valid charging sessions recorded by the back-office. A valid charging event is considered to be over 1 kWh drawn and whereby the session was longer than 120 seconds.3. The kWh Drawn is the total energy provided during a charging event. If energy is transferred at a constant rate over a period of time, the total energy transferred in kilowatt hours is equal to the power in kilowatts multiplied by the time in hours.
232

Notes and Definitions
233
NOTES & DEFINITIONS - SUMMARY
Summary Chapter
S. Notes, Sources and Further Information – historical
S.1 Occasionally, figures given for Great Britain (or the UK) are on a different basis from the figures for Scotland. Such differences in the basis of the figures for Scotland and GB/UK should not prevent their use in a broad comparison of the trends.
S.2 Motor vehicles, the road network, traffic and road casualties
S.2.1 Vehicles Licensed: (Chapter 1). The figures for 1962 to 1974 represented the numbers of licences current at any time during the third quarter. They were derived from an annual census which used the records held by local licensing authorities. The method underlying the census then changed as vehicle records were gradually transferred from local taxation offices to the Driver and Vehicle Licensing Centre. Consequently, the figures for 1974 to 1978 are not comparable. No census results were available for 1977. Censuses based entirely on the record of licensed vehicles at the Driver and Vehicle Licensing Agency (DVLA) began on 31 December 1978 and subsequent counts were taken on the last day of each year up to and including 31 December 1992.
Thereafter, the source of this information changed to the Vehicle Information Database (VID) held by what is now the Department for Transport (DfT). The results conform to the same definitions as earlier vehicle censuses, but, for technical reasons, are considered slightly more reliable than earlier estimates. Some vehicles have complicated licensing histories that may include incidents such as cheques failing to clear, changes of taxation status, late payments, and one or more valid or invalid refund claims. The VID undertakes a more detailed examination of licensing history than earlier vehicle census analyses and is therefore able to provide better estimates of licensed stock. The net effect of the change to the VID as the main source of statistics on currently licensed stock was to produce a small reduction in the estimated levels of licensed stock. The difference between the two sources can be broadly estimated from statistics for 1992 which are available from both the old and new sources.
The VID figures for all vehicles licensed at the end of 1992 are 2.4 per cent lower for Scotland, and 3.1 per cent lower for England and Wales, than the DVLA figures for the same date. For example, the VID figure for Scotland for 31 December 1992 is 1,840,000 compared with the DVLA figure of 1,884,000. To estimate the growth in the number of licensed vehicles over the longer term, these changes should be used to adjust the apparent vehicle growths calculated from figures which are on different bases pre- and post-1992.
234
NOTES & DEFINITIONS - SUMMARY
S.2.2 Car Traffic on major roads: The notes for Chapter 5 describe the methods used to estimate the volume of car traffic on major roads in Scotland for 1983 and subsequent years. As those methods cannot be used to estimate car traffic in Scotland for earlier years, the then Scottish Executive had to make ad-hoc estimates for the years from 1975 to 1982. These ad-hoc estimates were calculated using the rate of change in the volume of traffic for Great Britain as a whole, adjusted to take account of changes in the number of vehicles licensed in Scotland relative to the number for Great Britain as a whole. The estimates for 1975 to 1982 therefore indicate the likely level of car traffic on major roads in Scotland in those years, and may well be considerably less accurate than the estimates for later years.
S.3 Public transport (bus, rail, air and ferry)
S.3.1 Bus Passengers: The notes for Chapter 2 describe the method used to collect these statistics with effect from the 1985-86 financial year. A different method was used for 1984 and earlier years: the figures for 1975 to 1984 relate to calendar years and, prior to 1986, the term stage services was used (rather than local services). The figures for 1960 to 1974 are on a different basis: they were produced by adding together the total numbers of passenger journeys reported by the Scottish Bus Group (for calendar years) and the four city corporations (for financial years). They therefore include any non-local services run by these operators, and exclude any local (or stage) services that were run by other operators. In addition, it appears that the figures reported by the Glasgow city corporation may have included passenger journeys on trolley buses and on the Glasgow Underground. The method used to collect the data has been changed and data prior to 2004 are not comparable.
S.3.2 Rail Passengers: See the notes for Chapter 7. The statistics relate to financial years with effect from 1985-86. The figure for 1984 is derived from a total for the fifteen-month period 1 January 1984 to 31 March 1985, by scaling this down to an estimate for a twelve-month period. The figures for 1983 and earlier years are for calendar years. The figures for 1990-91 and earlier years were provided by British Rail after the end of each year; those for 1991-92 to 1999-2000 were provided by the Association of Train Operating Companies in Spring 2001. See also paragraph 7.5 for details of changes to Scotrail methodology.
S.4 Freight
S.4.1 Road Freight: The notes for chapter 3 describe these statistics and freight more generally as well as making comparisons between modes. There is a small discontinuity for road freight between the figures for 1986 and 1987: the former excludes freight whose destination is Northern Ireland, and the latter includes such freight. As Table 3.1 shows, the amount involved is a very small percentage of the total.
235
NOTES & DEFINITIONS - SUMMARY
S.4.2 Rail Freight: See the notes for Chapter 7. The statistics relate to financial years with effect from 1985-86. The figure for 1984 is derived from a total for the fifteen-month period from 1 January 1984 to 31 March 1985, by scaling this down to an estimate for a twelve-month period. The figures for 1983 and earlier years are for calendar years.
S.4.3 Coastal shipping: The figures for Scotland cover freight on coastwise voyages for which either the origin or the destination (or both) is in Scotland - i.e. all coastwise freight lifted in Scotland plus the coastwise freight lifted elsewhere in the UK which is discharged in Scotland. This definition of coastal shipping excludes foreign, one port and inland waterway freight shipping. For historical reasons, the definition used for the coastal shipping series differs from the definitions which are used for the water transport statistics in the notes for chapter 9. There is a small discontinuity between 1981 and 1982, due to a change in definitions. The figures were provided by the Department for Transport – Margaret Talbot (Tel: 0207 944 4131).
S.4.4 Coastwise Shipping: See the notes for Chapter 9. These figures are lower than the figures for coastal shipping, because the latter includes freight lifted elsewhere in the UK which is discharged in Scotland.
S.4.5 Pipelines: Figures from 1993 onwards estimate the total carried by on-shore pipelines which are at least 50 km in length and which carry crude oil or products. Figures for Scotland relate to pipelines originating in Scotland. Estimates are produced by the Department of Energy and Climate Change, based on pipeline operators information. The estimates were supplied by DTI and Charanjit Ransi (Tel: 0207 215 2718) can provide further information about them.
236
NOTES & DEFINITIONS - ROAD TRANSPORT VEHICLES
Chapter 1 – Road Transport Vehicles
1. Notes and Definitions
1.1 Motor Vehicles: There are three types of classification of motor vehicles:
Taxation Group: based on the level of tax placed on a motor vehicle according to its vehicle type (e.g. Private & light goods, Public transport, Goods etc);
Body Type: based on the look of a vehicle (e.g. cars).
1.2 Private and Light Goods Vehicles: the bulk of this group consists of private cars (whether owned by individuals or companies) and vans and light goods vehicles (goods vehicles which do not exceed 3,500 kgs gross weight). The group also contains a number of other types of vehicle including private buses and coaches.
1.3 Motorcycles: no distinction is made between motorcycles, scooters and mopeds for taxation purposes, and therefore motorcycles includes all two wheeled vehicles.
1.4 Public Transport: all vehicles classified for taxation in class 34 - Bus (introduced 1 July 1995). These are vehicles used for public conveyance, with more than 8 seats. Prior to 1 July 1995 public transport vehicles were taxed in class 35 Hackney, used similarly for public transportation but with no lower limit on seating capacity. Buses and coaches not licensed for public conveyance, and operated and used privately, are excluded and are classified for excise licensing with private and light goods. Taxis and private hire cars are now included in the private and light goods group.
1.5 Goods Vehicles: the totals for this group (goods vehicles which exceed 3,500 kgs gross weight) for the earlier years include the now-discontinued formerly separate Farmers Goods, General Goods and some vehicles which before 1 July 1995 were taxed in a specialised taxation class but which now fall into the Goods Vehicle class groups, which were shown separately in some of the previous editions of Scottish Transport Statistics. Goods vehicles that are used un-laden, privately or for driver training purposes are licensed in the Private HGV taxation class.
1.6 Crown and Exempt Vehicles: the ‘exempt’ vehicles include a number of distinct sub-groups and classes, of which the most important are: ‘Emergency vehicles’, ‘Disabled driver and disabled passenger carrying vehicles’, ‘All vehicles, except buses and goods vehicles used commercially if they were constructed before 1 January 1973’, and ‘Personal export and direct export vehicles’, and vehicles formerly in the 'Special Concessions' class i.e. agricultural tractors, combine harvesters, and mowing machines, electric vehicles, gritting vehicles and snow ploughs, and steam powered vehicles.
237
NOTES & DEFINITIONS - ROAD TRANSPORT VEHICLES
1.7 Special Vehicles: this group consists of vehicles over 3,500 kgs which do not pay Vehicle Excise Duty as heavy goods vehicles nor qualify for taxation in the special concessionary group. Vehicles in this group include road rollers, work trucks, digging machines and mobile cranes.
1.8 Average ages of vehicles: with effect from the estimates for 2008, the Department for Transport [DfT]) improved its method of estimating the age of the vehicle fleet. The estimated ages are slightly higher than previously, although the pattern from year to year is unchanged.
1.9 Goods vehicles licensed by operator size: To operate a goods vehicle (over 3,500 kgs gross weight) in GB (England, Scotland and Wales) in connection with a trade or business or for hire or reward you need to hold a goods vehicle operator's licence. The aims of operator licensing are basically road safety and fair competition. All operators undertake to keep their vehicles in a fit and serviceable condition and to ensure their drivers meet the statutory requirements regarding drivers' hours and records legislation. Operator licensing is the responsibility of the Traffic Commissioners. Each is responsible for a Traffic Area, of which there are 8 in GB. Where an operator has an operating centre(s) (i.e. the place(s) where vehicles are normally kept) in a Traffic Area, a licence must be held in that Traffic Area. Some of the larger operators will have more than one licence. Some operators have licences with no vehicles specified, relying solely on short term hire instead.
1.10 Driving tests: The theory test was introduced on 1 July 1996, therefore full year figures are available from 1997. A person who has passed the theory test must sit the practical test within two years. If the person fails the practical during this period then he/she can re-sit the practical without having to take the theory test again.
1.11 Households with cars available for private use: In the Scottish Household Survey (SHS), the term car is used only for cars: vans are not included in the analysis. The interviewer asks whether any cars are normally available for private use by members of the household. Cars normally kept or owned by someone outside the household are excluded, but company cars available for private use are included.
1.12 Household types: the following categories are used in the analysis of the SHS results:
A single pensioner household consists of just one adult of pensionable age (60+ for women, and 65+ for men) and no children
A single parent household contains an adult of any age and one or more children.
A single adult household consists of an adult of non-pensionable age and no children.
An older smaller household contains either (a) an adult of non-pensionable age and an adult of pensionable age and no children or (b) two adults of pensionable age and no children.
A large adult household has three or more adults and no children. A small adult household contains two adults of non-pensionable age and no
children.
238
NOTES & DEFINITIONS - ROAD TRANSPORT VEHICLES
A large family household consists of either (a) two adults and three or more children or (b) three or more adults and one or more children.
Small family households consist of two adults and one or two children.
1.13 Annual net household income and SHS urban / rural classification: notes on these classifications appear in the notes to Chapter 12.
1.14 Motor Vehicle Offences: those offences classified as motor vehicle offences in the classification of crimes and offences used for police recorded crime statistics. Certain crimes related to motor vehicles, namely causing death by dangerous driving, causing death by careless driving while under the influence of drink or drugs and reckless driving at common law, are excluded primarily because information on these crimes is not collected on the same basis as other motor vehicle offences. In 2019-20, the police recorded 37 crimes of causing death by dangerous driving, 15 crimes of causing death by careless driving, 2 crimes of an illegal driver being involved in a fatal accident and 1 crime of causing death by careless driving when under the influence of drink or drugs. There were no crimes of reckless driving at common law recorded in 2019-20. In 2018-19, there were 9 convictions where the main offence was causing death by dangerous driving, all of which resulted in a custodial sentence. There were 21 convictions where the main offence was causing death by careless driving, of which 14 resulted in a community sentence, 6 resulted in fines and 1 resulted in a custodial sentence. There was also 1 conviction for causing death by careless driving while under the influence of drink or drugs, which resulted in a custodial sentence. There were no proceedings in 2018-19 with reckless driving at common law as the main offence.
However, the statistics dealing with recorded crime and court proceedings are not directly comparable as a person may be proceeded against for more than one crime involving more than one victim and there is the possibility that the crime recorded by the police may be altered in the course of judicial proceedings. Also a crime may be recorded by the police in one year and court proceedings concluded in a subsequent year.
Sources
1.15 Numbers of vehicles
The source of this information is the Vehicle Information Database (VID) held by the Department for Transport (DfT). The results conform to the same definitions as earlier vehicle censuses, but, for technical reasons, are considered slightly more reliable than earlier estimates. Some vehicles have complicated licensing histories, that may include incidents such as cheques failing to clear, changes of taxation status, late payments, and one or more valid or invalid refund claims. The VID undertakes a more detailed examination of licensing history than earlier vehicle census analyses and is therefore able to provide better estimates of licensed stock. The figures include all vehicles which pay tax and certain vehicles which are exempt. The exempt vehicles are described in section 1.6. The figures exclude vehicles registered by the armed forces, or as personal or direct export and trade licences issued to manufacturers, repairers of and dealers in motor vehicles. In 2010 DfT revised stock figures from 2006 to 2009 - see
239
NOTES & DEFINITIONS - ROAD TRANSPORT VEHICLES
https://assets.publishing.service.gov.uk/government/uploads/system/uploads/attachment_data/file/763837/vehicle-licensing-statistics-notes-definitions.pdf
1.16 Number of Vehicles: Taxation class changes in the period covered by the tables
1.16.1 In 1995 there were major reforms of the vehicle taxation system. The bulk of the changes came into operation on 1 July 1995, but some additional changes were introduced on 29 November 1995. The intention was to remove many of the complications in the existing taxation structure, using a strategy to link Vehicle Excise Duty (VED) rates for many directly to the rate for the private and light goods group (PLG), or the basic minimum rate for heavy goods vehicles (HGVs). One measure to help achieve this was the creation of three umbrella taxation groups:
An emergency vehicles group - exempt from VED A special concessionary group, including agricultural machines, snow ploughs,
gritting vehicles, electric vehicles and, later, steam powered vehicles, paying VED at one quarter of the annual PLG rate
A special vehicles group, limited to vehicles over 3500 kgs, including mobile cranes, works trucks, digging machines, showmen’s vehicles, etc, paying VED at a rate equivalent to the basic minimum rate for HGVs
From 1 April 2001, vehicles licensed in the special concessionary group were exempted from the payment of VED.
1.16.2 In addition, the goods vehicle taxation system was itself considerably simplified by the abolition of separate goods vehicle classes for farmers and showmen. All remaining goods vehicle taxation classes were also abolished and vehicles in those groups transferred to an appropriate tax class. At the same time, the basis for calculation of excise duty for goods vehicles was amended to revenue weight. Revenue weight means either confirmed maximum gross weight as determined by plating and testing regulations, or design weight for vehicles not subject to plating and testing (formerly known as Restricted HGVs).
1.16.3 The process also included further simplifications and tidying arrangements. These included cases in which vehicles not over 3,500 kgs gross weight were removed into the private and light goods taxation class rather than remaining in specialised taxation classes and groups, and the re-allocation of some tax classes into more appropriate groups. One key change of a similar type was to abolish the separate taxation of public transport vehicles with eight seats or fewer, and tax all such vehicles in the PLG class. From start of July 1995 bigger public transport vehicles were taxed in a new bus taxation class. The changes were completed by the introduction in the November 1995 budget of a new exempt class for vehicles over 25 years of age previously in the private and light goods or motorcycle groups. In 1998 the exemption for vehicles over 25 years of age was replaced with one applying to all vehicles, except buses and goods vehicles used commercially if they were constructed before 1 January 1973.
240
NOTES & DEFINITIONS - ROAD TRANSPORT VEHICLES
1.16.4 In general, the process of implementing these changes was gradual, and vehicles were allowed to remain in their current class until a new tax disk was required, whereupon they were transferred into other groups and classes as appropriate. Since tax disks may run for up to a year, some vehicles remained legitimately taxed in abolished groups at the end of 1995. That process was effectively complete by the end of 1996, but users of taxation and stock statistics for 1995 and later years should take special care to ensure they are aware of the changes and the methods by which vehicles were re-allocated to other groups.
1.17 Heavy Goods Vehicles: there is a large increase in the over 38 tonnes category, and a large decrease in the 32.1 to 38 tonnes category, between 1998 and 1999, and continuing in later years. This is due primarily to legislation which came into effect in 2001 allowing 6-axled lorries to run at up to 44 tonnes. This has led to many lorries 'up-plating' i.e. the lorries do not necessarily physically change, but are simply taxed differently so that they may carry greater loads.
1.18 A further reform to the tax class structure for vehicles weighing up to 3,500kg was announced in 1998. In 1999 a two banded system based on engine size was introduced for the PLG class. In March 2001 four new tax classes were introduced. The Petrol Car, Diesel Car and Alternative Fuel Car taxation classes were introduced for passenger vehicles weighing up to 3,500kg registered on or after 1 March 2001. The Light Goods Vehicles tax class was introduced for goods vehicles weighing up to 3,500kg registered on or after 1 March 2001.
1.19 Numbers of vehicles: Analysis by local government areas
1.19.1 Until 1995 the DVLA used the postcode of the registered keeper (of the vehicle) to allocate vehicles to local government regions. With the 1996 re-organisation of local authorities in Scotland, local government area analyses required major revisions. This was achieved by use of the most recently available postcode directory, which, when used in conjunction with the Vehicle Information Database, allowed vehicle stocks to be estimated for the new local authorities.
1.20 Numbers of new registrations of vehicles
1.20.1 The numbers of new registrations of vehicles of various taxation class types have been obtained by DfT from DVLA. In recent years, changes to taxation classes and local government reorganisation have affected the DVLA computer system used to produce these figures, and it can longer provide the numbers of new registrations for each taxation class for Scotland. Scottish figures appearing here are estimated by DfT, using post town area data, and are subject to a small margin of error.
1.21 Taxis licensed
1.21.1 These figures are based on an annual survey conducted by the Scottish Government and represent the taxi fleet size/driver numbers at the time of replying to the survey.
241
NOTES & DEFINITIONS - ROAD TRANSPORT VEHICLES
1.22 Goods vehicles operators by licence type and number of vehicles specified on the licence
1.22.1 These figures were produced from information taken from the Traffic Commissioners administrative records.
1.23 Most popular car sold
1.23.1 These figures are supplied by Society of Motor Manufacturers and Traders (SMMT). They are based on postcode location derived from form V55 which is completed by the car dealer. The figures do not include sales from non SMMT dealers, such as overseas dealers.
1.24 MOT tests
1.24.1 These figures are supplied by VOSA (Vehicle Operator Services Agency) and are based on test results data entered electronically at each privately operated Vehicle Testing Station in Scotland.
1.25 Driving test receipts
1.25.1 Figures for both driving licence theory and practical tests are obtained from the Driving Standards Agency (DSA).
1.26 Scottish Household Survey
1.26.1 Information about the Scottish Household Survey is given in the notes to chapter 12.
1.27 Numbers of Blue Badges
1.27.1 The Scottish Government requested details from Local Authorities on the number of badges awarded under the EU Blue Badge scheme. Blue badges are valid for up to 3 years from the date of issue. Totals (shown in Table 1.21) will include all valid badges on issue in the specified year.
1.27.2 The Blue Badge Improvement Service (BBIS), a central database for all blue badges on issue, was introduced on 1 January 2012. Data accuracy for the total number of blue badges on issue has improved as all blue badges are recorded on BBIS.
242
NOTES & DEFINITIONS - ROAD TRANSPORT VEHICLES
1.28 Motor Vehicle Offences
1.28.1 The statistical return from which the figures on recorded motor vehicle offences in this publication are taken is a simple count of the numbers of crimes and offences, for each local authority, which the police have recorded and cleared up. Returns of quarterly data are submitted by Police Scotland and are used to produce a national total. Data from other police forces, such as the British Transport Police, are not included. Each quarterly submission of data to the Scottish Government contains revisions (such as the re-designation of incidents found on investigation not to be criminal) back to quarter 1 of the same financial year. However, amendments which arise after the end of the year are not incorporated.
1.28.2 Most motor vehicle offences are discovered and recorded as a result of police activity rather than by being reported to the police by the public. Hence the numbers of such offences recorded are mainly determined by the level of enforcement or police deployment.
1.28.3 The figures included in the Motor vehicle offences group do not include stationary motor vehicle offences dealt with by the issue of a fixed penalty ticket. However, offences dealt with under the vehicle defect rectification scheme and offences for which the procurator fiscal offers a fixed penalty are included in the figures. In addition to this, moving traffic offences which are the subject of a police conditional offer of a fixed penalty are also included, e.g. speeding, traffic directions offences.
1.28.4 Certain motor vehicle offences are not always recorded in cases where police forces are unable to clear-up the offence (e.g. speeding offences where the driver is untraceable). Clear-up rates for motor vehicle offences in these circumstances are artificial. Thus, clear-up rates for the Motor vehicle offences group are not included.
1.28.5 The number of Vehicle Excise Licence Offences recorded decreased from 3,792 in 2017-18 to 176 in 2018-19. This was largely due to standardisation of practice across Police Scotland divisions in November 2017, whereby the Driver and Vehicle Licensing Agency (rather than the police) took primacy in dealing with these offences. There was a small increase in this crime from 2018-19 to 2019-20 (17 crimes).
1.29 Further Information
1.29.1 Further information on motor vehicle licensing statistics can be found in the DfT publications Transport Statistics Great Britain, & Vehicle Licensing Statistics.
1.29.2 Further information on motor vehicle offences recorded by the Police is available in the Scottish Government’s ‘Criminal Proceedings in Scottish Courts’.
1.29.3 Enquiries regarding the statistics should be directed as follows:
243
NOTES & DEFINITIONS - ROAD TRANSPORT VEHICLES
Motor vehicle licensing (Tables 1.1 to 1.3 and 1.5 to 1. 9)
Paul Syron, Department for Transport, Tel: 020 7944 3077
Taxi and Private hire cars licensed by Local Authority area (Table 1.4)
Peter Reid, Transport Scotland Tel: 0131 244 4533
Goods vehicle operators by licence type & number of vehicles specified on the licence (Table 1.10)
David Dumbleton, Vehicle and Operator Services Agency, Tel: 0113 254 3280
Cars sold in Scotland by make and mode (Table 1.11)
Paul Kingston, Society of Motor Manufacturers & Traders, Tel:0207 235 7000
Road vehicle testing scheme (MOT) (Table 1.12)
Stephen Hacker, VOSA, Tel: 0117 954 3382
Driving licence tests and DVLA receipts (Tables 1.13 & 1.14)
Applications, tests concluded & passes: (theory) Linda Massey (Tel 0115 936 6254) or (practical - https://www.gov.uk/government/collections/driving-tests-and-instructors-statistics#data-tables) Malcolm Sims (Tel 0115 936 6465), DSA
Receipts from vehicle licences –Carl James, DVLA, Tel: 01792 783 201
Receipts from driving licences - Ms Lynne Harris, DVLA, Tel: 01792 788 088
SHS figures for Driving licence holders and Households with a car available for private use. (Tables 1.16, 1.17, 1.19 & 1.20)
Andrew Knight, Transport Statistics, Transport Scotland, Tel: 0131 244 7256
Blue Badge Statistics (Table 1.21)
Daniel Bulawa, Transport Scotland (Tel: 0131 244 0923)
Motor vehicle offences (Table 1.22)
Adele Walls, Scottish Government Justice Statistics Unit (Tel: 0131 244 2228).
1.34 Other data sources
Within Scottish Transport Statistics:
Summary – Includes comparisons with GB
Chapter 2 – Bus and coach travel,
Chapter 5 – Road Traffic (including congestion)
244
NOTES & DEFINITIONS - ROAD TRANSPORT VEHICLES
Chapter 11 – Personal and Cross modal travel
Chapter 13 – Environment and Emissions
Other Transport Scotland Publications:
Transport and Travel in Scotland – includes more detailed analysis of SHS data, in particular:
Table 20 – Frequency of driving
SHS Local Authority Results – provides breakdowns of SHS data by Local Authority, Regional Transport Partnership and Urban Rural Classification. In particular:
Table 4 – Car access by Local Authority
Table 5 – Frequency of driving by Local Authority
Department for Transport produce a number of related publications, including:
Traffic estimates
Vehicle registrations
Bus and Coach statistics
Eurostat collate figures for EU states including figures for vehicle registrations. More details can be found in the notes for Chapter 12.
245
NOTES & DEFINITIONS – BUS AND COACH
Chapter 2 - Bus and Coach Travel
2. Notes and Definitions
2.1 Local bus service: one which is available to the general public, where passengers pay separate fares and travel a radial distance no greater than 15 miles (24 kms) from the point of boarding.
2.2 Other services: include contract, private hire, express journeys, excursions and tours which are not registered as local services.
2.3 Passenger journeys (boardings): the statistics are compiled on the basis that each boarding of a vehicle counts as one passenger journey. Therefore, each trip made by a passenger on one vehicle on one route counts as a separate journey. Return tickets therefore count as two passenger journeys. The numbers of passenger journeys using season tickets or travel passes are largely based on button presses by the driver or scaling factors applied to ticket machine data by the operator. Figures from 2004-05 include any adjustments applied by operators to allow for driver under-counting, but where this is not done no adjustment is made by DfT.
2.4 Vehicle kilometres: estimates are for ‘live’ (in service) mileage and exclude empty running of buses (e.g. between garage and terminus), driver instruction and vehicle testing.
2.5 Local bus fare indices: Information about the size of each fares change is supplied by a representative sample of around 100 operators. Indices are obtained by averaging the reported changes using weights based on receipts from passengers (excluding concessionary fare reimbursement from local authorities). In theory, therefore, the index measures the change in the average charge to the fare-paying passenger. The implementation of free concessionary fares is, though, included once, in the quarter within which it was introduced.
2.6 Commercial services: are those run without direct financial support from a local transport authority. They are still eligible for central Government subsidy in the form of the Bus Service Operators Grant (BSOG) (formerly known as the fuel duty rebate) and (where applicable) for concessionary fare reimbursement.
2.7 Subsidised services: are those considered socially necessary and run under contract to local transport authorities with some direct subsidy. They include a few services subsidised without competitive tendering, under Section 91 of the Transport Act 1985 (‘de minimis’ arrangements) in England and Wales or in accordance with the duty of best value in Scotland.
246
NOTES & DEFINITIONS – BUS AND COACH
2.8 Concessionary fare reimbursement: A National Concessionary Travel schemes for groups such as elderly people and disabled people was rolled out in early 2006. Prior to that local authorities ran their own schemes. Bus operators are reimbursed for revenue lost as a result of their participation in the schemes, after taking into account a portion of the income from the extra travel generated, i.e. it is supposed to be profit-neutral. Journeys made under these schemes can be found in Table 11.29. These schemes should not be confused with the reductions offered to children, for example, by many operators on commercial grounds.
2.9 Staff employed: Platform staff comprise drivers, conductors and any other on-vehicle staff; maintenance staff include all employees engaged on cleaning, repair, service or maintenance of vehicles, while other staff include administrative staff. There may be some duplication of functions, particularly amongst the smaller operators.
2.10 Walking time to nearest bus stop: the Scottish Household Survey (SHS) interviewer asks how long it would take him/her to walk to the nearest bus stop (or place where one could get a bus).
2.11 Frequency of bus service: the SHS interviewer asks about the frequency of service at the nearest bus stop (or place one could get on a bus). If the householder says that the frequency of service varies, the interviewer asks for the week-day off-peak frequency.
2.12 SHS urban/rural classification: notes on this are provided in the notes to Chapter 12.
Sources
2.13 The DfT survey of Public Service Vehicle Operators
2.13.1 The basis for most of the statistics in this chapter is the annual returns which a sample of Public Service Vehicle operators makes to the Department for Transport (DfT).
2.13.2 The sample includes all operators who are licensed with 21 or more licence discs (which normally, but not always, equate to the number of vehicles), plus a random sample of smaller operators. Until 2010-11, the sample included both local and other operators, but from 2011-12 only local operators have been surveyed. Local operators are identified from the list of operators who receive BSOG and other sources. Sampling is stratified and based upon the size of the operator’s fleet (in terms of the number of licence discs), though some operators are selected with
247
NOTES & DEFINITIONS – BUS AND COACH
certainty where this is necessary to ensure sufficient coverage in each geographical area.
2.13.3 Proxy data are generated for all local operators, and imputation is used for data which are missing either because the operator was not sampled or did not respond. Imputation is based either on previous returns from the operator or using other methods such as using other data the operator has supplied.
2.13.4 The figures for Scotland are primarily based on returns for operators with an address in Scotland, even though some operators may do work in England and vice versa. However, important information relating to local operators (mainly passenger boardings, vehicle kilometres and passenger receipts) is obtained at local authority level and so these estimates will exclude data relating to England, even though other variables such as staff numbers are all allocated to just one of an operator’s local authorities – the one with the highest number of passenger boardings. (NB: a large group, such as Stagecoach, is not treated as a single operator: there will be a separate statistical return for each of its subsidiary companies.)
2.13.5 In September 2006, DfT revised the passenger numbers for each year from 1985/86 onwards in order to adjust for driver under-recording of the numbers of passengers who did not pay cash (e.g. those using season tickets, concessionary fare passes, return halves of tickets etc). A further survey showed that the allowance was not affected by the introduction of free concessionary fares.
2.13.6 In October 2012, the DfT revised passenger numbers, vehicle kms and passenger revenue relating to 2004-05 onwards. Although previous figures are presented these are not strictly comparable with the later years. The methodology used by DfT means that figures back to 2004-05 are subject to minor revisions each year (for example as new data is used to improve imputation of previous year’s figures) though the broad trends shown are rarely affected.
2.14 Scottish Government and Transport Scotland finance data
2.14.1 This data is taken from Local Authority Finance returns and Transport Scotland finance records relating to grant payments and the administration of the National Concessionary Travel scheme.
2.14.2 In Summer 2011, Transport Scotland reviewed the Government Support for bus figures published in Bus and Coach Statistics 2011. This led to a revision of the figures to exclude support for non bus transport. Figures have been revised back to 2006-07 when the National Concessionary Travel Scheme was introduced.
248
NOTES & DEFINITIONS – BUS AND COACH
2.15 Transport Scotland National Concessionary Travel scheme data
2.15.1 Transport Scotland is responsible for reimbursing bus operators for carrying passengers under the National Concessionary Travel scheme. The application process for an NCT pass is managed by a third party contractor but summary numbers are provided to Transport Scotland which have been used to populated the card holder numbers used in this chapter.
2.16 Scottish Household Survey
2.16.1 The Scottish Household Survey is a large household level survey run in Scotland. Data is collected on a range of topics including transport and travel. The survey also includes a Travel Diary component. This data is used to analyse travel patterns and choices. More details can be found in the notes to Chapter 11 of this publication (personal and cross modal travel).
2.17 Further Information
2.17.1 DfT’s Annual Bus Statistics include some more detailed analyses of GB bus statistics. http://www.dft.gov.uk/statistics/series/buses/
2.17.2 Enquiries regarding the statistics in Tables 2.1 to 2.8 should be made to Matthew Tranter, Department for Transport, Tel: 0207 944 3076 [email protected]
2.17.3 Enquiries relating to the Government Support table (2.9) and concessionary travel pass number (2.13 and 2.14) should be made to Andrew Knight of the Transport Scotland Statistics branch (tel: 0131 244 7256).
2.17.4 Further information on the Scottish Household Survey figures can be found in Chapter 11. Enquires on the SHS- based Tables 2.10 and 2.12 should be made to Andrew Knight of the Transport Scotland Statistics branch (tel: 0131 244 7256).
2.18 Other data sources
Within Scottish Transport Statistics:
Chapter 1 - Road vehicles,
Chapter 5 – Road Traffic (including congestion)
Chapter 6 - Road casualties
Chapter 11 - Personal Travel chapter (including travel to work)
249
NOTES & DEFINITIONS – BUS AND COACH
Other Transport Scotland Publications:
Transport and Travel in Scotland – includes more detailed analysis of SHS data, in particular:
Table 4 – satisfaction with public transport
Table 5 – concessionary pass possession
Table 21 – Park and ride
Table 28 – Frequency of bus and train use
Tables 29 and 30 – Views on local buses and trains
Tables 31 and 32 – Concessionary pass use
Scottish Household Survey Travel Diary – includes detailed tables using the Travel Diary dataset, in particular:
Table 2 – journeys by mode of transport
Table 2a – journey distance by mode of transport
Table 2b – stages by mode of transport
Table 4a – mode of transport by journey distance
Table 5a – distance summary statistics by mode of transport
SHS Local Authority Results – provides breakdowns of SHS data by Local Authority, Regional Transport Partnership and Urban Rural Classification. In particular:
Table 1 - Travel to work by mode of transport
Table 2 - Travel to school by mode of transport
Table 11 - Frequency of bus and train use
Table 12 – Convenience of public transport
Table 13 – Satisfaction with public transport
Table 14a – Views on bus services
Table 15 – Concessionary pass use
Table 16 – journeys by mode of transport
Department for Transport produce a number of related publications, including:
Traffic estimates
Vehicle registrations
Bus and Coach statistics
Non Official Statistics sources
Office of the Traffic Commissioner – Traffic Commissioners’ Annual report.
Confederation of Passenger Transport – Cost Index
250
NOTES & DEFINITIONS – ROAD FREIGHT
Chapter 3 - Road Freight
3. Notes and Definitions
3.1 Origin and destination: these refer to the origins and destinations of the trips that were recorded in the surveys. These are not necessarily the ultimate origins and destinations of the goods (a trip on a surveyed vehicle may represent only one stage in the journey of a consignment: goods may have been trans-shipped on a number of occasions). Individual origins and destinations are standardised by the Department for Transport to NUTS3 regions (an EU wide geography based on existing local administrative boundaries), with all published outputs based on these regions.
3.2 Entering Scotland and leaving Scotland: Trips with a destination in Scotland and an origin outwith Scotland are classed as ‘entering Scotland’, whilst trips with an origin in Scotland and a destination outwith Scotland are classed as ‘leaving Scotland’ - where a trip is defined as a vehicle moving from an origin to a destination to either load and/or unload goods.
3.3 Remaining in Scotland: goods for which both the origin and the destination of the trip are within Scotland.
3.4 Length of haul: tonne kilometres moved divided by tonnes lifted. This information relates to individual vehicle trips, and not to the total distance that the goods may have travelled.
3.5 Goods lifted: the total weight of goods carried, measured in tonnes.
3.6 Goods moved: the weight of the goods carried multiplied by the distance hauled, measured in tonne kilometres.
3.7 Groupage: when, for mixed consignments, no single commodity makes up 75% or more of the consignment weight.
3.8 Road Freight Intensity Index (table 3.3): this indicates how the volume of road freight (measured in tonne-kilometres) has been changing relative to the Scottish economy as a whole. The road freight intensity index is an index of the ratio of (i) the index of road freight tonne-kilometres moved by UK HGVs on journeys originating in Scotland to (ii) the index of Scottish Gross Domestic Product (measured in terms of the Gross Value Added for all industries).
251
NOTES & DEFINITIONS – ROAD FREIGHT
Sources
3.9 Statistics of freight lifted and moved by road were provided by the Department for Transport, (DfT) from three sample surveys.
3.10 Domestic road freight activity by GB registered HGVs
3.10.1 Information about domestic road freight activity by GB registered HGVs is obtained from the DfT’s Continuing Survey of Roads Goods Transport Great Britain (CSRGT GB). This collects details of the journeys that were made by a sample of heavy goods vehicles (HGVs: vehicles with a gross vehicle weight (weight of vehicle plus carrying capacity) of 3.5 tonnes or more).
3.10.2 Each week, a stratified sample of HGVs are randomly selected from the Driver and Vehicle Licensing Authority (DVLA) licensing records. The sample is stratified by region and type and weight of vehicle, in order that the sample surveyed is representative of the population of HGVs in GB. A questionnaire is sent to each selected vehicle’s registered keeper, asking for information about the vehicle, and about every trip that it made in a sample week. The sample weeks are spread evenly across the year.
3.10.3 The origins and destinations are reported in the survey as the names of towns, or postcodes (where known). DfT standardises these origins/destinations to NUTS3 regions (an EU wide geography based on existing local administrative boundaries) using a computerised gazetteer, and validates these origins and destinations against other metrics such as the lengths of the routes between these places. These NUTS3 regions are then aggregated to the appropriate Region or Island Area for each Scottish origin and destination. DfT did not record origins and destinations in terms of the new Council areas before 2004. Following the completion of local government reorganisation across Britain, DfT has coded to NUTS3 regions that are used to produce statistics for the European Union. There are 23 of these areas in Scotland.
3.10.4 The results of the survey are grossed-up to produce estimates which represent the total road freight activity during the year, by all GB registered HGVs. This is done quarterly, in two stages. First, the sample vehicles’ results are grossed up to the whole HGV population using the ratio of the average number of HGVs in each stratum (from DVLA licensing records) to the achieved sample for each stratum. The average number of HGVs in each stratum is calculated as the average of the numbers at the start and the end of the quarter). Then the results are multiplied by 13, to raise the activity in the sampled week to an estimate for the whole of the quarter.
3.10.5 As with any sample based statistics there will be a degree of sample error. The annual sample for Scottish vehicles is too small for detailed yearly analysis of
252
NOTES & DEFINITIONS – ROAD FREIGHT
the estimates, and so the table which shows the estimated flows of freight to and from the former Regions of Scotland was produced by combining the results from several years’ surveys.
3.11 International road freight activity by GB registered HGVs
3.11.1 Statistics on international road freight activity are derived from DfT’s International Road Haulage Survey (IRHS) which covers a sample of GB-registered heavy goods vehicles (HGVs with a gross vehicle weight (weight of vehicle plus carrying capacity) of 3.5 tonnes or more). Work by foreign-registered vehicles, and the transport of goods in unaccompanied trailers, is not within the scope of the survey. Other EU countries are responsible for monitoring the international movements of their own vehicles.
3.11.2 The survey covers trips using roll-on/roll-off ferries and the Channel Tunnel to serve origins and destinations located outside of the UK, where the driver accompanies the vehicle throughout the journey. Trailers, when unaccompanied on a ferry crossing, are treated as domestic traffic when hauled to or from a UK port. If the trailer is subsequently picked up by a foreign vehicle, that leg of the journey will be recorded in the statistics of the country in which the vehicle is registered. These statistics therefore exclude traffic which is carried in unaccompanied trailers, or in foreign-registered vehicles.
3.11.3 GB hauliers with an International Operators Licence are asked to provide details of all international trips by its HGVs across a predetermined set of sample periods. Details of each trip are required, in those cases where a vehicle starts two (or more) international trips within the specified period.
3.11.4 The results of the survey – combined with internationals legs from the CSRGT NI survey - are grossed-up to produce estimates which represent the total road international freight activity by UK-registered HGVs during the year as a whole. The results are grossed to the total number of UK HGVs leaving the country collected by the Department for Transport’s Roll-on Roll-off (Ro-Ro) survey, stratified by groups of ports.
3.12 Domestic and international road freight activity by NI registered HGVs
3.12.1 Information about domestic and international road freight activity by HGVs registered in Northern Ireland is obtained from the Continuing Survey of Roads Goods Transport Northern Ireland (CSRGT NI).
3.12.2 Due to the unique situation in relation to Northern Ireland and the Republic of Ireland, there is a higher prevalence for HGVs in Northern Ireland to perform international work (predominantly in the Republic of Ireland). As such the CSRGT is
253
NOTES & DEFINITIONS – ROAD FREIGHT
administered through a separate survey for NI registered vehicles, which records international activity as well as domestic activity.
3.12.3 Results from the CSRGT NI are grossed in the same way as the CSRGT GB described above. Domestic and international journey totals are added to the CSRGT GB and the IRHS respectively to produce estimates of domestic and international activity by UK-registered vehicles
3.13 Other Sources
3.13.1 Gross Domestic Product: The index used is an updated version of the index of Gross Value Added for all industries, published in Table 1.1 of Scottish Economic Statistics 2008.
3.13.2 Sources for data on rail, air and water freight can be found in the relevant chapter in this publication. Rail (Chapter 7), air (Chapter 8), water (Chapter 9), and international comparisons. (Chapter 12)
3.14 Further Information
3.14.1 Further information on the domestic and international activity of GB and UK registered HGVs can be found in the DfT publication Road Freight Statistics: 2018. DfT also produces another publication on the number of powered vehicles and unaccompanied trailers leaving Great Britain for Europe in its quarterly bulletin Road Goods Vehicles Travelling to Europe
3.14.2 Road freight statistics contact – Dr Matthew Johnson , Head of Road Freight Statistics, Department for Transport (Tel: 07584 641273).
3.14.3 Index of Gross Domestic Product for Scotland - 0131 244 2234 or [email protected]
3.14.4 Further information on rail, air and water freight can be found in the notes for the relevant chapter in this publication. Rail (Chapter 7), air (Chapter 8), water (Chapter 9), and international comparisons (Chapter 12).
3.14.5 Road freight data from 2011 to 2016 have been revised since the DfT publication Road Freight Statistics: 2016. Revisions on the domestic road freight series were made after a review of part of the methodology used to produce these estimates, where more information can be found here. There were also slight revisions on the international road freight series after corrections were made to the number of roll-on roll-off vehicles reported, where more information can be found here.
254
NOTES & DEFINITIONS – ROAD FREIGHT
3.15 Other Data Sources
Department for Transport produce a number of related publications, including:
Maritime and shipping statistics
Port freight statistics
Waterborne freight in the UK
Civil Aviation Authority
UK Airlines – Annual Operating and Traffic Statistics
Office of Rail and Road
Freight Rail Usage
Eurostat and the EC Directorate General for Energy and Transport
EU Energy and Transport in Figures
Other Transport Scotland Publications:
Freight in Scotland Report
255
NOTES & DEFINITIONS - ROAD NETWORK
Chapter 4 - Road Network
4. Notes and Definitions
4.1 The trunk road network is the responsibility of Scottish Ministers, and comprises all motorways and some of the main A roads (local councils are responsible for non-trunk roads). The Government’s view, when it reviewed the trunk road network in 1994, was that the trunk road network should:
provide the road user with a coherent and continuous system of routes which serve destinations of importance to industry, commerce, agriculture and tourism;
define nationally important routes which will be developed in line with strategic national transport demands; and
ensure that those roads which are of predominately local importance are managed locally.
4.2 On 1st April 1996, local government was reorganised, and the 32 present Councils replaced the former Regions, Districts and Island Areas. At the same time, changes were made to the trunk road network: about 580 km of former non-trunk roads became trunk roads, and over 340 km of former trunk roads ceased to be trunk roads.
4.3 Major roads: Motorways and A roads.
4.4 Changes in road lengths: Where there has been a change to the use of a Geographical Information System (GIS) as the basis of the road lengths figures, they may differ significantly from those for the previous year: see section 4.8.4. In 2012 the Trunk road figures were recalculated to include A road slip roads which had been excluded from the totals in previous publications. The time series has been updated to include this data resulting in an increase of 3-4% in Trunk road length and an increase in overall road length of 0.2%. The methodology for calculating the trunk road totals from the database has also changed resulting in some small changes to road lengths from those previously published.
4.5 Operating Units: Since 2001-02, the management and maintenance of the trunk road network has been performed by 4 Operating Companies (South West, North East, South East & North West). Details of the areas covered by these Units can be found in the Annex.
256
NOTES & DEFINITIONS - ROAD NETWORK
4.6 Trunk road constructed, resurfaced, etc in tables 4.3 and 4.4: Figures up to 1995/96 (which appeared in previous editions) were estimates based on the area that was treated, and an assumed standard lane width of 3.5 metres. From 1996/97 actual figures are produced from the Transport Scotland Trunk Roads Network Management.
4.7 Local authority road network condition
4.7.1 The statutory performance indicator for the condition of the local authority road network is defined as the percentage of the road network, derived from a combination of established condition parameters measured at network level, which should be considered for maintenance treatment, i.e. have reached a condition where more detailed monitoring or investigation is required to establish if and when remedial measures are required.
4.7.2 In 2007-08, the indicator changed from the former Scottish SPI, which included data on longitudinal profile, rutting and texture, to the new UK. Standard Road Condition Indicator (RCI), which in addition includes data on carriageway cracking and takes account of the severity of each defect and its relative importance to road users. Further information about the collection of RCI data can be found at:
http://www.ukroadsliaisongroup.org/en/asset-condition/road-condition-information/data-collection/scanner/SCANNER-Road-Condition-Index.cfm
4.7.3 Information on the condition of local authority roads is collected in the Scottish Road Maintenance Condition Survey, which is co-ordinated by the Society of Chief Officers of Transportation in Scotland (SCOTS), on behalf of Scottish Local Authorities. The survey is described briefly in section 4.9.4. As with any survey, the nature of the methods used could lead to apparent minor year-to-year variations.
4.7.4 Where previously, a breach of any single parameter threshold would result in a 10 m-section being classified as amber or red; from 2007/08 onwards the new RCI each defect is assigned a score, dependent on its severity and relative importance, and the summation of the individual parameter scores is used to define the section category.
In order to present its results graphically and on maps, the following colour coding has been adopted:
Green - a score less than 40 – the road is considered to be in an acceptable condition;
Amber - a score of 40 or greater but less than 100 - further investigation should be taken to establish if treatment is required;
257
NOTES & DEFINITIONS - ROAD NETWORK
Red - a score of 100 or greater - the road has deteriorated to the point at which repairs are likely to be required to prolong its future life.
4.7.5 The performance indicator covers the amber and red categories, taken together. It represents the percentage of the road network for which some kind of maintenance may be required. It does not take account of the difference in the costs of the treatments which may be required to restore the carriageway to an acceptable standard. The indicator does not currently cover edge deterioration, although it is the intention, subject to further research, to include this.
4.7.6 SCOTS notes that, when examining the results for individual local authorities, it is important to remember that local road networks vary in character, carry different volumes of traffic and serve widely disparate communities. In SCOTS' view, authorities should not be judged on the absolute values of their amber or red proportions in any given year, but on their performance to improve the condition of their road networks.
Sources
4.8 Road lengths
4.8.1 Information on road lengths is mainly obtained from annual returns made to the Transport Scotland by Councils and by the trunk road management operators. (The figures for motorways are now prepared by Transport Scotland using a GIS - see section 4.8.3). These returns provide the total lengths of the roads for which the Council or trunk road management operator is responsible. The road lengths are categorised in a number of ways (e.g. by class of road, by type of road and by speed limit).
4.8.2 Because the returns provide only the total lengths of roads of various types (they do not provide any information about any individual roads) they can contain errors which cannot be detected, and, even in cases where an error is suspected, it may not be possible to determine how the figures should be corrected. There are a few cases of apparently unusual changes in the figures between one year and the next, which may be due to errors in the statistical returns (for example, it appears that the figures for dual carriageways may have been affected by the double-counting of some lengths of dual carriageway in some years).
4.8.3 Some councils now calculate their road lengths using GIS, which should reduce the number of errors in the longer term. However, changing to a GIS as the source of the statistics can cause a discontinuity in the figures. They will no longer be affected by any errors inherent in the old method of estimation. There may also be changes in the basis of the figures - for example, in the way in which the lengths of roads at roundabouts are counted. Different methods can give different results: for example, the straight-line distance across a roundabout will differ from the
258
NOTES & DEFINITIONS - ROAD NETWORK
distance around the roundabout; or just half the distance around might be used (to represent the average distance which is travelled on the roundabout).
4.8.4 The effect of a change to a GIS as the source of the data can be seen using the figures for motorways for 2000, which were prepared by the then Scottish Executive using a GIS. The figures for each local authority area (which were published in Table 5.2 of Scottish Transport Statistics no. 20 / 2001 edition) could differ from the figures reported by the trunk road management operators for 1999 (which were published in the previous edition), even in local authority areas where there were no changes to the motorway network between April 1999 and April 2000. The then Scottish Executive derived its figures using particular ways of counting the road lengths for (eg) slip roads and roundabouts. The precise basis of the figures which were reported for earlier years is not known.
4.8.5 The change to the use of a GIS was also the reason why the length of unclassified roads reported by Falkirk Council increased from 400 km in 1999 to 572 km in 2000. In such a case, it must be assumed that the figures produced by the use of the new system are more reliable than those which had been provided previously.
4.9 Trunk road network - residual life
4.9.1 The physical condition of Motorways and trunk roads is monitored by annual condition surveys which are undertaken for Transport Scotland by specialist contractors. The surveys are designed to provide information about the structural, surface and safety condition of the road surface (which are referred to as pavements by the engineers). Road condition data is measured by a slow moving vehicle that tests the structural strength by pushing a weight onto the road and measuring how much it deflects. This is then analysed to assess how much life is left in the road pavement. A road network cannot be kept in perfect condition: there will always be some wear and tear, and it is most economic to replace a worn out carriageway at the end of its useful life. When there is no life (which is counted in the residual life <0 column in Table 4.5), the road requires close monitoring to ensure its overall condition does not deteriorate significantly before it is replaced. The data from the surveys is processed annually in a Pavement Management system so as to identify objectively performance and to target the available funds on those areas of greatest need.
4.9.2 The base network includes most motorways and dual carriageway trunk roads. The surveyed network also includes some single carriageway trunk roads. The surveyed network figures are on a cumulative basis – for example, the figure for 2002-03 represents the combination of the condition in 2002-03 of the roads which were surveyed in 2002-03, the condition in 2001-02 of the roads which were surveyed most recently in 2001-02, and so on. Therefore, the surveyed network figures do not represent the current position in each of the specified years: there may
259
NOTES & DEFINITIONS - ROAD NETWORK
have been some improvement or deterioration in the condition of some of the roads since they were surveyed in earlier years. In addition, as the coverage of the surveyed network expands, it includes further roads, whose condition may differ significantly from that of the roads that were already in the surveyed network. Therefore, some of the apparent changes in the figures between years may be due to the expansion of the surveyed network.
4.9.3 Local authority road network condition - the Scottish Road Maintenance Condition Survey
4.9.4 The Scottish Road Maintenance Condition Survey, which is organised by the Society of Chief Officers of Transportation in Scotland (SCOTS) on behalf of Local Authorities, is carried out by a specialist contractor using vehicles accredited annually by the TRL. TRL also undertakes quality assurance checks throughout the year. The vehicles are equipped with lasers and high resolution cameras, to collect data for processing by computer and currently record:-
The road geometry (gradient and shape); Variations in the longitudinal profile (evenness of ride along the road); Transverse profile variance (deformation across the road ); Wheel track rutting / deformation in the wheel path ; The presence of cracking within the carriageway; Texture (roughness of the surface of the road); The extent of edge deterioration (due to over-riding or lack of lateral support).
As indicated previously in section 4.7, the construction of the Scottish road performance indicator was changed in 2007-08 to the new UK Standard Road Condition Indicator (RCI), with each ten metre stretch of road being assigned to one of three categories (Green, Amber or Red) depending on the overall defect score.
4.9.5 The survey currently aims to cover all local authority A roads in both directions every two years, all B and C roads in both directions every four years, and a 10% sample of unclassified roads in one direction each year. In order to minimise the effect of sampling errors on the result, the RCI for unclassified roads is calculated from four years data, as agreed with Audit Scotland and is in effect a rolling four-year indicator. While the survey machines have been calibrated and shown to provide consistent results, variations can occur due to minor differences in machine settings or in the path followed by the survey vehicle (which may well be dictated by, for example, the presence of other vehicles on particular parts of the road).
4.9.6 The SRMCS survey started in the 2002-03 financial year, when it covered all A roads in all local authorities plus a sample of the B, C and unclassified roads in some local authority areas. 2003-04 was the first year for which the survey covers a sample of all road categories in all local authority areas, and is therefore the first year for which results can be produced for Scotland as a whole.
260
NOTES & DEFINITIONS - ROAD NETWORK
4.10 Further Information
4.10.1 Information on GB road network statistics can be found in the Department for Transport annual publications Road Traffic Statistics and Transport Statistics Great Britain.
4.10.2 Further information on road lengths in Scotland is available from Transport Scotland’s Trunk Road Network Management, contact Stuart Hay (tel: 0131 203 8738).
4.10.3 Further information on the construction of Scotland's trunk road network, is available from Mark Scott of Transport Scotland’s Trunk Road Infrastructure and Professional Services (tel: 0141 272 7270).
4.10.4 Further information on the maintenance and the condition of Scotland’s trunk road network, is available from Mark Scott of Transport Scotland Trunk Roads Network Management (tel: 0141 272 7270).
4.10.5 Further information on the Scottish Road Maintenance Condition Survey of the local authority road network, conducted on behalf of Councils by the Society of Chief Officers of Transportation in Scotland, is available from Graeme Ferguson, Project Manager ([email protected]) or at www.scotsnet.org.uk .
4.11 Other data sources
Within Scottish Transport Statistics:
Chapter 5 – Road Traffic
Chapter 12 – international Comparisons.
Department for Transport produce a range of statistics on the GB network as referred to above and Eurostat compile road length statistics for EU countries, including a split by road type. See the notes for chapter 12 for more detail.
261
NOTES & DEFINITIONS - ROAD TRAFFIC
Chapter 5 - Road Traffic
5. Notes and Definitions
5.1 The traffic estimates produced by the Department for Transport
5.1.1 The methods that have been used to estimate the volume of traffic on major roads (Motorways and A roads) in Scotland have changed over the years. Section 5.1 describes the method which the Department for Transport (DfT) used to produce the estimates for 1993 onwards. The method used prior to this is explained in the Road Traffic chapter of earlier versions of this publication. Estimates of the volume of traffic on minor roads (B roads, C roads and unclassified roads) in Scotland that are suitable for publication are only available from 1993. Section 5.6 describes the methods used.
5.1.2 Please note that the DfT traffic estimates provide only a rough indication of the likely volume of traffic on the roads in each local authority area, and that the DfT traffic estimates for individual Council areas are not National Statistics. DfT provides the estimates that it produces for individual local authority areas as being the best that it can produce from the limited amount of data available to it - rough indications of the likely volumes of traffic on roads in each Council area, for use with caution as no better estimates are available. Therefore:
it is not possible for DfT to quantify the possible margins of error around the estimates for individual local authority areas;
they are not classed as National Statistics; more detailed breakdowns of the estimates for individual Council areas are not
published.
5.1.3 DfT's methodology for estimating traffic volumes distinguishes between Motorways, urban roads (i.e. roads, other than Motorways, which are in urban areas) and rural roads (i.e. roads, other than Motorways, which are in rural areas). It defines an urban road as a road (other than a Motorway) that lies within the boundaries of an urban area which had a population of 10,000 or more in 2001 (using the Population Census boundaries for settlements); a rural road as located in an area with a smaller population. However, there are exceptions. DfT adjusted the urban/rural classification of stretches of major road which are on the outskirts of urban areas, in some cases where it was not possible to break them at a junction with another major or minor road. E.g. a stretch of road which is part of a trunk road bypass will usually be classified by DfT as rural (even the part of it which runs through an urban area) whereas a relatively short road between two urban areas that are close to each other will normally be classified by DfT as urban (even the stretch which is in a rural area). DfT's estimate these adjustments to have a small impact on the overall traffic estimates.
262
NOTES & DEFINITIONS - ROAD TRAFFIC
5.1.4 DfT's urban / rural classification of roads differs from the built-up / non-built-up classification of roads, used for the DfT traffic estimates prior to 2003. The built-up / non-built-up classification was based on speed limits, with roads with a speed limit of 40 mph or less being classed as built-up; those with a higher speed limit being non-built-up. For example, a dual carriageway with a 50 mph speed limit in an urban area is counted as an urban road on the basis of its location, but as a non-built-up road on the basis of its speed limit. In contrast, a road with a 40 mph speed limit in a small town (population under 10,000) is classed as a rural road on the basis of its location, but as a built-up road on the basis of its speed limit. While most roads in urban areas have speed limits of 40 mph or less (so are built-up), there are many roads in small towns and villages in rural areas which also have speed limits of 40 mph or less (so are also built-up). Therefore, urban / rural traffic figures are not comparable to built-up / non-built-up traffic figures: the two could differ noticeably for some local authority areas. It will not be possible to quantify this, because each set of DfT's estimates were produced using only one of the two classifications, so there is no table which cross-tabulates the traffic estimates by both urban / rural and built-up / non-built-up. Also urban boundaries tend to change slowly over time, whilst there has been a trend for more roads in rural areas to be assigned speed limits of 40 mph or less. So, a time series for traffic on urban roads may show a different trend from a time series for built-up roads.
5.1.5 On 1st April 1996, local government was reorganised, and the 32 present Councils replaced the former Regions, Districts and Island Areas. At the same time, changes were made to the trunk road network: some former non-trunk roads became trunk roads, and some former trunk roads ceased to be trunk roads. Section 4.3 of the 2002 edition described how this affected the traffic estimates produced by DfT's previous methodology, and caused discontinuities in the series of figures for traffic volumes on major roads. DfT's traffic estimates are no longer affected by such discontinuities, because they count major roads on the basis of their trunk road status at a recent date, rather than on the basis of their trunk road status in the year in question. As a result, there is no discontinuity in the figures between 1995 and 1996. The new estimation method which DfT introduced in 2003 also removed some other discontinuities from the figures (again, details of these were given in previous editions).
5.2 Traffic flows at selected sites
5.2.1 The average daily traffic flows at Automated Traffic Classifier Sites are total past the point figures: traffic is counted in both directions. The estimated traffic flows are based on 7-day averages which include both weekdays and weekends. On occasion, the ATCS counters are not in operation for enough of the month to provide a reliable estimate: in these cases, .. is used to indicate that no estimate is available.
263
NOTES & DEFINITIONS - ROAD TRAFFIC
5.3 Traffic on specific trunk road routes: average time lost
5.3.1. Table 5.8 in previous editions of STS provided estimates of the time lost by traffic on particular routes. Due to a number of reasons including major changes to the network which would have required a substantial rework to the methodology, this table is no longer being updated.
5.4 Estimated consumption of petrol and diesel
5.4.1 The estimates for the consumption of petrol and diesel of road traffic relate to the areas in which the vehicles travelled rather than where the fuel was purchased or the locations of the registered keepers of the vehicles.
Sources
5.5 The method of estimating major road traffic volumes for 1993 onwards
5.5.1 Estimates of traffic volumes on major roads (Motorways and A roads) in Scotland by road type, vehicle type, and area within Scotland are produced by DfT in conjunction with the Transport Scotland Trunk Road Network Management (formerly Scottish Executive Trunk Roads Network Management Division) (TRNM).
5.5.2 The method of estimation has two main stages. First, traffic flows (which represent the numbers of vehicles flowing past particular points in a specified period) are estimated for each of the approximately 2,100 (in 2006) individual road links on Motorway and A roads in Scotland. (A link is normally a section of road between two major intersections). The estimates of the traffic flows on these road links are then combined with information about the lengths of the links, to derive total traffic volume estimates (measured in millions of vehicle kilometres) for major roads by road type, vehicle type and Council area. The type of a road is determined by its class (Motorway or A road), by whether or not it is a trunk road (trunk roads are those roads for whose upkeep Scottish Ministers are responsible), and by whether it is in an urban area or a rural area (see Section 3.1). The steps involved in each of these stages are described in subsequent paragraphs.
5.5.3 The estimates of traffic flows for the individual major road links for each year are derived by a methodology which involves the use of two different types of traffic counts: link and core:
The road link traffic counts are taken manually, for 12 hours in one day, on a rotating basis (on average about once every four years), at each of the approximately 2,100 (in 2006) road links covering nearly all of the major road network in Scotland. These counts take place in neutral weeks during late March, April, May, June, September and October (the aim is to avoid counting, for example, during school holidays, and so to obtain counts which are representative of the level of traffic on each link). Traditionally, roughly one sixth of all the road
264
NOTES & DEFINITIONS - ROAD TRAFFIC
links on the major road network were counted each year in Scotland, but the proportion counted each year has risen, and was about 22% in 2005 (compared with around 30% in England and Wales). At one time, the aim was to count each Scottish site once every six years. However, in 1999, the counting schedule was changed in order to improve the accuracy of the estimates: now, the more important links in Scotland should be counted more often, and the less important should be counted less often. Up to and including 2002, about 300 or so counts were taken each year. However, following a study of possible ways of improving the road traffic estimates for Scotland, the then Scottish Executive (SE) increased the number of counts (in 2006, there were about 480 or so per year). These 12 hours in one day counts must be scaled up to estimate the total flow of traffic for the year as a whole, and in order to reflect changes in traffic levels in the years after each count was taken. The core counters provide the information that is used in the scaling.
The core counters are automatic traffic classifiers, which are located at selected sites on major roads through Great Britain. These operate, on the whole, continuously: 24 hours per day, throughout the year, and provide information about traffic flows classified by category of vehicle according to their length and number of axles. The locations of the core counters, taken together, cover a good cross-section of types of road. There are around 150 core sites on major roads (including motorways) in Great Britain, of which about 25 are in Scotland.
5.5.4 For the purpose of combining the data from the manual counts and the automatic counters, DfT allocates each road link, and each core counter, to one of 22 groupings of road type. These were based on a detailed analysis of the results from all the individual automatic counter sites, and take into account traffic flow levels, (GB) regional groupings, and the road's category, which is a combination of its class (e.g. Motorway, A road, etc) and its urban/rural classification. The groupings range from lightly-trafficked roads in holiday areas, such as Devon and Cornwall, to major roads in Central London. There are no groupings which consist solely of Scottish roads, because there are not enough core counters on roads in Scotland which are in the same category, and have similar levels of traffic flow, to form any separate Scottish groupings.
5.5.5 The estimated traffic flows for each major road link for the latest year are then derived by a series of calculations of which the following provides only a broad outline. The core traffic counters are used to derive two sets of factors, which are then applied to each of the 2,100 (in 2006) link counts:
Expansion Factors for road type and vehicle type are used to scale the single day 12 hour link counts to provide estimated traffic flows for the whole year in which the counts were taken.
Growth Factors for each road and vehicle type are used to scale estimated traffic flows in the previous year forward to the latest year, for those links which were not counted in the latest year.
265
NOTES & DEFINITIONS - ROAD TRAFFIC
5.5.6 DfT estimates the total traffic volume (in vehicle-kilometres) on each major road link by multiplying together the estimated traffic flow for the link and the length of the link. DfT obtains the length of each major road link, and identifies the Council(s) in which it is located, using a Geographic Information System (GIS). When a link lies completely within the area of one Council, its estimated traffic volume is counted wholly against that Council. In a case where a link crosses a boundary between Councils, it is split (for the purposes of the calculations) at the boundary into two separate links. Similar calculations are performed for each new link: the length within the relevant local authority (which DfT obtains from the GIS) is multiplied by the average traffic flow calculated for the original link (regardless of the Council area in which the traffic count was taken - because the original link was a section of road between major intersections, the traffic flow should not vary much along its length).
5.5.7 DfT compared its estimates for some motorway and trunk road links with the information that was available from the volumetric automatic traffic counters which are operated on motorway and trunk road links by TRNM, the Highways Agency in England and the Welsh Assembly Government in Wales. In general, there was a much closer correlation between the two sets of data than for the estimates which DfT had made in 2002 and earlier years. DfT noted that its estimates were slightly lower, and thought that there might be a number of reasons for this (e.g. the manual counters might miss some vehicles, the fact that the DfT core counters cannot be positioned on the most congested roads, etc). DfT therefore adjusted its expansion factors in order to eliminate the apparent slight bias in its overall estimates. DfT did not attempt to make its estimate for each individual link agree exactly with the total from any volumetric counter on that link because, for example, the volumetric counters on some links did not provide information for the whole of the year.
5.5.8 These calculations produce estimates of traffic volumes for each road link (or part of a road link) which is within the area of each Council. The estimated traffic volume for each Council is then obtained by adding up the estimates for the relevant links (or parts of links), and the estimates for Scotland as a whole are then produced by adding up the estimates for each Council. As indicated earlier, DfT produced the figures for trunk roads by counting each major road link on the basis of its trunk road status at a recent date.
5.5.9 DfT's estimates of the total volume of traffic on major roads in each local authority area are based on 12 hours in one day manual counts at an average of under 10 (up to 2002: under 15 for 2003 onwards) sites on major roads per Council per year - so they are clearly not based on much data. And, because the manual traffic counts are taken on a rotating census basis, there may be several years between successive counts at a particular site: in which time, there could be large changes in the volume of traffic there. The estimates therefore provide only a broad indication of the likely volume of traffic on major roads in each Council area. DfT notes that there could be some large percentage errors in its traffic estimates for the major roads in some local authority areas. Therefore, DfT's estimates for individual Council areas are not classed as National Statistics.
266
NOTES & DEFINITIONS - ROAD TRAFFIC
5.6 Method used to estimate traffic on minor roads for 1993 onwards
5.6.1 Estimates of traffic volumes on minor roads (B roads, C roads and unclassified roads) in Scotland by road type and vehicle type are produced by DfT in conjunction with TRNM.
5.6.2 The method used differs from that used for the major roads, because far fewer data are available for minor roads: up to and including 2002, only 200 or so 12 hours on one day manual traffic counts per year were taken at Scottish minor road sites. In each of the years up to 1997, a fresh sample of sites was picked by, in effect, taking a series of random points on a map, looking within a circle with a specified radius around each point, and identifying which (if any) minor road was nearest to the selected point. The number of other minor roads within the circle was used, at a later stage, when the results were grossed-up to produce the overall traffic estimates. This method of sampling was suitable for the production of results for GB as a whole, but not for Scotland: the kinds of minor roads in the Scottish sample could vary greatly from one year to the next, and, as a result, the Scottish component of the GB estimates was not sufficiently reliable to be published in its own right.
5.6.3 Over the years, a list of all the minor road sites that had been chosen in this way built up, and became the basis for selecting a panel sample of minor road sites to be counted in 1998 and later years. Taking the counts at the same sites each year should produce a better estimate of the year to year percentage change in the volume of traffic on minor roads. The sample was picked from a list of all the sites at which traffic counts had been taken between 1992 and 1997. Disproportionate stratified sampling was used, with a higher sampling fraction for roads which had had a greater volume of traffic, as this should produce more accurate results than a simple random sample of minor road sites. Sites with average flows of fewer than 200 vehicles per day were excluded altogether. Some of the sites chosen for the panel for 1998 were found to be unsuitable, and were replaced by substitute sites in the panel for 1999. There was little change in the composition of the panel of sites until 2003, when, following a study of possible ways of improving the traffic estimates for Scotland, SE increased the number of minor road traffic counts in Scotland to about 320 or so per year.
5.6.4 As with the major road traffic counts, the minor road 12 hour traffic counts must be expanded to estimate the flows for a whole day, and a whole year. This is done using expansion factors calculated from information recorded by a set of core automatic traffic classifiers located on a sample of roughly 40 minor roads across GB, of which about 5 are in Scotland.
5.6.5 The data from the GB-wide core automatic traffic classifiers were used to calculate growth and expansion factors for minor roads outwith London (with
267
NOTES & DEFINITIONS - ROAD TRAFFIC
separate sets of factors for urban and rural roads of each class). There are too few core classifiers in Scotland for there to be any separate Scottish groupings.
5.6.6 The number of manual counts per year at minor road sites across Scotland represent an average per local authority area per year of only 6-7 (up to 2002) and only 10 (2003 onwards) - clearly, too few to be the basis for reliable estimates of minor road traffic for individual local authority areas calculated solely from the data collected in each year. DfT had therefore to estimate the volume of traffic on minor roads in individual local authority areas in other ways. DfT started by producing estimates of the volume of traffic on minor roads in each local authority area in 1999 (as that is the new base year for its panel of minor road manual traffic count sites). The information base for these estimates was widened to include manual counts taken in other years by uprating them to 1999 using the growth factors produced from the core counters. DfT used different methods for B roads and for other minor roads (C roads and unclassified roads).
5.6.7 B roads: DfT looked at the location and traffic levels of all the B road manual traffic count sites, including ones counted in the past that were not included in the panel sample, identified gaps in coverage and initiated extra counts where necessary. Using its knowledge of the variation in B road traffic by type of location, and the length of B roads in each area, DfT produced estimates of B road traffic for each local authority area.
5.6.8 C and unclassified roads: Estimating traffic on other minor roads was more difficult, and had to be done in another way. First, DfT estimated the average levels of traffic flow on each type of these roads across GB (e.g. urban C roads, etc), using the information from the minor road manual counts and core counters. Second, DfT compared the average levels of traffic flow on the non-trunk A roads in each local authority area with the GB average traffic flows for such roads. Third, DfT made the assumption that an area which has non-trunk A road flows that are above the GB averages will also have minor road flows that are proportionately greater than the corresponding GB averages, and that an area whose non-trunk A road flows are below the GB averages will have proportionately lower flows on its minor roads. DfT then estimated the flows for each type of minor road in a local authority by applying to the GB average flows for each type of minor road the relevant ratios (of its non-trunk A road flows to the corresponding GB averages). The resulting estimates were multiplied by the length of minor road of each type in that local authority to give the estimated minor road traffic volumes for the area. This produced what DfT considered to be sensible results for many local authorities. However, there were some areas for which DfT felt the results were odd in relation to those for nearby areas or similar areas. For these local authority areas, DfT undertook a more detailed study. This involved looking at the minor road traffic count data for different parts of the local authority, deriving a traffic intensity value for each part, and comparing the results with the traffic intensities of other local authorities for which DfT was confident about the minor road traffic estimates, in order to produce what DfT considered to be more credible estimates for some parts of the local authority. The resulting estimates were then added together to produce totals for the local
268
NOTES & DEFINITIONS - ROAD TRAFFIC
authority as a whole, and the results for all the local authorities in Scotland were then added together to produce minor road totals for each area and for Scotland as a whole.
5.6.9 DfT used its estimates for 1999 as the basis for the estimates for earlier years and for later years. The minor road traffic volumes for the years prior to 1999 were estimated by applying year to year change factors, which were calculated from the information produced by the panel survey. The estimates for 2000 to 2003, inclusive, were produced by applying year to year change factors which were derived from the data collected by the GB-wide core automatic traffic classifiers. The methodology was changed for the production of the estimates for 2004, when the overall percentage changes in minor road traffic volumes between 2003 and 2004 were calculated using information, from the panel survey, about the percentage changes in traffic flow levels at each of the sites for which comparable results were available from the manual counts taken in the two years. In all cases, the estimates also took account of information about changes in the length of the minor road network.
5.6.10 Given the assumptions that DfT has to make, and the fact that its estimates of the total volume of traffic on minor roads in each local authority area are based on 12 hours in one day manual counts at an average of 6-7 (up to 2002: about 10 for 2003 onwards) sites on minor roads per Council per year, it is clear that these estimates can only provide a broad indication of the likely volume of traffic on minor roads in each local authority area. That is why figures for individual minor road types are not published for local authority area: only the total volume of minor road traffic for each area appears in Table 5.4, with no breakdown by type of minor road within local authority. DfT notes that there could be some large percentage errors in its traffic estimates for the minor roads in some local authority areas. Therefore, DfT's estimates for individual Council areas are not classed as National Statistics.
5.6.11 1993 is the first year for which there are estimates of the volume of traffic on minor roads for individual local authority areas, and also is the first year for which there are estimates for Scotland as a whole. There are no reliable estimates of the total volume of minor road traffic in Scotland for 1992 or any earlier year.
5.7 Average time lost by traffic on specific trunk road routes
5.7.1 Table 5.8 in previous editions of STS provided estimates of the time lost by traffic on particular routes. Due to a number of reasons including major changes to the network which would have required a substantial rework to the methodology, this table is no longer being updated.
269
NOTES & DEFINITIONS - ROAD TRAFFIC
5.8 Scottish Household Survey
5.8.1 Information about the Scottish Household Survey is given in the notes for Chapter 12.
5.9 Estimated consumption of petrol and diesel
5.9.1 The figures for the petrol and diesel consumption of road traffic are estimated by AEA Energy & Environment, which was commissioned to do this by the Department of Energy and Climate Change. AEA produce the estimates using a range of data, including: (a) information from equipment, located alongside many A roads, which monitors the levels of various substances emitted by vehicles; (b) average fuel consumption factors (expressed in terms of grams of fuel per kilometre driven) for different classes of vehicles; (c) the Department for Transport's information about the traffic flows on each link of the major road network; and (d) the DfT's estimates of the total volume of road traffic on minor roads. AEA estimate the consumption of petrol and diesel separately for each type of vehicle for each Council area, producing more detailed estimates than appear in Table 5.10.
5.10 Further Information
5.10.1 Further information on GB road traffic statistics can be found in the annual DfT publications Road Traffic Statistics and Transport Statistics Great Britain, and also in the former DETR's Focus on Roads publication. DfT also has a Geographical Information System (GIS) website which provides statistics of major road traffic flows for Great Britain. The website enables users to access Annual Average Daily Flows (numbers of vehicles), and traffic (thousand vehicle kms) for each major road link in Great Britain. Information can be found at http://www.dft.gov.uk/traffic-counts/, alternatively contact Behnom Havaei-Ahary at DfT Statistics Roads 2 branch (020 7944 2122)
5.10.2 For enquiries about DfT's methods of estimating road traffic, contact Penny Allen of the Department for Transport (0207 944 8057).
5.10.3 For further information on average daily traffic flows at selected Automated Traffic Classifier (ATC) Sites and on key routes on the road network contact Stuart Hay, Transport Scotland Trunk Road and Bus Operations, Operations Services (0131 203 8738).
5.10.4 Scottish Household Survey congestion figures - Andrew Knight of the Scottish Government Transport Statistics branch (tel: 0131 244 7256).
270
NOTES & DEFINITIONS - ROAD TRAFFIC
5.10.5 Petrol and diesel consumption by road traffic - see Road transport energy consumption at regional and local authority level or Laura Williams of The Department of Energy and Climate Change (Tel: 0300 068 5045).
5.11 Other data sources
Within Scottish Transport Statistics:
Chapter 1 - Road vehicles,
Chapter 4 – Road Network
Chapter 6 - Road casualties
Chapter 11 - Personal Travel chapter (including travel to work)
Chapter 13 – Environment and Emissions
Other Transport Scotland Publications:
Transport and Travel in Scotland – includes more detailed analysis of SHS data, in particular:
Table 8 – Effects of traffic congestion
Table 5 – concessionary pass possession
Table 21 – Park and ride
Table 28 – Frequency of bus and train use
Tables 29 and 30 – Views on local buses and trains
Tables 31 and 32 – Concessionary pass use
Scottish Household Survey Travel Diary – includes detailed tables using the Travel Diary dataset, in particular:
Table 2 – journeys by mode of transport
Table 2a – journey distance by mode of transport
Table 4a – mode of transport by journey distance
Table 5a – distance summary statistics by mode of transport
SHS Local Authority Results – provides breakdowns of SHS data by Local Authority, Regional Transport Partnership and Urban Rural Classification. In particular:
Table 6 – Congestion delays
Table 16 – Proportion of journeys by mode of transport
Table 18 – Travel day
Table 19 and 20 – Distance travelled
Department for Transport produce a number of related publications, including:
Traffic estimates
Vehicle registrations
271
NOTES & DEFINITIONS - REPORTED INJURY ROAD ACCIDENTS
Chapter 6 - Reported Injury Road Accidents
6. Notes and Definitions
6.1 Fatal injury: an injury which causes death fewer than 30 days after the accident;
6.2 Fatal accident: an accident in which at least one person is fatally injured;
6.3 Serious injury: an injury which does not cause death fewer than 30 days after the accident, and which is in one (or more) of the following categories:
(a) an injury for which a person is detained in hospital as an in-patient
or (b) any of the following injuries (whether or not the person is detained in hospital): fractures, concussion, internal injuries, crushings, severe cuts and lacerations, severe general shock requiring treatment
or (c) any injury causing death 30 or more days after the accident;
6.4 Serious accident: an accident in which at least one person is seriously injured, but no-one suffers a fatal injury;
6.5 Slight injury: an injury which is neither fatal nor serious – for example, a sprain, bruise, or cut which is not judged to be severe, or slight shock requiring roadside attention;
6.6 Slight accident: an accident in which at least one person suffers slight injuries, but no-one is seriously injured, or fatally injured.
6.7 It follows that whether some injuries are classified as serious or as slight could depend upon hospitals’ admission policies, or upon other administrative practices, and therefore changes in the numbers of injuries of these two types could result from changes in admissions policies or other administrative practices.
6.8 Built-up roads: accidents which occur on built-up roads are those which occur on roads which have speed limits of up to and including 40 miles per hour (ignoring temporary speed limits on roads for which the normal speed limit is over 40 mph). Therefore, an accident on a motorway in an urban area would not be counted as occurring on a built-up road, because the speed limit on the motorway is 70 mph. An accident on a stretch of motorway with a temporary speed limit of
272
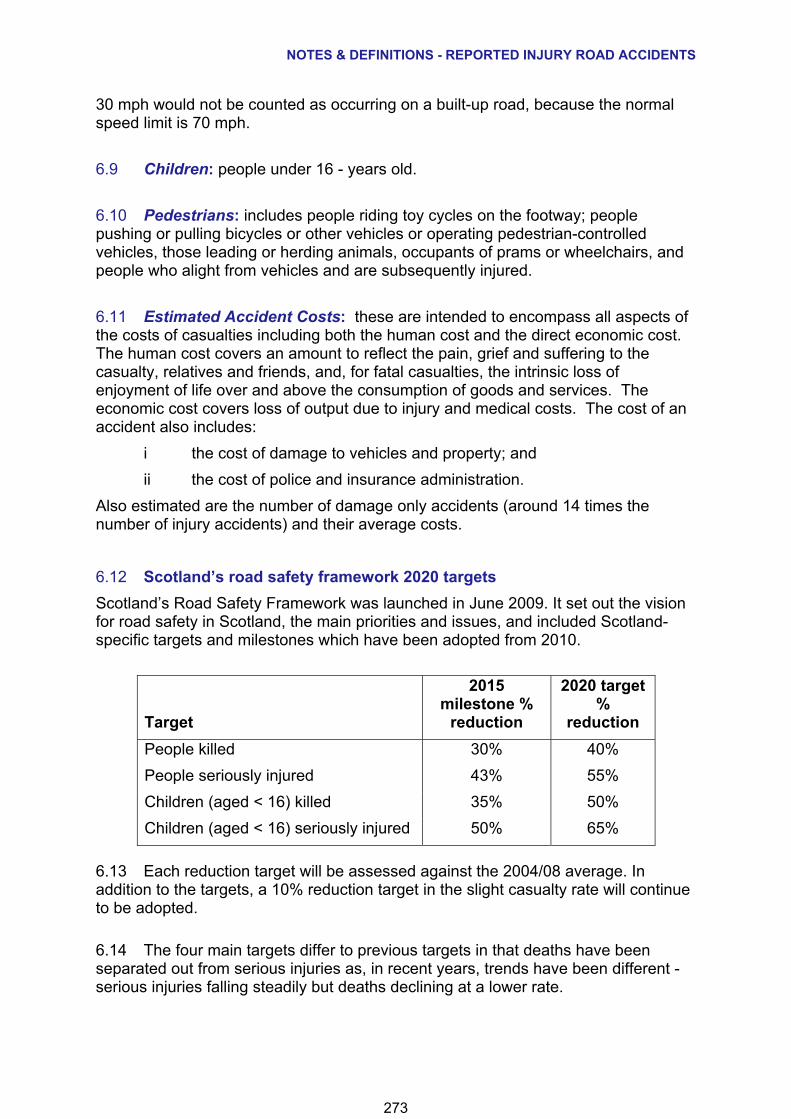
NOTES & DEFINITIONS - REPORTED INJURY ROAD ACCIDENTS
30 mph would not be counted as occurring on a built-up road, because the normal speed limit is 70 mph.
6.9 Children: people under 16 - years old.
6.10 Pedestrians: includes people riding toy cycles on the footway; people pushing or pulling bicycles or other vehicles or operating pedestrian-controlled vehicles, those leading or herding animals, occupants of prams or wheelchairs, and people who alight from vehicles and are subsequently injured.
6.11 Estimated Accident Costs: these are intended to encompass all aspects of the costs of casualties including both the human cost and the direct economic cost. The human cost covers an amount to reflect the pain, grief and suffering to the casualty, relatives and friends, and, for fatal casualties, the intrinsic loss of enjoyment of life over and above the consumption of goods and services. The economic cost covers loss of output due to injury and medical costs. The cost of an accident also includes:
i the cost of damage to vehicles and property; and
ii the cost of police and insurance administration.
Also estimated are the number of damage only accidents (around 14 times the number of injury accidents) and their average costs.
6.12 Scotland’s road safety framework 2020 targets
Scotland’s Road Safety Framework was launched in June 2009. It set out the vision for road safety in Scotland, the main priorities and issues, and included Scotland-specific targets and milestones which have been adopted from 2010.
Target
2015 milestone %
reduction
2020 target %
reduction
People killed 30% 40%
People seriously injured 43% 55%
Children (aged < 16) killed 35% 50%
Children (aged < 16) seriously injured 50% 65%
6.13 Each reduction target will be assessed against the 2004/08 average. In addition to the targets, a 10% reduction target in the slight casualty rate will continue to be adopted.
6.14 The four main targets differ to previous targets in that deaths have been separated out from serious injuries as, in recent years, trends have been different - serious injuries falling steadily but deaths declining at a lower rate.
273
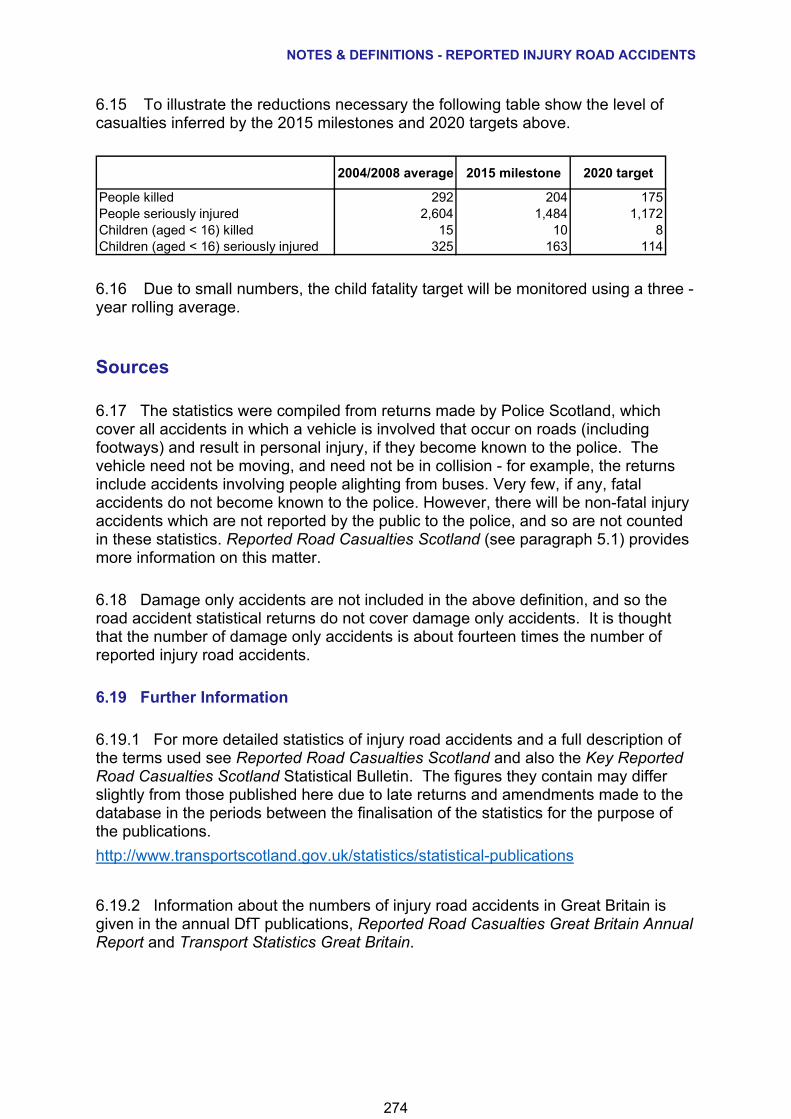
NOTES & DEFINITIONS - REPORTED INJURY ROAD ACCIDENTS
6.15 To illustrate the reductions necessary the following table show the level of casualties inferred by the 2015 milestones and 2020 targets above.
6.16 Due to small numbers, the child fatality target will be monitored using a three - year rolling average.
Sources
6.17 The statistics were compiled from returns made by Police Scotland, which cover all accidents in which a vehicle is involved that occur on roads (including footways) and result in personal injury, if they become known to the police. The vehicle need not be moving, and need not be in collision - for example, the returns include accidents involving people alighting from buses. Very few, if any, fatal accidents do not become known to the police. However, there will be non-fatal injury accidents which are not reported by the public to the police, and so are not counted in these statistics. Reported Road Casualties Scotland (see paragraph 5.1) provides more information on this matter.
6.18 Damage only accidents are not included in the above definition, and so the road accident statistical returns do not cover damage only accidents. It is thought that the number of damage only accidents is about fourteen times the number of reported injury road accidents.
6.19 Further Information
6.19.1 For more detailed statistics of injury road accidents and a full description of the terms used see Reported Road Casualties Scotland and also the Key Reported Road Casualties Scotland Statistical Bulletin. The figures they contain may differ slightly from those published here due to late returns and amendments made to the database in the periods between the finalisation of the statistics for the purpose of the publications.
http://www.transportscotland.gov.uk/statistics/statistical-publications
6.19.2 Information about the numbers of injury road accidents in Great Britain is given in the annual DfT publications, Reported Road Casualties Great Britain Annual Report and Transport Statistics Great Britain.
2004/2008 average 2015 milestone 2020 target
People killed 292 204 175People seriously injured 2,604 1,484 1,172Children (aged < 16) killed 15 10 8Children (aged < 16) seriously injured 325 163 114
274
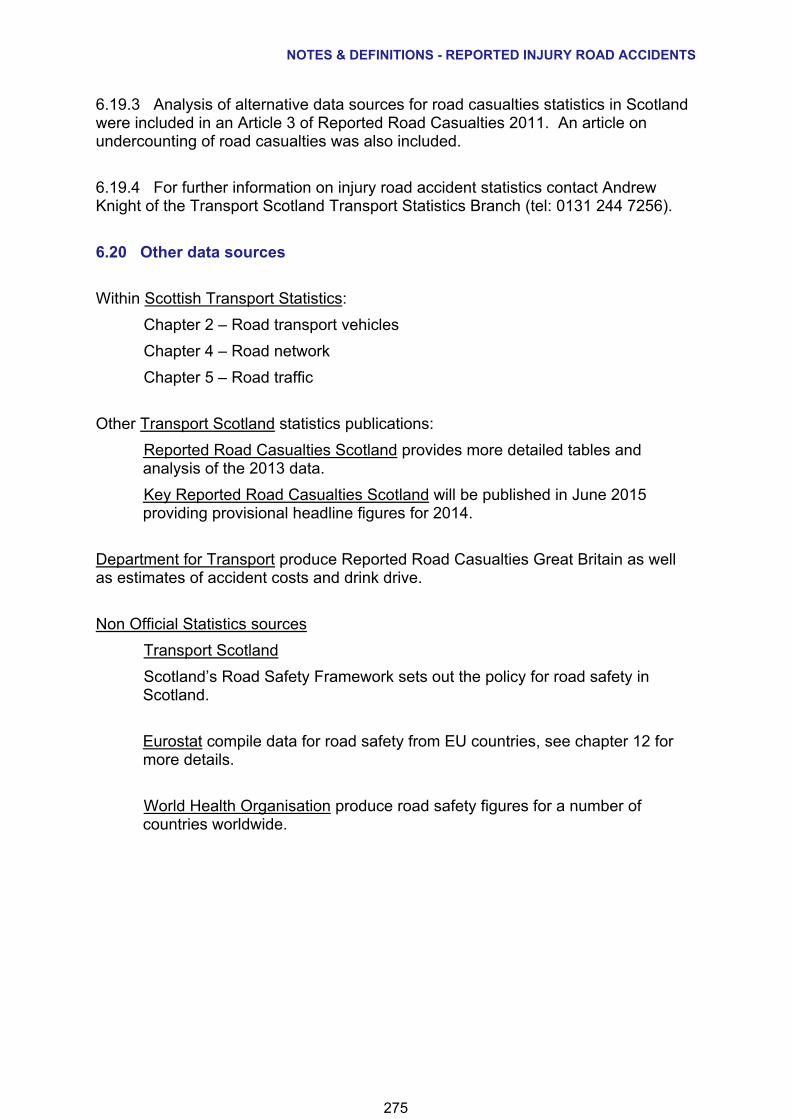
NOTES & DEFINITIONS - REPORTED INJURY ROAD ACCIDENTS
6.19.3 Analysis of alternative data sources for road casualties statistics in Scotland were included in an Article 3 of Reported Road Casualties 2011. An article on undercounting of road casualties was also included.
6.19.4 For further information on injury road accident statistics contact Andrew Knight of the Transport Scotland Transport Statistics Branch (tel: 0131 244 7256).
6.20 Other data sources
Within Scottish Transport Statistics:
Chapter 2 – Road transport vehicles
Chapter 4 – Road network
Chapter 5 – Road traffic
Other Transport Scotland statistics publications:
Reported Road Casualties Scotland provides more detailed tables and analysis of the 2013 data.
Key Reported Road Casualties Scotland will be published in June 2015 providing provisional headline figures for 2014.
Department for Transport produce Reported Road Casualties Great Britain as well as estimates of accident costs and drink drive.
Non Official Statistics sources
Transport Scotland
Scotland’s Road Safety Framework sets out the policy for road safety in Scotland.
Eurostat compile data for road safety from EU countries, see chapter 12 for more details.
World Health Organisation produce road safety figures for a number of countries worldwide.
275
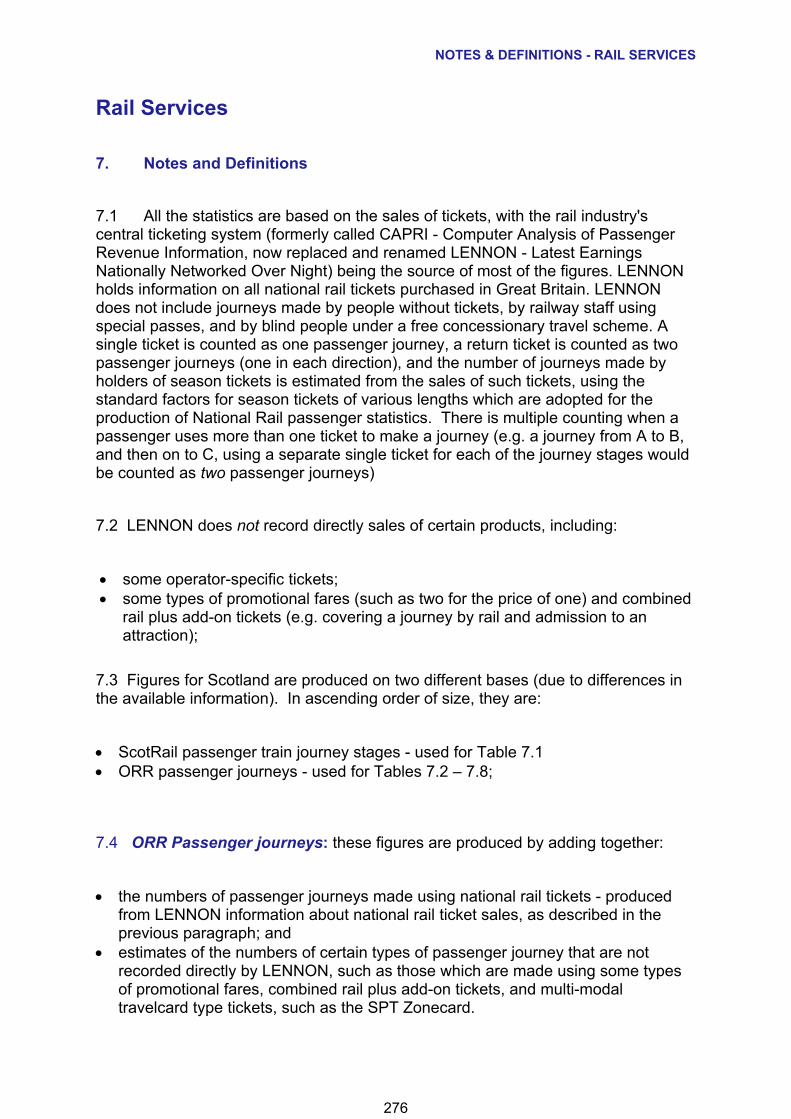
NOTES & DEFINITIONS - RAIL SERVICES
Rail Services
7. Notes and Definitions
7.1 All the statistics are based on the sales of tickets, with the rail industry's central ticketing system (formerly called CAPRI - Computer Analysis of Passenger Revenue Information, now replaced and renamed LENNON - Latest Earnings Nationally Networked Over Night) being the source of most of the figures. LENNON holds information on all national rail tickets purchased in Great Britain. LENNON does not include journeys made by people without tickets, by railway staff using special passes, and by blind people under a free concessionary travel scheme. A single ticket is counted as one passenger journey, a return ticket is counted as two passenger journeys (one in each direction), and the number of journeys made by holders of season tickets is estimated from the sales of such tickets, using the standard factors for season tickets of various lengths which are adopted for the production of National Rail passenger statistics. There is multiple counting when a passenger uses more than one ticket to make a journey (e.g. a journey from A to B, and then on to C, using a separate single ticket for each of the journey stages would be counted as two passenger journeys)
7.2 LENNON does not record directly sales of certain products, including:
some operator-specific tickets; some types of promotional fares (such as two for the price of one) and combined
rail plus add-on tickets (e.g. covering a journey by rail and admission to an attraction);
7.3 Figures for Scotland are produced on two different bases (due to differences in the available information). In ascending order of size, they are:
ScotRail passenger train journey stages - used for Table 7.1 ORR passenger journeys - used for Tables 7.2 – 7.8;
7.4 ORR Passenger journeys: these figures are produced by adding together:
the numbers of passenger journeys made using national rail tickets - produced from LENNON information about national rail ticket sales, as described in the previous paragraph; and
estimates of the numbers of certain types of passenger journey that are not recorded directly by LENNON, such as those which are made using some types of promotional fares, combined rail plus add-on tickets, and multi-modal travelcard type tickets, such as the SPT Zonecard.
276
NOTES & DEFINITIONS - RAIL SERVICES
ORR figures include estimates of zonecard trips using a slightly different basis to ScotRail estimates and therefore figures are not comparable.
7.5 ScotRail passenger train journey stages: these figures are produced from:
data which have been subject to the ORCATS process (Operational Research Computer Allocation of Tickets to Services). This uses the national rail ticket sales information from LENNON to allocate the revenue from a passenger’s ticket to the Train Operating Companies (TOCs) which provide the services on the route or routes which were used for the passenger’s journey. In the ORCATS process, a passenger journey that would involve a change of train is counted against each of the trains that would be used in the course of that journey.
For example, a journey made using a through single ticket from North Berwick to Carlisle would be counted twice, to reflect the fact that the passenger would use one train from North Berwick to Edinburgh, and then change at Edinburgh to another train to Carlisle. This is done in order that the revenue relating to the ticket can be allocated pro rata to the operators of the different trains used in the course of the journey. Therefore, figures in Table 7.1 represent the numbers of different trains used in the course of journeys on ScotRail services, not the actual numbers of journeys made (hence differs from the ORR).
Estimates of the numbers of journeys (or parts of journeys) made using tickets (such as Zonecards) whose sales are not recorded directly by LENNON (some of these estimates are added after the allocation process).
ScotRail revised its methodology to better estimate Strathclyde Zonecard journeys from 2009/10. To allow meaningful year on year comparisons to be made passenger figures from 2003/04 onwards present the impact on previously published figures. Note that Office of Rail and Road figures are compiled on a different basis and do not adjust for this.
7.6 Journeys originating in Scotland, and cross-border journeys: the statistics are compiled on the basis of where each journey starts. For example, someone who used a Zonecard to travel from a suburban station to, say, Glasgow Central, and then bought a single to (say) Manchester, would be counted as making one internal (within Scotland) journey and one cross-border originating in Scotland journey.
7.7 Ticket types: the following are identified:
Full fare - e.g. first class, standard single and standard open return; Reduced fare - e.g. saver, supersaver, cheap day return, special promotional
fares, such as two for the price of one and combined rail plus add-on tickets (see below);
Season tickets - includes Zonecards.
7.8 Journeys datasets in LENNON - LENNON contains two datasets - pre-allocation (sales) and post-allocation (earnings). Allocations are created for each ticket group, dependant on sales levels, by ORCATS (Operational Research
277
NOTES & DEFINITIONS - RAIL SERVICES
Computer Allocation of Tickets to Services). These allocations are principally used to apportion journeys between TOCs. ORCATS is a mathematical model, which was introduced in the 1980s, which uses a similar logic to journey planning systems and identifies passenger ‘opportunities to travel’ from an origin station to a destination station using timetable information. An opportunity to travel may include one or more changes of train and one journey will be generated for each train used during an opportunity to travel. This will result in the number of journeys being inflated by around 5%, compared to the pre-allocation dataset which does not assign journeys between TOCs.
7.9 Revenue: this includes all ticket revenue and miscellaneous charges associated with passenger travel, such as car park charges earned by the Train Operators. In the case of combined rail plus add-on tickets (e.g. a ticket which covers both a journey by rail and admission to an attraction, or a ticket which covers both a journey by rail and a bus, taxi or ferry journey from the destination station) the figures held in the database for revenue from the sales of such tickets do not indicate how much relates to the rail travel. Therefore, all the revenue from the sales of such tickets is counted in these statistics.
7.10 Concessionary fares: the figures for revenue include payments made by passengers for concessionary fares, but not the additional payments made by local authorities and the Strathclyde Partnership for Transport to reimburse the train operator for the difference between the concessionary fare and the normal fare for the journey (because these are not recorded in the database).
7.11 Passenger journeys by local authority: Table 7.6a and Table 7.6b are taken from the ORR National Rail Statistics Regional Usage Chapter. Table 7.6c is calculated on a similar basis and replaces versions of the table included in earlier versions of STS as the new methodology corrects the allocation of multi-trip tickets between Edinburgh and Glasgow.
7.12 Passenger journeys, using national rail tickets, to and from particular stations 7.12.1 The figures in Tables 7.7 and 7.8 are produced from information about through tickets sold for journeys between different destinations, and are subject to the same points as were made in the earlier paragraph on passenger journeys made using national rail tickets. However, there are differences, because the figures in these tables aim to represent the numbers of people using each individual station (but not counting those who change trains there, unless they buy another ticket: these figures are of entries and exits to/from the national rail system, not counting interchanges). Normally, a single journey between two stations within Scotland will be counted twice (once against the origin station and once against the destination station) and a single journey between Scotland and England will be counted only once (against only the station in Scotland). However, when the contractor working for the Office of Rail Regulation (Now called the Office of Rail and Road - ORR)
278
NOTES & DEFINITIONS - RAIL SERVICES
produced the figures, there were two complications, the second of which caused some journeys to be counted less than this: in the case of some places with more than one station, it is possible to buy a
ticket which allows travel to and from any of the stations at that place. Such tickets are recorded in the database as being to/from a group station (e.g. Glasgow stations) rather than being to/from any particular station (e.g. Central or Queen Street). When the ORR’s contractor produced statistics of the numbers of passengers using each station (like those in Table 7.7), it split the numbers of journeys made using tickets which specified origins/destinations as places (e.g. Glasgow) between the relevant stations. This could be based on information about services and passenger numbers for the places concerned, or could simply count them all against the major stations within the group
it is possible to purchase national rail tickets for travel between a particular station (or place) and an SPT zone in Glasgow - the ticket allows the traveller to use any of the stations in that SPT zone. Such tickets are recorded in the database as being between the specified place and the SPT zone. Prior to 2008 - 09 , when producing the station usage statistics, the ORR’s contractor counted journeys against origins/destinations outwith Glasgow as described above. They were unable to count any origins/destinations recorded as SPT zones to specific Glasgow stations as it had no basis on which to split the journeys made using such tickets between the stations in the zones. This resulted in an underestimation of the number of passengers using Glasgow stations (in addition to the exclusions, mentioned earlier, such as journeys made using SPT zonecards.
7.12.2 However, from 2008–09, ORR’s contractor has assigned the previously unknown origin/destinations. Information provided by the PTEs has been used to estimate the number of journeys made on national rail services on PTE sold tickets that are not captured in the rail industry’s LENNON system.
7.12.3 Station usage figures were produced on this basis for every station in Great Britain, and made available on the ORR Web site, as described in section 5. The ORR station usage data consist of separate estimates of the total numbers of people entering, exiting and interchanging at stations. The station usage information from which Table 7.7 was produced is based on ticket sales covering all National Rail stations throughout England, Scotland and Wales. (It does not include those stations that are owned by London Underground. The ticketing system does not record certain journeys made using TfL bought travelcards, TfL Freedom Passes, staff travel passes and certain other PTE specific products. However, from 2008 – 09 the data now includes estimates of journeys and revenue made on zonal products sold outside of the main ticketing database. 7.12.4 The calculation of station usage levels uses sales recorded in the railway ticketing system prior to their allocation to individual operators, and so does not take into account any changes of train during the course of a journey. The figures which appear in Table 7.7 are estimates of the numbers of entries and exits, and do not
279
NOTES & DEFINITIONS - RAIL SERVICES
include the estimated numbers of people who change trains at the specified stations (unless they buy another ticket there).
7.13 Rail punctuality - Public Performance Measure
7.13.1 The Public Performance Measure (PPM) combines punctuality and reliability into a single measure of the performance of individual trains against the planned timetable for the day, which may differ from the published timetable (e.g. due to engineering works, speed restrictions, flooding, etc).
7.13.2 For long-distance operators (such as GNER, Virgin CrossCountry and Virgin West Coast) the PPM is the percentage of trains arriving within ten minutes of timetable at the final destination; for regional operators (such as ScotRail) the PPM is the percentage arriving within five minutes of timetable. (The definitions differ because, in general, long-distance operators' trains run further than regional operators' trains.) The figures relate to all the services which are provided by the operator, so (for example) the PPM for GNER is an overall measure for all its trains, not just for those which run to, from or within Scotland.
7.13.3 Trains which complete their journey are measured for punctuality at the final destination. When a train fails to run its entire planned route, calling at all timetabled stations, it is either shown as cancelled (if it runs less than half of its planned mileage) or counted in the 20 or more minutes late band. Therefore, such a train would not be counted as arriving at the final destination within the number of minutes specified in the PPM.
7.14 Passengers in excess of capacity
7.14.1 From 2001 to 2003, the former Strategic Rail Authority monitored overcrowding on Edinburgh commuter services across the Forth Bridge . Passengers in excess of capacity (PIXC) was calculated for weekday commuter trains which arrived in Edinburgh between 07:00 and 09:59, or which departed between 16:00 and 18:59.
7.14.2 PIXC was calculated as the number of passengers travelling in excess of capacity on all of the specified services divided by the total number of passengers travelling on those services, and expressed as a percentage. For journeys of more than 20 minutes, capacity was deemed to be the number of standard class seats on the train; for journeys of 20 minutes or fewer, there was also an allowance for standing room (which varies with the type of rolling stock - e.g. for modern sliding door stock, it was typically of the order of 35% of the number of seats).
7.14.3 The SRA set limits on the level of PIXC at 4.5% on one peak, and 3.0% across both peaks. However, there is no requirement to monitor passengers in
280
NOTES & DEFINITIONS - RAIL SERVICES
excess of capacity under the current Scottish passenger rail franchise, which applies from 17 October 2004 (the date when First Group took over the operation of the ScotRail franchise) - and therefore such information is no longer collected.
7.15 Rail passenger satisfaction: National Rail Passenger Survey
7.15.1 Passengers' ratings of their train journeys are shown in three groups: those which are regarded as generic; those which relate to the station; and those which relate to the journey.
7.15.2 The table shows the percentages who said that they were satisfied / very satisfied with each factor, or who rated it as good / very good. The difference between the percentage shown for a factor and 100% is made up of both
(a) those who said that they were dissatisfied / very dissatisfied, or who rated it poor / very poor; and
(b) those who said that they were neither satisfied nor dissatisfied, or who rated it neither good / very good nor poor / very poor.
7.15.3 A passenger who changes trains later in the course of a journey is asked for his/her views of the first station and the first train that was used of the journey after they were given a questionnaire. In all analyses, such a person's answers are counted against the operator of the first train.
7.15.4 ScotRail is classified as a regional operator by the Office of Rail and Road, therefore results for ScotRail should be compared with those for all GB regional operators that appear in the table. ‘Others whose journey started in Scotland’ is made up of long distance routes and these results should be compared with all GB long distance operators.
7.16 Freight traffic
7.16.1 Freight traffic: the figures for 1996-97 onwards were prepared from information supplied by the rail freight companies. The numbers of tonne-kilometres in those years relate to the whole distance that the freight is carried on the companies' trains, not just to that part of the journey which is within Scotland.
7.17 Origins and destinations of freight traffic:
7.17.1 Three points should be noted about the figures which have been provided by the rail companies for 1996-97 onwards:
281
NOTES & DEFINITIONS - RAIL SERVICES
(i) lifted within Scotland includes freight from abroad which arrives at a Scottish port (e.g. Hunterston) and is lifted from there by rail;
(ii) lifted outwith UK includes freight from abroad which was imported via ports in England and Wales (eg Teesside) and was then brought from there into Scotland by rail;
(iii) lifted within Scotland, delivered outwith UK includes freight which is delivered to a Scottish port (eg Leith) or to an English port (eg Southampton) for export
7.17.2 It follows that the figures in the tables for freight lifted or delivered outwith the UK cover much more than just rail traffic which goes through the Channel Tunnel.
7.17.3 There are no statistics available for freight lifted or delivered outwith UK in the years prior to 1996-97. In the figures that were produced for those years, traffic delivered by rail to ports for export was counted on the basis of the location of the port, and so was counted under either Scotland or elsewhere in the UK. Similarly, freight which was imported, and picked up by rail at a port, was counted on the basis of the location of the port. However, the figures that were produced for those years excluded any international freight traffic through the Channel Tunnel (for which freight services commenced in June 1994).
7.18 Other statistics
7.18.1 Railway Accidents: the statistics are of railway incidents statutorily reported under The Reporting of Incidents, Diseases and Dangerous Occurrences Regulations 1995 (RIDDOR). These regulations came into force on the 1 April 1996 and brought railway accident reporting in line with other industry accident reporting. The fatalities are classified by the former Region because those are the areas which are shown in the Rail Atlas which HM Railway Inspectorate uses to identify the locations of the fatalities. Due to an EU safety directive which came into force in 2006, railway accident statistics in table 7.19 and 7.20 have been changed from a financial year basis to a calendar year basis with effect from 2003.
Sources
7.19 Tables 7.1, 7.2, 7.3 (ScotRail figures) and 7.4 to 7.8 were supplied by the Office of Rail and Road, which produced the numbers of passenger journeys, and the associated revenue, from information held in the LENNON database. This records the number of tickets, and the associated revenue, for journeys between every pair of railway stations in Great Britain, and other information, such as estimates (which are sent to it by ScotRail) of the numbers of rail journeys which were made by holders of SPT's multi-modal Zonecard - for further details, please see the notes and definitions in Section 3. As indicated earlier, the ORR provided revised figures for 2003-04 and earlier years for Tables 7.1, 7.2 and H1. Some of the other tables include figures for 2003-04 and earlier years which appeared in previous editions, having been supplied by the former Strategic Rail Authority, which
282
NOTES & DEFINITIONS - RAIL SERVICES
derived them in a similar way. Table 7.6 in the 2012 publication is taken from the ORR National Rail Statistics, regional usage chapter. Note that the table showing travel between Local Authorities included in previous versions of STS has not been included in this publication as the methodology used to allocate journeys is being investigated. An updated version of the table will be included on the website in due course.
7.20 The SPT figures in Table 7.17, were compiled from information provided by the Strathclyde Partnership for Transport.
7.21 The rail punctuality (Public Performance Measure) figures in Table 7.9 and 7.10 were provided by the ORR. The punctuality of trains is generally recorded using automated monitoring systems, which log performance using the signalling equipment.
7.22 The rail passenger satisfaction survey figures in Table 7.11 were provided by Transport Focus. The survey is conducted by distributing self-completion questionnaires, with reply-paid envelopes, to about 700 stations across GB, which are selected to be representative of the entire network, including about 50 stations in Scotland. A few shifts are also conducted on train. The questionnaires are distributed at different times of the day and across different days of the week. There are two survey periods per year: Spring and Autumn. The overall response rate is about 31%. The data are weighted to represent the passengers using each operator's services. Data is weighted by journey purpose, station size and by weekend/weekday. Transport Focus publishes the results of the Spring and Autumn surveys separately, but has combined them for publication here, in order to provide annual figures.
7.23 Tables 7.12 and 7.13: the figures for 1996-97 and later years were prepared from information supplied by the rail freight companies.
7.24 Tables 7.14, 7.15 and 7.16 were compiled from information supplied by Network Rail.
7.25 Tables 7.18 and 7.19: figures for these tables were previously obtained from Office of Rail and Road. We have now changed the source to the RSSB to improve consistency with other official statistics.
7.26 Further Information
7.26.1 Rail statistics for Great Britain are available from the annual DfT publication Transport Statistics Great Britain and from the Office of Rail and Road's quarterly National Rail Trends. The fourth quarter edition of National Rail Trends also includes figures for individual Train Operating Companies and for Scotland, Wales and the regions of England. Figures for the 100 busiest stations are available on the ORR Web site http://orr.gov.uk/statistics/published-stats/station-usage-estimates - tel: 020 7282 2192/2196 or [email protected]. .
283
NOTES & DEFINITIONS - RAIL SERVICES
7.26.2 Passenger satisfaction figures from the National Rail Passenger Survey - contact David Greeno of Transport Focus (tel: 0300 123 0837).
7.26.3 Services supported and/or operated by Strathclyde Partnership for Transport (including Glasgow Subway) – Martin Breen of SPT(tel: 0141 333 3741).
7.26.4 Railway accidents – Peter Moran, Office of Rail and Road (tel: 0207 282 2074) email [email protected] .
7.26.5 Network Rail statistics - contact David Boyce (tel: 0141 555 4107).
7.27 Other data sources
Within Scottish Transport Statistics:
Chapter 11 - Personal Travel chapter (including travel to work)
Other Transport Scotland Publications:
Transport and Travel in Scotland – includes more detailed analysis of SHS data, in particular:
Table 28 - Frequency of bus and train use
Tables 29 and 30 - Views on local buses and trains
Scottish Household Survey Travel Diary – includes detailed tables using the Travel Diary dataset, in particular:
Table 2 - journeys by mode of transport
Table 2a - journey distance by mode of transport
Table 4a - mode of transport by journey distance
Table 5a - distance summary statistics by mode of transport
SHS Local Authority Results – provides breakdowns of SHS data by Local Authority, Regional Transport Partnership and Urban Rural Classification. In particular:
Table 16 – Proportion of journeys by mode of transport
Department for Transport publish the results of the National Rail Travel Survey which covers passenger journeys in Great Britain.
Office of Rail and Road publish a range of statistics for GB including National Rail Trends, which includes a section on regional usage providing data at Scotland level (some of which is replicated in this chapter). There is also a Data Portal available through the ORR website.
Non Official Statistics sources include rail service providers.
284
NOTES & DEFINITIONS - AIR TRANSPORT
Chapter 8 - Air Transport
8. Notes and Definitions
8.1 Aircraft Movement: an aircraft take-off or landing at an airport: one arrival and one departure are counted as two movements. Air transport movements are landings or take-offs of aircraft engaged in the transport of passengers or cargo on commercial terms. All scheduled service movements, whether loaded, empty or positioning; and charter movements transporting passengers or cargo and air taxi movements are included.
8.2 Types of passenger: a terminal passenger is one who joins or leaves an aircraft at the reporting airport, excluding passengers carried on air taxi charter services. A passenger travelling between two reporting airports is counted twice, once at each airport. There are two types of terminal passenger: terminating passengers, who arrive or depart at the airport by a surface means of transport; and transfer passengers, who change aircraft at the airport. A transit passenger is one who arrives at and departs from a reporting airport on the same aircraft which is transiting the airport. Each transit passenger is counted once only.
8.3 Freight: the weight of property carried out on an aircraft including, for example the weight of vehicles, excess baggage, and diplomatic bags, but excluding mail and passengers’ and crews’ permitted luggage. Freight carried on air taxi services and in transit through the airport on the same aircraft is excluded.
8.4 International Services: Services to and from Scotland from places outside the UK, Isle of Man and Channel Islands.
8.5 International and Domestic Destinations: the figures in Tables 8.2 to 8.7 are based on the origin and destination of passengers as reported to UK airport authorities by the airport handling agent. Operators are required to report in respect of each service operated, the point of uplift and discharge of each passenger. The figures may not reflect a passenger's entire air journey: the point at which a passenger disembarks from a particular service may not represent his ultimate destination. In some cases the actual point of uplift or discharge is not recorded. In such cases all passengers are allocated to the end point of the service, i.e. the aircraft's origin or ultimate destination. The figures include all passengers carried on scheduled and chartered services excluding those charter passengers carried on air taxi service and passengers carried on aircraft chartered by Government Departments. In Tables 8.3 and 8.4, international traffic figures are given for each country for which scheduled traffic was reported until and including 2004 data. In cases where charter only routes carried fewer than 5,000 passengers, the countries concerned may not appear separately in Table 8.3, and may be shown under “Other international traffic” in Table 8.4. All non- air taxi is recorded individually.
285
NOTES & DEFINITIONS - AIR TRANSPORT
8.6 Air punctuality statistics
8.6.1 These statistics cover both arrivals and departures. They relate solely to punctuality at the specified airport. For example, the information which is used about flights from Edinburgh relates only to the punctuality of their departure, so the statistics take no account of any subsequent delays before landing at, say, London. Similarly, the information which is used about arrivals at Edinburgh relates only to the time of arrival (no allowance is made for whether or not the flight departed on time from the airport of origin).
8.6.2 The calculations cover those flights for which information about the planned and the actual times of operation has been matched - for example, cancelled flights, and flights which are diverted to or from another airport, are excluded (the numbers of such flights are included in the figures which are given for unmatched flights).
8.6.3 The percentages early to 15 minutes late would probably be lower, and the average delays would probably be higher, if these statistics were calculated in the same way as the rail punctuality statistics (the latter are based on the time of arrival at the destination, and take account of cancellations).
8.6.4 All cargo and air taxi services are excluded.
8.6.5 Unmatched actual flights are air transport movements which actually took place at the airport, but for which no corresponding planned flight was found. There may be a number of reasons for this, such as:
the flight was a diversion from another airport; the flight was a short-haul flight more than one hour before the planned time; the flight was planned to take place in the previous month; errors in, or omissions from, the records of Airport Coordination Ltd (ACL) or the
airport.
8.6.6 Unmatched planned flights are those which were reported in data supplied by ACL, but for which no corresponding air transport movement return has been found. There may be a number of reasons for this, such as:
the flight was diverted to another airport; the flight was cancelled; the planned time was for a short-haul flight more than one hour after the flight; the flight took place in the following month; errors in, or omissions from, the records of ACL or the airport.
8.6.7 Average delays: the averages relate to all flights – not just to the ones which were delayed. With effect from January 2000, flights which are early are counted as
286
NOTES & DEFINITIONS - AIR TRANSPORT
zero delay; prior to that they were counted as a negative delay. As a result, the average delays for 2000 onwards are not directly comparable with the figures for 1999 and earlier years. This accounts for the whole of the apparent increase in the averages for Glasgow for 2000: when the Civil Aviation Authority (CAA) recalculated the averages for 1999 on the current basis, it found that they would be two minutes more than when calculated on the original basis. A similar recalculation using the data for Edinburgh for 1999 suggested that the change had no effect on its averages, when these were rounded to the nearest whole minute.
8.6.8 Taxi-ing time: the CAA changed its assumption for the taxi-ing time for Edinburgh airport departures from 5 minutes to 10 minutes with effect from the start of 2001. As a result, the punctuality and average delay figures for Edinburgh for 2001 onwards are not on the same basis as the figures for 2000 and earlier years. However, when the CAA recalculated the figures for Edinburgh for 2000 on the current basis, it appeared that this change did not affect the averages or the percentage early or within 15 minutes, when these were rounded to the nearest whole number.
8.7 Route Development Fund
8.7.1 The Route Development Fund (RDF) formally ended on 31 May 2007 and has not been replaced. It has not proved possible to introduce a replacement route development scheme within the constraints imposed by the European Commission. However, the Scottish Government continues to work with airlines and airport operators on the development of new international air routes which improve business connectivity, encourage inward investment and make Scotland more accessible for inbound tourism. As Table 8.16 that was included in previous publications can no longer be updated it has been removed. Versions of the table and information about the RDF can be found in previous editions including STS 2011.
8.8 Survey of passenger characteristics
8.8.1 International and domestic passengers: a passenger is classified as domestic if his/her flight is between two points which are within the UK or the Channel Islands).
8.8.2 Business and leisure journeys: the business category includes purposes such as meetings with customers, conferences, trade fares, armed services and airline staff, studies paid for by an employer, overseas employment, etc. The leisure category includes holidays, visiting friends or relatives, migration, culture, sport, study (not paid for by an employer), etc.
8.8.3 UK and Foreign passengers: a passenger is classified as a UK resident if the UK is the country in which he/she has lived for most of the last twelve months.
287
NOTES & DEFINITIONS - AIR TRANSPORT
8.8.4 Mode of transport: this is the mode of surface transport that was used to arrive at the airport - so, in cases where the journey involved the use of more than one mode of transport, it may not be the mode used for the majority of the journey.
8.8.5 Origins and destinations of terminating passengers: when analysing the results of the survey, the CAA used the former Regions for Scottish origins and destinations. The interviewer asks where did you start your journey to catch this flight?. In cases where the answer is not the person's home, the interviewer asks whether it was a transit stop - i.e. somewhere the traveller chose to break the journey to the airport (e.g. an airport hotel prior to an early morning flight, calling in on or staying with relatives, stopping somewhere to rest or for a meal, etc) - and, if it was a transit stop, asks for the proper origin of the journey.
Sources
8.9 Tables 8.1 to 8.13 are compiled from information supplied by the Civil Aviation Authority (CAA).
8.10 Air punctuality statistics
8.10.1 These statistics are prepared by the CAA with the co-operation of the airport operators and Airport Coordination Ltd (ACL). They are produced for Edinburgh, Glasgow and some other UK airports. The first year for which information is available varies from airport to airport: for example, figures for Edinburgh are only available from April 1996, so it is not possible to provide figures for Edinburgh for 1996 as a whole, or for any earlier years.
8.10.2 The actual times of flights' wheels on/off the runway are derived from flight air transport movement returns made by airports to the CAA. The planned times, which relate to arrival/departure from the stand, and include changes made up to 24 hours beforehand, are supplied by ACL. The CAA also uses assumptions about taxi-ing time - currently these are:
Edinburgh: arrivals - 5 minutes; departures - 10 minutes; Glasgow: arrivals - 5 minutes; departures - 10 minutes
The CAA matches the two sets of data and resolves any obvious mismatches. For example, if an airline appears to operate a series of flights significantly off slot, the CAA will substitute information from published timetables, where these are available, in place of the ACL slot. The statistics are then calculated from the information for those flights for which the data have been matched - so cancelled flights, and flights which are diverted to or from another airport, are excluded from the calculations.
288
NOTES & DEFINITIONS - AIR TRANSPORT
8.11 Survey of passengers
8.11.1 Tables 8.14 to 8.16 were prepared using figures from the Civil Aviation Authority's Passenger Survey reports.
8.11.2 The survey only includes Scottish airports in some years: most recently 2013, and prior to that 2009. Only departing passengers are interviewed, as previous surveys found no significant differences between the characteristics of arriving and departing passengers. The information collected includes: the purpose, origin, destination and type of ticket used for the journey; the age-group, income band, job title and other details needed to determine the socio-economic group of the passenger; the number of people in the party, whether the traveller was accompanied to the airport, and whether the person has flown before; etc.
8.11.3 Each month's sample is weighted, using information on routes and destinations, to gross up the results to the actual level of traffic. The weighting factors therefore vary, but generally, a single survey interview will be weighted in such a way as to represent around 1,000 actual passengers.
8.12 Further Information
8.12.1 Further information on UK civil aviation is available from the Civil Aviation Authority’s regular publications, from Mrs D McLean of the CAA Data Unit (tel: 0207 453 6258 or e-mail [email protected] ), and from the CAA Economic Regulation Group's website: http://www.caa.co.uk/default.aspx?catid=80&pagetype=90. For example, the CAA website includes:
a wide range of tables of monthly and annual statistics about airports, including the kinds of figures which appear in Tables 8.1 to 8.13 and much other information besides;
detailed tables of punctuality statistics, which give figures separately for each operator on each route, for each month and for each year as a whole, for Edinburgh, Glasgow and some other UK airports;
detailed reports of the results of the surveys of passengers, which include tables analysing them by purpose of journey, type of service, type of passenger, origin/destination, age-group, income band, socio-economic group, type of business, etc.
8.12 Other data sources
Within Scottish Transport Statistics:
Chapter 3 - Freight includes comparison across freight modes.
Chapter 11 - Personal Travel chapter includes data on visits abroad
Department for Transport produce a number of related publications but most come from the Civil Aviation Authority, see section 5.
289
NOTES & DEFINITIONS - WATER TRANSPORT
Chapter 9 - Water Transport
9. Notes and Definitions
9.1 The change in the Department for Transport's method of compiling statistics of port traffic with effect from 2000
9.1.1 A new data collection system for maritime traffic was introduced with effect from 2000. As a result, some data for 2000 onwards are not directly comparable with previous years. The reason for the change was to comply with a new EC Maritime Statistics Directive (Council Directive 95/64/EC on statistical returns in respect of the carriage of goods and passengers by sea).
9.1.2 One of the effects of this change is that some data for 2000, principally coastwise and one-port crude oil traffic, and the inland waters penetration of such traffic, are not directly comparable with information for previous years. However, the overall totals are unaffected.
9.1.3 Previously, all freight information was collected from ports annually. Major ports (generally those with cargo volumes of at least 2 million tonnes a year) were asked for detailed information on weight of traffic in and out of their ports, identifying cargo categories (eg liquid bulks, dry bulks, containers, Roll-on-Roll-off etc), and whether they were foreign, coastwise or one port cargoes. Other (minor) ports were required to provide only total weight of cargo inwards and outwards.
9.1.4 In the new collection system, most of the detailed freight information is collected from shipping lines, operators or shipping agents, which are required to supply detailed returns of their inwards and outwards traffic at each major port for each ship, on each route. Major ports (now defined as those with at least 1 million tonnes of cargo a year) are only required to supply summary information (for use as control totals) while other (minor) ports continue to provide just the total weight of cargo inwards and outwards.
9.1.5 One difference between the data from 2000 and previous years affects both coastwise and one-port crude oil estimates from 2000. The new collection arrangements produce much more reliable data on origins and destinations and (when aggregated) coastwise, one-port and foreign traffic summaries. Previously, this information was estimated by ports, with varying degrees of accuracy, particularly for crude oil traffic, which means that origins and destinations for crude oil data in 1999 and earlier years are approximate only, e.g. ports or refinery operators would not necessarily have been able to tell if crude oil was shipped directly from the UK offshore installation, or piped to a land terminal such as Sullom Voe and then shipped out from the land terminal, or if it was imported from a North Sea country or another foreign crude oil producer. As a consequence, it is likely that
290
NOTES & DEFINITIONS - WATER TRANSPORT
pre-2000, coastwise crude oil estimates were overestimated and one-port traffic correspondingly underestimated. This leads to the figures for coastwise traffic lifted in Scotland falling substantially in 2000 compared with 1999.
Definitions
9.2 Coastwise traffic: traffic between ports of the United Kingdom, excluding traffic between a UK port and either the sea bed or an off-shore installation. It should be noted that Table 9.1(a) covers only freight lifted in Scotland, and therefore its figures for coastwise traffic exclude cargoes arriving from other UK ports; Table 9.1(b) covers freight discharged in Scotland, so includes cargoes arriving from other UK ports (including those elsewhere in Scotland).
9.3 One port traffic: traffic between the sea bed or an offshore installation and a UK port. For example, it includes traffic to and from offshore installations, materials shipped for dumping at sea, and dredged sand and gravel etc landed at a port for commercial purposes. The disappearance of the sea dumped traffic is due to the end of sewage dumping at sea. It should be noted that Table 9.1(a) covers only freight lifted in Scotland: Table 9.1(b) contains figures for the one port traffic arriving from offshore installations and any incoming sea dredged aggregates. The reason for the increase in one-port oil traffic is due to increased number of crude oil shipments into Sullom Voe and Flotta, particularly from the newer Atlantic fields west of the Shetlands, Schiehallion and Foinaven.
9.4 Domestic traffic: in the statistics of traffic through the ports, domestic traffic comprises coastwise traffic plus one port traffic.
9.5 Foreign traffic: traffic between ports in the United Kingdom and other countries.
9.6 Inland waterways: in general, waterways bounded by the furthest point downstream which is fewer than both 3 km wide at low tide and 5 km wide at high tide (spring). However, this definition is not applied strictly: for example, the definition is relaxed, where necessary, in order not to count, as inland waterway traffic, short-haul shipping movements of foreign and coastwise traffic, such as all sea-going traffic to or from major seaboard ports.
9.7 Inland waters traffic: subdivides into coastwise, one port and foreign (in each case, that part of the traffic that is carried upstream of the inland waters boundary, excluding short haul inland movements of sea-going traffic) and internal (i.e. not sea-going) traffic. All passenger and passenger vehicle ferry services are excluded, such as crossing movements (e.g. Gourock-Dunoon) and coastwise ferries entering sheltered waters (e.g. Loch Ryan, on services between Stranraer or Cairnryan and Northern Ireland).
291
NOTES & DEFINITIONS - WATER TRANSPORT
9.8 Tonne-kilometres: where part of a voyage is on an inland waters and part is at sea, account is taken of the inland waterway boundary, so that, in the case of traffic involving inland ports, there is no double-counting of tonne-kilometres between the figures for inland waters and the figures for coastwise, one port and foreign traffic. (This is in contrast to the double-counting of some of the figures for tonnage - for example, if a voyage to another UK port starts on a Scottish inland waterway in Scotland, the tonnage would be counted in the figures for both inland waters and coastwise traffic.)
9.9 Container and roll-on traffic: includes all traffic carried on special container and roll-on vessels, as well as the container traffic carried on conventional services.
9.10 Main Freight Units comprise containers, road goods vehicles, unaccompanied trailers, rail wagons, shipborne port to port trailers and shipborne barges only.
9.11 Ferry Routes within Scotland. The Scottish Government subsidises the principal operators of the Clyde and Hebrides ferry services (operated by CalMac Ferries Ltd), the Gourock – Dunoon passenger ferry service (operated by Argyll Ferries Ltd) and the Northern Isles (Orkney and Shetland) ferry services (operated by Serco NorthLink Ferries and Shetland Line 1984 Ltd). The companies providing most of the services, CalMac Ferries Ltd and Argyll Ferries Ltd, are part of the David MacBrayne Limited group. The following Local Authorities fund a number of ferry services: Orkney Islands Council, Shetland Islands Council, Highland Council and Argyll & Bute Council. Other services are privately operated.
9.12 Road Equivalent Tariff (RET): The Road Equivalent Tariff (RET) scheme involves setting ferry fares on the basis of the cost of travelling an equivalent distance by road - Ministers have announced the Scottish Government’s intention to:
continue RET as a permanent feature on the Western Isles, Coll and Tiree for passengers and cars, including small commercial vehicles and coaches
replace RET for larger commercial vehicles on the Western Isles, Coll and Tiree, with an enhanced pre-RET discount scheme
roll out a further RET pilot for passenger and cars including small commercial vehicles and coaches to Colonsay, Islay and Gigha from October 2012
roll out a further RET pilot for passenger and cars including small commercial vehicles and coaches to Arran from October 2014
roll out RET to other West Coast and Clyde islands within the term of this Parliament.
RET was introduced in the following routes in 2008: Oban-Castlebay-Lochboisdale; Oban-Coll/Tiree; Oban-Coll/Tiree/Castlebay; Uig-Tarbert-Lochmaddy; and Ullapool-Stornaway. RET was introduced to the following routes in 2012: Kennacraig-Islay, Kennacraig- Islay/Colonsay/Oban; Oban-Colonsay; and Tayinloan-Gigha.
292
NOTES & DEFINITIONS - WATER TRANSPORT
9.13 Persons assisted: Coastguard statistics relating to persons given assistance do not include people who are rescued.
Sources
9.14 Most of the data in this section is supplied by the Department for Transport (DfT). The Scottish Government obtains shipping service information from Caledonian MacBrayne, Western Ferries, Northlink Ferries, Orkney Ferries, Shetland Island Council and some of the other operators of shipping and ferry services.
9.15 Waterborne Freight Lifted in Scotland (Table 9.1)
9.15.1 Statistics of waterborne freight (coastwise traffic, one port traffic and inland waters traffic) are compiled by MDS-Transmodal Ltd under contract to the Department for Transport.
9.15.2 A number of data sources are used to determine the level of coastwise traffic, including the tonnage of goods reported in the port traffic statistics, (see below) and other surveys, and information about vessel movements. (The vessel movement data include the Northern Ireland, Orkney and Shetland ferry services, but exclude ferries operated by Caledonian MacBrayne and others in and around the Western Isles.) The pattern of coastwise shipping flows, by port and commodity group, is represented by origin and destination matrices, and combined with Admiralty information about the distances between ports. Where appropriate, account is taken of the inland waters boundary, so that there is no double-counting of tonne-kilometres between inland waters and coastwise shipping, in the case of traffic involving inland ports. The method which is used to derive the statistics of coastwise shipping involves some adjustments and reclassifications. As a result, the totals that it produces do not match the port traffic statistics for reasons which are described in the DfT Statistical Bulletin Waterborne Freight in the United Kingdom.
9.15.3 The principal sources for the statistics of one-port traffic are the port statistics (see section 9.16 below) and information about the distances between the ports and the at sea origins and destinations of the traffic, such as offshore installations and dumping grounds.
9.15.4 The sources of the inland waterway statistics are described in section 9.17 below.
9.16 Traffic at Scottish Ports (Tables 9.2 to 9.9)
9.16.1 A new system for collecting detailed port traffic statistics was introduced in 2000 to comply with the requirements of an EC Maritime Statistics Directive. Annual
293
NOTES & DEFINITIONS - WATER TRANSPORT
traffic returns are made by shipping lines or their agents and port authorities. This information has been used to derive data on coastal and one-port traffic, and on the inland waters penetration of such traffic. From 1 January 2000, shipping lines or their agents are required to supply detailed statistics of foreign, coastwise and one-port traffic for all cargoes loaded or unloaded at major UK ports. Major ports are now defined as those ports with cargo volumes of at least one million tonnes in the previous year, plus a few smaller ports. The major ports handled 97 per cent of total port traffic in 2000. In addition, port authorities at the major ports are required to supply inwards and outwards control totals for each cargo category. For all other ports, the port authorities are required to supply just two figures: total inwards and total outwards traffic. The lack of detailed statistics for these minor ports means that a degree of approximation is required in the statistics for their traffic. For more details about the new data collection system, see DfT's publication ‘Maritime Statistics’
9.16.2 For 1999 and earlier years, the port traffic statistics were produced, for the most part, from the records made by each port authority of the dues levied on goods passing through the port (supplemented, in some cases, by figures supplied by others).
9.16.3 From 1995 to 1999, the smaller ports (then defined as, generally, those with fewer than 2 million tonnes of traffic per year) were not required to supply detailed statistics - they provided only two figures, their inwards and outwards traffic. Full details of freight traffic were collected only for those ports with at least 2 million tonnes of cargo in the previous year (and for a few ports with less traffic): these were called the ‘major’ ports. In the 1995 and 1996 surveys, there were seven ‘major’ ports in Scotland: Aberdeen, Clyde, Cromarty Firth, Forth, Glensanda (on Loch Linnhe, south-west of Fort William, which exports crushed granite, which is classified in the statistics as crude minerals), Orkney, and Sullom Voe. In the 1997 and 1998 surveys, there were eight: these seven plus Cairnryan, which was counted as a major port because its 1996 return of its inwards and outwards totals had shown that its traffic exceeded 2 million tonnes in 1996. In 1999 the number of 'major' ports increased from eight to nine, since total traffic at Peterhead had exceeded 2 million tonnes in 1998. In 2000, with the introduction of the new definition of a major port (at least 1 million tonnes), Stranraer and Dundee became major ports, bringing the total in Scotland to 11.
9.17 Inland Waterways (Tables 9.10 and 9.11)
9.17.1 Statistics for internal traffic (ie traffic which is wholly within inland waters) are collected directly by DfT's contractor, MDS-Transmodal, from all known operators using personal interviews and postal questionnaires, supplemented by statistics from British Waterways collected primarily for toll levying purposes. Some information is also drawn from Maritime Statistics Directive returns where traffic is classified as internal movements and these traffic movements are then excluded from other traffic estimates to avoid duplication. For traffic moving to and from the open sea, the figures for inland waterway tonne-kilometres are calculated using information about
294
NOTES & DEFINITIONS - WATER TRANSPORT
the distances from each inland waterway boundary to the ports and wharves which are upstream of the boundary.
9.18 Shipping Services (Tables 9.12 to 9.17)
9.18.1 Transport Scotland obtains shipping service information from DfT (in respect of the services between Scotland and Northern Ireland, the Rosyth/Zeebrugge and Lerwick/Europe routes). Transport Scotland writes directly to Caledonian MacBrayne, Western Ferries, Northlink Ferries, Orkney Ferries, Shetland Island Council and the other major ferry operators in Scotland for the required information.
9.19 HM Coastguard Statistics (Table 9.18)
9.19.1 Statistics on search and rescue operations are obtained from the Maritime and Coastguard Agency.
9.20 Further Information
9.20.1 UK water transport statistics can be found in the annual DfT publications Maritime Statistics, Waterborne Freight in the UK and Transport Statistics Great Britain.
9.20.2 Water freight transport statistics, and figures for Scotland/Northern Ireland, the Rosyth/Zeebrugge and Lerwick/Europe routes - Maritime Statistics Branch of DfT ([email protected] Tel: 0207 944 4131).
9.20.3 Passengers and vehicles carried on ferry services within Scotland - Andrew Knight, Transport Scotland Transport Statistics Branch (tel: 0131 244 7256).
9.20.4 Punctuality of lifeline ferry services - Transport Scotland Transport Group: Douglas Ellis (CalMac figures) on 0141 272 7431 and Paul Linhart-macaskill (NorthLink figures) on 0131 244 5312.
9.20.5 HM Coastguard statistics - Kate Skinner, Maritime and Coastguard Agency (tel: 0203 8172022)
9.21 Other data sources
Within Scottish Transport Statistics:
Chapter 3 - Freight,
Chapter 12 – International Comparisons (including water freight)
Other Transport Scotland Publications:
A relatively small number of ferry journeys compared to other modes means little data is available from the SHS.
Department for Transport produce a number of related publications, including:
Port statistics
Non Official Statistics sources
Transport Scotland – Scottish Ferry Services: Ferries Plan (2013-2022)
Ferry operators
295
NOTES & DEFINITIONS - FINANCE
Chapter 10 - Finance
10. Notes and Definitions
10.1 Following local government reorganisation on 1 April 1996, the management and maintenance of motorways and other trunk roads was sub-divided into 8 operating units. These applied for the years from 1996-97 to 2000-01 inclusive. New arrangements were introduced with effect from 2001-02 which resulted in 4 Operating Companies maintaining the trunk road network. The introduction of 3rd Generation Contracts for Trunk Road Maintenance in April 2006 and 2007 means there are now 3 Operating Companies. Details of the areas covered by each of these companies can be found in the Annex.
10.2 Local authority trading services: Those services of a commercial nature which are, or could be, substantially financed by charges made to recipients of the services.
10.3 In a few cases, negative figures are shown in the net expenditure tables. This is due to income/receipts exceeding the expenditure in a particular category.
10.4 Retail Prices Index: Rail fares are 5 parts per 1,000 (or 0.5%) of the Retail Prices Index. Bus and coach fares are also 5 parts per 1,000 (or 0.5%). 'Motoring costs' accounts for 14.6% of the Retail Prices Index. This breaks down into:
6.2% Purchase of vehicles (CHBK)
2.2% Maintenance of motor vehicles (DOCT)
3.8% Petrol and Oil (DOCU)
2.4% Tax and Insurance.(DOCV)
Car parking charges are included under 'Maintenance of motor vehicles'.
10.5 Resource Accounting and Budgeting (also known as Accruals): Under resource accounting income is shown when it is earned, and costs are shown when they are incurred, the timing of the cash movement is irrelevant. The costs of a capital asset are spread ('depreciated') evenly over its useful life. A capital charge was also made against the value of capital assets until 2009-10.
10.6 Cash Accounting: Income is shown when money is received, and costs are shown when payment is made. All receipts and payments made in a financial year are included in the cash accounts for that period. The whole cost of a capital asset is recorded when it is bought.
296
NOTES & DEFINITIONS - FINANCE
Sources & Further Information
10.7 The statistics in this chapter come from the following sources:
Table 10.1(upper half) - Building a Better Scotland: Spending Proposals 2003-2006 and Scotland’s Budget Documents 2006-07: Budget (Scotland) (No.3) Bill Supporting Document – roads contact Paul McHugh, Transport Scotland (tel: 0141 272 7932) and rail contact Elaine McAtamney, Transport Scotland (tel: 0141 272 7455)
Tables 10.1(lower), 10.3 to 10.5 - from returns by Councils and boards to The Scottish Government - contact Louise Cuthbertson (tel:0131 244 7033) or email: [email protected] .
Tables 10.2 - Transport Scotland Trunk Roads Network Management. Contact Ross Williamson, Transport Scotland (tel: 0141 272 7932)
Tables 10.6 - The Department of Energy and Climate Change. Contact Susan Lomas (tel: 0300 068 5047).
Table 10.7 - http://www.ons.gov.uk/ons/rel/cpi/consumer-price-indices/index.html Table 42. - (tel: 0207 533 5845)
Table 10.8 - The Office for National Statistics Family Spending publication, http://www.ons.gov.uk/ons/rel/family-spending/family-spending/family-spending-2011-edition/index.html table A35 – (tel: 0207 533 5756).
10.8 Other data sources
As well as the data sources listed above, data on spend by UK Government can be found on the HM Treasury web pages.
297
NOTES & DEFINITIONS - PERSONAL AND CROSS-MODAL TRAVEL
Chapter 11 - Personal and Cross-Modal Travel
11. Notes and Definitions
11.1 Scottish Household Survey (SHS)
11.1.1 Annual net household income: this is the net income (i.e. after taxation and other deductions) which is brought into the household by the highest income householder and/or his/her spouse or partner, if there is one. It includes any contributions to the household finances made by other members of the household (e.g. dig money). In the case of households for which any of the main components of income were not known (for example, because of refusal to answer a question), the SHS contractors imputed the missing amounts, using information that was obtained from other households that appeared similar.
11.1.2 SHS urban / rural classification: the urban / rural classification shown in some tables was developed for use in analysing the results of the SHS. It is based on settlement size, and (for the less-populated areas) the estimated time that would be taken to drive to a settlement with a population of 10,000 or more. Each postcode in Scotland was classed as either urban or non-urban, then clumps of adjacent urban postcodes, which together contained more than a certain total number of addresses, were grouped together to form settlements. Six categories were then defined:
Large urban areas - settlements with populations of 125,000 or more. These are around - but not the same as - Aberdeen, Dundee, Edinburgh and Glasgow. This category may (a) include areas outwith the boundaries of these four cities, in cases where a settlement extends into a neighbouring local authority, and (b) exclude some non-urban areas within the boundaries of these four cities.
Other urban areas - other settlements of population 10,000 or more. Accessible small towns - settlements of between 3,000 and 9,999 people,
which are within 30 minutes’ drive of a settlement of 10,000+ people. Remote small towns - settlements of between 3,000 and 9,999 people,
which are not within 30 minutes’ drive of a settlement of 10,000+ people. Accessible rural areas - settlements of fewer than 3,000 people, which are
within 30 minutes’ drive of a settlement of 10,000+ people. Remote rural areas - settlements of fewer than 3,000 people, which are not
within 30 minutes’ drive of a settlement of 10,000+ people.
11.1.3 Full driving licence and frequency of driving: the SHS asks whether the person currently holds a full driving licence (car or motorcycle). For those who are said to hold a licence, the SHS asks how often the person drives nowadays. The interviewer records whichever of the categories shown in the table is the most appropriate, in the light of the answer. Prior to April 2003, these questions were
298
NOTES & DEFINITIONS - PERSONAL AND CROSS-MODAL TRAVEL
asked of the head of the household, or his or her spouse/partner, about each adult member of the household. Since April 2003, these questions have been asked of a randomly-selected adult member of the household about themselves. Hence, results for previous years may not be entirely comparable with results for 2003 onwards.
11.1.4 Frequency of walking: the SHS asks on how many of the last seven days the person made a trip of more than quarter of a mile by foot. The interviewer asks about walking for the purpose of going somewhere, such as work, shopping or to visit friends. The interviewer then asks about walking just for the pleasure of walking or to keep fit or to walk the dog.
11.1.5 Frequency of cycling: the SHS asks on how many of the last seven days the person made a trip of more than quarter of a mile by bicycle. The interviewer asks about cycling for the purpose of going somewhere, such as work, shopping or to visit friends. The interviewer then asks about cycling just for the pleasure or to keep fit.
11.1.6 Sampling variability: as with the NTS, the SHS is a sample survey so results will be subject to sampling variability. More information including a look up table to calculate confidence intervals can be found in the background section of the Transport and Travel in Scotland or SHS: Travel Diary publications.
11.2 International Passenger Survey
11.2.1 The International Passenger Survey is designed to be representative of all people travelling in and out of the UK in terms of: the usage of air, sea and tunnel; UK residents going abroad and foreign residents coming to the UK; different types of traveller (e.g. holiday, business, etc); and travel to and from different parts of the world. However, it is not designed to produce results which are representative for different regions of residence within the UK. While the survey's procedures should not lead to any major bias in the estimates for Scottish residents, the sample-based nature of the survey may result in their being over-represented in the survey in some years, and under-represented in other years.
11.2.2 Visits abroad: The figures include all tourists who make trips which last no more than a year, those travelling to Eire have been included in the IPS since 1999.
11.2.3 Miscellaneous and other purposes: includes visits for study, to attend sporting events, for shopping, health, religious or other purposes, and multi-purpose visits for which no one purpose predominates.
299
NOTES & DEFINITIONS - PERSONAL AND CROSS-MODAL TRAVEL
11.2.4 Area visited: in cases where two or more countries are visited, a person is counted on the basis of the one country in which he or she stayed for the longest time.
11.3 Inter-zonal trips made on an average weekday - the Transport Model for Scotland (TMfS)
11.3.1 These are the estimated annual average numbers of trips made per weekday between or within the areas shown, using the specified modes of transport (for example, they do not include trips made by foot, by bicycle, or by motorcycle). The figures represent the estimated total flows over the whole 24 hours of an average weekday. A return journey, from A to B and back again, on the same day, would be counted as two trips: one from A to B and one from B to A.
11.3.2 The figures are estimates of the numbers of inter-zonal trips - i.e. trips which cross the boundary of at least one of the zones used in the Transport Model for Scotland (TMfS). The zones used in the model are constructed by amalgamating Population Census output areas. The model's zones vary in size from area to area, depending on factors such as the size and density of the population and the nature of the transport network that the model must represent. As a result, there is no simple definition of a zone. Some Council areas have many zones (e.g. there are 180 in Edinburgh, and 239 in Glasgow); others have only a few (e.g. there are 10 in East Lothian, 11 in Midlothian and 21 in West Lothian). It follows that a trip of a particular length will be more likely to be counted as an inter-zonal trip if it is in (say) Edinburgh than if it is in (say) East Lothian.
11.3.4 Person trips relate to the number of people travelling by the specified modes of transport, and vehicle trips to the numbers of vehicles going between the specified areas. Thus, for example, if a car containing two people goes from A to B, it is counted as two person trips and one vehicle trip.
11.3.5 The areas identified in the table are sectors within TMfS. These correspond broadly (but not necessarily exactly) to the Strategic Development Planning areas or current Councils. Some of these sectors do not contain many TMfS zones - for example, the Borders sector contains 11 zones, and the Perth & Kinross sector contains 23 zones. All else being equal, the larger the zones are within a sector, the smaller the proportion of the trips within the sector that will be treated as inter-zonal trips - and, hence, the smaller the proportion that will be represented within the model.
11.3.6 Elsewhere in Scotland refers to those parts of Scotland not identified in other sectors: broadly, Argyll & Bute, Eilean Siar, Highland, Moray, Orkney Islands, and Shetland Islands.
300
NOTES & DEFINITIONS - PERSONAL AND CROSS-MODAL TRAVEL
11.3.7 The estimated average number of trips originating in an area usually differs from the estimated number with a destination in that area - for example, compare the estimates of 111,000 person trips with a destination in Dumfries & Galloway and 112,000 trips originating in Dumfries and Galloway. This is because the estimation process (which is described in section 11.8) is mainly based upon survey data covering the 7 a.m. to 7 p.m. period, and cannot take full account of trips which involve returning later in the evening. Therefore, the TMfS-based estimates indicate broadly the levels of flows within Scotland, but do not provide precise measures.
11.3.8 The model's estimates of the number of cross-border trips by bus and train may not be particularly reliable, because of the way that they are produced.
Sources
11.4 Scottish Household Survey - Frequencies of driving, walking and cycling; and usual main methods of travel to school and travel to work (Tables 11.10 to 11.13 and 11.17 to 11.19 and 11.21 to 11.23)
11.4.1 Information on these and some other transport-related topics is collected by the Scottish Household Survey, which started in February 1999. The SHS collects information on a wide range of topics, to allow exploration of the relationships between different sets of variables. Interviewing takes place throughout the year.
11.4.2 The SHS is a survey of private households. For the purposes of the survey, a household is defined as one person or a group of people living in accommodation as their only or main residence and either sharing at least one meal a day or sharing the living accommodation. A student's term-time address is taken as his/her main residence, in order that he/she is counted where he/she lives for most of the year. The sample was drawn from the Small User file of the Postcode Address File (PAF) which does not include many nurses’ homes, student halls of residence, hostels for the homeless, other communal establishments, mobile homes, and sites for travelling people.
11.4.3 Each year, SHS interviews are conducted with a randomly-chosen sample of (on average) over 15,000 households across Scotland. Within each Council area, the sample is stratified using a geo-demographic indicator in order that it will be representative across that Council's area. A higher sampling fraction is used in the areas of the Councils with the smallest populations, in order that (in each two-year period) there is a minimum of 550 household interviews per Council. The results are then reweighted so that they will be representative of Scotland as a whole.
11.4.4 The SHS interview is conducted in two parts. The first part is with the highest income householder, or his/her spouse/partner (if any), who answers questions about the household and its members. This provides household members’ age and gender , and the annual net household income. Prior to April 2003, it
301
NOTES & DEFINITIONS - PERSONAL AND CROSS-MODAL TRAVEL
included questions about the type of driving licence (if any) held by each adult member of the household, and the frequency of driving. Main method of travel to school was also collected (for one randomly-chosen schoolchild member of the household). As the information is collected for one schoolchild per household, proportionately greater weight is given to cases with greater numbers of schoolchildren in the household.
11.4.5 The second part of the SHS aims to obtain results which are representative of Scottish adults by interviewing a randomly-chosen adult (aged 16+) member of the household (who may happen to be the person who answered the questions in the first part of the interview - for example, this is always the case for single pensioner households). This part has fewer respondents as not all randomly-chosen adults are available. Information on the frequency of walking, place of work , usual method of travel to work etc are collected Questions are also asked about journeys made on the previous day (the Travel Diary). These include the start and end times of each stage of the journey, the mode of transport used, the purpose of the journey, and experiences of congestion. As one adult is interviewed per household, proportionately greater weight is given to cases with greater numbers of adults in the household. For the Travel Diary questions, further weighting is given according to the day of the week and the economic status of the adult.
11.4.6 Although the SHS's sample is chosen at random, respondents will not necessarily be a representative cross-section of the people of Scotland. E.g. the sample could include disproportionate numbers of certain types of people, in which case the survey's results would be affected. In general, the smaller the sample from which an estimate is produced, the greater the likelihood that the estimate could be misleading. SHS publications (see sections 11.10 and 11.11) provide examples of the 95% confidence limits for estimates of a range of percentages calculated from sub-samples of a range of sizes.
11.4.7 The above information relates only to sampling variability. The survey's results could also be affected by non-contact / non-response bias: the characteristics of the (roughly) one-third of households who should have been in the survey but who could not be contacted, or who refused to take part, could differ markedly from those of the people who were interviewed. If that is the case, the SHS's results will not be representative of the whole population. Without knowing the true values (for the population as a whole) of some quantities, one cannot be sure about the extent of any such biases in the SHS. However, comparison of SHS results with information from other sources suggests that they are broadly representative of the overall Scottish population, and therefore that any non-contact or non-response biases are not large overall. Of course, such biases could be more significant for certain sub-groups of the population. In addition, because it is a survey of private households, the SHS does not cover some sections of the population - for example, it does not collect information about many students in halls of residence. The SHS technical reports (see section 11.11) provide more information on these matters.
302
NOTES & DEFINITIONS - PERSONAL AND CROSS-MODAL TRAVEL
11.5 Travel to work (Tables 11.14 to 11.16)
11.5.1 The information about the usual means of travel to work and the time taken to travel to the usual place of work shown in tables 11.14 and 11.15 is obtained from the Labour Force Survey using questions which have been included in those survey interviews which have been conducted in the Autumn each year since 1992. The tables include the self-employed, those on Government training schemes and unpaid family workers as well as employees, but exclude those working at home, and those whose workplace or mode of transport to work was not known. The LFS is a household survey covering 60,000 households each quarter in GB, and about 6,000 households per quarter in Scotland.
11.5.2 Scotland’s Census took place on Sunday 27 March 2011 with the chief purpose of providing an accurate population count as well as collecting data on key characteristics of individuals in Scotland, including their travel to work. Some individuals are missed in the Census, and this under-counting does not usually occur uniformly across all geographical areas or across other sub-groups (for example, by age and sex) of the population.
11.5.3 To fill the gap, the National Records for Scotland (NRS) implemented a coverage assessment process to estimate the population that was missed, also identifying and adjusting for the people who were counted more than once or who were counted in the wrong place. Carrying out this work allowed a census estimate of the entire population to be obtained.
11.5.4 The methods were largely based on those developed by the Office for National Statistics (ONS). The ONS systems were also implemented although adapted as necessary to cope with Scotland specific data. ONS have produced a full suite of methodology papers detailing the statistical theory and practical application of the methodology. They can be found here: http://www.ons.gov.uk/ons/guide-method/census/2011/census-data/2011-census-user-guide/quality-and-methods/methods/coverage-assessment-and-adjustment-methods/index.html
11.5.6 It was not always practical or appropriate to replicate exactly what was done for the rest of the UK due to differences in fieldwork processes, data capture and processing and also the availability of comparator data sources. The ONS documentation should be read bearing in mind there were small differences between Scotland and the rest of the UK.
11.5.7 Table 11.16 provides some Census of Population information about travel to work. Information about travel to work has been collected in population censuses since 1966. There have been some changes in the categories used – for example, the 1966 Census had a category described as none which was included in the 1971 Census under its On foot and none category; the 1971 Census had a category described as Public Transport which was separate from the categories for Train and
303
NOTES & DEFINITIONS - PERSONAL AND CROSS-MODAL TRAVEL
Bus; and the 1966 and 1971 Census travel to work figures did not identify separately those who were working at home, so they are included in the figures for those years. However, the effect of such differences on the statistics will be small compared to the scale of the changes in the shares of the main modes of travel .
11.5.8 Information about travel to work is also collected by the SHS (see section 11.4 above), which is the source for tables 11.17 and 11.18.
11.6 Hands Up Scotland Survey (Table 11.23a)
11.6.1 Established in 2008, the Hands Up Scotland Survey is the largest national dataset to look at travel to school across Scotland. The project is funded by Transport Scotland and is a joint survey between Sustrans and Scottish local authorities.
11.6.2 Schools across Scotland complete the survey by asking their pupils ‘How do you normally travel to school?’ The responses are then sent to local authority officers who collate the data and return it to Sustrans’ Research and Monitoring Unit for overall collation, analysis and reporting.
11.6.3 A Parliamentary Order was passed designating Sustrans as Official Statistics Providers in the production of Hands Up Scotland on 1st June 2012. Sustrans is currently looking to acquire National Statistics status for the survey.
11.6.4 The Hands Up Scotland 2015 survey took place between 7th and 11th September 2015 – with results due to be published in May 2016.
11.7 International Passenger Survey - Scottish residents' visits abroad (Tables 11.24 to 11.26)
11.7.1 This information is collected by the International Passenger Survey (IPS), from a sample of passengers returning to the UK by the principal air, sea and tunnel routes (excluding some routes which are too small in volume or which are too expensive to be covered). Travellers passing through passport control during the day are randomly selected for interview (interviewing is suspended at night). A weighting procedure takes account of the non-sampled routes and time periods. For example, the figures for certain airports are uplifted to take account of the passenger numbers at the other UK airports which are not covered by the survey. Prior to 2005, Edinburgh and Glasgow were the only Scottish airports at which interviewing took place. Prestwick airport was added to the survey in 2005 and Aberdeen has been collected since 2009. These are uplifted to take account of the non sampled
304
NOTES & DEFINITIONS - PERSONAL AND CROSS-MODAL TRAVEL
airports. Rosyth was included in quarters 2, 3 and 4 of 2007 and quarters 2 & 3 of 2008.
11.7.2 The figures in the tables are based on interviews with Scottish residents who returned to the UK. This is the Office for National Statistics' standard practice for producing such estimates, as it can then also analyse other information that is collected in the interviews (such as the amount that people say that they spent while on holiday).
11.7.3 The survey covers both adults and children, and is voluntary - for example, the response rate was 80% in 2003, and the results reported in these tables for that year are based upon interviews with about 2,000 Scottish residents.
11.7.4 The IPS data used in the tables are adjusted to take account of the fact that not all people respond to questions regarding area of residence. This means that tables produced by area of residence will not always exactly match other published data regarding trips abroad by UK residents.
11.8 Transport Model for Scotland - Trips made on an average weekday (Table 11.27)
11.8.1 These figures were provided using the Transport Model for Scotland 2012. This model covers the Scottish Strategic Mainland Transport Network, and also includes representation of travel patterns between Scotland and England.
11.8.2 The area covered by the model is divided into 720 zones. The model uses planning data for each zone (e.g. population, number of households, car ownership, employment, number of employed residents) to calculate the number of trips that would be expected to be generated. It also uses information collected by traffic counts, roadside interviews and surveys of passengers on public transport. The information collected and used to develop the model started in 2002 and continued through to 2012, which is the base year. TMfS also uses information from other sources, such as ‘donor’ models (such as the Strathclyde Integrated Transport Model), the 2001 Census of Population and the Scottish Household Survey (which has been conducted continuously since February 1999). Data collected in other years were factored to represent the base year. The quality and coverage of the data that are held within the TMfS vary between different areas and different parts of the transport network. This is the result of the historical interest in the movement of people and goods between various points on the transport network, and the resultant availability of data. However, the base information used to develop TMfS12 is more robust and comprehensive than that used in former versions of the national model.
11.8.3 The pattern of travel movements is held in a series of trip matrices covering the morning peak period, the evening peak period and the intervening off-peak
305
NOTES & DEFINITIONS - PERSONAL AND CROSS-MODAL TRAVEL
period. Taken together, these matrices can be combined to provide a matrix reflecting trip movements during the period 7 a.m. to 7 p.m. on a typical weekday. Daily, monthly and annual averages can then be derived by grossing-up these figures using time series data sources. The resulting expected flows around the transport network are then calibrated and validated for each modelled time period using information about the actual numbers of trips that were made on particular routes.
11.8.4 Applying the calibration and validation process to the expected numbers of generated trips calculated by the model produces estimates of the numbers of trips which are consistent with the observed traffic counts and the results of surveys and interviews. The estimated numbers of trips for the areas shown in the table were then produced by aggregating the estimated numbers of trips for the relevant zones.
11.8.5 The model's estimates of the numbers of people travelling by bus and train across the border with England are less reliable because it uses its standard set of public transport factors to gross up the cross-border passenger numbers obtained (e.g.) from surveys and passenger counts which were carried out at certain times on certain days. Because local bus services account for the vast majority of public transport in Scotland, the model's standard public transport grossing-up factors mainly reflect the pattern of local bus passenger usage - so applying these factors to the data for cross-border bus and train traffic may not take proper account of the different patterns of such traffic.
11.9 Passenger journeys made under concessionary fare schemes (Table 11.29)
11.9.1 The figures for the Strathclyde Concessionary Travel scheme were supplied by Strathclyde Partnership for Transport (SPT); the figures for other schemes were collected from Transport Scotland (national schemes) and from local authorities using the Local Financial Returns form LFR5.
11.9.2 The National Concessionary Travel bus scheme was introduced on 1st April 2006, which allows elderly and disabled free travel on all scheduled bus services in Scotland. This is administered by Transport Scotland and replaced any local bus schemes. The Young People's Concessionary bus Travel Scheme started in 8 January 2007, aimed at 16 to 18 year olds (inclusive) and full time volunteers (aged under 26).
11.9.3 Local authorities were asked to provide numbers of passenger journeys on the same basis as the expenditure on concessionary fares that they report in the LFR5. This relates to concessionary fares for elderly people, for people with visual or other disabilities, and for children (but exclude school transport).
306
NOTES & DEFINITIONS - PERSONAL AND CROSS-MODAL TRAVEL
11.9.4 SPT was able to provide passenger numbers from its records for the Strathclyde Concessionary Travel scheme for several years; figures for the passenger numbers for other schemes are only available for 2000-01 onwards because that was the first year for which that information was requested from local authorities using the LFR forms.
11.10 Further Information
11.10.1 Labour Force Survey - [email protected]
11.10.2 There are a number of transport specific publications on the Scottish Household Survey available at:
www.scotland.gov.uk/Topics/Statistics/Browse/Transport-Travel/Publications
11.10.3 SHS publications include Scotland's People, a detailed Annual Report and can be accessed at: www.scotland.gov.uk/Topics/Statistics/16002/Publications General Enquiries regarding the Scottish Household Survey should be directed to the SHS Project Manager: Nic Krzyzanowski (tel: 0131 244 0824). Enquiries relating to SHS Transport and Travel data should be directed to [email protected].
11.10.4 Enquiries regarding the International Passenger Survey should be directed to Luke Thwaites of the Office for National Statistics (tel: 01633 45 6032).
11.10.5 Further information or guidance on the detailed application of the Transport Model for Scotland can be obtained from Alison Irvine, Transport Scotland Strategy and Investment (tel: 0141 272 7571). See also https://www.transport.gov.scot/our-approach/industry-guidance/land-use-and-transport-integrations-in-scotland-latis/#
11.10.6 Further information about the numbers of passenger journeys made under concessionary fare schemes can be obtained from Maureen Fisher in Transport Scotland (tel: 0131 272 7533).
11.10.7 Further information about the number of telephone calls and Web site hits for Traveline Scotland can be obtained from Juliet Bell, Commercial and Marketing Manager, Trunk Roads and Network Management, Transport Scotland, (tel: 0141 272 7194).
11.11 Other data sources
Official Statistics data sources
Within Scottish Transport Statistics:
Chapter 1 - Road vehicles,
307
NOTES & DEFINITIONS - PERSONAL AND CROSS-MODAL TRAVEL
Chapter 5 – Road Traffic (including congestion)
Chapter 12 - International Travel (includes modal share comparisons)
Other Transport Scotland Publications:
Transport and Travel in Scotland – includes more detailed analysis of SHS data, in particular:
Table 11 – car sharing
Table 16 and 17 – Reasons for choice of travel to school mode
Table 18a – bicycle access
Table 21 – Park and ride
Table 28 – Frequency of bus and train use
Tables 31 and 32 – Concessionary pass use
Scottish Household Survey Travel Diary – includes detailed tables using the Travel Diary dataset, in particular:
Table 2 – journeys by mode of transport
Table 2a&b – journey and stage distance by mode of transport
Table 3 – Purpose of travel
Table 4a & 5a – mode of transport by journey distance
SHS Local Authority Results – provides breakdowns of SHS data by Local Authority, Regional Transport Partnership and Urban Rural Classification. In particular:
Table 1& 2 - Travel to work and school by mode of transport
Table 11 - Frequency of bus and train use
Table 12 – Convenience of public transport
Table 15 – Concessionary pass use
Table 16 – journeys by mode of transport
Table 17 – purpose of travel.
Non Official Statistics sources
Transport Scotland
On the Move: Car, rail and bus travel trends in Scotland (Charilaos Latinopoulos, Scott Le Vine, Peter Jones & John Polak)
Non Transport Scotland data sources:
On The Move (Scott Le Vine and Peter Jones), provides analysis of NTS data on personal travel in GB
Eurostat statistics on modal share (See chapter 12 for further detail)
308
NOTES & DEFINITIONS - INTERNATIONAL COMPARISONS
Chapter 12 – International Comparisons
12. Notes & Sources: EU countries
12.1 Most EU country statistics originate from the 2020 EU Energy and Transport in Figures, produced annually by the EC Directorate General for Energy and Transport with the assistance of Eurostat. The publication contains a range of detailed statistics and only a summary are presented in this chapter. Email [email protected] or available at https://ec.europa.eu/transport/facts-fundings/statistics/pocketbook-2020_en
Notes & Sources: Scotland, UK & GB
12.2 In general, notes on and definitions of the figures for Scotland (and, by implication, the figures on the same basis for the UK or GB as a whole) appear in the relevant chapters. Therefore, this section covers only matters which are not dealt with there.
12.3 Population, area and population density:
12.3.1 The population figures for GB and UK are mid-2019 estimates (NB: the EU publication's figures are for 1 January 2019) based on Office for National Statistics release (published in June 2020), available at https://bit.ly/2KXOxkd Scottish figures are taken directly from the General Registry Office of Scotland.
12.3.2 Areas figures relate to 2008 (no year is specified for the EU publication's figures) taken from Table 1.1 of the 2010 edition of the Annual Abstract of Statistics. Population densities were calculated by the Scottish Government using these area estimates.
12.4 Motorways: the figures for Scotland and for GB are for 2018 (the same year as most of the EU figures). They were taken from Table RDL0201 of DfT’s road lengths statistics publication. The DfT's figure for Scotland was used in this table. As explained in paragraph 5.5 below the methodology used by DfT means that the figure for the length of motorways in Scotland (excluding slip roads) differs slightly from Table 12.5.1).
12.5 All roads:
12.5.1 The figures for Scotland and for GB relate to 2018 (the same year as most of the EU figures), taken from Table RDL0201 of DfT’s road lengths statistics. The
309
NOTES & DEFINITIONS - INTERNATIONAL COMPARISONS
DfT's figure for Scotland was used in this table which differs from the road length figure in Table 4.1, due to the DfT using a Geographical Information System (GIS) and Ordnance Survey data to produce estimates. Whereas (as explained in the notes to Chapter 4), most of the figures in Table 4.1 are produced from annual returns made by local authorities.
12.5.2 Some countries (Bulgaria, Denmark, Germany, Italy, Luxembourg, Portugal and Romania) did not have information for ‘other roads’ in the latest EU publication. Therefore the total road length figure for all countries excludes ‘other roads’. In the case of Scotland and the UK, ‘Unclassified roads’ have been excluded.
12.6 Railways: the figures are for the route length at the end of the financial year 2018/19 (the EU figures are for 2018). The figure for Scotland is from Table 7.14 of this publication; the GB figure was taken from Table TSGB0601 of TSGB 2019.
12.7 Passenger cars: passenger cars figures for Scotland and GB are for 2018 (most EU figures are for 2018). They are taken from Table TSGB0903 of DfT's Transport Statistics Great Britain 2019 edition.
12.8 Powered two wheelers: the figures for Scotland and GB are for 2018 (the same year as most of the EU figures). They are taken from Table TSGB0903 of DfT's Transport Statistics Great Britain 2019 edition, which includes figures for motorcycles, scooters and mopeds and based on numbers of vehicles licensed at 31st December. The EU publication's figure (for the UK) is lower than the DfT figure for GB due to different methodologies. EU figures are based on national sources and definitions may vary.
12.9 Goods vehicles: the figures for Scotland and GB are for 2018 (the same year as most of the EU figures). The Scottish figure is taken from Table 1.2 of this publication, and the GB figure is taken from Table TSGB0903 of DfT's Transport Statistics Great Britain 2019 edition. They are the totals of the figures for the body types light goods and goods (the latter being heavy goods vehicles). The result of using the body type figures is slightly different from that which would have been obtained had taxation group figures been used.
12.10 New registrations of passenger cars: the GB and Scotland figures are for new registrations of all vehicles and are for 2019 (the same year as most of the EU figures). They are taken from Table VEH0152 of DfT's Vehicle Licensing Statistics.
310
NOTES & DEFINITIONS - INTERNATIONAL COMPARISONS
12.11 Passenger transport - distance travelled and modal shares
12.11.1 The figures for Scotland and GB are for the two year period 2011/2012 (the EU figures are for 2018). Following the increase in its sample size with effect from 2002, the National Travel Survey can provide some figures for a single year for Scotland, but figures for the two year period should be less susceptible to sampling fluctuations. The figures for Scotland are taken from STS 2013 Table 11.2 and converted from miles into kilometres. The GB figures for 2011/2012 were calculated by simply averaging the figures from 2011 and 2012 for each relevant mode of transport shown in Table NTS0305 of DfT's National Travel Survey: 2012 bulletin, and converting the result from miles into kilometres.
12.11.2 The NTS figures relate to the mode of travel, not to the main mode that is used in some other analyses of NTS figures and use detailed mode breakdowns of NTS results as opposed to aggregate groupings. Also passenger cars category consists of car only - driver, car only - passenger and taxi / minicab; the buses and coaches category covers private hire bus, bus in London, local bus and non-local bus; and the tram / metro category relates only to the London Underground (the Glasgow Underground is not identified in the results of the NTS).
12.11.3 The NTS average for the total distance travelled per person in GB (covering all modes of transport) is 6,826 miles, or 10,985 kilometres in 2011/12 For the modes of transport shown in the table (which excludes, for example, air and ferry) the NTS average is 10,556 kilometres. This difference between the Uk and GB figures arises because the two sets of figures are on different bases:
the NTS figures relate only to personal travel within GB, and are produced from the results of a survey of households across GB;
the EU publication's figures have been derived by dividing estimates of the total volume of travel (passenger-kilometres) within the country by the total population of the country.
The kinds of travel which would be counted using the latter approach (but not by the NTS) include
travel within GB by foreign tourists and other non-residents; travel for business purposes (e.g. to and from meetings); and, possibly, some travel in the course of their work by the likes of lorry drivers,
postmen and bus drivers. Therefore, estimates produced using the latter approach will be greater than the NTS estimates, which cover only personal travel by residents.
12.11.4 There are no official estimates of the total passenger-kilometres travelled within Scotland: the only Scottish estimates of the average distance travelled per head of population are NTS ones, which cover only personal travel by residents.
12.11.5 Although the two methods produce markedly different average distances, they produce quite similar modal shares - e.g. the modal share for passenger cars is:
311
NOTES & DEFINITIONS - INTERNATIONAL COMPARISONS
NTS – 82.3%; shown in EU Energy and Transport in Figures – 85.6% (NB: in both cases, the modal shares are calculated excluding powered two-wheelers, walking and cycling, for consistency with the figures in the relevant table of the EU publication). Therefore, the modal shares for Scotland, calculated from the NTS results, should be comparable to the modal shares for the EU countries.
12.12 International air passengers (traffic between EU countries): the figures for Scotland and the UK are both for 2017 (the same year as the EU figures). The Scottish figure is taken from the Total EU countries in Table 8.3(a) of this publication. It is the number of passengers to and from the EU-28 countries for the main Scottish international airports (Aberdeen, Edinburgh, Glasgow and Glasgow Prestwick). The table shows figures for 21 of the EU member states: these are the countries for which the international air passenger route analysis table on the Civil Aviation Authority's Web site (from which the figures for Table 8.3(a) were obtained) shows passengers to/from Scottish airports (for example, the CAA table does not show any passengers between, say, Luxembourg and any Scottish airport in 2005). These figures will underestimate slightly the total number of international passengers between Scotland and EU countries because they do not include (a) passengers on charter only routes in cases where fewer than 5,000 passengers were carried between an airport and a particular country, nor (b) any passengers to and from EU countries at other airports in Scotland. The UK figure is taken from Table AVI0105 of DfT’s Aviation Statistics publication, using the figures for EU-28.
12.13 Road fatalities: the figures for Scotland and GB are both for 2018 (as are most of the EU figures). The Scottish figure is taken from Table 2 of Reported Road Casualties Scotland 2018, and the GB figure is taken from Table RAS30003 of Reported Road Casualties Great Britain 2018.
12.14 Freight transport - modal shares
12.14.1 Both Scotland and GB relate to 2018 (as do the EU figures). The Scottish figures are derived from the tonne-kilometre figures for each mode of transport which appear in Table H2(b) of this publication. The GB figures are derived from the tonne-kilometre figures for each mode of transport which appear in Table TSGB0403 of TSGB 2019.
12.14.2 The figures for Scotland are based on the tonnage of goods lifted in Scotland and the distance on which they are carried on that journey, be it within Scotland or from Scotland to (say) England. For example, the tonne-kilometres for goods taken from Edinburgh to London would be calculated using the full distance between Edinburgh and London (over 660 kilometres) not just the distance between Edinburgh and the border (under 160 kilometres). Therefore, the figures do not represent the modal shares for freight transport within Scotland: they include tonne-kilometres outwith Scotland on journeys which started in Scotland, and they exclude tonne-kilometres within Scotland on journeys which started elsewhere.
312
NOTES & DEFINITIONS - INTERNATIONAL COMPARISONS
12.15 Other data sources
Eurostat collect a range of Transport data for European countries and publish it on their website. It can be accessed at:
http://ec.europa.eu/eurostat/web/main
United Nations Economic Commission for Europe also publish European Transport data:
http://w3.unece.org/pxweb/
World Health Organisation collect data on road accidents from around the world and publish a comparison:
https://www.who.int/publications/i/item/9789241565684
313
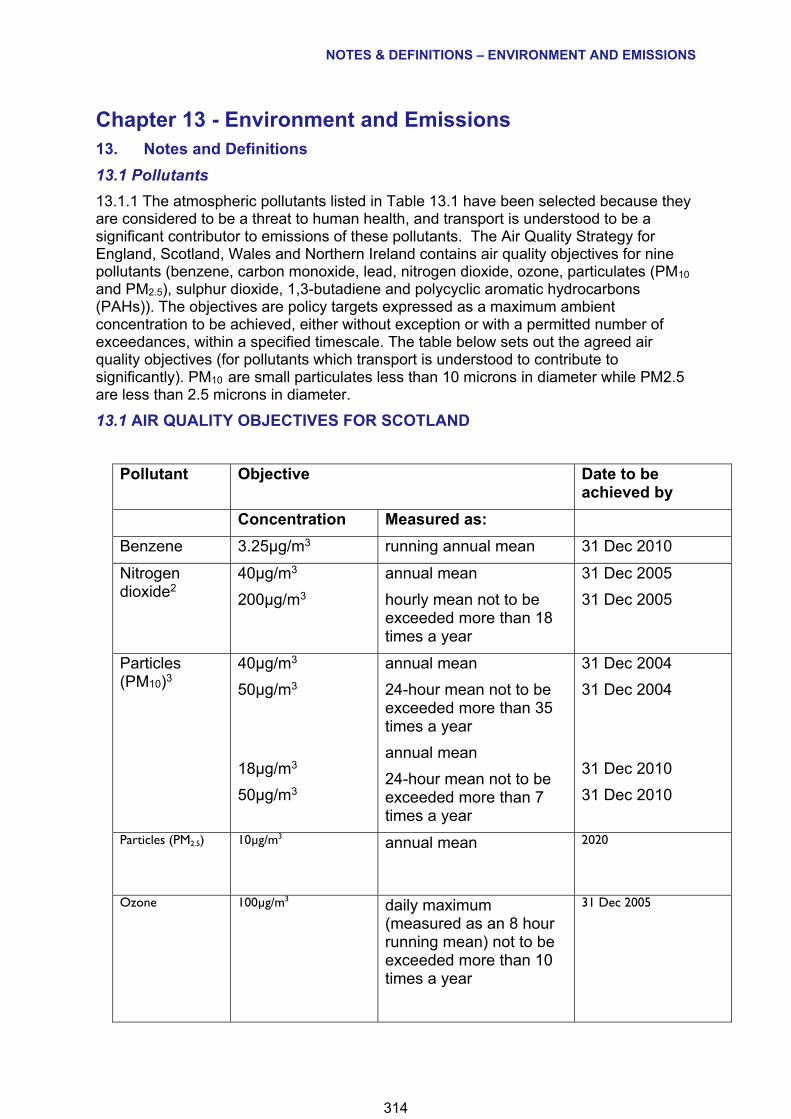
NOTES & DEFINITIONS – ENVIRONMENT AND EMISSIONS
Chapter 13 - Environment and Emissions 13. Notes and Definitions
13.1 Pollutants
13.1.1 The atmospheric pollutants listed in Table 13.1 have been selected because they are considered to be a threat to human health, and transport is understood to be a significant contributor to emissions of these pollutants. The Air Quality Strategy for England, Scotland, Wales and Northern Ireland contains air quality objectives for nine pollutants (benzene, carbon monoxide, lead, nitrogen dioxide, ozone, particulates (PM10
and PM2.5), sulphur dioxide, 1,3-butadiene and polycyclic aromatic hydrocarbons (PAHs)). The objectives are policy targets expressed as a maximum ambient concentration to be achieved, either without exception or with a permitted number of exceedances, within a specified timescale. The table below sets out the agreed air quality objectives (for pollutants which transport is understood to contribute to significantly). PM10 are small particulates less than 10 microns in diameter while PM2.5 are less than 2.5 microns in diameter.
13.1 AIR QUALITY OBJECTIVES FOR SCOTLAND
Pollutant Objective Date to be achieved by
Concentration Measured as:
Benzene 3.25µg/m3 running annual mean 31 Dec 2010
Nitrogen dioxide2
40µg/m3
200µg/m3
annual mean
hourly mean not to be exceeded more than 18 times a year
31 Dec 2005
31 Dec 2005
Particles (PM10)3
40µg/m3
50µg/m3
18µg/m3
50µg/m3
annual mean
24-hour mean not to be exceeded more than 35 times a year
annual mean
24-hour mean not to be exceeded more than 7 times a year
31 Dec 2004
31 Dec 2004
31 Dec 2010
31 Dec 2010
Particles (PM2.5) 10µg/m3 annual mean 2020
Ozone 100µg/m3 daily maximum (measured as an 8 hour running mean) not to be exceeded more than 10 times a year
31 Dec 2005
314
NOTES & DEFINITIONS – ENVIRONMENT AND EMISSIONS
13.2 Emissions.
13.2.1 CAT is the Carbon Account for Transport. The Carbon Account for Transport (CAT) fulfils a requirement of the National Transport Strategy to develop a carbon balance sheet for transport. It is published on an annual cycle and contains:
• Scotland’s annual transport emissions from 1990 to 2017;
• emissions efficiency estimates across different modes of transport;
• emissions efficiency of road vehicles registered in Scotland;
• comparison of Scotland’s emissions to those of the UK as a whole;
• key leading transport emissions indicators.
13.2.2 The Climate Change (Scotland) Act 2009 requires Scottish Ministers to lay a report in Parliament setting out their proposals and policies for meeting annual emissions reduction targets. The Climate Change Plan, published February 2018, is the Scottish Government’s third report on proposals and policies for meeting its climate change targets. It sets out how Scotland can deliver its target of 66% emissions reductions, relative to the baseline, for the period 2018–2032. In April 2019 the First Minister acknowledged that Scotland – like the rest of the world – faces a Climate Emergency and confirmed that the Scottish Government would accept the recommendations of the UK Committee on Climate Change to set a target of net zero greenhouse gas emissions by 2045 with interim reduction targets of 70% by 2030 and 90% by 2040. The Scottish Government has committed to updating the Climate Change Plan within six months of the Climate Change Bill receiving Royal Assent so that it reflects the more ambitious targets being established.
13.2.3 While the UK emissions return to the UN does not include emissions from international aviation and shipping (IAS), the Climate Change Scotland Act 2009 explicitly includes this category of emissions in its calculation of total Scottish emissions and the required reduction in emissions to fulfil the terms of the Act. International aviation and shipping emissions are shown in the national emissions Inventory as an additional, outside scope, item.
13.2.4 Ultra Low Emission Vehicles (ULEV) - An ULEV emits extremely low levels of carbon dioxide (CO2) compared to conventional vehicles fuelled by petrol/diesel. They typically also have much lower or virtually nil emissions of air pollutants and lower noise levels. Since 2009, the Office for Low Emission Vehicles has considered ULEVs as new cars or vans that emit less than 75 grams of CO2 from the tailpipe per kilometre driven, based on the current European type approval test.
13.2.5 Plug in Grant - Since January 2011, UK motorists purchasing a qualifying ultra-low emission car have been able to receive a grant of 25% towards the cost of the vehicle, up to a maximum of £5,000. The Plug-in Car Grant has been designed to help make the whole-life costs of a qualifying car more comparable with petrol or diesel equivalents. The terms of this scheme were modified in early 20161
1 Revised terms of Plug-in-Grant scheme
315
NOTES & DEFINITIONS – ENVIRONMENT AND EMISSIONS
Sources
13.3 Pollutants and air quality objectives
13.3.1 The information on air pollutant emissions is taken from the publication Air Quality Pollutant Inventories for England, Scotland, Wales and Northern Ireland: 1990 – 2018, published on the National Atmospheric Emissions Inventory website. Emissions estimates are modelled and revisions may be made to the whole time series each year. Separate information on emissions resulting from the use of petrol and diesel in passenger cars and light goods vehicles is provided for the first time.
13.3.2 A sensitive parameter in the emission calculations for petrol cars is the assumption made about the proportion of the fleet with catalyst systems that have failed, for example due to mechanical damage or failure of the lambda sensor. Following discussions with DfT, it is assumed that the failure rate is 5% per annum for all Euro standards, and that up to 2008 only 20% of failed catalysts were rectified properly, but those that were rectified were done so within a year of failing. The revisions are based on evidence on fitting of replacement catalysts. According to DfT there is evidence that a high proportion of replacement catalysts were not Type Approved and do not restore the emission performance of the vehicle to its original level (DfT 2009). This is being addressed through the Regulations Controlling Sale and Installation of Replacement Catalytic Converters and Particle Filters for Light Duty Vehicles (LDVs) for Euro 3 (or above) LDVs after June 2009. Therefore a change in the repair rate is taken into account for Euro 3 and above petrol LDVs from mid-2009, assuming all failed vehicles are rectified properly.
13.3.3 The methodology for estimating emissions from shipping was revised in the Air Quality Pollutant Inventories for England, Scotland, Wales and Northern Ireland: 1990-2016 (http://naei.beis.gov.uk/reports/reports?report_id=970). Full details of the revision are given in the report. As a result of the revision there has been a large apparent increase in emissions from shipping compared with the previous inventory which particularly affects the NOx figures. The percentage of NOx emissions allocated to transport in 2015 increased from 45% in the 2017 inventory to 53% in the 2018 inventory.
13.3.4 In the inventory Air Quality Pollutant Inventories for England, Scotland, Wales and Northern Ireland: 1990-2017 (https://naei.beis.gov.uk/reports/reports?report_id=996) there was a major revision to the emission factor for gas oil combustion on locomotive trains for all years after 1998. Additional revisions are due to minor refinements to the shipping methodology which now produces uses pollutant-specific techniques to disaggregate UK emissions, but this is minor compared to changes to the emissions for Railways.
13.3.5 In the inventory Air Quality Pollutant Inventories for England, Scotland, Wales and Northern Ireland: 1990-2018 (https://naei.beis.gov.uk/reports/reports?report_id=1010), emission and fuel consumption factors for different train classes have been revised based on newly available data, leading to a reduction in emissions for NFR code 1A3c
(Railways: intercity, regional and freight.
316
NOTES & DEFINITIONS – ENVIRONMENT AND EMISSIONS
13.3.6 Detailed information on all sites in the Scotland Air Quality Database are available from the data section of the “Air Quality in Scotland” website (http://www.scottishairquality.co.uk). The air quality objectives are taken from The Air Quality Strategy for England, Scotland, Wales and Northern Ireland: Addendum. Summary statistics for all sites are available from the “Scottish Environment Statistics Online” website (http://www.gov.scot/seso/Datasets.aspx?TID=2). Please note that this website is no longer being updated as of 30 September 2017.
13.4 Emissions of greenhouse gases from transport allocated to Scotland
13.4.1 The majority of the Scottish emissions tables shown here are based on emissions estimates reported in Greenhouse Gas Inventories for England, Scotland, Wales & Northern Ireland 1990-2017, compiled by Aether/Ricardo-AEA under contract to the Department for Business, Energy and Industrial Strategy, the Scottish Government, the Welsh Government and the Northern Ireland Department of Environment. Data from other sources, such as Scottish Transport Statistics, are also presented in the report. In this inventory:
In line with the methodology used to report against the Climate Change (Scotland) Act 2009, emissions from transport only include those at the point of use, also known as tailpipe emissions. Lifestyle and displaced emissions, such as emissions from generating the electricity to power electric trains, are not included. The all sources figures given in Table 13.2 take account of removals of carbon dioxide as a result of Land Use, Land Use Change and Forestry (LULUCF).
13.4.2 The way in which emissions are allocated to the different countries within the UK are described in the Greenhouse Gas Inventories report. In summary, the bases of the different estimates are:
road transport - the estimated volume of traffic on the roads within each country. The estimates for carbon dioxide are constrained so that the total for the four countries agrees with the internationally-reported overall total for the UK as a whole (which was calculated from the total volume of fuel sold within the UK);
railways - emissions from railway locomotives in Great Britain are disaggregated based on diesel oil consumption data for passenger services and National Atmospheric Emissions Inventory (NAEI) estimates for freight services. In addition, emissions associated with the use of coal for steam locomotives are also included within the calculations. The data used in the 2006 inventory was reported for each railway company, whose area of operation can in most cases be allocated to one of the four constituent countries;
civil aviation - estimates of emissions from domestic aviation are calculated based on aircraft movement data from the UK’s major airports. The total number of domestic flights from each of the devolved administration areas has been calculated, and based on this, a fraction of the total UK emission has been allocated to each constituent country. This approach is also used to allocate emissions from aircraft support vehicles;
317
NOTES & DEFINITIONS – ENVIRONMENT AND EMISSIONS
national navigation - the disaggregation of emissions from navigation and coastal shipping has been derived in a similar way to the approach used for aviation, based on port movements in each constituent country.
13.4.3 Road transport carbon dioxide (CO2) emissions are estimated using vehicle kilometre data constrained so the sum of the UK areas equate to the total for the UK inventory (where that total is derived from fuel sales data of petrol and DERV within the UK as specified in the reporting guidelines of the Intergovernmental Panel on Climate Change). A criticism of this method is that the presentation of results does not always provide a CO2 emission trend that is directly consistent with the vehicle kilometre trend data, as the fluctuations in UK fuel data have a more significant impact on the resultant emission trends. As an alternative, road transport CO2 emissions from the constituent countries of the UK may be estimated solely by vehicle kilometre data unconstrained to the UK total derived from fuel consumption data.
13.4.4 The difference in results between the constrained and unconstrained methods at Devolved Administration level largely reflects the difference in the results at UK level between bottom-up calculated fuel consumption using vehicle km data and fuel consumption factors and the fuel sales data in the Digest of UK Energy Statistics (DUKES). The reason for a disparity has previously been attributed to cross-border fuel sales (“fuel tourism”) although model uncertainty was always emphasised as an additional, and probably a major explanation for the differences.
13.4.5 Any change in the methodologies or the factors used to calculate fuel consumption will affect the magnitude of the difference between calculated fuel consumption at national level and sales figures from DUKES and so, in turn, it will affect the disparity between the Devolved Administration CO2 emissions from the constrained and unconstrained approaches.
13.5 Carbon dioxide emissions per passenger-kilometre
13.5.1 The figures are taken from the new Greenhouse Gas Conversion Factor Repository created for Defra
https://www.gov.uk/government/publications/greenhouse-gas-reporting-conversion-factors-2018
13.5.2 Figures are consistent with the factors used in the compilation of the UK’s National Atmospheric Emissions Inventory (NAEI) and in the Greenhouse Gas Emissions Inventory compiled for Scotland and other constituent countries in the UK by Ricardo - AEA.
13.5.3 Figures within the repository are estimated using data for GB/UK as a whole and so do not relate specifically to Scotland. There are no estimates of emissions per passenger-kilometre for Scotland alone. The basis of each estimate is as follows:
318
NOTES & DEFINITIONS – ENVIRONMENT AND EMISSIONS
Road Transport - The factors used are estimated values for the average petrol and diesel car fleet travelling on average trips in the UK. This has been divided by an average car occupancy rate of 1.50 passengers to calculate average emissions per passenger kilometre.
Rail - the national rail estimate refers to an average emission factor for diesel, electric and steam trains. The light rail and tram factors are based on an average of the annual electricity consumption and passenger kilometre data provided by network operators, and a CO2 emission factor for electricity generation on the national grid from the UK Greenhouse Gas Inventory.
Air - the emission factor is an aggregate representation of typical CO2 emissions from illustrative types of aircraft for the three types of air services – domestic, short haul and long haul. Broadly speaking the definition of domestic flights, are those within the UK, short-haul are those within Europe and long-haul are outside of Europe. In keeping with evidence from the IPCC, a 8% uplift factor has been applied to allow for sub-optimal routing and stacking at airports during periods of heavy congestion.
13.6 Vehicle Licensing data
13.6.1 Data used in tables 13.6 to 13.10 is provided by the Department for Transport Vehicle Licensing team. More information can be found in Chapter 1 of STS or on the DfT website.
13.7 Further Information
13.7.1 Carbon dioxide and other greenhouse gases emissions allocated to Scotland - see Official Statistics publication Scottish Greenhouse Gas Emissions http://www.gov.scot/Publications/2017/06/9986 or Peter Sumner of Transport Scotland, Transport Analytical Services (0131 244 3446).
13.7.2 Carbon dioxide emissions per passenger-kilometre is available from
https://www.gov.uk/government/publications/greenhouse-gas-reporting-conversion-factors-2017
13.7.3 Air Pollutants and Air Quality - see Scottish Environment Statistics Online http://www.gov.scot/seso/Datasets.aspx?TID=2 or John Landrock of The Scottish Government, Environment Statistics branch (0131 244 0441).
13.8 Other data sources
Within Scottish Transport Statistics:
Chapter 1 – Road vehicles
Chapter 5 – Road Traffic
319
NOTES & DEFINITIONS – ENVIRONMENT AND EMISSIONS
Chapter 11 – Personal and Cross Modal Travel
Other Transport Scotland Statistics Publications:
Transport and Travel in Scotland – includes more detailed analysis of the SHS data, in particular:
Table 2 – Fuel costs
Table 7 – Mode of transport for travel to work
Table 11 – Car sharing
Table 18b – Car Access
Table 20 – Frequency of driving.
Table 28 – Frequency of train use
Scottish Household Survey Travel Diary – includes detailed tables using the Travel Diary dataset, in particular:
Table 2 – journeys by mode of transport
Table 2a – journey distance by mode of transport
Table 4a – mode of transport by journey distance
Table 5a – distance summary statistics by mode of transport
SHS Local Authority Results – provides breakdowns of SHS data by Local Authority, Regional Transport Partnership and Urban Rural Classification. In particular:
Table 1 – Travel to work by mode of transport
Table 2 – Travel to school by mode of transport
Table 16 – Journeys by mode of transport.
Department for Transport produce a number of related publications mostly at GB level, including:
Traffic estimates
Vehicle registrations.
BEIS
Digest of UK Energy Statistics (DUKES)
Scottish Government
Scottish Greenhouse Gas Emissions, 2016 – Official Statistics bulletin
Some non-Official Statistics sources
Transport Scotland – Report on Proposals and Policies
Transport Scotland - Carbon Account for Transport
320
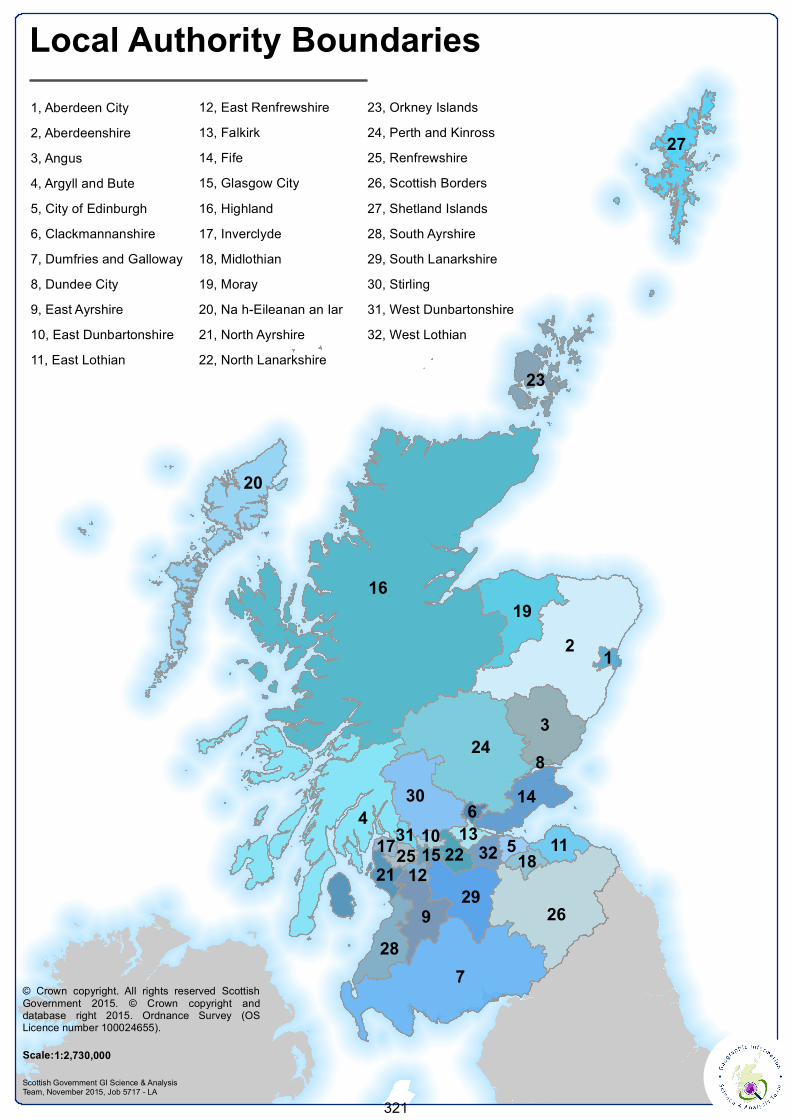
16
7
2
4
24
26
3
9
19
30
20
29
14
28
11
27
23
52221
32
1
18
613
2531
1510
1217
8
Local Authority Boundaries
© Crown copyright. All rights reserved ScottishGovernment 2015. © Crown copyright anddatabase right 2015. Ordnance Survey (OSLicence number 100024655).
Scottish Government GI Science & AnalysisTeam, November 2015, Job 5717 - LA
1:2,730,000Scale:
1, Aberdeen City2, Aberdeenshire3, Angus4, Argyll and Bute5, City of Edinburgh6, Clackmannanshire7, Dumfries and Galloway8, Dundee City9, East Ayrshire10, East Dunbartonshire11, East Lothian
14, Fife15, Glasgow City16, Highland17, Inverclyde18, Midlothian19, Moray20, Na h-Eileanan an Iar21, North Ayrshire22, North Lanarkshire
12, East Renfrewshire13, Falkirk
23, Orkney Islands24, Perth and Kinross25, Renfrewshire26, Scottish Borders27, Shetland Islands28, South Ayrshire29, South Lanarkshire30, Stirling31, West Dunbartonshire32, West Lothian
321
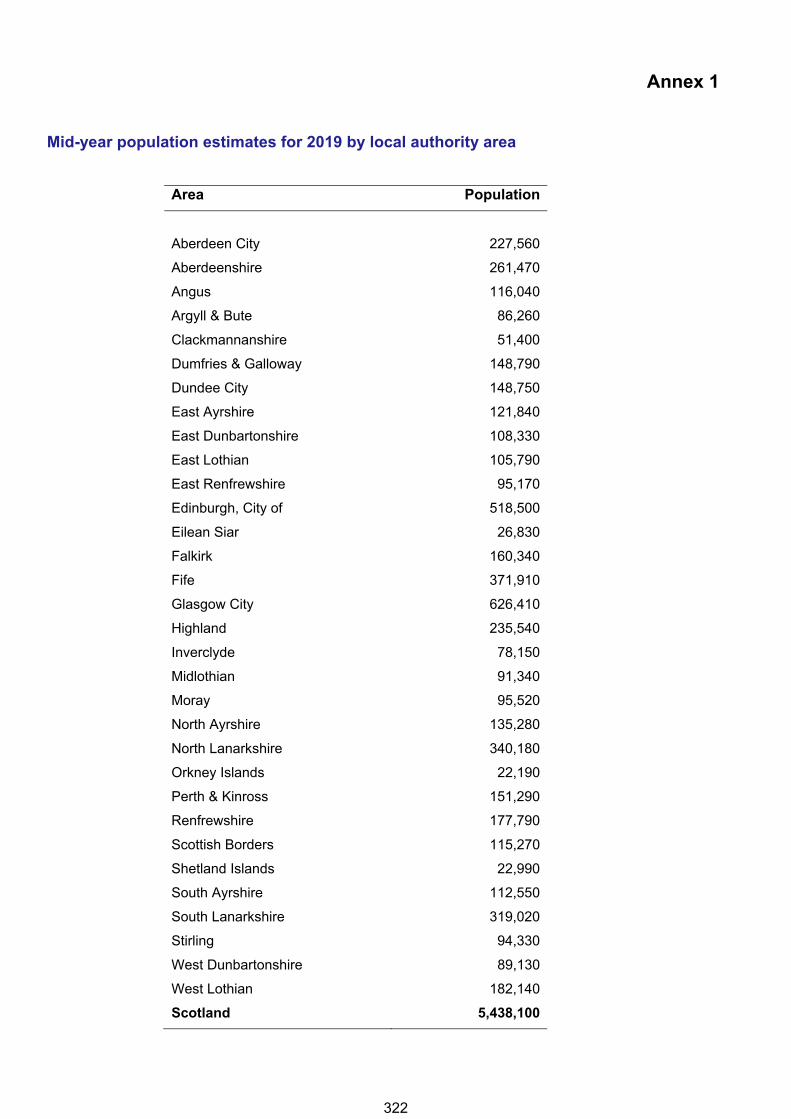
Annex 1
Mid-year population estimates for 2019 by local authority area
Area Population
Aberdeen City 227,560
Aberdeenshire 261,470
Angus 116,040
Argyll & Bute 86,260
Clackmannanshire 51,400
Dumfries & Galloway 148,790
Dundee City 148,750
East Ayrshire 121,840
East Dunbartonshire 108,330
East Lothian 105,790
East Renfrewshire 95,170
Edinburgh, City of 518,500
Eilean Siar 26,830
Falkirk 160,340
Fife 371,910
Glasgow City 626,410
Highland 235,540
Inverclyde 78,150
Midlothian 91,340
Moray 95,520
North Ayrshire 135,280
North Lanarkshire 340,180
Orkney Islands 22,190
Perth & Kinross 151,290
Renfrewshire 177,790
Scottish Borders 115,270
Shetland Islands 22,990
South Ayrshire 112,550
South Lanarkshire 319,020
Stirling 94,330
West Dunbartonshire 89,130
West Lothian 182,140
Scotland 5,438,100
322
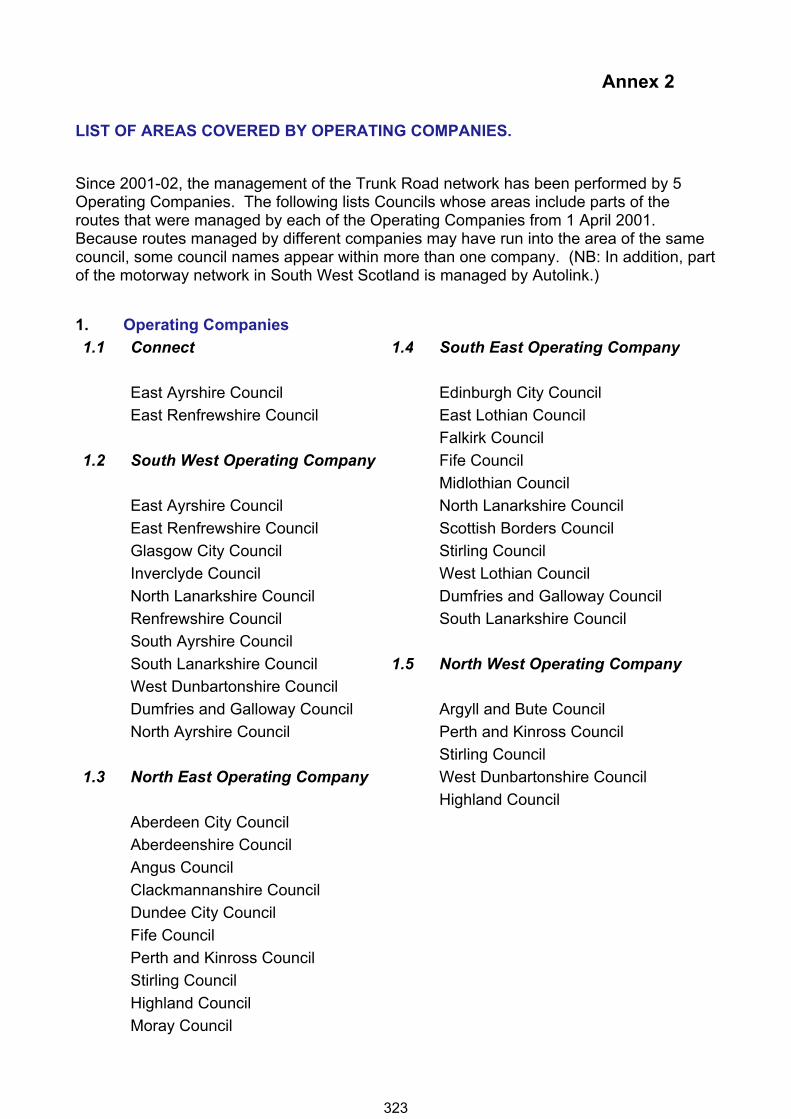
Annex 2
LIST OF AREAS COVERED BY OPERATING COMPANIES.
Since 2001-02, the management of the Trunk Road network has been performed by 5 Operating Companies. The following lists Councils whose areas include parts of the routes that were managed by each of the Operating Companies from 1 April 2001. Because routes managed by different companies may have run into the area of the same council, some council names appear within more than one company. (NB: In addition, part of the motorway network in South West Scotland is managed by Autolink.)
1. Operating Companies
1.1 Connect
East Ayrshire Council
East Renfrewshire Council
1.2 South West Operating Company
East Ayrshire Council
East Renfrewshire Council
Glasgow City Council
Inverclyde Council
North Lanarkshire Council
Renfrewshire Council
South Ayrshire Council
South Lanarkshire Council
West Dunbartonshire Council
Dumfries and Galloway Council
North Ayrshire Council
1.3 North East Operating Company
Aberdeen City Council
Aberdeenshire Council
Angus Council
Clackmannanshire Council
Dundee City Council
Fife Council
Perth and Kinross Council
Stirling Council
Highland Council
Moray Council
1.4 South East Operating Company
Edinburgh City Council
East Lothian Council
Falkirk Council
Fife Council
Midlothian Council
North Lanarkshire Council
Scottish Borders Council
Stirling Council
West Lothian Council
Dumfries and Galloway Council
South Lanarkshire Council
1.5 North West Operating Company
Argyll and Bute Council
Perth and Kinross Council
Stirling Council
West Dunbartonshire Council
Highland Council
323
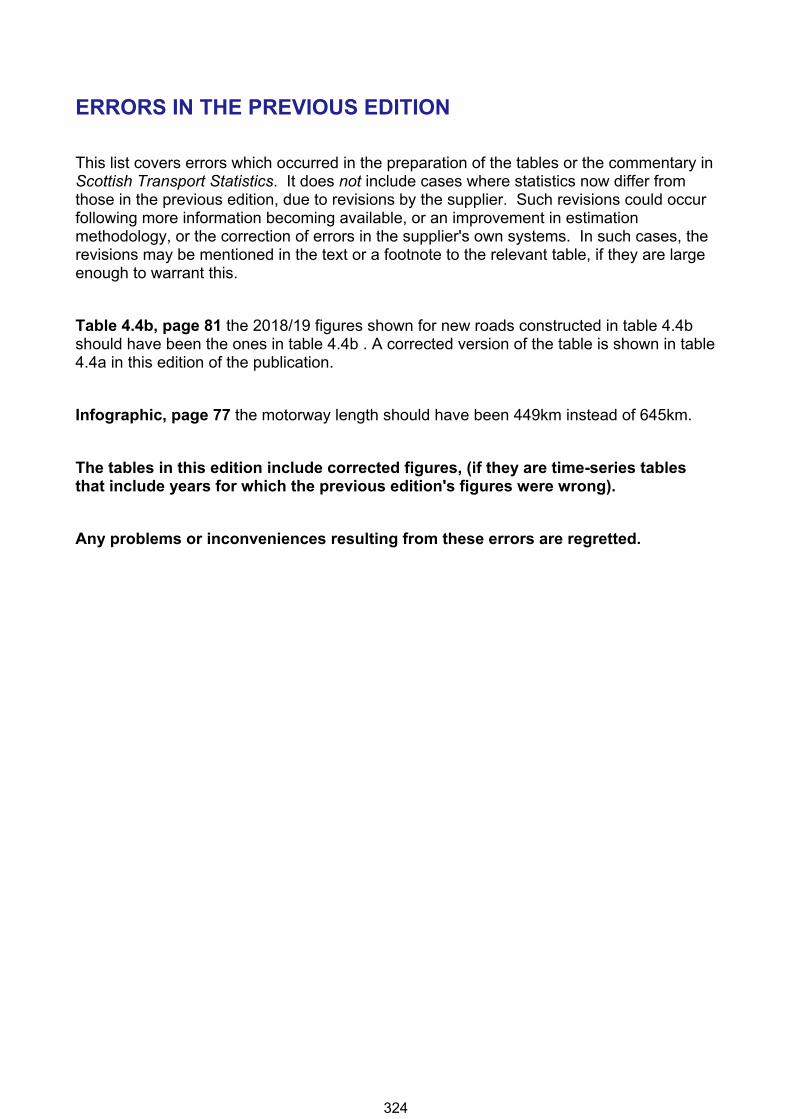
ERRORS IN THE PREVIOUS EDITION
This list covers errors which occurred in the preparation of the tables or the commentary in Scottish Transport Statistics. It does not include cases where statistics now differ from those in the previous edition, due to revisions by the supplier. Such revisions could occur following more information becoming available, or an improvement in estimation methodology, or the correction of errors in the supplier's own systems. In such cases, the revisions may be mentioned in the text or a footnote to the relevant table, if they are large enough to warrant this.
Table 4.4b, page 81 the 2018/19 figures shown for new roads constructed in table 4.4b should have been the ones in table 4.4b . A corrected version of the table is shown in table 4.4a in this edition of the publication.
Infographic, page 77 the motorway length should have been 449km instead of 645km.
The tables in this edition include corrected figures, (if they are time-series tables that include years for which the previous edition's figures were wrong).
Any problems or inconveniences resulting from these errors are regretted.
324
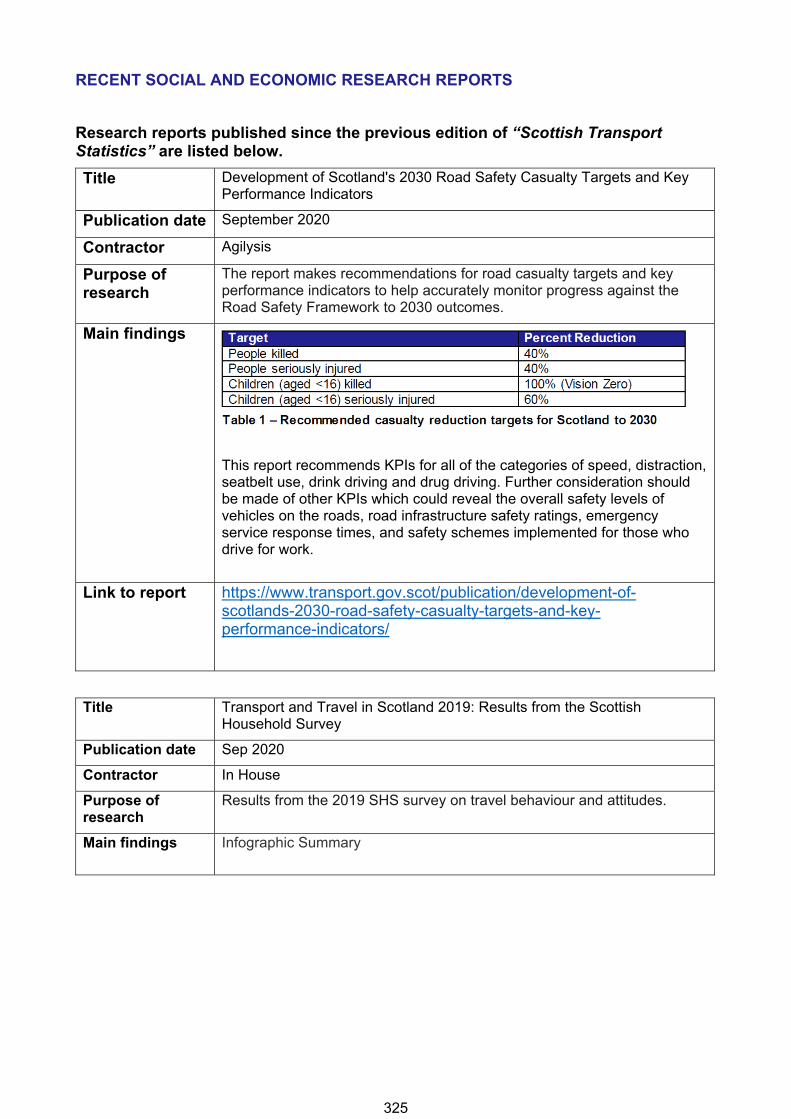
RECENT SOCIAL AND ECONOMIC RESEARCH REPORTS
Research reports published since the previous edition of “Scottish Transport Statistics” are listed below.
Title Development of Scotland's 2030 Road Safety Casualty Targets and Key Performance Indicators
Publication date September 2020
Contractor Agilysis
Purpose of research
The report makes recommendations for road casualty targets and key performance indicators to help accurately monitor progress against the Road Safety Framework to 2030 outcomes.
Main findings
This report recommends KPIs for all of the categories of speed, distraction, seatbelt use, drink driving and drug driving. Further consideration should be made of other KPIs which could reveal the overall safety levels of vehicles on the roads, road infrastructure safety ratings, emergency service response times, and safety schemes implemented for those who drive for work.
Link to report https://www.transport.gov.scot/publication/development-of-
scotlands-2030-road-safety-casualty-targets-and-key-performance-indicators/
Title Transport and Travel in Scotland 2019: Results from the Scottish Household Survey
Publication date Sep 2020
Contractor In House
Purpose of research
Results from the 2019 SHS survey on travel behaviour and attitudes.
Main findings Infographic Summary
325
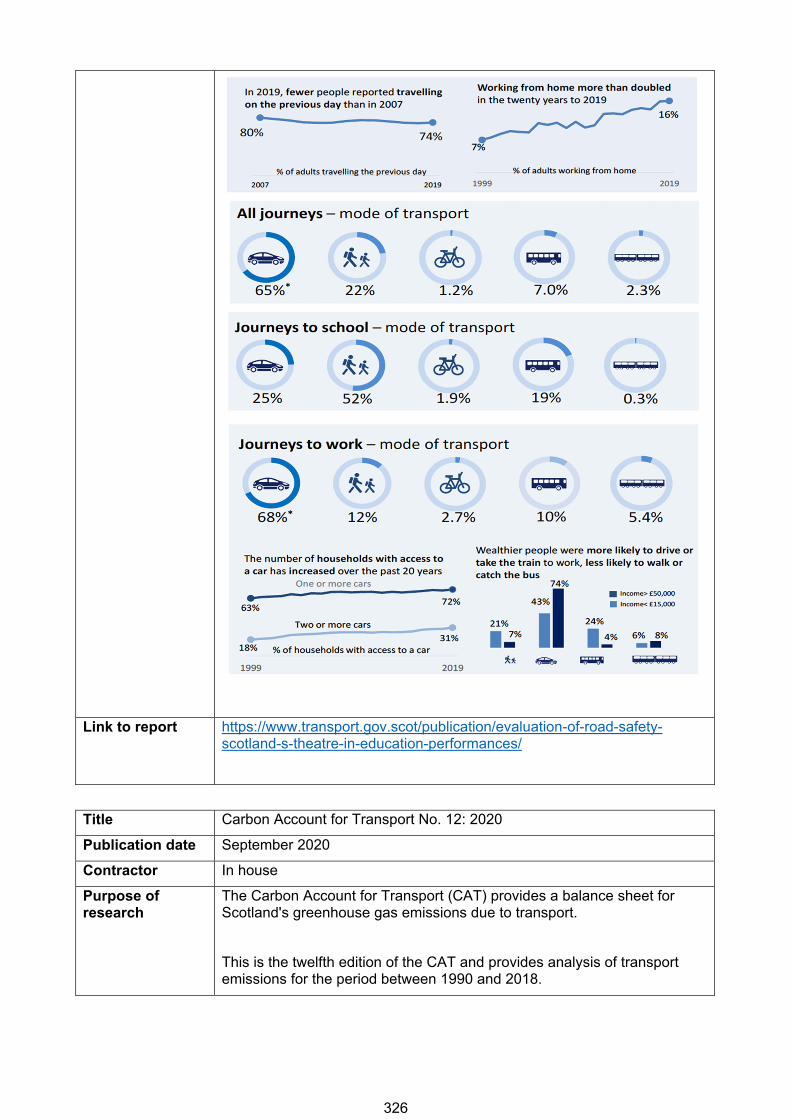
Link to report https://www.transport.gov.scot/publication/evaluation-of-road-safety-
scotland-s-theatre-in-education-performances/
Title Carbon Account for Transport No. 12: 2020
Publication date September 2020
Contractor In house
Purpose of research
The Carbon Account for Transport (CAT) provides a balance sheet for Scotland's greenhouse gas emissions due to transport.
This is the twelfth edition of the CAT and provides analysis of transport emissions for the period between 1990 and 2018.
326
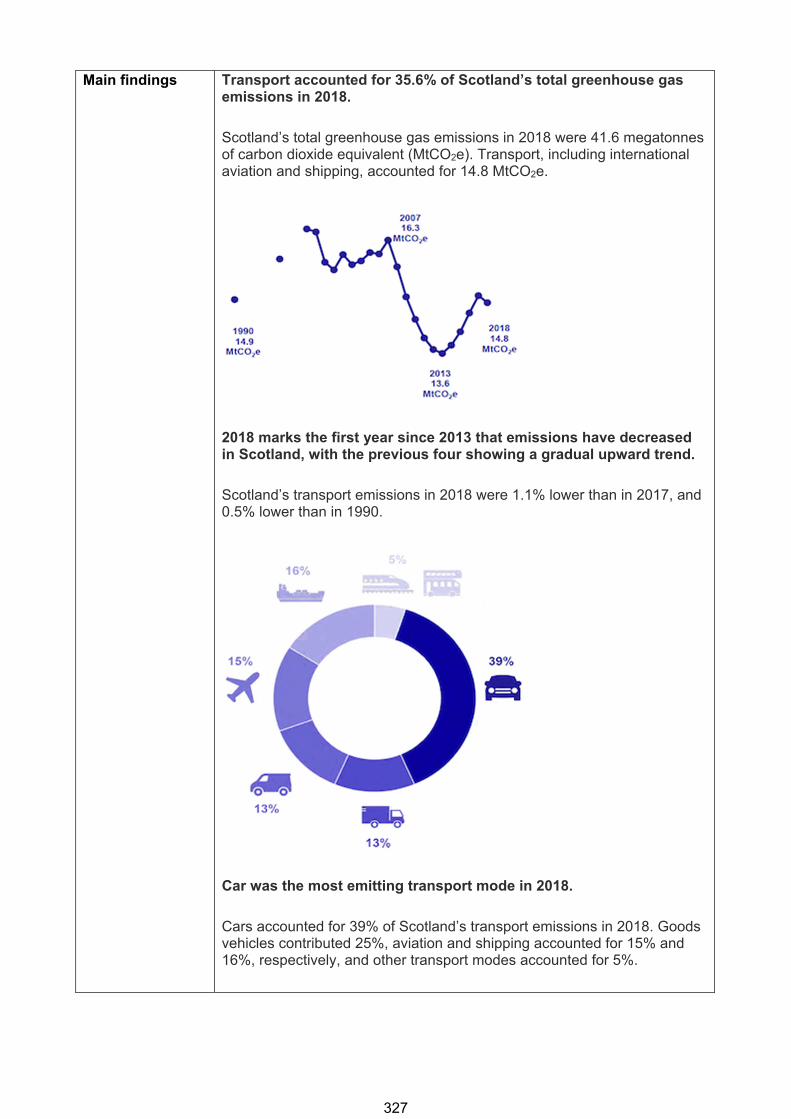
Main findings Transport accounted for 35.6% of Scotland’s total greenhouse gas emissions in 2018.
Scotland’s total greenhouse gas emissions in 2018 were 41.6 megatonnes of carbon dioxide equivalent (MtCO2e). Transport, including international aviation and shipping, accounted for 14.8 MtCO2e.
2018 marks the first year since 2013 that emissions have decreased in Scotland, with the previous four showing a gradual upward trend.
Scotland’s transport emissions in 2018 were 1.1% lower than in 2017, and 0.5% lower than in 1990.
Car was the most emitting transport mode in 2018.
Cars accounted for 39% of Scotland’s transport emissions in 2018. Goods vehicles contributed 25%, aviation and shipping accounted for 15% and 16%, respectively, and other transport modes accounted for 5%.
327
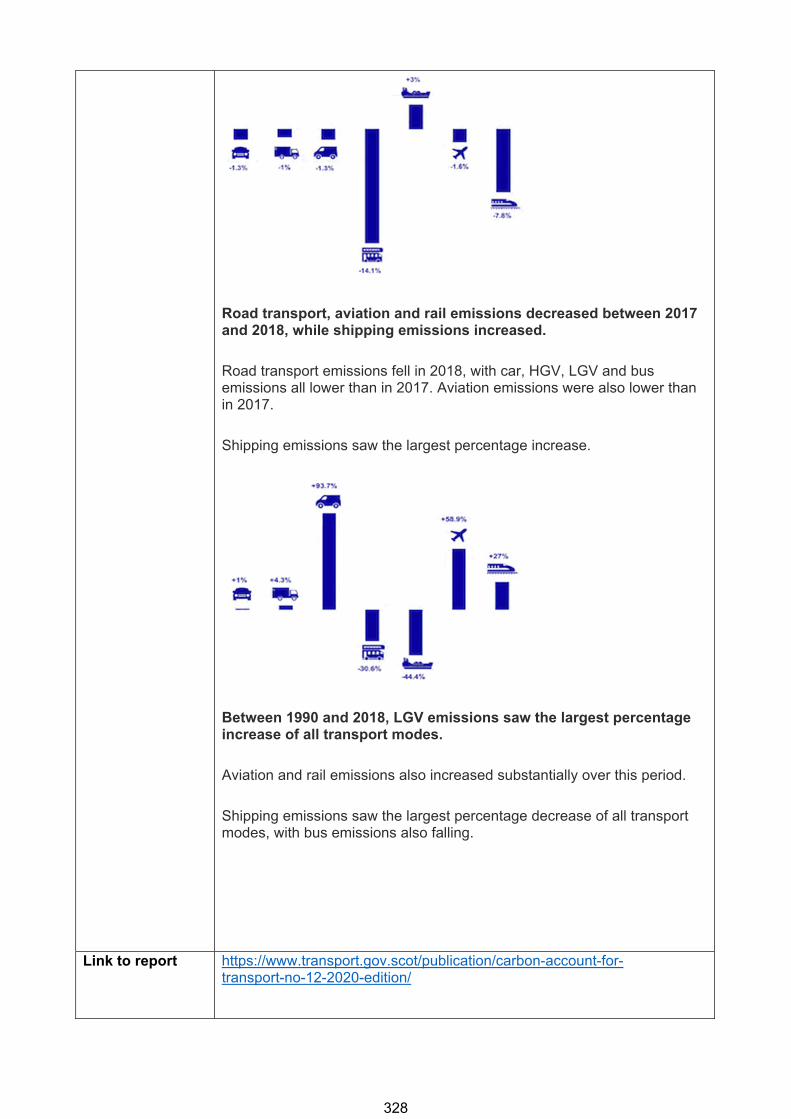
Road transport, aviation and rail emissions decreased between 2017 and 2018, while shipping emissions increased.
Road transport emissions fell in 2018, with car, HGV, LGV and bus emissions all lower than in 2017. Aviation emissions were also lower than in 2017.
Shipping emissions saw the largest percentage increase.
Between 1990 and 2018, LGV emissions saw the largest percentage increase of all transport modes.
Aviation and rail emissions also increased substantially over this period.
Shipping emissions saw the largest percentage decrease of all transport modes, with bus emissions also falling.
Link to report https://www.transport.gov.scot/publication/carbon-account-for-transport-no-12-2020-edition/
328
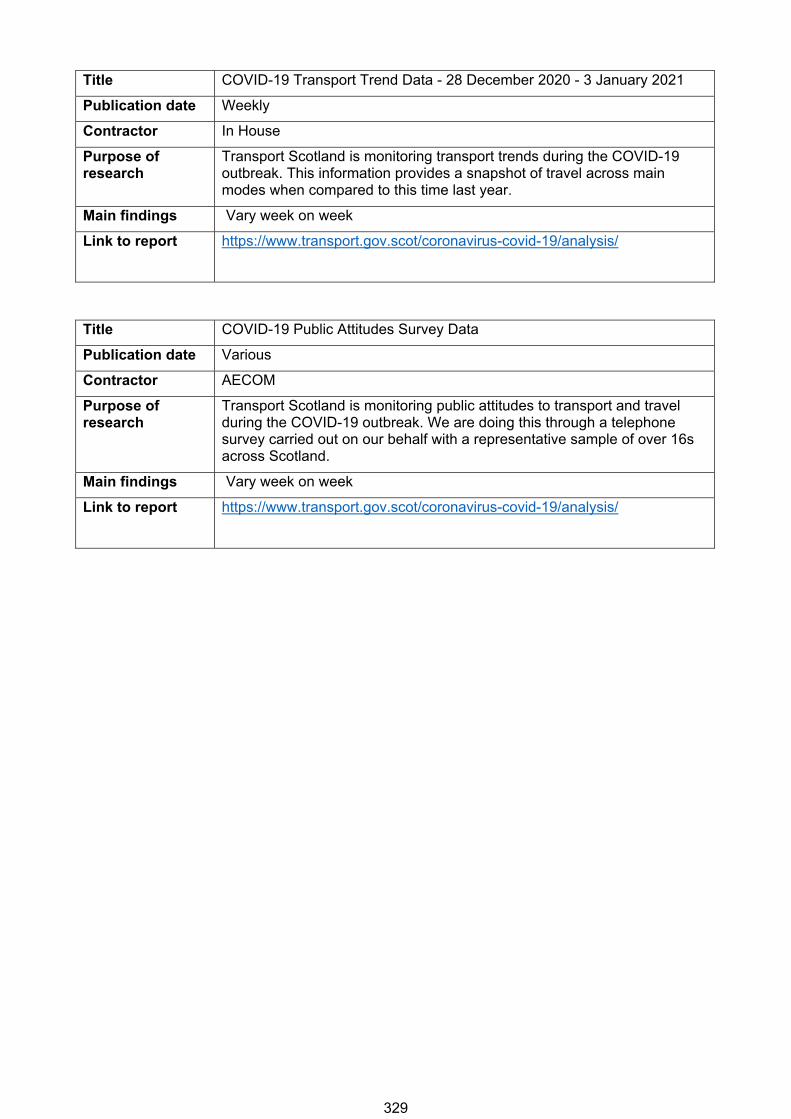
Title COVID-19 Transport Trend Data - 28 December 2020 - 3 January 2021
Publication date Weekly
Contractor In House
Purpose of research
Transport Scotland is monitoring transport trends during the COVID-19 outbreak. This information provides a snapshot of travel across main modes when compared to this time last year.
Main findings Vary week on week
Link to report https://www.transport.gov.scot/coronavirus-covid-19/analysis/
Title COVID-19 Public Attitudes Survey Data
Publication date Various
Contractor AECOM
Purpose of research
Transport Scotland is monitoring public attitudes to transport and travel during the COVID-19 outbreak. We are doing this through a telephone survey carried out on our behalf with a representative sample of over 16s across Scotland.
Main findings Vary week on week
Link to report https://www.transport.gov.scot/coronavirus-covid-19/analysis/
329
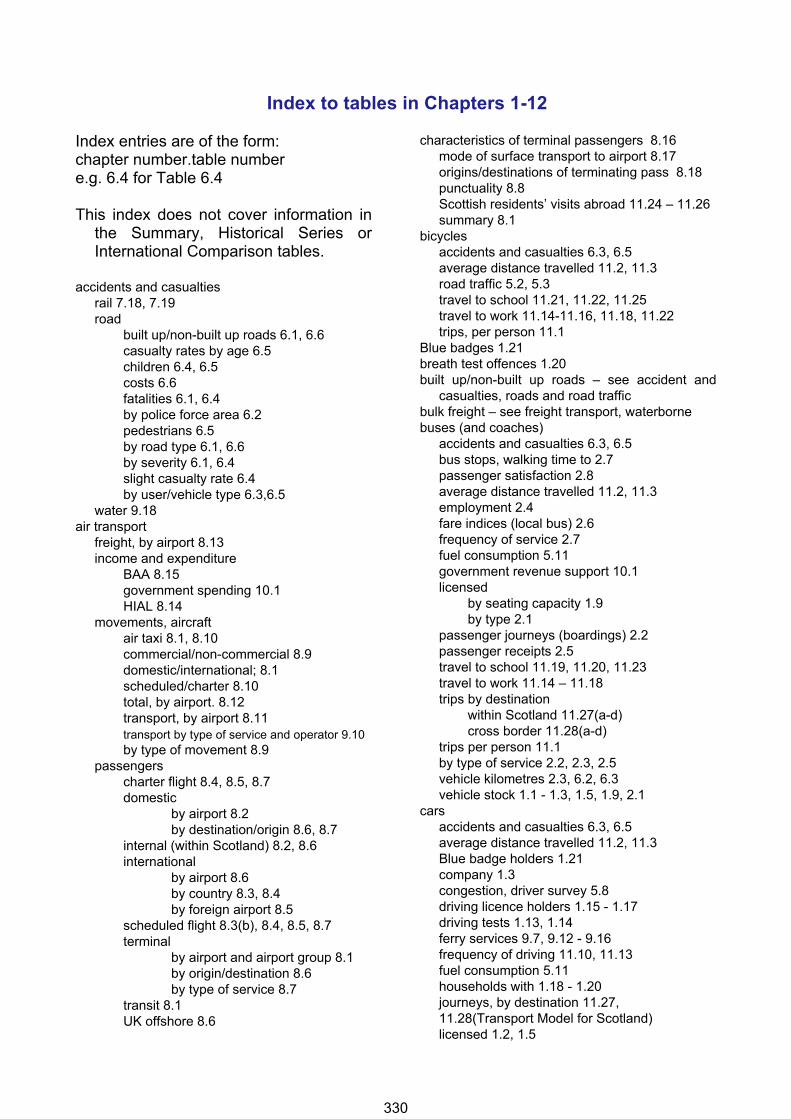
Index to tables in Chapters 1-12 Index entries are of the form: chapter number.table number e.g. 6.4 for Table 6.4 This index does not cover information in
the Summary, Historical Series or International Comparison tables.
accidents and casualties rail 7.18, 7.19 road built up/non-built up roads 6.1, 6.6 casualty rates by age 6.5 children 6.4, 6.5 costs 6.6 fatalities 6.1, 6.4 by police force area 6.2 pedestrians 6.5 by road type 6.1, 6.6 by severity 6.1, 6.4 slight casualty rate 6.4 by user/vehicle type 6.3,6.5 water 9.18 air transport freight, by airport 8.13 income and expenditure BAA 8.15 government spending 10.1 HIAL 8.14 movements, aircraft air taxi 8.1, 8.10 commercial/non-commercial 8.9 domestic/international; 8.1 scheduled/charter 8.10 total, by airport. 8.12 transport, by airport 8.11 transport by type of service and operator 9.10 by type of movement 8.9 passengers charter flight 8.4, 8.5, 8.7 domestic by airport 8.2 by destination/origin 8.6, 8.7 internal (within Scotland) 8.2, 8.6 international by airport 8.6 by country 8.3, 8.4 by foreign airport 8.5 scheduled flight 8.3(b), 8.4, 8.5, 8.7 terminal by airport and airport group 8.1 by origin/destination 8.6 by type of service 8.7 transit 8.1 UK offshore 8.6
characteristics of terminal passengers 8.16 mode of surface transport to airport 8.17 origins/destinations of terminating pass 8.18 punctuality 8.8 Scottish residents’ visits abroad 11.24 – 11.26 summary 8.1 bicycles accidents and casualties 6.3, 6.5 average distance travelled 11.2, 11.3 road traffic 5.2, 5.3 travel to school 11.21, 11.22, 11.25 travel to work 11.14-11.16, 11.18, 11.22 trips, per person 11.1 Blue badges 1.21 breath test offences 1.20 built up/non-built up roads – see accident and
casualties, roads and road traffic bulk freight – see freight transport, waterborne buses (and coaches) accidents and casualties 6.3, 6.5 bus stops, walking time to 2.7 passenger satisfaction 2.8 average distance travelled 11.2, 11.3 employment 2.4 fare indices (local bus) 2.6 frequency of service 2.7 fuel consumption 5.11 government revenue support 10.1 licensed by seating capacity 1.9 by type 2.1 passenger journeys (boardings) 2.2 passenger receipts 2.5 travel to school 11.19, 11.20, 11.23 travel to work 11.14 – 11.18 trips by destination within Scotland 11.27(a-d) cross border 11.28(a-d) trips per person 11.1 by type of service 2.2, 2.3, 2.5 vehicle kilometres 2.3, 6.2, 6.3 vehicle stock 1.1 - 1.3, 1.5, 1.9, 2.1 cars accidents and casualties 6.3, 6.5 average distance travelled 11.2, 11.3 Blue badge holders 1.21 company 1.3 congestion, driver survey 5.8 driving licence holders 1.15 - 1.17 driving tests 1.13, 1.14 ferry services 9.7, 9.12 - 9.16 frequency of driving 11.10, 11.13 fuel consumption 5.11 households with 1.18 - 1.20 journeys, by destination 11.27,
11.28(Transport Model for Scotland) licensed 1.2, 1.5
330
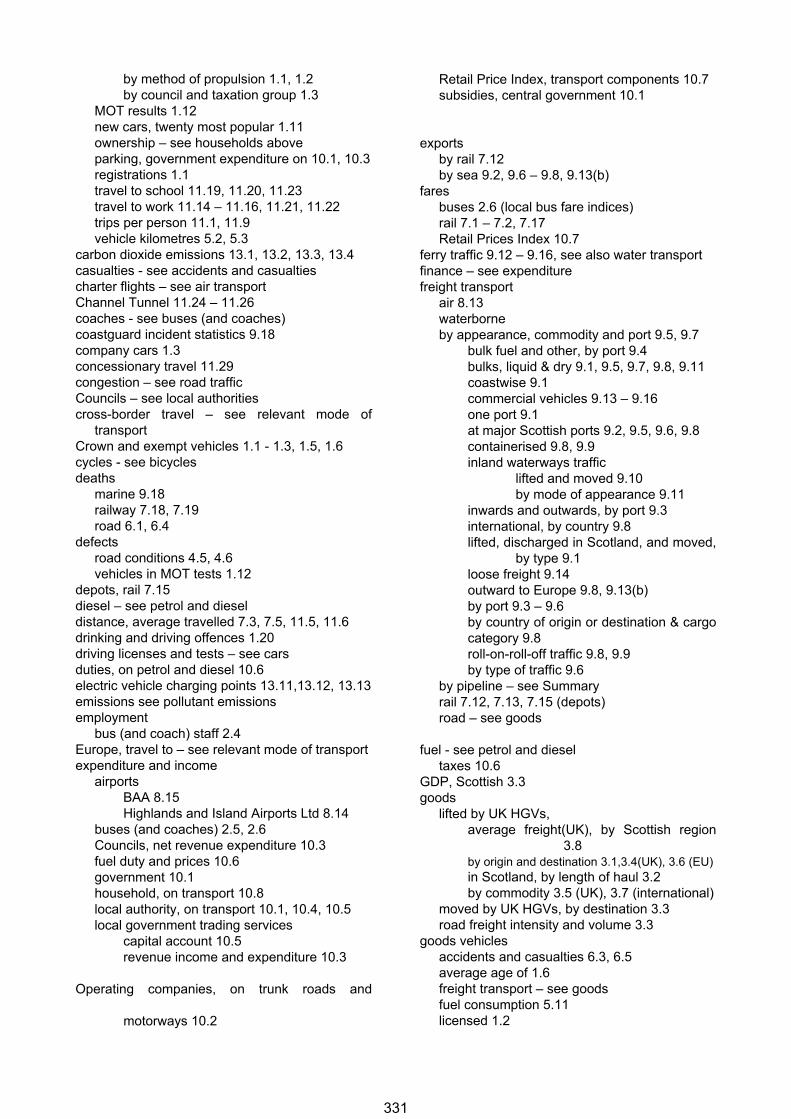
by method of propulsion 1.1, 1.2 by council and taxation group 1.3 MOT results 1.12 new cars, twenty most popular 1.11 ownership – see households above parking, government expenditure on 10.1, 10.3 registrations 1.1 travel to school 11.19, 11.20, 11.23 travel to work 11.14 – 11.16, 11.21, 11.22 trips per person 11.1, 11.9 vehicle kilometres 5.2, 5.3 carbon dioxide emissions 13.1, 13.2, 13.3, 13.4 casualties - see accidents and casualties charter flights – see air transport Channel Tunnel 11.24 – 11.26 coaches - see buses (and coaches) coastguard incident statistics 9.18 company cars 1.3 concessionary travel 11.29 congestion – see road traffic Councils – see local authorities cross-border travel – see relevant mode of
transport Crown and exempt vehicles 1.1 - 1.3, 1.5, 1.6 cycles - see bicycles deaths marine 9.18 railway 7.18, 7.19 road 6.1, 6.4 defects road conditions 4.5, 4.6 vehicles in MOT tests 1.12 depots, rail 7.15 diesel – see petrol and diesel distance, average travelled 7.3, 7.5, 11.5, 11.6 drinking and driving offences 1.20 driving licenses and tests – see cars duties, on petrol and diesel 10.6 electric vehicle charging points 13.11,13.12, 13.13 emissions see pollutant emissions employment bus (and coach) staff 2.4 Europe, travel to – see relevant mode of transport expenditure and income airports BAA 8.15 Highlands and Island Airports Ltd 8.14 buses (and coaches) 2.5, 2.6 Councils, net revenue expenditure 10.3 fuel duty and prices 10.6 government 10.1 household, on transport 10.8 local authority, on transport 10.1, 10.4, 10.5 local government trading services capital account 10.5 revenue income and expenditure 10.3 Operating companies, on trunk roads and
motorways 10.2
Retail Price Index, transport components 10.7 subsidies, central government 10.1 exports by rail 7.12 by sea 9.2, 9.6 – 9.8, 9.13(b) fares buses 2.6 (local bus fare indices) rail 7.1 – 7.2, 7.17 Retail Prices Index 10.7 ferry traffic 9.12 – 9.16, see also water transport finance – see expenditure freight transport air 8.13 waterborne by appearance, commodity and port 9.5, 9.7 bulk fuel and other, by port 9.4 bulks, liquid & dry 9.1, 9.5, 9.7, 9.8, 9.11 coastwise 9.1 commercial vehicles 9.13 – 9.16 one port 9.1 at major Scottish ports 9.2, 9.5, 9.6, 9.8 containerised 9.8, 9.9 inland waterways traffic lifted and moved 9.10 by mode of appearance 9.11 inwards and outwards, by port 9.3 international, by country 9.8 lifted, discharged in Scotland, and moved,
by type 9.1 loose freight 9.14 outward to Europe 9.8, 9.13(b) by port 9.3 – 9.6 by country of origin or destination & cargo
category 9.8 roll-on-roll-off traffic 9.8, 9.9 by type of traffic 9.6 by pipeline – see Summary rail 7.12, 7.13, 7.15 (depots) road – see goods fuel - see petrol and diesel taxes 10.6 GDP, Scottish 3.3 goods lifted by UK HGVs, average freight(UK), by Scottish region
3.8 by origin and destination 3.1,3.4(UK), 3.6 (EU) in Scotland, by length of haul 3.2 by commodity 3.5 (UK), 3.7 (international) moved by UK HGVs, by destination 3.3 road freight intensity and volume 3.3 goods vehicles accidents and casualties 6.3, 6.5 average age of 1.6 freight transport – see goods fuel consumption 5.11 licensed 1.2
331
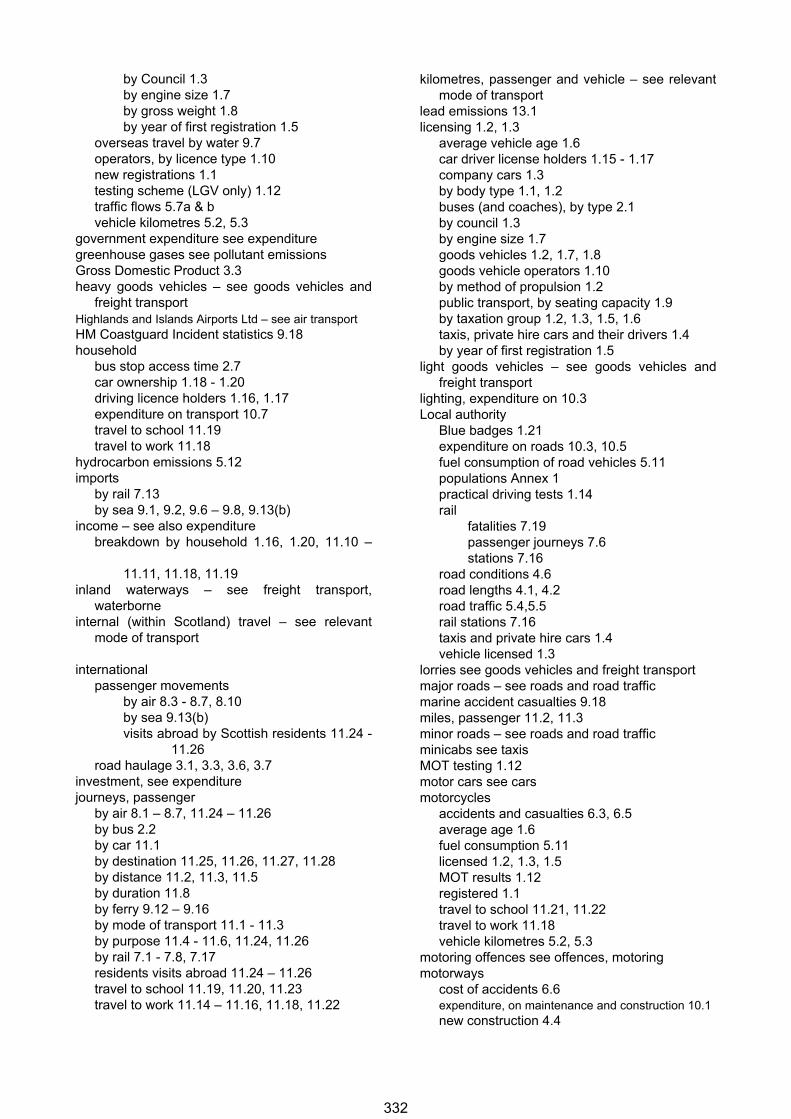
by Council 1.3 by engine size 1.7 by gross weight 1.8 by year of first registration 1.5 overseas travel by water 9.7 operators, by licence type 1.10 new registrations 1.1 testing scheme (LGV only) 1.12 traffic flows 5.7a & b vehicle kilometres 5.2, 5.3 government expenditure see expenditure greenhouse gases see pollutant emissions Gross Domestic Product 3.3 heavy goods vehicles – see goods vehicles and
freight transport Highlands and Islands Airports Ltd – see air transport HM Coastguard Incident statistics 9.18 household bus stop access time 2.7 car ownership 1.18 - 1.20 driving licence holders 1.16, 1.17 expenditure on transport 10.7 travel to school 11.19 travel to work 11.18 hydrocarbon emissions 5.12 imports by rail 7.13 by sea 9.1, 9.2, 9.6 – 9.8, 9.13(b) income – see also expenditure breakdown by household 1.16, 1.20, 11.10 –
11.11, 11.18, 11.19 inland waterways – see freight transport,
waterborne internal (within Scotland) travel – see relevant
mode of transport international passenger movements by air 8.3 - 8.7, 8.10 by sea 9.13(b) visits abroad by Scottish residents 11.24 -
11.26 road haulage 3.1, 3.3, 3.6, 3.7 investment, see expenditure journeys, passenger by air 8.1 – 8.7, 11.24 – 11.26 by bus 2.2 by car 11.1 by destination 11.25, 11.26, 11.27, 11.28 by distance 11.2, 11.3, 11.5 by duration 11.8 by ferry 9.12 – 9.16 by mode of transport 11.1 - 11.3 by purpose 11.4 - 11.6, 11.24, 11.26 by rail 7.1 - 7.8, 7.17 residents visits abroad 11.24 – 11.26 travel to school 11.19, 11.20, 11.23 travel to work 11.14 – 11.16, 11.18, 11.22
kilometres, passenger and vehicle – see relevant mode of transport
lead emissions 13.1 licensing 1.2, 1.3 average vehicle age 1.6 car driver license holders 1.15 - 1.17 company cars 1.3 by body type 1.1, 1.2 buses (and coaches), by type 2.1 by council 1.3 by engine size 1.7 goods vehicles 1.2, 1.7, 1.8 goods vehicle operators 1.10 by method of propulsion 1.2 public transport, by seating capacity 1.9 by taxation group 1.2, 1.3, 1.5, 1.6 taxis, private hire cars and their drivers 1.4 by year of first registration 1.5 light goods vehicles – see goods vehicles and
freight transport lighting, expenditure on 10.3 Local authority Blue badges 1.21 expenditure on roads 10.3, 10.5 fuel consumption of road vehicles 5.11 populations Annex 1 practical driving tests 1.14 rail fatalities 7.19 passenger journeys 7.6 stations 7.16 road conditions 4.6 road lengths 4.1, 4.2 road traffic 5.4,5.5 rail stations 7.16 taxis and private hire cars 1.4 vehicle licensed 1.3 lorries see goods vehicles and freight transport major roads – see roads and road traffic marine accident casualties 9.18 miles, passenger 11.2, 11.3 minor roads – see roads and road traffic minicabs see taxis MOT testing 1.12 motor cars see cars motorcycles accidents and casualties 6.3, 6.5 average age 1.6 fuel consumption 5.11 licensed 1.2, 1.3, 1.5 MOT results 1.12 registered 1.1 travel to school 11.21, 11.22 travel to work 11.18 vehicle kilometres 5.2, 5.3 motoring offences see offences, motoring motorways cost of accidents 6.6 expenditure, on maintenance and construction 10.1 new construction 4.4
332
length 4.1, 4.2 repaired 4.4 requiring monitoring 4.5 traffic on 5.1 - 5.4, 5.6, 5.7a & b movements, aircraft – see air transport National Passenger Survey (rail) 7.11 new cars, most popular – see cars nitrogen oxide emissions 13.1, 13.3 offences, motoring 1.20 overseas travel - see international particulate emissions 13.1 passenger journeys see journeys, passenger; and
under relevant mode of transport pedestrians casualties 6.5 average distance travelled 11.2, 11.3 frequency of walking 11.11, 11.13 travel to school 11.19, 11.20, 11.23 travel to work 11.14 - 11.16, 11.18, 11.22 trips, number of 11.1 personal and cross-modal travel by main mode, individual travel distance per year, average 11.2 trip length, average 11.3 trips per year 11.1, 11.9(by cars available) place of work 11.14 by purpose, individual travel distance per year, average 11.5 duration of trip, average 11.8 hours per year per person 11.7 trip length, average 11.6 trips per year 11.4 by socio-economic status driving, frequency of 11.10 school, travel to 11.19 walking, frequency of 11.11 work, travel to 11.18 Transport Model for Scotland within Scotland, by mode 11.27 cross-border, by mode 11.28 Traveline Scotland, usage 11.30 travel to work average time taken 11.15 usual mode of travel 11.14, 11.16, 11.18, 11.22 travel to school 11.19, 11.20, 11.23 visits abroad by Scottish residents 11.24 –
11.26 petrol and diesel deliveries 5.10 duties 10.6 motor vehicles registered and licensed by 1.1, 1.2 prices 10.6 consumption, by vehicle type/council area 5.11 pipelines – see Summary place of work 11.17, 11.21 pollutant emissions 13.1, 13.2, 13.3, 13.4 population estimates, by local authority, Annex 1 ports exports/imports 9.1, 9.2, 9.6 – 9.8, 9.13(b)
ferries see also freight transport and water
transport to Northern Ireland 9.13(a) to Europe 9.13(b) shipping services 9.13 Caledonian MacBrayne 9.15 other major routes 9.16 reliability of lifeline services 9.17 foreign and domestic traffic by port 9.3 vehicle and passenger ferry traffic 9.12 - 9.16 private motoring – see cars and motorcycles public expenditure see expenditure, government public transport – see individual transport mode
headings e.g. buses punctuality aircraft 8.8 ferries 9.16 passenger’s views 2.8, 7.11 rail 7.9 - 7.10 road traffic delays 5.9, 5.10 rail accidents and casualties 7.18, 7.19 average distance travelled 11.2, 11.3 distances travelled by passengers to
Aberdeen, Edinburgh and Glasgow 7.5 expenditure 10.1, 10.4 freight 7.12, 7.13 Glasgow Subway 7.17 household expenditure on 10.7 passenger journeys concessionary 11.29 cross-border 7.1, 7.2, 7.4 (by region) by fare type 7.1, 7.2 internal (within Scotland) 7.1, 7.6 (by
local authority) by origin/destination 7.4, 7.6 – 7.8 originating in Scotland 7.1 ScotRail and SPTE 7.3, 7.17 passenger kilometres 7.3 passenger revenue 7.1 – 7.2, 7.17 passenger satisfaction survey 7.11 punctuality and reliability 7.9, 7.10 route length 7.14 RPI component 10.7 stations freight 7.15 hundred busiest 7.7 new or re-opened (since 1970) 7.8 open 7.15, 7.16 (by local authority) track (route kilometres) 7.14 train kilometres 7.12, 7.13, 7.17 Transport Model for Scotland, by destination
11.27, 11.28 travel to school 11.19, 11.23 travel to work 11.14 - 11.16, 11.18, 11.22
333
trips per person 11.1 receipts, passenger – see individual transport
modes; also, fares regional breakdowns – see topic of interest; also
local authorities registrations, vehicle 1.1, 2.1 reliability – see punctuality and reliability Retail Prices Index and bus fares 2.6 and Gross Domestic Product 2.5, 3.3 transport components 10.7 revenue support, public transport 10.1, 10.3 see also individual modes of transport rivers freight traffic on major 9.10, 9.11 road accidents and casualties – see accidents and
casualties road class, for breakdown by - see appropriate
topic heading road freight – see freight transport, road; also,
goods road freight intensity and Scottish GDP 3.3 road traffic see also under individual modes of transport congestion, driver survey 5.8 by council/local authority area 5.4, 5.5 daily traffic flow at key points 5.1, 5.6, 5.7a & b fuel consumption, by vehicle type and council
area 5.11 fuel deliveries 5.10 pollutant emissions 13.1 by vehicle type 5.2, 5.3 by road type 5.1 – 5.5 roads construction and repair (Trunk) 4.3, 4.4 dual carriageway 4.1, 4.5(c) expenditure council 10.3 - 10.5 government 10.1, 10.3 - 10.5 Operating Companies 10.2 infrastructure 4.1, 4.2 length by class of road and council area 4.2 by road type 4.1, 4.2 by speed limit 4.1 motorway network 4.1, 4.2, 4.5(c) motorway slips 4.1, 4.2 network condition 4.5, 5.6 roll-on roll-off ferry
traffic 9.8, 9.9 rural roads – see roads, road traffic, and accidents
and casualties scheduled flights – see air transport school – see personal and cross-modal travel ScotRail – see rail speed limits breakdown by – see individual topic heading
offences 1.20 staff - see employment stations – see rail, stations Strathclyde PTE – see rail taxes and duties on petrol and diesel 10.6 taxis concessionary travel 11.29 licensed 1.2, 1.4 passenger distance travelled 11.2, 11.3 registered 1.1 terminal passengers – see air transport time lost 5.9, 5.10 time spent travelling per year 11.7 traffic see road traffic trains see rail transport components, Retail Prices Index 10.7 Transport Model for Scotland – see personal and
cross-modal travel Traveline Scotland 11.30 travel to school/work - see personal and cross-
modal travel trunk roads – see roads and road traffic unleaded petrol – see petrol and diesel urban roads – see roads, road traffic, and accidents
and casualties vehicles – see bicycles, buses, cars, goods
vehicles, motorcycles vehicle kilometres 2.3, 6.2, 6.3 vehicles licensed – see licensing walking see pedestrians water transport Caledonian MacBrayne traffic 9.15 reliability and punctuality 9.17 coastguard incident statistics 9.18 European traffic 9.13(b) freight – see freight transport, waterborne Ireland 9.13(a) major ferry services (non-Cal Mac) 9.16 operating companies 9.13 reliability and punctuality 9.17 traffic, car, bus and passenger 9.12 – 9.16 user revenue and subsidies 9.13 weekday travel 11.27, 11.28 work - see personal and cross-modal trave
334
Transport Scotland Statistics publications
Transport and Travel in Scotland Annual. Summarises a broad range of transport statistics including road vehicles, traffic, casualties, bus and rail passengers, road and rail freight, air and water transport and personal travel. Further breakdowns of Scottish Household Survey transport data including households' access to cars and bikes, frequency of driving, modes of travel to work and school, use and opinions of public transport and access to services are also presented.
From the 2014 release onwards, this publication includes findings from the Scottish Household Survey Travel Diary. Latest edition: provides figures up to 2019, published September 2020 Web only
SHS Transport: Local Area Analysis Annual. Provides SHS information for Local Authorities and Regional Transport Partnership areas.
Latest edition: provides figures for 2019, published September 2020 Web tables only
Key Reported Road Casualty Statistics Annual. Provisional figures on accidents, casualties by severity, casualties by type of road, casualties by mode of transport, and child casualties, including trends in recent years and progress towards the casualty reduction targets for the year 2020. Also figures by Police Force and local authority.
Latest edition: provides figures up to 2019; published in July 2020 Web only
Reported Road Casualties Scotland Annual. More detailed tables on accidents, motorists and casualties, and country comparisons. Also includes 2020 casualty reduction targets, estimates of undercounting of road casualties, Contributory Factor data and compares the reported numbers of casualties with information from other sources. Detailed tables on Accidents, Accident costs, Vehicles involved, Drivers and riders, Drivers breath tested, Drink-drive accidents and casualties, and Casualties.
Latest edition: provides figures up to 2019, published in October 2020
Published Annually Web only
Scottish Household Survey Travel Diary results
Discontinued: These results are now published within the Transport and Travel in Scotland publication.
Provides details of journeys made collected via the Travel Diary. Includes purposes for travel, distances, the times of day at which trips start, duration of journeys, days of the week and car occupancy levels.
Last release (webtables): 2012 figures, trends since 2002; published November 2013. Web only
Last detailed biennial data: figures to 2009/10, trends since 1999; published Nov 2011. Web only
National Travel Survey Scottish Results Biennial.
Discontinued: DfT no longer collect data for Scotland and this publication is no longer updated.
These web-tables provides trends on the average number of journeys and average distance travelled per person per year, including average journey length, main mode of travel, journey purpose.
Last edition: figures up to 2009/2010; published in March 2012 Web only
335
Bus and Coach Statistics Annual.
Discontinued: The bus chapter in Scottish Transport Statistics has now been expanded to include the findings from this publication.
Presents Department for Transport statistics on bus and coach operators, and some related Scottish Household Survey (SHS) results. Includes: vehicle kms, patronage levels, fare indices; passenger receipts; public transport support and concessionary fare reimbursement; adults' frequency of use of local bus services; views on aspects of bus services; travel to work by bus; reasons for not using buses; safety on buses; concessionary travel passes.
Last release (webtables): figures up to 2010-11; published February 2012 Web only
Transport Statistics publications produced by other administrations
The Department for Transport (DfT) produces many statistical publications, most of which provide detailed breakdowns of the figures for GB/UK as a whole. However, some contain statistics for Scotland.
DfT's annual Regional Transport Statistics bulletin gives figures on many topics for Scotland, Wales, Northern Ireland and each of the regions of England. It should be the "first port of call" for anyone who wishes to compare any figures for transport in Scotland with those for some or all of the other parts of GB/UK.
Other DfT publications include some figures for Scotland, such as Transport Statistics Great Britain (which, like Scottish Transport Statistics, contains figures on many different aspects of Transport), Maritime Statistics, Public Transport Statistics, and Road Casualties Great Britain. Further information about DfT Transport Statistics publications is available via: http://tinyurl.com/nm8re6m
The Welsh Assembly Government produces various publications which contain statistics on transport in Wales, in particular Welsh Transport Statistics. More information is available via: http://new.wales.gov.uk
The statistical publications produced in Northern Ireland include Northern Ireland Transport Statistics. More information is available via: www.drdni.gov.uk/index/statistics.htm
336
TRANSPORT STATISTICS USERS’ GROUP The Transport Statistics Users’ Group (TSUG) was set up in 1985 as a result of an initiative by the Statistics Users Council and the The Institute of Logistics and Transport (then known as The Chartered Institute of Transport).
From its inception TSUG has had strong links with the government departments responsible for transport statistics. It has developed an excellent working relationship with the Transport Analytical Services Team of Transport Scotland.
The aims of TSUG are:
to identify problems in the provision and understanding of transport statistics, and to discuss solutions with the responsible authorities;
to provide a forum for the exchange of views and information between users and providers;
to encourage the proper use of statistics through greater publicity.
to facilitate a network for sharing ideas, information and expertise.
The main activities of TSUG are:
The production of a regular Newsletter containing news and reviews of matters relating to transport statistics and the TSUG membership.
The organisation of Seminars addressing contemporary issues in the field of transport statistics. Most seminars are held in London, but there is an annual seminar in Edinburgh and other ad hoc regional seminars. Reports of seminars appear in the Newsletter.
The maintenance of a Website which TSUG Members can use to find out about and book on TSUG
seminars, and access an information archive.
The membership of TSUG includes government agencies, local authorities, trade associations, transport consultants, transport operators and universities, as well as individual professionals. Corporate membership of the Group is £50, personal membership £22.50, and student membership £10. For further information about TSUG and membership, please visit the website at www.tsug.org.uk or contact:
TSUG Membership Secretary TSUG Representative for Scotland
Heather Ward Dr Jock Robertson
Department of Civil, Tel: 01529 497354
Environmental & Geomatic Engineering Mobile: 07712 750658
UCL Email: [email protected]
Gower Street
London WC1E 6BT
Tel: 020 7679 1564
Email: [email protected]
337
A NATIONAL STATISTICS PUBLICATION FOR SCOTLAND
The United Kingdom Statistics Authority has designated these statistics as National Statistics, in accordance with the Statistics and Registration Service Act 2007 and signifying compliance with the Code of Practice for Official Statistics.
Designation can be interpreted to mean that the statistics: meet identified user needs; are produced, managed and disseminated to high standards; and are explained well.
Correspondence and enquiries
For enquiries about this publication please contact:
Andrew Knight,
Transport Scotland Analytical Services,
Telephone: 0131 244 7256,
e-mail: [email protected]
For general enquiries about Scottish Government statistics please contact:
Office of the Chief Statistician, Telephone: 0131 244 0442,
e-mail: [email protected]
How to access background or source data
The data collected for this statistical bulletin:
☒ are available in more detail through Scottish Neighbourhood Statistics
☐are available as part of a GB dataset on data.gov.uk
☒ may be made available on request, subject to consideration of legal and ethical factors. Pleasecontact [email protected] for further information.
☐ cannot be made available by Scottish Government for further analysis as Scottish Government isnot the data controller.
Complaints and suggestions
If you are not satisfied with our service or have any comments or suggestions, please write to the Chief Statistician, 3WR, St Andrews House, Edinburgh, EH1 3DG, Telephone: (0131) 244 0302,
e-mail [email protected]
If you would like to be consulted about statistical collections or receive notification of publications, please register your interest at http://www.gov.scot/scotstat
Details of forthcoming publications can be found at http://www.gov.scot/statistics
Most recent editions of Transport Statistics Publications - available here http://www.transport.gov.scot/statistics/statistical-publications
Title Last published Price Scottish Transport Statistics February 2021 Web only
Transport and Travel in Scotland (TATIS) September 2020 Web only
Reported Road Casualties Scotland October 2020 Web only
Key Reported Road Casualty Statistics July 2020 Web only
ISSN 1351 3869 ISBN 978-1-911672-07-4
Crown Copyright
You may use or re-use this information (not including logos) free of charge in any format or medium, under the terms of the Open Government Licence. See: www.nationalarchives.gov.uk/doc/open-government-licence/
338

339
Follow us:
transcotland
@transcotland
transport.gov.scot
© Crown copyright 2021
You may re-use this information (excluding logos and images) free of charge in any format or medium, under the terms of the Open Government Licence. To view this licence, visit http://www.nationalarchives.gov.uk/doc/open-government-licence or e-mail: [email protected]
Where we have identified any third party copyright information you will need to obtain permission from the copyright holders concerned.
Further copies of this document are available, on request, in audio and visual formats and in community languages. Any enquiries regarding this document / publication should be sent to us at [email protected]
This document is also available on the Transport Scotland website: www.transport.gov.scot
Published by Transport Scotland, February 2021
Related Documents