ISSN 1830-5881

Welcome message from author
This document is posted to help you gain knowledge. Please leave a comment to let me know what you think about it! Share it to your friends and learn new things together.
Transcript

ISSN 1830-5881

Scoreboard 20 ❍ Internal Market ❍ December 20092
The Commission is keen to receive feedback on this Scoreboard, and to have suggestions for future editions. Please send reactions to Mr. Jörgen Holmquist, Director General, Internal Market and Services DG, The European Commission, B-1049 Brussels, or to the following e-mail address: [email protected]
Please also use this address if you would like to receive a copy of this or future Scoreboards.
Editor: Veronica Rego Casais -Internal Market and Services Directorate-General-
More information on the European Union is available on the Internet.(http://europa.eu and http://ec.europa.eu/citizensrights)
Cataloguing data can be found at the end of this publication.
Luxembourg: Publications Office of the European Union, 2010
ISSN 1830-5881
© European Union, 2010Reproduction is authorised provided the source is acknowledged.
Printed in Belgium
Printed on white chlorine-free paper

Scoreboard 20 ❍ Internal Market ❍ December 2009 3
TABLE OF CONTENTS
MAIN FINDINGS
1. STATE OF TRANSPOSITION OF INTERNAL MARKET LEGISLATION INTO NATIONAL LAW
Average transposition deficit in November 2009
First challenge – All Member States achieving the 1% target
Second challenge – All Member States achieving the “zero tolerance” target
Third challenge – Reducing the transposition delays
Fourth challenge – Improving the conformity of the legislation
Fragmentation of the Internal Market
Looking ahead
2. INFRINGEMENT PROCEDURES FOR WRONG APPLICATION OF INTERNAL MARKET RULES
Evolution of the number of infringement proceedings
Number of infringement proceedings – Breakdown per Member State
Number of infringement proceedings – Breakdown per sector
Number of infringement proceedings – Breakdown by type
Duration – Time required to resolve infringement proceedings
Duration – Early resolution rate
Duration – Member States’ compliance with judgments of the Court of Justice
5
727
8
10
13
15
17
192
21
21
22
23
24
25
272
28

Scoreboard 20 ❍ Internal Market ❍ December 20094

Scoreboard 20 ❍ Internal Market ❍ December 2009 5
MAIN FINDINGS
Transposition
It is the first time ever that the EU average transposition deficit is better than the interim target set by Heads of State and Government. At 0.7% the EU average transposition deficit is well below the interim target of 1% to be achieved by 2009. This is a welcome improvement on the previous position. In total, 16 Member States achieved or equalled their best result ever: Belgium, the Czech Republic, Estonia, Spain, France, Cyprus, Latvia, Lithuania, Luxembourg, Hungary, Malta, Portugal, Romania, Slovakia, Finland and the United Kingdom. Lithuania and Malta are the overall best performers with 3 directives away from a perfect score.
Moreover, Member States managed to improve on the three challenges highlighted in the previous Internal Market Scoreboard n°19.
On the challenge calling for a reduction of long overdue directives, Member States managed to decrease the number of long overdue directives from 22 to 16 within the last six months.
As to the challenge to bring the deficit in line with the 1% target the number of Member States achieving the target went up from 18 to 20. The Member States still not in line with the 1% target are the following: Austria, Portugal, the Czech Republic, Poland, Italy, Luxembourg and Greece. This being said, with the exception of Austria, all 7 Member States managed to considerably reduce their deficits.
In line with the third challenge Member States managed to reduce the number of directives not correctly transposed. Adding the number of directives not correctly transposed to the number of directives not transposed in time results in an EU average deficit of 1.5% compared to 1.8% half a year ago.
While these achievements are highly welcome there is scope for further improvements. A further challenge is therefore added in this Internal Market Scoreboard edition calling on all Member States to put an increased focus on the need to reduce transposition delays. Today, on average Member States take an extra 9 months to transpose directives after the transposition deadline expires. Greece and Luxembourg are the worst offenders in this respect.
It is to be noted, finally, that the fragmentation factor on Internal Market legislation decreased to 5% which translates into 74 Internal Market directives not producing their full effect in the whole EU. In other words, the Internal Market is still operating at only 95% of its potential. Hence, more efforts are needed to further reduce the fragmentation factor.
Infringements
The overall number of infringement proceedings has decreased slightly by 1.2% compared to half a year ago. As in previous years, the areas of “taxation and custom union” and “environment” remain the biggest sources of infringements.
Italy accounts for most of the open infringement proceedings, followed by Greece and Spain. The average time used to resolve infringements rose. Compared to December 2007 the time needed has increased from 25 months to 28 for EU 15 and from 12 months to 16 for EU 12.
In addition, Member States take considerable time to comply with rulings of the Court of Justice. For example, Austria and Spain take on average approximately 25 months to comply with such rulings.

Scoreboard 20 ❍ Internal Market ❍ December 20096

Scoreboard 20 ❍ Internal Market ❍ December 2009 7
A well functioning Internal Market results in increased opportunities for businesses and citizens. But the Internal Market does not deliver benefits automatically. Member States need to transpose Internal Market legislation into their national law within the deadline they have agreed among themselves. Timely transposition is a necessary condition for achieving the policy objectives set out in the relevant legislation. Moreover, it is important for the credibility of the Internal Market in the eyes of the public. This is why EU Heads of State and Government have repeatedly called on Member States to improve their transposition records1.
STATE OF TRANSPOSITION OF INTERNAL MARKET LEGISLATION INTO NATIONAL LAW
1.
1 Conclusions of the European Council summits of Stockholm (23-24 March 2001), Barcelona (15-16 March 2002), Brussels (20-21 March 2003, 25-26 March 2004 and 8-9 March 2007). The targets were agreed at the following summits: Stockholm (1.5%), Barcelona (0% for long overdue directives), Brussels 2007 (1%).
2 Internal Market directives are directives considered to have an impact on the functioning of the internal market as defined in Articles 26 and 114 (1) of the Treaty on the Functioning of the European Union (at the time of the notification deadline Articles 14 and 95 of EC Treaty). This includes the four freedoms and the supporting policies having a direct impact on the functioning of the Internal Market (a.o. taxation, employment and social policy, education and culture, public health and consumer protection, energy, transport and environment except nature protection).
3 Conclusions of the European Council summits of Brussels on 8-9 March 2007.
At 0.7%, the EU average transposition deficit for the 27 Member States is well below the interim target of 1% agreed by the Heads of State and Government in 20073. This is a welcome improvement on the previous position and the first time that Member States achieve a better result than they have agreed upon.
The transposition deficit shows the percentage of notifications of Internal Market directives not yet communicated to the Commission, in relation to the total number of notifications which should have been communicated by the deadline. The current Scoreboard takes into account all notifications of directives with a transposition deadline until 31 October 2009 which have been notified by 10 November 2009. As of 31 October 2009, 1521 directives and 976 regulations relate to the functioning of the Internal Market2.
Figure 1: Best EU average transposition deficit ever !
Average transposition deficit in November 2009
6.3
3.93.6
3.0
2.0 2.12.3
3.6
1.61.2 1.2
1.00.7
0
1
2
3
4
5
6
7
1997 1998 1999 2000 2001 2002 2003 2004 2005 2006 2007 2008 2009
Percentage
EU25
EU27
EFTA7.8
5.5
3.7 3.9
1.8 1.50.9
1.7 1.6 1.4 1.7 1.30.7
0
2
4
6
8
1997
1998
1999
2000
2001
2002
2003
2004
2005
2006
2007
2008
2009

Scoreboard 20 ❍ Internal Market ❍ December 20098
It reflects the high priority given by Member States to timely transposition. The constant and important decrease in the average transposition deficit since 2004 suggests that the “best practices in transposition” as laid down in the Commission Recommendation of 20044 may have provided useful guidance to Member States on how to meet this challenge. Moreover, it would seem that Member States have focused their efforts on tackling the three challenges identified in the last edition of the Internal Market Scoreboard: 1) eliminating long overdue directives; 2) all Member States achieving the 1% target and 3) improving the correct transposition of EU legislation.
It is a source of great satisfaction that Member States managed to further reduce the transposition deficit and that they delivered on all three challenges. Therefore, Member States and their authorities are to be congratulated on these developments.
This edition of the Internal Market Scoreboard will continue to put the spotlight on these three challenges.
Moreover, it introduces an additional challenge as regards the reduction of average transposition delays. If Member States do not transpose Internal Market directives on time, they deprive businesses and citizens of their rights and of the full benefits of a properly functioning Internal Market. In fact, the longer the delay is, the more serious are the consequences. It would seem appropriate, therefore, to look not only at the number of directives being transposed too late but also the duration of the delay itself.
4 Commission Recommendation of 12 July 2004 on the transposition into national law of Directives affecting the internal market, OJ L 98 of 16.04.2005, p.47 and following.
5 Conclusions of the European Council summit of Brussels on 8-9 March 2007.
The number of Member States in line with the European Council’s 1% deficit target5 increased from 18 to 20 Member States. The United Kingdom, Estonia and Belgium have joined this group, whereas Austria dropped out.
First challenge – All Member States achieving the 1% target
Figure 2: 20 Member States achieved the 1% target
Transposition deficit of the Member States that achieved the 1% target as of 10 November 2009.
● 14 out of the 20 Member States achieved or equalled their best result ever: Lithuania, Malta, Denmark, Romania, Hungary, Latvia, Slovakia, Sweden, Spain, the United Kingdom, France, Estonia, Cyprus and Belgium. Latvia and Spain achieved the highest decrease among those Member States that were in line with the 1% target already six months ago, improving on their already enviable transposition deficit by 0.3%.
● Lithuania and Malta share the first place with 3 directives awaiting transposition. Malta deserves praise for its ranking in first position for the third consecutive time.
0.2 0.2 0.3 0.3 0.3 0.4 0.4 0.4 0.4 0.5 0.5 0.5 0.5 0.6 0.7 0.7 0.7 0.8 0.9 1.00.0
1.0
LT3
MT3
BG4
DK4
RO4
HU6
LV6
SK6
SE6
NL7
SI7
ES8
FI8
DE9
FR10
EE11
UK11
CY12
BE13
IE15
Number of directives not notified
Per
cent
age
1.0%target

Scoreboard 20 ❍ Internal Market ❍ December 2009 9
Half a year ago 9 Member States failed to achieve the 1% target, in some cases reflecting a transposition deficit of more than double the EU average. These Member States were called upon to reinforce their efforts to bring their transposition deficit in line with the 1% target. It is a source of satisfaction that all 9 Member States (the United Kingdom, Belgium, Estonia, Luxembourg, Italy, the Czech Republic, Portugal, Poland and Greece) have made serious progress in reducing their transposition deficit.
Figure 3: Vast majority of Member States have made enormous progress over the last 6 months, while only 4 Member States are sliding back
Change in the number of outstanding directives since Scoreboard n°19 of July 2009.
-16
-12 -12-11 -11
-7 -7-6 -6
-5 -5-4 -4 -4 -4 -4
-3-2
+2+2+1+100
-1-1-1
-20
-15
-10
-5
0
5
PT PL EE EL CZ BE UK LV IT LU ES CY SE LT HU DE FR NL BG RO SK MT SI DK AT FI IE
Cha
nge
in th
e nu
mbe
r of
dire
ctiv
es n
ot c
omm
unic
ated
EFTA
+3-2 +2
-5
0
5
LI NO IS
By comparing Member States’ current transposition performance with that recorded on July 2009, the following conclusions can be drawn:
● In total, 21 Member States have made progress, while 4 Member States have slightly increased their backlogs and 2 Member States equalled their previous result. In particular Portugal, followed by Poland and Estonia made a huge leap forward within the last six months.
● On the other hand one can observe that even the slightest relaxing of transposition efforts might have a negative impact on the transposition ranking. By adding one directive to their backlog within the last six months, Denmark lost its first position on the transposition performance and Austria went above the ceiling missing the 1% target. Finland added two more directives and moved down from fifth to twelfth position compared to half a year ago. Ireland’s deteriorating performance means that they may miss the 1% target next time.
Transposition requires a permanent effort and any relaxation quickly means that deficit rises again.
Another positive consequence of the enormous progress in reducing the transposition deficit is that the number of Member States not in line with the 1% target further decreased.

Scoreboard 20 ❍ Internal Market ❍ December 200910
Figure 4: 7 Member States remaining above the ceiling of the 1.0 % targetEFTA
0.5 1.30.40.0
1.0
LI
7
NO
8
IS
22
1.1 1.1 1.2 1.4 1.4 1.4 1.50.0
1.0
2.0
3.0
AT
16
PT
16
CZ
19
PL
21
IT
22
LU
22
EL
23
Number of directives not notified
Per
cent
age
1.0%target
Transposition deficit of the Member States that missed the 1% target as of 10 November 2009.
● Today, 7 Member States are not in line with the 1% target compared to 9 Member States six month ago.
● With the exception of Austria, all these Member States managed to reduce their transposition deficit. Thereby, 3 of these Member States achieved their best score ever: Portugal, the Czech Republic and Luxembourg.
● 1.5% represents the highest deficit now, whereas six Member States were way above this percentage only half a year ago: Luxembourg, Italy, the Czech Republic, Portugal, Poland and Greece.
Second challenge – All Member States achieving the “zero tolerance” target
Ensuring that delays in transposing Internal Market directives into national law do not become too long is important. This is why the European Heads of State and Government set a “zero tolerance” target for directives whose transposition is late by more than two years6. Such long transposition delays cause serious harm to the functioning of the Internal Market as they undermine its integrity.
Due to the improved performance of most Member States the number of long overdue directives decreased from 22 such directives to 16 within the last six months. The decrease from 22 to 16 represents a reduction of 25% and is to be welcomed.
This decrease is the result of two factors. Firstly it is due to the efforts by 6 Member States to reduce their backlogs on long overdue directives: Luxembourg, Belgium, Poland, the United Kingdom, the Czech Republic and Slovenia. Secondly, it is due to the efforts by 10 Member States to maintain their good results and remain in line with the zero deficit target: Bulgaria, Denmark, Estonia, Cyprus, Latvia, Lithuania, Hungary, Malta, the Netherlands and Romania.
However, more needs to be done to bring the deficit closer to the zero deficit target. What is required now from those Member States with an increased number of long overdue directives is to reverse this negative trend. Also, those Member States with a high number of such directives should do their utmost to reduce their deficit.
6 Conclusion of the Europeans Council summit of Barcelona on 15/16 March 2002.

Scoreboard 20 ❍ Internal Market ❍ December 2009 11
Figure 5: Progress on directives two years or more overdue
3 1 1 0 0 0 0 0 0 0 0 0 0 0 01111336 1 11150
1
2
3
4
5
6
7
8
EL LU IT AT PT BE DE IE ES FR PL SK FI SE UK BG CZ DK EE CY LV LT HU MT NL SI RO
Num
ber
of d
irect
ives
not
not
ified
red = increase of 2 years overdue directives since Scoreboard n°19 of May 2009dotted lines = decrease of 2 years overdue directives since Scoreboard n°19 of May 2009
● Luxembourg, Belgium and the Czech Republic continued their good progress already shown six months ago. Likewise, Poland shows a notable reduction within the last half year. Luxembourg and the Czech Republic post the highest decrease, reducing their number of long overdue directives by 3 such directives.
● However, rather than bringing or maintaining their deficit in line with the zero tolerance target, there are some Member States going into reverse. In total, 8 Member States increase the number of directives overdue by two years or more compared to half a year ago: Greece, Italy Austria, Germany, Ireland, Spain, Slovakia and Sweden. Austria accounts for the biggest increase adding 2 such directives.
● Compared to a year ago Greece, Italy and Austria have tripled their deficits from 2 to 6 such directives (Greece) and from 0 to 3 long overdue directives (Italy and Austria). Today Greece is the worst offender in this area with 6 long overdue directives.
● With one long overdue directive one could assume that with some efforts Belgium, Germany, Ireland, Spain, France, Poland, Slovakia, Finland, Sweden and the United Kingdom could eliminate their deficit within the next six months. However, one also has to take account of new directives coming on stream. In total, there are 6 long overdue directives whose transposition deadline expired two years or more ago by May 2010. The majority of Member States have taken the necessary action to transpose these upcoming long overdue directives. However Belgium, Ireland, Spain, France, Italy, Austria and Poland have to reinforce their efforts to avoid that the deficit on long overdue directives rises anew.
Number of directives with a deadline for transposition into national law by 31 October 2007, which have not been fully notifiedby 10 November 2009.

Scoreboard 20 ❍ Internal Market ❍ December 200912
Figure 6: 16 directives are more than two years beyond their transposition deadline !
DirectivesNot yet fully
transposed byTransposition
date
2004/80/EC Compensation to crime victims EL 1/01/06
2002/91/EC Energy performance of buildings EL, LU 4/01/06
2004/8/EC Promotion of cogeneration based on a useful heat demand in the internal energy market PT, SK, FI 21/02/06
2004/49/EC Safety on the Community's railways LU 30/04/06
2005/33/EC Reduction in the sulphur content of certain liquid fuels UK 11/08/06
2006/17/EC Donation, procurement and testing of human tissues and cells IT 1/11/06
2006/100/ECAdaptation of certain Directives in the field of freedom of movement of persons, by reasonof the accession of Bulgaria and Romania
EL, LU, PT 1/01/07
2006/73/EC Organisational requirements and operating conditions for investment firms PL 31/01/07
2006/22/EC Social legislation relating to road transport activities PT 1/04/07
2004/35/EC Environmental liability with regard to the prevention and remedying of environmental damage AT 30/04/07
2005/29/EC Unfair business-to-consumer commercial practices in the internal market ES 12/06/07
2005/94/EC Control of avian influenza IT 1/07/07
2005/32/EC Setting of ecodesign requirements for energy-using products EL 11/08/07
2006/86/EC Coding, processing, preservation, storage and distribution of human tissues and cells IT 1/09/07
2006/24/ECPublicly available electronic communications services andpublic communications networks / Retention of data
IE, EL, LU, AT, SE 15/09/07
2005/36/EC Recognition of professional qualifications BE, DE, EL, FR, LU, AT 20/10/07
7 In both cases Greece was condemned by the Court of Justice and is currently subject to a 260 TFEU (ex 228 TEC) procedure in view of specifying the amount of the lump sum or penalty payment.
● Greece and Luxembourg have the longest transposition delays, closely followed by Portugal, Slovakia and Finland. Greece is almost four years overdue with 2 directives which should have been transposed in January 20067.
One striking conclusion from the above figure is that out of the 16 long overdue directives 11 such directives do not achieve their full effect due to one Member State failing to transpose. These long delays cannot be justified by administrative burdens or the complexity of the directives. They simply should not exist. The Commission has launched infringement proceedings against Member States in all these cases and in a significant number of cases the Court of Justice of the European Union has already given its ruling.
Directives with a transposition deadline by 31 October 2007, which are not (fully) transposed by at least one Member State - Situation as of 10 November 2009.

Scoreboard 20 ❍ Internal Market ❍ December 2009 13
Figure 7: Average transposition delay considerably high
Average transposition delay in months for overdue directives – Situation as of 10 November 2009.
Third challenge – Reducing the transposition delays
For citizens and businesses it is of vital importance to be able to exercise their rights under the law as early as possible. The longer the delay, the more serious are the negative consequences for the good functioning of the Internal Market. This is why Article 260(3) of the new Treaty on the Functioning of the European Union (TFEU) provides the possibility for the Court of Justice to impose financial penalties already in the context of the first referral to the Court under Article 258 TFEU, vis-à-vis Member States who have not notified the Commission of their national transposition measures of directives adopted under a legislative procedure in time8. It is also the reason why in this Internal Market Scoreboard an additional challenge is introduced calling on all Member States to put an increased focus on the need to reduce transposition delays.
16 15 14 14 13 12 12 12 11 11 11 10 10 8 8 8 7 7 7 5 5 4 4 3 310 100
5
10
15
EL LU ES AT PT BE IT SK FI IE FR DE EE PL UK CZ SE NL SI LT LV HU RO DK MT BG CY
Mon
ths EU average = 9 months
● Apart from the number of Internal Market directives that have not been transposed, it is also interesting to note the extent to which the transposition of those directives is overdue. This indicator illustrates that Greece and Luxembourg are the Member States with the longest transposition delays and at the same time with the highest transposition deficit.
● On average, Member States take an extra 9 months to transpose EU directives after the transposition deadline expires. Moreover, as illustrated in figure 5 a considerable number of Member States fail to transpose directives for which the deadline expired by two or more years. These long delays have a particular negative impact on Member States’ average transposition deficit. This explains why most of the Member States with the longest transposition delays are at the same time those with the highest number of long overdue directives. This is in particular the case for: Greece, Luxembourg, Italy, Austria and Portugal.
Figure 8 looks at the infringement cases launched by the Commission against Member States for non-communication of the national measures implementing Internal Market directives. Such cases follow the strict procedure prescribed in Article 258 TFEU (ex Article 226 TEC) and Article 260 TFEU (ex Article 228 TEC). They are opened within three months after the deadline for transposition of a directive has elapsed. If the Member State persists in its non-compliance the European Commission may bring the case before the Court of Justice.
8 It is planned that the European Commission will adopt a communication on the application of this part of the TFEU early this year.

Scoreboard 20 ❍ Internal Market ❍ December 200914
Figure 8: State of non-communication cases
EL PL IT UK CZ AT BE LU PT EE IE FR FI DE ES SK HU LV CY LT SE NL SI DK MT RO BG EU
Referral to the Court underex Art. 228
1 1
Infringement proceedingsinitiated under ex Art. 228
2 1 2 3 1 1 1 1 12
Court ruling 2 1 4 2 2 8 2 2 1 2 26
Referral to the Court underex Art. 226
3 4 3 4 4 3 1 2 1 1 1 1 28
Reasoned opinion 9 4 9 4 2 3 5 4 6 3 3 2 1 2 1 1 3 1 1 1 1 66
Formal notice 17 23 16 16 23 15 6 13 9 11 7 10 12 8 6 11 9 7 9 8 7 5 5 5 4 3 3 268
Total 34 33 28 28 27 24 22 21 18 15 15 15 14 11 11 11 10 10 9 9 8 6 6 5 4 4 3 401
Procedural state of cases where a Member State has not communicated to the Commission the national legislation transposing a directive due before 31/10/2009.
The majority of cases are solved before the European Commission brings the case to the Court of Justice as is illustrated by the fact that there are more cases in the earlier stages of proceedings (letter of formal notice, reasoned opinion) than cases before the Court. It does not therefore follow that a certain number of reasoned opinions (or of letters of formal notice) will lead to a corresponding number of Court proceedings.
However, figure 8 illustrates that there is a considerable number of cases at an advanced stage of the infringement procedure. Currently in around 10% (39 out of 401) of the open infringement procedures the Court of Justice has given its ruling or the procedure for a of lump sum or penalty payment has been initiated. The new procedure foreseen in Article 206 (3) TFEU for imposing penalty payments upon Member States for late transposition of directives adopted under a legislative procedure already at the stage of the first referral to the Court, will provide a further incentive for Member States to comply early on with their legal obligations to transpose on time. We may see, therefore, an improvement in this respect in the future.

Scoreboard 20 ❍ Internal Market ❍ December 2009 15
Fourth challenge – Improving the conformity of the legislation
For the well functioning of the Internal Market timely transposition of EU legislation represents just the first step. It is as important that EU legislation be transposed correctly.
412 292
369
343
0
100
200
300
400
500
600
700
800
May 2009 Nov. 2009
Missing notifications Incorrect notifications
1.5%
1.8%Percentage ofdirectives not(correctly) notified
Num
ber
of d
irect
ives
Figure 9: Number of incorrect transposition measures is decreasing
Number of Internal Market directives not yet communicated to the Commission as having been transposed (transposition deficit) added by the number of directives transposed but for which an infringement proceeding for non-conformity has been initiated by the Commission (Situation as of 1 May 2009 compared to situation as of 1 November 2009).
● The overall number of missing notifications was reduced from 412 down to 292 within the last six month. In addition it would appear that Member States did not only improve on their timely transposition deficit but also on the correct transposition of EU legislation with the result that the number of infringement proceedings went down from 369 to 343. As a consequence, the EU average deficit of directives that have not achieved their full effect due to either late or incorrect transposition went down from 1.8% to 1.5%. This is a positive development but further improvements can be made by Member States.
Scoreboard 20 ❍ Internal Market ❍ December 200916
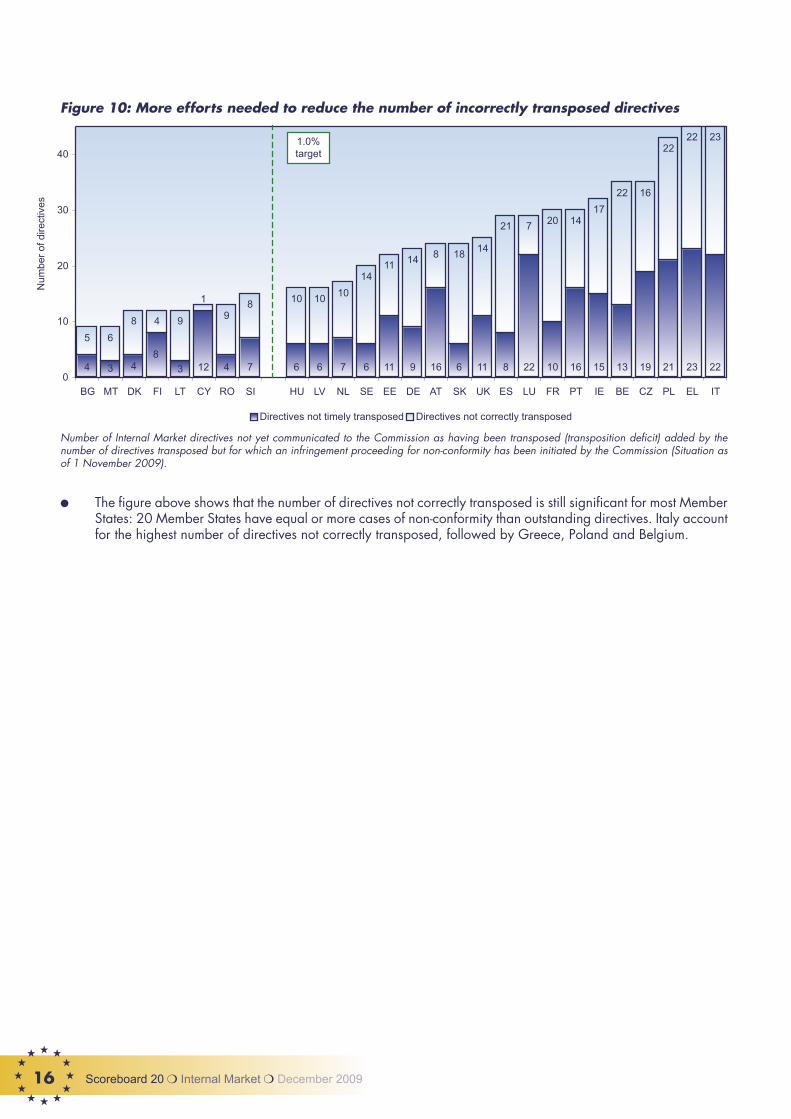
Figure 10: More efforts needed to reduce the number of incorrectly transposed directives
4 12 4 7 6 6 7 6 11 9 16 6 11 8 22 10 16 15 13 19 21 23 22
6
8 4 9 9
10 1010
1411 14 8 18
14
21 7 20 1417
22 16
2222 23
338
4
1 8
5
0
10
20
30
40
BG MT DK FI LT CY RO SI HU LV NL SE EE DE AT SK UK ES LU FR PT IE BE CZ PL EL IT
Num
ber
of d
irect
ives
Directives not timely transposed Directives not correctly transposed
1.0%target
Number of Internal Market directives not yet communicated to the Commission as having been transposed (transposition deficit) added by the number of directives transposed but for which an infringement proceeding for non-conformity has been initiated by the Commission (Situation as of 1 November 2009).
● The figure above shows that the number of directives not correctly transposed is still significant for most Member States: 20 Member States have equal or more cases of non-conformity than outstanding directives. Italy account for the highest number of directives not correctly transposed, followed by Greece, Poland and Belgium.

Scoreboard 20 ❍ Internal Market ❍ December 2009 17
Figure 11: Fragmentation factor improved
27%
15%
13% 13%
10%9%
9%
27%
10%7% 8%
6%5%
0%
5%
10%
15%
20%
25%
30%
1997 1998 1999 2000 2001 2002 2003 2004 2005 2006 2007 2008 2009
EU25
EU27
The so-called ‘fragmentation factor’ records the percentage of the outstanding directives which one or more Member States have failed to transpose in relation to the total number of Internal Market directives, with the consequence that the Internal Market is not a reality in the areas covered by those directives.
Given the improved transposition performance by Member States, the fragmentation factor has also been reduced to its lowest level. Compared to six months ago the number of Internal Market Directives having not achieved their full effect in all Member States went down from 100 to 74. More than half of these directives (38 out of the 74 directives) do not achieve their full effect due to only one or two Member States failing to transpose. The failure to transpose a directive that has been transposed in all the other Member States holds the Internal Market hostage to one Member State’s inability to transpose directives. This penalises all Member States, their citizens and businesses.
Therefore, more efforts are needed to reduce it even further as a fragmentation level of 5% means that the same percentage of directives do not achieve their full effect in the Internal Market.
When the transposition delays are broken down by sector the pattern of implementation varies between Member States. Shaded figures highlight the sectors where Member States’ account the highest number of directives not transposed.
Fragmentation of the Internal Market
The fragmentation factor is an overall indicator of legal gaps. Whenever one or more Member States fail to transpose directives on time they leave a gap in the EU legal framework. Hence, instead of an Internal Market covering all Member States it remains much smaller and fragmented. Consequently, the economic interests of all Member States suffer if already one Member State does not deliver.

Scoreboard 20 ❍ Internal Market ❍ December 200918
Figure 12: Most outstanding directives in the area of transport and environment
Breakdown by Member States of the backlog of non-transposed directives and sector concerned – Situation as of 10 November 2009.The highlighted figures show, for each Member State, the sector(s) with the most outstanding directives.(#) Number of directives in the sector
Agr
icul
tura
l tra
ctor
san
d m
achi
nery
(69
)C
apita
l goo
ds (
60)
Che
mic
als
(41)
Con
sum
ers
(17)
Ene
rgy
(10)
Env
ironm
ent (
105)
Fin
anci
al s
ervi
ces
(104
)F
ood
legi
slat
ion
(105
)F
ree
mov
emen
tof
per
sons
(15
)
Inte
llect
ual p
rope
rty
(11)
Mot
or v
ehic
les
(229
)P
harm
aceu
tical
s +
cos
met
ics
(85)
Pub
lic p
rocu
rem
ent (
8)
Soc
ial P
olic
y (6
9)
Tran
spor
ts (
107)
Vet
erin
ary
+ p
lant
heal
th le
gisl
atio
n (3
78)
Oth
ers
(51)
TO
TAL
4
4
2
2
2
2
2
2
2
23
35
5
5
1 3
31
2
2
2
2
2
2
2
2
2
2
2
2
2
2
2
22
2
2
2
2
2
9 1
1
1 1
1
1
1
1
1
1
1
1
1
1
1
1
1
1
13 3
3
3 3
3
1
1
11
1
1
1
1
1
1
1
1
1
1
1
1
1
1
1
1
5
5
3
3
2
1 11
1
11
1
1
1
1
1
1
1
1
1
1
1
1
1
1
3
4
4
4 4
7
4
4
3
3
4
4
4
4
1
1
1
3
2
2
1
2 2
2
2
1
1
11
1
1
1
1
1
1
1
1
EL
LU
IT
PL
CZ
PT
AT
IE
BE
CY
UK
EE
FR
DE
FI
ES
SI
NL
SE
SK
LV
HU
RO
DK
BG
MT
LT 1
23
22
22
21
19
16
16
15
13
12
11
11
10
9
8
8
7
7
6
6
6
6
4
4
4
3
3Ta
xatio
n (5
7)
As highlighted above, most Member States face the highest number of directives still to transpose in the area of transport and environment. To a certain extent this can be explained by the high number of directives for which the transposition deadline expired recently and the fact that Member States take an extra 9 months on average to transpose directives.
● Luxembourg with 7 directives overdue accounts for most of the outstanding directives in the area of transport. Followed by the United-Kingdom (5 directives overdue) then by Italy, Poland, Portugal, Austria and Germany (all 4 directives overdue).
● Almost half of the Czech Republic (9 out of 19) total number of outstanding directives is in the area of environment. As concerns Estonia and France the area of environment represent around one third of their outstanding directives.
● Spain has more than half (5 out of 8) of their directives still to transpose in the area of financial services.
In the sectors most concerned, the Internal Market is not yet a reality: Member States need to take action to reduce this legal gap.

Scoreboard 20 ❍ Internal Market ❍ December 2009 19
Figure 13: A lot of work ahead for Luxembourg, Poland, Greece, Italy and Czech Republic to reach the 1% target in six months
This figure sets out the number of directives that each Member State needs to notify by 10 May 2010 to reach the target of 1% transposition deficit by the next Scoreboard. This number is composed by the already existing backlog added by the number of directives still to be transposed for the next Scoreboard (29 such directives as of 1 November 2009). Less 16 directives in order to be in line with the 1% target.
Looking ahead
There is no fixed number of Internal Market directives as some are repealed while new ones are added. Transposition requires a permanent effort to avoid that the deficit rises anew. To explore the full potential of the Internal Market it will be necessary to lower the deficit still further and to take account of new directives coming on stream. The figure below reflects the total number of directives that each Member State needs to notify by May 2010 to reach the 1% target.
34 31 31 31 30 26 25 25 23 23 22 19 19 18 17 16 16 16 16 16 15 15 14 13 13 13 130
20
40
LU PL EL IT CZ PT IE AT BE CY UK FR FI SE HU EE LV BG DK SK ES SI LT DE NL RO MT
Num
ber
of d
irect
ives
EU average: 20 directives
● In July 2009, the average number of directives Member States had to transpose in order to reach the 1% target in the upcoming Scoreboard was 17. Today, the number is 20 directives what means that more Member States will have to work harder than six months ago.
Given the volume of legislation that will come on stream in the next 6 months and some particular high backlogs, it is difficult to see how some Member States will meet the 1% target without drastic action.

Scoreboard 20 ❍ Internal Market ❍ December 200920

Scoreboard 20 ❍ Internal Market ❍ December 2009 21
Figure 14: The number of pending infringement cases remains high
Development of pending infringement cases until 1 November 2009
INFRINGEMENT PROCEDURES9 FOR WRONG APPLICATION OF INTERNAL MARKET RULES
2.
In order to exploit the Internal Market’s full potential the legislation agreed at European level needs not only to be timely but also correctly transposed into national law and properly applied by all Member States.
As guardian of the Treaty the Commission shall ensure that both Treaty provisions and acts adopted by the Institutions of the European Union are correctly implemented and applied by the Member States. Where the Commission considers that Internal Market rules are not properly applied, it may open infringement proceedings against the Member States in question. The infringement procedure envisages a dialogue between the Commission and the Member State concerned. However, initiating an infringement procedure merely reflects the Commission’s view that the Member State is failing to fulfil its obligations under the Treaty. Only the Court of Justice can rule definitively that a breach of the EU law has occurred. This should be kept in mind when interpreting statistics on infringement procedures.
In this Internal Market Scoreboard edition, next to the number of infringement proceedings (by Member States, sectors and types) we give a special attention to the duration of those proceedings highlighting different aspects: average resolution speed, early resolution rate and compliance with Court judgments.
Evolution of the number of infringement proceedings
As regards the number of Internal Market infringement proceedings little has changed in recent years. Today’s number of Internal Market infringement proceedings for EU 15 is 929 cases. The number of infringement proceedings against EU 10 is relatively stable and with 277 cases more than three times lower than EU 15. In total, the number of infringement proceedings for EU 27 has decreased by 1.2% compared to six month ago and 6% compared to November 2007.
9 “Infringement procedures” in chapter 2 are to be understood as representing all cases where the transposition is presumed not to be in conformity with the directive it transposes or cases where Internal Market rules (both rules contained in the Treaty on the Functioning of the European Union and in Internal Market directives) are presumed to be incorrectly applied and where a letter of formal notice has been sent to the Member State concerned. Cases of non-communication, i.e. concerning directives counted in the transposition deficit, are excluded from this chapter in order to avoid double-counting.
0
200
400
600
800
1000
1200
1400
May2003
Nov.2003
May2004
Nov.2004
May2005
Nov.2005
May2006
Nov.2006
May2007
Nov.2007
May2008
Nov.2008
May2009
Nov.2009
Num
ber
of p
endi
ng c
ases
EU10
EU15
EU25
EU27
Scoreboard 20 ❍ Internal Market ❍ December 200922
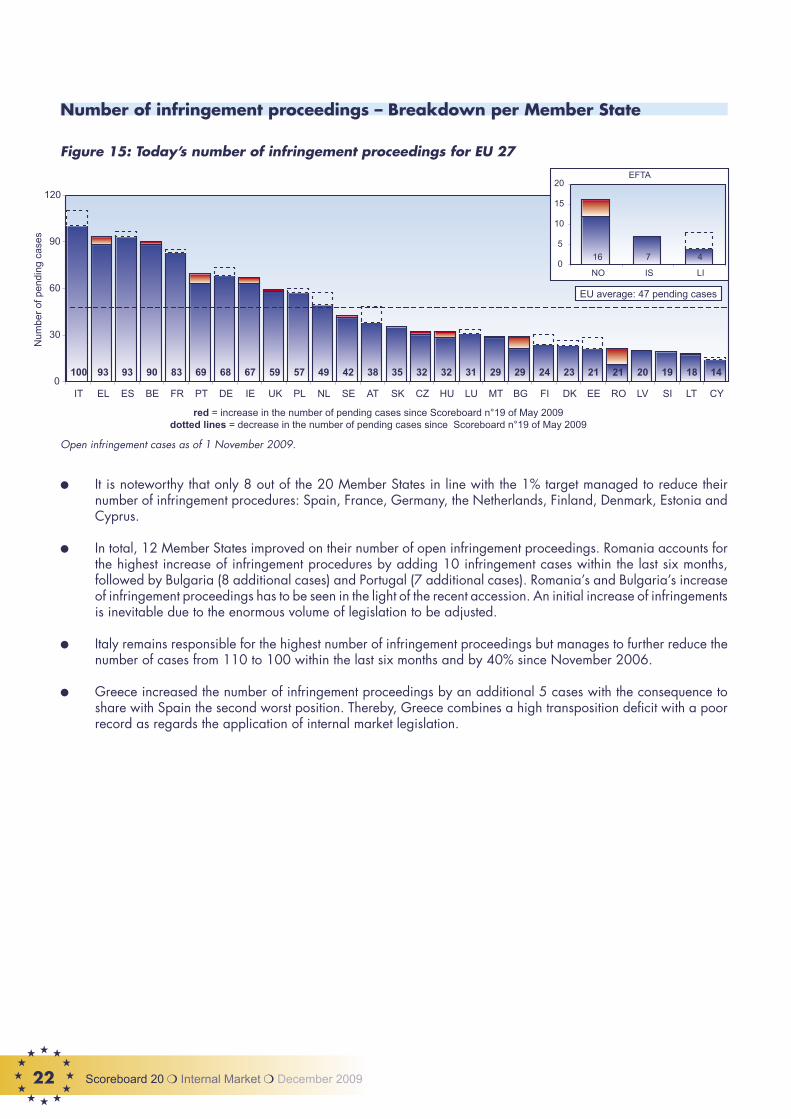
Figure 15: Today’s number of infringement proceedings for EU 27
Open infringement cases as of 1 November 2009.
Number of infringement proceedings – Breakdown per Member State
100 83 68 57 49 38 35 31 24 23 21 20 19 141821292993 32324259676990930
30
60
90
120
IT EL ES BE FR PT DE IE UK PL NL SE AT SK CZ HU LU MT BG FI DK EE RO LV SI LT CY
Num
ber
of p
endi
ng c
ases
red = increase in the number of pending cases since Scoreboard n°19 of May 2009dotted lines = decrease in the number of pending cases since Scoreboard n°19 of May 2009
EFTA
16 7 40
5
10
15
20
NO IS LI
EU average: 47 pending cases
● It is noteworthy that only 8 out of the 20 Member States in line with the 1% target managed to reduce their number of infringement procedures: Spain, France, Germany, the Netherlands, Finland, Denmark, Estonia and Cyprus.
● In total, 12 Member States improved on their number of open infringement proceedings. Romania accounts for the highest increase of infringement procedures by adding 10 infringement cases within the last six months, followed by Bulgaria (8 additional cases) and Portugal (7 additional cases). Romania’s and Bulgaria’s increase of infringement proceedings has to be seen in the light of the recent accession. An initial increase of infringements is inevitable due to the enormous volume of legislation to be adjusted.
● Italy remains responsible for the highest number of infringement proceedings but manages to further reduce the number of cases from 110 to 100 within the last six months and by 40% since November 2006.
● Greece increased the number of infringement proceedings by an additional 5 cases with the consequence to share with Spain the second worst position. Thereby, Greece combines a high transposition deficit with a poor record as regards the application of internal market legislation.
Scoreboard 20 ❍ Internal Market ❍ December 2009 23
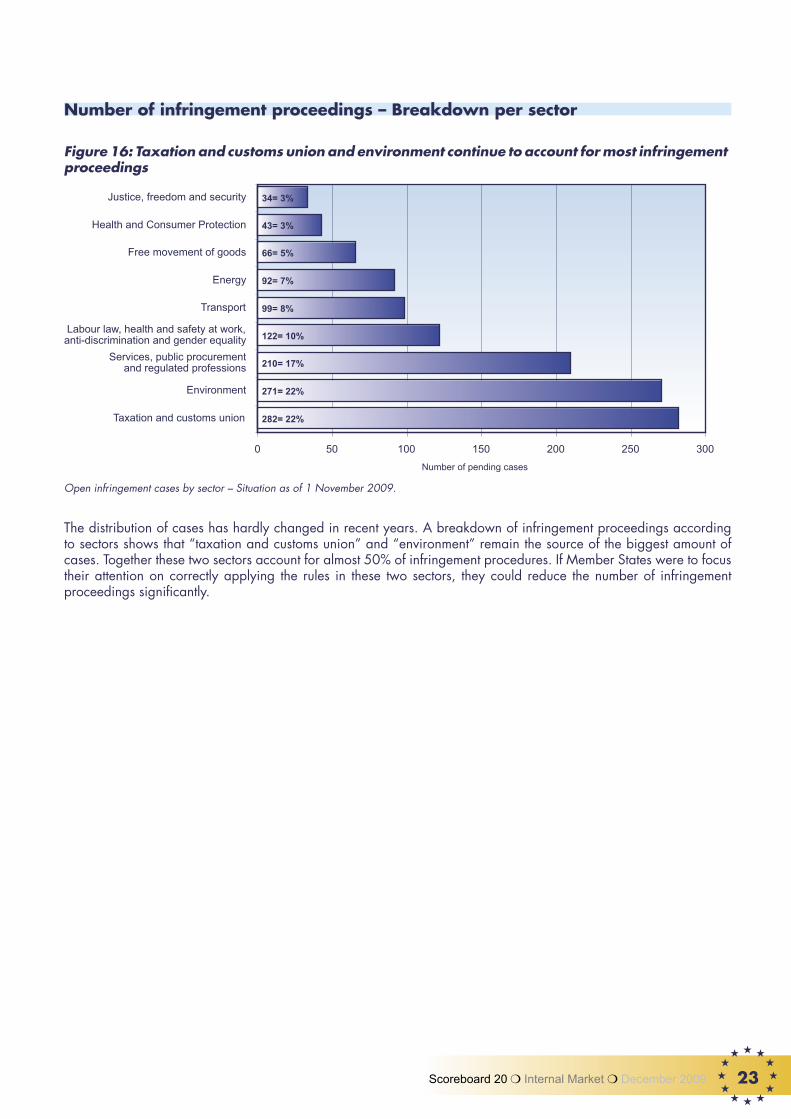
Figure 16: Taxation and customs union and environment continue to account for most infringement proceedings
Number of infringement proceedings – Breakdown per sector
Open infringement cases by sector – Situation as of 1 November 2009.
The distribution of cases has hardly changed in recent years. A breakdown of infringement proceedings according to sectors shows that “taxation and customs union” and “environment” remain the source of the biggest amount of cases. Together these two sectors account for almost 50% of infringement procedures. If Member States were to focus their attention on correctly applying the rules in these two sectors, they could reduce the number of infringement proceedings significantly.
34= 3%
43= 3%
66= 5%
92= 7%
99= 8%
122= 10%
210= 17%
271= 22%
282= 22%
0 50 100 150 200 250 300
Taxation and customs union
Environment
Services, public procurementand regulated professions
Labour law, health and safety at work,anti-discrimination and gender equality
Transport
Energy
Free movement of goods
Health and Consumer Protection
Justice, freedom and security
Number of pending cases
Scoreboard 20 ❍ Internal Market ❍ December 200924
Number of infringement proceedings – Breakdown by type
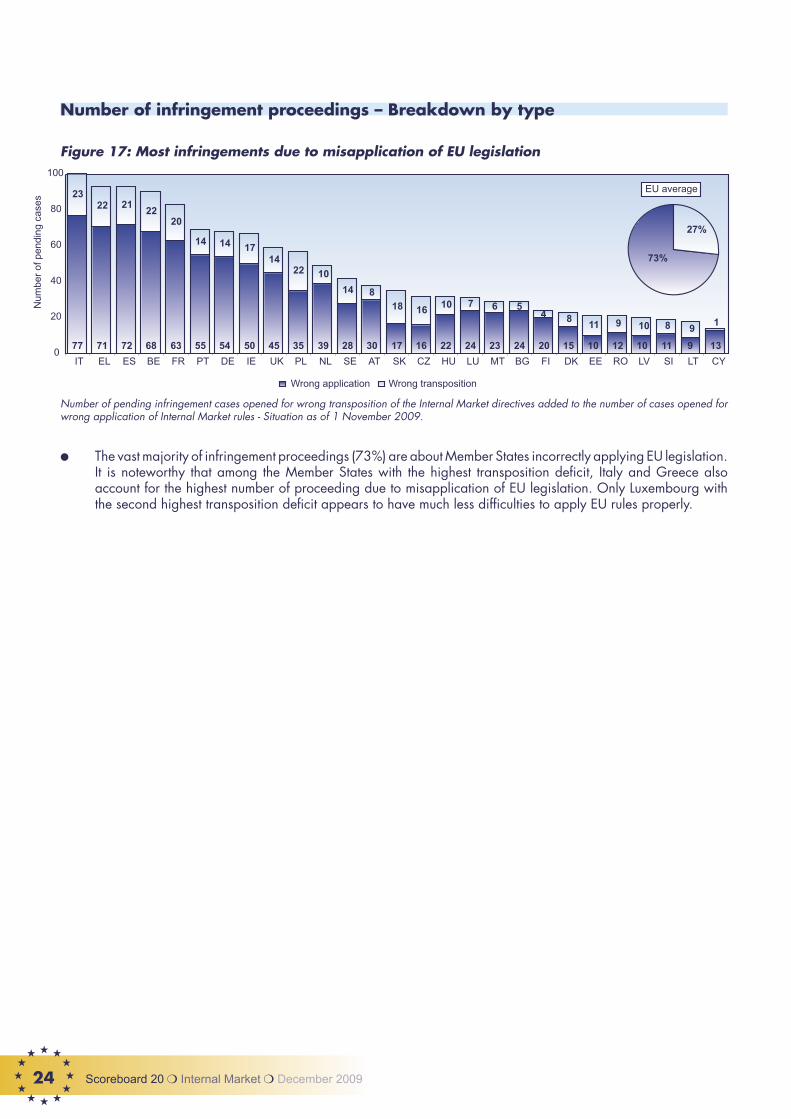
Figure 17: Most infringements due to misapplication of EU legislation
77 71 72 68 63 55 54 50 45 35 39 28 30 17 16 22 24 23 24 20 15 10 12 10 11 9 13
2322 21
2220
14 14 1714
22 10
14 8
18 16 10 7 6 54 8
11 9 10 8 91
0
20
40
60
80
100
IT EL ES BE FR PT DE IE UK PL NL SE AT SK CZ HU LU MT BG FI DK EE RO LV SI LT CY
Num
ber
of p
endi
ng c
ases
73%
27%
EU average
Wrong application Wrong transposition
Number of pending infringement cases opened for wrong transposition of the Internal Market directives added to the number of cases opened for wrong application of Internal Market rules - Situation as of 1 November 2009.
● The vast majority of infringement proceedings (73%) are about Member States incorrectly applying EU legislation. It is noteworthy that among the Member States with the highest transposition deficit, Italy and Greece also account for the highest number of proceeding due to misapplication of EU legislation. Only Luxembourg with the second highest transposition deficit appears to have much less difficulties to apply EU rules properly.

Scoreboard 20 ❍ Internal Market ❍ December 2009 25
Figure 18: Average speed of infringement resolution is lower
Duration – Time required to resolve infringement proceedings
When problems with the application of Internal Market rules do arise, they need to be solved quickly to ensure that citizens and businesses are able to exercise their rights. Therefore, a special focus on the time required to resolve infringement proceedings and the time taken by Member States to comply with Court judgments would appear appropriate.
33 32 32 32 30 30 30 28 28 27 27 26 25 21 19 17 17 17 16 16 15 15 14 11 926 190
10
20
30
DK26
ES71
IE33
FR64
PT47
BE41
NL35
FI29
SE27
AT49
DE68
EL59
IT93
UK44
LU29
PL42
EE19
LV30
MT40
CZ31
SK22
HU24
LT17
SI24
CY26
RO12
BG14
Number of cases per MS
Num
ber
of m
onth
s
EU12 average= 16 months
EU15 average= 28 months
Infringement cases closed or brought before the Court of Justice between 31/10/2007 and 31/10/2009: average time in months needed to either close an infringement case or to bring it before the Court of Justice counted from the moment of the sending of the letter of formal notice (1016 such cases).
● The time necessary to either resolve an infringement or to bring it before the Court of Justice rose. Compared to December 2007 the time needed has increased from 25 months to 28 for EU 15 and from 12 months to 16 for EU 12.
● In particular Denmark’s slow resolution speed is striking given that they have the lowest number of infringement cases within the EU 15. Compared to the other EU 12 Member States, Poland takes almost half a year more than the average to resolve their infringement.

Scoreboard 20 ❍ Internal Market ❍ December 200926
Figure 19: Still too many cases take more than 3 years
Infringement cases closed or brought before the Court of Justice between 31 October 2007 and 31 October 2009: average time in years needed to either close an infringement case or to bring it before the Court of Justice counted from the moment of the sending of the letter of formal notice (1016 such cases)
● 18% of cases take more than three years before they are resolved or brought before the Court. This is by far too long given that infringement proceedings create legal uncertainty and undermine the well functioning of the Internal Market. Therefore, Member States should invest more efforts to resolve ongoing infringements proceedings faster.
18%(186 cases)
20%(207 cases)
33%(334 cases)
28%(289 cases)
0%
5%
10%
15%
20%
25%
30%
35%
40%
less than 1 y 1 - 2 y 2 - 3 y more than 3 y

Scoreboard 20 ❍ Internal Market ❍ December 2009 27
Duration – Early resolution rate
Figure 20: Member States’ early resolution performance slightly improving
The figure above shows Member States’ ability to resolve the problems raised in infringement procedures quickly, which means that between the sending of the letter of formal notice and the closure no more than two years and a half elapsed.
● The average early resolution rate further improved and is now at almost 39% compared to 37% a year ago.
● The ranking of best performing Member States is somewhat different compared to a year ago. In particular Latvia and Malta show an enormous improvement increasing their early resolution rate from 25% to 70% (Latvia) and from 26 to 68% (Malta). At the other end of the spectrum Belgium has gone into reverse decreasing its early resolution rate from 33% to 22% within the last twelve months.
In conclusion it seems clear that Member States need to make additional efforts to implement Internal Market rules properly and to take rapid and effective action where proper implementation goes wrong.
73% 70% 68% 63% 62% 62% 59% 59% 58% 58% 58% 53% 52% 50% 47% 46% 46% 46% 44% 42% 40% 37% 35% 35% 33% 32% 22%0%
10%
20%
30%
40%
50%
60%
70%
80%
CY LV MT RO SI LT CZ IT FI LU AT DE HU BG SK EL EE UK IE FR PL ES SE NL PT DK BE
Per
cent
age
EU average= 38.6%
Number of cases closed by 31 October 2009 as a percentage of the number of cases where a letter of formal notice has been sent between 1 March 2007 and 28 February 2009.

Scoreboard 20 ❍ Internal Market ❍ December 200928
Figure 21: Member States take considerable delays to comply with Court judgments
Duration – Member States’ compliance with judgments of the Court of Justice
25.1 24.5 23.1 18.9 18.7 18.7 17.8 17.6 16.1 15.1 15.1 14.7 13.5 12.2 10.4 8.9 6.1 5.20
5
10
15
20
25
AT
11
ES
23
FR
15
SK
11
PT
9
SE
6
NL
9
BE
11
IT
35
DE
15
LU
14
FI
9
IE
6
EL
15
DK
3
PL
3
SI
1
MT
1
Number of cases
Dur
atio
n si
nce
judg
emen
t of t
he C
ourt
(in
mon
ths)
EU average= 17.7 months
Cases closed between 1 November 2006 and 1 November 2009 (197 cases) - Average duration between the judgment of the Court and the resolution of the case.
Once the Court of Justice has ruled Member States’ failure to fulfil its obligation under EU legislation, Member States have the obligation to take immediately the necessary measures to comply with the Court judgment and to complete the process of compliance as soon as possible. However, despite this legal obligation the vast majority of Member States take considerable time to comply with Court judgments. Austria and Spain account for the longest delays (almost two years).
It should be recalled that in case of failure to comply with a Court’s judgment Article 260 (2) TFEU (ex Article 228) gives the European Commission the power to take Member States to Court a second time, and to ask the Court to impose financial penalties, if they fail to heed the original judgment.
Considering that following a Court ruling the infringement of the law of the European Union is clear and has already deprived citizens and businesses of their rights under the law for several years, Member States must make a better effort in remedying the problem fast.
10 See in particular the judgments in case C-291/93 Commission v Italian Republic (1994) paragraph 6, case C-101/91 Commission v Italian Republic (1993) paragraph 20 and case C-328/90 Commission v Hellenic Republic (1992) paragraph 6.


Scoreboard 20 ❍ Internal Market ❍ December 200930
European Commission
Internal Market Scoreboard
Luxembourg: Publications Office of the European Union
2010 — 28 pp. — 21 x 29.7 cm
ISSN 1830-5881
Scoreboard 20 ❍ Internal Market ❍ December 2009 3
How to obtain EU publications
Publications for sale:
● via EU Bookshop (http://bookshop.europa.eu)
● from your bookseller by quoting the title, the publisher and/or ISBN number
● You can obtain their contact details by linking http://bookshop.europa.eu, or by sending a fax to +352 2929-42758.
Free publications:
● via EU Bookshop (http://bookshop.europa.eu)
● at the European Commission’s representations or delegations. You can obtain their contact details by linking http://ec.europa.eu/ or by sending a fax to +352 2929-42758.

KM-AD-09-002-EN
-C
Related Documents