SCOR Q3 2017 YTD results 26 October 2017 SCOR demonstrates its shock-absorbing capacity in the first nine months of 2017

Welcome message from author
This document is posted to help you gain knowledge. Please leave a comment to let me know what you think about it! Share it to your friends and learn new things together.
Transcript

SCOR
Q3 2017 YTD results
26 October 2017
SCOR demonstrates its
shock-absorbing capacity
in the first nine months of 2017

2
Disclaimer
General:
Numbers presented throughout this report may not add up precisely to the totals in the tables and text. Percentages and percent changes are
calculated on complete figures (including decimals); therefore the presentation might contain immaterial differences in sums and percentages due to
rounding.
Unless otherwise specified, the sources for the business ranking and market positions are internal.
Forward looking statements:
This presentation includes forward-looking statements and information about the objectives of SCOR, in particular, relating to its current or future
projects. These statements are sometimes identified by the use of the future tense or conditional mode, as well as terms such as “estimate”, “believe”,
“have the objective of”, “intend to”, “expect”, “result in”, “should” and other similar expressions. It should be noted that the achievement of these
objectives and forward-looking statements is dependent on the circumstances and facts that arise in the future. Forward-looking statements and
information about objectives may be affected by known and unknown risks, uncertainties and other factors that may significantly alter the future results,
performance and accomplishments planned or expected by SCOR. Information regarding risks and uncertainties that may affect SCOR’s business is
set forth in the 2016 reference document filed on 3 March 2017 under number D.17-0123 with the French Autorité des marchés financiers (AMF) and
posted on SCOR’s website www.scor.com.
In addition, such forward-looking statements are not “profit forecasts” in the sense of Article 2 of Regulation (EC) 809/2004.
Financial information:
The Group’s financial information contained in this presentation is prepared on the basis of IFRS and interpretations issued and approved by the
European Union.
Unless otherwise specified, prior-year balance sheet, income statement items and ratios have not been reclassified.
The calculation of financial ratios (such as book value per share, return on investments, return on invested assets, Group cost ratio, return on equity,
combined ratio and life technical margin) are detailed in the Appendices of this presentation (see page 20).
The third quarter 2017 financial information included in this presentation is unaudited.
Unless otherwise specified, all figures are presented in Euros.
Any figures for a period subsequent to 30 September 2017 should not be taken as a forecast of the expected financials for these periods.
3
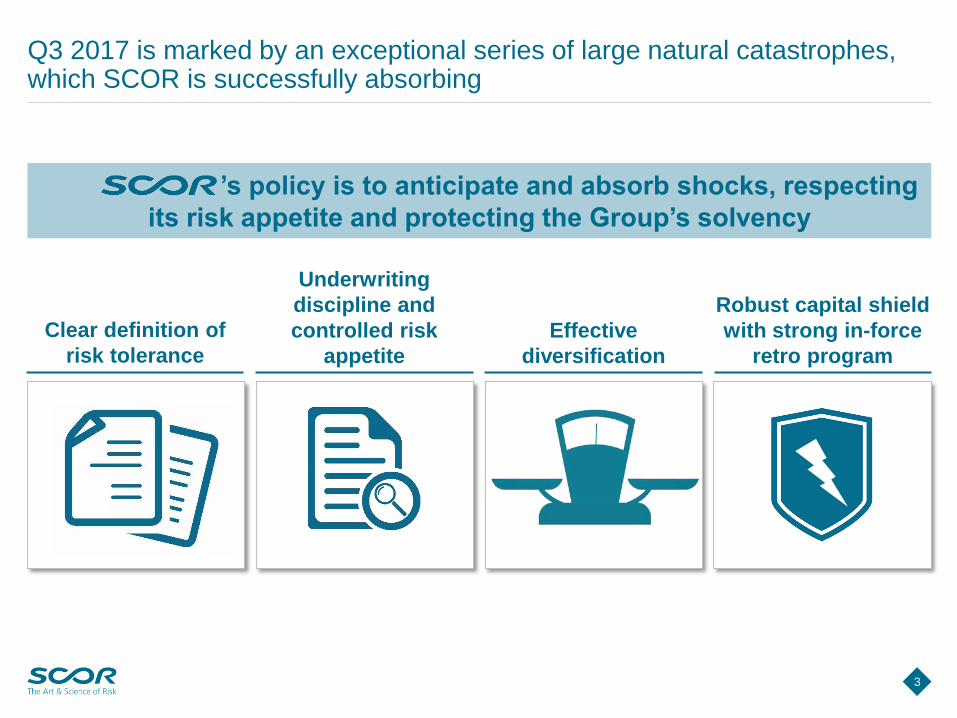
Underwriting
discipline and
controlled risk
appetite
Effective
diversification
Robust capital shield
with strong in-force
retro program
’s policy is to anticipate and absorb shocks, respecting
its risk appetite and protecting the Group’s solvency
Q3 2017 is marked by an exceptional series of large natural catastrophes, which SCOR is successfully absorbing
Clear definition of
risk tolerance

4
4
Historically, SCOR has successfully proven its capacity to absorb natural catastrophes and financial shocks while increasing its shareholders’ equity
Q22006
Q12007
Q42007
Q32008
Q22009
Q12010
Q42010
Q32011
Q22012
Q12013
Q42013
Q32014
Q22015
Q12016
Q42016
Q32017
A+
A
EUR
1.7bn
Beginning
of subprime
crisis
Lehman
Brothers
bankruptcy
Greece
bailoutUS lost
AAA rating
Euro
depreciationFrance lost
AAA rating
Hurricanes
Gustav
and Ike European
storm
Klaus
Earthquake
Chile
Floods in Australia,
Earthquake in NZ, Earthquake
and Tsunami in Japan
Floods in
Thailand
Hurricane
Sandy
European &
Alberta floods
AA-
Greek
crisis
Brexit
US
elections
French
elections
Fire in Fort
McMurray
A-
EUR
6.0bn
Nat cat events
Financial & political events
Shareholders’ equity
S&P rating
Hurricanes Harvey, Irma, Maria
Earthquakes in Mexico▐ Evolution of shareholders’ equity (in EUR m) and rating (S&P)
5
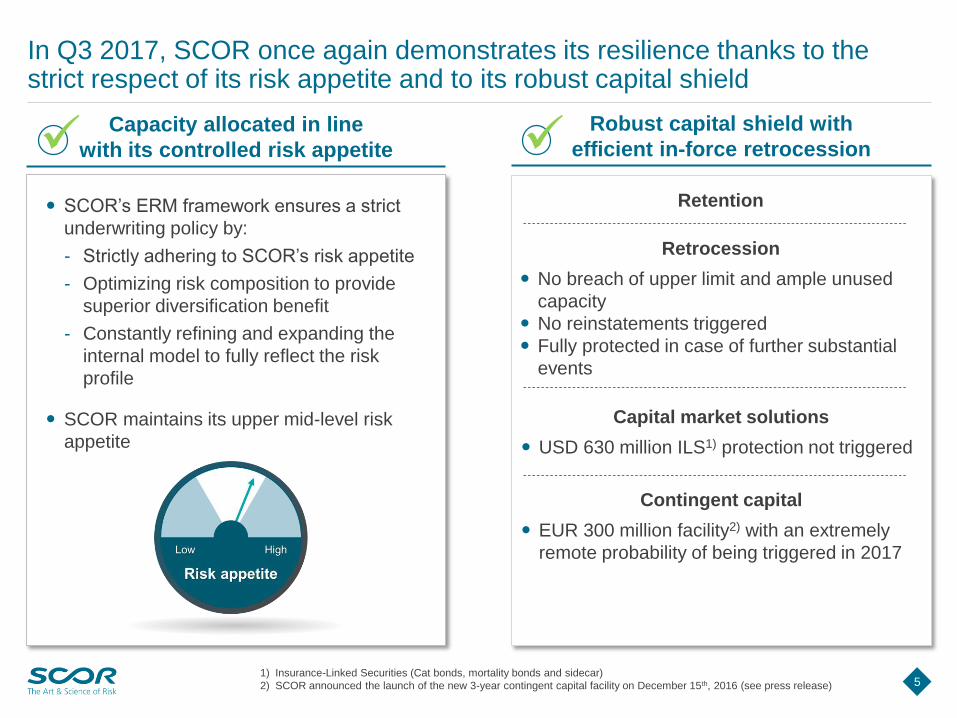
In Q3 2017, SCOR once again demonstrates its resilience thanks to the strict respect of its risk appetite and to its robust capital shield
1) Insurance-Linked Securities (Cat bonds, mortality bonds and sidecar)
2) SCOR announced the launch of the new 3-year contingent capital facility on December 15th, 2016 (see press release)
Robust capital shield with
efficient in-force retrocessionCapacity allocated in line
with its controlled risk appetite
Retention
Retrocession
No breach of upper limit and ample unused
capacity
No reinstatements triggered
Fully protected in case of further substantial
events
Capital market solutions
USD 630 million ILS1) protection not triggered
Contingent capital
EUR 300 million facility2) with an extremely
remote probability of being triggered in 2017
SCOR’s ERM framework ensures a strict
underwriting policy by:
- Strictly adhering to SCOR’s risk appetite
- Optimizing risk composition to provide
superior diversification benefit
- Constantly refining and expanding the
internal model to fully reflect the risk
profile
SCOR maintains its upper mid-level risk
appetite

6
SCOR’s exposure remains within risk tolerance limits and the solvency ratio stands in the upper half of the optimal range
1) Eligible own funds
2) As at the end of Q2 2017
Solvency is in the upper half of the
optimal range after Q3 2017 lossesRisk exposure remains
within limits of risk appetite
US
earthquake
North Atlantic
hurricane
EU wind
Japan
earthquake
Terrorist attack 290
200
660
900
430
Estimated
solvency range
after loss
Optimal
range
Optimal
range
Optimal
range
Optimal
range
Optimal
range
2017 limit
10% EOF1)
(EUR 1 000m)2)
▐ In EUR m of a 1-in-200
year impact on EOF1)2)▐ Estimated solvency ratio (in %)
Optimal
range
220%
185%
~226%
End ofH1 2017
QTDmovement
End ofQ3 2017
Solvency ratio movement largely driven by natural
catastrophe losses
~213%
-13%pts

7
Following this exceptional series of natural catastrophes, SCOR is structurally well positioned to benefit from any improvement in the P&C environment
Strong P&C
franchise
Global network with leading positions, seeking
value in the long term
Leveraging Tier 1 status to grow the franchise
Very strong
rating
Highly rated Tier 1 value proposition, supported by
rating upgrades, illustrated by AM Best recent
upgrade to A+, key for the US P&C market
Underweight
US P&C
Potential to expand, especially in the US, the
largest growth market for SCOR Global P&C
Low volatility
Reduced volatility and improved profitability thanks
to a highly diversified portfolio, underwriting
discipline and an efficient in-force retro program
Well positioned for
profitable growth in
the new P&C market
environment
AA-
8
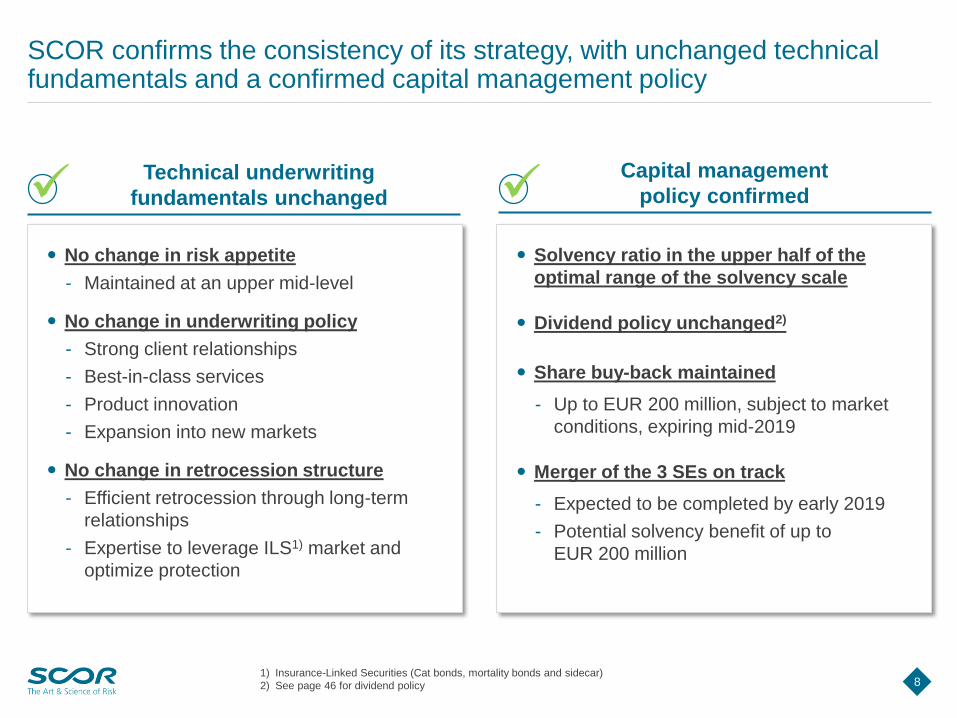
SCOR confirms the consistency of its strategy, with unchanged technical fundamentals and a confirmed capital management policy
Technical underwriting
fundamentals unchanged
Capital management
policy confirmed
Solvency ratio in the upper half of the
optimal range of the solvency scale
Dividend policy unchanged2)
Share buy-back maintained
- Up to EUR 200 million, subject to market
conditions, expiring mid-2019
Merger of the 3 SEs on track
- Expected to be completed by early 2019
- Potential solvency benefit of up to
EUR 200 million
No change in risk appetite
- Maintained at an upper mid-level
No change in underwriting policy
- Strong client relationships
- Best-in-class services
- Product innovation
- Expansion into new markets
No change in retrocession structure
- Efficient retrocession through long-term
relationships
- Expertise to leverage ILS1) market and
optimize protection
1) Insurance-Linked Securities (Cat bonds, mortality bonds and sidecar)
2) See page 46 for dividend policy
9
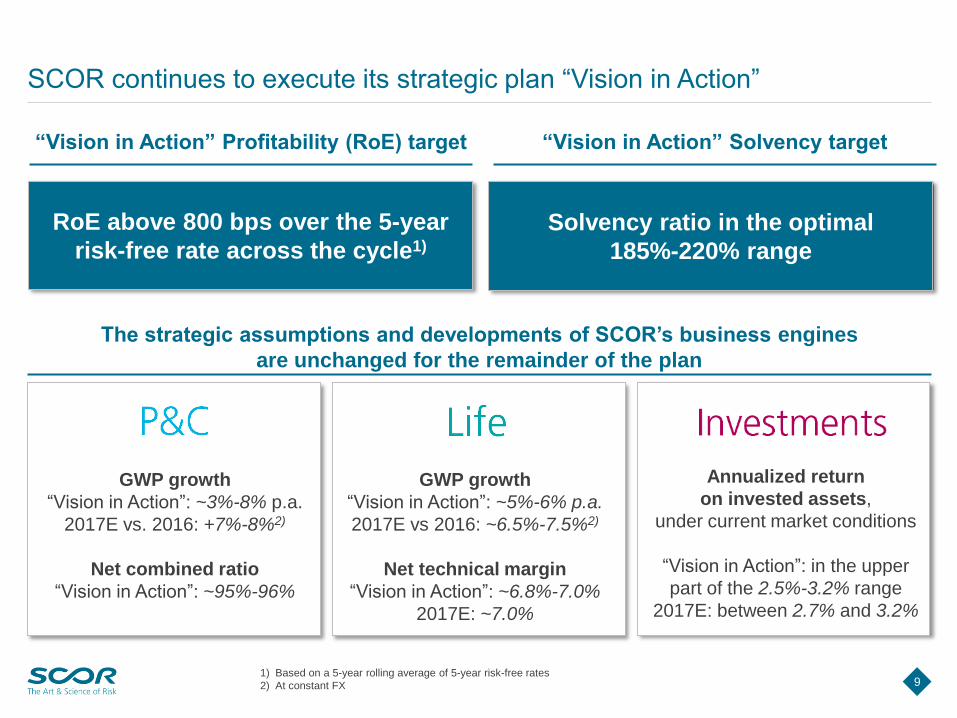
SCOR continues to execute its strategic plan “Vision in Action”
1) Based on a 5-year rolling average of 5-year risk-free rates
2) At constant FX
RoE above 800 bps over the 5-year
risk-free rate across the cycle1)
Solvency ratio in the optimal
185%-220% range
The strategic assumptions and developments of SCOR’s business engines
are unchanged for the remainder of the plan
“Vision in Action” Profitability (RoE) target “Vision in Action” Solvency target
GWP growth
“Vision in Action”: ~3%-8% p.a.
2017E vs. 2016: +7%-8%2)
Net combined ratio
“Vision in Action”: ~95%-96%
GWP growth
“Vision in Action”: ~5%-6% p.a.
2017E vs 2016: ~6.5%-7.5%2)
Net technical margin
“Vision in Action”: ~6.8%-7.0%
2017E: ~7.0%
Annualized return
on invested assets,
under current market conditions
“Vision in Action”: in the upper
part of the 2.5%-3.2% range
2017E: between 2.7% and 3.2%
10
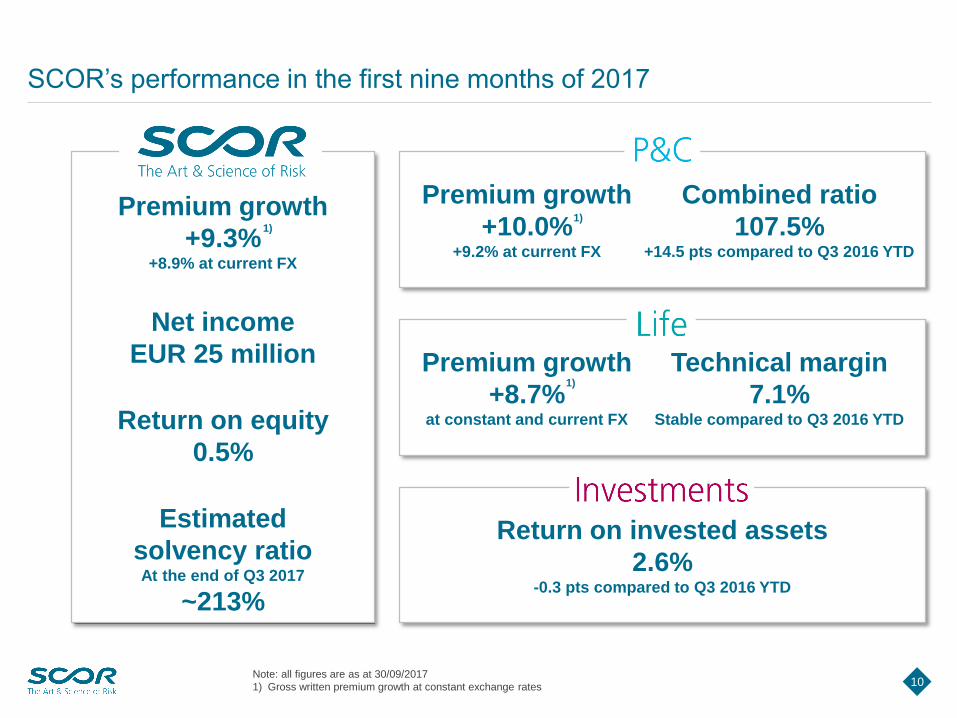
SCOR’s performance in the first nine months of 2017
Premium growth
+8.7%at constant and current FX
Technical margin
7.1%Stable compared to Q3 2016 YTD
1)
Premium growth
+10.0%+9.2% at current FX
1)
Combined ratio
107.5%+14.5 pts compared to Q3 2016 YTD
Return on invested assets
2.6%-0.3 pts compared to Q3 2016 YTD
Premium growth
+9.3%+8.9% at current FX
1)
Net income
EUR 25 million
Return on equity
0.5%
Estimated
solvency ratioAt the end of Q3 2017
~213%
Note: all figures are as at 30/09/2017
1) Gross written premium growth at constant exchange rates

11
Return on Equity normalization from 2017 events
Q3 2017 YTD net income and RoE normalization
1) 5-year rolling average of 5-year risk-free rates is at 69 bps for Q3 2017. See Appendix C, page 31 for details
2) EUR 116 million pre-tax negative one-off linked to the change in Ogden discount rate in Q1 2017
3) EUR 45 million pre-tax positive effect related to a reserve release in Q1 2017
4) Corresponds to the difference between EUR 430 million post-tax losses from Q3 related to the Harvey, Irma, Maria hurricanes and
the Mexican earthquakes, and other actual cat losses year-to-date, to reach the 6% cat budget post-tax as of Q3 year-to-date
▐ In € millions (rounded), post tax
Q3 2017 YTDnet income
Ogdenimpact
Q1 Reserverelease
Q3 CATlosses
Normalizationto 6% CAT ratio
YTD
Q3 CAT impacton ILS funds
Q3 2017 YTD netincome normalizedto 6% CAT budget
RoE / risk-free1)
-15bps
RoE / risk-free1)
765bps
25
+93
-35
+430
+10
523403
-121
3)
Harvey
Irma
Maria
Mexican EQ
2)
4)

12
SCOR Q3 2017 YTD financial details
1) See page 11 for normalization of net income and RoE
2) The net combined ratio calculation has been refined to exclude some immaterial non-technical items that were previously
included. Considering their potential growth, these items have been excluded to ensure they do not distort the net combined ratio
in the future. The impact on the previously reported ratio is +0.24% pts as at September 30th, 2016
▐ In € millions (rounded) Q3 2017 YTD Q3 2016 YTD Variation at current FX Variation at constant FX
Gross written premiums 11 122 10 216 8.9% 9.3%
Net earned premiums 10 006 9 189 8.9% 9.3%
Operating results 97 710 -86.3%
Net income1) 25 438 -94.3%
Group cost ratio 4.9% 5.0% -0.1 pts
Net investment income 448 501 -10.5%
Return on invested assets 2.6% 2.9% -0.3 pts
Annualized RoE1) 0.5% 9.3% -8.8 pts
EPS (€) 0.14 2.37 -94.3%
Book value per share (€) 31.97 34.65 -7.7%
Operating cash flow 671 1 304 -48.5%
Gross written premiums 4 622 4 234 9.2% 10.0%
Net combined ratio2) 107.5% 93.0% 14.5 pts
Gross written premiums 6 500 5 982 8.7% 8.7%
Life technical margin 7.1% 7.1% 0.0 pts
Gro
up
P&
CL
ife

13
SCOR records a book value per share of EUR 31.97
1) The leverage ratio is calculated as the percentage of subordinated debt compared to the sum of total shareholders’ equity and subordinated debt. The
calculation excludes accrued interest from debt and includes the effects of the swaps related to the CHF 315 million (issued in 2012) and
CHF 250 million (issued in 2013) subordinated debt issuances
2) Excluding minority interests. Refer to page 30 for the detailed calculation of the book value per share
3) Variation of unrealized gains/losses on AFS securities, net of shadow accounting and taxes, see Appendix G, page 45
4) Composed of treasury share purchases, share award plan and share option vestings, movements on net investment hedges, changes in share capital,
share buy-back and other movements
▐ In € millions (rounded)
6 695 6 333 6 025
+25 +14+46
-447-308
2 2562 229
2 229
ConsolidatedShareholders' equity
as at 31.12.2016
Net income Revaluation reserve(financial
instruments AFS)
Currency translationadjustment
Other variations ConsolidatedShareholders' equity
as at 30.09.2017before paying
dividends
Dividendsdistributed
May 4, 2017
ConsolidatedShareholders' equity
as at 30.09.2017
Book value per share2)
3)
Financial leverage1)
Total shareholders’ equity
Subordinated debt
24.4%
€ 35.94
26.3%
€ 31.97
4)
Largely due to
negative impact of
USD weakening

14
SCOR records net operating cash flow of EUR 671 million in the first nine months of 2017
1) Investment activities are the acquisition and disposal of assets and other investments not included in cash equivalents. They
predominantly include net purchases / disposals of investments; see page 28 for details
2) Financing activities are activities that result in changes in the size and composition of the contributed equity and borrowings of
the entity. They predominantly include increases in capital, dividends paid by SCOR SE and cash generated by the issuance or
reimbursement of financial debt
3) Includes cash and cash equivalents from third parties
▐ In € millions (rounded)
Q3 2017
YTD
Q3 2016
YTD
Cash and cash equivalents at 1 January 1 688 1 626
Net cash flows from operations, of which: 671 1 304
SCOR Global P&C 495 848
SCOR Global Life 176 456
Net cash flows used in investment activities1) -307 -279
Net cash flows used in financing activities2) -433 -875
Effect of changes in foreign exchange rates -87 -42
Total cash flow -156 108
Cash and cash equivalents at 30 September 1 532 1 734
Short-term investments (i.e. T-bills less than
12 months) classified as ‘’other loans and
receivables’’
87 165
Total liquidity3) 1 620 1 899
SCOR’s business model continues to
deliver strong underlying operating cash
flow:
− SCOR Global P&C continues to provide
strong cash flow in line with expectations
− SCOR Global Life has shown some
catch up since Q1 2017 and is starting to
normalize as expected
Total liquidity of EUR 1.6 billion supported
by strong cash generation, although
rebalancing of the invested assets is
underway, in line with “Vision in Action”

15
SCOR Global P&C’s result is impacted by the exceptional series of large natural catastrophes losses that occurred in Q3 2017
Gross written premiums
Net combined ratio2)
1) At current FX 2) The net combined ratio calculation has been refined to exclude some immaterial non-technical items that were previously
included. Considering their potential growth, these items have been excluded to ensure they do not distort the net combined ratio in the future. The
impact on the previously reported ratio is +0.24% pts as at September 30th, 2016 3) With EUR 40 million (pre-tax) positive effect from reserve
releases in long-tail lines of business in Q2 2016 4) With EUR 45 million (pre-tax) positive effect from reserve releases in long-tail lines of business
and EUR 116 million (pre-tax) negative one-off linked to change in Ogden rate in Q1 2017 5) See Appendix E, page 34, for detailed calculation of the
combined ratio 6) See page 9 for details
▐ In € millions
▐ In %
Solid gross written premium growth of 10.0% YTD at constant FX
(+9.2% at current FX), trending towards the FY 2017 assumption
of 7%-8% communicated during the 2017 Investor Day
After five consecutive years of lower-than-expected cat losses,
Q3 2017 is impacted by an exceptional ~1/25 years series of large
natural catastrophe events, leading to a YTD cat ratio of 16.8%,
15 pts of which come from the Harvey, Irma, Maria hurricanes and
the Mexican earthquakes, which represent a combined impact of
EUR 598 million net of retrocession and pre-tax
(EUR 430 million net of tax). Consequently, the YTD combined
ratio stands at 107.5%
Excluding the impact of the change in the Ogden rate
(2.9 pts), which was fully taken into account in Q1 2017, the net
attritional loss plus commission ratio is fairly stable
Underlying the strong fundamentals, the normalized net combined
ratio stands at 95.0%5) in Q3 2017 YTD, fully in line with the
“Vision in Action” plan6)
Efficient capital shield policy leads to a retention of approximately
60% of the total gross losses from the five events. If SCOR had
had to face the same series of events with Irma being a
USD 125 billion industry event, there would only have been a
marginal net impact on the Group
Group P&C underwriting capacity remains unaffected by this
series of large events
4 234 4 622
Q3 2016YTD
Q3 2017YTD
+9.2%1)
(at constant
exchange
rates)
+10.0%
55.0% 58.2%
5.7%16.8%
25.5%25.8%
6.8%
6.7%
Q3 2016YTD
Q3 2017YTD
86.2%100.8%
Net technical ratio
P&C management expenses (-0.1 pts)
Commissions (+0.3 pts)
Natural catastrophes (+11.1 pts)
Net attritional (+3.2 pts)
93.0%107.5%
3) 4)

16
SCOR Global Life records profitable growth in the first nine months of 2017 and continues to expand its franchise in Asia-Pacific
Gross written premiums
Life technical margin3)
▐ In € millions
▐ In %
Strong growth in Q3 2017 YTD, with gross written
premiums standing at EUR 6 500 million, up 8.7% at
current and constant exchange rates compared to
Q3 2016 YTD, supported by:
− Development of the franchise in Asia-Pacific with
the underwriting of a new Financial Solutions deal
− Continued healthy pipeline of new business in
EMEA and in the Americas, across all product lines
Full-year 2017 gross written premium growth is
expected to stand at 6.5%-7.5%, at constant FX,
slightly above “Vision in Action” annual premium
growth assumption2)
Robust technical margin of 7.1% in Q3 2017 YTD,
slightly above “Vision in Action” assumption2), driven
by:
− Profitability of new business continues to meet the
Group’s RoE target
− Underlying US mortality claim experience higher
than expected. Technical result not impacted,
benefiting from active in-force management and
strong reserve position set up at acquisition date4)
1) At current FX
2) See page 9
3) See Appendix F, page 35 for detailed calculation of the Life technical margin
4) Transamerica Re on August 10th, 2011 and Generali US on October 1st, 2013
5 982 6 500
Q3 2016YTD
Q3 2017YTD
+8.7%1)
(at constant
exchange
rates)
+8.7%
7.1% 7.1%
Q3 2016YTD
Q3 2017YTD

17
In the first nine months of 2017, SCOR Global Investments delivers a return on invested assets of 2.6%
1) Funds withheld & other deposits
2) 4.9-year duration on invested assets (vs. 4.5 years in Q2 2017, adjusted for methodological change – refer to page 135 of 2017 IR Day)
3) Investable cash: includes current cash balances, and future coupons and redemptions
4) Corresponds to marginal reinvestment yields based on Q3 2017 asset allocation of asset yielding classes (i.e. fixed income, loans
and real estate), according to current reinvestment duration assumptions and spreads. Yield curves as at September 30 th, 2017
Total invested assets: EUR 18.4 billion at 30/09/2017
Total investments of EUR 26.6 billion, with total invested
assets of EUR 18.4 billion and funds withheld1) of
EUR 8.2 billion
After the pause in portfolio rebalancing in Q2 2017,
reinvestment towards “Vision in Action” asset allocation
resumed in Q3 2017:
− Decrease in liquidity to 8% (vs. 9% in Q2 2017)
− Increase in corporate bonds (+3 pts vs. Q2 2017)
− Slight increase in fixed income portfolio duration at
4.6 years2) (vs. 4.5 years in Q2 2017)
Very high quality fixed income portfolio, with an A+
average rating
Highly liquid investment portfolio, with financial cash
flows3) of EUR 5.6 billion expected over the next
24 months
Investment income on invested assets of EUR 364
million in Q3 2017 YTD, generating a return on invested
assets of 2.6% in the first nine months of 2017 (2.7%
excluding Q3 CAT impact on ILS funds)
Reinvestment yield of 2.6% at the end of Q3 20174)
FY 2017 return on invested assets estimated between
2.7% and 3.2% at current market conditions
Return on invested assets vs. risk-free benchmark
▐ In % (rounded)Liquidity 8%
Fixed income
77%
Short-term
investments
1%
Covered bonds &
agency MBS 10%
Corporate bonds
43%
Structured &
securitized
products 1%
Loans 4%
Equities 3%
Real estate 5%
Others 4%
Government
bonds &
assimilated 22%
4.0% 3.7%
2.9% 2.6% 2.9% 3.1% 2.9%2.6%
3.2%
2.3%1.8% 1.7% 1.6%
1.0% 0.9% 1.1%
2010 2011 2012 2013 2014 2015 2016 Q3'17YTDReturn on invested assets
SGI risk-free duration-adjusted benchmark
Cash 7%

18
2017/2018 forthcoming events and Investor Relations contacts
Forthcoming scheduled events
SCOR is scheduled to attend the following investor conferences
Contacts: [email protected]
Ian Kelly
Head of Investor Relations
+44 20 32 07 85 61
Olivier Armengaud
Investor Relations
Manager
+33 1 58 44 86 12
Florent Chaix
Investor Relations
Manager
+33 1 58 44 73 83
Annabelle Paillette
Investor Relations
Analyst
+33 1 58 44 83 99
22 February 2018
—
SCOR group
FY 2017 results
Société Générale (ESG/SRI), Paris (November 7th)
Citi, Asia-Pacific (November 28-30th)
Oddo, Lyon (January 11th)
Natixis, Paris (January 15th)
February 2018, TBC
—
SCOR Global P&C
January 2018 renewals

19
The SCOR IR app puts SCOR at the fingertips of investors
Home page
Latest press releases
Financial communication
Share price monitor
Conference presentations
Research Publications
Push notifications
Contacts
@SCOR_SE SCOR SCOR SE

20
APPENDICES
A
F
G
H
I
J
K
B
C
D
E
Appendix A: P&L
Appendix B: Balance sheet & Cash flow
Appendix C: Calculation of EPS, Book value per share and RoE
Appendix D: Expenses & cost ratio
Appendix E: P&C
Appendix F: Life
Appendix G: Investments
Appendix H: Capital management policy
Appendix I: Debt
Appendix J: Rating evolution
Appendix K: Listing information
Appendix L: AwardsL

21
Appendix A: Consolidated statement of income, Q3 2017 YTD
Q3 2017 YTD Q3 2016 YTD
Gross written premiums 11 122 10 216
Change in gross unearned premiums -194 -102
Revenues associated with life financial reinsurance contracts 5 6
Gross benefits and claims paid -9 058 -7 214
Gross commissions on earned premiums -1 871 -1 806
Gross technical result 4 1 100
Ceded written premiums -939 -932
Change in ceded unearned premiums 17 7
Ceded claims 1 112 472
Ceded commissions 79 129
Net result of retrocession 269 -324
Net technical result 273 776
Other income and expenses excl. revenues associated with financial reinsurance contracts -37 -48
Total other operating revenues / expenses -37 -48
Investment revenues 303 270
Interest on deposits 133 137
Realized capital gains / losses on investments 74 173
Change in investment impairment -22 -25
Change in fair value of investments -1 -2
Foreign exchange gains / losses -12 8
Investment income 475 561
Investment management expenses -49 -45
Acquisition and administrative expenses -397 -351
Other current operating income and expenses -148 -158
Current operating results 117 735
Other operating income and expenses -20 -25
Operating results before impact of acquisitions 97 710
Acquisition-related expenses
Operating results 97 710
Financing expenses -113 -149
Share in results of associates 3 8
Corporate income tax 37 -132
Consolidated net income 24 437
of which non-controlling interests -1 -1
Consolidated net income, Group share 25 438
▐ In € millions (rounded)
22
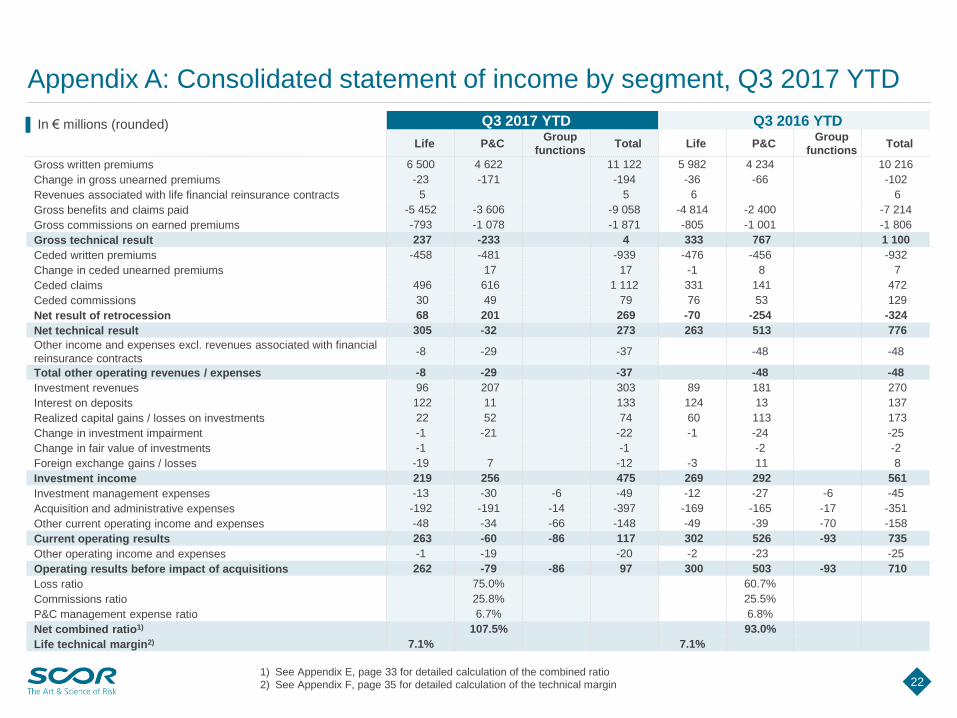
Appendix A: Consolidated statement of income by segment, Q3 2017 YTD
1) See Appendix E, page 33 for detailed calculation of the combined ratio
2) See Appendix F, page 35 for detailed calculation of the technical margin
Q3 2017 YTD Q3 2016 YTD
Life P&CGroup
functionsTotal Life P&C
Group
functionsTotal
Gross written premiums 6 500 4 622 11 122 5 982 4 234 10 216
Change in gross unearned premiums -23 -171 -194 -36 -66 -102
Revenues associated with life financial reinsurance contracts 5 5 6 6
Gross benefits and claims paid -5 452 -3 606 -9 058 -4 814 -2 400 -7 214
Gross commissions on earned premiums -793 -1 078 -1 871 -805 -1 001 -1 806
Gross technical result 237 -233 4 333 767 1 100
Ceded written premiums -458 -481 -939 -476 -456 -932
Change in ceded unearned premiums 17 17 -1 8 7
Ceded claims 496 616 1 112 331 141 472
Ceded commissions 30 49 79 76 53 129
Net result of retrocession 68 201 269 -70 -254 -324
Net technical result 305 -32 273 263 513 776
Other income and expenses excl. revenues associated with financial
reinsurance contracts-8 -29 -37 -48 -48
Total other operating revenues / expenses -8 -29 -37 -48 -48
Investment revenues 96 207 303 89 181 270
Interest on deposits 122 11 133 124 13 137
Realized capital gains / losses on investments 22 52 74 60 113 173
Change in investment impairment -1 -21 -22 -1 -24 -25
Change in fair value of investments -1 -1 -2 -2
Foreign exchange gains / losses -19 7 -12 -3 11 8
Investment income 219 256 475 269 292 561
Investment management expenses -13 -30 -6 -49 -12 -27 -6 -45
Acquisition and administrative expenses -192 -191 -14 -397 -169 -165 -17 -351
Other current operating income and expenses -48 -34 -66 -148 -49 -39 -70 -158
Current operating results 263 -60 -86 117 302 526 -93 735
Other operating income and expenses -1 -19 -20 -2 -23 -25
Operating results before impact of acquisitions 262 -79 -86 97 300 503 -93 710
Loss ratio 75.0% 60.7%
Commissions ratio 25.8% 25.5%
P&C management expense ratio 6.7% 6.8%
Net combined ratio1) 107.5% 93.0%
Life technical margin2) 7.1% 7.1%
▐ In € millions (rounded)

23
Appendix A: SCOR Q3 2017 QTD financial details
▐ In € millions (rounded) Q3 2017 Q3 2016 Variation at current FX Variation at constant FX
Gross written premiums 3 600 3 481 3.4% 7.7%
Net earned premiums 3 246 3 101 4.7% 9.0%
Operating results -365 244 -249.6%
Net income / loss -267 163 -263.8%
Group cost ratio 5.0% 4.8% 0.2 pts
Net investment income 136 156 -12.8%
Return on invested assets 2.3% 2.6% -0.3 pts
Annualized RoE -16.2% 10.7% -26.9 pts
EPS (€) -1.43 0.88 -262.3%
Book value per share (€) 31.97 34.65 -7.7%
Operating cash flow 343 854 -59.8%
Gross written premiums 1 502 1 433 4.8% 9.0%
Net combined ratio 136.7% 91.4% 45.3 pts
Gross written premiums 2 098 2 048 2.4% 6.8%
Life technical margin 7.0% 7.1% -0.1 pts
Gro
up
P&
CL
ife
24
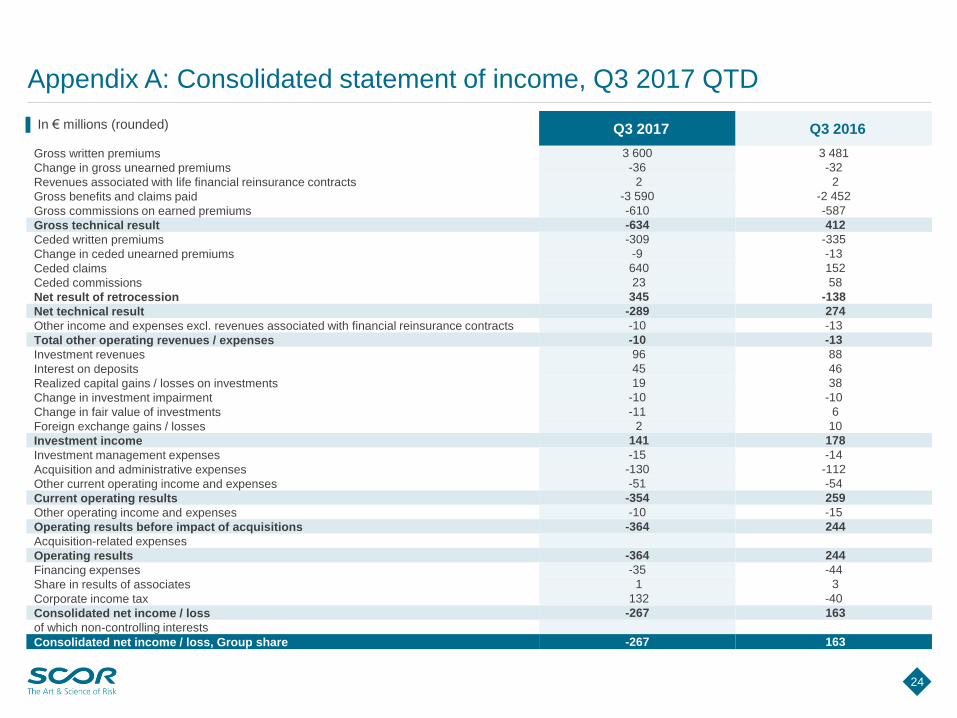
Appendix A: Consolidated statement of income, Q3 2017 QTD
Q3 2017 Q3 2016
Gross written premiums 3 600 3 481
Change in gross unearned premiums -36 -32
Revenues associated with life financial reinsurance contracts 2 2
Gross benefits and claims paid -3 590 -2 452
Gross commissions on earned premiums -610 -587
Gross technical result -634 412
Ceded written premiums -309 -335
Change in ceded unearned premiums -9 -13
Ceded claims 640 152
Ceded commissions 23 58
Net result of retrocession 345 -138
Net technical result -289 274
Other income and expenses excl. revenues associated with financial reinsurance contracts -10 -13
Total other operating revenues / expenses -10 -13
Investment revenues 96 88
Interest on deposits 45 46
Realized capital gains / losses on investments 19 38
Change in investment impairment -10 -10
Change in fair value of investments -11 6
Foreign exchange gains / losses 2 10
Investment income 141 178
Investment management expenses -15 -14
Acquisition and administrative expenses -130 -112
Other current operating income and expenses -51 -54
Current operating results -354 259
Other operating income and expenses -10 -15
Operating results before impact of acquisitions -364 244
Acquisition-related expenses
Operating results -364 244
Financing expenses -35 -44
Share in results of associates 1 3
Corporate income tax 132 -40
Consolidated net income / loss -267 163
of which non-controlling interests
Consolidated net income / loss, Group share -267 163
▐ In € millions (rounded)

25
Appendix A: Consolidated statement of income by segment, Q3 2017 QTD
Q3 2017 Q3 2016
Life P&CGroup
functionsTotal Life P&C
Group
functionsTotal
Gross written premiums 2 098 1 502 3 600 2 048 1 433 3 481
Change in gross unearned premiums 6 -42 -36 5 -37 -32
Revenues associated with life financial reinsurance contracts 2 2 2 2
Gross benefits and claims paid -1 779 -1 811 -3 590 -1 674 -778 -2 452
Gross commissions on earned premiums -262 -348 -610 -251 -336 -587
Gross technical result 65 -699 -634 130 282 412
Ceded written premiums -147 -162 -309 -195 -140 -335
Change in ceded unearned premiums -9 -9 -13 -13
Ceded claims 171 469 640 109 43 152
Ceded commissions 9 14 23 44 14 58
Net result of retrocession 33 312 345 -42 -96 -138
Net technical result 98 -387 -289 88 186 274
Other income and expenses excl. revenues associated with financial
reinsurance contracts-3 -7 -10 -13 -13
Total other operating revenues / expenses -3 -7 -10 -13 -13
Investment revenues 27 69 96 30 58 88
Interest on deposits 41 4 45 43 3 46
Realized capital gains / losses on investments 5 14 19 21 17 38
Change in investment impairment -1 -9 -10 -10 -10
Change in fair value of investments -1 -10 -11 6 6
Foreign exchange gains / losses -9 11 2 1 9 10
Investment income 62 79 141 95 83 178
Investment management expenses -4 -9 -2 -15 -4 -9 -1 -14
Acquisition and administrative expenses -63 -63 -4 -130 -54 -53 -5 -112
Other current operating income and expenses -16 -12 -23 -51 -17 -13 -24 -54
Current operating results 74 -399 -29 -354 108 181 -30 259
Other operating income and expenses -2 -8 -10 -15 -15
Operating results before impact of acquisitions 72 -407 -29 -364 108 166 -30 244
Loss ratio 104.1% 59.3%
Commissions ratio 25.9% 25.8%
P&C management expense ratio 6.7% 6.3%
Net combined ratio1) 136.7% 91.4%
Life technical margin2) 7.0% 7.1%
▐ In € millions (rounded)
1) See Appendix E, page 33 for detailed calculation of the combined ratio
2) See Appendix F, page 35 for detailed calculation of the technical margin

26
Appendix B: Consolidated balance sheet – Assets
1) Include other intangible assets, tangible assets and other assets
Q3 2017 YTD Q4 2016
Goodwill 859 788
Value of business acquired 1 419 1 612
Insurance business investments 27 151 28 137
Real estate investments 826 770
Available-for-sale investments 16 071 16 553
Investments at fair value through income 1 068 812
Loans and receivables 8 998 9 815
Derivative instruments 188 187
Investments in associates 79 114
Share of retrocessionaires in insurance and investment contract liabilities 1 805 1 362
Other assets 9 684 9 592
Accounts receivable from assumed insurance and reinsurance transactions 6 006 6 174
Accounts receivable from ceded reinsurance transactions 168 103
Deferred tax assets 687 683
Taxes receivable 179 164
Miscellaneous assets1) 1 272 1 092
Deferred acquisition costs 1 372 1 376
Cash and cash equivalents 1 532 1 688
Total assets 42 529 43 293
▐ In € millions (rounded)
27
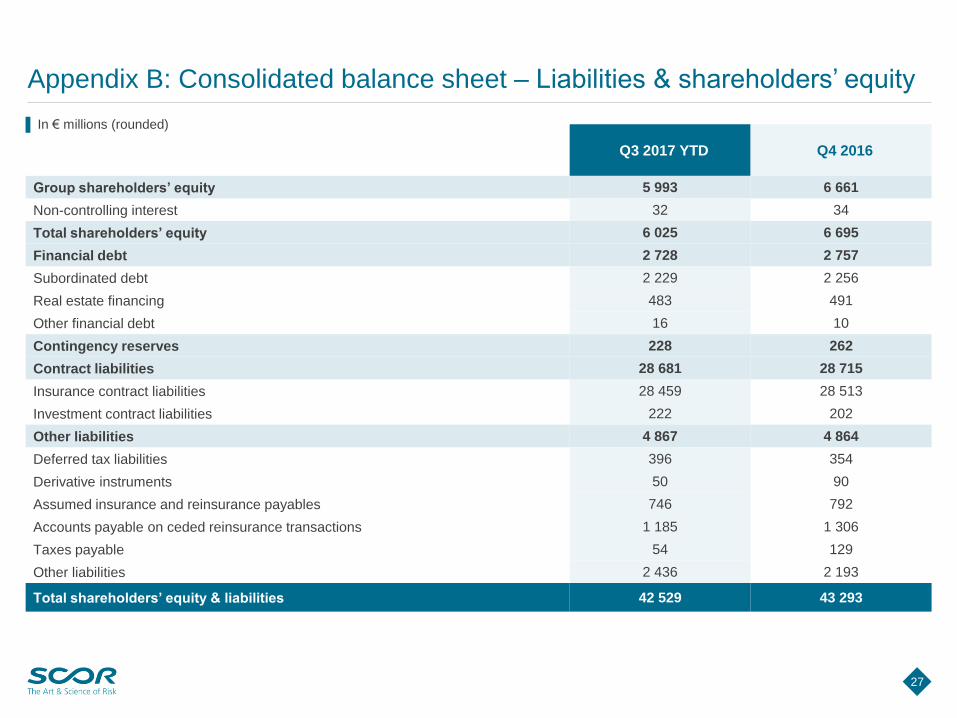
Appendix B: Consolidated balance sheet – Liabilities & shareholders’ equity
Q3 2017 YTD Q4 2016
Group shareholders’ equity 5 993 6 661
Non-controlling interest 32 34
Total shareholders’ equity 6 025 6 695
Financial debt 2 728 2 757
Subordinated debt 2 229 2 256
Real estate financing 483 491
Other financial debt 16 10
Contingency reserves 228 262
Contract liabilities 28 681 28 715
Insurance contract liabilities 28 459 28 513
Investment contract liabilities 222 202
Other liabilities 4 867 4 864
Deferred tax liabilities 396 354
Derivative instruments 50 90
Assumed insurance and reinsurance payables 746 792
Accounts payable on ceded reinsurance transactions 1 185 1 306
Taxes payable 54 129
Other liabilities 2 436 2 193
Total shareholders’ equity & liabilities 42 529 43 293
▐ In € millions (rounded)

28
Appendix B: Consolidated statements of cash flows
Q3 2017 YTD Q3 2016 YTD
Cash and cash equivalents at the beginning of the period 1 688 1 626
Net cash flows in respect of operations 671 1 304
Cash flow in respect of changes in scope of consolidation -174 8
Cash flow in respect of acquisitions and sale of financial assets -94 -230
Cash flow in respect of acquisitions and disposals of tangible and intangible fixed assets -39 -57
Net cash flows in respect of investing activities -307 -279
Transactions on treasury shares and issuance of equity instruments 8 -91
Dividends paid -310 -280
Cash flows in respect of shareholder transactions -302 -371
Cash related to issue or reimbursement of financial debt -7 -292
Interest paid on financial debt -94 -115
Other cash flow from financing activities -30 -97
Cash flows in respect of financing activities -131 -504
Net cash flows in respect of financing activities -433 -875
Effect of changes in foreign exchange rates -87 -42
Cash and cash equivalents at the end of the period 1 532 1 734
▐ In € millions (rounded)

29
Appendix B: Net contract liabilities by segment
Net liabilities Life & P&C
▐ In € millions (rounded)
49% 51%
51% 49%
27 354 26 876
31/12/2016 30/09/2017
Total
SCOR Global P&C
SCOR Global Life

30
Appendix C: Calculation of EPS, book value per share and RoE
Earnings per share calculation
Book value per share calculation
Post-tax Return on Equity (RoE)
Q3 2017
YTD
Q3 2016
YTD
Group net income1) (A) 25 438
Average number of opening shares (1) 192 534 569 192 653 095
Impact of new shares issued (2) 333 557 -266 180
Time Weighted Treasury Shares2) (3) -6 223 324 -7 366 647
Basic Number of Shares (B)
= (1)+(2)+(3)186 644 801 185 020 267
Basic EPS (A)/(B) 0.14 2.37
30/09/2017 30/09/2016
Group shareholders’ equity1) (A) 5 993 6 406
Shares issued at the end of the
quarter (1)193 121 919 192 353 751
Treasury Shares at the end of the
quarter2) (2)-5 616 798 -7 479 249
Basic Number of Shares (B) = (1)+(2) 187 505 121 184 874 502
Basic Book Value PS (A)/(B) 31.97 34.65
1) Excluding non-controlling interests
2) 50% of the movement in the period
Q3 2017
YTD
Q3 2016
YTD
Group net income1) 25 438
Opening shareholders’ equity 6 661 6 330
Weighted group net income2) 13 219
Payment of dividends -169 -154
Weighted increase in capital 4 -7
Effects of changes in foreign exchange
rates2)-223 -87
Revaluation of assets available for
sale and other2)28 50
Weighted average shareholders’
equity6 313 6 350
Annualized RoE 0.5% 9.3%

31
5-year daily spot rates 1) Currency mix 3)
Weighted average rates
EUR 2) USD GBP EUR USD GBP EUR USD GBP Total
1st October 2012 0.56 0.62 0.73 58% 28% 14% 0.32 0.17 0.10 0.60
2nd October 2012 0.54 0.62 0.70 58% 28% 14% 0.31 0.17 0.10 0.58
3rd October 2012 0.52 0.60 0.67 58% 28% 14% 0.30 0.17 0.09 0.56
… … … … … … … … … … …
31st Dec 2012 0.29 0.73 0.87 58% 28% 14% 0.17 0.21 0.12 0.49
… … … … … … … … … … …
31st Dec 2013 0.93 1.74 1.87 57% 30% 13% 0.53 0.53 0.23 1.29
… … … … … … … … … … …
31st Dec 2014 0.01 1.65 1.17 55% 32% 13% 0.01 0.53 0.15 0.69
… … … … … … … … … … …
31st Dec 2015 -0.04 1.77 1.35 51% 36% 13% -0.02 0.63 0.18 0.79
… … … … … … … … … … …
30th Dec 2016 -0.54 1.92 0.48 51% 36% 13% -0.28 0.71 0.06 0.49
… … … … … … … … … … …
27th September 2017 -0.28 1.91 0.80 51% 37% 12% -0.14 0.70 0.09 0.65
28th September 2017 -0.26 1.90 0.80 51% 37% 12% -0.13 0.69 0.09 0.66
29th September 2017 -0.27 1.93 0.79 51% 37% 12% -0.14 0.71 0.09 0.66
0.69
Appendix C: Calculation of the risk-free rate component of the “Vision in Action” RoE target
1) 5-year risk-free rate
2) 5-year German government bond
3) Year-end currency mix based on SCOR’s net technical reserves
5-year rolling
average of 5-year
risk-free rates
X =
5 y
ears

32
Appendix D: Reconciliation of total expenses to cost ratio
▐ In € millions (rounded)
Q3 2017 YTD Q3 2016 YTD
Total expenses as per Profit & Loss account -594 -554
ULAE (Unallocated Loss Adjustment Expenses) -42 -40
Total management expenses -636 -594
Investment management expenses 49 45
Total expense base -587 -549
Minus corporate finance expenses 2 1
Minus amortization 31 27
Minus non-controllable expenses 10 13
Total management expenses (for Group cost ratio calculation) -544 -508
Gross Written Premiums (GWP) 11 122 10 216
Group cost ratio 4.9% 5.0%

33
Appendix E: Calculation of P&C net combined ratio
1) Gross written premiums + Change in gross unearned premiums
2) Ceded gross written premiums + Change in ceded unearned premiums
Q3 2017 YTD Q3 2016 YTD
Gross earned premiums1) 4 451 4 168
Ceded earned premiums2) -464 -448
Net earned premiums (A) 3 987 3 720
Gross benefits and claims paid -3 606 -2 400
Ceded claims 616 141
Total net claims (B) -2 990 -2 259
Loss ratio (Net attritional + Natural catastrophes): -(B)/(A) 75.0% 60.7%
Gross commissions on earned premiums -1 078 -1 001
Ceded commissions 49 53
Total net commissions (C) -1 029 -948
Commission ratio: -(C)/(A) 25.8% 25.5%
Total technical ratio: -((B)+(C))/(A) 100.8% 86.2%
Acquisition and administrative expenses -191 -165
Other current operating income / expenses -34 -39
Other income and expenses from reinsurance operations -42 -48
Total P&C management expenses (D) -267 -252
P&C management expense ratio: -(D)/(A) 6.7% 6.8%
Total net combined ratio: -((B)+(C)+(D))/(A) 107.5% 93.0%
▐ In € millions (rounded)
34
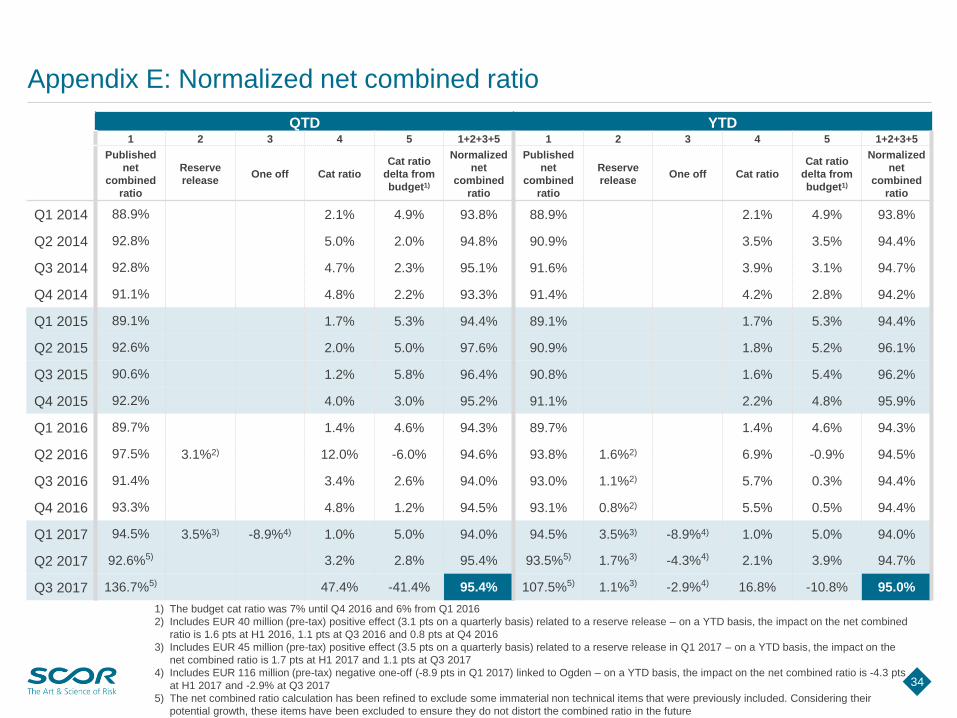
Appendix E: Normalized net combined ratio
1) The budget cat ratio was 7% until Q4 2016 and 6% from Q1 2016
2) Includes EUR 40 million (pre-tax) positive effect (3.1 pts on a quarterly basis) related to a reserve release – on a YTD basis, the impact on the net combined
ratio is 1.6 pts at H1 2016, 1.1 pts at Q3 2016 and 0.8 pts at Q4 2016
3) Includes EUR 45 million (pre-tax) positive effect (3.5 pts on a quarterly basis) related to a reserve release in Q1 2017 – on a YTD basis, the impact on the
net combined ratio is 1.7 pts at H1 2017 and 1.1 pts at Q3 2017
4) Includes EUR 116 million (pre-tax) negative one-off (-8.9 pts in Q1 2017) linked to Ogden – on a YTD basis, the impact on the net combined ratio is -4.3 pts
at H1 2017 and -2.9% at Q3 2017
5) The net combined ratio calculation has been refined to exclude some immaterial non technical items that were previously included. Considering their
potential growth, these items have been excluded to ensure they do not distort the combined ratio in the future
QTD YTD1 2 3 4 5 1+2+3+5 1 2 3 4 5 1+2+3+5
Published
net
combined
ratio
Reserve
releaseOne off Cat ratio
Cat ratio
delta from
budget1)
Normalized
net
combined
ratio
Published
net
combined
ratio
Reserve
releaseOne off Cat ratio
Cat ratio
delta from
budget1)
Normalized
net
combined
ratio
Q1 2014 88.9% 2.1% 4.9% 93.8% 88.9% 2.1% 4.9% 93.8%
Q2 2014 92.8% 5.0% 2.0% 94.8% 90.9% 3.5% 3.5% 94.4%
Q3 2014 92.8% 4.7% 2.3% 95.1% 91.6% 3.9% 3.1% 94.7%
Q4 2014 91.1% 4.8% 2.2% 93.3% 91.4% 4.2% 2.8% 94.2%
Q1 2015 89.1% 1.7% 5.3% 94.4% 89.1% 1.7% 5.3% 94.4%
Q2 2015 92.6% 2.0% 5.0% 97.6% 90.9% 1.8% 5.2% 96.1%
Q3 2015 90.6% 1.2% 5.8% 96.4% 90.8% 1.6% 5.4% 96.2%
Q4 2015 92.2% 4.0% 3.0% 95.2% 91.1% 2.2% 4.8% 95.9%
Q1 2016 89.7% 1.4% 4.6% 94.3% 89.7% 1.4% 4.6% 94.3%
Q2 2016 97.5% 3.1%2) 12.0% -6.0% 94.6% 93.8% 1.6%2) 6.9% -0.9% 94.5%
Q3 2016 91.4% 3.4% 2.6% 94.0% 93.0% 1.1%2) 5.7% 0.3% 94.4%
Q4 2016 93.3% 4.8% 1.2% 94.5% 93.1% 0.8%2) 5.5% 0.5% 94.4%
Q1 2017 94.5% 3.5%3) -8.9%4) 1.0% 5.0% 94.0% 94.5% 3.5%3) -8.9%4) 1.0% 5.0% 94.0%
Q2 2017 92.6%5) 3.2% 2.8% 95.4% 93.5%5) 1.7%3) -4.3%4) 2.1% 3.9% 94.7%
Q3 2017 136.7%5) 47.4% -41.4% 95.4% 107.5%5) 1.1%3) -2.9%4) 16.8% -10.8% 95.0%

35
Appendix F: Calculation of the Life technical margin
1) Gross written premiums + Change in gross unearned premiums
2) Ceded gross written premiums + Change in ceded unearned premiums
▐ In € millions (rounded)
Q3 2017 YTD Q3 2016 YTD
Gross earned premiums1) 6 477 5 946
Ceded earned premiums2) -458 -477
Net earned premiums (A) 6 019 5 469
Net technical result 305 263
Interest on deposits 122 124
Technical result (B) 427 387
Net technical margin (B)/(A) 7.1% 7.1%
36
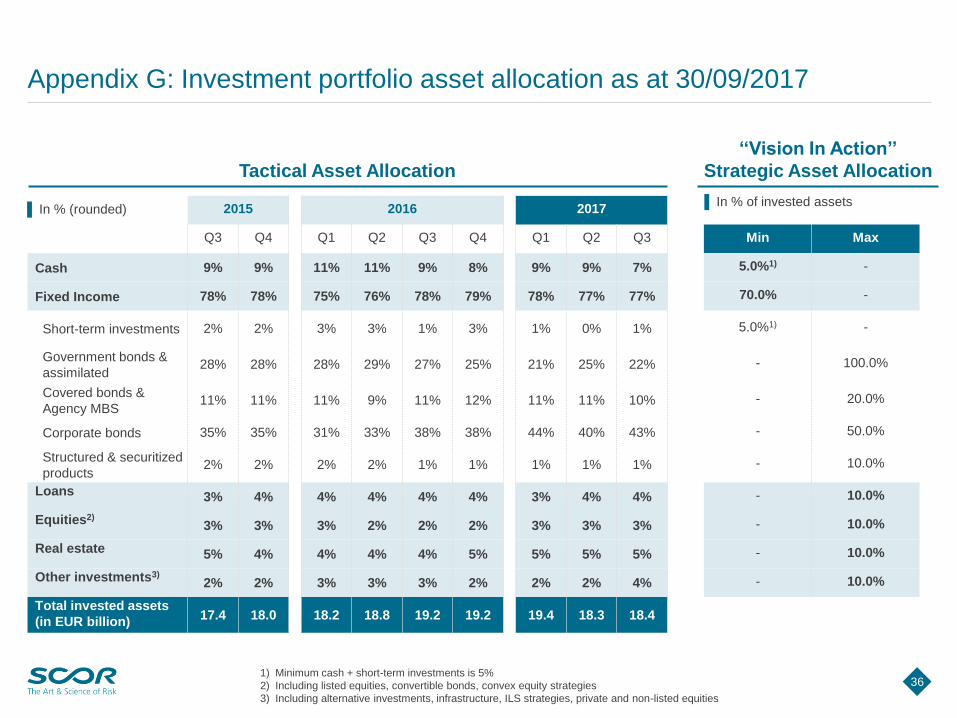
Appendix G: Investment portfolio asset allocation as at 30/09/2017
Tactical Asset Allocation
‘‘Vision In Action’’
Strategic Asset Allocation
1) Minimum cash + short-term investments is 5%
2) Including listed equities, convertible bonds, convex equity strategies
3) Including alternative investments, infrastructure, ILS strategies, private and non-listed equities
2015 2016 2017
Q3 Q4 Q1 Q2 Q3 Q4 Q1 Q2 Q3 Min Max
Cash 9% 9% 11% 11% 9% 8% 9% 9% 7% 5.0%1) -
Fixed Income 78% 78% 75% 76% 78% 79% 78% 77% 77% 70.0% -
Short-term investments 2% 2% 3% 3% 1% 3% 1% 0% 1% 5.0%1) -
Government bonds &
assimilated28% 28% 28% 29% 27% 25% 21% 25% 22% - 100.0%
Covered bonds &
Agency MBS11% 11% 11% 9% 11% 12% 11% 11% 10% - 20.0%
Corporate bonds 35% 35% 31% 33% 38% 38% 44% 40% 43% - 50.0%
Structured & securitized
products2% 2% 2% 2% 1% 1% 1% 1% 1% - 10.0%
Loans 3% 4% 4% 4% 4% 4% 3% 4% 4% - 10.0%
Equities2)3% 3% 3% 2% 2% 2% 3% 3% 3% - 10.0%
Real estate 5% 4% 4% 4% 4% 5% 5% 5% 5% - 10.0%
Other investments3)2% 2% 3% 3% 3% 2% 2% 2% 4% - 10.0%
Total invested assets
(in EUR billion)17.4 18.0 18.2 18.8 19.2 19.2 19.4 18.3 18.4
▐ In % (rounded)▐ In % of invested assets

37
Appendix G: Details of investment returns
1) Net of investment management expenses
2) Excluding funds withheld by cedants & other deposits
3) 2.7% excluding Q3 CAT impact on ILS funds
2016 2017
Q1 Q2 Q3 Q3 YTD Q4 FY Q1 Q2 Q3 Q3 YTD
Total net investment income1) 176 169 155 500 169 670 151 161 136 448
Average investments 26 888 26 944 26 911 26 914 26 939 26 921 27 116 26 601 25 974 26 564
Return on Investments (ROI) 2.6% 2.5% 2.3% 2.5% 2.5% 2.5% 2.3% 2.4% 2.1% 2.3%
Return on invested assets2) 3.3% 3.0% 2.6% 2.9% 3.0% 2.9% 2.6% 2.9% 2.3%3) 2.6%3)
Income 2.0% 2.0% 1.8% 1.9% 2.2% 2.0% 2.1% 2.2% 2.1% 2.1%
Realized capital gains/losses 1.7% 1.2% 0.9% 1.2% 0.8% 1.1% 0.5% 0.7% 0.4% 0.6%
Impairments & real estate amortization -0.2% -0.2% -0.2% -0.2% -0.1% -0.2% -0.1% -0.1% -0.2% -0.1%
Fair value through income -0.2% 0.0% 0.1% 0.0% 0.1% 0.0% 0.1% 0.0% 0.0% 0.1%
Return on funds withheld & other deposits 2.0% 2.2% 2.3% 2.2% 2.3% 2.2% 2.4% 2.2% 2.4% 2.3%
▐ In € millions (rounded)
Annualized returns:

38
2016 2017
Q1 Q2 Q3 Q3 YTD Q4 FY Q1 Q2 Q3 Q3 YTD
Investment revenues on invested assets 89 93 88 270 104 374 101 105 96 302
Realized gains/losses on fixed income 22 53 17 92 33 125 11 35 19 65
Realized gains/losses on loans 0 0 0 0
Realized gains/losses on equities 0 1 4 5 0 5 0 -0 1 1
Realized gains/losses on real estate 52 0 1 53 5 58 -0 0 0
Realized gains/losses on other investments 0 0 18 18 1 19 12 -0 0 12
Realized gains/losses on invested assets1) 74 54 40 168 39 207 23 35 20 78
Change in impairment on fixed income -1 -0 0 -1 -1 -2 0 -0 0 0
Change in impairment on loans -1 0 -1
Change in impairment on equity -1 -2 -5 -8 -0 -8
Change in impairment/amortization on real estate -5 -5 -6 -16 -5 -21 -5 -4 -6 -15
Change in impairment on other investments -1 -0 -4 -5
Change in impairment on invested assets -7 -8 -10 -25 -6 -31 -7 -4 -10 -21
Fair value through income on invested assets1) -7 1 6 -0 5 5 6 1 1 8
of which: step acquisition revaluation gain 13 13
Financing costs on real estate investments -2 -1 -1 -4 -1 -5 -1 -1 -1 -3
Total investment income on invested assets 147 138 124 409 141 550 122 136 106 364
Income on funds withheld & other deposits 44 47 46 137 45 182 46 42 45 133
Investment management expenses -15 -16 -14 -45 -17 -62 -17 -17 -15 -49
Total net investment income 176 169 156 501 169 670 151 161 136 448
Foreign exchange gains / losses -1 -1 10 8 3 11 -2 -12 2 -12
Step acquisition revaluation gain -13 -13
Income on technical items -1 -0 -3 -4 5 1 -0 -0 -0 -0
Financing costs on real estate investments 9 2 1 11 1 12 1 1 1 3
IFRS investment income net of investment
management expenses183 169 164 516 178 694 150 150 126 426
Appendix G: Investment income development
1) Fair value through income on invested assets includes EUR 4m realized loss on derivatives, included in realized capital
gains/losses on investments under IFRS
▐ In € millions (rounded)

39
Appendix G: Government bond portfolio as at 30/09/2017
11%
43%
8%
12%
26%EU (Non-UK)
North America
UK
China
Other
By region Top exposures
1) Supranational exposures consisting primarily of ‘‘European Investment Bank’’ securities and similar securities
▐ In %. Total € 4.1 billion
Q3 2017 YTD
USA 36%
China 12%
UK 8%
Canada 7%
Australia 5%
Supranational1) 4%
Germany 4%
Republic of Korea 4%
Singapore 4%
France 2%
Belgium 2%
South Africa 2%
Japan 1%
Brazil 1%
Denmark 1%
Netherlands 1%
Norway 1%
Other 5%
Total 100%
▐ In %. Total € 4.1 billion
No exposure to US municipal bonds
40
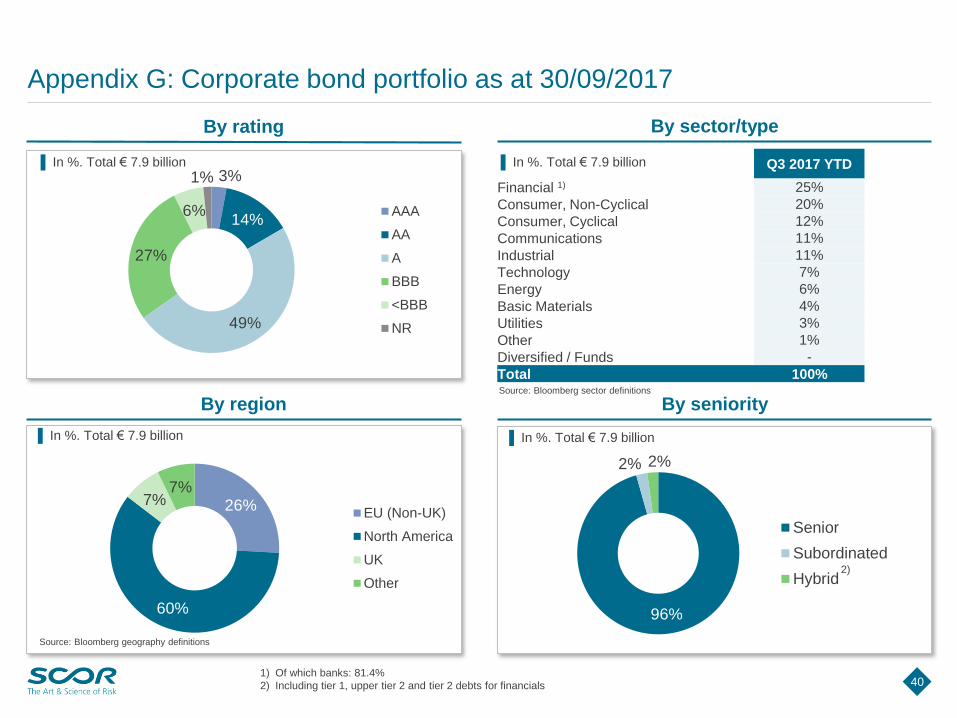
Appendix G: Corporate bond portfolio as at 30/09/2017
By rating
By region
Q3 2017 YTD
Financial 1) 25%
Consumer, Non-Cyclical 20%
Consumer, Cyclical 12%
Communications 11%
Industrial 11%
Technology 7%
Energy 6%
Basic Materials 4%
Utilities 3%
Other 1%
Diversified / Funds -
Total 100%
By sector/type
By seniority
1) Of which banks: 81.4%
2) Including tier 1, upper tier 2 and tier 2 debts for financials
Source: Bloomberg sector definitions
▐ In %. Total € 7.9 billion
3%
14%
49%
27%
6%
1%
AAA
AA
A
BBB
<BBB
NR
▐ In %. Total € 7.9 billion
26%
60%
7%7%
EU (Non-UK)
North America
UK
Other
96%
2% 2%
Senior
Subordinated
Hybrid
Source: Bloomberg geography definitions
2)
▐ In %. Total € 7.9 billion▐ In %. Total € 7.9 billion

41
Appendix G: ‘‘Banks’’ corporate bond portfolio as at 30/09/2017
By rating
By region
Q3 2017 YTD
USA 40%Canada 12%France 9%Netherlands 8%Sweden 8%Great Britain 7%Australia 6%Switzerland 6%Belgium 1%Danemark 1%Other 2%
Total 100%
By seniority
Top exposures
1) Including tier 1, upper tier 2 and tier 2 debts for financials
▐ In %. Total € 1.6 billion
▐ In %. Total € 1.6 billion
28%
52%
7%
13%
EU (Non-UK)
North America
UK
Other
90%
8% 2%
Senior
Subordinated
Hybrid
<1 %
13%
58%
27%
2%
<1 %
AAA
AA
A
BBB
<BBB
NR
Source: Bloomberg geography definitions
▐ In %. Total € 1.6 billion
▐ In %. Total € 1.6 billion

42
Appendix G: Structured & securitized product portfolio as at 30/09/2017
By rating By portfolio
64%1%
19%
3%5%
8% AAA
AA
A
BBB
<BBB
NR
4%
64%
10%
7%
15%ABS
CLO
CDO
MBS
Other
▐ In %. Total € 0.2 billion ▐ In %. Total € 0.2 billion
43
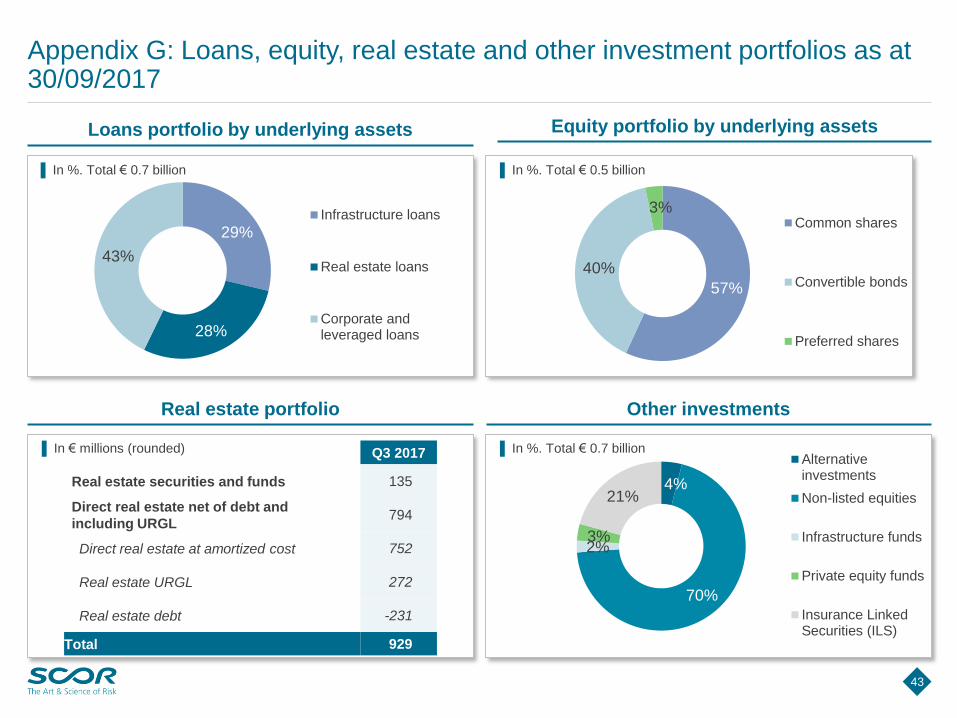
Appendix G: Loans, equity, real estate and other investment portfolios as at 30/09/2017
Loans portfolio by underlying assets
Real estate portfolio
Q3 2017
Real estate securities and funds 135
Direct real estate net of debt and
including URGL794
Direct real estate at amortized cost 752
Real estate URGL 272
Real estate debt -231
Total 929
Equity portfolio by underlying assets
Other investments
▐ In € millions (rounded)
4%
70%
2%3%
21%
Alternativeinvestments
Non-listed equities
Infrastructure funds
Private equity funds
Insurance LinkedSecurities (ILS)
57%
40%
3%Common shares
Convertible bonds
Preferred shares
29%
28%
43%
Infrastructure loans
Real estate loans
Corporate andleveraged loans
▐ In %. Total € 0.7 billion
▐ In %. Total € 0.5 billion▐ In %. Total € 0.7 billion

44
Appendix G: Reconciliation of IFRS asset classification to IR presentation as at 30/09/2017
1) Including Atlas cat bonds, Atlas IX mortality bond, derivatives used to hedge US equity-linked annuity book and FX derivatives2) 3rd party gross invested assets (gross of direct real estate debt and direct real estate URGL (mainly MRM))3) Certain consolidated entities held for investment purposes have been included in the scope of Invested Assets in Q3 20174) This relates to purchase of investments in September 2017 with normal settlements in October 20175) Includes real estate financing and relates only to buildings owned for investment purposes
Cash Fixed
incomeLoans Equities Real estate
Other
investments
Total
invested
assets
Funds withheld
by cedants &
other deposits
Total
investments
Accrued
interest
Technical
items1)
Total
IFRS
classification
Real estate investments 826 826 826 826
Equities 56 42 316 134 248 796 796 796
Fixed income 14 195 968 15 163 15 163 112 15 275
Available-for-sale
investments14 251 1 010 316 134 248 15 959 15 959 112 16 071
Equities 0 260 808 1 068 1 068 1 068
Fixed income 0 0 0 0
Investments at fair value
through income0 260 808 1 068 1 068 1 068
Loans and receivables 88 689 1 3 781 8 215 8 996 2 8 998
Derivative instruments 188 188
Total insurance business
investments14 339 1 699 576 961 1 059 18 634 8 215 26 849 114 188 27 151
Cash and cash equivalents 1 532 1 532 1 532 1 532
Total insurance business
investments and cash and
cash equivalents
1 532 14 339 1 699 576 961 1 059 20 166 8 215 28 381 114 188 28 683
3rd party gross invested
Assets2) -128 -150 -1 010 -50 -73 -667 -2 078 -2 078
Non listed equities3) 287 287 287
Direct real estate URGL 272 272 272
Direct real estate debt -231 -231 -231 -2315)
Cash payable/receivable4) -11 -11 -11
Total SGI classification 1 393 14 189 689 526 929 679 18 405 8 215 26 620
▐ In € millions (rounded)

45
Appendix G: Reconciliation of asset revaluation reserve
1) Including short-term investments2) Direct real estate is included in the balance sheet at amortized cost. The unrealized gain on real estate presented here is the
estimated amount that would be included in the balance sheet, were the real estate assets to be carried at fair value3) Includes revaluation reserves (FX on equities AFS)
31/12/2016 30/09/2017 Variance YTD
Fixed income URGL -20 11 31
Government bonds & assimilated1) -9 -16 -6
Covered & agency MBS -16 -13 2
Corporate bonds 2 40 38
Structured products 2 0 -2
Loans URGL -1 2 2
Equities URGL 36 104 68
Real estate URGL 282 280 -1
Real estate securities 10 8 -2
Direct real estate URGL2) 272 272 1
Other investments URGL 101 79 -22
Invested assets URGL 398 476 78
Less direct real estate investments URGL2) -272 -272 -1
URGL on 3rd party insurance business investments 5 6 1
Total insurance business investments URGL 131 210 79
Gross asset revaluation reserve 133 204 71
Deferred taxes on revaluation reserve -32 -49 -17
Shadow accounting net of deferred taxes 33 6 -27
Other3) -0 -13 -12
Total asset revaluation reserve 134 148 14
▐ In € millions (rounded)

Appendix H: SCOR has an active capital management policy and has paid EUR 2.2 billion dividends to shareholders since 2007
46
SCOR remunerates shareholders on the
basis of a well-defined dividend policy
SCOR manages its capital optimally
thanks to a disciplined annual process
Step 1: Ensures the projected solvency
position is in the optimal range
Step 2: Estimates and allocates capital to
support future accretive growth
Step 3: Defines the amount of a sustainable
regular dividend accordingly
Step 4: Evaluates any excess capital for
shareholder repatriation or future use
SCOR favors cash dividends, and if relevant
includes special dividends or share buy-backs
Minimum dividend payout ratio of 35%
37% 35%45% 48% 48%
62%53%
44%51%
44%51%
0.80 0.80 0.80
1.001.10 1.10
1.201.30
1.401.50
1.65
2006 2007 2008 2009 2010 2011 2012 2013 2014 2015 2016
Distribution rate
Dividend per share (€)

47
Appendix I: Debt structure as at 30/09/2017
1) The issue date is the closing of the debt issue i.e. the settlement date
Type
Original
amount
issued
Current amount
outstanding (book
value)
Issue date1)
MaturityFloating/
fixed rateCoupon + step-up
Undated subordinated
fixed to floating rate
notes PerpNC5.7
CHF 315
MillionCHF 315 million 8 October 2012 Perpetual Fixed
Initial rate at 5.25% p.a. until
June 8, 2018, floating rate indexed
on the 3-month CHF Libor
+ 4.8167% margin
Undated subordinated
fixed to floating rate
notes PerpNC5.2
CHF 250
MillionCHF 250 million
30 September
2013Perpetual Fixed
Initial rate at 5.00% p.a. until
November 30, 2018, floating rate
indexed on the 3-month CHF Libor
+ 4.0992% margin
Undated subordinated
notes PerpNC11
EUR 250
MillionEUR 250 million 1 October 2014 Perpetual Fixed
Initial rate at 3.875% p.a. until
October 1, 2025,
revised every 11 years at 11-years
EUR mid-swap rate + 3.7%
Undated subordinated
notes PerpNC6
CHF 125
millionCHF 125 million
20 October
2014Perpetual Fixed
Initial rate at 3.375% p.a. until
October 20, 2020,
revised every 6 years at 6-years CHF
mid-swap rate + 3.0275%
Dated Subordinated
notes 32NC12
EUR 250
MillionEUR 250 million 5 June 2015
32 years
2047Fixed
Initial rate at 3.25% p.a.
until June 5, 2027,
revised every 10 years at the 10-year
EUR mid-swap rate +3.20%
Dated Subordinated
Notes30.5NC10
EUR 600
MillionEUR 600 million
7 December
2015
30.5 years
8 June 2046Fixed
Initial rate at 3% p.a.
until June 8, 2026,
revised every 10 years at 10-year
EUR mid-swap rate + 3.25%
Dated Subordinated
Notes 32NC12
EUR 500
Million
EUR 500
Million27 May 2016
32 years
27 May 2048Fixed
Initial rate at 3.625% p.a.
until May 27, 2028,
revised every 10 years at 10-year
EUR mid-swap rate + 3.90%

48
Appendix J: SCOR’s Financial Strength Rating has improved dramatically since 2003
1) Credit watch with positive implications
Se
cu
re Ex
ce
lle
nt
A+
A
A-
Ve
ry g
oo
dB++
B+
2003 2004 2005 2006 2007 2008 2009 2010 2011 2012 2013 2014 2015 2016 2017
Se
cu
re
Ve
ry
str
on
g Aa1
Aa2
Aa3
Str
on
g A1
A2
A3
Go
od
Baa1
Baa2
Baa3
2003 2004 2005 2006 2007 2008 2009 2010 2011 2012 2013 2014 2015 2016 2017
Se
cu
re
Ve
ry
str
on
g AA+
AA+
AA-
Str
on
g A+
A+
A-
Go
od
BBB+
BBB+
BBB-
Vulnerab
le
Moderate
ly weak BB+
2003 2004 2005 2006 2007 2008 2009 2010 2011 2012 2013 2014 2015 2016 2017
Se
cu
re
Ve
ry
str
on
g AA+
AA+
AA-
Str
on
g A+
A+
A-
Go
od
BBB+
BBB+
BBB-
2003 2004 2005 2006 2007 2008 2009 2010 2011 2012 2013 2014 2015 2016 2017
+
+
+ +
+
+
+
+
+
-
X
+
-
+
+
-
++
+
Revios acquisition (11/06) Converium acquisition (08/07) TaRe acquisition (08/11)
Stable outlook Positive outlook / cwp1)+- Credit watch negative X Issuer Credit Rating to “a+”
Generali US acquisition (10/13)
Fitch rating – 6 upgrades AM Best rating – 3 upgrades
AA-Stable Outlook
AA-Stable Outlook
Aa3Stable Outlook
A+Stable Outlook
S&P rating – 4 upgrades Moody’s rating – 6 upgrades

49
Appendix K: SCOR’s listing information
Main information
DR Symbol SCRYY
CUSIP 80917Q106
Ratio 10 ADRs: 1 ORD
Country France
Effective Date June 5, 2007
Underlying
SEDOL
B1LB9P6
Underlying ISIN FR0010411983
U.S. ISIN US80917Q1067
Depositary BNY Mellon
SCOR’s ADR shares trade on the
OTC market
Main information
Valor symbol SCR
Valor number 2'844'943
ISIN FR0010411983
Trading currency CHF
Effective Date August 8, 2007
Security segment Foreign Shares
Main information
Valor symbol SCR
ISIN FR0010411983
Trading currency EUR
Country France
SCOR’s shares are publicly traded
on the Eurolist by the Euronext
Paris stock market
SCOR’s shares are publicly traded
on the SIX Swiss Exchange
(formerly known as the SWX Swiss
Exchange)
SCOR’s shares are also tradable over the counter on the Frankfurt Stock Exchange
Euronext Paris listing SIX Swiss Exchange listing ADR programme
50
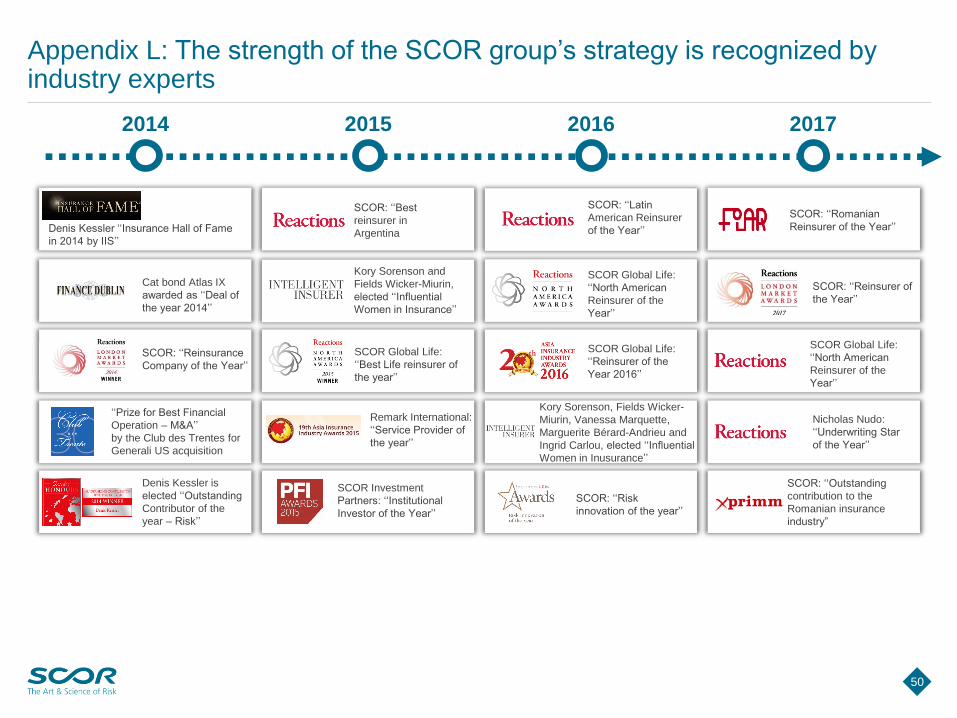
Appendix L: The strength of the SCOR group’s strategy is recognized by industry experts
2014 201720162015
Denis Kessler ‘‘Insurance Hall of Fame
in 2014 by IIS’’
SCOR: ‘‘Reinsurance
Company of the Year’’
Cat bond Atlas IX
awarded as ‘‘Deal of
the year 2014’’
SCOR: ‘‘Best
reinsurer in
Argentina
SCOR Global Life:
‘‘Best Life reinsurer of
the year’’
Remark International:
‘‘Service Provider of
the year’’
SCOR Investment
Partners: ‘‘Institutional
Investor of the Year’’
Kory Sorenson and
Fields Wicker-Miurin,
elected ‘‘Influential
Women in Insurance’’
SCOR: ‘‘Latin
American Reinsurer
of the Year’’
SCOR Global Life:
‘‘Reinsurer of the
Year 2016’’
Kory Sorenson, Fields Wicker-
Miurin, Vanessa Marquette,
Marguerite Bérard-Andrieu and
Ingrid Carlou, elected ‘‘Influential
Women in Inusurance’’
SCOR: ‘‘Risk
innovation of the year’’
Nicholas Nudo:
‘‘Underwriting Star
of the Year’’
SCOR: ‘‘Romanian
Reinsurer of the Year’’
‘‘Prize for Best Financial
Operation – M&A’’
by the Club des Trentes for
Generali US acquisition
Denis Kessler is
elected ‘‘Outstanding
Contributor of the
year – Risk’’
SCOR Global Life:
‘‘North American
Reinsurer of the
Year’’
SCOR: ‘‘Reinsurer of
the Year’’
SCOR Global Life:
‘‘North American
Reinsurer of the
Year’’
SCOR: ‘‘Outstanding
contribution to the
Romanian insurance
industry”
Related Documents