SCM 330 SCM 330 Ocean Discovery through Technology Ocean Discovery through Technology Area F GE Area F GE

SCM 330 Ocean Discovery through Technology Area F GE.
Dec 13, 2015
Welcome message from author
This document is posted to help you gain knowledge. Please leave a comment to let me know what you think about it! Share it to your friends and learn new things together.
Transcript
SCM 330SCM 330 Ocean Discovery through TechnologyOcean Discovery through Technology
Area F GEArea F GE
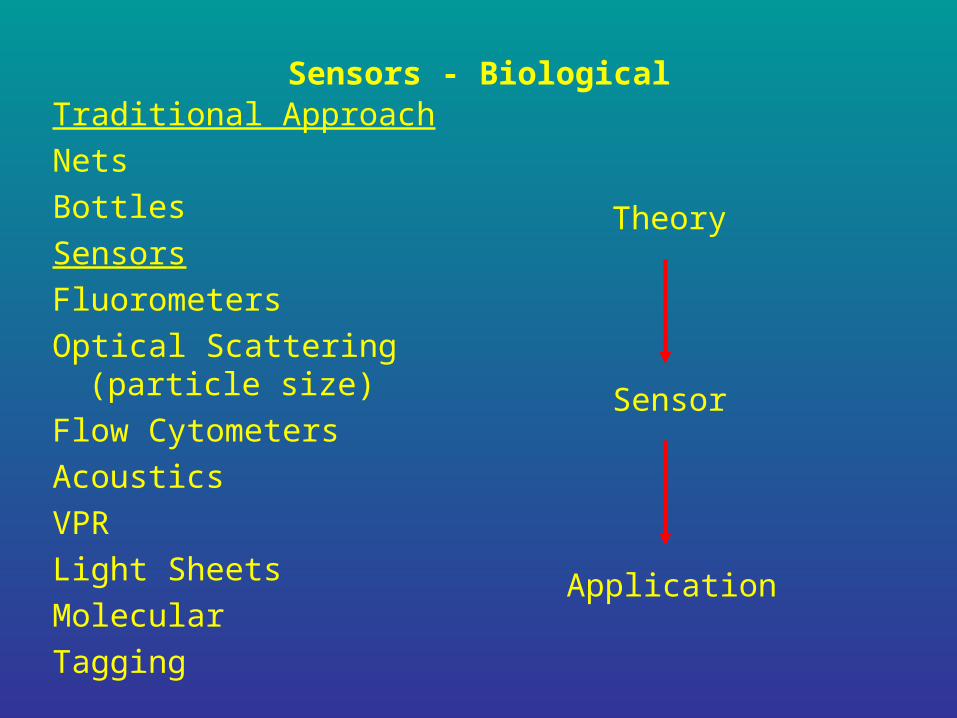
Sensors - BiologicalTraditional Approach
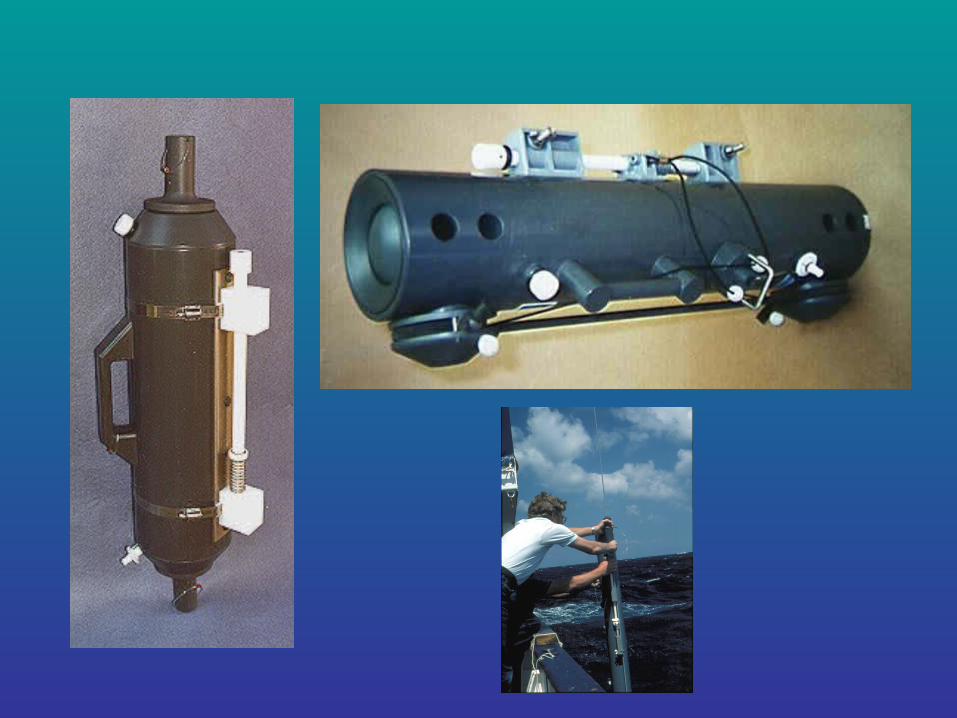
Nets
Bottles
Sensors
Fluorometers
Optical Scattering (particle size)
Flow Cytometers
Acoustics
VPR
Light Sheets
Molecular
Tagging
Theory
Application
Sensor

Nets


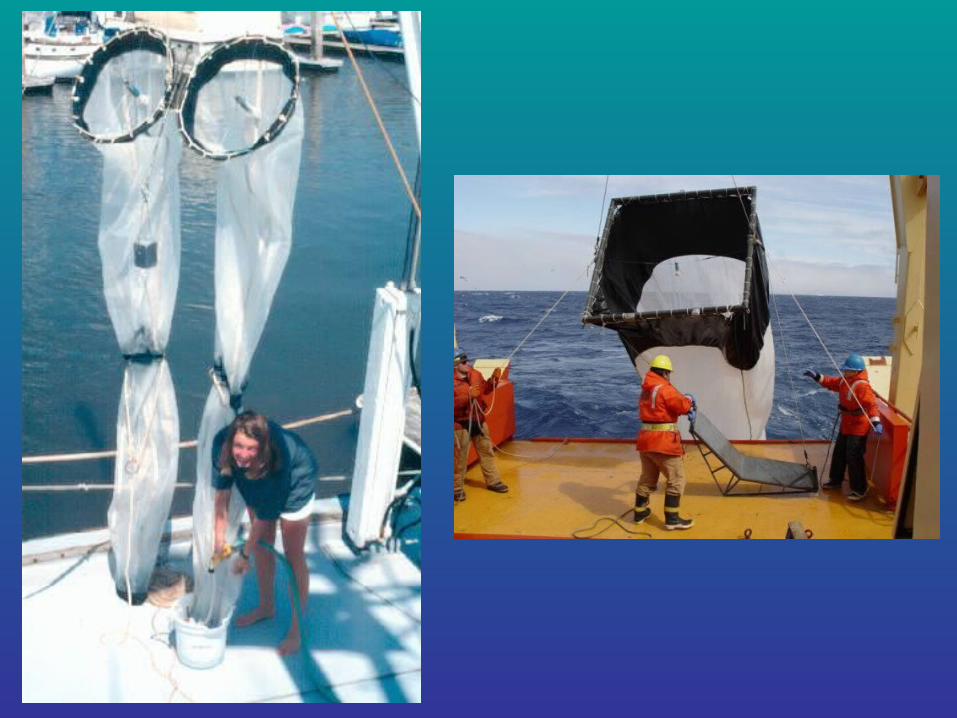

Bottles


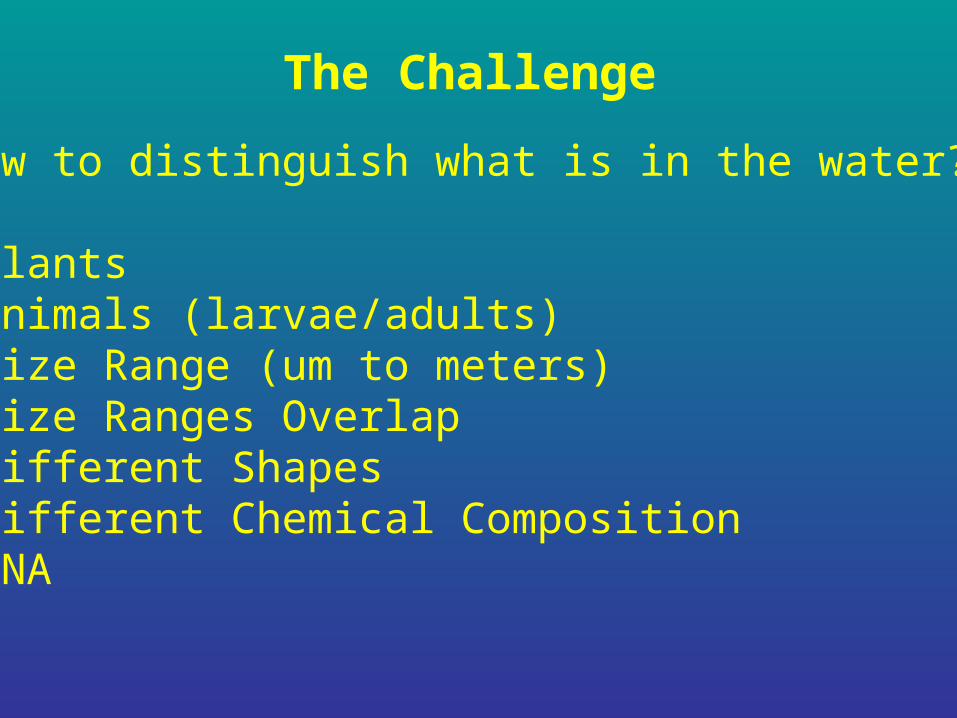
The Challenge
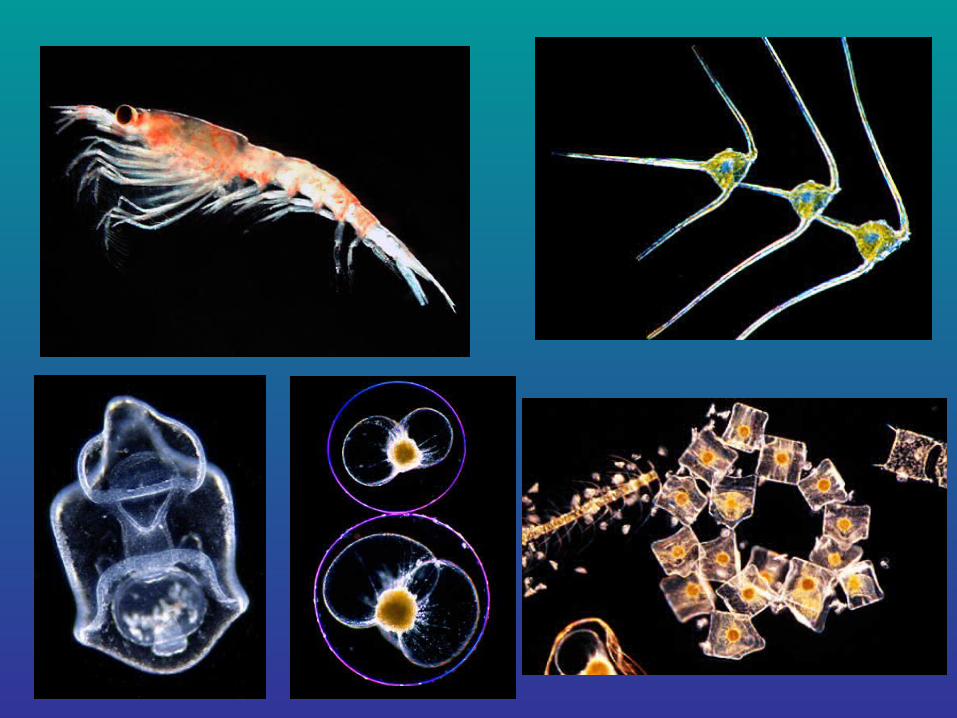
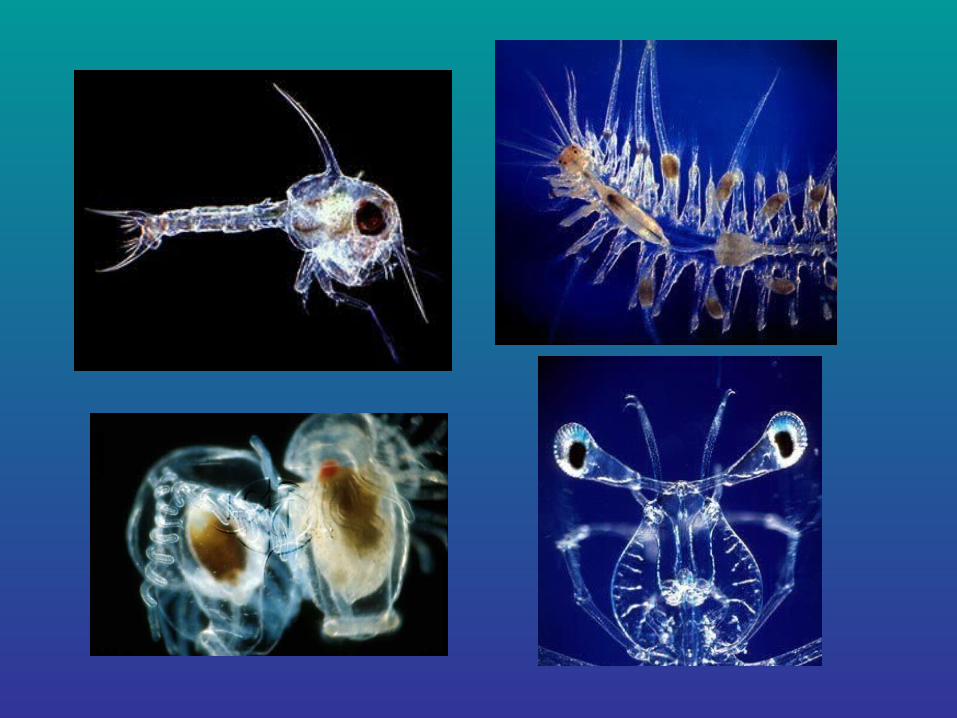
How to distinguish what is in the water?
•Plants•Animals (larvae/adults)•Size Range (um to meters)•Size Ranges Overlap•Different Shapes•Different Chemical Composition•DNA

Sensor Design
Requirements
•Compact•Low Power•High Sampling Rate•General Application•Pressure Tolerant•Low Cost

Fluorometers
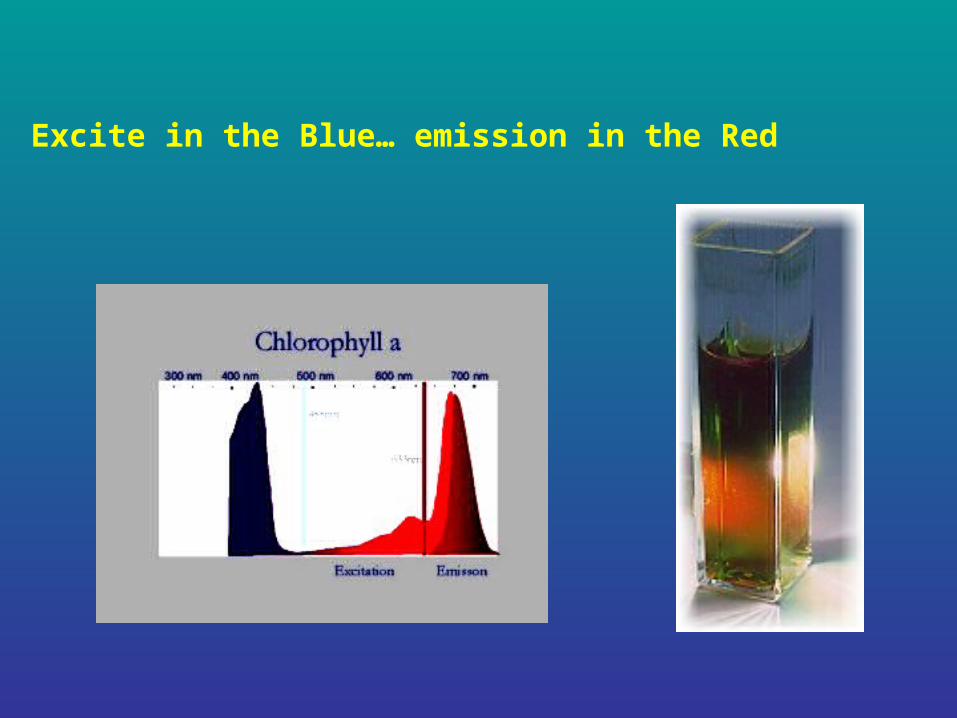
Excite in the Blue… emission in the Red


Spectrofluorometer(Multiple Excitation/Multiple Emission)

Off the Coast of Oregon

Shore Station Off Canada

Morro Bay

Optical Scattering
Scattering at 32 angles is the primary information that is recorded. This primary measurement is mathematically inverted to get the size distribution (1um – 2000um)
Backscatter decreases with size – Used as a tool to look at size distributions of particles.
Laser In-Situ Scattering and Transmissometer (LISST)
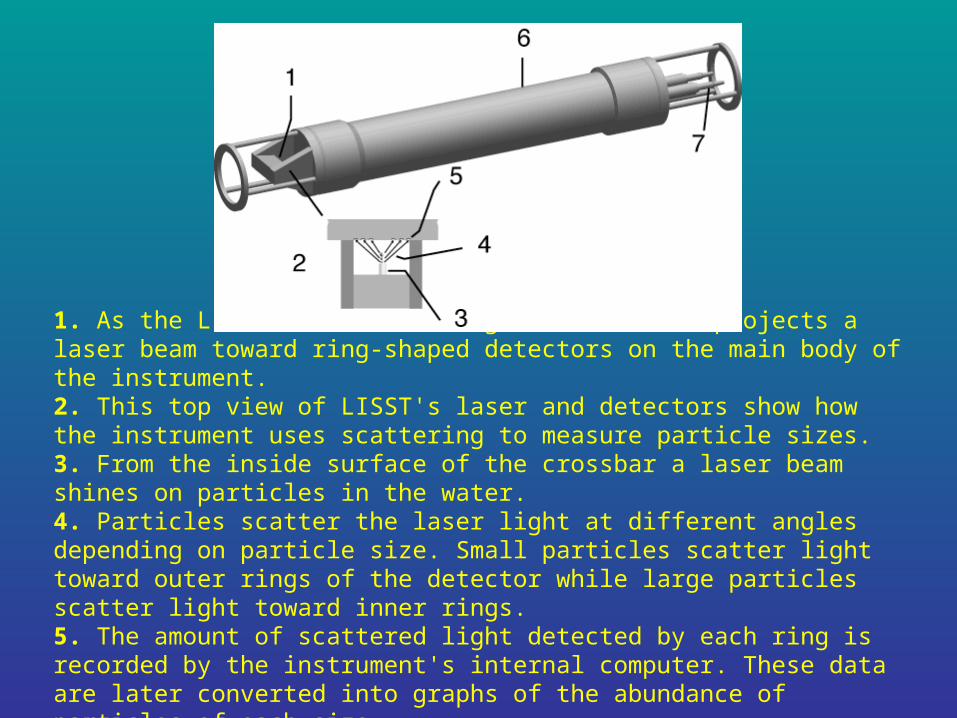
1. As the LISST descends through the water it projects a laser beam toward ring-shaped detectors on the main body of the instrument.2. This top view of LISST's laser and detectors show how the instrument uses scattering to measure particle sizes.3. From the inside surface of the crossbar a laser beam shines on particles in the water.4. Particles scatter the laser light at different angles depending on particle size. Small particles scatter light toward outer rings of the detector while large particles scatter light toward inner rings.5. The amount of scattered light detected by each ring is recorded by the instrument's internal computer. These data are later converted into graphs of the abundance of particles of each size.


Inshore Offshore
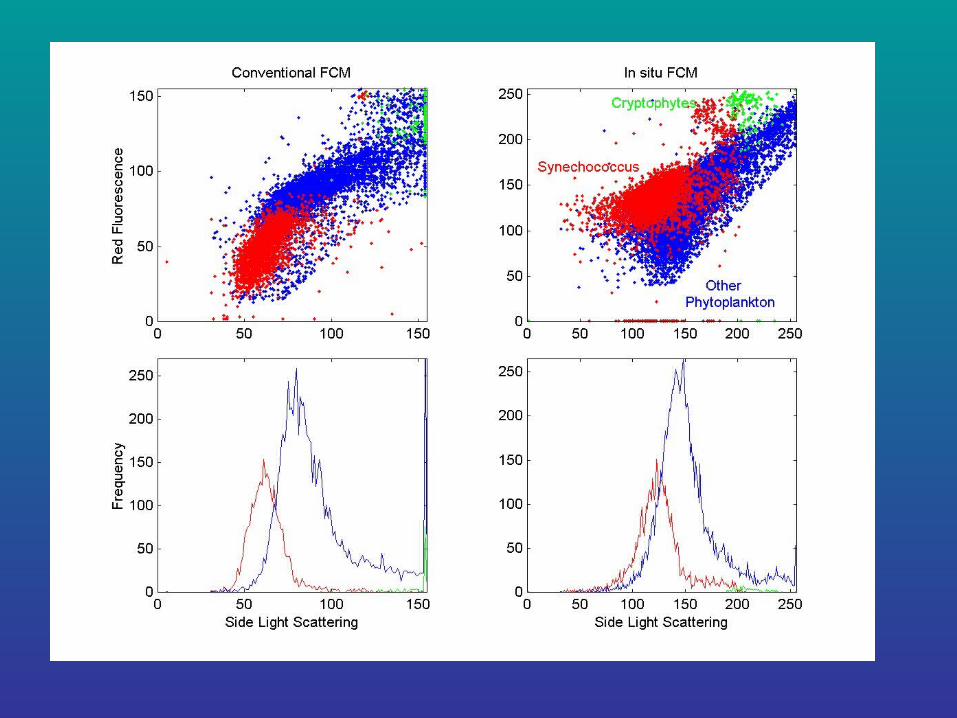
Flow CytometryFlow cytometry has proved a valuable tool for the analysis of phytoplankton and other suspended particles because of its speed and quantitative measurements, but the method’s oceanographic application has been limited by the need to take discrete water samples for analysis on board ship or in the laboratory.
This instrument differs from conventional flow cytometers in that it uses a simple ducted flow of seawater through the flow cell, rather than hydrodynamically focusing a stream of sample seawater by injecting it into a sheath of particle-free fluid.
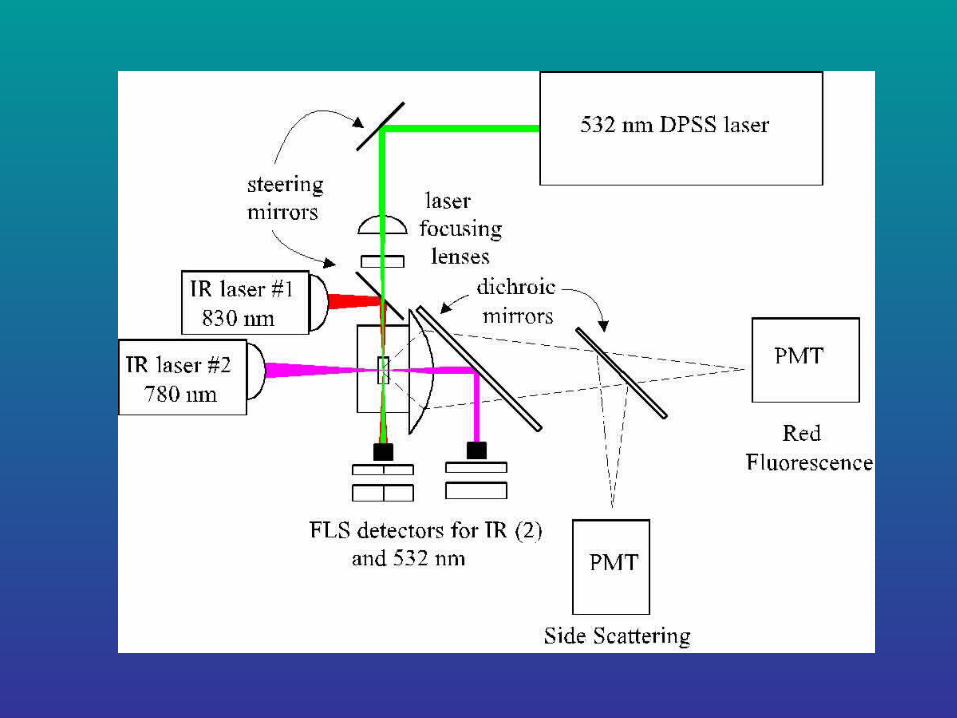
The new instrument defines a sensing region in the center of a diode-pumped 532 nm laser beam, based on the intersection of 2 diode lasers; only signals from those particles which pass through all 3 beams are accepted.


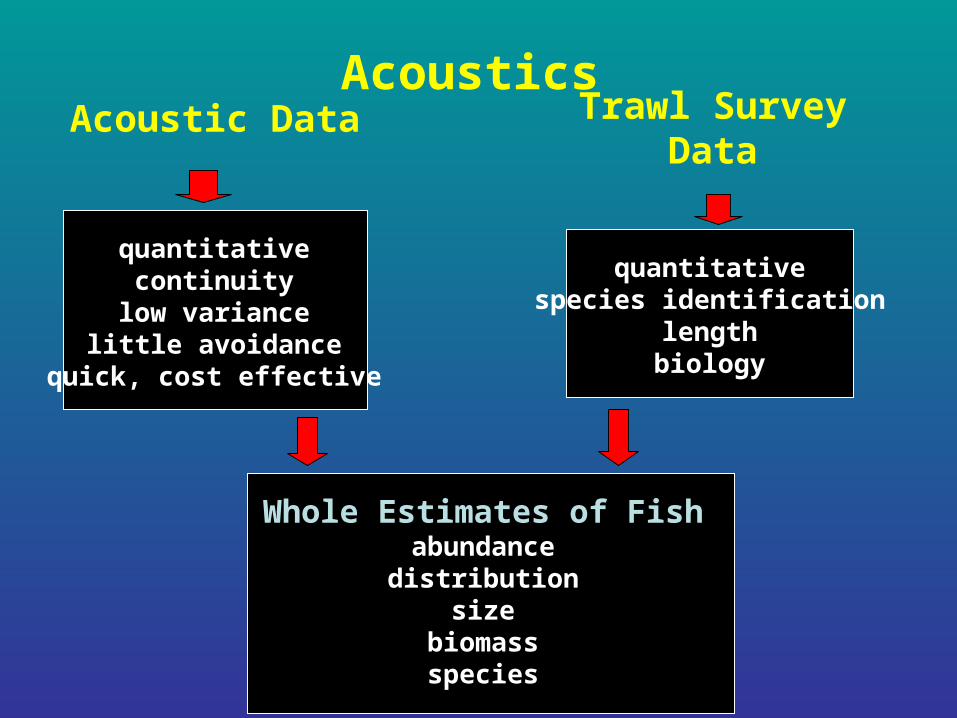
Acoustic Data Trawl SurveyData
quantitativecontinuity
low variancelittle avoidance
quick, cost effective
quantitativespecies identification
lengthbiology
Whole Estimates of Fishabundancedistribution
sizebiomassspecies
Acoustics
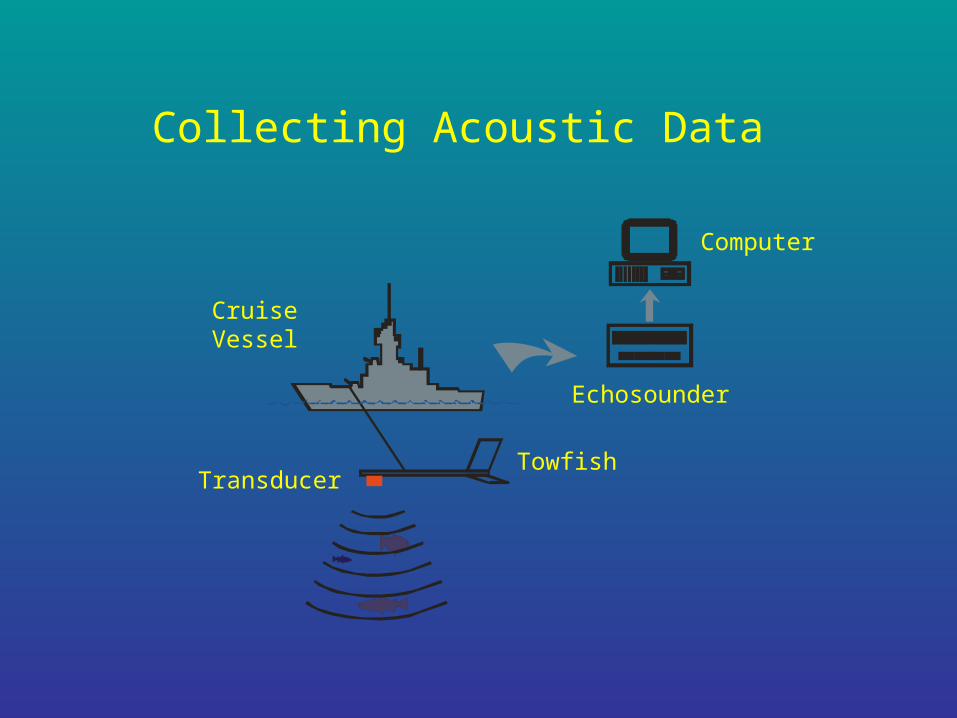
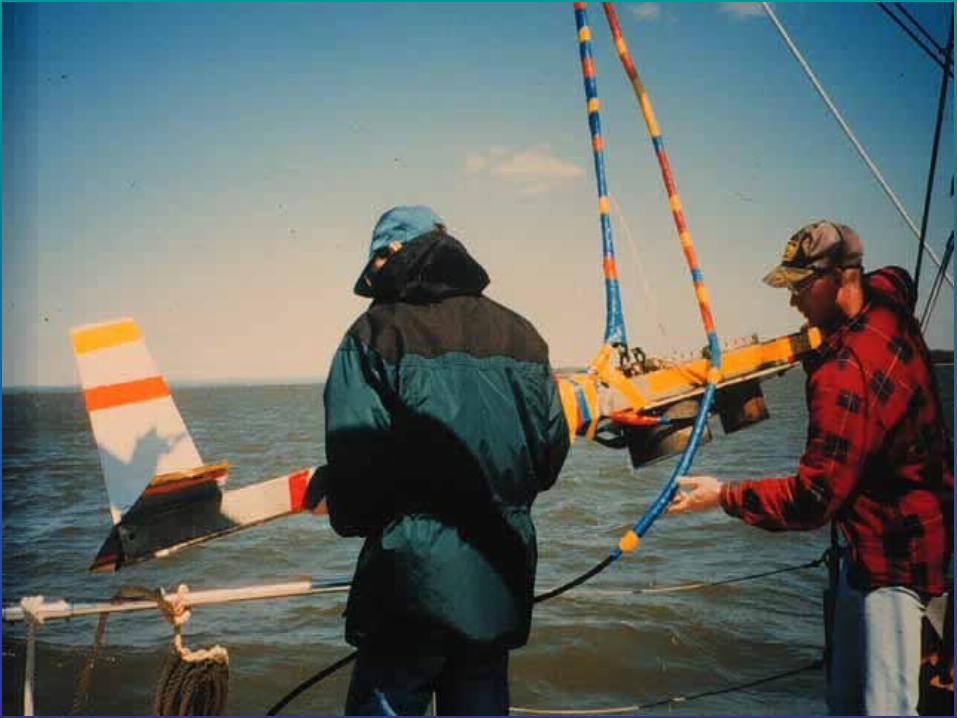
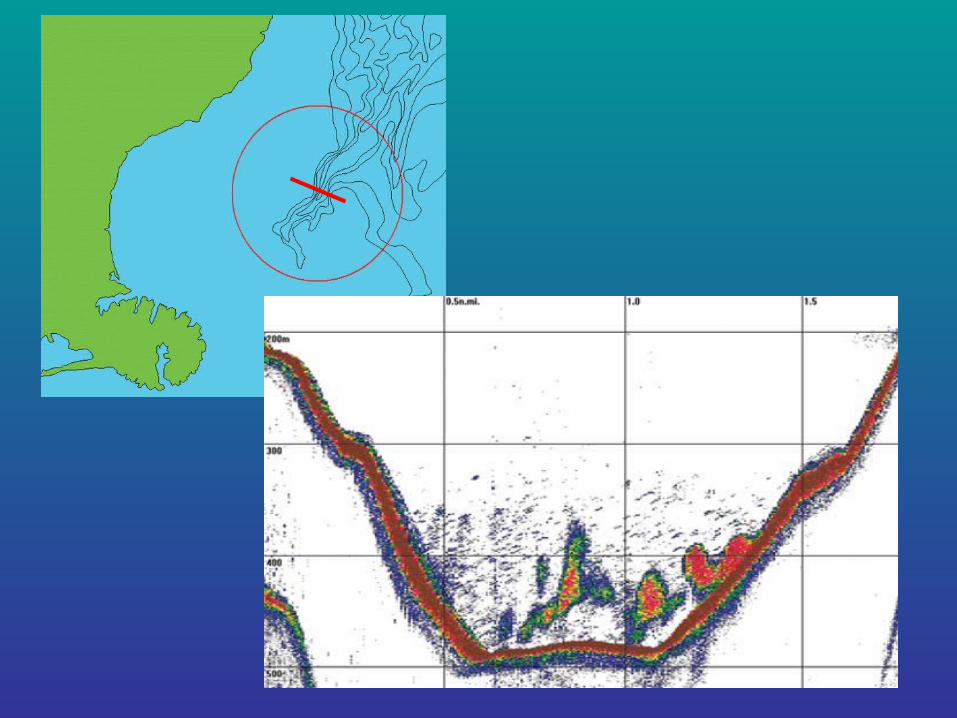
Collecting Acoustic Data
Computer
Echosounder
TowfishTransducer
CruiseVessel


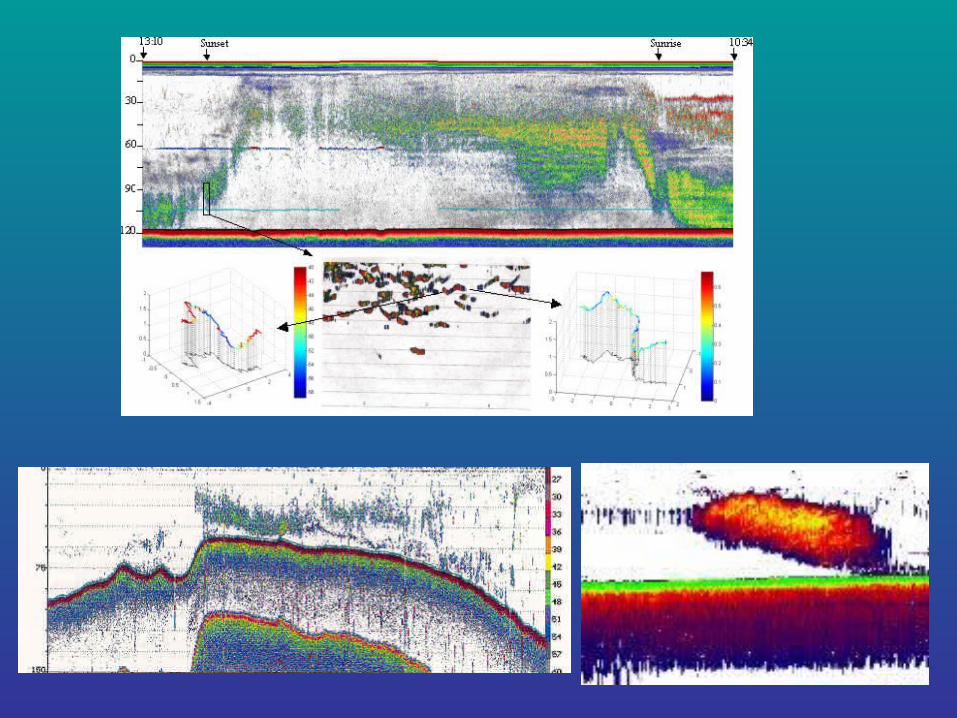
Acoustic Echogram
Surface
Fish targets
Bottomsubstrate
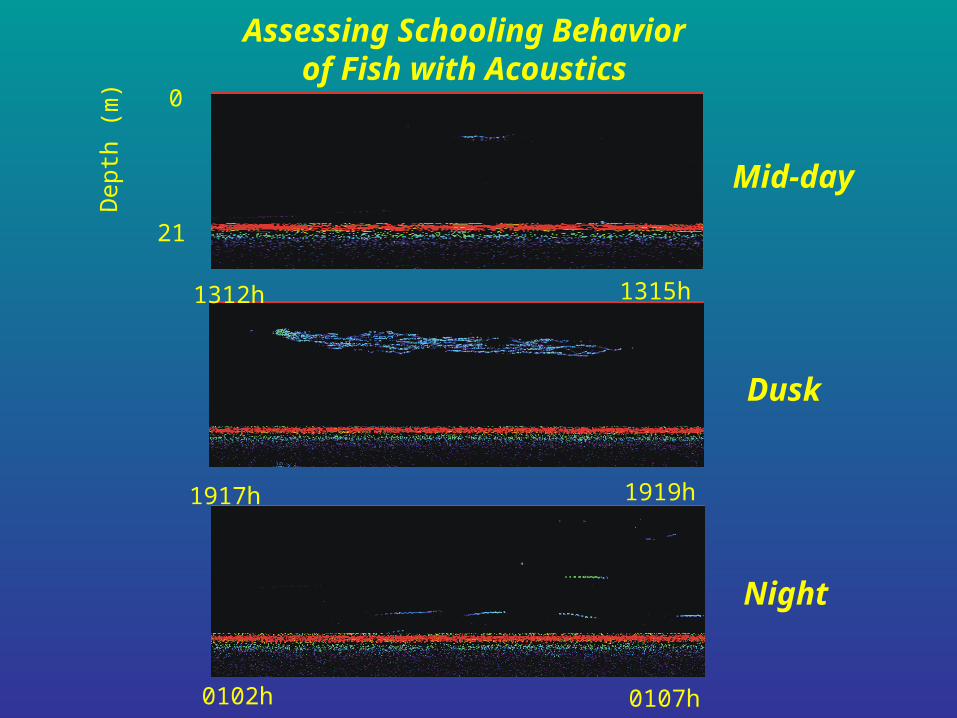
Assessing Schooling Behaviorof Fish with Acoustics
Dep
th (
m) 0
21
1312h 1315h
1917h 1919h
0102h 0107h
Mid-day
Dusk
Night
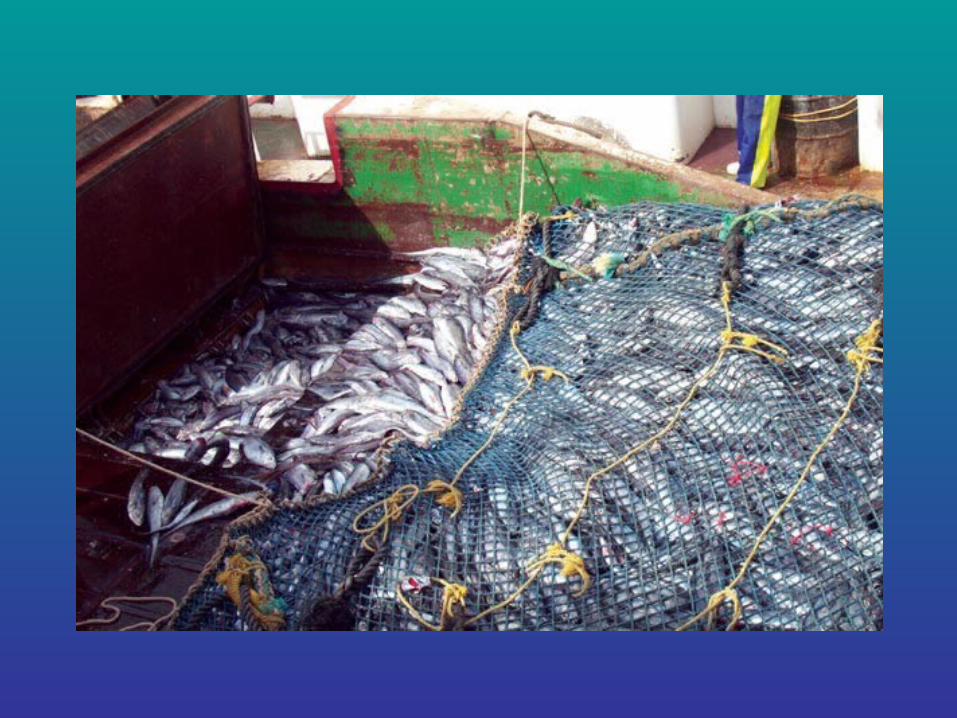

Pollock Salmon

Related Documents