DSC 2003 Working Papers (Draft Versions) http://www.ci.tuwien.ac.at/Conferences/DSC-2003/ SciViews: an object-oriented abstraction layer to design GUIs on top of various calculation kernels Philippe Grosjean [email protected] Abstract SciViews aims to provide a unique, polymorph object-oriented interface (called “Plug”) to different data analysis software like R, Octave, Scilab, Mat- lab, Splus, Ox, Mathematica,. . . It is thus possible to develop (Graphical) User Interfaces independently to the calculation kernel and adapt them easily to other systems. Moreover, the same GUI can possibly access several kernels si- multaneously. A working prototype is developed in Visual Basic for Windows, but other implementations of this concept are possible. A plug to connect R is provided. Other plugs are in various stages of achievement. Several clients are also in development, including SciViews compatible clients for office pro- grams (Excel and Word) and a versatile GUI with menus, toolbars, docking windows, a complete IDE and an integrated reporting system for generating rich-formatted texts with graphs called “Insider”. 1 Introduction Free data analysis software like R [1] (see http://www.R-project.org/), Octave [2] (see http://www.octave.org/) or Scilab (see http://www.rocq.inria.fr/ scilab/) offer a command line interface (CLI). CLI has proven to be a flexible and efficient way for power users to interact with the calculation kernel. However, there is a steady demand [3] for a more intuitive graphical user interface (GUI) for some users, mainly occasional ones. Most commercial software like Splus, SPSS, SAS, Matlab, Mathematica, . . . propose feature-rich GUIs. There are several difficulties in building a GUI for a data analysis software originally designed to be used through a CLI. Some are technical, other ones are

Welcome message from author
This document is posted to help you gain knowledge. Please leave a comment to let me know what you think about it! Share it to your friends and learn new things together.
Transcript
DSC 2003 Working Papers(Draft Versions)
http://www.ci.tuwien.ac.at/Conferences/DSC-2003/
SciViews:
an object-oriented abstraction
layer to design GUIs on top
of various calculation kernels
Philippe Grosjean
Abstract
SciViews aims to provide a unique, polymorph object-oriented interface(called “Plug”) to different data analysis software like R, Octave, Scilab, Mat-lab, Splus, Ox, Mathematica,. . . It is thus possible to develop (Graphical) UserInterfaces independently to the calculation kernel and adapt them easily toother systems. Moreover, the same GUI can possibly access several kernels si-multaneously. A working prototype is developed in Visual Basic for Windows,but other implementations of this concept are possible. A plug to connect Ris provided. Other plugs are in various stages of achievement. Several clientsare also in development, including SciViews compatible clients for office pro-grams (Excel and Word) and a versatile GUI with menus, toolbars, dockingwindows, a complete IDE and an integrated reporting system for generatingrich-formatted texts with graphs called “Insider”.
1 Introduction
Free data analysis software like R [1] (see http://www.R-project.org/), Octave[2] (see http://www.octave.org/) or Scilab (see http://www.rocq.inria.fr/scilab/) offer a command line interface (CLI). CLI has proven to be a flexibleand efficient way for power users to interact with the calculation kernel. However,there is a steady demand [3] for a more intuitive graphical user interface (GUI) forsome users, mainly occasional ones. Most commercial software like Splus, SPSS,SAS, Matlab, Mathematica, . . . propose feature-rich GUIs.
There are several difficulties in building a GUI for a data analysis softwareoriginally designed to be used through a CLI. Some are technical, other ones are
DSC 2003 Working Papers 2
conceptual problems. Major technical issues with CLI-designed software relate tothe main loop (or event loop). With a CLI, command submission is synchronous: nointeraction with the interface is allowed during calculation. Since a GUI is usuallyevent-driven, and possibly interacts with the user or with other programs at anytime (for instance, to redraw windows when they are resized or moved), it is notacceptable to freeze the UI completely during calculation.
For conceptual issues, the kind of GUI (spreadsheet, notebook, IDE-like, . . . )has a major influence on the way the user interacts with the calculation kernel. Thelook-and-feel, and also extra features provided by the GUI can also range from ex-tremely useful helping tools to annoying and useless gadgets. It seems that the waythe GUI actually drives the user, and especially rather inexperienced statisticianscan have a significant impact on the analyses. If the user interface is extremely easyto use, for instance, providing a dialog box with default values and an ‘OK’ button,there are chances that most inexperienced users run meaningless analysis. This isbecause such an interface does not require understanding of underlying calculationsto produce “results”. On the contrary, an UI requiring a stepwise constructiveelaboration of the analysis, like S language keyed at the command line is by far lessprone to such a side-effect. Moreover, the command history associated with the CLIallows easy recording and replaying of the session, a critical feature for repetitivetasks or for teaching (because it eases verification of student’s works). This raisesthe question whether an intuitive and easy to use GUI is even desirable for dataanalysis software. Yet, GUI can simplify life of the user in many ways (context-sensitive help, explorers, completion lists, menus or shortcuts to frequently-usedfeatures). Thus, due to this ambiguity –beginners or occasional users want easierGUIs, but they learn better habits with a bare CLI–, the “perfect” GUI for dataanalysis software perhaps remains to be designed. It is probably a subtle balancebetween several contradictory requirements.
The main motivation for creating SciViews is to raise the opportunity to de-sign easily different kind of GUIs on top of various calculation kernels, in order toencourage experimentation of concepts. The second major motivation relates tothe other side: the calculation kernel. Several ones exist, with their particularities,their strengths and weaknesses. Therefore, not a single calculation kernel is ableto answer all questions equally well. Having the same, familiar GUI accessing dif-ferent kernels is a big advantage in this context. Unfortunately, such a polyvalentGUI does not exist. ESS (Emacs Speaks Statistics, [4]) introduced this attractiveconcept of one UI capable to drive various different statistical kernels. However,Emacs is a very particular UI, not really tailored to design GUIs (it is not its pur-pose). SciViews aims thus to fill the gap. The present paper exposes its conceptand introduces a SciViews prototype (available at http://www.sciviews.org/).
2 Abstraction of the Kernel - GUI Interface
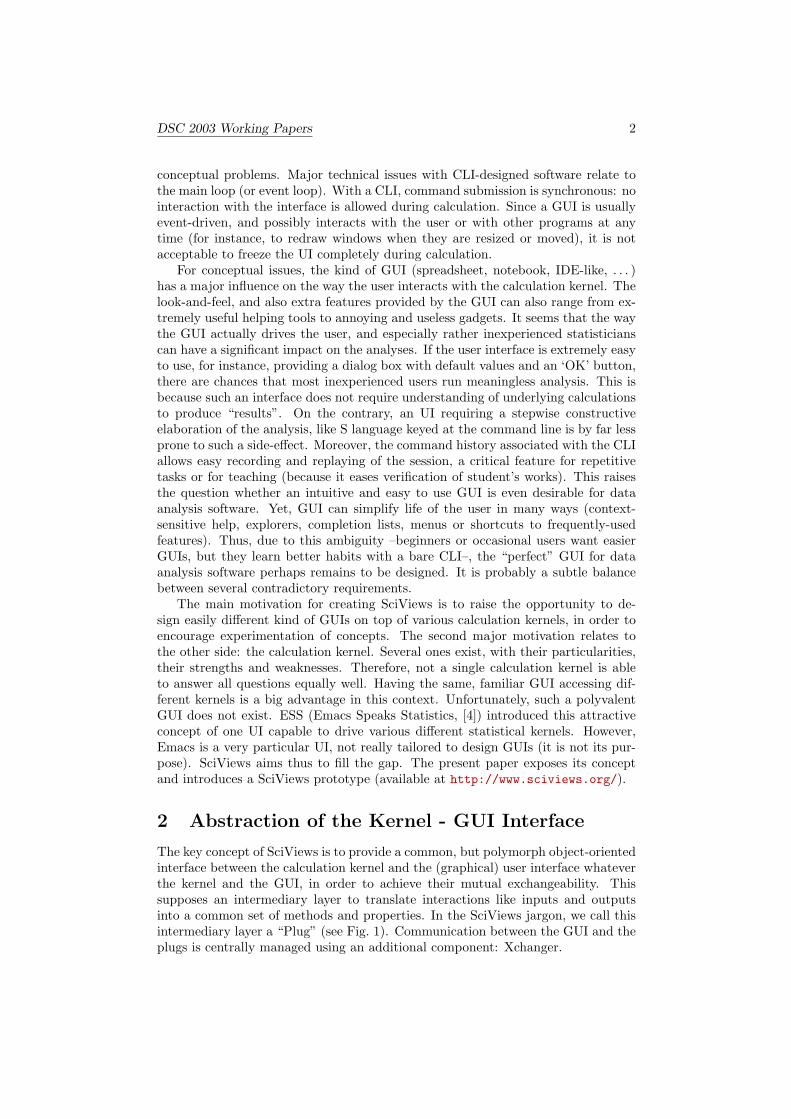
The key concept of SciViews is to provide a common, but polymorph object-orientedinterface between the calculation kernel and the (graphical) user interface whateverthe kernel and the GUI, in order to achieve their mutual exchangeability. Thissupposes an intermediary layer to translate interactions like inputs and outputsinto a common set of methods and properties. In the SciViews jargon, we call thisintermediary layer a “Plug” (see Fig. 1). Communication between the GUI and theplugs is centrally managed using an additional component: Xchanger.
DSC 2003 Working Papers 3
Figure 1: A GUI connects to various kernels using “Plugs”.
Adding this intermediary layer between the UI and the calculation kernel isobviously resource consuming. Such an architecture is thus not pertinent when thedata flow between the UI and the kernel(s) is large or when performances suffer nocompromise. However, since it aims to substitute a typical command line interface,this gives the conditions of use: the equivalent of a command line string issued bythe user for the input, and the equivalent of a few screens of textual results for theoutput, with potentially alternate means to exchange larger amount of data thatwill not flow through the plug (graphics, large matrices, . . . ). To define the limitsof usability of such a system, we will accept solutions where:
computation time >> transaction time
or, in the case of very short computation time:
number of transactions. sec−1 < 10
with: ‘computation time’ being the time required to process the command insidethe kernel and ‘transaction time’ being the processing time used by additional layersplaced between the GUI and the kernel. The first condition applies for computer-intensive commands. It indicates that additional overhead due to the intermediarylayer should remain proportionally negligible. The second condition is a limitationimposed for transactions that require very little computation in the kernel. A rapidsuccession of such transactions between the GUI and the kernel would saturate theprocessing unit with message passing through the intermediary layer. That secondcondition fixes thus the highest sustainable flow of transactions that the system can
DSC 2003 Working Papers 4
guarantee. We arbitrarily place the limit at 10 transactions per second, that is,indeed much more commands than a user can issue per second!
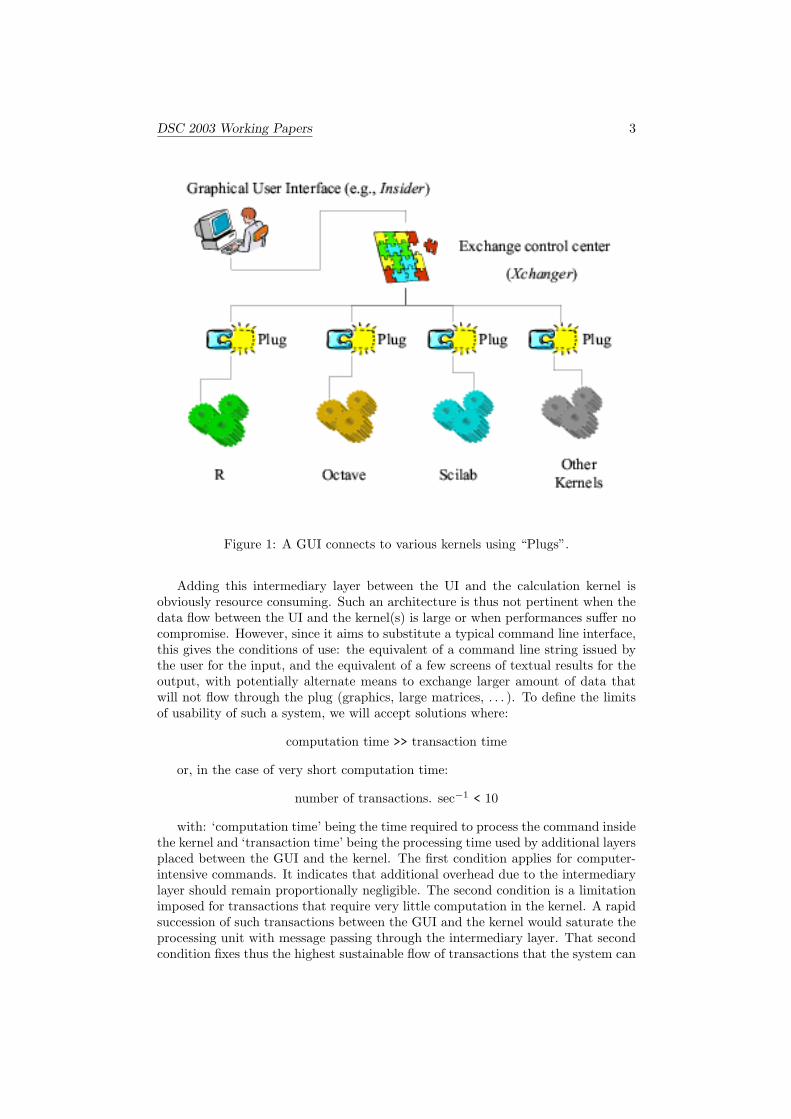
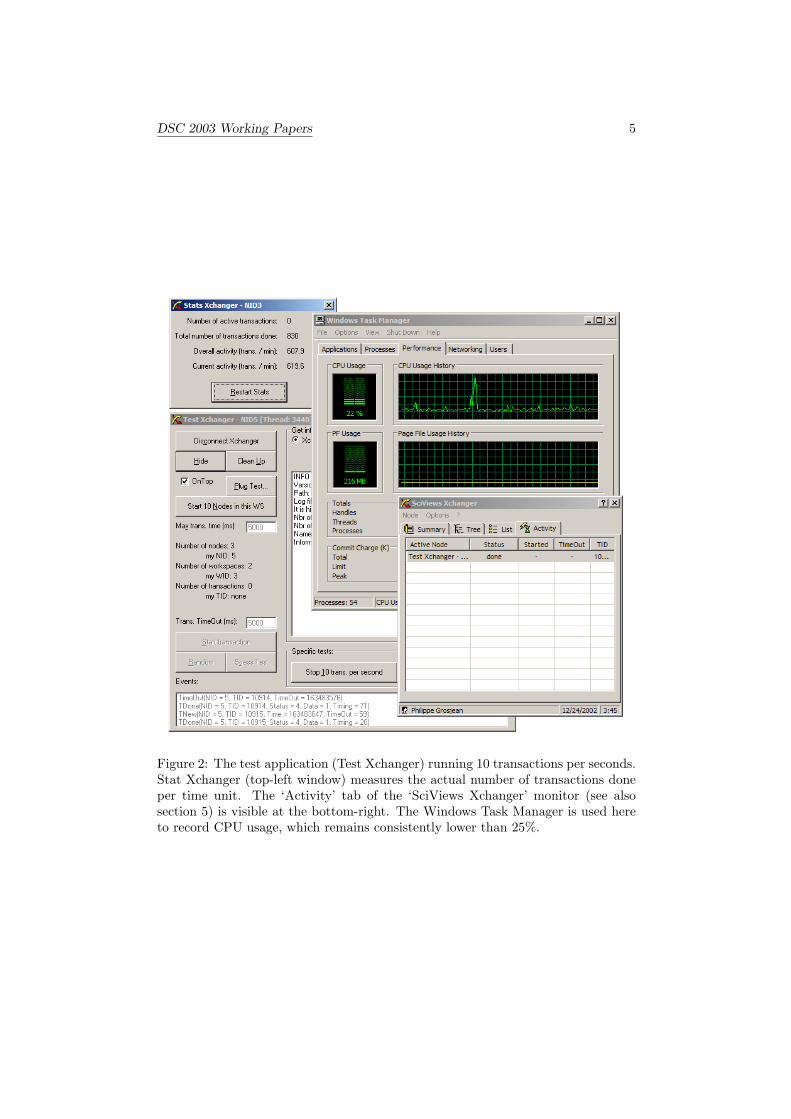
A prototype is developed to check the concept and to verify that it satisfiesthese conditions. It is written using a RAD tool: Visual Basic 6 professional. Asimple GUI client (“Test Xchanger”) implements a few tests: (1) it can plug toa R kernel and initiate computer-intensive transactions, (2) it can spawn 10 nodesthat each trigger transactions randomly in order to verify that concurrent use of theresources is possible, (3) it can trigger 10 transactions per seconds to check CPUusage in the second condition, and (4) it can fire as much transactions as possibleper time unit (stress test) to push the system to the limits. “Stats Xchanger”,another simple SciViews client, calculates the number of transactions per time unitactually achieved with a given test. Fig. 2 illustrates a test of the second conditionperformed on a Pentium IV 1.6 Ghz with 1 Gb memory (but less than 256 Kbis actually used) under Windows XP professional: the total CPU usage remainslower than 25%, leaving about 75% of the CPU resources free for computations.Of course, with a lower flow of transactions, that is, during usual conditions ofutilization, the CPU usage by the additional SciViews layer is much lower: justa few percent, leaving much of the processing time for kernel’s calculations. Theprototype meets thus the two conditions.
3 Insider, a Versatile GUI Client
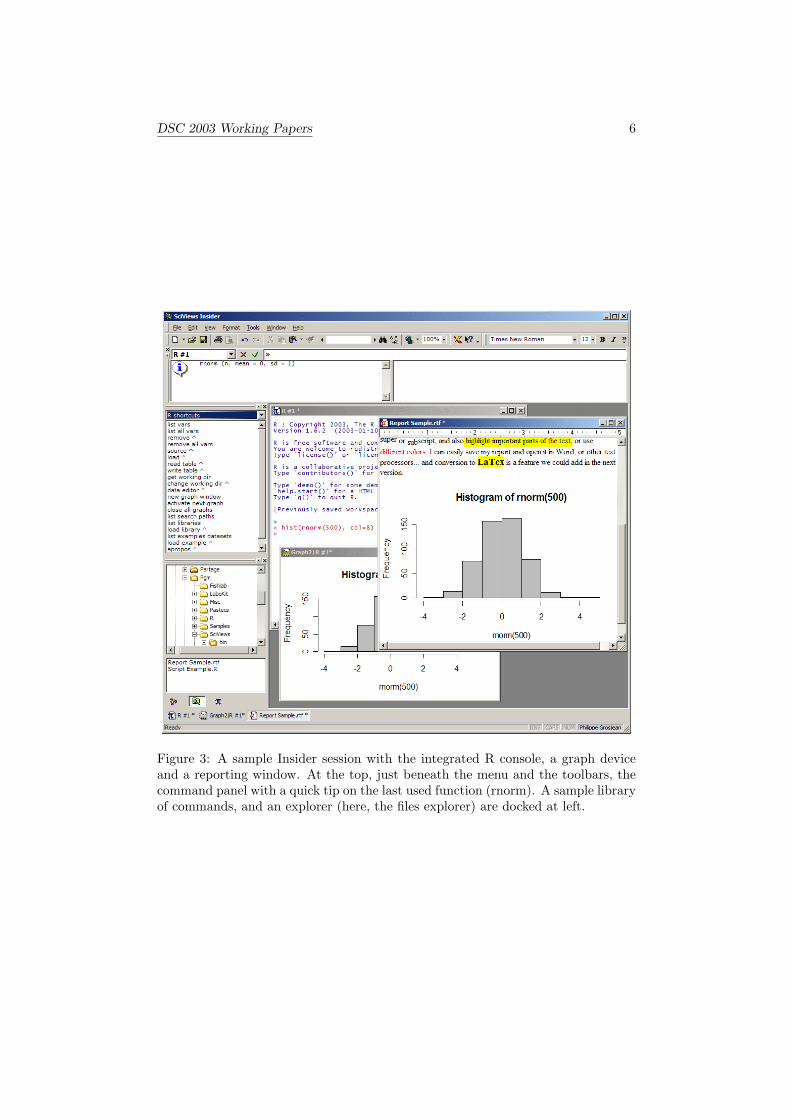
Several SciViews client GUIs are already planned: beside the simple test clientdescribed here above, addins for Excel and for Word are in development. We alsoinitiate an ambitious client called “Insider”. Insider provides a modern, highlyflexible and customizable GUI with menus, toolbars, dockable windows, objectsand files explorers, an IDE for scripts editing and an integrated reporting systemcombining rich-formatting text and images. Indeed, the list of the kind of documentInsider can manage is expandable, since new ones can be easily added. Better yet,each document can freely interact with an unlimited amount of different calculationkernels thanks to the object-oriented architecture of SciViews. Fig. 3 is a screenshotof Insider showing a session with a single R kernel connected.
4 Nodes Hierarchy, System Integrity and Xchgr-Mon
Even in a complex situation where possibly different GUIs connect to various kernelson the same machine or through the net, we want to leave the maximum control tothe user. Each involved process is connected to SciViews Xchanger through a spe-cial object called “Node”. Nodes are further organized into separate “Workspaces”.A visual control of this organization is required. Direct interaction like interrupt-ing transactions, forcing kernels disconnection at any time, or even killing frozenprocesses without endangering the rest of the edifice are possible direct actions wewant to offer to the user.
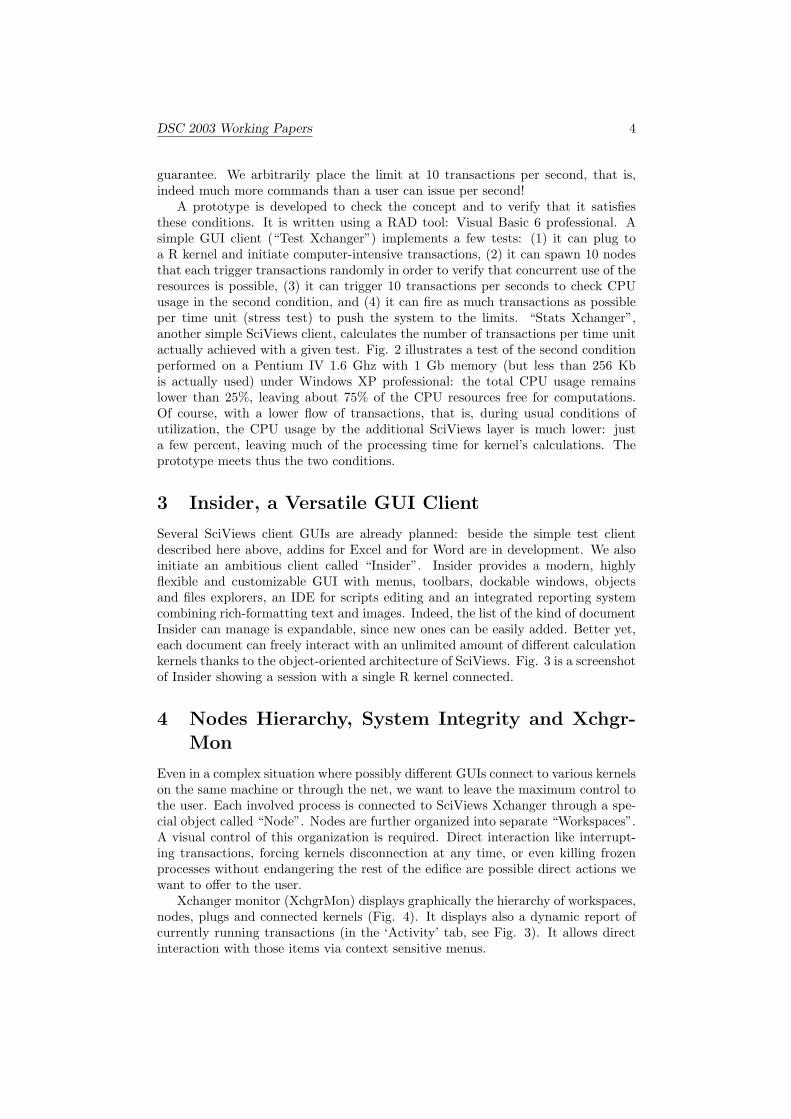
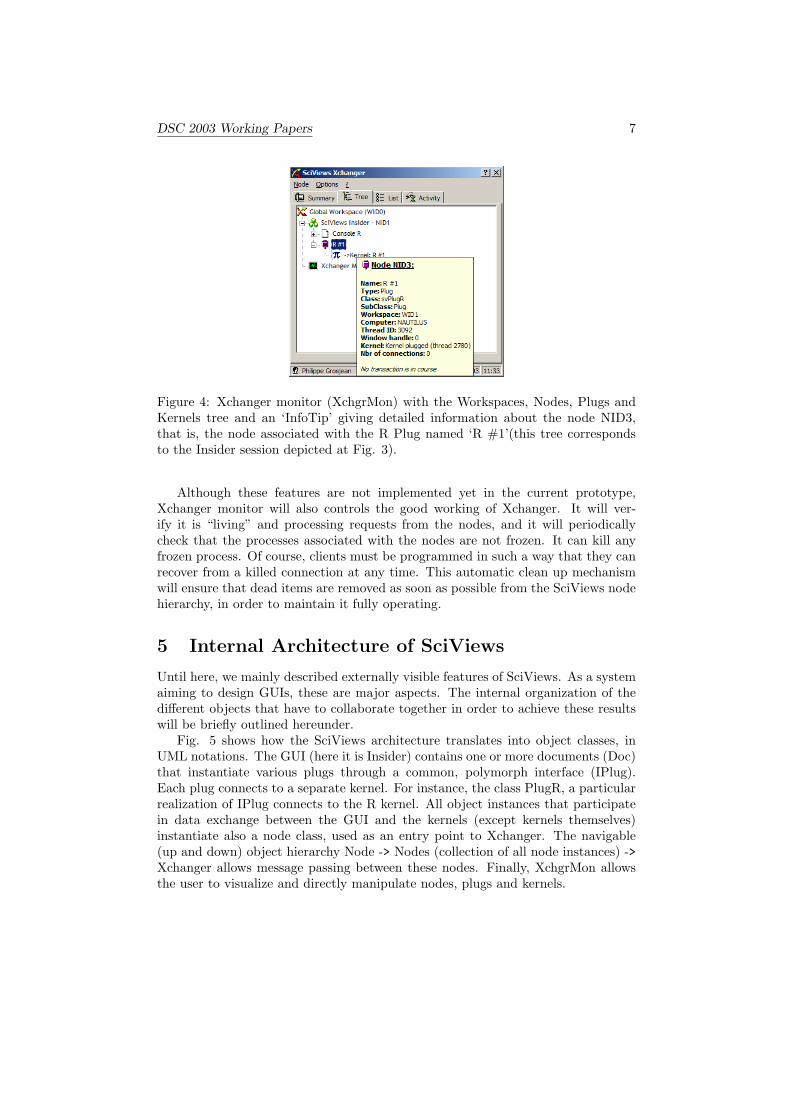
Xchanger monitor (XchgrMon) displays graphically the hierarchy of workspaces,nodes, plugs and connected kernels (Fig. 4). It displays also a dynamic report ofcurrently running transactions (in the ‘Activity’ tab, see Fig. 3). It allows directinteraction with those items via context sensitive menus.
DSC 2003 Working Papers 5
Figure 2: The test application (Test Xchanger) running 10 transactions per seconds.Stat Xchanger (top-left window) measures the actual number of transactions doneper time unit. The ‘Activity’ tab of the ‘SciViews Xchanger’ monitor (see alsosection 5) is visible at the bottom-right. The Windows Task Manager is used hereto record CPU usage, which remains consistently lower than 25%.
DSC 2003 Working Papers 6
Figure 3: A sample Insider session with the integrated R console, a graph deviceand a reporting window. At the top, just beneath the menu and the toolbars, thecommand panel with a quick tip on the last used function (rnorm). A sample libraryof commands, and an explorer (here, the files explorer) are docked at left.
DSC 2003 Working Papers 7
Figure 4: Xchanger monitor (XchgrMon) with the Workspaces, Nodes, Plugs andKernels tree and an ‘InfoTip’ giving detailed information about the node NID3,that is, the node associated with the R Plug named ‘R #1’(this tree correspondsto the Insider session depicted at Fig. 3).
Although these features are not implemented yet in the current prototype,Xchanger monitor will also controls the good working of Xchanger. It will ver-ify it is “living” and processing requests from the nodes, and it will periodicallycheck that the processes associated with the nodes are not frozen. It can kill anyfrozen process. Of course, clients must be programmed in such a way that they canrecover from a killed connection at any time. This automatic clean up mechanismwill ensure that dead items are removed as soon as possible from the SciViews nodehierarchy, in order to maintain it fully operating.
5 Internal Architecture of SciViews
Until here, we mainly described externally visible features of SciViews. As a systemaiming to design GUIs, these are major aspects. The internal organization of thedifferent objects that have to collaborate together in order to achieve these resultswill be briefly outlined hereunder.
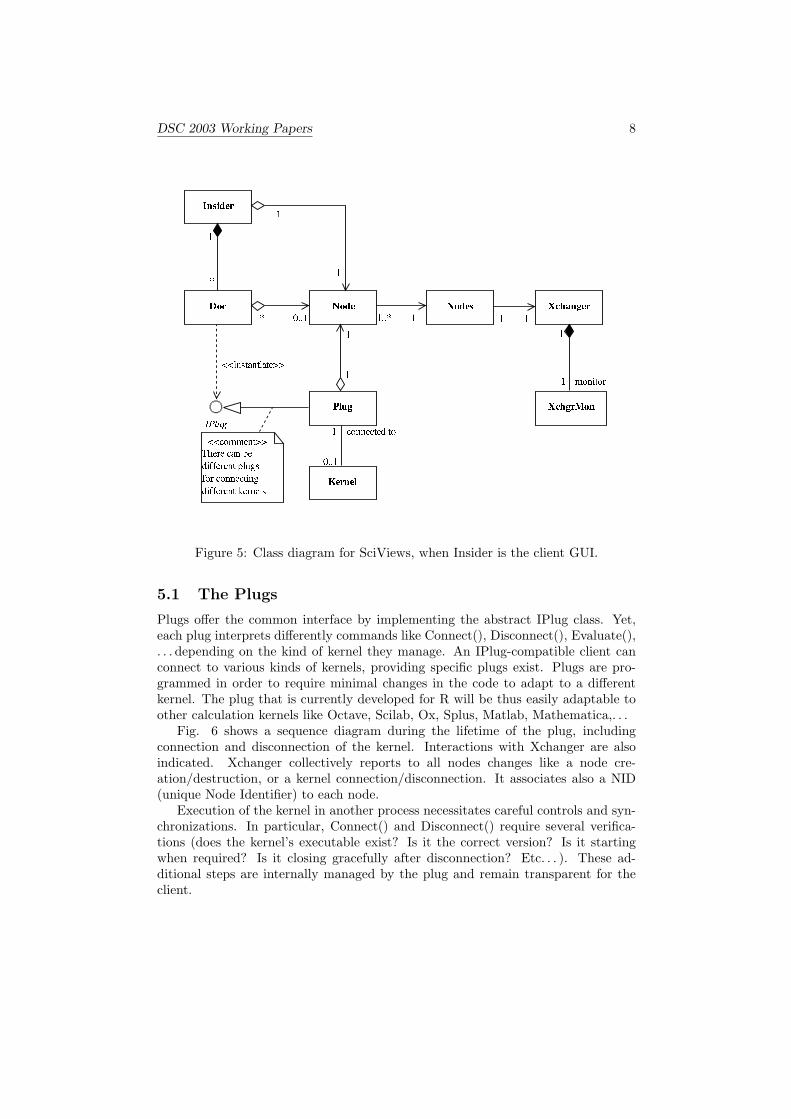
Fig. 5 shows how the SciViews architecture translates into object classes, inUML notations. The GUI (here it is Insider) contains one or more documents (Doc)that instantiate various plugs through a common, polymorph interface (IPlug).Each plug connects to a separate kernel. For instance, the class PlugR, a particularrealization of IPlug connects to the R kernel. All object instances that participatein data exchange between the GUI and the kernels (except kernels themselves)instantiate also a node class, used as an entry point to Xchanger. The navigable(up and down) object hierarchy Node -> Nodes (collection of all node instances) ->Xchanger allows message passing between these nodes. Finally, XchgrMon allowsthe user to visualize and directly manipulate nodes, plugs and kernels.
DSC 2003 Working Papers 8
�����������
� ���������
���������������
� �������
���!"������
���!���#$���
� ������
%%�&('�)�) *�+�,�--./ *�01*2&(34+�5�*6�7�8�8 *�0�*�+�,�9�:<;�=?>8 '@0&('@+�+�*�&�, 7 +�=6�7�8�8 *�0�*�+�,�A�*�01+�*�:B>
C
C
C
D
%�% 7 +E>4,B34+�, 7 34,<*�-�-
F?G�GHCDC
C
C CCC�G�G�D
F?G<GBC
C &('@+�+�*�&�,�* 6 ,B'
C
C )I'@+ 7 ,B'@0
Figure 5: Class diagram for SciViews, when Insider is the client GUI.
5.1 The Plugs
Plugs offer the common interface by implementing the abstract IPlug class. Yet,each plug interprets differently commands like Connect(), Disconnect(), Evaluate(),. . . depending on the kind of kernel they manage. An IPlug-compatible client canconnect to various kinds of kernels, providing specific plugs exist. Plugs are pro-grammed in order to require minimal changes in the code to adapt to a differentkernel. The plug that is currently developed for R will be thus easily adaptable toother calculation kernels like Octave, Scilab, Ox, Splus, Matlab, Mathematica,. . .
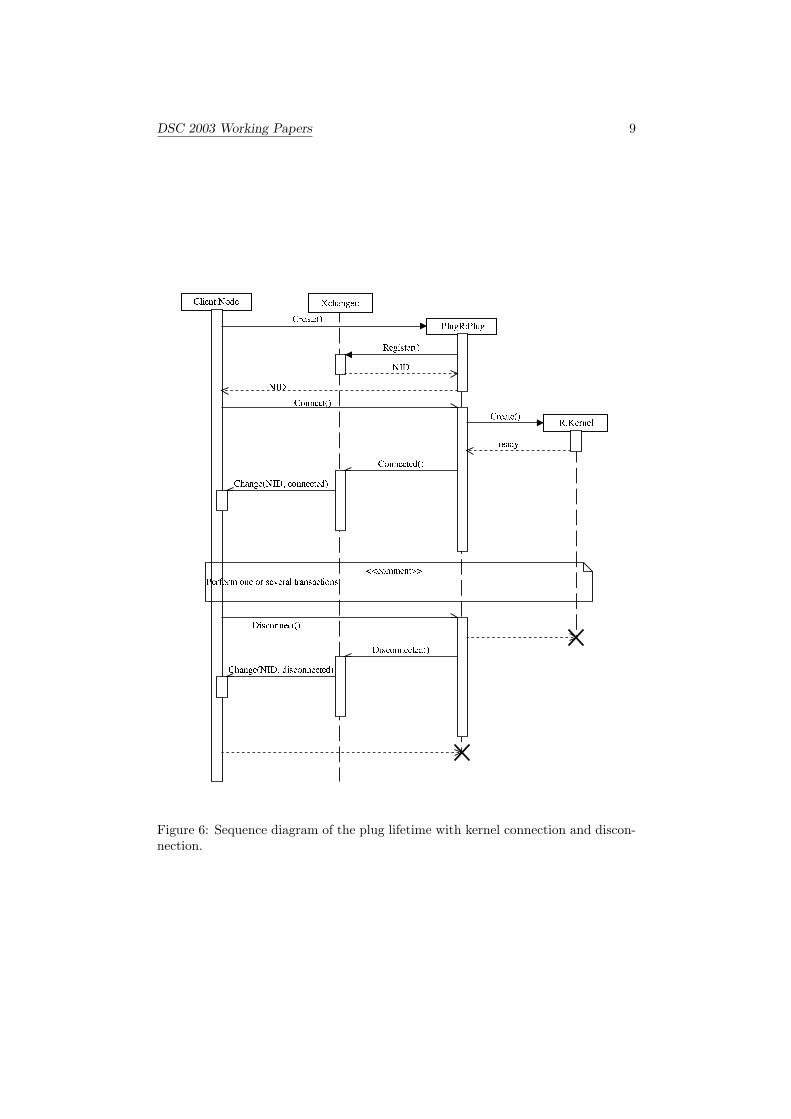
Fig. 6 shows a sequence diagram during the lifetime of the plug, includingconnection and disconnection of the kernel. Interactions with Xchanger are alsoindicated. Xchanger collectively reports to all nodes changes like a node cre-ation/destruction, or a kernel connection/disconnection. It associates also a NID(unique Node Identifier) to each node.
Execution of the kernel in another process necessitates careful controls and syn-chronizations. In particular, Connect() and Disconnect() require several verifica-tions (does the kernel’s executable exist? Is it the correct version? Is it startingwhen required? Is it closing gracefully after disconnection? Etc. . . ). These ad-ditional steps are internally managed by the plug and remain transparent for theclient.
DSC 2003 Working Papers 9
����������� �� ���
� ������� � ����
�� ����������
����� ��������� � � ����!" ���# ��� �%$���&���"'������"'��($�' � ���� �($
) ��* '���������%�"��'����+�,
��-".
���"��'����/+0,
�"��'��1
�% ����� � �"+�,
.��"$ � ����� � �"+�,
������"$������2+�,
��-".
�% ���� � �����(+0,
� * '�����+���-".43 � ����� � ������,
.���$ � ���� � ������+�,
� * '�����/+���-".435���$ � ���� � �����,
Figure 6: Sequence diagram of the plug lifetime with kernel connection and discon-nection.
DSC 2003 Working Papers 10
5.2 Asynchronous Management of Transactions
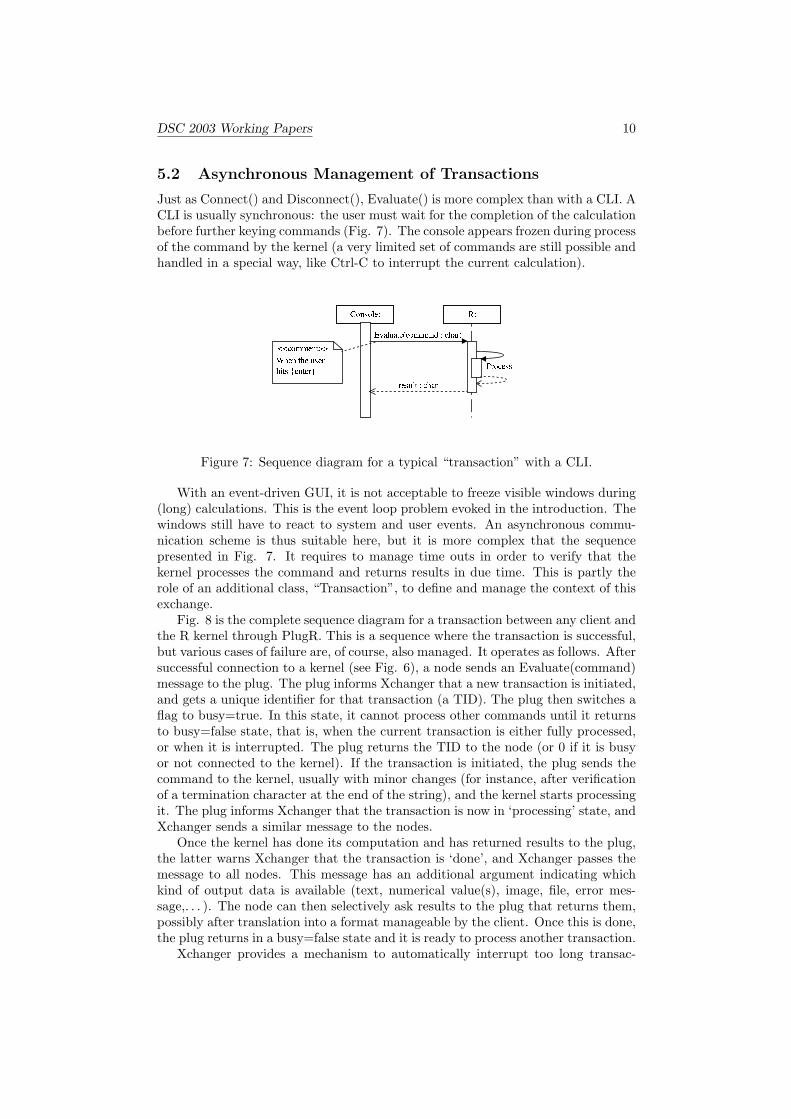
Just as Connect() and Disconnect(), Evaluate() is more complex than with a CLI. ACLI is usually synchronous: the user must wait for the completion of the calculationbefore further keying commands (Fig. 7). The console appears frozen during processof the command by the kernel (a very limited set of commands are still possible andhandled in a special way, like Ctrl-C to interrupt the current calculation).
������������� � �
����� �������������
��� ���� � ���������� �� ��������!
"�#�$ �%� $ ��& � ����� $ ��'�� � ��$ �)(
�)������%��� � ��$ �
* �)� � ����
Figure 7: Sequence diagram for a typical “transaction” with a CLI.
With an event-driven GUI, it is not acceptable to freeze visible windows during(long) calculations. This is the event loop problem evoked in the introduction. Thewindows still have to react to system and user events. An asynchronous commu-nication scheme is thus suitable here, but it is more complex that the sequencepresented in Fig. 7. It requires to manage time outs in order to verify that thekernel processes the command and returns results in due time. This is partly therole of an additional class, “Transaction”, to define and manage the context of thisexchange.
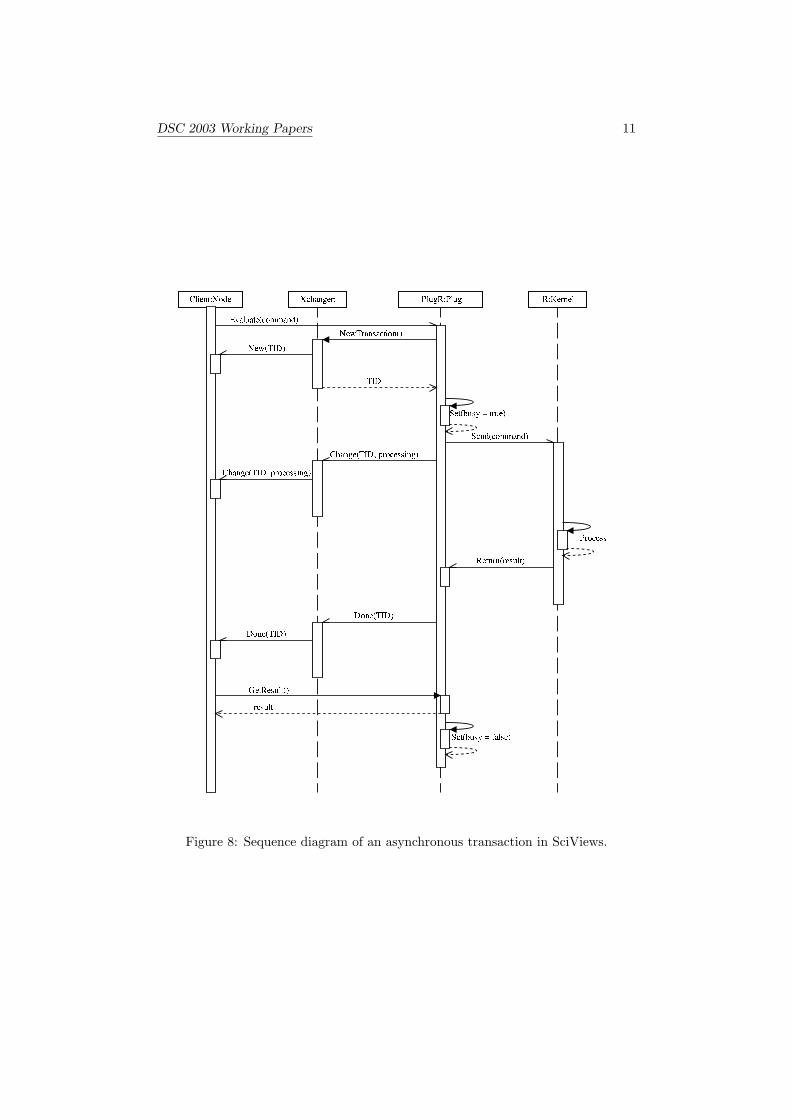
Fig. 8 is the complete sequence diagram for a transaction between any client andthe R kernel through PlugR. This is a sequence where the transaction is successful,but various cases of failure are, of course, also managed. It operates as follows. Aftersuccessful connection to a kernel (see Fig. 6), a node sends an Evaluate(command)message to the plug. The plug informs Xchanger that a new transaction is initiated,and gets a unique identifier for that transaction (a TID). The plug then switches aflag to busy=true. In this state, it cannot process other commands until it returnsto busy=false state, that is, when the current transaction is either fully processed,or when it is interrupted. The plug returns the TID to the node (or 0 if it is busyor not connected to the kernel). If the transaction is initiated, the plug sends thecommand to the kernel, usually with minor changes (for instance, after verificationof a termination character at the end of the string), and the kernel starts processingit. The plug informs Xchanger that the transaction is now in ‘processing’ state, andXchanger sends a similar message to the nodes.
Once the kernel has done its computation and has returned results to the plug,the latter warns Xchanger that the transaction is ‘done’, and Xchanger passes themessage to all nodes. This message has an additional argument indicating whichkind of output data is available (text, numerical value(s), image, file, error mes-sage,. . . ). The node can then selectively ask results to the plug that returns them,possibly after translation into a format manageable by the client. Once this is done,the plug returns in a busy=false state and it is ready to process another transaction.
Xchanger provides a mechanism to automatically interrupt too long transac-
DSC 2003 Working Papers 11
����������� ����� ���������� ������ ��� ������������������ �������
� �� ��� � ���! � ��"�" � ��#
$����!&%��'�(�)*��&���#
+��������'�����!�#
����'�����
$����!�%��'�(�)-, � ��'���#
���.�/ � � �' ��� ������!&#
/ 0�1
���.�!�/ 0&1�#
� ��� ����!&/ 0�1�23���� � ��'�'�����#
� �� �����!&/�0&1�23�&� � ��'�'������#
1�����!&/ 0�1�#
1 ����!&/ 0�1�#
$ �����! � ��"�" � ���#
� ��� � ��'�'
����������!��&��'�����#
Figure 8: Sequence diagram of an asynchronous transaction in SciViews.
DSC 2003 Working Papers 12
tions. When the client initiates a transaction, it provides two time out values: aprocessing time out, and a reception time out. The processing time out is themaximum allowed time to wait between the beginning of the transaction and thecompletion of the calculation by the kernel (that is, when the kernel starts sendingback results). The receiving time out is the maximum delay permitted between thebeginning and the end of output returned by the kernel. If one of these time outs oc-curs while the transaction is, respectively, in ‘processing’ or ‘receiving’ states, thenXchanger warns the plug and the client node and they can in turn take requiredaction (cleanly stop the transaction or retry it, for instance).
The IPlug interface provides much more features, including full control of thechild windows created in the kernel process (graphs, dialog boxes, . . . ) but theseare not detailed here.
6 Conclusions and Perspectives
SciViews focuses on providing a common object-oriented communication betweendifferent GUIs and calculation kernels. A flexible GUI designed for data analysis (In-sider) is also provided. Some features that ease access to statistical analyses thanksto object explorers, electronic reference cards (that we call “command libraries”),menus and dialog boxes and also interactive graphs can be developed within Insider.Although the whole software is just a prototype, it is a working “proof-of-concept”.It is not platform-independent (Visual Basic and COM on which the prototype re-lies are proprietary developments of Microsoft, and they run only under Windows).A different implementation –in Java, or C++/CORBA– would be required to runon Unix/Linux or MacOS. Nevertheless, we will continue to develop the currentprototype in the near future, because there is an urgent need for a R GUI underWindows.
Obviously, many aspects require optimization, including the way plugs communi-cate internally with the kernels (we used the ESS mode of R for the current PlugR).However, interlanguage communication libraries are rapidly evolving for data analy-sis software like R (see the Omega Hat project, http://www.omegahat.org). Sincethis communication process is encapsulated inside the plugs, such changes or op-timizations could be done hopefully without touching at the rest of the SciViewsarchitecture, and more particularly, without modifications of GUI clients.
The R Plug is complementary to the R COM server and client independently de-veloped [5]. The R Plug is much more complex because it manages exchanges asyn-chronously, it has to cope with a complete object hierarchy (workspaces, nodes,. . . ),and it is intended to be more robust against failures in the client or the server. TheR COM server thus remains much simpler to use outside of the SciViews context.Due to these differences, we regard both the R Plug and the R COM server as twocomplementary products. Yet, it should be profitable to homogenize the syntax oftheir methods and properties as much as possible.
We hope that SciViews will raise opportunities and interests to experiment var-ious kind of GUI metaphors (menu/dialog box, spreadsheet, notebook, object ex-plorer, . . . ) in the context of data analysis, with R, but also with other free systemslike Octave or Scilab. A more efficient, yet intuitive man-machine interfaces couldperhaps emerge from such experimentations in the particular field of data analyses.
DSC 2003 Working Papers 13
7 References
[1] Ihaka, R. and Gentleman, R., 1996. A language for data analysis and graphics.Journal of Computational and Graphical Statistics, 5(3):299-314.
[2] Eaton, J. W., 2001. Octave: past, present, and future. In Kurt Hornik andFriedrich Leisch, editors, DSC 2001 Proceedings of the 2nd International Workshopon Distributed Statistical Computing, http://www.ci.tuwien.ac.at/Conferences/DSC-2001/. ISSN: 1609-395X.
[3] Dalgaard, P., 2001. The R-Tcl/Tk interface. In Kurt Hornik and FriedrichLeisch, editors, DSC 2001 Proceedings of the 2nd International Workshop on Dis-tributed Statistical Computing, http://www.ci.tuwien.ac.at/Conferences/DSC-2001/.ISSN: 1609-395X.
[4] Rossini, A., Machler, M., Hornik, K., Heiberger, R. M., and Sparapani,R., 2001. Emacs Speaks Statistics: A universal interface fro statistical analysis.Report 164, Department of Biostatistics, University of Washington. URL http://software.biostat.washington.edu/statsoft/ess/ess~techrep.pdf.
[5] Baier, T., and Neuwirth, E., 2001 Embedding R in standard software, andthe other way round. In Kurt Hornik and Friedrich Leisch, editors, DSC 2001 Pro-ceedings of the 2nd International Workshop on Distributed Statistical Computing,http://www.ci.tuwien.ac.at/Conferences/DSC-2001/. ISSN: 1609-395X.
Related Documents