EFSA Journal 2015;13(10):4253 Suggested citation: EFSA NDA Panel (EFSA Panel on Dietetic Products, Nutrition and Allergies), 2015. Scientific Opinion on Dietary Reference Values for copper. EFSA Journal 2015;13(10):4253, 51 pp. doi:10.2903/j.efsa.2015.4253 Available online: www.efsa.europa.eu/efsajournal © European Food Safety Authority, 2015 SCIENTIFIC OPINION Scientific Opinion on Dietary Reference Values for copper 1 EFSA Panel on Dietetic Products, Nutrition and Allergies (NDA) 2,3 European Food Safety Authority (EFSA), Parma, Italy ABSTRACT Following a request from the European Commission, the EFSA Panel on Dietetic Products, Nutrition and Allergies (NDA) derived Dietary Reference Values (DRVs) for copper. Owing to the absence of appropriate biomarkers of copper status and the limitations of available balance studies, the Panel was unable to derive Average Requirements (ARs) and Population Reference Intakes (PRIs). Hence, Adequate Intakes (AIs) were defined based on mean observed intakes in several European Union (EU) countries, given that there is no evidence of overt copper deficiency in the European population. Data from balance studies were used as supportive evidence. For adults, AIs of 1.6 mg/day for men and 1.3 mg/day for women are proposed. For children, AIs are 0.7 mg/day for children aged 1 to < 3 years, 1 mg/day for children aged 3 to < 10 years, and 1.3 and 1.1 mg/day for boys and girls aged 10 to < 18 years, respectively. For infants aged 7–11 months, based on mean observed intakes in four EU countries, an AI of 0.4 mg/day is proposed, which is supported by upwards extrapolation of estimated copper intake in exclusively breast-fed infants. For pregnant women, an increment of 0.2 mg/day is estimated to cover the amount of copper deposited in the fetus and the placenta over the course of pregnancy and in anticipation of the needs for lactation, and for lactating women the same increment is estimated to cover the amount of copper secreted with breast milk. Thus, for pregnant and lactating women, the Panel derived an AI of 1.5 mg/day. © European Food Safety Authority, 2015 KEY WORDS copper, balance, observed intake, Adequate Intake, Dietary Reference Value 1 On request from the European Commission, Question No EFSA-Q-2011-01210, adopted on 23 September 2015. 2 Panel members: Jean Louis Bresson, Barbara Burlingame, Tara Dean, Susan Fairweather-Tait, Marina Heinonen, Karen Ildico Hirsch-Ernst, Inge Mangelsdorf, Harry McArdle, Androniki Naska, Monika Neuhäuser-Berthold, Grażyna Nowicka, Kristina Pentieva, Yolanda Sanz, Alfonso Siani, Anders Sjödin, Martin Stern, Daniel Tomé, Dominique Turck, Hendrik Van Loveren, Marco Vinceti and Peter Willatts. Correspondence: [email protected] 3 Acknowledgement: The Panel wishes to thank the members of the Working Group on Dietary Reference Values for Minerals: Peter Aggett, Carlo Agostoni, Susan Fairweather-Tait, Marianne Geleijnse, Ambroise Martin, Harry McArdle, Androniki Naska, Hildegard Przyrembel and Alfonso Siani for the preparatory work on this scientific opinion and EFSA staff: Anja Brönstrup, José Ángel Gómez Ruiz and Fanny Héraud for the support provided to this scientific opinion.

Welcome message from author
This document is posted to help you gain knowledge. Please leave a comment to let me know what you think about it! Share it to your friends and learn new things together.
Transcript
EFSA Journal 2015;13(10):4253
Suggested citation: EFSA NDA Panel (EFSA Panel on Dietetic Products, Nutrition and Allergies), 2015. Scientific Opinion
on Dietary Reference Values for copper. EFSA Journal 2015;13(10):4253, 51 pp. doi:10.2903/j.efsa.2015.4253
Available online: www.efsa.europa.eu/efsajournal
© European Food Safety Authority, 2015
SCIENTIFIC OPINION
Scientific Opinion on Dietary Reference Values for copper1
EFSA Panel on Dietetic Products, Nutrition and Allergies (NDA)2,3
European Food Safety Authority (EFSA), Parma, Italy
ABSTRACT
Following a request from the European Commission, the EFSA Panel on Dietetic Products, Nutrition and
Allergies (NDA) derived Dietary Reference Values (DRVs) for copper. Owing to the absence of appropriate
biomarkers of copper status and the limitations of available balance studies, the Panel was unable to derive
Average Requirements (ARs) and Population Reference Intakes (PRIs). Hence, Adequate Intakes (AIs) were
defined based on mean observed intakes in several European Union (EU) countries, given that there is no
evidence of overt copper deficiency in the European population. Data from balance studies were used as
supportive evidence. For adults, AIs of 1.6 mg/day for men and 1.3 mg/day for women are proposed. For
children, AIs are 0.7 mg/day for children aged 1 to < 3 years, 1 mg/day for children aged 3 to < 10 years, and 1.3
and 1.1 mg/day for boys and girls aged 10 to < 18 years, respectively. For infants aged 7–11 months, based on
mean observed intakes in four EU countries, an AI of 0.4 mg/day is proposed, which is supported by upwards
extrapolation of estimated copper intake in exclusively breast-fed infants. For pregnant women, an increment of
0.2 mg/day is estimated to cover the amount of copper deposited in the fetus and the placenta over the course of
pregnancy and in anticipation of the needs for lactation, and for lactating women the same increment is estimated
to cover the amount of copper secreted with breast milk. Thus, for pregnant and lactating women, the Panel
derived an AI of 1.5 mg/day.
© European Food Safety Authority, 2015
KEY WORDS
copper, balance, observed intake, Adequate Intake, Dietary Reference Value
1 On request from the European Commission, Question No EFSA-Q-2011-01210, adopted on 23 September 2015. 2 Panel members: Jean Louis Bresson, Barbara Burlingame, Tara Dean, Susan Fairweather-Tait, Marina Heinonen, Karen
Ildico Hirsch-Ernst, Inge Mangelsdorf, Harry McArdle, Androniki Naska, Monika Neuhäuser-Berthold, Grażyna Nowicka,
Kristina Pentieva, Yolanda Sanz, Alfonso Siani, Anders Sjödin, Martin Stern, Daniel Tomé, Dominique Turck, Hendrik
Van Loveren, Marco Vinceti and Peter Willatts. Correspondence: [email protected] 3 Acknowledgement: The Panel wishes to thank the members of the Working Group on Dietary Reference Values for
Minerals: Peter Aggett, Carlo Agostoni, Susan Fairweather-Tait, Marianne Geleijnse, Ambroise Martin, Harry McArdle,
Androniki Naska, Hildegard Przyrembel and Alfonso Siani for the preparatory work on this scientific opinion and EFSA
staff: Anja Brönstrup, José Ángel Gómez Ruiz and Fanny Héraud for the support provided to this scientific opinion.
Dietary Reference Values for copper
EFSA Journal 2015;13(10):4253 2
SUMMARY
Following a request from the European Commission, the EFSA Panel on Dietetic Products, Nutrition
and Allergies (NDA) was asked to deliver a Scientific Opinion on Dietary Reference Values (DRVs)
for the European population, including copper.
Copper is an essential micronutrient required for electron transfer processes. It is a central component
of many enzymes, including those involved in neurotransmitter synthesis, in energy metabolism and in
collagen and elastin cross-linking.
The main food group contributing to the copper intake of all population groups except infants is grains
and grain-based products. Another important contributor to copper intake is the food group meat and
meat products.
Based on balance studies and other studies, the Panel considered that copper absorption from the diet
is around 50 % for all age and life-stage groups.
The primary site of copper absorption is the upper small intestine. Uptake is through a carrier protein,
Ctr1, and once in the cell, the copper is directed towards its target via one of a series of chaperone
proteins that ensure the metal is present in a non-toxic form. In the gut, the major pathway of transport
into the portal circulation is via a Cu-ATPase, ATP7A. In the portal circulation, copper is bound to
histidine, albumin or possibly transcuprein and transported to the liver, where it is incorporated into
ceruloplasmin, which is then secreted into the systemic circulation. It is taken up into the liver through
Ctr1 and, if it is not incorporated into ceruloplasmin, it is stored as metallothionein. Excess copper is
excreted in bile after transport across the apical membrane of the hepatocytes via another ATPase,
ATP7B. This copper is not reabsorbed. In humans, between 80 and 95 % of the copper in plasma is
ceruloplasmin, with the remainder being a low-molecular weight form. It is not certain which of these
two pools, ceruloplasmin or low-molecular weight copper complexes, makes the major contribution to
uptake by organs other than the liver, although it is more likely to be low-molecular weight copper
complexes than ceruloplasmin, with the latter playing a major role in the release of iron from the liver.
If the dietary supply of copper is less than adequate, the body upregulates transfer systems to make
more copper available. If these are not able to rectify the problem, the result is copper deficiency.
Clinical symptoms are not common in humans, and generally are seen as a consequence of mutations
in the genes involved in copper metabolism. Symptoms of copper deficiency include anaemia that is
refractory to iron supplementation, neurological defects and cutis laxa (“floppy” skin). There are also
changes in hair colour and texture, and an increased risk of aneurysm as a consequence of impaired
collagen and elastin synthesis.
The Panel noted that there are no biomarkers of copper status that are sufficiently robust, sensitive and
specific to be used for deriving requirements for copper. The Panel also considered whether health
outcomes can be used to derive DRVs for copper. However, it was concluded that the limited evidence
available on copper intake and cardiovascular disease-related outcomes and cancer cannot be used for
setting DRVs for copper.
There have been several balance studies examining the relationship between copper intake and losses
in men, but few in women and children. Studies differed with regard to experimental conditions, and
many studies had limitations and their results varied. Nevertheless, the Panel considered that they may
be used, for men at least, in conjunction with data on observed intakes in the European Union (EU) to
inform the setting of DRVs for copper.
The Panel decided to derive Adequate Intakes (AIs) based on observed intakes in several EU
countries. Mean copper intakes in eight EU countries range from 1.27 to 1.67 mg/day in men aged 18
years and older and from 1.15 to 1.44 mg/day in non-pregnant women aged 18 years and older. The
Panel noted that midpoints of ranges for intake estimates in three age groups of adults and in both
Dietary Reference Values for copper
EFSA Journal 2015;13(10):4253 3
sexes are in good agreement with medians, for the corresponding sex and age groups, of the average
intakes estimated per survey. The Panel noted that there is, at present, insufficient evidence to set
different DRVs according to age in adults, but decided to set different AI values for women and men,
as intakes are lower for women. For men, based on observed intakes and taking into account that zero
copper balance was reported at a copper intake of approximately 1.6 mg/day in men, the Panel
proposed an AI of 1.6 mg/day. For women, based on observed intakes, the Panel proposed an AI of
1.3 mg/day.
For infants aged 7–11 months, based on results from four surveys in infants, the Panel proposed an AI
of 0.4 mg/day. The Panel noted that upwards extrapolation by allometric scaling of estimated copper
intake in exclusively breast-fed infants aged 0–6 months results in an estimated intake at 7–11 months
of 0.36 mg/day, which supports the AI of 0.4 mg/day.
For boys and girls aged 1 to < 3 years, considering the absence of a strong basis for a distinct value
according to sex and the distribution of observed mean intakes of 0.60–0.86 mg/day in boys and 0.57–
0.94 mg/day in girls, the Panel selected the midpoint of average intakes and set an AI of 0.7 mg/day.
In children aged 3 to < 10 years, mean observed intakes range from 0.92 to 1.44 mg/day in boys and
from 0.82 to 1.30 mg/day in girls. The Panel considered the distribution of the observed mean intakes
and set an AI of 1.0 mg/day for boys and girls aged 3 to < 10 years. In children aged 10 to < 18 years,
mean observed intakes range from 1.16 to 1.59 mg/day in boys and from 0.98 to 1.41 mg/day in girls.
Considering the rather large differences in intakes of boys and girls, the Panel decided to set separate
AI values. Taking into account the distribution of observed average intakes, the Panel proposed an AI
of 1.3 mg/day for boys and of 1.1 mg/day for girls aged 10 to < 18 years.
In pregnancy, taking into account the requirement for the developing fetus and its placenta, the
additional requirement for copper was calculated to be 0.06 mg/day. Considering that about 50 % of
ingested copper is absorbed, and in anticipation of copper requirements for lactation, the Panel
proposed that the AI of non-pregnant women be increased by 0.2 mg/day during pregnancy.
For lactation, taking into account that copper absorption is about 50 %, an increment of 0.56 mg/day
would be required to compensate for copper losses in breast milk. The Panel assumed that this can be
mitigated in part by the increased AI in pregnancy. Thus, the Panel proposed that the AI of non-
pregnant women be increased by 0.2 mg/day during lactation.

Dietary Reference Values for copper
EFSA Journal 2015;13(10):4253 4
TABLE OF CONTENTS
Abstract .................................................................................................................................................... 1 Summary .................................................................................................................................................. 2 Background as provided by the European Commission ........................................................................... 6 Terms of reference as provided by the European Commission ................................................................ 6 Assessment ............................................................................................................................................... 8 1. Introduction ..................................................................................................................................... 8 2. Definition/category .......................................................................................................................... 8
2.1. Chemistry ................................................................................................................................ 8 2.2. Function of copper .................................................................................................................. 8
2.2.1. Biochemical functions ........................................................................................................ 8 2.2.2. Health consequences of deficiency and excess .................................................................. 9
Deficiency .................................................................................................................. 9 2.2.2.1.
Excess ........................................................................................................................ 9 2.2.2.2.
2.3. Physiology and metabolism .................................................................................................. 10 2.3.1. Intestinal absorption ......................................................................................................... 10 2.3.2. Transport in blood ............................................................................................................ 10 2.3.3. Distribution to tissues ....................................................................................................... 11 2.3.4. Storage .............................................................................................................................. 12 2.3.5. Metabolism ....................................................................................................................... 12 2.3.6. Elimination ....................................................................................................................... 12
Faeces ....................................................................................................................... 12 2.3.6.1.
Urine ........................................................................................................................ 12 2.3.6.2.
Skin and sweat ......................................................................................................... 13 2.3.6.3.
Breast milk ............................................................................................................... 13 2.3.6.4.
2.3.7. Interaction with other nutrients ......................................................................................... 14 Copper and iron ....................................................................................................... 14 2.3.7.1.
Copper and zinc ....................................................................................................... 14 2.3.7.2.
Copper and molybdenum ......................................................................................... 14 2.3.7.3.
Conclusions on interactions with other nutrients ..................................................... 14 2.3.7.4.
2.4. Biomarkers ............................................................................................................................ 14 2.4.1. Serum/plasma copper concentration ................................................................................. 14 2.4.2. Ceruloplasmin concentration and ceruloplasmin activity ................................................. 15 2.4.3. Erythrocyte superoxide dismutase .................................................................................... 15 2.4.4. Diamine oxidase ............................................................................................................... 16 2.4.5. Skin lysyl oxidase ............................................................................................................. 16 2.4.6. Other biomarkers .............................................................................................................. 16
2.5. Effects of genotype ............................................................................................................... 16 3. Dietary sources and intake data ..................................................................................................... 17
3.1. Dietary sources...................................................................................................................... 17 3.2. Dietary intake ........................................................................................................................ 17
4. Overview of Dietary Reference Values and recommendations ..................................................... 19 4.1. Adults .................................................................................................................................... 19 4.2. Infants and children ............................................................................................................... 21 4.3. Pregnancy and lactation ........................................................................................................ 22
5. Criteria (endpoints) on which to base Dietary Reference Values .................................................. 23 5.1. Indicators of copper requirement in adults ........................................................................... 23 5.2. Balance studies in adults ....................................................................................................... 23 5.3. Indicators of copper requirement in children ........................................................................ 25 5.4. Indicators of copper requirement in pregnancy and lactation ............................................... 25 5.5. Copper intake and health consequences ................................................................................ 26
5.5.1. Cardiovascular disease-related outcomes ......................................................................... 26 5.5.2. Cancer ............................................................................................................................... 26
6. Data on which to base Dietary Reference Values .......................................................................... 27
Dietary Reference Values for copper
EFSA Journal 2015;13(10):4253 5
6.1. Adults .................................................................................................................................... 27 6.2. Infants aged 7–11 months ..................................................................................................... 28 6.3. Children ................................................................................................................................ 28 6.4. Pregnancy .............................................................................................................................. 28 6.5. Lactation ............................................................................................................................... 29
Conclusions ............................................................................................................................................ 29 Recommendations for research .............................................................................................................. 29 References .............................................................................................................................................. 30 Appendices ............................................................................................................................................. 41 Appendix A. Copper concentration in human milk of healthy mothers of term infants
published after the review of Dorea (2000) ................................................................ 41 Appendix B. Dietary surveys in the EFSA Comprehensive European Food Consumption
Database included in the nutrient intake calculation and number of subjects
in the different age classes .......................................................................................... 43 Appendix C. Copper intake in males in different surveys according to age classes and
country ........................................................................................................................ 44 Appendix D. Copper intake in females in different surveys according to age classes and
country ........................................................................................................................ 46 Appendix E. Minimum and maximum percentage contribution of different food groups
(FoodEx2 level 1) to copper intake in males .............................................................. 48 Appendix F. Minimum and maximum percentage contribution of different food groups
(FoodEx2 level 1) to copper intake in females ........................................................... 49 Abbreviations ......................................................................................................................................... 50
Dietary Reference Values for copper
EFSA Journal 2015;13(10):4253 6
BACKGROUND AS PROVIDED BY THE EUROPEAN COMMISSION
The scientific advice on nutrient intakes is important as the basis of Community action in the field of
nutrition, for example such advice has in the past been used as the basis of nutrition labelling. The
Scientific Committee for Food (SCF) report on nutrient and energy intakes for the European
Community dates from 1993. There is a need to review and, if necessary, to update these earlier
recommendations to ensure that the Community action in the area of nutrition is underpinned by the
latest scientific advice.
In 1993, the SCF adopted an opinion on the nutrient and energy intakes for the European Community.4
The report provided Reference Intakes for energy, certain macronutrients and micronutrients, but it did
not include certain substances of physiological importance, for example dietary fibre.
Since then new scientific data have become available for some of the nutrients, and scientific advisory
bodies in many European Union Member States and in the United States have reported on
recommended dietary intakes. For a number of nutrients these newly established (national)
recommendations differ from the reference intakes in the SCF (1993) report. Although there is
considerable consensus between these newly derived (national) recommendations, differing opinions
remain on some of the recommendations. Therefore, there is a need to review the existing EU
Reference Intakes in the light of new scientific evidence, and taking into account the more recently
reported national recommendations. There is also a need to include dietary components that were not
covered in the SCF opinion of 1993, such as dietary fibre, and to consider whether it might be
appropriate to establish reference intakes for other (essential) substances with a physiological effect.
In this context EFSA is requested to consider the existing Population Reference Intakes for energy,
micro- and macronutrients and certain other dietary components, to review and complete the SCF
recommendations, in the light of new evidence, and in addition advise on a Population Reference
Intake for dietary fibre.
For communication of nutrition and healthy eating messages to the public it is generally more
appropriate to express recommendations for the intake of individual nutrients or substances in food-
based terms. In this context the EFSA is asked to provide assistance on the translation of nutrient
based recommendations for a healthy diet into food based recommendations intended for the
population as a whole.
TERMS OF REFERENCE AS PROVIDED BY THE EUROPEAN COMMISSION
In accordance with Article 29 (1)(a) and Article 31 of Regulation No. 178/2002,5 the Commission
requests EFSA to review the existing advice of the Scientific Committee for Food on population
reference intakes for energy, nutrients and other substances with a nutritional or physiological effect in
the context of a balanced diet which, when part of an overall healthy lifestyle, contribute to good
health through optimal nutrition.
In the first instance EFSA is asked to provide advice on energy, macronutrients and dietary fibre.
Specifically advice is requested on the following dietary components:
Carbohydrates, including sugars;
Fats, including saturated fatty acids, polyunsaturated fatty acids and monounsaturated fatty
acids, trans fatty acids;
4 Scientific Committee for Food, 1993. Nutrient and energy intakes for the European Community. Reports of the Scientific
Committee for Food, 31st series. Food – Science and Technique, European Commission, Luxembourg, 248 pp. 5 Regulation (EC) No 178/2002 of the European Parliament and of the Council of 28 January 2002 laying down the general
principles and requirements of food law, establishing the European Food Safety Authority and laying down procedures in
matters of food safety. OJ L 31, 1.2.2002, p. 1-24.
Dietary Reference Values for copper
EFSA Journal 2015;13(10):4253 7
Protein;
Dietary fibre.
Following on from the first part of the task, EFSA is asked to advise on population reference intakes
of micronutrients in the diet and, if considered appropriate, other essential substances with a
nutritional or physiological effect in the context of a balanced diet which, when part of an overall
healthy lifestyle, contribute to good health through optimal nutrition.
Finally, EFSA is asked to provide guidance on the translation of nutrient based dietary advice into
guidance, intended for the European population as a whole, on the contribution of different foods or
categories of foods to an overall diet that would help to maintain good health through optimal nutrition
(food-based dietary guidelines).
Dietary Reference Values for copper
EFSA Journal 2015;13(10):4253 8
ASSESSMENT
1. Introduction
In 1993, the Scientific Committee for Food (SCF) adopted an opinion on the nutrient and energy
intakes for the European Community (SCF, 1993). For copper, the SCF (1993) set an Average
Requirement (AR) of 0.8 mg/day and a Population Reference Intake (PRI) of 1.1 mg/day for adults.
An additional intake of 0.3 mg/day was advised for lactating women, but no extra intake was proposed
for pregnant women. A PRI of 0.3 mg/day for infants aged 6–11 months was set and for children PRIs
were interpolated between the PRIs for infants and adults. A Lowest Threshold Intake was also set at
0.6 mg/day for adults.
2. Definition/category
2.1. Chemistry
Copper is a transition metal; it has the atomic number 29 and an atomic mass of 63.55 Da. There are
two stable copper isotopes, 63
Cu and 65
Cu (abundance ratio 70 and 30 %, respectively (Rosman and
Taylor, 1998)). Copper plays a significant role in biology through its capacity to have two oxidation
states; it mainly exists as either Cu(I) or Cu(II) and this ability to gain or lose an electron underpins its
role in energy transfer processes in biological systems. It also has 27 radioactive isotopes, two of
which (64
Cu and 67
Cu, with half-lives of 12.7 hours and 61.8 hours, respectively) have been used in
biological studies.
Copper in biological systems is rarely found as a free ion, but is normally chelated to amino acids,
primarily histidine, or in mammals to proteins with imidazole residues, such as albumin. The
interaction with amino acids is significant in terms of the biology of copper, as it is probably one of
the major factors in determining uptake and processing of the metal. In most mammalian plasma,
including humans, copper binds to the N-terminal three amino acids of albumin. This binding is
critically dependent on the ante-penultimate amino acid being histidine.
2.2. Function of copper
2.2.1. Biochemical functions
Copper serves as an electron donor and acceptor in a similar chemical reaction to that for iron. It is
part of the catalytic centre in many enzymes, especially those involved in neurotransmitter synthesis.
There are about 12 cupro-enzymes in humans. Table 1 contains a partial list of the enzymes and their
roles in metabolism, giving an idea of the spectrum of functions served by cupro-enzymes.
Table 1: Examples of copper-dependent enzymes
Enzyme Role in metabolism
Amine oxidase Deamination of primary amines
Ceruloplasmin, GPI-ceruloplasmin, hephaestin, zyklopen
(multi-copper ferroxidases)
Iron metabolism ferroxidases
Cu/Zn superoxide dismutase (SOD) Superoxide dismutation
Cytochrome c oxidase Electron transport, energy metabolism
Dopamine -monooxygenase Dopamine to noradrenaline conversion
Lysyl oxidase Collagen and elastin cross-linking
Peptidylglycine α-amidating monooxygenase α-Amidation of neuropeptides
Tyrosinase Melanin synthesis
GPI, glycosylphosphatidylinositol.
Dietary Reference Values for copper
EFSA Journal 2015;13(10):4253 9
2.2.2. Health consequences of deficiency and excess
Deficiency 2.2.2.1.
The effect of copper deficiency on haematological function was first recognised in the early 20th
century, when anaemia that was refractory to iron supplementation was shown to be cured by giving
ashed food containing copper (see Fox (2003) for a comprehensive review of this early literature).
Sheep in Western Australia were also shown to develop a disorder called swayback as a consequence
of copper deficiency. The symptoms included neurological deficit, “floppy” (lax) skin and muscular
weakness. In addition, the wool was changed in a very characteristic fashion. The similarity to the hair
changes in babies born with an X-linked disorder called Menkes disease was noted by Danks and
colleagues in Melbourne, who showed that Menkes disease was indeed induced by functional copper
deficiency (Danks et al., 1972).
Menkes disease is an X-linked recessive disorder due to mutations of ATP7A, one of two copper
pumps involved in transferring copper across cell membranes (Mercer et al., 1993; Vulpe et al., 1993).
In the case of Menkes disease, the copper is not taken across the gut membrane, so the deficiency is
throughout the body. Boys born with Menkes disease have neurological deficits, very lax skin (cutis
laxa) and “kinky” hair – hence the name kinky hair syndrome (Danks et al., 1972). Importantly, the
lamina propria of the large vessels is disrupted, and the boys will often die early from aortic
aneurysms. Attempts to rectify the disorder by injecting copper, either in babies at term or early in life,
introduced directly into the cerebrospinal fluid, have had limited success (Kaler et al., 1996; Kaler,
1998; Kaler, 2014). There are many different mutations recorded in ATP7A, some of which do not
have lethal consequences, such as those that cause occipital horn syndrome, and the functions of the
different parts of the enzyme have been deduced from the phenotype demonstrated from these
mutations (Proud et al., 1996).
Given the wide range of enzymes that use copper as a co-factor (Section 2.2.1), the symptoms of
copper deficiency are diverse. They include normocytic and hypochromic anaemia,
hypercholesterolaemia, skin and hair hypopigmentation, leukopenia, neutropenia, myelodysplasia
and, in the majority of patients, neurological findings, most commonly due to neuromyelopathy
(human swayback). Osteoporosis, scoliosis and scorbutic-like changes have also been reported in
copper-deficient infants and children (Williams, 1983; Danks, 1988; Lukasewycz and Prohaska,
1990; Prohaska, 1990; Klevay, 2000).
Furthermore, there is evidence that copper deficiency is associated with alterations in immune function
(Kelley et al., 1995; Turnlund et al., 2004) and possibly bone function (Baker et al., 1999a), although,
in a further study, Baker et al. (1999b) failed to confirm their earlier results. However, all these
symptoms can occur in other diseases, making it very difficult to identify copper deficiency from the
phenotype.
Excess 2.2.2.2.
Under normal circumstances, copper homeostasis ensures that copper overload does not occur. The
SCF (2003) set a No Observed Adverse Effect Level (NOAEL) of 10 mg/day on the basis of a
supplementation study lasting 12 weeks, which showed the absence of adverse effects on liver
function at this dose (Pratt et al., 1985). Using an uncertainty factor of two, a Tolerable Upper Intake
Level (UL) of 5 mg/day was established for adults, but not for pregnant and lactating women, owing
to the absence of adequate data. For children, the UL of adults was extrapolated based on body weight.
An excess of copper has been recorded and shown to cause problems only under certain specific
conditions, notably genetic disorders such as Wilson disease (Tanzi et al., 1993; Tao et al., 2003).
Wilson disease is caused by a mutation in ATP7B, a transport protein similar to ATP7A, but expressed
in different tissues (Tanzi et al., 1993). In Wilson disease, the protein is defective in the liver and
excretion is inhibited, so that copper accumulates initially in the liver, followed by the brain, heart,
kidney and eyes. Over time, hepatic damage results in cirrhosis, and can also develop into fulminant
Dietary Reference Values for copper
EFSA Journal 2015;13(10):4253 10
liver disease. The latter occurs following the breakdown of the copper storage systems, with
subsequent release of copper into the blood, and hence a vicious cycle of cell damage and copper
release. Copper toxicosis has been recorded in dogs, but not in humans, and is caused by mutations in
a protein termed MURR1, which interacts directly with ATP7B (Tao et al., 2003). To date, no
equivalent mutations have been detected in humans.
Excessive copper accumulation has also been recorded in Indian childhood cirrhosis (Tanner, 1998).
Milk heated in copper vessels was found to contain very high amounts of copper. Some children
accumulated large amounts of copper in their liver and suffered from symptoms of copper overload. A
similar disorder was recorded in families from the Austrian Tyrol (Muller et al., 1998). The Tyrolean
cirrhosis was mapped to one particular village and to one progenitor in that village. More recently,
however, a comprehensive study of Indian childhood cirrhosis has concluded that, while copper may
have some role to play in the development of the disorder, it may also have a genetic predisposition
(Nayak and Chitale, 2013).
2.3. Physiology and metabolism
2.3.1. Intestinal absorption
Copper in the lumen of the gut is largely bound to amino acids. It is taken up across the apical
membrane of the enterocyte, probably through a protein called Ctr1 (see Figure 1 in Section 2.3.3).
Whether it is absorbed as Cu(II) or Cu(I) is not clear. Once in the cell, the copper is directed, through
unknown mechanisms, to one of a family of copper chaperones. Atox1 carries the copper to either
ATP7A or ATP7B, depending on the tissue. In the gut, it is ATP7A and, in patients with Menkes
disease, where ATP7A is defective, the copper will accumulate within the gut cell (Schaefer and
Gitlin, 1999).
There is a limited number of studies on copper absorption in humans. Most of them measured apparent
absorption only, which may differ from true absorption because endogenous losses are not considered.
In two studies in adults, faecal excretion of absorbed copper was taken into account to estimate true
copper absorption from dietary copper intakes ranging from 0.7 to 6 mg/day, and true copper
absorption ranged from 45 to 49 % (Harvey et al., 2003; Harvey et al., 2005).
The effect of diet composition on copper absorption has been examined, although care must be
exercised when interpreting the results, as apparent rather than true absorption was generally
measured. In adults, apparent copper absorption (in %) tended to be higher with omnivorous diets than
with lacto-ovo-vegetarian diets (Hunt et al., 1998; Hunt and Vanderpool, 2001). However, this
difference was compensated for by the higher copper content of the lacto-ovo-vegetarian diets
compared to the omnivorous diets, resulting in similar amounts of copper absorbed daily.
The Panel considers that absorption of copper from a mixed diet is around 50 %.
2.3.2. Transport in blood
Once released from the gut, the copper binds to albumin or possibly a protein termed transcuprein.
This copper is accumulated by the liver. Around 40 % of copper is taken up into the liver in the first
pass. Once taken up, the copper is stored in metallothionein, incorporated into ceruloplasmin or
excreted in the bile.
Most of the copper in blood is bound to ceruloplasmin, with values varying from 80 to 95 % (Wirth
and Linder, 1985; Hellman and Gitlin, 2002). Ceruloplasmin is a ferroxidase, one of a family of multi-
copper ferroxidases. Each molecule has six atoms of copper that are not exchangeable, with a seventh
that may be loosely bound. It plays a critical role in iron release from the liver (see Section 2.3.3), but
has also been proposed as a copper delivery mechanism. Putative ceruloplasmin receptors have been

Dietary Reference Values for copper
EFSA Journal 2015;13(10):4253 11
identified in various tissues (Hilton et al., 1995; Sasina et al., 2000), but the protein has never been
isolated and therefore its mechanism has not yet been elucidated.
The remainder of the copper in plasma is present predominantly as histidine-bound or albumin-bound
copper. This relatively small fraction is the one most likely to form the pool for transfer to tissues.
However, it is very difficult to measure, although various approaches are being developed (Beattie et
al., 2001; Venelinov et al., 2004; Zhang et al., 2014).
2.3.3. Distribution to tissues
Copper uptake into cells is a passive process, probably through carrier-mediated diffusion (McArdle,
1995; Gambling et al., 2008). The Cu(I) is taken into the cell through Ctr1, much in the same way as
described for absorption in the gut (see Figure 1). Following uptake, copper binds to one of a series of
chaperones (CCS, Atox1, Cox17). From CCS, copper is incorporated into superoxide dismutase
(SOD)1 (Cu/Zn SOD). From Cox17, copper goes to the mitochondria, where it is incorporated into the
electron transport chain enzymes. Atox1, the first chaperone identified, traffics copper to either
ATP7A or ATP7B, depending on the tissue.
Figure 1: Copper metabolism in the liver. Cu(I) is transferred into the cell through Ctr1. It binds to
chaperones (CCS, Atox1, Cox17) and is stored in metallothionein (MT) or released as ceruloplasmin
(Cp). The copper is then transferred to the final target protein, depending on the chaperone. In the case
of ATP7A and B, the copper can be transferred out of the cell, into the bile or fetal circulation,
depending on the tissue, or can be incorporated into ceruloplasmin (in the liver with ATP7B)
Once copper is taken up into the liver, it is stored, incorporated into ceruloplasmin or excreted into the
bile. In order to synthesise ceruloplasmin, copper is transported across the endoplasmic reticulum by
ATP7B and is added to the apo-protein during synthesis. When copper is present in excess, the
ATP7B relocates to the bile duct canaliculus membrane, and the copper is transported into the bile. It
is thought that this copper is not reabsorbed, presumably because it is complexed to bile salts or other
moieties and is not available (see review by Wang et al. (2011)). This is the major excretory pathway
for copper homeostasis.
Ceruloplasmin synthesis is regulated by many factors. Copper deficiency or excess itself does not
change mRNA levels, but the apo-protein is unstable and is catabolised. However, levels are increased
by steroids, including oral contraceptives, and in the inflammatory response. Its main function is to act
as a ferroxidase, oxidising iron released from the liver from Fe2+
to Fe3+
prior to incorporation into
transferrin (Prohaska, 2011). However, as mentioned in Section 2.3.2, there are also some data
suggesting that ceruloplasmin may act as a copper transport protein (Hilton et al., 1995).
Copper is essential for normal fetal development, and deficiency during pregnancy results in a wide
spectrum of problems. Transfer from mother to fetus occurs across the placenta. The mechanism of
transport is largely similar to that described in liver and other cells, except that both ATP7A and B
Dietary Reference Values for copper
EFSA Journal 2015;13(10):4253 12
seem to be involved. At present, the results suggest that ATP7A transports copper out of the placenta
to the fetal side, while ATP7B may have a role in returning excess copper back to the maternal blood
(Hardman et al., 2004; Hardman et al., 2006). How these two are regulated in tandem is not known.
The amount of copper transported across the placenta increases as gestation proceeds. The expression
of the copper genes outlined in Figure 1 has been measured during pregnancy in a rat model
(Lenartowicz et al., 2014). The pattern is different for the different genes, but tends to drop from about
day 17 of gestation to term (21.5 days), thereafter increasing in the postnatal period (Lenartowicz et
al., 2014). The expression in humans has not been determined, but, given that copper metabolism is
similar in both species, it is not likely to be very different.
2.3.4. Storage
Copper is largely stored in the liver. In one study, it is suggested that there is no increase in copper
concentration in the fetal liver as gestation proceeds (Donangelo et al., 1993), but that copper content
rises as the liver grows. Estimates of copper concentration in infant liver are quite variable, and some
references state that it is similar to adult levels at about 40 µg/g dry weight (Dorea et al., 1987), while
others suggest that the neonatal to adult ratio is as high as 16:1 (Meinel et al., 1979). It is also
proposed that the concentration varies within the liver, which may be related to differential functions
in different parts of the liver (Meinel et al., 1979). In the fetus, copper accumulates mostly during the
latter third of gestation. This may be needed to provide stores during the perinatal period, but it may
also reflect the fact that the bile ducts are not patent prenatally, and the major excretion pathway is
blocked. Copper concentration in the liver reaches about 40 µg/g dry weight in adults (Dorea et al.,
1987; Gurusamy and Davidson, 2007). The concentration of free copper in a cell is very low, probably
no more than a few atoms per cell, but total levels can be quite varied.
2.3.5. Metabolism
Copper uptake is largely regulated on a cellular level, operating through passive diffusion pathways.
Most of the copper in blood is bound to ceruloplasmin (Section 2.3.2). Ceruloplasmin is an acute
phase protein, and is also increased in plasma by steroid hormones and by oral contraception. In a cell
model of placental function, it was shown that insulin and oestrogen upregulate expression of ATP7A
(the Menkes protein) and decrease levels of ATP7B (the protein associated with Wilson disease)
(Hardman et al., 2007). Whether or not this occurs in other cells is not known. There are few data on
the possible endocrine effects of membrane copper transporters, although one group has reported
differential localisation of Ctr1 in mammary cells depending on the degree of differentiation
(Freestone et al., 2014), possibly through the action of prolactin (Kelleher and Lönnerdal, 2006).
2.3.6. Elimination
Faeces 2.3.6.1.
Copper is primarily excreted through the bile. Excess copper is transported across the bile duct
canaliculus membrane by ATP7B (Prohaska and Gybina, 2004). In the bile, the copper forms
complexes that prevent reabsorption and is presumably linked to bile salts, because current evidence
suggests it is not reabsorbed in the gut and passes through to the faeces (Prohaska and Gybina, 2004).
Faecal copper increases almost linearly with dietary intake and ranges from 0.33 mg/day (for a dietary
copper intake of 0.38 mg/day) to 2.17 mg/day (for a dietary copper intake of 2.49 mg/day) (Turnlund
et al., 1998).
Urine 2.3.6.2.
Urinary copper shows little or no variation with dietary copper intake and ranges from 11 μg/day to
60 μg/day (Turnlund et al., 1990; Turnlund et al., 1998; Milne et al., 2001; Turnlund et al., 2005). This
is very small (between 1 and 2 %) (Turnlund et al., 2005) in relation to total turnover and is ignored in
most balance studies.
Dietary Reference Values for copper
EFSA Journal 2015;13(10):4253 13
Skin and sweat 2.3.6.3.
Sweat and dermal losses in adults have been reported to vary between 120–150 μg/day (two daily
collections in three men) (Milne et al., 1990) and 340 ± 240 µg/day (88 daily collections in 13 men)
(Jacob et al., 1981). Several different factors may alter sweat losses for copper. For example,
Chinevere et al. (2008) showed, in a study in eight healthy young men, that heat acclimation resulted
in a lower sweat rate and a lower loss of copper as a consequence of exercise, from 0.41 mg/hour to
0.22 mg/hour. However, later studies (Ely et al., 2013) suggested that the results may be explained at
least in part as being an artefact of the collection procedure. In studies of athletes on bicycle
ergometers, as much as 0.83 mg copper could be lost in sweat, measured from whole-body washdown
(Baker et al., 2011). However, results are very variable from exercise period to period and between
individuals (Aruoma et al., 1988).
The Panel considers that copper losses in sweat and skin may be significant, but the results are
variable and subject to many confounding factors. Dermal losses are not usually measured in balance
studies, and this may limit the value of balance studies in terms of deriving requirements for copper.
Breast milk 2.3.6.4.
In a comprehensive review of breast milk copper concentrations in women around the world at stages
of lactation between one day and nine months, Dorea (2000) reported concentrations ranging from
about 200 to 1 000 µg/L over the course of lactation, with most values in the order of 300–400 µg/L.
Breast milk copper concentration did not correlate with dietary copper intake or with serum copper
concentration, but decreased with time of lactation. Ceruloplasmin was identified in human milk and
may carry up to 25 % of total milk copper. In general, copper concentrations in breast milk were quite
variable in different studies, but did not correlate with social status, nutrient intake or copper levels in
the diet.
Comprehensive searches of the literature published from January 1990 to February 2012 (Bost et al.,
2012) and from January 2011 to January 2014 (LASER Analytica, 2014) were performed as
preparatory work to this assessment in order to identify data on breast milk copper concentration.
Appendix A reports data from 12 studies on the mean copper concentration of human milk from
healthy lactating mothers of term infants, published after the review of Dorea (2000).
Milk copper concentrations significantly decrease with advancing lactation (Dörner et al., 1989;
Lönnerdal, 1998; Dorea, 2000; Wünschmann et al., 2003). Copper concentrations in breast milk were
reported to decrease from 420 ± 58 μg/L at day 1 to 344 ± 93 μg/L at day 36 post-partum in British
women (Hibberd et al., 1982); from 450 ± 110 μg/L at days 0–4 to 270 ± 90 μg/L at days 10–30 in
Polish women (Wasowicz et al., 2001); from 1 084 (80 % range 752–1 488) µg/L fore-milk at 2 weeks
to 680 (80 % range 395–1 156) µg/L fore-milk at 16 weeks (Dörner et al., 1989); and from
1 040 ± 54 μg/L at days 4–7 to 847 ± 38 μg/L at days 30–45 in women in the USA (Feeley et al.,
1983). In a sample of 23 women–infant pairs from Germany, Poland and the Czech Republic studied
over 2–8 weeks, Wünschmann et al. (2003) observed that the copper intake of breast-fed infants
< 4 months was 250 µg/day (range 150–320 µg/day), while it decreased to 105 µg/day (range
66-210 µg/day) in infants aged > 4 months (highest age was 16.4 months at the start of the study).
Maternal diet does not seem to influence milk copper concentration (Wünschmann et al., 2003). The
mechanisms governing the transfer of copper from blood to breast milk are not fully understood, but
they do not seem to depend on maternal intake or maternal copper reserves. Serum copper
concentration does not seem to influence the uptake of copper by the mammary gland and specific
maternal conditions that markedly alter copper metabolism, such as Wilson disease, do not affect milk
copper concentrations (Dorea, 2000).
The Panel notes that the available data indicate that, during the first six months of lactation,
mean/median copper concentrations in mature breast milk of populations from Western countries are
variable and are reported to range between about 100 and 1 000 µg/L. The Panel selected a value of

Dietary Reference Values for copper
EFSA Journal 2015;13(10):4253 14
350 µg/L as breast milk copper concentration of mature milk (Dorea, 2000; EFSA NDA Panel, 2013)
and, based on a mean milk transfer of 0.8 L/day (Butte et al., 2002; FAO/WHO/UNU, 2004; EFSA
NDA Panel, 2009) during the first six months of lactation in exclusively breastfeeding women, the
Panel estimates a loss of 280 µg/day of copper in breast milk during the first six months of lactation.
2.3.7. Interaction with other nutrients
Copper and iron 2.3.7.1.
Copper is required for normal functioning of the multi-copper ferroxidases, hephaestin, ceruloplasmin,
glycosylphosphatidylinositol (GPI)-anchored ceruloplasmin and zyklopen (Gambling et al., 2008).
These are all critical for iron release on the basolateral side of epithelia. Hephaestin knockout mice die
from iron deficiency, while patients with aceruloplasminaemia have iron overload in the liver and
brain and will suffer from cirrhosis and psychiatric problems (Harris et al., 1998). To date, there are no
recorded mutants of the GPI-anchored ceruloplasmin, and zyklopen knockout mice are not available.
Although copper is largely taken up by Ctr1, it is possible that some copper enters through DMT1, the
iron transport channel. As such, high levels of iron in the diet can reduce copper absorption (Sharp,
2004).
Copper and zinc 2.3.7.2.
It is well established that high levels of dietary zinc can affect copper absorption and that chronic high
zinc intake can result in severe neurological diseases attributable to copper deficiency (Hedera et al.,
2009). A NOAEL for zinc of 50 mg/day was based on the absence of any adverse effect on a wide
range of indicators of copper status in controlled metabolic studies (SCF, 2002). High levels of zinc, in
rats at least, induce metallothionein. This sequesters both copper and zinc, but has a higher affinity for
copper. Thus, when copper is absorbed, it displaces the zinc, which in turn induces more
metallothionein. This results in blocking of copper absorption.
Two studies examined the interactions between zinc and copper directly. They found that a zinc intake
of 53 mg/day can reduce copper absorption and change copper balance (Taylor et al., 1991; Milne et
al., 2001). High levels of zinc (i.e. above the UL for zinc (SCF, 2002)) can be used to treat Wilson
disease. This treatment acts to prevent absorption of copper, rather than removing it from intracellular
stores like for other treatments (Brewer et al., 1998).
Copper and molybdenum 2.3.7.3.
In ruminants, copper molybdenosis has been recognised for many years but this has not been observed
in humans (Nederbragt et al., 1984; Ladefoged and Sturup, 1995).
In four adult males on two sorghum diets providing daily doses of 2.4 mg of copper and 166 µg or
540 µg of molybdenum, faecal copper excretion was comparable and apparent copper absorption was
unaffected by molybdenum intake (Deosthale and Gopalan, 1974).
Conclusions on interactions with other nutrients 2.3.7.4.
The Panel considers that zinc, iron and molybdenum at levels occurring in the normal diet do not
interfere with copper metabolism and, hence, interactions do not need to be taken into consideration
when setting Dietary Reference Values (DRVs) for copper.
2.4. Biomarkers
2.4.1. Serum/plasma copper concentration
Traditionally, serum/plasma copper concentration is taken as the best indicator of status, but it reflects
ceruloplasmin concentration rather than copper stores, and this can vary during the acute phase
reaction, in infection, and is also increased by steroid hormones and the use of oral contraceptives
Dietary Reference Values for copper
EFSA Journal 2015;13(10):4253 15
(Harvey and McArdle, 2008). The Panel considers that serum and plasma copper concentrations are
equivalent.
Based on a systematic review to evaluate the usefulness of biomarkers of copper status, Harvey et al.
(2009) concluded that serum copper concentration responds to copper supplementation depending on
copper status, with a greater response to supplementation in copper-deficient subjects (two studies)
than in copper-replete subjects (five studies). Less information was available regarding the response of
plasma copper concentration to supplementation.
In one trial, a small but significant decrease in plasma copper concentration was observed in young
healthy men at the end of a copper depletion period compared with the preceding equilibration period
or the subsequent repletion period (Turnlund et al., 1997; Werman et al., 1997). In contrast, other
studies showed no difference in plasma copper concentration following a period of depletion (Milne et
al., 1990; Turnlund et al., 1990; Milne and Nielsen, 1996; Baker et al., 1999b; Milne et al., 2001;
Araya et al., 2003; Davis, 2003; Harvey et al., 2003).
The Panel considers that plasma and serum copper concentrations are of limited value as biomarkers
of copper status in individuals, especially in relation to copper overload, but notes that low
concentrations may indicate copper depletion.
2.4.2. Ceruloplasmin concentration and ceruloplasmin activity
Ceruloplasmin is the major copper carrier in the plasma. Plasma ceruloplasmin concentration and
ceruloplasmin activity significantly declined when dietary copper intake was reduced from
0.66 mg/day for 24 days to 0.38 mg/day for 42 days in one controlled trial involving male subjects.
Ceruloplasmin concentration and activity increased again after a repletion period providing 2.49 mg
copper/day for 24 days (Turnlund et al., 1997).
No effect of dietary copper (either by depletion to 0.7 mg/day or by supplementation to levels as high
as 7 mg/day) on plasma ceruloplasmin concentration was reported in other trials (Milne et al., 1990;
Milne and Nielsen, 1996; Baker et al., 1999b; Davis et al., 2000; Kehoe et al., 2000; Turley et al.,
2000; Milne et al., 2001; Araya et al., 2003; Harvey et al., 2003; Turnlund et al., 2004). Furthermore,
ceruloplasmin is an acute phase protein, and is elevated with oral contraceptive use, so that its value as
a biomarker is somewhat restricted.
The Panel considers that ceruloplasmin is of limited value as a biomarker of copper status in
individuals.
2.4.3. Erythrocyte superoxide dismutase
In animal studies, SOD levels are decreased in copper deficiency (West and Prohaska, 2004). The
effect of dietary copper on the activity of the erythrocyte Cu/Zn SOD has been assessed in five
controlled trials and one balance study (Turnlund et al., 1997; Davis et al., 2000; Kehoe et al., 2000;
Milne et al., 2001; Davis, 2003; Harvey et al., 2003). Five out of these six trials reported no change in
erythrocyte SOD in response to dietary copper. In a randomised controlled trial (RCT), Davis (2003)
did not observe any difference in erythrocyte SOD activity in 17 men receiving a diet containing
0.59 mg/day for six weeks or one containing 2.59 mg/day for six weeks. In another trial in 12 young
men, no difference in SOD activity was observed at the end of the three feeding periods with “low”
(0.66 mg/day for 24 days), “very low” (0.38 mg/day for 42 days) and “high” (2.49 mg/day for 24
days) copper intakes (Turnlund et al., 1997). No change in SOD activity was observed by Kehoe et al.
(2000) or Harvey et al. (2003) with copper intakes varying between 1.59 and 6 mg/day. In one study in
postmenopausal women, the authors reported an increase in erythrocyte SOD activity when copper
intake increased from 1 to 3 mg/day (Milne et al., 2001). However, in this study, dietary zinc was
either very low (3 mg/day) or very high (53 mg/day), which may have affected the response of
erythrocyte SOD to dietary copper. Moreover, a systematic review on biomarkers of copper status
concluded that erythrocyte SOD is not a suitable biomarker of copper status (Harvey et al., 2009).

Dietary Reference Values for copper
EFSA Journal 2015;13(10):4253 16
The Panel considers that erythrocyte SOD cannot be used as a biomarker of copper status.
2.4.4. Diamine oxidase
Serum diamine oxidase (DAO) was increased after copper supplementation with 3 mg/day for six
weeks in two RCTs including 24 participants each (Kehoe et al., 2000; O'Connor et al., 2003).
However, the Panel considers that the studies were at a high risk of bias owing to incomplete reporting
of outcomes. One systematic review included three other supplementation studies (RCTs) assessing
serum DAO activity (Harvey et al., 2009). According to the authors, no conclusions can be drawn
regarding the usefulness of DAO activity as a biomarker of copper status.
The Panel considers that DAO cannot be used as a biomarker of copper status.
2.4.5. Skin lysyl oxidase
One controlled trial carried out in 12 young men (Werman et al., 1997) observed a decrease in skin
lysyl oxidase activity when changing from a diet providing 0.66 mg copper/day to a diet providing
0.38 mg copper/day and an increase in its activity after a repletion period (2.48 mg copper/day), which
suggests that lysyl oxidase activity declines when dietary copper intake is inadequate. In their
systematic review, Harvey et al. (2009) were unable to identify suitable further data to evaluate the
usefulness of skin lysyl oxidase as a biomarker of copper status.
The Panel considers that there is insufficient information to assess the usefulness of skin lysyl oxidase
as a biomarker of copper status.
2.4.6. Other biomarkers
In a systematic review on possible biomarkers of copper status, Harvey et al. (2009) stated that no
conclusions can be drawn on the usefulness of erythrocyte and platelet copper; leucocyte SOD;
erythrocyte, platelet and plasma glutathione peroxidase; platelet and leucocyte cytochrome c oxidase;
total glutathione; and urinary pyridinoline. There was a lack of data for novel biomarkers such as CCS
(copper chaperone for SOD) (Harvey et al., 2009; de Romana et al., 2011), and peptidyl glycine α-
amidating monooxygenase activity (Harvey et al., 2009; Bousquet-Moore et al., 2010) as biomarkers
of copper status. More recently it has been suggested that CCS mRNA may be related to copper status
(Araya et al., 2014), but more work is needed to test if it can be a biomarker in the general population.
The Panel considers that other biomarkers of copper status are neither sensitive nor specific enough to
be used for setting DRVs for copper.
2.5. Effects of genotype
ATP7A and ATP7B have many recorded polymorphisms (Thomas et al., 1995b; Thomas et al., 1995a;
Institute of Genetic Medicine et al., 2015). Some of these have a significant enough effect to be
classified as lethal mutations, while others are compatible with survival, some with very minor
handicaps.
Recently, it has been suggested that single nucleotide polymorphisms (SNPs) in ATP7B are associated
with an increase in non-ceruloplasmin copper, and with an increased incidence of Alzheimer’s disease
(Bucossi et al., 2012; Squitti, 2012). Furthermore, different ATP7B SNPs have been shown to be
associated with an increased incidence of Alzheimer’s disease (Squitti et al., 2013). However, whether
the link is causal or not has yet to be demonstrated. Furthermore, in a pilot phase 2 clinical trial,
Kessler et al. (2008) showed that supplementation with copper actually had a positive effect on a
marker for Alzheimer’s disease, in that levels of serum amyloid peptide A42 (which is reduced in
Alzheimer’s disease) decreased by only 10 %, compared with 30 % in the placebo group, suggesting a
protective effect of copper. The Panel concludes that more data are required before these findings can
be considered when setting DRVs for copper.

Dietary Reference Values for copper
EFSA Journal 2015;13(10):4253 17
3. Dietary sources and intake data
3.1. Dietary sources
Foods differ widely in their natural copper content. Factors such as season (copper concentration is
higher in greener portions), soil quality (Ginocchio et al., 2002; Chaignon et al., 2003), geography,
water source and use of fertilisers influence the copper content in food. Rich dietary sources of copper
are liver, some seafood (oysters), cocoa products, nuts (particularly cashew) and seeds (de Romana et
al., 2011).
Besides food, drinking water can be another major source of copper, although the mineral content in
drinking water is very variable. Factors such as natural mineral content, pH and a copper or non-
copper plumbing system determine copper concentration in water (National Research Council (US)
Committee on Copper in Drinking Water, 2000). Soft acidic water, especially when transported by
copper pipelines, has a higher copper concentration. In unflushed samples of drinking water in Malmö
and Uppsala (Sweden), the 10th and 90
th percentiles of copper concentration were 0.17 and 2.11 mg/L,
respectively, and the median concentration was 0.72 mg/L. In a small percentage of dwellings,
however, drinking water had copper concentrations of more than 5 mg/L. Median daily intake of
copper from drinking water in children aged 9–21 months was estimated to be 0.46 mg in Uppsala and
0.26 mg in Malmö (Pettersson and Rasmussen, 1999). In Berlin (Germany), copper concentration in
random daytime samples of tap water ranged between > 0.01 and 3.0 mg/L, with a median of
0.03 mg/L (Zietz et al., 2003). In the European Union (EU), the maximum permitted concentration of
copper in water intended for human consumption is 2 mg/L.6
It has been estimated that foods may account for 90 % or more of copper intake in adults when the
copper content in drinking water is low (< 0.1 mg/L). If the copper content is higher (> 1–2 mg/L),
water may account for up to 50 % of total intake. In infants, contribution of water to daily copper
intake may be higher because they consume proportionally more water than adults (de Romana et al.,
2011).
Currently, copper as copper lysine complex, cupric carbonate, cupric citrate, cupric gluconate and
cupric sulphate may be added to both foods7 and food supplements,
8 whereas copper L-aspartate,
copper bisglycinate and copper (II) oxide may only be used in the manufacture of food supplements.8
The copper content of infant and follow-on formulae9 and processed cereal-based foods and baby
foods for infants and young children10
is regulated.
3.2. Dietary intake
EFSA estimated dietary intake of copper from food consumption data from the EFSA Comprehensive
European Food Consumption Database (EFSA, 2011b), classified according to the food classification
and description system FoodEx2 (EFSA, 2011a). Data from 13 dietary surveys from nine EU countries
were used. These countries comprised Finland, France, Germany, Ireland, Italy, Latvia, the
Netherlands, Sweden and the UK. The data covered all age groups from infants to adults aged 75 years
and older (Appendix B).
Nutrient composition data of foods and water-based beverages were derived from the EFSA Nutrient
Composition Database (Roe et al., 2013). Food composition information from Finland, France,
6 Council Directive 98/83/EC of 3 November 1998 on the quality of water intended for human consumption. OJ L 330,
5.12.1998, p. 32. 7 Regulation No 1925/2006 of the European Parliament and of the Council of 20 December 2006 on the addition of vitamins
and minerals and of certain other substances to foods. OJ L 404, 30.12.2006, p. 26. 8 Directive 2002/46/EC of the European Parliament and of the Council of 10 June 2002 on the approximation of the laws of
the Member States relating to food supplements. OJ L 183, 12.7.2002, p. 51. 9 Commission Directive 2006/141/EC of 22 December 2006 on infant formulae and follow-on formulae and amending
Directive 1999/21/EC. OJ L 401, 30.12.2006, p. 1. 10 Commission Directive 2006/125/EC of 5 December 2006 on processed cereal-based foods and baby foods for infants and
young children. OJ L 339, 6.12.2006, p. 16.

Dietary Reference Values for copper
EFSA Journal 2015;13(10):4253 18
Germany, Italy, the Netherlands, Sweden and the UK were used to calculate copper intake in these
countries, assuming that the best intake estimate would be obtained when both the consumption data
and the composition data are from the same country. For nutrient intake estimates of Ireland and
Latvia, food composition data from the UK and Germany, respectively, were used, because no specific
composition data from these countries were available. In the case of missing values in a food
composition database, data providers had been allowed to make use of values from another country’s
database. The amount of borrowed copper values in the seven composition databases used varied
between 12.7 and 100 %, although in six of the seven databases the percentage of borrowed values
was higher than 60 % of the total. Estimates were based on food consumption only (i.e. without
dietary supplements). Nutrient intake calculations were performed only on subjects with at least two
reporting days.
Data on infants were available from Finland, Germany, the UK and Italy. The contribution of human
milk was taken into account if the amounts of human milk consumed (Italian INRAN-SCAI survey
and the UK DNSIYC) or the number of breast milk consumption events (German VELS study) were
reported. In the case of the Italian INRAN-SCAI survey, human milk consumption had been estimated
based on the number of eating occasions using standard portions per eating occasion. In the Finnish
DIPP study, only the information “breast-fed infants” was available, but without any indication about
the number of breast milk consumption events during one day or the amount of breast milk consumed
per event. For the German VELS study, the total amount of breast milk was calculated based on the
observations by Paul et al. (1988) on breast milk consumption during one eating occasion at different
ages, i.e. the amount of breast milk consumed on one eating occasion was set to 135 g/eating occasion
for infants aged 6–7 months and to 100 g/eating occasion for infants aged 8–12 months. The Panel
notes the limitations in the methods used for assessing breast milk consumption in infants and the
related uncertainties in the intake estimates for infants (Appendices C and D).
Average copper intakes ranged between 0.34 and 0.50 mg/day (0.12–0.22 mg/MJ) in infants (< 1 year,
four surveys), between 0.57 and 0.94 mg/day (0.14–0.20 mg/MJ) in children aged 1 to < 3 years (five
surveys), between 0.82 and 1.44 mg/day (0.12–0.19 mg/MJ) in children aged 3 to < 10 years (seven
surveys), between 0.98 and 1.92 mg/day (0.13–0.20 mg/MJ) in children aged 10 to < 18 years (seven
surveys) and between 1.15 and 2.07 mg/day (0.14–0.25 mg/MJ) in adults (≥ 18 years, eight surveys).
Average daily intakes were in most cases slightly higher in males (Appendix C) than in females
(Appendix D), mainly owing to larger quantities of food consumed per day.
The main food group contributing to copper intake was grains and grain-based products, except for
infants for whom the main contributor to copper intake was food products for the young population
(Appendices E and F). Another important contributor to copper intake was the food group meat and
meat products, with an average contribution up to 19 % in males and up to 16 % in females. Although
grains and grain-based products do not contain concentrations of copper as high as those reported for
other food groups, such as offal or nuts, the high consumption of foods in this group (e.g. bread) and
the large variety of products included makes it the most important contributor to copper intake. The
food groups starchy roots or tubers and products thereof, sugar plants; coffee, tea and infusions; fish,
seafood, amphibians, reptiles and invertebrates, were also important contributors, with the final group
important in only certain European populations. Differences in the main contributors to copper intakes
between sexes were minor. The contribution of water and water-based beverages to copper intake in
various age groups was up to 12 %.
EFSA’s copper intake estimates in mg/day were compared with published intake values, where
available, from the same survey and dataset and the same age class using the study in Finnish
adolescents (Hoppu et al., 2010), the FINDIET 2012 Survey (Helldán et al., 2013), the French national
INCA2 survey (Afssa, 2009), the VELS survey in infants and children (Kersting and Clausen, 2003),
the Irish National Adult Nutrition Survey (IUNA, 2011), the Dutch National Food Consumption
Survey (van Rossum et al., 2011) and the UK National Diet and Nutrition Survey (Bates et al., 2011).
When the EFSA copper intake estimates were compared with published intake estimates from the
same survey and same age ranges, the EFSA estimates differed at most by around 25 % from the

Dietary Reference Values for copper
EFSA Journal 2015;13(10):4253 19
published values in all countries and surveys, although in several cases differences were less than 5–
10 % (Table 2).
Table 2: EFSA’s average daily copper intake estimates, expressed as percentages of intakes
reported in the literature
Country Percentage of published intake (% range over different age classes in a specific survey)
Finland 103–110 (NWSSP), 108–118 (FINDIET2012)
France 96–112 (INCA2)
Germany 99–103 (VELS children), 75–80 (VELS infants)
Ireland 98–121 (NANS)
Netherlands 115–120 (DNFCS)
UK 107–125 (NDNS Rolling Programme, Years 1–3)
DNFCS, Dutch National Food Consumption Survey; FINDIET, the national dietary survey of Finland; INCA, étude
Individuelle Nationale des Consommations Alimentaires; NANS, National Adult Nutrition Survey; NDNS, National Diet and
Nutrition Survey; NWSSP, Nutrition and Wellbeing of Secondary School Pupils; VELS, Verzehrsstudie zur Ermittlung der
Lebensmittelaufnahme von Säuglingen und Kleinkindern für die Abschätzung eines akuten Toxizitätsrisikos durch
Rückstände von Pflanzenschutzmitteln.
In addition to the surveys mentioned above, there were also available data on copper intake from the
EsKiMo study (Germany) and the DNSIYC-2011 (UK). In these two cases, the comparison with the
EFSA average copper intake estimates is difficult; in the case of the EsKiMo study, EFSA average
copper intake estimates were lower by 13–15 % in children aged 6 to < 10 years and by 42–58 % in
children aged 10–11 years than published estimates. This could be partially explained by the fact that
the EsKiMo study included copper supplement consumption in their data (Mensink et al., 2007).
Regarding the DNSIYC-2011 study, the comparison is also difficult, as the intakes for infants and
young children are reported by ethnic groups and socio-economic classes. However, the EFSA
estimated intakes for infants (0.38–0.41 mg/day) and children aged up to 1.5 years (0.57–0.60 mg/day)
do not differ much from those published (0.45–0.52 mg/day for infants, 0.45–0.55 mg/day in children
aged up to 1.5 years).
Overall, several sources of uncertainties may contribute to these differences. These include
inaccuracies in mapping food consumption data according to food classifications, nutrient content
estimates available from the food composition tables, the use of “borrowed” copper values from other
countries in the food composition database, and replacing missing copper values with values of similar
foods or food groups in the copper intake estimation process. It is not possible to conclude which of
these intake estimates (i.e. the EFSA intake estimate or the published one) would be closer to the
actual copper intake.
4. Overview of Dietary Reference Values and recommendations
4.1. Adults
The German-speaking countries (D-A-CH, 2015) considered that a copper intake of 1.25 mg/day is
needed to replace faecal and urinary losses (Klevay et al., 1980). An AR estimated by the World
Health Organization (WHO) of 11 µg/kg body weight per day (WHO, 1996) and the PRI set by SCF
(1993) were also considered when setting an Adequate Intake (AI) range of 1.0–1.5 mg/day (Table 3).
For the Nordic Nutrition Recommendations (NNR) 2012, it was acknowledged that there are limited
data but that the available data demonstrate that a copper intake of 0.7–0.8 mg/day maintains adequate
copper status as indicated by plasma copper concentration, SOD activity and ceruloplasmin production
(Reiser et al., 1985; Lowy et al., 1986; Lukaski et al., 1988; Turnlund et al., 1990; Turnlund et al.,
1997). In addition, it was pointed out that an intake below 0.7 mg/day has been associated with an
increase in faecal free radical production, faecal water alkaline phosphatase activity, cytotoxicity or
impaired immune function (Bonham et al., 2002; Davis, 2003). In line with IOM (2001), an AR of

Dietary Reference Values for copper
EFSA Journal 2015;13(10):4253 20
0.7 mg/day was set and, using a coefficient of variation (CV) of 15 %, a recommended intake of
0.9 mg/day was derived (Nordic Council of Ministers, 2014).
IOM (2001) set an Estimated Average Requirement (EAR) using depletion/repletion studies assessing
biochemical indicators of copper status in men and women (Turnlund et al., 1990; Milne and Nielsen,
1996; Turnlund et al., 1997). According to IOM (2001), the study by Turnlund et al. (1990) showed
that a copper intake in 11 young men above 0.38 mg/day is needed to prevent a decrease in relevant
biochemical indicators (SOD activity, serum copper and ceruloplasmin concentration), whereas the
study by Turnlund et al. (1997) showed that no decline in these biomarkers was observed in 11 young
men at an intake of 0.79 mg/day. A linear model based on the two studies defined an intake of
0.55 mg/day at which half of the group of young men would not maintain a satisfactory copper status.
IOM (2001) also considered the study of Milne and Nielsen (1996), which showed that a copper intake
of 0.57 mg/day in 10 women maintained serum copper and ceruloplasmin concentrations, whereas
platelet copper concentration decreased significantly in 8 out of 10 women. Based on these studies, an
EAR of 0.7 mg/day was set. The factorial method was used as supportive evidence. To achieve neutral
copper balance, it was considered that an intake of 0.51 mg/day is needed to replace obligatory copper
losses via faeces, urine, sweat and other routes (Shike et al., 1981; Milne and Gallagher, 1991;
Turnlund et al., 1997; Turnlund, 1998), this value being somewhat lower than the EAR set based on
indicators of copper status. A Recommended Dietary Allowance (RDA) of 0.9 mg/day was derived,
applying a CV of 15 % to the EAR to account for the limited data available and the few copper intake
levels in depletion/repletion studies.
Afssa (2001) set requirements for copper using a factorial approach. Total losses of copper of 400–
500 µg/day, consisting of losses via the skin (50–100 µg/day), urinary losses (25–50 µg/day) and
faecal losses (300–400 µg/day) were assumed. The AR was considered to fall within a range of 1.35–
1.65 mg/day, taking into account 30 % absorption (Sandstead, 1982). A PRI of 2 mg/day for men and
1.5 mg/day for women was set.
The SCF (1993) derived an AR of 0.8 mg/day and set a PRI of 1.1 mg/day. The AR was largely based
on the study by Turnlund et al. (1989), in which men with an intake of 0.79 mg/day for 42 days did not
show a decrease in copper status. A study with an intake range of 0.7–1.0 mg/day for four weeks,
which showed copper-responsive clinical and biochemical effects in some adults, was also considered,
but it was stated that these defects could have also resulted from the experimental diet given (Reiser et
al., 1985).
The Netherlands Food and Nutrition Council (1992) set an adequate range of intake on the basis of a
factorial approach and balance studies. In the factorial approach, faecal losses (0.4–1.2 mg/day), sweat
losses (0.3 mg/day) and an estimated absorption efficiency of 40 % were taken into account to
determine a requirement of 1.75–3.75 mg/day (Bloomer and Lee, 1978; Ting et al., 1984; Turnlund,
1987; Turnlund et al., 1988). It was stated that copper balance was positive for an intake above
1.4 mg/day (Robinson et al., 1973; Hartley et al., 1974; Turnlund et al., 1981; Turnlund et al., 1983),
although these studies did not consider losses via the skin. With some uncertainty, the adequate range
of intake was concluded to fall within the range 1.5–3.5 mg/day.
The UK Committee on Medical Aspects of Food Policy (COMA) (DH, 1991) set a Reference Nutrient
Intake (RNI) of 1.2 mg/day on the basis of data from balance studies (no references given) and
biochemical signs of copper deficiency observed at an intake of 0.8–1.0 mg/day, such as a decline in
activity of SOD and cytochrome oxidase and altered metabolism of enkephalins. It was stressed that
an EAR or a Lower Reference Nutrient Intake could not be set owing to the lack of data.
WHO and the Food and Agriculture Organization (WHO/FAO, 2004) did not derive DRVs for copper.

Dietary Reference Values for copper
EFSA Journal 2015;13(10):4253 21
Table 3: Overview of Dietary Reference Values for copper for adults
D-A-CH
(2015)
NCM
(2014)
Afssa
(2001)
IOM
(2001)
SCF
(1993)
NL
(1992)
DH
(1991)
Age (years) ≥ 19 ≥ 18 20–50 ≥ 19 ≥ 18 ≥ 19 ≥ 19
PRI Men (mg/day) 1.0–1.5
(a) 0.9 2.0 0.9 1.1 1.5–3.5
(b) 1.2
Women (mg/day) 1.0–1.5 (a)
0.9 1.5 0.9 1.1 1.5–3.5 (b)
1.2
Age (years) ≥ 50
PRI Men (mg/day) 1.5
Women (mg/day) 1.5
NCM, Nordic Council of Ministers; NL, Netherlands Food and Nutrition Council.
(a): Adequate Intake.
(b): Adequate range of intake.
4.2. Infants and children
In NNR 2012 it was stated that breast milk copper concentration is about 0.25 mg/L, according to
IOM (2001), and that the copper status of fully breast-fed infants is adequate (Nordic Council of
Ministers, 2014). For infants aged 6 to 11 months and children, copper requirements were extrapolated
from adult requirements, taking into account an allowance for growth, in line with IOM (2001)
(Table 4).
IOM (2001) set an AI of 0.22 mg/day (or 0.024 mg/kg body weight per day) for infants aged 7–12
months, considering an average human milk copper concentration between 7 and 12 months post-
partum of 0.2 mg/L, a mean breast milk intake of 0.6 L/day and a median copper intake with
complementary foods of 0.1 mg/day, as shown by the Third National Health and Nutrition
Examination Survey (n = 45 infants of that age). For children, the IOM (2001) extrapolated from the
EAR of adults using allometric scaling (body weight to the power of 0.75), owing to the absence of
data for children. The choice of the scaling approach was justified by the structural and functional role
of copper in many enzymes and because it resulted in higher values than extrapolation based on
isometric scaling (i.e. linear with body weight). In the absence of information about the variability in
requirement, a CV of 15 % was applied to the EARs to derive RDAs for various age groups.
For infants and young children, Afssa (2001) assumed that the requirement for copper is between 40
and 80 µg/kg body weight per day.
The SCF (1993) estimated copper requirements for infants factorially, considering endogenous losses
according to Zlotkin and Buchanan (1983) and a copper requirement for growth based on a tissue
copper content of 1.38 µg/g (Widdowson and Dickerson, 1964). Assuming absorption efficiency to be
50 % resulted in a PRI of 36 µg/kg body weight per day or 0.3 mg/day. For children, the PRI values
were interpolated and were given as 30 µg/kg body weight per day at 1–6 years, 24 µg/kg body weight
per day at 7–10 years and 18 µg/kg body weight per day at 15–17 years of age.
For infants aged 0 to 12 months, the Netherlands Food and Nutrition Council (1992) set an adequate
range of intake of 0.3–0.5 mg/day based on a copper concentration of breast milk of about 0.3–
0.5 mg/L (Cavell and Widdowson, 1964; Vuori, 1979) and assumed absorption efficiencies of 50 %
from breast milk and 40 % from infant formula. For children, adequate ranges of intake were
extrapolated from that of adults on the basis of body weight.
The UK COMA (DH, 1991) set an RNI for infants based on the factorial approach. An average tissue
copper content of 1.38 µg/g (Widdowson and Dickerson, 1964) was considered, as well as losses of
endogenous copper (Zlotkin and Buchanan, 1983). An absorption efficiency of 50 % was assumed
(Miller, 1987). Thus, RNIs of 47, 39 and 36 µg/kg body weight per day were set for successive 3-
month periods of infancy. For children, RNIs were interpolated.

Dietary Reference Values for copper
EFSA Journal 2015;13(10):4253 22
Table 4: Overview of Dietary Reference Values for copper for children
D-A-CH
(2015)
NCM
(2014)
Afssa
(2001)
IOM
(2001)
SCF
(1993)
NL
(1992)
DH (1991)
Age (months) 4–< 12 6–11 6–12 7–12 6–11 6–12 4–12
PRI (mg/day) 0.6–0.7 (a)
0.3 0.6 0.22 (a)
0.3 0.3–0.5 (b)
0.3
Age (years) 1–< 4 1–< 2 1–3 1–3 1–3 1–4 1–3
PRI (mg/day) 0.5–1.0 (a)
0.3 0.75 0.34 0.4 0.3–0.7 (b)
0.4
Age (years) 4–< 7 2–5 4–6 4–8 4–6 4–7 4–6
PRI (mg/day) 0.5–1.0 (a)
0.4 1.0 0.44 0.6 0.5–1.0 (b)
0.6
Age (years) ≥ 7 6–9 7–10 7–10 7–10 7–10
PRI (mg/day) 1.0–1.5 (a)
0.5 1.2 0.7 0.6–1.4 (b)
0.7
Age (years) 10–13 11–20 9–13 11–14 10–13 11–14
PRI (mg/day) 0.7 1.5 0.7 0.8 1.0–2.5 (b)
0.8
Age (years) 14–17 14–18 15–17 13–16 15–18
PRI (mg/day) 0.9 0.89 1.0 1.5–3.0 (b)
1.0
Age (years) 16–19
PRI (mg/day) 1.5–3.5 (b)
NCM, Nordic Council of Ministers; NL, Netherlands Food and Nutrition Council.
(a): Adequate Intake.
(b): Adequate range of intake.
4.3. Pregnancy and lactation
In NNR 2012 it was noted that there is a small additional requirement for copper in the last trimester
of pregnancy, which may be met by adaptive mechanisms leading to increased absorption efficiency
(Nordic Council of Ministers, 2014). Nevertheless, an additional intake of 0.1 mg/day was
recommended during pregnancy (Table 5). For lactating women, an additional intake of 0.4 mg/day
was set to compensate for secretion of copper into milk, assuming a copper breast milk concentration
of 0.25 mg/L, a daily milk volume of 0.75 L/day and an absorption efficiency of 50 %.
In the absence of data on copper requirement in pregnancy, IOM (2001) considered the amount of
copper accumulated in the fetus (13.7 mg according to Widdowson and Dickerson (1964)) and the
products of conception (estimated at one-third of the value for the fetus, i.e. 4.6 mg) over the course of
pregnancy. To support a total accumulation of 18 mg it was estimated that an intake of 0.067 mg/day
is needed, taking into account a copper absorption of 65–70 %. Although absorption may be
upregulated to meet this additional requirement without additional copper intake, the available data
(Turnlund et al., 1983) were considered too limited, and an additional EAR of 0.1 mg/day was derived
for pregnancy. A CV of 15 % was applied to set the RDA for pregnancy at 1.0 mg/day. For lactating
women, an additional EAR of 0.3 mg/day was considered to replace the amount of copper secreted
with breast milk (about 0.2 mg/day). An RDA of 1.3 mg/day was derived considering a CV of 15 %.
Afssa (2001) advised an increase in intake of 0.5 mg/day for pregnant women owing to the additional
copper requirement of the fetus during the last trimester. During lactation, the amount of copper
secreted in breast milk was estimated to be 0.1–0.3 mg/day. An additional intake of 0.5 mg/day was
proposed for lactating women.
The SCF (1993) and the UK COMA (DH, 1991) did not set an increment for pregnancy, as it was
assumed that the requirement for the products of conception of 0.033, 0.063 and 0.148 mg/day for the
first, second and third trimesters, respectively (Shaw, 1980), could be met by metabolic adaptation.
For lactating women, considering a milk production of 0.75 L/day, a copper concentration in breast
milk of 0.22 mg/L (Casey et al., 1989) and an absorption efficiency of 50 %, SCF (1993) advised on
an extra intake of 0.3 mg/day. The UK COMA (DH, 1991) considered the same copper concentration
of breast milk but a slightly higher breast milk volume (0.85 L/day) and calculated an additional intake
of 0.38 mg/day for lactating women, although a value of 0.3 mg/day was derived as additional RNI for
lactating women.
Dietary Reference Values for copper
EFSA Journal 2015;13(10):4253 23
The Netherlands Food and Nutrition Council (1992) noted a copper deposition in the fetus and
placenta of 16 mg (Cavell and Widdowson, 1964) and considered that this amount is deposited mainly
in the last trimester, equivalent to a requirement for absorbed copper of 0.2 mg/day. When taking into
account an absorption efficiency of 40 %, an increment in intake of 0.5 mg/day was proposed for
pregnant women during the last trimester of pregnancy. For lactating women, a daily secretion of
copper in breast milk of 0.2–0.4 mg/day was assumed. When taking into account an absorption
efficiency of 40 %, an additional intake of 0.5–1.0 mg/day was proposed for lactation.
The German-speaking countries (D-A-CH, 2015) did not derive (separate) DRVs for copper for
pregnant and lactating women.
Table 5: Overview of Dietary Reference Values for copper for pregnant and lactating women
D-A-CH
(2015)
NCM
(2014)
Afssa
(2001)
IOM
(2001)
SCF
(1993)
NL
(1992)
DH (1991)
Pregnancy Additional intake (mg/day) – 0.1 0.5 0.1 0 0.5
(a) 0
PRI (mg/day) 1.0–1.5 (b)
1.0 2.0 1 1.1 2.0–3.5 (a),(c)
1.2
Lactation Additional intake (mg/day) – 0.4 0.5 0.3 0.3 0.5–1.0 0.3
PRI (mg/day) 1.0–1.5 (b)
1.3 2.0 1.3 1.4 2.0–3.5 (c)
1.5
NCM, Nordic Council of Ministers; NL, Netherlands Food and Nutrition Council.
(a): Third trimester.
(b): Adequate Intake.
(c): Adequate range of intake.
5. Criteria (endpoints) on which to base Dietary Reference Values
5.1. Indicators of copper requirement in adults
The Panel considers that there are no biomarkers of copper status that are sufficiently robust, sensitive
and specific to be used for deriving requirements for copper (see Section 2.4).
5.2. Balance studies in adults
Balance studies are based on the assumption that a healthy subject on an adequate diet maintains an
equilibrium or a null balance between nutrient intakes and nutrient losses. At this null balance, the
intake matches the requirement determined by the given physiological state of the individual. When
intakes exceed losses (positive balance), there is nutrient accretion that may be attributable to growth
or weight gain, anabolism or repletion of stores; when losses exceed intakes (negative balance),
nutrient stores are progressively depleted resulting, in the long term, in clinical symptoms of
deficiency. In addition to numerous methodological concerns about accuracy and precision in the
determination of intakes and losses (Baer et al., 1999), the validity of balance studies for addressing
requirements has been questioned: they might possibly reflect only adaptive changes before a new
steady state is reached (Young, 1986), or they might reflect only the conditions for maintenance of
nutrient stores in the context of a given diet and, consequently, the relevance of the pool size for health
still needs to be established for each nutrient (Mertz, 1987).
Several studies report estimations of copper balance in adults.
A series of four copper balance studies were carried out in eight men aged 18–36 years (Milne et al.,
1990) to evaluate the effects of mild copper depletion. During an equilibration period of up to 43 days,
diets providing 1.22–1.57 mg copper/day were consumed. This was followed by a depletion period
with a copper intake of 0.73–0.99 mg/day for up to 120 days. Depletion was then followed by
repletion of up to 39 days with a diet containing 4.34–6.42 mg copper/day. Copper balance was
calculated as the difference between dietary intake and faecal and urinary losses. Sweat and dermal
losses were measured in only three of the men. When the data from the balances on days 30, 42 and 43

Dietary Reference Values for copper
EFSA Journal 2015;13(10):4253 24
of the equilibration period were combined, a mean daily intake of 1.29 ± 0.44 mg copper resulted in a
positive balance of 0.015 ± 0.07 mg/day, but this figure did not take into account sweat and dermal
losses, which on average were 0.12–0.15 mg/day. The Panel notes that, if these losses are included in
the balance calculations, an intake of 1.29 ± 0.44 mg is not sufficient to achieve null balance in men.
The mean balance on days 105, 108 and 120 of the depletion period was 0.025 ± 0.08 mg/day, and it
was 0.51 ± 0.30 mg/day on days 25, 30 and 39 of the repletion period.
Turnlund et al. (1998) examined the effect of consuming “low” and “very low” copper diets
(0.66 mg/day for 24 days followed by 0.38 mg/day for 42 days) compared with higher intakes
(2.49 mg/day for 24 days following the “very low” copper diet period) on copper retention in 11
young men. Balances were calculated for 6-day periods throughout the study, and average copper
retention over each dietary period was calculated. Mean copper retention over the dietary periods was
–0.13, –0.015 and 0.51 mg/day11
for the “low”, “very low” and “high” copper diets, respectively. The
Panel notes that faecal copper excretion changed throughout the dietary periods, presumably a feature
of adaptation to the differing levels of intake. Sweat/dermal and urinary losses were not taken into
account, and the Panel concludes that copper balance is achieved at levels of intake above 0.66 and
below 2.49 mg/day.
Turnlund et al. (2005) examined the effect of high copper intake on copper metabolism. In this study,
nine men aged 26–49 years consumed a diet containing 1.6 mg copper/day for 18 days before
receiving a copper-supplemented diet containing 7.8 mg copper/day, and copper retention was
calculated as the difference between copper intake and faecal and urinary excretion over the last 12
days of each metabolic period. With a copper intake of 1.6 mg/day, the retention of copper was
calculated to be 0.06 mg/day, and it was calculated to be 0.67 mg/day with the high intake. The Panel
notes that this study did not make any allowances for sweat and dermal losses.
Harvey et al. (2003) examined the effect of consuming “low” (0.7 mg/day), “medium” (1.6 mg/day)
and “high” (6.0 mg/day) copper diets for eight weeks on copper absorption and endogenous losses in
12 men aged 20–59 years. There was a washout period of four weeks between study periods. Copper
balance, calculated as the difference between intake and faecal excretion, was –0.13 ± 0.32,
0.00 ± 0.31 and 0.75 ± 1.05 mg/day on the “low”, “medium” and “high” copper diets, respectively.
The Panel notes that urinary, sweat and dermal losses were not measured.
Milne et al. (2001) examined the effect of changing zinc status on copper balance in postmenopausal
women. Twenty-one women were fed a diet containing 2 mg copper/day for 10 days. They were then
divided into two groups, one given 1 mg copper/day and the other 3 mg copper/day. After 10 days of
equilibration, they were given a diet either high or low in zinc. The results showed that the women
were in positive copper balance only when given 3 mg copper/day and 53 mg zinc/day (high zinc
diet). Furthermore, the ratio of immunoreactive ceruloplasmin and serum ferroxidase activity was
dependent on the copper–zinc ratio. The authors concluded that low zinc status can amplify the
consequences of a low dietary copper intake, and that an intake of 1 mg/day of copper is inadequate
for postmenopausal women.
Prystai et al. (1999) studied the effect of drinking tea on the balance of several micronutrients in five
men and four women who underwent four experimental treatments (black, decaffeinated black, green
or no tea) of 14 days each. The first seven days of each period were used as dietary adaptation, while
the second seven days were used in the calculation of mineral balances. Data from both sexes were
combined, as no sex differences were recorded. At copper intakes in the four treatment periods
between 1.2 and 1.4 mg/day (least square means), balances were slightly negative and ranged between
–0.1 and –0.4 mg/day (least square means). The Panel notes that the number of participants was small
and that balance figures are given for combined sexes only, but considers that the data suggest that
intakes of about 1.3 mg/day may be marginal for both men and women.
11 A figure of 511 mg/day is reported in the paper, which is assumed to be a reporting error.
Dietary Reference Values for copper
EFSA Journal 2015;13(10):4253 25
The Panel notes that copper intakes of 2.49 mg/day (Turnlund et al., 1998) and 7.8 mg/day (Harvey et
al., 2003) resulted in a positive copper balance in men. The Panel also notes that balance values were
negative for copper intakes from 0.38 to 0.7 mg/day in men (Turnlund et al., 1998; Harvey et al.,
2003), while zero balance was reached at a copper intake of approximately 1.6 mg/day in men (Harvey
et al., 2003; Turnlund et al., 2005). The Panel considers that, although dietary intake was usually
carefully controlled, not all potential sources of copper loss were considered (such as losses via urine,
sweat and skin), so the intake at which balance may be zero is likely to be underestimated. The Panel
also considers that some of the balance studies (Prystai et al., 1999; Turnlund et al., 2005) have a
rather short duration of the periods during which dietary intake is maintained at a fixed level before
balance measurement, which may be insufficient for homeostatic adaptation to occur.
The Panel considers that, although there are significant limitations to the balance studies, meaning that
they cannot be used alone, they may be used, together with other data, to inform the setting of DRVs
for copper.
5.3. Indicators of copper requirement in children
Few studies are available on copper balance in older infants and children.
Price and colleagues examined copper balance in 15 girls aged 7–9 years (Price et al., 1970). After a
6-day adjustment period with a diet containing 1.86 mg copper/day, the girls were randomly allocated
to one of four different diets for five balance periods consisting of six consecutive days. Food, faeces
and urine were collected and average 24-hour balances were derived. Intakes ranged between 1.55 and
1.7 mg/24 hours and net balance (apparent retention) ranged between 0.48 and 0.77 mg/24 hours. The
authors compared their data with a previous study in girls (Engel et al., 1967), where balance was
(close to) zero (0.0 to –0.06 mg/24 hours) following copper intakes of 1.08–1.33 mg/24 hours and
balance was positive (0.66 and 1.38 mg/24 hours) when copper intake was either 2.83 or
3.87 mg/24 hours. The Panel notes that copper balance seems to be zero or positive for copper intakes
above about 1 mg/day in girls, although the Panel notes that dermal losses were not measured.
Alexander and colleagues carried out 3-day balance studies in eight healthy children aged between
about 3 months and 8 years (Alexander et al., 1974). Urine and faeces were collected and duplicate
diets were analysed. Mean copper intake was 35.0 ± 22.0 µg/kg body weight per day and mean total
excretion was 30.4 ± 17.0 µg/kg body weight per day. This gave a mean retention of 4.6 ± 12.3 µg/kg
body weight per day. The Panel notes that a copper intake of about 35 µg/kg body weight per day was
associated with positive balance in infants and children, that children were heterogeneous with respect
to age and that there was large variability around the mean estimate.
The Panel concludes that the information is too limited to be used for deriving DRVs for copper for
children.
5.4. Indicators of copper requirement in pregnancy and lactation
McCance and Widdowson (1951) reported that the copper content of a human fetus at term is
4.7 mg/kg fat free mass. A total value of about 16 mg in the placenta and fetus was reported (Cavell
and Widdowson, 1964). The Panel considers that the accretion rate is not linear, with most of the
accumulation occurring in the last trimester of pregnancy. There are no data on changes in absorption
in pregnant women, but, in mice, the increase in copper levels in the fetus is not matched by a
comparable increase in percentage absorption (McArdle and Erlich, 1991). However, given the total
accretion and the time of gestation, an approximate increment of about 0.2 mg/day in the last trimester
(16 mg/93 days) can be estimated.
There are very limited data describing how the body adapts to pregnancy and its requirements. Some
early studies suggested that maternal copper deficiency does not alter serum copper concentrations in
the fetus or placenta, but how this is mediated is not known. In rats, maternal copper deficiency is not
Dietary Reference Values for copper
EFSA Journal 2015;13(10):4253 26
associated with alteration in expression in the genes for copper transport and metabolism (Andersen et
al., 2007). There is no information on what changes, if any, occur in humans.
5.5. Copper intake and health consequences
A comprehensive search of the literature published between January 1990 and February 2012 was
performed as preparatory work to identify relevant health outcomes on which DRVs for copper may
be based (Bost et al., 2012). Additional literature searches were performed until April 2015.
5.5.1. Cardiovascular disease-related outcomes
Copper deficiency diseases such as Menkes disease, although primarily neurological, are also
associated with an increased risk of cardiovascular disease (Tumer and Moller, 2010). An increased
occurrence of ventricular premature discharges during copper depletion has been reported in two trials
in postmenopausal women (Milne and Nielsen, 1996; Milne et al., 2001). In the first trial, 13 women
underwent an equilibration period with 1.37 mg copper/day for 35 days, followed by a deprivation
period with 0.57 mg copper/day for 105 days and a repletion period with 2 mg copper/day for 35 days.
In three women, a significant increase in the number of ventricular premature discharges was observed
after 21, 63 and 91 days on the diet providing 0.57 mg copper/day. However, the authors do not
provide any information regarding the results of the electrocardiogram or the extent of the increase in
premature ventricular discharges. No significant increase was observed for the other women
consuming the diet with 0.57 mg copper/day (Milne and Nielsen, 1996). In the 2001 study, 3 women
out of 12 on a diet providing 1 mg copper/day during a 90-day period exhibited abnormal
electrocardiographic recording (premature ventricular discharge) requiring copper supplementation
before the end of the study. However, two of these women still exhibited an increased number of
abnormal premature ventricular discharges after copper supplementation with 3 mg/day (the duration
of copper supplementation is not specified). After the study, it was noted that these two women had
very high zinc levels from the cement they were using for their dentures. Their data were not included
in the final paper. Moreover, none of the women receiving 3 mg copper/day showed significant
changes in the electrocardiograms (Milne et al., 2001). The Panel notes the absence of information
regarding blinding and randomisation, and the enrolment of some subjects with specific health
conditions. The Panel considers that no conclusions can be drawn from these studies on whether or not
cardiac arrhythmia may be a result of copper deficiency.
The results of heart rate monitoring are also reported in a third study examining the effect of copper
depletion in 11 young men (Turnlund et al., 1997). In this study, no difference was observed in the
occurrence of ventricular premature discharges and supraventricular ectopic beats between the
adaptation (0.66 mg/day for 24 days), depletion (0.38 mg/day for 42 days) and repletion (2.49 mg/day
for 24 days) periods.
In an RCT in 16 women aged 21–28 years, Bugel et al. (2005) examined cardiovascular risk factors
following copper supplementation with 0, 3 or 6 mg/day in a cross-over design of three 4-week
periods with three weeks of washout in between. The copper content of the habitual diet of the women
was not assessed. Supplementation with 3 and 6 mg/day increased serum copper concentration and
erythrocyte SOD activity, but some biomarkers associated with cardiovascular disease (low-density
lipoprotein (LDL)-, high-density lipoprotein (HDL)- and very low-density lipoprotein (VLDL)-
cholesterol, triacylglycerol, lipoprotein(a), Apo A-1, Apo B and various haemostatic factors associated
with thrombosis) were not altered, although there was a decrease in fibrolytic enzyme activity.
The Panel considers that the evidence on copper intake and cardiac arrhythmia and on copper intake
and biomarkers associated with cardiovascular disease cannot be used for setting DRVs for copper.
5.5.2. Cancer
The World Cancer Research Fund considered the role of micronutrients in cancer development. It was
suggested that copper status might play a role in the development of cancers with an immune function
Dietary Reference Values for copper
EFSA Journal 2015;13(10):4253 27
origin, but that the evidence for such a link was very limited. It was also considered that there was no
evidence for an association between copper intake/status and lung cancer (WCRF/AICR, 2007).
Two prospective cohort studies and one case–control study assessed the association between copper
intake/status and the risk of several types of cancer. Mahabir et al. (2010) showed no association
between total (dietary and supplemental) copper intake and lung cancer risk in a cohort study with a
mean follow-up of seven years and including 482 875 subjects (7 052 cases) in the USA. Subjects
were mostly white (91 %), 60 % were men, 49 % were former smokers, 12 % were current smokers
and 36 % never smoked (smoking status was unknown for 3 % of the subjects). Thompson et al.
(2010) did not observe an association between total copper intake or that from diet or supplements
only and the risk of non-Hodgkin’s lymphoma, diffuse large B-cell lymphoma or follicular lymphoma
in a cohort study with a follow-up of 20 years and including 35 159 women (415 cases).
Senesse et al. (2004) studied the association between copper intake and colorectal cancer. A total of
171 colorectal cancer cases (109 males, 62 females) were compared with 309 (159 males, 150
females) controls and there was an increased risk of colorectal cancer in the fourth quartile of copper
intake (odds ratio 2.4, 95 % confidence interval (CI) 1.3–4.6, P < 0.01) compared with the first
quartile.
The Panel considers that there is very limited evidence for an association between copper intake and
cancer incidence and that the data cannot be used for setting DRVs for copper.
6. Data on which to base Dietary Reference Values
6.1. Adults
The Panel considers that there are no biomarkers of copper status that are sufficiently robust to be used
to derive requirements for copper (see Section 5.1). The Panel also considers that there are significant
limitations to copper balance studies (Section 5.2), but that they may be used in conjunction with
intake data to inform the setting of DRVs for copper for adults. The Panel proposes to set an AI
(EFSA NDA Panel, 2010), using both observed intakes and the results from balance studies, despite
their limitations.
The range of average copper intakes in eight EU countries is 1.47–1.67 mg/day (midpoint
1.57 mg/day) for men and 1.20–2.07 mg/day for women aged 18 to < 65 years (see Section 3.2 and
Appendices C and D). The Panel notes, however, that the Latvian survey, for which the average intake
was 2.07 mg/day, comprised pregnant women only. Excluding this survey, the range of average
intakes is 1.20–1.44 mg/day (midpoint 1.32 mg/day) for women. For older adults (65 to < 75 years),
the ranges are 1.33–1.67 mg/day (midpoint 1.50 mg/day) for men and 1.20–1.41 mg/day (midpoint
1.31 mg/day) for women. For adults aged 75 years and over, the ranges are 1.27–1.50 mg/day
(midpoint 1.39 mg/day) for men and 1.15–1.37 mg/day (midpoint 1.26 mg/day) for women. The Panel
notes that midpoints of ranges for intake estimates in these age and sex groups are in good agreement
with medians, for the corresponding sex and age groups, of the average intakes estimated per survey.
The Panel notes that there is at present insufficient evidence for considering different DRVs according
to age in adults, and decided to merge the ranges for all men aged 18 years and older (observed mean
copper intakes of 1.27–1.67 mg/day), for which the midpoint is 1.47 mg/day. Similarly, for women,
the merged range for all women aged 18 years and older is 1.15–1.44 mg/day (excluding Latvian
pregnant women), with a midpoint at 1.30 mg/day. The median of average intakes of adult women
(≥ 18 years, excluding Latvian pregnant women) is 1.29 mg/day, and the median of average intakes of
adult men (≥ 18 years) is 1.52 mg/day.
Given these differences in intake, the Panel proposes to set AIs for men and women separately. For
men, based on observed intakes and taking into account that zero copper balance was reported at a
copper intake of approximately 1.6 mg/day in men (Harvey et al., 2003; Turnlund et al., 2005), the

Dietary Reference Values for copper
EFSA Journal 2015;13(10):4253 28
Panel proposes an AI of 1.6 mg/day. For women, based on observed intakes, the Panel proposes an AI
of 1.3 mg/day.
6.2. Infants aged 7–11 months
Considering a mean copper concentration in breast milk of 0.35 mg/L and a volume of milk intake
during the first six months of life in exclusively breast-fed infants of 0.8 L/day (Butte et al., 2002;
FAO/WHO/UNU, 2004; EFSA NDA Panel, 2009), it can be estimated that the copper intake of infants
aged 0–6 months is 0.28 mg/day. In order to estimate the copper intake of infants aged 7–11 months
from the calculated copper intake in infants from birth to six months, allometric scaling may be
applied on the assumption that copper requirement is related to metabolically active body mass. Using
averages of the median weight-for-age of male and female infants aged three months (6.1 kg) and nine
months (8.6 kg) according to the WHO Growth Standards (WHO Multicentre Growth Reference
Study Group, 2006), a value of 0.36 mg/day was calculated.
Average copper intakes of infants in four surveys in the EU ranged between 0.34 and 0.50 mg/day
(Section 3.2 and Appendices C and D). Taking into account the results of upwards extrapolation of
copper intakes in exclusively breast-fed infants, the Panel proposes an AI for infants aged 7–11
months of 0.4 mg/day.
6.3. Children
As for adults, the Panel proposes to set AIs based on observed intakes in EU countries.
In young children (1 to < 3 years), mean observed copper intakes from five surveys in four EU
countries range from 0.60 to 0.86 mg/day in boys and from 0.57 to 0.94 mg/day in girls (Appendices C
and D). The Panel notes, however, that for both sexes the upper value is derived from the Italian
survey with very few children (20 boys and 16 girls). Excluding this survey, the ranges of mean
intakes are 0.60–0.79 mg/day (midpoint 0.70 mg/day) in boys and 0.57–0.73 mg/day (midpoint
0.65 mg/day) in girls. For boys and girls aged 1 to < 3 years, considering the absence of a strong basis
for a distinct value according to sex and the distribution of observed mean intakes, the Panel selects
the midpoint of average intakes and sets an AI of 0.7 mg/day for boys and girls.
In children aged 3 to < 10 years, mean observed copper intakes from seven surveys in six EU
countries range from 0.92 to 1.44 mg/day (midpoint 1.18 mg/day) in boys and from 0.82 to
1.30 mg/day (midpoint 1.06 mg/day) in girls (Appendices C and D). It was considered unnecessary to
derive a distinct value according to sex. The median of average intakes of both sexes combined is
0.98 mg/day. For boys and girls aged 3 to < 10 years, considering the distribution of the observed
mean intakes, the Panel sets an AI of 1.0 mg/day.
In children aged 10 to < 18 years, mean observed copper intakes from seven surveys in seven EU
countries range from 1.16 to 1.59 mg/day (midpoint 1.38 mg/day) in boys and from 0.98 to
1.92 mg/day in girls (Appendices C and D). However, the Panel notes that the data provided for Latvia
include pregnant girls below 18 years of age and are rather high compared with other datasets;
excluding Latvian pregnant girls provides a narrower range of 0.98–1.41 mg/day (midpoint
1.20 mg/day). The median of average intakes of girls aged 10 to < 18 years (excluding Latvian
pregnant girls) is 1.12 mg/day, and the median of average intakes of boys aged 10 to < 18 years is
1.32 mg/day. Considering the rather large differences in copper intakes between boys and girls aged
10 to < 18 years, the Panel proposes that AIs be set according to sex. For boys aged 10 to < 18 years,
considering the distribution of the observed average intakes, the Panel sets an AI of 1.3 mg/day. For
girls aged 10 to < 18 years, considering the distribution of the observed average intakes, the Panel sets
an AI of 1.1 mg/day.
6.4. Pregnancy
The Panel accepts that a total quantity of 16 mg of copper is accumulated in the fetus and the placenta
over the course of pregnancy (Section 5.4). To allow for the extra need related to the growth of

Dietary Reference Values for copper
EFSA Journal 2015;13(10):4253 29
maternal tissues and fetal and placental requirements, and given the limited information on what
adaptive changes may occur during pregnancy, the Panel proposes an additional requirement of
0.06 mg/day (16 mg/280 days) to the whole period of pregnancy.
Considering that about 50 % of ingested copper is absorbed, and in anticipation of copper
requirements for lactation, the Panel proposes that the AI of non-pregnant women be increased by
0.2 mg/day during pregnancy.
6.5. Lactation
During the first six months of lactation, the Panel notes that available data indicate that copper
concentrations in mature breast milk of populations from Western countries are variable and range
between about 0.1 and 1.0 mg/L, decreasing as lactation proceeds. Based on a mean milk transfer of
0.8 L/day (Butte et al., 2002; FAO/WHO/UNU, 2004; EFSA NDA Panel, 2009) during the first six
months of lactation in exclusively breastfeeding women and a concentration of copper in breast milk
of 0.35 mg/L (mean value over time), a loss of 0.28 mg/day of copper in breast milk is estimated
during the first six months of lactation.
Taking into account that absorption of copper is about 50 %, an increment of 0.56 mg/day would be
required to compensate for these losses. The Panel assumes that this can be mitigated in part by the
increased AI in pregnancy. Thus, the Panel proposes that the AI of non-pregnant women be increased
by 0.2 mg/day during lactation.
CONCLUSIONS
The Panel concludes that ARs and PRIs for copper cannot be derived for adults, infants and children,
and proposes AIs. For adults, this approach considers the range of average copper intakes estimated
from dietary surveys in eight EU countries and the results of some balance studies. For infants aged 7–
11 months and children, the Panel proposes AIs after considering observed intakes and taking into
account, for infants aged 7–11 months, upwards extrapolation from the estimated copper intakes of
breast-fed infants aged 0–6 months. The Panel considers it appropriate to increase the AI for pregnant
women to cover the amount of copper deposited in the fetus and placenta over the course of pregnancy
and in anticipation of the needs for lactation. For lactating women the same increment is estimated to
compensate for copper losses in breast milk.
Table 6: Summary of Adequate Intakes for copper
Age Adequate Intake (mg/day)
Males Females
7–11 months 0.4 0.4
1–< 3 years 0.7 0.7
3–< 10 years 1.0 1.0
10–< 18 years 1.3 1.1
≥ 18 years 1.6 1.3
Pregnancy 1.5
Lactation 1.5
RECOMMENDATIONS FOR RESEARCH
The Panel notes that there is a need for research to identify sensitive and specific markers of copper
status; this would also allow the prevalence, symptoms and consequences of marginal copper
deficiency in European populations to be determined with greater precision and sensitivity.
The Panel suggests that there is a need to investigate copper intake and status in populations at an
increased risk of copper deficiency, such as older adults and women of reproductive age.

Dietary Reference Values for copper
EFSA Journal 2015;13(10):4253 30
The Panel acknowledges that there is a need for research to understand factors influencing copper
bioavailability.
The Panel suggests that more research is needed to understand copper metabolism, especially in
relation to homeostatic adaptations in pregnancy and lactation.
REFERENCES
Afssa (Agence française de sécurité sanitaire des aliments), 2001. Apports nutritionnels conseillés
pour la population française. Editions Tec&Doc, Paris, France, 605 pp.
Afssa (Agence française de sécurité sanitaire des aliments), 2009. Étude Individuelle Nationale des
Consommations Alimentaires 2 (INCA 2) (2006-2007). Rapport. 228 pp.
Alexander F, Clayton BE and Delves HT, 1974. Mineral and trace-metal balances in children
receiving normal and synthetic diets. Quarterly Journal of Medicine, 43, 89-111.
Andersen HS, Gambling L, Holtrop G and McArdle HJ, 2007. Effect of dietary copper deficiency on
iron metabolism in the pregnant rat. British Journal of Nutrition, 97, 239-246.
Araya M, Olivares M, Pizarro F, Gonzalez M, Speisky H and Uauy R, 2003. Gastrointestinal
symptoms and blood indicators of copper load in apparently healthy adults undergoing controlled
copper exposure. American Journal of Clinical Nutrition, 77, 646-650.
Araya M, Gutierrez L and Arredondo M, 2014. CCS mRNA transcripts and serum CCS protein as
copper marker in adults suffering inflammatory processes. Biometals, 27, 645-652.
Aruoma A, Reilly T, MacLaren D and Halliwell B, 1988. Iron, copper and zinc concentrations in
human sweat and plasma; the effect of exercise. Clinica Chimica Acta, 177, 81-88.
Baer JD, Fong AKH, Novotny JA and Oexmann MJ, 1999. Compartmental modeling, stable isotopes,
and balance studies. In: Well-controlled diet studies in humans: A practical guide to design and
management. Eds Dennis BH, Ershow AG, Obarzanek E and Clevidence BA. American Dietetic
Association, Chicago, IL, USA, 238-254.
Baker A, Harvey L, Majask-Newman G, Fairweather-Tait S, Flynn A and Cashman K, 1999a. Effect
of dietary copper intakes on biochemical markers of bone metabolism in healthy adult males.
European Journal of Clinical Nutrition, 53, 408-412.
Baker A, Turley E, Bonham MP, O'Conner JM, Strain JJ, Flynn A and Cashman KD, 1999b. No effect
of copper supplementation on biochemical markers of bone metabolism in healthy adults. British
Journal of Nutrition, 82, 283-290.
Baker LB, Stofan JR, Lukaski HC and Horswill CA, 2011. Exercise-induced trace mineral element
concentration in regional versus whole-body wash-down sweat. International Journal of Sport
Nutrition and Exercise Metabolism, 21, 233-239.
Bates CJ, Hamer M and Mishra GD, 2011. Redox-modulatory vitamins and minerals that
prospectively predict mortality in older British people: the National Diet and Nutrition Survey of
people aged 65 years and over. British Journal of Nutrition, 105, 123-132.
Beattie JH, Reid MD, Harvey LJ, Dainty JR, Majsak-Newman G and Fairweather-Tait SJ, 2001.
Selective extraction of blood plasma exchangeable copper for isotope studies of copper absorption.
Analyst, 126, 2225-2229.
Bjorklund KL, Vahter M, Palm B, Grander M, Lignell S and Berglund M, 2012. Metals and trace
element concentrations in breast milk of first time healthy mothers: a biological monitoring study.
Environmental Health, 11, 92.
Bloomer LC and Lee GR, 1978. Normal copper metabolism. In: Metals and the liver. Ed Powell LW.
Marcel Dekker, New York, NY, USA, 179-239.

Dietary Reference Values for copper
EFSA Journal 2015;13(10):4253 31
Bonham M, O'Connor JM, Hannigan BM and Strain JJ, 2002. The immune system as a physiological
indicator of marginal copper status? British Journal of Nutrition, 87, 393-403.
Bost M, Houdart S, Huneau JF, Kalonji E, Margaritis I and Oberli M, 2012. Literature search and
review related to specific preparatory work in the establishment of Dietary References Values for
Copper (Lot 3). Project developed on the procurement project CT/EFSA/NUTRI/2011/01. EFSA
Supporting publication 2012:EN-302, 63 pp.
Bousquet-Moore D, Prohaska JR, Nillni E, Czyzyk T, Wetsel W, Mains RE and Eipper BA, 2010.
Interactions of peptide amidation and copper: novel biomarkers and mechanisms of neural
dysfunction. Neurobiology of Disease, 37, 130-140.
Brewer GJ, Dick RD, Johnson VD, Brunberg JA, Kluin KJ and Fink JK, 1998. Treatment of Wilson's
disease with zinc: XV long-term follow-up studies. Journal of Laboratory and Clinical Medicine,
132, 264-278.
Brown KH, Engle-Stone R, Krebs NF and Peerson JM, 2009. Dietary intervention strategies to
enhance zinc nutrition: promotion and support of breastfeeding for infants and young children.
Food and Nutrition Bulletin, 30, S144-171.
Bucossi S, Polimanti R, Mariani S, Ventriglia M, Bonvicini C, Migliore S, Manfelliotto D, Salustri G,
Vernieri F, Rossini PM and Squitti R, 2012. Association of K832R and R952K SNPs of Wilson's
disease gene with Alzheimer's disease. Journal of Alzheimer's Disease, 29, 913-919.
Bugel S, Harper A, Rock E, O'Connor JM, Bonham MP and Strain JJ, 2005. Effect of copper
supplementation on indices of copper status and certain CVD risk markers in young healthy
women. British Journal of Nutrition, 94, 231-236.
Butte NF, Lopez-Alarcon MG and Garza C, 2002. Nutrient adequacy of exclusive breastfeeding for
the term infant during the first six months of life. World Health Organization, 47 pp.
Casey CE, Neville MC and Hambidge KM, 1989. Studies in human lactation: secretion of zinc,
copper, and manganese in human milk. American Journal of Clinical Nutrition, 49, 773-785.
Cavell PA and Widdowson EM, 1964. Intakes and excretions of iron, copper, and zinc in the neonatal
period. Archives of Disease in Childhood, 39, 496-501.
Chaignon V, Sanchez-Neira I, Herrmann P, Jaillard B and Hinsinger P, 2003. Copper bioavailability
and extractability as related to chemical properties of contaminated soils from a vine-growing area.
Environmental Pollution, 123, 229-238.
Chinevere TD, Kenefick RW, Cheuvront SN, Lukaski HC and Sawka MN, 2008. Effect of heat
acclimation on sweat minerals. Medicine and Science in Sports and Exercise, 40, 886-891.
D-A-CH (Deutsche Gesellschaft für Ernährung, Österreichische Gesellschaft für Ernährung,
Schweizerische Gesellschaft für Ernährung), 2015. Referenzwerte für die Nährstoffzufuhr. 2.
Auflage, 1. Ausgabe.
Danks DM, Campbell PE, Stevens BJ, Mayne V and Cartwright E, 1972. Menkes's kinky hair
syndrome. An inherited defect in copper absorption with widespread effects. Pediatrics, 50, 188-
201.
Danks DM, 1988. Copper deficiency in humans. Annual Review of Nutrition, 8, 235-257.
Davis CD, Milne DB and Nielsen FH, 2000. Changes in dietary zinc and copper affect zinc-status
indicators of postmenopausal women, notably, extracellular superoxide dismutase and amyloid
precursor proteins. American Journal of Clinical Nutrition, 71, 781-788.
Davis CD, 2003. Low dietary copper increases fecal free radical production, fecal water alkaline
phosphatase activity and cytotoxicity in healthy men. Journal of Nutrition, 133, 522-527.
de Romana DL, Olivares M, Uauy R and Araya M, 2011. Risks and benefits of copper in light of new
insights of copper homeostasis. Journal of Trace Elements in Medicine and Biology, 25, 3-13.

Dietary Reference Values for copper
EFSA Journal 2015;13(10):4253 32
Deosthale YG and Gopalan C, 1974. The effect of molybdenum levels in sorghum (Sorghum vulgare
Pers.) on uric acid and copper excretion in man. British Journal of Nutrition, 31, 351-355.
DH (Department of Health), 1991. Dietary reference values for food energy and nutrients for the
United Kingdom. Report of the Panel on Dietary Reference Values of the Committee on Medical
Aspects of Food Policy. HMSO, London, UK, 212 pp.
Domellof M, Lönnerdal B, Dewey KG, Cohen RJ and Hernell O, 2004. Iron, zinc, and copper
concentrations in breast milk are independent of maternal mineral status. American Journal of
Clinical Nutrition, 79, 111-115.
Donangelo C, Trugo N and Dorea J, 1993. Hepatic reserves of iron, copper and vitamin B12 in
Brazilian fetuses and infants of different socioeconomic status. Nutrition, 9, 430.
Dorea JG, Brito M and Araujo MO, 1987. Concentration of copper and zinc in liver of fetuses and
infants. Journal of the American College of Nutrition, 6, 491-495.
Dorea JG, 2000. Iron and copper in human milk. Nutrition, 16, 209-220.
Dörner K, Dziadzka S, Hohn A, Sievers E, Oldigs HD, Schulz-Lell G and Schaub J, 1989.
Longitudinal manganese and copper balances in young infants and preterm infants fed on breast-
milk and adapted cow's milk formulas. British Journal of Nutrition, 61, 559-572.
EFSA (European Food Safety Authority), 2011a. Report on the development of a food classification
and description system for exposure assessment and guidance on its implementation and use. EFSA
Journal 2011;9(12):2489, 84 pp. doi:10.2903/j.efsa.2011.2489
EFSA (European Food Safety Authority), 2011b. Use of the EFSA Comprehensive European Food
Consumption Database in exposure assessment. EFSA Journal 2011;9(3):2097, 34 pp.
doi:10.2903/j.efsa.2011.2097
EFSA NDA Panel (EFSA Panel on Dietetic Products, Nutrition and Allergies), 2009. Scientific
Opinion on the appropriate age for introduction of complementary feeding of infants. EFSA
Journal 2009;7(12):1423, 38 pp. doi:10.2903/j.efsa.2009.1423
EFSA NDA Panel (EFSA Panel on Dietetic Products, Nutrition and Allergies), 2010. Scientific
Opinion on principles for deriving and applying Dietary Reference Values. EFSA Journal
2010;8(3):1458, 30 pp. doi:10.2903/j.efsa.2010.1458
EFSA NDA Panel (EFSA Panel on Dietetic Products, Nutrition and Allergies), 2013. Scientific
Opinion on nutrient requirements and dietary intakes of infants and young children in the European
Union. EFSA Journal 2013;11(10):3408, 103 pp. doi:10.2903/j.efsa.2013.3408
Ely MR, Kenefick RW, Cheuvront SN, Chinevere T, Lacher CP, Lukaski HC and Montain SJ, 2013.
The effect of heat acclimation on sweat microminerals: artifact of surface contamination.
International Journal of Sport Nutrition and Exercise Metabolism, 23, 470-479.
Engel RW, Price NO and Miller RF, 1967. Copper, manganese, cobalt, and molybdenum balance in
pre-adolescent girls. Journal of Nutrition, 92, 197-204.
FAO/WHO/UNU (Food and Agriculture Organization of the United Nations/World Health
Organization/United Nations University), 2004. Human energy requirements. Report of a Joint
FAO/WHO/UNU Expert Consultation. Rome, Italy, 17-24 October 2001. FAO Food and Nutrition
Technical Report Series, 103 pp.
Feeley RM, Eitenmiller RR, Jones JB, Jr. and Barnhart H, 1983. Copper, iron, and zinc contents of
human milk at early stages of lactation. American Journal of Clinical Nutrition, 37, 443-448.
Fox PL, 2003. The copper-iron chronicles: the story of an intimate relationship. Biometals, 16, 9-40.
Freestone D, Cater MA, Ackland ML, Paterson D, Howard DL, de Jonge MD and Michalczyk A,
2014. Copper and lactational hormones influence the CTR1 copper transporter in PMC42-LA
mammary epithelial cell culture models. The Journal of Nutritional Biochemistry, 25, 377-387.
Dietary Reference Values for copper
EFSA Journal 2015;13(10):4253 33
Gambling L, Andersen HS and McArdle HJ, 2008. Iron and copper, and their interactions during
development. Biochemical Society Transactions, 36, 1258-1261.
Ginocchio R, Rodriguez PH, Badilla-Ohlbaum R, Allen HE and Lagos GE, 2002. Effect of soil copper
content and pH on copper uptake of selected vegetables grown under controlled conditions.
Environmental Toxicology and Chemistry, 21, 1736-1744.
Gulson BL, Mizon KJ, Korsch MJ, Mahaffey KR and Taylor AJ, 2001. Dietary intakes of selected
elements from longitudinal 6-day duplicate diets for pregnant and nonpregnant subjects and
elemental concentrations of breast milk and infant formula. Environmental Research, 87, 160-174.
Gurusamy K and Davidson BR, 2007. Trace element composition in metastatic liver disease: a
systematic review. Journal of Trace Elements in Medicine and Biology, 21, 169-177.
Hannan MA, Dogadkin NN, Ashur IA and Markus WM, 2005. Copper, selenium, and zinc
concentrations in human milk during the first three weeks of lactation. Biological Trace Element
Research, 107, 11-20.
Hardman B, Manuelpillai U, Wallace EM, van de Waasenburg S, Cater M, Mercer JF and Ackland
ML, 2004. Expression and localization of Menkes and Wilson copper transporting ATPases in
human placenta. Placenta, 25, 512-517.
Hardman B, Manuelpillai U, Wallace EM, Monty JF, Kramer DR, Kuo YM, Mercer JF and Ackland
ML, 2006. Expression, localisation and hormone regulation of the human copper transporter
hCTR1 in placenta and choriocarcinoma Jeg-3 cells. Placenta, 27, 968-977.
Hardman B, Michalczyk A, Greenough M, Camakaris J, Mercer JF and Ackland ML, 2007. Hormonal
regulation of the Menkes and Wilson copper-transporting ATPases in human placental Jeg-3 cells.
Biochemical Journal, 402, 241-250.
Harris ZL, Klomp LW and Gitlin JD, 1998. Aceruloplasminemia: an inherited neurodegenerative
disease with impairment of iron homeostasis. American Journal of Clinical Nutrition, 67, 972S-
977S.
Hartley TF, Dawson JB and Hodgkinson A, 1974. Simultaneous measurement of Na, K, Ca, Mg, Cu
and Zn balances in man. Clinica Chimica Acta, 52, 321-333.
Harvey LJ, Majsak-Newman G, Dainty JR, Lewis DJ, Langford NJ, Crews HM and Fairweather-Tait
SJ, 2003. Adaptive responses in men fed low- and high-copper diets. British Journal of Nutrition,
90, 161-168.
Harvey LJ, Dainty JR, Hollands WJ, Bull VJ, Beattie JH, Venelinov TI, Hoogewerff JA, Davies IM
and Fairweather-Tait SJ, 2005. Use of mathematical modeling to study copper metabolism in
humans. American Journal of Clinical Nutrition, 81, 807-813.
Harvey LJ and McArdle HJ, 2008. Biomarkers of copper status: a brief update. British Journal of
Nutrition, 99 Suppl 3, S10-13.
Harvey LJ, Ashton K, Hooper L, Casgrain A and Fairweather-Tait SJ, 2009. Methods of assessment of
copper status in humans: a systematic review. American Journal of Clinical Nutrition, 89, 2009S-
2024S.
Hedera P, Peltier A, Fink JK, Wilcock S, London Z and Brewer GJ, 2009. Myelopolyneuropathy and
pancytopenia due to copper deficiency and high zinc levels of unknown origin II. The denture
cream is a primary source of excessive zinc. Neurotoxicology, 30, 996-999.
Helldán A, Raulio S, Kosola M, Tapanainen H, Ovaskainen ML and Virtanen S, 2013. Finravinto
2012 - tutkimus - The National FINDIET 2012 Survey. THL. Raportti 16/2013, 217 pp.
Hellman NE and Gitlin JD, 2002. Ceruloplasmin metabolism and function. Annual Review of
Nutrition, 22, 439-458.
Dietary Reference Values for copper
EFSA Journal 2015;13(10):4253 34
Hibberd CM, Brooke OG, Carter ND, Haug M and Harzer G, 1982. Variation in the composition of
breast milk during the first 5 weeks of lactation: implications for the feeding of preterm infants.
Archives of Disease in Childhood, 57, 658-662.
Hilton M, Spenser DC, Ross P, Ramsey A and McArdle HJ, 1995. Characterisation of the copper
uptake mechanism and isolation of the ceruloplasmin receptor/copper transporter in human
placental vesicles. Biochimica et Biophysica Acta, 1245, 153-160.
Hoppu U, Lehtisalo J, Tapanainen H and Pietinen P, 2010. Dietary habits and nutrient intake of
Finnish adolescents. Public Health Nutrition, 13, 965-972.
Hunt JR, Matthys LA and K JL, 1998. Zinc absorption, mineral balance, and blood lipids in women
consuming controlled lactoovovegetarian and omnivorous diets for 8 wk. American Journal of
Clinical Nutrition, 67, 421-430.
Hunt JR and Vanderpool RA, 2001. Apparent copper absorption from a vegeterian diet. American
Journal of Clinical Nutrition, 74, 803-807.
Institute of Genetic Medicine, Johns Hopkins Medicine and National Human Genome Research
Institute, 2015. Online Mendelian Inheritance in Man. An online catalog of human genes and
genetic disorders. ATPase, Cu(2+)-Transporting, Beta Polypeptide; ATP7B. Johns Hopkins
University. Accessed on 23 September 2015. Available online: http://omim.org/entry/606882
IOM (Institute of Medicine), 2001. Dietary Reference Intakes for vitamin A, vitamin K, arsenic,
boron, chromium, copper, iodine, iron, manganese, molybdenum, nickel, silicon, vanadium, and
zinc. Food and Nutrition Board. National Academy Press, Washington, DC, USA, 797 pp.
IUNA (Irish Universities Nutrition Alliance), 2011. National Adult Nutrition Survey. Summary Report
March 2011, 37 pp.
Jacob RA, Sandstead HH, Munoz JM, Klevay LM and Milne DB, 1981. Whole body surface loss of
trace metals in normal males. American Journal of Clinical Nutrition, 34, 1379-1383.
Kaler SG, Das S, Levinson B, Goldstein DS, Holmes CS, Patronas NJ and Packman S, 1996.
Successful early copper therapy in Menkes disease associated with a mutant transcript containing a
small in-frame deletion. Biochemical and Molecular Medicine, 57, 37-46.
Kaler SG, 1998. Diagnosis and therapy of Menkes syndrome, a genetic form of copper deficiency.
American Journal of Clinical Nutrition, 67, 1029S-1034S.
Kaler SG, 2014. Neurodevelopment and brain growth in classic Menkes disease is influenced by age
and symptomatology at initiation of copper treatment. Journal of Trace Elements in Medicine and
Biology, 28, 427-430.
Kehoe CA, Turley E, Bonham MP, O'Conner JM, McKeown A, Faughnan MS and Coulter JA, 2000.
Responses of putative indices of copper status to copper supplementation in human volunteers.
British Journal of Nutrition, 84, 151-156.
Kelleher SL and Lönnerdal B, 2006. Mammary gland copper transport is stimulated by prolactin
through alterations in Ctr1 and ATP7A localization. American Journal of Physiology, 291, R1181-
R1191.
Kelley DS, Daudu PA, Taylor PC, Mackey BE and Turnlund JR, 1995. Effects of low-copper diets on
human immune response. American Journal of Clinical Nutrition, 62, 412-416.
Kersting M and Clausen K, 2003. Ernährungsphysiologische Auswertung einer repräsentativen
Verzehrsstudie bei Säuglingen und Kleinkindern VELS mit dem Instrumentarium der DONALD
Studie. Forschungsinstitut für Kinderernährung, Dortmund, Germany, 103 pp.
Kessler H, Pajonk FG, Bach D, Schneider-Axmann T, Falkai P, Herrmann W, Multhaup G, Wiltfang
J, Schafer S, Wirths O and Bayer TA, 2008. Effect of copper intake on CSF parameters in patients
with mild Alzheimer's disease: a pilot phase 2 clinical trial. Journal of Neural Transmission, 115,
1651-1659.

Dietary Reference Values for copper
EFSA Journal 2015;13(10):4253 35
Klevay L, 2000. Cardiovascular disease from copper deficiency - a history. Journal of Nutrition, 130,
489S-492S.
Klevay LM, Reck SJ, Jacob RA, Logan GM, Jr., Munoz JM and Sandstead HH, 1980. The human
requirement for copper. I. Healthy men fed conventional, American diets. American Journal of
Clinical Nutrition, 33, 45-50.
Ladefoged O and Sturup S, 1995. Copper deficiency in cattle, sheep, and horses caused by excess
molybdenum from fly ash: a case report. Veterinary and Human Toxicology, 37, 63-65.
LASER Analytica, 2014. Comprehensive literature search and review of breast milk composition as
preparatory work for the setting of dietary reference values for vitamins and minerals. Project
developed on the procurement project RC/EFSA/NUTRI/2013/06 – OC/EFSA/SAS/2012/01.
EFSA Supporting publication 2014:EN-629, 154 pp.
Lenartowicz M, Kennedy C, Hayes H and McArdle HJ, 2014. Transcriptional regulation of copper
metabolism genes in the liver of fetal and neonatal control and iron-deficient rats. Biometals, 15,
51-59.
Leotsinidis M, Alexopoulos A and Kostopoulou-Farri E, 2005. Toxic and essential trace elements in
human milk from Greek lactating women: association with dietary habits and other factors.
Chemosphere, 61, 238-247.
Lönnerdal B, 1998. Copper nutrition during infancy and childhood. American Journal of Clinical
Nutrition, 67, 1046S-1053S.
Lowy SL, Fisler JS, Drenick EJ, Hunt IF and Swendseid ME, 1986. Zinc and copper nutriture in obese
men receiving very low calorie diets of soy or collagen protein. American Journal of Clinical
Nutrition, 43, 272-287.
Lukasewycz OA and Prohaska JR, 1990. The immune response in copper deficiency. Annals of the
New York Academy of Sciences, 587, 997-1006.
Lukaski HC, Klevay LM and Milne DB, 1988. Effects of dietary copper on human autonomic
cardiovascular function. European Journal of Applied Physiology and Occupational Physiology,
58, 74-80.
Mahabir S, Forman MR, Dong YQ, Park Y, Hollenbeck A and Schatzkin A, 2010. Mineral intake and
lung cancer risk in the NIH-American Association of Retired Persons Diet and Health study.
Cancer Epidemiology, Biomarkers & Prevention, 19, 1976-1983.
McArdle HJ and Erlich R, 1991. Copper uptake and transfer to the mouse fetus during pregnancy.
Journal of Nutrition, 121, 208-214.
McArdle HJ, 1995. The metabolism of copper during pregnancy - a review. Food Chemistry, 54, 79-
84.
McCance RA and Widdowson EM, 1951. Composition of the body. British Medical Bulletin, 7, 297-
306.
Meinel B, Bode J, Koenig W and Richter F, 1979. Contents of trace elements in the human liver
before birth. Biology of the Neonate, 36, 225-232.
Mensink GB, Heseker H, Richter A, Stahl A and Vohmann C, 2007. Ernährungsstudie als KIGGS-
Modul (EsKiMo). 143 pp.
Mercer JFB, Livingston J, Hall B, Paynter JA, Begy C, Chandrasekharappa S, Lockhart P, Grimes A
and Bhave M, 1993. Isolation of a partial candidate gene for Menkes disease by positional cloning.
Nature Genetics, 3, 20-25.
Mertz W, 1987. Use and misuse of balance studies. Journal of Nutrition, 117, 1811-1813.
Miller CA, 1987. Study of the influences on mineral homeostasis in infants fed synthetic milk
formulae. PhD Thesis, Aberdeen University Medical School, Aberdeen, UK.

Dietary Reference Values for copper
EFSA Journal 2015;13(10):4253 36
Milne DB, Johnson PE, Klevay LM and Sandstead HH, 1990. Effect of copper intake on balance,
absorption, and status indices of copper in men. Nutrition Research, 10, 975-986.
Milne DB and Gallagher SK, 1991. Effect of dietary copper on platelet volume and aggregation in
men. FASEB Journal, 5, A1076-A1076.
Milne DB and Nielsen FH, 1996. Effects of a diet low in copper on copper-status indicators in
postmenopausal women. American Journal of Clinical Nutrition, 63, 358-364.
Milne DB, Davis CD and Nielsen FH, 2001. Low dietary zinc alters indices of copper function and
status in postmenopausal women. Nutrition, 17, 701-708.
Muller T, Muller W and Feichtinger H, 1998. Idiopathic copper toxicosis. American Journal of
Clinical Nutrition, 67, 1082S-1086S.
Nakamori M, Ninh NX, Isomura H, Yoshiike N, Hien VT, Nhug BT, Nhien NV, Nakano T, Khan NC
and Yamamoto S, 2009. Nutritional status of lactating mothers and their breast milk concentration
of iron, zinc and copper in rural Vietnam. Journal of Nutritional Science and Vitaminology, 55,
338-345.
National Research Council (US) Committee on Copper in Drinking Water, 2000. Copper in drinking
water. National Academies Press, Washington, DC, USA, 162 pp.
Nayak NC and Chitale AR, 2013. Indian Childhood Cirrhosis (ICC) and ICC-like diseases: The
changing scenario of facts versus notions. Indian Journal of Medical Research, 137, 1029-1042.
Nederbragt H, van den Ingh TS and Wensvoort P, 1984. Pathobiology of copper toxicity. Veterinary
Quarterly, 6, 179-185, 235.
Netherlands Food and Nutrition Council, 1992. Recommended Dietary Allowances 1989 in the
Netherlands. 115 pp.
Nordic Council of Ministers, 2014. Nordic Nutrition Recommendations 2012. Integrating nutrition and
physical activity. 5th edition. Copenhagen, Denmark, 627 pp.
O'Connor JM, Bonham MP, Turley E, McKeown A, McKelvey-Martin VJ, Gilmore WS and Strain JJ,
2003. Copper supplementation has no effect on markers of DNA damage and liver function in
healthy adults (FOODCUE project). Annals of Nutrition and Metabolism, 47, 201-206.
Orun E, Yalcin SS, Aykut O, Orhan G and Morgil GK, 2012. Zinc and copper concentrations in
breastmilk at the second month of lactation. Indian Pediatrics, 49, 133-135.
Paul AA, Black AE, Evans J, Cole TJ and Whitehead RG, 1988. Breastmilk intake and growth in
infants from two to ten months. Journal of Human Nutrition and Dietetics, 1, 437-450.
Pettersson R and Rasmussen F, 1999. Daily intake of copper from drinking water among young
children in Sweden. Environmental Health Perspectives, 107, 441-446.
Pratt WB, Omdahl JL and Sorenson JR, 1985. Lack of effects of copper gluconate supplementation.
American Journal of Clinical Nutrition, 42, 681-682.
Price NO, Bunce GE and Engle RW, 1970. Copper, manganese, and zinc balance in preadolescent
girls. American Journal of Clinical Nutrition, 23, 258-260.
Prohaska JR, 1990. Biochemical changes in copper deficiency. Journal of Nutritional Biochemistry, 1,
452-461.
Prohaska JR and Gybina AA, 2004. Intracellular copper transport in mammals. Journal of Nutrition,
134, 1003-1006.
Prohaska JR, 2011. Impact of copper limitation on expression and function of multicopper oxidases
(ferroxidases). Advances in Nutrition, 2, 89-95.
Dietary Reference Values for copper
EFSA Journal 2015;13(10):4253 37
Proud VK, Mussell HG, Kaler SG, Young DW and Percy AK, 1996. Distinctive Menkes disease
variant with occipital horns: delineation of natural history and clinical phenotype. American
Journal of Medical Genetics, 65, 44-51.
Prystai EA, Kies CV and Driskell JA, 1999. Calcium, copper, iron, magnesium, and zinc utilization of
humans as affected by consumption of black, decaffeinated and green teas. Nutrition Research, 19,
167-177.
Reiser S, Smith JC, Jr., Mertz W, Holbrook JT, Scholfield DJ, Powell AS, Canfield WK and Canary
JJ, 1985. Indices of copper status in humans consuming a typical American diet containing either
fructose or starch. American Journal of Clinical Nutrition, 42, 242-251.
Robinson MF, McKenzie JM, Tomson CD and van Rij AL, 1973. Metabolic balance of zinc, copper,
cadmium, iron, molybdenum and selenium in young New Zealand women. British Journal of
Nutrition, 30, 195-205.
Roe MA, Bell S, Oseredczuk M, Christensen T, Westenbrink S, Pakkala H, Presser K and Finglas PM,
2013. Updated food composition database for nutrient intake. Project developed on the
procurement project CFT/EFSA/DCM/2011/03. EFSA Supporting publication 2013:EN-355, 21
pp.
Rosman KJR and Taylor PDP, 1998. Isotopic composition of the elements 1997. Pure and Applied
Chemistry, 20, 217-235.
Sandstead HH, 1982. Copper bioavailability and requirements. American Journal of Clinical Nutrition,
35, 809-814.
Sasina LK, Tsymbalenko NV, Platonova NA, Puchkova LV, Voronina OV, Gyulikhandanova NE and
Gaitskhoki VS, 2000. Isolation and partial characterization of cDNA clone of human ceruloplasmin
receptor. Bulletin of Experimental Biology and Medicine, 129, 578-582.
SCF (Scientific Committee for Food), 1993. Nutrient and energy intakes for the European
Community. Reports of the Scientific Committee for Food, 31st Series. Food - Science and
Technique, European Commission, Luxembourg, 248 pp.
SCF (Scientific Committee on Food), 2002. Opinion of the Scientific Committee on Food on the
Tolerable Upper Intake Level of zinc (expressed on 5 March 2002). SCF/CS/NUT/UPPLEV/62
Final, 18 pp.
SCF (Scientific Committee on Food), 2003. Opinion of the Scientific Committee on Food on the
Tolerable Upper Intake Level of copper. 10 pp.
Schaefer M and Gitlin JD, 1999. Genetic disorders of membrane transport. IV. Wilson's disease and
Menkes disease. American Journal of Physiology, 276, G311-314.
Senesse P, Meance S, Cottet V, Faivre J and Boutron-Ruault MC, 2004. High dietary iron and copper
and risk of colorectal cancer: a case-control study in Burgundy, France. Nutrition and Cancer, 49,
66-71.
Sharp P, 2004. The molecular basis of copper and iron interactions. Proceedings of the Nutrition
Society, 63, 563-569.
Shaw JC, 1980. Trace elements in the fetus and young infant. II. Copper, manganese, selenium, and
chromium. American Journal of Diseases of Children, 134, 74-81.
Shike M, Roulet M, Kurian R, Whitwell J, Stewart S and Jeejeebhoy KN, 1981. Copper metabolism
and requirements in total parenteral nutrition. Gastroenterology, 81, 290-297.
Squitti R, 2012. Copper dysfunction in Alzheimer's disease: from meta-analysis of biochemical studies
to new insights into genetics. Journal of Trace Elements in Medicine and Biology, 26, 93-96.
Squitti R, Polimanti R, Siotto M, Bucossi S, Ventriglia M, Mariani S, Vernieri F, Scrascia F, Trotta L
and Rossini PM, 2013. ATP7B variants as modulators of copper dyshomeostasis in Alzheimer's
disease. Neuromolecular Medicine, 15, 515-522.
Dietary Reference Values for copper
EFSA Journal 2015;13(10):4253 38
Tanner MS, 1998. Role of copper in Indian childhood cirrhosis. American Journal of Clinical
Nutrition, 67, 1074S-1081S.
Tanzi RE, Petrukhin K, Chernov I, Pellequer JL, Wasco W, Ross B, Romano DM, Parano E, Pavone L
and Brzustowicz LM, 1993. The Wilson disease gene is a copper transporting ATPase with
homology to the Menkes disease gene. Nature Genetics, 5, 344-350.
Tao TY, Liu F, Klomp L, Wijmenga C and Gitlin JD, 2003. The copper toxicosis gene product Murr1
directly interacts with the Wilson disease protein. Journal of Biological Chemistry, 278, 41593-
41596.
Taylor CM, Bacon JR, Aggett PJ and Bremner I, 1991. Intestinal absorption and losses of copper
measured using 65Cu in zinc-deprived men. European Journal of Clinical Nutrition, 45, 187-194.
Thomas GR, Roberts EA, Walshe JM and Cox DW, 1995a. Haplotypes and mutations in Wilson
disease. American Journal of Human Genetics, 56, 1315-1319.
Thomas GR, Forbes JR, Roberts EA, Walshe JM and Cox DW, 1995b. The Wilson disease gene:
spectrum of mutations and their consequences. Nature Genetics, 9, 210-217.
Thompson CA, Habermann TM, Wang AH, Vierkant RA, Folsom AR, Ross JA and Cerhan JR, 2010.
Antioxidant intake from fruits, vegetables and other sources and risk of non-Hodgkin's lymphoma:
The Iowa Women's Health Study. International Journal of Cancer, 126, 992-1003.
Ting BTG, Kasper LJ, Young VR and Janghorbani M, 1984. Copper absorption in healthy young men:
studies with stable isotope Cu-65 and neutron activation analysis. Nutrition Research, 4, 757-769.
Tumer Z and Moller LB, 2010. Menkes disease. European Journal of Human Genetics, 18, 511-518.
Turan S, Saygi S, Kilic Z and Acar O, 2001. Determination of heavy metal contents in human
colostrum samples by electrothermal atomic absorption spectrophotometry. Journal of Tropical
Pediatrics, 47, 81-85.
Turley E, McKeown, Bonham MP, O'Connor JM, Chopra M, Harvey LJ, Majsak- Newman G,
Fairweather-Tait SJ, Bugel S, Sandstrom B, Rock E, Mazur A, Rayssiguier Y and Strain JJ, 2000.
Copper supplementation in humans does not affect the susceptibility of low density lipoprotein to
in vitro induced oxidation (FOODCUE project). Free Radical Biology and Medicine, 29, 1129-
1134.
Turnlund JR, Costa F and Margen S, 1981. Zinc, copper, and iron balance in elderly men. American
Journal of Clinical Nutrition, 34, 2641-2647.
Turnlund JR, Swanson CA and King JC, 1983. Copper absorption and retention in pregnant women
fed diets based on animal and plant proteins. Journal of Nutrition, 113, 2346-2352.
Turnlund JR, 1987. Zinc, copper, and iron nutrition studied with enriched stable isotopes. Biological
Trace Element Research, 12, 247-257.
Turnlund JR, Reager RD and Costa F, 1988. Iron and copper absorption in young and elderly men.
Nutrition Research, 8, 333-343.
Turnlund JR, Keyes WR, Anderson HL and Acord LL, 1989. Copper absorption and retention in
young men at three levels of dietary copper by use of the stable isotope 65Cu. American Journal of
Clinical Nutrition, 49, 870-878.
Turnlund JR, Keen C and Smith RG, 1990. Copper status and urinary and salivary copper in young
men at three levels of dietary copper. American Journal of Clinical Nutrition, 51, 658-664.
Turnlund JR, Scott KC, Peiffer GL, Jang AM, Keyes AM, Keen CL and Sakanaski TM, 1997. Copper
status of young men consuming a low-copper diet. American Journal of Clinical Nutrition, 65, 72-
78.
Turnlund JR, 1998. Human whole-body copper metabolism. American Journal of Clinical Nutrition,
67, 960S-964S.
Dietary Reference Values for copper
EFSA Journal 2015;13(10):4253 39
Turnlund JR, Keyes WR, Peiffer GL and Scott KC, 1998. Copper absorption, excretion, and retention
by young men consuming low dietary copper determined by using the stable isotope 65Cu.
American Journal of Clinical Nutrition, 67, 1219-1225.
Turnlund JR, Jacob RA, Keen CL, Strain JJ, Kelley DS, Domek JM, Keyes WR, Ensunsa JL,
Lykkesfeldt J and Coulter J, 2004. Long-term high copper intake: effects on indexes of copper
status, antioxidant status, and immune function in young men. American Journal of Clinical
Nutrition, 79, 1037-1044.
Turnlund JR, Keyes WR, Kim SK and Domek JM, 2005. Long-term high copper intake: effects on
copper absorption, retention, and homeostasis in men. American Journal of Clinical Nutrition, 81,
822-828.
Ustundag B, Yilmaz E, Dogan Y, Akarsu S, Canatan H, Halifeoglu I, Cikim G and Aygun AD, 2005.
Levels of cytokines (IL-1beta, IL-2, IL-6, IL-8, TNF-alpha) and trace elements (Zn, Cu) in breast
milk from mothers of preterm and term infants. Mediators of Inflammation, 2005, 331-336.
van Rossum CTM, Fransen HP, Verkaik-Kloosterman J, Buurma-Rethans EJM and Ocké MC, 2011.
Dutch National Food Consumption Survey 2007-2010: Diet of children and adults aged 7 to 69
years. RIVM Report number: 350050006/2011, National Institute for Public Health and the
Environment, 143 pp.
Venelinov TI, Davies IM and Beattie JH, 2004. Dialysis-chelex method for determination of
exchangeable copper in human plasma. Analytical and Bioanalytical Chemistry, 379, 777-780.
Vulpe C, Levinson B, Whitney S, Packman S and Gitschier J, 1993. Isolation of a candidate gene for
Menkes disease and evidence that it encodes a copper-transporting ATPase. Nature Genetics, 3, 7-
13.
Vuori E, 1979. Copper, iron, manganese and zinc in breast milk. PhD Thesis, University of Helsinki,
Helsinki, Finland, 40 pp.
Wang Y, Hodgkinson V, Zhu S, Weisman GA and Petris MJ, 2011. Advances in the understanding of
mammalian copper transporters. Advances in Nutrition, 2, 129-137.
Wasowicz W, Gromadzinska J, Szram K, Rydzynski K, Cieslak J and Pietrzak Z, 2001. Selenium,
zinc, and copper concentrations in the blood and milk of lactating women. Biological Trace
Element Research, 79, 221-233.
WCRF/AICR (World Cancer Research Fund/American Institute for Cancer Research), 2007. Food,
Nutrition, Physical Activity and the Prevention of Cancer: a Global Perspective. 537 pp.
Werman MJ, Bhathena SJ and Turnlund JR, 1997. Dietary copper intake influences skin lysyl oxidase
in young men. Journal of Nutritional Biochemistry, 8, 201-204.
West EC and Prohaska JR, 2004. Cu,Zn-superoxide dismutase is lower and copper chaperone CCS is
higher in erythrocytes of copper-deficient rats and mice. Experimental Biology, 229, 756-764.
WHO (World Health Organization), 1996. Trace elements in human nutrition and health. 343 pp.
WHO Multicentre Growth Reference Study Group (World Health Organization), 2006. WHO Child
Growth Standards: Length/height-for-age, weight-for-age, weight-for-length, weight-for-height and
body mass index-for-age: Methods and development. 312 pp.
WHO/FAO (World Health Organization/Food and Agriculture Organization of the United Nations),
2004. Vitamin and mineral requirements in human nutrition: report of a Joint FAO/WHO Expert
Consultation, Bangkok, Thailand, 21-30 September 1998. 341 pp.
Widdowson EM and Dickerson JWT, 1964. Chemical composition of the body. In: Mineral
Metabolism. Eds Comar C and Bronner F. Academic Press, New York, NY, USA, 1-247.
Williams D, 1983. Copper deficiency in humans. Seminars in Hematology, 20, 118-128.
Dietary Reference Values for copper
EFSA Journal 2015;13(10):4253 40
Winiarska-Mieczan A, 2014. Cadmium, lead, copper and zinc in breast milk in Poland. Biological
Trace Element Research, 157, 36-44.
Wirth PL and Linder MC, 1985. Distribution of copper among components of human serum. Journal
of the National Cancer Institute, 75, 277-284.
Wünschmann S, Kühn I, Heidenreich H, Fränzle S, Wappelhorst O and Markert B, 2003. Transfer von
Elementen in die Muttermilch. Forschungsbericht StSch 4258 im Auftrag des Bundesamtes für
Strahlenschutz, Bundesministerium für Umwelt, Naturschutz und Reaktorsicherheit. 122 pp.
Young VR, 1986. Nutritional balance studies: indicators of human requirements or of adaptive
mechanisms? Journal of Nutrition, 116, 700-703.
Zhang Y, Chen Y, Lin Z, Li Q, Peng L and Han M, 2014. Ultrasonic oscillation dialysis-graphite
furnace atomic absorption spectrometer method for determination of "free" copper and
exchangeable copper in serum. Clinical Laboratory, 60, 543-551.
Zietz BP, de Vergara JD and Dunkelberg H, 2003. Copper concentrations in tap water and possible
effects on infant's health - results of a study in Lower Saxony, Germany. Environmental Research,
92, 129-138.
Zlotkin SH and Buchanan BE, 1983. Meeting zinc and copper intake requirements in the parenterally
fed preterm and full-term infant. Journal of Pediatrics, 103, 441-446.
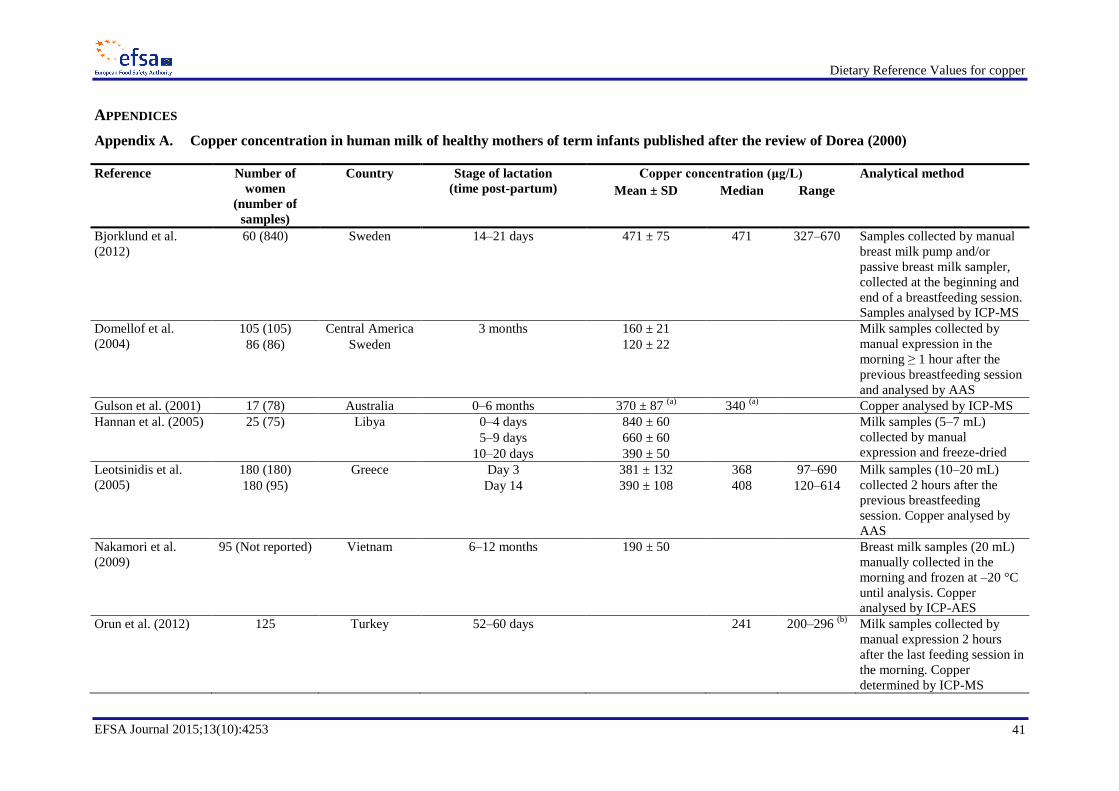
Dietary Reference Values for copper
EFSA Journal 2015;13(10):4253 41
APPENDICES
Appendix A. Copper concentration in human milk of healthy mothers of term infants published after the review of Dorea (2000)
Reference Number of
women
(number of
samples)
Country Stage of lactation
(time post-partum)
Copper concentration (μg/L) Analytical method
Mean ± SD Median Range
Bjorklund et al.
(2012)
60 (840) Sweden 14–21 days 471 ± 75 471 327–670 Samples collected by manual
breast milk pump and/or
passive breast milk sampler,
collected at the beginning and
end of a breastfeeding session.
Samples analysed by ICP-MS
Domellof et al.
(2004)
105 (105) Central America 3 months 160 ± 21 Milk samples collected by
manual expression in the
morning ≥ 1 hour after the
previous breastfeeding session
and analysed by AAS
86 (86) Sweden 120 ± 22
Gulson et al. (2001) 17 (78) Australia 0–6 months 370 ± 87 (a)
340 (a)
Copper analysed by ICP-MS
Hannan et al. (2005) 25 (75) Libya 0–4 days 840 ± 60 Milk samples (5–7 mL)
collected by manual
expression and freeze-dried 5–9 days 660 ± 60
10–20 days 390 ± 50
Leotsinidis et al.
(2005)
180 (180) Greece Day 3 381 ± 132 368 97–690 Milk samples (10–20 mL)
collected 2 hours after the
previous breastfeeding
session. Copper analysed by
AAS
180 (95) Day 14 390 ± 108 408 120–614
Nakamori et al.
(2009)
95 (Not reported) Vietnam 6–12 months 190 ± 50 Breast milk samples (20 mL)
manually collected in the
morning and frozen at –20 °C
until analysis. Copper
analysed by ICP-AES
Orun et al. (2012) 125 Turkey 52–60 days 241 200–296 (b)
Milk samples collected by
manual expression 2 hours
after the last feeding session in
the morning. Copper
determined by ICP-MS
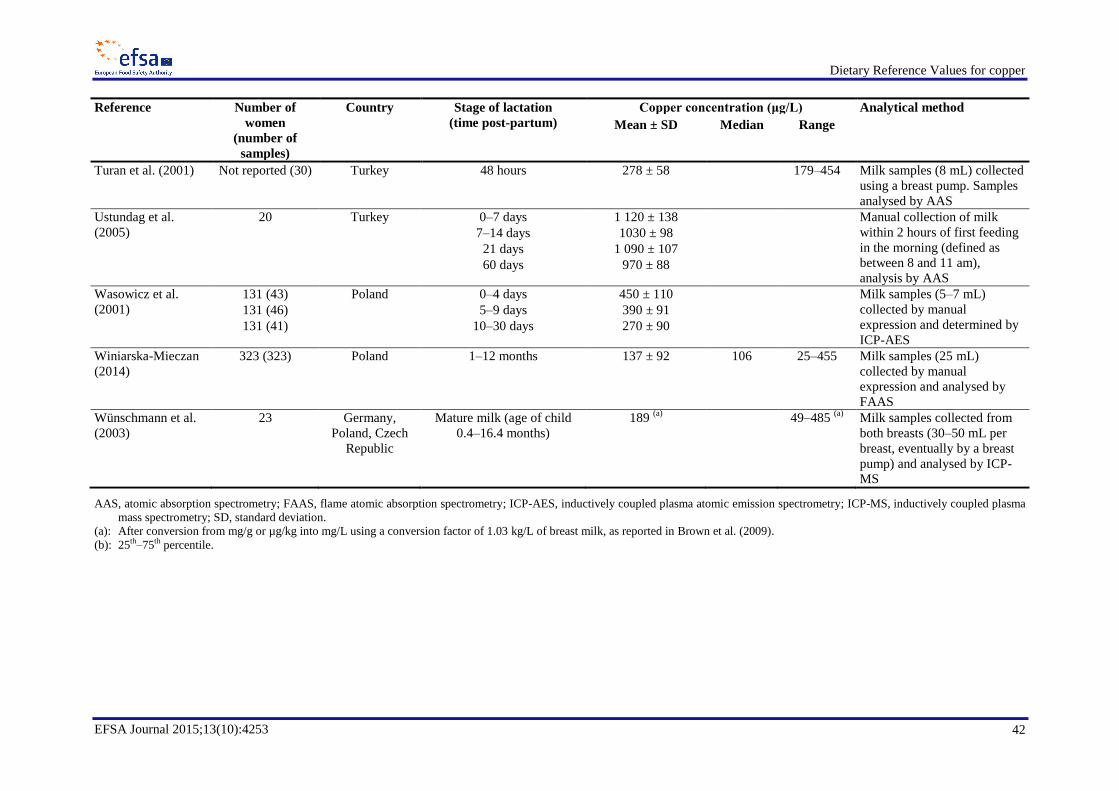
Dietary Reference Values for copper
EFSA Journal 2015;13(10):4253 42
Reference Number of
women
(number of
samples)
Country Stage of lactation
(time post-partum)
Copper concentration (μg/L) Analytical method
Mean ± SD Median Range
Turan et al. (2001) Not reported (30) Turkey 48 hours 278 ± 58 179–454 Milk samples (8 mL) collected
using a breast pump. Samples
analysed by AAS
Ustundag et al.
(2005)
20 Turkey 0–7 days 1 120 ± 138 Manual collection of milk
within 2 hours of first feeding
in the morning (defined as
between 8 and 11 am),
analysis by AAS
7–14 days 1030 ± 98
21 days 1 090 ± 107
60 days 970 ± 88
Wasowicz et al.
(2001)
131 (43) Poland 0–4 days 450 ± 110 Milk samples (5–7 mL)
collected by manual
expression and determined by
ICP-AES
131 (46) 5–9 days 390 ± 91
131 (41) 10–30 days 270 ± 90
Winiarska-Mieczan
(2014)
323 (323) Poland 1–12 months 137 ± 92 106 25–455 Milk samples (25 mL)
collected by manual
expression and analysed by
FAAS
Wünschmann et al.
(2003)
23 Germany,
Poland, Czech
Republic
Mature milk (age of child
0.4–16.4 months)
189 (a)
49–485 (a)
Milk samples collected from
both breasts (30–50 mL per
breast, eventually by a breast
pump) and analysed by ICP-
MS
AAS, atomic absorption spectrometry; FAAS, flame atomic absorption spectrometry; ICP-AES, inductively coupled plasma atomic emission spectrometry; ICP-MS, inductively coupled plasma
mass spectrometry; SD, standard deviation.
(a): After conversion from mg/g or µg/kg into mg/L using a conversion factor of 1.03 kg/L of breast milk, as reported in Brown et al. (2009).
(b): 25th–75th percentile.
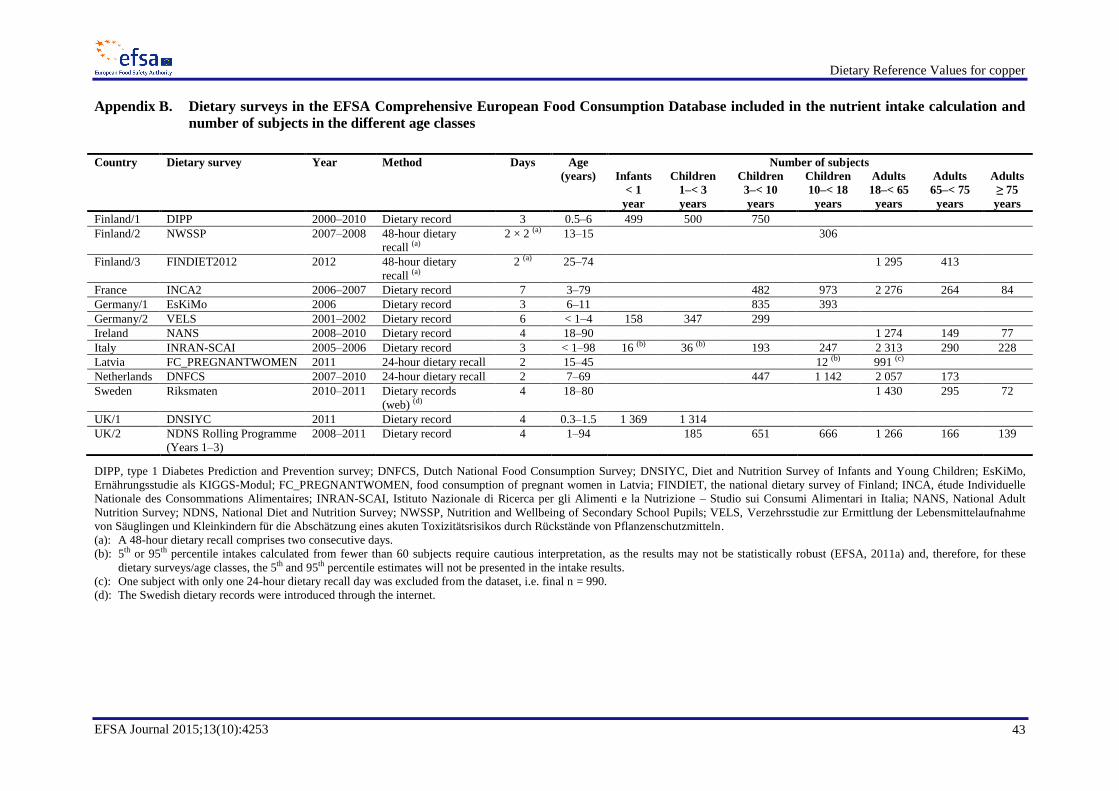
Dietary Reference Values for copper
EFSA Journal 2015;13(10):4253 43
Appendix B. Dietary surveys in the EFSA Comprehensive European Food Consumption Database included in the nutrient intake calculation and
number of subjects in the different age classes
DIPP, type 1 Diabetes Prediction and Prevention survey; DNFCS, Dutch National Food Consumption Survey; DNSIYC, Diet and Nutrition Survey of Infants and Young Children; EsKiMo,
Ernährungsstudie als KIGGS-Modul; FC_PREGNANTWOMEN, food consumption of pregnant women in Latvia; FINDIET, the national dietary survey of Finland; INCA, étude Individuelle
Nationale des Consommations Alimentaires; INRAN-SCAI, Istituto Nazionale di Ricerca per gli Alimenti e la Nutrizione – Studio sui Consumi Alimentari in Italia; NANS, National Adult
Nutrition Survey; NDNS, National Diet and Nutrition Survey; NWSSP, Nutrition and Wellbeing of Secondary School Pupils; VELS, Verzehrsstudie zur Ermittlung der Lebensmittelaufnahme
von Säuglingen und Kleinkindern für die Abschätzung eines akuten Toxizitätsrisikos durch Rückstände von Pflanzenschutzmitteln.
(a): A 48-hour dietary recall comprises two consecutive days.
(b): 5th or 95th percentile intakes calculated from fewer than 60 subjects require cautious interpretation, as the results may not be statistically robust (EFSA, 2011a) and, therefore, for these
dietary surveys/age classes, the 5th and 95th percentile estimates will not be presented in the intake results.
(c): One subject with only one 24-hour dietary recall day was excluded from the dataset, i.e. final n = 990.
(d): The Swedish dietary records were introduced through the internet.
Country Dietary survey Year Method Days Age
(years)
Number of subjects
Infants
< 1
year
Children
1–< 3
years
Children
3–< 10
years
Children
10–< 18
years
Adults
18–< 65
years
Adults
65–< 75
years
Adults
≥ 75
years
Finland/1 DIPP 2000–2010 Dietary record 3 0.5–6 499 500 750
Finland/2 NWSSP 2007–2008 48-hour dietary
recall (a)
2 × 2 (a) 13–15 306
Finland/3 FINDIET2012 2012 48-hour dietary
recall (a)
2 (a) 25–74 1 295 413
France INCA2 2006–2007 Dietary record 7 3–79 482 973 2 276 264 84
Germany/1 EsKiMo 2006 Dietary record 3 6–11 835 393
Germany/2 VELS 2001–2002 Dietary record 6 < 1–4 158 347 299
Ireland NANS 2008–2010 Dietary record 4 18–90 1 274 149 77
Italy INRAN-SCAI 2005–2006 Dietary record 3 < 1–98 16 (b) 36 (b) 193 247 2 313 290 228
Latvia FC_PREGNANTWOMEN 2011 24-hour dietary recall 2 15–45 12 (b) 991 (c)
Netherlands DNFCS 2007–2010 24-hour dietary recall 2 7–69 447 1 142 2 057 173
Sweden Riksmaten 2010–2011 Dietary records
(web) (d)
4 18–80 1 430 295 72
UK/1 DNSIYC 2011 Dietary record 4 0.3–1.5 1 369 1 314
UK/2 NDNS Rolling Programme
(Years 1–3)
2008–2011 Dietary record 4 1–94 185 651 666 1 266 166 139
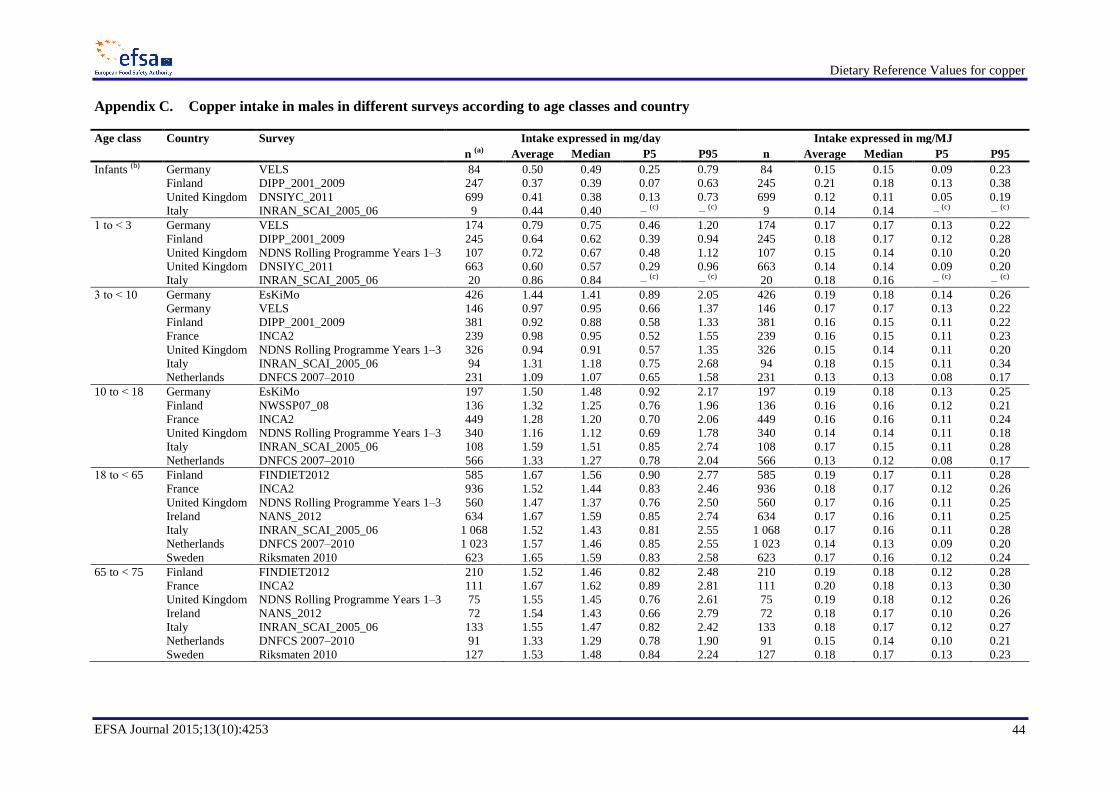
Dietary Reference Values for copper
EFSA Journal 2015;13(10):4253 44
Appendix C. Copper intake in males in different surveys according to age classes and country
Age class Country Survey Intake expressed in mg/day Intake expressed in mg/MJ
n (a) Average Median P5 P95 n Average Median P5 P95
Infants (b) Germany VELS 84 0.50 0.49 0.25 0.79 84 0.15 0.15 0.09 0.23
Finland DIPP_2001_2009 247 0.37 0.39 0.07 0.63 245 0.21 0.18 0.13 0.38
United Kingdom DNSIYC_2011 699 0.41 0.38 0.13 0.73 699 0.12 0.11 0.05 0.19
Italy INRAN_SCAI_2005_06 9 0.44 0.40 – (c) – (c) 9 0.14 0.14 – (c) – (c)
1 to ˂ 3 Germany VELS 174 0.79 0.75 0.46 1.20 174 0.17 0.17 0.13 0.22
Finland DIPP_2001_2009 245 0.64 0.62 0.39 0.94 245 0.18 0.17 0.12 0.28
United Kingdom NDNS Rolling Programme Years 1–3 107 0.72 0.67 0.48 1.12 107 0.15 0.14 0.10 0.20
United Kingdom DNSIYC_2011 663 0.60 0.57 0.29 0.96 663 0.14 0.14 0.09 0.20
Italy INRAN_SCAI_2005_06 20 0.86 0.84 – (c) – (c) 20 0.18 0.16 – (c) – (c)
3 to ˂ 10 Germany EsKiMo 426 1.44 1.41 0.89 2.05 426 0.19 0.18 0.14 0.26
Germany VELS 146 0.97 0.95 0.66 1.37 146 0.17 0.17 0.13 0.22
Finland DIPP_2001_2009 381 0.92 0.88 0.58 1.33 381 0.16 0.15 0.11 0.22
France INCA2 239 0.98 0.95 0.52 1.55 239 0.16 0.15 0.11 0.23
United Kingdom NDNS Rolling Programme Years 1–3 326 0.94 0.91 0.57 1.35 326 0.15 0.14 0.11 0.20
Italy INRAN_SCAI_2005_06 94 1.31 1.18 0.75 2.68 94 0.18 0.15 0.11 0.34
Netherlands DNFCS 2007–2010 231 1.09 1.07 0.65 1.58 231 0.13 0.13 0.08 0.17
10 to ˂ 18 Germany EsKiMo 197 1.50 1.48 0.92 2.17 197 0.19 0.18 0.13 0.25
Finland NWSSP07_08 136 1.32 1.25 0.76 1.96 136 0.16 0.16 0.12 0.21
France INCA2 449 1.28 1.20 0.70 2.06 449 0.16 0.16 0.11 0.24
United Kingdom NDNS Rolling Programme Years 1–3 340 1.16 1.12 0.69 1.78 340 0.14 0.14 0.11 0.18
Italy INRAN_SCAI_2005_06 108 1.59 1.51 0.85 2.74 108 0.17 0.15 0.11 0.28
Netherlands DNFCS 2007–2010 566 1.33 1.27 0.78 2.04 566 0.13 0.12 0.08 0.17
18 to ˂ 65 Finland FINDIET2012 585 1.67 1.56 0.90 2.77 585 0.19 0.17 0.11 0.28
France INCA2 936 1.52 1.44 0.83 2.46 936 0.18 0.17 0.12 0.26
United Kingdom NDNS Rolling Programme Years 1–3 560 1.47 1.37 0.76 2.50 560 0.17 0.16 0.11 0.25
Ireland NANS_2012 634 1.67 1.59 0.85 2.74 634 0.17 0.16 0.11 0.25
Italy INRAN_SCAI_2005_06 1 068 1.52 1.43 0.81 2.55 1 068 0.17 0.16 0.11 0.28
Netherlands DNFCS 2007–2010 1 023 1.57 1.46 0.85 2.55 1 023 0.14 0.13 0.09 0.20
Sweden Riksmaten 2010 623 1.65 1.59 0.83 2.58 623 0.17 0.16 0.12 0.24
65 to < 75 Finland FINDIET2012 210 1.52 1.46 0.82 2.48 210 0.19 0.18 0.12 0.28
France INCA2 111 1.67 1.62 0.89 2.81 111 0.20 0.18 0.13 0.30
United Kingdom NDNS Rolling Programme Years 1–3 75 1.55 1.45 0.76 2.61 75 0.19 0.18 0.12 0.26
Ireland NANS_2012 72 1.54 1.43 0.66 2.79 72 0.18 0.17 0.10 0.26
Italy INRAN_SCAI_2005_06 133 1.55 1.47 0.82 2.42 133 0.18 0.17 0.12 0.27
Netherlands DNFCS 2007–2010 91 1.33 1.29 0.78 1.90 91 0.15 0.14 0.10 0.21
Sweden Riksmaten 2010 127 1.53 1.48 0.84 2.24 127 0.18 0.17 0.13 0.23

Dietary Reference Values for copper
EFSA Journal 2015;13(10):4253 45
Age class Country Survey Intake expressed in mg/day Intake expressed in mg/MJ
n (a) Average Median P5 P95 n Average Median P5 P95
≥ 75 France INCA2 40 1.34 1.30 – (c) – (c) 40 0.17 0.17 – (c) – (c)
United Kingdom NDNS Rolling Programme Years 1–3 56 1.40 1.07 – (c) – (c) 56 0.20 0.16 – (c) – (c)
Ireland NANS_2012 34 1.27 1.21 – (c) – (c) 34 0.17 0.16 – (c) – (c)
Italy INRAN_SCAI_2005_06 69 1.46 1.43 0.81 2.49 69 0.17 0.16 0.11 0.27
Sweden Riksmaten 2010 42 1.50 1.40 – (c) – (c) 42 0.18 0.17 – (c) – (c)
DIPP, type 1 Diabetes Prediction and Prevention survey; DNFCS, Dutch National Food Consumption Survey; DNSIYC, Diet and Nutrition Survey of Infants and Young Children; EsKiMo,
Ernährungsstudie als KIGGS-Modul; FC_PREGNANTWOMEN, food consumption of pregnant women in Latvia; FINDIET, the national dietary survey of Finland; INCA, étude Individuelle
Nationale des Consommations Alimentaires; INRAN-SCAI, Istituto Nazionale di Ricerca per gli Alimenti e la Nutrizione – Studio sui Consumi Alimentari in Italia; NANS, National Adult
Nutrition Survey; NDNS, National Diet and Nutrition Survey; NWSSP, Nutrition and Wellbeing of Secondary School Pupils; P5, 5th percentile; P95, 95th percentile; VELS, Verzehrsstudie zur
Ermittlung der Lebensmittelaufnahme von Säuglingen und Kleinkindern für die Abschätzung eines akuten Toxizitätsrisikos durch Rückstände von Pflanzenschutzmitteln.
(a): Number of individuals in the population group.
(b): The proportions of breast-fed infants were 58 % in the Finnish survey, 40 % in the German survey, 44 % in the Italian survey and 21 % in the UK survey. Most infants were partially breast-
fed. For the Italian and German surveys, breast milk intake estimates were derived from the number of breastfeeding events recorded per day multiplied by standard breast milk amounts
consumed on an eating occasion at different ages. For the UK survey, the amount of breast milk consumed was either directly quantified by the mother (expressed breast milk) or
extrapolated from the duration of each breastfeeding event. As no information on the breastfeeding events were reported in the Finnish survey, breast milk intake was not taken into
consideration in the intake estimates of Finnish infants.
(c): 5th or 95th percentile intakes calculated from fewer than 60 subjects require cautious interpretation, as the results may not be statistically robust (EFSA, 2011a) and, therefore, for these
dietary surveys/age classes, the 5th and 95th percentile estimates will not be presented in the intake results.
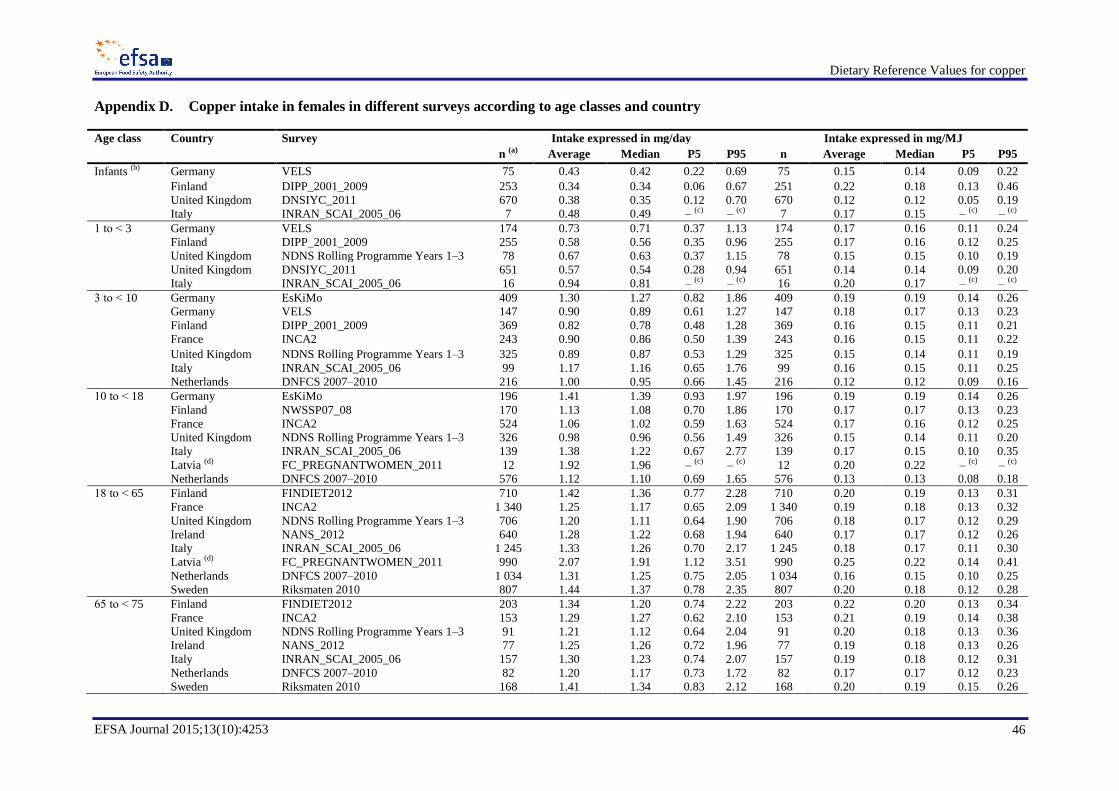
Dietary Reference Values for copper
EFSA Journal 2015;13(10):4253 46
Appendix D. Copper intake in females in different surveys according to age classes and country
Age class Country Survey Intake expressed in mg/day Intake expressed in mg/MJ
n (a) Average Median P5 P95 n Average Median P5 P95
Infants (b) Germany VELS 75 0.43 0.42 0.22 0.69 75 0.15 0.14 0.09 0.22
Finland DIPP_2001_2009 253 0.34 0.34 0.06 0.67 251 0.22 0.18 0.13 0.46
United Kingdom DNSIYC_2011 670 0.38 0.35 0.12 0.70 670 0.12 0.12 0.05 0.19
Italy INRAN_SCAI_2005_06 7 0.48 0.49 – (c) – (c) 7 0.17 0.15 – (c) – (c)
1 to ˂ 3 Germany VELS 174 0.73 0.71 0.37 1.13 174 0.17 0.16 0.11 0.24
Finland DIPP_2001_2009 255 0.58 0.56 0.35 0.96 255 0.17 0.16 0.12 0.25
United Kingdom NDNS Rolling Programme Years 1–3 78 0.67 0.63 0.37 1.15 78 0.15 0.15 0.10 0.19
United Kingdom DNSIYC_2011 651 0.57 0.54 0.28 0.94 651 0.14 0.14 0.09 0.20
Italy INRAN_SCAI_2005_06 16 0.94 0.81 – (c) – (c) 16 0.20 0.17 – (c) – (c)
3 to ˂ 10 Germany EsKiMo 409 1.30 1.27 0.82 1.86 409 0.19 0.19 0.14 0.26
Germany VELS 147 0.90 0.89 0.61 1.27 147 0.18 0.17 0.13 0.23
Finland DIPP_2001_2009 369 0.82 0.78 0.48 1.28 369 0.16 0.15 0.11 0.21
France INCA2 243 0.90 0.86 0.50 1.39 243 0.16 0.15 0.11 0.22
United Kingdom NDNS Rolling Programme Years 1–3 325 0.89 0.87 0.53 1.29 325 0.15 0.14 0.11 0.19
Italy INRAN_SCAI_2005_06 99 1.17 1.16 0.65 1.76 99 0.16 0.15 0.11 0.25
Netherlands DNFCS 2007–2010 216 1.00 0.95 0.66 1.45 216 0.12 0.12 0.09 0.16
10 to ˂ 18 Germany EsKiMo 196 1.41 1.39 0.93 1.97 196 0.19 0.19 0.14 0.26
Finland NWSSP07_08 170 1.13 1.08 0.70 1.86 170 0.17 0.17 0.13 0.23
France INCA2 524 1.06 1.02 0.59 1.63 524 0.17 0.16 0.12 0.25
United Kingdom NDNS Rolling Programme Years 1–3 326 0.98 0.96 0.56 1.49 326 0.15 0.14 0.11 0.20
Italy INRAN_SCAI_2005_06 139 1.38 1.22 0.67 2.77 139 0.17 0.15 0.10 0.35
Latvia (d) FC_PREGNANTWOMEN_2011 12 1.92 1.96 – (c) – (c) 12 0.20 0.22 – (c) – (c)
Netherlands DNFCS 2007–2010 576 1.12 1.10 0.69 1.65 576 0.13 0.13 0.08 0.18
18 to ˂ 65 Finland FINDIET2012 710 1.42 1.36 0.77 2.28 710 0.20 0.19 0.13 0.31
France INCA2 1 340 1.25 1.17 0.65 2.09 1 340 0.19 0.18 0.13 0.32
United Kingdom NDNS Rolling Programme Years 1–3 706 1.20 1.11 0.64 1.90 706 0.18 0.17 0.12 0.29
Ireland NANS_2012 640 1.28 1.22 0.68 1.94 640 0.17 0.17 0.12 0.26
Italy INRAN_SCAI_2005_06 1 245 1.33 1.26 0.70 2.17 1 245 0.18 0.17 0.11 0.30
Latvia (d) FC_PREGNANTWOMEN_2011 990 2.07 1.91 1.12 3.51 990 0.25 0.22 0.14 0.41
Netherlands DNFCS 2007–2010 1 034 1.31 1.25 0.75 2.05 1 034 0.16 0.15 0.10 0.25
Sweden Riksmaten 2010 807 1.44 1.37 0.78 2.35 807 0.20 0.18 0.12 0.28
65 to ˂ 75 Finland FINDIET2012 203 1.34 1.20 0.74 2.22 203 0.22 0.20 0.13 0.34
France INCA2 153 1.29 1.27 0.62 2.10 153 0.21 0.19 0.14 0.38
United Kingdom NDNS Rolling Programme Years 1–3 91 1.21 1.12 0.64 2.04 91 0.20 0.18 0.13 0.36
Ireland NANS_2012 77 1.25 1.26 0.72 1.96 77 0.19 0.18 0.13 0.26
Italy INRAN_SCAI_2005_06 157 1.30 1.23 0.74 2.07 157 0.19 0.18 0.12 0.31
Netherlands DNFCS 2007–2010 82 1.20 1.17 0.73 1.72 82 0.17 0.17 0.12 0.23
Sweden Riksmaten 2010 168 1.41 1.34 0.83 2.12 168 0.20 0.19 0.15 0.26

Dietary Reference Values for copper
EFSA Journal 2015;13(10):4253 47
Age class Country Survey Intake expressed in mg/day Intake expressed in mg/MJ
n (a) Average Median P5 P95 n Average Median P5 P95
≥ 75 France INCA2 44 1.29 1.14 – (c) – (c) 44 0.22 0.18 – (c) – (c)
United Kingdom NDNS Rolling Programme Years 1–3 83 1.15 1.02 0.61 1.77 83 0.19 0.17 0.13 0.32
Ireland NANS_2012 43 1.17 1.16 – (c) – (c) 43 0.19 0.18 – (c) – (c)
Italy INRAN_SCAI_2005_06 159 1.17 1.13 0.69 1.77 159 0.18 0.17 0.12 0.26
Sweden Riksmaten 2010 30 1.37 1.27 – (c) – (c) 30 0.20 0.19 – (c) – (c)
DIPP, type 1 Diabetes Prediction and Prevention survey; DNFCS, Dutch National Food Consumption Survey; DNSIYC, Diet and Nutrition Survey of Infants and Young Children; EsKiMo,
Ernährungsstudie als KIGGS-Modul; FC_PREGNANTWOMEN, food consumption of pregnant women in Latvia; FINDIET, the national dietary survey of Finland; INCA, étude Individuelle
Nationale des Consommations Alimentaires; INRAN-SCAI, Istituto Nazionale di Ricerca per gli Alimenti e la Nutrizione – Studio sui Consumi Alimentari in Italia; NANS, National Adult
Nutrition Survey; NDNS, National Diet and Nutrition Survey; NWSSP, Nutrition and Wellbeing of Secondary School Pupils; P5, 5th percentile; P95, 95th percentile; VELS, Verzehrsstudie zur
Ermittlung der Lebensmittelaufnahme von Säuglingen und Kleinkindern für die Abschätzung eines akuten Toxizitätsrisikos durch Rückstände von Pflanzenschutzmitteln.
(a): Number of individuals in the population group.
(b): The proportions of breast-fed infants were 58 % in the Finnish survey, 40 % in the German survey, 44 % in the Italian survey and 21 % in the UK survey. Most infants were partially breast-
fed. For the Italian and German surveys, breast milk intake estimates were derived from the number of breastfeeding events recorded per day multiplied by standard breast milk amounts
consumed on an eating occasion at different ages. For the UK survey, the amount of breast milk consumed was either directly quantified by the mother (expressed breast milk) or
extrapolated from the duration of each breastfeeding event. As no information on the breastfeeding events were reported in the Finnish survey, breast milk intake was not taken into
consideration in the intake estimates of Finnish infants.
(c): 5th or 95th percentile intakes calculated from fewer than 60 subjects require cautious interpretation, as the results may not be statistically robust (EFSA, 2011a) and, therefore, for these
dietary surveys/age classes, the 5th and 95th percentile estimates will not be presented in the intake results.
(d): Pregnant women only.
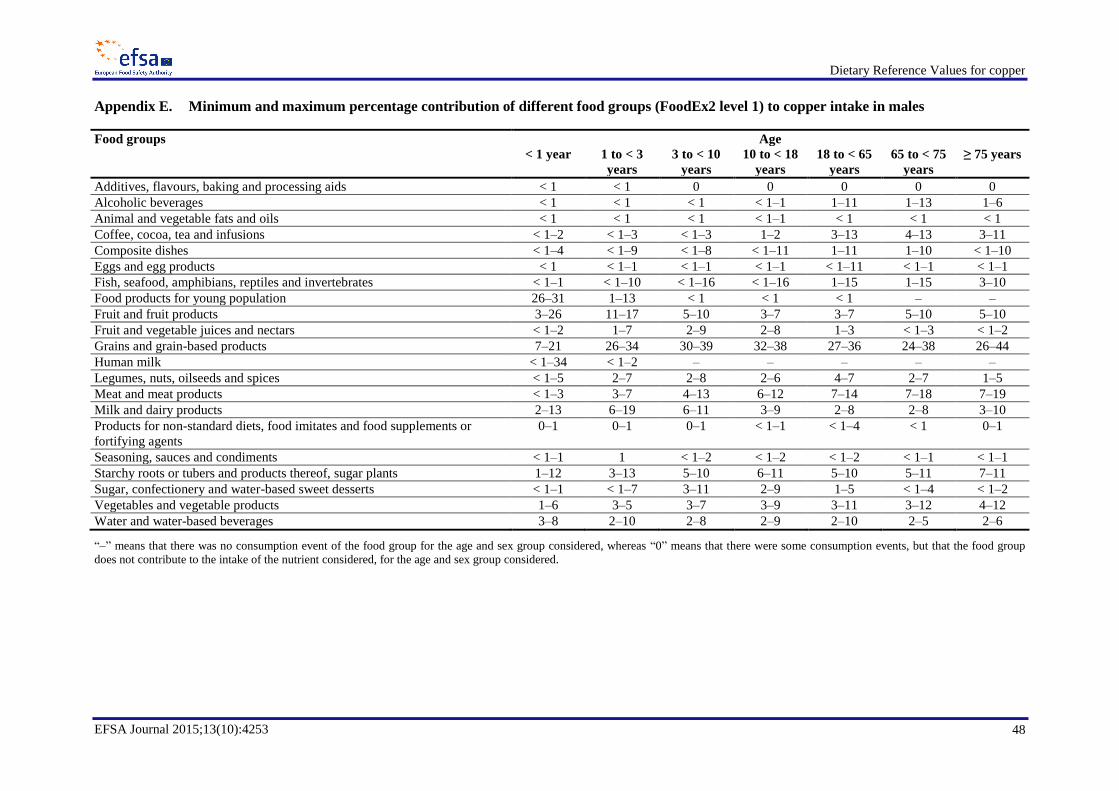
Dietary Reference Values for copper
EFSA Journal 2015;13(10):4253 48
Appendix E. Minimum and maximum percentage contribution of different food groups (FoodEx2 level 1) to copper intake in males
Food groups Age
< 1 year 1 to < 3
years
3 to < 10
years
10 to < 18
years
18 to < 65
years
65 to < 75
years
≥ 75 years
Additives, flavours, baking and processing aids < 1 < 1 0 0 0 0 0
Alcoholic beverages < 1 < 1 < 1 < 1–1 1–11 1–13 1–6
Animal and vegetable fats and oils < 1 < 1 < 1 < 1–1 < 1 < 1 < 1
Coffee, cocoa, tea and infusions < 1–2 < 1–3 < 1–3 1–2 3–13 4–13 3–11
Composite dishes < 1–4 < 1–9 < 1–8 < 1–11 1–11 1–10 < 1–10
Eggs and egg products < 1 < 1–1 < 1–1 < 1–1 < 1–11 < 1–1 < 1–1
Fish, seafood, amphibians, reptiles and invertebrates < 1–1 < 1–10 < 1–16 < 1–16 1–15 1–15 3–10
Food products for young population 26–31 1–13 < 1 < 1 < 1 – –
Fruit and fruit products 3–26 11–17 5–10 3–7 3–7 5–10 5–10
Fruit and vegetable juices and nectars < 1–2 1–7 2–9 2–8 1–3 < 1–3 < 1–2
Grains and grain-based products 7–21 26–34 30–39 32–38 27–36 24–38 26–44
Human milk < 1–34 < 1–2 – – – – –
Legumes, nuts, oilseeds and spices < 1–5 2–7 2–8 2–6 4–7 2–7 1–5
Meat and meat products < 1–3 3–7 4–13 6–12 7–14 7–18 7–19
Milk and dairy products 2–13 6–19 6–11 3–9 2–8 2–8 3–10
Products for non-standard diets, food imitates and food supplements or
fortifying agents
0–1 0–1 0–1 < 1–1 < 1–4 < 1 0–1
Seasoning, sauces and condiments < 1–1 1 < 1–2 < 1–2 < 1–2 < 1–1 < 1–1
Starchy roots or tubers and products thereof, sugar plants 1–12 3–13 5–10 6–11 5–10 5–11 7–11
Sugar, confectionery and water-based sweet desserts < 1–1 < 1–7 3–11 2–9 1–5 < 1–4 < 1–2
Vegetables and vegetable products 1–6 3–5 3–7 3–9 3–11 3–12 4–12
Water and water-based beverages 3–8 2–10 2–8 2–9 2–10 2–5 2–6
“–” means that there was no consumption event of the food group for the age and sex group considered, whereas “0” means that there were some consumption events, but that the food group
does not contribute to the intake of the nutrient considered, for the age and sex group considered.

Dietary Reference Values for copper
EFSA Journal 2015;13(10):4253 49
Appendix F. Minimum and maximum percentage contribution of different food groups (FoodEx2 level 1) to copper intake in females
Food groups Age
< 1 year 1 to < 3
years
3 to < 10
years
10 to < 18
years
18 to < 65
years
65 to < 75
years
≥ 75 years
Additives, flavours, baking and processing aids 0 0 0 0 0 0 0
Alcoholic beverages < 1 < 1 < 1 < 1 < 1–3 < 1–2 < 1–2
Animal and vegetable fats and oils < 1 < 1 < 1 < 1 < 1 < 1 < 1
Coffee, cocoa, tea and infusions < 1–10 < 1–17 1–3 1–10 4–12 4–14 4–12
Composite dishes < 1–3 < 1–9 < 1–8 < 1–12 1–11 < 1–9 1–10
Eggs and egg products < 1 < 1–1 < 1–1 < 1–1 < 1–1 < 1–1 < 1–1
Fish, seafood, amphibians, reptiles and invertebrates 0 < 1–8 < 1–12 < 1–19 1–15 1–12 1–7
Food products for young population 19–37 1–11 < 1 < 1 < 1 – < 1
Fruit and fruit products 8–26 5–16 5–10 4–12 5–10 8–13 7–13
Fruit and vegetable juices and nectars < 1–2 1–7 2–8 2–8 1–3 1–2 1–2
Grains and grain-based products 10–21 24–37 31–38 29–38 24–42 20–38 19–40
Human milk < 1–15 1–2 – – – – –
Legumes, nuts, oilseeds and spices 1–6 2–7 2–7 3–6 4–8 4–8 3–6
Meat and meat products 1–3 3–7 4–10 5–11 6–13 6–17 6–16
Milk and dairy products 1–15 7–15 6–11 3–9 2–8 3–8 3–9
Products for non-standard diets, food imitates and food supplements or
fortifying agents
0–1 0–1 0–1 < 1–1 < 1–4 < 1–1 0–2
Seasoning, sauces and condiments < 1–1 < 1–1 < 1–2 < 1–2 < 1–2 < 1–1 1
Starchy roots or tubers and products thereof, sugar plants 3–12 5–12 5–10 6–12 4–9 4–9 6–8
Sugar, confectionery and water-based sweet desserts < 1–2 < 1–6 3–11 3–10 1–10 1–3 1–3
Vegetables and vegetable products 5–7 3–5 3–8 4–8 4–12 5–13 5–12
Water and water-based beverages 3–9 2–10 2–9 2–10 2–12 3–10 3–8
“–” means that there was no consumption event of the food group for the age and sex group considered, whereas “0” means that there were some consumption events, but that the food group
does not contribute to the intake of the nutrient considered, for the age and sex group considered.

Dietary Reference Values for copper
EFSA Journal 2015;13(10):4253 50
ABBREVIATIONS
Afssa Agence française de sécurité sanitaire des aliments
AI Adequate Intake
AR Average Requirement
COMA Committee on Medical Aspects of Food Policy
CV coefficient of variation
D-A-CH Deutschland–Austria–Confoederatio Helvetica
DAO diamine oxidase
DH UK Department of Health
DIPP type 1 Diabetes Prediction and Prevention survey
DNFCS Dutch National Food Consumption Survey
DNSIYC Diet and Nutrition Survey of Infants and Young Children
DRV Dietary Reference Value
EAR Estimated Average Requirement
EsKiMo Ernährungsstudie als KIGGS-Modul
EU European Union
FAO Food and Agriculture Organization
FC_PREGNANTWOMEN food consumption of pregnant women in Latvia
FINDIET national dietary survey of Finland
GPI glycosylphosphatidylinositol
INCA étude Individuelle Nationale des Consommations Alimentaires
INRAN-SCAI Istituto Nazionale di Ricerca per gli Alimenti e la Nutrizione – Studio
sui Consumi Alimentari in Italia
IOM US Institute of Medicine of the National Academy of Sciences
MT metallothionein
NANS National Adult Nutrition Survey
NDNS National Diet and Nutrition Survey
NNR Nordic Nutrition Recommendations

Dietary Reference Values for copper
EFSA Journal 2015;13(10):4253 51
NOAEL No Observed Adverse Effect Level
NWSSP Nutrition and Wellbeing of Secondary School Pupils
PRI Population Reference Intake
RCT randomised controlled trial
RDA Recommended Dietary Allowance
RNI Reference Nutrient Intake
SCF Scientific Committee for Food
SD standard deviation
SNP single nucleotide polymorphism
SOD superoxide dismutase
UL Tolerable Upper Intake Level
UNU United Nations University
VELS Verzehrsstudie zur Ermittlung der Lebensmittelaufnahme von
Säuglingen und Kleinkindern für die Abschätzung eines akuten
Toxizitätsrisikos durch Rückstände von Pflanzenschutzmitteln
WHO World Health Organization
Related Documents