Scientific Method

Scientific Method. What is the goal of Science? Investigate and understand the natural world Explain events in the natural world Use explanations to make.
Dec 31, 2015
Welcome message from author
This document is posted to help you gain knowledge. Please leave a comment to let me know what you think about it! Share it to your friends and learn new things together.
Transcript

Scientific Method

• What is the goal of Science?
• Investigate and understand the natural world
• Explain events in the natural world
• Use explanations to make useful predictions
Science as a Way of Knowing• How should you
think about science?• Science is an ongoing process– Involves asking
questions– Observing– Making inferences– Testing hypotheses

• What are the basic components of scientific inquiry?
• 1. Identify the Problem• 2. Formulate testable
Hypothesis• 3. Design & Conduct
experiment• 4. Analyze Data• 5. Develop Conclusion

Let’s Break it Down…..
• 1. Identify the Problem– Make observations using five senses
• Quantitative– Expressed as numbers, counting, or measuring
• Qualitative– Descriptive and involve characteristics that cannot be counted
– Collect information– Develop a question you can test
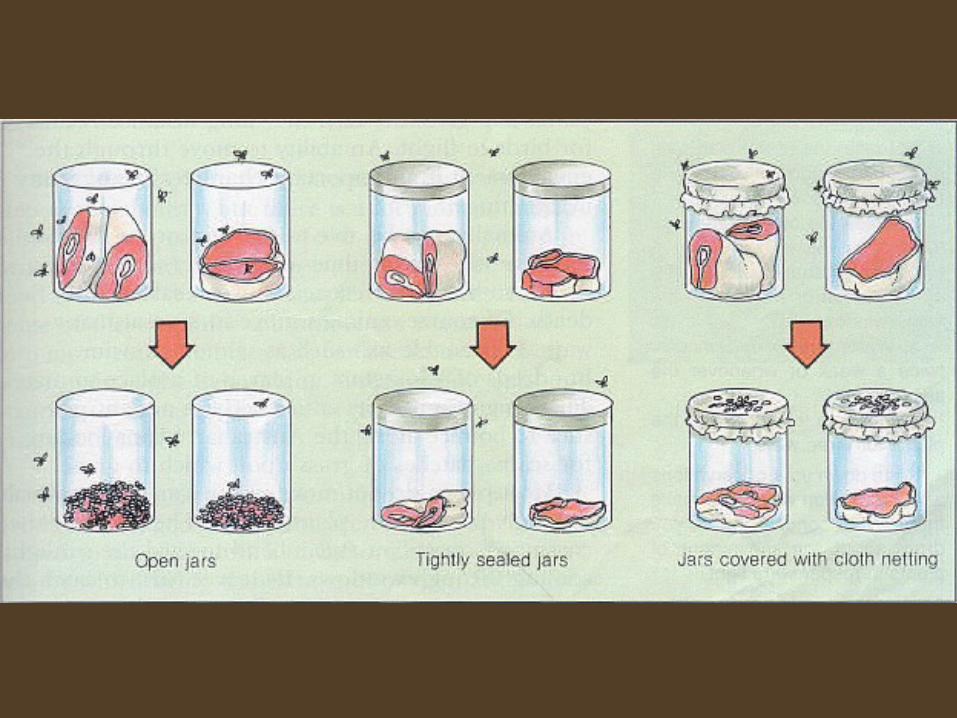
*A scientist observed maggots “appearing” on raw meat– He wondered how did this happen?*Question for experiment* • What is the cause or source of the maggots on the meat?

Breaking it down …….
• 2. Formulate a testable hypothesis– Could be an If/Then statement– Must relate to independent and dependent
variable
* hypothesis* If I see flies crawling all over the meat, then
flies produce maggots.-OR-Flies produce maggots
• How do we know what the IV and DV are?
variables- 2 kinds
• Independent variable- the factor the experimenter adjusts ( what “I” change)– AKA Manipulated Variable
• Dependant variable- the result (data your collecting)– AKA Responding Variable

Breaking down….• 3. Design and Conduct the experiment
– List materials needed– Make sure it is a valid procedure
• Experiment is not biased (one sided)
– Indentify Variables : IV, DV, constants, control• IV- what “I” change• DV- ‘D’ata you collect• Constants- what needs to stay the same to make the
experiment valid• Control- ‘the original’ unchanged test subject that the IV is
compared to
– Record observations– Collect Data– Multiple trials

Experiment example
• Materials: two jars, meat, gauze, flies, ect…• Control – uncovered meat• Constants - jars, meat, location, temperature,
time• IV- Gauze covering that keeps flies away from
meat• DV - Whether maggots appear or not• Record observations and collect data
– Quantitative & Qualitative• Multiple trials

Breaking it down…
• 4. Analyze Data– Organize data into charts, graphs and tables– Identify if the data supports the hypothesis
*In a lab report you put what you see in your graphs, charts and tables into complete sentences!!!!!!!!
* This shows your understanding of the data gathered
Data tables and Graphing
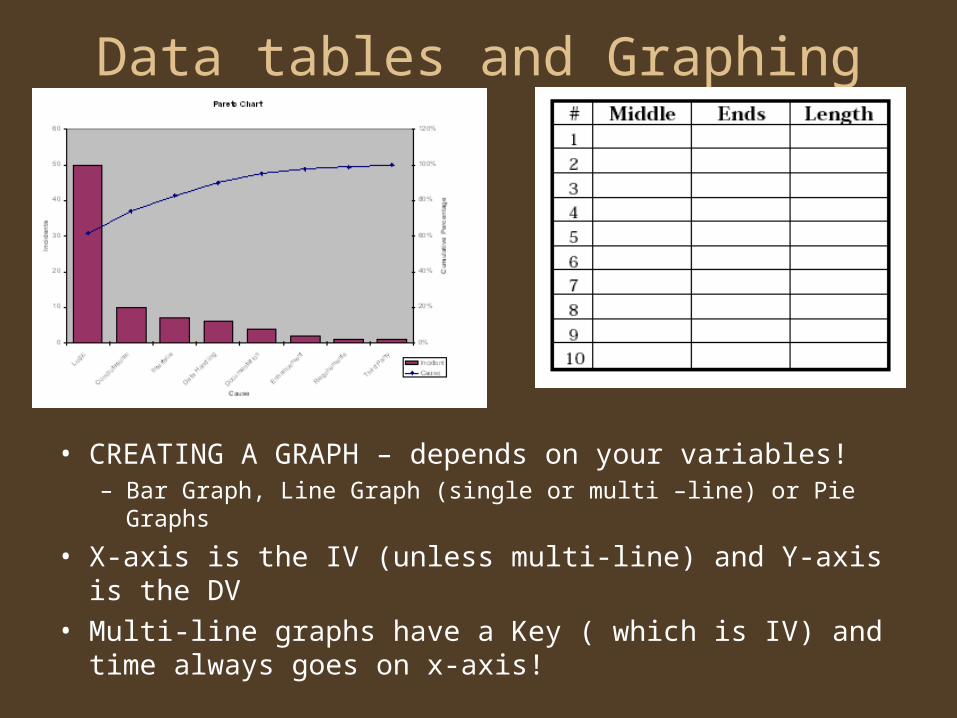
• CREATING A GRAPH – depends on your variables!– Bar Graph, Line Graph (single or multi –line) or Pie Graphs
• X-axis is the IV (unless multi-line) and Y-axis is the DV• Multi-line graphs have a Key ( which is IV) and time
always goes on x-axis!
Last break down….• 5. Develop Conclusion
– Make clear, concise statement based on results; written as a restatement of the hypothesis
– Accept/reject the hypothesis and explain why– Communicate results– Identify sources of error– Determine the need for further research
*Maggots form only when flies come in contact with meat, so his hypothesis “flies produce maggots” was correct. Spontaneous generation of maggots did not occur.
Related Documents


