Zeszyty Naukowe 32(104) z. 2 65 Scientific Journals Zeszyty Naukowe Maritime University of Szczecin Akademia Morska w Szczecinie 2012, 32(104) z. 2 pp. 65–70 2012, 32(104) z. 2 s. 65–70 Analysis of road accidents in Poland over the last ten years Rafał S. Jurecki, Marek Jaśkiewicz Kielce University of Technology, Department of Motor Vehicles and Transport 25-314 Kielce, Al. Tysiąclecia Państwa Polskiego 7, e-mail: {rjurecki;mjaskiewicz}@tu.kielce.pl Key words: accident, accident statistics, accident causes Abstract The following paper presents an analysis of the number of accidents, injuries and deaths over the last years. Accident trends have been identified in Poland with reference to different seasons. It includes an analysis of statistical data on both the number of vehicles, type of accidents occurring on roads and their causes. The evaluation of the road accidents’ effects has been carried out. Analysis of number of accidents and injured Increase of the number of cars in Poland is very significant [1]. Within 30 years the number of all motor vehicles registered in Poland increased from less than 3 million (in 1981) to 17 million (in 2010) (Fig. 1) [2]. Fig. 1. Number of passenger cars registered in Poland in the years 1981–2010 Number of passenger cars in Poland increased from approximately 2.7 million units in 1981 to more than 17 million in 2009 – which is more than 6 times [2]. An important parameter describing the number of cars is an indicator, determining the number of cars per 1000 inhabitants. In 2010, the number of cars per 1000 Poles was over 450 [3] and has been approaching the European average. Its first significant increase occurred in 1989 just when there was a change of a political system in Poland. Another major impulse for a change in that indica- tor was 2004 – Polish accession to the EU [2]. At this period of time trade exchange was simplified and customs duties on cars imported from the EU was abolished. A very high growth rate of this indi- cator in 2005–2009 is worth observing. If such dynamics keeps its level for another few years, then in 2013–2014 anexpected value of this ratio would be at the level of 550–600. If we apply the value of the above-mentioned indicator to the data from other countries, it follows from them that Poland is still in the group of coun- tries with relatively low motorization rate [4]. In 2005 the EU average was 472, while in 2006, 466 (in Poland respectively values of 323 and 351). Poland in the year of joining the EU (2004) was the leading country concerning the dynamics in number of cars [5]. The size of the indicator in the new EU countries increases year to year, while in the “old EU” changes very little [4] or even decreases. Number of road accidents in Poland in the years 1980–2010 underwent many changes (Fig. 2) [2]. At the turn of 1988–1991, i.e. in the first period after the change of a political system in Poland, it recorded first significant growth. Then, the number of accidents exceeded 50 thousand to reach in 1991 0 2000000 4000000 6000000 8000000 10000000 12000000 14000000 16000000 18000000 1981 1983 1985 1987 1989 1991 1993 1995 1997 1999 2001 2003 2005 2007 2009 Number of pasenger car Year

Welcome message from author
This document is posted to help you gain knowledge. Please leave a comment to let me know what you think about it! Share it to your friends and learn new things together.
Transcript

Zeszyty Naukowe 32(104) z. 2 65
Scientific Journals Zeszyty Naukowe Maritime University of Szczecin Akademia Morska w Szczecinie
2012, 32(104) z. 2 pp. 65–70 2012, 32(104) z. 2 s. 65–70
Analysis of road accidents in Poland over the last ten years
Rafał S. Jurecki, Marek Jaśkiewicz
Kielce University of Technology, Department of Motor Vehicles and Transport 25-314 Kielce, Al. Tysiąclecia Państwa Polskiego 7, e-mail: {rjurecki;mjaskiewicz}@tu.kielce.pl
Key words: accident, accident statistics, accident causes
Abstract The following paper presents an analysis of the number of accidents, injuries and deaths over the last years.
Accident trends have been identified in Poland with reference to different seasons. It includes an analysis
of statistical data on both the number of vehicles, type of accidents occurring on roads and their causes.
The evaluation of the road accidents’ effects has been carried out.
Analysis of number of accidents and injured
Increase of the number of cars in Poland is very
significant [1]. Within 30 years the number of all
motor vehicles registered in Poland increased from
less than 3 million (in 1981) to 17 million (in 2010)
(Fig. 1) [2].
Fig. 1. Number of passenger cars registered in Poland in the
years 1981–2010
Number of passenger cars in Poland increased
from approximately 2.7 million units in 1981 to
more than 17 million in 2009 – which is more than
6 times [2]. An important parameter describing the
number of cars is an indicator, determining the
number of cars per 1000 inhabitants. In 2010, the
number of cars per 1000 Poles was over 450 [3]
and has been approaching the European average. Its
first significant increase occurred in 1989 just when
there was a change of a political system in Poland.
Another major impulse for a change in that indica-
tor was 2004 – Polish accession to the EU [2]. At
this period of time trade exchange was simplified
and customs duties on cars imported from the EU
was abolished. A very high growth rate of this indi-
cator in 2005–2009 is worth observing. If such
dynamics keeps its level for another few years, then
in 2013–2014 anexpected value of this ratio would
be at the level of 550–600.
If we apply the value of the above-mentioned
indicator to the data from other countries, it follows
from them that Poland is still in the group of coun-
tries with relatively low motorization rate [4]. In
2005 the EU average was 472, while in 2006, 466
(in Poland respectively values of 323 and 351).
Poland in the year of joining the EU (2004) was the
leading country concerning the dynamics in number
of cars [5]. The size of the indicator in the new EU
countries increases year to year, while in the “old
EU” changes very little [4] or even decreases.
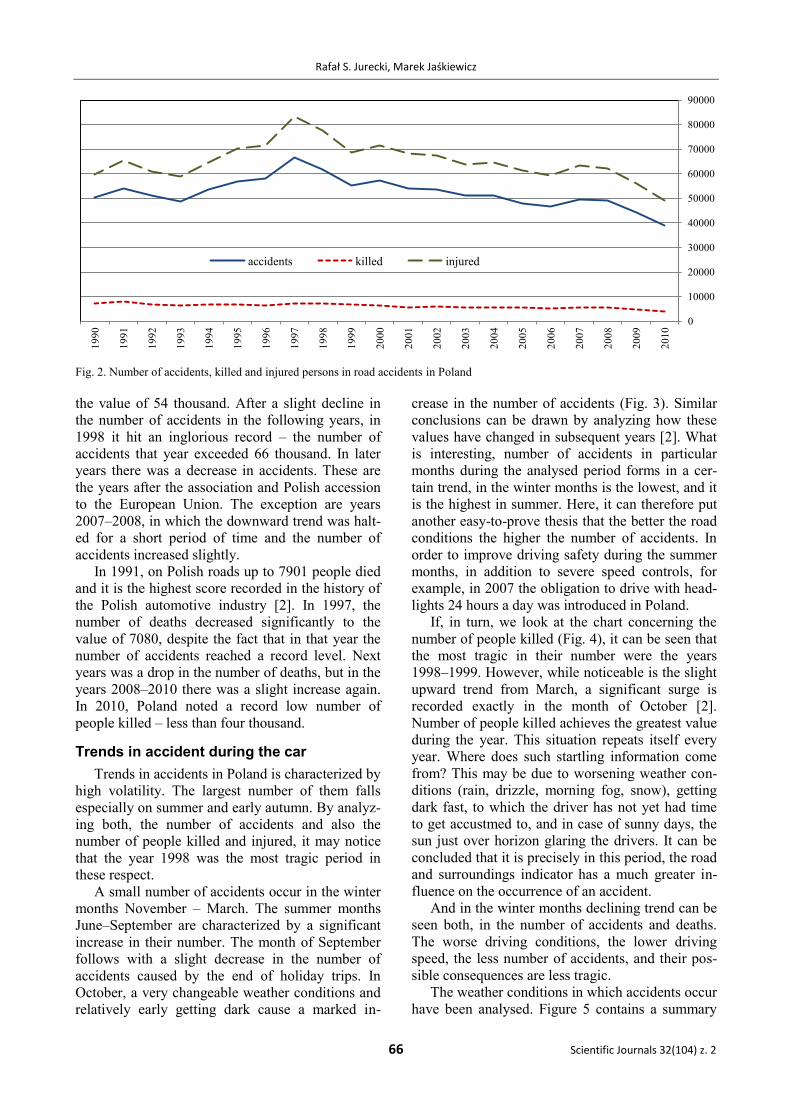
Number of road accidents in Poland in the years
1980–2010 underwent many changes (Fig. 2) [2].
At the turn of 1988–1991, i.e. in the first period
after the change of a political system in Poland, it
recorded first significant growth. Then, the number
of accidents exceeded 50 thousand to reach in 1991
0
2000000
4000000
6000000
8000000
10000000
12000000
14000000
16000000
18000000
19
81
19
83
19
85
19
87
19
89
19
91
19
93
19
95
19
97
19
99
20
01
20
03
20
05
20
07
20
09
Nu
mb
er o
f p
asen
ger
car
Year
Rafał S. Jurecki, Marek Jaśkiewicz
66 Scientific Journals 32(104) z. 2
the value of 54 thousand. After a slight decline in
the number of accidents in the following years, in
1998 it hit an inglorious record – the number of
accidents that year exceeded 66 thousand. In later
years there was a decrease in accidents. These are
the years after the association and Polish accession
to the European Union. The exception are years
2007–2008, in which the downward trend was halt-
ed for a short period of time and the number of
accidents increased slightly.
In 1991, on Polish roads up to 7901 people died
and it is the highest score recorded in the history of
the Polish automotive industry [2]. In 1997, the
number of deaths decreased significantly to the
value of 7080, despite the fact that in that year the
number of accidents reached a record level. Next
years was a drop in the number of deaths, but in the
years 2008–2010 there was a slight increase again.
In 2010, Poland noted a record low number of
people killed – less than four thousand.
Trends in accident during the car
Trends in accidents in Poland is characterized by
high volatility. The largest number of them falls
especially on summer and early autumn. By analyz-
ing both, the number of accidents and also the
number of people killed and injured, it may notice
that the year 1998 was the most tragic period in
these respect.
A small number of accidents occur in the winter
months November – March. The summer months
June–September are characterized by a significant
increase in their number. The month of September
follows with a slight decrease in the number of
accidents caused by the end of holiday trips. In
October, a very changeable weather conditions and
relatively early getting dark cause a marked in-
crease in the number of accidents (Fig. 3). Similar
conclusions can be drawn by analyzing how these
values have changed in subsequent years [2]. What
is interesting, number of accidents in particular
months during the analysed period forms in a cer-
tain trend, in the winter months is the lowest, and it
is the highest in summer. Here, it can therefore put
another easy-to-prove thesis that the better the road
conditions the higher the number of accidents. In
order to improve driving safety during the summer
months, in addition to severe speed controls, for
example, in 2007 the obligation to drive with head-
lights 24 hours a day was introduced in Poland.
If, in turn, we look at the chart concerning the
number of people killed (Fig. 4), it can be seen that
the most tragic in their number were the years
1998–1999. However, while noticeable is the slight
upward trend from March, a significant surge is
recorded exactly in the month of October [2].
Number of people killed achieves the greatest value
during the year. This situation repeats itself every
year. Where does such startling information come
from? This may be due to worsening weather con-
ditions (rain, drizzle, morning fog, snow), getting
dark fast, to which the driver has not yet had time
to get accustmed to, and in case of sunny days, the
sun just over horizon glaring the drivers. It can be
concluded that it is precisely in this period, the road
and surroundings indicator has a much greater in-
fluence on the occurrence of an accident.
And in the winter months declining trend can be
seen both, in the number of accidents and deaths.
The worse driving conditions, the lower driving
speed, the less number of accidents, and their pos-
sible consequences are less tragic.
The weather conditions in which accidents occur
have been analysed. Figure 5 contains a summary
0
10000
20000
30000
40000
50000
60000
70000
80000
90000
20
10
20
09
20
08
20
07
20
06
20
05
20
04
20
03
20
02
20
01
20
00
19
99
19
98
19
97
19
96
19
95
19
94
19
93
19
92
19
91
19
90
accidents killed injured
Fig. 2. Number of accidents, killed and injured persons in road accidents in Poland

Analysis of road accidents in Poland over the last ten years
Zeszyty Naukowe 32(104) z. 2 67
Fig. 3. Number of accidents in each month
Fig. 4. Number of people killed in accidents in particular months
Fig. 5. List of accidents and their percentage specifying the conditions under which they occurred

Rafał S. Jurecki, Marek Jaśkiewicz
68 Scientific Journals 32(104) z. 2
of accidents, taking into account weather conditions
in which they occurred and their percentage share.
Analyzing the data in the graph can be said that
good weather conditions unfortunately favour the
formation of accidents. Over 80% of accidents
arose because when the driving conditions were
good or it was cloudy, but there was no precipita-
tion. How to explain this phenomenon? The reasons
may be many such as the better conditions, the
more courageous drivers become, their vigilance is
smaller and moving at higher speeds cause acci-
dents with more serious consequences.
Similar charts apply to people killed in accidents
(Fig. 6) [2]. Observing the percentage graphs (on
the right) of shares we have the impression as if
they were the same. How to explain such a big
compatibility of these characteristics? It can cer-
tainly be argued that the percentage of accidents,
the number of people killed and injured determined
in individual months of the year, as was the case in
relation to all-year-round values, show a high corre-
lation. It is interesting that accidents are the least in
heavy traffic conditions during precipitation, fog.
Because of good weather conditions, both, the
number of people killed and injured prevails, and
therefore fundamental changes to improve safety
especially in such conditions should be made.
Of course, when analyzing these values it was
necessary to bear in mind the characteristic climate
of Poland, as in other countries, where other
weather conditions dominate, these values may be
different.
Accidents caused by drivers
It is worth looking at the types of accidents,
which prevailed in the years 1999–2010 on Polish
roads. Among the most common causes of acci-
dents (Fig. 7), three stand out:
– traffic collision (43–48%);
– running down a pedestrian (25–37%);
– hitting a tree or another road object (about 10%).
These three types of accidents comprise total of
almost 90% of all accidents. Hence, carried out
road investments, may in future years significantly
reduce their number. It is worth noting that the per-
centage share of accidents – the crash of vehicles in
traffic shows a slightly upward trend (Fig. 8).
A very high proportion of pedestrians involved
in road accidents is worth noting as it is one of
the highest in Europe. The reason for this may be
reflective elements apart from the tragic mistakes of
drivers, also serious deficiencies in the infrastruc-
ture: the lack of pavements, wide hard shoulders,
Fig. 6. Number of people killed and their percentage share depending on weather conditions
Fig. 7. Types of accidents in Poland [2] and their percentage share
Analysis of road accidents in Poland over the last ten years
Zeszyty Naukowe 32(104) z. 2 69
which residents of villages and small towns could
use after dusk, the lack of habit of wearing reflec-
tive clothes after dark, poorly labeled or poorly
visible pedestrian crossings, etc. However, while in
the case of a collision of vehicles in traffic a small
percentage increase has been recorded, in the case
of pedestrian collisions there is a clear downward
trend in the number of accidents. What could be the
reason for its cause? Perhaps, part of the road pro-
jects have already cast for use raises safety, and
perhaps, the reason for is increasing number of cars
and that many people instead of walking choose to
take a car.
The share of the third group in terms of percent-
age of accidents that is collisions of vehicles into
a tree or other object is immutable in recent years
and remains at about 15%. The occurrence of such
an accident can result from many causes. Firstly, it
results from the lack of the habit of proper lighting
of vehicles and other road objects (agricultural ma-
chinery, bicycles, construction work carried out,
which are left on the side of cars) especially impor-
tant during periods of limited visibility such as late
autumn. Despite the need for a warning triangle,
not all drivers know how and when to use it. Some
European countries use a number of provisions that
force drivers, for example, to possess and use
reflective vests when a driver leaves the vehicle
outside built-up areas. Secondly, the fact that a
large share of this group of accidents are associated
with the existing road infrastructure. There is often
impossible to find a safe place while running off the
road during a crash or other needs to stop. This
results in risks associated with the necessity of oc-
cupying one of the lanes by a particular object and
reducing traffic flow. Planting trees has been an-
other issue widespread on Polish roads (inherited
from the previous regime). Such solutions can be
visually attractive and beneficial for environmental
reasons but unfortunately are very high risky in
case a driver runs off the road. The effect of such
a collision is usually death or serious injury. Such
a solution is not used on new parts of roads, and
various types of protections are applied: barriers,
road barriers, reflective warnings before running
off, corresponding horizontal road markings etc.
The most common cause of accidents is a colli-
sion of vehicles in motion. Due to the imperfections
of Polish roads which are dominated by the road-
ways with non-divided lanes, such collisions unfor-
tunately entail tragic consequences.
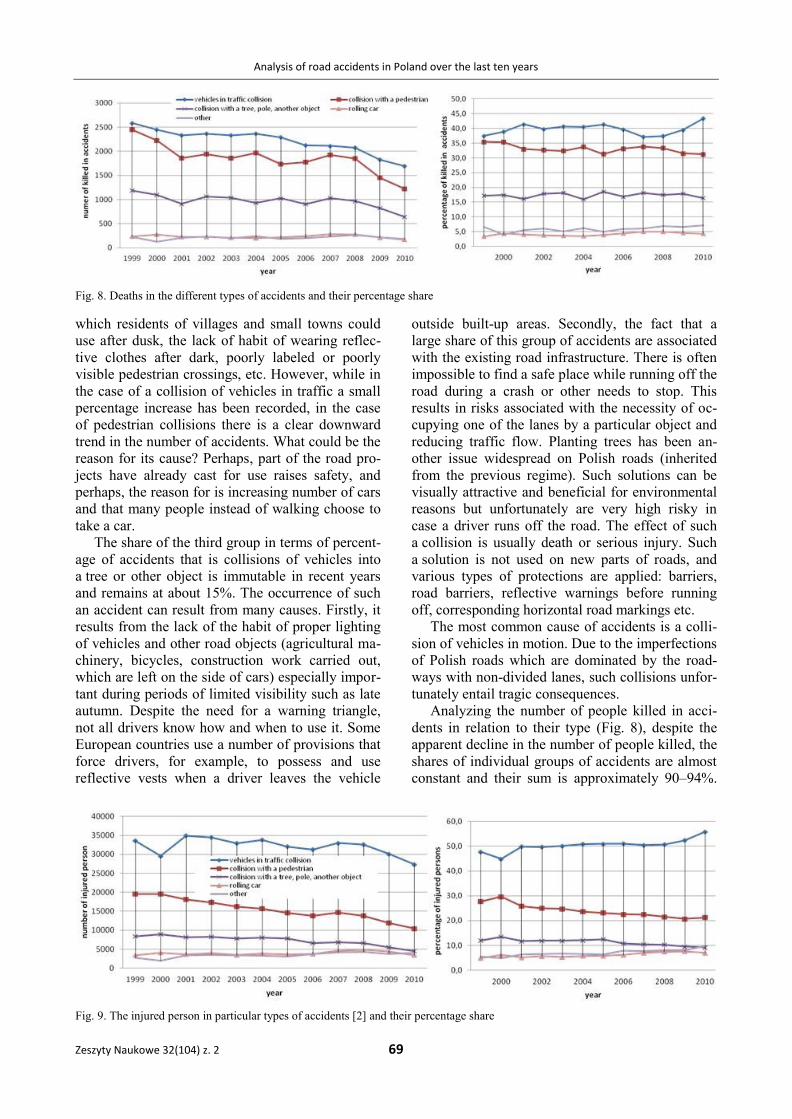
Analyzing the number of people killed in acci-
dents in relation to their type (Fig. 8), despite the
apparent decline in the number of people killed, the
shares of individual groups of accidents are almost
constant and their sum is approximately 90–94%.
Fig. 8. Deaths in the different types of accidents and their percentage share
Fig. 9. The injured person in particular types of accidents [2] and their percentage share
Rafał S. Jurecki, Marek Jaśkiewicz
70 Scientific Journals 32(104) z. 2
Accidents involving vehicles in traffic collisions
account for approximately 50% of all accidents and
fatalities account for about 43% of all deaths.
Attention needs to be paid on the group of accidents
involving pedestrians. These accidents have a 28%
share but fatalities account for almost 31% of all
deaths.
If we examine the number of people injured
(Fig. 9) at the turn of the last years we may observe
a clear decreasing trend in the case of the wounded
as a result of collisions on pedestrians or other road
objects. In the event of a collision of vehicles
in motion the share of people injured has not
decreased and has maintained and even slightly
increased.
Conclusions
Since the beginning of the automotive industry
road accidents are inseparably associated with road
traffic. The experience of other EU countries, in
which significant progress has been achieved in the
field of travellers’ safety, shows that the current
state of affairs in Poland in this area can and should
be changed. Some actions have been taken for
several years which aim at improving the situation
and for just a few years great investment has been
conducted to improve road infrastructure. In
addition to the good, safe roads, traffic monitoring
networks such as cameras and over-speed control
devices, the fundamental change in the approach of
the drivers themselves has to take place.
Unfortunately, perhaps in order to achieve the latter
goal, it will be necessary to introduce more
stringent legal and administrative sanctions against
persons who notoriously violate traffic regulations.
One also cannot forget here about educational and
preventive activities, which may also contribute to
a significant reduction in the number of road
accidents.
References
1. Materials of the Central Statistical Office of Poland
www.gus.gov.pl.
2. Road accidents in Poland, Reports, Materials from the
Police Headquarters, source site http://www.statystyka.
policja.pl.
3. Materials of the National Road Safety Board in Poland
http://www.krbrd.gov.pl.
4. EUROSTAT, Statistical Book Panorama of Transport,
2009, http://epp.eurostat.ec.europa.eu/cache/ITY_OFFPUB
/KS-DA-09-001/EN/KS-DA-09-001-EN.PDF
5. Materials of the General Directorate for National Roads
and Motorways (GDDKiA in Poland), http://www.gddkia.
gov.pl/article/drogi_i_mosty/autostrady//index.php.
Others
6. ZIELINSKA A.: Main problems of Road Safety on Polish
roads. Post-conference materials of the First International
Scientific Conference: Legal and economic and technical
aspects of safety of road communication, edited by Kazim-
ierz Lejda and Kazimierz Rajchel, Rzeszów 1997.
7. IRTAD Annual Report 2009, International Traffic Safety
Data and Analysis Group, http://internationaltransport-
forum.org/irtad/index.html.
8. A Record Decade for Road Safety, International Traffic
Safety Data and Analysis Group, http://www.international-
transportforum.org/Press/PDFs/ 2010-09-15IRTAD.pdf.
9. Accidents, International Traffic Safety Data and Analysis
Group, http://www.internationaltransportforum.org/statis-
tics/accident.pdf.
10. Road Accidents statistics in Europe, 2007 European Road
Safety Day Youth on the road safety is no accidents,
http://ec.europa.eu/lietuva/documents/1177679582_press_
stats_en.pdf.
11. Report of the National Road Safety Board, State of Traffic
Safety and the activities performed in this field in 2008,
http://www.mi.gov.pl/files/0/1791760/sprawozdanie2008ca
loscpoRM.pdf.
12. Statistical data http://www.nationmaster.com/graph/tra_
mot_veh-transportation-motor-vehicles.
13. The effects and costs of road accidents, Road and Safety
http://www.drogaibezpieczenstwo.org.pl/ UserFiles/File/
Skutki_i_koszty.pdf.
14. Statistical of the General Directorate for National Roads
and Motorways in Poland, http://www.gddkia.gov.pl/
article/drogi_i_mosty/autostrady//index.php?id_item_tree
=b56050f1573f8c11484235dcb4a72260
www.pbd.org.pl/file/get/hash/84b1fb
15. http://www.forbes.com/2008/07/30/energy-europe-auto-
mobiles-biz-energy-cx_wp_0730cars_slide_3.htm.
16. Road accidents in Poland and in selected EU countries,
Adam Kucharz, Department of Social and Economic
Analysis of the Parlament of the Republic of Poland, In-
formation No. 1144, August 2005.
17. EuroRAP, European Road Assesment programe http://ten-
t.eurorap.org.
18. White Paper – “European transport policy for 2010: time to
decide” http://ec.europa.eu/transport/strategies/2001_white
_paper_en.htm
19. Transport activity Results in 2009, Statistical Information
and elaboration, GUS, Warsaw 2010, 84–87.
Related Documents