Notes on Science, Waves, & Sound Notes on Science, Waves, & Sound James M. Fiore James M. Fiore

Welcome message from author
This document is posted to help you gain knowledge. Please leave a comment to let me know what you think about it! Share it to your friends and learn new things together.
Transcript
Notes on Science, Waves, & SoundNotes on Science, Waves, & Sound
James M. FioreJames M. Fiore

2
Notes on Science, Waves, & SoundNotes on Science, Waves, & Sound
by
James M. Fiore
Version 2.1.3, 18 March 2022
A companion to Laboratory Manual for Science of Sound, another free Open Educational Resource
3
This Notes on Science, Waves, and Sound, by James M. Fiore is copyrighted under the terms of a Creative Commons license:
This work is freely redistributable for non-commercial use, share-alike with attribution
Published by James M. Fiore via dissidents
For more information or feedback, contact:
James Fiore, Professor
Electrical Engineering Technology
Mohawk Valley Community College
1101 Sherman Drive
Utica, NY 13501
[email protected]@jimfiore.org
For the latest revisions, related titles, and links to low cost print versions, go to: www.mvcc.edu/jfiore or my mirror sites www.dissidents.com and www.jimfiore.org
YouTube Channel: Electronics with Professor Fiore
4
Table of ContentsTable of Contents
1. The Scientific Method 1. The Scientific Method .. .. .. .. .. .. .. .. 66
2. Facts Versus Theories 2. Facts Versus Theories .. .. .. .. .. .. .. .. 88
3. Cognitive Bias and Logical Fallacies 3. Cognitive Bias and Logical Fallacies .. .. .. .. .. .. 99
4. Scientific Notation 4. Scientific Notation .. .. .. .. .. .. .. .. 1212
5. The Metric System 5. The Metric System .. .. .. .. .. .. .. .. 1414
6. Introduction to Waves 6. Introduction to Waves .. .. .. .. .. .. .. .. 1717
7. Simple Harmonic Motion and Resonance 7. Simple Harmonic Motion and Resonance .. .. .. .. .. 2121
8. Pitch, Frequency, Overtones, Timbre and All That Stuff 8. Pitch, Frequency, Overtones, Timbre and All That Stuff .. .. .. 2626
9. Human Hearing 9. Human Hearing .. .. .. .. .. .. .. .. .. 2828
10. Basic Acoustics10. Basic Acoustics .. .. .. .. .. .. .. .. .. 3535
11. Loudspeakers and Microphones11. Loudspeakers and Microphones .. .. .. .. .. .. 3939
12. Digital Audio12. Digital Audio .. .. .. .. .. .. .. .. .. 4646
13. Musical Scales and Temperament.13. Musical Scales and Temperament. .. .. .. .. .. .. 5353
5
1 1 The Scientific MethodThe Scientific Method
The scientific method is a means of uncovering and explaining physical phenomena. It relies on observation andlogical reasoning to achieve insight into the actions and relations of the phenomena, and a means of relating it tosimilar items. The method starts with observations and measurements. Based on these and background knowledge such as mathematics, physics, the behavior of similar phenomena, and so on, a tentative explanation,or hypothesis, is derived. The hypothesis is then tested using experimental or field data. The precise nature of thetests depend on the area of study, but the idea will always be the same: namely to see if the predictions of the hypothesis are borne out under alternate applicable conditions or data sets. A proper hypothesis must be testable and falsifiable. That is, the hypothesis must be able to be proven wrong by subsequent observation. If it is not, then the hypothesis is better classified as philosophy. For example, Newtonian gravitation could be proven false by letting go of a suspended hammer and watching it remain motionless or fall upwards, rather than fall down toward the Earth. Similarly, Evolution could be proven false by the discovery of “fossil rabbits in the Precambrian”, to quote famous biologist J. B. S. Haldane (Haldane was being somewhat snippy, but in general, he meant anything that would be clearly out of the expected time-line, in this case a small mammal predating even the most simple creatures with backbones).
A hypothesis is tested by repeated cycles of prediction, observation and measurement, and also subject to peer review, that is, the critique of others in the field of study who may point out inconsistencies in the explanations or logic, errors in experimental design, and so on. This cycle continues until the weight of data and scientific opinion elevates the hypothesis to a theory. One might say that a theory is a hypothesis that has withstood the rigors of the scientific method. This cycle was well expressed by the Marquise du Châtelet1. She explained hypotheses as “probable propositions”. While it would only take one observation to falsify a hypothesis, several would be required to vindicate it: “each non-contradictory result would add to the probability of the hypothesis and ultimately…we would arrive at a point where its ‘certitude’ and even its ‘truth’, was so probable that we could not refuse our assent”.
It is important to note that the scientific usage of the word theory is entirely different from its popular usage, which is perhaps closer to hunch or seat-of-the-pants guess. Also, a scientific theory is not true in the same sense as a fact. Facts come in three main varieties: direct and indirect observations; and those that may be logically deduced. A direct observation is something that you have measured yourself, such as noting the time it takes for a ball to reach the ground when released from a given height. An indirect observation is something thatmay be inferred from other known quantities or proper historical data, such as “George Washington was the firstpresident of the United States of America”. An example of the third variety would be “If x is an even integer larger than four and smaller than eight, then x must be six”. At first glance, it may seem that facts are highest on the pecking order, but scientific theories are much more useful than facts because isolated facts have very little predictive capacity. It is the predictive and explanatory ability of theories that make them so powerful.
1 Du Châtelet was that most rare of 18th century women: a mathematician and physicist. She translated Newton’s Principia Mathematica into French and was also the lover of Voltaire. Unfortunately, after an affair with the poet Jean François de Saint-Lambert in her early 40s, she became pregnant and died six days after giving birth.
6

So a theory is a best estimate so far, a model to explain some observable aspect of the universe. It is understood that as our view of what is observable widens and our knowledge extends, so too a given theory may be refined. A good example is Newtonian Gravitation. This model was sufficient to describe the movements of the planets around the sun and is still used to plan the flight of space craft. In the early 1900s, however, Einstein’s Theory ofRelativity refined Newtonian Gravitation to include more extreme (relativistic) effects. It is important to note that we did not throw out Newton’s equations; rather, we now have a better understanding of the set of conditions under which they apply. While this trek towards more and more refinement is not truth in and of itself, to paraphrase the late Harvard paleontologist, Stephen Jay Gould, to ignore the weight of scientific data behind an established theory would be perverse.
7
2 2 Facts Versus TheoriesFacts Versus Theories
Ponder the following query: “If a fact is fundamentally true, isn’t it better than a theory?”
At first glance, it may appear that a fact is more valuable than a theory because the former is, by definition, true and unchangeable. The reality is that theories are much more useful to us than individual, isolated facts. Consider the following. Suppose you hold out a stone at arm’s length and let go. It drops to the ground. That’s a fact. You saw it happen. Unfortunately, by itself, it doesn’t tell you very much. Suppose you repeat this several times and each time the stone drops in precisely the same way as it did initially. This is beginning to get useful because you’re noticing a pattern, and patterns can be predictive. Now, suppose you pick up stones of differing sizes, say 100 grams, 200 grams, half a kilogram and a kilogram, and drop each of them in turn. You observe that they each hit the ground in the same amount of time. Further, you drop them from different heights and you notice that the higher up they are, the longer it takes for them to hit the ground, but they all take the same amount of time to reach the ground.
You might now formulate a hypothesis: namely that the mass of a stone doesn’t have an affect on how fast it falls from a given height and that height and fall time are directly related. Your hypothesis is predictive. Although you used only four sizes of stones and a few heights, your broadened hypothesis should apply to any stone dropped from any height. So now you (and a bunch friends) starting picking up random pairs of stones anddrop them from random heights, and sure enough, you see the same effect again and again. If you do this enough and it is continually verified without exception, you might even make a “law of falling stones”, particularly if you were able to quantify the times and heights through careful measurement and reduce the relation to a nice formula. It is useful because you can now predict what will happen with any stone dropped from any height. But this law is rather limited. It only applies to stones because you may have noticed that stones drop much faster than pieces of cork. While you might then proceed to make a “law of falling cork”, that would unnecessarily complicate things. Instead, you could take a step back and try to figure out why stones and cork both fall, but not at the same rate. Eventually, you might discover that the difference has to do with air friction and you can now create a law governing falling bodies in a frictionless environment. That’s even more useful than the original “law of falling stones”.
But even this new and improved “law of falling bodies” doesn’t offer a lot of insight into what is really going onin the larger scheme of things. Through repeated observations and experiments this could be extended to cover not just falling bodies on the earth, but the interactions between any bodies, including falling stones and cork on the moon, or the interaction between the earth and the sun, the sun and the other planets, the sun and other stars, and so on. What you’ll have arrived at is a full-blown theory of gravitation (Newtonian gravitation). Now that is an extremely useful tool. It helps us design airplanes, get satellites into orbit, even get people to the moon and back safely.
8
33 Cognitive Bias and Logical FallaciesCognitive Bias and Logical Fallacies
As humans, we need to recognize that we are fallible. No matter how good our intentions, we make mistakes and can be fooled. The first step toward reducing and ultimately eliminating these sources of error is to understand them. We will lump these into two broad categories: cognitive bias and logical fallacies.
Cognitive BiasCognitive Bias
A cognitive bias is an inclination toward looking at a situation in an unbalanced or unfair manner. Generally, people are not aware of these biases. One example is confirmation bias (AKA, confirmation of expected outcomes). That is, we expect (or hope) to see a certain result and thus we tend to overvalue evidence that confirms it while discounting evidence that contradicts it. One way to avoid this is through the use of a double-blind test. Suppose we wish to test a new drug to see if it is effective and safe. As we may have invested a lot of time and money developing the drug, it is only natural that we want it to work, and this may skew our analysis (unintentionally, of course). What we do is have a third party create two sets of pills; one is the drug under test and the other is a placebo (it looks like the other pill but does nothing). These sets are identified using codes known only to the third party. The sets are then given to the researchers who, in turn, give them to the patients. The important thing is that neither the patients nor the researchers know which pills are which. When the trial has run its course, the researchers (us) analyze the data to determine if any set of pills was successful. Only afterthe analysis is completed does the third party tell the researchers which set was real and which set was the placebo.
Another cognitive bias is the Dunning-Kruger effect, named after the two social psychologists who studied it. This states that the knowledge needed to determine if someone is competent in a certain field is competence in that same field. Thus, individuals who have low competence are not in a position to accurately evaluate their own level of competence. Consequently, these individuals often over estimate their competence. This is known as illusory superiority. To put it crudely, these individuals are too ignorant of the subject to understand just how ignorant they are. Among the highly competent, two other effects may be seen. First, the advanced individual may be keenly aware of any shortcomings or gaps in their competence and may undervalue their level as a result. Second, they may assume that their level of competence is typical, and that most people are therefore “at their level”.
It is useful to remember that in our increasingly complex and interdependent society, no one can be an expert at everything, or even at most things. Instead, it is likely that we are all largely ignorant of a majority of subjects and /or incompetent at a variety of skills.
9
Logical FallaciesLogical Fallacies
Logical fallacies represent faulty reasoning. They are “thinking traps” that people sometimes fall into. Familiarity with them will help reduce their occurrence. There are dozens of logical fallacies but we shall only investigate a representative few.
To help explain the process, we'll begin with a syllogism. This is, in essence, a simple argument. It starts with a major premise (a generalization) which is followed by a minor premise (a more specific statement). From these, we derive a conclusion. For example:
All humans breathe air. (major premise)Alice is a human. (minor premise)Therefore, Alice breathes air. (conclusion)
Errors can occur when either premise is false or when the conclusion does not follow (the latter being referred toas a non-sequitur). For example:
All fish live in water.Lobsters live in water.Therefore, lobsters are fish.
The problem with this is the linkage between the major and minor premises. Saying “all fish live in water” does not preclude something else (like a lobster or a sea snake or kelp) from living in water. Compare the prior example to this version:
All fish live in water.Trout are fish.Therefore, trout live in water.
While these examples may seem obvious, there are trickier versions. For example:
I am made of nothing but atoms.Atoms are not alive.Therefore, I am not alive.
Nope. Doesn't work. This error is called the fallacy of composition. Basically, it says that what is true of the parts must be true of the whole, and vice versa. It ignores the concept of emergent properties (consider the behavior of a single bird to a flock, or a single fish to a school).
The fallacy of composition can be illustrated without using a syllogism. Suppose you are in a crowded movie theater. If you stand up, you will have a better view of the screen. In contrast, it is not true that if everyone stands up, everyone will have a better view. In fact, everyone will most likely have a worse view. If one person stands, they are unique. That unique character is lost when everyone stands.
10
Turning to a different fallacy, the latin phrase post hoc ergo propter hoc can be translated as “Before this, therefore because of this”. This fallacy is sometimes referred to as the post hoc fallacy or the causation fallacy. It is an error regarding causality; the assumption being that because event A occurred before event B, then event A must have caused event B. On the surface, it seems logical enough. For example, you might see a lightning strike and then hear a clap of thunder. It seems reasonable to assume that the lightning caused the thunder (generally speaking, that is the case). On the other hand, you might wake up some morning when it's dark outside. Shortly thereafter, the sun rises. Obviously, your waking did not cause the sun to rise.
Another error involves proportional contribution to an outcome. Relative size is mistakenly seen as a determiner. That is, the error assumes that only large contributors have any sway in the outcome. Basically, this fallacy proposes that if something makes up only a small percentage of the total, then its effect must be minimal.This is easily proven wrong. As an example, the atmosphere of the Earth is comprised largely of nitrogen (78%) and oxygen (21%) along with a number of trace gases such as argon, carbon dioxide and so forth. If the atmosphere was suddenly altered so that it included just 0.1% hydrogen sulfide, every human would be dead after their first breath of this new combination.
Along with size, there is a similar issue regarding linearity of effect. A linear function is one that can be plotted as a straight line. More to the point, if we have a linear system, then doubling an input to that system doubles its effect. To wit, if you order two pieces of pie for dessert, it will cost twice as much as one piece. Many systems do not behave in a linear fashion. Systems or relationships can be logarithmic, square law, cubic, or follow someother characteristic. For instance, the braking distance of a car does not vary linearly with its speed, it varies in accordance with the square of its speed. Therefore, if you're traveling twice as fast, it doesn't take twice as far to come to a stop, it takes four (two squared) times farther to stop. Remember this the next time you're speeding down a highway.
The next two items sometimes appear in arguments for or against a proposition. They are the excluded middleand the ad hominem. The excluded middle presents a false set of choices. Essentially, it falsely reduces the set ofpossible outcomes and then proceeds to disprove all but one of them. By process of elimination, the remaining outcome should be true. For example, someone might complain that a politician would only support a particular bill if he was either stupid or a communist (or a fascist, take your pick). They then show that the politician is notstupid, so by their logic the politician must be a communist. Of course, there are any number of possible scenarios that have been excluded; for instance, the politician might have taken a hefty bribe to vote for the bill or the analysis of the bill by the complainer might be faulty.
Finally, ad hominem is a Latin term meaning “to the person”. The ad hominem attempts to disprove a point by arguing against the person making a claim, not the claim itself. For example, suppose Doug makes a claim in favor of a new theory of gravity. Fran's counter argument is that Doug is an evil person who likes to spray paint swear words on other people's pet cats, and therefore can't be trusted. The reality is that, in spite of his proclivityfor feline profanity, Doug's ideas regarding gravity might be spot on. Those ideas need to be addressed directly.
11
44 Scientific NotationScientific Notation
In any effort to reduce the cumbersome nature of very large and very small numbers, scientists and engineers use scientific notation. This removes the problem of excessive leading and trailing zeroes. For example, considerthe value 17,000,000,000,000. It might take you a moment to note that this is commonly referred to as “17 trillion”. Similarly, it takes more than a few seconds to see that 0.0000000032 is “3.2 billionths” or even “32 ten-billionths”. As scientists and engineers use very large and very small numbers frequently, keeping track of all of those zeroes can be a pain and a source of error. With scientific notation, a number is expressed as two parts: first a mantissa, or “precision part”, and secondly an exponent which tells you the magnitude or “scale of largeness”. The exponent is basically a power to which the number 10 is raised. You can also think of it as the number of zeroes trailing. The first example, 17,000,000,000,000 would be written as 17 times 10 to the 12th power, or 17 times 1012. Note that there are 12 trailing zeroes. The value 5,600,000,000 could be written as 56 times 108, noting the 8 trailing zeroes. It could also be written as 5.6 times 109. (If the power of 10 is a multiple of 3, that is, it corresponds to one of those place-holding commas; we call it engineering notation- more on this in a moment.) Continuing, if you imagine moving the decimal point of 0.0000000032 to the right, you’d move it9 times to get between the 3 and 2. This would be 3.2 times 10-9, the negative power indicating a shift right rather than left (i.e., smaller than 1). This value may be written as 32 times 10-10 as well. On a normal scientific calculator, there is a further shortcut: The exponent button, which is typically labeled E, EXP or EE. So, to enter the last example, you’d type in 3.2E-9 or 3.2EE-9 or 3.2EXP-9. (For consistency, we will always use a single E for descriptions from here on.)
Certainly, it is much more compact and less prone to transcription error to write 4.32 times 10-9 than 0.00000000432 (and better still to use 4.32E-9); but, there is an even better reason to use this form, and that’s when multiplying or dividing values.
1. When multiplying two values in scientific notation, multiply the two mantissas (the precision parts) and then add the exponents. For example, 3.2E9 times 2E-3 is 6.4E6. You can probably do that in your head whereas 3,200,000,000 times 0.002 may not be so obvious.
2. When dividing two values in scientific notation, divide the two mantissas and then subtract the exponents. Forexample, 3.2E9 divided by 2E-3 is 1.6E12 (remember, subtracting a negative three is the same as adding a positive three).
To further simplify, we give names to powers that are multiples of three:
109 Giga (billions) Use the letter G as a shortcut106 Mega (millions) Use the letter M as a shortcut103 Kilo (thousands) Use the letter K as a shortcut10-3 milli (thousandths) Use the letter m as a shortcut10-6 micro (millionths) Use the letter µ (the Greek letter mu) as a shortcut10-9 nano (billionths) Use the letter n as a shortcut
12

So, for our earlier example of 0.0000000032, we can say 3.2n (3.2 nano, or 3.2E-9 or 3.2 times to 10-9). We then apply these prefixes to whatever it is we are measuring. If we are measuring distance, we’d use meters (1 meter is approximately 39.37 inches). If it’s sort of far, like the Boilermaker Road Race, we’d use kilometers. The Boilermaker is 15k, or 15,000 meters (about 9.3 miles). If the distance is fairly small, like the parameters of an integrated circuit chip, we might use micrometers (millionths of a meter). If you want to impress your friends, run the Boilermaker and tell them that you just ran 15 times 109 micrometers!
13
55 The Metric SystemThe Metric System
Consider the following: The United States of America is the only country of any economic consequence on the planet that still widely uses a system of measurement based on the old English/Imperial system, what we'll call the US customary system. Every other country uses metric (yes, even over in England they chucked the old system). So here is the USA as the last holdout, the last kid on the block, still clinging to its precious feet, inches, pounds, gallons, and so forth. Why is this? After all, it is reasonable to assume that unless the US customary system is somehow easier to use or more accurate than the metric system, the USA must be suffering some productivity losses since no other country “speaks the same language”. Clearly, manufacturers are going tohave a tough time selling non-metric parts in metric markets. Thus, it is fair to ask:
1. Is the US customary system more accurate than the metric system?
2. Is the US customary system easier to use than the metric system?
3. If items 1 and 2 are not true, why is the USA still using the US customary system?
Let's take a look, shall we?
The accuracy of any system of measurement is only as good as its standards and tools. There is no fundamental reason why one system must be more accurate than the other. In practice though, it may well be that the tools offered in one system are superior due to the large number of users (perhaps solely in terms of cost/performance). This would tend to put the US customary system at a disadvantage these days, but let's be cautious and call this even since we don't have any hard data to verify this hypothesis.
Is the US customary system easier to use than the metric system? To hear some people talk, you might think so. For example, in the 1970s when the USA was considering to make a voluntary transition to metric, grocery items were labeled with metric equivalents. Also, people were inundated with news clips concerning how to convert from one system to the other. “There are 2.2 pounds in each kilogram, Johnny, and a kilometer is about 0.62 miles.” People found this confusing, especially since they didn't really understand all this business about kilo and milli and so forth. All of the measurements seemed to contain parts of the same words. This became particularly nasty when someone would go into a store and see a bag of chips labeled as “454 grams” next to their beloved “1 pound”. They must have been thinking “Argh, how can this be made easier? I can remember 1 pound, but I can't remember 454 grams. It's just dumb.” And thus, this author believes, there grew an inherent distaste of the metric system in the USA (of course, the fact that this is a system developed and used by so-called foreigners may have something to do with it as well).
Let's flip the labels. Imagine you walk into a store and instead of seeing a nice round figure like “1 pound”, you see a nice round figure like “500 grams”. By doing this, the US customary equivalent gets all of the ugly trailingdigits that no one likes. Neat to be sure, but this is just a cute psychological trick. After all, no one buys items in a grocery store based solely on the amount specified on the label. People buy things by relative size. The average person looks at a bag of pretzels and thinks “This should be enough for the party”. They don't calculate
14
that they'll need precisely 22 ounces and then buy a 22 ounce bag. It's for this very reason that manufacturers make “almost round” weights. Where it was once common to buy 1 pound (16 ounce) bags of chips, you can now find 15.5 ounce bags, 14.75 ounce bags and so on. After all, if you reduce the size while keeping the stickerprice the same, your profit grows. Most people won't even notice that what they bought isn't quite a pound. To alleviate this problem, the government decided that it would be good to place unit pricing stickers on the shelves, indicating the actual cost per pound, per ounce, and so forth. One problem here is that one bag of cookies may give the unit price per ounce while another gives it per pound. The average consumer isn't going to attempt the ounces/pounds conversion in their head.
A case in point is the big bottle of soda. At one time it was normal to buy one or two quart bottles of soda. Thesedays, you couldn't find a two quart bottle of soda if your life depended on it. Instead, your local grocery is packed with 2 liter bottles of soda. If you look closely, you'll note that it says “2 liters (67.6 fluid ounces, 2 quarts 3.6 fluid ounces)”. Like the guy with the pretzels, people don't have a problem with this conversion since there is no conversion to be made! People think “This looks big enough” and they buy it. That's it. They don't gohome and dump 3.6 fluid ounces down the drain because they really wanted 2 quarts. Further, this author has never heard of a case were someone inadvertently bought way too much soda because they screwed up the conversion between quarts and liters. After all, if they mistakenly figured that 3 quarts was about 45 liters, they'ddiscover their error pretty quickly in the soda aisle. Interestingly, it is worth noting that while Americans are finewith liter soda bottles, they are still forced to buy their dairy products by the quart or gallon.
In short, we've seen that the average American had no trouble replacing their US customary soda bottles with metric soda bottles. If they can do this, they should be able to handle any other measurement. “But”, you ask, “why would they want to?” The simple answer is (drum roll please...)
Because the metric system is far easier to use than the US customary system.
What? What about all of those conversions? Forget the conversions. Remember this: You only need conversions if you plan on using both systems simultaneously. The USA has no reason to use both since it's the only country that still uses the US customary system. If the USA abandons these units, everyone will speak the common language of metric units. We won't ever need pounds, feet, miles, gallons, or teaspoons again. No longer will school children (and adults alike) be plagued with questions like “How many feet are there in 2.5 miles?” (remember now, there's 5280 feet in one mile - what a nice round figure.) “If I play a 7200 yard golf course, how many miles did I walk?” (let's see, 3 feet per yard, 5280 feet per mile...) “A recipe calls for 1/4 cup of waterfor 8 servings. If this is reduced to 3 servings, how many tablespoons of water are required?” If we switch, the only people that will need to care about conversions are historians.
The main problem with the US customary system is that it has so many names for the same thing. We have something we call weight. If it's on a human scale, we have a unit called pounds. If it's a lot bigger, we have tons. If it's smaller we have ounces. The killer is that we have weird conversions between them. 2000 pounds make one ton, but only 16 ounces make one pound. We've got gallons for liquid measure. Four quarts make one gallon. Two pints make one quart. Two cups make one pint. 16 ounces make one cup (or is it 8? Never mind the fact that we already used the term “ounces” for weight.) What's going on here? How about a little consistency? The US customary system makes it difficult to combine or split quantities because you have these goofy conversion factors.
15
In contrast, the metric system really only has one unit for each item of measurement. If we're talking distance, then we're talking meters (for those of you who positively need the conversion, it's about 10% more than one yard. If you play golf, think meters. It's just like those liter soda bottles.) For bigger distances, we just stick a “kilo” in front which means “1000”. (If you're reading this from a computer, you must be familiar with terms like kilobytes and megabytes, right? “Mega” is short for “one million”.) If we're talking about small distances, we reduced this to millimeters or even micrometers (milli is 1/1000 and micro is 1/million). The key here is that to translate from big units to small units all we have to do is move a decimal point. To put feet into miles you have to divide feet by 5280. What a pain. To put 2300 meters into kilometers is easy! Just move the decimal 3 places and you've divided by 1000 (2.3 kilometers, or in long hand 2.3 times 1000 meters).
So, for distance (feet, miles, etc.) we'll use meters, for liquid measure (gallons, cups, etc.) we'll use liters, and forweight (pounds, tons, etc.) we'll use grams. (Technically, grams represent mass, not weight. Weight depends on the gravitational field you're in while mass doesn't. If you don't plan on moving to Mars any time soon, don't worry about it.)
Now if you still have doubts about the logic behind this system, just imagine taking a system wherein you already use powers-of-ten and replace it with something entirely inconsistent. Consider US currency. There are dollars and there are cents (100 cents to the dollar, pretty easy). For larger quantities you might use “kilo dollars” as in “That new job starts at $55k”. Imagine that instead of the existing system, there were 12 cents to the zarg and 15 zargs made a dollar. Also, 3400 dollars made a fliknek. So, you might read an advert for a job which pays 16.5 flikneks and another for a new car at 9 flikneks, 299 dollars. A big of chips? Maybe 3 dollars, 9 zargs. Does this sound like a logical system, a system you'd prefer over the current system? If not, why not?
If you find the metric system confusing, make the following changes to your vocabulary. Instead of saying yards, say meters. Instead of saying quarts, say liters. Instead of saying pounds, cut it in two and say kilograms. These approximations are accurate to within 10% and that's good enough for everyday conversation. After a while, this will come naturally, and you'll begin to get a sense of the size of things like kilometers or milliliters. After all, humans are amazingly adaptable, and familiarization will bring this. Indeed, there are many industries and pursuits in which individuals use the metric system on a daily basis. (Ask any engineer, chemist, or physicistfor starters.)
Our third and final question asks why the USA hasn't switched completely to the metric system. This author doesn't have a good answer. It might have something to do with short-term thinking, greed, stupidity, ignorance, or simple inertia. Just how much does it cost the USA to not go metric? Well for starters, how about the 125 million dollar Mars Climate Orbiter that took a nose-dive into the surface of the red planet in 1999 because a sub-contractor used US customary units instead of metric? At the time, some folks were talking about a failure of a cross-checking system to catch these sorts of errors, conveniently ignoring the fact that the money and time spent on such a system would not be needed at all if the USA just went metric. One newspaper article noted that 95% of the planet currently uses metric. This factoid is particularly humorous when you realize that that non-metric 5% is the USA! (The USA currently accounts for approximately 5% of the global population.)
One thing is clear, there's no need for it to stay this way, and there are good reasons to change. Just say no to the US customary system of measurement. The brain you save may be your own.
16
66 Introduction to WavesIntroduction to Waves
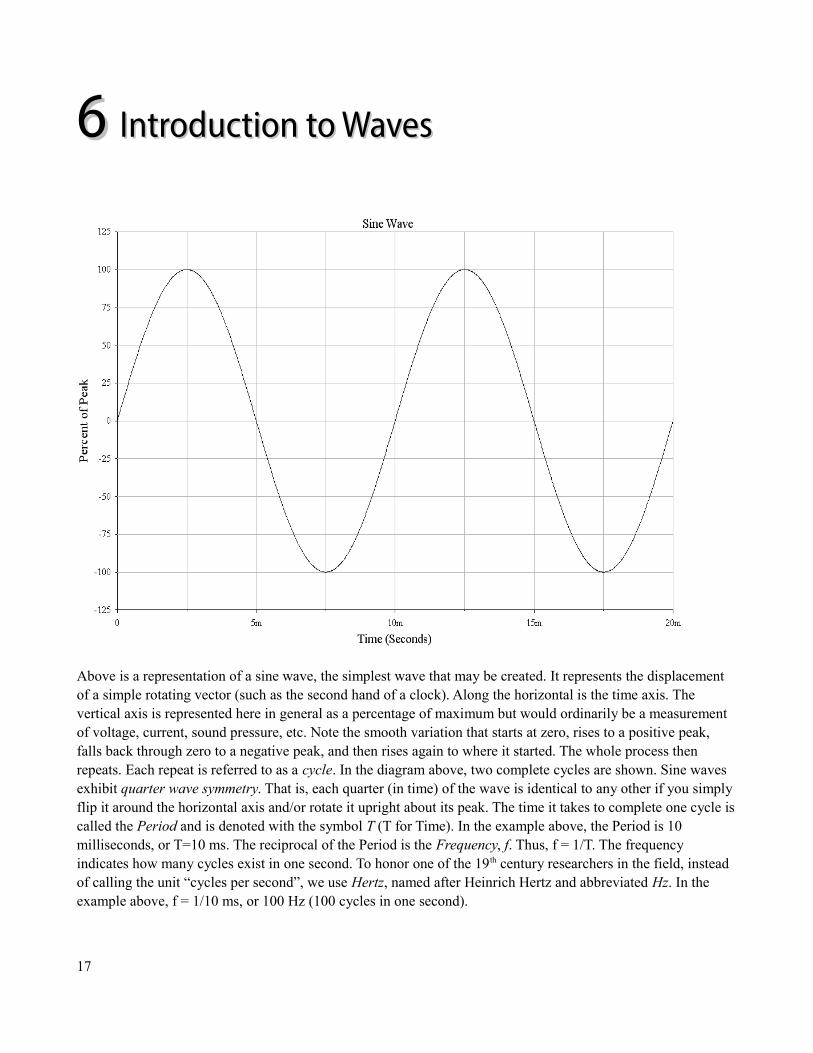
Above is a representation of a sine wave, the simplest wave that may be created. It represents the displacement of a simple rotating vector (such as the second hand of a clock). Along the horizontal is the time axis. The vertical axis is represented here in general as a percentage of maximum but would ordinarily be a measurement of voltage, current, sound pressure, etc. Note the smooth variation that starts at zero, rises to a positive peak, falls back through zero to a negative peak, and then rises again to where it started. The whole process then repeats. Each repeat is referred to as a cycle. In the diagram above, two complete cycles are shown. Sine waves exhibit quarter wave symmetry. That is, each quarter (in time) of the wave is identical to any other if you simply flip it around the horizontal axis and/or rotate it upright about its peak. The time it takes to complete one cycle iscalled the Period and is denoted with the symbol T (T for Time). In the example above, the Period is 10 milliseconds, or T=10 ms. The reciprocal of the Period is the Frequency, f. Thus, f = 1/T. The frequency indicates how many cycles exist in one second. To honor one of the 19th century researchers in the field, instead of calling the unit “cycles per second”, we use Hertz, named after Heinrich Hertz and abbreviated Hz. In the example above, f = 1/10 ms, or 100 Hz (100 cycles in one second).
17
Another item of interest is the speed of propagation of the wave. This varies widely. In the case of light in a vacuum (or to a close approximation, an electrical current in a wire), the velocity is approximately 3E8 meters per second (i.e., 3 times ten to the eighth power, or 300,000,000) or about 186,000 miles per second. In the case of sound in air at room temperature, the velocity is around 343 meters per second (about 767 MPH or 1125 feet per second). Sound waves through other media such as steel or helium are considerably different (in the case of helium, almost three times faster, in the case of water, about 4.3 times faster). The velocity of sound waves will also change with temperature. For “human comfortable” temperatures, the speed of sound in air increases by about 0.6 meters per second per degree celsius (almost one foot per second per degree Fahrenheit). Based on these values, we can compute that it will take the sound from an explosion one mile away (5280 feet) a little lessthan 5 seconds to reach the listener (5280 feet/1125 feet per second). Similarly, the round trip of a radio wave from the Earth up to a communications satellite in geosynchronous orbit and back (about 22,000 miles one-way), would be a little less than a quarter of a second (44,000 miles/186,000 miles per second).
Given a velocity and a period, you can imagine how far apart the peaks of the wave are. This distance is called the wavelength and is denoted by the Greek letter lambda λ. Wavelength is equal to the velocity divided by the frequency, λ = v/f. Thus, for the 100 Hz waveform above, if this represents sound in air, λ = 343 m/s / 100 Hz, or3.43 meters (a little over 11 feet). Notice that the higher the frequency, the shorter the wavelength. Also, note that the faster the velocity, the shorter the wavelength. This explains the common trick of “sounding like DonaldDuck” by taking a breath of helium. The speed of sound in helium is much faster than that of air, so it can cover a given distance in less time. The distance in this case is the length of your vocal tract. The decrease in time corresponds to a shorter period and thus, a higher frequency. (This is a simplified explanation as the real situation is a bit more complicated, involving vocal tract resonances which alter the formants of the voice, and thus the timbre.)2
The amplitude (vertical) of the wave can be expressed as a peak quantity, which would be the change from the center zero line up to the most positive value. Amplitude may also be expressed as peak-to-peak, the distance from the most negative to the most positive. Note that for a sine wave this will always be twice the peak value, although for other sorts of waves which may be asymmetrical, that may not be the case. Alternately, amplitude may be given as an RMS (Root Mean Square) value. RMS is a special calculation used for finding equivalent DC power (very common, for example, with audio power amplifiers). For sine waves, RMS is always the peak value divided by the square root of two (approximately 1.414). As one over the square root of two is approximately equal to 0.707, the RMS value of any sine wave is approximately 70.7 percent of its peak value. Again, this ratio would not necessarily be true of non-sine waves, and we will not concern ourselves with computing those other ratios. Finally, the ratio of the peak value to the RMS value is called the crest ratio. This is a fixed value for sine waves (again, about 1.414), but can be over 10:1 for some kinds of audio signals.
2 Please do not play around with helium inhalation! It is possible to starve your brain of oxygen when doing this.
18
Example ProblemsExample Problems
Assume the velocity of sound in air is 343 m/s (about 1125 feet per second).
1. The open E string of a standard tuned guitar is approximately 82 Hz. What is the period of this wave and whatis its wavelength.
2. You see a flash of lightning and then, 2.5 seconds later, you hear the accompanying thunder crash. How far away was the lightning strike?
3. Suppose you toss a pebble into a pool of liquid. As the ripples move past you, you time them and discover that the peaks come by every two seconds. Also, you note that the peaks are moving along at a rate of 4 meters per second. What is the frequency of the wave and what is the wavelength?
4. While watching fireworks you see a bright flash followed by an explosion. If you are 2000 feet from the explosion, what is the time lag between the flash and the sound?
19
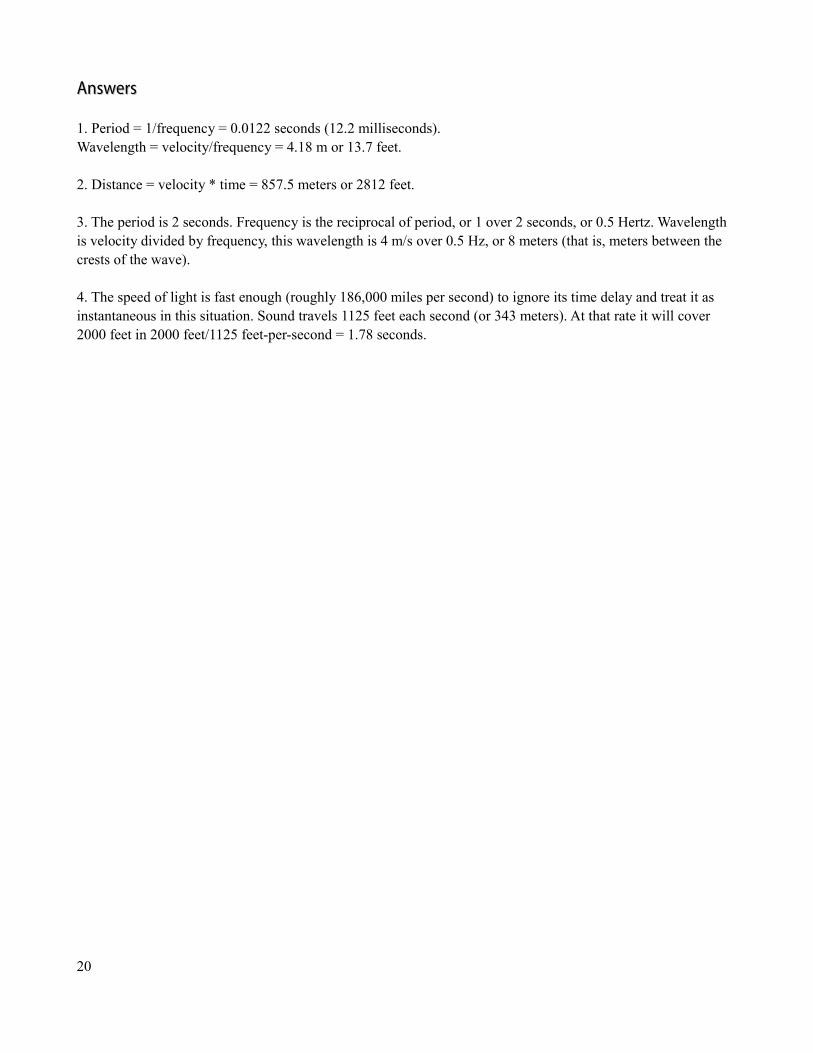
AnswersAnswers
1. Period = 1/frequency = 0.0122 seconds (12.2 milliseconds).Wavelength = velocity/frequency = 4.18 m or 13.7 feet.
2. Distance = velocity * time = 857.5 meters or 2812 feet.
3. The period is 2 seconds. Frequency is the reciprocal of period, or 1 over 2 seconds, or 0.5 Hertz. Wavelength is velocity divided by frequency, this wavelength is 4 m/s over 0.5 Hz, or 8 meters (that is, meters between the crests of the wave).
4. The speed of light is fast enough (roughly 186,000 miles per second) to ignore its time delay and treat it as instantaneous in this situation. Sound travels 1125 feet each second (or 343 meters). At that rate it will cover 2000 feet in 2000 feet/1125 feet-per-second = 1.78 seconds.
20
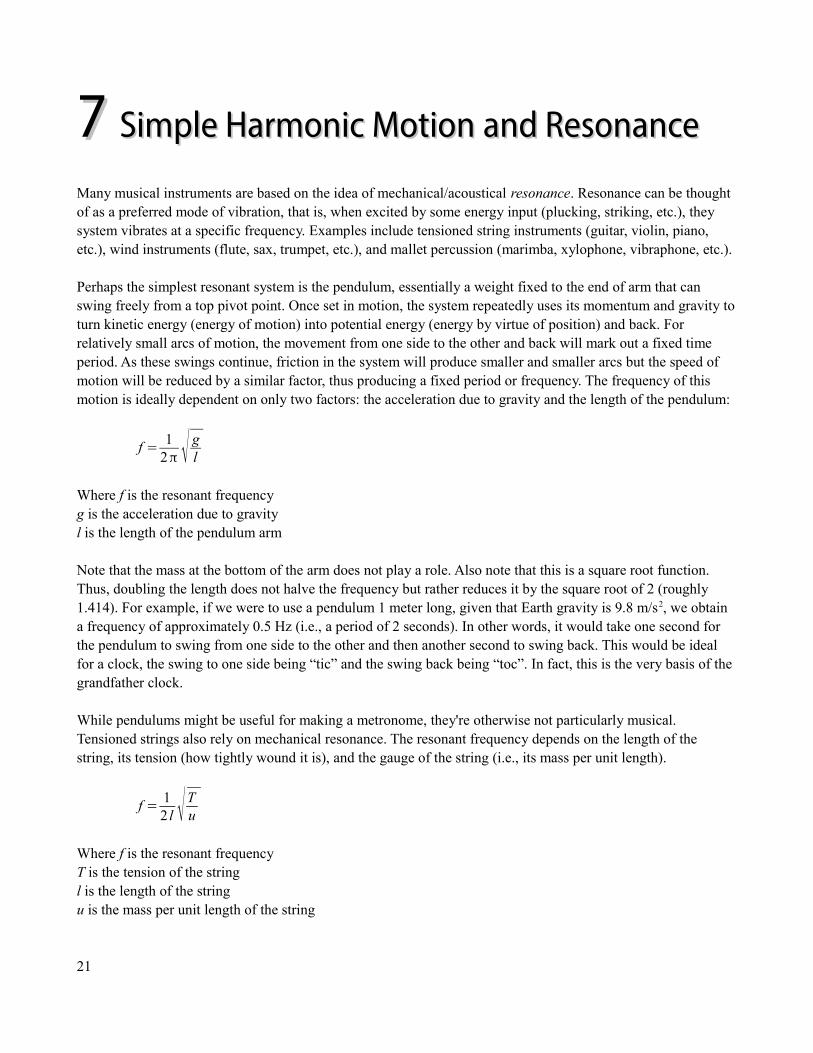
77 Simple Harmonic MotionSimple Harmonic Motion and Resonance and Resonance
Many musical instruments are based on the idea of mechanical/acoustical resonance. Resonance can be thought of as a preferred mode of vibration, that is, when excited by some energy input (plucking, striking, etc.), they system vibrates at a specific frequency. Examples include tensioned string instruments (guitar, violin, piano, etc.), wind instruments (flute, sax, trumpet, etc.), and mallet percussion (marimba, xylophone, vibraphone, etc.).
Perhaps the simplest resonant system is the pendulum, essentially a weight fixed to the end of arm that can swing freely from a top pivot point. Once set in motion, the system repeatedly uses its momentum and gravity toturn kinetic energy (energy of motion) into potential energy (energy by virtue of position) and back. For relatively small arcs of motion, the movement from one side to the other and back will mark out a fixed time period. As these swings continue, friction in the system will produce smaller and smaller arcs but the speed of motion will be reduced by a similar factor, thus producing a fixed period or frequency. The frequency of this motion is ideally dependent on only two factors: the acceleration due to gravity and the length of the pendulum:
f =1
2π √ gl
Where f is the resonant frequencyg is the acceleration due to gravityl is the length of the pendulum arm
Note that the mass at the bottom of the arm does not play a role. Also note that this is a square root function. Thus, doubling the length does not halve the frequency but rather reduces it by the square root of 2 (roughly 1.414). For example, if we were to use a pendulum 1 meter long, given that Earth gravity is 9.8 m/s2, we obtain a frequency of approximately 0.5 Hz (i.e., a period of 2 seconds). In other words, it would take one second for the pendulum to swing from one side to the other and then another second to swing back. This would be ideal for a clock, the swing to one side being “tic” and the swing back being “toc”. In fact, this is the very basis of the grandfather clock.
While pendulums might be useful for making a metronome, they're otherwise not particularly musical. Tensioned strings also rely on mechanical resonance. The resonant frequency depends on the length of the string, its tension (how tightly wound it is), and the gauge of the string (i.e., its mass per unit length).
f =12 l √T
u
Where f is the resonant frequencyT is the tension of the stringl is the length of the stringu is the mass per unit length of the string
21
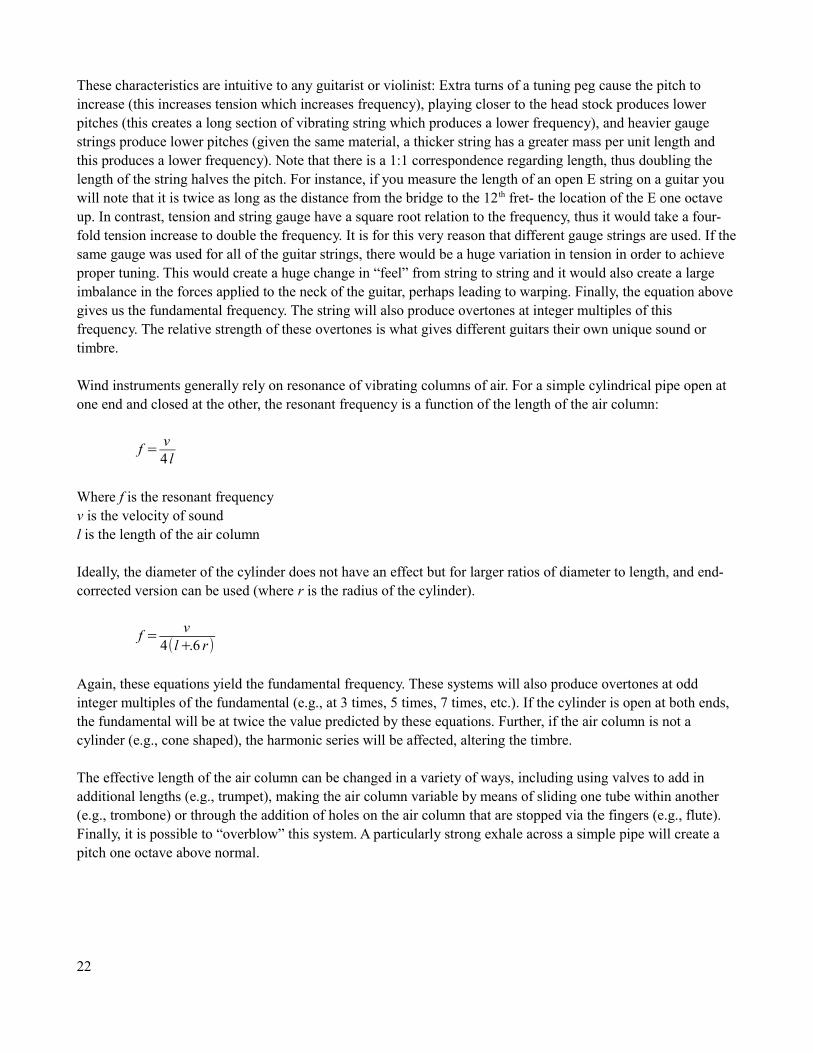
These characteristics are intuitive to any guitarist or violinist: Extra turns of a tuning peg cause the pitch to increase (this increases tension which increases frequency), playing closer to the head stock produces lower pitches (this creates a long section of vibrating string which produces a lower frequency), and heavier gauge strings produce lower pitches (given the same material, a thicker string has a greater mass per unit length and this produces a lower frequency). Note that there is a 1:1 correspondence regarding length, thus doubling the length of the string halves the pitch. For instance, if you measure the length of an open E string on a guitar you will note that it is twice as long as the distance from the bridge to the 12th fret- the location of the E one octave up. In contrast, tension and string gauge have a square root relation to the frequency, thus it would take a four-fold tension increase to double the frequency. It is for this very reason that different gauge strings are used. If thesame gauge was used for all of the guitar strings, there would be a huge variation in tension in order to achieve proper tuning. This would create a huge change in “feel” from string to string and it would also create a large imbalance in the forces applied to the neck of the guitar, perhaps leading to warping. Finally, the equation abovegives us the fundamental frequency. The string will also produce overtones at integer multiples of this frequency. The relative strength of these overtones is what gives different guitars their own unique sound or timbre.
Wind instruments generally rely on resonance of vibrating columns of air. For a simple cylindrical pipe open at one end and closed at the other, the resonant frequency is a function of the length of the air column:
f =v4 l
Where f is the resonant frequencyv is the velocity of soundl is the length of the air column
Ideally, the diameter of the cylinder does not have an effect but for larger ratios of diameter to length, and end-corrected version can be used (where r is the radius of the cylinder).
f =v
4(l+.6 r)
Again, these equations yield the fundamental frequency. These systems will also produce overtones at odd integer multiples of the fundamental (e.g., at 3 times, 5 times, 7 times, etc.). If the cylinder is open at both ends, the fundamental will be at twice the value predicted by these equations. Further, if the air column is not a cylinder (e.g., cone shaped), the harmonic series will be affected, altering the timbre.
The effective length of the air column can be changed in a variety of ways, including using valves to add in additional lengths (e.g., trumpet), making the air column variable by means of sliding one tube within another (e.g., trombone) or through the addition of holes on the air column that are stopped via the fingers (e.g., flute). Finally, it is possible to “overblow” this system. A particularly strong exhale across a simple pipe will create a pitch one octave above normal.
22
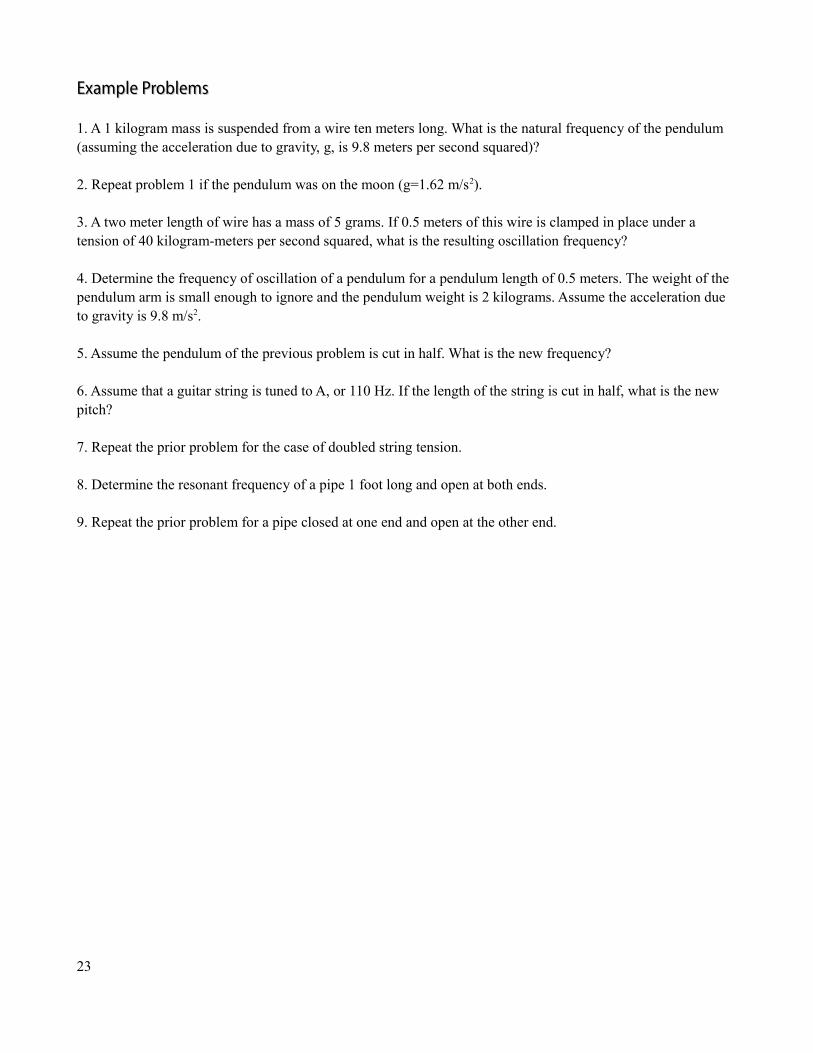
Example ProblemsExample Problems
1. A 1 kilogram mass is suspended from a wire ten meters long. What is the natural frequency of the pendulum (assuming the acceleration due to gravity, g, is 9.8 meters per second squared)?
2. Repeat problem 1 if the pendulum was on the moon (g=1.62 m/s2).
3. A two meter length of wire has a mass of 5 grams. If 0.5 meters of this wire is clamped in place under a tension of 40 kilogram-meters per second squared, what is the resulting oscillation frequency?
4. Determine the frequency of oscillation of a pendulum for a pendulum length of 0.5 meters. The weight of the pendulum arm is small enough to ignore and the pendulum weight is 2 kilograms. Assume the acceleration due to gravity is 9.8 m/s2.
5. Assume the pendulum of the previous problem is cut in half. What is the new frequency?
6. Assume that a guitar string is tuned to A, or 110 Hz. If the length of the string is cut in half, what is the new pitch?
7. Repeat the prior problem for the case of doubled string tension.
8. Determine the resonant frequency of a pipe 1 foot long and open at both ends.
9. Repeat the prior problem for a pipe closed at one end and open at the other end.
23
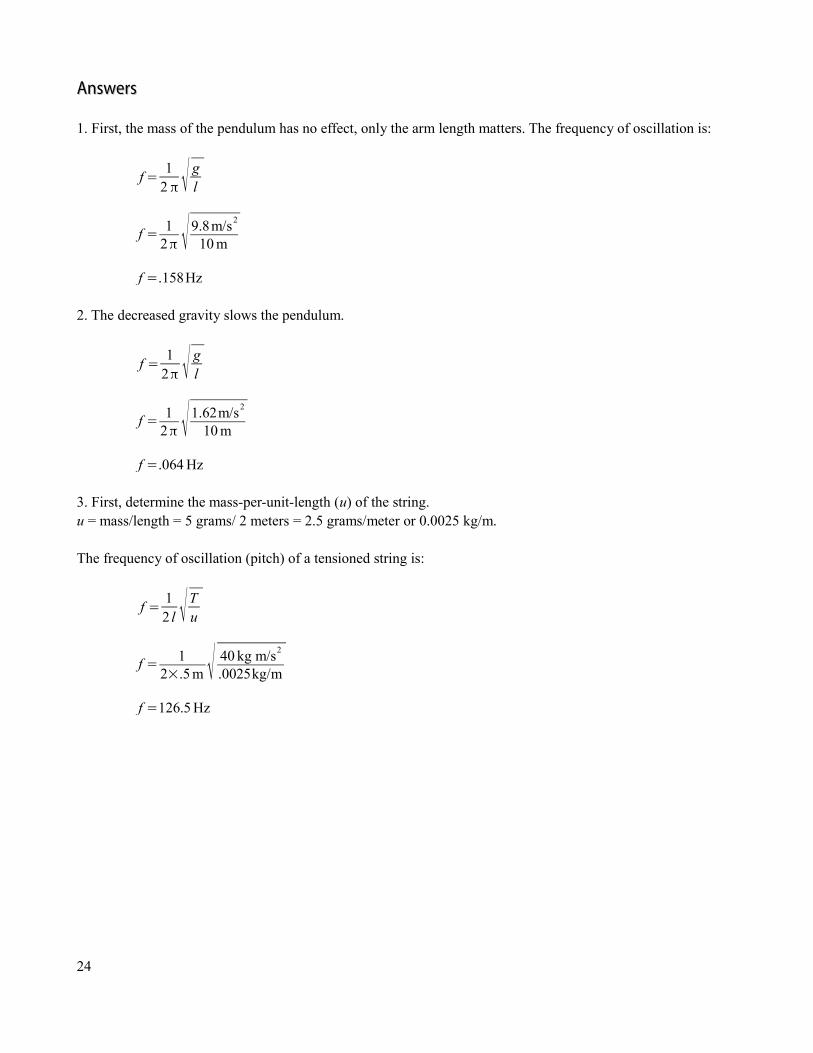
AnswersAnswers
1. First, the mass of the pendulum has no effect, only the arm length matters. The frequency of oscillation is:
f =1
2 π √ gl
f =1
2π √9.8m/s2
10 m
f =.158Hz
2. The decreased gravity slows the pendulum.
f =1
2π √ gl
f =1
2π √1.62m/s2
10 m
f =.064 Hz
3. First, determine the mass-per-unit-length (u) of the string. u = mass/length = 5 grams/ 2 meters = 2.5 grams/meter or 0.0025 kg/m.
The frequency of oscillation (pitch) of a tensioned string is:
f =12 l √T
u
f =1
2×.5 m √ 40 kg m/s2
.0025kg/m
f =126.5 Hz
24
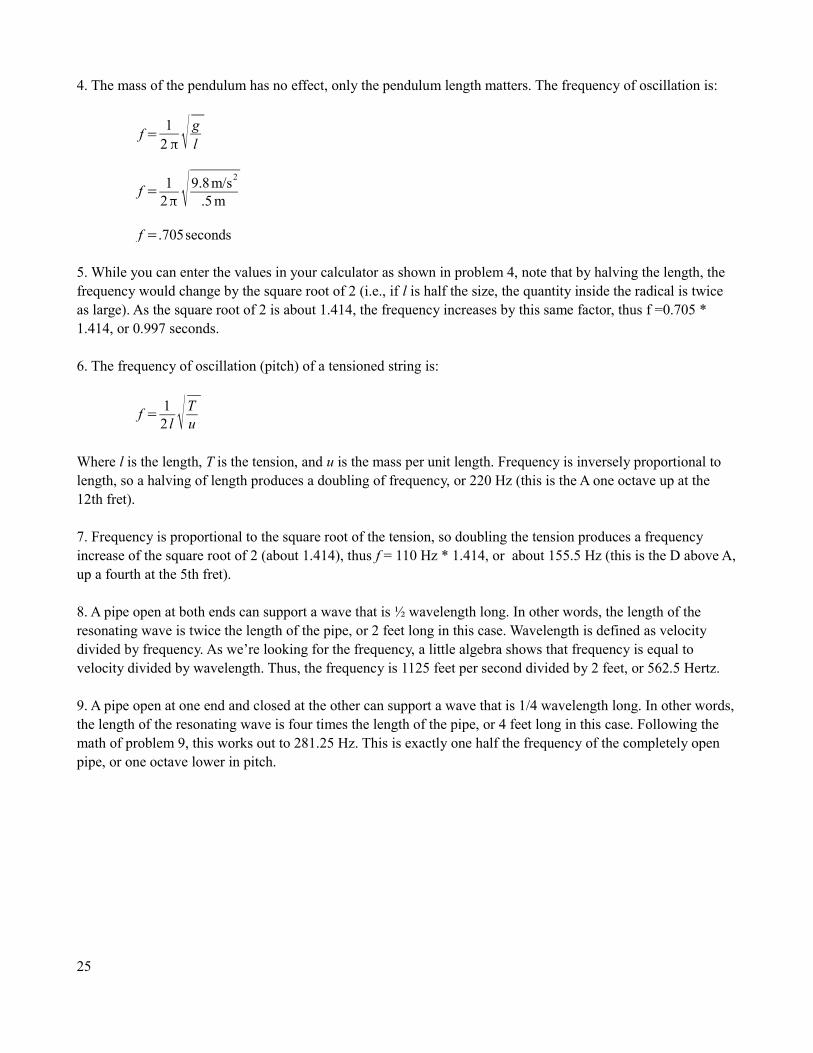
4. The mass of the pendulum has no effect, only the pendulum length matters. The frequency of oscillation is:
f =1
2 π √ gl
f =1
2π √9.8m/s2
.5 m
f =.705seconds
5. While you can enter the values in your calculator as shown in problem 4, note that by halving the length, the frequency would change by the square root of 2 (i.e., if l is half the size, the quantity inside the radical is twice as large). As the square root of 2 is about 1.414, the frequency increases by this same factor, thus f =0.705 * 1.414, or 0.997 seconds.
6. The frequency of oscillation (pitch) of a tensioned string is:
f =12 l √T
u
Where l is the length, T is the tension, and u is the mass per unit length. Frequency is inversely proportional to length, so a halving of length produces a doubling of frequency, or 220 Hz (this is the A one octave up at the 12th fret).
7. Frequency is proportional to the square root of the tension, so doubling the tension produces a frequency increase of the square root of 2 (about 1.414), thus f = 110 Hz * 1.414, or about 155.5 Hz (this is the D above A,up a fourth at the 5th fret).
8. A pipe open at both ends can support a wave that is ½ wavelength long. In other words, the length of the resonating wave is twice the length of the pipe, or 2 feet long in this case. Wavelength is defined as velocity divided by frequency. As we’re looking for the frequency, a little algebra shows that frequency is equal to velocity divided by wavelength. Thus, the frequency is 1125 feet per second divided by 2 feet, or 562.5 Hertz.
9. A pipe open at one end and closed at the other can support a wave that is 1/4 wavelength long. In other words,the length of the resonating wave is four times the length of the pipe, or 4 feet long in this case. Following the math of problem 9, this works out to 281.25 Hz. This is exactly one half the frequency of the completely open pipe, or one octave lower in pitch.
25
88 Pitch, Frequency, Overtones, Timbre and AllPitch, Frequency, Overtones, Timbre and AllThat StuffThat StuffThe fundamental building block of all sounds is the sine wave. This can be thought of as a fixed length vector rotating at a constant rate, rather like the second hand of a clock. This is the simplest repetitive motion we can get. This motion is fully described by the magnitude of the vector (e.g., the length of the second hand) and its angular velocity or rotational speed (e.g., one revolution in sixty seconds). Humans can hear sounds with rates between 20 and 20,000 revolutions per second. This rate is called the frequency of the source. The unit of revolutions (or cycles) per second is also known as Hertz and abbreviated as Hz. You can create something very close to a simple sine wave by whistling. Typically, this will produce a tone in the 1000 to 2000 Hz range. Frequency and pitch are tightly correlated and the terms are often used synonymously although that is not entirely accurate. If you make the whistle rise in pitch, you are increasing its frequency.
More complex sounds, such as the human voice, a musical instrument, or the sound of a waterfall, are made up of several different sine waves. The collection of all of the different sine waves that make up a sound at any given instant is referred to as its spectrum. Each of the individual components is referred to as a partial. Typically, the lowest partial (i.e., the lowest frequency in the spectrum) is called the fundamental and all of the other elements are called the overtones. The overtones are numbered sequentially from the fundamental on up. For example, a sound might consist of sine waves at 100 Hz, 260 Hz and 400 Hz. The set of three frequencies comprise the spectrum. Each of the components is a partial. The fundamental is 100 Hz and the overtones are 260 Hz and 400 Hz. 260 Hz is called the first overtone while 400 Hz is called the second overtone.
In music theory, the set of overtones is part of what is referred to as the sound’s timbre. Timbre is what makes two musical instruments sound different when they are playing the same note. It is important to remember that the set of overtones does not have to be static. Individual partials can become quieter or louder as the sound evolves through time. In fact, some partials might disappear completely while new ones are created.
Overtones can be classified as either harmonic or inharmonic. If the overtone is a simple integer multiple of the fundamental then it is harmonic, otherwise it is inharmonic. In the example above, 260 Hz is inharmonic while 400 Hz is harmonic. Often, environmental sounds such as thunder, the sound of splattering rain and the like are inharmonic. In contrast, musical instruments often produce a harmonic sequence of overtones. This is particularly true of instruments that rely on the resonance of tensioned strings (guitar, violin, piano, etc.) or air columns (trumpet, saxophone, flute, etc.). By their very nature, these sound sources produce overtones that are integer multiples of the fundamental. The fundamental is determined in part by the length of the mechanical system (e.g., length of the guitar string or distance from the mouthpiece to the effective end of an air column). The overtones are similarly constrained and they must wholly “fit” within that length, hence only integer multiples are produced. Consequently, when discussing musical instruments, the overtones are often referred to as harmonics, which is short for harmonic overtone. Many of the signal waveforms used in electronic circuitry, such as square waves and triangle waves, exhibit an integer overtone sequence and the term harmonic is commonly used there as well.
26
If a sound source has a harmonic overtone structure, it is classified as being definitely pitched. The fundamental supplies the pitch or note name and the overtones establish the timbre. For example, if we tension a guitar string a certain way, it might produce a fundamental at 220 Hz with overtones at 440 Hz, 660 Hz, 880 Hz, 1100 Hz and so on. Note that these overtones are all integer multiples of the fundamental, they “line up” with it and reinforce it. By convention, 220 Hz is known as the note A (A below middle C to be precise). We could also tension a piano string to produce a 220 Hz fundamental. It would also produce harmonic overtones at 440 Hz, 660 Hz, and so on, although the relative strength of each partial and they way evolve over time would be somewhat different than that produced with the guitar. For example, the guitar’s first overtone might be louder than the piano’s first overtone but the second overtone might be quieter. Because both instruments produce a 220 Hz fundamental we say both are producing an A below middle C. In contrast, because the corresponding overtones are not identical in strength, we recognize one as a guitar and the other as a piano.
Some instruments produce a strong fundamental but produce an inharmonic overtone sequence. A drum is a classic example. Unlike a string or air column, a drum head can move along two axes. Instead of integer overtones at 2X, 3X, 4X and so forth above the fundamental, a drum produces overtones at 1.59X, 2.14X, 2.3X, 2.65X et al times the fundamental. These overtones do not reinforce the fundamental in the manner of integer overtones. Consequently, drums are said to be indefinitely pitched. When one drum is said to be of “lower pitch”than another, what this really means is that it has a lower fundamental. The drum isn’t truly pitched, the “pitch” is indeterminate. We could tension the drum head to produce a fundamental at 220 Hz but the drum isn’t really producing an A below middle C the way the guitar or piano did. The inharmonic overtones create a much more complex waveform and the human sensation of true pitch is lost. Interestingly, it is possible to reduce or mute certain overtones when designing and playing drums in order to achieve an overtone sequence that is closer to the harmonic ideal. Such is the case with timpani; drums which produce a true sense of pitch.
Some sound sources have neither a stable fundamental nor a harmonic overtone structure. Examples include explosions and the sound of wind through trees. The list of partials appears to be more or less randomly assignedthrough the frequency spectrum and continually evolves. These sources are said to be unpitched.
Regarding human speech, vowel sounds are generally pitched. Consonants, particularly plosives such as ‘p’ or ‘d’, are unpitched.
27
99 Human HearingHuman Hearing
IntroductionIntroduction
As I type this I am listening to a tone piece by Robert Fripp entitled Refraction. What’s going on here? An acoustic pressure wave is being set up in the room through a pair of loudspeakers. The wave is complex, containing numerous frequency components of varying amplitude. These components are reflected and absorbedat different rates by the objects in the room. Eventually, both direct and reflected versions of the original content reach my ears. I hear a piece of music. I discern different instrumental parts. There is a sense of a surrounding acoustic space, both in terms of this listening room and within the recording itself. I can tell from where certain sounds are emanating. I hear changes in pitch and loudness. Certain sounds appear to move from place to place. I don’t have to analyze it to know this. I hear music.
Up to this point we have considered sound from its physical standpoint, that of a quantifiable acoustic pressure wave. Hearing, on the other hand, revolves around the reception and interpretation of the acoustic energy. Whatever else might be said about human hearing, it certainly does not behave as a laboratory instrument. Human hearing is far more complex than the most expensive digital multimeter or oscilloscope.
Loudness, Pitch, and TimbreLoudness, Pitch, and Timbre
As mentioned in previous readings, the human hearing mechanism tends to operate in a super-logarithmic fashion. We noted, for example, that it requires an approximate 8 to 10 dB increase in level to create a sound that is subjectively twice as loud. This should not be surprising when the dynamic range of human hearing is considered. The softest sound heard, 0 dB-SPL, corresponds to a pressure of 20 micropascals. From there to the threshold of pain encompasses a range of approximately 140 dB. That’s a power range3 of 1014. That range is equivalent to the factor between 1 second and 3.17 million years4. That’s a serious dynamic range.
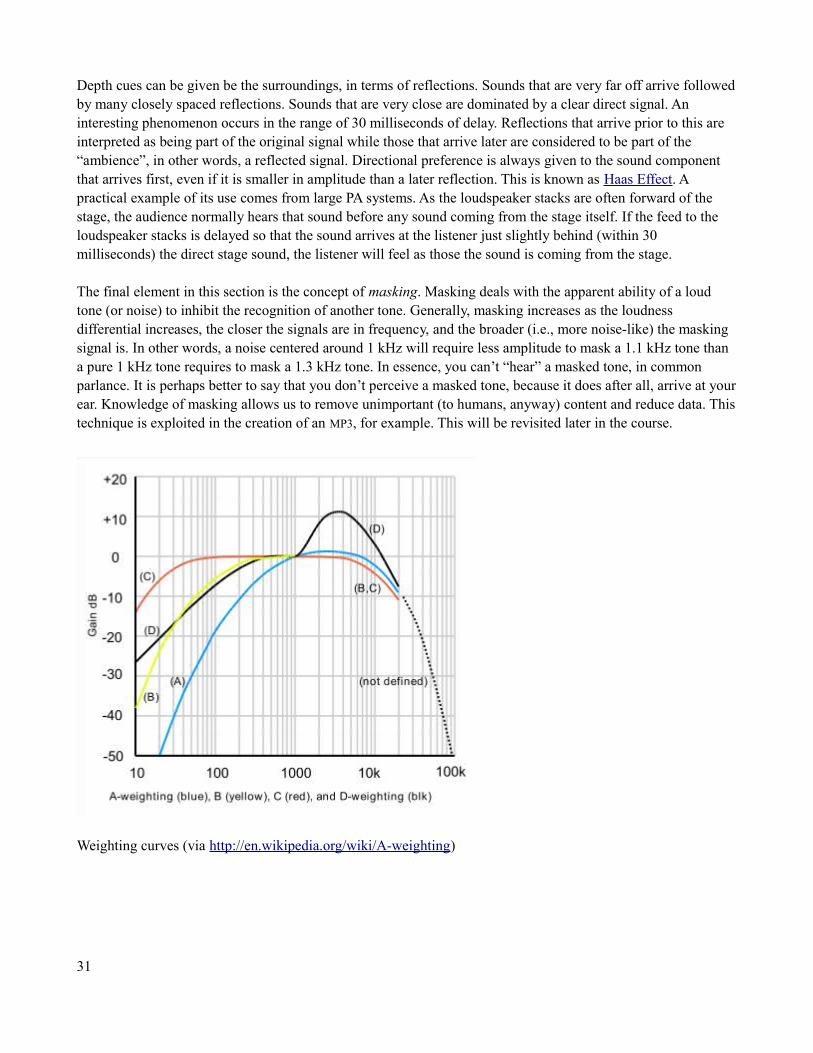
The sensitivity of human hearing varies with both frequency and relative amplitude. Thus perceived loudness is not the same as the amplitude of the acoustic pressure. The human ear is acutely sensitive to sound pressures in the 1 kHz to 5 kHz range. When compared to considerably lower or higher frequency tones, the acoustic intensity at, say 3 kHz, might be 20 dB lower and still achieve the same perceived loudness. Early research in this area was done by Fletcher and Munson, and expanded upon by Rabinson and Dadson, producing the Equal Loudness Contours curve set. These curves indicate the dB-SPL levels required at any given frequency to achieve a subjectively equal loudness. Each curve is calibrated to the intensity at 1 kHz and given the unit phons. Thus, a 50 phon 1 kHz tone is achieved via a level of 50 dB-SPL. This tone will be heard to be just as loud as any other 50 phon signal, although this second signal might require somewhat more or less than a 50 dB-SPL intensity. For example, 50 phons is achieved at 50 Hz via an intensity of nearly 70 dB-SPL, and at 4 kHz byabout 42 dB-SPL. Beside the obvious valley-like shape of the curves, the other notable fluctuation is the
3 To be strictly accurate, pressure is analogous to voltage, so this also represents a pressure ratio of 107.
4 According to current evidence, 3.17 million years ago our hominid ancestors were just beginning to walk upright.
28
variance as the relative loudness increases. The contours are noticeably more flat in the bass end as the loundess increases. This effect gives rise to an odd sonic artifact of modern recording. If recorded music is played back at levels well below where they were recorded (and mixed), the result will sound very bass-shy. To partially compensate for this, many audio receivers include a loudness switch that will introduce a bass-boost, returning the spectral balance to normal (more or less). It is important then, to never use the loudness switch when music is being played at louder levels, which may be just the opposite of what some consumers might expect.
To help correlate data with human hearing, audio equipment is often measured using weighting filters. The basicidea is to shape the response of the measurement instrument so that it better reflects what humans perceive. Common curves are A-weight and C-weight. A-weight is used to better correlate noise measurements with perceived noise levels. These are basically bandpass filters, with A-weight being much more aggressive in its reduction of lower frequency content. An A-weighted measurement may be denoted by writing dB(A) or sometimes as dB-A.
Prolonged exposure to excessive sound pressures can lead to hearing damage and OSHA has set limits on safe exposure levels based on the exposure in the workplace. If the values are exceeded, some form of hearing protection will be needed to bring the effective level within the limit. The effectiveness of devices such as ear plugs and around-the-ear muffs is given by their Noise Reduction Rating (NRR). This value is simply subtractedfrom the averaged environmental noise level in dBC to arrive at an effective value. For example, if the ambient noise level is 105 dBC and ear plugs are used with an NRR of 20 dB, the resulting effective level is 85 dBC. As the A and C scales are not the same, a 7 dB correction factor has to be subtracted from the NRR when using dBAscale (i.e., for dBA measurements, the ear plugs above would reduce the sound pressure level by 7 dB less, or 13dB, instead of 20 dB).
Like loudness, pitch is a subjective quality of sound that only roughly correlates with a common measurement parameter. Pitch is similar to frequency, but not identical. Perhaps the most basic of units for pitch is the octave. This is generally taken to be a factor of two in frequency, although this is not precisely true. If a typical person was asked to select a tone that was “twice as high in pitch” as a reference tone, the selected tone may be somewhat more or less than a perfect factor of two above the reference. The direction and size of the deviation depend on the reference frequency. These variations are quite small when compared to loudness variations though, and are commonly ignored by engineers. In contrast, people who make their living off of the adjustmentof pitch, such as piano tuners, are uniquely aware of this effect. In spite of this, typical instruments such as guitars are normally tuned with perfect factor-of-two octaves. The reason for this is obvious when multiple notesare played together. If two notes have a “nice” mathematical relationship in frequency such as 2:1, they will sound harmonious when played together. If they are off a little (such as with 200 Hz and 399 Hz), a difference orbeat frequency will be heard, and this will sound quite sour under normal circumstances. In fact, this is how most musicians tune their instruments by ear: They adjust the string tension or other tuning element to remove the beats.
Timbre is correlated to spectral distribution. If both a violinist and a clarinetist are playing an “A”, both instruments are producing the same fundamental frequency. What is it that makes it possible to distinguish between the violin and the clarinet? If we look at the waveforms we will see that these instruments are not producing simple sine waves, but instead, very complex waves. These waves consist of a fundamental along with a series of harmonic overtones. These overtones are normally at integer multiplies of the fundamental. Thisis similar in nature to the harmonic sequence seen in regular non-sinusoidal waveforms such as square waves and triangle waves. The situation with instruments is somewhat more complex however, as the harmonic
29
sequence is not static. For example, all square waves produce the same harmonic sequence no matter what their amplitude or frequency (fundamental, plus 1/3 amplitude at 3 times the frequency, plus 1/5 amplitude at 5 times the frequency, etc.). Musical instruments, as well as other sources such as the human voice, have a harmonic structure that is dynamic in nature. The precise amplitude and phase is a function of both the fundamental frequency and the overall loudness. In other words, if you recorded the same note on a violin twice, once played loudly and once softly, and then corrected for the loudness differential, they results would not sound identical. Timbre, then, is a subjective term describing the overall harmonic structure of a sound. Words such as bright, soft, muted, brittle, harsh, or silky might be used to describe timbre. The timbre of a violin is clearly not that of aclarinet, but the timbre of a loud clarinet isn’t the same as that of a quiet one either.
Psychoacoustics and LocalizationPsychoacoustics and Localization
The foregoing leads us into the realm of psychoacoustics, or the way in which our ear-mind connection informs us of the acoustical world around us. The fact that frequency and pitch are not identical, for example, can be filed under this topic, although it is generally used when referring to a few more specialized effects. In this section we’ll focus on the sub-topic of localization. Localization refers to the ability to determine where an object is and how/if it is moving.
Some elements of localization are monaural, that is, you only need one ear for them. Other elements are basically binaural (two ears). To start with, let’s consider determining a sound source somewhere in a horizontal plane around you. As you have two ears, you have the ability to triangulate a source. Many people assume that this is strictly an amplitude phenomenon. In other words, if the sound is to your right, the sound in your right earwill be louder than the sound in your left ear because your head effectively blocks your left ear. This is partially true but doesn’t tell the whole story. As typical ears are separated by about 6 inches, there will be a 0.4 to 0.5 millisecond delay to the opposite ear for sounds that are off axis by 90 degrees. This time discrepancy is also used by the brain to determine the location of the source. Note that for a sound directly in front of you, both earsreceive a signal with more or less the same amplitude and phase. The outer ear, or pinna, also serves to direct thesound and produces its own phase shifts and sound alterations. Thus, by slightly (and unconsciously) tilting the head, directional information can be added. The pinna also serve to block higher frequencies from behind. If only simple amplitude and time delays were used then it would be impossible to determine the location of a sound source located somewhere along an arc from directly in front (0 degrees) to directly behind (180 degrees).Experiments have shown that the outer ear is a very important part of localization. Unlike some animals, humans cannot move their ears independent of their heads. This can be seen in many herbivores that must stay well aware of the presence of predators, such as rabbits and deer. These animals have large outer ears that can move independently, giving them a very good “view” of the surrounding sound field. A similar anthropological argument has been made regarding the relatively weak localization skills of humans for sound sources considerably above the horizontal plane: We neither regularly hunted nor were hunted by animals that lived above us.
In the case of moving objects, humans pick up this information from the fact that the amplitude and time delays are constantly shifting, favoring one ear over another. The faster the shift, the faster the source is moving (rotationally speaking, in degrees per second). Very quick objects that are predominantly on axis (directly in front or behind) may also exhibit discernable Doppler shift.
30
Depth cues can be given be the surroundings, in terms of reflections. Sounds that are very far off arrive followedby many closely spaced reflections. Sounds that are very close are dominated by a clear direct signal. An interesting phenomenon occurs in the range of 30 milliseconds of delay. Reflections that arrive prior to this are interpreted as being part of the original signal while those that arrive later are considered to be part of the “ambience”, in other words, a reflected signal. Directional preference is always given to the sound component that arrives first, even if it is smaller in amplitude than a later reflection. This is known as Haas Effect. A practical example of its use comes from large PA systems. As the loudspeaker stacks are often forward of the stage, the audience normally hears that sound before any sound coming from the stage itself. If the feed to the loudspeaker stacks is delayed so that the sound arrives at the listener just slightly behind (within 30 milliseconds) the direct stage sound, the listener will feel as those the sound is coming from the stage.
The final element in this section is the concept of masking. Masking deals with the apparent ability of a loud tone (or noise) to inhibit the recognition of another tone. Generally, masking increases as the loudness differential increases, the closer the signals are in frequency, and the broader (i.e., more noise-like) the masking signal is. In other words, a noise centered around 1 kHz will require less amplitude to mask a 1.1 kHz tone than a pure 1 kHz tone requires to mask a 1.3 kHz tone. In essence, you can’t “hear” a masked tone, in common parlance. It is perhaps better to say that you don’t perceive a masked tone, because it does after all, arrive at yourear. Knowledge of masking allows us to remove unimportant (to humans, anyway) content and reduce data. Thistechnique is exploited in the creation of an MP3, for example. This will be revisited later in the course.
Weighting curves (via http://en.wikipedia.org/wiki/A-weighting)
31
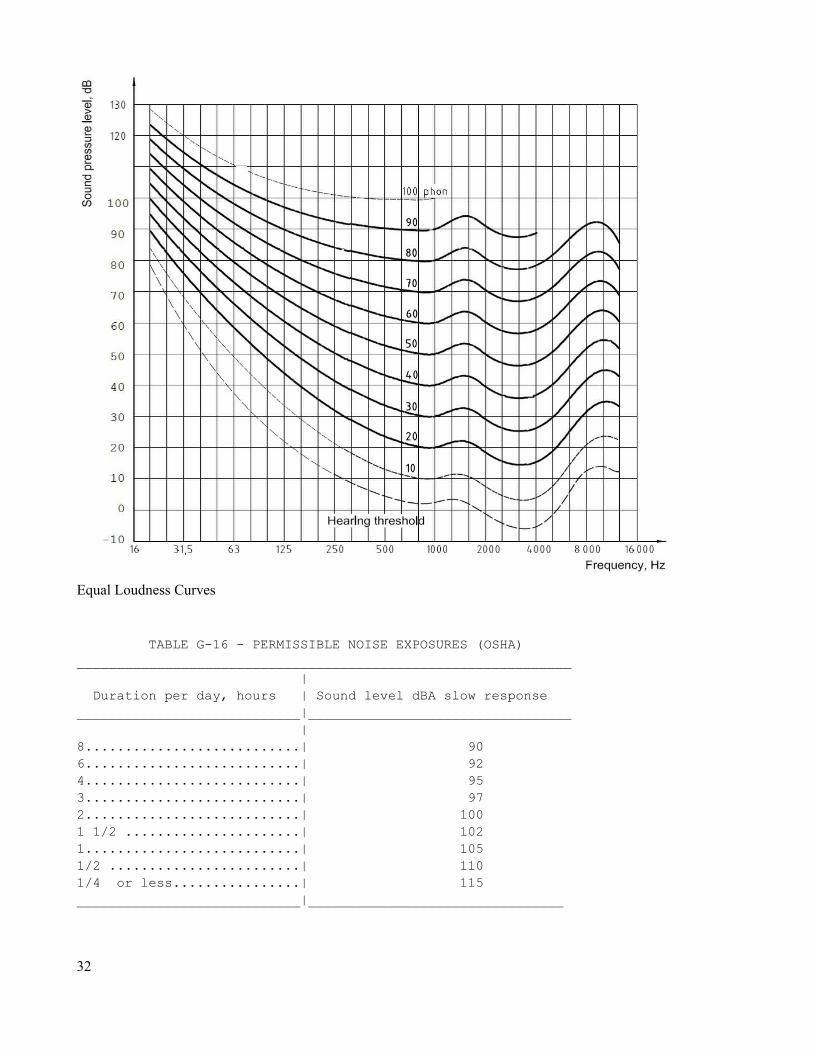
Equal Loudness Curves
TABLE G-16 - PERMISSIBLE NOISE EXPOSURES (OSHA)______________________________________________________________ | Duration per day, hours | Sound level dBA slow response____________________________|_________________________________ |8...........................| 906...........................| 924...........................| 953...........................| 972...........................| 1001 1/2 ......................| 1021...........................| 1051/2 ........................| 1101/4 or less................| 115____________________________|________________________________
32
OSHA Noise Table from:
https://www.osha.gov/pls/oshaweb/owadisp.show_document?p_table=standards&p_id=9735
For further explanation see also:https://www.osha.gov/pls/oshaweb/owadisp.show_document?p_table=STANDARDS&p_id=9737
or go to https://www.osha.gov/SLTC/noisehearingconservation/standards.html and click on the “Methods for Estimating HPD Attenuation” link.
Example ProblemsExample Problems
1. Determine the attenuation of a 50 Hz tone to A and C weighting filters.
2. What is the sound pressure level required for a 250 Hz tone at 80 phons?
3. What sound pressure level at 63 Hz is required to achieve the same loudness as a 4 kHz tone at 70 dB-SPL?
4. Determine the loudness of a 63 Hz tone at 80 dB-SPL.
5. What sound pressure level is required 8 kHz tone to reach a loudness of 70 phons?
6. What sound pressure level is required for a 125 Hz tone to sound as loud as a 50 dB-SPL 4 kHz tone?
7. If a work environment measures 105 dB-SPL, will ear plugs with a NRR (Noise Reduction Rating) of 20 dB be sufficient for a four hour work shift by OSHA standards? What if the work environment measures105 dBA instead?
33
AnswersAnswers
1. From the weighting curves in the text or above, find 50 Hz and then read up and across to the dB scale. For A,it’s –30 dB, for C, it’s about –1 dB.
2. From the equal loudness contours, approximately 84 dB-SPL.
3. 70 dB-SPL at 4 kHz is about 72 phons. To achieve 72 phons at 63 Hz requires approximately 94 dB-SPL.
4. 50 phons.
5. 81 dB-SPL.
6. 4 kHz at 50 dB-SPL is about 52 phons. 125 Hz at 52 phons is about 70 dB-SPL.
7. From the table the four hour limit is 95 dBA. Estimated exposure = time weighted average of work environment (in dBC) – NRR. Estimated exposure = 105 dBC – 20 dB = 85 dBA (sufficient).Estimated exposure = time weighted average of work environment (in dBA) – (NRR – 7 dB). Estimated exposure = 105 dBA – (20 dB – 7 dB) = 92 dBA (sufficient).
34
1010 Basic AcousticsBasic AcousticsIn this section we shall discuss what happens when waves interact with boundaries or when the medium they travel through changes. These items are defraction, refraction, reflection, absorption and transmission (through). These five items can be remembered via the mnemonic “DR. RAT”.
First, let's consider what happens if the medium through the sound is traveling differs. This can cause the wave to bend in a particular direction. This phenomenon is called refraction. A good example is when sound travels across the ground where there is a layer of cold air and above it (or below it) a layer of warm air. Sound travels faster through warm air than through cold, thus, as the wave progresses along these two layers, the wave front inthe warm air tends to progress faster, leading the wave front in the cold air. This results in the wave bending toward the colder air. If the cold air is at ground level with the warm air above, then the sound wave tends to “hug” the ground. Under the opposite conditions, the wavetends to bend upward toward the sky and away from theground. In the former case, the sound intensity at ground levelsome distance from the source would tend to be a bit higherthan normal. In the latter case, the sound intensity would tendto be somewhat lower than normal.
Defraction involves the interaction of a sound wave with anobject. For example, the sound wave might meet a largeobstruction such as a house or it might reach an otherwiseimpenetrable barrier that contains one or more holes. In bothcases, an important characteristic is the size of the object (orhole) in relation to the wavelength of the sound. If a solidobject is much larger than the wavelength of the sound, then it will cast an obvious “sound shadow” on the far side. In other words, the sound level will be reduced compared to if the structure was not present. Once the object is smaller than the wavelength, the sound will simply bend around the object producing no reduction in sound pressure. If, for example, you where attending a concert and a 6” wide steel post was a few feet in front ofyou, directly between you and the loudspeakers, you would not hear a discernible difference.
Regarding the complementary “hole in the wall” scenario, if the aperture is wavelength-sized or smaller, then it is as if this aperture acts as a new point source, re-radiating the sound. These diffraction effects are familiar to anyone who has paddled a canoe or kayak on a large lake, but with regards to wind rather than sound. A “wind shadow” of calm water will occur on the lee side of an island or peninsula, with choppy water outside the area. Similarly, the effect of waves created by the wind can be seen in the region between two islands that are closely spaced: there will be wind shadows beyond the islands, but the wind blowing between the islands can be seen to expand into those wind shadows.
The “RAT” of the good doctor involves what happens to sound waves as they travel inside a room and hit a wall,the ceiling, or floor. There are three possibilities: the sound can reflect off of the surface back into the room, the sound can be absorbed by the surface, or the sound can be transmitted through the material (into the next room
35
or to the outside). In practical terms, these surfaces actually exhibit a bit of each characteristic. That is, some of the sound may be reflected back into the room, some of it might be absorbed, and some of it might find its way outside the room. For example, a painted concrete wall is very good at reflecting sound and not very good at transmission (which is good if we're building something that needs to contain sound so that it does not annoy theneighbors). In contrast, several feet of moderately dense fiberglass is an excellent absorber but not good as a reflector. Further, the characteristic of a material will depend on the frequency of interest. Standard “acoustic” ceiling tiles offer some absorption in the midrange frequencies but are largely transmissive at very low frequencies. There are a couple ways to quantify the performance of acoustical building materials. First, an absorption or reflection coefficient may be given, usually specified for a range of frequencies. For example, a reflection coefficient of 0.9 means that 90% of the sound energy that strikes the surface will bounce back into the room. Conversely, an absorption coefficient of 0.05 means that 5% is absorbed, implying that 95% is reflected back (in this case, no distinction is made between absorption and transmission as we are only concerned with what remains in the room). Alternately, materials can be given an STC rating (Sound Transmission Class) which indicates how much of a reduction in sound pressure occurs. For example, a standardstud-and-drywall interior wall in a home has an STC of about 33 dB, meaning that sound pressure levels will be reduced by about this much, on average (some frequencies seeing more and some seeing less). Most people do not consider this construction to be very effective at sound isolation. In contrast, a wall made up of a pair of wallframes separated by an inch, each using double layers of drywall on the outer surfaces with a viscous acoustic “glue” between the sheets and the space between stuffed with fiberglass insulation can have an STC of over 60. This results in superior isolation and is ideal for a music practice room, home theater room, or the like.
What remains of concern is what happens to the sound energy that is reflected back into the room. A reflected wave will continue until it hits another surface where, again, a portion will be reflected. This portion will continue on until it hits another surface, loosing some energy at each reflection, rather like a billiard ball bouncing around a table after a hard strike. The more reflective the surfaces are, the longer it will take for the sound energy to die away to inaudibility. The amount of time it takes for the sound to die away by 60 dB is called the reverberation time and is denoted as RT60. Rooms with short reverberation times are said to be acoustically “dry”. An example would be a living room filled with heavy upholstered furniture, thick drapes and carpeting, and the like. The opposite would be a large, empty concrete basement, or even better, a cave. RT60 is directly proportional to the volume of the room and inversely proportional to the amount of absorption in the room (i.e., the total surface area times the average absorption coefficient).
Finally, all rooms exhibit room modes (sometimes called Eigen modes). The simplest form of room mode involves two parallel walls. Basically, it is possible for a sound source to set up a standing wave. This occurs when the distance between the walls is an integer multiple of the sound's wavelength. This results in alternating patterns of nodes and anti-nodes in the room, nodes being points of minimal sound pressure and anti-nodes being points of maximal sound pressure. All surfaces are at anti-nodes. The fundamental mode frequencies can be found using the formula below:
f =v2 l
Where f is the fundamental frequency of the mode (higher modes exist at integer multiples of this)v is the velocity of soundl is the length or distance between the two walls or surfaces
36
In a typical room there will be three of these modes: one between the side walls, one between the front and back walls, and one between the floor and ceiling. These simple, two-surface modes tend to dominate the room response and are referred to as axial modes. There are also modes involving four surfaces (tangential modes) and all six surfaces (oblique modes).
The practical effect of room modes is that your location as a listener can be effected, particularly for the lower register or bass region. If you unfortunate enough to be sitting at a point that is a node for the three fundamental modes, the music will sound bass-shy. If you're sitting where three anti-nodes coincide, you will hear an excess of bass.
Example ProblemsExample Problems
1. A loudspeaker is fed a 1 kHz tone (i.e., 1000 Hertz). In its path is a solid concrete wall 5 meters high by 5 meters wide. Will this wall present a reasonable obstruction and thus create a sound shadow behind it? Assume there is no appreciable leakage of sound through the wall.
2. Repeat problem the previous problem for a 30 Hz tone.
3. A room has a reverberation time of 2 seconds. If we double the amount of absorption in the room, what happens to the reverb time?
4. If we double the volume of a room while leaving the average absorption the same, what happens to the RT60?
5. Find the fundamental axial modes for a room with dimensions of 10 feet by 15 feet by 20 feet.
37
AnswersAnswers
1. For there to be an effective blocking of the sound, the barrier must be a reasonable portion of a wavelength or larger. The wavelength at 1 kHz is 343 m/s / 1000 Hz, or 0.343 meters. The wall is nearly 15 times larger and thus presents a good block.
2. The wavelength at 30 Hz is approximately 11.4 meters, or more than twice the dimensions. The sound will diffract around the wall reasonably well producing minimal shadowing.
3. Doubling absorption halves the reverb time to 1 second.
4. Reverb time is directly proportional to room volume so this doubles the RT60.
5. Use the formula:
f =v
2 l
f =1125ft/s2×10 ft
f =56.25 Hz
Similarly, the other two modes are 37.5 Hz and 28.1 Hz. In general, this is not a good situation as there will be many higher order modes the coincide in the room, creating “hot spots” and “dead spots”. It would be better if none of the room dimensions were simple integer multiples of each other.
38
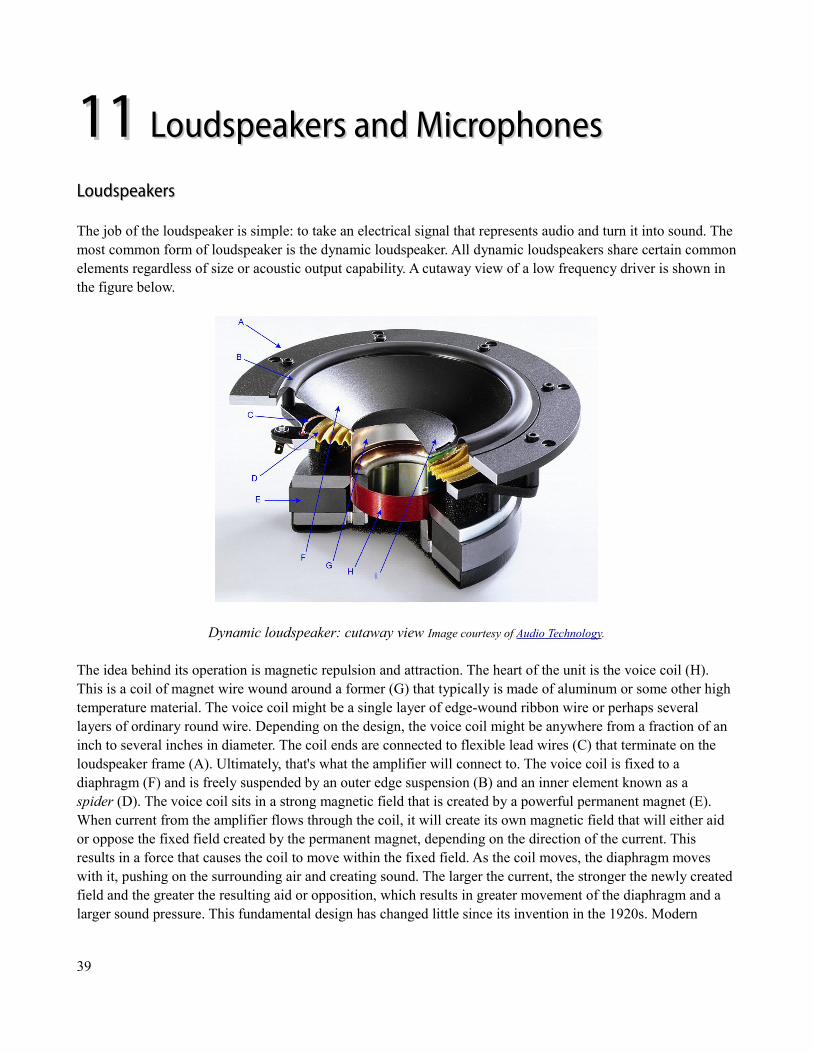
11 11 Loudspeakers and MicrophonesLoudspeakers and Microphones
LoudspeakersLoudspeakers
The job of the loudspeaker is simple: to take an electrical signal that represents audio and turn it into sound. The most common form of loudspeaker is the dynamic loudspeaker. All dynamic loudspeakers share certain commonelements regardless of size or acoustic output capability. A cutaway view of a low frequency driver is shown in the figure below.
Dynamic loudspeaker: cutaway view Image courtesy of Audio Technology.
The idea behind its operation is magnetic repulsion and attraction. The heart of the unit is the voice coil (H). This is a coil of magnet wire wound around a former (G) that typically is made of aluminum or some other high temperature material. The voice coil might be a single layer of edge-wound ribbon wire or perhaps several layers of ordinary round wire. Depending on the design, the voice coil might be anywhere from a fraction of an inch to several inches in diameter. The coil ends are connected to flexible lead wires (C) that terminate on the loudspeaker frame (A). Ultimately, that's what the amplifier will connect to. The voice coil is fixed to a diaphragm (F) and is freely suspended by an outer edge suspension (B) and an inner element known as a spider (D). The voice coil sits in a strong magnetic field that is created by a powerful permanent magnet (E). When current from the amplifier flows through the coil, it will create its own magnetic field that will either aid or oppose the fixed field created by the permanent magnet, depending on the direction of the current. This results in a force that causes the coil to move within the fixed field. As the coil moves, the diaphragm moves with it, pushing on the surrounding air and creating sound. The larger the current, the stronger the newly created field and the greater the resulting aid or opposition, which results in greater movement of the diaphragm and a larger sound pressure. This fundamental design has changed little since its invention in the 1920s. Modern
39
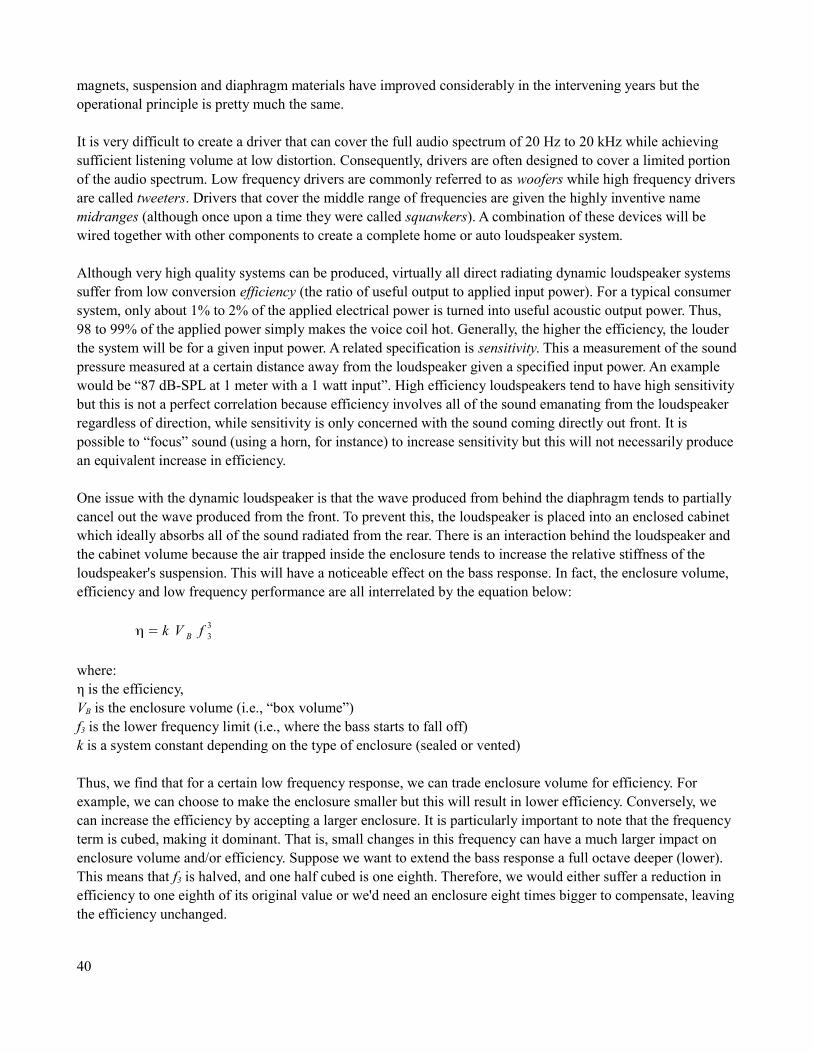
magnets, suspension and diaphragm materials have improved considerably in the intervening years but the operational principle is pretty much the same.
It is very difficult to create a driver that can cover the full audio spectrum of 20 Hz to 20 kHz while achieving sufficient listening volume at low distortion. Consequently, drivers are often designed to cover a limited portion of the audio spectrum. Low frequency drivers are commonly referred to as woofers while high frequency driversare called tweeters. Drivers that cover the middle range of frequencies are given the highly inventive name midranges (although once upon a time they were called squawkers). A combination of these devices will be wired together with other components to create a complete home or auto loudspeaker system.
Although very high quality systems can be produced, virtually all direct radiating dynamic loudspeaker systems suffer from low conversion efficiency (the ratio of useful output to applied input power). For a typical consumer system, only about 1% to 2% of the applied electrical power is turned into useful acoustic output power. Thus, 98 to 99% of the applied power simply makes the voice coil hot. Generally, the higher the efficiency, the louder the system will be for a given input power. A related specification is sensitivity. This a measurement of the soundpressure measured at a certain distance away from the loudspeaker given a specified input power. An example would be “87 dB-SPL at 1 meter with a 1 watt input”. High efficiency loudspeakers tend to have high sensitivitybut this is not a perfect correlation because efficiency involves all of the sound emanating from the loudspeaker regardless of direction, while sensitivity is only concerned with the sound coming directly out front. It is possible to “focus” sound (using a horn, for instance) to increase sensitivity but this will not necessarily producean equivalent increase in efficiency.
One issue with the dynamic loudspeaker is that the wave produced from behind the diaphragm tends to partially cancel out the wave produced from the front. To prevent this, the loudspeaker is placed into an enclosed cabinet which ideally absorbs all of the sound radiated from the rear. There is an interaction behind the loudspeaker and the cabinet volume because the air trapped inside the enclosure tends to increase the relative stiffness of the loudspeaker's suspension. This will have a noticeable effect on the bass response. In fact, the enclosure volume, efficiency and low frequency performance are all interrelated by the equation below:
η = k V B f 33
where:η is the efficiency,VB is the enclosure volume (i.e., “box volume”)f3 is the lower frequency limit (i.e., where the bass starts to fall off)k is a system constant depending on the type of enclosure (sealed or vented)
Thus, we find that for a certain low frequency response, we can trade enclosure volume for efficiency. For example, we can choose to make the enclosure smaller but this will result in lower efficiency. Conversely, we can increase the efficiency by accepting a larger enclosure. It is particularly important to note that the frequency term is cubed, making it dominant. That is, small changes in this frequency can have a much larger impact on enclosure volume and/or efficiency. Suppose we want to extend the bass response a full octave deeper (lower). This means that f3 is halved, and one half cubed is one eighth. Therefore, we would either suffer a reduction in efficiency to one eighth of its original value or we'd need an enclosure eight times bigger to compensate, leavingthe efficiency unchanged.
40
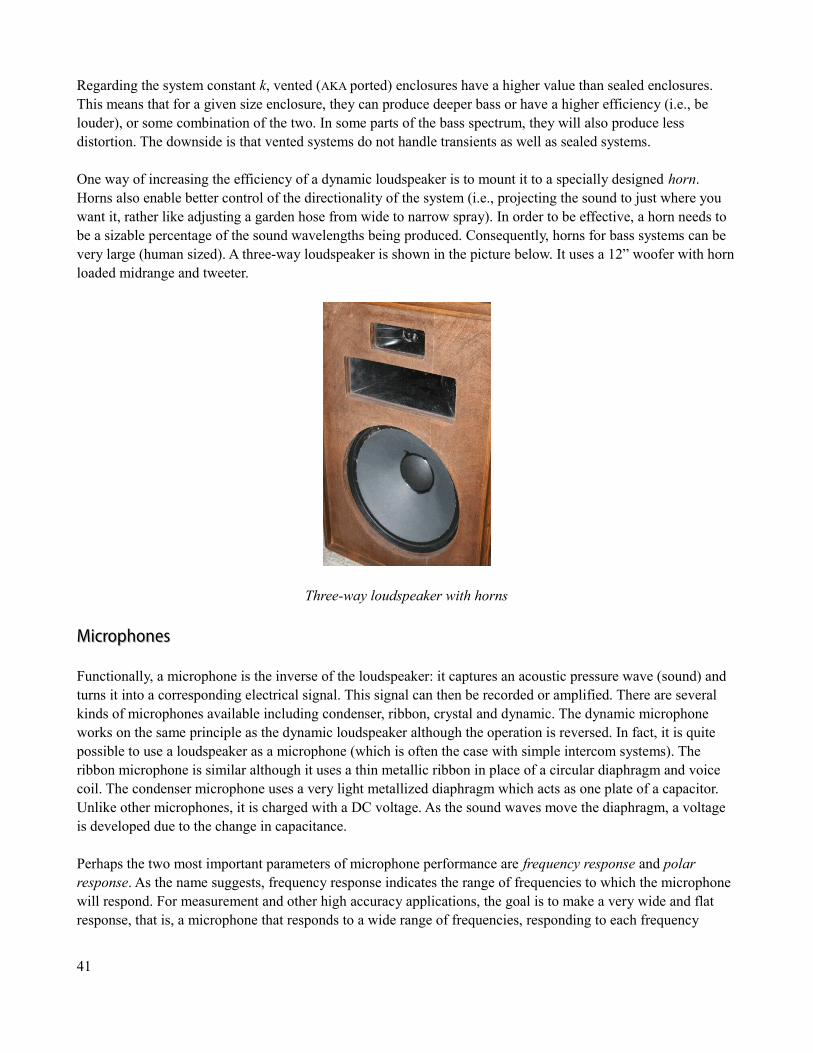
Regarding the system constant k, vented (AKA ported) enclosures have a higher value than sealed enclosures. This means that for a given size enclosure, they can produce deeper bass or have a higher efficiency (i.e., be louder), or some combination of the two. In some parts of the bass spectrum, they will also produce less distortion. The downside is that vented systems do not handle transients as well as sealed systems.
One way of increasing the efficiency of a dynamic loudspeaker is to mount it to a specially designed horn. Horns also enable better control of the directionality of the system (i.e., projecting the sound to just where you want it, rather like adjusting a garden hose from wide to narrow spray). In order to be effective, a horn needs to be a sizable percentage of the sound wavelengths being produced. Consequently, horns for bass systems can be very large (human sized). A three-way loudspeaker is shown in the picture below. It uses a 12” woofer with hornloaded midrange and tweeter.
Three-way loudspeaker with horns
MicrophonesMicrophones
Functionally, a microphone is the inverse of the loudspeaker: it captures an acoustic pressure wave (sound) and turns it into a corresponding electrical signal. This signal can then be recorded or amplified. There are several kinds of microphones available including condenser, ribbon, crystal and dynamic. The dynamic microphone works on the same principle as the dynamic loudspeaker although the operation is reversed. In fact, it is quite possible to use a loudspeaker as a microphone (which is often the case with simple intercom systems). The ribbon microphone is similar although it uses a thin metallic ribbon in place of a circular diaphragm and voice coil. The condenser microphone uses a very light metallized diaphragm which acts as one plate of a capacitor. Unlike other microphones, it is charged with a DC voltage. As the sound waves move the diaphragm, a voltage is developed due to the change in capacitance.
Perhaps the two most important parameters of microphone performance are frequency response and polar response. As the name suggests, frequency response indicates the range of frequencies to which the microphonewill respond. For measurement and other high accuracy applications, the goal is to make a very wide and flat response, that is, a microphone that responds to a wide range of frequencies, responding to each frequency
41
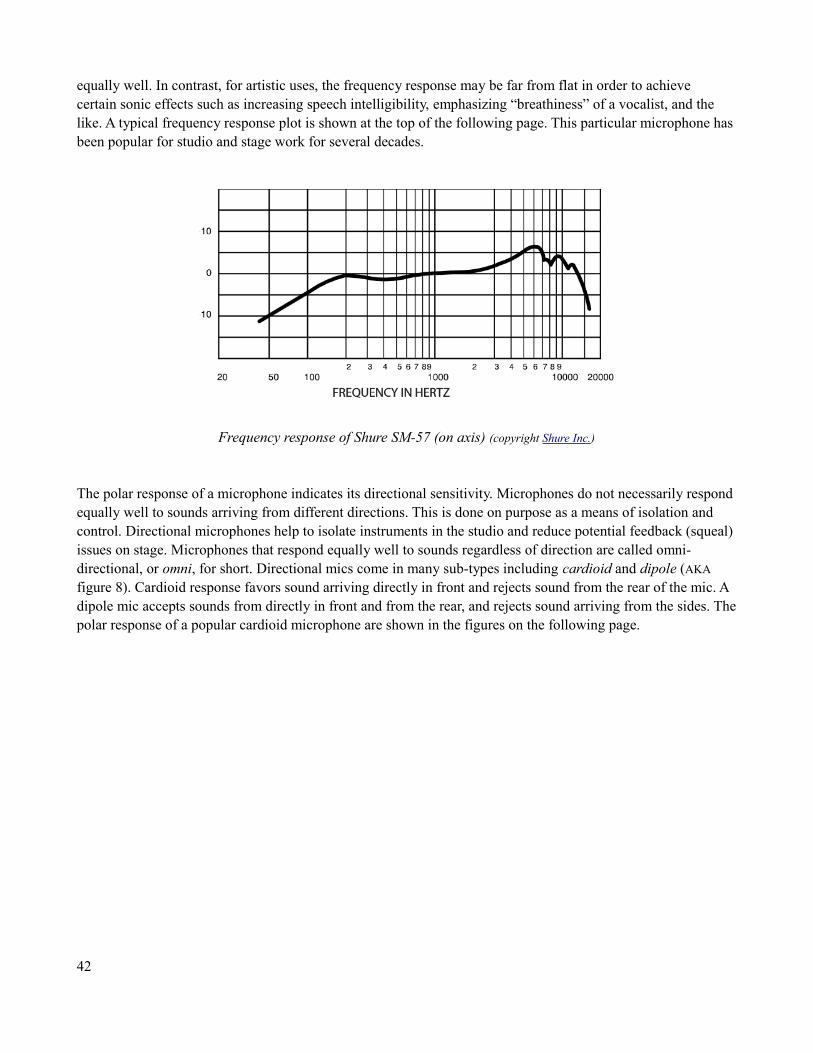
equally well. In contrast, for artistic uses, the frequency response may be far from flat in order to achieve certain sonic effects such as increasing speech intelligibility, emphasizing “breathiness” of a vocalist, and the like. A typical frequency response plot is shown at the top of the following page. This particular microphone hasbeen popular for studio and stage work for several decades.
Frequency response of Shure SM-57 (on axis) (copyright Shure Inc.)
The polar response of a microphone indicates its directional sensitivity. Microphones do not necessarily respond equally well to sounds arriving from different directions. This is done on purpose as a means of isolation and control. Directional microphones help to isolate instruments in the studio and reduce potential feedback (squeal)issues on stage. Microphones that respond equally well to sounds regardless of direction are called omni-directional, or omni, for short. Directional mics come in many sub-types including cardioid and dipole (AKA figure 8). Cardioid response favors sound arriving directly in front and rejects sound from the rear of the mic. A dipole mic accepts sounds from directly in front and from the rear, and rejects sound arriving from the sides. Thepolar response of a popular cardioid microphone are shown in the figures on the following page.
42
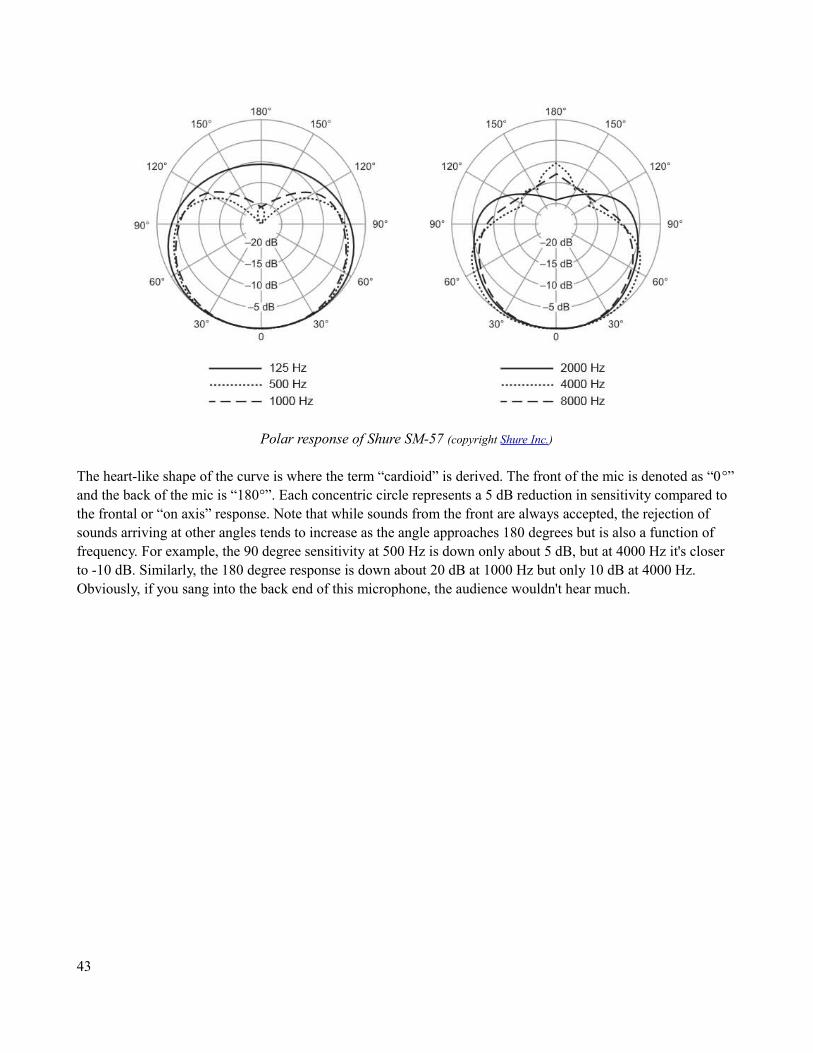
Polar response of Shure SM-57 (copyright Shure Inc.)
The heart-like shape of the curve is where the term “cardioid” is derived. The front of the mic is denoted as “0°”and the back of the mic is “180°”. Each concentric circle represents a 5 dB reduction in sensitivity compared to the frontal or “on axis” response. Note that while sounds from the front are always accepted, the rejection of sounds arriving at other angles tends to increase as the angle approaches 180 degrees but is also a function of frequency. For example, the 90 degree sensitivity at 500 Hz is down only about 5 dB, but at 4000 Hz it's closer to -10 dB. Similarly, the 180 degree response is down about 20 dB at 1000 Hz but only 10 dB at 4000 Hz. Obviously, if you sang into the back end of this microphone, the audience wouldn't hear much.
43
Example ProblemsExample Problems
1. What is meant by microphone directionality? What is a cardioid response?
2. Are loudspeakers directional? Explain.
3. What is the difference between loudspeaker efficiency and sensitivity?
4. Comparing two loudspeakers of similar construction, if unit A has twice the internal enclosure volume of unit B, which of the following may be true?
A) Unit A may be twice as efficient as B with the same low frequency response.B) Unit A may produce lower frequencies than B with the same overall efficiency.C) Unit A may be four times as efficient as B but not produce as much bass.D) Unit A may be slightly more efficient than B and produce somewhat more bass.
5. If I want to create a loudspeaker similar to an existing system but which will produce lower frequencies, I must:
A) Use a larger enclosure to keep the efficiency the same.B) Accept a lower efficiency in order to keep the enclosure the same size.C) Find some alternate construction technology in order to keep both the enclosure and efficiency the same.D) Figure out how to use my calculator.
6. What are the advantages and disadvantages of horn loaded loudspeaker systems versus direct radiating systems?
7. Determine the 90 degree off-axis response of the Shure SM-57 at a frequency of 8000 Hz.
8. Determine the 180 degree off-axis response of the Shure SM-57 at a frequency of 125 Hz.
44
AnswersAnswers
1. Directional mics are more sensitive to sound arriving from some directions than others. Omni-directional mics are equally sensitive to sound arriving from any direction. A cardioid response is a specific type of directional response which favors sound directly in front of the mic while ignoring sound directly behind. The resulting plot of sensitivity is reminiscent of a rounded heart, hence the name.
2. Most home loudspeakers are omni-directional at low frequencies while becoming more directional as frequency increases. This is due to the ratio of the wavelength of sound being reproduced versus the size of the diaphragm. (If the diaphragm is smaller than the wavelength the result will be relatively omni-directional.) In professional applications, loudspeaker systems are designed with very specific directional response in order to increase intelligibility.
3. Sensitivity is the measurement of SPL directly in front of the loudspeaker measured at a certain distance for a specific input power (such as 1 watt/1 meter). Efficiency refers to the total radiated acoustic output power versuselectrical input power. Given two loudspeakers with identical efficiencies, the more directional of the pair will exhibit a higher sensitivity (the sound is concentrated into a more confined area).
4. All of the items. Remember the formula η = k VB f33 where η is the efficiency, VB is the enclosure volume, f3 is
the “3 dB down frequency” or low frequency cutoff point and k is a system constant which depends on type of construction (e.g., sealed box, vented box, etc.) Doubling Vb means you can move the other variables by a total of a factor of 2 (doubling efficiency or halving f3 cubed) or some combination that produces a total factor of 2 (e.g., increasing one by factor of 8 while reducing the other by a factor of 4).
5. All of the items. See problem 4 for details. Item C implies changing k (going from a sealed to a vented system). For normal humans in the early 21st century, item D is most likely required.
6. Horns offer the advantages of increased efficiency (greater acoustical output for the same electrical power input) and directional control. Their downside includes very large size (especially for low frequencies) and complex construction. Consequently, they are not often used in home audio systems but are often used in large public address systems. 7. From the polar graph, about -9 dB.
8. From the polar graph, about -11 dB.
45
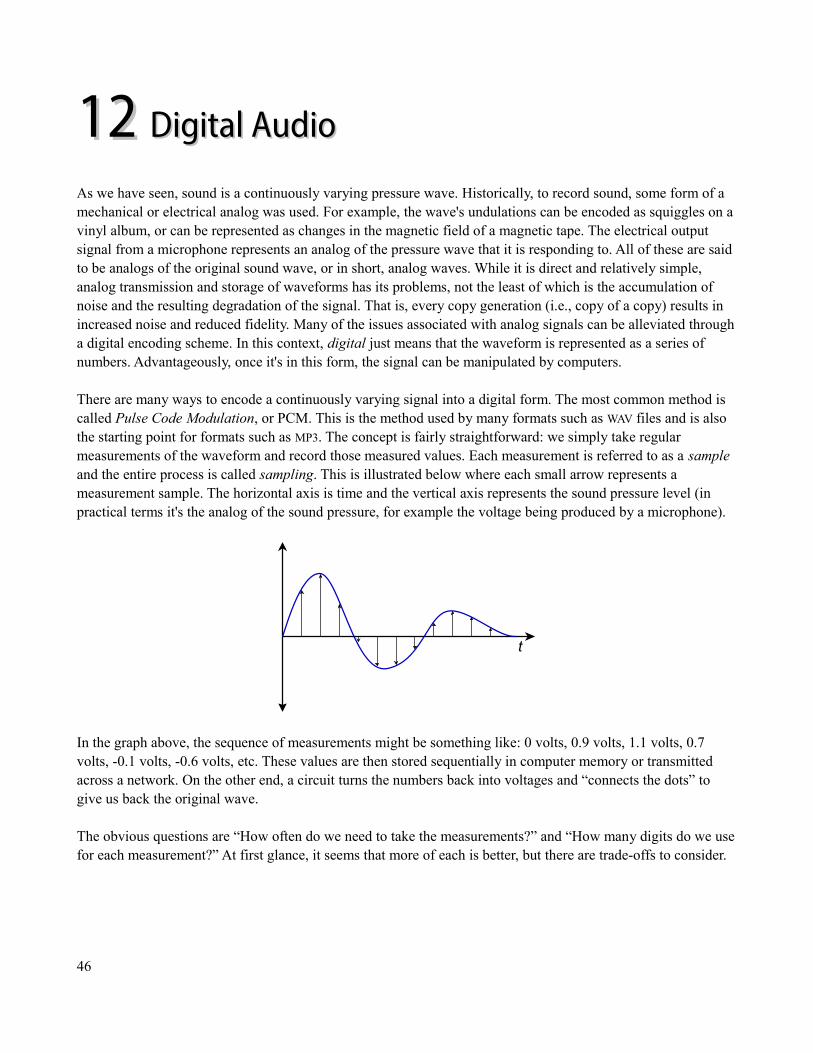
1212 Digital AudioDigital Audio
As we have seen, sound is a continuously varying pressure wave. Historically, to record sound, some form of a mechanical or electrical analog was used. For example, the wave's undulations can be encoded as squiggles on avinyl album, or can be represented as changes in the magnetic field of a magnetic tape. The electrical output signal from a microphone represents an analog of the pressure wave that it is responding to. All of these are said to be analogs of the original sound wave, or in short, analog waves. While it is direct and relatively simple, analog transmission and storage of waveforms has its problems, not the least of which is the accumulation of noise and the resulting degradation of the signal. That is, every copy generation (i.e., copy of a copy) results in increased noise and reduced fidelity. Many of the issues associated with analog signals can be alleviated througha digital encoding scheme. In this context, digital just means that the waveform is represented as a series of numbers. Advantageously, once it's in this form, the signal can be manipulated by computers.
There are many ways to encode a continuously varying signal into a digital form. The most common method is called Pulse Code Modulation, or PCM. This is the method used by many formats such as WAV files and is also the starting point for formats such as MP3. The concept is fairly straightforward: we simply take regular measurements of the waveform and record those measured values. Each measurement is referred to as a sample and the entire process is called sampling. This is illustrated below where each small arrow represents a measurement sample. The horizontal axis is time and the vertical axis represents the sound pressure level (in practical terms it's the analog of the sound pressure, for example the voltage being produced by a microphone).
In the graph above, the sequence of measurements might be something like: 0 volts, 0.9 volts, 1.1 volts, 0.7 volts, -0.1 volts, -0.6 volts, etc. These values are then stored sequentially in computer memory or transmitted across a network. On the other end, a circuit turns the numbers back into voltages and “connects the dots” to give us back the original wave.
The obvious questions are “How often do we need to take the measurements?” and “How many digits do we usefor each measurement?” At first glance, it seems that more of each is better, but there are trade-offs to consider.
46
t
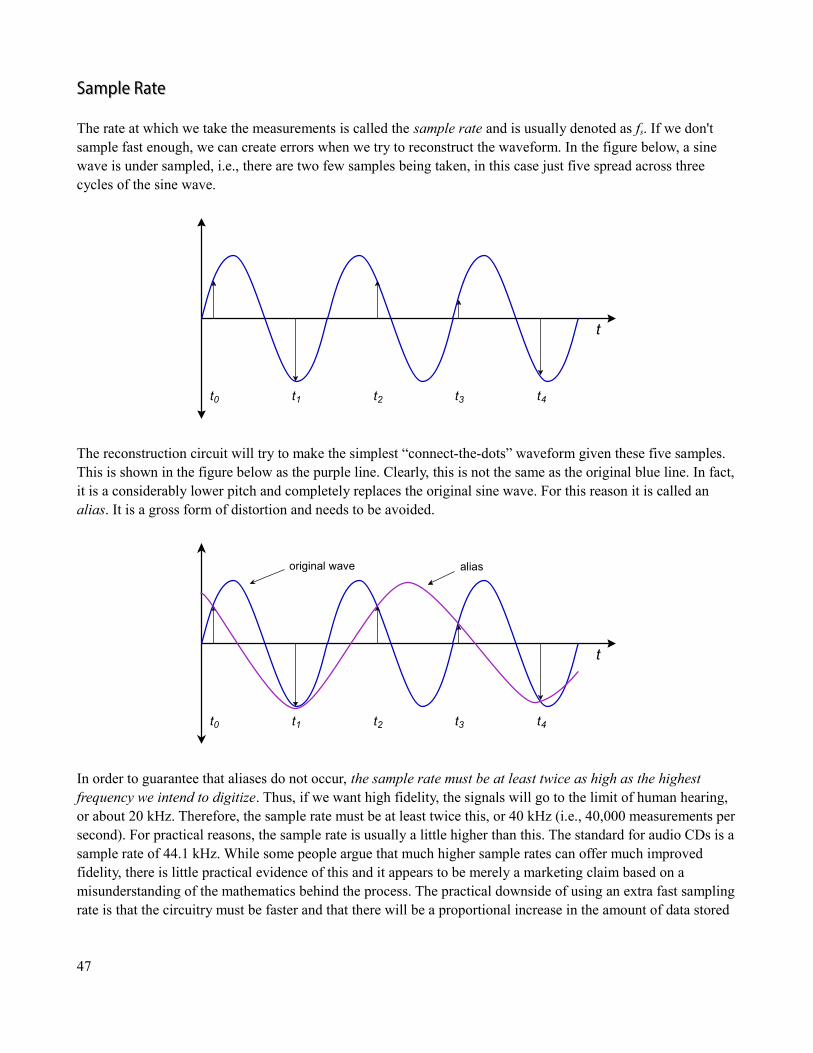
Sample RateSample Rate
The rate at which we take the measurements is called the sample rate and is usually denoted as fs. If we don't sample fast enough, we can create errors when we try to reconstruct the waveform. In the figure below, a sine wave is under sampled, i.e., there are two few samples being taken, in this case just five spread across three cycles of the sine wave.
The reconstruction circuit will try to make the simplest “connect-the-dots” waveform given these five samples. This is shown in the figure below as the purple line. Clearly, this is not the same as the original blue line. In fact,it is a considerably lower pitch and completely replaces the original sine wave. For this reason it is called an alias. It is a gross form of distortion and needs to be avoided.
In order to guarantee that aliases do not occur, the sample rate must be at least twice as high as the highest frequency we intend to digitize. Thus, if we want high fidelity, the signals will go to the limit of human hearing, or about 20 kHz. Therefore, the sample rate must be at least twice this, or 40 kHz (i.e., 40,000 measurements persecond). For practical reasons, the sample rate is usually a little higher than this. The standard for audio CDs is asample rate of 44.1 kHz. While some people argue that much higher sample rates can offer much improved fidelity, there is little practical evidence of this and it appears to be merely a marketing claim based on a misunderstanding of the mathematics behind the process. The practical downside of using an extra fast samplingrate is that the circuitry must be faster and that there will be a proportional increase in the amount of data stored
47
t
t1t0 t2 t3 t4
t
t1t0 t2 t3 t4
aliasoriginal wave
or transmitted. For example, if you double the sample rate, you'll generate twice as many samples and that will require twice the memory to store.
Bit ResolutionBit Resolution
The second aspect involves the number of digits used to store the samples. Although we routinely think of numbers in base 10 (i.e., using numerals 0 through 9 with each place being ten times larger than the prior), digital systems use a binary or base 2 numbering scheme. In this system, there are only two numerals, 0 and 1. This is convenient for the circuitry because “1” can be represented by an arbitrary voltage and “0” can be represented by zero volts. In this system, each place is based on a power of 2 so instead of the places being units, tens, hundreds, thousands, etc., the places are units, twos, fours, eights, sixteens, and so forth. Each 1/0 is referred to as a bit. You can think of it as the yes/no or true/false answer to a single unambiguously phrased question such as “Are you at least 21 years old?” A collection of eight bits is called a byte. One byte represents atotal of 256 different bit combinations (from 00000000 through 11111111)5.
If we choose to measure our signal using a byte-sized representation, we have an effective resolution of one part in 256. Thus, if the entire signal from negative peak to positive peak was one volt, we'd be resolving this to 1/256th of a volt (about 4 millivolts). Obviously, it will generally be the case that there will be a small difference between the actual signal voltage and our measurement. It's like stepping on a bathroom scale that displays whole pounds- the scale cannot tell you if you're 150.1 or 150.4 pounds as both will show up as 150. The difference between the true value and the recorded value is an error. Every single measurement will have some error, and mathematically, those combined errors show up as a noise signal, degrading the audio. If we use more bits, the error is reduced, and therefore the noise is reduced. For every bit you add, you cut the error in half. Thislowers the noise by about 6 dB. Thus, we can approximate the dynamic range6 as:
dynamic range ≈ 6 dB • number of bits per sample
For CDs, the resolution is 16 bits per sample (i.e., two bytes per sample). This means that it has a dynamic rangeof 16 times 6 dB, or about 96 dB.
Storage and Transmission SpeedStorage and Transmission Speed
In general, the higher the sample rate and the larger the bit resolution, the greater the storage requirements and the higher the required speed for real-time transmission. Suppose you want to store a five second message using CD quality sampling. Each sample is 16 bits or 2 bytes. The sample rate is 44,100 Hz, yielding 88,200 bytes per second for each channel. There are two channels for stereo so that's 176.4 kilobytes per second combined. For a five second message, that's multiplied by five for a total storage of 882 kilobytes (.882 megabytes). Reducing the sample rate and/or the bit resolution will reduce the storage accordingly.
5 That's enough combinations to have a unique code or pattern for all of the upper and lower case English letters, the ten numerals, all of the punctuation symbols and other symbols such as $ and @. Consequently, “one byte” can be thought of as roughly equivalent to “one character”.
6 The range from the noise floor up to the largest signal that can be encoded.
48
The second concern is transmission speed over a network. If you wish to send data in real-time, as in a live conversation or concert, multiply the sample rate by the bit resolution to get the channel requirements. Multiply that result by the number of channels to get the final result. For example, to live stream a concert using CD quality standards, the transmission bit rate would be 16 bits-per-sample times 44.1 kHz times 2 channels, or 1.411 megabits-per-second.
CompressionCompression
To reduce the storage space and the transmission speed we can apply compression algorithms to the data. There are two kinds of compression: lossless (or reversible) and lossy (or irreversible). Lossless compression relies on redundancies in the data. They work by finding mathematical redundancies in the file and replacing them with something smaller. It is form or symbol replacement where a simple symbol is used to represent a larger set of symbols. A good example can be made using a text file. Suppose that you compress a letter written to a friend. In this letter the character combination “ the ” occurs numerous times. That is a five byte sequence. Suppose youreplace every occurrence with a special number that lies outside the normal range of character codes. This one byte takes the place of five, for a four byte savings per occurrence. On decompression, the special character is expanded back into “ the ”. There will, of course, need to be some sort of table to indicate what the replacement is, but for a large file this overhead can be ignored. This is how file compression schemes such as Zip and FLAC work. In summary, a lossless compressor encodes the original file into a smaller file that takes up less space and then decodes it back into the original file later when needed. The decoded file is identical to the original, hence the term “lossless”.
This technique works quite well with certain types of data. Text files can usually be compressed to less than half of their normal size, and in some cases considerably less than that. Unfortunately, the more variation there is in the data, the less effective the compression will be. Musical waveforms generally do not contain much redundancy of the sort exhibited by text files. To illustrate this, the popular WinZip program was applied to a one second long CD quality generated sine wave file. The original file was approximately 88 kilobytes in size. The zipped file was merely 85 kilobytes, for a savings of just over 3%. In contrast, a similar length pulse (not bandwidth limited) shrunk from 88 kilobytes to less than 1 kilobyte. Unfortunately, real world music signals are much closer to the former case than the later. Thus, this form of compression is generally of minimal use for audio.
In contrast to lossless (or perfectly reversible) compression is lossy compression. With lossy compression, the decompressed version is not identical to the original. The idea is to first analyze the file and determine which parts of it are significant. The not-so-significant parts are thrown away and therefore, there are less data to compress which will lead to better compression ratios. Lossless schemes can reduce file size by a factor of two or so while lossy schemes can reduce files by a factor of ten or more. Remember, this greater compression is achieved by literally “throwing away” portions of the audio. Once that's done, you can't get those parts back, hence the term “lossy”.
The trick here is to determine what is and what is not significant. This is tied directly to the information in the file. That is, the algorithm that determines significance will be entirely different between audio files and picture files for example. The algorithm attempts to model the human perception system in use. In the case of audio files, that means a psycho-acoustic model of human hearing is needed. Simply put, the perceptual coder tosses away anything that you can’t hear. This includes frequency components below the absolute hearing threshold
49
and components that are masked by louder, nearby frequency content (see the the section on masking for details). These simplified data are then used for the new file. Because items have been thrown away, the decompressed version is not identical to the original, although if done properly it should sound no different. If the perceptual coder is adjusted so that it throws away “less important” content instead of inaudible content, even greater compression can be achieved, although with a reduction in quality. Perceptual coders are what make the high compression rates of JPG (JPEG) and MP3 (MPEG layer 3) files possible. In the case of JPG picture files, high compression may remove the subtle variations of skin tone or sky color, creating a somewhat blocky or “pixelated” result. High compression ratios for MP3s usually result in a loss of high frequency content and dynamics. Aggressive use of lossy compression can seriously degrade the fidelity of the signal. As the MP3 format is an example of lossy compression, it is quite possible to use it to reduce the 1.411 megabit-per-second requirement of uncompressed CD quality audio to less than 100 kilobits-per-second, but the resulting drop in audio quality would make any discerning listener cringe. Fortunately, the compression ratio is under user control, so with some forethought, the user can choose the compression best suited for the job and reap maximum benefits.
It must be remembered though, that once a perceptual coder has done its work, there’s no going back from the resulting file. For this reason, file libraries often leave data in an uncompressed or modestly compressed form, using higher compression only as needed for specific applications. For example, a band might record a song using CD quality sampling for processing and production. The final work will be archived this way. The song will then be compressed, perhaps at various compression levels. The song can then be distributed in a more space efficient manner, yet the original remains intact.
The InternetThe Internet
Many people see the Internet as a sort of vast interconnected library, complete with a messaging system. This offers up many possibilities. For example, once a band has recorded a song and then compressed it into MP3 format, it can be placed on a web server. People from all over the globe can down-load the song and play it. For users with a limited bandwidth Internet connection, a lower fidelity version can be downloaded in similar times due to the higher compression ratio. Of course, the user may prefer the lower fidelity simply to get a larger number of songs onto their MP3 player or phone. This technique also allows for live streaming audio to different users with differing bandwidths.
Of course, there is also the possibility of users compressing copyrighted material and sharing it without consent of the owners of the material (normally the musicians). There has been considerable coverage of this topic in themedia over the years, mostly notably the Napster/RIAA fracas. This is not limited to the music industry. It is worthwhile to remember that technology only dictates what is technically possible, not what is ethical. It does not follow that what can be done, should be done7. Technology tends to be ethically inert. Ethics is a descriptor of human behavior. If something is taken from some party without that party’s consent (direct or implied), that legally constitutes theft. How easy it is to do and the narrow likelihood of being caught, do not alter this fact.
7 For example, it is technically possible to create and install a small subcutaneous implant for each citizen with characteristics that will uniquely identify individuals at various points in a city, but do we want to do this in a free and open society? If that idea frightens you, consider that it is possible to track people via their cell phones, no implant required!
50
Example ProblemsExample Problems
1. What is meant by sample rate? What is meant by bit resolution?
2. How many bytes of memory are required to store one minute of CD quality audio in mono (one channel)? (“CD quality” means 16 bits or 2 bytes per sample, 44,100 samples per second).
3. Repeat problem two for “super definition” audio sampled at 96 kHz with 24 bit resolution.
4. What is the bit rate (bits per second) for a sound sampled at 20 kHz with 12 bit resolution?
5. What are the approximate best-case signal to noise ratios for the systems described in problems 2, 3, and 4?
6. Using MP3, I could compress my CD quality stereo music by a factor of five with some loss in quality. How many minutes of music would fit on a 1 Gig flash drive using this format?
51
AnswersAnswers
1. Sample rate refers to the number of measurements taken of the waveform each second. For example, a samplerate of 32 kHz means that 32000 measurements (samples) are taken during each second of audio. Resolution refers to the number of digits available to record the samples, and thus the ultimate accuracy of each measurement. The more bits, the less error and noise there will be.
2. 44100 samples/sec * 60 secs * 2 bytes/sample = 5.29 Megabytes.(Note how the units work out: samples/sec * secs * bytes/sample = bytes.)
3. 96000 samples/sec * 60 secs * 3 bytes/sample = 17.28 Megabytes.
4. 20,000 samples/sec * 12 bits/sample = 240,000k bits/second (240 kbps).
5. Each bit of resolution adds about 6 dB to the signal to noise ratio.#2- 16 bits * 6 dB/bit = 96 dB.#3- 24 bits * 6 dB/bit = 144 dB.#4- 12 bits * 6 dB/bit = 72 dB.
6. For uncompressed (normal) CD quality audio, you’d need 44,100 samples/second * 2 channels (stereo) * 60 seconds/minute * 2 bytes/sample = 10.58 Megabytes per minute of music. So total minutes available is 1 Gigabyte/10.58 Megabytes/minute = 94.5 minutes for CD quality uncompressed. Multiply by 5 for this compressed format, or 472.5 minutes.
52
13 13 Musical ScalesMusical Scales and Temperament and Temperament
This section covers what might be termed “the mathematics of music”. In Western music, we take it for granted that an octave is filled with 12 notes (the seven white keys and five black keys of piano, for instance). From this palette we create various scales such as the eight notes that define a major scale (do-re-mi-fa-so-la-ti-do), minor scales, five note pentatonic scales and so forth. There is nothing sacrosanct about this pool of twelve notes. Indeed, there are other musical cultures whose note palette and scales do not match those of traditional Western music. The question we are left with is how these notes are defined, that is, how are the various frequencies determined?
First, it is important to note that, to human ears, some pairs of frequencies sound “nicer” than others. Usually, these are comprised of simple integer ratios. Consider an instrument playing two notes, let's say a low A and another A an octave up. Using standard tuning, these would be at 110 Hz and 220 Hz. That's a nice 1:2 ratio. The110 Hz note would have harmonics at 220 Hz, 330 Hz, 440 Hz, 550 Hz, 660 Hz, 770 Hz, 880 Hz and so on. The 220 Hz note would have harmonics at 440 Hz, 880 Hz and so on. Notice that many of these harmonics are the same. The ear recognizes this “sameness” and we hear this as a nice, consonant interval. If, on the other hand, the second note had a very odd mathematical relation with the first note (say, it was 113.7 Hz), none of the harmonics would “line up” and we would hear this as dissonant and generally unpleasant.
There several ways of determining how each note us related to other notes and what the resulting frequencies will be. We shall look at three of them: Just tuning, Pythagorean tuning and Equal Temperament tuning (ET for short).
Just TuningJust Tuning
Just tuning is an old form of tuning dating back many years. It builds the palette of twelve notes by using small integer ratios. For example, the ratio of a perfect fifth (the span from A to E) is a ratio of 2:3. Similarly, a perfectfourth (the span from A to D) is a ratio of 3:4. Thus, if we start with A=110, then E must be 3/2 times that, or 165 Hz. Similarly, the D would be 4/3 times 110 Hz, or 146.67 Hz. Just tuning gives very nice, pure sounding intervals. The practical problem with it is that the ratios between adjacent notes (say, the ratio of C to B versus Fto E) are not consistent. Consequently, it is not possible to change keys in the middle of a piece of music.
Pythagorean TuningPythagorean Tuning
Pythagorean tuning is another old form of tuning. It is based on the idea of repeating an interval, typically the perfect fifth. It works like this: starting with the A used previously, we go up a perfect fifth to the E. This frequency would be 1.5 times the original, or 110 Hz times 1.5 for 165 Hz (the same as seen with Just intonation, above). We then find a perfect fifth above this new note. A perfect fifth above E is B. This frequency would be 1.5 times 165 Hz, or 247.5 Hz. This is more than an octave above the starting A note, so we divide it by two to get the B immediately above the starting A. That's 123.75 Hz. We now find the perfect fifth above this B (F#) by multiplying 123.75 Hz by 1.5. We continue this process until the entire octave is filled.
53
Pythagorean tuning does achieve consistent intervals, however, when we arrive back at the starting note, there will be a discrepancy which produces an out of tune note. This is usually referred to as a “wolf tone”. The solution to this problem is to simply avoid using it. Not the greatest solution, one might conclude.
Equal Temperament Equal Temperament
Equal temperament is the current standard and has been in use for centuries. It sets the ratios between each note to an identical value. As there are twelve notes in an octave, this value is the 12 th root of 2 (approximately 1.059). By doing this, all intervals between a given span of notes will be identical. There will never be wolf tones or similar out-of-tune intervals. Also, it is easy to modulate between keys. The downside is that the intervals do not align with the ideal values. For example, the perfect fifth of the ET tuning is just off of the ideal 2:3 ratio. The same is true for other ratios such as the major third. This makes the ET system slightly less consonant than, say, a just tuning, but the flexibility of the system is a major asset. Further, the ratio errors tend to be small and not objectional to most people. Surely, if this was not the case, then we wouldn't see the near universal acceptance and and implementation of the system as we do.
One interesting aspect of the ET scheme is that you can easily generate a note palette of any size. The standard we use is sometimes called “12ET” meaning “12 tone equal temperament”. It would not be difficult to design a system using 15 or 18 notes per octave. They would simply use adjacent note ratios of the 15th root of 2 and the 18th root of 2, respectively. What music composed and performed using those systems would sound like is a completely different question.
54
Related Documents


![17.2 Sound Waves: In Halliday and Resnick: Longitudinal waves are sound waves! Chapter 17: [Sound] Waves-(II) Sound waves propagate in gases. Can they.](https://static.cupdf.com/doc/110x72/56649eb25503460f94bb9375/172-sound-waves-in-halliday-and-resnick-longitudinal-waves-are-sound-waves.jpg)


