KEEPING ILLINOIS COMPETITIVE Science, Technology, Engineering & Math Education ILLINOIS STATUS REPORT JUNE 2006

Welcome message from author
This document is posted to help you gain knowledge. Please leave a comment to let me know what you think about it! Share it to your friends and learn new things together.
Transcript
KEEPING ILLINOIS COMPETITIVE
Science, Technology, Engineering & Math EducationILLINOIS STATUS REPORT
JUNE 2006
ii Science, Technology, Engineering and Mathematics Education
June 2006 © Northern Illinois University www.keepingillinoiscompetitive.niu.edu
ACKNOWLEDGEMENTS
Northern Illinois University P-20 Task Force This report is an initiative of Northern Illinois University’s
P-20 Task Force. At NIU “P-20” refers to the educational continuum from pre-school through graduate school. For 2005-2007, the P-20 Task Force’s top priority is improvement of mathematics and science education.
www.p20.niu.edu
Illinois Business Roundtable The Illinois Business Roundtable generously provided funding for this report. www.IllinoisBusinessRoundtable.com
Keeping Illinois Competitive Report Team Northern Illinois University Outreach Penny Billman Marilyn McConachie Lee Patton Rachel Turner
Keeping Illinois Competitive on the Web www.keepingillinoiscompetitive.niu.edu
For information or to order copies, contact [email protected] or call toll-free 1-866-855-1239
Copyright 2006Northern Illinois University
DeKalb, Illinois 60115www.niu.edu
Illinois STEM Education Report iii
June 2006 © Northern Illinois University www.keepingillinoiscompetitive.niu.edu
TABLE OF CONTENTS
EXECUTIVE SUMMARY ...................................................................................................... 1
INTRODUCTION ............................................................................................................ 10
TRENDS AFFECTING BUSINESS AND EDUCATION IN ILLINOIS ....................................... 13
I. Convergence of Demographic, Technological, and Globalization Trends .............. 14
A. The Decline of the Middle Class .............................................................. 15
B. A Projected Shortage of Skilled Workers for the Future ............................. 18
C. Increasing Competition Due to Economic Globalization ........................... 22
II. The Changing Academic Core: Knowledge and Skills Needed in the 21st Century .. 26
A. Importance of STEM Education for Everyone ............................................ 27
B. Changing Knowledge and Skills Needed for 21st Century Workers ............ 29
C. Issues in Implementing the Changing Basic Core ..................................... 30
INDICATORS OF ILLINOIS STUDENTS’ STEM PERFORMANCE .......................................... 32
III. Student Achievement ......................................................................................... 33
A. International Comparisons - United States .............................................. 33
B. International Comparisons - Illinois ......................................................... 38
C. Illinois and U.S. Comparisons - NAEP ...................................................... 39
D. Illinois State Assessments ........................................................................ 48
IV. Readiness for College and Work ........................................................................ 54
A. High School Dropout and Graduation Rates ............................................ 55
B. Readiness for College ............................................................................. 56
C. Readiness of High School Graduates for the Workforce ............................ 62
V. College Participation and Completion ................................................................ 64
A. The Education Pipeline ............................................................................ 64
B. Students in STEM Majors ......................................................................... 66
iv Science, Technology, Engineering and Mathematics Education
June 2006 © Northern Illinois University www.keepingillinoiscompetitive.niu.edu
ALIGNING STEM EDUCATION TO 21st CENTURY KNOWLEDGE AND SKILLS .................. 70
VI. Standards, Assessment, and Instruction ............................................................... 71
A. Illinois Learning Standards and State Assessments ................................... 71
B. Instructional Approaches to Engage Students ........................................... 73
C. Alignment of High School Requirements to College and Workplace Readiness ............................................................................. 75
D. Alignment of STEM Education to Illinois’ Economic Development ............. 79
VII. Resources for STEM Education .......................................................................... 82
A. Student and Parent Awareness of the Need for STEM Education ............... 82
B. Preparation and Professional Development of Educators .......................... 83
C. Support for Innovative Research and Development and STEM Education ... 85
STEM EDUCATION ISSUES FOR 21st CENTURY COMPETITIVENESS ................................. 92
VIII. A Call to Action for Illinois ................................................................................ 93
ENDNOTES .................................................................................................................... 98
REFERENCES ................................................................................................................ 108
APPENDICES ................................................................................................................ 115
Appendix A. Selections from the Illinois Learning Standards ..................................... 116 Appendix B. Additional NAEP Analysis .................................................................... 120 Appendix C. Summary of Recommendations from Selected Reports ......................... 122Appendix D. Design Team ...................................................................................... 126
TABLE OF CONTENTS (cont.)
Illinois STEM Education Report v
June 2006 © Northern Illinois University www.keepingillinoiscompetitive.niu.edu
FIGURES
Figure 1 Proportion of Manufacturing Employment in 1999 and 2004 ......................... 15
Figure 2 Percentages of the 30 Fastest Growing Occupations by Level of Required Education ..................................................................................................... 17
Figure 3 Illinois Population at Work-Entry and Work-Exit Ages (In Thousands) .............. 18
Figure 4 Percentages of Illinois Worker-Age (25 to 64 Year Old) by Ethnicity ................ 19
Figure 5 Percentages of Workforce in Science and Engineering Occupations in 2003 ... 20
Figure 6 Percentages of Workforce in Engineering, Life/Physical Sciences, and Computer Specialties in 2003 ....................................................................... 21
Figure 7 Percentages of U.S. Patents of Foreign Origin 1994-2004 ............................. 24
Figure 8 Percentages of Correct Answers in 8th Grade Mathematics Test by Content Area in 2003 ................................................................................... 35
Figure 9 Percentages of Correct Answers in 8th Grade Science Test by Content Area ... 36
Figure 10 4th Grade NAEP Mathematics Comparisons .................................................. 41
Figure 11 8th Grade NAEP Mathematics Comparisons .................................................. 41
Figure 12 4th Grade NAEP Science Comparisons .......................................................... 42
Figure 13 8th Grade NAEP Science Comparison .......................................................... 42
Figure 14 Percentages of Students Scoring At or Above “Proficient” Level on 2005 NAEP Mathematics Test by Income Level ....................................................... 43
Figure 15 Percentages of Students Scoring At or Above “Proficient” Level on 2005 NAEP Mathematics Test by Ethnicity ............................................................... 43
Figure 16 Comparison of Achievement on NAEP Mathematics 4th Grade in Public Schools by Ethnicity ...................................................................................... 45
Figure 17 Comparison of Achievement on NAEP Mathematics 8th Grade in Public Schools by Ethnicity ...................................................................................... 45
Figure 18 Percentages of Students on 2000 NAEP Science Exam Who Are At or Above Proficient Level by Ethnicity ........................................................................... 46
Figure 19 Percentages of Students on 2000 NAEP Science Exam Who Are At or Above Proficient Level by Ethnicity .......................................................................... 46
Figure 20 Illinois State Assessments in Mathematics for 2005: Percentages of Students Meeting or Exceeding Standards ................................................................... 49
Figure 21 ISAT 3rd Grade Mathematics: Students Meeting or Exceeding Standards ........ 50
Figure 22 ISAT 5th Grade Mathematics: Students Meeting or Exceeding Standards ........ 50
Figure 23 ISAT 8th Grade Mathematics: Students Meeting or Exceeding Standards ........ 50
Figure 24 PSAE 11th Grade Mathematics: Students Meeting or Exceeding Standards ..... 50
Figure 25 Illinois State Assessments in Mathematics for 2005: Percentages of Students Meeting or Exceeding Standards ..................................................... 51
vi Science, Technology, Engineering and Mathematics Education
June 2006 © Northern Illinois University www.keepingillinoiscompetitive.niu.edu
Figure 26 ISAT 4th Grade Science: Students Meeting or Exceeding Standards ................ 52
Figure 27 ISAT 7th Grade Science: Students Meeting or Exceeding Standards ................ 52
Figure 28 PSAE 11th Grade Science: Students Meeting or Exceeding Standards ............. 52
Figure 29 Readiness of High School Graduates for College ........................................... 57
Figure 30 Readiness of Illinois High School Graduates by Ethnicity ................................ 58
Figure 31 Average 2005 ACT Score by Ethnicity and Core Courses ............................... 59
Figure 32 Percentages of Illinois Students and Job Profiles at Each Level on Applied Mathematics WorkKeys in 2005 .................................................................... 62
Figure 33 Percentages of Degree Recipients in Illinois Who are Non-Residents .............. 67
Figure 34 College Major, Persistence, and Completion by Ethnicity ................................ 68
Figure 35 Percentages of Eighth Grade Students Taking Algebra in 2005 ...................... 77
Figure 36 Percentages of High School Science Teachers Certified in the Subject in Grades 9-12, 2004 ...................................................................................... 84
Figure 37 Academic Article Output per 1,000 Science and Engineering Doctorate Holders in Academia 1997-2003 .................................................................. 86
Figure 38 Elementary and Secondary Public School Expenditures as Share of Gross State Product: 2003 ...................................................................................... 88
Figure 39 Absolute Dollar Gaps in Expenditure Per Student for Highest and Lowest Poverty Districts ............................................................................................ 88
Figure 40 Differences in Performance of Illinois Students on 4th Grade NAEP Exam .... 121
Figure 41 Differences in Performance of Illinois Students on 8th Grade NAEP Exam .... 121
Figure 42 Illinois and U.S. Score Differences in Performance on 4th Grade NAEP Mathematics Tests by Ethnicity and Low-Income Status ................................ 121
Figure 43 Illinois and U.S. Score Differences in Performance on 8th Grade NAEP Mathematics Test by Ethnicity and Low-Income Status .................................. 121
FIGURES (cont.)
Illinois STEM Education Report vii
June 2006 © Northern Illinois University www.keepingillinoiscompetitive.niu.edu
TABLES
Table 1 Scores on TIMSS 2003 Mathematics Test for Selected Countries ..................... 34
Table 2 Scores on TIMSS 2003 Science Test for Selected Countries ............................. 36
Table 3 Comparison of Mean Performance on PISA Mathematics and Science Tests in 2003 in Selected Countries ....................................................................... 37
Table 4 Percentages of Students at “Proficient” Level or Higher on NAEP ................... 40
Table 5 2005 NAEP Mathematics Comparisons ......................................................... 44
Table 6 Percentages of Students Scoring At or Above Proficient Level on 2005 NAEP Mathematics Test ........................................................................ 44
Table 7 Graduation Rates by Ethnicity and Gender Using Manhattan Institute Methodology ................................................................................................ 56
Table 8 Comparison of Graduation Rates for Illinois .................................................. 56
Table 9 Percent of Public High School Students Taking an AP Exam Compared to Percent Scoring 3 or Higher on at Least One AP Exam ................................... 60
Table 10 The College Degree Pipeline ......................................................................... 65
Table 11 Retention and Completion Rates of College Students ..................................... 65
Table 12 Number of Degrees Awarded by Illinois Colleges and Universities in 2003-2004 ............................................................................................... 67
Table 13 Comparison of Illinois Graduation Requirements to ACT and UIUC ............... 76
Table 14 Comparison of Gaps in Scores of Illinois Students Compared to National Gaps in Mathematics Performance on the 2005 NAEP ................................. 120
Table 15 Percentages of Students Scoring At or Above Proficient Level on2005 NAEP Mathematics Test ...................................................................... 120
viii Science, Technology, Engineering and Mathematics Education
June 2006 © Northern Illinois University www.keepingillinoiscompetitive.niu.edu
Illinois STEM Education Report 1
June 2006 © Northern Illinois University www.keepingillinoiscompetitive.niu.edu
EXECUTIVE SUMMARY
The United States is losing its edge in innovation and is watching the erosion of its capacity to create new scientific and technological breakthroughs. Increased global competition, lackluster performance in mathematics and science education, and a lack of national focus on renewing its science and technology infrastructure have created a new economic and technological vulnerability as serious as any military or terrorist threat. - A Commitment to America’s Future, 2005i
Keeping Illinois Competitive confirms the importance of stronger science, technology, engineering, and mathematics (STEM) education to our state’s competitiveness. This report identifies current strengths and critical challenges facing Illinois as it strives to flourish in a global economy where other nations and U.S. states compete.
Illinois’ future economic vitality requires a skilled workforce that can adapt to new technologies regardless of the occupation; a research agenda for innovation; and well-informed, productive citizens. The 21st Century Illinois workers and citizens must have rich, multi-dimensional backgrounds in order to be successful in the emerging economic and cultural environment. The focus of this report is on the STEM subjects (science, technology, engineering, and mathematics), which comprise part of a comprehensive education.
After a review of demographic, technological, and globalization trends, as well as Illinois’ performance on a variety of STEM indicators, Keeping Illinois Competitive concludes that Illinois faces five challenges. Addressing these challenges will require the public and private sectors working together to ensure that the STEM education system prepares the skilled workers needed to support Illinois’ economic development and quality of life.
Challenge One: Student Academic Achievement Slightly more than half of Illinois high school students have the requisite mathematics
and science skills for postsecondary education or jobs in the emerging new economy.
Challenge Two: Alignment to 21st Century Knowledge and Skills State curricula, assessments, and pedagogy are not consistently aligned with the 21st
Century knowledge and skills needed for the state’s economic vitality.
Challenge Three: Teacher Preparation Many mathematics and science teachers do not have the proper qualifications or access
to ongoing professional development to improve their teaching.
Challenge Four: Investment in STEM Education Strategies may not be adequate to recruit and retain the most qualified individuals for
STEM professions and for research and development for innovation.
Challenge Five: Lifelong Leaning In the 21st Century, all citizens and workers will need increasing mathematics and
science skills and opportunities for lifelong learning.
2 Science, Technology, Engineering and Mathematics Education
June 2006 © Northern Illinois University www.keepingillinoiscompetitive.niu.edu
EXECUTIVE SUMMARY
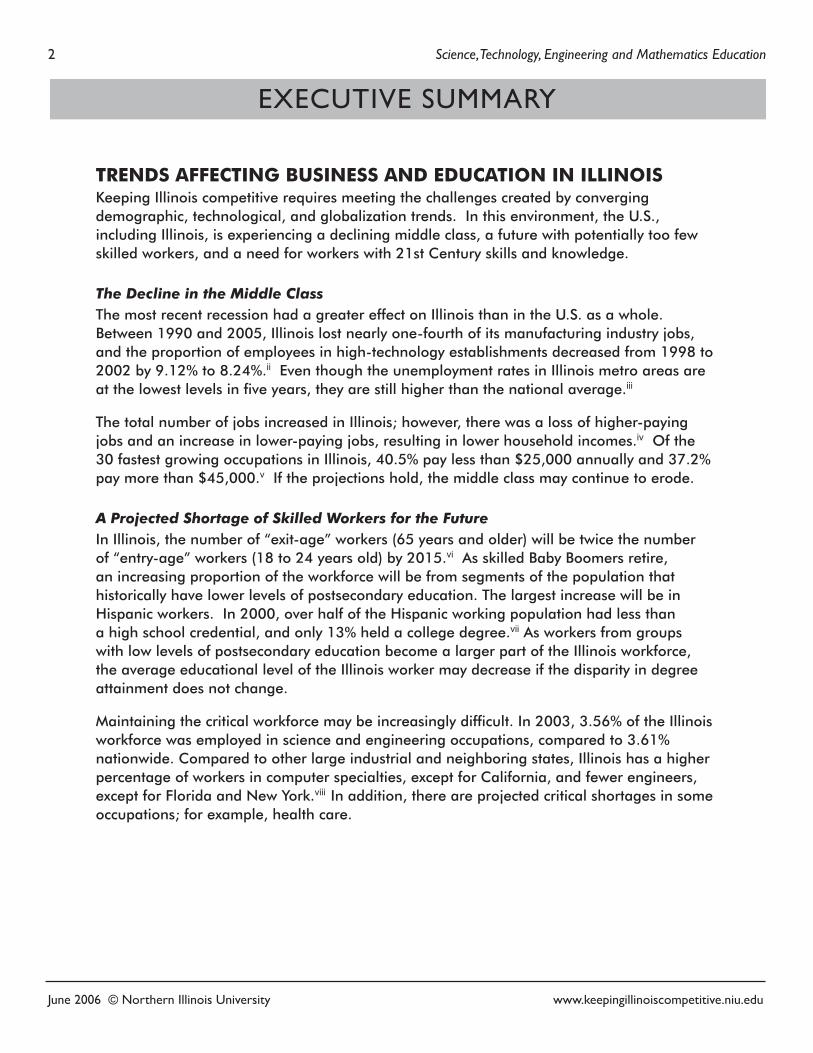
TRENDS AFFECTING BUSINESS AND EDUCATION IN ILLINOISKeeping Illinois competitive requires meeting the challenges created by converging demographic, technological, and globalization trends. In this environment, the U.S., including Illinois, is experiencing a declining middle class, a future with potentially too few skilled workers, and a need for workers with 21st Century skills and knowledge.
The Decline in the Middle ClassThe most recent recession had a greater effect on Illinois than in the U.S. as a whole. Between 1990 and 2005, Illinois lost nearly one-fourth of its manufacturing industry jobs, and the proportion of employees in high-technology establishments decreased from 1998 to 2002 by 9.12% to 8.24%.ii Even though the unemployment rates in Illinois metro areas are at the lowest levels in five years, they are still higher than the national average.iii
The total number of jobs increased in Illinois; however, there was a loss of higher-paying jobs and an increase in lower-paying jobs, resulting in lower household incomes.iv Of the 30 fastest growing occupations in Illinois, 40.5% pay less than $25,000 annually and 37.2% pay more than $45,000.v If the projections hold, the middle class may continue to erode.
A Projected Shortage of Skilled Workers for the FutureIn Illinois, the number of “exit-age” workers (65 years and older) will be twice the number of “entry-age” workers (18 to 24 years old) by 2015.vi As skilled Baby Boomers retire, an increasing proportion of the workforce will be from segments of the population that historically have lower levels of postsecondary education. The largest increase will be in Hispanic workers. In 2000, over half of the Hispanic working population had less than a high school credential, and only 13% held a college degree.vii As workers from groups with low levels of postsecondary education become a larger part of the Illinois workforce, the average educational level of the Illinois worker may decrease if the disparity in degree attainment does not change.
Maintaining the critical workforce may be increasingly difficult. In 2003, 3.56% of the Illinois workforce was employed in science and engineering occupations, compared to 3.61% nationwide. Compared to other large industrial and neighboring states, Illinois has a higher percentage of workers in computer specialties, except for California, and fewer engineers, except for Florida and New York.viii In addition, there are projected critical shortages in some occupations; for example, health care.
Illinois STEM Education Report 3
June 2006 © Northern Illinois University www.keepingillinoiscompetitive.niu.edu
EXECUTIVE SUMMARY
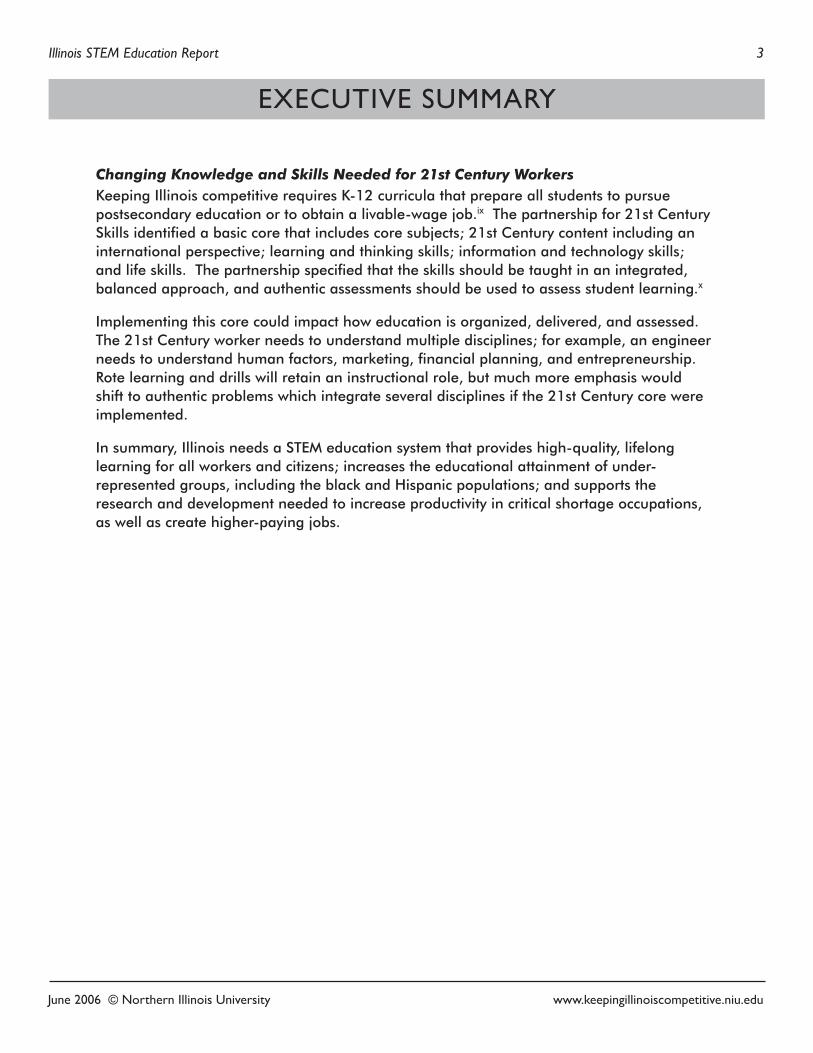
Changing Knowledge and Skills Needed for 21st Century WorkersKeeping Illinois competitive requires K-12 curricula that prepare all students to pursue postsecondary education or to obtain a livable-wage job.ix The partnership for 21st Century Skills identified a basic core that includes core subjects; 21st Century content including an international perspective; learning and thinking skills; information and technology skills; and life skills. The partnership specified that the skills should be taught in an integrated, balanced approach, and authentic assessments should be used to assess student learning.x
Implementing this core could impact how education is organized, delivered, and assessed. The 21st Century worker needs to understand multiple disciplines; for example, an engineer needs to understand human factors, marketing, financial planning, and entrepreneurship. Rote learning and drills will retain an instructional role, but much more emphasis would shift to authentic problems which integrate several disciplines if the 21st Century core were implemented.
In summary, Illinois needs a STEM education system that provides high-quality, lifelong learning for all workers and citizens; increases the educational attainment of under-represented groups, including the black and Hispanic populations; and supports the research and development needed to increase productivity in critical shortage occupations, as well as create higher-paying jobs.
4 Science, Technology, Engineering and Mathematics Education
June 2006 © Northern Illinois University www.keepingillinoiscompetitive.niu.edu
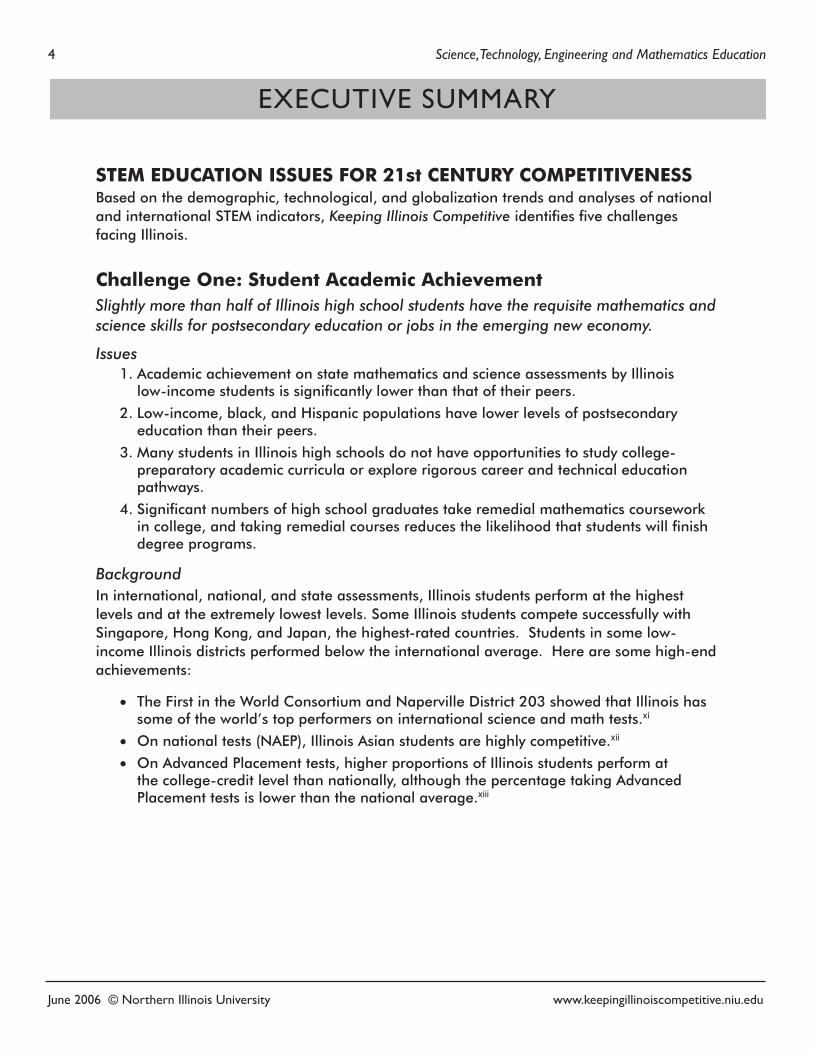
STEM EDUCATION ISSUES FOR 21st CENTURY COMPETITIVENESSBased on the demographic, technological, and globalization trends and analyses of national and international STEM indicators, Keeping Illinois Competitive identifies five challenges facing Illinois.
Challenge One: Student Academic AchievementSlightly more than half of Illinois high school students have the requisite mathematics and science skills for postsecondary education or jobs in the emerging new economy.
Issues1. Academic achievement on state mathematics and science assessments by Illinois
low-income students is significantly lower than that of their peers.
2. Low-income, black, and Hispanic populations have lower levels of postsecondary education than their peers.
3. Many students in Illinois high schools do not have opportunities to study college-preparatory academic curricula or explore rigorous career and technical education pathways.
4. Significant numbers of high school graduates take remedial mathematics coursework in college, and taking remedial courses reduces the likelihood that students will finish degree programs.
BackgroundIn international, national, and state assessments, Illinois students perform at the highest levels and at the extremely lowest levels. Some Illinois students compete successfully with Singapore, Hong Kong, and Japan, the highest-rated countries. Students in some low-income Illinois districts performed below the international average. Here are some high-end achievements:
• The First in the World Consortium and Naperville District 203 showed that Illinois has some of the world’s top performers on international science and math tests.xi
• On national tests (NAEP), Illinois Asian students are highly competitive.xii
• On Advanced Placement tests, higher proportions of Illinois students perform at the college-credit level than nationally, although the percentage taking Advanced Placement tests is lower than the national average.xiii
EXECUTIVE SUMMARY
Illinois STEM Education Report 5
June 2006 © Northern Illinois University www.keepingillinoiscompetitive.niu.edu
There are disparities in achievement across the grade levels and among subgroups of students, as indicated in the Illinois state assessment results.xiv
• Students decrease in their levels of achievement as they move from the early grades through high school. The percentage of students meeting or exceeding the state standards in mathematics decreases from 79% in 3rd grade to 53% in 11th grade. In science, the decreases are similar – from 71% meeting or exceeding the standards in 4th grade to only 53% meeting or exceeding the standards in 11th grade.
• In third grade, 6 out of 10 low-income students meet or exceed standards; by 8th grade only 3 out of 10 meet the standards, and by 11th grade the number has decreased to fewer than 3 out of 10.
• The performance of Hispanics has improved but is still well below that of their white and Asian peers. In third grade mathematics, 15% more of the white students than Hispanic students meet or exceed state standards; the gap doubles by 11th grade.
• In 3rd grade, about 1 in 2 black students meet the state standards, and by 11th grade, only 1 in 5 meet the state standards.
On the national assessments, Illinois students performed at the national average; however, Illinois also has some of the largest achievement gaps in the U.S.
• The difference between the scores of 4th grade Illinois low-income students and their “not low-income” peers was the largest gap in the nation.
• Only 9% of the 4th grade and 6% of the 8th grade Illinois black students achieved a “proficient” level” on the national test, and over half did not reach the “basic” level in mathematics.
• 8th grade Hispanic students had higher scores than their U.S. Hispanic peers in mathematics; however, only 13% were at the national “proficient” level.
Whether the indicator is high school completion rates, readiness for college, or readiness for work, Illinois students who are low-income, black, and/or Hispanic do not fare as well as their white and Asian peers.xv
• The high school completion rates appear to be increasing in Illinois; however, only 70-75% of all of the 9th grade students will complete high school. Fewer than 50% of the black and Hispanic male students will graduate.
• Significantly more white and Asian students in Illinois, both male and female, graduate as compared to their U.S. peers.
• Significantly more male and female black students in Illinois drop out than their U.S. peers.
• The number of Illinois public high school graduates is projected to increase by 8.3% between 2002 and 2014, compared to a national increase of 9%. In Illinois, there is a disproportionate projected growth for the Hispanic population. If these projections hold true, and if the performance of the ethnic minority groups does not improve, Illinois may have increasing numbers of students from the populations most likely to drop out of school.
EXECUTIVE SUMMARY
6 Science, Technology, Engineering and Mathematics Education
June 2006 © Northern Illinois University www.keepingillinoiscompetitive.niu.edu
Challenge Two: Alignment to 21st Century Knowledge and SkillsState curricula, assessments, and pedagogy are not consistently aligned with the 21st Century knowledge and skills needed for the state’s economic vitality.
Issues1. Content area performance descriptors and state assessments do not cover 21st
Century skills such as those in the “Applications of Learning” or the career and workforce skills that are part of the Illinois Learning Standards.
2. A statewide, inclusive process to regularly review and update the Illinois Learning Standards and performance descriptors to include cutting-edge technology and research-based pedagogy does not exist at this time.
3. The emerging instructional models that integrate disciplines and are grounded in authentic, real-world problems could be explored by state level organizations.
4. Current data-collection methods in the state do not provide accurate, consistent information on graduation and drop-out rates or the pathways students take through the P-20 educational system.
BackgroundThe content delivered in Illinois classrooms should lead to high school graduates who are prepared for both postsecondary education and a livable-wage job. Significant numbers of Illinois high school graduates do not meet these benchmarks.xvi
• Over 35% of Illinois students performed at the highest levels (6 or 7 out of 7) on the WorkKeys in Applied Mathematics.
• 8.2% scored lower than the level required for any of the WorkKeys job profiles; over twice as many low-income students were at this low level.
• 65% of the highest income students are the “most ready” for college, compared to only 20% of the lowest-income students.
• Less than 11% of the black high school graduates and less than 17% of the Hispanic high school graduates are prepared for college, compared to 55% of the Asian high school graduates and 55% of the white high school graduates, according to the Illinois Education Research Council.
Keeping Illinois competitive requires the learning standards and graduation requirements to be aligned with the 21st Century core of knowledge and skills in order to sustain the state’s economic vitality.xvii
• Illinois raised high school graduation requirements in 2005, but not to the level advocated by national groups; most recent studies agree that the knowledge and skills required for college are quite similar to the knowledge and skills required for entry-level jobs.
EXECUTIVE SUMMARY
Illinois STEM Education Report 7
June 2006 © Northern Illinois University www.keepingillinoiscompetitive.niu.edu
• The current high school graduation requirements are focused on “seat time” and are not explicitly aligned with the standards.
• Even though the Illinois Learning Standards have received above-average national ratings, the “Applications of Learning” sections of the standards which reflect the additional 21st Century skills and knowledge are not included in the benchmarks, performance descriptors, and state-level assessments.
Challenge Three: Teacher PreparationMany mathematics and science teachers do not have the proper qualifications or access to ongoing professional development to improve their teaching.
Issues1. The training necessary to meet the minimum state certification requirements for the
subjects they teach is either not being provided for, or not being pursued by, all Illinois science and mathematics teachers who are not fully qualified.
2. Barriers exist that prevent mathematics and science teachers from acquiring and implementing new content knowledge and pedagogical skills in the classroom.
BackgroundSignificant numbers of students are taught mathematics and science by teachers who do not have the required certification to teach in their assigned subject areas:xviii
• Slightly more than 50% of 8th grade mathematics teachers in Illinois are certified to teach mathematics and 26% have elementary certification. Nearly one-fourth have neither certification.
• In Illinois high schools, one-third of chemistry teachers, two-fifths of physics teachers, about one-half of biology teachers, and nearly three-fourths of earth science teachers do not hold the proper state certifications to teach in these content areas.
• The Associates of Arts in Teaching (AAT) in science and mathematics was created for the purpose of increasing the numbers and quality of community college students wishing to transfer to teacher education programs and ultimately be certified in critical shortage areas such as mathematics and science.
• Scholarships and tuition waiver programs—such as Illinois Future Teacher Corp Program, Illinois Special Education Teacher Tuition Waiver, Minority Teachers of Illinois, Robert C. Byrd Scholarship Program, Golden Apple Foundation, and the Illinois Teacher Loan Repayment Program—are available for those pursuing careers as educators, particularly for those willing to teach in high-risk schools.
EXECUTIVE SUMMARY
8 Science, Technology, Engineering and Mathematics Education
June 2006 © Northern Illinois University www.keepingillinoiscompetitive.niu.edu
Challenge Four: Investment in STEM EducationStrategies may not be adequate to recruit and retain the most qualified individuals for STEM professions and for research and development for innovation.
Issues1. Parents say that awareness programs aimed at recruiting high-potential students to
postsecondary STEM education are inadequate.xix
2. Barriers exist which discourage or prohibit students, especially low-income students, from enrolling in and completing STEM programs.xx
3. P-20 instructional activities that develop the skills needed for innovation have not been identified and disseminated.
4. Investment in STEM research has decreased in recent years.
BackgroundIllinois needs innovative STEM research and development to increase productivity in critical shortage occupations, to increase innovation in business and industry, and to keep Illinois competitive both nationally and globally.xxi
• 57% of Illinois high school graduates go directly into college, the same as for the U.S., but within six years, slightly more Illinois students complete four-year degrees than found nationally.
• From 1994 to 2004, the number of students in Illinois colleges and universities increased with a significant increase in the Hispanic population but a decrease in the black population.
• In 2004, Illinois colleges and universities granted over 10,000 bachelor and higher degrees in computer and information science, engineering, and mathematics.
• Over half of the master’s and doctoral degrees were granted to non-residents.
Resources are needed to build Illinois’ capacity for innovation.xxii
• Illinois is one of the higher volume publishing states in terms of the number of academic articles per science and engineering doctorate.
• From 1997 to 2003, the number of academic patents per 1,000 academic doctorate holders increased from 10.5 to 13.0 in the United States and from 7.7 to 10.5 in Illinois.
• For 2001 to 2003, the U.S. Small Business Innovation Ratio to $1 million gross state product was 141, compared to Illinois’ ratio of 43.
• From 1998 to 2003, the percentage of R & D conducted by industry in the private sector decreased in the United States from 2.14% to 2.06%. In Illinois, the percentage of industry-performed R & D increased from 1.90% in 1998 to 2.00% in 2000 but decreased to 0.85% in 2003.
• Illinois has one of the largest P-12 funding gaps in the U.S. between the average expenditures of the top and bottom quartile of low-income districts.
EXECUTIVE SUMMARY
Illinois STEM Education Report 9
June 2006 © Northern Illinois University www.keepingillinoiscompetitive.niu.edu
Challenge Five: Lifelong LearningIn the 21st Century, all citizens and workers will need increasing mathematics and science skills and opportunities for lifelong learning.
Issues1. Continuing education is needed to keep all workers’ skills current.
2. Citizens may not be sufficiently aware of the need for all citizens to keep their STEM knowledge and skills up to date.
BackgroundIt is important for all Illinoisans, as employees and as citizens, to understand the STEM issues that affect their lives. Keeping Illinois competitive requires all workers to keep their skills up to date according to their occupational standards.xxiii
• Many of Illinois’ unemployed engineers and computer scientists have college educations; however, the job openings are in the newer technologies.
• Nearly 90% of the surveyed parents indicated that the science and engineering communities need to do a better job of telling today’s students about STEM job opportunities.
These five challenges provide a starting point for dialogue. Keeping Illinois competitive will require all public and private sectors working together to create coordinated, integrated, innovative solutions to these challenges.
EXECUTIVE SUMMARY
10 Science, Technology, Engineering and Mathematics Education
June 2006 © Northern Illinois University www.keepingillinoiscompetitive.niu.edu
Having reviewed trends in the United States and abroad, the committee is deeply concerned that the scientific and technical building blocks of our economic leadership are eroding at a time when many other nations are gathering strength.1 —Rising Above the Gathering Storm, 2005
The National Academy of Sciences, the National Academy of Engineering, and the Institute of Medicine expressed this concern, mirroring national reports issued in the last few years. The call to action—the critical and immediate need to address the challenges eroding the nation’s role as a global economic leader—are coming from all sectors of business, government, education, and society; and there are new reports daily in the professional and public media.
These calls for action are in response to the rapid changes and unprecedented challenges facing the nation. The convergence of rapid demographic and technological changes, along with the lightning-speed globalization of the economy, is resulting in a new world—one that is vastly different from anything the U.S. has known. The knowledge and skills necessary for economic success in this new world are more complex and demanding than those in the past. The days of finding a well-paying, lifelong job without postsecondary education are over. The need for increased skills applies to the average citizen as well as the worker. The issues facing voters are complex, and even a trip to the doctor requires more advanced knowledge of science than it did 20 years ago.
A Roadmap for American Innovation, a 2005 report on competitiveness, summarized the challenges facing the U.S. as follows:
• Talent, technology, and capital are available globally.
• Global competitors are gaining on the U.S. through investment in research and education.
• U.S. investment in engineering, math, and related sciences has been flat for more than a decade.
• High school students in the U.S. perform well below those in other industrialized nations in the fields of mathematics and science. 2
Each of these challenges directly affects science, technology, engineering, and mathematics (STEM) education. How can Illinois ensure that all citizens have the 21st Century skills needed to be effective citizens and gainfully employed? How can Illinois ensure students leave high school with the necessary skills for citizenship, work, and postsecondary education? How can Illinois ensure that appropriate investments support the innovation endeavors needed to keep the state globally competitive?
INTRODUCTION
Illinois STEM Education Report 11
June 2006 © Northern Illinois University www.keepingillinoiscompetitive.niu.edu
The U.S. was the primary leader in innovation in the 20th Century and now is only one of many countries investing heavily in education, research, and the infrastructure necessary to be a global leader. According to the Council on Competitiveness, “Innovation will be the single most important factor in determining America’s success through the 21st Century,”3 and the future rests on talent, investment, and infrastructure:
• Talent - Preparing a quality workforce with appropriate knowledge and skills requires preparing people who can consistently develop new ideas and commercialize ideas produced from research and development. More in-depth math, science, and business skills are needed, leading to workers with multi-disciplinary backgrounds. Credit and non-credit education and training should evolve from higher education and business interactions.
• Investment - Public and private funding should allow for risk taking and exploratory approaches.
• Infrastructure - Government structures should ensure regulations and policies are innovation friendly.4
Echoing the Council on Competitiveness, a national consensus is emerging—the U.S. needs a better educated citizenry, especially in the STEM fields, and there needs to be support provided to this system through investment and infrastructure.
Multiple national initiatives are in place currently, with others proposed, to transform STEM education to meet the new challenges of the 21st Century. The President of the United States, the U.S. Department of Education, the Republican and Democrat parties, and Congress are discussing the challenges and proposing solutions. Numerous state coalitions have formed to improve STEM education. Major business and industry groups have offered recommendations. In light of the developing national momentum, this study analyzed STEM education in Illinois in comparison to various international, national, and state indicators of effectiveness. The ultimate goal was to identify the current strengths and critical challenges facing Illinois as it strives to remain competitive with other states and other nations in the 21st Century.
This report consists of four parts:
Trends Affecting Business and Education in Illinois
The impact of demographic, technological, and globalization trends on the workforce and on the knowledge and skills needed by citizens in the 21st Century.
Indicators of Illinois Students’ STEM Performance
International, national, and state data at the student level, including academic achievement, readiness for college and work, and completion of college degrees.
INTRODUCTION
12 Science, Technology, Engineering and Mathematics Education
June 2006 © Northern Illinois University www.keepingillinoiscompetitive.niu.edu
Aligning STEM Education to 21st Century Knowledge And Skills
Investment and infrastructure issues as they relate to STEM education, including instructional support, funding, and public awareness. Instructional support includes teacher preparation and supply as well as appropriate school curricula.
STEM Education Issues for 21st Century Competitiveness
The major issues in STEM education that Illinois needs to address.
The competitiveness of Illinois, both within the United States and as part of the global economy, depends upon informed, productive citizens; a skilled workforce that is adaptable to new technology regardless of the occupation; and a cadre of highly-skilled workers for the STEM professions. In other words, Illinois needs a strong STEM education system. The analyses presented in this study can be used to create the STEM education system needed for the 21st Century.
INTRODUCTION
June 2006 © Northern Illinois University www.keepingillinoiscompetitive.niu.edu
Illinois STEM Education Report 13
TRENDS AFFECTING BUSINESS AND
EDUCATION IN ILLINOIS
In these early years of the 21st Century, unprecedented demographic changes, major technological developments, and the expanding global economy are affecting the way we live and the economic vitality of the United States and Illinois. A convergence of multiple, complex trends has resulted in a situation in which businesses are scrambling to remain globally competitive, electronic communication has created instantaneous global connections, and workers of the 20th Century need to develop new skills to remain competitive in the 21st Century.
The convergence of these trends has created several challenges for the U.S. and Illinois: a decline of the middle class, projected shortages of skilled workers, increasing global competition, and a new set of knowledge and skills needed by all citizens. Keeping Illinois competitive will require
• The simultaneous creation of new higher-paying jobs
• Increasing the science and mathematics skills of all citizens
• Increasing levels of educational attainment, especially for black and Hispanic populations
• Increasing productivity in occupations with projected critical shortages
• Recruiting and retaining the most innovative, skilled workers
14 Science, Technology, Engineering and Mathematics Education
June 2006 © Northern Illinois University www.keepingillinoiscompetitive.niu.edu
CONVERGENCE OF DEMOGRAPHIC, TECHNOLOGICAL, AND GLOBALIZATION TRENDS
The following is a simplistic description of three major trends affecting the U.S. and Illinois:
• Demographic - The population is getting older, poorer, and more ethnically diverse.
• Technological - Broadband and other media are changing how we communicate and access information. Technology is increasing productivity in major workforce areas such as manufacturing.
• Globalization - The U.S. workforce is competing with a global pool of workers, and the U.S. is only one of several world economic leaders.
Each of these statements is true; however, taken separately, they fail to convey the impact that the combined trends are having on the U.S. More than 20 recent national reports reacted to the combined trends by declaring a “crisis.” Like other commentators, the Council on Competitiveness and the Business Roundtable identified an urgent need to respond to the crisis through vast improvements in mathematics and science education. For Illinois, the convergence of these trends contributes to the following:
• The decline of the middle class
• A projected shortage of skilled workers for the future
• Increasing competition due to economic globalization
Keeping Illinois competitive will require addressing these gaps in innovative ways, and a strong STEM education program is fundamental to building the talented workforce and to providing the supportive research and infrastructure necessary for an innovative culture.
CHAPTER 1
A strong STEM education program is fundamental to building the talented workforce and providing the supportive research and infrastructure necessary for an innovative culture.
Illinois STEM Education Report 15
June 2006 © Northern Illinois University www.keepingillinoiscompetitive.niu.edu
The Decline of the Middle ClassThe middle class in Illinois is declining as evidenced by widening gaps in income and job opportunities for middle-tier workers.5 This gap is not unique to Illinois; it is an international and national trend as well. The top 20% of U.S. workers control 85% of the U.S. wealth, and the middle tier is shrinking as the top and bottom tiers increase. Internationally, the uneven distribution of wealth is particularly evident in China, where the wealthiest 5% control half of the bank deposits, and there is great disparity between the top-tier and bottom-tier workers.6
For Illinois, a decrease in higher-paying jobs accompanied by an increase in lower-paying jobs resulted in lower household incomes and the decline of the middle class.7 Often, the dislocated workers lack the skills needed for 21st Century higher-paying jobs. Keeping Illinois competitive will require increasing the number of higher-paying jobs and upgrading the skills of the work pool simultaneously.
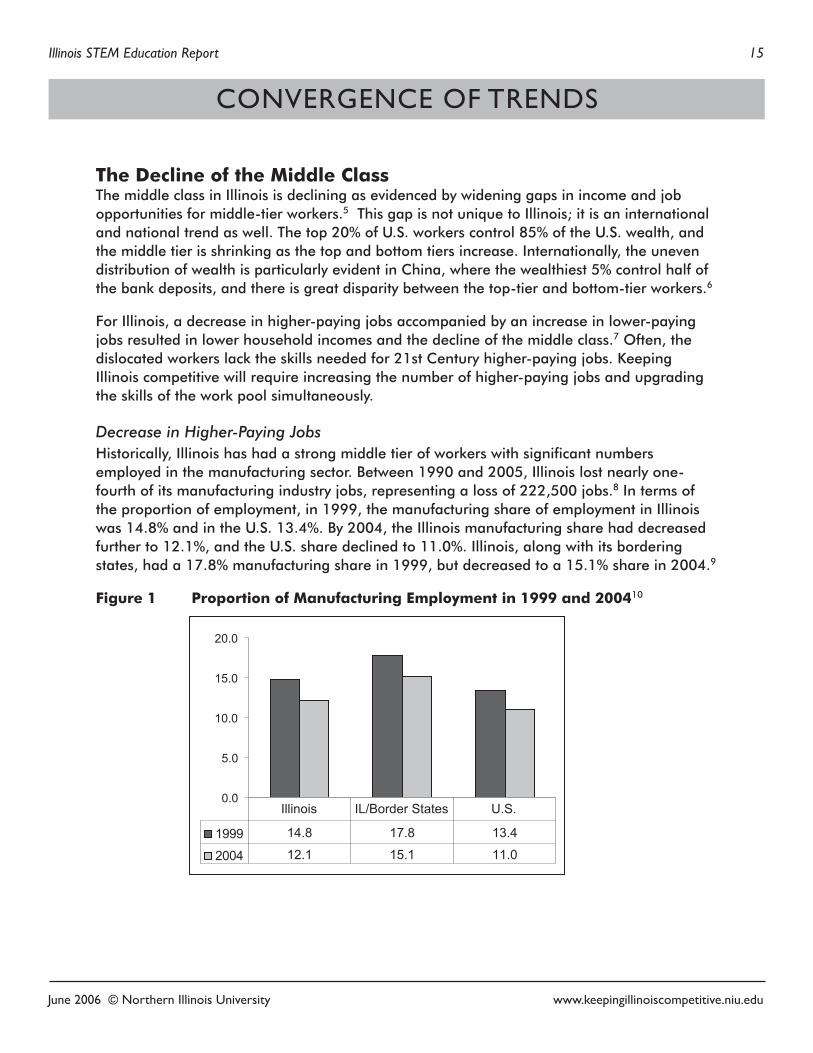
Decrease in Higher-Paying JobsHistorically, Illinois has had a strong middle tier of workers with significant numbers employed in the manufacturing sector. Between 1990 and 2005, Illinois lost nearly one-fourth of its manufacturing industry jobs, representing a loss of 222,500 jobs.8 In terms of the proportion of employment, in 1999, the manufacturing share of employment in Illinois was 14.8% and in the U.S. 13.4%. By 2004, the Illinois manufacturing share had decreased further to 12.1%, and the U.S. share declined to 11.0%. Illinois, along with its bordering states, had a 17.8% manufacturing share in 1999, but decreased to a 15.1% share in 2004.9
Figure 1 Proportion of Manufacturing Employment in 1999 and 200410
CONVERGENCE OF TRENDS
0.0
5.0
10.0
15.0
20.0
1999 14.8 17.8 13.4
2004 12.1 15.1 11.0
Illinois IL/Border States U.S.
16 Science, Technology, Engineering and Mathematics Education
June 2006 © Northern Illinois University www.keepingillinoiscompetitive.niu.edu
In addition to manufacturing, the proportion of employees in high-tech establishments decreased from 1998 to 2002 in the U.S. from 8.93% to 8.35%. Illinois experienced a similar decrease from 9.12% to 8.24%. These decreases reflect the nearly 7% of jobs in high-technology industries in the U.S. which were lost between 2000 and 2002.11
Increases in Jobs but at Lower Pay LevelsDuring the same periods, the number of jobs in other employment sectors increased. In the nation, Illinois, and the states bordering Illinois, there were increases in employment for educational and health services, leisure and hospitality, and government, with smaller increases in the construction industry. Illinois also had small decreases in employment shares for the following: trade, transportation, and utilities; information; and professional and business services. The U.S. and Illinois’ bordering states had similar declines except for professional and business services.12 However, according to the Illinois Department of Employment Security, “it is clear that the recession has had a much larger impact on the employment of Illinois and its surrounding border states than it has on national employment.”13
Unfortunately, the lost jobs, especially in manufacturing and high-technology, were mostly higher-paying jobs. The new jobs in education and health services paid 4.6% less than the manufacturing jobs, and the leisure and hospitality industry jobs averaged 29.2% less than the manufacturing jobs they replaced.14 The net result of replacing higher-paying positions with lower-paying positions was lower household incomes.15
Displaced Workers Often Lack 21st Century SkillsThe displaced manufacturing and high-tech workers are having difficulty in finding employment. Even though the unemployment rates in Illinois metro areas are at the lowest levels in five years, they are still higher than the national average as Illinois struggles to recover from the declines in recent years.16
The manufacturing and high-tech jobs were lost for several reasons including increased productivity due to technological advances, increased off-shoring due to economic globalization, and displacement of work to other states. Regardless of the reasons, these jobs will most likely not return, and the new jobs in manufacturing and high-tech establishments require advanced technical skills, thus creating a situation in which the unemployed are under-qualified for the new jobs in their past occupational sectors. In fact, there is a strong link between those currently unemployed and the level of educational attainment—the highest rates of unemployment are among those with the least education.17
Technology is reshaping old jobs, including manufacturing, and defining most of the new jobs. Workers are caught in a cycle—postsecondary education is required to qualify for most livable-wage, entry-level positions; ongoing continuing education is necessary to expand knowledge and skills; and without a commitment to continually developing and updating skills, even those with previous postsecondary education can find themselves unemployable
CHAPTER 1
Illinois STEM Education Report 17
June 2006 © Northern Illinois University www.keepingillinoiscompetitive.niu.edu
for jobs they have previously held. Many of Illinois’ unemployed engineers and computer scientists have college educations; however, the content they studied has become obsolete, and the job openings require knowledge of newer technologies.
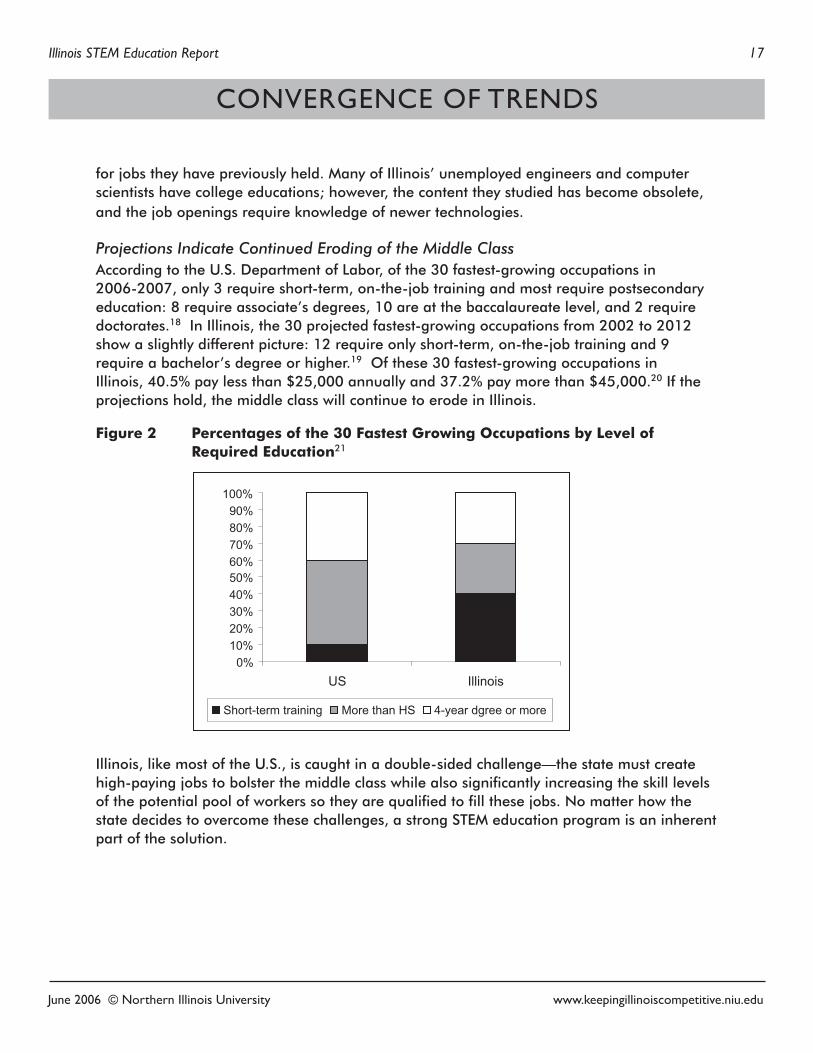
Projections Indicate Continued Eroding of the Middle ClassAccording to the U.S. Department of Labor, of the 30 fastest-growing occupations in 2006-2007, only 3 require short-term, on-the-job training and most require postsecondary education: 8 require associate’s degrees, 10 are at the baccalaureate level, and 2 require doctorates.18 In Illinois, the 30 projected fastest-growing occupations from 2002 to 2012 show a slightly different picture: 12 require only short-term, on-the-job training and 9 require a bachelor’s degree or higher.19 Of these 30 fastest-growing occupations in Illinois, 40.5% pay less than $25,000 annually and 37.2% pay more than $45,000.20 If the projections hold, the middle class will continue to erode in Illinois.
Figure 2 Percentages of the 30 Fastest Growing Occupations by Level of Required Education21
Illinois, like most of the U.S., is caught in a double-sided challenge—the state must create high-paying jobs to bolster the middle class while also significantly increasing the skill levels of the potential pool of workers so they are qualified to fill these jobs. No matter how the state decides to overcome these challenges, a strong STEM education program is an inherent part of the solution.
CONVERGENCE OF TRENDS
0%10%20%30%40%50%60%70%80%90%
100%
US Illinois
Short-term training More than HS 4-year dgree or more
18 Science, Technology, Engineering and Mathematics Education
June 2006 © Northern Illinois University www.keepingillinoiscompetitive.niu.edu
A Projected Shortage of Skilled Workers for the FutureAlthough increasing the number of high paying jobs and increasing the skills of the work pool will help bolster the middle class, the U.S. and Illinois will face yet another obstacle in the future. Researchers predict that there will be a shortage of skilled workers due to Baby Boomer retirements, shifting demographics, and rapidly increasing, technological changes. In 2003, the Department of Commerce and Economic Opportunity (DCEO) initiated the Critical Skill Shortage Initiative to align regional workforce programs to a supply of workers and to build a skilled and globally competitive workforce throughout the state. Manufacturing and health care were two areas of critical shortages; both require sound STEM skills.22 Keeping Illinois competitive will require increasing educational attainment, particularly of the black and Hispanic population; ensuring all workers engage in lifelong learning to keep their skills current; and investing in innovative ways to increase the productivity of occupations with potential critical shortages.
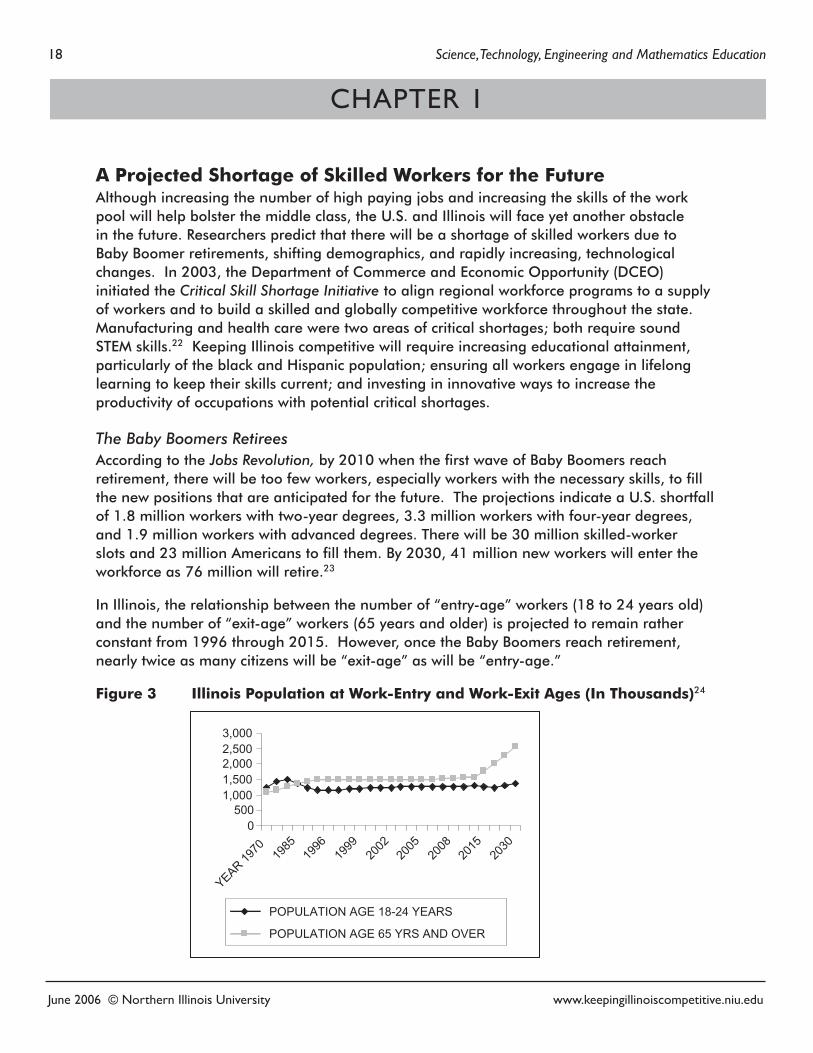
The Baby Boomers RetireesAccording to the Jobs Revolution, by 2010 when the first wave of Baby Boomers reach retirement, there will be too few workers, especially workers with the necessary skills, to fill the new positions that are anticipated for the future. The projections indicate a U.S. shortfall of 1.8 million workers with two-year degrees, 3.3 million workers with four-year degrees, and 1.9 million workers with advanced degrees. There will be 30 million skilled-worker slots and 23 million Americans to fill them. By 2030, 41 million new workers will enter the workforce as 76 million will retire.23
In Illinois, the relationship between the number of “entry-age” workers (18 to 24 years old) and the number of “exit-age” workers (65 years and older) is projected to remain rather constant from 1996 through 2015. However, once the Baby Boomers reach retirement, nearly twice as many citizens will be “exit-age” as will be “entry-age.”
Figure 3 Illinois Population at Work-Entry and Work-Exit Ages (In Thousands)24
CHAPTER 1
0500
1,0001,5002,0002,5003,000
YEAR 1970 19
8519
9619
9920
0220
0520
0820
1520
30
POPULATION AGE 18-24 YEARS
POPULATION AGE 65 YRS AND OVER
Illinois STEM Education Report 19
June 2006 © Northern Illinois University www.keepingillinoiscompetitive.niu.edu
In addition, there are indications that Illinois is similar to the nation: skilled Baby Boomers are retiring in record numbers, but the new workers taking their place are largely under-prepared, particularly in mathematics and science.25 Nationally, approximately half of the science and engineering bachelor’s degree holders in the labor force leave full-time employment by the age of 62, and half of the doctorate degree holders leave by age 66.26 If the Baby Boomers continue to retire at these same ages, there is a potential for shortages of skilled workers and a “brain drain.”
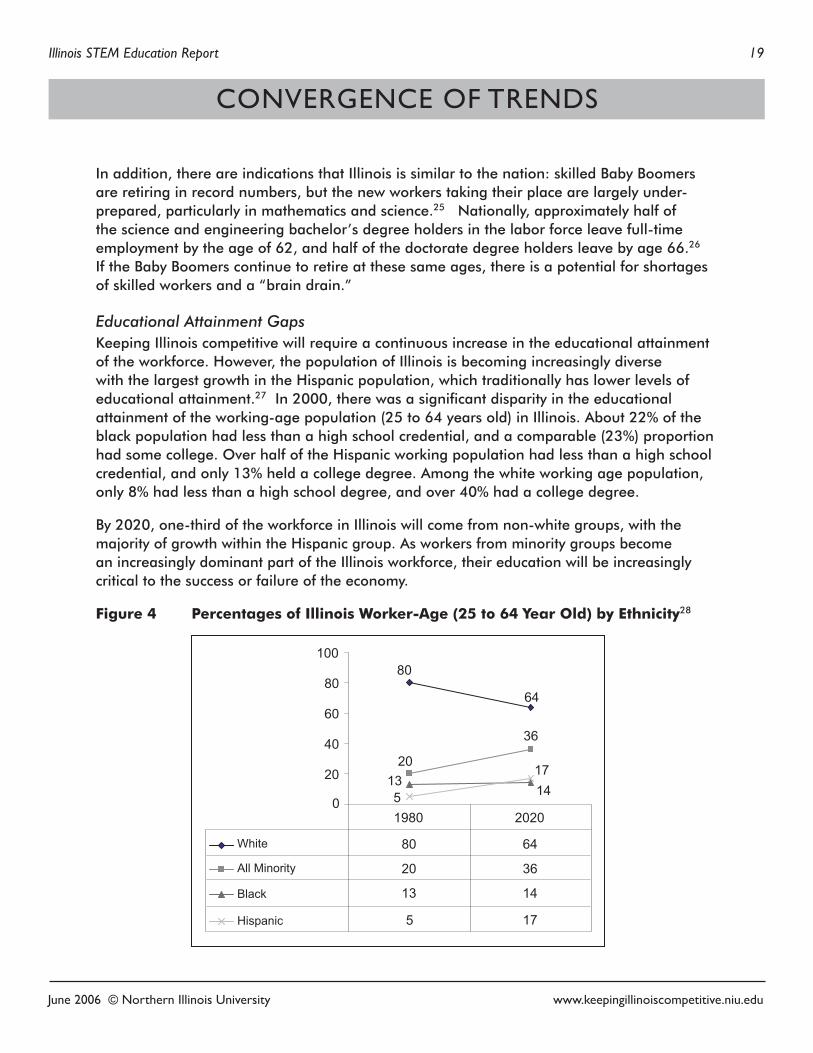
Educational Attainment GapsKeeping Illinois competitive will require a continuous increase in the educational attainment of the workforce. However, the population of Illinois is becoming increasingly diverse with the largest growth in the Hispanic population, which traditionally has lower levels of educational attainment.27 In 2000, there was a significant disparity in the educational attainment of the working-age population (25 to 64 years old) in Illinois. About 22% of the black population had less than a high school credential, and a comparable (23%) proportion had some college. Over half of the Hispanic working population had less than a high school credential, and only 13% held a college degree. Among the white working age population, only 8% had less than a high school degree, and over 40% had a college degree.
By 2020, one-third of the workforce in Illinois will come from non-white groups, with the majority of growth within the Hispanic group. As workers from minority groups become an increasingly dominant part of the Illinois workforce, their education will be increasingly critical to the success or failure of the economy.
Figure 4 Percentages of Illinois Worker-Age (25 to 64 Year Old) by Ethnicity28
CONVERGENCE OF TRENDS
80
64
20135 14
17
36
0
20
40
60
80
100
White 80 64
All Minority 20 36
Black 13 14
Hispanic 5 17
1980 2020
20 Science, Technology, Engineering and Mathematics Education
June 2006 © Northern Illinois University www.keepingillinoiscompetitive.niu.edu
With the possibility of a shortage of skilled workers, it will be important for Illinois to have No Worker Left Behind. Some states, such as Connecticut, are trying to tap the unemployed populations in inner cities, another population which historically has been under-represented in postsecondary education.29 If the disparity in degree attainment does not change, the educational level of the Illinois worker will decrease as the population shifts to fewer workers from populations with higher levels of educational attainment and more workers from populations with lower levels of educational attainment.30
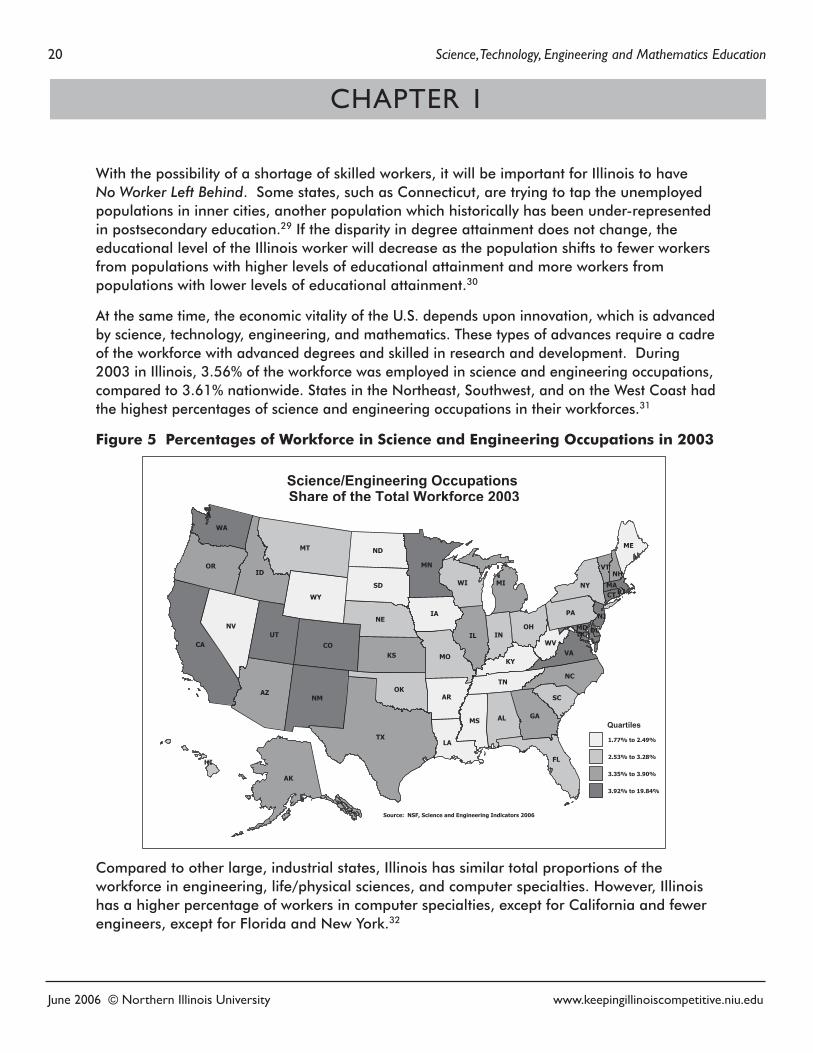
At the same time, the economic vitality of the U.S. depends upon innovation, which is advanced by science, technology, engineering, and mathematics. These types of advances require a cadre of the workforce with advanced degrees and skilled in research and development. During 2003 in Illinois, 3.56% of the workforce was employed in science and engineering occupations, compared to 3.61% nationwide. States in the Northeast, Southwest, and on the West Coast had the highest percentages of science and engineering occupations in their workforces.31
Figure 5 Percentages of Workforce in Science and Engineering Occupations in 2003
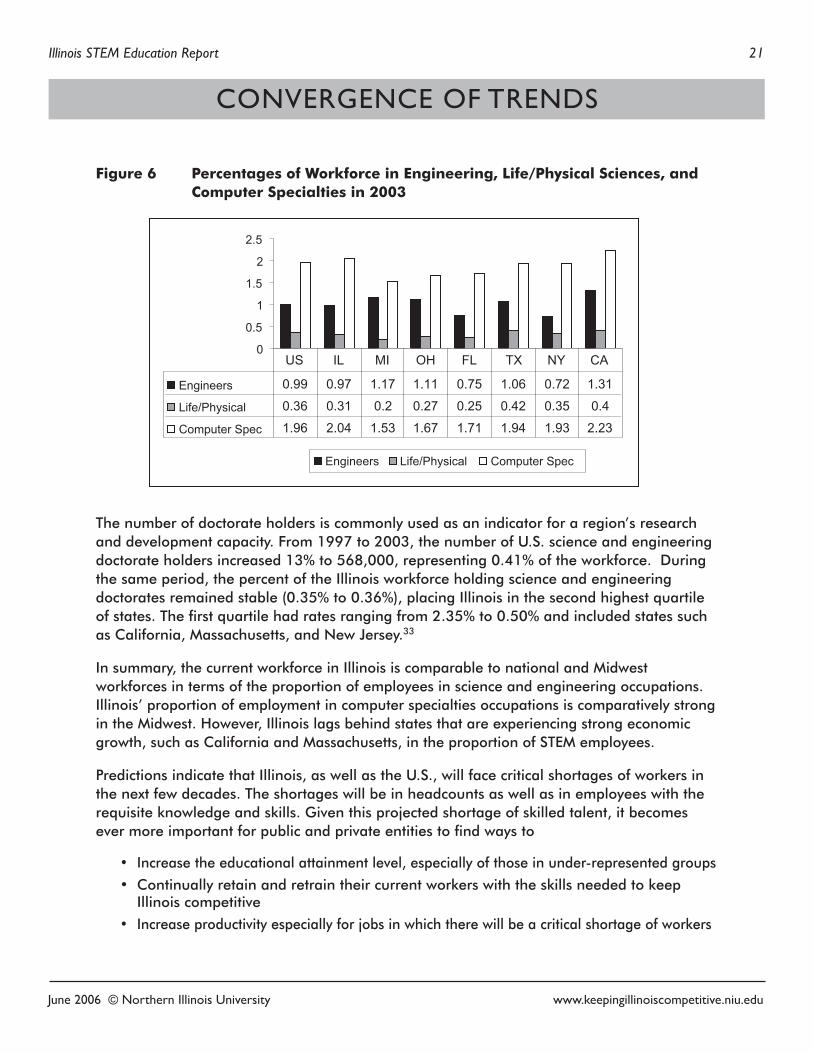
Compared to other large, industrial states, Illinois has similar total proportions of the workforce in engineering, life/physical sciences, and computer specialties. However, Illinois has a higher percentage of workers in computer specialties, except for California and fewer engineers, except for Florida and New York.32
CHAPTER 1
OM
OC
KA
ZA
IH
AC
VN
MN
XT
KO
SK
YW
DI
TU
AW
RO
TM
AIEN
DN
DS
NM
NI
YK
SM
LA
RA
NT
LI
AGLA
FL
AV
CN
CS
DM
AP
HO
VW
IMIW YN
JN
CD ED
TCAM
TV
IR
HN
EM
selitrauQ
%94.2 ot %77.1
%82.3 ot %35.2
%09.3 ot %53.3
48.91 ot %29.3 %
snoitapuccO gnireenignE/ecneicS3002ecrofkroWlatoTehtfoerahS
6002 srotacidnI gnireenignE dna ecneicS ,FSN :ecruoS
Illinois STEM Education Report 21
June 2006 © Northern Illinois University www.keepingillinoiscompetitive.niu.edu
Figure 6 Percentages of Workforce in Engineering, Life/Physical Sciences, and Computer Specialties in 2003
The number of doctorate holders is commonly used as an indicator for a region’s research and development capacity. From 1997 to 2003, the number of U.S. science and engineering doctorate holders increased 13% to 568,000, representing 0.41% of the workforce. During the same period, the percent of the Illinois workforce holding science and engineering doctorates remained stable (0.35% to 0.36%), placing Illinois in the second highest quartile of states. The first quartile had rates ranging from 2.35% to 0.50% and included states such as California, Massachusetts, and New Jersey.33
In summary, the current workforce in Illinois is comparable to national and Midwest workforces in terms of the proportion of employees in science and engineering occupations. Illinois’ proportion of employment in computer specialties occupations is comparatively strong in the Midwest. However, Illinois lags behind states that are experiencing strong economic growth, such as California and Massachusetts, in the proportion of STEM employees.
Predictions indicate that Illinois, as well as the U.S., will face critical shortages of workers in the next few decades. The shortages will be in headcounts as well as in employees with the requisite knowledge and skills. Given this projected shortage of skilled talent, it becomes ever more important for public and private entities to find ways to
• Increase the educational attainment level, especially of those in under-represented groups
• Continually retain and retrain their current workers with the skills needed to keep Illinois competitive
• Increase productivity especially for jobs in which there will be a critical shortage of workers
CONVERGENCE OF TRENDS
0
0.5
1
1.5
2
2.5
Engineers Life/Physical Computer Spec
Engineers 0.99 0.97 1.17 1.11 0.75 1.06 0.72 1.31
Life/Physical 0.36 0.31 0.2 0.27 0.25 0.42 0.35 0.4
Computer Spec 1.96 2.04 1.53 1.67 1.71 1.94 1.93 2.23
US IL MI OH FL TX NY CA
22 Science, Technology, Engineering and Mathematics Education
June 2006 © Northern Illinois University www.keepingillinoiscompetitive.niu.edu
Increasing Competition Due to Economic GlobalizationDue to rapid changes in technology and political relationships, traditional boundaries are of far less importance than historically. Real-time communication, instant messaging, and virtual labs allow scientists from around the world to collaborate on research and development. The barriers once associated with time, location, language, and culture have been reduced.
As the global market and workplaces expand, innovation—once the hallmark of the U.S. —can occur anywhere. Not only can it occur, but the rapid emergence of the economies of South Korea, India, China, Singapore, Malaysia, and Thailand shows that innovation is occurring and that the U.S. faces increasing competition. The Asian countries have been particularly aggressive in recruiting top American experts in critical technologies to work at elaborate new facilities in their countries. At the same time, other nations are joining the global market, but at a much slower pace; e.g. Eastern Europe, central Asia, the Middle East, Latin America, and Africa.34
China—perceived by many as a likely pre-eminent 21st Century power—provides a good example of rapid economic globalization. The power of the country lies in the enormous number of its people—one out of five people in the world resides in China. Even though it has moved 300 million people out of poverty and quadrupled the average person’s annual income, significant poverty still exists. Given the current rate of growth, China can pass the U.S. economy in 30 years; however, the U.S. will maintain a higher per capita income.35
India is another global competitor. Norman R. Augustine, retired Chairman and Chief Executive Officer of Lockheed Martin Corporation summarized the situation as “Five qualified chemists can be hired in India for the cost of just one in America…For the cost of one engineer in the United States, a company can hire eleven in India…Given such enormous disadvantages in labor cost, we cannot be satisfied merely to match other economies in those area where we do enjoy strength; rather we must excel…markedly.”36
As countries around the world produce more highly skilled STEM graduates and larger pools of workers, keeping Illinois competitive will require attracting and retaining the most skilled talent. Trends in decreasing numbers of foreign-born students and increases in U.S. patents that are foreign originated indicate that a “brain drain” of highly skilled workers is a possibility as other global economies strengthen.
CHAPTER 1
Illinois STEM Education Report 23
June 2006 © Northern Illinois University www.keepingillinoiscompetitive.niu.edu
Increasing Levels of Graduates One indicator of global competition is the number of college graduates produced by a country. According to one report in 2004, China graduated approximately 500,000 engineers; India graduated 200,000 engineers; and the U.S. graduated 70,000 engineers.37 More recently, Duke University researchers compared only equivalent degrees and certificates and reported that in 2004, China actually graduated approximately 351,500 engineers; India graduated 112,000 engineers; and the U.S. graduated 137,400 engineers.38 Regardless of the exact numbers, because their populations are so large, even a small proportion of their population will create a large number of graduates. On the other hand, South Korea graduates as many engineers as the U.S. even though it has only one-sixth of the U.S. population.39
Foreign-born Students and Workers in the U.S. In the U.S. and in Illinois, significant proportions of the workforce and science and engineering graduate programs are composed of foreign-born individuals. For example, more than half of all engineering doctorates awarded in U.S. engineering colleges go to foreign-born students.40 In the 2003 U.S. science and engineering workforce, 25% of all college-educated workers and 40% of all doctorate holders were foreign born.41 Over half of the doctorate holders in several fields who resided in the U.S. were foreign born: computer science (57%), electrical engineering (57%), civil engineering (54%), and mechanical engineering (52%).42
The number of foreign-born students coming to study in the STEM fields in the U.S. has begun to rise after sharp drops in the period following 9/11. Illinois sustained its population of these students. In 1999, foreign-born students made up 2.98% of all Illinois college or university students; in 2004, that number increased to 24,135 or 3.1%. In March 2006, a survey of the Council of Graduate Schools reported an 11% increase in foreign applications; however, applications are still down by 23% since 2003.43
Foreign-born scientists, technologists, engineers, and mathematicians—for a long time considered the backbone of medicine and other fields—appear to be going outside of the U.S. for advanced study and employment, leaving a gap in the U.S. educational pipeline and workforce. Increasing numbers of students are graduating in STEM fields outside of the U.S. and finding positions elsewhere as well. In China during 2004, about 2.8 million students graduated from universities, and 70% found jobs in China, thus turning China into an exporter of higher education graduates.44 In 2004, students from India comprised the majority of foreign students in the U.S.45 Many, after graduation, returned to India’s “Silicon Valley” at Bangalore. The U.S., once the major producer of STEM graduates, has increasing competition from China and other countries in not only educating the STEM workforce but in recruiting them for the workforce.
CONVERGENCE OF TRENDS
24 Science, Technology, Engineering and Mathematics Education
June 2006 © Northern Illinois University www.keepingillinoiscompetitive.niu.edu
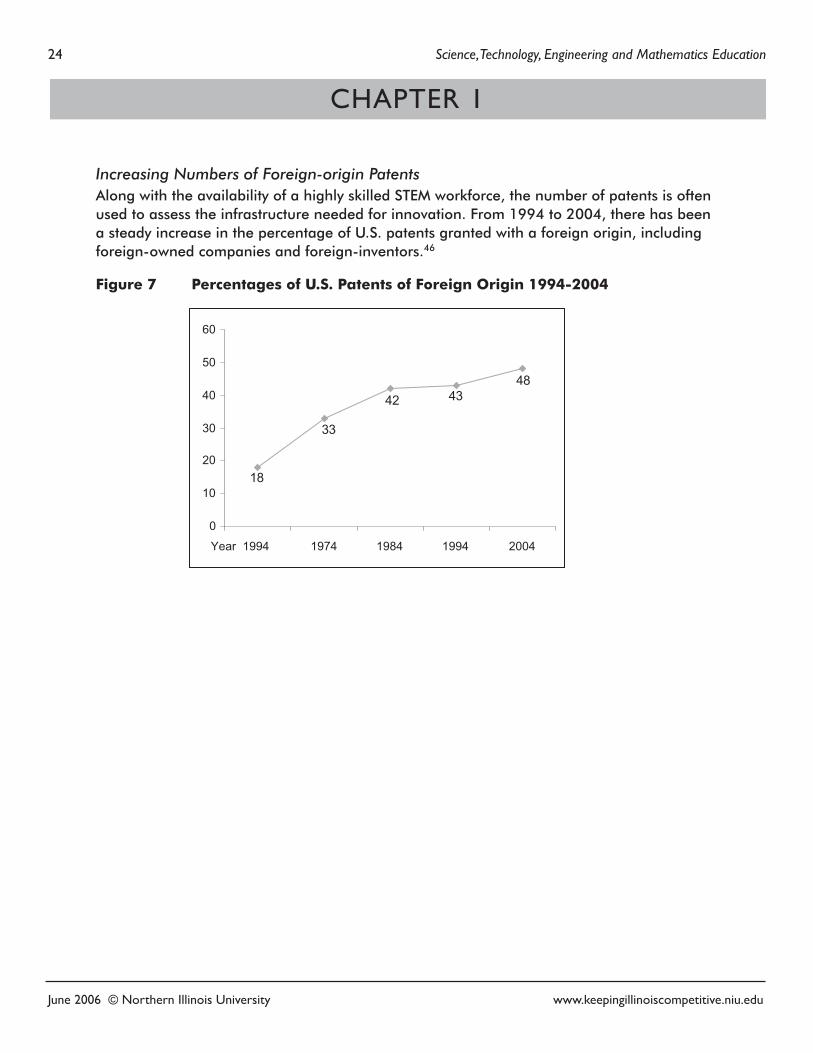
Increasing Numbers of Foreign-origin Patents Along with the availability of a highly skilled STEM workforce, the number of patents is often used to assess the infrastructure needed for innovation. From 1994 to 2004, there has been a steady increase in the percentage of U.S. patents granted with a foreign origin, including foreign-owned companies and foreign-inventors.46
Figure 7 Percentages of U.S. Patents of Foreign Origin 1994-2004
CHAPTER 1
18
33
42 4348
0
10
20
30
40
50
60
Year 1994 1974 1984 1994 2004
June 2006 © Northern Illinois University www.keepingillinoiscompetitive.niu.edu
Illinois STEM Education Report 25
CONVERGENCE OF TRENDS
Chapter SummaryKeeping Illinois competitive requires meeting the challenges created by converging demographic, technological, and globalization trends. In this environment, the U.S., including Illinois, is experiencing a declining middle class and a potential future with too few skilled workers. Because the most recent recession had a greater effect on Illinois, it is even more critical for Illinois to take strategic action.
For Illinois, the solutions involve increasing the STEM skills of everyone; increasing the educational attainment of minority populations; recruiting and retaining the most innovative, skilled workers; investing in the STEM occupations that can provide cutting-edge solutions which increase productivity; and developing the STEM occupations that offer a livable wage and add value to the economic infrastructure.
The solutions, however, create a conundrum. If the talent pool is projected to be too small, one solution is to increase productivity, thus decreasing the need for workers. This is especially important for those occupations in which critical shortages are projected. On the other hand, increasing productivity requires innovation and a culture of research and development, which depends on a highly-skilled STEM workforce. Likewise, the STEM occupations drive innovation, which results in higher-paying jobs, but a highly-skilled, well-educated workforce is needed to fill these higher-paying jobs.
For Illinois, the solutions involve increasing the STEM skills of everyone ...and developing the STEM occupations that offer a livable-wage and add value to the economic infrastructure.
26 Science, Technology, Engineering and Mathematics Education
June 2006 © Northern Illinois University www.keepingillinoiscompetitive.niu.edu
THE CHANGING ACADEMIC CORE: KNOWLEDGE AND SKILLS NEEDED IN THE 21ST CENTURY
We are attempting to educate and prepare students today so that they are ready to solve future problems not yet identified using technologies not yet invented based on scientific knowledge not yet discovered. —Joseph Lagowski, University of Texas at Austin
A child entering preschool today will graduate from high school or college and enter a world of work vastly different than the one we know. By the time the child completes school, some current jobs will be obsolete, and some new jobs never imagined will be commonplace. If trends continue, jobs will become more cognitive and less routine. For example, today’s assembly line includes advanced manufacturing techniques; robotics; and programmable, multi-use machines—a scenario much different than the one in the 1960s when today’s retirees entered the workforce. An office worker in 1965 used dictation machines, carbon paper, and mimeographs—no computers, no copiers, and no Microsoft Office.
Technology has revolutionized how we live as well as how we work. In less than 25 years, computers, cell phones, iPods, and wireless broadband have changed how we communicate, interact, find prospective spouses, shop, bank, and live. There are phones that support audio and text messages, and some phones are designed especially for six-year-olds. Between cell phones and e-mail, we live in a 24/7 world. Put another way, the generation entering the workforce today grew up with Internet, cell phones, and Google; the generation leaving the workforce had party lines, slide rules, and a hard copy of the Encyclopedia Britannica.
CHAPTER II
By the time the child completes school, some current jobs will be obsolete, and some new jobs never imagined will be common-place. If trends continue, jobs will become more cognitive and less routine.
Illinois STEM Education Report 27
June 2006 © Northern Illinois University www.keepingillinoiscompetitive.niu.edu
Importance of STEM Education for Everyone“The rapid advances in technology in all fields mean that even those students who do not pursue professional occupations in technological fields will also require solid foundations in science and math in order to be productive and capable members of our Nation’s society.”47 More than two-thirds of all new positions require some form of postsecondary education.48 Nearly three-fourths of the increased need for postsecondary education requirements comes from the higher skills demanded by employers for jobs that previously did not require any college.49 For example, employers with unfilled jobs were asked to identify why they were finding it difficult to locate qualified employees. A common response was that the applicants’ skills were a primary hindrance, including a deficit in the applicants’ mathematics, computer, and problem-solving skills. The need for more mathematics, computer, and problem-solving skills was found for more skilled occupations as well as for positions such as delivery truck driver.50 In other words, the first step is to ensure that students learn a basic core of knowledge and skills starting in grade school; however, this is a critical, but not a sufficient goal. The accompanying task is to prepare an educated society of lifelong learners.
STEM education matters to average citizens as much as it does to workers in technical fields. A democratic society is founded on the premise that the electorate is sufficiently informed to make thoughtful decisions. The tremendous rate of technological change and globalization has increased the need for the electorate to keep current on multiple, complex topics. How many current registered voters understand the basic technology associated with wind farms, ethanol plants, stem cell research, and biotechnology? What information do they use when they vote or lobby elected officials on these topics? Do they have the basic knowledge to understand the health choices they may need to make? Do they have the basic knowledge to understand the breadth and scope of the possible uses of new technologies and their accompanying ethical and moral issues?
THE CHANGING ACADEMIC CORE
28 Science, Technology, Engineering and Mathematics Education
June 2006 © Northern Illinois University www.keepingillinoiscompetitive.niu.edu
Keeping Illinois competitive requires gearing up the STEM skills with greater rigor in the P-12 curricula, increasing the number of students who pursue postsecondary education, and providing lifelong education opportunities to create
• an informed electorate of productive citizens
• a skilled workforce which is adaptable to new technology for all occupations
• a cadre of highly-skilled workers for the STEM professions
Many research reports, symposia, and coalitions have called for the revamping of STEM education to meet the new basic core of knowledge and skills needed for the 21st Century. The question becomes, “What is the basic core of knowledge and skills everyone should have?”
As part of the Illinois Survey of Critical Technologies, the Illinois Mathematics and Science Academy (IMSA) educators, researchers, engineers, and representatives of business and industry identified 26 science and mathematics concepts in five categories: biosciences, environmental and energy technologies, human health and development, information technology and communication, and materials science and advanced manufacturing.51 The experts considered these concepts to be primary drivers of Illinois’ future success in the global economy. After examining teachers’ knowledge and classroom instruction in the identified concepts, the Illinois Survey of Critical Technologies concluded that there is “a need to identify the ‘new basics’ in science and mathematics.” Further, “the ‘new basics’ should result in revisions of content standards and assessments for students at all levels.”52
The first step is to identify the new basic core; the second step is to review standards, curricula, and assessments. This section summarizes some views on what the core should be. Part Two of this report examines student performance indicators. Chapter VI of Part Three discusses standards, assessment, and instruction.
CHAPTER II
Illinois STEM Education Report 29
June 2006 © Northern Illinois University www.keepingillinoiscompetitive.niu.edu
Changing Knowledge and Skills Needed for 21st Century WorkersToday’s graduates need to be critical thinkers, problem solvers, and effective communicators who are proficient in both core subjects and new 21st Century content and skills.53 Several influential projects have described the knowledge and skills needed by students for both college and the workforce, including the American Diploma Project,54 whose approach has been adopted by 22 states; the Standards for Success55 project in which college faculty identified what students needed know to succeed in college; and the research by ACT, Inc.56 which defines a rigorous new college-preparation core curriculum.
Most recently, the Partnership for 21st Century Skills involved educators, employers, parents, community members, and students in identifying the 21st Century skills.57 In addition to the following list of core content, the partnership specified that the skills should be taught in an integrated, balanced approach and authentic assessments should be used to assess student learning.58
• Core Subjects - English, reading or language arts, mathematics, science, foreign languages, civics, government, economics, arts, history, and geography
• 21st Century Content - global awareness; financial, economic, business, and entrepreneurial literacy; civic literacy; health and wellness awareness
• Learning and Thinking Skills - know how to keep learning throughout life, critical-thinking and problem-solving skills, communication skills, creativity and innovation skills, collaboration skills, contextual learning skills, and information and media literacy skills
• Information and Communications Technology - ability to use technology to develop knowledge and skills
• Life Skills - leadership, ethics, accountability, adaptability, personal productivity, personal responsibility, people skills, self-direction, and social responsibility
THE CHANGING ACADEMIC CORE
30 Science, Technology, Engineering and Mathematics Education
June 2006 © Northern Illinois University www.keepingillinoiscompetitive.niu.edu
Issues in Implementing the Changing Basic CoreIn comparing the skill sets proposed by national studies and the current skill sets, certain themes recur, such as a broad core of basic skills, higher-level thinking skills, interpersonal skills, various meta-cognitive skills related to knowing how to learn, employability skills, and technology skills. Students will live and work in a global environment, and STEM education will need an international perspective. This expanded skill set should force educators to rethink how education is organized, delivered, and assessed.
The knowledge and skills needed in the 21st Century do not fit neatly into the current compartmentalized discipline system used in U.S. education. A significant number of the critical technologies’ concepts crossed traditional disciplines; e.g., biotechnology, bioinformatics, and nanotechnology.59 “Advances in medical technologies integrate biology with physics, mathematics, materials sciences, and software engineering. Innovation in the IT sector is built on research that spans a range of sciences, including solid-state physics, chemistry, mathematics, and language theory.”60 The 21st Century Renaissance learner does not label content into separate categories; he sees the bigger picture of integrated knowledge, which better allows for higher-level thinking, pattern recognition, creativity, and innovative problem-solving.
The 21st Century worker needs to understand multiple disciplines; for example, an engineer needs to understand human factors, marketing, financial planning, and entrepreneurship. The focus is on using knowledge and skills to solve real-life, complex problems. Reading, writing, math, and science are not ends in themselves—they are the building materials used along with thinking skills, global perspective, and technology skills to solve authentic problems. Rote learning and drills will retain an instructional role, but much more emphasis needs to shift to a problem-based learning approach.
Currently, few questions on college entrance exams or Illinois state assessments require cross-disciplinary, problem-solving skills. However, the Illinois Learning Standards has recognized the importance of these types of skills. In the standards, each content area has specific “Applications of Learning.” The Illinois Learning Standards state, “Through Applications of Learning, students demonstrate and deepen their understanding of basic knowledge and skills. These applied learning skills cross academic disciplines and reinforce the important learning of the disciplines. The ability to use these skills will greatly influence students’ success in schools, in the workplace and in the community.”61 The Applications of Learning for each content area are subcategorized as “solving problems”, “communicating”, “using technology”, “working on teams”, and “making connections”. (See Appendix A for examples of the Applications in each subject area.) The Applications are part of the standards document, but there are no benchmarks or performance indicators associated with them. Also they are not subjected to rigorous assessment, although the Applications embody knowledge and skills faculty and employers say are critically needed.
CHAPTER II
June 2006 © Northern Illinois University www.keepingillinoiscompetitive.niu.edu
Illinois STEM Education Report 31
THE CHANGING ACADEMIC CORE
Lastly, it is not enough to graduate from high school with the basic core knowledge and skills of the day because that basic core will always be evolving. Being an informed citizen and effective employee requires continuous lifelong learning. Perhaps the most important core skills are knowing how to learn, how to find information, and how to process information. Chapter VI discusses in more depth the Illinois curriculum and graduation requirements.
Chapter SummaryKeeping Illinois competitive requires rigorous P-12 curricula that prepare all students to be productive citizens and prepare a skilled pool of workers. The basic core for the 21st Century includes basic skills, higher-level thinking skills, interpersonal skills, various meta-cognitive skills related to knowing how to learn, employability skills, and technology skills.
Implementing this core impacts how education is organized, delivered, and assessed. For Illinois, the Illinois Learning Standards, including the section referred to as the “Applications of Learning,” aligns with the knowledge and skills needed for the 21st Century.
The basic core for the 21st Century includes basic skills, higher-level thinking skills, interpersonal skills, various meta-cognitive skills related to knowing how to learn, employability skills, and technology skills.
June 2006 © Northern Illinois University www.keepingillinoiscompetitive.niu.edu
32 Science, Technology, Engineering and Mathematics Education
INDICATORS OF ILLINOIS STUDENTS’ STEM PERFORMANCE
Keeping Illinois competitive requires that Illinois workers and citizens have science and mathematics skills that are at least commensurate with the levels achieved by those in competitive states and countries. To compete globally, Illinois needs students who graduate from high school adequately prepared to be successful in postsecondary education or in the workplace. How well is Illinois meeting these goals?
This part of the report examines three sets of Illinois performance indicators as they relate to the STEM fields:
Chapter III Student Achievement
Chapter IV Readiness for College and Work
Chapter V College Participation and Completion
Before proceeding to the indicators, readers should consider two caveats in relation to the interpretation of the data. The first concerns the model used to describe the preparation of the workforce. Judith Ramaley of the National Science Foundation recommends that the “pipeline” model for education be replaced with a “pathways” model.62 The pipeline model implies a straightforward, linear progression in which one moves through school and to work. In reality, students follow various pathways as they enroll in multiple institutions, sometimes simultaneously; combine work and education; and retrain for multiple careers. The data presented in the next three chapters are the best measures currently available; however, they are much more attuned to a “pipeline” than to “pathways.”
The second caveat is that this study includes a mix of research methodologies and measurements with varying confidence intervals. Small differences between numbers may not represent a statistically significant difference. With proper care, these data can provide an accurate perspective on STEM performance in Illinois and the U.S.
June 2006 © Northern Illinois University www.keepingillinoiscompetitive.niu.edu
Illinois STEM Education Report 33
CHAPTER III: STUDENT ACHIEVEMENT
STUDENT ACHIEVEMENT
Keeping Illinois globally competitive requires all citizens to have strong mathematics and science skills. To determine the status of STEM performance in Illinois, Chapter III compares the performance of
• U.S. students to their international peers
• Illinois students to their international peers
• Illinois students to their national peers
• Subgroups of students within Illinois to each other
A recurring theme in this chapter is the average, or at times below average, performance of the U.S. in international comparisons, and the average performance of Illinois students compared to the aggregated U.S. performance. However, the Illinois average represents some high-scoring subgroups and some extremely low-scoring subgroups. Keeping Illinois competitive will require strategically addressing three gaps: 1) the extreme differences in performance of U.S. students when compared to the highest-scoring Asian countries; 2) the gap in the performance of Illinois low-income students, black students, and Hispanic students compared to Asian and white students; and 3) the decreasing percentages of students meeting or exceeding state goals as they move from fifth grade to middle school and then to high school, especially the male low-income students.
International Comparisons - United StatesOver the past ten years, major international studies have assessed student academic achievement in nearly 50 countries. Testing protocols and standardized procedures have increasingly become stricter to help ensure that representative samples of all students in each country are used so that the scores from the various participating nations can be compared.
Two major international studies provide information about U.S. student academic achievement in STEM subjects:
• Trends in International Mathematics and Science Study (TIMSS) assessed student mastery of curriculum-based knowledge and skills in mathematics and science at the equivalent of 4th grade and 8th grade in 46 countries.
• Programme for International Student Assessment (PISA) focused on how 15-year olds in 40 countries used mathematics, science, and problem-solving skills to solve real-life problem; most participants were Organisation for Economic Co-operation and Development (OECD) countries.
Keeping Illinois competitive will require addressing the low performance of Illinois low-income students and the decreasing percentages of students who meet state goals as they move from grade school through high school.
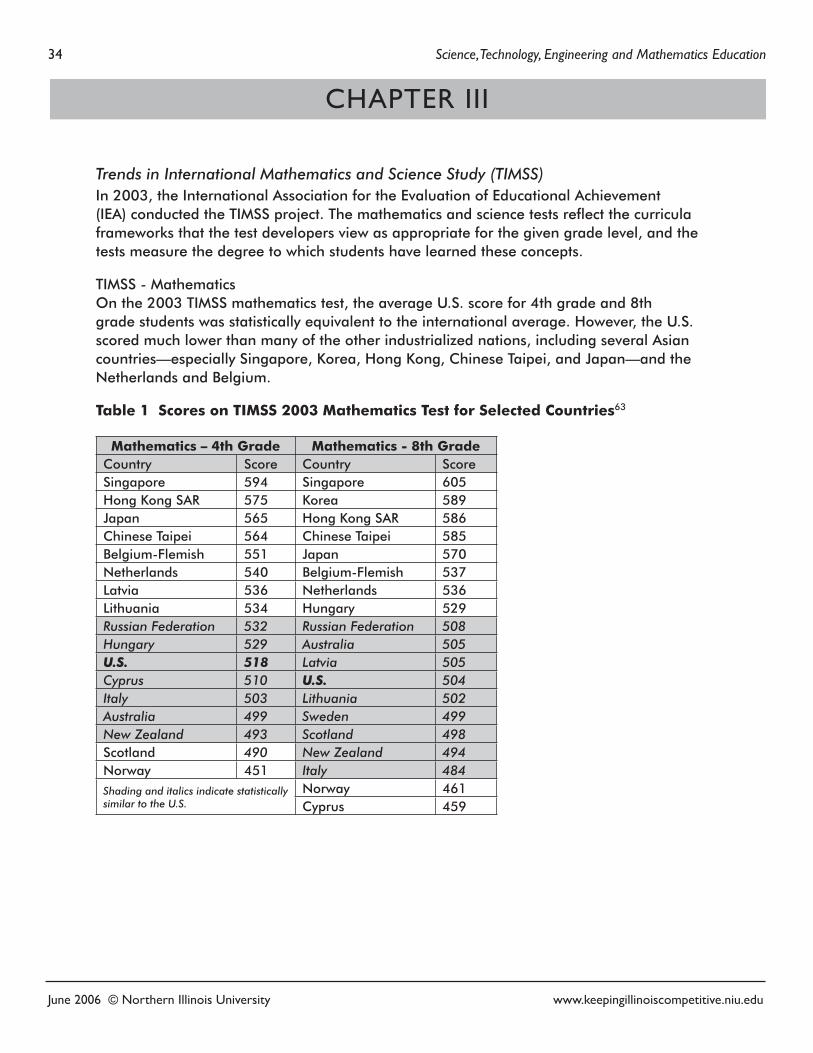
34 Science, Technology, Engineering and Mathematics Education
June 2006 © Northern Illinois University www.keepingillinoiscompetitive.niu.edu
Trends in International Mathematics and Science Study (TIMSS)In 2003, the International Association for the Evaluation of Educational Achievement (IEA) conducted the TIMSS project. The mathematics and science tests reflect the curricula frameworks that the test developers view as appropriate for the given grade level, and the tests measure the degree to which students have learned these concepts.
TIMSS - MathematicsOn the 2003 TIMSS mathematics test, the average U.S. score for 4th grade and 8th grade students was statistically equivalent to the international average. However, the U.S. scored much lower than many of the other industrialized nations, including several Asian countries—especially Singapore, Korea, Hong Kong, Chinese Taipei, and Japan—and the Netherlands and Belgium.
Table 1 Scores on TIMSS 2003 Mathematics Test for Selected Countries63
Mathematics – 4th Grade Mathematics - 8th GradeCountry Score Country ScoreSingapore 594 Singapore 605Hong Kong SAR 575 Korea 589Japan 565 Hong Kong SAR 586Chinese Taipei 564 Chinese Taipei 585Belgium-Flemish 551 Japan 570Netherlands 540 Belgium-Flemish 537Latvia 536 Netherlands 536Lithuania 534 Hungary 529Russian Federation 532 Russian Federation 508Hungary 529 Australia 505U.S. 518 Latvia 505Cyprus 510 U.S. 504Italy 503 Lithuania 502Australia 499 Sweden 499New Zealand 493 Scotland 498Scotland 490 New Zealand 494Norway 451 Italy 484Shading and italics indicate statistically similar to the U.S.
Norway 461Cyprus 459
CHAPTER III
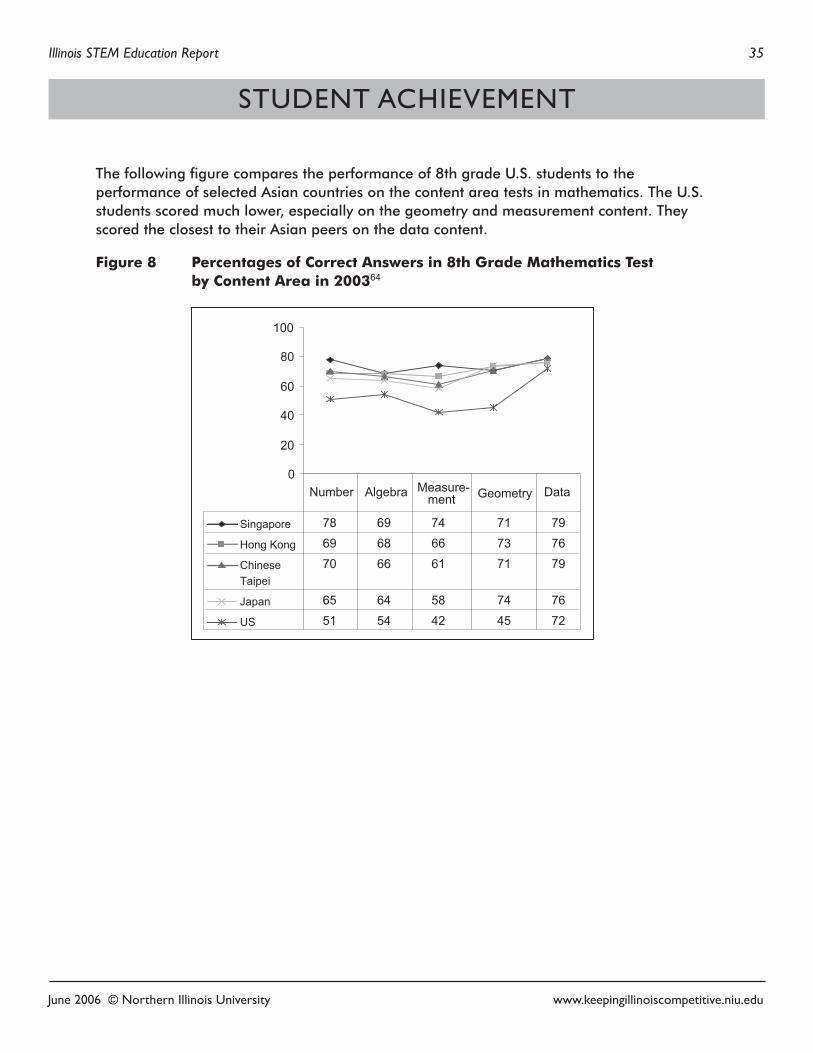
Illinois STEM Education Report 35
June 2006 © Northern Illinois University www.keepingillinoiscompetitive.niu.edu
The following figure compares the performance of 8th grade U.S. students to the performance of selected Asian countries on the content area tests in mathematics. The U.S. students scored much lower, especially on the geometry and measurement content. They scored the closest to their Asian peers on the data content.
Figure 8 Percentages of Correct Answers in 8th Grade Mathematics Test by Content Area in 200364
STUDENT ACHIEVEMENT
0
20
40
60
80
100
Singapore 78 69 74 71 79
Hong Kong 69 68 66 73 76
ChineseTaipei
70 66 61 71 79
Japan 65 64 58 74 76
US 51 54 42 45 72
Number Algebra Measure-ment Geometry Data
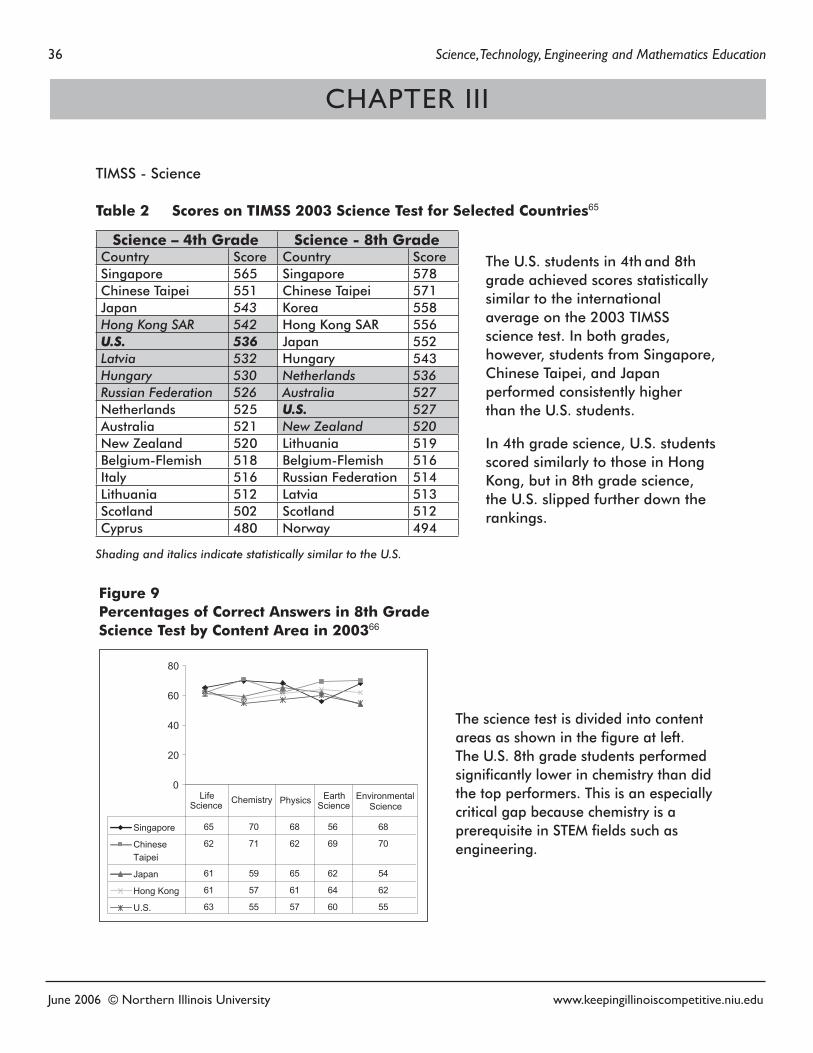
36 Science, Technology, Engineering and Mathematics Education
June 2006 © Northern Illinois University www.keepingillinoiscompetitive.niu.edu
TIMSS - Science
Table 2 Scores on TIMSS 2003 Science Test for Selected Countries65
Science – 4th Grade Science - 8th GradeCountry Score Country Score Singapore 565 Singapore 578Chinese Taipei 551 Chinese Taipei 571Japan 543 Korea 558Hong Kong SAR 542 Hong Kong SAR 556U.S. 536 Japan 552Latvia 532 Hungary 543Hungary 530 Netherlands 536Russian Federation 526 Australia 527Netherlands 525 U.S. 527Australia 521 New Zealand 520New Zealand 520 Lithuania 519Belgium-Flemish 518 Belgium-Flemish 516Italy 516 Russian Federation 514Lithuania 512 Latvia 513Scotland 502 Scotland 512Cyprus 480 Norway 494
Shading and italics indicate statistically similar to the U.S.
The science test is divided into content areas as shown in the figure at left. The U.S. 8th grade students performed significantly lower in chemistry than did the top performers. This is an especially critical gap because chemistry is a prerequisite in STEM fields such as engineering.
CHAPTER III
0
20
40
60
80
Singapore 65 70 68 56 68
ChineseTaipei
62 71 62 69 70
Japan 61 59 65 62 54
Hong Kong 61 57 61 64 62
U.S. 63 55 57 60 55
Life Science Chemistry Physics Earth
ScienceEnvironmental
Science
Figure 9 Percentages of Correct Answers in 8th Grade Science Test by Content Area in 200366
The U.S. students in 4th and 8th grade achieved scores statistically similar to the international average on the 2003 TIMSS science test. In both grades, however, students from Singapore, Chinese Taipei, and Japan performed consistently higher than the U.S. students.
In 4th grade science, U.S. students scored similarly to those in Hong Kong, but in 8th grade science, the U.S. slipped further down the rankings.
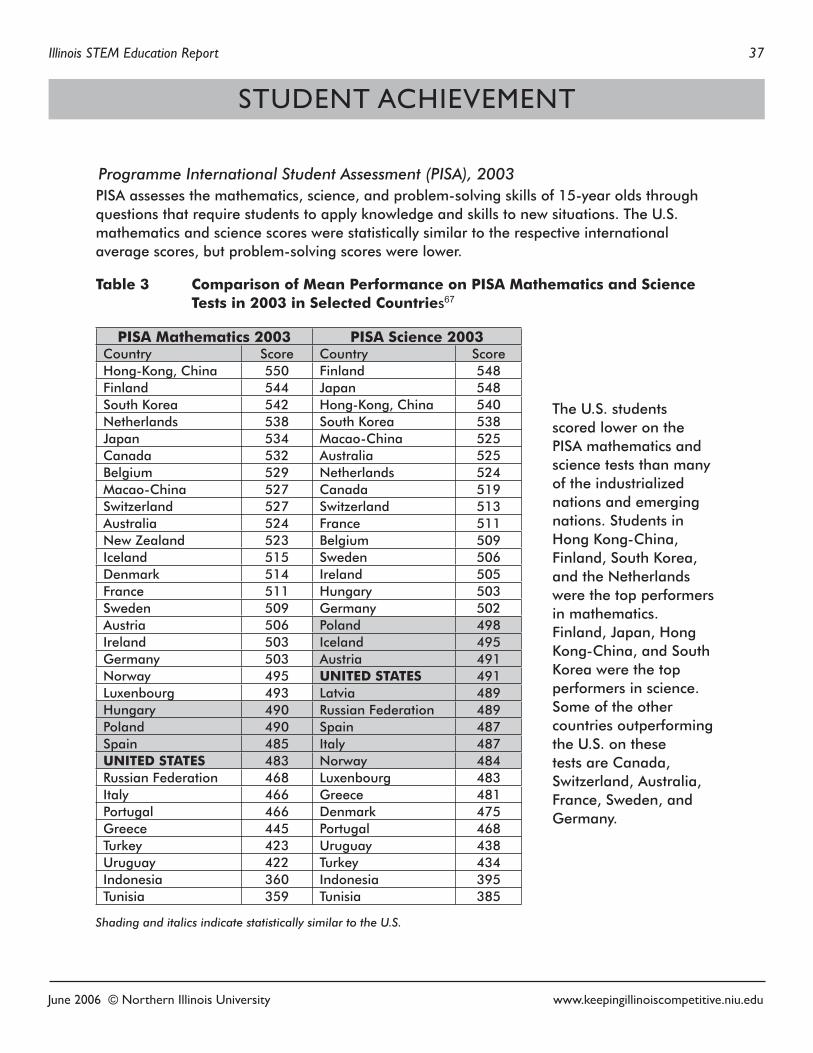
Illinois STEM Education Report 37
June 2006 © Northern Illinois University www.keepingillinoiscompetitive.niu.edu
Programme International Student Assessment (PISA), 2003PISA assesses the mathematics, science, and problem-solving skills of 15-year olds through questions that require students to apply knowledge and skills to new situations. The U.S. mathematics and science scores were statistically similar to the respective international average scores, but problem-solving scores were lower.
Table 3 Comparison of Mean Performance on PISA Mathematics and Science Tests in 2003 in Selected Countries67
PISA Mathematics 2003 PISA Science 2003Country Score Country ScoreHong-Kong, China 550 Finland 548Finland 544 Japan 548South Korea 542 Hong-Kong, China 540Netherlands 538 South Korea 538Japan 534 Macao-China 525Canada 532 Australia 525Belgium 529 Netherlands 524Macao-China 527 Canada 519Switzerland 527 Switzerland 513Australia 524 France 511New Zealand 523 Belgium 509Iceland 515 Sweden 506Denmark 514 Ireland 505France 511 Hungary 503Sweden 509 Germany 502Austria 506 Poland 498Ireland 503 Iceland 495Germany 503 Austria 491Norway 495 UNITED STATES 491Luxenbourg 493 Latvia 489Hungary 490 Russian Federation 489Poland 490 Spain 487Spain 485 Italy 487UNITED STATES 483 Norway 484Russian Federation 468 Luxenbourg 483Italy 466 Greece 481Portugal 466 Denmark 475Greece 445 Portugal 468Turkey 423 Uruguay 438Uruguay 422 Turkey 434Indonesia 360 Indonesia 395Tunisia 359 Tunisia 385
Shading and italics indicate statistically similar to the U.S.
STUDENT ACHIEVEMENT
The U.S. students scored lower on the PISA mathematics and science tests than many of the industrialized nations and emerging nations. Students in Hong Kong-China, Finland, South Korea, and the Netherlands were the top performers in mathematics. Finland, Japan, Hong Kong-China, and South Korea were the top performers in science. Some of the other countries outperforming the U.S. on these tests are Canada, Switzerland, Australia, France, Sweden, and Germany.
38 Science, Technology, Engineering and Mathematics Education
June 2006 © Northern Illinois University www.keepingillinoiscompetitive.niu.edu
When students were required to use their knowledge and skills to solve authentic problems, the U.S. scored lower than 22 countries, the same as 8 countries, and higher than 9 countries. The top-scoring countries on problem-solving included Korea, Hong Kong-China, Finland, and Japan. The nine countries scoring lower than the U.S. were Greece, Thailand, Serbia, Uruguay, Turkey, Mexico, Brazil, Indonesia, and Tunisia.
Summary of International Comparisons - United StatesStatistically, the U.S. students performed at approximately the international average on TIMSS and PISA mathematics and science exams. These statistics, however, can be deceiving because the scaled scores for the U.S. students were predominately lower than the scores of other industrialized nations on all of these tests. Also, U.S. students outscored only 9 countries on the PISA problem-solving tests.
To remain competitive with the top-scoring countries—Hong Kong-China, Singapore, Chinese-Taipei, Korea, Japan, and the Netherlands—the U.S. needs to improve the mathematics, science, and problem-solving skills of all students. These skills lay the foundation for innovation, increased productivity, and the development and implementation of new technologies. A starting point is to look at the curricula and instructional strategies, which are discussed in Chapter VI.
International Comparisons - IllinoisIn 1997 and 1999, TIMSS allowed subgroups within a state to participate in the international studies. Illinois was represented in 1997 by the First in the World Consortium, a group of 17 Chicago suburban districts and the Illinois Math and Science Academy (IMSA). These districts and IMSA were determined to learn how their students were doing in a global competition and to make the necessary changes to become “first in the world.”68 These school districts were already among the highest performing in Illinois and the nation. The students in the consortium were predominantly white (78%), only 7% were low income, and 6% had limited English proficiency. With considerably more fiscal resources than most schools, the districts’ per-pupil expenditures were 55% higher than the national average. The teachers within the consortium had higher levels of education and more years of teaching experience than the national and state averages.
Compared to their global competitors, the First in the World students did extremely well in 1997. In 4th and 8th grade mathematics, only students in Singapore performed better. No nation outperformed the consortium in 4th and 8th grade science.
At the 12th grade level, students were assessed for general achievement in mathematics and science knowledge and in a separate test for advanced topics. In the general test, First in the World students performed similarly with the top seven countries; however, the consortium students scored around the average in the advanced tests. A bright spot on the advanced tests was a subgroup of consortium students taking Advanced Placement courses; they were
CHAPTER III
Illinois STEM Education Report 39
June 2006 © Northern Illinois University www.keepingillinoiscompetitive.niu.edu
the highest performers in mathematics, and another Advanced Placement subgroup shared the highest tier in physics with five countries.
In 1999, the First in the World Consortium again participated in TIMSS, joined this time by Chicago Public Schools and Naperville District 203.69 Naperville and the First in the World Consortium performed in the second tier in mathematics and were only outperformed by Singapore, Korea, Chinese Taipei, Hong Kong, and Japan. In science, Naperville and the First in the World Consortium performed in the top-tier along with Chinese Taipei, Singapore, and a consortium of Michigan schools. Chicago Public School students performed below the U.S and international averages in mathematics and science.
The consortium implemented teacher learning networks and collaborative learning communities to improve students’ performance through professional development and activities using new curriculum models, instructional practices, assessment strategies, and technology.
The TIMSS project collected additional data to identify factors associated with student achievement. The top performers came from homes with high levels of educational resources. Students from the Chicago Public Schools, similar to other large inner city districts with high levels of low-income students, performed at a lower level.
The 1997 TIMSS and the 1999 TIMSS Benchmarking study highlight a theme that will recur in the following sections on student indicators of STEM performance: Illinois has some of the highest performing students and some of the lowest performers. Keeping Illinois competitive requires that the gap between the achievements of these students be reduced, if not eliminated. The single factor that has the highest correlation to achievement is the income status of the student; e.g., low-income students are struggling to reach even average levels of performance.
Illinois and U.S. Comparisons - NAEPThe National Assessment of Educational Progress (NAEP) tests, which sometimes are called “the gold standard” of U.S. assessments, provide an external benchmark for academic achievement for all of the states. The results of these tests are disseminated on the “Nation’s Report Card” and include measures of 4th and 8th grade student academic achievement in mathematics and science.
Student results are reported in both numerical scores and by the performance levels “basic”, “proficient”, and “advanced”. “Basic” is defined as partial mastery of the skills and knowledge, but not competence in the subject. “Proficient” represents a solid academic performance for the grade assessed. “Advanced” describes superior performance.70 Using standards and frameworks that are internationally respected, the National Assessment Governing Board that oversees NAEP regards “proficient” as the acceptable level.
STUDENT ACHIEVEMENT
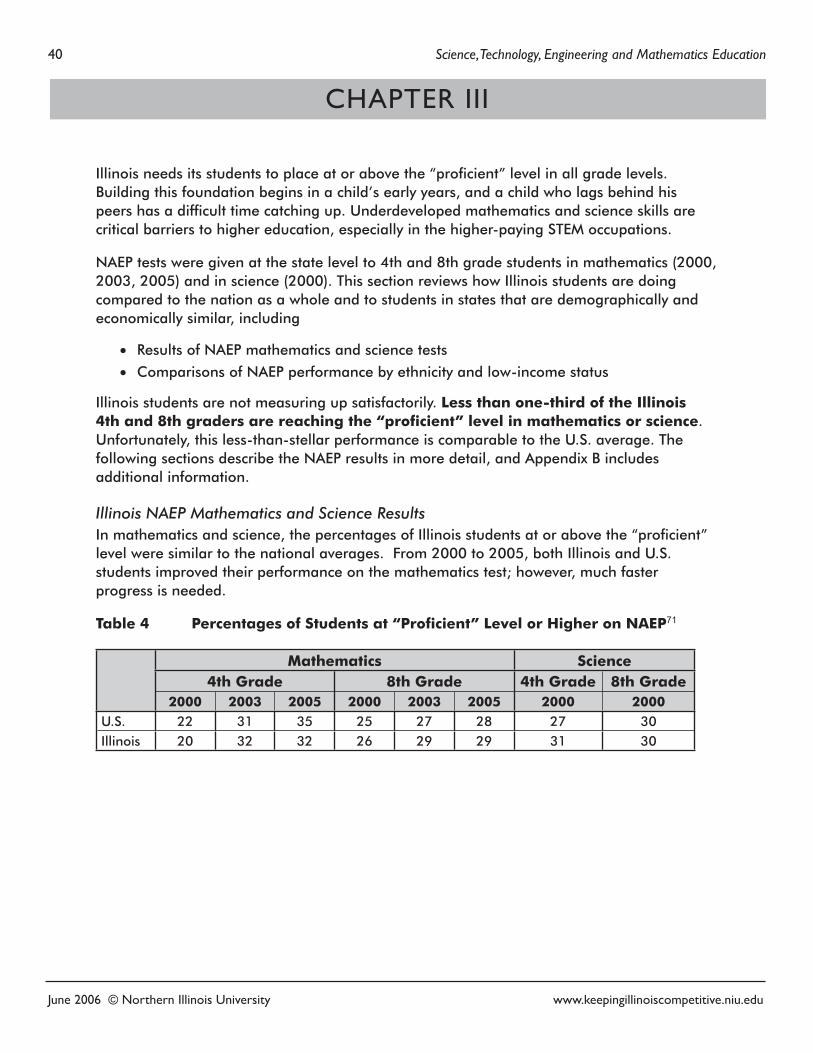
40 Science, Technology, Engineering and Mathematics Education
June 2006 © Northern Illinois University www.keepingillinoiscompetitive.niu.edu
Illinois needs its students to place at or above the “proficient” level in all grade levels. Building this foundation begins in a child’s early years, and a child who lags behind his peers has a difficult time catching up. Underdeveloped mathematics and science skills are critical barriers to higher education, especially in the higher-paying STEM occupations.
NAEP tests were given at the state level to 4th and 8th grade students in mathematics (2000, 2003, 2005) and in science (2000). This section reviews how Illinois students are doing compared to the nation as a whole and to students in states that are demographically and economically similar, including
• Results of NAEP mathematics and science tests
• Comparisons of NAEP performance by ethnicity and low-income status
Illinois students are not measuring up satisfactorily. Less than one-third of the Illinois 4th and 8th graders are reaching the “proficient” level in mathematics or science. Unfortunately, this less-than-stellar performance is comparable to the U.S. average. The following sections describe the NAEP results in more detail, and Appendix B includes additional information.
Illinois NAEP Mathematics and Science Results In mathematics and science, the percentages of Illinois students at or above the “proficient” level were similar to the national averages. From 2000 to 2005, both Illinois and U.S. students improved their performance on the mathematics test; however, much faster progress is needed.
Table 4 Percentages of Students at “Proficient” Level or Higher on NAEP71
Mathematics Science4th Grade 8th Grade 4th Grade 8th Grade
2000 2003 2005 2000 2003 2005 2000 2000U.S. 22 31 35 25 27 28 27 30Illinois 20 32 32 26 29 29 31 30
CHAPTER III
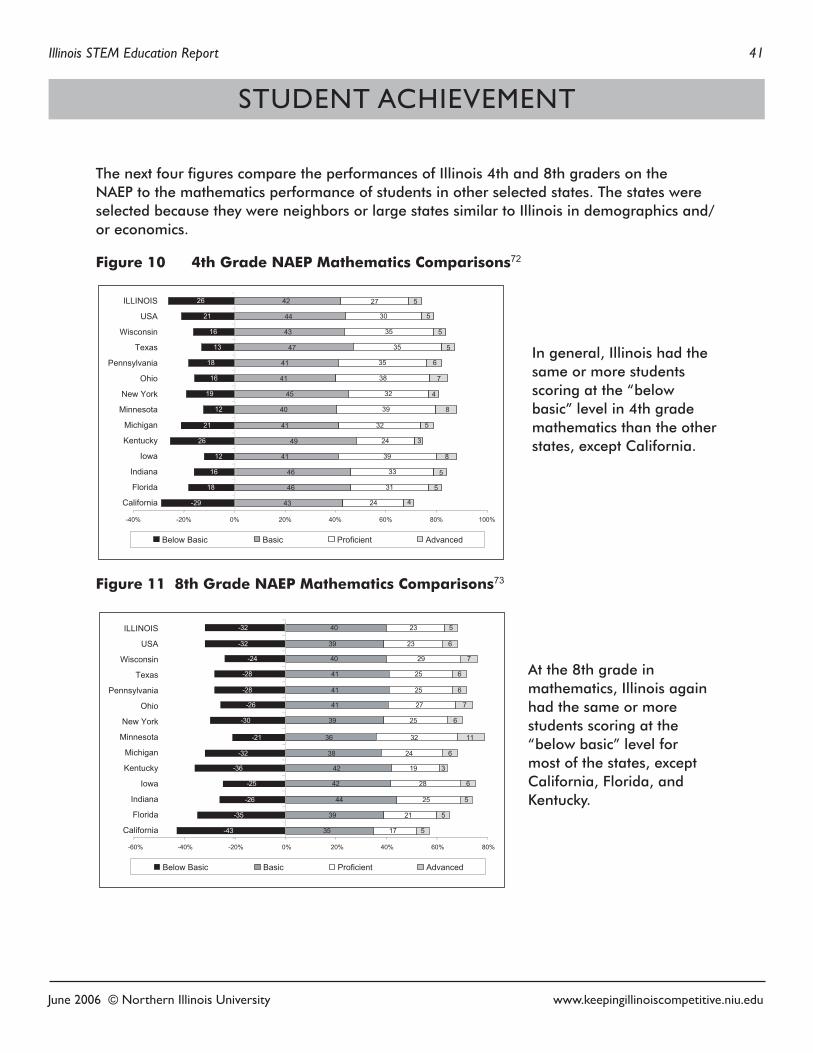
Illinois STEM Education Report 41
June 2006 © Northern Illinois University www.keepingillinoiscompetitive.niu.edu
The next four figures compare the performances of Illinois 4th and 8th graders on the NAEP to the mathematics performance of students in other selected states. The states were selected because they were neighbors or large states similar to Illinois in demographics and/or economics.
Figure 10 4th Grade NAEP Mathematics Comparisons72
In general, Illinois had the same or more students scoring at the “below basic” level in 4th grade mathematics than the other states, except California.
Figure 11 8th Grade NAEP Mathematics Comparisons73
At the 8th grade in mathematics, Illinois again had the same or more students scoring at the “below basic” level for most of the states, except California, Florida, and Kentucky.
STUDENT ACHIEVEMENT
-
-
- -
-
- -
-
-
- -
-
-
-40% -20% 0% 20% 40% 60% 80% 100%
Below Basic Basic Proficient Advanced
California
Florida
Indiana
Iowa
Kentucky
Minnesota
New York
Ohio
Texas
Wisconsin
USA
ILLINOIS
Pennsylvania
Michigan
43
46
46
41
49
41
40
45
41
41
47
43
44
42
-29
18
16
12
26
21
12
19
16
18
13
16
21
26
24
31
33
39
24
32
39
32
38
35
35
35
30
27
4
5
5
8
3
5
8
4
7
6
5
5
5
5
-40% -60% -20% 0% 20% 40% 60% 80%
Below Basic Basic Proficient Advanced
California
Florida
Indiana
Iowa
Kentucky
Minnesota
New York
Ohio
Texas
Wisconsin
USA
ILLINOIS
Pennsylvania
Michigan
-43
-35
-26
-25
-36
-32
-21
-30
-26
-28
-28
-24
-32
-32
35
39
44
42
42
38
36
39
41
41
41
40
39
40
17
21
25
28
19
24
32
25
27
25
25
29
23
23
5
5
5
6
3
6
11
6
7
6
6
7
6
5
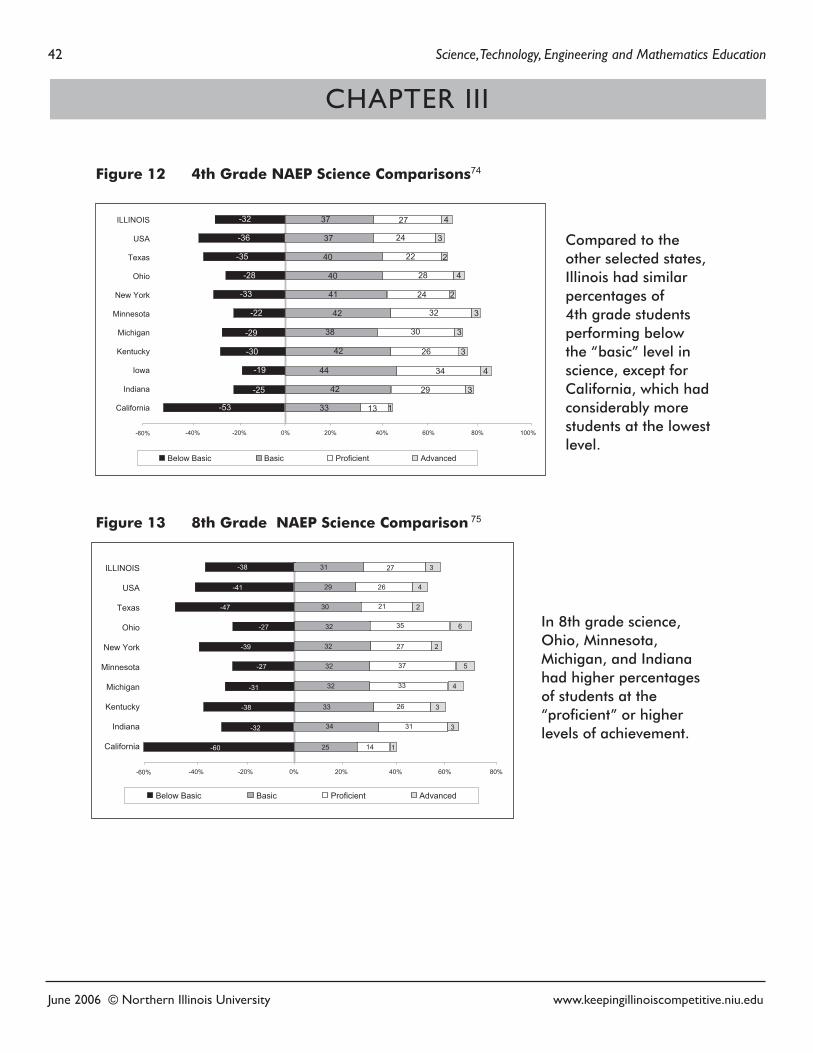
42 Science, Technology, Engineering and Mathematics Education
June 2006 © Northern Illinois University www.keepingillinoiscompetitive.niu.edu
Figure 12 4th Grade NAEP Science Comparisons74
Compared to the other selected states, Illinois had similar percentages of 4th grade students performing below the “basic” level in science, except for California, which had considerably more students at the lowest level.
Figure 13 8th Grade NAEP Science Comparison 75
In 8th grade science, Ohio, Minnesota, Michigan, and Indiana had higher percentages of students at the “proficient” or higher levels of achievement.
-
-
-
-40% -20% 0% 20% 40% 60% 80% 100%
Below Basic Basic Proficient Advanced
California
Indiana
Kentucky
Michigan
Minnesota
Ohio
Texas
USA
ILLINOIS
New York
Iowa
-60%
13
29
34
26
30
32
24
28
22
24
27
33
42
44
42
38
42
41
40
40
37
37
1
3
3
3
2
4
3
2
4
3
4
-53
-25
-19
-30
-29
-22
-33
-28
-35
-36
-32
-40% -20% 0% 20% 40% 60% 80%-60%
-
-
Below Basic Basic Proficient Advanced
California
Kentucky
Michigan
Minnesota
Ohio
Texas
USA
ILLINOIS
New York
Indiana
-60
-32
-38
-31
-27
-39
-27
-47
-41
-38
14
31
26
33
37
27
35
21
26
27
25
34
33
32
32
32
32
30
29
31
3
4
5
2
3
4
2
6
1
3
CHAPTER III
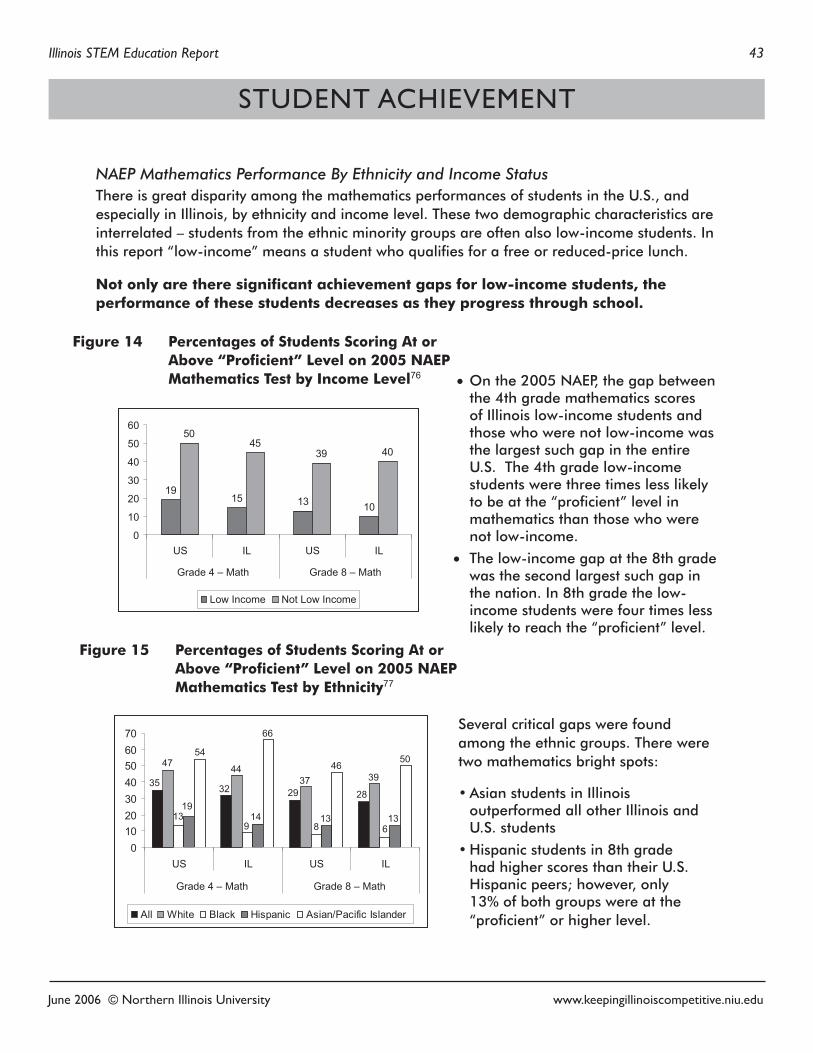
Illinois STEM Education Report 43
June 2006 © Northern Illinois University www.keepingillinoiscompetitive.niu.edu
NAEP Mathematics Performance By Ethnicity and Income StatusThere is great disparity among the mathematics performances of students in the U.S., and especially in Illinois, by ethnicity and income level. These two demographic characteristics are interrelated – students from the ethnic minority groups are often also low-income students. In this report “low-income” means a student who qualifies for a free or reduced-price lunch.
Not only are there significant achievement gaps for low-income students, the performance of these students decreases as they progress through school.
• On the 2005 NAEP, the gap between the 4th grade mathematics scores of Illinois low-income students and those who were not low-income was the largest such gap in the entire U.S. The 4th grade low-income students were three times less likely to be at the “proficient” level in mathematics than those who were not low-income.
• The low-income gap at the 8th grade was the second largest such gap in the nation. In 8th grade the low-income students were four times less likely to reach the “proficient” level.
Several critical gaps were found among the ethnic groups. There were two mathematics bright spots:
• Asian students in Illinois outperformed all other Illinois and U.S. students
• Hispanic students in 8th grade had higher scores than their U.S. Hispanic peers; however, only 13% of both groups were at the “proficient” or higher level.
1915 13 10
5045
39 40
0
10
20
30
40
50
60
US IL US IL
Grade 4 – Math Grade 8 – Math
Low Income Not Low Income
STUDENT ACHIEVEMENT
Figure 14 Percentages of Students Scoring At or Above “Proficient” Level on 2005 NAEP Mathematics Test by Income Level76
Figure 15 Percentages of Students Scoring At or Above “Proficient” Level on 2005 NAEP Mathematics Test by Ethnicity77
35 32 29 28
47 4437 39
139 8 6
1914 13 13
54
66
4650
010203040506070
US IL US IL
Grade 4 – Math Grade 8 – Math
All White Black Hispanic Asian/Pacific Islander
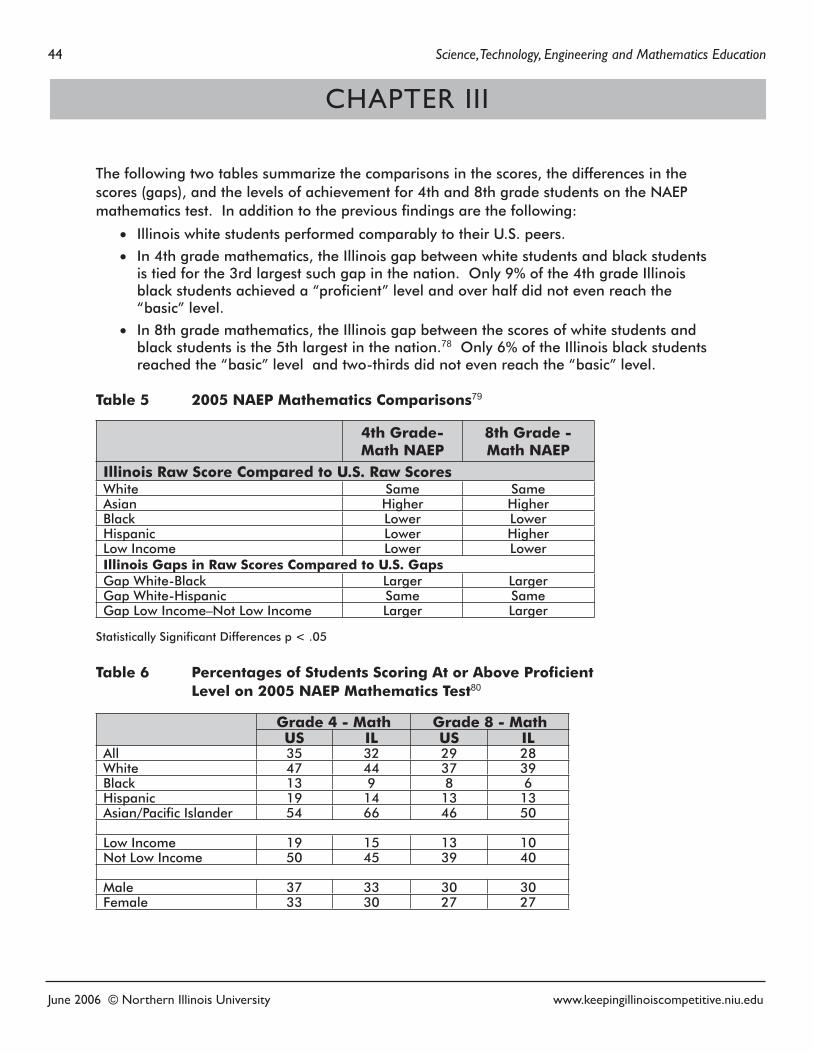
44 Science, Technology, Engineering and Mathematics Education
June 2006 © Northern Illinois University www.keepingillinoiscompetitive.niu.edu
The following two tables summarize the comparisons in the scores, the differences in the scores (gaps), and the levels of achievement for 4th and 8th grade students on the NAEP mathematics test. In addition to the previous findings are the following:
• Illinois white students performed comparably to their U.S. peers.
• In 4th grade mathematics, the Illinois gap between white students and black students is tied for the 3rd largest such gap in the nation. Only 9% of the 4th grade Illinois black students achieved a “proficient” level and over half did not even reach the “basic” level.
• In 8th grade mathematics, the Illinois gap between the scores of white students and black students is the 5th largest in the nation.78 Only 6% of the Illinois black students reached the “basic” level and two-thirds did not even reach the “basic” level.
Table 5 2005 NAEP Mathematics Comparisons79
4th Grade- Math NAEP
8th Grade - Math NAEP
Illinois Raw Score Compared to U.S. Raw ScoresWhite Same SameAsian Higher HigherBlack Lower LowerHispanic Lower HigherLow Income Lower LowerIllinois Gaps in Raw Scores Compared to U.S. GapsGap White-Black Larger LargerGap White-Hispanic Same SameGap Low Income–Not Low Income Larger Larger
Statistically Significant Differences p < .05
Table 6 Percentages of Students Scoring At or Above Proficient Level on 2005 NAEP Mathematics Test80
Grade 4 - Math Grade 8 - MathUS IL US IL
All 35 32 29 28White 47 44 37 39Black 13 9 8 6Hispanic 19 14 13 13Asian/Pacific Islander 54 66 46 50
Low Income 19 15 13 10Not Low Income 50 45 39 40
Male 37 33 30 30Female 33 30 27 27
CHAPTER III
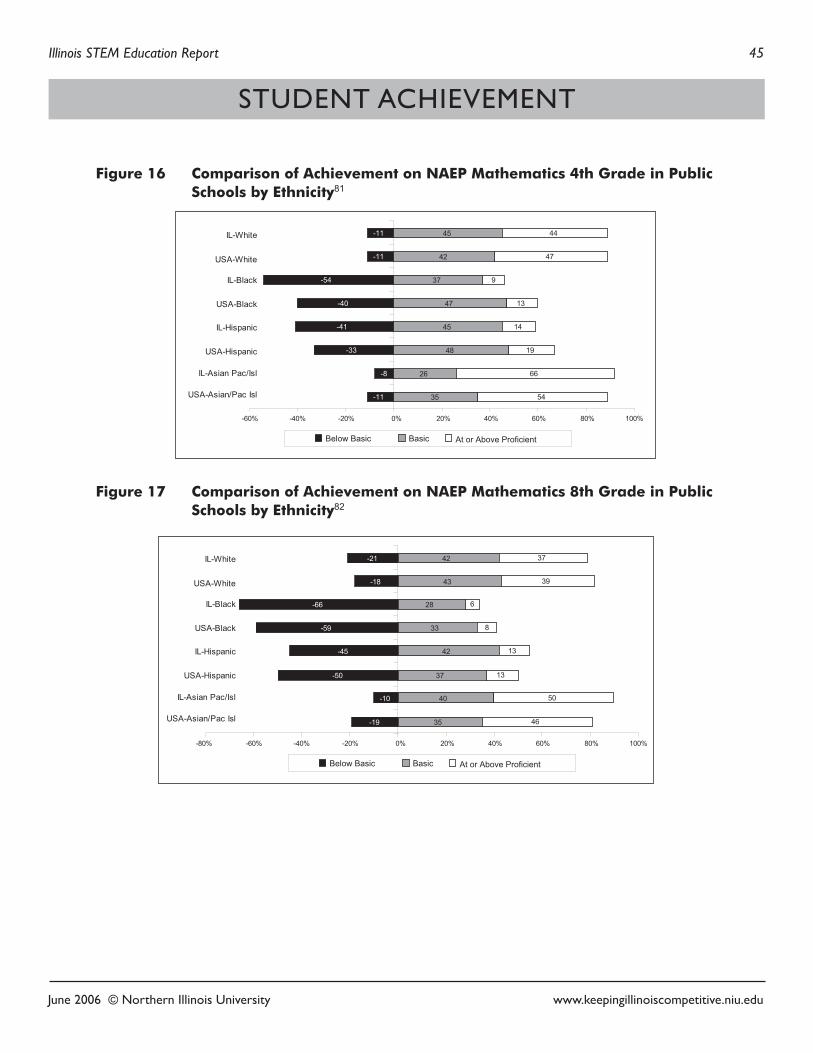
Illinois STEM Education Report 45
June 2006 © Northern Illinois University www.keepingillinoiscompetitive.niu.edu
Figure 16 Comparison of Achievement on NAEP Mathematics 4th Grade in Public Schools by Ethnicity81
Figure 17 Comparison of Achievement on NAEP Mathematics 8th Grade in Public Schools by Ethnicity82
STUDENT ACHIEVEMENT
-60%-80% -40% -20% 0% 20% 40% 60% 80% 100%
Below Basic Basic At or Above Proficient
USA-Asian/Pac Isl
IL-Asian Pac/Isl
USA-Hispanic
IL-Hispanic
USA-Black
IL-Black
USA-White
IL-White
-19
-10
-50
-45
-59
-66
-18
-21
35
40
37
42
33
28
43
42
46
50
13
13
8
6
39
37
-60% -40% -20% 0% 20% 40% 60% 80% 100%
Below Basic Basic At or Above Proficient
USA-Asian/Pac Isl
IL-Asian Pac/Isl
USA-Hispanic
IL-Hispanic
USA-Black
IL-Black
USA-White
IL-White
-11
-8
-33
-41
-40
-54
-11
-11
35
26
48
45
47
37
42
45
54
66
19
14
13
9
47
44
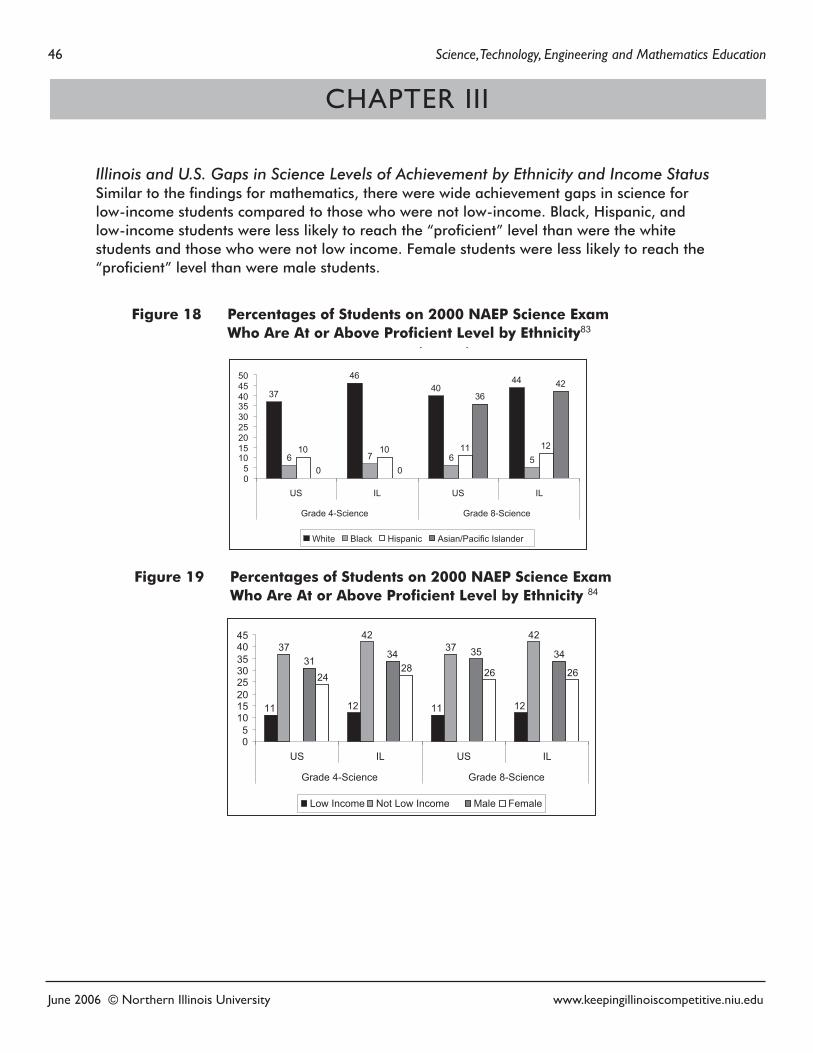
46 Science, Technology, Engineering and Mathematics Education
June 2006 © Northern Illinois University www.keepingillinoiscompetitive.niu.edu
CHAPTER III
Illinois and U.S. Gaps in Science Levels of Achievement by Ethnicity and Income StatusSimilar to the findings for mathematics, there were wide achievement gaps in science for low-income students compared to those who were not low-income. Black, Hispanic, and low-income students were less likely to reach the “proficient” level than were the white students and those who were not low income. Female students were less likely to reach the “proficient” level than were male students.
37
4640
44
6 7 6 510 10 11 12
0 0
3642
05
101520253035404550
US IL US IL
Grade 4-Science Grade 8-Science
White Black Hispanic Asian/Pacific Islander
11 12 11 12
3742
3742
3134 35 34
2428 26 26
05
1015202530354045
US IL US IL
Grade 4-Science Grade 8-Science
Low Income Not Low Income Male Female
Figure 19 Percentages of Students on 2000 NAEP Science Exam Who Are At or Above Proficient Level by Ethnicity 84
Figure 18 Percentages of Students on 2000 NAEP Science Exam Who Are At or Above Proficient Level by Ethnicity83
Illinois STEM Education Report 47
June 2006 © Northern Illinois University www.keepingillinoiscompetitive.niu.edu
STUDENT ACHIEVEMENT
In summary, on the NAEP, a nationally recognized assessment, less than one-third of the Illinois students met the “proficient” level of competency. Similar to the international studies, Illinois’ low-income students have extremely low levels of performance. As students progress through school, the level of achievement decreases.
According to the NCES’ Projections of Education Statistics to 2014, the number of Illinois public high school graduates is projected to increase by 8.3% between 2002 and 2014, compared to a national increase of 9%. In Illinois, there is a disproportionate projected growth in the traditionally underrepresented ethnic categories, especially the Hispanic population. In fact, projections estimate that 40% of the Illinois high school graduating class of 2013-2014 will be from traditionally underrepresented groups.85
If these projections hold true, and if the performances of the ethnic minority groups does not improve, Illinois will face a situation in which increasing numbers of students fail to meet the state standards and, therefore, are seriously under-prepared for postsecondary education or work.
48 Science, Technology, Engineering and Mathematics Education
June 2006 © Northern Illinois University www.keepingillinoiscompetitive.niu.edu
Illinois State AssessmentsThe results of international and national assessments yield insights into the competition that will be faced by the Illinois workforce of the future. If these results are predictive, then many of these students, one day voting citizens, will lack the basic knowledge needed to truly understand complex, scientific topics of the day. In this section, the results of the Illinois State Assessments compare how well students have achieved the minimum state standards.
In Illinois, a decade of reform efforts accelerated in 1997, when the Illinois State Board of Education established the Illinois Learning Standards for early elementary grades through high school. The Illinois Learning Standards represent what students should know and be able to do in order to prepare for both livable-wage jobs and postsecondary education. Students’ progress on achieving the standards is measured by the Illinois Standards Achievement Test (ISAT) in grades 3 through 8 and the Prairie State Achievement Exam (PSAE) in grade 11.
The Illinois Learning Standards and the assessments have fared relatively well in external reviews by independent agencies. The standards, which have been supplemented by performance indicators and sample classroom assessments, are generally regarded as rigorous. Evaluators have found that the assessments are aligned with the standards. Implementation of the standards has proceeded slowly, according to studies by the University of Illinois.86
From 1999 to 2005, students in 3rd, 5th, and 8th grades took the ISAT mathematics exam. Beginning in 2006, students in 3rd through 8th grades take the ISAT reading and mathematics tests annually. The ISAT science exam is administered to students in 4th and 7th grades. Students in 11th grade take the PSAE, which includes mathematics and science subtests as well as the full ACT.
According to the federal No Child Left Behind law, by 2014, all students in every state should meet that state’s standards. In Illinois, that means 100% of students must at least meet the standards as measured by the ISAT and PSAE. The federal law reinforces a position taken by the Illinois State Board of Education—that this level of achievement is necessary if students are to be prepared for college and for jobs with livable wages.
Student performance on the ISAT and PSAE exams is reported by four levels:87
• “Academic Warning” - limited knowledge and skills in subject; applies knowledge and skills ineffectively
• “Below Standards” - demonstrates basic knowledge and skills in subject; applies knowledge in limited ways
• “Meets Standards” - demonstrates proficient knowledge and skills in the subject; effectively applies knowledge and skills to solve problems
• “Exceeds Standards” - demonstrates advanced knowledge and skills in the subject; creatively applies knowledge and skills to solve problems and evaluate the results
CHAPTER III
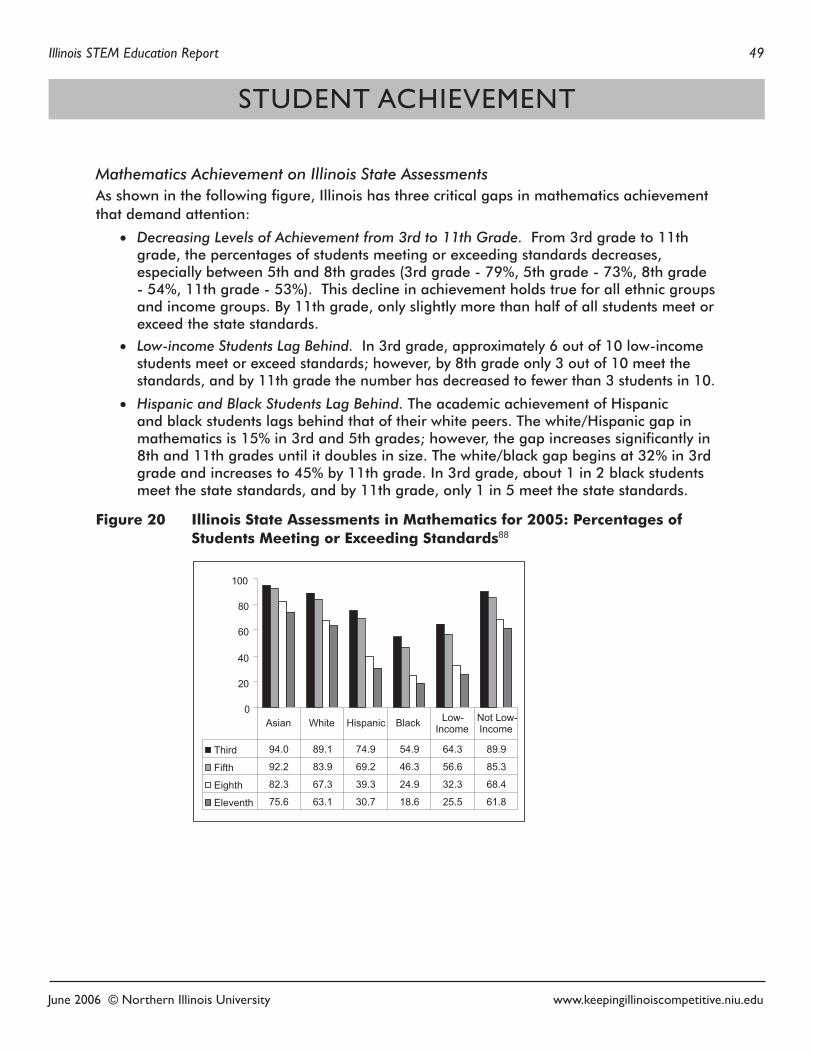
Illinois STEM Education Report 49
June 2006 © Northern Illinois University www.keepingillinoiscompetitive.niu.edu
Mathematics Achievement on Illinois State AssessmentsAs shown in the following figure, Illinois has three critical gaps in mathematics achievement that demand attention:
• Decreasing Levels of Achievement from 3rd to 11th Grade. From 3rd grade to 11th grade, the percentages of students meeting or exceeding standards decreases, especially between 5th and 8th grades (3rd grade - 79%, 5th grade - 73%, 8th grade - 54%, 11th grade - 53%). This decline in achievement holds true for all ethnic groups and income groups. By 11th grade, only slightly more than half of all students meet or exceed the state standards.
• Low-income Students Lag Behind. In 3rd grade, approximately 6 out of 10 low-income students meet or exceed standards; however, by 8th grade only 3 out of 10 meet the standards, and by 11th grade the number has decreased to fewer than 3 students in 10.
• Hispanic and Black Students Lag Behind. The academic achievement of Hispanic and black students lags behind that of their white peers. The white/Hispanic gap in mathematics is 15% in 3rd and 5th grades; however, the gap increases significantly in 8th and 11th grades until it doubles in size. The white/black gap begins at 32% in 3rd grade and increases to 45% by 11th grade. In 3rd grade, about 1 in 2 black students meet the state standards, and by 11th grade, only 1 in 5 meet the state standards.
Figure 20 Illinois State Assessments in Mathematics for 2005: Percentages of Students Meeting or Exceeding Standards88
0
20
40
60
80
100
Third 94.0 89.1 74.9 54.9 64.3 89.9
Fifth 92.2 83.9 69.2 46.3 56.6 85.3
Eighth 82.3 67.3 39.3 24.9 32.3 68.4
Eleventh 75.6 63.1 30.7 18.6 25.5 61.8
Asian White Hispanic Black Low-Income
Not Low-Income
STUDENT ACHIEVEMENT
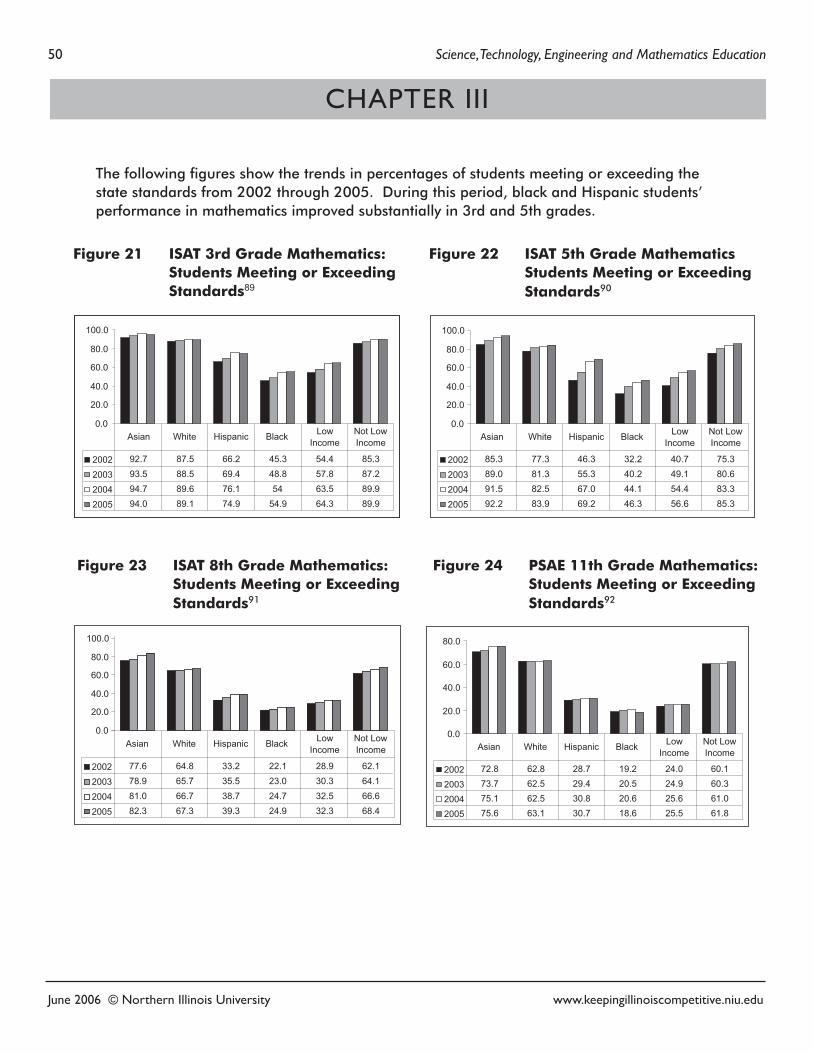
50 Science, Technology, Engineering and Mathematics Education
June 2006 © Northern Illinois University www.keepingillinoiscompetitive.niu.edu
The following figures show the trends in percentages of students meeting or exceeding the state standards from 2002 through 2005. During this period, black and Hispanic students’ performance in mathematics improved substantially in 3rd and 5th grades.
0.0
20.0
40.0
60.0
80.0
100.0
2002 92.7 87.5 66.2 45.3 54.4 85.3
2003 93.5 88.5 69.4 48.8 57.8 87.2
2004 94.7 89.6 76.1 54 63.5 89.9
2005 94.0 89.1 74.9 54.9 64.3 89.9
Asian White Hispanic Black Low Income
Not Low Income
0.0
20.0
40.0
60.0
80.0
100.0
2002 85.3 77.3 46.3 32.2 40.7 75.3
2003 89.0 81.3 55.3 40.2 49.1 80.6
2004 91.5 82.5 67.0 44.1 54.4 83.3
2005 92.2 83.9 69.2 46.3 56.6 85.3
Asian White Hispanic Black Low Income
Not Low Income
2002 77.6 64.8 33.2 22.1 28.9 62.1
2003 78.9 65.7 35.5 23.0 30.3 64.1
2004 81.0 66.7 38.7 24.7 32.5 66.6
2005 82.3 67.3 39.3 24.9 32.3 68.4
Asian White Hispanic Black Low Income
Not Low Income
0.0
20.0
40.0
60.0
80.0
100.0
0.0
20.0
40.0
60.0
80.0
2002 72.8 62.8 28.7 19.2 24.0 60.1
2003 73.7 62.5 29.4 20.5 24.9 60.3
2004 75.1 62.5 30.8 20.6 25.6 61.0
2005 75.6 63.1 30.7 18.6 25.5 61.8
Asian White Hispanic Black Low Income
Not Low Income
Figure 21 ISAT 3rd Grade Mathematics: Students Meeting or Exceeding Standards89
Figure 23 ISAT 8th Grade Mathematics: Students Meeting or Exceeding Standards91
Figure 24 PSAE 11th Grade Mathematics: Students Meeting or Exceeding Standards92
CHAPTER III
Figure 22 ISAT 5th Grade Mathematics Students Meeting or Exceeding Standards90
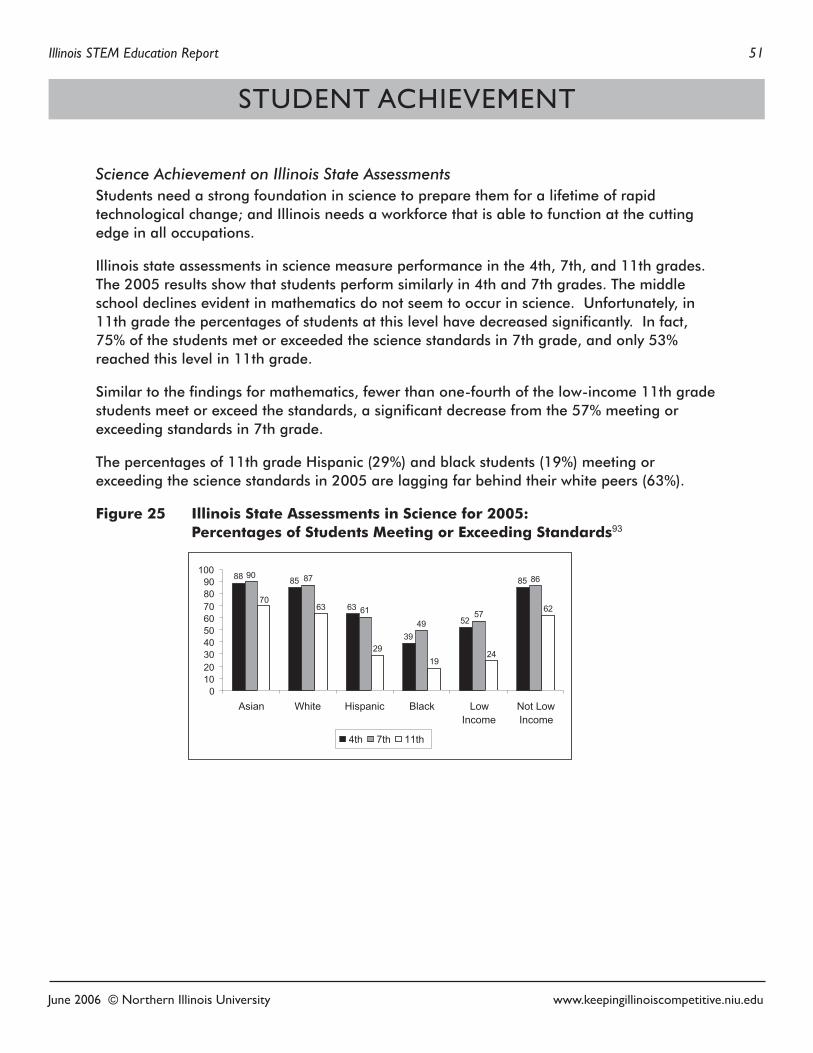
Illinois STEM Education Report 51
June 2006 © Northern Illinois University www.keepingillinoiscompetitive.niu.edu
Science Achievement on Illinois State Assessments Students need a strong foundation in science to prepare them for a lifetime of rapid technological change; and Illinois needs a workforce that is able to function at the cutting edge in all occupations.
Illinois state assessments in science measure performance in the 4th, 7th, and 11th grades. The 2005 results show that students perform similarly in 4th and 7th grades. The middle school declines evident in mathematics do not seem to occur in science. Unfortunately, in 11th grade the percentages of students at this level have decreased significantly. In fact, 75% of the students met or exceeded the science standards in 7th grade, and only 53% reached this level in 11th grade.
Similar to the findings for mathematics, fewer than one-fourth of the low-income 11th grade students meet or exceed the standards, a significant decrease from the 57% meeting or exceeding standards in 7th grade.
The percentages of 11th grade Hispanic (29%) and black students (19%) meeting or exceeding the science standards in 2005 are lagging far behind their white peers (63%).
Figure 25 Illinois State Assessments in Science for 2005: Percentages of Students Meeting or Exceeding Standards93
88 85
63
39
52
8590 87
6149
57
86
7063
2919
24
62
0102030405060708090
100
Asian White Hispanic Black LowIncome
Not LowIncome
4th 7th 11th
STUDENT ACHIEVEMENT
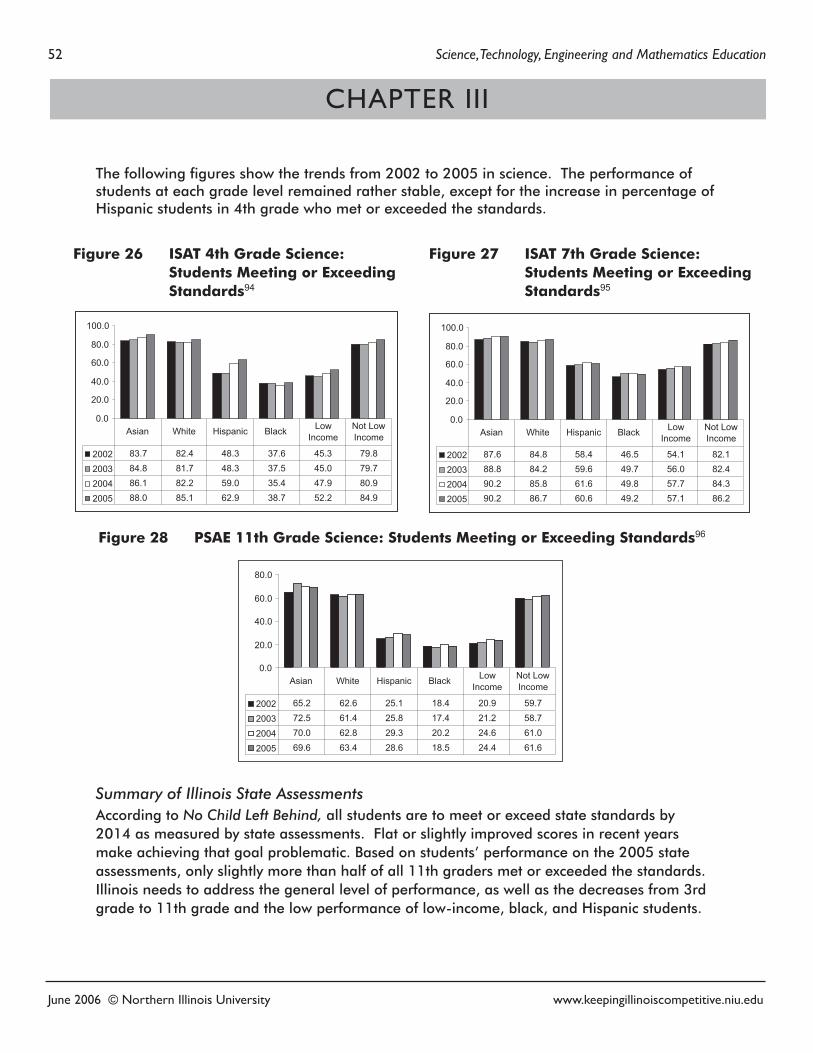
52 Science, Technology, Engineering and Mathematics Education
June 2006 © Northern Illinois University www.keepingillinoiscompetitive.niu.edu
The following figures show the trends from 2002 to 2005 in science. The performance of students at each grade level remained rather stable, except for the increase in percentage of Hispanic students in 4th grade who met or exceeded the standards.
Summary of Illinois State AssessmentsAccording to No Child Left Behind, all students are to meet or exceed state standards by 2014 as measured by state assessments. Flat or slightly improved scores in recent years make achieving that goal problematic. Based on students’ performance on the 2005 state assessments, only slightly more than half of all 11th graders met or exceeded the standards. Illinois needs to address the general level of performance, as well as the decreases from 3rd grade to 11th grade and the low performance of low-income, black, and Hispanic students.
0.0
20.0
40.0
60.0
80.0
100.0
2002 83.7 82.4 48.3 37.6 45.3 79.8
2003 84.8 81.7 48.3 37.5 45.0 79.7
2004 86.1 82.2 59.0 35.4 47.9 80.9
2005 88.0 85.1 62.9 38.7 52.2 84.9
Asian White Hispanic Black Low Income
Not Low Income
0.0
20.0
40.0
60.0
80.0
100.0
2002 87.6 84.8 58.4 46.5 54.1 82.1
2003 88.8 84.2 59.6 49.7 56.0 82.4
2004 90.2 85.8 61.6 49.8 57.7 84.3
2005 90.2 86.7 60.6 49.2 57.1 86.2
Asian White Hispanic Black Low Income
Not Low Income
0.0
20.0
40.0
60.0
80.0
2002 65.2 62.6 25.1 18.4 20.9 59.7
2003 72.5 61.4 25.8 17.4 21.2 58.7
2004 70.0 62.8 29.3 20.2 24.6 61.0
2005 69.6 63.4 28.6 18.5 24.4 61.6
Asian White Hispanic Black Low Income
Not Low Income
Figure 26 ISAT 4th Grade Science: Students Meeting or Exceeding Standards94
Figure 27 ISAT 7th Grade Science: Students Meeting or Exceeding Standards95
Figure 28 PSAE 11th Grade Science: Students Meeting or Exceeding Standards96
CHAPTER III
June 2006 © Northern Illinois University www.keepingillinoiscompetitive.niu.edu
Illinois STEM Education Report 53
Chapter SummaryKeeping Illinois competitive requires that our students perform competitively in international, national, and state measures of what they know and can do. Even though Illinois appears to be average, as opposed to competitive, the academic achievement gaps between low-income, black, and Hispanic students and their Asian, white, and “not low-income” peers are larger than the national averages. These discrepancies point to a need to raise the middle group of students as well as to raise those at the low end of the scale. On the other hand, the First in the World Consortium and Naperville showed that Illinois has some of the top performers in the world. On national tests, Illinois Asian students are highly competitive.
This chapter also presented the results of the NAEP and the Illinois state assessments, which both report the percentages of students who meet various levels of achievement. It might be assumed that the NAEP “proficient” level should compare with the Illinois “meet standards” level. That is true in terms of definitions, since the U.S. “proficient” and the Illinois “meet standards” establish the targets that all students should reach. Actual achievement in meeting these similar targets is, however, quite different. Illinois performance on the rigorous NAEP assessments at the “proficient” level is significantly lower than performance on the ISAT and PSAE “meets standards” level. In 2005, 54% of the 8th grade students “met” or “exceeded” the Illinois standards on the ISAT mathematics exam, but only 28% of the Illinois students reached at least the “proficient” level on the national exam. Similar disparities occur in other subjects and grade levels and are common across all but a few states. No Child Left Behind requires that all states participate in NAEP, so that state results may be compared with national benchmarks. Additional research is needed in Illinois to determine the reasons for the extreme discrepancies between NAEP and ISAT results.
The bottom line, regardless of which test is reviewed, is that Illinois needs to address the low performance of low-income, black, and Hispanic students. Just as India and China have moved millions of residents in poverty towards a knowledge-based workforce, Illinois also needs to raise the achievement levels of the low-achieving populations. Strides have been made with the Hispanic population; however, more and faster progress is imperative.
The bottom line, regardless of which test is reviewed, is that Illinois needs continually to address the low performance of low-income, black, and Hispanic students.
STUDENT ACHIEVEMENT
54 Science, Technology, Engineering and Mathematics Education
June 2006 © Northern Illinois University www.keepingillinoiscompetitive.niu.edu
CHAPTER IV
READINESS FOR COLLEGE AND WORK
Keeping Illinois competitive requires students to exit from high school well prepared for college or qualified to obtain a livable-wage job. Unfortunately, across the nation this is not happening. The American Diploma Project found that approximately 40% of high school graduates felt ill prepared for college or the workforce.97 Peter Hart in Rising to the Challenge found that 42% of the U.S. students are ill prepared for college, and 45% of the high school graduates lack the skills expected by employers.98
This chapter examines the following student indicators of readiness for college and work:
• High school dropout and graduation rates
• Readiness for college
• Readiness of high school graduates for the workforce
These student indicators have been defined and measured using various methodologies. Each approach has a theoretical foundation but is limited by the lack of complete data. It is common for multiple but differing statistics to describe dropout rates, graduation rates, and levels of readiness. For example, Illinois graduation rates range from 86% to less than 70%, depending upon the approach. The National Governors Association, Achieve, and other organizations have proposed a longitudinal data system that would allow more standardization of student achievement indicators and appropriate comparisons across states. The goal is to have the data system in place for all 50 states by 2009.99 This chapter discusses Illinois student data using some of the more common measures.
Regardless of the method or the metric, the interpretation of the data is very similar: too many students in the U.S. and in Illinois are not completing high school or are completing high school without the requisite knowledge and skills to be successful in college and/or the workplace. Gaps in the readiness indicators are most pronounced for low-income, black, and Hispanic students, especially male students.
Too many students in the U.S. and in Illinois are not completing high school or are completing high school without the requisite knowledge and skills to be successful in college and/or the workplace.
Illinois STEM Education Report 55
June 2006 © Northern Illinois University www.keepingillinoiscompetitive.niu.edu
High School Dropout and Graduation RatesThe high school dropout rate is a problem that directly impacts the economic vitality of the state. Students who do not complete high school will not have the sufficient background to find a livable-wage job, and, therefore, are likely to have low levels of income.100 The Alliance for Excellent Education looked at the impact of high school dropout rates on lost wages and taxes of students who were in 9th grade in 2000-01 and who did not graduate from high school. The total lost lifetime earnings for the United States dropouts was estimated at $325,622,960,000, and the total lost lifetime earnings for Illinois dropouts was estimated at $10,847,520,000.101
To address the dropout problem, Illinois increased the mandatory school age from 16 to 17 years old and implemented provisions for penalties to those who are found truant. The high school senior dropout rates reported by the Illinois State Board of Education decreased from 7.0% in 1994 to 4.0% in 2005.102 This metric looks at the attrition in the final years of high school.
A more comprehensive approach to assessing dropout rates involves a longitudinal assessment of all of the dropouts that occur for a cohort of students who begin 9th grade and complete high school four years later. A 2005 project at the Manhattan Institute computed high school graduation rates by looking at the 9th grade cohort, correcting for changes in population, and examining the number of diplomas issued. Using this methodology, the metric can be interpreted as both a graduation rate and a dropout rate. The U.S. graduation rate has changed slightly from 72% in 1991 to 70% in 2003,103 and the authors of the study would conclude the dropout rate of the 9th grade U.S. cohort graduating in 2003 was 30%. For Illinois, the 2003 graduation rate was 73%, with a dropout rate of 27%. Illinois students, in aggregate, are very similar to the U.S. average, and Illinois ranked 26th in the nation.
The tables below, however, points out the large discrepancies in the graduation/dropout rates based on ethnicity and gender:
• On the positive side, significantly more white and Asian students in Illinois, both male and female, graduate as compared to their U.S. peers.
• The percentages of graduating Hispanic students are very similar for the U.S. and Illinois; however, the graduation rates of Hispanic students are still rather low compared to the rates of their white and Asian peers.
• For black students, the statistics are rather bleak: significantly more male and female black students in Illinois drop out than their U.S. peers.
Over half of the black male and Hispanic male students dropped out of school before graduation, creating a large cadre of unskilled workers in Illinois. Given the demographic characteristics of Chicago, it is not surprising that it ranked 88th out of the 100 largest school districts in the nation and had an overall dropout rate of 50%.
READINESS FOR COLLEGE AND WORK
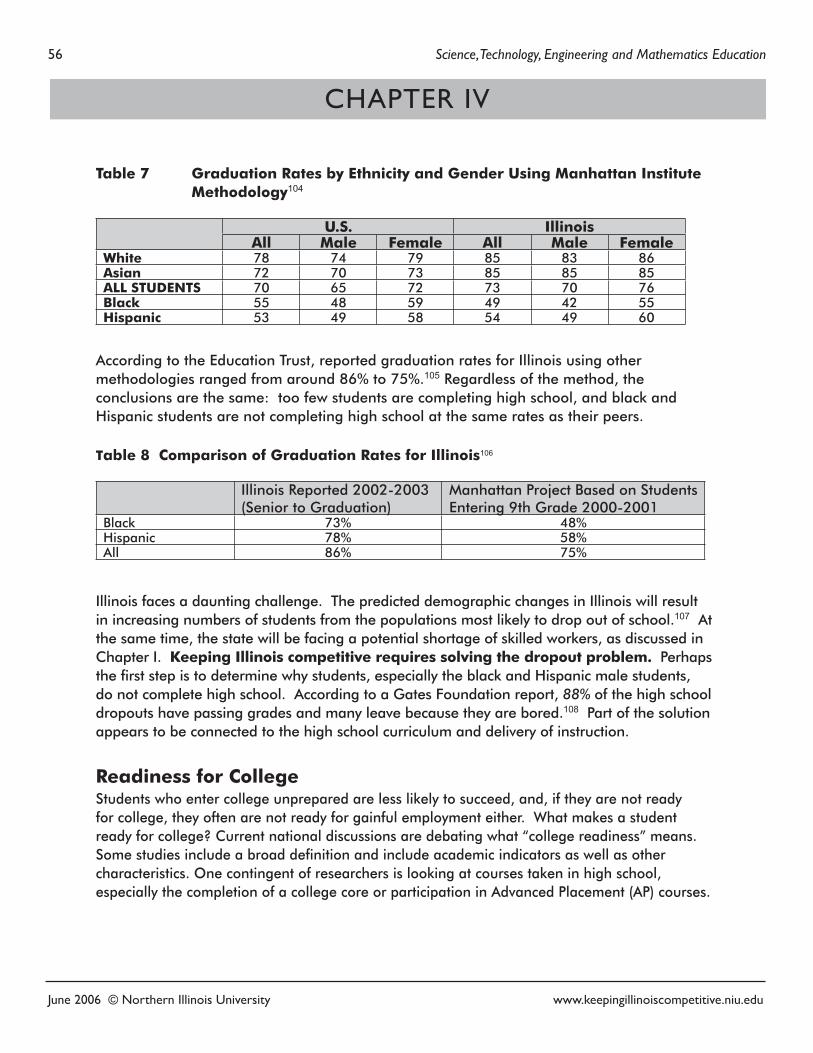
56 Science, Technology, Engineering and Mathematics Education
June 2006 © Northern Illinois University www.keepingillinoiscompetitive.niu.edu
Table 7 Graduation Rates by Ethnicity and Gender Using Manhattan Institute Methodology104
U.S. IllinoisAll Male Female All Male Female
White 78 74 79 85 83 86Asian 72 70 73 85 85 85ALL STUDENTS 70 65 72 73 70 76Black 55 48 59 49 42 55Hispanic 53 49 58 54 49 60
According to the Education Trust, reported graduation rates for Illinois using other methodologies ranged from around 86% to 75%.105 Regardless of the method, the conclusions are the same: too few students are completing high school, and black and Hispanic students are not completing high school at the same rates as their peers.
Table 8 Comparison of Graduation Rates for Illinois106
Illinois Reported 2002-2003 (Senior to Graduation)
Manhattan Project Based on Students Entering 9th Grade 2000-2001
Black 73% 48%Hispanic 78% 58%All 86% 75%
Illinois faces a daunting challenge. The predicted demographic changes in Illinois will result in increasing numbers of students from the populations most likely to drop out of school.107 At the same time, the state will be facing a potential shortage of skilled workers, as discussed in Chapter I. Keeping Illinois competitive requires solving the dropout problem. Perhaps the first step is to determine why students, especially the black and Hispanic male students, do not complete high school. According to a Gates Foundation report, 88% of the high school dropouts have passing grades and many leave because they are bored.108 Part of the solution appears to be connected to the high school curriculum and delivery of instruction.
Readiness for CollegeStudents who enter college unprepared are less likely to succeed, and, if they are not ready for college, they often are not ready for gainful employment either. What makes a student ready for college? Current national discussions are debating what “college readiness” means. Some studies include a broad definition and include academic indicators as well as other characteristics. One contingent of researchers is looking at courses taken in high school, especially the completion of a college core or participation in Advanced Placement (AP) courses.
CHAPTER IV
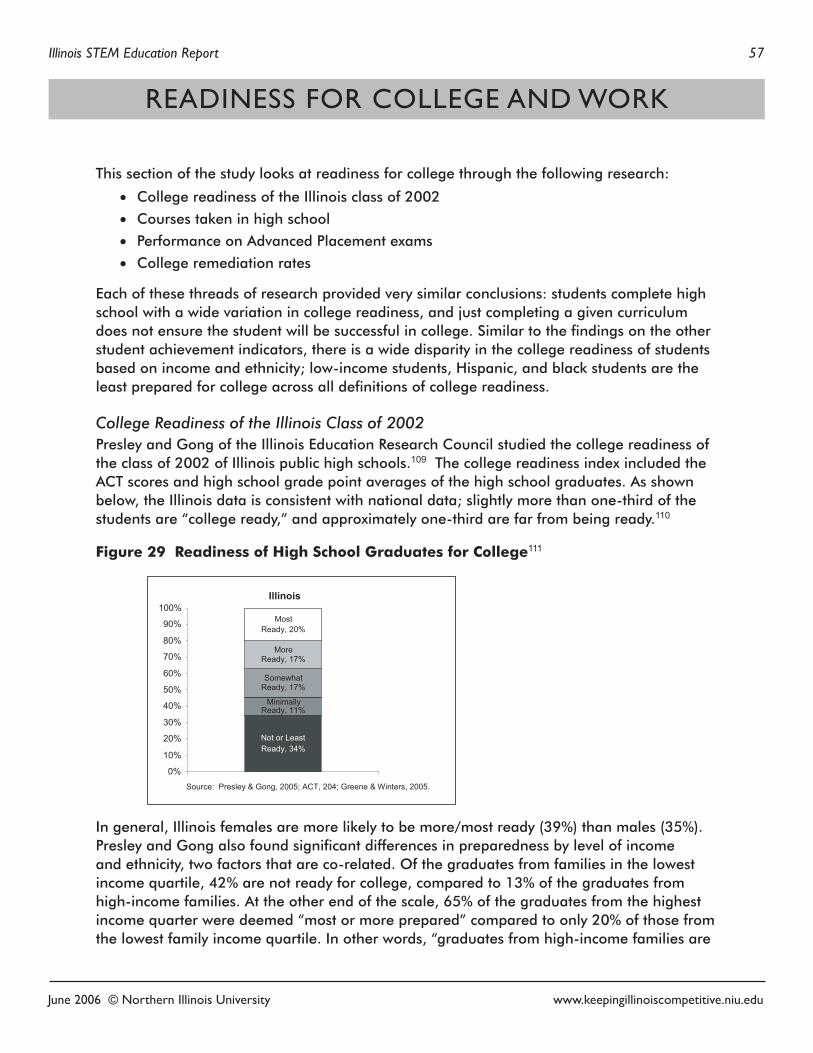
Illinois STEM Education Report 57
June 2006 © Northern Illinois University www.keepingillinoiscompetitive.niu.edu
This section of the study looks at readiness for college through the following research:
• College readiness of the Illinois class of 2002
• Courses taken in high school
• Performance on Advanced Placement exams
• College remediation rates
Each of these threads of research provided very similar conclusions: students complete high school with a wide variation in college readiness, and just completing a given curriculum does not ensure the student will be successful in college. Similar to the findings on the other student achievement indicators, there is a wide disparity in the college readiness of students based on income and ethnicity; low-income students, Hispanic, and black students are the least prepared for college across all definitions of college readiness.
College Readiness of the Illinois Class of 2002Presley and Gong of the Illinois Education Research Council studied the college readiness of the class of 2002 of Illinois public high schools.109 The college readiness index included the ACT scores and high school grade point averages of the high school graduates. As shown below, the Illinois data is consistent with national data; slightly more than one-third of the students are “college ready,” and approximately one-third are far from being ready.110
Figure 29 Readiness of High School Graduates for College111
In general, Illinois females are more likely to be more/most ready (39%) than males (35%). Presley and Gong also found significant differences in preparedness by level of income and ethnicity, two factors that are co-related. Of the graduates from families in the lowest income quartile, 42% are not ready for college, compared to 13% of the graduates from high-income families. At the other end of the scale, 65% of the graduates from the highest income quarter were deemed “most or more prepared” compared to only 20% of those from the lowest family income quartile. In other words, “graduates from high-income families are
READINESS FOR COLLEGE AND WORK
Source: Presley & Gong, 2005; ACT, 204; Greene & Winters, 2005.
Not or LeastReady, 34%
Minimally Ready, 11%
Somewhat Ready, 17%
More Ready, 17%
Most Ready, 20%
0%
10%
20%
30%
40%
50%
60%
70%
80%
90%
100%Illinois
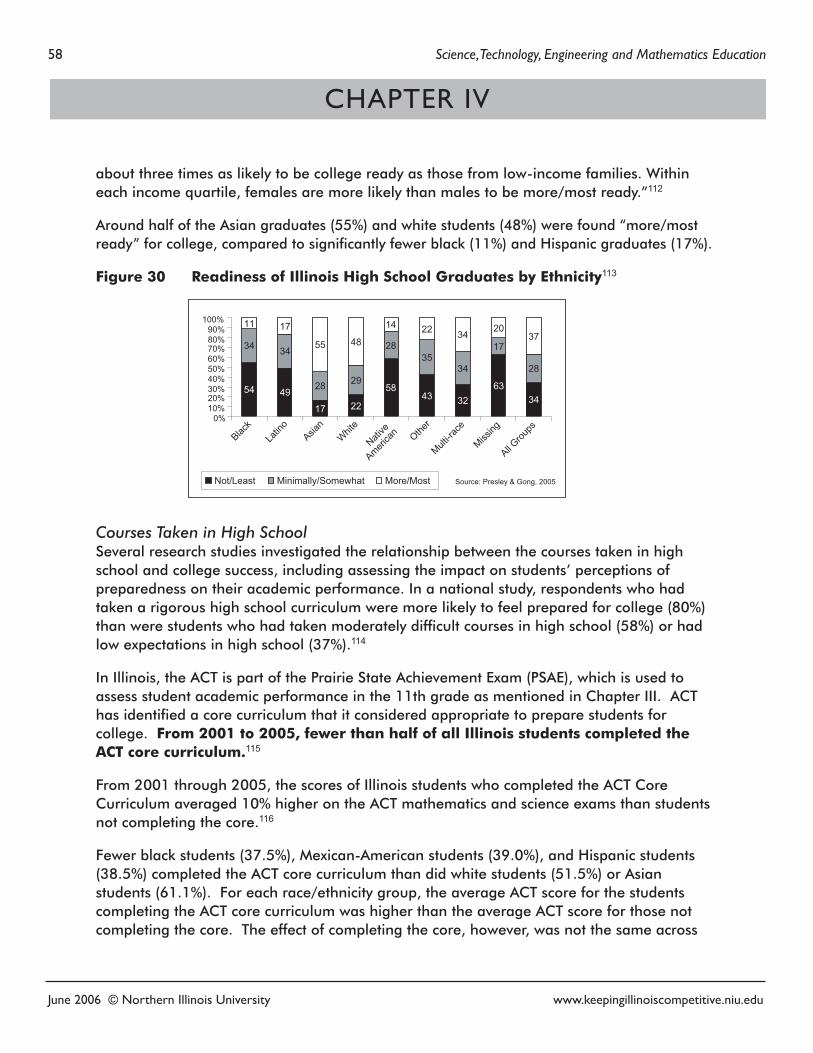
58 Science, Technology, Engineering and Mathematics Education
June 2006 © Northern Illinois University www.keepingillinoiscompetitive.niu.edu
about three times as likely to be college ready as those from low-income families. Within each income quartile, females are more likely than males to be more/most ready.”112
Around half of the Asian graduates (55%) and white students (48%) were found “more/most ready” for college, compared to significantly fewer black (11%) and Hispanic graduates (17%).
Figure 30 Readiness of Illinois High School Graduates by Ethnicity113
Courses Taken in High SchoolSeveral research studies investigated the relationship between the courses taken in high school and college success, including assessing the impact on students’ perceptions of preparedness on their academic performance. In a national study, respondents who had taken a rigorous high school curriculum were more likely to feel prepared for college (80%) than were students who had taken moderately difficult courses in high school (58%) or had low expectations in high school (37%).114
In Illinois, the ACT is part of the Prairie State Achievement Exam (PSAE), which is used to assess student academic performance in the 11th grade as mentioned in Chapter III. ACT has identified a core curriculum that it considered appropriate to prepare students for college. From 2001 to 2005, fewer than half of all Illinois students completed the ACT core curriculum.115
From 2001 through 2005, the scores of Illinois students who completed the ACT Core Curriculum averaged 10% higher on the ACT mathematics and science exams than students not completing the core.116
Fewer black students (37.5%), Mexican-American students (39.0%), and Hispanic students (38.5%) completed the ACT core curriculum than did white students (51.5%) or Asian students (61.1%). For each race/ethnicity group, the average ACT score for the students completing the ACT core curriculum was higher than the average ACT score for those not completing the core. The effect of completing the core, however, was not the same across
CHAPTER IV
54 49
17 22
5843 32
6334
34 34
28 29
2835
34
17
28
11 17
55 48
14 22 3420
37
0%10%20%30%40%50%60%70%80%90%
100%
Black
Latin
oAsia
nW
hite
Native
America
n Other
Multi-ra
ce
Missing
All Grou
ps
Not/Least Minimally/Somewhat More/Most Source: Presley & Gong, 2005
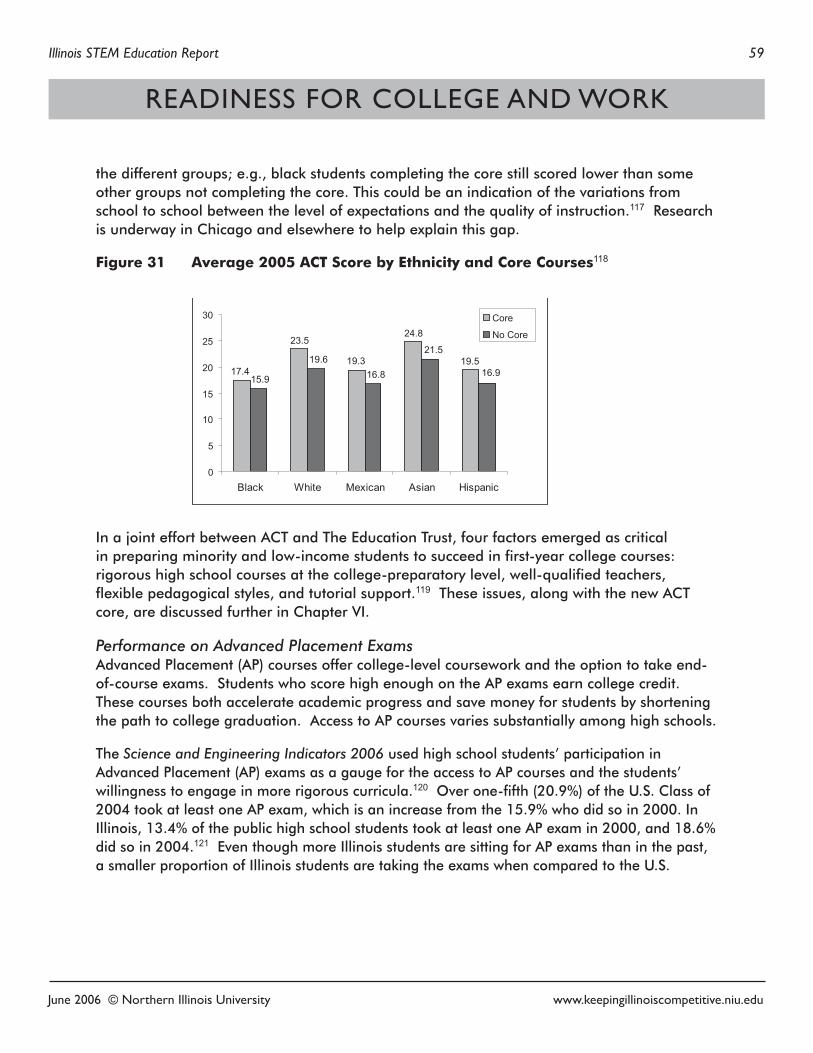
Illinois STEM Education Report 59
June 2006 © Northern Illinois University www.keepingillinoiscompetitive.niu.edu
the different groups; e.g., black students completing the core still scored lower than some other groups not completing the core. This could be an indication of the variations from school to school between the level of expectations and the quality of instruction.117 Research is underway in Chicago and elsewhere to help explain this gap.
Figure 31 Average 2005 ACT Score by Ethnicity and Core Courses118
In a joint effort between ACT and The Education Trust, four factors emerged as critical in preparing minority and low-income students to succeed in first-year college courses: rigorous high school courses at the college-preparatory level, well-qualified teachers, flexible pedagogical styles, and tutorial support.119 These issues, along with the new ACT core, are discussed further in Chapter VI.
Performance on Advanced Placement ExamsAdvanced Placement (AP) courses offer college-level coursework and the option to take end-of-course exams. Students who score high enough on the AP exams earn college credit. These courses both accelerate academic progress and save money for students by shortening the path to college graduation. Access to AP courses varies substantially among high schools.
The Science and Engineering Indicators 2006 used high school students’ participation in Advanced Placement (AP) exams as a gauge for the access to AP courses and the students’ willingness to engage in more rigorous curricula.120 Over one-fifth (20.9%) of the U.S. Class of 2004 took at least one AP exam, which is an increase from the 15.9% who did so in 2000. In Illinois, 13.4% of the public high school students took at least one AP exam in 2000, and 18.6% did so in 2004.121 Even though more Illinois students are sitting for AP exams than in the past, a smaller proportion of Illinois students are taking the exams when compared to the U.S.
READINESS FOR COLLEGE AND WORK
17.4
23.5
19.3
24.8
19.5
15.9
19.616.8
21.5
16.9
0
5
10
15
20
25
30
Black White Mexican Asian Hispanic
Core
No Core
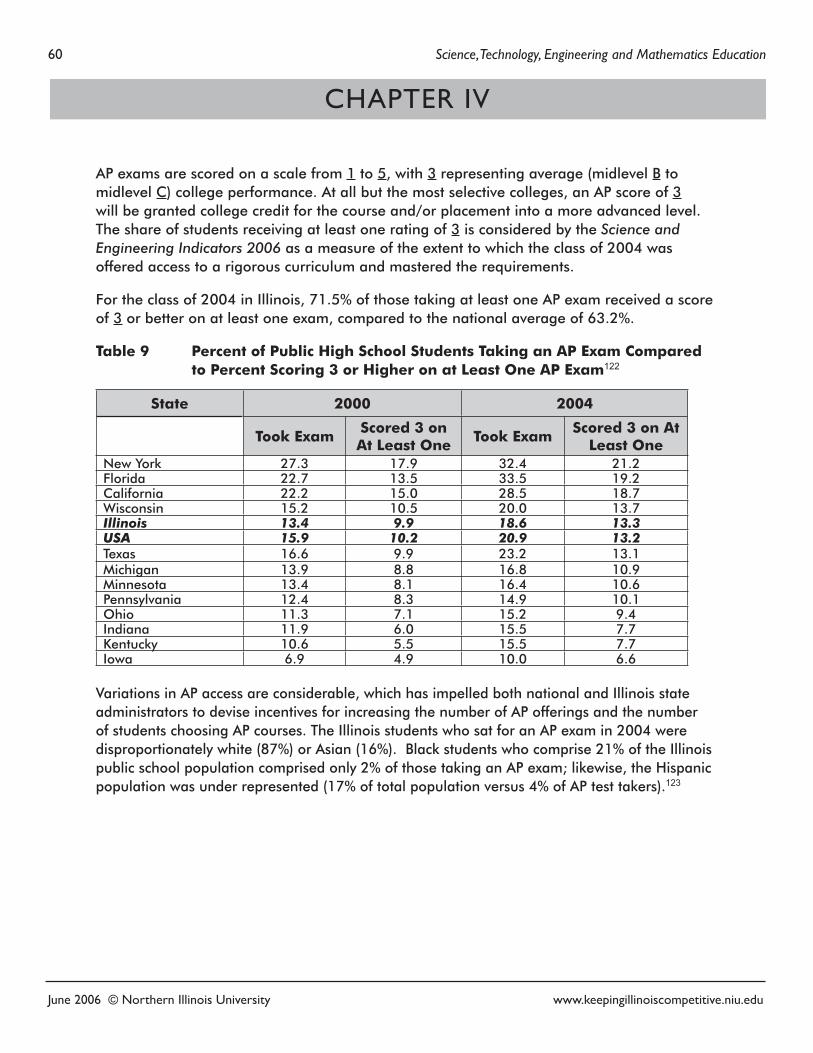
60 Science, Technology, Engineering and Mathematics Education
June 2006 © Northern Illinois University www.keepingillinoiscompetitive.niu.edu
AP exams are scored on a scale from 1 to 5, with 3 representing average (midlevel B to midlevel C) college performance. At all but the most selective colleges, an AP score of 3 will be granted college credit for the course and/or placement into a more advanced level. The share of students receiving at least one rating of 3 is considered by the Science and Engineering Indicators 2006 as a measure of the extent to which the class of 2004 was offered access to a rigorous curriculum and mastered the requirements.
For the class of 2004 in Illinois, 71.5% of those taking at least one AP exam received a score of 3 or better on at least one exam, compared to the national average of 63.2%.
Table 9 Percent of Public High School Students Taking an AP Exam Compared to Percent Scoring 3 or Higher on at Least One AP Exam122
State 2000 2004
Took Exam Scored 3 on At Least One Took Exam Scored 3 on At
Least One New York 27.3 17.9 32.4 21.2Florida 22.7 13.5 33.5 19.2California 22.2 15.0 28.5 18.7Wisconsin 15.2 10.5 20.0 13.7Illinois 13.4 9.9 18.6 13.3USA 15.9 10.2 20.9 13.2Texas 16.6 9.9 23.2 13.1Michigan 13.9 8.8 16.8 10.9Minnesota 13.4 8.1 16.4 10.6Pennsylvania 12.4 8.3 14.9 10.1Ohio 11.3 7.1 15.2 9.4Indiana 11.9 6.0 15.5 7.7Kentucky 10.6 5.5 15.5 7.7Iowa 6.9 4.9 10.0 6.6
Variations in AP access are considerable, which has impelled both national and Illinois state administrators to devise incentives for increasing the number of AP offerings and the number of students choosing AP courses. The Illinois students who sat for an AP exam in 2004 were disproportionately white (87%) or Asian (16%). Black students who comprise 21% of the Illinois public school population comprised only 2% of those taking an AP exam; likewise, the Hispanic population was under represented (17% of total population versus 4% of AP test takers).123
CHAPTER IV
Illinois STEM Education Report 61
June 2006 © Northern Illinois University www.keepingillinoiscompetitive.niu.edu
College Remediation RatesColleges and universities assess entering students’ academic preparation through a variety of assessments, including transcript analyses and placement tests. Colleges using transcript analysis look at courses taken and the grades received. There is growing evidence that grades are one of the strongest predictors of college success.124
Research on remediation rates is confounded because readiness standards differ greatly both within a college and between colleges. Nationally, “between 28% and 40% of first-time freshmen in four-year public institutions, and between 42% and 63% of first-time freshmen in two-year public institutions, enroll in at least one remedial course.125
According to college faculty across the nation, 20% of the entering freshmen are “not well-prepared” and 32% are “somewhat well-prepared” in science. For mathematics, nearly one-third of the students were rated by college faculty as “not very well-prepared” and another third were described as “somewhat well-prepared”.126
The bottom line is that large numbers of students are entering college in need of remediation. In fact, in 2005, a total of 83,585 Illinois public community college students enrolled in remedial courses in mathematics.127 The need for remediation decreases the chances the student will graduate. A national study found that 75% of students not needing remediation will graduate; however, only 46% of students needing one or two remedial mathematics courses will graduate.128 If this holds true, over 45,000 Illinois community college students enrolled in remedial mathematics courses will not persist to graduation. In addition, the true number of students needing remediation is not known. Some students decide not to enroll in college after taking the placement tests, and others downgrade their ambitions to certificates not requiring college-level preparation.
In summary, there is great variation in the college readiness of graduating seniors in Illinois, and the students least prepared are mostly from low-income populations. Even though a rigorous high school curriculum helps prepare students for college, completing a college-prep core of courses does not guarantee the student is college ready. The differential effect of the college-prep core appears to indicate variation in the level of expectations and quality of instruction within and among schools. There are many costs to under preparedness— students need remediation at the college level or they may decide not to pursue further education.
READINESS FOR COLLEGE AND WORK
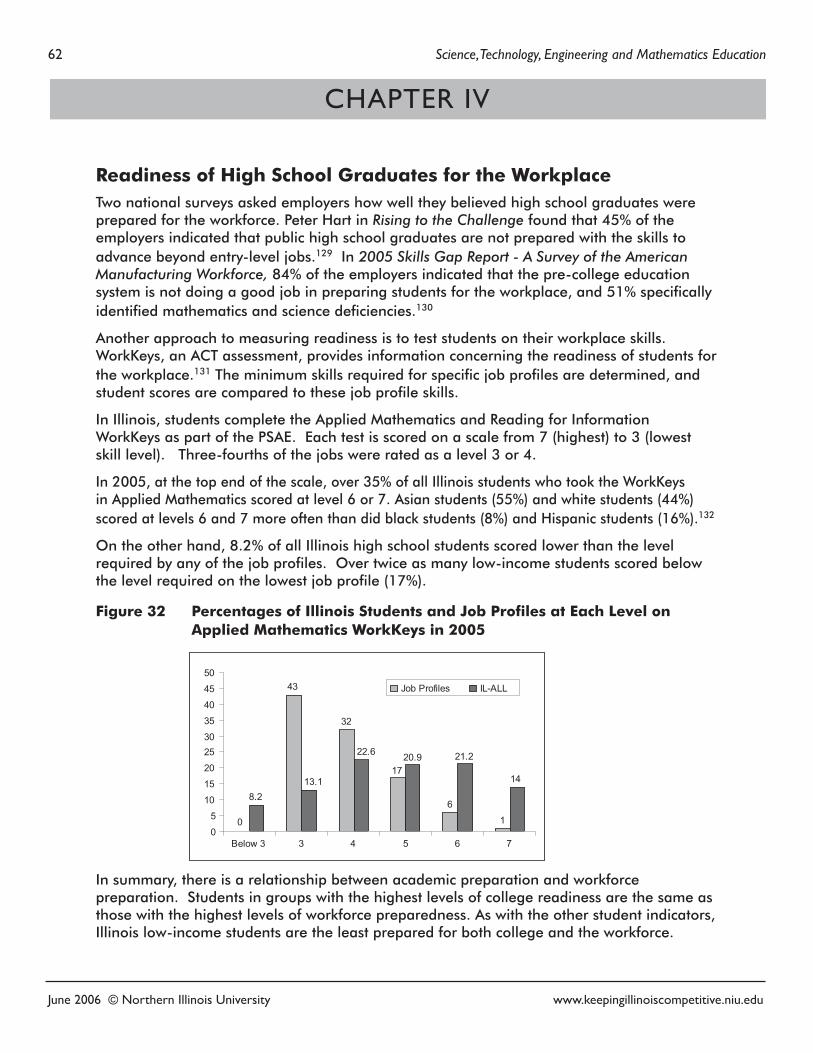
62 Science, Technology, Engineering and Mathematics Education
June 2006 © Northern Illinois University www.keepingillinoiscompetitive.niu.edu
Readiness of High School Graduates for the WorkplaceTwo national surveys asked employers how well they believed high school graduates were prepared for the workforce. Peter Hart in Rising to the Challenge found that 45% of the employers indicated that public high school graduates are not prepared with the skills to advance beyond entry-level jobs.129 In 2005 Skills Gap Report - A Survey of the American Manufacturing Workforce, 84% of the employers indicated that the pre-college education system is not doing a good job in preparing students for the workplace, and 51% specifically identified mathematics and science deficiencies.130
Another approach to measuring readiness is to test students on their workplace skills. WorkKeys, an ACT assessment, provides information concerning the readiness of students for the workplace.131 The minimum skills required for specific job profiles are determined, and student scores are compared to these job profile skills.
In Illinois, students complete the Applied Mathematics and Reading for Information WorkKeys as part of the PSAE. Each test is scored on a scale from 7 (highest) to 3 (lowest skill level). Three-fourths of the jobs were rated as a level 3 or 4.
In 2005, at the top end of the scale, over 35% of all Illinois students who took the WorkKeys in Applied Mathematics scored at level 6 or 7. Asian students (55%) and white students (44%) scored at levels 6 and 7 more often than did black students (8%) and Hispanic students (16%).132
On the other hand, 8.2% of all Illinois high school students scored lower than the level required by any of the job profiles. Over twice as many low-income students scored below the level required on the lowest job profile (17%).
Figure 32 Percentages of Illinois Students and Job Profiles at Each Level on Applied Mathematics WorkKeys in 2005
In summary, there is a relationship between academic preparation and workforce preparation. Students in groups with the highest levels of college readiness are the same as those with the highest levels of workforce preparedness. As with the other student indicators, Illinois low-income students are the least prepared for both college and the workforce.
0
43
32
17
6
1
8.213.1
22.6 20.9 21.2
14
0
5
10
15
20
2530
35
40
45
50
Below 3 3 4 5 6 7
Job Profiles IL-ALL
CHAPTER IV
June 2006 © Northern Illinois University www.keepingillinoiscompetitive.niu.edu
Illinois STEM Education Report 63
Chapter SummaryKeeping Illinois competitive requires students to graduate from high school with the skills and knowledge needed to succeed in postsecondary education and/or work. Whether the indicator is high school completion rates, readiness for college, or readiness for work, Illinois students who are low-income, black, and/or Hispanic do not fare as well as their white and Asian peers.
The high school completion rates appear to be increasing in Illinois; however, only 70-75% of all of the 9th grade students will complete high school. This percentage is even lower for low-income students, especially the males. In fact, fewer than 50% of the black and Hispanic male students will graduate.
Graduating from high school does not guarantee the student will be prepared for college: only 35-40% of Illinois high school graduates are ready for college-level work according to ACT data. Again, there are disparities among students based on income and ethnicity. Around 65% of the highest-income students are the “most ready” for college, compared to only 20% of the lowest-income students. Less than 11% of the black students and less than 17% of the Hispanic students are prepared for college, compared to 55% of the Asian students and 48% of the white students.
There were great disparities among the percentages of students who completed the ACT Core Curriculum—about 61% of the Asian students, about half of the white students, but only 39% of the Hispanic students and 37.5% of the black students. Completing the core did not guarantee the student was prepared for college.
Illinois students’ performance on the AP tests and the ACT WorkKeys illustrate the two ends of the performance continuum in Illinois. At the top end, Illinois has some of the best students in the nation. For example, Illinois students who sit for Advanced Placement exams do extremely well—71.5% received a college-ready grade compared to only 63% nationally. At the other end of the continuum, 80% of the low-income students were not prepared to succeed in college, and 17% were not qualified for any of the jobs profiled on the ACT WorkKeys.
It is critical that Illinois address the disparity issues tied to low income and ethnicity as a secondary factor. In addition, the knowledge and skills of the high school graduate needs to be better aligned with the skills and knowledge needed to succeed in college and the workplace. Requirements for graduating from high school vary markedly from college and workplace expectations.
Graduating from high school does not guarantee the student will be prepared for college: only 35-40% of Illinois high school graduates are ready for college-level work according to ACT data.
READINESS FOR COLLEGE AND WORK
64 Science, Technology, Engineering and Mathematics Education
June 2006 © Northern Illinois University www.keepingillinoiscompetitive.niu.edu
COLLEGE PARTICIPATION AND COMPLETION Keeping Illinois competitive requires increasing the number of students who enter and complete college programs, especially programs leading to STEM degrees. From 1975 to 1999, the United States went from 3rd to 14th in terms of the number of students completing national science and engineering degrees among 19 nations.133 Even though some countries apparently included less than 4-year degrees in their reporting, the conclusion remains that the U.S. is struggling to compete globally in graduating students in STEM majors. It is not surprising that leading companies represented by the Business Roundtable set the goal of doubling the number of U.S. science, technology, engineering, and mathematics graduates with bachelor’s degrees by 2015.134
If the U.S. is to reach this goal, students must gain the requisite knowledge and skills needed for a STEM major as they move through the education pipeline. As discussed in Chapter III, the mathematics and science skills of Illinois students are not reaching this level, especially in high school. In addition, students need to complete high school, enroll in college, and complete college. As discussed in Chapter IV, significant numbers of Illinois students are not completing high school, and when they do, many are not prepared for college-level work. This chapter looks at what happens at college in terms of the education pipeline and students in STEM majors
The Education Pipeline One approach to measuring college completion rates is to look at the pipeline of students who complete high school, enroll in college, and complete an associate’s or a bachelor’s degree. Without a national student tracking system, such as the one proposed in the Data Quality Campaign sponsored by the National Governors Association and other organizations,135 assessing the pipeline of students from high school through college is very difficult. One problem is that existing data in the pipeline model underestimates students by counting the following as dropouts: students who take more than four years to complete high school, change high schools, obtain a GED, attend multiple colleges, enter college later than directly from high school, drop out of college but later return, or enroll in college part time. These students constitute a significant percentage of the student population. Put simply, existing data collection methods rarely account for the multiple pathways that students follow as they progress through high school and college. Clifford Adelman in The Toolbox Revisited (2006) presented a new approach by tracking students’ 8.5 years. At this time, comparative data is not available for Illinois.
CHAPTER V
Of 100 Illinois high school seniors, 57 will go immediately to college, and 33 will complete a 4-year degree within 6 years.
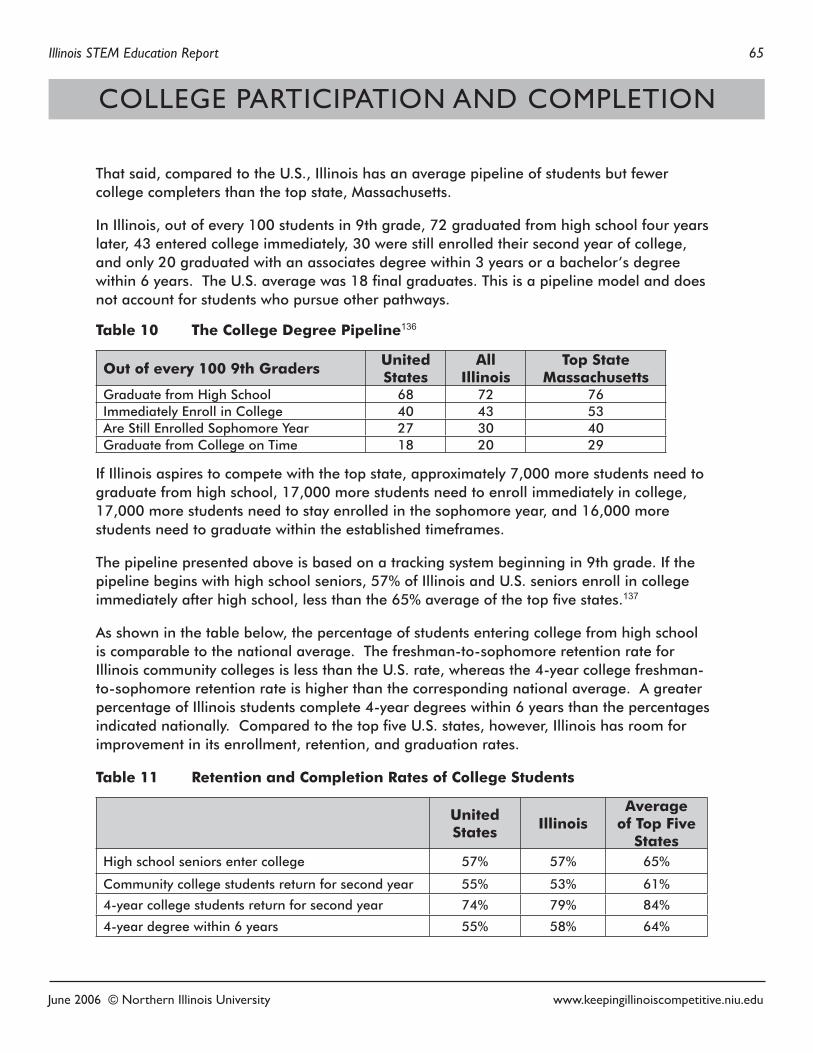
Illinois STEM Education Report 65
June 2006 © Northern Illinois University www.keepingillinoiscompetitive.niu.edu
That said, compared to the U.S., Illinois has an average pipeline of students but fewer college completers than the top state, Massachusetts.
In Illinois, out of every 100 students in 9th grade, 72 graduated from high school four years later, 43 entered college immediately, 30 were still enrolled their second year of college, and only 20 graduated with an associates degree within 3 years or a bachelor’s degree within 6 years. The U.S. average was 18 final graduates. This is a pipeline model and does not account for students who pursue other pathways.
Table 10 The College Degree Pipeline136
Out of every 100 9th Graders United States
AllIllinois
Top StateMassachusetts
Graduate from High School 68 72 76Immediately Enroll in College 40 43 53Are Still Enrolled Sophomore Year 27 30 40Graduate from College on Time 18 20 29
If Illinois aspires to compete with the top state, approximately 7,000 more students need to graduate from high school, 17,000 more students need to enroll immediately in college, 17,000 more students need to stay enrolled in the sophomore year, and 16,000 more students need to graduate within the established timeframes.
The pipeline presented above is based on a tracking system beginning in 9th grade. If the pipeline begins with high school seniors, 57% of Illinois and U.S. seniors enroll in college immediately after high school, less than the 65% average of the top five states.137
As shown in the table below, the percentage of students entering college from high school is comparable to the national average. The freshman-to-sophomore retention rate for Illinois community colleges is less than the U.S. rate, whereas the 4-year college freshman-to-sophomore retention rate is higher than the corresponding national average. A greater percentage of Illinois students complete 4-year degrees within 6 years than the percentages indicated nationally. Compared to the top five U.S. states, however, Illinois has room for improvement in its enrollment, retention, and graduation rates.
Table 11 Retention and Completion Rates of College Students
United States Illinois
Average of Top Five
StatesHigh school seniors enter college 57% 57% 65%
Community college students return for second year 55% 53% 61%
4-year college students return for second year 74% 79% 84%
4-year degree within 6 years 55% 58% 64%
COLLEGE PARTICIPATION AND COMPLETION
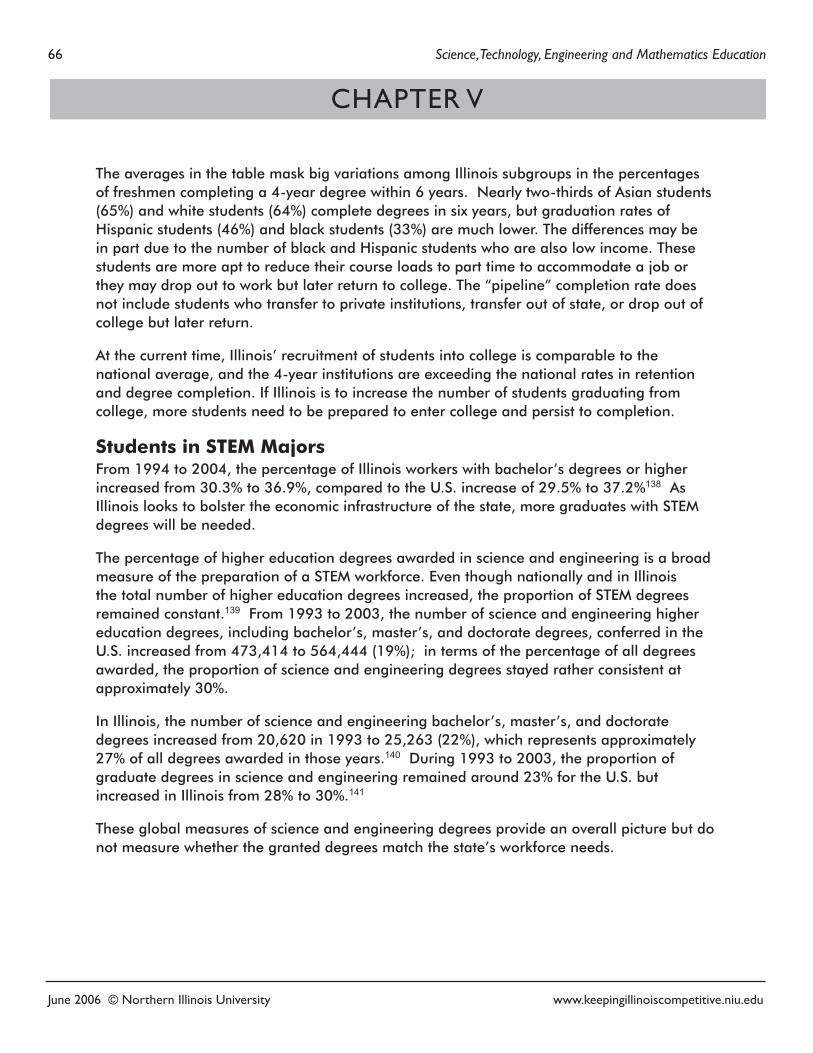
66 Science, Technology, Engineering and Mathematics Education
June 2006 © Northern Illinois University www.keepingillinoiscompetitive.niu.edu
The averages in the table mask big variations among Illinois subgroups in the percentages of freshmen completing a 4-year degree within 6 years. Nearly two-thirds of Asian students (65%) and white students (64%) complete degrees in six years, but graduation rates of Hispanic students (46%) and black students (33%) are much lower. The differences may be in part due to the number of black and Hispanic students who are also low income. These students are more apt to reduce their course loads to part time to accommodate a job or they may drop out to work but later return to college. The “pipeline” completion rate does not include students who transfer to private institutions, transfer out of state, or drop out of college but later return.
At the current time, Illinois’ recruitment of students into college is comparable to the national average, and the 4-year institutions are exceeding the national rates in retention and degree completion. If Illinois is to increase the number of students graduating from college, more students need to be prepared to enter college and persist to completion.
Students in STEM MajorsFrom 1994 to 2004, the percentage of Illinois workers with bachelor’s degrees or higher increased from 30.3% to 36.9%, compared to the U.S. increase of 29.5% to 37.2%138 As Illinois looks to bolster the economic infrastructure of the state, more graduates with STEM degrees will be needed.
The percentage of higher education degrees awarded in science and engineering is a broad measure of the preparation of a STEM workforce. Even though nationally and in Illinois the total number of higher education degrees increased, the proportion of STEM degrees remained constant.139 From 1993 to 2003, the number of science and engineering higher education degrees, including bachelor’s, master’s, and doctorate degrees, conferred in the U.S. increased from 473,414 to 564,444 (19%); in terms of the percentage of all degrees awarded, the proportion of science and engineering degrees stayed rather consistent at approximately 30%.
In Illinois, the number of science and engineering bachelor’s, master’s, and doctorate degrees increased from 20,620 in 1993 to 25,263 (22%), which represents approximately 27% of all degrees awarded in those years.140 During 1993 to 2003, the proportion of graduate degrees in science and engineering remained around 23% for the U.S. but increased in Illinois from 28% to 30%.141
These global measures of science and engineering degrees provide an overall picture but do not measure whether the granted degrees match the state’s workforce needs.
CHAPTER V
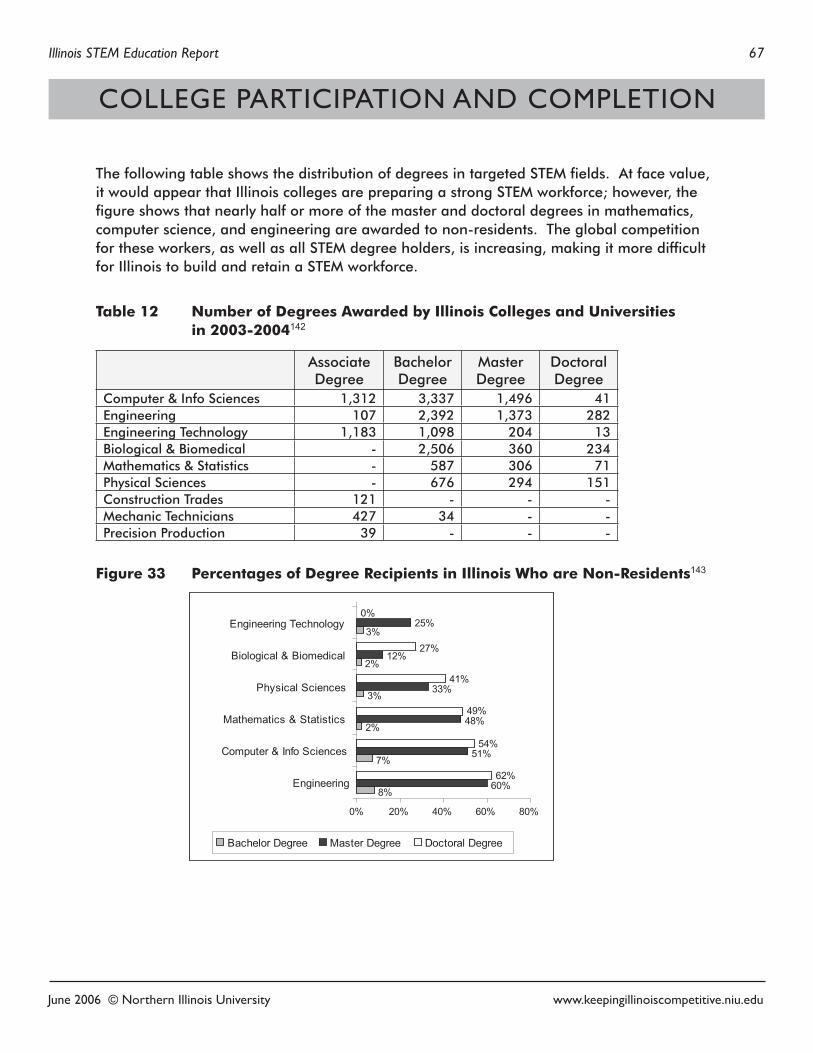
Illinois STEM Education Report 67
June 2006 © Northern Illinois University www.keepingillinoiscompetitive.niu.edu
The following table shows the distribution of degrees in targeted STEM fields. At face value, it would appear that Illinois colleges are preparing a strong STEM workforce; however, the figure shows that nearly half or more of the master and doctoral degrees in mathematics, computer science, and engineering are awarded to non-residents. The global competition for these workers, as well as all STEM degree holders, is increasing, making it more difficult for Illinois to build and retain a STEM workforce.
Table 12 Number of Degrees Awarded by Illinois Colleges and Universities in 2003-2004142
AssociateDegree
Bachelor Degree
Master Degree
Doctoral Degree
Computer & Info Sciences 1,312 3,337 1,496 41Engineering 107 2,392 1,373 282Engineering Technology 1,183 1,098 204 13Biological & Biomedical - 2,506 360 234Mathematics & Statistics - 587 306 71Physical Sciences - 676 294 151Construction Trades 121 - - -Mechanic Technicians 427 34 - -Precision Production 39 - - -
Figure 33 Percentages of Degree Recipients in Illinois Who are Non-Residents143
COLLEGE PARTICIPATION AND COMPLETION
8%
7%
2%
3%
2%
3%
60%
51%
48%
33%
12%
25%
62%
54%
49%
41%
27%
0%
0% 20% 40% 60% 80%
Engineering
Computer & Info Sciences
Mathematics & Statistics
Physical Sciences
Biological & Biomedical
Engineering Technology
Bachelor Degree Master Degree Doctoral Degree
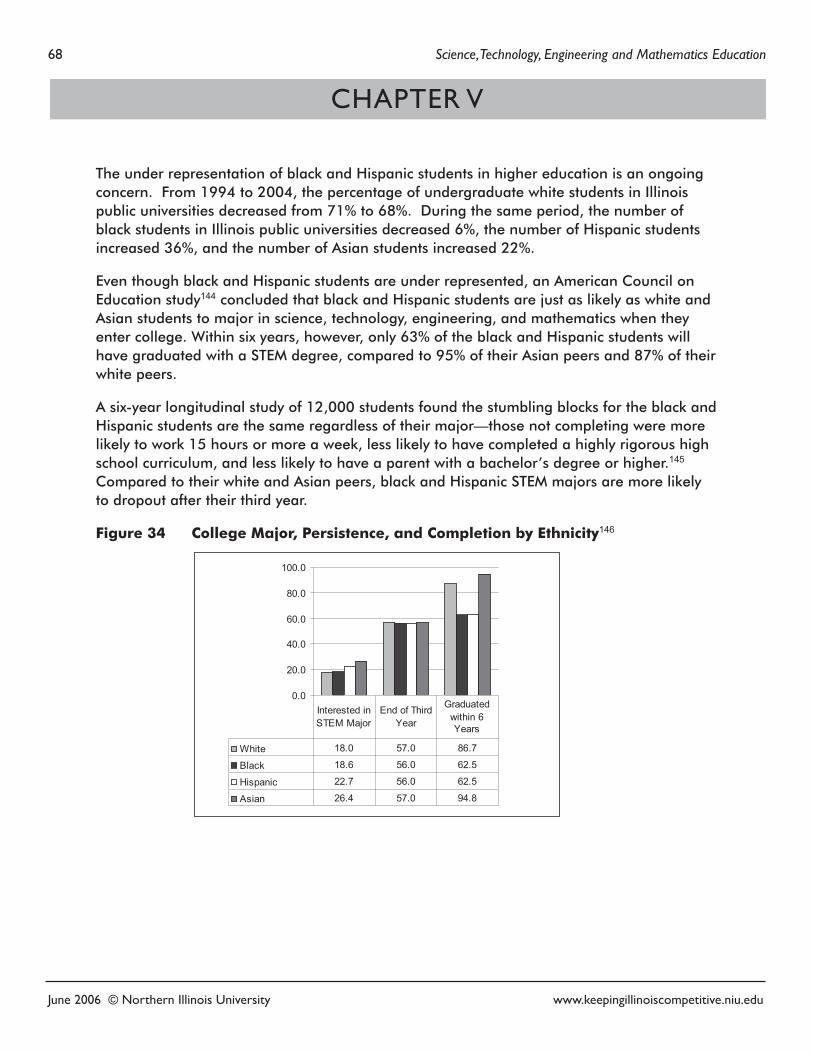
68 Science, Technology, Engineering and Mathematics Education
June 2006 © Northern Illinois University www.keepingillinoiscompetitive.niu.edu
The under representation of black and Hispanic students in higher education is an ongoing concern. From 1994 to 2004, the percentage of undergraduate white students in Illinois public universities decreased from 71% to 68%. During the same period, the number of black students in Illinois public universities decreased 6%, the number of Hispanic students increased 36%, and the number of Asian students increased 22%.
Even though black and Hispanic students are under represented, an American Council on Education study144 concluded that black and Hispanic students are just as likely as white and Asian students to major in science, technology, engineering, and mathematics when they enter college. Within six years, however, only 63% of the black and Hispanic students will have graduated with a STEM degree, compared to 95% of their Asian peers and 87% of their white peers.
A six-year longitudinal study of 12,000 students found the stumbling blocks for the black and Hispanic students are the same regardless of their major—those not completing were more likely to work 15 hours or more a week, less likely to have completed a highly rigorous high school curriculum, and less likely to have a parent with a bachelor’s degree or higher.145 Compared to their white and Asian peers, black and Hispanic STEM majors are more likely to dropout after their third year.
Figure 34 College Major, Persistence, and Completion by Ethnicity146
0.0
20.0
40.0
60.0
80.0
100.0
White 18.0 57.0 86.7
Black 18.6 56.0 62.5
Hispanic 22.7 56.0 62.5
Asian 26.4 57.0 94.8
Interested in STEM Major
End of Third Year
Graduated within 6 Years
CHAPTER V
June 2006 © Northern Illinois University www.keepingillinoiscompetitive.niu.edu
Illinois STEM Education Report 69
Chapter Summary Keeping Illinois competitive requires a highly-skilled STEM workforce with higher levels of education. The enrollment rate of Illinois high school graduates entering directly into college is 57%, the same as for the U.S. Over the next 6 years, slightly more Illinois students (58%) will complete 4-year degrees than found nationally (55%).
In 2004, Illinois colleges and universities granted over 10,000 bachelor and higher degrees in computer and information science, engineering, and mathematics. Over half of the master and doctoral degrees were granted to non-residents. Although data is not yet available, contemporary anecdotal evidence suggests that the non-resident graduate students are more likely than formerly to look for jobs in their home countries as economic opportunities increase, especially in India and China.
From 1994 to 2004, the number of students in Illinois colleges and universities increased with a significant increase in the Hispanic population and a decrease in the black population. Even though the proportion of black and Hispanic students who select a STEM major is similar to their white and Asian peers, fewer complete degrees within six years. The black and Hispanic students, compared to their white and Asian peers, have a high dropout rate after the third year of college. The factors linked to not completing degrees are often related to the low-income status of many of the black and Hispanic students: inadequate preparation because of less rigorous high school curricula, parents without college degrees, and a need to work to support themselves and their families.
The challenges for Illinois are to find ways to overcome the barriers faced by low-income students and prevent a brain drain of the STEM workers.
COLLEGE PARTICIPATION AND COMPLETION
Only slightly more than one-fourth of all college degrees awarded in Illinois is in a STEM field.
Over 60% of the graduate engineering degrees and half of the computer science and mathematics degrees are earned by non-residents.
June 2006 © Northern Illinois University www.keepingillinoiscompetitive.niu.edu
70 Science, Technology, Engineering and Mathematics Education
ALIGNING STEM EDUCATION TO 21st
CENTURY KNOWLEDGE AND SKILLS
The preceding section looked at the traditional metrics of measuring student achievement such as academic performance, graduation rates, and matriculation into college. According to the Partnership for 21st Century Schools, “Even if every student in the country satisfied traditional metrics, they still would remain woefully under-prepared for 21st Century success beyond high school.”147 As described in Chapter II, workers and citizens in the 21st Century need to be proficient in the traditional core subjects as well possess higher-level thinking skills, interpersonal skills, various meta-cognitive skills related to learning how to learn, employability skills, and technology skills.
Keeping Illinois competitive requires that high school and postsecondary instructional programs prepare students for 21st Century jobs.
Chapter VI examines the current alignment of curricula, state assessments, and secondary and postsecondary instruction to the 21st Century needs of business and industry in Illinois. An underlying assumption is that the updated core of 21st Century knowledge and skills for Illinois are similar to those identified by national projects such as the American Diploma Project and Standards for Success.
June 2006 © Northern Illinois University www.keepingillinoiscompetitive.niu.edu
Illinois STEM Education Report 71
STANDARDS, ASSESSMENT, AND INSTRUCTIONState standards, instructional methods, and high school graduation requirements should reflect the 21st Century knowledge and skills students need to be ready for college and the workplace. Given this focus, this chapter examines
• Illinois Learning Standards and state assessments
• Instructional approaches to engage students
• Alignment of high school requirements to college and workplace readiness
• Alignment of STEM education to Illinois’ economic development
Illinois Learning Standards and State Assessments The Illinois Learning Standards148 provide the framework for K-12 education by outlining the essential knowledge and skills students need to learn. The state assessments measure the degree to which students are progressing in meeting the standards. Taken together, the state standards and assessments are seminal factors in determining the quality of pre-college STEM education in Illinois.
Seven learning areas are detailed in the Illinois standards: English language arts, mathematics, science, social science, physical development and health, fine arts, and foreign languages. For each area, specific standards are given for early elementary, late elementary, middle/junior high school, early high school, and late high school levels.
Illinois’ standards are considered to be above average by several rating studies. The State of State Science Standards 2005,149 produced by the Fordham Foundation, gave Illinois a rating of B, the same rating it received in 2000. Nineteen states received either an A or B rating in 2005. Fordham reviewers attributed the high grade to the more detailed expectations indicated by “Performance Indicators” created by the Illinois State Board of Education and Illinois teachers. To increase its rating, Illinois needs to improve the “science content and instructional approach” of the science standards.
The State of State Math Standards 2005150 graded Illinois standards as a C, higher than the D received in 1998 and 2000. To put this grade in perspective, the U.S. average was a high D, and only 6 states received a rating of A or B. The Fordham grades of mathematics standards are based on controversial assumptions, as national debates on mathematics content continue.
VI. STANDARDS, ASSESSMENT, AND INSTRUCTION
The Illinois Learning Standards, including its “Applications of Learning” and the workforce and career competencies, represent the knowledge and skills needed by students in the 21st Century.
72 Science, Technology, Engineering and Mathematics Education
June 2006 © Northern Illinois University www.keepingillinoiscompetitive.niu.edu
In addition to the student goals by level in school, each of the seven subject areas of the Illinois Learning Standards contains a section called “Applications for Learning,” which describes how students should apply the knowledge and skills in solving problems, communicating, using technology, working on teams, and making connections with other learning areas. (See Appendix A for more information on the Applications for Learning.)
As described in Chapter II, these “Applications of Learning” are similar in approach to that expounded by the Partnership for 21st Century Schools; e.g., the integration of content areas, the application of knowledge and skills in new ways, and the importance placed on interpersonal skills and communication. In Illinois there are no specific student indicators for the “Applications of Learning,” only general descriptions of the intended student outcomes for the subject area as a whole are given.
Are the standards aligned with workplace expectations? The Illinois standards development team recognized this need and included business and industry representatives on the group who drafted the standards. According to Harry Litchfield, co-chair of the standards project team and then an executive at Deere and Company, they were supportive of the process and product.151 They were instrumental in drafting the appendix of the Illinois Learning Standards which aligns the learning standards in each content area to a list of workplace skills and career development competencies (Appendix A). This appendix has been used extensively by educators in career and technical education to raise the level of rigor in their courses.
There is a growing national consensus that the 21st Century basic core is different than the traditional core, as discussed in Chapter II. Since content from Algebra II is included on the PSAE, the Illinois mathematics standards may be close to the 21st Century basic core. Nevertheless, neither science nor mathematics standards have been analyzed for their relationship to 21st Century expectations exemplified in the work of the American Diploma Project and the AAU/Pew “Standards for Success.”
Furthermore, rapid technological change and the blurring of the traditional disciplines require state-level processes to regularly critique and update the learning standards and assessments. For example, the Illinois Survey of Critical Technologies identified cutting-edge topics important for STEM education; e.g. artificial intelligence, alternative fuels, green technology, and fuel cells that cross traditional departmental lines.152 According to an Illinois State Board of Education science consultant, “There are so many new and important areas of knowledge, but Illinois lacks a system for deciding when new concepts should be added and where to focus scarce training resources.”153
Even when the standards are aligned to the 21st Century basic core, as they obviously are in high-performing districts, curricula based on the standards must be enacted; that is, classroom instruction must reflect the standards. Several Illinois schools have addressed the alignment of instruction to the Illinois standards as part of their Comprehensive School Reform projects,154 their Mathematics and Science Partnership grants, or their
CHAPTER VI
Illinois STEM Education Report 73
June 2006 © Northern Illinois University www.keepingillinoiscompetitive.niu.edu
school improvement planning. Currently, a pilot project is using the Surveys of Enacted Curriculum155 to determine the usefulness of that tool in assessing the alignment of classroom instruction to the Illinois Learning Standards in mathematics, science, and career and technical education.
Because “what is tested” is often “what is taught,” it is important to align state assessments with the most important knowledge and skills. The “Applications of Learning” and the list of workplace skills and career development competencies are not reflected in the state assessments except for the use of WorkKeys as part of the 11th grade assessment. Since state assessments are developed years in advance of actual administration, the critical technologies that will drive the Illinois economy for the future do not appear on the PSAE. If any of the “Applications of Learning” are to be assessed, local districts must take the initiative.
Instructional Approaches to Engage StudentsBeyond alignment studies and the assessments that tend to direct instruction, practical applications of knowledge, such as those encouraged by the Applications of Learning, can help to engage students in learning science and mathematics. A common sense approach, perhaps, but one supported by research. In the last few decades, much has been learned on how we learn and the impact of different pedagogies on learning.156 Unfortunately, it appears the research has not been widely implemented:
• The Bayer Survey of parents of under-represented students indicated that one of the challenges for their students is that science classes are boring or uninteresting (58% daughters, 51% sons).157
• The Gates foundation found 88% of high school dropouts have passing grades and many dropouts list “boredom” as the reason for leaving school.
In the past ten years, national studies focused on how to improve STEM education and have offered recommendations ranging from a total reorganization of the educational system to less comprehensive approaches such as changing how mathematics and science content is taught. Some, such as Bill Gates, have argued for a new concept of high school:
When we looked at the millions of students our high schools are not preparing for higher education—we look at the damaging impact that has on their lives —we came to a painful conclusion: America’s high schools are obsolete…By obsolete, I don’t just mean that our high schools are broken, flawed, and under-funded—though a case could be made for every one of those points. By obsolete, I mean that our high schools—even when they’re working exactly as designed—cannot teach our kids what they need to know today. Training the workforce of tomorrow with the high schools of today is like trying to teach kids about tomorrow’s computers on a 50-year-old mainframe. It’s the wrong tool for the times.158
STANDARDS, ASSESSMENT, AND INSTRUCTION
74 Science, Technology, Engineering and Mathematics Education
June 2006 © Northern Illinois University www.keepingillinoiscompetitive.niu.edu
Although a full study of instructional alternatives is beyond the scope of this paper, several basic themes recur frequently in analyses of mathematics and science instruction at both school and college levels:
• Increased use of relevant, practical, application-based approaches
• Integration of content across disciplines from the early grades
• A focus on depth of learning and thinking as opposed to rote memorization
For example, college students have limited opportunities to participate in authentic situations they might encounter in the workplace. Experiential learning projects are most likely to be found in colleges of business, engineering, and health sciences; and in homeland security courses. These projects may include cross-functional teams with students from engineering, marketing, financial investment, and psychology working together on a real-world task to identify what consumers need and to develop and market a product using “consumer to market” strategies. This teamwork exercise differs from a group project of like majors who may know and process information similarly. The experiential approach allows the college major to understand his role in the larger picture of an organization, hone teamwork skills, apply the abstract knowledge acquired in the classroom, and develop an understanding of the need for an interdisciplinary perspective. Authentic, experiential learning projects are also being used in some middle schools and high schools.
At the school level, another approach is the integration of mathematics and science with a focus on critical thinking beginning in the early grades. Such an approach is hands-on and accommodating to a wider range of student abilities.159 An integrated curriculum is being implemented in a small number of schools around the country.
A related instructional methodology is “problem-based learning.” The Illinois Math and Science Academy and some of the Illinois teacher preparation programs train teachers and preservice teachers to use “problem-based learning,” which emphasizes multi-disciplinary approaches to solving complex problems. They are part of national and international efforts to replace formulaic methods of teaching math and science with more engaging instructional activities.160
Research on high-scoring countries in international competitions shows that the instructional materials of these countries build deeper levels of understanding, whereas the pervasive U.S. approach is one more attuned to definitions and formulae.161 The U.S. approach is to show students an example of a problem which represents the material to be covered in the standards and then have the student do multiple problems of the same type. A perusal of Japanese instructional materials shows a focus on applying concepts, where problems build on previous ones, and students are encouraged to solve unrehearsed, dissimilar problems.162 Related research has shown that students given such challenging work in a highly varied curriculum are more successful on standardized tests than those who have undergone narrowly focused test prepping.163
CHAPTER VI
Illinois STEM Education Report 75
June 2006 © Northern Illinois University www.keepingillinoiscompetitive.niu.edu
Perhaps the U.S. Department of Education Secretary’s Summit on Science Education summarized the concerns with science education the best:164
• At all grade levels we try to teach too many disconnected concepts and less may be more.
• In current classrooms, many topics are covered superficially.
• There are too few student investigations of real and simulated systems.
• There is no systematic way to fundamentally change instructional practice in response to science advances.
• Science standards are a decade old and need to be revised to be based on a few core areas, incorporate current advances, and make better use of technology.
• Increase the number of qualified teachers for science and provide professional development, especially for those in urban and rural schools.
• Increase the use of better and more sophisticated online, simulation, and real-time data acquisition probeware.
In summary, Illinois Learning Standards present a traditional discipline-focused approach to student learning and the state assessments are aligned to these standards. Two sections of the standards—the “Applications of Learning” and an appendix on workplace skills and career competencies—provide a glimpse of the knowledge and skills needed by students in the 21st Century. At this time, the state assessments are not overtly aligned to these two sections of the standards, nor are there systematic processes in place to address new and emerging fields of study or to measure the alignment of classroom instruction to the standards.
Alignment of High School Requirements to College and Workplace ReadinessSeveral major national projects, such as the American Diploma Project and High Schools That Work, offer methods of improving high school education that promise to improve the level of STEM education performance. These projects are important, especially in light of data presented by the 2005 National Education Summit on High Schools: 40% of high school students say they are just going through motions and one-third did not try hard.165
On the other hand, no matter what the curricula is for high school or how rigorous the graduation requirements, if only slightly more than half of all 8th grade students are meeting the Illinois mathematics and science standards, they are not “high-school ready.” For high schools, the challenges seem conflicting – how can they remediate nearly half of the students while trying to make the high school curriculum more rigorous and aligned to the expectations of postsecondary institutions and the workplace?
STANDARDS, ASSESSMENT, AND INSTRUCTION
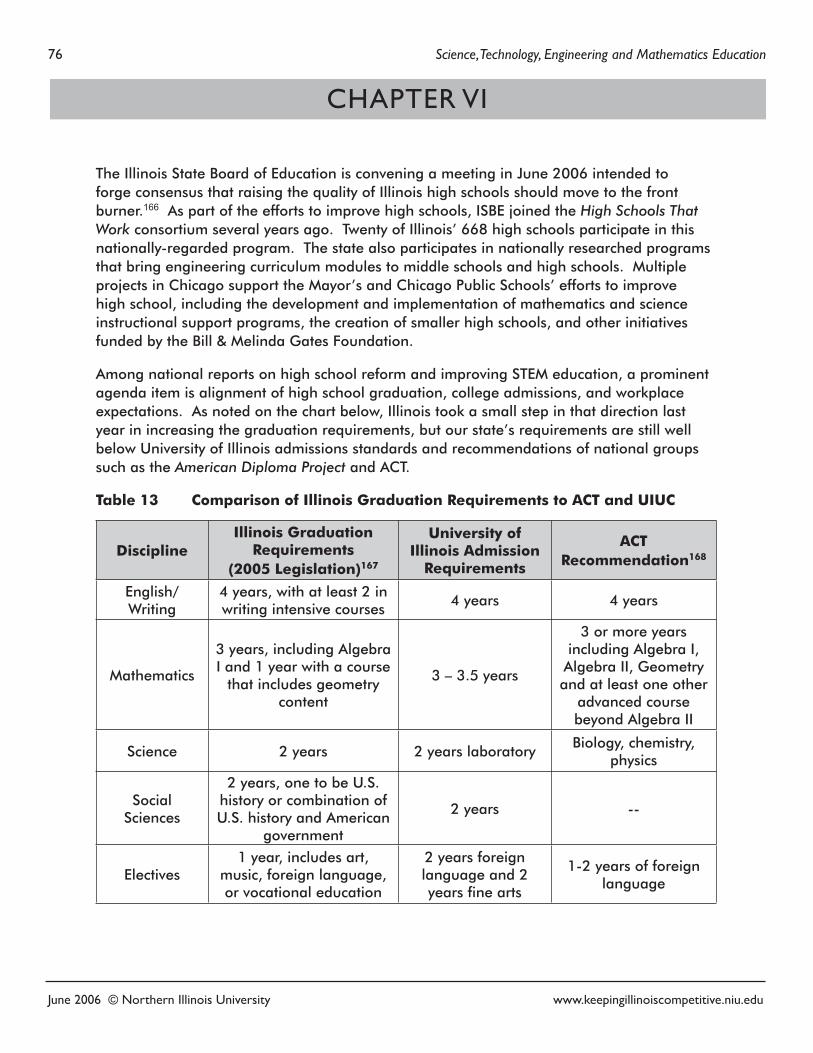
76 Science, Technology, Engineering and Mathematics Education
June 2006 © Northern Illinois University www.keepingillinoiscompetitive.niu.edu
The Illinois State Board of Education is convening a meeting in June 2006 intended to forge consensus that raising the quality of Illinois high schools should move to the front burner.166 As part of the efforts to improve high schools, ISBE joined the High Schools That Work consortium several years ago. Twenty of Illinois’ 668 high schools participate in this nationally-regarded program. The state also participates in nationally researched programs that bring engineering curriculum modules to middle schools and high schools. Multiple projects in Chicago support the Mayor’s and Chicago Public Schools’ efforts to improve high school, including the development and implementation of mathematics and science instructional support programs, the creation of smaller high schools, and other initiatives funded by the Bill & Melinda Gates Foundation.
Among national reports on high school reform and improving STEM education, a prominent agenda item is alignment of high school graduation, college admissions, and workplace expectations. As noted on the chart below, Illinois took a small step in that direction last year in increasing the graduation requirements, but our state’s requirements are still well below University of Illinois admissions standards and recommendations of national groups such as the American Diploma Project and ACT.
Table 13 Comparison of Illinois Graduation Requirements to ACT and UIUC
DisciplineIllinois Graduation
Requirements(2005 Legislation)167
University of Illinois Admission
Requirements
ACT Recommendation168
English/Writing
4 years, with at least 2 in writing intensive courses
4 years 4 years
Mathematics
3 years, including Algebra I and 1 year with a course
that includes geometry content
3 – 3.5 years
3 or more years including Algebra I,
Algebra II, Geometry and at least one other
advanced course beyond Algebra II
Science 2 years 2 years laboratoryBiology, chemistry,
physics
Social Sciences
2 years, one to be U.S. history or combination of U.S. history and American
government
2 years --
Electives1 year, includes art,
music, foreign language, or vocational education
2 years foreign language and 2 years fine arts
1-2 years of foreign language
CHAPTER VI
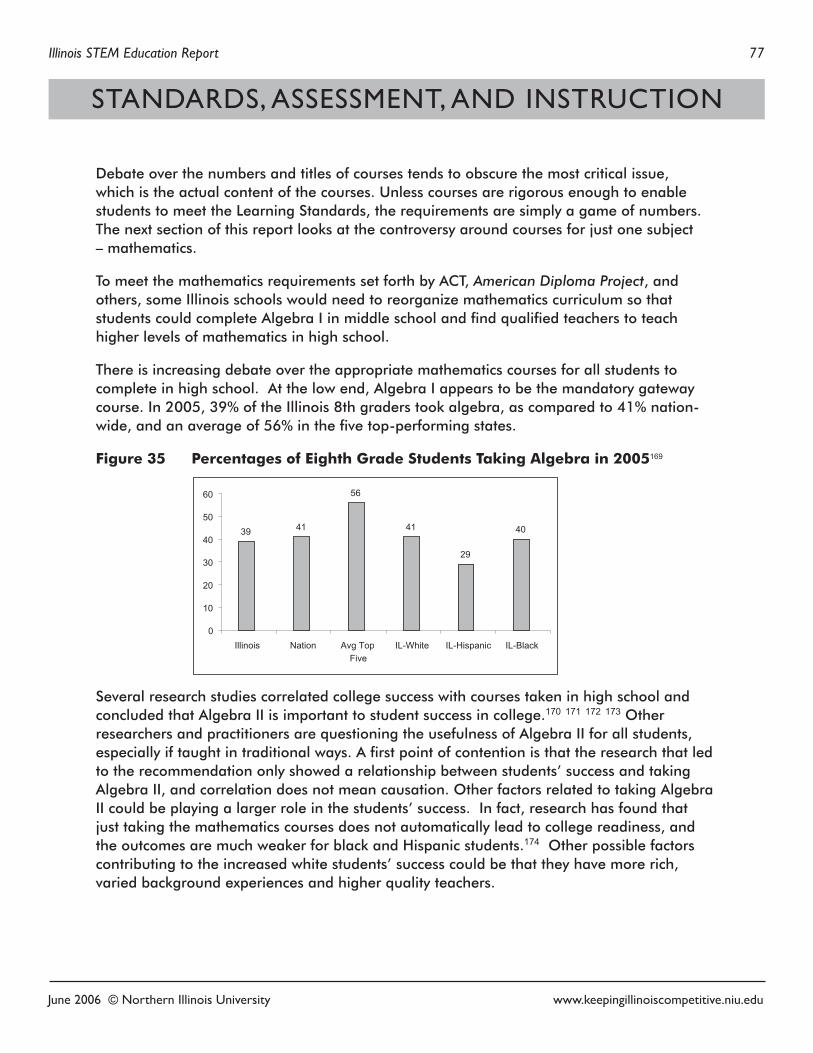
Illinois STEM Education Report 77
June 2006 © Northern Illinois University www.keepingillinoiscompetitive.niu.edu
Debate over the numbers and titles of courses tends to obscure the most critical issue, which is the actual content of the courses. Unless courses are rigorous enough to enable students to meet the Learning Standards, the requirements are simply a game of numbers. The next section of this report looks at the controversy around courses for just one subject – mathematics.
To meet the mathematics requirements set forth by ACT, American Diploma Project, and others, some Illinois schools would need to reorganize mathematics curriculum so that students could complete Algebra I in middle school and find qualified teachers to teach higher levels of mathematics in high school.
There is increasing debate over the appropriate mathematics courses for all students to complete in high school. At the low end, Algebra I appears to be the mandatory gateway course. In 2005, 39% of the Illinois 8th graders took algebra, as compared to 41% nation-wide, and an average of 56% in the five top-performing states.
Figure 35 Percentages of Eighth Grade Students Taking Algebra in 2005169
Several research studies correlated college success with courses taken in high school and concluded that Algebra II is important to student success in college.170 171 172 173 Other researchers and practitioners are questioning the usefulness of Algebra II for all students, especially if taught in traditional ways. A first point of contention is that the research that led to the recommendation only showed a relationship between students’ success and taking Algebra II, and correlation does not mean causation. Other factors related to taking Algebra II could be playing a larger role in the students’ success. In fact, research has found that just taking the mathematics courses does not automatically lead to college readiness, and the outcomes are much weaker for black and Hispanic students.174 Other possible factors contributing to the increased white students’ success could be that they have more rich, varied background experiences and higher quality teachers.
39 41
56
41
29
40
0
10
20
30
40
50
60
Illinois Nation Avg TopFive
IL-White IL-Hispanic IL-Black
STANDARDS, ASSESSMENT, AND INSTRUCTION
78 Science, Technology, Engineering and Mathematics Education
June 2006 © Northern Illinois University www.keepingillinoiscompetitive.niu.edu
A second point of contention is that “more of the same” of an old model is not the answer. Algebra II is the next step in the traditional sequence leading to calculus. Few occupations require a knowledge of calculus, but many do require other topics such as data analysis, statistics, discrete mathematics, and mathematical modeling. Some mathematics educators contend that rather than abstract mathematics, such as calculus, greater numbers of students need more applied mathematics such as statistics.175
In the same line of reasoning, there are advocates to less mathematical and more applied approaches to science, such as in Physics First. The traditional sequence of science courses is biology, chemistry, and physics. Physics First, as the name implies, would put physics in the high school curriculum first, because biology requires an understanding of chemistry which requires physics knowledge.176 Advocates of Physics First say that the course content is simpler than biology and can be learned by younger students. Opponents of alternative science models usually prefer the traditional, calculus-based, college prep curriculum now expected by higher education. The pervasiveness of the 19th and 20th Century college prep programs is evident in both the American Diploma Project and ACT’s new core.
As the debate continues between the traditional and pedagogical newer models and content, it will be important to ensure that graduation requirements meet the expectations of postsecondary institutions. For Illinois, aligning the state standards to college expectations is difficult because each institution of higher education has its own unique requirements, placement testing, and criteria for remediation. Other states such as “California, Kentucky, and Oklahoma have established ‘remediation-free’ standards to clarify what incoming students need to know to place into credit-bearing courses,…[and] Oregon has identified the level of knowledge and skills needed for college entry and aligned this with the state’s high school standards.”177
Illinois has some under-utilized mechanisms in place which could help with the alignment of high school, community college, and university standards. Public colleges and universities provide feedback reports to high schools on the success of students who matriculated to their institutions from the high school. Universities provide similar feedback information to community colleges. The Illinois Public Community College Act describes a college-ready background for students but it is not universally implemented. Perhaps a coordinated P-20 approach to improving high schools (and mathematics and science also) would initiate conversations between institutions that would put available tools to work.
In summary, Illinois raised high school graduation requirements in 2005, but not to a level expected by the state’s own public universities. High school reform faces a dual challenge of trying to remediate students while increasing the rigor of instruction. Further work is needed to ensure the level of rigor truly matches the expectations of colleges and the workplace.
CHAPTER VI
Illinois STEM Education Report 79
June 2006 © Northern Illinois University www.keepingillinoiscompetitive.niu.edu
Alignment of STEM Education to Illinois’ Economic DevelopmentChapter I pointed out some potential areas of concern for Illinois: the decline in the middle class, the need to create higher paying jobs, and a projected shortage of skilled workers in the future. If these predictions hold true, it will be important for the educational institutions to work closely with the business sector to create the skilled workforce needed for Illinois’ economic vitality. Currently, according to Illinois Community College Board standards, all public community college career and technical programs are required to have advisory councils. Many other programs in community colleges and universities have such committees, but there is little evidence to show the extent to which advisors influence curriculum content. Influence seems most likely in professional training and programs such as business, technology, engineering, and health sciences.
There are many indications that the alignment of educational expectations and business needs could be stronger. In Closing the Expectations Gap 2006, Illinois was reported as one of fifteen states that has not aligned high school requirements to college and workforce standards and has no current plans in place to do so.178 Only five states had completed the alignment process with the remaining states in progress.
Nearly one-third of the currently unemployed Illinois workers for whom their educational level is known, had some postsecondary education.179 In addition, increasing numbers of college graduates are under employed. Earning a postsecondary degree or certificate does not automatically lead to employment. Increasing numbers of graduates are finding that there is an over supply of potential workers with credentials similar to theirs or that the certificates or degrees they completed do not align with what employers are seeking.
Illinois is actively pursuing ways to alleviate the shortages in the healthcare workforce; however, bolstering the middle class may need more alignment of education and industry, especially for the skilled trades, manufacturing, engineering, and emerging technologies.
The challenge for Illinois, as for every state, is to align programs of study to result in
• Students completing with the skills needed by current business and industry
• Sufficient numbers of graduates to fill critical shortages
• Skilled workers to support the economic development initiatives of the state
STANDARDS, ASSESSMENT, AND INSTRUCTION
80 Science, Technology, Engineering and Mathematics Education
June 2006 © Northern Illinois University www.keepingillinoiscompetitive.niu.edu
Nationally, there has been a renewed interest in career and technical education programs and more internship and work-study programs:
The key to our nation’s success won’t come from channeling an indiscriminate mass of students along one track toward college, especially when we lose 30 percent of them along the way. It will come by combining demanding academics with other educational opportunities, and by creating a class of high school graduates who leave with skills to succeed both in a technical job and in the realm of higher education. It will come by graduating classes of students who have something invested in their own success, and who arrive in the world with a vision and the know-how to achieve it.” 180
State leaders in Kentucky believe that rigorous career/technical courses—ones that integrate academic skills and industry-developed end-of-program exams—have improved the academic achievement of students. Since the courses were redesigned, Kentucky’s career and technical students have improved more than other students on the state accountability test.181 Some states, following the Kentucky pattern, maintain multiple tracks, some headed for the workplace, some headed toward high education, and some preparing for both. Other states are attempting to integrate more career and technical education into traditional academic coursework. Regardless of the instructional approach, all students must complete a rigorous curriculum.
Whether students enter the workplace from high school or from postsecondary education, their individual instructional programs should be closely tied to the theoretical and practical knowledge and skills needed to be successful in the workforce. Emphasis on real world applications of curriculum content does not diminish the critical importance of mastery of core academic subjects. This is not about “dumbing down” traditional curriculum, as has been charged by the critics of Physics First. It does suggest a need for reevaluating curriculum content and establishing a balance appropriate for our times.
Chapter SummaryKeeping Illinois competitive requires the learning standards and graduation requirements to be aligned with the needs of the economic infrastructure of the state. Even though the traditional aspects of the Illinois Learning Standards have received above average national ratings, the “Applications of Learning” sections of the standards, which reflect the additional 21st Century skills and knowledge, and the alignment of the standards to workplace expectations are not assessed at the state level. Little is known about the extent to which the Applications are implemented in the classrooms. In fact, assessment of the Applications at the local level may be more appropriate and more practical.
CHAPTER VI
June 2006 © Northern Illinois University www.keepingillinoiscompetitive.niu.edu
Illinois STEM Education Report 81
National research on instructional practices advocates a rethinking of the traditional U.S. organization and delivery of instruction. The major focus at this time is on redesigning high schools to be more engaging for students; to use more authentic, problem-solving and hands-on approaches; and to be aligned with the expectations of postsecondary education and the workplace. Illinois has made some headway in addressing the high school problems, most notably with the Chicago initiatives and through isolated projects receiving Comprehensive School Reform grants and High Schools That Work.
For all levels of education, research indicates that cross-disciplinary approaches focused on deep levels of understanding and the opportunity to solve new problems result in higher levels of student academic performance. There are isolated projects across Illinois implementing this type of approach.
Illinois has several underutilized mechanisms in place that could be useful in aligning the standards and instructional programming across high school and postsecondary education and to the needs of business and industry. The current high school graduation requirements, which are comparatively low and are focused on “seat time” not alignment with standards, need to be the subject of ongoing discussion.
The success of graduation standards is necessarily tied to the ways in which instructional programming is structured. Nationally, there is a renewed interest in career and technical education as a way to provide multiple pathways for students to achieve the same rigorous preparation for postsecondary education and the workplace. At the college level, increased emphasis is being placed on ensuring the instructional programs provide students with practical, applied knowledge and skills as well as theoretical knowledge. These approaches require collaborative relationships among education, economic development, and business and industry professionals.
STANDARDS, ASSESSMENT, AND INSTRUCTION
No matter what the curricula is for high school or how rigorous the graduation requirements, if only slightly more than half of all 8th grade students are meeting the Illinois mathematics and science standards, they are not “high-school ready.”
82 Science, Technology, Engineering and Mathematics Education
June 2006 © Northern Illinois University www.keepingillinoiscompetitive.niu.edu
RESOURCES FOR STEM EDUCATION Keeping Illinois competitive requires that there is support for STEM education within the state. Essential elements of support include making parents aware of the need for their children to succeed in mathematics and science, providing qualified educators, providing financial aid to support promising students, and creating a rich environment for research activities.
This chapter includes sections on
• Student and parent awareness of the need for STEM education
• Preparation and professional development of educators
• Support for innovative research and development
Student and Parent Awareness of the Need for STEM EducationTo increase student achievement in all grades, parents and students need to value strong mathematics and science skills. Research indicates there is a need for greater awareness of the importance of STEM Education:
• On a Bayer Facts of Science Survey in 2003, nearly 90% of the general public felt the low international mathematics and science ratings of the U.S. students could negatively affect the U.S. security and economy.182 On the other hand, Reality Check 2006: Are American Parents and Students Ready for More Math and Science reported that 57% of the parents say the amount of current mathematics and science their child studies is about right.183
• A national survey of parents concluded that even though attitudes and interest in mathematics—particularly among minority students—have increased, “half of all students still plan to take mathematics only as long as they are required to do so.”184
• In a national survey, nearly two-thirds of the college students and over three-fourths of the non-college students surveyed reported they would have worked harder and taken more rigorous courses in high school if they knew then what they know now.185
• The Bayer Facts of Science Survey XI - 2005 asked parents of under-represented students about their children and science and engineering. Over 95% of the parents are confident that their children have the ability to succeed in science and engineering careers and see these careers valuable for their child. At the same time, 88% of the parents indicated that the science and engineering communities need to do a better job of telling today’s students about these job opportunities and providing role models or mentors for their children (56% daughters, 45% sons).186
CHAPTER VII
Essential elements of support include making parents aware of the need for their children to succeed in mathematics and science, providing qualified educators, providing financial aid to support promising students, and creating a rich environment for research activities.
Illinois STEM Education Report 83
June 2006 © Northern Illinois University www.keepingillinoiscompetitive.niu.edu
• An ACT study found that over 90% of all surveyed students indicated that their mother or other female guardian was helpful in selecting their high school courses, whereas tenth-grade students reported that about 70% of their counselors were helpful.187
• Success in STEM college programs is related to the courses completed in high school,188 which in turn is highly related to courses taken in middlle school.
Whether students are relying more on their mothers or their guidance counselors, data supplied by ACT makes clear that students are not choosing enough of the rigorous courses that will help them succeed in college and the workplace.189 Instead, far too many of them are enrolling in middle school and high school courses that will lead them to years of remediation at the community college and/or university.
No comprehensive data was found on how well Illinois is meeting the challenge of providing accurate and timely career planning information to parents and students in elementary, middle, and high schools, as well as postsecondary institutions. However, the Illinois Department of Employment Security provides a comprehensive one-stop information center for workforce and career education at http://www.ilworkinfo.com/.
Preparation and Professional Development of EducatorsIn the 2005 debate over raising high school graduation requirements, local education leaders protested that qualified teachers were simply not available for more advanced science and mathematics courses. Research has supported their contention, placing the supply of qualified teachers as a central challenge for upgrading STEM education.
Illinois has a multiple-assessment qualification process for teachers: a passing performance on the Basic Skills Test before entrance into a teacher education program, a passing performance on Content Tests, and a passing performance on the Assessment of Professional Teaching (APT), an assessment of general knowledge of the teaching profession and pedagogical methodologies. In addition, Illinois has three-tiered licensing: initial, standard, and master, with specific requirements for advancing in level and remaining current in licensure. According to the Illinois Teacher Salary Study 2003-2004, the median schedules salary was $53,820, ranking the state 8th in the nation and 1st in the Midwest.190
That said, Illinois teachers for mathematics and science are consistently listed as critical shortages. In 2005, 225 school districts reported shortages of physics and chemistry teachers, up 8% and 9% respectively.191 The future need for STEM teachers may be great: about 30% of the math and science teachers for grades 9-12 are over the age of 50.192
Illinois high school teachers of science and mathematics are required either to major in their subjects or take 24 academic credits in the subject and pass a test of content knowledge.
RESOURCES FOR STEM EDUCATION
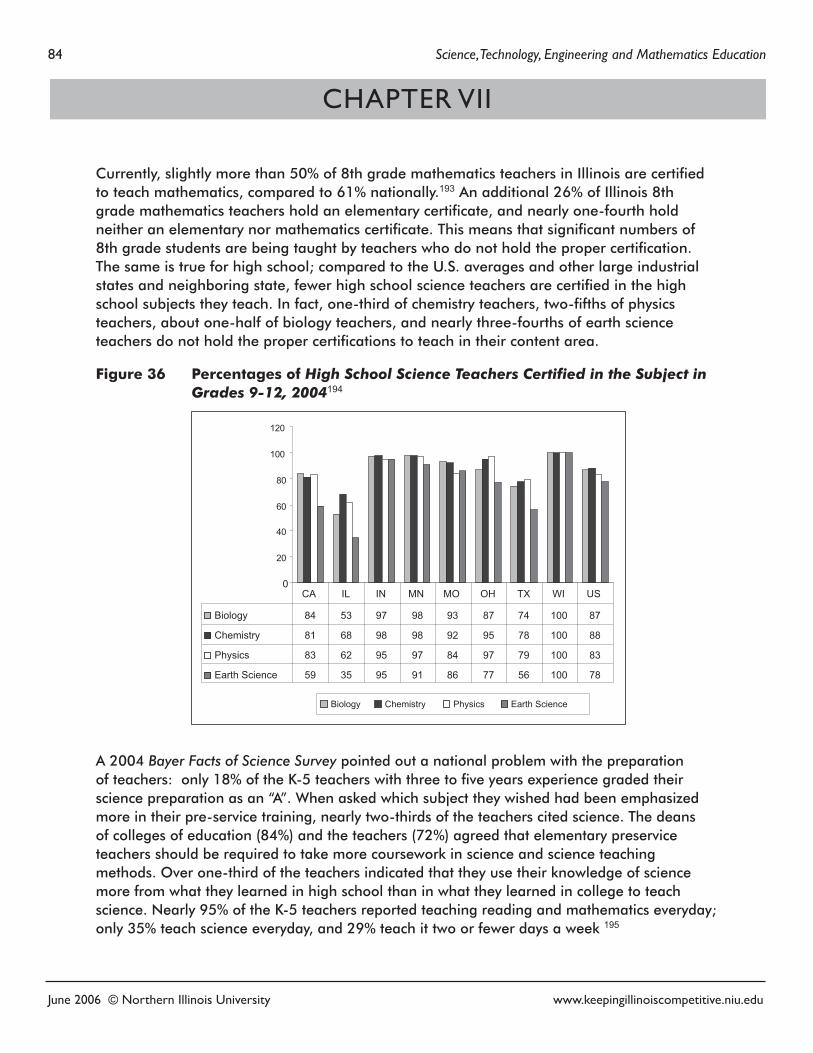
84 Science, Technology, Engineering and Mathematics Education
June 2006 © Northern Illinois University www.keepingillinoiscompetitive.niu.edu
Currently, slightly more than 50% of 8th grade mathematics teachers in Illinois are certified to teach mathematics, compared to 61% nationally.193 An additional 26% of Illinois 8th grade mathematics teachers hold an elementary certificate, and nearly one-fourth hold neither an elementary nor mathematics certificate. This means that significant numbers of 8th grade students are being taught by teachers who do not hold the proper certification. The same is true for high school; compared to the U.S. averages and other large industrial states and neighboring state, fewer high school science teachers are certified in the high school subjects they teach. In fact, one-third of chemistry teachers, two-fifths of physics teachers, about one-half of biology teachers, and nearly three-fourths of earth science teachers do not hold the proper certifications to teach in their content area.
Figure 36 Percentages of High School Science Teachers Certified in the Subject in Grades 9-12, 2004194
A 2004 Bayer Facts of Science Survey pointed out a national problem with the preparation of teachers: only 18% of the K-5 teachers with three to five years experience graded their science preparation as an “A”. When asked which subject they wished had been emphasized more in their pre-service training, nearly two-thirds of the teachers cited science. The deans of colleges of education (84%) and the teachers (72%) agreed that elementary preservice teachers should be required to take more coursework in science and science teaching methods. Over one-third of the teachers indicated that they use their knowledge of science more from what they learned in high school than in what they learned in college to teach science. Nearly 95% of the K-5 teachers reported teaching reading and mathematics everyday; only 35% teach science everyday, and 29% teach it two or fewer days a week 195
0
20
40
60
80
100
120
Biology Chemistry Physics Earth Science
Biology 84 53 97 98 93 87 74 100 87
Chemistry 81 68 98 98 92 95 78 100 88
Physics 83 62 95 97 84 97 79 100 83
Earth Science 59 35 95 91 86 77 56 100 78
CA IL IN MN MO OH TX WI US
CHAPTER VII
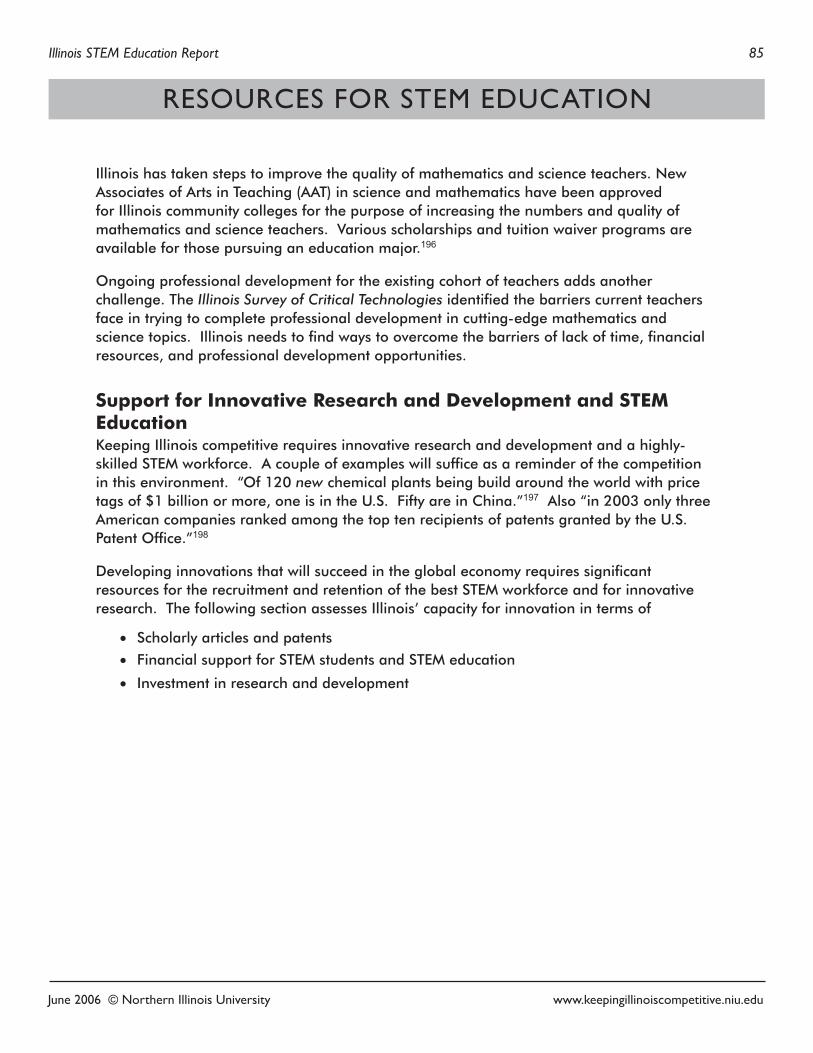
Illinois STEM Education Report 85
June 2006 © Northern Illinois University www.keepingillinoiscompetitive.niu.edu
Illinois has taken steps to improve the quality of mathematics and science teachers. New Associates of Arts in Teaching (AAT) in science and mathematics have been approved for Illinois community colleges for the purpose of increasing the numbers and quality of mathematics and science teachers. Various scholarships and tuition waiver programs are available for those pursuing an education major.196
Ongoing professional development for the existing cohort of teachers adds another challenge. The Illinois Survey of Critical Technologies identified the barriers current teachers face in trying to complete professional development in cutting-edge mathematics and science topics. Illinois needs to find ways to overcome the barriers of lack of time, financial resources, and professional development opportunities.
Support for Innovative Research and Development and STEM EducationKeeping Illinois competitive requires innovative research and development and a highly-skilled STEM workforce. A couple of examples will suffice as a reminder of the competition in this environment. “Of 120 new chemical plants being build around the world with price tags of $1 billion or more, one is in the U.S. Fifty are in China.”197 Also “in 2003 only three American companies ranked among the top ten recipients of patents granted by the U.S. Patent Office.”198
Developing innovations that will succeed in the global economy requires significant resources for the recruitment and retention of the best STEM workforce and for innovative research. The following section assesses Illinois’ capacity for innovation in terms of
• Scholarly articles and patents
• Financial support for STEM students and STEM education
• Investment in research and development
RESOURCES FOR STEM EDUCATION
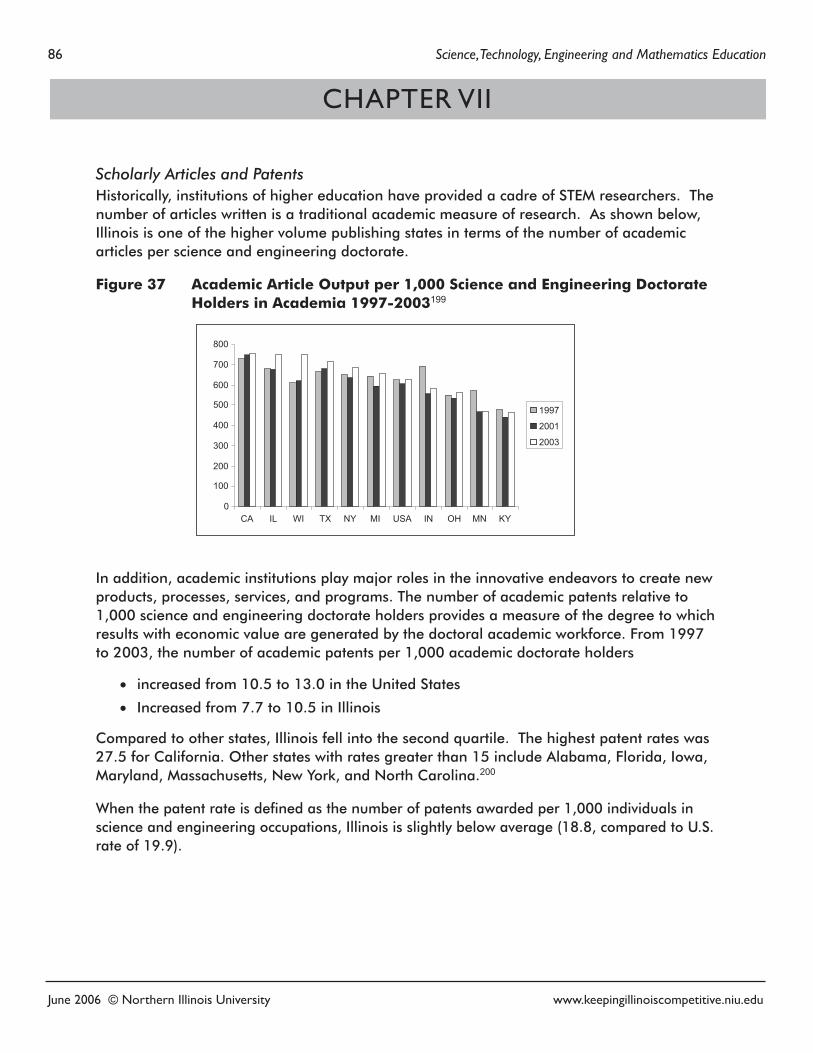
86 Science, Technology, Engineering and Mathematics Education
June 2006 © Northern Illinois University www.keepingillinoiscompetitive.niu.edu
Scholarly Articles and PatentsHistorically, institutions of higher education have provided a cadre of STEM researchers. The number of articles written is a traditional academic measure of research. As shown below, Illinois is one of the higher volume publishing states in terms of the number of academic articles per science and engineering doctorate.
Figure 37 Academic Article Output per 1,000 Science and Engineering Doctorate Holders in Academia 1997-2003199
In addition, academic institutions play major roles in the innovative endeavors to create new products, processes, services, and programs. The number of academic patents relative to 1,000 science and engineering doctorate holders provides a measure of the degree to which results with economic value are generated by the doctoral academic workforce. From 1997 to 2003, the number of academic patents per 1,000 academic doctorate holders
• increased from 10.5 to 13.0 in the United States
• Increased from 7.7 to 10.5 in Illinois
Compared to other states, Illinois fell into the second quartile. The highest patent rates was 27.5 for California. Other states with rates greater than 15 include Alabama, Florida, Iowa, Maryland, Massachusetts, New York, and North Carolina.200
When the patent rate is defined as the number of patents awarded per 1,000 individuals in science and engineering occupations, Illinois is slightly below average (18.8, compared to U.S. rate of 19.9).
0
100
200
300
400
500
600
700
800
CA IL WI TX NY MI USA IN OH MN KY
1997
2001
2003
CHAPTER VII
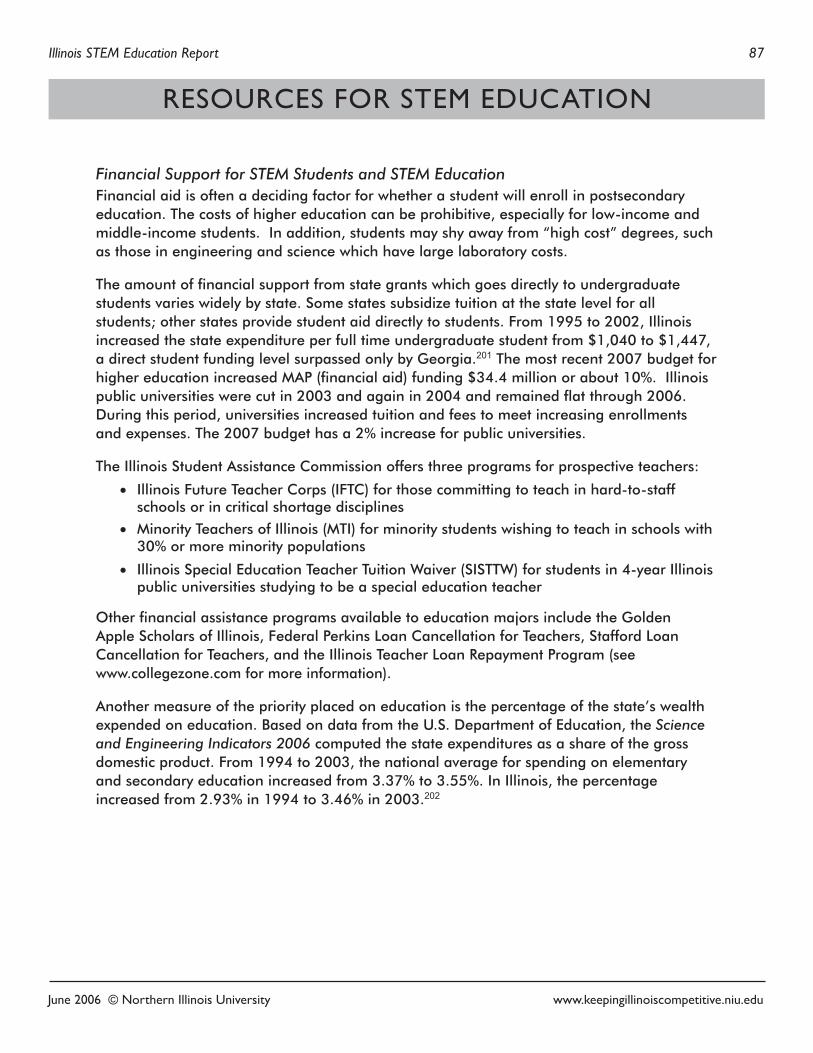
Illinois STEM Education Report 87
June 2006 © Northern Illinois University www.keepingillinoiscompetitive.niu.edu
Financial Support for STEM Students and STEM EducationFinancial aid is often a deciding factor for whether a student will enroll in postsecondary education. The costs of higher education can be prohibitive, especially for low-income and middle-income students. In addition, students may shy away from “high cost” degrees, such as those in engineering and science which have large laboratory costs.
The amount of financial support from state grants which goes directly to undergraduate students varies widely by state. Some states subsidize tuition at the state level for all students; other states provide student aid directly to students. From 1995 to 2002, Illinois increased the state expenditure per full time undergraduate student from $1,040 to $1,447, a direct student funding level surpassed only by Georgia.201 The most recent 2007 budget for higher education increased MAP (financial aid) funding $34.4 million or about 10%. Illinois public universities were cut in 2003 and again in 2004 and remained flat through 2006. During this period, universities increased tuition and fees to meet increasing enrollments and expenses. The 2007 budget has a 2% increase for public universities.
The Illinois Student Assistance Commission offers three programs for prospective teachers:
• Illinois Future Teacher Corps (IFTC) for those committing to teach in hard-to-staff schools or in critical shortage disciplines
• Minority Teachers of Illinois (MTI) for minority students wishing to teach in schools with 30% or more minority populations
• Illinois Special Education Teacher Tuition Waiver (SISTTW) for students in 4-year Illinois public universities studying to be a special education teacher
Other financial assistance programs available to education majors include the Golden Apple Scholars of Illinois, Federal Perkins Loan Cancellation for Teachers, Stafford Loan Cancellation for Teachers, and the Illinois Teacher Loan Repayment Program (see www.collegezone.com for more information).
Another measure of the priority placed on education is the percentage of the state’s wealth expended on education. Based on data from the U.S. Department of Education, the Science and Engineering Indicators 2006 computed the state expenditures as a share of the gross domestic product. From 1994 to 2003, the national average for spending on elementary and secondary education increased from 3.37% to 3.55%. In Illinois, the percentage increased from 2.93% in 1994 to 3.46% in 2003.202
RESOURCES FOR STEM EDUCATION
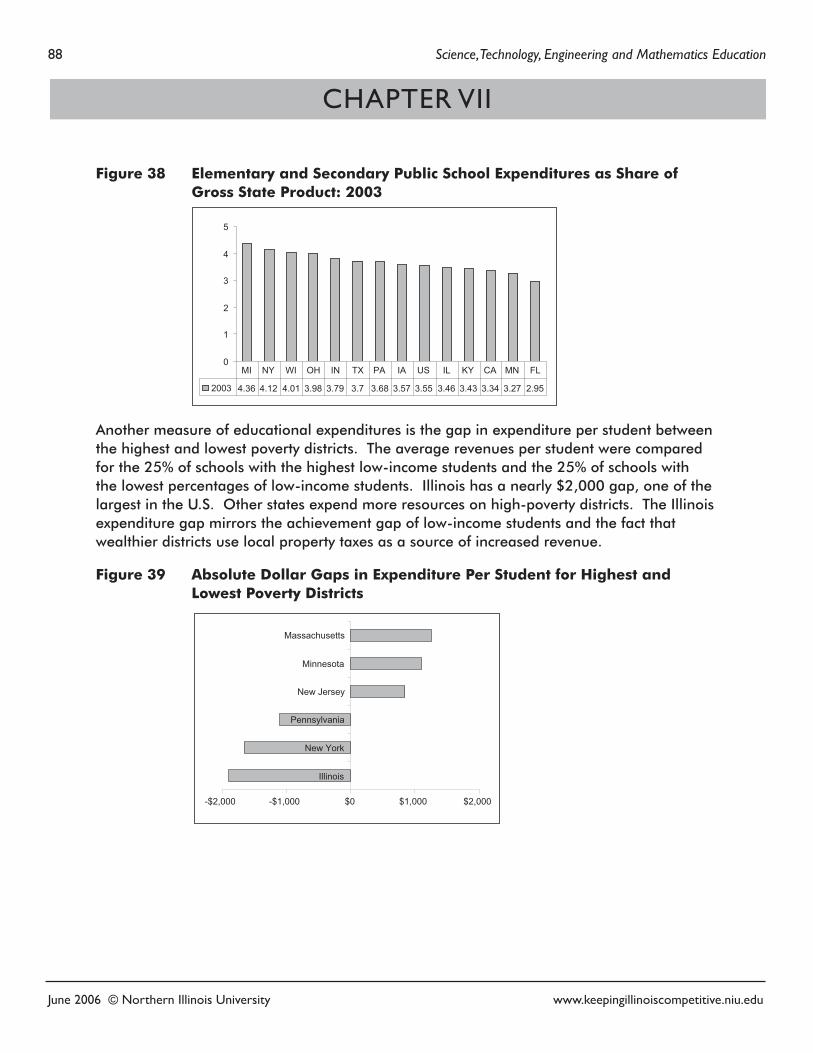
88 Science, Technology, Engineering and Mathematics Education
June 2006 © Northern Illinois University www.keepingillinoiscompetitive.niu.edu
Figure 38 Elementary and Secondary Public School Expenditures as Share of Gross State Product: 2003
Another measure of educational expenditures is the gap in expenditure per student between the highest and lowest poverty districts. The average revenues per student were compared for the 25% of schools with the highest low-income students and the 25% of schools with the lowest percentages of low-income students. Illinois has a nearly $2,000 gap, one of the largest in the U.S. Other states expend more resources on high-poverty districts. The Illinois expenditure gap mirrors the achievement gap of low-income students and the fact that wealthier districts use local property taxes as a source of increased revenue.
Figure 39 Absolute Dollar Gaps in Expenditure Per Student for Highest and Lowest Poverty Districts
-$2,000 -$1,000 $0 $1,000 $2,000
Illinois
New York
Pennsylvania
New Jersey
Minnesota
Massachusetts
CHAPTER VII
0
1
2
3
4
5
2003 4.36 4.12 4.01 3.98 3.79 3.7 3.68 3.57 3.55 3.46 3.43 3.34 3.27 2.95
MI NY WI OH IN TX PA IA US IL KY CA MN FL
Illinois STEM Education Report 89
June 2006 © Northern Illinois University www.keepingillinoiscompetitive.niu.edu
The appropriations of state tax funds for higher education operating expenses in Illinois increased 10.1% from 1990 to 2005. During the same period, the aggregate funding for states in the Midwest increased 8.7% and national funding for higher education increased 19.2%. The decline in the manufacturing industry was particularly severe in the Midwest, taking a toll on tax revenues.
Investment in Research and DevelopmentResearch and development activities (R & D) are necessary to support a strong STEM infrastructure. Globally, the top five countries with R & D as a percentage of the gross domestic product are Israel, Sweden, Finland, Japan, and Iceland. The U.S. leads in per capita spending on information and communication technology, followed by Switzerland, Denmark, Sweden, and Norway. The top producers of innovations in genetically modified crops are the U.S., Argentina, Canada, Brazil, and China.203
The ratio of the amount of academic spending relative to the gross state product is a measure used in the Science and Engineering Indicators 2006. The U.S. average ratio of academic R & D spending to $1,000 GSP increased from 3.01 in 1993 to 3.60 in 2003, and in Illinois, the ratio increased from 2.45 to 3.23 during the same period. 204
From 1998 to 2002, the U.S. average percent of the gross state product attributed to R & D remained stable (2.48%, 2.46% respectively). Similar conclusions can be made for Illinois, with the percentage of the gross state product attributed to R & D going from 2.14% to 2.10%. Over 3.5% of the gross state product was attributed to R & D in states such as California, Massachusetts, Michigan, New Mexico, Rhode Island, and Washington.205
Another measure of R & D funding is the amount of federal R & D obligations per civilian worker in a state. From 1992 to 2002, federal R & D obligations rose from $64 billion to $84 billion. The per civilian expenditure in the U.S. increased from $536 to $612. In Illinois, the per civilian rate increased $166 to $284. As pointed out in the Science and Engineering Indicators 2006, federal R & D obligations varied greatly. For instance, some sparsely populated states host national laboratories, and a number of R & D institutes surround the District of Columbia.206
The federal Small Business Innovation Research (SBIR) program supports companies with 500 or fewer employees with awards for planning and commercialization. Science and Engineering Indicators 2006 examined the three-year total of SBIR awards relative to $1 million in the gross state product. For 2001 to 2003, the U.S. ratio of SBIR to $1 million gross state product was 141, compared to Illinois’ ratio of 43. States with the highest rankings tended to have federal laboratories or well-recognized academic research institutions from which small businesses have emerged.207
RESOURCES FOR STEM EDUCATION
90 Science, Technology, Engineering and Mathematics Education
June 2006 © Northern Illinois University www.keepingillinoiscompetitive.niu.edu
Private industry is another source of R & D funding. From 1998 to 2003, private industry funding increased from $164 billion to $198 billion, an increase of 21% unadjusted for inflation. The percentage of R & D conducted by industry in the private sector decreased in the United States from 2.14% to 2.06% in 1998 to 2003. In Illinois, the percentage of industry-performed R & D increased from 1.90% in 1998 to 2.00% in 2000 but decreased to 0.85% in 2003.208
The expansion and emergence of companies can also be funded via venture capital. In 2003, the ratio of venture capital expansion to the gross state product was 0.76 in Illinois compared to the national average of 1.73. California and Massachusetts received the majority of the total venture capital dispersed in the U.S. in 2003.
Lastly, the amount of resources expended in ongoing training of employees is essential to the currency of workers’ knowledge and skills. Increasing the educational level of employees by approximately one year can result in a 12.7% increase in productivity in the non-manufacturing sector.209
CHAPTER VII
June 2006 © Northern Illinois University www.keepingillinoiscompetitive.niu.edu
Illinois STEM Education Report 91
Chapter SummaryKeeping Illinois competitive requires that resources be provided for STEM education. In addition to funding, other resources include staffing of the schools with qualified teachers and providing the most current instructional approaches and information to parents and students.
One of the greater challenges for Illinois is the need to increase the mathematics and science skills of all students, and this requires students in middle and junior high school to select more rigorous courses. Nationally, the role of the guidance counselor has become that of a career specialist, even in the elementary grades.
The quality of education provided is directly related to the qualifications of teachers in the classroom. Since Illinois ranks far below other states in the percentages of mathematics and science teachers who have the appropriate teaching credentials, the quality of STEM educators needs attention. Several steps have been taken. Illinois implemented the A.A.S. degree in community colleges to try to increase the number of mathematics and science teachers. Some school districts report success in their partnerships with universities to provide alternative certification programs for technically-proficient career changers. Illinois offers scholarships for students preparing to teach in areas where it is difficult to place teachers. Several states offer scholarships for students preparing for careers in STEM education and STEM professions, a mechanism supported by several of the national STEM reports.
In terms of fiscal resources, Illinois appeared average in the federal and state aggregate expenditures on education. However, the state has one of the largest gaps between student expenditures in the lowest- and the highest-poverty districts. Because of the large discrepancy among states in the amount of federal research funding, it is difficult to compare Illinois to other states. In the past few years, Illinois has received additional federal funds for R & D activities.
RESOURCES FOR STEM EDUCATION
One of the greater challenges for Illinois is the need to increase the mathematics and science skills of all students, and this requires students in middle and junior high school to select more rigorous courses.
June 2006 © Northern Illinois University www.keepingillinoiscompetitive.niu.edu
92 Science, Technology, Engineering and Mathematics Education
STEM EDUCATION ISSUES FOR
21ST CENTURY COMPETITIVENESS
June 2006 © Northern Illinois University www.keepingillinoiscompetitive.niu.edu
Illinois STEM Education Report 93
V111. A CALL TO ACTION
A CALL TO ACTION FOR ILLINOIS
At a time when the Illinois economic infrastructure needs innovation and a workforce with 21st Century skills, slightly more than half of the Illinois high school graduates have the mathematics and science knowledge needed to be successful in postsecondary education or to secure livable-wage jobs. At the same time, the convergence of demographic, technological, and globalization trends has resulted in the decline of the middle class, a potential shortage of skilled workers, and the need for an aggressive research and development agenda to create more higher-paying jobs and to keep Illinois globally competitive.
Illinois has historically been home to some of the world’s best and brightest in mathematics and science, as well as to international, cutting-edge industries. It is home, also, to some of the lowest performing students in the nation, and it is recovering from severe recessions, especially in manufacturing and high technology industries.
The key to addressing these challenges involves private and public sectors working together to align STEM across the span of grades from pre-kindergarten through graduate school and to ensure that the entire STEM education system prepares the skilled workers needed for 21st Century jobs.
Keeping Illinois Competitive joins numerous other reports in bringing to the forefront the critical challenges facing STEM education. Appendix C summarizes the recommendations from a selection of these reports. At least half of these studies recommended
• Improving K-12 mathematics and science curriculum
• Providing opportunities and incentives for professional development
• Providing students with incentives to pursue STEM careers
The spirit of these recommendations is reflected below in the challenges and issues facing STEM Education in Illinois. Keeping Illinois competitive requires that the following challenges be addressed through the collaborative leadership of the private and private sectors.
The key to addressing these challenges involves public and private sectors working together to ensure that the entire STEM education system prepares the skilled workers needed for 21st Century jobs.
94 Science, Technology, Engineering and Mathematics Education
June 2006 © Northern Illinois University www.keepingillinoiscompetitive.niu.edu
Challenge One: Student Academic AchievementSlightly more than half Illinois high school students have the requisite mathematics and science skills for postsecondary education or jobs in the emerging new economy.
Academic Progress - Within Illinois, students decrease in their levels of achievement as they move from the early grades through high school. The percentage of students meeting or exceeding the state standards in mathematics decreases from 79% in 3rd grade to 53% in 11th grade. In science, the decreases are similar – from 71% meeting or exceeding the standards in 4th grade to only 53% meeting or exceeding the standards in 11th grade.
Achievement Gap - Low-income students, including minorities, are the least prepared for college and the workplace. The performance of Hispanics has improved but is still well below that of their white and Asian peers.
High School Graduation - About 30% of all 9th grade students will not complete high school; closer to 50% of black and Hispanic males are likely to graduate.
ACT Scores - Exiting high school students have ACT scores which are among the top in the nation and among the lowest.
College Persistence - Once in college, about half of the community college freshmen and about one-fifth of the university freshmen do not return for their second year.
Improving the academic achievement of all students requires a P-20 approach to STEM education and the alignment of this system to the needs of the workplace.
The following issues were identified:
1. Academic achievement on state mathematics and science assessments by Illinois low-income students is significantly lower than that of their peers.
2. Low-income, black, and Hispanic populations have lower levels of postsecondary education than their peers.
3. Many students in Illinois high schools do not have opportunities to study college-preparatory academic curricula or explore rigorous career and technical education pathways.
4. Significant numbers of high school graduates take remedial mathematics coursework in college, and taking remedial courses reduces the likelihood that students will finish degree programs.
CHAPTER V111
Illinois STEM Education Report 95
June 2006 © Northern Illinois University www.keepingillinoiscompetitive.niu.edu
Challenge Two: Alignment to 21st Century Knowledge and SkillsState curricula, assessments, and pedagogy are not consistently aligned with the 21st Century knowledge and skills needed for the state’s economic vitality.
The nationally proposed curricula for the 21st Century include a broad core of academic knowledge, basic skills, higher-level thinking skills, interpersonal skills, meta-cognitive skills, and technology skills. To align curricula, assessments, and classroom instruction to this new academic core may require organizational, delivery, and pedagogical changes across the P-20 continuum.
The following issues were identified:
1. Content area performance descriptors and state assessments do not cover 21st Century skills such as those in the “Applications of Learning” or the career and workforce skills that are part of the Illinois Learning Standards.
2. A statewide, inclusive process to regularly review and update the Illinois Learning Standards and performance descriptors to include cutting-edge technology and research-based pedagogy does not exist at this time.
3. The emerging instructional models that integrate disciplines and are grounded in authentic, real-world problems could be explored by state level organizations.
4. Current data-collection methods in the state do not provide accurate, consistent information on graduation and drop-out rates or the pathways students take through the P-20 educational system.
A CALL TO ACTION
96 Science, Technology, Engineering and Mathematics Education
June 2006 © Northern Illinois University www.keepingillinoiscompetitive.niu.edu
Challenge Three: Teacher PreparationMany mathematics and science teachers do not have the proper qualifications or access to ongoing professional development to improve their teaching.
Illinois has high percentages of teachers in mathematics and science who do not have the required certification to teach in their assigned subject area. Slightly more than 50% of 8th grade mathematics teachers in Illinois are certified to teach mathematics. At the high school level, one-third of chemistry teachers, two-fifths of physics teachers, about one-half of biology teachers, and nearly three-fourths of earth science teachers do not hold the proper state certifications to teach in their content area.
The following issues were identified:
1. The training necessary to meet the minimum state certification requirements for the subjects they teach is either not being provided for, or not being pursued by, all Illinois science and mathematics teachers who are not fully qualified.
2. Barriers exist that prevent mathematics and science teachers from acquiring and implementing new content knowledge and pedagogical skills in the classroom.
Challenge Four: Investment in STEM EducationStrategies may not be adequate to recruit and retain the most qualified individuals for STEM professions and for research and development for innovation.
Illinois needs innovative research and development to increase the productivity in critical shortage occupations, to increase innovation in current business and industry, and to keep Illinois competitive both nationally and globally.
The following issues were identified:
1. Parents say that awareness programs aimed at recruiting high-potential students to postsecondary STEM education are inadequate.
2. Barriers exist which discourage or prohibit students, especially low-income students, from enrolling in and completing STEM programs.
3. P-20 instructional activities that develop the skills needed for innovation have not been identified and disseminated.
4. Investment in STEM research has decreased in recent years.
CHAPTER V111
June 2006 © Northern Illinois University www.keepingillinoiscompetitive.niu.edu
Illinois STEM Education Report 97
A CALL TO ACTION
Challenge Five: Lifelong Learning
In the 21st Century, all citizens and workers will need increasing mathematics and science skills and opportunities for lifelong learning.
It is important for all Illinoisans, as employees and as citizens, to understand the STEM issues that affect their lives. Keeping Illinois competitive requires all workers to keep their skills up to date according to their occupational standards.
The following issues were identified:
1. Continuing education is needed to keep all workers’ skills current.
2. Citizens may not be sufficiently aware of the need for all citizens to keep their STEM knowledge and skills up-to-date
Keeping Illinois competitive requires all public and private sectors working together to create coordinated, integrated, innovative solutions to these challenges.
Keeping Illinois competitive requires all public and private sectors working together to create coordinated, integrated, innovative solutions to these challenges.
June 2006 © Northern Illinois University www.keepingillinoiscompetitive.niu.edu
98 Science, Technology, Engineering and Mathematics Education
ENDNOTES
Illinois STEM Education Report 99
June 2006 © Northern Illinois University www.keepingillinoiscompetitive.niu.edu
i Business-Higher Education Forum, A Commitment to America’s Future: Responding to the Crisis in Mathematics and Science Education, (Washington, D.C., January 2005).
ii State of Illinois, Department of Employment Security, The Illinois Labor Market Review, 9 (2), 2004, <http://lmi.ides.state.il.us/lmr/winter_2004/ILMR.pdf>.
iii Illinois Department of Employment Security, Local Area Unemployment Statistics, <http://lmi.ides.state.il.us/laus/lausmenu.htm>.
iv Center for Tax and Budget Accountability and Northern Illinois University, The State of Working Illinois, 2005 (Chicago, IL, 2005). <http://www.stateofworkingillinois.niu.edu>.
v Ibid.vi Woods and Poole Economics, Inc., State of Illinois, 2005.vii U.S. Census Bureau Data, 2000.viii National Science Foundation, Division of Science Resources Statistics, Science and Engineering Indicators
2006 Arlington, VA (NSB 06-01) [February 2006], Table 8-21.ix A livable wage is the hourly wage or annual income sufficient to meet a family’s basic needs plus all
applicable Federal and State taxes. Basic needs include food, housing, child care, transportation, health care, clothing, household and personal expenses, insurance, and 5% savings.
x Results that Matter: 21st Century Skills and High School Reform. Partnership for 21st Century Skills. (Washington, D.C.: U.S. Department of Education, March 2006).
xi A First Look at What We Can Learn from High Performing School Districts: An Analysis of TIMSS Data from the First in the World Consortium, August 1999. <http://www.ed.gov/pubs/FirstLook/FiWConsortium.pdf>.
xii U.S. Department of Education, Institute of Education Sciences, The Nation’s Report Card: Mathematics 2005 (NCES 2006-453) and The Nation’s Report Card: Science 2000 (NCES 2002-452). Kathryn Sandel and Bindu Batchu, The Gap Persists: Closing Illinois’ Achievement Divide, A+ Illinois, 2005.
xiii The College Board, Advanced Placement Program, National and 50 State Summary Reports, New York, 2004. National Science Foundation, Division of Science Resources Statistics, Science and Engineering Indicators 2006Arlington, VA (NSB 06-01) [February 2006].
xiv Illinois State Board of Education, 2005 Illinois State Report Card, <http://webprod1.isbe.net/ereportcard/publicsite/getSearchCriteria.aspx>.
xv Jay P. Greene and Marcus A Winters, Leaving Boys Behind: Public High School Graduation Rates. Center for Civic Innovation at the Manhattan Institute, Civic Report No. 48, April 2006. U.S. Department of Education, Institute of Education Sciences, Projections to Education Statistics to 2014 (NCES 2005-074). <http://nces.ed.gov/programs/projections/>.
xvi Jennifer B. Presley and Yugin Gong, The Demographics and Academics of College Readiness in Illinois, IERC 2005-3, (Edwardsville, IL: Illinois Education Research Council, 2005). WorkKeys data at <www.schooldata4all.org>.
xvii Illinois State Board of Education, Guidance Document: State Graduation Requirements (P.A. 94-0676), August 30, 2005.Illinois State Board of Education, Illinois Learning standards, http://www.isbe.net/ils/.
xviii Council of Chief State School Officers, State Services and Technical Assistance, State Departments of Education, Data on Public Schools, 2003-04. Washington, DC, 2005. Data for 2004.National Science Foundation, Division of Science Resources Statistics, Science and Engineering Indicators 2006 Arlington, VA (NSB 06-01) [February 2006].
xix Bayer Facts of Science Education XI - 2005, <www.bayerus.com/news/facts.cfm>.
ENDNOTES
100 Science, Technology, Engineering and Mathematics Education
June 2006 © Northern Illinois University www.keepingillinoiscompetitive.niu.edu
xx Increasing the Success of Minority Students in Science and Technology, American Council on Education, Washington, D.C., 2006.
xxi Illinois Board of Higher Education, Data Book 2005, < http://www.ibhe.org/Data%20Bank/DataBook/default.asp>.National Science Foundation, Division of Science Resources Statistics, Science and Engineering Indicators 2006 Arlington, VA (NSB 06-01) [February 2006].
xxii National Science Foundation, Division of Science Resources Statistics, Science and Engineering Indicators 2006 Arlington, VA (NSB 06-01) [February 2006].The Education Trust, EdWatch Online 2004: State Summary Reports. <www.edtrust.org>.
xxiii Bayer Facts of Science Education XI - 2005, <www.bayerus.com/news/facts.cfm>.
1 National Academy of Sciences, National Academy of Engineering, and Institute of Medicine, Rising Above the Gathering Storm: Energizing and Employing America for a Brighter Economic Future, (Washington, D.C., 2005), p. 4.
2 Council on Competitiveness, A Roadmap for American Innovation, Council on Competitiveness Online, 2005, <www.compete.org>.
3 Council on Competitiveness, Innovate America, (December 2004), p. 5.4 Ibid. 5 Center for Tax and Budget Accountability and Northern Illinois University, The State of Working Illinois, 2005
(Chicago, IL, 2005). <http://www.stateofworkingillinois.niu.edu>.6 Robert Reich, “The New Rich-Rich Gap,” Newsweek, (December 8, 2005). <http://www.msnbc.msn.com/
id/10206251/site/newsweek>7 Center for Tax and Budget Accountability and Northern Illinois University, The State of Working Illinois, 2005
(Chicago, IL, 2005). <http://www.stateofworkingillinois.niu.edu>. 8 State of Illinois, Department of Employment Security, The Illinois Labor Market Review, 9 (2), 2004, <http://lmi.
ides.state.il.us/lmr/winter_2004/ILMR.pdf>.9 Ibid.10 Ibid., Border states include Wisconsin, Indiana, Kentucky, Missouri, Iowa, Michigan, and Illinois.11 Ibid. 12 Ibid.13 Ibid. 14 Center for Tax and Budget Accountability and Northern Illinois University, The State of Working Illinois, 2005
(Chicago, IL, 2005). <http://www.stateofworkingillinois.niu.edu>. 15 Ibid.16 Illinois Department of Employment Security, Local Area Unemployment Statistics, <http://lmi.ides.state.il.us/
laus/lausmenu.htm>.17 Center for Tax and Budget Accountability and Northern Illinois University, The State of Working Illinois, 2005
(Chicago, IL, 2005). <http://www.stateofworkingillinois.niu.edu>. 18 U.S. Department of Labor, Bureau of Labor Statistics, Fast Growing Occupations Covered in the 2006-07
Occupational Outlook Handbook, 2004-2014, (December 21, 2005), <http://bis.gov/news.release/ooh.t01.htm>.
19 Center for Tax and Budget Accountability and Northern Illinois University, The State of Working Illinois, 2005 (Chicago, IL, 2005). <http://www.stateofworkingillinois.niu.edu>.
20 Ibid.
ENDNOTES
Illinois STEM Education Report 101
June 2006 © Northern Illinois University www.keepingillinoiscompetitive.niu.edu
21 U.S. Department of Labor, Bureau of Labor Statistics, Fast Growing Occupations Covered in the 2006-07 Occupational Outlook Handbook, 2004-2014, (December 21, 2005), <http://bis.gov/news.release/ooh.t01.htm> and Center for Tax and Budget Accountability and Northern Illinois University, The State of Working Illinois, 2005 (Chicago, IL, 2005). <http://www.stateofworkingillinois.niu.edu>.
22 Northern Illinois University, Critical Skill Shortage Reports, (DeKalb, IL: May 2004). 23 Steve Gunderson, Roberts Jones, and Kathryn Scanland, The Jobs Revolution: Changing How America Works,
(Chicago, IL: Copywriters, Inc., 2004).24 Woods and Poole Economics, Inc., State of Illinois, 2005.25 Ted Sanders, No Time to Waste: The Vital role of College and University Leaders in Improving Science
and Mathematics Education, paper presented at the Invitational Conference on Teacher Preparation and Institutions of Higher Education: Mathematics and Science Content Knowledge, U.S. Department of Education (Washington, D.C., October 5, 2004).
26 National Science Foundation, Division of Science Resources Statistics, Science and Engineering Indicators 2006Arlington, VA (NSB 06-01) [February 2006], pp. 3-4.
27 U.S. Census Bureau Data, 2000.28 U.S. Census Bureau, 5% Public Use Microdata Samples and Projections, 1980 and 2000.29 Connvene: A Platform to Advance a Statewide STEM Dialogue and Strategies: Business White Papery (October
2005), < http://www.ctacad.org/CONNvene%20White%20Paper%20Business.doc>.30 The National Center for Public Policy and Higher Education, Policy Alert Supplement: Educational Level of
Illinois’ Workforce Projected to Decline, (San Jose, CA: November 2005), <http://www.highereducation.org/reports/pa_decline/states/IL.pdf>.
31 National Science Foundation, Division of Science Resources Statistics, Science and Engineering Indicators 2006, Arlington, VA (NSB 06-01) [February 2006], Table 8-21.
32 Ibid., Tables 8-23 through 8-25.33 Ibid., Table 8-22.34 Ibid., O-3. 35 James M. Lindsay and Ivo H. Daalder, America’s Role in the World: Challenges to American Businesses and
Higher Education, (Washington, DC: Business-Higher Education Forum, August 2005).36 Statement of Norman R. Augustine, Chair, Committee on Prospering in the Global Economy of the 21st
Century; and Committee on Science, Engineering, and Public Policy, Division on Policy and Global Affairs, The National Academies before the Committee on Science, U.S. House of Representatives, October 20, 2005.
37 Geoffrey Colvin, “America Isn’t Ready,” Fortune Magazine, July 25, 2005.38 Gary Gereffi and Vivek Wadhwa, Framing the Engineering Outsourcing Debate: Placing the United States on a
Level Playing Field with China and India ( December 2005), <http://memp.pratt.duke.edu/downloads/duke_outsourcing_2005.pdf>
39 Ibid. 40 National Science Foundation, Division of Science Resources Statistics, Science and Engineering Indicators 2006
Arlington, VA (NSB 06-01) [February 2006], Chapter 2.41 Ibid.42 Ibid.43 “Foreign Applications to Graduate Schools Rise After 2-Year Drop, Survey Finds.” The Chronicle of Higher
Education (March 23, 2006), <http://chronicle.com/daily/2006/03/2006034303n.htm>.44 “National Postgraduate Exam Attracts Record 1.27 Million Examinees,” Xinhua: People’s Daily Online (January
16, 2006), <http://english.people.com.cn/>.
ENDNOTES
102 Science, Technology, Engineering and Mathematics Education
June 2006 © Northern Illinois University www.keepingillinoiscompetitive.niu.edu
45 Vaishali Honawar, “Indian Top Foreigners Bound for U.S. Colleges,” Education Week (November 30, 2005), p 21.
46 U.S. Patent and Trademark Office, Office of Electronic Information Products, Patent Technology Monitoring Division (December 2004).
47 National Science Board, America Pressing Challenge – Building a Stronger Foundation: A Companion to Science and Engineering Indicators – 2006, (Arlington, VA (NSB 06-02), January 2006), p. 2.
48 A.P. Carnevale and D.M. Desrochers, Standards for What? The Economic Roots of K-16 Reform, (Princeton, NJ: ETS, 2003).
49 Ibid.50 Illinois Department of Employment Security, Workforce Boards of Metropolitan Chicago Job Vacancy Survey
(Springfield, IL, May 2004). 51 Illinois State Board of Education and Northern Illinois University, Illinois Survey of Critical Technologies:
Summary Report (Springfield, IL, March 2006).52 Ibid., p. 5.53 Results that Matter: 21st Century Skills and High School Reform. Partnership for 21st Century Skills.
(Washington, D.C.: U.S. Department of Education, March 2006).54 American Diploma Project, <http://www.achieve.org/achieve.nsf/ADPNetwork?OpenForm>.55 Standards for Success, <http://www.s4s.org/cepr.s4s.phpStandards for success>.56 ACT, Crisis at the Core, <http://www.act.org/path/policy/reports/crisis.html>.57 Results that Matter: 21st Century Skills and High School Reform. Partnership for 21st Century Skills.
(Washington, D.C.: U.S. Department of Education, March 2006).58 Ibid.59 Illinois State Board of Education and Northern Illinois University, Illinois Survey of Critical Technologies:
Summary Report (Springfield, IL: March 2006).60 Council on Competitiveness, Innovate America, (December 2004), p.16.61 Illinois State Board of Education, Illinois Learning Standards, http://www.isbe.net/ils/.62 Judith Ramaley, “Policy Options Development,” Broadening Participation in Science and Engineering Research
and Education: Workshop Proceedings NSF: Alliance for Graduate Education and Professoriate, 2001, p. 84. 63 International Association for the Evaluation of Educational Achievement, Trends in International Mathematics
and Science Study (TIMSS), 2003.64 Ibid.65 Ibid.66 Ibid.67 Organisation for Economic Co-operation and Development, Programme for International Student Assessment
(PISA), 2003 Database and First Results from PISA 2003:Executive Summary, <http://www.oecd.org>.
68 A First Look at What We Can Learn from High Performing School Districts: An Analysis of TIMSS Data from the First in the World Consortium, August 1999. <http://www.ed.gov/pubs/FirstLook/FiWConsortium.pdf>.
69 Illinois State Board of Education, “Illinois TIMSS Scores Support Learning Standards”, (News Release, April 4, 2001).
70 U.S. Department of Education, Institute of Education Sciences, The Nation’s Report Card, 2005. <http://nces.ed.gov/nationsreportcard/>.
71 U.S. Department of Education, Institute of Education Sciences, The Nation’s Report Card: Mathematics 2005 (NCES 2006-453) and The Nation’s Report Card: Science 2000 (NCES 2002-452).
ENDNOTES
Illinois STEM Education Report 103
June 2006 © Northern Illinois University www.keepingillinoiscompetitive.niu.edu
72 Ibid.73 Ibid.74 Ibid. 75 Ibid.76 Ibid.77 Ibid.78 Kathryn Sandel and Bindu Batchu, The Gap Persists: Closing Illinois’ Achievement Divide, A+ Illinois, 2005.79 Quality Counts, <http://www.edweek.org/media/ew/qc/2006/17shr.il.h25.pdf>.80 U.S. Department of Education, Institute of Education Sciences, The Nation’s Report Card: Mathematics 2005
(NCES 2006-453).81 Ibid.82 Ibid.83 U.S. Department of Education, Institute of Education Sciences, The Nation’s Report Card: Science 2000 (NCES
2002-453).84 Ibid.85 U.S. Department of Education, Institute of Education Sciences, Projections to Education Statistics to 2014 (NCES
2005-074). <http://nces.ed.gov/programs/projections/.>86 Lizanne DeStefano and Nona Prestine, Evaluation of the Implementation of Illinois Learning Standards: Year
Four Report, report to the Illinois State Board of Education, August 2002.87 Interactive Illinois Report Card, <http://iirc.niu.edu/>.88 Illinois State Board of Education, 2005 Illinois State Report Card, <http://webprod1.isbe.net/ereportcard/
publicsite/getSearchCriteria.aspx>.89 Ibid.90 Ibid.91 Ibid.92 Ibid.93 Ibid.94 Ibid.95 Ibid.96 Ibid.97 The American Diploma Project, Ready or Not: Creating a High School Diploma that Counts, 2004.98 Peter D. Hart, Rising to the Challenge: Are High School Graduates Prepared for College and Work? (Washington,
DC: Achieve, Inc., 2005). 99 Measuring What Matters: Creating a Longitudinal Data System to Improve Student Achievement. <www.
DataQualityCampaign.org.>100 Center for Tax and Budget Accountability and Northern Illinois University, The State of Working Illinois, 2005
(Chicago, IL, 2005). <http://www.stateofworkingillinois.niu.edu>.101 High School Dropouts Cost the U.S. Billions in Lost Wages and Taxes. Alliance for Excellent Education,
Washington, D.C., March 1, 2006. 102 Illinois State Board of Education Annual Report, 2005, <http://www.isbe.net/board/pdf/AnnReport2005.pdf>.103 Jay P. Greene and Marcus A Winters, Leaving Boys Behind: Public High School Graduation Rates. Center for
Civic Innovation at the Manhattan Institute, Civic Report No. 48, April 2006. 104 Ibid.
ENDNOTES
104 Science, Technology, Engineering and Mathematics Education
June 2006 © Northern Illinois University www.keepingillinoiscompetitive.niu.edu
105 The Education Trust, Getting Honest About Grad Rates: How States Play the Numbers and Students Lose, June 2005.
106 Ibid., and Jay P. Greene and Marcus A Winters, Leaving Boys Behind: Public High School Graduation Rates. Center for Civic Innovation at the Manhattan Institute, Civic Report No. 48, April 2006.
107 U.S. Department of Education, Institute of Education Sciences, Projections to Education Statistics to 2014 (NCES 2005-074). <http://nces.ed.gov/programs/projections/>.
108 Gates Foundation as reported in the Thomas B. Fordham Foundation, The Education Gadfly, 6(17), April 27, 2006.
109 Jennifer B. Presley and Yugin Gong, The Demographics and Academics of College Readiness in Illinois, IERC 2005-3, (Edwardsville, IL: Illinois Education Research Council, 2005).
110 Ibid.111 Ibid.112 Ibid. 113 Ibid.114 Peter D. Hart, Rising to the Challenge: Are High School Graduates Prepared for College and Work? (Washington,
DC: Achieve, Inc., 2005). 115 Developing the STEM Education Pipeline, ACT High School Profile, State Composite for Illinois High School
Graduating Class 2005, ACT, Iowa City, IA, 2006.116 Ibid.117 Ibid.118 Ibid.119 On Course for Success: A Close Look at Selected High School Courses that Prepare All Students for College,
(Iowa City, IA: ACT and The Education Trust, 2004).120 National Science Foundation, Division of Science Resources Statistics, Science and Engineering Indicators 2006
Arlington, VA (NSB 06-01) [February 2006], Table 8-11. 121 The College Board, Advanced Placement Program, National and 50 State Summary Reports, New York, 2004. 122 Ibid.123 Ibid.124 <http://www.principalspartnership.com/SATbrief.pdf>.125 Lynn Olson, “Views Differ on Defining College Prep,” Education Week, April 26, 2006. 126 Ibid.127 Illinois Community College Board, Special analyses completed by Scott Parke on A1 Data, December 2006.128 Clifford Adelman, National Education Longitudinal Study (NELS:88), U.S. Department of Education, 2004. 129 Peter D. Hart, Rising to the Challenge: Are High School Graduates Prepared for College and Work? (Washington,
DC: Achieve, Inc., 2005). 130 2005 Skills Gap Report - A Survey of the American Manufacturing Workforce, Deloitte Development LLC, 2005.131 WorkKeys, ACT Inc., 2006, <http://www.act.org/workkeys/index.html>.132 <www.schooldata4all.org>133 National Science Foundation, Division of Science Resources Statistics, Science and Engineering Indicators
2006, Arlington, VA (NSB 06-01) [February 2006].134 Tapping America’s Potential, <http://www.tap2015.org>.135 Measuring What Matters: Creating a Longitudinal Data System to Improve Student Achievement.
<www.DataQualityCampaign.org.>
ENDNOTES
Illinois STEM Education Report 105
June 2006 © Northern Illinois University www.keepingillinoiscompetitive.niu.edu
136 The National Center for Public Policy and Higher Education, Policy Alert Supplement: Illinois’ Educational Pipeline, (San Jose, CA: April 2004), <http://www.ibhe.state.il.us/LegislativeBills/Summit/Materials/pipeline.pdf>.
137 National Governors Association and Achieve, National Education Summit on High Schools, February 2005. <http:// www.achieve.org>.
138 National Science Foundation, Division of Science Resources Statistics, Science and Engineering Indicators 2006.Arlington, VA (NSB 06-01) [February 2006]. Table 8-20.
139 National Science Foundation, Division of Science Resources Statistics, Science and Engineering Indicators 2006Arlington, VA (NSB 06-01) [February 2006]. Table 8-13 through 8-17. Note: S&E degrees include bachelor’s, master’s, and doctoral degrees in physical, computer, agricultural, biological, earth, atmospheric, ocean, and social sciences; psychology; mathematics; and engineering (U.S. Department of Education, National Center for Education Statistics, Integrated Postsecondary Education Data System, 2003).
140 Ibid.141 Ibid.142 Illinois Board of Higher Education, Data Book 2005,
<http://www.ibhe.org/Data%20Bank/DataBook/default.asp>.143 Ibid.144 Increasing the Success of Minority Students in Science and Technology, American Council on Education,
Washington, D.C., 2006.145 Ibid.146 Ibid.147 Results that Matter: 21st Century Skills and High School Reform. Partnership for 21st Century Skills.
(Washington, D.C.: U.S. Department of Education, March 2006).148 Illinois State Board of Education, Illinois Learning Standards, http://www.isbe.net/ils/.149 Paul R. Gross, Urula Goodenough, Lawrence S. Lerner, Susan Hack, Martha Schwartz, Richard Schwartz,
and Chester E. Finn, Jr., The State of State Science Standards 2005. (Washington, D.C.: Thomas B. Fordham Institute, 2005), <http://www.edexcellence.net/institute/publication/publication.cfm?id=352>.
150 David Klein, Bastiaan J. Braams, Thomas Parker, William Quirk, Wilfried Schmid, W. Stephen Wilson, Chester E. Finn, Jr., Justin Torres, Lawrence Braden, Ralph A. Raimi, The State of State Math Standards 2005.(Washington, D.C.: Thomas B. Fordham Institute, 2005), <http://www.edexcellence.net/institute/publication/publication.cfm?id=338S>.
151 E-mail from Harry Lichtfield, May 7, 2006.152 Illinois State Board of Education and Northern Illinois University, Illinois Survey of Critical Technologies:
Summary Report (Springfield, IL, March 2006).153 Illinois State Board of Education, Math, Science Education, (News Release, April 5, 2006).154 Penny Billman, Philip Buta, and John Lewis, Comprehensive School Reform in Illinois: Statewide Annual
Evaluation Program Year 2004-2005. Prepared for Illinois State Board of Education, December 2005. 155 Surveys of Enacted Curriculum, <http://www.ccsso.org/projects/Surveys_of_Enacted_Curriculum/>.156 Such as M. Suzanne Donovan and John D. Bransford, Eds., How Students Learn: History, Mathematics, and
Science in the Classroom, (Washington, DC: The National Academies Press, 2005). 157 Bayer Facts of Science Education XI - 2005, <www.bayerus.com/news/facts.cfm>158 <http://www.gatesfoundation.org/MediaCenter/Speeches/BillgSpeeches/BGSpeechNGA-050226.htm>. 159 Hands-on Program Adds Up for Arizona Math Students, National Alliance of State Science and Mathematics
Coalitions, NBS 3529 from Arizona Republic, April 4, 2006.
ENDNOTES
106 Science, Technology, Engineering and Mathematics Education
June 2006 © Northern Illinois University www.keepingillinoiscompetitive.niu.edu
160 Northern Illinois University offers a certificate in problem-based learning that is taught jointly with faculty from NIU and Illinois Math and Science Academy.
161 Rick Scott and Steve Sanchez, New Mexico First: Mathematics and Science Education in New Mexico. Background report for Town Hall/Summit, November 17-18, 2005.
162 Phil Daro quoted in Sean Cavanagh, “Poor Math Scores on World Stage Trouble U.S.,” Education Week, January 5, 2005.
163 F. M. Newman, A.S. Bryk, A. and J.K. Nagaoka, Authentic Intellectual Work and Standardized Tests: Conflict or Coexistence. (Chicago, IL: Consortium on Chicago School Research, 2001).
164 U.S. Department of Education, Secretary’s Summit on Science: Talking Points. Washington, D.C., March 16, 2004.165 National Governors Association and Achieve, National Education Summit on High Schools, February 2005.
<http:// www.achieve.org>. .166 Illinois State Board of Education, The Context and Status of High School Reform in Illinois, February 2006.167 Illinois State Board of Education, Guidance Document: State Graduation Requirements (P.A. 94-0676), August
30, 2005.168 Courses Count: Preparing Students for Postsecondary Success. ACT Policy Report. (Iowa City, IA: ACT, Inc., 2005). 169 <www.nces.ed.gov/nationsreportcards/naepdata> 170 Crisis at the Core: Preparing All Students for College and Work, (Iowa City, IA: ACT, Inc., 2004).171 Clifford Adelman, Answers in the Tool Box: Academic Intensity, Attendance Patterns, and Bachelor’s Degree
Attainment, Washington, DC: U.S. Department of Education, 1999.172 Jennifer B. Presley and Yugin Gong, The Demographics and Academics of College Readiness in Illinois, IERC
2005-3, Edwardsville, IL: Illinois Education Research Council, 2005.173 Mann, Robert, Analysis of High School Achievement and College Readiness in Mathematics for Students in
Illinois, Submitted to Illinois State Board of Education, Springfield, IL, August 31, 2005.174 Jennifer B. Presley and Yugin Gong, The Demographics and Academics of College Readiness in Illinois, IERC
2005-3, Edwardsville, IL: Illinois Education Research Council, 2005; and Crisis at the Core: Preparing All Students for College and Work, (Iowa City, IA: ACT Inc., 2004)
175 <http://www.achieve.org/achieve.nsf/ADP-Math-Intro?OpenForm>176 M.G. Bardeen and L.M. Lederman. Coherence in Science Education. Science, 281: 178 179. 1998. <http://
www.jyi.org/volumes/volume6/issue7/features/pattanayak.html>177 National Governors Association and Achieve, National Education Summit on High Schools, February 2005.
<http:// www.achieve.org>. 178 Michael Cohen, Closing the Expectations Gap 2006, Washington, D.C.: Achieve, Inc., 2006.179 Illinois Department of Employment Security, Characteristics of Displaced Workers in Illinois in Private, Non-farm
Industries 2005 Quarterly. < http://lmi.ides.state.il.us/>180 “Career/Technical Education: The Solution to Our Dropout Crisis?,” Education Gadfly, 6 (17), April 27, 2006. 181 SREB, Getting Students Ready for College and Careers, Atlanta, GA: 2006, <www.sreb.org>. 182 Bayer Facts of Science Education IX - 2003, <www.bayerus.com/msms/news/facts.cfm>.183 Public Agenda, Reality Check 2006: Are Parents and Students Ready for More Math and Science?, Press Release
February 15, 2006.184 Dana Markow and Kathleen Moore, Kathleen, “Progress Toward Power: A Follow-up Survey of Children and
Parents Attitudes About Math and Science”, Research Letter, 9 (1), NACM, 2001.185 Peter D. Hart, Rising to the Challenge: Are High School Graduates Prepared for College and Work? (Washington,
DC: Achieve, Inc., 2005). 186 Bayer Facts of Science Education XI - 2005, <www.bayerus.com/news/facts.cfm>.
ENDNOTES
Illinois STEM Education Report 107
June 2006 © Northern Illinois University www.keepingillinoiscompetitive.niu.edu
187 George Wimberly and Richard Noeth, College Readiness Begins in Middle School: ACT Policy Report, Iowa City, IA: ACT Inc., 2005, <www.act.org/research/policy/index.html>, pp. viii-ix.
188 Courses Count: Preparing Students for Postsecondary Success: ACT Policy Report, ACT, Iowa City, IA, 2005 <www.act.org/research/policy/index.html).
189 ACT, Crisis at the Core, <http://www.act.org/path/policy/reports/crisis.html>.190 Illinois State Board of Education, Illinois Teacher Salary Study 2003-2004, Springfield, IL, 2004.191 Illinois State Board of Education, Educator Supply and Demand in Illinois: 2005 Annual Report, Springfield, IL,
December 2005.192 Council of Chief State School Officers, State Services and Technical Assistance, State Departments of
Education, Data on Public Schools, 2003-04. Washington, DC, 2005.193 Ibid. 194 Ibid.195 Bayer Facts of Science X – 2004, <www.bayerus.com/news/facti.cfm>.196 Such as Illinois Future Teacher Corp Program, Illinois Special Education Teacher Tuition Waiver, Minority
Teachers of Illinois, Robert C. Byrd Scholarship Program.197 Statement of Norman R. Augustine, Chair, Committee on Prospering in the Global Economy of the 21st
Century; and Committee on Science, Engineering, and Public Policy, Division on Policy and Global Affairs, The National Academies before the Committee on Science, U.S. House of Representatives, October 20, 2005
198 Ibid.199 National Science Foundation, Division of Science Resources Statistics, Science and Engineering Indicators 2006,
Arlington, VA (NSB 06-01) [February 2006], Table 8.32.200 Ibid., Table 8.34.201 Ibid., Table 8.19.202 Ibid., Table 8.10. 203 “Measuring Global Technology,” Technology Review, April 2006.204 National Science Foundation, Division of Science Resources Statistics, Science and Engineering Indicators 2006,
Arlington, VA (NSB 06-01) [February 2006], Table 8.30.205 Ibid., Table 8-26.206 Ibid., Table 8-27.207 Ibid., Table 8-39.208 Ibid., Table 8-29. 209 Lisa M. Lynch and Sandra E. Black, Beyond the Incidence of Training: Evidence from a National Employers
Survey (Cambridge, MA: National Bureau of Economic Research, August 1995).
ENDNOTES
June 2006 © Northern Illinois University www.keepingillinoiscompetitive.niu.edu
108 Science, Technology, Engineering and Mathematics Education
REFERENCES
Illinois STEM Education Report 109
June 2006 © Northern Illinois University www.keepingillinoiscompetitive.niu.edu
Adelman, C., Answers in the Tool Box: Academic Intensity, Attendance Patterns, and Bachelor’s Degree Attainment (Washington, DC: U.S. Department of Education, 1999).
Adelman, C., National Education Longitudinal Study (Washington, D.C.: NELS:88, 2004.
Adelman, C., The Tool Box Revisited: Paths to Degree Completion from High School through College (Washington, D.C.: U.S. Department of Education, 2006).
Alliance for Excellent Education, High School Dropouts Cost the U.S. Billions in Lost Wages and Taxes (Washington, D.C.: March 1, 2006).
American Council on Education, Increasing the Success of Minority Students in Science and Technology (Washington, D.C.: 2006).
American Diploma Project (The), Ready or Not: Creating a High School Diploma that Counts, 2004. http://www.achieve.org/achieve.nsf/ADPNetwork?OpenForm.
Association of American Universities and The Pew Charitable Trusts, Standards for Success, http://www.s4s.org/cepr.s4s.phpStandars for success.
Bardeen, M.G. and Lederman, L.M., Coherence in Science Education. Science, 281: (178), 1998. http://www.jyi.org/volumes/volume6/issue7/features/pattanayak.html.
Bayer Facts of Science Education Surveys (Pittsburgh, PA: Bayer, 2006). www.bayerus.com/msms/news/facts.cfm.
Billman, P., Buta, P., and Lewis, J., Comprehensive School Reform in Illinois: Statewide Annual Evaluation Program Year 2004-2005. Prepared for Illinois State Board of Education, December 2005.
Bush, G.W. American Competitiveness Initiative (Washington, D.C.: State of the Union Address, January 2006). http://www.whitehouse.gov/stateoftheunion/2006/aci/.
Business-Higher Education Forum, A Commitment to America’s Future: Responding to the Crisis in Mathematics and Science Education (Washington, D.C.: January, 2005).
Callan, P. M., Finney, J. E., Kirst, M. W., Usdan, M. D., and Venezia, A., Claiming Common Ground: State Policymaking for Improving College Readiness and Success. (Washington, D.C.: The Institute for Educational Leadership, The National Center for Public Policy and Higher Education, and The Stanford Institute for Higher Education Research, 2006).
Career/Technical Education: The Solution to Our Dropout Crisis?, Education Gadfly, 6 (17), April 27, 2006.
Carnevale, A.P. and Desrochers, D.M., Standards for What? The Economic Roots of K-16 Reform (Princeton, NJ: ETS, 2003).
Center for Tax and Budget Accountability and Northern Illinois University, The State of Working Illinois, 2005 (Chicago, IL: 2005). http://www.stateofworkingillinois.niu.edu.
REFERENCES
110 Science, Technology, Engineering and Mathematics Education
June 2006 © Northern Illinois University www.keepingillinoiscompetitive.niu.edu
Cohen, M., Closing the Expectations Gap 2006 (Washington, D.C.: Achieve, Inc., 2006).
College Board (The), Advanced Placement Program, National and 50 State Summary Reports, New York, 2004.
Colvin, G., “America Isn’t Ready,” Fortune Magazine (July 25, 2005).
Council of Chief State School Officers, State Services and Technical Assistance, State Departments of Education, Data on Public Schools, 2003-04 (Washington, D.C.: 2005).
Council on Competitiveness, A Roadmap for American Innovation (Washington, D.C.: 2005). www.compete.org.
Council on Competitiveness, Innovate America (Washington, D.C.: December 2004).
Courses Count: Preparing Students for Postsecondary Success: ACT Policy Report (Iowa City, IA: ACT Inc., 2005). www.act.org/research/policy/index.html.
Crisis at the Core: Preparing All Students for College and Work (Iowa City, IA: ACT Inc., 2004). http://www.act.org/path/policy/reports/crisis.html.
DeStefano, L. and Prestine, N., Evaluation of the Implementation of Illinois Learning Standards: Year Four Report, Report to the Illinois State Board of Education, August 2002.
Developing the STEM Education Pipeline, ACT High School Profile, State Composite for Illinois High School Graduating Class 2005 (Iowa City, IA: ACT Inc., 2006).
Donovan, M.S. and Bransford, J.D., Eds., How Students Learn: History, Mathematics, and Science in the Classroom, (Washington, DC: The National Academies Press, 2005).
Education Trust (The), Getting Honest About Grad Rates: How States Play the Numbers and Students Lose, June 2005.
Foreign Applications to Graduate Schools Rise After 2-Year Drop, Survey Finds, The Chronicle of Higher Education, March 23, 2006.
Gereffi, G. and Wadhwa, V., Framing the Engineering Outsourcing Debate: Placing the United States on a Level Playing Field with China and India (December 2005). http://memp.pratt.duke.edu/downloads/duke_outsourcing_2005.pdf.
Gordon, E.E., The 2010 Meltdown: Solving the Impending Jobs Crisis, (Westport, CT: Praeger Publishing, 2005).
Greene, J.P. and Winters, M.A., Leaving Boys Behind: Public High School Graduation Rates (New York, NY: Center for Civic Innovation at the Manhattan Institute, Civic Report No. 48, April 2006).
Greene, J.P. and Winters, M.A., Public High School Graduation and College-readiness Rates: 1991-2002. (New York, NY: Center for Civic Innovation at the Manhattan Institute, Education Working Paper No. 8, February 2005).
REFERENCES
Illinois STEM Education Report 111
June 2006 © Northern Illinois University www.keepingillinoiscompetitive.niu.edu
Gross, P., Goodenough, U., Lerner, L.S., Hack, S., Schwartz, M., Schwartz, R., and Finn, C.E. Jr., The State of State Science Standards 2005. (Washington, D.C.: Thomas B. Fordham Institute, 2005), http://www.edexcellence.net/institute/publication/publication.cfm?id=352.
Gunderson, S., Jones, R., and Scanland, K., The Jobs Revolution: Changing How America Works, (Chicago, IL: Copywriters, Inc., 2004).
Hart, P.D., Research Associates/Public Opinion Strategies, Rising to the Challenge: Are High School Graduates Prepared for College and Work? (Washington, DC: Achieve, Inc., 2005).
Honawar, V. “Indian Top Foreigners Bound for U.S. Colleges,” Education Week (November 30, 2005), p 21.
Illinois Board of Higher Education, Data Book 2005 (Springfield, IL: 2005). http://www.ibhe.org/Data%20Bank/DataBook/default.asp.
Illinois College Access Network, “Illinois High School Summit,” (Chicago, IL: Summary of Illinois High School Summit, September 29, 2005.
Illinois Department of Employment Security, Characteristics of Displaced Workers in Illinois in Private, Non-farm Industries 2005 Quarterly. http://lmi.ides.state.il.us/
Illinois Department of Employment Security, Local Area Unemployment Statistics. http://lmi.ides.state.il.us/laus/lausmenu.htm.
Illinois Department of Employment Security, The Illinois Labor Market Review, 9 (2), 2004. http://lmi.ides.state.il.us/lmr/winter_2004/ILMR.pdf.
Illinois Department of Employment Security, Workforce Boards of Metropolitan Chicago Job Vacancy Survey (Springfield, IL: May 2004).
Illinois State Board of Education and Northern Illinois University, Illinois Survey of Critical Technologies: Summary Report (Springfield, IL: March 2006).
Illinois State Board of Education, “Illinois TIMSS Scores Support Learning Standards”, (News Release, April 4, 2001).
Illinois State Board of Education, 2005 Illinois State Report Card (Springfield, IL: 2005). http://webprod1.isbe.net/ereportcard/publicsite/getSearchCriteria.aspx.
Illinois State Board of Education, Annual Report 2005 (Springfield, IL: 2005). http://www.isbe.net/board/pdf/AnnReport2005.pdf.
Illinois State Board of Education, Educator Supply and Demand in Illinois: 2005 Annual Report (Springfield, IL: December 2005).
Illinois State Board of Education, Guidance Document: State Graduation Requirements (Springfield, IL: P.A. 94-0676, August 30, 2005).
Illinois State Board of Education, Illinois Learning Standards. http://www.isbe.net/ils/.
REFERENCES
112 Science, Technology, Engineering and Mathematics Education
June 2006 © Northern Illinois University www.keepingillinoiscompetitive.niu.edu
Illinois State Board of Education, Illinois Teacher Salary Study 2003-2004 (Springfield, IL: 2004).
Illinois State Board of Education, Math, Science Education, (News Release, April 5, 2006).
Illinois State Board of Education, The Context and Status of High School Reform in Illinois (Springfield, IL: February 2006).
International Association for the Evaluation of Educational Achievement, Trends in International Mathematics and Science Study (TIMSS), 2003.
Kimmelman, P., Kroeze, D., Schmidt, W., van der Ploeg, A., McNeely, M., and Tan, A., A First Look at What We Can Learn from High Performing School Districts: An Analysis of TIMSS Data from the First in the World Consortium, August 1999. http://www.ed.gov/pubs/FirstLook/FiWConsortium.pdf.
Klein, D., Braams, B.J., Parker,T., Quirk, W., Schmid, W., Wilson, S., Finn, C.E., Torres, J., Braden, L., and Raimi, R.A., The State of State Math Standards 2005 (Washington, D.C.: Thomas B. Fordham Institute, 2005). http://www.edexcellence.net/institute/publication/publication.cfm?id=338S.
Lindsay, J.M. and Daalder, I., America’s Role in the World: Challenges to American Businesses and Higher Education (Washington, DC: Business-Higher Education Forum, August 2005).
Lynch, L.M. and Black, S.E., Beyond the Incidence of Training: Evidence from a National Employers Survey (Cambridge, MA: Nation Bureau of Economic Research, August 1995).
Mann, R., Analysis of High School Achievement and College Readiness in Mathematics for Students in Illinois, Submitted to Illinois State Board of Education, Springfield, IL, August 31, 2005.
Markow, D. and Moore, K., “Progress toward Power: A Follow-up Survey of Children and Parents Attitudes About Math and Science”, Research Letter, 9 (1), NACM, 2001.
Measuring What Matters: Creating a Longitudinal Data System to Improve Student Achievement. www.DataQualityCampaign.org.
National Academy of Sciences, National Academy of Engineering, and Institute of Medicine, Rising Above the Gathering Storm: Energizing and Employing America for a Brighter Economic Future, (Washington, D.C., 2005).
National Alliance of State Science and Mathematics Coalitions, Hands-on Program Adds Up for Arizona Math Students, NBS 3529 from Arizona Republic, April 4, 2006.
National Association of Manufacturers, 2005 Skills Gap Report - A Survey of the American Manufacturing Workforce (Washington, D.C.: Deloitte Development LLC, 2005).
National Business Roundtable, Tapping America’s Potential: The Education for Innovation Initiative, http://www.tap2015.org.
REFERENCES
Illinois STEM Education Report 113
June 2006 © Northern Illinois University www.keepingillinoiscompetitive.niu.edu
National Center for Public Policy and Higher Education (The), Policy Alert Supplement: Educational Level of Illinois’ Workforce Projected to Decline, (San Jose, CA: November 2005), http://www.highereducation.org/reports/pa_decline/states/IL.pdf.
National Center for Public Policy and Higher Education (the), Policy Alert Supplement: Illinois’ Educational Pipeline, (San Jose, CA: April 2004), http://www.ibhe.state.il.us/LegislativeBills/Summit/Materials/pipeline.pdf.
National Governors Association and Achieve, National Education Summit on High Schools, February 2005. http:// www.achieve.org.
National Postgraduate Exam Attracts Record 1.27 Million Examinees, Xinhua: People’s Daily Online (January 16, 2006). http://english.people.com.cn/.
National Science Board, America Pressing Challenge – Building a Stronger Foundation: A Companion to Science and Engineering Indicators – 2006 (Arlington, VA: NSB 06-02, January 2006).
National Science Board. (2006). Science and engineering indicators 2006. Two volumes. Arlington, VA: National Science Foundation (volume I, NSB 06-01; volume 2, NSB 06-01A, 2006).
Newman, F.M., A.S. Bryk, A.S., and Nagaoka, J.K., Authentic Intellectual Work and Standardized Tests: Conflict or Coexistence. (Chicago, IL: Consortium on Chicago School Research, 2001).
Northern Illinois University, Interactive Illinois Report Card, http://iirc.niu.edu/.
Olson, L., “Views Differ on Defining College Prep,” Education Week, April 26, 2006.
On Course for Success: A Close Look at Selected High School Courses that Prepare All Students for College, (Iowa City, IA: ACT and The Education Trust, 2004).
Organisation for Economic Co-operation and Development, First Results from PISA 2003:Executive Summary. http://www.oecd.org.
Partnership for 21st Century Skills, Results that Matter: 21st Century Skills and High School Reform (Washington, D.C.: U.S. Department of Education, March 2006).
Presley, J.B. and Gong, Y., the Demographics and Academics of College Readiness in Illinois (Edwardsville, IL: Illinois Education Research Council, IERC 2005-3, 2005).
Public Agenda, Reality Check 2006: Are Parents and Students Ready for More Math and Science? Press Release February 15, 2006.
Quality Counts, http://www.edweek.org/media/ew/qc/2006/17shr.il.h25.pdf.
Ramaley, J., “Policy Options Development,” Broadening Participation in Science and Engineering Research and Education: Workshop Proceedings NSF: Alliance for Graduate Education and Professoriate, 2001.
REFERENCES
114 Science, Technology, Engineering and Mathematics Education
June 2006 © Northern Illinois University www.keepingillinoiscompetitive.niu.edu
Reich, R., “The New Rich-Rich Gap”, Newsweek, (December 8, 2005). http://www.msnbc.msn.com/id/10206251/site/newsweek
Roper ASW, Baby Boomers Envision Retirement II-Key Findings: Survey of Baby Boomers’ Expectations for Retirement (Washington, D.C.: AARP, 2004).
Sandel, K. and Batchu, B., The Gap Persists: Closing Illinois’ Achievement Divide, A+ Illinois, 2005. http://www.aplusillinois.org/documents/TheGapPersistsReport106FINAL.pdf
Sanders, T., No Time to Waste: The Vital role of College and University Leaders in Improving Science and Mathematics Education, Paper presented at the Invitational Conference on Teacher Preparation and Institutions of Higher Education: Mathematics and Science Content Knowledge, U.S. Department of Education (Washington, D.C., October 5, 2004).
Scott, R. and Sanchez, S., New Mexico First: Mathematics and Science Education in New Mexico. Background report for Town Hall/Summit, November 17-18, 2005.
SREB, Getting Students Ready for College and Careers (Atlanta, GA: 2006). www.sreb.org.
Thomas B. Fordham Foundation, The Education Gadfly, 6(17), April 27, 2006. http://www.gatesfoundation.org/MediaCenter/Speeches/BillgSpeeches/BGSpeechNGA-050226.htm
U.S. Department of Education, Institute of Education Sciences, Projections to Education Statistics to 2014 (Washington, D.C.: NCES 2005-074, 2005). http://nces.ed.gov/programs/projections/.
U.S. Department of Education, Institute of Education Sciences, The Nation’s Report Card (Washington, D.C.: 2005). http://nces.ed.gov/nationsreportcard/.
U.S. Department of Education, Institute of Education Sciences, The Nation’s Report Card: Mathematics 2005 (Washington, D.C.: NCES 2006-453, 2006).
U.S. Department of Education, Institute of Education Sciences, The Nation’s Report Card: Science 2000 (Washington, D.C.: NCES 2002-452, 2002).
U.S. Department of Education, Secretary’s Summit on Science: Talking Points. Washington, D.C., March 16, 2004.
U.S. Department of Labor, Bureau of Labor Statistics, Fast Growing Occupations, 2006-07 Occupational Outlook Handbook, 2004-2014, (Washington, D.C.: December 21, 2005). http://bis.gov/news.release/ooh.t01.htm.
Wimberly, G. and Noeth, R., College Readiness Begins in Middle School: ACT Policy Report (Iowa City, IA: ACT Inc., 2005). www.act.org/research/policy/index.html.
Woods and Poole Economics, Inc., Projections for State of Illinois (Washington, D.C.: 2005).
REFERENCES
June 2006 © Northern Illinois University www.keepingillinoiscompetitive.niu.edu
Illinois STEM Education Report 115
APPENDICES
116 Science, Technology, Engineering and Mathematics Education
June 2006 © Northern Illinois University www.keepingillinoiscompetitive.niu.edu
Selections from the Illinois Learning StandardsWorkplace Skills and Career Development Competencies are available at http://www.isbe.net/ils/pdf/appendixD_workplace.pdf
Applications of Learning – Mathematics http://www.isbe.net/ils/math/standards.htm
Through Applications of Learning, students demonstrate and deepen their understanding of basic knowledge and skills. These applied learning skills cross academic disciplines and reinforce the important learning of the disciplines. The ability to use these skills will greatly influence students’ success in school, in the workplace and in the community.
Solving ProblemsRecognize and investigate problems; formulate and propose solutions supported by reason and evidence.
The solving of problems is at the heart of “doing mathematics.” When people are called on to apply their knowledge of numbers, symbols, operations, measurement, algebraic approaches, geometric concepts and relationships, and data analysis, mathematics’ power emerges. Sometimes problems appear well structured, almost like textbook exercises, and simply require the application of an algorithm or the interpretation of a relationship. Other times, particularly in occupational settings, the problems are non-routine and require some imagination and careful reasoning to solve. Students must have experience with a wide variety of problem-solving methods and opportunities for solving a wide range of problems. The ability to link the problem-solving methods learned in mathematics with a knowledge of objects and concepts from other academic areas is a fundamental survival skill for life.
CommunicatingExpress and interpret information and ideas.
Everyone must be able to read and write technical material to be competitive in the modern workplace. Mathematics provides students with opportunities to grow in the ability to read, write and talk about situations involving numbers, variables, equations, figures and graphs. The ability to shift between verbal, graphical, numerical and symbolic modes of representing a problem helps people formulate, understand, solve and communicate technical information. Students must have opportunities in mathematics classes to confront problems requiring them to translate between representations, both within mathematics and between mathematics and other areas; to communicate findings both orally and in writing; and to develop displays illustrating the relationships they have observed or constructed.
APPENDIX A
Illinois STEM Education Report 117
June 2006 © Northern Illinois University www.keepingillinoiscompetitive.niu.edu
APPENDIX A
Applications of Learning – Mathematics (continued)
Using TechnologyUse appropriate instruments, electronic equipment, computers and networks to access information, process ideas and communicate results.
Technology provides a means to carry out operations with speed and accuracy; to display, store and retrieve information and results; and to explore and extend knowledge. The technology of paper and pencil is appropriate in many mathematical situations. In many other situations, calculators or computers are required to find answers or create images. Specialized technology may be required to make measurements, determine results or create images. Students must be able to use the technology of calculators and computers including spreadsheets, dynamical geometry systems, computer algebra systems, and data analysis and graphing software to represent information, form conjectures, solve problems and communicate results.
Working on TeamsLearn and contribute productively as individuals and as members of groups.
The use of mathematics outside the classroom requires sharing expertise as well as applying individual knowledge and skills. Working in teams allows students to share ideas, to develop and coordinate group approaches to problems, and to share and learn from each other in communicating findings. Students must have opportunities to develop the skills and processes provided by team problem-solving experiences to be prepared to function as members of society and productive participants in the workforce.
Making ConnectionsRecognize and apply connections of important information and ideas within and among learning areas.
Mathematics is used extensively in business; the life, natural and physical sciences; the social sciences; and in the fine arts. Medicine, architecture, engineering, the industrial arts and a multitude of occupations are also dependent on mathematics. Mathematics offers necessary tools and ways of thinking to unite the concepts, relationships and procedures common to these areas. Mathematics provides a language for expressing ideas across disciplines, while, at the same time, providing connections linking number and operation, measurement, geometry, data and algebra within mathematics itself. Students must have experiences which require them to make such connections among mathematics and other disciplines. They will then see the power and utility that mathematics brings to expressing, understanding and solving problems in diverse settings beyond the classroom.
118 Science, Technology, Engineering and Mathematics Education
June 2006 © Northern Illinois University www.keepingillinoiscompetitive.niu.edu
Applications of Learning – Science http://www.isbe.net/ils/science/standards.htm
Through Applications of Learning, students demonstrate and deepen their understanding of basic knowledge and skills. These applied learning skills cross academic disciplines and reinforce the important learning of the disciplines. The ability to use these skills will greatly influence students’ success in school, in the workplace and in the community.
Solving ProblemsRecognize and investigate problems; formulate and propose solutions supported by reason and evidence.
Asking questions and seeking answers are at the heart of scientific inquiry. Following the steps of scientific inquiry, students learn how to gather evidence, review and understand their findings, and compare their solutions with those of others. They learn that there can be differing solutions to the same problem, some more useful than others. In the process, they learn and apply scientific principles. They also learn to be objective in deciding whether their solutions meet specifications and perform as desired.
CommunicatingExpress and interpret information and ideas.
Scientists must carefully describe their methods and results to a variety of audiences, including other scientists. This requires precise and complete descriptions and the presentation of conclusions supported by evidence. Young science students develop the powers of observation and description. Older students gain the ability to organize and study data, to determine its meaning, to translate their findings into clear understandable language and to compare their results with those of other investigators.
Using TechnologyUse appropriate instruments, electronic equipment, computers and networks to access information, process ideas and communicate results.
Technology is invented and improved by the use of scientific principles. In turn, scientists depend on technology in performing experiments, analyzing data and communicating the results. Science students learn to use a range of technologies: instruments, computer hardware and software, on-line services and equipment, primary source data and images, and communication networks. They learn how technology, in turn, is the result of a scientific design process that includes continual refinements and improvements.
APPENDIX A
Illinois STEM Education Report 119
June 2006 © Northern Illinois University www.keepingillinoiscompetitive.niu.edu
Applications of Learning – Science (continued)
Working on TeamsLearn and contribute productively as individuals and as members of groups.
The practical application of science requires both individual and group efforts. Individuals bring unique insight and focus to the work of inquiry and problem solving. Working in groups, scientists pose questions, share hypotheses, divide their experimental efforts, and share data and results. Science students have the opportunity to work both ways—as individuals and as members of teams organized to conduct complex investigations and solve problems.
Making ConnectionsRecognize and apply connections of important information and ideas within and among learning areas.
Science has many disciplines, all interrelated. Understanding the functioning of living things depends on knowing chemistry; understanding chemistry depends on knowing physics. In the same way, science itself is highly dependent on mathematics—and it also relates strongly to medicine, geography, physical development and health, social trends and issues, and many other topics. Science, at its best, provides knowledge and skills that improve the understanding of virtually all subjects.
APPENDIX A
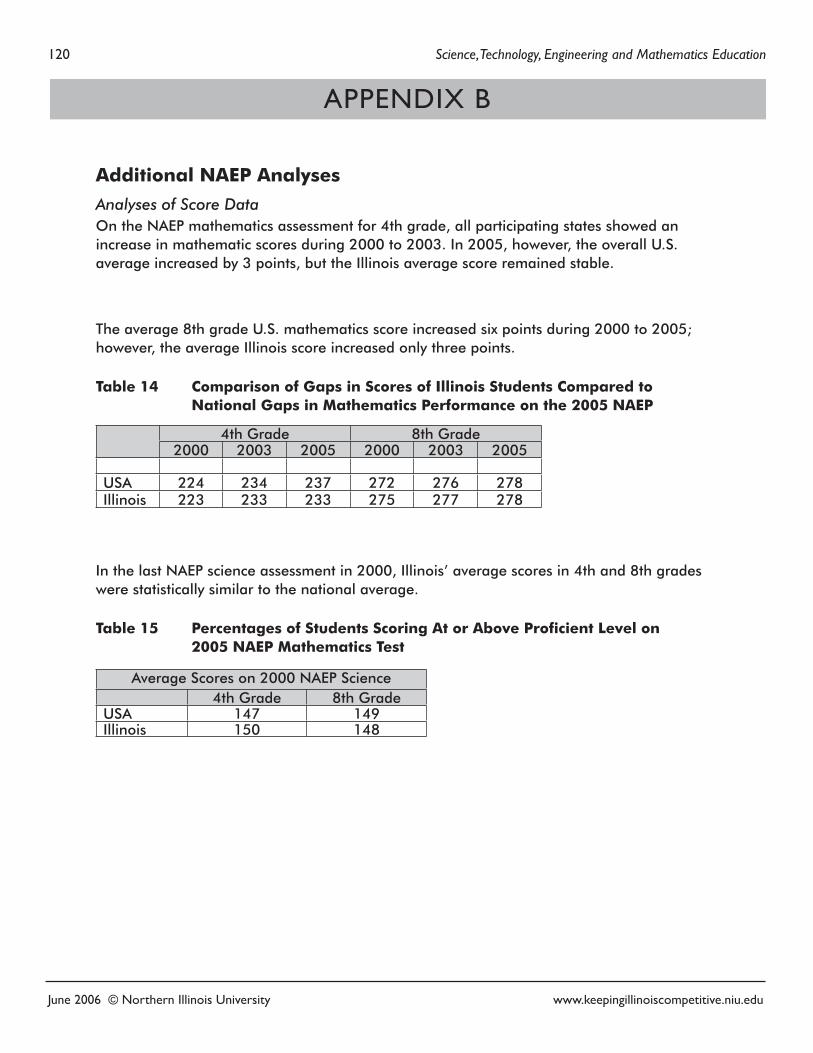
120 Science, Technology, Engineering and Mathematics Education
June 2006 © Northern Illinois University www.keepingillinoiscompetitive.niu.edu
Additional NAEP Analyses
Analyses of Score DataOn the NAEP mathematics assessment for 4th grade, all participating states showed an increase in mathematic scores during 2000 to 2003. In 2005, however, the overall U.S. average increased by 3 points, but the Illinois average score remained stable.
The average 8th grade U.S. mathematics score increased six points during 2000 to 2005; however, the average Illinois score increased only three points.
Table 14 Comparison of Gaps in Scores of Illinois Students Compared to National Gaps in Mathematics Performance on the 2005 NAEP
4th Grade 8th Grade2000 2003 2005 2000 2003 2005
USA 224 234 237 272 276 278Illinois 223 233 233 275 277 278
In the last NAEP science assessment in 2000, Illinois’ average scores in 4th and 8th grades were statistically similar to the national average.
Table 15 Percentages of Students Scoring At or Above Proficient Level on 2005 NAEP Mathematics Test
Average Scores on 2000 NAEP Science 4th Grade 8th Grade
USA 147 149Illinois 150 148
APPENDIX B
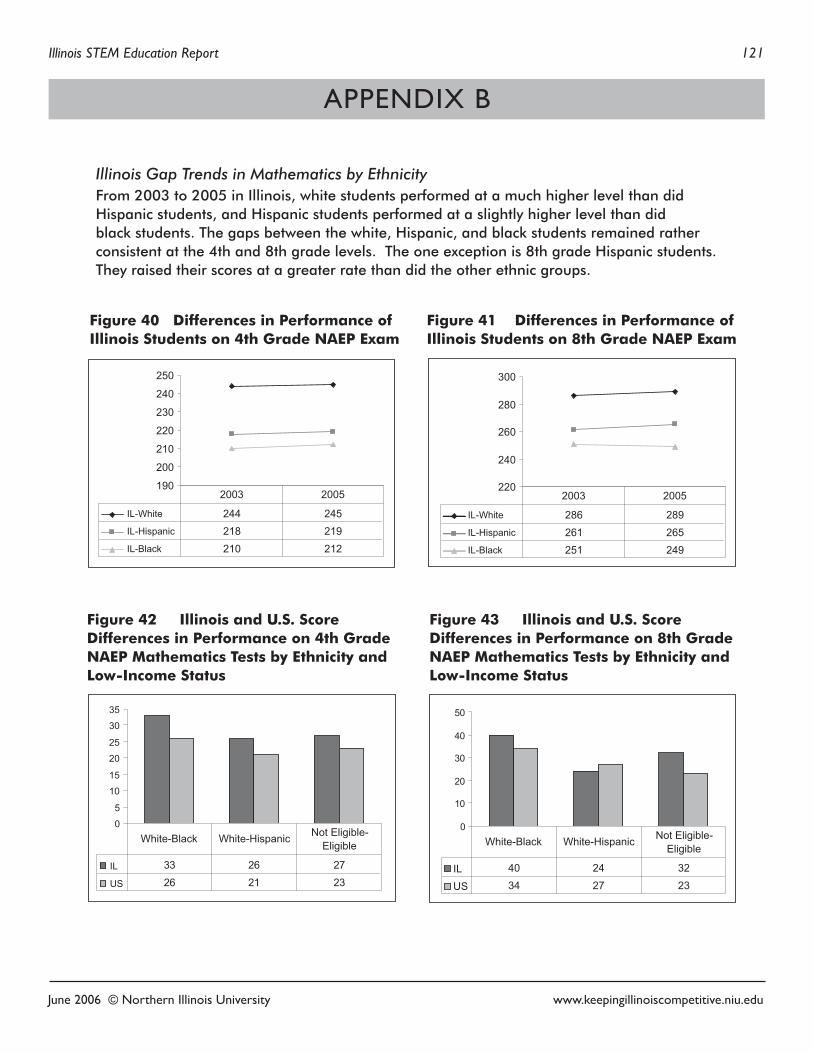
Illinois STEM Education Report 121
June 2006 © Northern Illinois University www.keepingillinoiscompetitive.niu.edu
Illinois Gap Trends in Mathematics by Ethnicity From 2003 to 2005 in Illinois, white students performed at a much higher level than did Hispanic students, and Hispanic students performed at a slightly higher level than did black students. The gaps between the white, Hispanic, and black students remained rather consistent at the 4th and 8th grade levels. The one exception is 8th grade Hispanic students. They raised their scores at a greater rate than did the other ethnic groups.
APPENDIX B
190
200
210
220
230
240
250
IL-White 244 245IL-Hispanic 218 219IL-Black 210 212
2003 2005
Figure 40 Differences in Performance of Illinois Students on 4th Grade NAEP Exam
Figure 41 Differences in Performance of Illinois Students on 8th Grade NAEP Exam
220
240
260
280
300
IL-White 286 289IL-Hispanic 261 265IL-Black 251 249
2003 2005
0
5
10
15
20
25
30
35
IL 33 26 27
US 26 21 23
White-Black White-Hispanic Not Eligible-Eligible
Figure 42 Illinois and U.S. Score Differences in Performance on 4th Grade NAEP Mathematics Tests by Ethnicity and Low-Income Status
Figure 43 Illinois and U.S. Score Differences in Performance on 8th Grade NAEP Mathematics Tests by Ethnicity and Low-Income Status
0
10
20
30
40
50
IL 40 24 32
US 34 27 23
White-Black White-Hispanic Not Eligible-Eligible
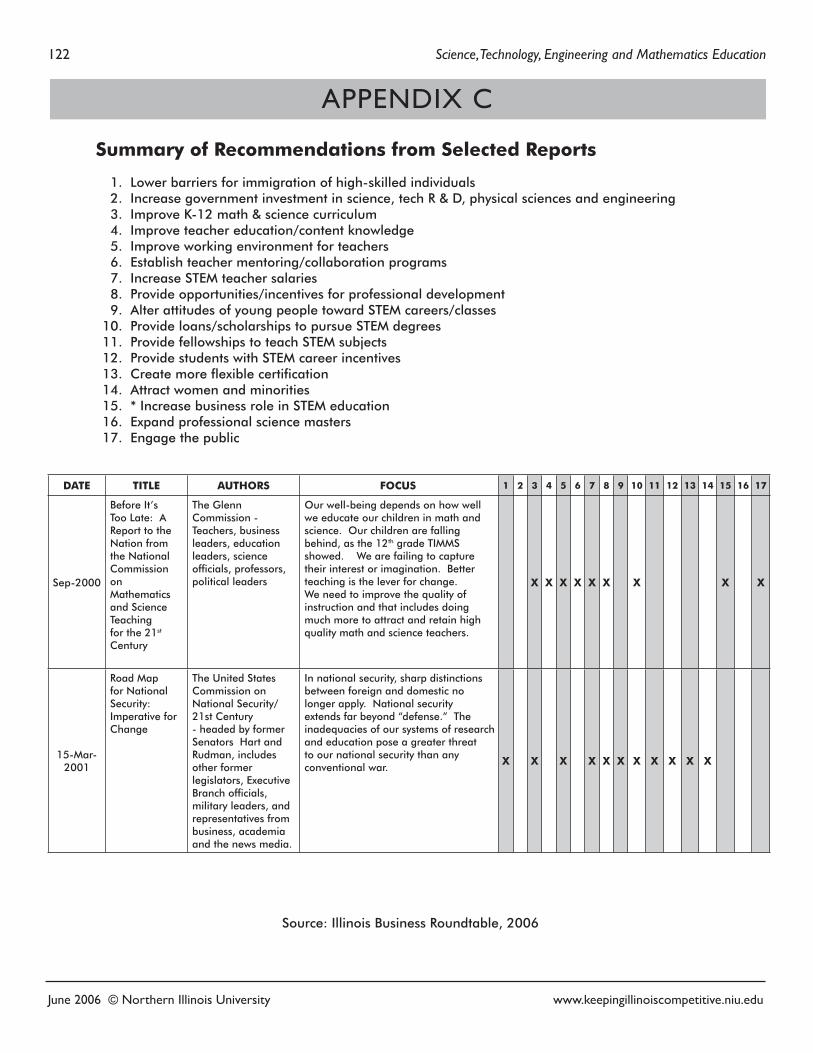
122 Science, Technology, Engineering and Mathematics Education
June 2006 © Northern Illinois University www.keepingillinoiscompetitive.niu.edu
Summary of Recommendations from Selected Reports
1. Lower barriers for immigration of high-skilled individuals 2. Increase government investment in science, tech R & D, physical sciences and engineering 3. Improve K-12 math & science curriculum 4. Improve teacher education/content knowledge 5. Improve working environment for teachers 6. Establish teacher mentoring/collaboration programs 7. Increase STEM teacher salaries 8. Provide opportunities/incentives for professional development 9. Alter attitudes of young people toward STEM careers/classes 10. Provide loans/scholarships to pursue STEM degrees 11. Provide fellowships to teach STEM subjects 12. Provide students with STEM career incentives 13. Create more flexible certification 14. Attract women and minorities 15. * Increase business role in STEM education 16. Expand professional science masters 17. Engage the public
APPENDIX C
DATE TITLE AUTHORS FOCUS 1 2 3 4 5 6 7 8 9 10 11 12 13 14 15 16 17
Sep-2000
Before It’s Too Late: A Report to the Nation from the National Commission on Mathematics and Science Teaching for the 21st Century
The Glenn Commission - Teachers, business leaders, education leaders, science officials, professors, political leaders
Our well-being depends on how well we educate our children in math and science. Our children are falling behind, as the 12th grade TIMMS showed. We are failing to capture their interest or imagination. Better teaching is the lever for change. We need to improve the quality of instruction and that includes doing much more to attract and retain high quality math and science teachers.
X X X X X X
X
X
X
15-Mar-2001
Road Map for National Security: Imperative for Change
The United States Commission on National Security/21st Century - headed by former Senators Hart and Rudman, includes other former legislators, Executive Branch officials, military leaders, and representatives from business, academia and the news media.
In national security, sharp distinctions between foreign and domestic no longer apply. National security extends far beyond “defense.” The inadequacies of our systems of research and education pose a greater threat to our national security than any conventional war.
X
X
X
X X X X X X X X
Source: Illinois Business Roundtable, 2006
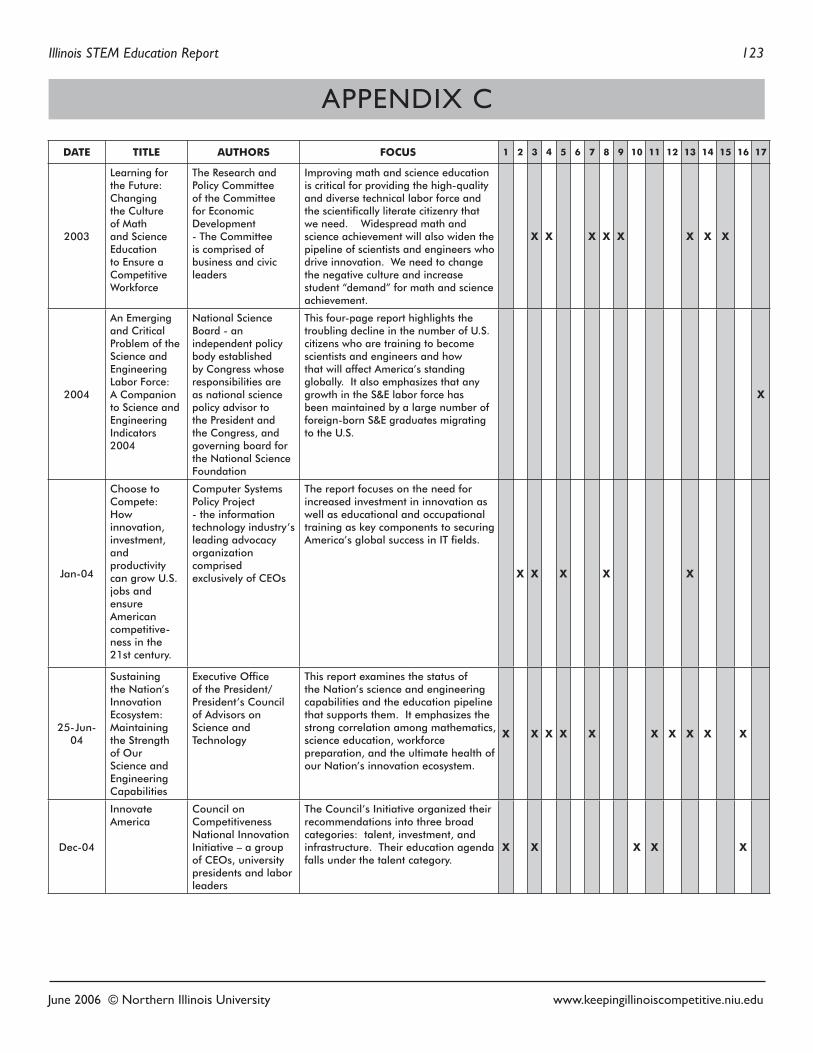
Illinois STEM Education Report 123
June 2006 © Northern Illinois University www.keepingillinoiscompetitive.niu.edu
APPENDIX C
DATE TITLE AUTHORS FOCUS 1 2 3 4 5 6 7 8 9 10 11 12 13 14 15 16 17
2003
Learning for the Future: Changing the Culture of Math and Science Education to Ensure a Competitive Workforce
The Research and Policy Committee of the Committee for Economic Development - The Committee is comprised of business and civic leaders
Improving math and science education is critical for providing the high-quality and diverse technical labor force and the scientifically literate citizenry that we need. Widespread math and science achievement will also widen the pipeline of scientists and engineers who drive innovation. We need to change the negative culture and increase student “demand” for math and science achievement.
X X
X X X
X X X
2004
An Emerging and Critical Problem of the Science and Engineering Labor Force: A Companion to Science and Engineering Indicators 2004
National Science Board - an independent policy body established by Congress whose responsibilities are as national science policy advisor to the President and the Congress, and governing board for the National Science Foundation
This four-page report highlights the troubling decline in the number of U.S. citizens who are training to become scientists and engineers and how that will affect America’s standing globally. It also emphasizes that any growth in the S&E labor force has been maintained by a large number of foreign-born S&E graduates migrating to the U.S.
X
Jan-04
Choose to Compete: How innovation, investment, and productivity can grow U.S. jobs and ensure American competitive-ness in the 21st century.
Computer Systems Policy Project - the information technology industry’s leading advocacy organization comprised exclusively of CEOs
The report focuses on the need for increased investment in innovation as well as educational and occupational training as key components to securing America’s global success in IT fields.
X X X X X
25-Jun-04
Sustaining the Nation’s Innovation Ecosystem: Maintaining the Strength of Our Science and Engineering Capabilities
Executive Office of the President/ President’s Council of Advisors on Science and Technology
This report examines the status of the Nation’s science and engineering capabilities and the education pipeline that supports them. It emphasizes the strong correlation among mathematics, science education, workforce preparation, and the ultimate health of our Nation’s innovation ecosystem.
X
X X X
X
X X X X
X
Dec-04
Innovate America
Council on Competitiveness National Innovation Initiative – a group of CEOs, university presidents and labor leaders
The Council’s Initiative organized their recommendations into three broad categories: talent, investment, and infrastructure. Their education agenda falls under the talent category.
X
X
X X
X
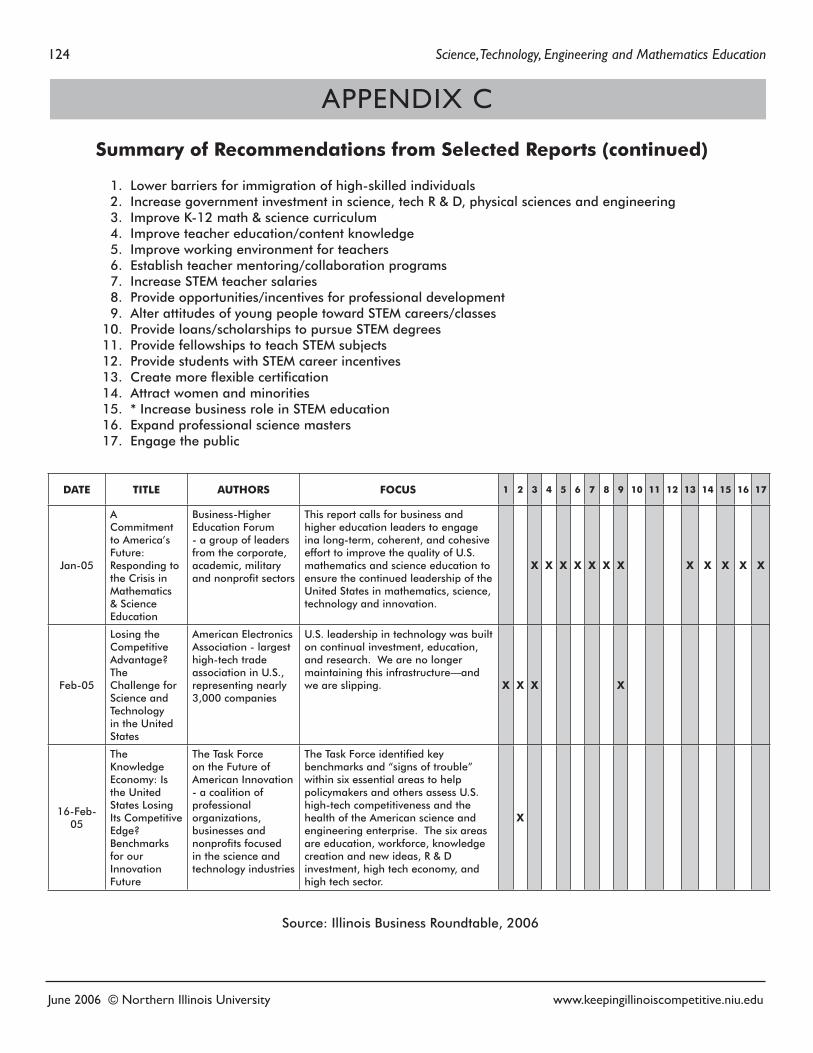
124 Science, Technology, Engineering and Mathematics Education
June 2006 © Northern Illinois University www.keepingillinoiscompetitive.niu.edu
DATE TITLE AUTHORS FOCUS 1 2 3 4 5 6 7 8 9 10 11 12 13 14 15 16 17
Jan-05
A Commitment to America’s Future: Responding to the Crisis in Mathematics & Science Education
Business-Higher Education Forum - a group of leaders from the corporate, academic, military and nonprofit sectors
This report calls for business and higher education leaders to engage ina long-term, coherent, and cohesive effort to improve the quality of U.S. mathematics and science education to ensure the continued leadership of the United States in mathematics, science, technology and innovation.
X X X X X X X
X X X X X
Feb-05
Losing the Competitive Advantage? The Challenge for Science and Technology in the United States
American Electronics Association - largest high-tech trade association in U.S., representing nearly 3,000 companies
U.S. leadership in technology was built on continual investment, education, and research. We are no longer maintaining this infrastructure—and we are slipping. X X X
X
16-Feb-05
The Knowledge Economy: Is the United States Losing Its Competitive Edge? Benchmarks for our Innovation Future
The Task Force on the Future of American Innovation - a coalition of professional organizations, businesses and nonprofits focused in the science and technology industries
The Task Force identified key benchmarks and “signs of trouble” within six essential areas to help policymakers and others assess U.S. high-tech competitiveness and the health of the American science and engineering enterprise. The six areas are education, workforce, knowledge creation and new ideas, R & D investment, high tech economy, and high tech sector.
X
Summary of Recommendations from Selected Reports (continued)
1. Lower barriers for immigration of high-skilled individuals 2. Increase government investment in science, tech R & D, physical sciences and engineering 3. Improve K-12 math & science curriculum 4. Improve teacher education/content knowledge 5. Improve working environment for teachers 6. Establish teacher mentoring/collaboration programs 7. Increase STEM teacher salaries 8. Provide opportunities/incentives for professional development 9. Alter attitudes of young people toward STEM careers/classes 10. Provide loans/scholarships to pursue STEM degrees 11. Provide fellowships to teach STEM subjects 12. Provide students with STEM career incentives 13. Create more flexible certification 14. Attract women and minorities 15. * Increase business role in STEM education 16. Expand professional science masters 17. Engage the public
APPENDIX C
Source: Illinois Business Roundtable, 2006
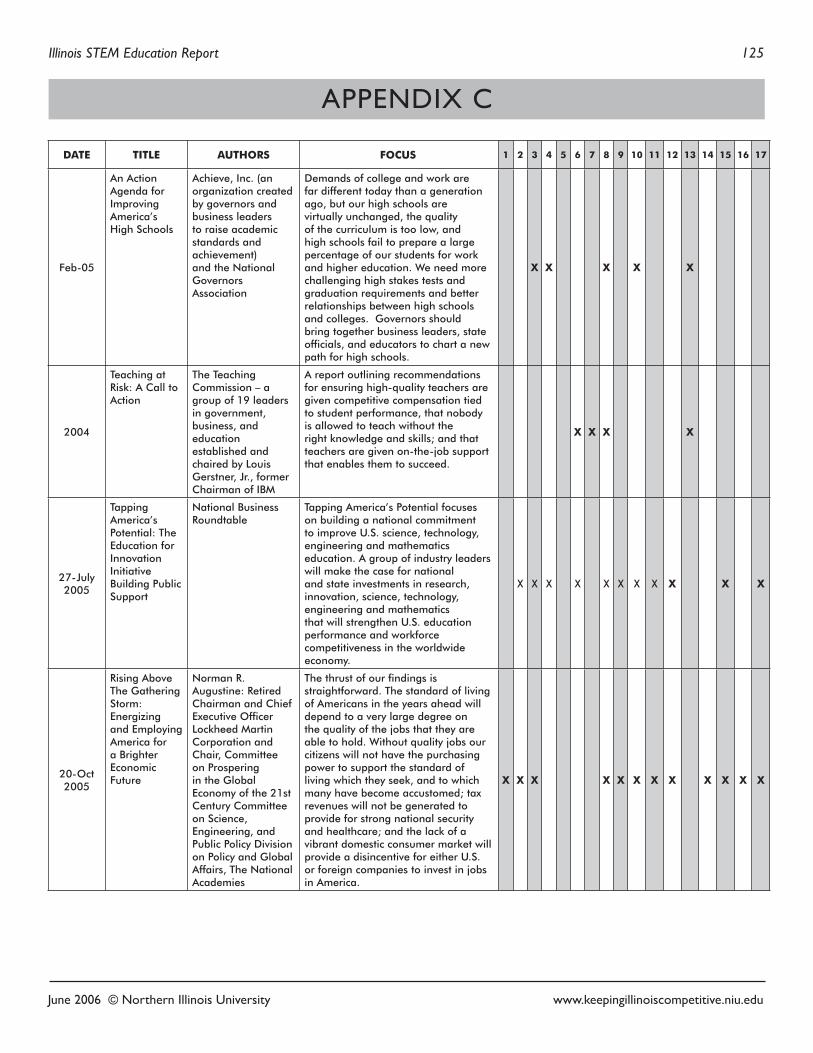
Illinois STEM Education Report 125
June 2006 © Northern Illinois University www.keepingillinoiscompetitive.niu.edu
DATE TITLE AUTHORS FOCUS 1 2 3 4 5 6 7 8 9 10 11 12 13 14 15 16 17
Feb-05
An Action Agenda for Improving America’s High Schools
Achieve, Inc. (an organization created by governors and business leaders to raise academic standards and achievement) and the National Governors Association
Demands of college and work are far different today than a generation ago, but our high schools are virtually unchanged, the quality of the curriculum is too low, and high schools fail to prepare a large percentage of our students for work and higher education. We need more challenging high stakes tests and graduation requirements and better relationships between high schools and colleges. Governors should bring together business leaders, state officials, and educators to chart a new path for high schools.
X X
X
X
X
2004
Teaching at Risk: A Call to Action
The Teaching Commission – a group of 19 leaders in government, business, and education established and chaired by Louis Gerstner, Jr., former Chairman of IBM
A report outlining recommendations for ensuring high-quality teachers are given competitive compensation tied to student performance, that nobody is allowed to teach without the right knowledge and skills; and that teachers are given on-the-job support that enables them to succeed.
X X X
X
27-July 2005
Tapping America’s Potential: The Education for Innovation Initiative Building Public Support
National Business Roundtable
Tapping America’s Potential focuses on building a national commitment to improve U.S. science, technology, engineering and mathematics education. A group of industry leaders will make the case for national and state investments in research, innovation, science, technology, engineering and mathematics that will strengthen U.S. education performance and workforce competitiveness in the worldwide economy.
X X X X X X X X X X X
20-Oct 2005
Rising Above The Gathering Storm: Energizing and Employing America for a Brighter Economic Future
Norman R. Augustine: Retired Chairman and Chief Executive Officer Lockheed Martin Corporation and Chair, Committee on Prospering in the Global Economy of the 21st Century Committee on Science, Engineering, and Public Policy Division on Policy and Global Affairs, The National Academies
The thrust of our findings is straightforward. The standard of living of Americans in the years ahead will depend to a very large degree on the quality of the jobs that they are able to hold. Without quality jobs our citizens will not have the purchasing power to support the standard of living which they seek, and to which many have become accustomed; tax revenues will not be generated to provide for strong national security and healthcare; and the lack of a vibrant domestic consumer market will provide a disincentive for either U.S. or foreign companies to invest in jobs in America.
X X X X X X X X X X X X
APPENDIX C
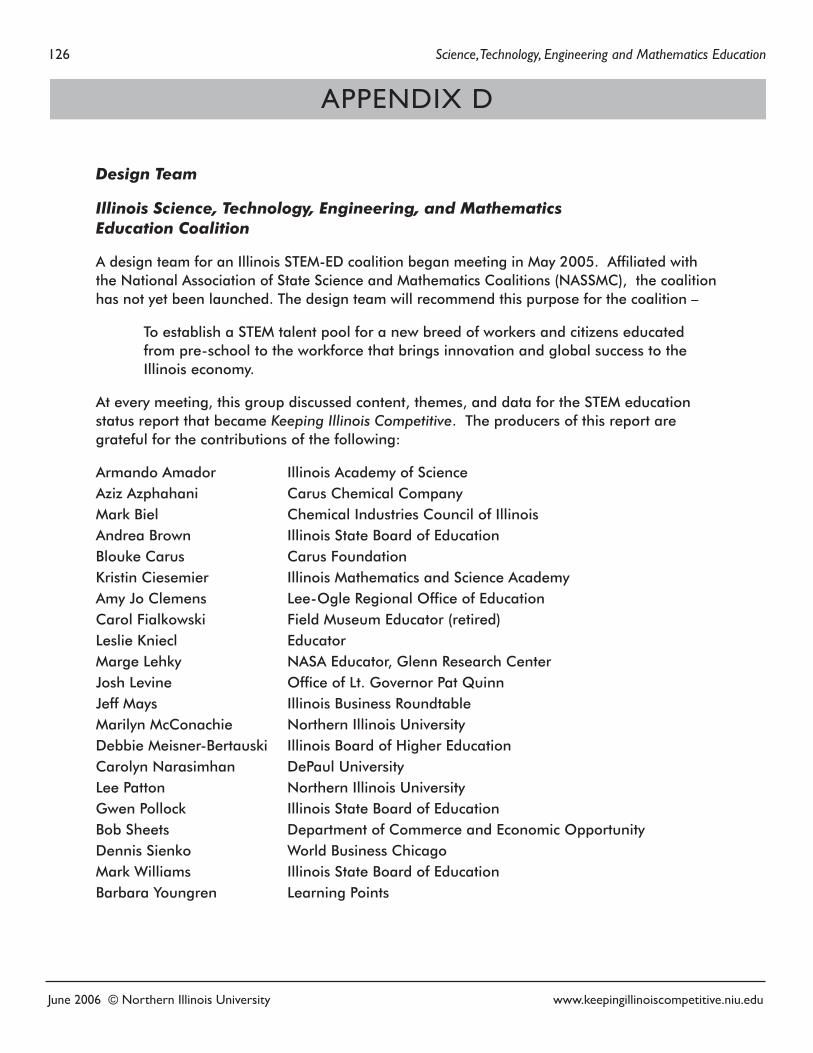
126 Science, Technology, Engineering and Mathematics Education
June 2006 © Northern Illinois University www.keepingillinoiscompetitive.niu.edu
APPENDIX D
Design Team
Illinois Science, Technology, Engineering, and Mathematics Education Coalition
A design team for an Illinois STEM-ED coalition began meeting in May 2005. Affiliated with the National Association of State Science and Mathematics Coalitions (NASSMC), the coalition has not yet been launched. The design team will recommend this purpose for the coalition –
To establish a STEM talent pool for a new breed of workers and citizens educated from pre-school to the workforce that brings innovation and global success to the Illinois economy.
At every meeting, this group discussed content, themes, and data for the STEM education status report that became Keeping Illinois Competitive. The producers of this report are grateful for the contributions of the following:
Armando Amador Illinois Academy of ScienceAziz Azphahani Carus Chemical CompanyMark Biel Chemical Industries Council of IllinoisAndrea Brown Illinois State Board of EducationBlouke Carus Carus FoundationKristin Ciesemier Illinois Mathematics and Science AcademyAmy Jo Clemens Lee-Ogle Regional Office of EducationCarol Fialkowski Field Museum Educator (retired)Leslie Kniecl EducatorMarge Lehky NASA Educator, Glenn Research CenterJosh Levine Office of Lt. Governor Pat QuinnJeff Mays Illinois Business RoundtableMarilyn McConachie Northern Illinois UniversityDebbie Meisner-Bertauski Illinois Board of Higher EducationCarolyn Narasimhan DePaul UniversityLee Patton Northern Illinois UniversityGwen Pollock Illinois State Board of EducationBob Sheets Department of Commerce and Economic OpportunityDennis Sienko World Business ChicagoMark Williams Illinois State Board of EducationBarbara Youngren Learning Points

Illinois STEM Education Report 127
June 2006 © Northern Illinois University www.keepingillinoiscompetitive.niu.edu
© June 2006
STEM EDUCATION REPORT
Science, Technology, Engineering & Math EducationILLINOIS STATUS REPORT
Related Documents