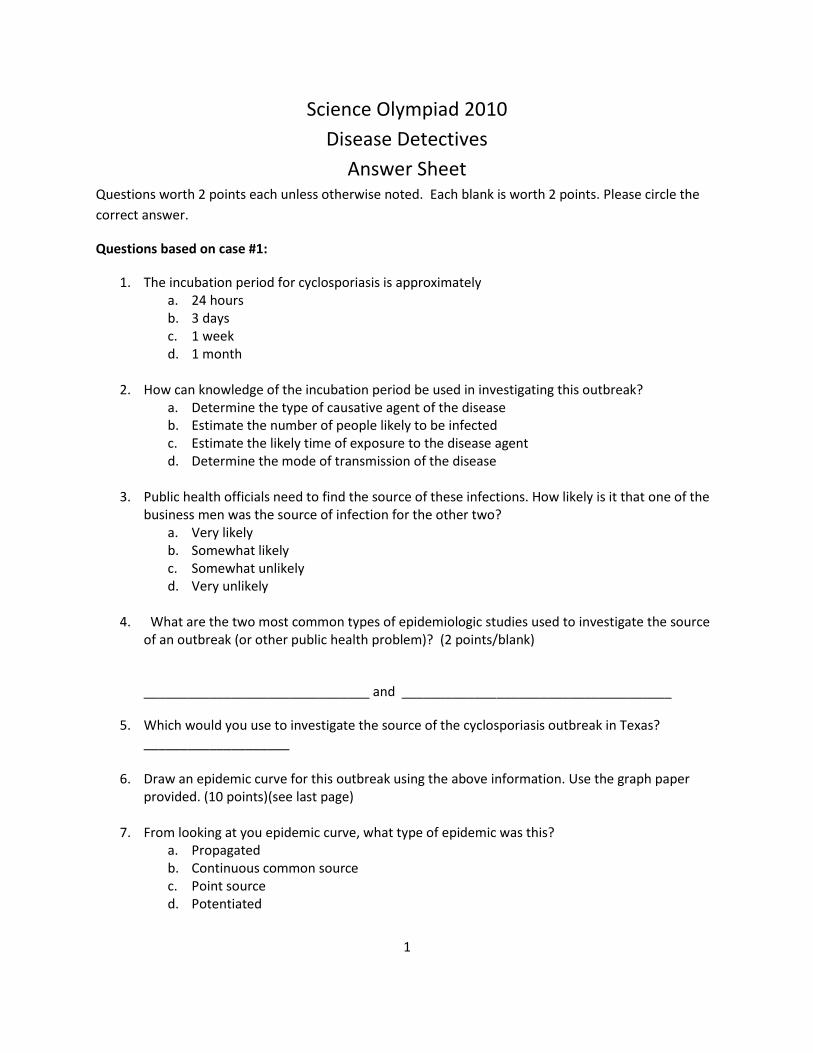
1 Science Olympiad 2010 Disease Detectives Answer Sheet Questions worth 2 points each unless otherwise noted. Each blank is worth 2 points. Please circle the correct answer. Questions based on case #1: 1. The incubation period for cyclosporiasis is approximately a. 24 hours b. 3 days c. 1 week d. 1 month 2. How can knowledge of the incubation period be used in investigating this outbreak? a. Determine the type of causative agent of the disease b. Estimate the number of people likely to be infected c. Estimate the likely time of exposure to the disease agent d. Determine the mode of transmission of the disease 3. Public health officials need to find the source of these infections. How likely is it that one of the business men was the source of infection for the other two? a. Very likely b. Somewhat likely c. Somewhat unlikely d. Very unlikely 4. What are the two most common types of epidemiologic studies used to investigate the source of an outbreak (or other public health problem)? (2 points/blank) _______________________________ and _____________________________________ 5. Which would you use to investigate the source of the cyclosporiasis outbreak in Texas? ____________________ 6. Draw an epidemic curve for this outbreak using the above information. Use the graph paper provided. (10 points)(see last page) 7. From looking at you epidemic curve, what type of epidemic was this? a. Propagated b. Continuous common source c. Point source d. Potentiated

Welcome message from author
This document is posted to help you gain knowledge. Please leave a comment to let me know what you think about it! Share it to your friends and learn new things together.
Transcript
1
Science Olympiad 2010
Disease Detectives
Answer Sheet Questions worth 2 points each unless otherwise noted. Each blank is worth 2 points. Please circle the
correct answer.
Questions based on case #1:
1. The incubation period for cyclosporiasis is approximately a. 24 hours b. 3 days c. 1 week d. 1 month
2. How can knowledge of the incubation period be used in investigating this outbreak? a. Determine the type of causative agent of the disease b. Estimate the number of people likely to be infected c. Estimate the likely time of exposure to the disease agent d. Determine the mode of transmission of the disease
3. Public health officials need to find the source of these infections. How likely is it that one of the business men was the source of infection for the other two?
a. Very likely b. Somewhat likely c. Somewhat unlikely d. Very unlikely
4. What are the two most common types of epidemiologic studies used to investigate the source
of an outbreak (or other public health problem)? (2 points/blank)
_______________________________ and _____________________________________
5. Which would you use to investigate the source of the cyclosporiasis outbreak in Texas? ____________________
6. Draw an epidemic curve for this outbreak using the above information. Use the graph paper
provided. (10 points)(see last page)
7. From looking at you epidemic curve, what type of epidemic was this? a. Propagated b. Continuous common source c. Point source d. Potentiated

2
8. Compared to people who didn’t eat the berry dessert, people who did eat the berry dessert were
a. No more likely to become ill
b. Twice as likely to become ill
c. 10 times more likely to become ill
d. 100 times more likely to become ill
9. There was a less than one-in-10,000 chance that the observed relative risk was due to chance
alone. Circle one: True or false? 10. Provide a case definition for this outbreak investigation. (4 points)
11. Cyclospora are transmitted by the fecal-oral route. List 3 other routes of transmission of infectious agents.
a. _________________________
b. _________________________
c. __________________________
12. What is the first step in an outbreak investigation such as this? a. Verify the diagnosis b. Prepare a case definition c. Prepare to investigate d. Prepare a budget
13. The epidemiological triad includes what three elements?
a. ____________________________
b. ____________________________
c. ____________________________

3
Questions based on case #2
14. The question that this research study was attempting to answer was
a. Do people working in backyard battery repair shops (BBRS) have increased levels of lead
in their blood?
b. Do household members of people working in BBRS have increased levels of lead in their
blood?
c. Does blood lead level correlate with lower IQ?
d. Is treatment for lead poisoning reaching everyone who needs it?
15. Based on the data presented in figure 1, the group with the highest blood concentration of lead
is
a. BBRS/worker
b. BBRS
c. Worker
d. Control
16. Confounding variables are
a. Factors outside the experimenter’s control
b. Factors that don’t affect the interpretation of data
c. Factors that affect the interpretation of data
17. List two potential confounding variables in this study.
a.__________________________________
b. __________________________________
18. Based on the data in figure 1, a child is in greater danger of lead poisoning if he or she lives near
a BBRS than if he or she has a family member working at a BBRS. Please circle: True or False
19. Which group or group of subjects included children with greater than 70 micrograms/deciliter of
lead in their blood? (Circle all that are correct)
a. BBRS/Worker
b. BBRS
c. Worker
d. Control
4
20. Which group or groups of subjects included at least some children with less than 25
micrograms/deciliter of lead in their blood? (Circle all that are correct)
a. BBRS/Worker
b. BBRS
c. Worker
d. Control
21. The area lead concentration was similar in the BBRS/worker group samples and the BBRS
samples. Please circle: True or False
22. The peak lead concentration was how much higher in the BBRS/worker group compared to the
BBRS group?
a. Equally high
b. Two times as high
c. Ten times as high
d. One hundred times as high
23. A flaw in the presentation of this study is
a. Lack of information on statistical significance
b. Lack of a control group
c. Exposing subjects to lead
d. All of the above
24. List three recommendations you would make to address the problem of lead poisoning in
Jamaica.
a. ______________________________________
b. ______________________________________
c. ______________________________________
5
Questions based on case #3
25. The investigators defined acute malnutrition as
a. Weight for height that was twice the median normal weight for height
b. Weight for height that was 2 standard deviations below the median normal weight for
height
c. Height that was less than half the median normal height for that age
d. Height that was 2 standard deviations below the median normal height for that age
26. The investigators defined chronic malnutrition as
a. Weight for height that was twice the median normal weight for height
b. Weight for height that was 2 standard deviations below the median normal weight for
height
c. Height that was less than half the median normal height for that age
d. Height that was 2 standard deviations below the median normal height for that age
27. What percentage of two-five year olds were acutely or chronically malnourished?
a. 33.4%
b. 36%
c. 40.2%
d. 75%
28. What age group had the highest incidence of anemia?
a. 6-11 months
b. 12-23 months
c. 24-59 months
29. Which age group had the highest incidence of chronic malnutrition?
a. 6-11 months
b. 12-23 months
c. 24-59 months
30. Anemia is an indicator of a deficiency in
a. Zinc
b. Copper
c. Iodine
d. Iron
6
31. What percentage of the children in this study had diarrhea?
a. 100%
b. 51.9%
c. 46.2%
d. 30.0%
32. Name two bacteria that cause diarrhea.
a. _________________
b. __________________
33. Name one of the primary viral causes of diarrhea
a. _____________________
34. Diarrhea is usually transmitted by which route?
a. _________________________
35. What is the major health problem related to nutrition in the United States?
a. ______________________________
36. One of the consequences of the current nutrition-related health problem in the United States in
the increased incidence of
a. Anemia
b. Diarrhea
c. Type 2 diabetes
d. Osteoporosis

Disease Detectives
2010 Science Olympiad UW-Oshkosh Regional Tournament
March 6, 2010 Division C
Team #______
School: ____________________ Student 1 Name: _____________ Student 2 Name: _____________
Hosted by Science Outreach

Disease Detectives Regional 2010 – Division C Exam
2 Page Total _______
Directions: Read the following scenarios and answer the questions that follow. Questions are matching, multiple choice, or short answer. The number in parenthesis indicates the point value for each question.
1. Match the following terms on the left with the definitions on the right. Each term will have only one
answer. (15)
A. Relative risk
a) An animate, living insect or animal that is involved with transmission of the disease agent.
B. Attack rate
b) Disease or infectious agent that is habitually present in a community, geographic area, or population group.
C. Odds ratio
c) More cases of a particular disease than expected in a given area or among a specialized group of people over a particular period of time.
D. Line list
d) Occurrence of a disease clearly in excess of normal expectancy.
E. Epidemic curve
e) An inanimate object that is laden with disease-causing agents.
F. Vector
f) Study that follows a group of subjects who received a specific exposure in order to examine the differences in incidence of a specific disease or other outcome of interest.
G. Fomite
g) The rate that a group experienced an outcome or illness.
H. Cohort
h) Chart of information about each case.
I. Case-control
i) An epidemic that spans a wide geographic area.
J. Endemic
j) Measure of association between frequency of exposure and frequency of outcome (formula is AD/BC).
K. Outbreak
k) Occurrence of an illness or illnesses in a population.
L. Epidemic
l) A histogram showing the course of a disease or outbreak.
M. Pandemic
m) Study that compares individuals who have a disease with individuals who do not have the disease in order to examine differences in exposures or risk factors for the disease
N. Mortality
n) Ratio of the risk of disease or death among the exposed to the risk among the unexposed.
O. Morbidity
o) Occurrence of death in a population.
2. In 1965, 400 soldiers were exposed to radiation from a bomb explosion. A total of 50 solders were 25
yards away, 100 solders were 1000 yards away, 200 solders were 2000 yards away, and 75 soldiers were 5000 yards away when the bomb exploded. A disease detective wants to determine the effect of this radiation exposure and these soldiers developing cancer. What data analysis would you perform? (1)
a. Odds ratio b. Attack rate c. Relative risk d. Risk ratio e. Incidence rate

Disease Detectives Regional 2010 – Division C Exam
3 Page Total _______
A disease detective is examining the relationship between consuming alcohol within 2 hours of driving a car and having a car accident.
3. Complete Table 1 using the following data from the study. Of the people in this study, a total of 150 people did not drink and were not involved in a car accident. 40 people did consume alcohol, but did not get into a car accident. 80 people drank alcohol and got into a car accident, and 90 people did not consume alcohol, but did get into a car accident. Note, all shaded boxes must be completed for full credit. (9)
4. Which of the following type of study would you conduct to examine this relationship? (1) a. Case control b. Cohort c. Ecologic
d. Quasi-experimental e. Cross-sectional
5. Using the data in Table 1, calculate the measure of association for consumption of alcohol within 2
hours of driving a car and having an accident. (2)
__________________________ On the morning of Thursday, March 4th, the local hospital emergency room reports that several patients were seen in the emergency room with gastroenteritis. All the patients attended a birthday party (held Tuesday, March 2nd) hosted by a mutual friend at their home. A total of 55 guests attended the birthday party dinner; however only 35 guests became sick. Dates of onset in these cases ranged from March 3rd to March 5th. Onset of illness in all cases was characterized chiefly by abdominal pain and nausea. Some patients experienced diarrhea and/or vomiting. At least one ill person reported a fever >99.5º (37.5ºC).
6. Is this an outbreak? (1) a. Yes, because the guests are all related and only 35 reported symptoms. b. Yes, because the occurrence of two or more cases of a similar illness resulting from the
ingestion of a common food constitutes an outbreak. c. Yes, because the guests experienced different symptoms. d. No, because the guests are all related. e. No, because the guests experienced different symptoms.
7. Assuming that exposure took place during the birthday party held at 5pm on March 2nd, give the range
of incubation periods for these 35 cases. (3)
a. Shortest Incubation Period__________________________
b. Longest Incubation Period__________________________
c. Incubation Range__________________________
8. What are the components that make a good case definition? (1)
a. Person, place and time b. Clinical criteria, place, and time c. Identifying information, clinical criteria, time, person, place, and risk factors d. Clinical criteria, person, place, and time e. Person, place, time, and possible cause
Table 1: Car accident and alcohol consumption. Car Accident YES NO
Drinking Alcohol
YES
NO

Disease Detectives Regional 2010 – Division C Exam
4 Page Total _______
A local catering company catered the birthday party, however guests did bring the cut fruit tray and the cake. The various foods consumed at the dinner party appear in Table 2.
9. In Table 2, complete the shaded squares. Each square is worth 0.5 points. (15)
10. Refer to Table 2. What food is most likely the source of the illness experienced? (1)
a. Hot turkey b. Tuna noodle salad c. Cut fruits
d. Cake e. Hot beef
11. Refer to Table 2. Which of the following food items had the greatest percentage of people getting sick?
(1) a. Chips b. Pickles c. Dips
d. Hot beef e. Cake
12. Stool specimen from ill birthday party attendees were submitted to the state lab. Four specimen tested
positive for Norovirus and negative for enteric bacteria. The stool specimen from the catering food worker was negative for both Norovirus and enteric bacteria. What intervention measure would you suggest? (1)
a. Wear gloves only when handling raw meat b. Never wear gloves c. Use good personal hygiene during food preparations d. Use the same cutting board and knife for raw meats and vegetables e. Thaw raw meat on the counter at room temperature
Table 2: Food consumption information of guests from the birthday dinner party held March 2nd.
Food / Drinks Persons who ATE Foods Persons who did NOT eat foods
Odds Ratio Ill Well Total % Ill Ill Well Total % Ill
Hot turkey 12 6 18 3 14 17
Hot beef 7 9 16 8 11 19 42
Buns 13 12 25 2 8 10
Veggies 9 9 18 6 11 17
Dips 8 7 15 53 7 13 20
Baked beans 6 8 14 9 12 21
Chips 11 10 21 4 10 14
Pickles 8 6 14 7 14 21
Cut fruits 11 7 18 4 13 17
Tuna noodle salad 7 4 11 8 16 24 3.5
Cake 8 16 14 7 14 21
Disease Detectives Regional 2010 – Division C Exam
5 Page Total _______
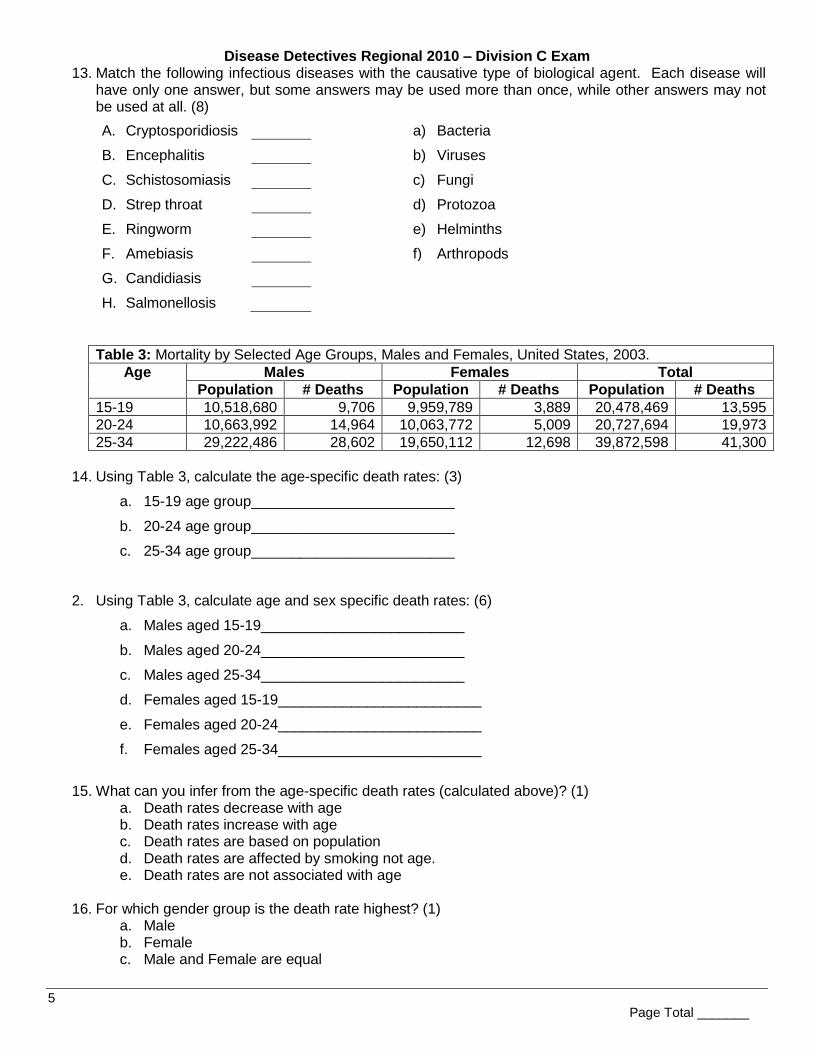
13. Match the following infectious diseases with the causative type of biological agent. Each disease will have only one answer, but some answers may be used more than once, while other answers may not be used at all. (8)
A. Cryptosporidiosis a) Bacteria
B. Encephalitis b) Viruses
C. Schistosomiasis
c) Fungi
D. Strep throat
d) Protozoa
E. Ringworm
e) Helminths
F. Amebiasis
f) Arthropods
G. Candidiasis
H. Salmonellosis
Table 3: Mortality by Selected Age Groups, Males and Females, United States, 2003.
Age Males Females Total
Population # Deaths Population # Deaths Population # Deaths
15-19 10,518,680 9,706 9,959,789 3,889 20,478,469 13,595
20-24 10,663,992 14,964 10,063,772 5,009 20,727,694 19,973
25-34 29,222,486 28,602 19,650,112 12,698 39,872,598 41,300
14. Using Table 3, calculate the age-specific death rates: (3)
a. 15-19 age group_________________________
b. 20-24 age group_________________________
c. 25-34 age group_________________________
2. Using Table 3, calculate age and sex specific death rates: (6)
a. Males aged 15-19_________________________
b. Males aged 20-24_________________________
c. Males aged 25-34_________________________
d. Females aged 15-19_________________________
e. Females aged 20-24_________________________
f. Females aged 25-34_________________________
15. What can you infer from the age-specific death rates (calculated above)? (1)
a. Death rates decrease with age b. Death rates increase with age c. Death rates are based on population d. Death rates are affected by smoking not age. e. Death rates are not associated with age
16. For which gender group is the death rate highest? (1)
a. Male b. Female c. Male and Female are equal

Disease Detectives Regional 2010 – Division C Exam
6 Page Total _______
17. Table 3 lists the 10 leading causes of death in 2007 and the leading causes of death in 1900. In 1900, chronic lower respiratory diseases, diabetes, Alzheimer’s disease, and septicemia were not among the 10 leading causes of death. How do you account for these changes? (1)
a. Chronic conditions have replaced acute infectious diseases
b. Aging of the general population
c. Changes in the fatal course of a disease
d. A and B e. B and C
18. Among the 10 leading causes of
death in 1900 were: influenza and pneumonia (202.2 per 100,000 – Rank 1), tuberculosis (194.4 per 100,000 – Rank 2), gastroenteritis (142.7 per 100,000 – Rank 3), and Diptheria (40.3 per 100,000 – Rank 10). (This data is not provided in Table 3). With the exception of influenza and pneumonia, these are no longer among the 10 leading causes of death. What is an explanation for this trend? (1)
a. More food and water contamination events b. Preventative and curative practices c. Aging population d. Increased exposure to sunlight e. Increased number of hospitals
19. The population of Metroville was 3,187,463 on June 30, 2008. During the period January 1 through
December 31, 2008, a total of 4,367 city residents were infected with HIV. During the same year, 768 new cases of HIV were reported, and 67 residents died as a result of HIV/AIDS. What is the prevalence per 100,000 population? (1)
a. 2.1 per 100,000 population b. 5.7 per 100,000 population c. 24.1 per 100,000 population
d. 137.0 per 100,000 population e. 161.1 per 100,000 population
20. Using the information in the previous question, what is the incidence per 100,000 population? (1)
a. 2.1 per 100,000 population b. 5.7 per 100,000 population c. 24.1 per 100,000 population
d. 137.0 per 100,000 population e. 161.1 per 100,000 population
21. Match the following infectious diseases with the causative type of biological agent. Each disease will
have only one answer, but some answers may be used more than once, while other answers may not be used at all. (7)
A. Cryptosporidiosis
a) Bacteria
B. Encephalitis b) Viruses
C. Schistosomiasis c) Fungi
D. Strep throat d) Protozoa
E. Ringworm
e) Helminths
F. Amebiasis
f) Arthropods
G. Candidiasis
Table 3: Leading causes of death and rates for those causes in 2007 and 1900, United States.
Cause of Death Rate per 100,000 Population 2007 1900
All Diseases 803.7 1,719.1 Disease of the heart 204.1 137.4 Malignant neoplasms 185.7 64.0 Cerebrovascular diseases 44.4 106.9 Chronic lower respiratory diseases
42.9 Not in top 10
Accidents 38.8 72.3 Alzheimer’s disease 24.8 Not in top 10 Diabetes mellitus 23.5 Not in top 10 Influenza and pneumonia 17.5 202.2 Nephritis 15.3 81.0 Septicemia 11.6 Not in top 10

Disease Detectives Regional 2010 – Division C Exam
7 Page Total _______
Lead is a common, potent, pervasive, environmental contaminant. Exposure to lead is a preventable risk in all areas of the United States. Lead exposure has been associated with decreased cognitive function, developmental delays, and behavior problems in children. The Centers for Disease Control and Prevention (CDC), has established a blood lead level (BLL) of 10 micrograms per deciliter (µg/dL) as the threshold for action (further testing and monitoring, and removal of lead source). Lead toxicity has been well-established, with evidence of harmful effects found in children whose blood lead levels exceed 10 µg/dL. A recent study suggested that a child is estimated to lose 2 IQ points for each 10 µg/dL increase in blood lead level. Eliminating elevated blood lead levels (EBLLs) among children is one of the 2010 US National health objectives. Data from the CDC indicate substantial yearly decreases in the percentage of children tested in the US with EBLLs is shown in Figure 2.
22. Which of the following is/are commonly associated with childhood lead poisoning? (1) a. Newer housing b. Lead based paints c. Access to medical care
d. All of the above e. None of the above
23. Lead has been found in which of the following? (1)
a. Toys b. Pottery (homemade) pots and
dishes
c. Candy wrappers d. A and C only e. A, B and C
24. In Figure 2, the percentage of children tested in the US with EBLLs has decreased over the past 10
years. To what may this decrease be attributed to? (1) a. Increased screening and testing of at risk children b. Increased use of lead based paints in homes c. Increased access to health care d. Increased use of lead in candy wrappers e. Increased screening of children from other countries
25. In Figure 2, the 1997 percentage of children tested with EBLLs in California was much higher than the
percentage of children in Wisconsin. A possible explanation for this is that: (1) a. California is more populated than Wisconsin b. California has a larger geographic area than Wisconsin c. California tested more children than Wisconsin d. California has a greater number of pre-1950 housing units than Wisconsin does e. California does not collect a blood sample by the capillary method, but Wisconsin does
Figure 2: Data from the CDC indicate substantial yearly decreases in the percentage of children tested in the US with EBLLs
Disease Detectives Regional 2010 – Division C Exam
8 Page Total _______
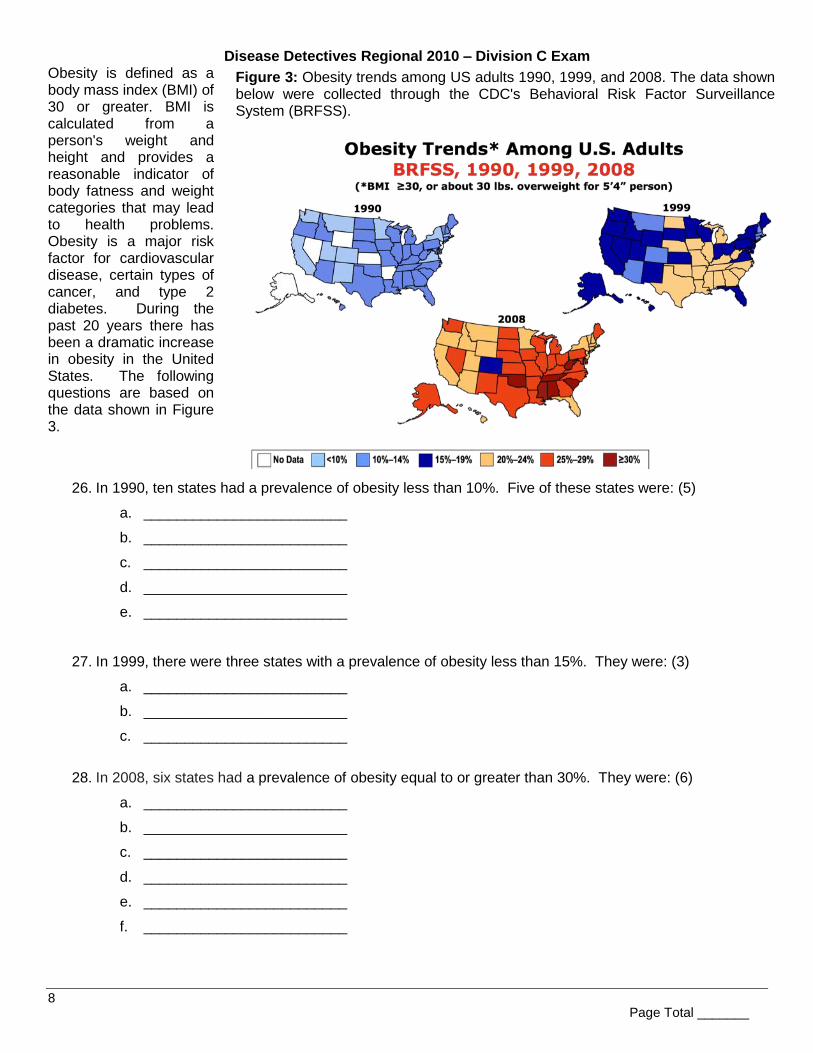
Obesity is defined as a body mass index (BMI) of 30 or greater. BMI is calculated from a person's weight and height and provides a reasonable indicator of body fatness and weight categories that may lead to health problems. Obesity is a major risk factor for cardiovascular disease, certain types of cancer, and type 2 diabetes. During the past 20 years there has been a dramatic increase in obesity in the United States. The following questions are based on the data shown in Figure 3.
26. In 1990, ten states had a prevalence of obesity less than 10%. Five of these states were: (5)
a. _________________________
b. _________________________
c. _________________________
d. _________________________
e. _________________________
27. In 1999, there were three states with a prevalence of obesity less than 15%. They were: (3)
a. _________________________
b. _________________________
c. _________________________
28. In 2008, six states had a prevalence of obesity equal to or greater than 30%. They were: (6)
a. _________________________
b. _________________________
c. _________________________
d. _________________________
e. _________________________
f. _________________________
Figure 3: Obesity trends among US adults 1990, 1999, and 2008. The data shown below were collected through the CDC's Behavioral Risk Factor Surveillance System (BRFSS).
Related Documents