ISSN 8755-6839 SCIENCE OF TSUNAMI HAZARDS The International Journal of The Tsunami Society Volume 21 Number 4 Published Electronically 2003 NEAR AND FAR-FIELD EFFECTS OF TSUNAMIS GENERATED BY THE PAROXYSMAL ERUPTIONS, EXPLOSIONS, CALDERA COLLAPSES AND MASSIVE SLOPE FAILURES OF THE KRAKATAU VOLCANO IN INDONESIA ON AUGUST 26-27, 1883 191 George Pararas-Carayannis Honolulu, Hawaii, USA ESTIMATION OF FAR-FIELD TSUNAMI POTENTIAL FOR THE CARIBBEAN COAST BASED ON NUMERICAL SIMULATION 222 Narcisse Zaibo Universite des Antilles et de la Guyane, Pointe-a-Pitre, France Efim Pelinovsky Institute of Applied Physics, Nizhny Novgorod, Russia Andrey Kurkin and Andrey Kozelkov State Technical University, Nizhny Novogorod, Russia copyright c 2003 THE TSUNAMI SOCIETY P. O. Box 37970, Honolulu, HI 96817, USA WWW.STHJOURNAL.ORG

Welcome message from author
This document is posted to help you gain knowledge. Please leave a comment to let me know what you think about it! Share it to your friends and learn new things together.
Transcript
ISSN 8755-6839
SCIENCE OF
TSUNAMI HAZARDSThe International Journal of The Tsunami SocietyVolume 21 Number 4 Published Electronically 2003
NEAR AND FAR-FIELD EFFECTS OF TSUNAMIS GENERATED BY THEPAROXYSMAL ERUPTIONS, EXPLOSIONS, CALDERA COLLAPSES ANDMASSIVE SLOPE FAILURES OF THE KRAKATAU VOLCANO ININDONESIA ON AUGUST 26-27, 1883 191
George Pararas-Carayannis
Honolulu, Hawaii, USA
ESTIMATION OF FAR-FIELD TSUNAMI POTENTIALFOR THE CARIBBEAN COAST BASED ONNUMERICAL SIMULATION 222
Narcisse Zaibo
Universite des Antilles et de la Guyane, Pointe-a-Pitre, France
Efim Pelinovsky
Institute of Applied Physics, Nizhny Novgorod, Russia
Andrey Kurkin and Andrey Kozelkov
State Technical University, Nizhny Novogorod, Russia
copyright c© 2003THE TSUNAMI SOCIETY
P. O. Box 37970,Honolulu, HI 96817, USA
WWW.STHJOURNAL.ORG
OBJECTIVE: The Tsunami Society publishes this journal to increaseand disseminate knowledge about tsunamis and their hazards.
DISCLAIMER: Although these articles have been technically reviewed bypeers, The Tsunami Society is not responsible for the veracity of any state-ment, opinion or consequences.
EDITORIAL STAFF
Dr. Charles Mader, Editor
Mader Consulting Co.1049 Kamehame Dr., Honolulu, HI. 96825-2860, USA
EDITORIAL BOARD
Mr. George Curtis, University of Hawaii - Hilo
Dr. Hermann Fritz, Georgia Institute of Technology
Dr. Galen Gisler, Los Alamos National Laboratory
Dr. Zygmunt Kowalik, University of Alaska
Dr. Tad S. Murty, Baird and Associates - Ottawa
Dr. Yurii Shokin, Novosibirsk
Professor Stefano Tinti, University of Bologna
TSUNAMI SOCIETY OFFICERS
Dr. Barbara H. Keating, President
Dr. Tad S. Murty, Vice President
Dr. Charles McCreery, Secretary
Dr. Laura Kong, Treasurer
Submit manuscripts of articles, notes or letters to the Editor. If an articleis accepted for publication the author(s) must submit a scan ready manuscript,a TeX or a PDF file in the journal format. Issues of the journal are publishedelectronically in PDF format. The journal issues for 2002 are available at
http://www.sthjournal.org.Tsunami Society members will be advised by e-mail when a new issue is
available and the address for access. There are no page charges or reprints forauthors.
Permission to use figures, tables and brief excerpts from this journal inscientific and educational works is hereby granted provided that the source isacknowledged.
Previous volumes of the journal are available in PDF format athttp://epubs.lanl.gov/tsunami/and on a CD-ROM from the Society to Tsunami Society members.
ISSN 8755-6839 http://www.sthjournal.orgPublished Electronically by The Tsunami Society in Honolulu, Hawaii, USA
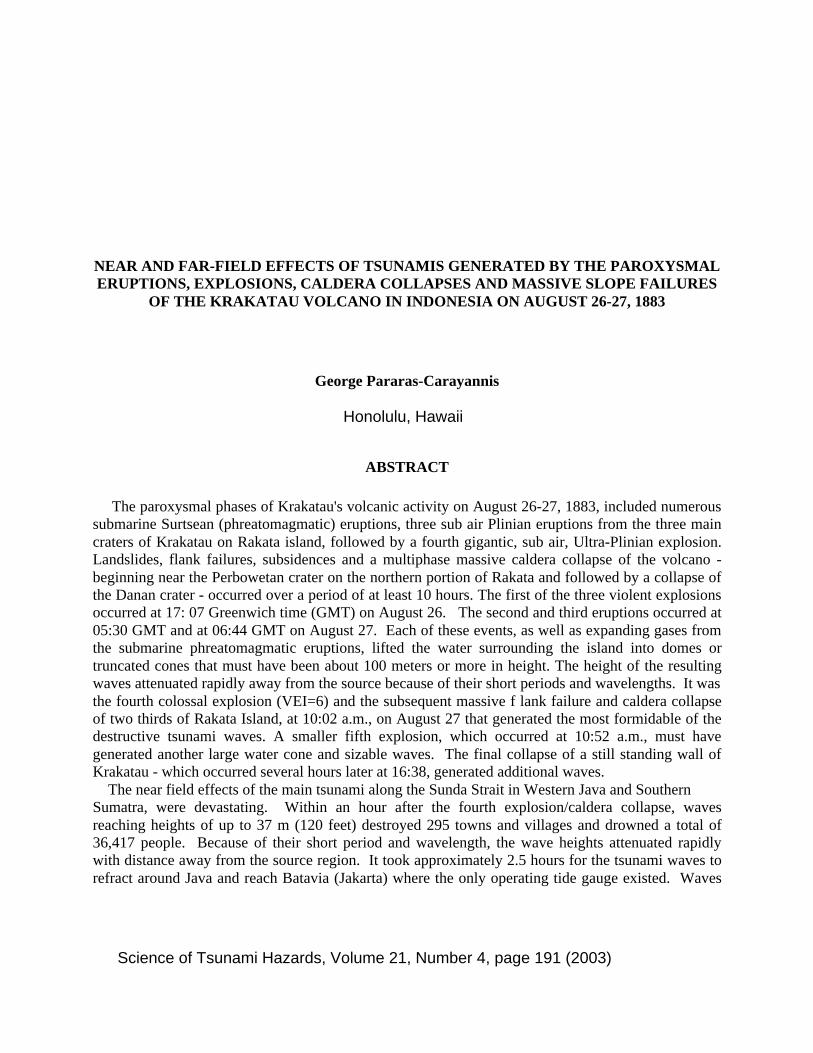
NEAR AND FAR-FIELD EFFECTS OF TSUNAMIS GENERATED BY THE PAROXYSMALERUPTIONS, EXPLOSIONS, CALDERA COLLAPSES AND MASSIVE SLOPE FAILURES
OF THE KRAKATAU VOLCANO IN INDONESIA ON AUGUST 26-27, 1883
George Pararas-Carayannis
ABSTRACT
The paroxysmal phases of Krakatau's volcanic activity on August 26-27, 1883, included numeroussubmarine Surtsean (phreatomagmatic) eruptions, three sub air Plinian eruptions from the three maincraters of Krakatau on Rakata island, followed by a fourth gigantic, sub air, Ultra-Plinian explosion.Landslides, flank failures, subsidences and a multiphase massive caldera collapse of the volcano -beginning near the Perbowetan crater on the northern portion of Rakata and followed by a collapse ofthe Danan crater - occurred over a period of at least 10 hours. The first of the three violent explosionsoccurred at 17: 07 Greenwich time (GMT) on August 26. The second and third eruptions occurred at05:30 GMT and at 06:44 GMT on August 27. Each of these events, as well as expanding gases fromthe submarine phreatomagmatic eruptions, lifted the water surrounding the island into domes ortruncated cones that must have been about 100 meters or more in height. The height of the resultingwaves attenuated rapidly away from the source because of their short periods and wavelengths. It wasthe fourth colossal explosion (VEI=6) and the subsequent massive f lank failure and caldera collapseof two thirds of Rakata Island, at 10:02 a.m., on August 27 that generated the most formidable of thedestructive tsunami waves. A smaller fifth explosion, which occurred at 10:52 a.m., must havegenerated another large water cone and sizable waves. The final collapse of a still standing wall ofKrakatau - which occurred several hours later at 16:38, generated additional waves. The near field effects of the main tsunami along the Sunda Strait in Western Java and SouthernSumatra, were devastating. Within an hour after the fourth explosion/caldera collapse, wavesreaching heights of up to 37 m (120 feet) destroyed 295 towns and villages and drowned a total of36,417 people. Because of their short period and wavelength, the wave heights attenuated rapidlywith distance away from the source region. It took approximately 2.5 hours for the tsunami waves torefract around Java and reach Batavia (Jakarta) where the only operating tide gauge existed. Waves
Honolulu, Hawaii
Science of Tsunami Hazards, Volume 21, Number 4, page 191 (2003)
of 2.4 meters in height were recorded - but with an unusually long period of 122 minutes. The longperiod is attributed to modification due to resonance effects and did not reflect source characteristics.The tsunami travel time to Surabaya at the eastern part of Java was 11.9 hours. The reported wave wasonly 0.2 meters. The far field effects of the tsunami were noticeable around the world, but insignificant. Small sealevel oscillations were recorded by tide gauges at Port Blair in the Andaman Sea, at Port Elizabeth inSouth Africa, and as far away as Australia, New Zealand, Japan, Hawaii, Alaska, the North-AmericanWest Coast, South America, and even as far away as the English Channel. It took 12 hours for thetsunami to reach Aden on the southern tip of the Arabian Peninsula, about 3800 nautical miles away.The wave reported at Aden, at Port Blair and at Port Elizabeth, represents the actual tsunamigenerated in the Sunda Strait. There were no land boundaries on the Indian Ocean side of Krakatau toprevent the tsunami energy from spreading in that direction. The tsunami travel time of a little over300 nautical miles per hour to Aden appears reasonable. However, it is doubtful that the waves,which were reported at distant locations in the Pacific or in the Atlantic Ocean, represented the actualtsunami generated in the Sunda Strait. Very little, if any at all, of the tsunami energy could haveescaped the surrounding inland seas to the east of the Sunda Strait. Most probably, the small wavesthat were observed in the Pacific as well as in the Atlantic were generated by the atmospheric pressurewave of the major Krakatoa explosion, and not from the actual tsunami generated in the Sunda Strait.The unusual flooding, which occurred at the Bay of Cardiff, in the U.K., was caused by atmosphericcoupling of the pressure wave from the major Krakatau eruption.
.
Science of Tsunami Hazards, Volume 21, Number 4, Page 192 (2003)
INTRODUCTION
The effects of the volcanic explosions and collapses of the volcano of Krakatau in Indonesia onAugust 26-27, 1883, including the effects of its destructive tsunami, were extensively reported inearly scientific reports based on geological surveys and data collected in the affected area (Verbeek,1884; Fuchs, 1884; Warton & Evans, 1888). Most of the original publications include descriptivedocumentation of the tsunami near field effects in the Sunda Strait and elsewhere in Indonesia, withspeculations as to the tsunami source mechanism. Analysis of the geological data collected by earlyand subsequent surveys resulted in publications that further documented the caldera collapse andprovided additional evaluation as to what occurred in 1883 and about tsunamis generated fromsubsequent eruptions of Anak Krakatau (Montessus de Ballore, 1907; Escher, B.G., 1919, 1928;Stehn, 1929; Wilson et al 1973;)
Additional descriptions of the tsunami effects - based on original and subsequent references – wereincluded in historical catalogs of earthquakes and tsunamis (Milne, 1912; Svyatlowski, 1957,Kawasumi, 1963; Heck, 1947; Imamura, 1949; Iida et al., 1967). Similarly, water level disturbances attide gauges from the great explosion were extensively reviewed and evaluated (Ewing & Press, 1955).Subsequent computations of the tsunami travel time and the modeling of the tsunami wereundertaken, using a point tsunami source and a simplified tsunami generation mechanism(Nomanbhoy & Satake 1997). Subsequent publications drew comparisons and analogies betweenKrakatau’s explosion/collapse tsunami mechanism with that of the multi-phase explosions andcollapses of the volcano of Santorin in the Bronze Age (Pararas-Carayannis, 1973, 1974, 1983, 1992).
Based on original surveys and a very extensive review of the geologic data in the scientificliterature, a comprehensive publication further described Krakatau’s eruption and its effects (Simkin& Fiske, 1983). The accuracy of its historical tsunami data was further verified by a review oforiginal documents – some translated from Dutch, German and French publications – prior to theabove publication and for corrections of earlier historical catalogs of tsunamis (Pararas-Carayannis,1983)
The atmospheric pressure effects of the Krakatau’s explosion were also researched anddocumented (Hirota, 1983). Additional tsunami descriptions were provided in numerous otherpublications (Anon., 1883; Whitney, 1992; Simkin & Siebert, 1994; Decker & Hadikusumo, 1961;Furneaux, 1964; Decker & Decker, 1989; Sea Frontiers, 1971). Over the years, numerous articles inmagazines and newspapers about the1883 Krakatau disaster and its destructive tsunami havefascinated and continue to fascinate readers. Similarly, museums and Internet web sites haveprovided extensive descriptions and bibliographies.
More recent papers have evaluated the tsunami generation mechanisms for different types ofvolcanoes with varying eruption intensities, have assessed the risk of postulated mega tsunamigeneration from massive edifice failures of island stratovolcanoes such as Krakatau, Santorin, Pitonde la Fournaise Cumbre Vieja, and Kilauea (Pararas-Carayannis, 2002a,b).
The present study is part of an ongoing investigation of tsunami source mechanisms from large-scale sub aerial and submarine volcanic and non-volcanic, mass waste processes. It examines brieflyonly the kinematic processes of flank failure and caldera collapses during the paroxysmal phases ofKrakatau’s eruption on August 26-27, 1883, comments on specific source characteristics andmechanisms of tsunami generation resulting from such mass waste of volcanic edifice structure, and
Science of Tsunami Hazards, Volume 21, Number 4, page 193 (2003)
summarizes the near and far-field tsunami effects – including the generation of atmospherically-induced sea level disturbances at great distances from the source region.
GEOLOGIC SETTING
Krakatau (Krakatoa) is one of the volcanoes of the Sunda volcanic arc in Indonesia, located in theSunda Strait, at 16.7 S. Latitude and 105.4 E. Longitude, 40 km off the west coast of Java. Thestratovolcano was formed by the subduction of the Indian-Australia Plate under the Eurasian Plate.Great volcanic eruptions have occurred in this region in the distant geologic past. A mega-colossalvolcanic explosion/collapse during the Quaternary period of the Ice Age, approximately 75,000 yearsago, devastated the center of the island of Sumatra and created a 100 km long caldera, now the site ofLake Toba. The volume of tephra discharge from this massive volcanic eruption is estimated at 2,000cubic km. The massive 1815 Ultra-Plinian eruption/explosion of the Mount Tambora volcano ejectedbetween 100 and 200 cubic kilometers of tephra.
BRIEF HISTORY OF KRAKATA’S VOLCANIC ACTIVITY AND TSUNAMIGENERATION
At its peak, the island of Rakata, which the volcano of Krakatau had formed, had reached a heightof 790 m (2,600 ft.) above sea level. According to ancient Japanese scriptures, the first known super-colossal eruption of Krakatau occurred in the year 416 A. D. – Some have reported it to occur in 535A.D. The energy of this eruption is estimated to have been about 400 megatons of TNT, or theequivalent of 20,000 Hiroshima bombs. This violent early eruption destroyed the volcano, whichcollapsed and created a 7 km (4-mile) wide submarine caldera. The remnants of this earlier violentvolcanic explosion were the three islands of Krakatau, Verlaten and Lang (Rakata, Panjang, andSertung). Undoubtedly the 416 A.D. eruption/explosion/collapse generated a series of catastrophictsunamis, which must have been much greater than those generated in 1883. However, there are norecords to document the size of these early tsunamis or the destruction they caused.
Subsequent to the 416 A.D. eruption and prior to 1883, three volcanic cones of Krakatau and atleast one older caldera had combined again to form the island of Rakata. The volcanic cones on theisland were aligned in a north-south direction. The northernmost was called Poeboewetan and thesouthernmost was called Rakata. Overall approximate dimensions of the island were 5 by 9Kilometers.
A long period of relative inactivity of Krakatau was interrupted by a moderate eruption thatoccurred between May 1680 and November 1681. This activity destroyed all the lush vegetation thathad grown on the island. Large quantities of rock, pumice, and ash fell into the sea. Undoubtedly,volcanic edifice mass waste, subsidence and partial flank failure events associated with this activity,generated large local tsunamis. However, the geomorphology of the island was not alteredsignificantly. Thus, prior to the great 1883 eruption, Krakatau was the remnant of the older volcanothat had not erupted for 200 years.
Science of Tsunami Hazards, Volume 21, Number 4, page 194 (2003)
The great 1883 eruptions, explosions, mass waste and collapse events of Krakatau generated thecatastrophic tsunamis along the Sunda Strait. Subsequent local tsunamis in the Sunda Strait weregenerated by the 1927 and 1928 eruptions of the new volcano of Anak Krakatau (Child of Krakatau)that formed in the area. Although large tsunamis were generated from these recent events, the heightsof the waves attenuated rapidly away from the source region, because their periods and wavelengthswere very short. There was no report of damage from these more recent tsunamis in the Sunda Strait.
CHRONOLOGY OF EVENTS PRIOR TO KAKATAU’S PAROXYSMAL PHASE
As mentioned, following about 200 years period of inactivity, Krakatau became active again inearly 1883 when a large earthquake struck the area. There was subsequent increase in seismicactivity. On May 20, 1883 Krakatau begun to erupt again. The initial explosive eruptions could beheard 160 km away. Steam and ash could be seen rising 11km above the summit of the volcano. Mostof the activity was from the 3 main vents – Perboewatan being the most active. The eruptionscontinued with varying degrees of severity to August – producing only gas, steam and ashes. Duringthat period the Danan vent got progressively wider because of collapses. By August 11, 1883. Threemajor vents of Krakatau were actively erupting. Eleven other vents were ejecting smaller quantitiesof steam, ash and dust.
CHRONOLOGY OF EVENTS DURING KRAKATAU’S PAROXYSMAL PHASE
The paroxysmal phase of Krakatau’s eruption took place in less than two days – on August 26 and27, 1983 – with remarkably few reported earthquakes. This final phase included numerous submarineSurtsean (phreatomagmatic) eruptions, three sub aerial Plinian eruptions from the three main craters,followed by a fourth gigantic, sub aerial, ultra-Plinian explosion, mass waste, flank failures andmassive caldera collapse.
The first of the four violent explosions begun with extraordinary intensity at 17: 07 Greenwich time(GMT) on August 26, 1883 (27 August local date). Subsequently, eruptions of lesser magnitudebecame more frequent, occurring on the average every 10 minutes. The first and subsequent smallerexplosions sent huge volumes of airborne tephra that completely blocked out the sun and broughtdarkness to the Sunda Straits. A black cloud of smoke rose 27 kilometers (17 miles) above thevolcano and was seen and reported by sailors on a ship, 120 km away. At the time, a plug of solidlava apparently blocked Krakatau’s central vent. Underneath it pressure was rapidly building up.Subsequently, there was a partial caldera collapse which increased Krakatau’s Perboewatan crater toapproximately 1,000 meters in diameter and its average depth to about 50 meters. Also, severalsubmarine Surtsean (phreatomagmatic) eruptions and partial flank collapses of the island must haveoccurred during this initial period. Probably, these continued intermittently during the following 10-hour period.
The second and third of Krakatau’s violent explosions occurred at 05:30 GMT and at 06:44 GMTon August 27, 1883, respectively. Finally, at 10:02 (GMT) on August 27, the fourth paroxysmaleruption/explosion blew away the northern two-thirds of Rakata Island. Almost instantaneously thisexplosion was followed by a very substantial collapse of the unsupported volcanic chambers ofKrakatau, thus forming a huge underwater caldera.
Science of Tsunami Hazards, Volume 21, Number 4, page 195 (2003)
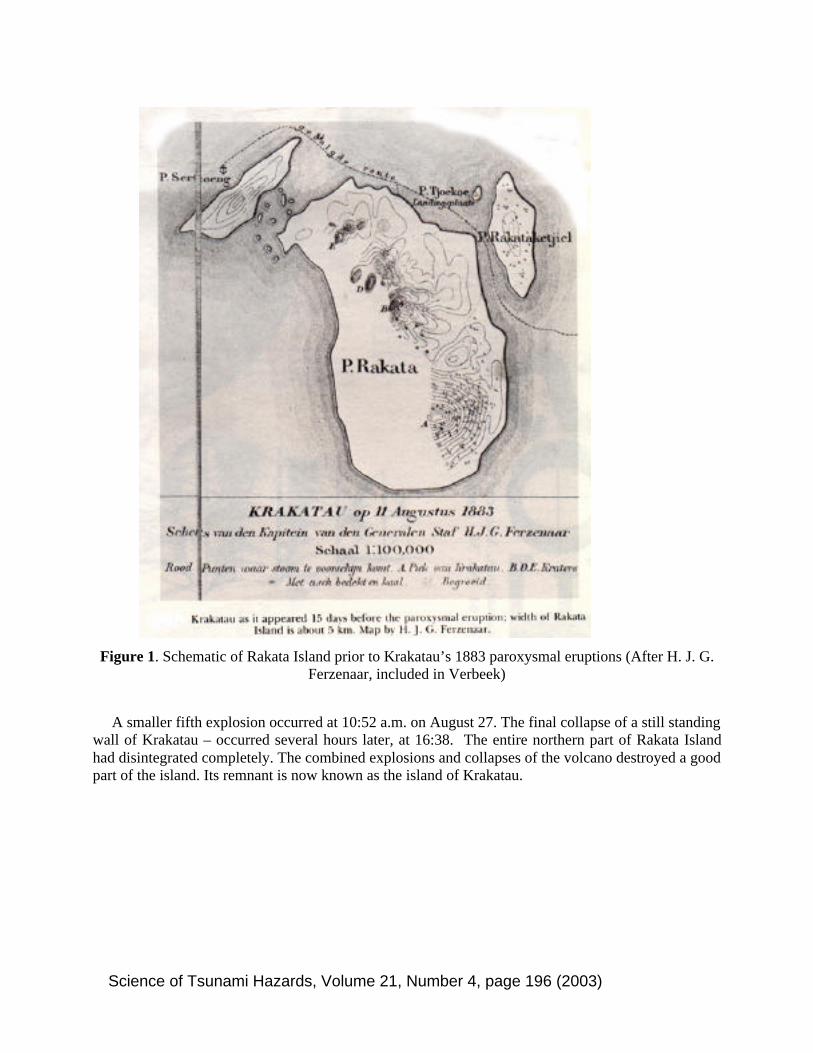
Figure 1. Schematic of Rakata Island prior to Krakatau’s 1883 paroxysmal eruptions (After H. J. G.Ferzenaar, included in Verbeek)
A smaller fifth explosion occurred at 10:52 a.m. on August 27. The final collapse of a still standingwall of Krakatau – occurred several hours later, at 16:38. The entire northern part of Rakata Islandhad disintegrated completely. The combined explosions and collapses of the volcano destroyed a goodpart of the island. Its remnant is now known as the island of Krakatau.
Science of Tsunami Hazards, Volume 21, Number 4, page 196 (2003)
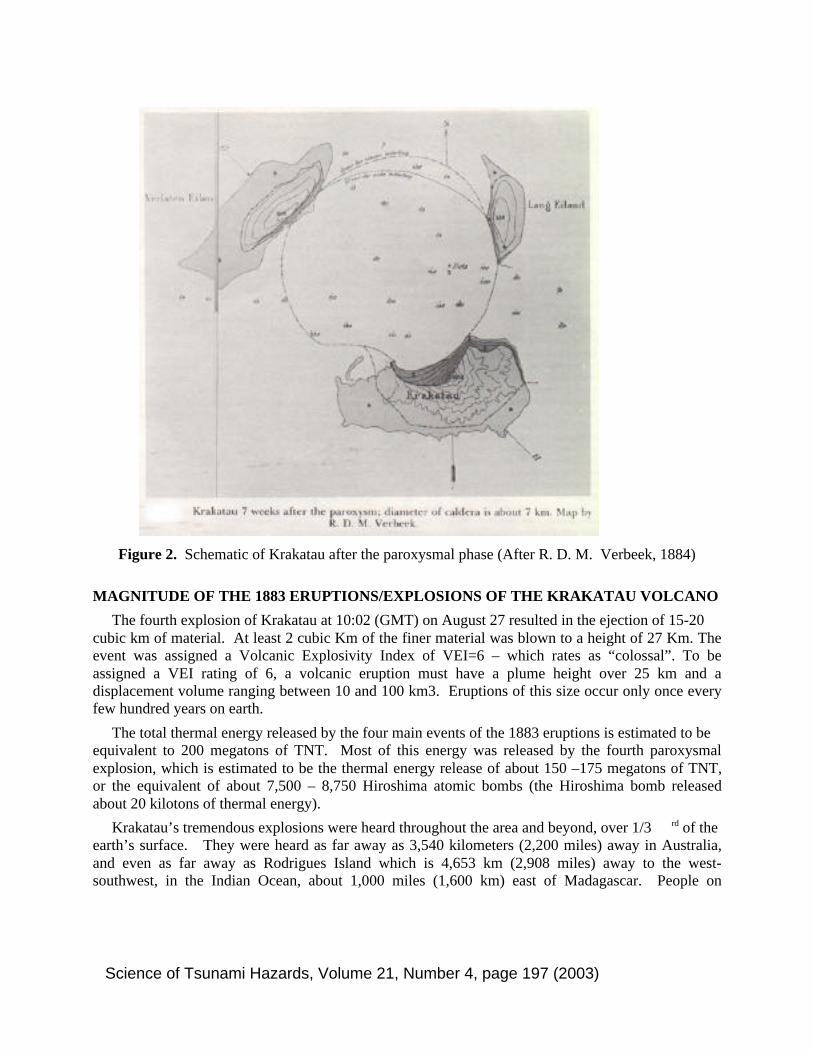
Figure 2. Schematic of Krakatau after the paroxysmal phase (After R. D. M. Verbeek, 1884)
MAGNITUDE OF THE 1883 ERUPTIONS/EXPLOSIONS OF THE KRAKATAU VOLCANO
The fourth explosion of Krakatau at 10:02 (GMT) on August 27 resulted in the ejection of 15-20cubic km of material. At least 2 cubic Km of the finer material was blown to a height of 27 Km. Theevent was assigned a Volcanic Explosivity Index of VEI=6 – which rates as “colossal”. To beassigned a VEI rating of 6, a volcanic eruption must have a plume height over 25 km and adisplacement volume ranging between 10 and 100 km3. Eruptions of this size occur only once everyfew hundred years on earth.
The total thermal energy released by the four main events of the 1883 eruptions is estimated to beequivalent to 200 megatons of TNT. Most of this energy was released by the fourth paroxysmalexplosion, which is estimated to be the thermal energy release of about 150 –175 megatons of TNT,or the equivalent of about 7,500 – 8,750 Hiroshima atomic bombs (the Hiroshima bomb releasedabout 20 kilotons of thermal energy).
Krakatau’s tremendous explosions were heard throughout the area and beyond, over 1/3 rd of theearth’s surface. They were heard as far away as 3,540 kilometers (2,200 miles) away in Australia,and even as far away as Rodrigues Island which is 4,653 km (2,908 miles) away to the west-southwest, in the Indian Ocean, about 1,000 miles (1,600 km) east of Madagascar. People on
Science of Tsunami Hazards, Volume 21, Number 4, page 197 (2003)
Rodrigues Island described the sounds to be like the distant roar of firing canons. The soundscontinued at intervals of three to four hours during the night of August 26th.
SOURCE DIMENSIONS AND MECHANISMS OF TSUNAMI GENERATION
The 1883 eruption of Krakatau provides the best understanding of the tsunamigenic potential frommass failures and collapses of island volcanoes. It is believed that not one but several tsunamis weregenerated as a result of several events that occurred during Krakatau’s paroxysmal phase. Thefollowing source dimensions and mechanisms of tsunami generation are inferred from examination ofhistorical records, chronology of events, underwater topography of Krakatau’s post 1883 caldera andgeological evidence. The 1927 birth of Anak Krakatau volcano (Stern, 1929a) in the caldera ofKrakatau altered significantly the underwater topography. However, observations from Strombolianintensity eruptions of Anak Krakatau in 1928 shed additional light on the mechanisms of tsunamigeneration from volcanic explosions.
Mechanisms: Violent Plinian and Ultra-Plinian eruptions/explosions, submarine phreatomagmaticactivity and other associated processes such as atmospheric shock waves, magmatically-inducedearthquakes, gravitational settling, sudden coastal subsidence, rock falls, landslides, flank failures andmassive caldera collapses, are some of the kinematic mechanisms by which several destructive localtsunamis were generated during Krakatau’s paroxysmal phase on August 26 and 27, 1983. Geologicevidence and the chronology of events support the following sequential tsunami generationmechanisms.
During the first 10 hours of Krakatau’s paroxysmal eruptive phase, local tsunamis were generatedin the immediate area primarily from numerous landslides, rock falls, flank failures, subsidences,falling ejecta, submarine phreatomagmatic eruptions and the atmospheric shock waves associatedwith the first three explosions. Also, during this period, sub aerial, multiphase collapses of thevolcanic vents occurred on Rakata Island. However, none of these nor the major caldera collapsewhich begun near the Perbowetan crater on the northern portion of the island or the subsequent partialcollapse of the Danan crater, contributed to tsunami generation. These collapses occurred above sealevel.
Tsunami Generation During the Early Paroxysmal Phase: The first three explosions ejectedmaterial primarily upwards and did not displace much water to generate a large tsunami. Otherconcurrent mass waste phenomena and falling ejecta must have contributed to the generation of largewaves. These waves had relatively short periods and wavelength and their heights attenuated rapidlyas they propagated away from the source region. However, the atmospheric shock waves from theseexplosions and concurrent phreatomagmatic eruptions must have generated larger waves. Theexpanding gases from submarine phreatomagmatic activity must have lifted the water surrounding theisland into domes or truncated cones that, at times, could have been as much as a 30-50 meters inheight. Also, the height of the waves that were thus generated attenuated very rapidly away from thesource area because of the limited source dimensions and the resulting short periods and wavelengths.This conclusion is supported by observations of the tsunami waves observed during the 1928eruptions of Anak Krakatau – the Son of Krakatau – that subsequently formed in the area.
Science of Tsunami Hazards, Volume 21, Number 4, page 198 (2003)
Tsunami Generation During Final Paroxysmal Phase: The fourth colossal paroxysmaleruption/explosion which occurred at 10:02 (GMT) on August 27, blew away the northern two-thirdsof Rakata island, resulting in the ejection of about 15-20 cubic km of material, and generating themajor destructive tsunami in the Sunda Strait. In spite of limited observations and data, it is verylikely that the destructive tsunami occurred in accordance to the following sequential scenario.
Most of the force of the fourth explosion was also directed upwards, so there was no significantcontribution to tsunami generation. However, the atmospheric shock wave was much more powerfulthan those of the earlier explosions. Also greater was the concurrent submarine phreatomagmaticactivity. Expanding gases from such activity must have lifted the water surrounding the island into adome or a truncated cone, rounded at the top and forming an acute angle with the surface of the water.The water cone thus raised must have been about100 meters or more in height. Substantial waves ofshort period were generated but attenuated rapidly away from the source. The waves thus generatedwere more significant than those generated during the earlier phase of the paroxysmal activity.Supporting this scenario are the previously mentioned observations of wave generation duringeruptions of the Anak Krakatau volcano.
Between January 12-20, 1928 eruptions of this new volcano generated water cones with heights ofup to 26 meters which were photographed from Lang island. A subsequent eruption on January 24,1928 generated a water mass of cylindrical shape. The waves were generated from Strombolianeruptions that lacked the intensity of the 1883 Plinian and super Plinian eruptions of Krakatau. The1928 waves were sizeable but attenuated rapidly because of short periods and wavelengths.
Following the fourth eruption/explosion of the 1883 paroxysmal phase of Krakatau, additionalwaves were generated in the immediate area from the falling pyroclastics and the large blocks ofpumice. These, too, were of extremely short periods and wavelengths and did not contributesignificantly to tsunami energy propagation away from the source. Most probably the waves fromfalling pyroclastics created standing waves and a chaotic sea surface in the immediate area. The largerwaves traveling in the same direction away from the source region quickly sorted out according totheir periods and added to their heights.
Immediately following the fourth paroxysmal explosion of Krakatau, there must have been severalsuccessive massive flank failures on all sides of the volcano. The waves thus generated were sizeablebut also of short period and wavelength. However within minutes after the fourth explosion, what wasleft of Krakatau’s basaltic peak begun to collapse into the volcano’s unsupported magmatic chambersresulting in the large depression of the sea floor which created the eastern branch of the 1883submarine caldera. It was this massive caldera collapse and the associated flank failures thatgenerated the major catastrophic tsunami in the Sunda Strait. A possible second explosion andcaldera collapse contributed to the generation of an additional tsunami.
Tsunami Generation After the Major Paroxysmal Phase : What is concluded from the above isthat the total engulfment and collapse of Krakatau did not occur as a single event. According toVerbeek (1894), fifty minutes after the major explosion, at 10:52 a.m., there was another severedetonation that was heard at great distance. This fifth explosion appears to have been primarilyhydromagmatic and is not known to be associated with additional volcanic collapse. However, this
Science of Tsunami Hazards, Volume 21, Number 4, page 199 (2003)
event must have also generated another large, truncated cone of water and sizable waves. Whenwaves form this subsequent event reached the nearest shores in the Sunda Strait about fifty minuteslater, they were indistinguishable from the waves of the earlier destructive tsunami.
Also, the final collapse of a still standing wall of Krakatau which occurred several hours later at16:38, must have generated additional tsunami waves of short wavelegth and period – alsoindistinguishable from the earlier major destructive tsunami. Given the catastrophic magnitude of theearlier tsunami waves that followed the 10:02 explosion, waves generated by both earlier andsubsequent events were not noticed. The only tide gauge that operated in Batavia was too far torecord these smaller tsunamis as separate discreet events. The small sea level disturbances that areevident on the earlier Batavia tide gauge record may have been caused by the atmospheric shockwaves of the volcanic explosions, rather by the short period tsunami waves which were probablyfiltered out.
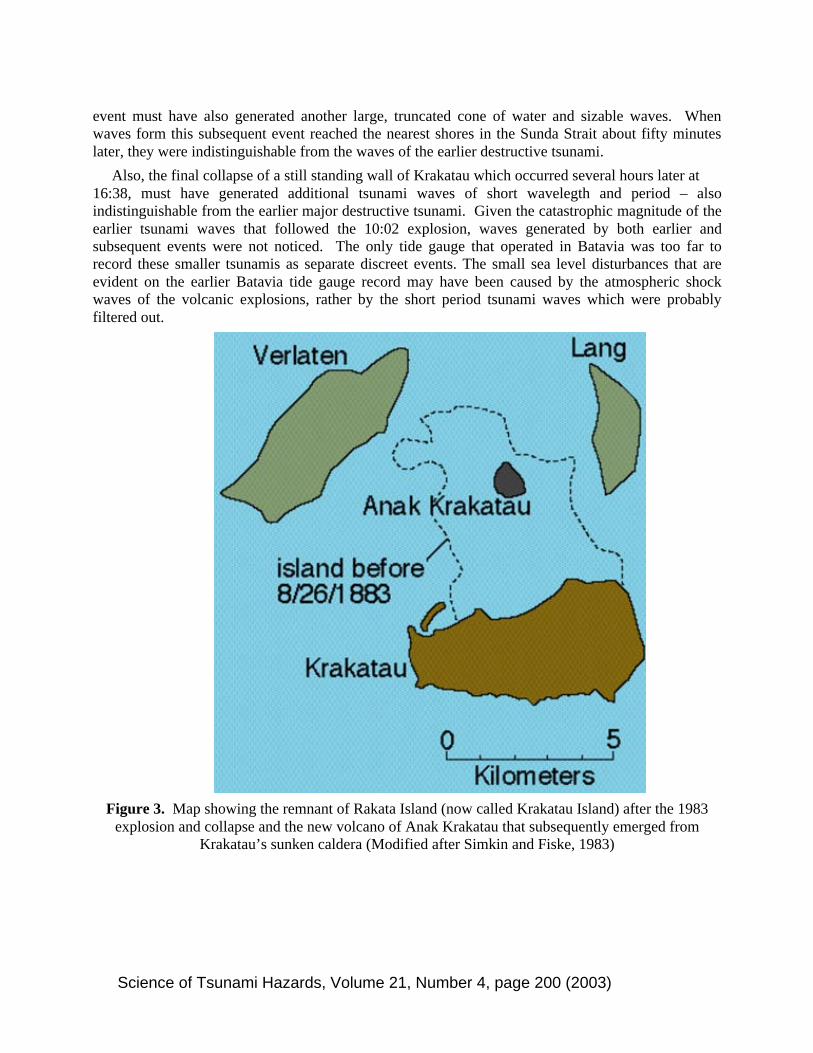
Figure 3. Map showing the remnant of Rakata Island (now called Krakatau Island) after the 1983explosion and collapse and the new volcano of Anak Krakatau that subsequently emerged from
Krakatau’s sunken caldera (Modified after Simkin and Fiske, 1983)
Science of Tsunami Hazards, Volume 21, Number 4, page 200 (2003)
The submarine eruptions of Krakatau continued in the evening and night of the 27 th of August butall activity stopped in the morning of the 28th. However, on October l7, 1883 there was again a smallsubmarine eruption, when mud was ejected and a small wave was generated (Verbeek, 1884).
Tsunami Source Dimensions: The dimensions of the tsunami generating area, as well as thevolume of water displaced by the mass waste of the volcanic structure edifice due to the 1883explosions and collapses of Krakatau, can be estimated from post disaster data collection and thebathymetry of the sea floor.
Prior to Krakatau’s paroxysmal phase, the island of Rakata had an average elevation of about 212m (700 feet). However, following the fourth major explosion, 40 sq. Km of the island were reduced toan extensive depression with the depth of more than 275 m (900 feet) below sea level. The hugeunderwater caldera that was formed by the massive collapse was about 7 km in diameter. The threeremaining islands of Verlaten, Lang and Krakatau – the latter being the remnant of Rakata, surroundthe caldera after the final collapse. The total horizontal extent of the area affected by the collapse andother kinematic processes which contributed to tsunami generation, is estimated at about 40 sq. Kms.
Although the bathymetry of Krakatau’s underwater caldera changed considerably after the birth ofthe Anak Krakatau volcano, review of original and subsequent bathymetry shows a complex relief ofthe sea floor between the three remaining islands. Following the 1883 events, the water depthbetween the islands of Lang and Verlaten was about 70 m. However, within this area there were twosmall basins with depths of about 120 m. The depth of the main caldera depression was about 270 m.The relief within this caldera depression appeared to have an eccentric uplift on one side which wasabout 60 m higher that the bottom of the basin. Further examination of the bathymetry showed that acentral ridge of about 25m in height separated the two deeper basins on the sea floor. The existenceof this ridge indicates that two events of major explosion/collapse took place, rather that a single one.The significance of two separate explosion/collapse events is that there were two discreettsunamigenic sources and that two major tsunamis were generated on August 27, 1883 – althoughthere is no data to support how far apart in time these tsunamis were generated. Perhaps the seconddepression of the underwater caldera was caused by a collapse that followed the fifth explosion at10:52, but this cannot be concluded with certainty.
Finally, the total volume of seawater displaced by the massive kinematic processes describedabove, is estimated to have been at least 20 cubic Kilometers. Therefore, given these approximatesource dimensions, the tsunami’s greatest initial wavelegth is estimated to have been as much as about7 km – the size of the caldera – and the greatest period of the resulting waves, no more than 4-5minutes. Unless the two explosions/collapses – described above – occurred at a very close timeinterval, the wavelengths and periods of the resulting waves from each tsunami event would beexpected to have had even shorter wavelengths and periods.
TSUNAMI TRAVEL TIMES
The origin time of the major tsunami has been assumed to be 10:02 (GMT) on August 27 – whichwas the time of the fourth colossal paroxysmal eruption/explosion/collapse. However this origin timemay be somewhat wrong as it took several minutes for the volcano to collapse and for the tsunami tobe generated. Furthermore, as the bathymetric data indicates, there were two separate tsunamis
Science of Tsunami Hazards, Volume 21, Number 4, page 201 (2003)
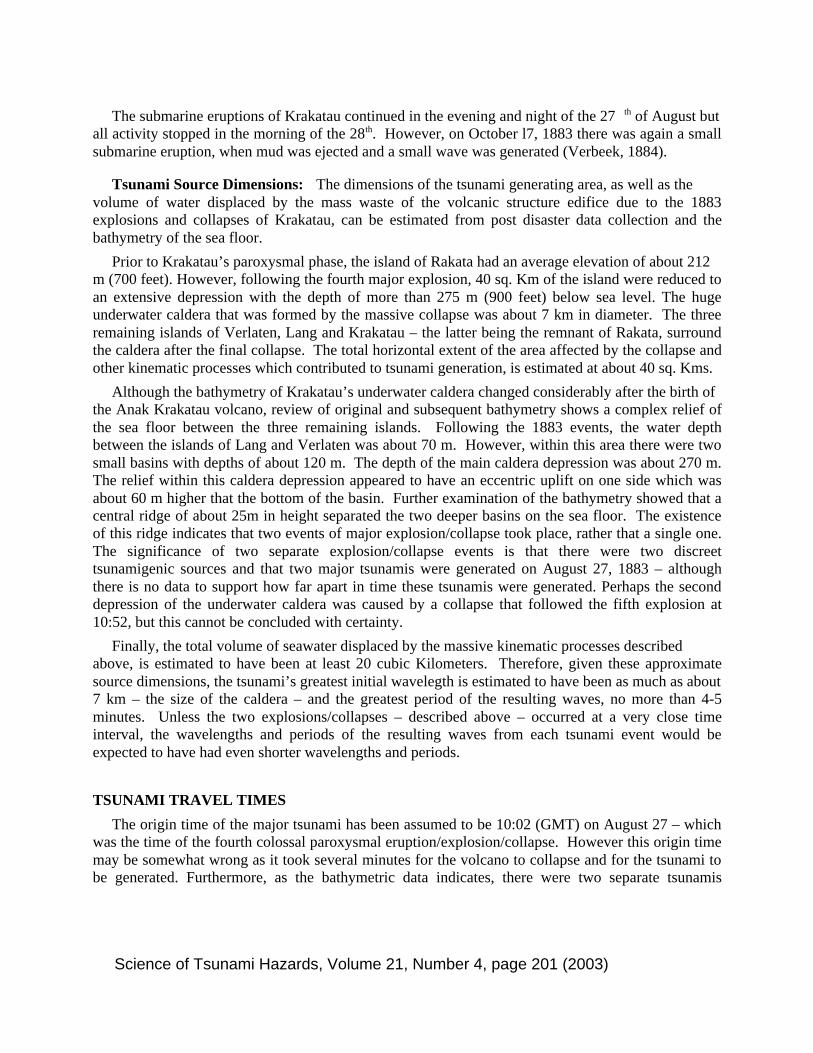
generated with origin times that may have been different. Using the 10:02 (GMT) as the majortsunami origin time, it took about 25 minutes for the first wave to reach the nearest land point onSumatra. It took considerably longer - in some cases as much as an hour - for the waves to reachmajor cities and villages on the Sunda Strait.
Figure 4. Travel Time of Major Tsunami from Krakatau’s Fourth Explosion and Collapse
(Modified after Yokohama, 1981)
NEAR FIELD TSUNAMI EFFECTS
The combination of the fourth colossal explosion and subsequent massive flank failures andcaldera collapses of Krakatau generated catastrophic tsunami waves. Because of the relative shallowbathymetry of the Sunda Strait, it took almost an hour for the destructive waves to reach the nearestcoastal settlements of western Java and southern Sumatra. In certain areas, the waves swept inland forseveral kilometers, destroying virtually everything in their path. A total of 295 towns and villageswere washed away. A total of 36,417 people were drowned. Maximum runup was as high as 37 m.(120 ft.) along certain areas.
The huge tsunami was well documented in terms of visual observations of heights reached alongthe coasts of Java and Sumatra as well from a recording at a tide gauge at Batavia (Jakarta). Sincethere is good descriptive documentation of the tsunami effects, the following is only a very brief
Science of Tsunami Hazards, Volume 21, Number 4, page 202 (2003)
description of the near field effects of the 1883 tsunami in Java and Sumatra. Many of the names oftowns and villages of this region provided here were taken from older accounts. Some of these nameshave since changed. For example Batavia is now Jakarta.
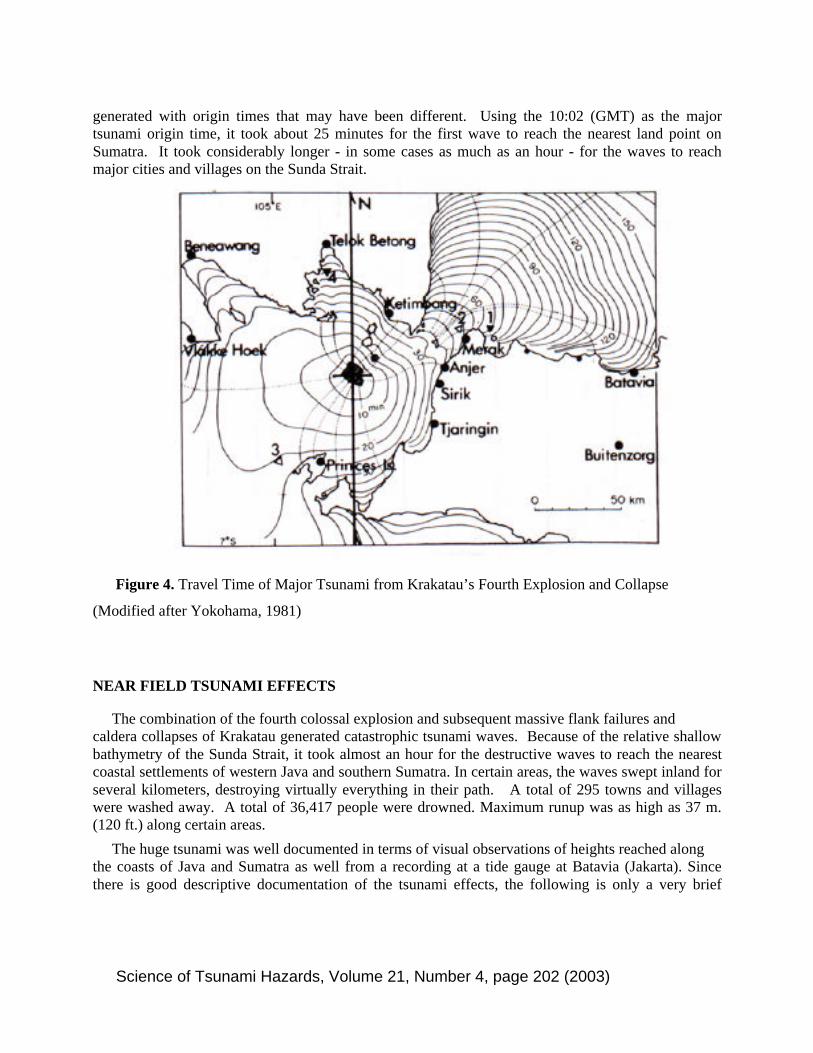
Figure 5. The extent of maximum inundation from the tsunami(s) generated by the August 27, 1883explosions and collapse of the volcano of Krakatau (Modified after Symons, 1888)
Island of Sumatra (Telok Batong, Vlakke Hook)
The tsunami travel time to the closest villages of Sumatra was about 1 hour after the explosion ofKrakatoa. At Telok Batong, tsunami waves up to 22 meters (72 feet) completely submerged thevillage. At Vlakke Hook the maximum tsunami wave height was 15 meters.
Island of Java {Sirik, Anjer, Tyringen, Merak, Batavia (Jakarta) and Surabaya}
Destructive tsunami waves reached the Western coast of Java within an hour after the fourthexplosion and ensuing collapse of Krakatau. The village of Sirik was almost entirely swept away. Ittook also about one hour for the destructive waves to reach Anjer where a 10-meter wave completelyoverwhelmed the lower part of town. At Tyringen, waves ranged from 15 - 20 meters in height (up to6O ft) while at Merak, the waves reached a maximum of 35 meters.
Science of Tsunami Hazards, Volume 21, Number 4, page 203 (2003)
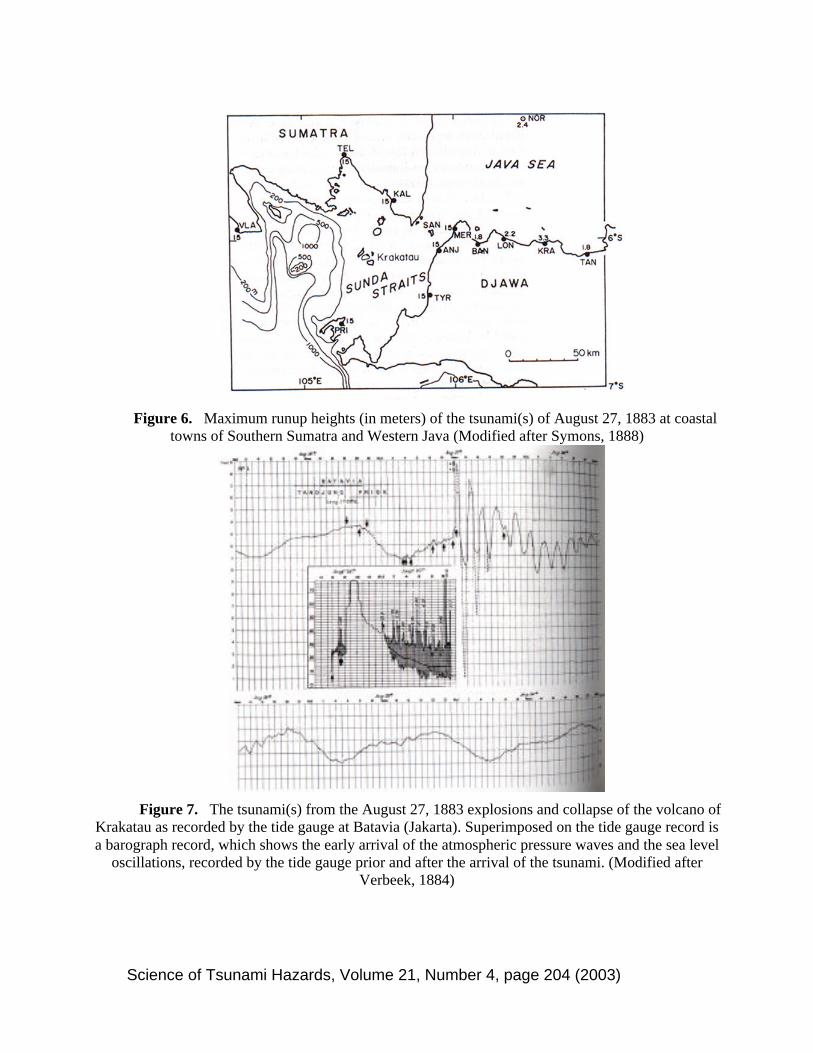
Figure 6. Maximum runup heights (in meters) of the tsunami(s) of August 27, 1883 at coastaltowns of Southern Sumatra and Western Java (Modified after Symons, 1888)
Figure 7. The tsunami(s) from the August 27, 1883 explosions and collapse of the volcano ofKrakatau as recorded by the tide gauge at Batavia (Jakarta). Superimposed on the tide gauge record isa barograph record, which shows the early arrival of the atmospheric pressure waves and the sea level
oscillations, recorded by the tide gauge prior and after the arrival of the tsunami. (Modified afterVerbeek, 1884)
Science of Tsunami Hazards, Volume 21, Number 4, page 204 (2003)
It took approximately 2.5 hours for the tsunami waves to refract around the western end of theisland of Java and to reach Batavia (Jakarta). Maximum waves of 2.4 meters were reported there witha very long period of 122 minutes. By the time the tsunami reached Surabaya, at the eastern part ofJava, the reported wave height was only 0.2 meters. The tsunami travel time to Surabaya was 11.9hours.
FAR FIELD TSUNAMI EFFECTS
Because of the short periods and wavelengths, the height of the tsunami waves attenuatedconsiderably with distance away from the source. The far field effects were negligible. However,small sea level oscillations from Krakatau's major explosion and collapse were observed or recordedby tide gauges around the world, as far away as Hawaii, the American West Coast, South America,and even as far away as the English Channel in France and England. Some of the tide gauge recordswere of the actual tsunami waves, while other recorded or observed sea level disturbances appear tohave been caused by the atmospheric shock pressure of the powerful explosions of the volcano.
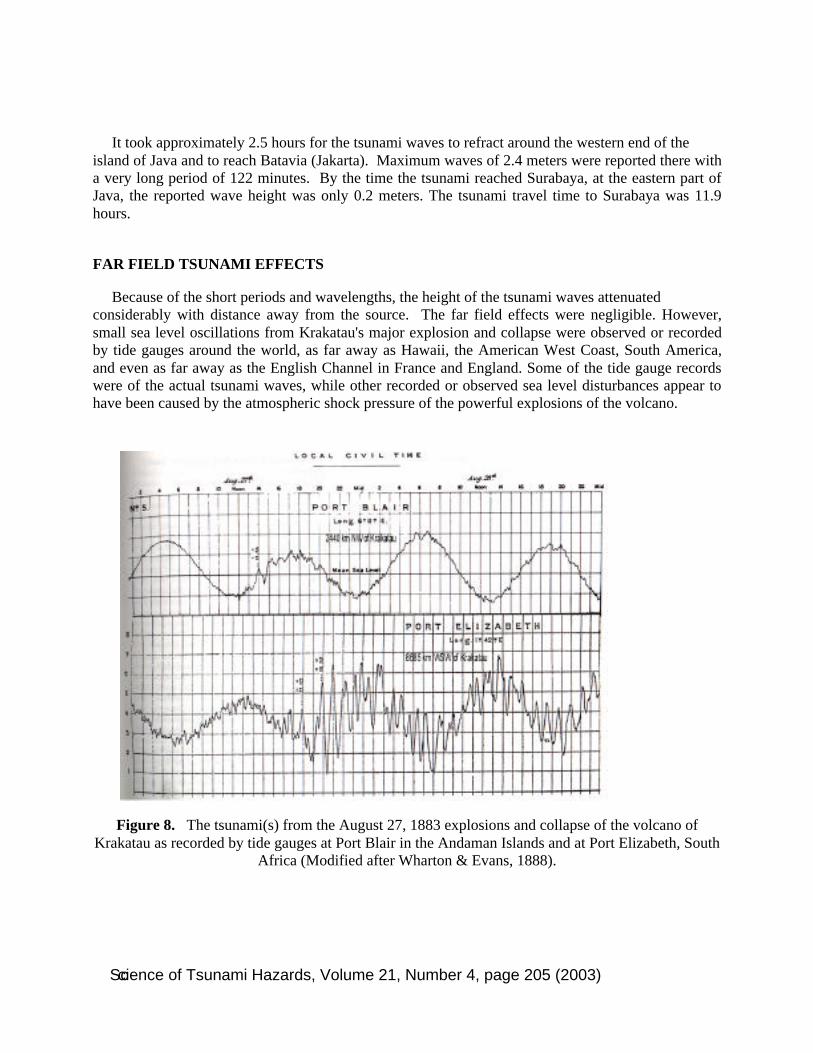
Figure 8. The tsunami(s) from the August 27, 1883 explosions and collapse of the volcano ofKrakatau as recorded by tide gauges at Port Blair in the Andaman Islands and at Port Elizabeth, South
Africa (Modified after Wharton & Evans, 1888).
Sccience of Tsunami Hazards, Volume 21, Number 4, page 205 (2003)
Using the time of Krakatau's fourth explosion as the tsunami origin time, it is estimated that it took12 hours for the tsunami waves to reach Aden on the southern tip of the Arabian Peninsula, some3800 nautical miles away from the Sunda Strait. Unfortunately there was no operating tide gauge. Thewave reported at Aden probably represents the one generated in the Sunda Strait. The travel time of alittle over 300 nautical miles per hour to Aden appears reasonable. There were no land boundaries onthe Indian Ocean side of the Sunda Strait to prevent the tsunami waves from Krakatau from spreadingand traveling in a westward direction. The tide gauges operating at Port Blair in the Andaman Islandsand at Port Elizabeth in South Africa recorded these direct tsunami waves.
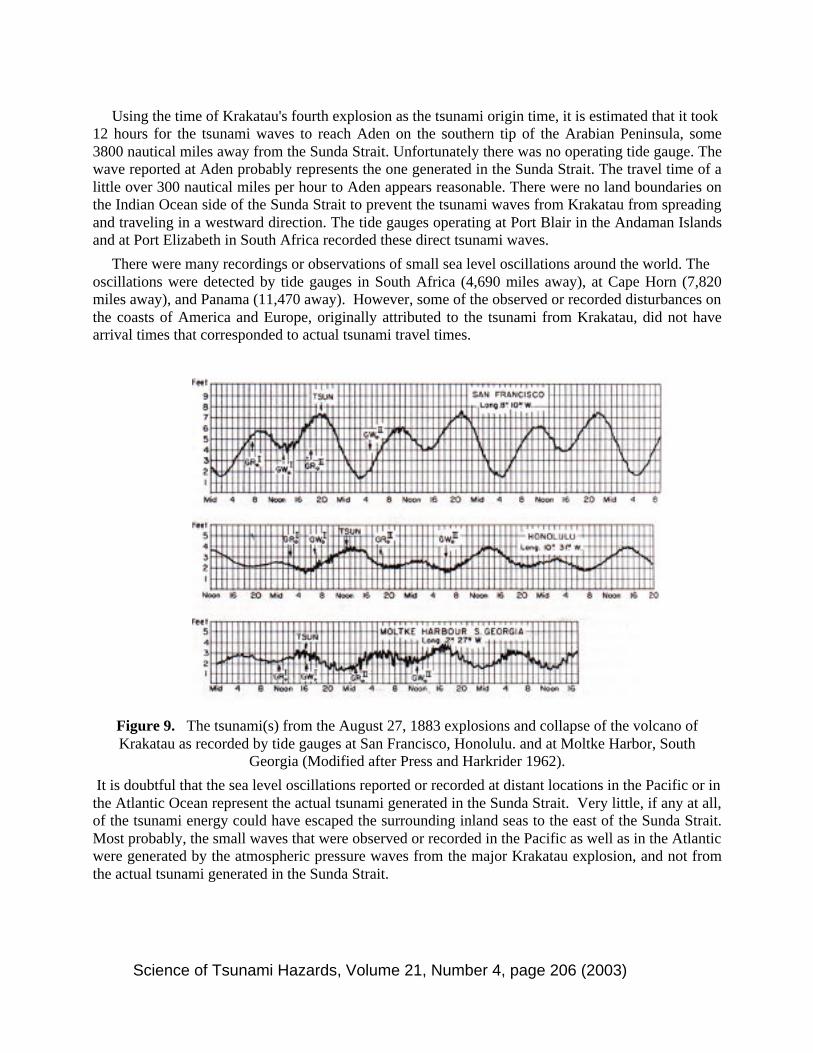
There were many recordings or observations of small sea level oscillations around the world. Theoscillations were detected by tide gauges in South Africa (4,690 miles away), at Cape Horn (7,820miles away), and Panama (11,470 away). However, some of the observed or recorded disturbances onthe coasts of America and Europe, originally attributed to the tsunami from Krakatau, did not havearrival times that corresponded to actual tsunami travel times.
Figure 9. The tsunami(s) from the August 27, 1883 explosions and collapse of the volcano ofKrakatau as recorded by tide gauges at San Francisco, Honolulu. and at Moltke Harbor, South
Georgia (Modified after Press and Harkrider 1962).
It is doubtful that the sea level oscillations reported or recorded at distant locations in the Pacific or inthe Atlantic Ocean represent the actual tsunami generated in the Sunda Strait. Very little, if any at all,of the tsunami energy could have escaped the surrounding inland seas to the east of the Sunda Strait.Most probably, the small waves that were observed or recorded in the Pacific as well as in the Atlanticwere generated by the atmospheric pressure waves from the major Krakatau explosion, and not fromthe actual tsunami generated in the Sunda Strait.
Science of Tsunami Hazards, Volume 21, Number 4, page 206 (2003)
The Honolulu tide gauge in the Hawaiian Islands recorded a small oscillation of 0.24 meters, 17hours after the explosion of Krakatau. In Alaska's Kodiak Island a small oscillation of 0.1 meter wasrecorded. In San Francisco, California, a 0.1-meter sea level oscillation was recorded 20 hours afterKrakatau’s explosion. In Japan, a small sea level oscillation was recorded at Honshu-Sagami and atShikoku-Satsuma. In Australia, a trace of the tsunami was recorded. It was less than 0.1 meter. InNew Zealand a 0.3-meter change in water level was reported.
ATMOSPHERICALLY GENERATED TSUNAMIS
A rapidly moving atmospheric pressure front moving over a shallow sea can couple with the seasurface and generate tsunami-like waves. It has been clearly established that the atmospheric pressureshock waves from the explosions of Krakatau were significant. They circled the earth and wererecorded by barographs throughout the world. In fact, some as many as seven times as the wavebounced back and forth between the eruption site and its antipode (located near Bogota, Colombia)for 5 days after the explosion.
Such atmospheric pressure wave coupling from the Krakatau main explosion, traveling around theearth, gave rise to unusual sea level oscillations in bays and estuaries far distantly from the sourceregion. Also, the atmospheric pressure wave appears to have been responsible for sea leveloscillations recorded by many tide gauges.
In all probability, the small sea level oscillations that were observed in the Pacific as well as in theAtlantic were generated by the atmospheric pressure waves that resulted from the major Krakatauexplosion, and not from the actual tsunami generated in the Sunda Strait. The waves recorded bygauges in Honolulu, San Francisco and elsewhere were caused by the atmospheric pressure waves,because their timing is not consistent with tsunami travel times. For example, if it took 11.9 hours forthe actual tsunami to reach Surabaya on the eastern end of Java, how could it take only 17 hours toreach Honolulu and 20 hours to reach San Francisco, particularly since little or no tsunami energycould escape the inland seas to the east of the Sunda Strait? Similarly, the unusual sea leveldisturbances observed in such distant locations as the Bay of Cardiff can only be explained bycoupling of the sea surface with the atmospheric pressure wave from the major explosion of Krakatau.
Since the shock wave travel at the speed of sound (approx. 340 meters/sec - about 1225 Km/hour)the travel time of the atmospheric pressure wave to Cardiff could be estimated. At that speed, and theshorter distance in a westward rather than eastward direction, an 18-hour travel time of theatmospheric wave from Krakatau’s fourth paroxysmal explosion to Cardiff seems possible. There isno way that a direct wave could travel on the surface of the ocean to reach Cardiff in such a short time– particularly considering that it took 12 hours for the actual waves to just reach Aden on the ArabianPeninsula. Additionally, it appears the configuration and geometry of the Bay at Cardiff, the offshorebathymetry, and the direction of approach of the shock wave were optimum for atmospheric couplingthat caused the observed sea level disturbances. Additional studies of microbarograph recordings ofthe atmospheric wave caused by the Krakatau explosions would be very helpful to further confirm theatmospheric origin of the sea level disturbances that were observed or recorded.
Science of Tsunami Hazards, Volume 21, Number 4, page 207 (2003)
SUMMARY AND CONCLUSIONS
Geologic evidence and observations reported in the scientific literature indicate that severaltsunamis were generated in the Sunda Strait during the paroxysmal phases of Krakatau's volcanicactivity on August 26-27, 1883. During a ten hour period, Rakata Island was significantly altered byseveral subsidences, explosions and large waves following four Plinian and several submarineSurtsean (phreatomagmatic) eruptions and explosions.
A sub aerial collapse of Krakatau’s caldera begun in the northern part of Rakata in the vicinity ofthe Perboewatan crater. Subsequent tsunami waves - generated by flank collapse activity - triggeredextensive landslides of previously deposited pumice on Verlaten and Lang islands and generatedadditional large local tsunami-like waves. One – but more likely two - major explosions followed byextensive flank failures and massive caldera collapses of Krakatau - on what used to be Rakata Island- generated the more destructive of the tsunamis observed in the Sunda Strait. The existence of aridge separating the resulting submarine caldera depression is indicative of two distinct largeexplosion/collapse events. The composition of deposits on neighbor islands also supports suchmechanism of tsunami generation during Krakatau’s paroxysmal phase.
The largest of the destructive tsunami waves were generated a little after 10:02 on August 27th(GMT), from the combination of explosion, subsidences, caldera collapses, landslides and massiveunderwater flank failures. Another substantial tsunami was generated at 16:38 by an additional phaseof Krakatau's caldera collapse.
The small waves and other sea level disturbances that were observed at great distances weregenerated by atmospheric, air-to-sea coupling of shock waves from the major Krakatoa explosion, andnot from the actual tsunami generated in the Sunda Strait.
Science of Tsunami Hazards, Volume 21, Number 4, page 208 (2003)
REFERENCES
Anon., 1883, On the Tsunami of Aug. 27, 1883, Daily Bulletin, Honolulu, Aug. 29, 1883.
Bulletin of the Global Volcanism Network, 1995, Krakatau
Decker R. and Hadikusumo D., 1961 Bulletin of Volcanology, V.20, no.3. Results of the 1960Expedition to Krakatau Journal of Geophysical Research, V.66, no.10, p.3497-3511.
Decker, R., and Decker, B., 1989, Volcanoes: W.H. Freeman, New York, 285 p.
Escher, B.G., 1919. Excursie-gids voor Krakatau, Samengesteld voor de Excursie. 7 pages, 5illustrations. Welte-vreden: Albrecht and Co. Samengesteld voorde Excursie, te houden door hetEerste Ned-erlandsch-Indisch Natuurwetenschappelijk Congres, Oct 1919.
Escher, B.G., 1928. Krakatau in 1883 and in 1928. Tijdschrift vanhet Koninklijk NederlandschAardriikskundig Genootschap, series 2, 45:715-743.
Ewing M. and F. Press, 1955. Tide gauge disturbances from the great eruption of Krakatoa, Trans.Am. Geophys. Union, v. 36, no. 1, p. 53-60.
Furneaux, Rupert, 1964. Krakatoa
Fuchs, C. W. C. 1884 Report on the volcanic events of the year 1877 -83 [German], (Tschermaks)Mneratogische und Petrographische Mitteinluengen, Vienna, n.s.v. 1, (pub. 1878), p. 106-136; year1878 (pub. 1879), n.s.v. 2, p. 97-125; year 1883 (pub. 1883), n.s.v. 5, p. 339-381; year 1884 (pub.1884), n.s.v. 6, p. 185-231.
Heck, N.H., 1947, List of seismic sea waves, Bull.. Seismol. Soc. Am., v. 37, no. 4, p. 269-284.
Hirota, I (1983) Wind around the earth (in Japanese), Chuko sinsho, Chuou-Kouron-Sha
Iida, K., D.C. Cox, and Pararas--Carayannis, G., 1967. Preliminary Catalog of Tsunamis Occurring inthe Pacific Ocean. Data, Report No. 5. Hawaii Inst.Geophys. HIG-67-10 (unpaged), Univ. of Hawaii,Aug. 1967.
Imamura, A., 1949 Homeland tsunami chronology [Japanese], Zisin, Ser. 2, v. 2, part 1, p. 23-28.
Kawasumi, H. [ed. J), 1963. List of great earthquakes in and near Japan; list of great earthquakes inChina; and list of great earthquakes of the world [Japanese], Ghigaku [Earth Sciences] in Rika-Nempyo [Nat. Sci. Almanac, Haruzen, Tokyo. p. 154-225
Milne, J. 1912, Catalog of destructive earthquakes, Brit. Assn. Adv. Sci. Rept. 81st Mtg., 1911, p.
649-740.
Montessus De Ballore, F. , 1907. The Science Seismology: Earthquake [French], Armand Colin,Paris, 579 pp.
Montserrat Archives (Volcanology): Krakatoa and the 1880's
Museon (the popular-science museum in The Hague), Some facts on the 1883 eruption of Krakatau,
Science of Tsunami Hazards, Volume 21, Number 4, page 209 (2003)
http://museon.museon.nl/objextra.eng/uitbarst.html
Nomanbhoy N. and Satake K. 1997?. Numerical Computation of Tsunamis From the 1883 KrakatauEruption (Geological Sciences, Univ. of Michigan, Ann Arbor, MI 48109; 313-763-4069)
Pararas-Carayannis, G., 1973. The Waves That Destroyed the Minoan Empire. Sea Frontiers, Vol 19,No. 2, p. 94, March-April, 1973.
Pararas-Carayannis, G., 1974 The Destruction of the Minoan Civilization. Encyclopedia Grollier,Science Supplement, pp 314-321, 1974
Pararas-Carayannis, G, 1983. Tsunami Effects from the Krakatau Eruption. Unpublished ITIC reviewof the Smithsonian Institution's book Krakatau 1883: The volcanic eruption and its effects: by Simkin,T., and Fiske, R.S., published in 1983 by the Smithsonian Institution Press: Washington, D.C., 464 p.
Pararas-Carayannis, G. 1999. The Tsunami Generated by the August 26, 1883 Explosion of theKrakatau Volcano, The Tsunami Page of Dr.George PC..http://drgeorgepc.com/Tsunami1883Krakatoa.html
Pararas-Carayannis, G., 1992.The Tsunami Generated from the Eruption of the Volcano of Santorin inthe Bronze Age. Natural Hazards 5::115-123,1992. 1992 Kluwer Academic Publishers. Netherlands.
Pararas-Carayannis, G., 2002a. Volcanically Generated Tsunamis, 2nd Symposium of the TsunamiSociety, Honolulu, Hawaii, May 25-29.
Pararas-Carayannis, G., 2002b. Evaluation of the Threat of Mega Tsunami Generation fromPostulated Massive Slope Failures of Island Stratovolcanoes on La Palma, Canary Islands, and on theIsland of Hawaii, Science of Tsunami Hazards. Vol 20 (5). Pages 251-277.
Press, F., and D. Harkrider, 1962. Propagation of Acoustic-Gravity Waves in the Atmosphere.Journalof Geophysical Research, 67:3889-3908.
Sea Frontiers, 1971 "Krakatoa-The Killer Wave,", Vol 17, No 3, May June
Simkin, T., and Fiske, R.S., 1983, Krakatau 1883: The volcanic eruption and its effects: SmithsonianInstitution Press: Washington, D.C., 464 p.
Simkin, T., and Siebert, L., 1994, Volcanoes of the world: Geoscience Press, Tucson, Arizona, 349 p.
Stehn, Ch.E.,1929. The Geology and Volcanism of the Krakatau Group. Proceedings of the FourthPacific Science Congress (Batavia), pages 1-35.
Svyatlowski, A.E., 1957. Tsunamis--destructive waves originating with underwater earthquakes inseas and oceans [Russian], Izdatel'stvo Akad. Nauk SSSR, p. 1-69, Eng. transl. by V. Stevenson,Hawaii Inst. Geophys., Transl. Ser. 8, 1961.
Symons, G.J. (ed), 1888. The Eruption of Krakatoa ans Subsequent Phenomena. Report of theKrakatoa Committee of the Royal Society. 494 pages. London: Trubner and Co.
Verbeek, R. D. M., 1884. Krakatoa [French], Parts I & II, Batavia, p. 396-461 [As cited by Montessusde Ballore, 1907;
Science of Tsunami Hazards, Volume 21, Number 4, page 210 (2003)
Warton, W. J. L., and F. J. Evans, 1888, On the seismic sea waves caused by the eruption at Krakatoa,August 26th and 27th, 1883, Part III of The Eruption of Krakatoa and Subsequent Phenomena, G. L.Symonds [ed.], Rept. of the Krakatoa Comm. of the Roy. Soc., p. 89-151.
Whitney, James A., 1992, Volcano. Grolier Electronic Publisher, Inc..
Wilson, J., T. Simkin, and L. Len 1973. Seismicity of a Caldera Collapse: Galapagos Islands 1968.Journal of Geophysical Research, 78:8591-8622.
Yokohama, I., 1981. A Geophysical Interpretation of the 1883 Krakatau Eruption. Journal ofVolcanology and Geothermal Research, 9:359-386
Science of Tsunami Hazards, Volume 21, Number 4, page 201 (2003)
ESTIMATION OF FAR-FIELD TSUNAMI POTENTIAL
FOR THE CARIBBEAN COAST
BASED ON NUMERICAL SIMULATION
Narcisse Zaibo1), Efim Pelinovsky2), Andrey Kurkin3), and Andrey Kozelkov3)
1) Département de Physique, Université des Antilles et de la Guyane, Pointe-à-Pitre, France; email: [email protected] 2) Laboratory of Hydrophysics and Nonlinear Acoustics, Institute of Applied Physics, Nizhny Novgorod, Russia; email: [email protected] 3) Applied Mathematics Department, State Technical University, Nizhny Novgorod, Russia; email: [email protected]
ABSTRACT
The tsunami problem for the coast of the Caribbean basin is discussed. Briefly the historical data of tsunami in the Caribbean Sea are presented. Numerical simulation of potential tsunamis in the Caribbean Sea is performed in the framework of the nonlinear-shallow theory. The tsunami wave height distribution along the Caribbean Coast is computed. These results are used to estimate the far-field tsunami potential of various coastal locations in the Caribbean Sea. In fact, five zones with tsunami low risk are selected basing on prognostic computations, they are: the bay “Golfo de Batabano” and the coast of province “Ciego de Avila” in Cuba, the Nicaraguan Coast (between Bluefields and Puerto Cabezas), the border between Mexico and Belize, the bay “Golfo de Venezuela” in Venezuela. The analysis of historical data confirms that there was no tsunami in the selected zones. Also, the wave attenuation in the Caribbean Sea is investigated; in fact, wave amplitude decreases in an order if the tsunami source is located on the distance up to 1000 km from the coastal location. Both factors wave attenuation and wave height distribution should be taken into account in the planned warning system for the Caribbean Sea.
Science of Tsunami Hazards, Volume 21, Number 4, page 202 (2003)
1. Introduction
The tsunami catalogue has been recently created for the Caribbean Sea (Lander et al, 2002;
HTDB/ATL, 2002; Loughlin and Lander, 2003) and in particular, for the Lesser Antilles
(Zahibo and Pelinovsky, 2001). In the past 500 years this region has had devastating tsunamis
causing damage in many states of the Caribbean Basin. According to Lander et al (2002),
totally, 91 reported waves might have been tsunamis. Of these, 27 are judged by the authors
to be true, verified tsunamis and the additional nine are considered to be very likely true
tsunamis. The list for the last century contains 33 events, thus one in every three years. Only
for the last 35 years there were 6 true and almost true tsunamis: 1969, December 25
(earthquake with magnitude 7.6 in Lesser Antilles, maximal tsunami amplitude of 46 cm at
Barbados); 1985, March 16 (moderate earthquake with magnitude 6.3 in Guadeloupe, several-
centimeter tsunami was recorded at Basse Terre, Guadeloupe); 1989, November 1 (weak
earthquake with magnitude 4.4 off the north coast of Puerto Rico generating a small wave in
Cabo Rojo); 1991, April 22 (the earthquake with magnitude 7.6 created the tsunami that
affected the coast of Central America from Costa Rica to Panama; wave height is 2 m in
Cahuito Perto Viejo, Costa Rica); 1997, July 9 (the earthquake of magnitude 6.8 occurred off
the coast of Venezuela and induced a weak tsunami on Tobago); 1997, December 26
(volcanic eruption in Montserrat generated the wave with height 3 m at Old Road Bay). The
last tsunami occurred in Guadeloupe (Deshaies) at July 12, 2003 induced by the volcanic
eruption in Montserrat (Zahibo et al, 2003a). Small boats moored in the mouth of the
Deshaies River were carried on more than 60 meters, and some of them were damaged (the
sea rised on 50 cm approximately).
Tsunami phenomenon in the Caribbean Sea has been the subject of special study in recent
years. First of all, we would like to mention the calculation of the tsunami travel time charts
for the Caribbean (Weissert, 1990). The estimated time for a complete crossing of the
Caribbean is 3.2 hrs laterally and 1.5 hrs meridionally. Two historical events in the Caribbean,
the 1918 Puerto Rico tsunami and the 1867 Virgin Island tsunami, induced by the davastating
earthquakes, have been simulated by Mercado & McCann (1998) and Zahibo et al (2003b).
Computed values of the tsunami wave heights are in a satisfactory agreement with the
observed data. The propagation of the trans-atlantic tsunami after the catastrophic Lisbon
earthquake (01/11/1755) has been modelled by Mader (2001a). According to his calculations,
the wave amplitude east of Saba (Lesser Antilles) is 5 m close to the observed value (7 m).
Science of Tsunami Hazards, Volume 21, Number 4, page 203 (2003)
Heinrich et al (2001) performed the numerical simulation of the 26/12/1997 debris avalanche
in Montserrat (Lesser Antilles) that induced tsunami waves up to 3 m.
Taking into account the lack of historical data for the evaluation of the tsunami risk in the
Caribbean Sea, the simulation of possible tsunamis can be an effective tool to forecast
tsunami events in the future. The potential hazard on the northern coast of Puerto Rico due to
submarine landslides along the Puerto Rico Trench has been estimated (Mercado et al, 2002).
We would also like to mention the possible tsunami expected from a lateral collapse of the
Cumbre Vieja Volcano on La Palma (Canary Islands); according to Mader (2001b) its height
may be 3 m high on the Caribbean Islands (Saba Island). Ward & Day (2001) and Pararas-
Carayannis (2002) discusses 20-40 m waves during this event in the Caribbean. Heinrich et al
(1998, 1999) studying the danger of the volcanic eruption in the Soufriere Hills Volcano,
Montserrat, showed that the potential debris avalanche can induce the tsunami waves of 1-2 m
in the nearest zone and 50 cm at Guadeloupe and Antigua. Le Friant et al (2002, 2003)
simulated the tsunami waves from the potential eruptions of some volcanos in the Lesser
Antilles (Martinique, Dominica) and showed that the islands in the Lesser Antilles face a non-
negligible risk from generation of tsunamis associated with potential future events.
The present paper has a goal to estimate the far-field tsunami potential for the Caribbean Sea
basing on the numerical simulation of the prognostic events. The historical information of
tsunamis in the Caribbean Sea with intensity exceeded 2 on the Imamura-Soloviev scale is
briefly reproduced in section 2. The numerical simulation of prognostic tsunamis is performed
with the use of the TUNAMI code that is based on the nonlinear shallow-water theory. The
important problem of prognostic tsunami sources is discussed in section 3. Additionally to the
small number of the seismic sources, the hydrodynamic sources are selected almost uniformly
along the coast of the Caribbean Sea. The computed distributions of tsunami heights along the
Caribbean Coast are described in section 4. These distributions are used for preliminary
estimations of the tsunami risk (far-field tsunami potential) in the Caribbean Sea. The five
zones with tsunami low risk are selected based on prognostic computations; they are, “Golfo de
Batabano” and coast of province “Ciego de Avila” in Cuba, Nicaraguan coast (between
Bluefields and Puerto Cabezas), border between Mexico and Belize, “Golfo de Venezuela” in
Venezuela. The analysis of historical data confirms that there was no tsunami in the selected
zones. The computed wave attenuation in the Caribbean Sea is investigated in section 5. If the
tsunami sources are located on the distance above 1000 km from the coastal locations such far-
field tsunamis can be evaluated as the low-risk tsunamis.
Science of Tsunami Hazards, Volume 21, Number 4, page 204 (2003)
2. Intense historical tsunamis in the Caribbean Sea
Most of tsunamis in the Caribbean Sea have been generated by the underwater earthquakes
that occurred in the Caribbean. The seismicity of the Caribbean basin is high, see Figure 1
taken from HTDB/ATL (2002). A few of tsunamis are the distant tsunami that came from the
Atlantic coast of Europe. Some local tsunamis were caused by the volcano eruptions; most of
volcanos are located on the Lesser Antilles. Several tsunamis described in catalogues are of
an unknown origin; perhaps, they are hurricane storm surges. The geographical distribution of
tsunamis with various intensities on the Imamura-Soloviev scale is shown in Figure 2. The
intensity tsunamis in the Caribbean Sea did not exceed 3.0 (mean height 4-8 m on the coastal
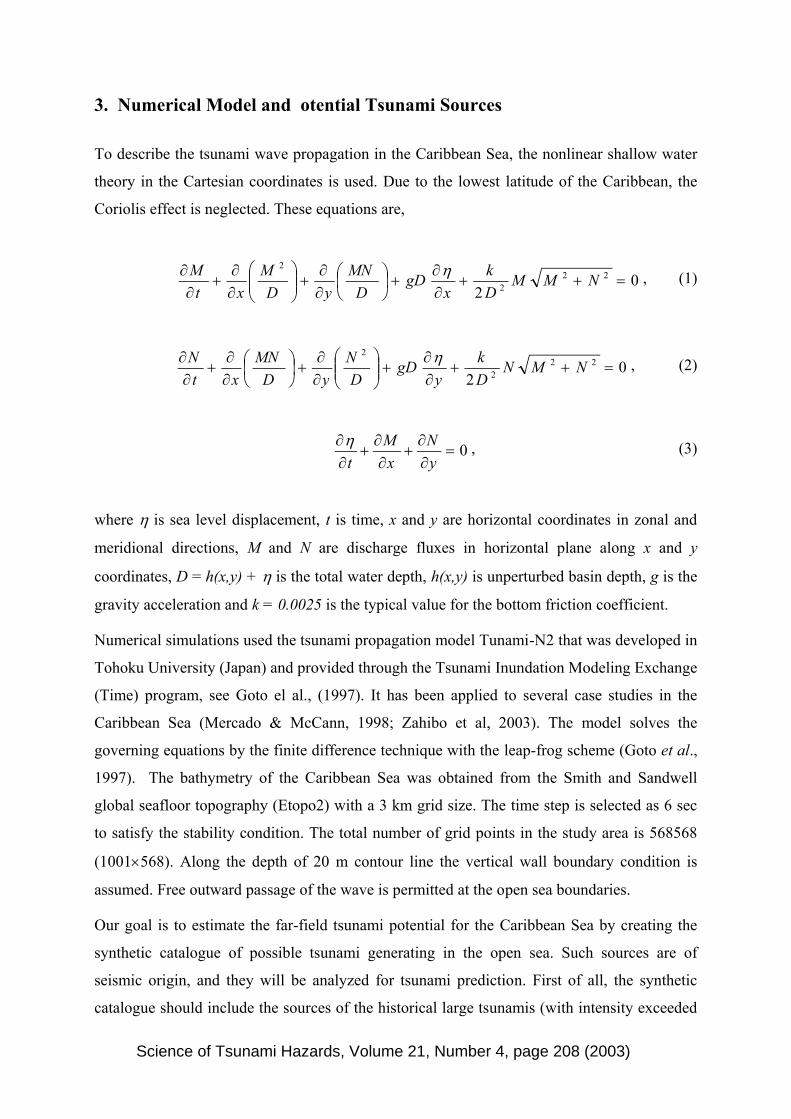
line of 200-400 km). The list of tsunamis with intensity 2.0-3.0 is given in Table 1 extracted
from HTDB/ATL (2002); it includes 27 events. The return period of such intense tsunamis is
about 15-20 years. Taking into account that the last tsunami with intensity 2 was recorded in
1979; we may point out that the probability of the next tsunami in the nearest future in the
Caribbean Sea is high.
Meanwhile, to evaluate the tsunami risk for coastal locations in the Caribbean Sea basing on
the historical data only is a very difficult task due to the lack of quantitative information. The
modeling of the several historical events in the Caribbean Sea that occurred in 1755, 1867,
1918 and 1997 (Mader, 2001a; Zahibo et al, 2003b; Mercado & McCann, 1998; Heinrich et
al, 2001) and the satisfactory agreement with observations demonstrate the applicability of
existing mathematical theories to describe the tsunami characteristics. Taking into account the
historical data and numerical simulations the variability of wave heights along the coastal line
is very large due to the local features of the coastal topography and the directivity of tsunami
sources. By using possible locations of tsunami sources (seismic zones, volcano locations and
so on) the synthetic catalogue of possible tsunamis at the fixed coastal locations can be
created; this will allow to compare the tsunami risk for different areas. This approach is now
very popular for estimations of far-field tsunami potential when the tsunami sources are
located in the open sea (Go et al, 1988; Nagano et al, 1991; Mofjeld et al, 2001; Choi et al,
2001, 2002a; Yalciner et al, 2002; Koike et al, 2003; Sato et al, 2003), and here it will be
applied for the Caribbean Sea.
Science of Tsunami Hazards, Volume 21, Number 4, page 205 (2003)
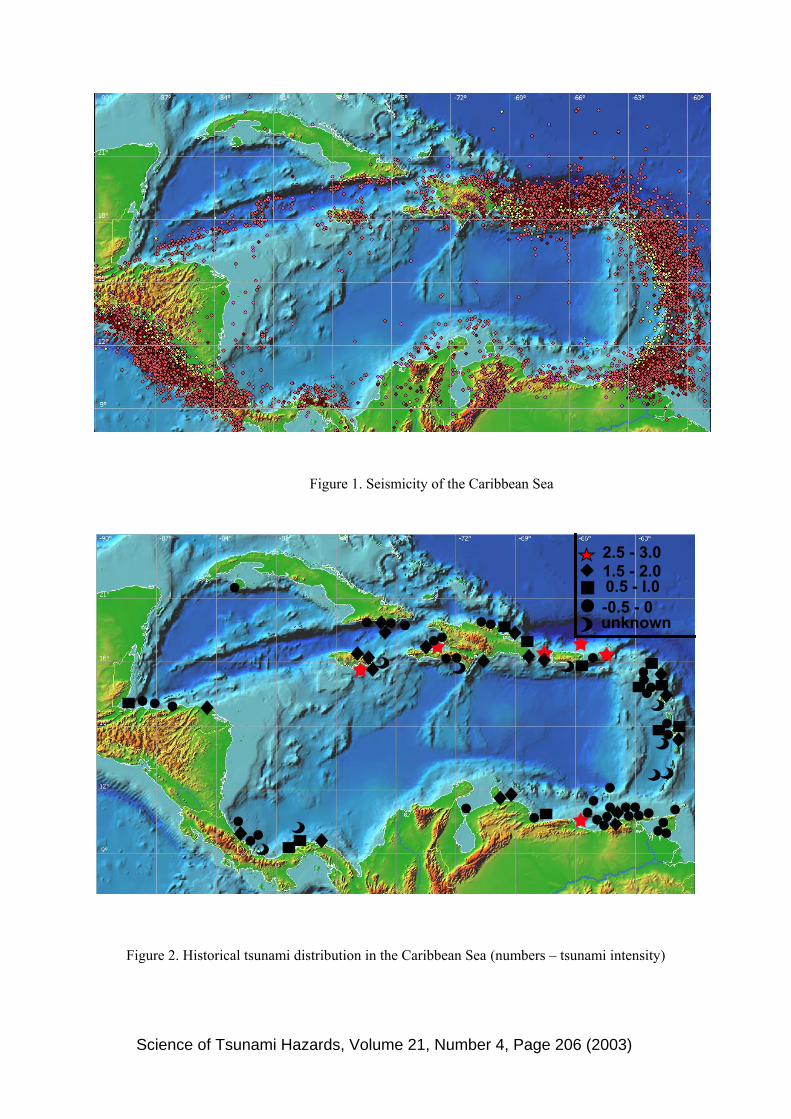
Figure 1. Seismicity of the Caribbean Sea
2.5 - 3.01.5 - 2.00.5 - I.0-0.5 - 0unknown
Figure 2. Historical tsunami distribution in the Caribbean Sea (numbers – tsunami intensity)
Science of Tsunami Hazards, Volume 21, Number 4, Page 206 (2003)
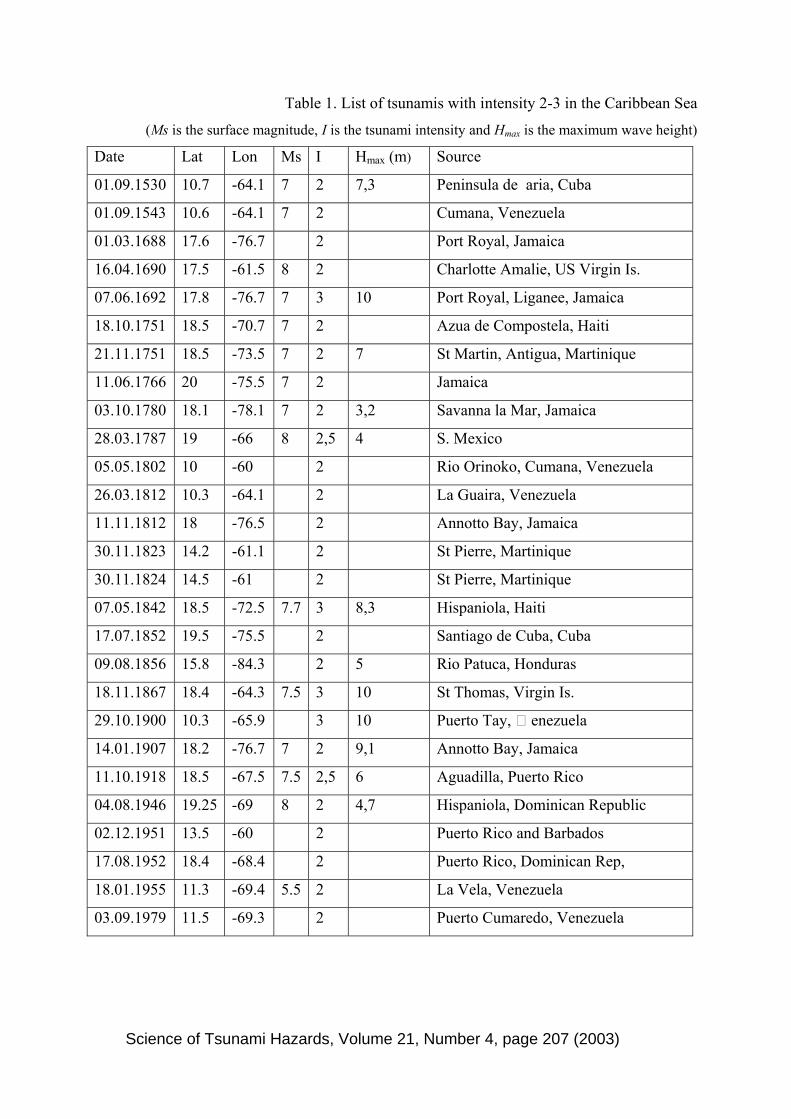
Table 1. List of tsunamis with intensity 2-3 in the Caribbean Sea
(Ms is the surface magnitude, I is the tsunami intensity and Hmax is the maximum wave height)
Date Lat Lon Ms I Hmax (m) Source
01.09.1530 10.7 -64.1 7 2 7,3 Peninsula de Paria, Cuba
01.09.1543 10.6 -64.1 7 2 Cumana, Venezuela
01.03.1688 17.6 -76.7 2 Port Royal, Jamaica
16.04.1690 17.5 -61.5 8 2 Charlotte Amalie, US Virgin Is.
07.06.1692 17.8 -76.7 7 3 10 Port Royal, Liganee, Jamaica
18.10.1751 18.5 -70.7 7 2 Azua de Compostela, Haiti
21.11.1751 18.5 -73.5 7 2 7 St Martin, Antigua, Martinique
11.06.1766 20 -75.5 7 2 Jamaica
03.10.1780 18.1 -78.1 7 2 3,2 Savanna la Mar, Jamaica
28.03.1787 19 -66 8 2,5 4 S. Mexico
05.05.1802 10 -60 2 Rio Orinoko, Cumana, Venezuela
26.03.1812 10.3 -64.1 2 La Guaira, Venezuela
11.11.1812 18 -76.5 2 Annotto Bay, Jamaica
30.11.1823 14.2 -61.1 2 St Pierre, Martinique
30.11.1824 14.5 -61 2 St Pierre, Martinique
07.05.1842 18.5 -72.5 7.7 3 8,3 Hispaniola, Haiti
17.07.1852 19.5 -75.5 2 Santiago de Cuba, Cuba
09.08.1856 15.8 -84.3 2 5 Rio Patuca, Honduras
18.11.1867 18.4 -64.3 7.5 3 10 St Thomas, Virgin Is.
29.10.1900 10.3 -65.9 3 10 Puerto Tay, Venezuela
14.01.1907 18.2 -76.7 7 2 9,1 Annotto Bay, Jamaica
11.10.1918 18.5 -67.5 7.5 2,5 6 Aguadilla, Puerto Rico
04.08.1946 19.25 -69 8 2 4,7 Hispaniola, Dominican Republic
02.12.1951 13.5 -60 2 Puerto Rico and Barbados
17.08.1952 18.4 -68.4 2 Puerto Rico, Dominican Rep,
18.01.1955 11.3 -69.4 5.5 2 La Vela, Venezuela
03.09.1979 11.5 -69.3 2 Puerto Cumaredo, Venezuela
Science of Tsunami Hazards, Volume 21, Number 4, page 207 (2003)
3. Numerical Model and Potential Tsunami Sources
To describe the tsunami wave propagation in the Caribbean Sea, the nonlinear shallow water
theory in the Cartesian coordinates is used. Due to the lowest latitude of the Caribbean, the
Coriolis effect is neglected. These equations are,
02
222
2
=++∂∂
+
∂∂
+
∂∂
+∂
∂ NMMDk
xgD
DMN
yDM
xtM η , (1)
02
222
2
=++∂∂
+
∂∂
+
∂∂
+∂
∂ NMNDk
ygD
DN
yDMN
xtN η , (2)
0=∂∂
+∂
∂+
∂∂
yN
xM
tη , (3)
where η is sea level displacement, t is time, x and у are horizontal coordinates in zonal and
meridional directions, M and N are discharge fluxes in horizontal plane along x and y
coordinates, D = h(x,y) + η is the total water depth, h(x,y) is unperturbed basin depth, g is the
gravity acceleration and k = 0.0025 is the typical value for the bottom friction coefficient.
Numerical simulations used the tsunami propagation model Tunami-N2 that was developed in
Tohoku University (Japan) and provided through the Tsunami Inundation Modeling Exchange
(Time) program, see Goto el al., (1997). It has been applied to several case studies in the
Caribbean Sea (Mercado & McCann, 1998; Zahibo et al, 2003). The model solves the
governing equations by the finite difference technique with the leap-frog scheme (Goto et al.,
1997). The bathymetry of the Caribbean Sea was obtained from the Smith and Sandwell
global seafloor topography (Etopo2) with a 3 km grid size. The time step is selected as 6 sec
to satisfy the stability condition. The total number of grid points in the study area is 568568
(1001×568). Along the depth of 20 m contour line the vertical wall boundary condition is
assumed. Free outward passage of the wave is permitted at the open sea boundaries.
Our goal is to estimate the far-field tsunami potential for the Caribbean Sea by creating the
synthetic catalogue of possible tsunami generating in the open sea. Such sources are of
seismic origin, and they will be analyzed for tsunami prediction. First of all, the synthetic
catalogue should include the sources of the historical large tsunamis (with intensity exceeded
Science of Tsunami Hazards, Volume 21, Number 4, page 208 (2003)
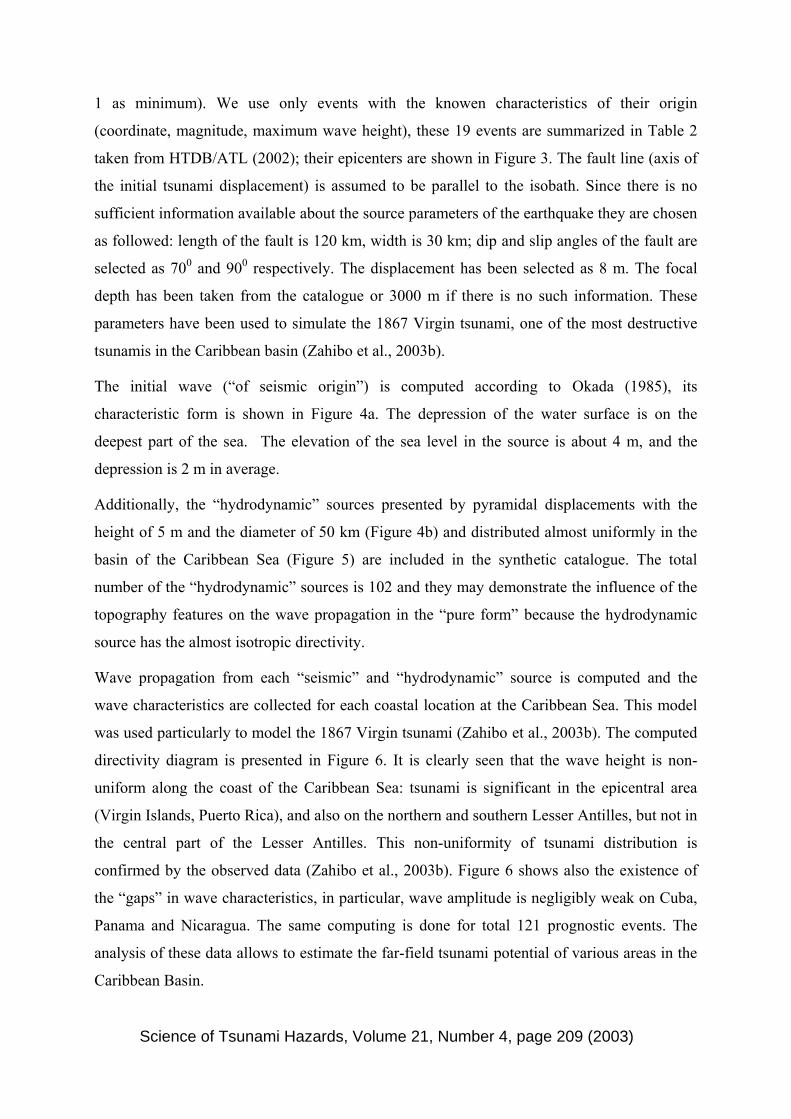
1 as minimum). We use only events with the knowen characteristics of their origin
(coordinate, magnitude, maximum wave height), these 19 events are summarized in Table 2
taken from HTDB/ATL (2002); their epicenters are shown in Figure 3. The fault line (axis of
the initial tsunami displacement) is assumed to be parallel to the isobath. Since there is no
sufficient information available about the source parameters of the earthquake they are chosen
as followed: length of the fault is 120 km, width is 30 km; dip and slip angles of the fault are
selected as 700 and 900 respectively. The displacement has been selected as 8 m. The focal
depth has been taken from the catalogue or 3000 m if there is no such information. These
parameters have been used to simulate the 1867 Virgin tsunami, one of the most destructive
tsunamis in the Caribbean basin (Zahibo et al., 2003b).
The initial wave (“of seismic origin”) is computed according to Okada (1985), its
characteristic form is shown in Figure 4a. The depression of the water surface is on the
deepest part of the sea. The elevation of the sea level in the source is about 4 m, and the
depression is 2 m in average.
Additionally, the “hydrodynamic” sources presented by pyramidal displacements with the
height of 5 m and the diameter of 50 km (Figure 4b) and distributed almost uniformly in the
basin of the Caribbean Sea (Figure 5) are included in the synthetic catalogue. The total
number of the “hydrodynamic” sources is 102 and they may demonstrate the influence of the
topography features on the wave propagation in the “pure form” because the hydrodynamic
source has the almost isotropic directivity.
Wave propagation from each “seismic” and “hydrodynamic” source is computed and the
wave characteristics are collected for each coastal location at the Caribbean Sea. This model
was used particularly to model the 1867 Virgin tsunami (Zahibo et al., 2003b). The computed
directivity diagram is presented in Figure 6. It is clearly seen that the wave height is non-
uniform along the coast of the Caribbean Sea: tsunami is significant in the epicentral area
(Virgin Islands, Puerto Rica), and also on the northern and southern Lesser Antilles, but not in
the central part of the Lesser Antilles. This non-uniformity of tsunami distribution is
confirmed by the observed data (Zahibo et al., 2003b). Figure 6 shows also the existence of
the “gaps” in wave characteristics, in particular, wave amplitude is negligibly weak on Cuba,
Panama and Nicaragua. The same computing is done for total 121 prognostic events. The
analysis of these data allows to estimate the far-field tsunami potential of various areas in the
Caribbean Basin.
Science of Tsunami Hazards, Volume 21, Number 4, page 209 (2003)
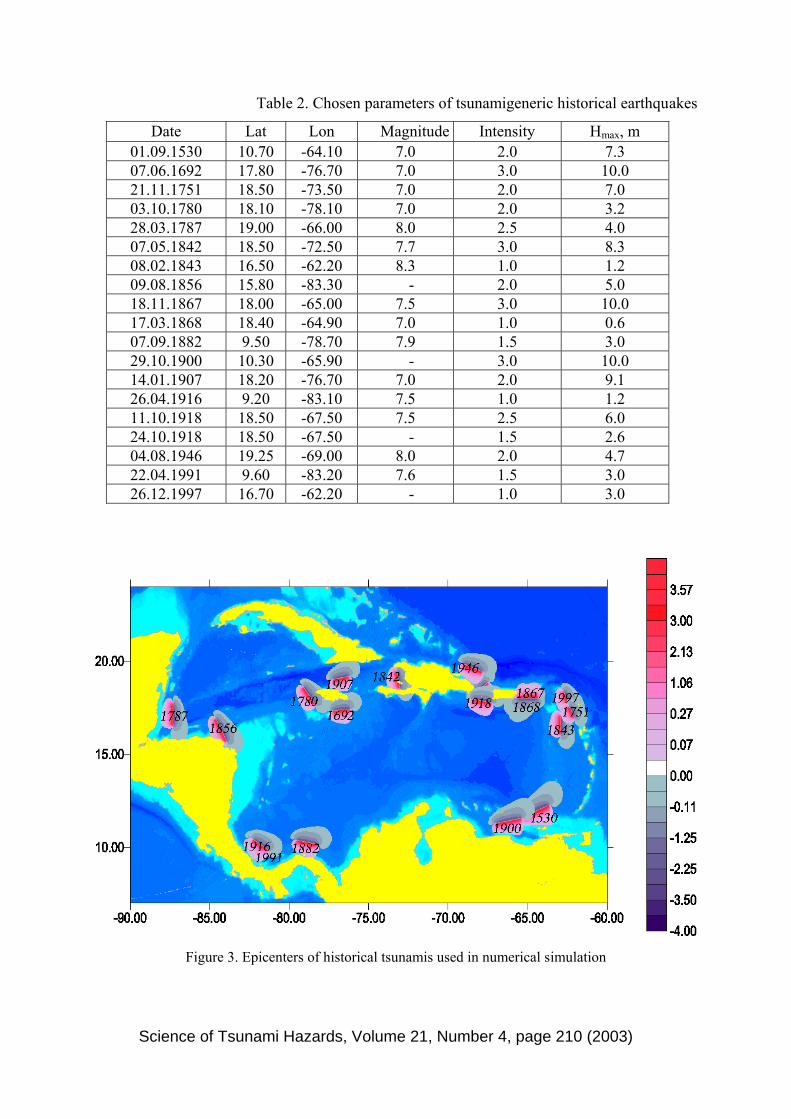
Table 2. Chosen parameters of tsunamigeneric historical earthquakes
Date Lat Lon Magnitude Intensity Hmax, m 01.09.1530 10.70 -64.10 7.0 2.0 7.3 07.06.1692 17.80 -76.70 7.0 3.0 10.0 21.11.1751 18.50 -73.50 7.0 2.0 7.0 03.10.1780 18.10 -78.10 7.0 2.0 3.2 28.03.1787 19.00 -66.00 8.0 2.5 4.0 07.05.1842 18.50 -72.50 7.7 3.0 8.3 08.02.1843 16.50 -62.20 8.3 1.0 1.2 09.08.1856 15.80 -83.30 - 2.0 5.0 18.11.1867 18.00 -65.00 7.5 3.0 10.0 17.03.1868 18.40 -64.90 7.0 1.0 0.6 07.09.1882 9.50 -78.70 7.9 1.5 3.0 29.10.1900 10.30 -65.90 - 3.0 10.0 14.01.1907 18.20 -76.70 7.0 2.0 9.1 26.04.1916 9.20 -83.10 7.5 1.0 1.2 11.10.1918 18.50 -67.50 7.5 2.5 6.0 24.10.1918 18.50 -67.50 - 1.5 2.6 04.08.1946 19.25 -69.00 8.0 2.0 4.7 22.04.1991 9.60 -83.20 7.6 1.5 3.0 26.12.1997 16.70 -62.20 - 1.0 3.0
Figure 3. Epicenters of historical tsunamis used in numerical simulation
Science of Tsunami Hazards, Volume 21, Number 4, page 210 (2003)
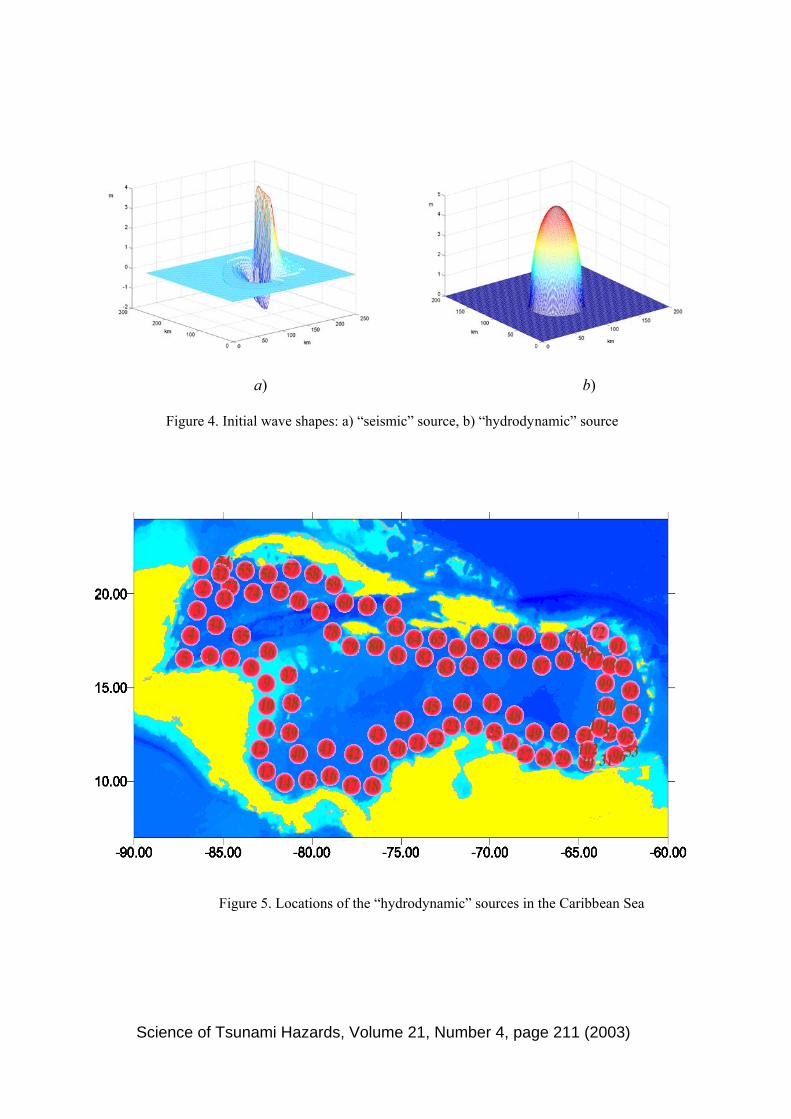
a) b) Figure 4. Initial wave shapes: a) “seismic” source, b) “hydrodynamic” source
Figure 5. Locations of the “hydrodynamic” sources in the Caribbean Sea
Science of Tsunami Hazards, Volume 21, Number 4, page 211 (2003)
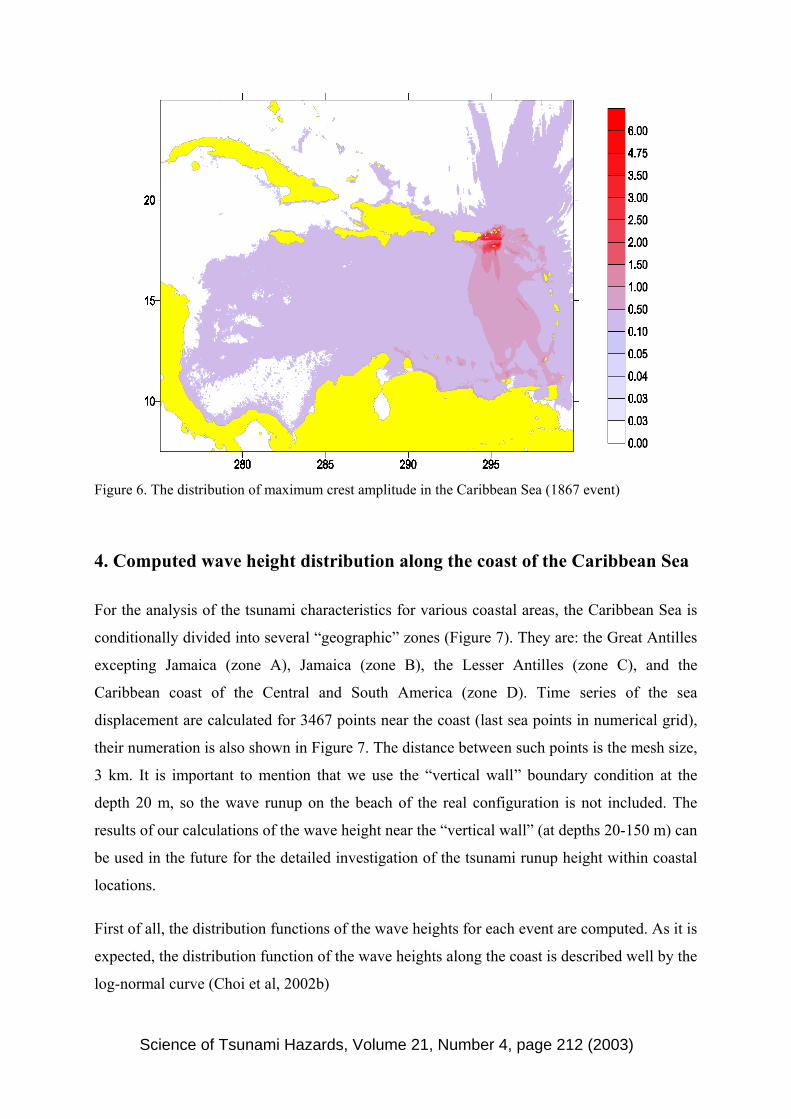
Figure 6. The distribution of maximum crest amplitude in the Caribbean Sea (1867 event)
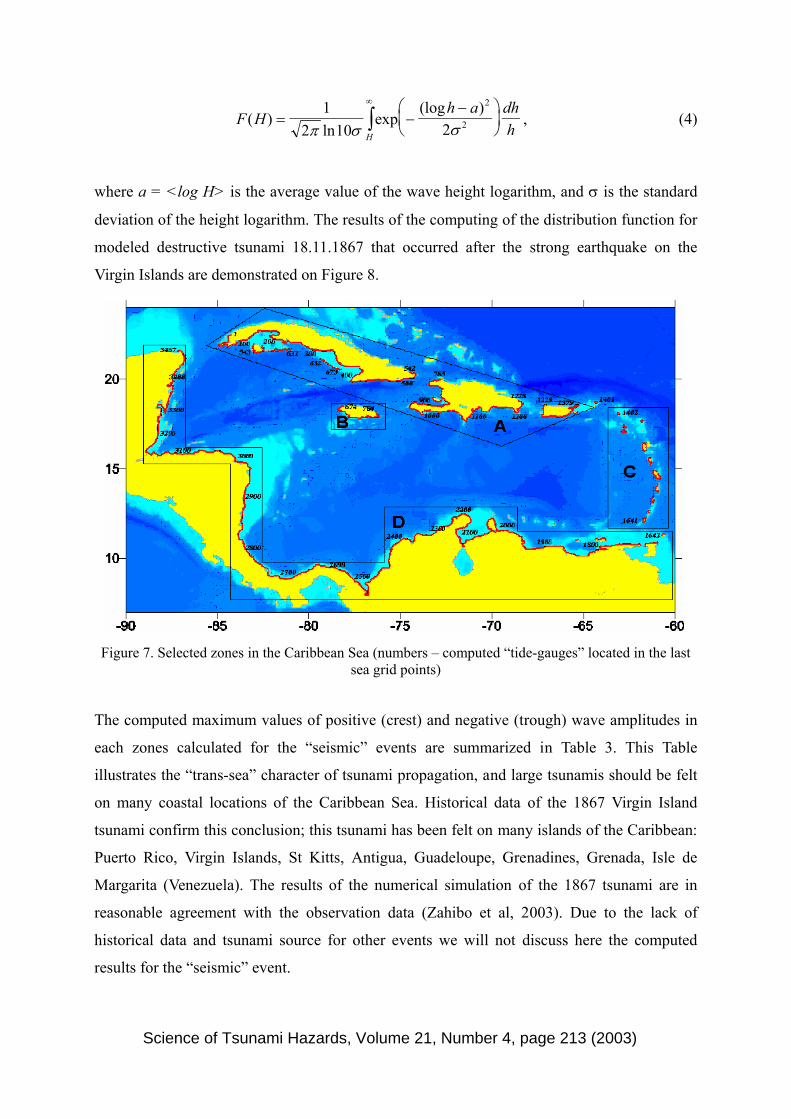
4. Computed wave height distribution along the coast of the Caribbean Sea
For the analysis of the tsunami characteristics for various coastal areas, the Caribbean Sea is
conditionally divided into several “geographic” zones (Figure 7). They are: the Great Antilles
excepting Jamaica (zone A), Jamaica (zone B), the Lesser Antilles (zone C), and the
Caribbean coast of the Central and South America (zone D). Time series of the sea
displacement are calculated for 3467 points near the coast (last sea points in numerical grid),
their numeration is also shown in Figure 7. The distance between such points is the mesh size,
3 km. It is important to mention that we use the “vertical wall” boundary condition at the
depth 20 m, so the wave runup on the beach of the real configuration is not included. The
results of our calculations of the wave height near the “vertical wall” (at depths 20-150 m) can
be used in the future for the detailed investigation of the tsunami runup height within coastal
locations.
First of all, the distribution functions of the wave heights for each event are computed. As it is
expected, the distribution function of the wave heights along the coast is described well by the
log-normal curve (Choi et al, 2002b)
Science of Tsunami Hazards, Volume 21, Number 4, page 212 (2003)
F Hh a dh
hH
( )ln
exp(log )
= −−
∞
∫1
2 10 2
2
2π σ σ, (4)
where a = <log H> is the average value of the wave height logarithm, and σ is the standard
deviation of the height logarithm. The results of the computing of the distribution function for
modeled destructive tsunami 18.11.1867 that occurred after the strong earthquake on the
Virgin Islands are demonstrated on Figure 8.
Figure 7. Selected zones in the Caribbean Sea (numbers – computed “tide-gauges” located in the last
sea grid points)
The computed maximum values of positive (crest) and negative (trough) wave amplitudes in
each zones calculated for the “seismic” events are summarized in Table 3. This Table
illustrates the “trans-sea” character of tsunami propagation, and large tsunamis should be felt
on many coastal locations of the Caribbean Sea. Historical data of the 1867 Virgin Island
tsunami confirm this conclusion; this tsunami has been felt on many islands of the Caribbean:
Puerto Rico, Virgin Islands, St Kitts, Antigua, Guadeloupe, Grenadines, Grenada, Isle de
Margarita (Venezuela). The results of the numerical simulation of the 1867 tsunami are in
reasonable agreement with the observation data (Zahibo et al, 2003). Due to the lack of
historical data and tsunami source for other events we will not discuss here the computed
results for the “seismic” event.
Science of Tsunami Hazards, Volume 21, Number 4, page 213 (2003)
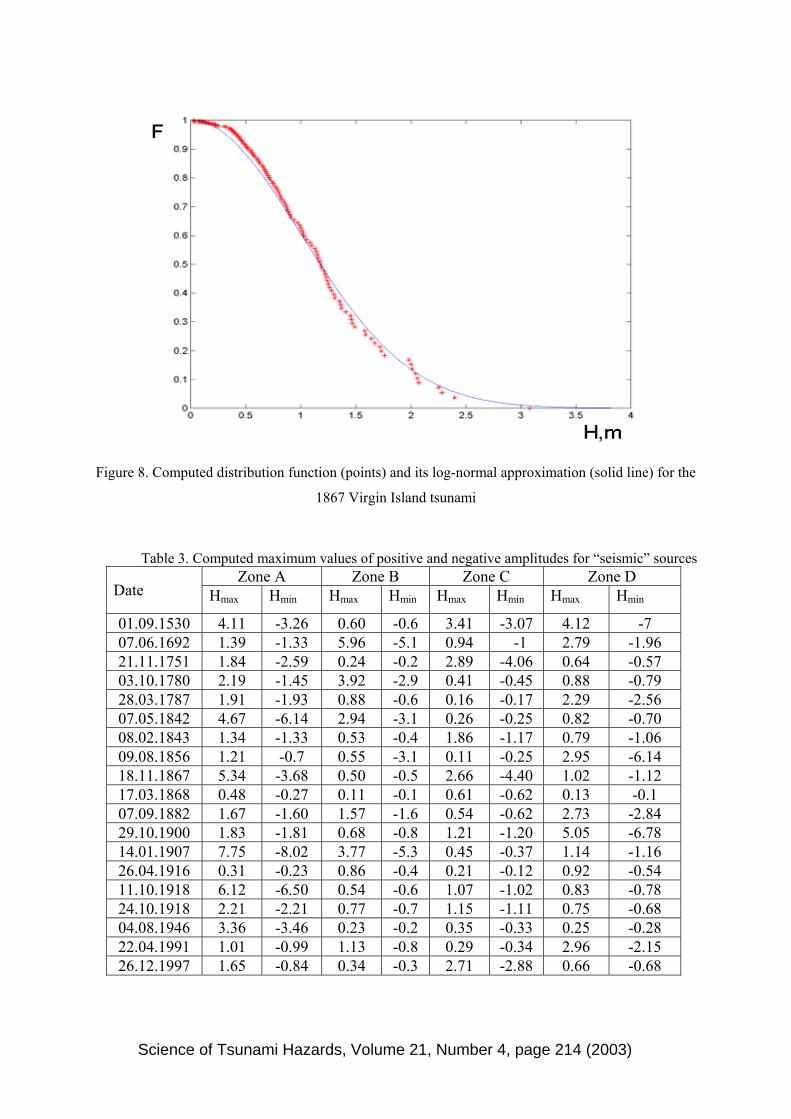
Figure 8. Computed distribution function (points) and its log-normal approximation (solid line) for the
1867 Virgin Island tsunami
Table 3. Computed maximum values of positive and negative amplitudes for “seismic” sources Zone A Zone B Zone C Zone D
Date Hmax Hmin Hmax Hmin Hmax Hmin Hmax Hmin
01.09.1530 4.11 -3.26 0.60 -0.6 3.41 -3.07 4.12 -7 07.06.1692 1.39 -1.33 5.96 -5.1 0.94 -1 2.79 -1.96 21.11.1751 1.84 -2.59 0.24 -0.2 2.89 -4.06 0.64 -0.57 03.10.1780 2.19 -1.45 3.92 -2.9 0.41 -0.45 0.88 -0.79 28.03.1787 1.91 -1.93 0.88 -0.6 0.16 -0.17 2.29 -2.56 07.05.1842 4.67 -6.14 2.94 -3.1 0.26 -0.25 0.82 -0.70 08.02.1843 1.34 -1.33 0.53 -0.4 1.86 -1.17 0.79 -1.06 09.08.1856 1.21 -0.7 0.55 -3.1 0.11 -0.25 2.95 -6.14 18.11.1867 5.34 -3.68 0.50 -0.5 2.66 -4.40 1.02 -1.12 17.03.1868 0.48 -0.27 0.11 -0.1 0.61 -0.62 0.13 -0.1 07.09.1882 1.67 -1.60 1.57 -1.6 0.54 -0.62 2.73 -2.84 29.10.1900 1.83 -1.81 0.68 -0.8 1.21 -1.20 5.05 -6.78 14.01.1907 7.75 -8.02 3.77 -5.3 0.45 -0.37 1.14 -1.16 26.04.1916 0.31 -0.23 0.86 -0.4 0.21 -0.12 0.92 -0.54 11.10.1918 6.12 -6.50 0.54 -0.6 1.07 -1.02 0.83 -0.78 24.10.1918 2.21 -2.21 0.77 -0.7 1.15 -1.11 0.75 -0.68 04.08.1946 3.36 -3.46 0.23 -0.2 0.35 -0.33 0.25 -0.28 22.04.1991 1.01 -0.99 1.13 -0.8 0.29 -0.34 2.96 -2.15 26.12.1997 1.65 -0.84 0.34 -0.3 2.71 -2.88 0.66 -0.68
Science of Tsunami Hazards, Volume 21, Number 4, page 214 (2003)
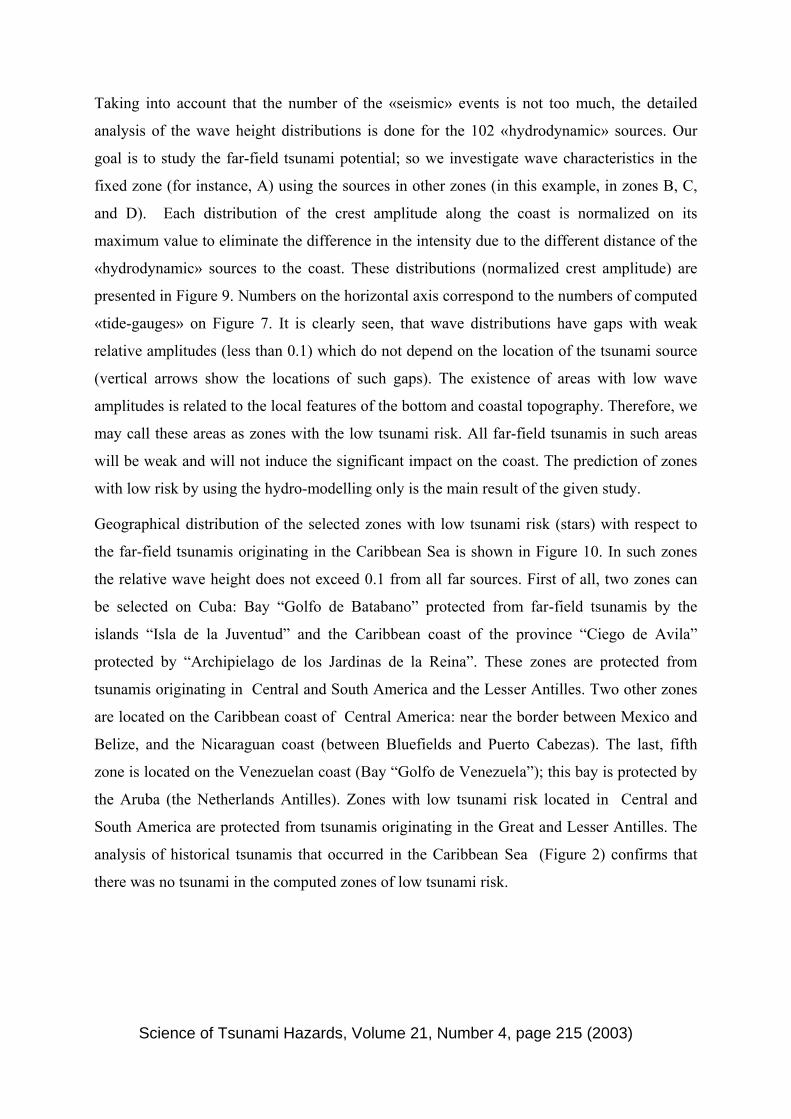
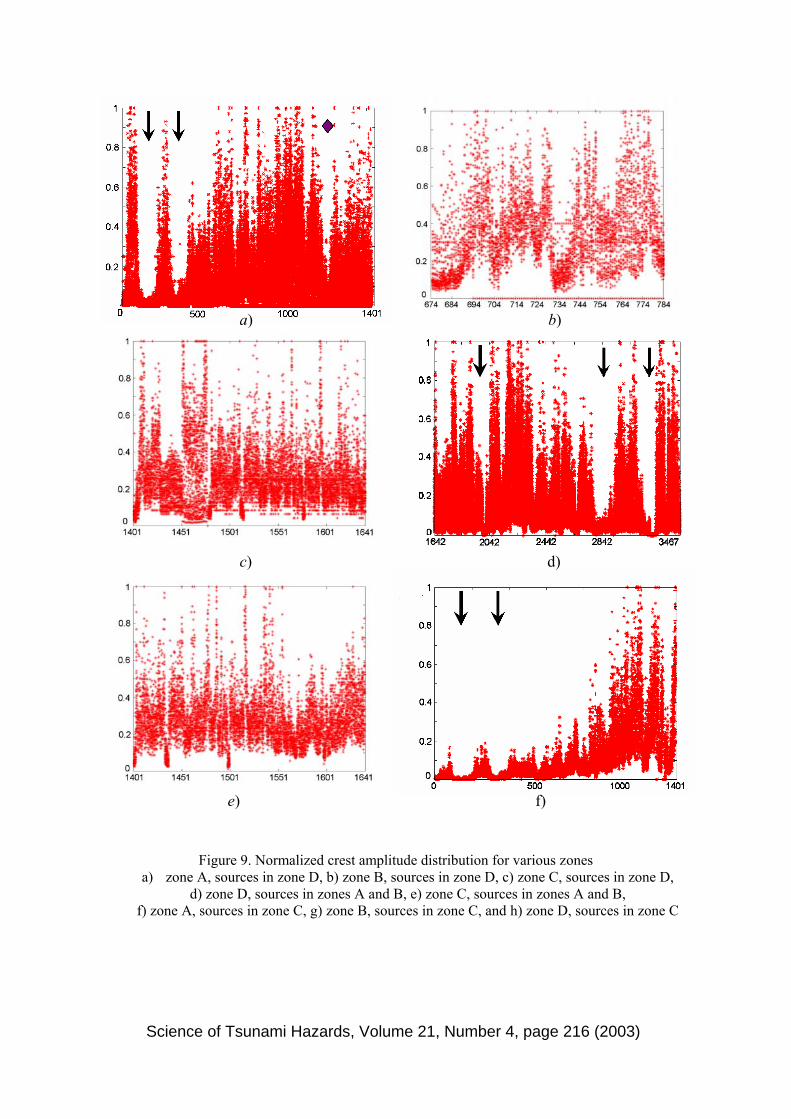
Taking into account that the number of the «seismic» events is not too much, the detailed
analysis of the wave height distributions is done for the 102 «hydrodynamic» sources. Our
goal is to study the far-field tsunami potential; so we investigate wave characteristics in the
fixed zone (for instance, A) using the sources in other zones (in this example, in zones B, C,
and D). Each distribution of the crest amplitude along the coast is normalized on its
maximum value to eliminate the difference in the intensity due to the different distance of the
«hydrodynamic» sources to the coast. These distributions (normalized crest amplitude) are
presented in Figure 9. Numbers on the horizontal axis correspond to the numbers of computed
«tide-gauges» on Figure 7. It is clearly seen, that wave distributions have gaps with weak
relative amplitudes (less than 0.1) which do not depend on the location of the tsunami source
(vertical arrows show the locations of such gaps). The existence of areas with low wave
amplitudes is related to the local features of the bottom and coastal topography. Therefore, we
may call these areas as zones with the low tsunami risk. All far-field tsunamis in such areas
will be weak and will not induce the significant impact on the coast. The prediction of zones
with low risk by using the hydro-modelling only is the main result of the given study.
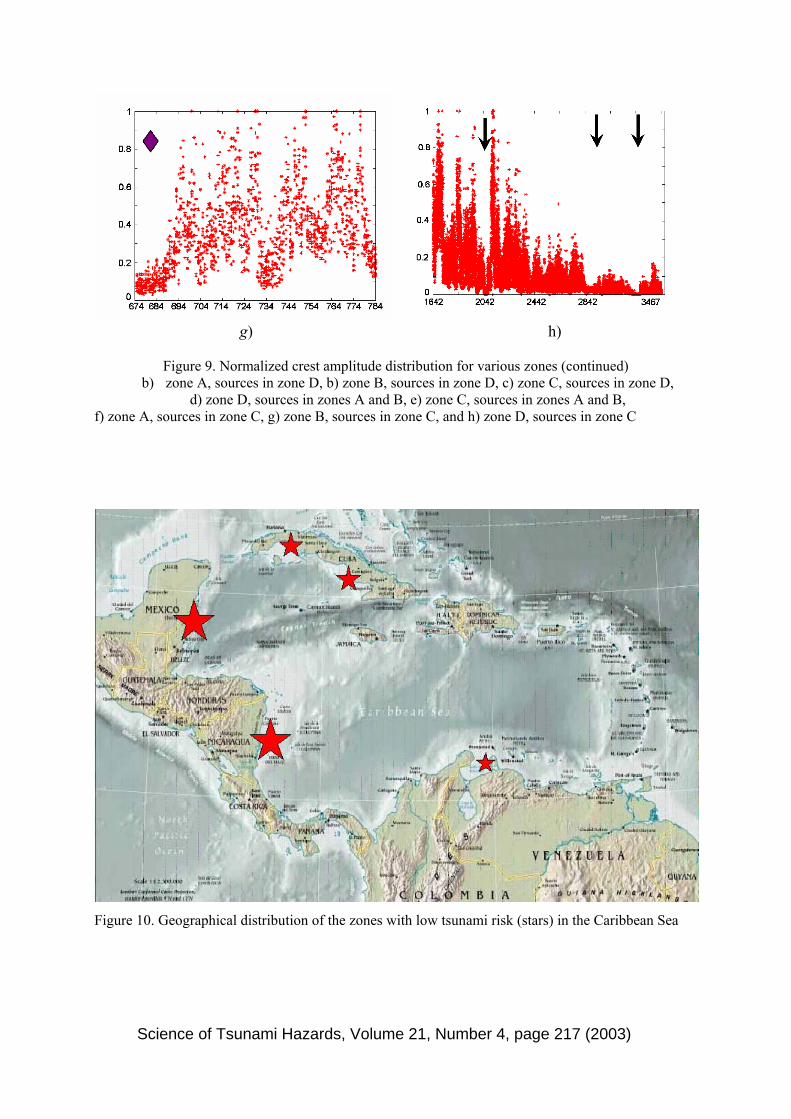
Geographical distribution of the selected zones with low tsunami risk (stars) with respect to
the far-field tsunamis originating in the Caribbean Sea is shown in Figure 10. In such zones
the relative wave height does not exceed 0.1 from all far sources. First of all, two zones can
be selected on Cuba: Bay “Golfo de Batabano” protected from far-field tsunamis by the
islands “Isla de la Juventud” and the Caribbean coast of the province “Ciego de Avila”
protected by “Archipielago de los Jardinas de la Reina”. These zones are protected from
tsunamis originating in Central and South America and the Lesser Antilles. Two other zones
are located on the Caribbean coast of Central America: near the border between Mexico and
Belize, and the Nicaraguan coast (between Bluefields and Puerto Cabezas). The last, fifth
zone is located on the Venezuelan coast (Bay “Golfo de Venezuela”); this bay is protected by
the Aruba (the Netherlands Antilles). Zones with low tsunami risk located in Central and
South America are protected from tsunamis originating in the Great and Lesser Antilles. The
analysis of historical tsunamis that occurred in the Caribbean Sea (Figure 2) confirms that
there was no tsunami in the computed zones of low tsunami risk.
Science of Tsunami Hazards, Volume 21, Number 4, page 215 (2003)
a) zoned
f) zone A
Scienc
а) b)
c) d) e) f)Figure 9. Normalized crest amplitude distribution for various zones A, sources in zone D, b) zone B, sources in zone D, c) zone C, sources in zone D, ) zone D, sources in zones A and B, e) zone C, sources in zones A and B,
, sources in zone C, g) zone B, sources in zone C, and h) zone D, sources in zone C
e of Tsunami Hazards, Volume 21, Number 4, page 216 (2003)
Figurb) zone
df) zone A, source
Figure 10. Geogr
Science
g) h)
e 9. Normalized crest amplitude distribution for various zones (continued) A, sources in zone D, b) zone B, sources in zone D, c) zone C, sources in zone D, ) zone D, sources in zones A and B, e) zone C, sources in zones A and B, s in zone C, g) zone B, sources in zone C, and h) zone D, sources in zone C
aphical distribution of the zones with low tsunami risk (stars) in the Caribbean Sea
of Tsunami Hazards, Volume 21, Number 4, page 217 (2003)
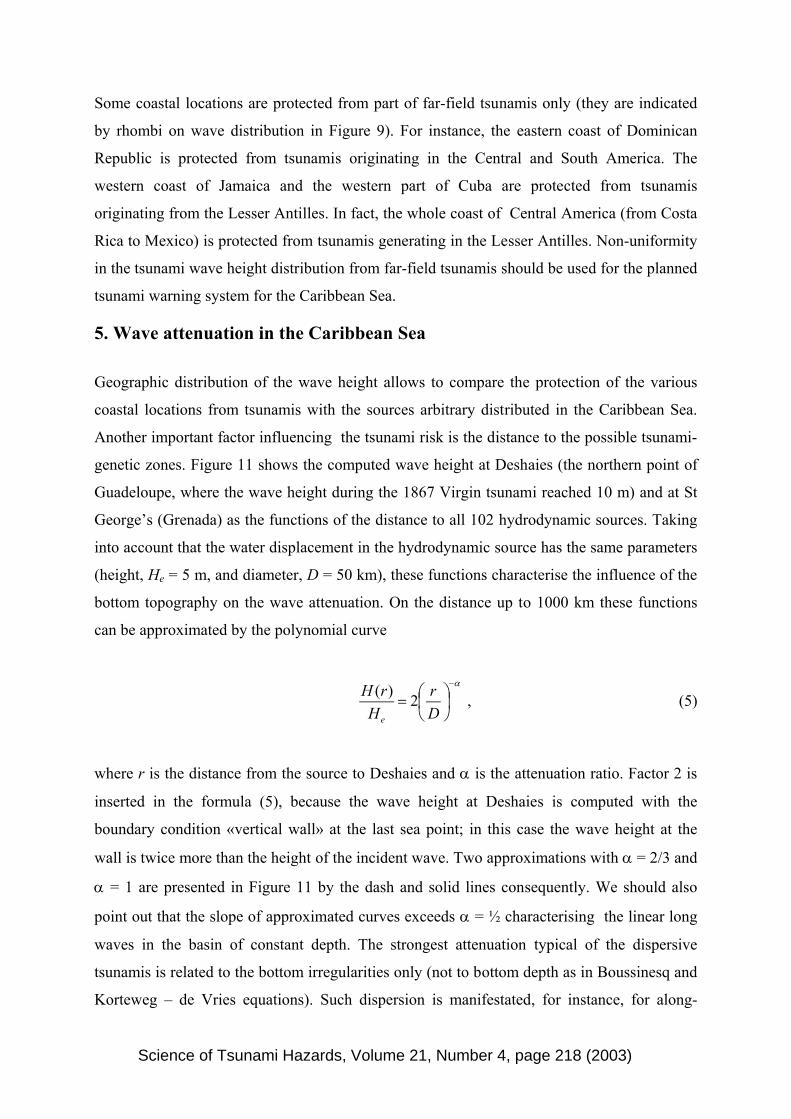
Some coastal locations are protected from part of far-field tsunamis only (they are indicated
by rhombi on wave distribution in Figure 9). For instance, the eastern coast of Dominican
Republic is protected from tsunamis originating in the Central and South America. The
western coast of Jamaica and the western part of Cuba are protected from tsunamis
originating from the Lesser Antilles. In fact, the whole coast of Central America (from Costa
Rica to Mexico) is protected from tsunamis generating in the Lesser Antilles. Non-uniformity
in the tsunami wave height distribution from far-field tsunamis should be used for the planned
tsunami warning system for the Caribbean Sea.
5. Wave attenuation in the Caribbean Sea
Geographic distribution of the wave height allows to compare the protection of the various
coastal locations from tsunamis with the sources arbitrary distributed in the Caribbean Sea.
Another important factor influencing the tsunami risk is the distance to the possible tsunami-
genetic zones. Figure 11 shows the computed wave height at Deshaies (the northern point of
Guadeloupe, where the wave height during the 1867 Virgin tsunami reached 10 m) and at St
George’s (Grenada) as the functions of the distance to all 102 hydrodynamic sources. Taking
into account that the water displacement in the hydrodynamic source has the same parameters
(height, He = 5 m, and diameter, D = 50 km), these functions characterise the influence of the
bottom topography on the wave attenuation. On the distance up to 1000 km these functions
can be approximated by the polynomial curve
α−
=
Dr
HrH
e
2)( , (5)
where r is the distance from the source to Deshaies and α is the attenuation ratio. Factor 2 is
inserted in the formula (5), because the wave height at Deshaies is computed with the
boundary condition «vertical wall» at the last sea point; in this case the wave height at the
wall is twice more than the height of the incident wave. Two approximations with α = 2/3 and
α = 1 are presented in Figure 11 by the dash and solid lines consequently. We should also
point out that the slope of approximated curves exceeds α = ½ characterising the linear long
waves in the basin of constant depth. The strongest attenuation typical of the dispersive
tsunamis is related to the bottom irregularities only (not to bottom depth as in Boussinesq and
Korteweg – de Vries equations). Such dispersion is manifestated, for instance, for along-
Science of Tsunami Hazards, Volume 21, Number 4, page 218 (2003)
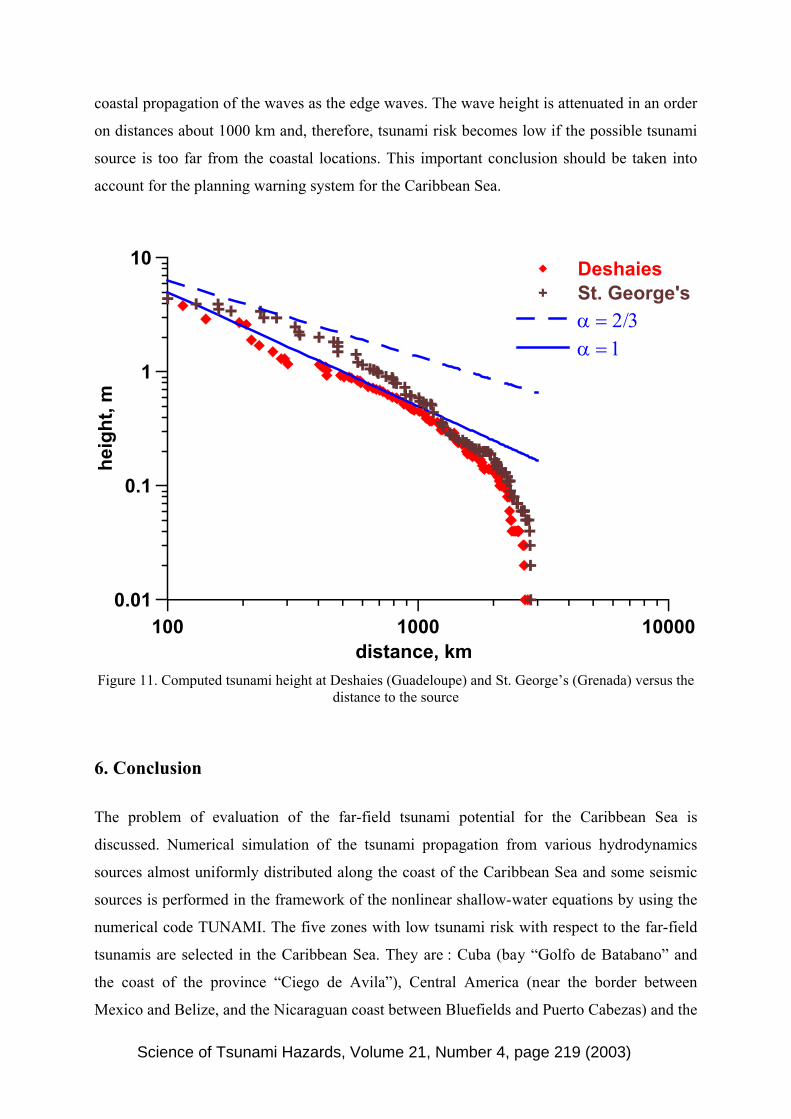
coastal propagation of the waves as the edge waves. The wave height is attenuated in an order
on distances about 1000 km and, therefore, tsunami risk becomes low if the possible tsunami
source is too far from the coastal locations. This important conclusion should be taken into
account for the planning warning system for the Caribbean Sea.
100 1000 10000distance, km
0.01
0.1
1
10
heig
ht, m
DeshaiesSt. George'sα = 2/3α = 1
Figure 11. Computed tsunami height at Deshaies (Guadeloupe) and St. George’s (Grenada) versus the
distance to the source
6. Conclusion
The problem of evaluation of the far-field tsunami potential for the Caribbean Sea is
discussed. Numerical simulation of the tsunami propagation from various hydrodynamics
sources almost uniformly distributed along the coast of the Caribbean Sea and some seismic
sources is performed in the framework of the nonlinear shallow-water equations by using the
numerical code TUNAMI. The five zones with low tsunami risk with respect to the far-field
tsunamis are selected in the Caribbean Sea. They are : Cuba (bay “Golfo de Batabano” and
the coast of the province “Ciego de Avila”), Central America (near the border between
Mexico and Belize, and the Nicaraguan coast between Bluefields and Puerto Cabezas) and the
Science of Tsunami Hazards, Volume 21, Number 4, page 219 (2003)
Venezuelan coast (Bay “Golfo de Venezuela”). The analysis of historical tsunamis that
occurred in the Caribbean Sea confirms that there was no tsunami in the computed zones of
low tsunami risk. Also, the computing shows that the wave height is attenuated in an order if
the tsunami source is located on distance about 1000 km from the coastal location, and such
far-field tsunamis can be evaluated as low-risk tsunamis. The existence of zones with low
tsunami risk with respect to the far-field tsunamis should be used for the planned tsunami
warning system for the Caribbean Sea.
Acknowledgements. This study is supported by the grants from EGIDE (04500YH) and
INTAS (01-2156), and for the Russian co-authors also by the grants from RFBR (02-05-6510
and 03-05-64975). The authors thank Professors Fumihiko Imamura and Ahmet Yalciner for
the provided numerical code of TUNAMI.
References
Choi, B.H., Hong, S.J., and Pelinovsky, E. Simulation of prognostic tsunamis on the Korean
coast, Geophysical Research Letters, 2001, vol. 28, 2013-2016.
Choi, B. H., Pelinovsky, E., Lee, J.S., and Woo, S.B. Estimation of tsunami risk zoning on
the coasts adjacent to the East Coast from hypothetical earthquake, J. Earthquake
Engineering Society of Korea, 2002a, vol. 6, 1-17.
Choi, B. H., Pelinovsky, E., Ryabov, I., and Hong, S.J. Distribution functions of tsunami
wave heights, Natural Hazards, 2002b, vol. 25, 1-21.
Go, Ch.N., Kaistrenko, V.M., Pelinovsky, E.N., and Simonov, K.V. A Quantitative
estimation of tsunami hazard and the tsunami zoning scheme of the Pacific Coast of the
USSR, Pacific Annual. Vladivostok, 1988, 7–15.
Goto, C., Ogawa, Y., Shuto, N., and Imamura, N. Numerical method of tsunami simulation
with the leap-frog scheme (IUGG/IOC Time Project), IOC Manual, UNESCO, No. 35, 1997.
Heinrich, F., Boudon, G., Komorowski, J.C., Sparks, R.S.J., Herd, R., and Voight, B.
Numerical simulation of the December 1997 debris avalanche in Montserrat. Geophys.
Research Letters, 2001, vol. 28, 2529-2532.
Heinrich, F., Guibourg, S., Mangeney, A., and Roche, R. Numerical modelling of a
landslide-generated tsunami following a potential explosion of the Montserrat Volcano. Phys.
Chem. Earth, 1999, vol. A24, 163-168.
Science of Tsunami Hazards, Volume 21, Number 4, page 220 (2003)
Heinrich, F., Mangeney, A., Guibourg, S., and Roche, R. Simulation of water waves
generated by a potential debris avalanche in Montserrat, Lesser Antilles. Geophys. Research
Letters, 1998, vol. 25, 3697-3700.
HTDB/ATL Expert Tsunami Database for the Atlantics. Version 3.6 of March 15, 2002.
Tsunami Laboratory, Novosibirsk, Russia, 2002.
Koike, N., Kawata, Y., and Imamura, F. Far-field tsunami potential and a real-time forecast
system for the Pacific using the inversion method, Natural Hazards, 2003, vol. 29, 423-436.
Lander, J.F., Whiteside, L.S., and Lockridge, P.A. A brief history of tsunami in the
Caribbean Sea. Science of Tsunami Hazards, 2002, vol. 20, 57-94.
Le Friant, A., Boudon, G., Komorowski, J-C., and Deplus, C. L’île de la Dominique, à
l’origine des avalanches de débris les plus volumineuses de l’arc des Petites Antilles. C.R.
Geoscience, 2002, vol. 334, 235-243.
Le Friant, A., Heinrich, P., Deplus, C., and Boudon, G. Numerical simulation of the last
flank-collapse event of Montagne Pelée, Martinique, Lesser Antilles. Geophys. Research
Letters, 2003, vol. 30, No. 2, 1034.
Mader, C.L. Modeling the 1755 Lisbon tsunami. Science of Tsunami Hazards, 2001a, vol. 9,
93-98.
Mader, C.L. Modeling the La Palma landslide tsunami. Science of Tsunami Hazards, 2001b,
vol. 19, 150-170.
Mercado, A., and McCann, W. Numerical simulation of the 1918 Puerto Rico tsunami.
Natural Hazards, 1998, vol. 18, 57-76.
Mercado, A., Grindlay, N., Lynett, P., and Liu, P.L.-F. Investigation of the potential
tsunami hazard on the north coast of Puerto Rico due to submarine landslides along the Puerto
Rico trench. 245p. Submitted to Puerto Rico State Emergency Management Agency. 2002.
Mofjeld, H.O., Titov, V.V., Gonzalez, F.I., and Newman, J.C. Tsunami scattering
provinces in the Pacific Ocean, Geophys. Research Letters, 2001, vol. 28, 335-337.
Okada, Y. Surface deformation due to shear and tensile faults in a half-space, Bull. Seism.
Soc. America, 1985, vol. 75, 1135-1154.
O’Loughlin, K.F., and Lander, J.F. Caribbean Tsunamis: A 500-Year History from 1498–
1998. Advances in Natural and Technological Hazards Research, v. 20, Kluwer, 2003.
Nagano, O., Imamura, F., and Shuto, N. A numerical model for a far-field tsunamis and its
application to predict damages done to aquaculture, Natural Hazards, 1991, vol. 4, 235-255.
Science of Tsunami Hazards, Volume 21, Number 4, Page 221 (2003)
Pararas-Carayannis, G. Evaluation of the threat of mega tsunami generation from
postulated massive slope failures of island stratovolcanoes on La Palma, Canary Islands, and
on the Island of Hawaii. Science of Tsunami Hazards, 2002, vol. 20, 251-277.
Sato, H., Murakami, H., Kozuki, Y., and Yamamoto, N. Study on a simplified method of
tsunami risk assessment, Natural Hazards, 2003, vol. 29, 325-340.
Ward, S.N., and Day, S. Cumbre Vieja Volcano – potential collapse and tsunami at La
Palma, Canary Islands. Geophys. Research Letters, 2001, vol. 28, 3397-3400.
Weissert, T.P. Tsunami travel time charts for the Caribbean. Science of Tsunami Hazards,
1990, vol. 8, 67-78.
Yalciner, A. C., Alpar, B., Altinok, T., Ozbay, I., and Imamura, F. Tsunamis in the Sea of
Marmara. Historical documents for the past, models for the future. Marine Geology, 2002,
vol. 190, 445-463.
Zahibo, N., and Pelinovsky, E. Evaluation of tsunami risk in the Lesser Antilles. Natural
Hazard and Earth Sciences, 2001, vol. 3, 221-231.
Zahibo, N., Pelinovsky, E., and Kozelkov, A. The July 12, 2003 Montserrat tsunami.
Tsunami Newsletter, 2003a (submitted).
Zahibo, N., Pelinovsky, E., Yalciner, A., Kurkin, A., Koselkov, A., and Zaitsev, A. The
1867 Virgin Island Tsunami: observations and modelling. Oceanologica Acta, 2003b, vol. 26,
609 – 621.
Science of Tsunami Hazards, Volume 21, Number 4, page 222 (2003)
Science of Tsunami Hazards, Vol 21, No. 4 (2003) ISSN 8755-6839
copyright c© 2003THE TSUNAMI SOCIETY
P. O. Box 37970,Honolulu, HI 96817, USA
Related Documents