Nitrification and total nitrogen removal in a super-oxygenated wetland David Austin a, ⁎, Rafael Vazquez-Burney b , Gary Dyke c , Timothy King d a JACOBS, Saint Paul, MN, United States of America b JACOBS, Tampa, FL, United States of America c JACOBS, Detroit, MI, United States of America d The Dow Chemical Company, United States of America HIGHLIGHTS • The median annual nitrification rate in the super-oxygenated was at least 206 m/y. • Cold water (0.5 °C) did not immediately degrade nitrification rates. • Injection of nitrifying bacteria reversed mid-winter nitrification loss. • The peak summer nitrification rate was 112 m/y. • Winter denitrification rates were close to zero. GRAPHICAL ABSTRACT abstract article info Article history: Received 23 January 2018 Received in revised form 2 October 2018 Accepted 8 October 2018 Available online 09 October 2018 A novel surface flow wetland demonstrates high-rate nitrification by recirculating water supersaturated with ox- ygen. Design of the wetland was based on two hypotheses: (1) Oxygen supersaturation of a recirculating side- stream would support nitrification in a surface flow wetland at rates comparable to aerated subsurface flow wetlands, and; (2) Nitrification would be maintained in cold water conditions (0.5–5.0 °C) with minimal bioaug- mentation using commercially available liquid suspensions of nitrifying bacteria. The wetland has an area of 23,000 m 2 , of which the final 21,000 m 2 is oxygenated. Mean flow was 863 m 3 d -1 . A downflow oxygen contactor (Speece cone) maintains dissolved oxygen at or over saturation in the wetland. Mean inflow NH 3 -N was 8.0 mg L -1 , mean outflow 0.6 mg L -1 . In winter, nitrification began to degrade slowly at a water temperature of 0.5 °C to about half the summer rate but was restored by bioaugmentation with nitrifying bacteria in one month at water temperatures less than 3.3 °C. Determination of nitrification rates by a first-order, tanks-in- series model (P-k-C*) was hindered by the method detection limit (0.2 mg L -1 NH 3 -N) of analytical methods and the inherent limitations of first order models for complete nitrification. The median monthly nitrification areal rate coefficient from April 2016 through June 2017 was at least 216 m y -1 , which is 15 times greater than median passive wetland literature rates. High nitrification rates allow for at least a 90% reduction of required treatment area for nitrification at approximately one third the capital cost of aerated subsurface flow wetlands. Denitrification rates were well within observed literature values. The peak monthly mean denitrification rate, ob- served in June 2017, was 76 m y -1 , but winter denitrification rates were close to zero. © 2018 Published by Elsevier B.V. Keywords: Nitrification Oxygen Treatment wetland Speece cone Denitrification Science of the Total Environment 652 (2019) 307–313 ⁎ Corresponding author. E-mail address: [email protected] (D. Austin). https://doi.org/10.1016/j.scitotenv.2018.10.110 0048-9697/© 2018 Published by Elsevier B.V. Contents lists available at ScienceDirect Science of the Total Environment journal homepage: www.elsevier.com/locate/scitotenv

Welcome message from author
This document is posted to help you gain knowledge. Please leave a comment to let me know what you think about it! Share it to your friends and learn new things together.
Transcript

Science of the Total Environment 652 (2019) 307–313
Contents lists available at ScienceDirect
Science of the Total Environment
j ourna l homepage: www.e lsev ie r .com/ locate /sc i totenv
Nitrification and total nitrogen removal in a super-oxygenated wetland
David Austin a,⁎, Rafael Vazquez-Burney b, Gary Dyke c, Timothy King d
a JACOBS, Saint Paul, MN, United States of Americab JACOBS, Tampa, FL, United States of Americac JACOBS, Detroit, MI, United States of Americad The Dow Chemical Company, United States of America
H I G H L I G H T S G R A P H I C A L A B S T R A C T
• The median annual nitrification rate inthe super-oxygenated was at least206 m/y.
• Cold water (0.5 °C) did not immediatelydegrade nitrification rates.
• Injection of nitrifying bacteria reversedmid-winter nitrification loss.
• The peak summer nitrification rate was112 m/y.
• Winter denitrification rates were closeto zero.
⁎ Corresponding author.E-mail address: [email protected] (D. Austin
https://doi.org/10.1016/j.scitotenv.2018.10.1100048-9697/© 2018 Published by Elsevier B.V.
a b s t r a c t
a r t i c l e i n f oArticle history:Received 23 January 2018Received in revised form 2 October 2018Accepted 8 October 2018Available online 09 October 2018
A novel surface flowwetland demonstrates high-rate nitrification by recirculatingwater supersaturatedwith ox-ygen. Design of the wetland was based on two hypotheses: (1) Oxygen supersaturation of a recirculating side-stream would support nitrification in a surface flow wetland at rates comparable to aerated subsurface flowwetlands, and; (2) Nitrification would bemaintained in coldwater conditions (0.5–5.0 °C)withminimal bioaug-mentation using commercially available liquid suspensions of nitrifying bacteria. The wetland has an area of23,000m2, ofwhich thefinal 21,000m2 is oxygenated.Meanflowwas 863m3d−1. A downflowoxygen contactor(Speece cone) maintains dissolved oxygen at or over saturation in the wetland. Mean inflow NH3-N was8.0 mg L−1, mean outflow 0.6 mg L−1. In winter, nitrification began to degrade slowly at a water temperatureof 0.5 °C to about half the summer rate but was restored by bioaugmentation with nitrifying bacteria in onemonth at water temperatures less than 3.3 °C. Determination of nitrification rates by a first-order, tanks-in-series model (P-k-C*) was hindered by the method detection limit (0.2 mg L−1 NH3-N) of analytical methodsand the inherent limitations of first order models for complete nitrification. The median monthly nitrificationareal rate coefficient from April 2016 through June 2017 was at least 216 m y−1, which is 15 times greaterthanmedian passivewetland literature rates. High nitrification rates allow for at least a 90% reduction of requiredtreatment area for nitrification at approximately one third the capital cost of aerated subsurface flow wetlands.Denitrification rateswerewellwithin observed literature values. The peakmonthlymean denitrification rate, ob-served in June 2017, was 76 m y−1, but winter denitrification rates were close to zero.
© 2018 Published by Elsevier B.V.
Keywords:NitrificationOxygenTreatment wetlandSpeece coneDenitrification
).
308 D. Austin et al. / Science of the Total Environment 652 (2019) 307–313
1. Introduction
Passive oxygen transfer from the atmosphere to bulkwater limits ni-trification rates in surface flow (SF) wetlands. Kadlec and Wallace(2009) report a median areal nitrification rate coefficient, kA-NH3N, of14.7 m y−1. Such low nitrification rates force passive SF wetlands tobe impracticably large. For example, per the P-k-C* model at a flow of10,000 m3 d−1 with inflow NH3-N of 10 mg L−1, and outflow of1 mg L−1, a passive SF wetland would require a wetted area of770,000 m2. The hydraulic loading rate (HLR) would be 0.013 m d−1.This calculation assumes 7 reactors in series (P), an irreducible NH3-Nbackground concentration (C*) of zero, and temperature of 20 °C.
Aerated subsurface flow (SSF) wetlands use diffusers, typically dripirrigation tubing, distributed beneath granular media for oxygen trans-fer (Wallace et al., 2006), raising kA-NH3N to almost 3000m y−1 (Nivala,2012). An increase of over two ordersmagnitude in kA-NH3N radically re-duces the required treatment area. For the previous example, increasingkA-NH3N by an order of magnitude (147 m y−1) would reduce the treat-ment area to 84,000m2, and just 9000m2 for a two order of magnitudeincrease (1470 m y−1). Such large increases in kA-NH3N tend to removenitrification as a rate constraint on treatment wetland design area. Sim-ilar improvements to treatment performance could be achieved in SFwetlands if oxygen transfer could be improved by mechanical means.The advantages of doing sowould be to avoid the high cost of treatmentmedia (Wallace and Knight, 2006) and the higher habitat value of SFwetlands compared to SSF wetlands (Kadlec and Wallace, 2009).
Both SSF and SF wetlands are fixed film systems in which bacterialbiofilms in contact with water are responsible for biogeochemical treat-ment of water. In SSF wetlands, granular media and plant roots provideattachment sites for biofilms. Instead of granular media, in SF wetlandsbiofilms form on submersed plant material, organic detritus, and sedi-ment surfaces.
The physical differences of these systems impact design. Unlike SSFwetlands, SF wetlands have both practical and fundamental limitationsthat prevent use of diffused air to achieve high nitrification rates, forcingconsideration of other mechanical means of oxygen transfer.
Practical limitations are decisive. Gnawing rodents, such asmuskratsor nutria, destroy plastic diffusers located in deep zones (Kadlec andWallace, 2009). Even if rodent-resistant diffuser materials were eco-nomically viable, distributed aeration in shallow (0.1 to 0.3 m deep)planted zones is not feasible because plant growthwill heave up and de-stroy diffuser networks. SSF wetlands suffer neither of these constraintsbecause a layer of treatment media both protects and anchors diffusers.
Both process (e.g. nitrification) and sediment oxygen demand (SOD)set overall oxygen demand in treatment wetlands. Nitrification de-mands 4.4 g O2 per g of NH3-N (Metcalf and Eddy, 2003). From a limno-logical perspective, SF treatment wetlands are eutrophic tohypereutrophic basins, characterized by high primary productivity ofphotosynthetic biofilms and emergent macrophytes. Decay of organiccarbon fixed by primary productivity takes places at the sediment sur-face, exerting a high SOD in the range of 2 to 8 g O2 m−2 d−1 (Kadlecand Wallace, 2009). Oxygen transfer to the wetland must satisfy bothSOD and treatment demand to ensure complete nitrification occurs. At-mospheric oxygen transfer, reported as 1 to 6 gO2m2 d−1 byKadlec andWallace (2009), is insufficient to meet nitrification treatment goals be-cause of SOD, hence the low nitrification rates of SF wetlands.
Diffused air cannot meet oxygen demand in SF wetlands. Emergentplants grow in water approximately 0.1 to 0.3 m deep. Oxygen transferefficiency of diffused air at this depth is less than 5%. Aeration in deepzones (1.5 m deep) may appear to be a reasonable strategy to improveoxygen transfer efficiency, perhaps as high as 20%. Deep zones runningorthogonally to flow across the width, berm to berm, of SF wetlands arean integral design feature to minimize short circuiting by dissipatingpreferential flow paths that inevitably occur in planted areas(Lightbody et al., 2009). Deep zones spaced evenly over 15% of totalarea are sufficient to prevent short circuiting. However, at the low
flow velocity of SF wetlands SOD alone will deplete DO flowing from adeep zone well before the next deep zone.
Cost and scale are strong motivating factors to improve oxygentransfer to SF wetlands. Kadlec and Wallace (2009) report that SF wet-lands capital cost is approximately one third of SSF wetlands. Site spe-cific factors, such as the need for liners in SF wetlands, or availabilityof suitable aggregate for SSF wetlands, or land costs, force substantialvariability on capital costs. Cost estimating tools calibrated over manylarge-scale treatment wetland projects over three decades, largely con-form to a three to one capital cost savings of SF wetlands compared toSSF wetlands (Jacobs Engineering Group, unpublished data).
Clogging also motivates the consideration of SF over SSF wetlands.The latter are a type of contact bed long known to clog if overloadedwith labile carbon or suspended solids (Barwise, 1899; Dunbar, 1908;Kadlec and Wallace, 2009; Kinnicutt et al., 1919). There are various de-sign strategies to mitigate or remediate the inherent tendency of SSFwetlands to clog wetlands (Austin et al., 2007; Behrends et al., 2006;Dunbar, 1908; Esser, 2015; Knowles et al., 2011; Molle et al., 2005;Nivala et al., 2012; Wallace and Knight, 2006). In contrast, SF wetlandsnever clog.
Super-oxygenation is an innovative means of achieving high masstransfer rates of dissolved oxygen to SF wetlands. A recirculatingpump station forces water through a downflow pure oxygen contactor(Speece cone). Water supersaturated with dissolved oxygen (DO) isinjected back into the wetland. Palmer et al. (2009) demonstratedhigh nitrification rates in a benchtop SF wetland using pure oxygen in-jection. In the same study, Allen et al. (2010) observed increased nitrifi-cation potential of sediments and enrichment of nitrifying anddenitrifying bacteria compared to a non-oxygenated control.
For SF wetlands to meet the nitrification capacity observed in aer-ated subsurface flowwetlands across awide climate range, two hypoth-eses (engineering design theories) require demonstration:(1) Sufficient oxygen for complete nitrification can be supplied by side-streamoxygenation tomeet treatment needs, and; (2) Bioaugmentationcan maintain nitrification in winter (near freezing) conditions. A super-oxygenated SF wetland was designed to test these hypotheses.
2. Materials and methods
The SF wetland is in Michigan, USA. It is an unlined, earthen basin,designed to treat up to 1500 m3 d−1 of groundwater contaminatedwith NH3-N up to 50 g m−3 to less than 1.0 mg L−1 (discharge permitstandard). The wetted area of the wetland is 23,000 m2. A 19-kWpump recirculates 4000 m3 d−1 of water from the discharge end ofthewetland to just downstreamof the inlet end (Figs. 1, 2), which is ap-proximately 5 times the mean forward flow rate. Recirculating waterpasses through a downflow oxygen contactor (Speece cone), pressur-ized to 3 atm and rated to 266 kg O2 d−1. Pure oxygen supply to thecone is from a liquid oxygen tank and vaporizers. The calculated DOconcentration discharging from the Speece cone is 67 mg L−1 at 20 °C.Super-oxygenated water discharges equally into three open waterzones via eductor diffusers with a nominal mixing ratio of 3:1. Diffusersare deployed across deep zones. The oxygenated zone of the wetlandhas an area of 21,000 m2. Planted zones operate in the summer at25 cm depth, in winter 50 cm to prevent ice from freezing to the wet-land bottom.
Hydraulic design of the wetland follows criteria detailed inLightbody et al. (2009). In the study wetland, each open water zonelength is 20 m and 1.2 m deep. Width of the first three open waterzones is berm to berm. These open water zones are at least partiallymixed by discharge from the eductor diffusers used for recirculation.Each open water zone cancels preferential flow paths.
A heated bioaugmentation station for winter operations is used toinject a liquid suspension of nitrifying bacteria (USA Blue Book, productnumber 46953) into the recirculation system as needed in cold waterconditions. The dosing system is heated because freezing will lyze

Fig. 1. Treatment wetland section schematic.
309D. Austin et al. / Science of the Total Environment 652 (2019) 307–313
nitrifying bacteria. Nitrifiers in the suspension colonize fixed bisofilmsand thus do not function as a suspension in the treatment system.There was no injection of denitrifying bacteria or electron donors (e.g.carbon) for denitrification.
Thewetlandwas constructed and planted in 2015with native emer-gent vegetation split in approximately equal portions betweenSchoenoplectus tabernaemontani (softstem bulrush), Scirpus atrovirivens(green bulrush), and Tyhpa latifolia (broadleaf cattail). Plant cover waseffectively 100% by fall 2015. Operations began on April 1, 2016.
Inflow was determined from groundwater pumping rates. Evapora-tion rates were calculated fromMichigan State University data. The dis-charge flow meter was inoperable or out of calibration until October2016, forcing calculation of rate constants using the HLR (inflow) perEq. (1), rather than a water balance.
Inflow and outflow are monitored daily for temperature, pH and DO(field sonde); weekly (grab sample) for NH3-N (SM 4500 NH3 D), NO2/NO3-N (SM 353.2), and total Kjeldahl nitrogen (TKN)(SM4500_NH3_C). For NH3-N outflow values below 0.2 mg L−1 areflagged in laboratory reports as inaccurate: J – estimated value abovetheminimumdetection limit (MDL); U – belowMDL.Methods are stan-dard to permitted treatment systems. As the permit discharge standardis 1.0 mg L-1 per SM 4500 NH3 D Organic nitrogen was calculated asTKN - NH3-N. Dissolved inorganic nitrogen (DIN) is calculated as NH3-N + NO3-N + NO2-N. Carbonaceous biochemical oxygen demand(CBOD) was determined by SM 521B. Samples from inflow and outflowwere analyzed by a licensed laboratory with data reported to the Mich-igan Department of Environmental Quality.
Rate coefficients were extracted from data using a first-order, tanks-in-series model (Kadlec and Wallace, 2009). Monthly inflow and out-flow values were averaged to provide a mean monthly rate coefficientper Eq. (1).
kA ¼ Co−C�
Ci−C�
� �−1P
−1
" #Pq; ð1Þ
where,
Ci = inlet concentration (mg L−1)Co = outlet concentration (mg L−1)C⁎ = zero for NH3-N and NOx-N; 1.7 mg L−1 for TNkA = reaction rate coefficient (m y−1)P = tanks in series = 2 (assumed value due to high recirculationrate, which is 5 times average forward flow rate)q = hydraulic loading rate (m/d) = Qin ÷ Aw,
Qin = monthly average flow, m3 d−1
Aw = wetland oxygenated area (20,598 m2)
Rate coefficient calculation used the reported J and U-flagged valuesand 10% of J and U-flagged outflow values. The arbitrary fraction of theflagged values was used to examine potential effects of the MDL in thecalculation of rate coefficients and rate distortions produced by firstorder models with effluent values approaching zero.
Prior to construction, site soils tended to be saturated, placing thegroundwater table close to the bottom of the treatment wetland.
3. Results
Average inflow to the wetland was 863 m3 d−1 (σ = 136 m3 d−1).pH was circumneutral with a maximum value of 8.0, minimum 7.2.CBOD was less than 2.0 mg L−1.
Net precipitation-ET losses averaged 0.81 mm d−1 April–November2016, which is approximately 19 m3 d−1 over 23,000 m2, or approxi-mately 2% of inflow. From October 2016 through June 2017 when accu-rate totalizing outflow measurements were available, the average lossto groundwater was 7 mm d−1. Over 23,000 m2 these groundwaterlosses would average 161 m3 d−1, which is 20% of inflows over this pe-riod. However, because the water level was 50 cm from November toApril, groundwater loses are likely higher during the summer (25 cmdepth) because of a higher driving head. Water losses are neglected incalculations of areal rate coefficients. Per Eq. (1), a 20% lower HLR pro-duces kA which is 20% lower if all other parameters do not change.
Dissolved oxygen at the wetland discharge was consistently near orover 100 percent saturation from start-up over a range of pure oxygengas flux rates of 40 to 140 L min−1 (82.3 to 288 kg O2 d−1) (Fig. 3). Ox-ygen flux rates were turned down as saturation values increased in coldwater. Using a nitrification oxygen demandof 4.43 gO2 per gNH3-N, thepeak nitrification demand of 60 kg d−1 was always met by the O2 fluxrate.
Nitrification began immediately at start-up, reaching the 1.0 mg L−1
NH3-N treatment goal within six weeks (Fig. 4). Nitrification rates didnot degrade until late December when the water temperature haddropped to 0.5 °C and the wetland was covered with ice. Bioaugmenta-tion with nitrifying bacteria in two 4 L batches after February 23, 2017restored outflow NH3-N to less than 1.0 mg L−1 by March 23, 2017when the water temperature was 3.3 °C.
The 0.2 mg L−1 MDL of NH3-N analyses substantially affects themonthly mean kA-NH3 (Fig. 5). After the end of the ramp-up period inMay 2016, accepting flagged outflow values provides a kA-NH3 range of25 m y−1 (February 2017) to 369 m y−1 (November 2016). At 10% offlagged values, the February 2017 kA-NH3 does not change, but the No-vember kA-NH3 is 1234m y−1. Annual median nitrification kA-NH3 valuesare 216m y−1 accepting flagged values and 758m y−1 at 10% of flaggedvalues. Thus, annual median nitrification rates range from 15 to 54times greater than the median 14.7 m y−1 reported by Kadlec andWallace (2009).
Total nitrogen removal was seasonally dependent (Fig. 6), primarilyfrom coldwater loss of denitrification (Fig. 7). Dissolved inorganic nitro-gen and TN losses were far more strongly correlated with temperature(r2 = 0.79 and 0.51, respectively) than nitrification (r2 = 0.32). Thehighest monthly average kA-TN value was 76 m y−1 for June 2017. Themedian May through October kA-DIN of 51 m y−1 was significantlyhigher (p = 0.005) than the November through April kA-DIN of9 m y−1. By comparison, for nitrification (excluding April 2016 rampup) themedianMay through November kA-NH3 of 238m yr−1 is not sig-nificantly different (p= 0.11) than the November through April kA-NH3
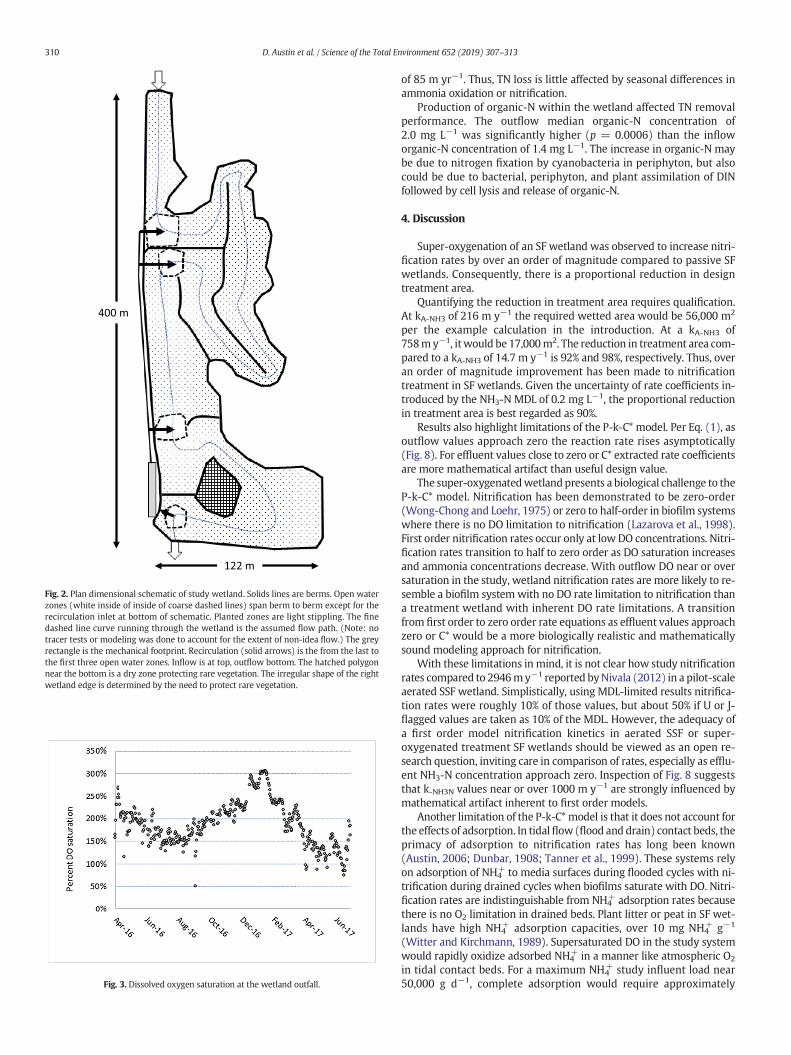
Fig. 3. Dissolved oxygen saturation at the wetland outfall.
400 m
122 m
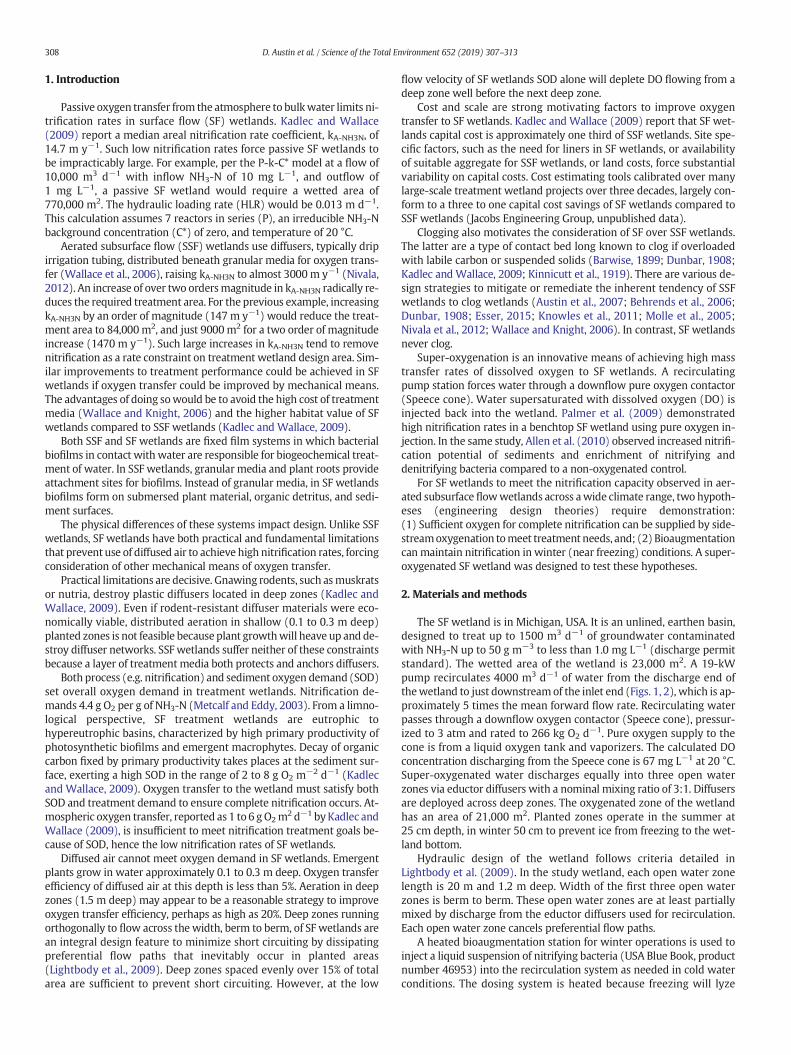
Fig. 2. Plan dimensional schematic of study wetland. Solids lines are berms. Open waterzones (white inside of inside of coarse dashed lines) span berm to berm except for therecirculation inlet at bottom of schematic. Planted zones are light stippling. The finedashed line curve running through the wetland is the assumed flow path. (Note: notracer tests or modeling was done to account for the extent of non-idea flow.) The greyrectangle is the mechanical footprint. Recirculation (solid arrows) is the from the last tothe first three open water zones. Inflow is at top, outflow bottom. The hatched polygonnear the bottom is a dry zone protecting rare vegetation. The irregular shape of the rightwetland edge is determined by the need to protect rare vegetation.
310 D. Austin et al. / Science of the Total Environment 652 (2019) 307–313
of 85 m yr−1. Thus, TN loss is little affected by seasonal differences inammonia oxidation or nitrification.
Production of organic-N within the wetland affected TN removalperformance. The outflow median organic-N concentration of2.0 mg L−1 was significantly higher (p = 0.0006) than the infloworganic-N concentration of 1.4 mg L−1. The increase in organic-N maybe due to nitrogen fixation by cyanobacteria in periphyton, but alsocould be due to bacterial, periphyton, and plant assimilation of DINfollowed by cell lysis and release of organic-N.
4. Discussion
Super-oxygenation of an SF wetland was observed to increase nitri-fication rates by over an order of magnitude compared to passive SFwetlands. Consequently, there is a proportional reduction in designtreatment area.
Quantifying the reduction in treatment area requires qualification.At kA-NH3 of 216 m y−1 the required wetted area would be 56,000 m2
per the example calculation in the introduction. At a kA-NH3 of758my−1, itwould be 17,000m2. The reduction in treatment area com-pared to a kA-NH3 of 14.7 m y−1 is 92% and 98%, respectively. Thus, overan order of magnitude improvement has been made to nitrificationtreatment in SF wetlands. Given the uncertainty of rate coefficients in-troduced by the NH3-N MDL of 0.2 mg L−1, the proportional reductionin treatment area is best regarded as 90%.
Results also highlight limitations of the P-k-C* model. Per Eq. (1), asoutflow values approach zero the reaction rate rises asymptotically(Fig. 8). For effluent values close to zero or C* extracted rate coefficientsare more mathematical artifact than useful design value.
The super-oxygenatedwetlandpresents a biological challenge to theP-k-C* model. Nitrification has been demonstrated to be zero-order(Wong-Chong and Loehr, 1975) or zero to half-order in biofilm systemswhere there is no DO limitation to nitrification (Lazarova et al., 1998).First order nitrification rates occur only at low DO concentrations. Nitri-fication rates transition to half to zero order as DO saturation increasesand ammonia concentrations decrease. With outflow DO near or oversaturation in the study, wetland nitrification rates are more likely to re-semble a biofilm system with no DO rate limitation to nitrification thana treatment wetland with inherent DO rate limitations. A transitionfrom first order to zero order rate equations as effluent values approachzero or C* would be a more biologically realistic and mathematicallysound modeling approach for nitrification.
With these limitations in mind, it is not clear how study nitrificationrates compared to 2946my−1 reported byNivala (2012) in a pilot-scaleaerated SSF wetland. Simplistically, using MDL-limited results nitrifica-tion rates were roughly 10% of those values, but about 50% if U or J-flagged values are taken as 10% of the MDL. However, the adequacy ofa first order model nitrification kinetics in aerated SSF or super-oxygenated treatment SF wetlands should be viewed as an open re-search question, inviting care in comparison of rates, especially as efflu-ent NH3-N concentration approach zero. Inspection of Fig. 8 suggeststhat k-NH3N values near or over 1000 m y−1 are strongly influenced bymathematical artifact inherent to first order models.
Another limitation of the P-k-C* model is that it does not account forthe effects of adsorption. In tidalflow (flood and drain) contact beds, theprimacy of adsorption to nitrification rates has long been known(Austin, 2006; Dunbar, 1908; Tanner et al., 1999). These systems relyon adsorption of NH4
+ to media surfaces during flooded cycles with ni-trification during drained cycles when biofilms saturate with DO. Nitri-fication rates are indistinguishable from NH4
+ adsorption rates becausethere is no O2 limitation in drained beds. Plant litter or peat in SF wet-lands have high NH4
+ adsorption capacities, over 10 mg NH4+ g−1
(Witter and Kirchmann, 1989). Supersaturated DO in the study systemwould rapidly oxidize adsorbed NH4
+ in a manner like atmospheric O2
in tidal contact beds. For a maximum NH4+ study influent load near
50,000 g d−1, complete adsorption would require approximately

0
5
10
15
20
25
0123456789
101112131415
Tem
pera
ture
, o C
NH 3-
N, m
g L-1
Influent NH3-N Ou�all NH3-N Temperature
Fig. 4. Nitrification performance and water temperature. Bioaugmentation was from February 23 to March 23, 2017.
311D. Austin et al. / Science of the Total Environment 652 (2019) 307–313
5000 kg of peat. With an oxygenated wetted area of 20,598 m2, the re-quired peatmass is 242 gm−2. Stem thickness in the studywetlandwasnot measured, but growth was uniformly thick. Yearly dry weight bio-mass production in northern latitude, non-forested freshwater wet-lands tends to be over 1000 g m−2 yr−1 (Brinson et al., 1981). Thus,adsorption to plant litter may be an unquantified factor in nitrificationrates in super-oxygenated SF wetlands. Observed nitrification perfor-mance in the first four to six weeks after start-up suggests that a sub-stantial fraction of influent NH3-N adsorbs to wetland soils and litter.
Cold water temperatures did not directly suppress nitrification ratesof existing biomass but did suppress nitrifying biomass growth. Therewas no loss of nitrification until water temperatures reached 0.5 °C(Fig. 4). The highest observed monthly nitrification rate was Novemberwhen water temperatures ranged from 8.5 to 3 °C (Figs. 4, 5). Nitrifica-tion was restored by bioaugmentation when water temperatures wereless than 5 °C. Loss of nitrification was due to cold-induced loss of
Fig. 5. Mean monthly nitrification rates. Dashed horizontal line is kA-NH3 = 14.7 m y−1.
biomass, not cold-induced biomass loss of nitrification. Rapid restora-tion of nitrification by bioaugmentation in cold water strongly supportsthis assertion.
Solids retention time (SRT), also known asmean cell residence time,is key to understanding the cold weather nitrification response of thestudy wetland. Comparison of SF wetlands to wastewater treatment la-goons is instructive. Complete loss of nitrification in moderately coldwater (b15 °C) is well-known in wastewater treatment lagoons (VanDyke et al., 2003), principally because of nitrifier wash-out. In lagoons,hydraulic retention time (HRT) and SRT are equal. SF wetlands, in con-trast, fundamentally differ from lagoons because HRT and SRT are notequal. From a process perspective, SF wetlands have more in commonwith other biological treatment processes, such as activated sludge orfixed film bioreactors that extend SRT far beyond HRT, than treatmentlagoons.
Nitrification loss commonly occurs at water temperatures less than10 °C in activated sludge systems operating with SRTs of less than30 days (Metcalf and Eddy, 2003; USEPA, 2011). In low-SRT biofilm sys-tems there is also well-known suppression of nitrification induced bycoldwater (Mannucci et al., 2015). Cold adaptedmicrobial communitiesinwastewater treatment systemshave been observed to have far higherrates than mesophilic communities subjected to cold water (Duceyet al., 2010). Cold adaptations have been observed in sediments tofully compensate for metabolic temperature effects (Thamdrup andFleischer, 1998). Nitrification is well-known to be a significant causeof oxygen depletion under the ice in freshwater sediments (Knowlesand Lean, 1987). In cold, freshwater systems nitrifiers in sedimentsare wholly responsible for nitrification (Pauer and Auer, 2000). In aer-ated, subsurface flow gravel filters or wetlands there is little to no effectof temperature on nitrification rates (Mattson, 2018; Redmond et al.,2014). Nitrification is thus not necessarily a function of temperature. Itcan be, but in long-SRT (e.g. sediments), cold-adapted ecosystems (nat-ural or engineered) the effect of cold on nitrification rates is minimizedor not observed in-situ.
Loss of nitrification provides some insight into biofilm SRT in thestudy wetland. Approximately one third of influent NH3-N was notnitrified on February 13, 2017 just prior to bioaugmentation. Loss of ni-trification was obviously linear. Extrapolating the loss rate, about half ofinfluent NH3-Nwould have remain un-nitrified inmid-March had therebeen no bioaugmentation. Assuming that nitrifier growth was negligi-ble below 5 °C after December 1, 2016, and not yet cold-adapted priorto bioaugmentation, half of the nitrification capacity of the wetlandwould have been lost in 100 days per observed loss of nitrification.

0123456789
1011121314
TN, m
g L-1
Ou�all Total Nitrogen Influent Total Nitrogen
Fig. 6. TN performance.
312 D. Austin et al. / Science of the Total Environment 652 (2019) 307–313
Themean SRTof nitrifying biofilms in thewetland is thus on the order of100 days. Bioaugmentation in early winter would have prevented lossof nitrifying biomass.
Cold weather nitrification results are similar to those found in aer-ated SSF wetlands or aerated gravel filters without step-feed of influent(Wallace, 2000). North AmericanWetland Engineering observed loss ofnitrification in aerated SSF wetlands in late winter or early spring evenafter operating at mid-winter water temperatures of 0.5 °C withoutloss of nitrification (Wallace, unpublished data). Assuming negligiblegrowth of nitrifiers below 5 °C, which occurs before the winter solsticein northern states in the USA, substantial loss of nitrification near thespring equinox, rather than early winter, is evidence for a mean SRTnear 100 days.
The lack of nitrification catabolic dependence on temperature is sig-nificant for design. There is no evidence that a temperature correctionfactor for nitrification is appropriate in the study system. Nitrification(catabolic) activity of wetland biofilms was little affected by graduallowering of temperature. From September 16, 2017 (23 °C) to Decem-ber 16, 2017 (0.6 °C) the average daily temperature change was −0.3°C without change in nitrification performance. Rather, low tempera-ture apparently suppressed growth (anabolism). The design tempera-ture should be taken as 20 °C with bioaugmentation to remediatenitrification rates in cold water. Step feeding ammonia-rich inflow is ef-fective atmaintaining nitrification in harshwinter conditions in aeratedsubsurface gravelfilters (Mattson et al., 2018) andmay be an alternativedesign strategy, but remains to be tested in SF wetlands.
R² = 0.32
R² = 0.51
R² = 0.79
0
1
2
3
4
5
6
7
8
9
10
11
12
0 5 10 15 20 25 30
mg
L-1
Temperature, oC
Effluent NH3-N Effluent TN
Effluent DIN Linear (Effluent NH3-N)
Linear (Effluent TN) Linear (Effluent DIN)
Fig. 7. Outflow NH3-N, DIN, and TN as a function of temperature.
There was no DO limitation of nitrification during the study period.OutflowDO saturation rates demonstrate that there is operationally sta-ble supersaturation (Fig. 3), ranging from150% in summer (20–25 °C) to300% inwinter (0.5–5.0 °C). It is clear from these supersaturation valuesthat oxygen flux rates could have been reducedwithout inhibition of ni-trification. The permit discharge DO at 5.0mg L−1, however, forced cau-tion. Operationally, it was better to err on the side of too much DO thantoo little.
Unlike nitrification, DIN loss strongly depended on temperature(Fig. 7). Observed rates of denitrification were well within literaturevalues (Kadlec and Wallace, 2009) despite saturated to supersaturatedDO. Allen et al. (2010) observed heterotrophic denitrifiers in an oxygen-ated benchtop SF wetland, but none in a non oxygenated control. HighDO only partially suppresses denitrification (Chen et al., 2006). Thus,oxygenation is may not be a practical impediment to denitrification ina super-oxygenated SF wetland. Heterotrophic catabolism strongly de-pends on temperature (Raich and Schlesinger, 1992), which is consis-tent with study findings. Design for denitrification of super-oxygenated SF wetlands should consider seasonal temperatures varia-tions in removal rates as described by Kadlec and Wallace (2009).
5. Conclusions
Super-oxygenation raises the nitrification rate in SF wetlands byover an order ofmagnitude compared to passive SFwetlands by provid-ing an excess of dissolved oxygen. The corresponding reduction in areafor super-oxygenated SF wetlands is over 90% compared to passive SF
y = 137.13x-0.54
R² = 1.00
0
500
1000
1500
2000
2500
0 0.02 0.04 0.06 0.08 0.1 0.12 0.14 0.16 0.18 0.2
k AT, m
y-1
Effluent NH3-N, mg L-1
Fig. 8. Sensitivity of nitrification rate calculation to NH3-N flagged outflow values below0.2 mg L−1.
313D. Austin et al. / Science of the Total Environment 652 (2019) 307–313
wetlands. Gradual cold-water impairment of nitrification is remediedby bioaugmentation, making this treatment wetland technology practi-cal in any climate in which emergent wetland plants can grow.
Because SF wetlands have about one third the construction cost ofSSFwetlands per unit area, andwill not clogwith biofilms, accumulatedsolids, or ice this technology applies broadly to both greenfield and ret-rofit projects. Operational research is needed to optimize oxygen supplyand recirculation rates.
Acknowledgements
The authors thank The Dow Chemical Company for the opportunityto publish results.
References
Allen, J.G., Beutel, M.W., Call, D.R., Fischer, A.M., 2010. Effects of oxygenation on ammoniaoxidation potential and microbial diversity in sediment from surface-flow wetlandmesocosms. Bioresour. Technol. 101, 1389–1392.
Austin, D.C., 2006. Influence of cation exchange capacity (CEC) in a tidal flow, flood anddrain wastewater treatment wetland. Ecol. Eng. 28, 35–43.
Austin, D., Maciolek, D., Wallace, S., Davis, B., 2007. Damköhler number design method toavoid clogging of subsurface flow constructed wetlands by heterotrophic biofilms.Water Sci. Technol. 56, 7–14.
Barwise, S., 1899. The Purification of Sewage. Crosby Lockwood and Son, London, England.Behrends, L., Bailey, E., Houke, L., Jansen, P., Smith, H., 2006. Non-invasive methods for
treating and removing sludge from subsurface flow constructed wetlands. 10th Inter-national Conference on Wetland Systems for Water Pollution Control. IWA Publish-ing, Lisbon, Portugal, pp. 1271–1281.
Brinson, M.M., Lugo, A.E., Brown, S., 1981. Primary productivity, decomposition and con-sumer activity in freshwater wetlands. Annu. Rev. Ecol. Syst. 12, 123–161.
Chen, F., Xia, Q., Ju, L.-K., 2006. Competition between oxygen and nitrate respirations incontinuous culture of Pseudomonas aeruginosa performing aerobic denitrification.Biotechnol. Bioeng. 93, 1069–1078.
Ducey, T.F., Vanotti, M.B., Shriner, A.D., Szogi, A.A., Ellison, A.Q., 2010. Characterization of amicrobial community capable of nitrification at cold temperature. Bioresour. Technol.101, 491–500.
Dunbar,W.P., 1908. Principles of Sewage Treatment. Google Books. Original - Charles Grif-fin & Company, Limited, London.
Esser, D., 2015. 25 years of treating raw sewage with vertical downflow treatment wet-lands in France - a personal history of lessons learned. IWA Specialist Group on Wet-land Systems for Water Pollution Control, pp. 16–26.
Kadlec, R., Wallace, S., 2009. Treatment Wetlands. CRC Press, Boca Raton, Florida.Kinnicutt, L., Winslow, C.E., Pratt, R.W., 1919. Sewage Disposal. Google Books, Original -
John Wiley and Sons, New York, New York.Knowles, R., Lean, D.R.S., 1987. Nitrification: a significant cause of oxygen depletion under
winter ice. Can. J. Fish. Aquat. Sci. 44, 743–749.Knowles, P., Dotro, G., Nivala, J., Garcia, J., 2011. Clogging in subsurface-flow treatment
wetlands: occurrence and contributing factors. Ecol. Eng. 37, 99–112.Lazarova, V., Nogueira, R., Manem, J., Melo, L., 1998. Influence of dissolved oxygen on ni-
trification kinetics in a circulating bed reactor. Water Sci. Technol. 37, 189–193.Lightbody, A., Nepf, H., Bays, J., 2009. Modeling the hydraulic effect of transverse deep
zones on the performance of short-circuiting constructed treatment wetlands. Ecol.Eng. 35, 754–768.
Mannucci, A., Munz, G., Mori, G., Lubello, C., Oleszkiewicz, J.A., 2015. Applicability of theArrhenius model for ammonia oxidizing bacteria subjected to temperature time gra-dients. Front. Environ. Sci. Eng. 9, 988–994.
Mattson, R.R., 2018. Submerged Attached-growth Reactors as Lagoon Retrofits for Cold-weather Ammonia Removal. Civil and Environmental Engineering. Master of Science.University of Iowa.
Mattson, R.R., Wildman, M., Just, C., 2018. Submerged attached-growth reactors as lagoonretrofits for cold-weather ammonia removal: performance and sizing. Water Sci.Technol. (wst2018399-wst2018399).
Metcalf and Eddy, 2003. Wastewater Engineering, Treatment and Reuse. McGraw Hill,New York, New York.
Molle, P., Lienard, A., Boutin, C., Merlin, G., Iwema, A., 2005. How to treat raw sewage withconstructed wetlands: an overview of the French systems. Water Sci. Technol. 51,11–21.
Nivala, J., 2012. Effect of Design on Treatment Performance, Plant Nutrition and Cloggingin Subsurface Flow TreatmentWetlands. Department of Bioscience. Ph.D. Aarhus Uni-versity, Aarhus, Denmark, p. 140.
Nivala, J., Knowles, P., Dotro, G., García, J., Wallace, S., 2012. Clogging in subsurface-flowtreatment wetlands: measurement, modeling and management. Water Res. 46,1625–1640.
Palmer, H., Beutel, M., Gebremariam, S., 2009. High rates of ammonia removal in experi-mental oxygen-activated nitrification wetland mesocosms. J. Environ. Eng. 135,972–979.
Pauer, J.J., Auer, M.T., 2000. Nitrification in the water column and sediment of ahypereutrophic lake and adjoining river system. Water Res. 34, 1247–1254.
Raich, J.W., Schlesinger, W.H., 1992. The global carbon dioxide flux in soil respiration andits relationship to vegetation and climate. Tellus B 44, 81–99.
Redmond, E.D., Just, C.L., Parkin, G.F., 2014. Nitrogen removal from wastewater by an aer-ated subsurface-flow constructed wetland in cold climates. Water Environ. Res. 86,305–313.
Tanner, C., D'Eugenio, J., McBride, G., Sukias, J., Thompson, K., 1999. Effect of water levelfluctuation on nitrogen removal from constructed wetland mesocosms. Ecol. Eng.12, 67–92.
Thamdrup, B., Fleischer, S., 1998. Temperature dependence of oxygen respiration, nitro-gen mineralization, and nitrification in Arctic sediments. Aquat. Microb. Ecol. 15,191–199.
USEPA, 2011. In: Development OoRa (Ed.), Principles of design and operations of waste-water treatment pond systems for plant operators, engineers, and managers. UnitedStates Enviromnetal Protection Agency.
Van Dyke, S., Jones, S., Ong, S.K., 2003. Cold weather nitrogen removal deficiencies of aer-ated lagoons. Environ. Technol. 24, 767–777.
Wallace, S.D., 2000. Design and performance of cold climate wetland treatment systems.Proceedings of the 2000 National Onsite Wastewater Recycling Association(NOWRA) Annual Conferencep. 31.
Wallace, S., Knight, R., 2006. Small-scale Constructed Wetland Wastewater TreatmentSystems: Feasibility, Design, and O&M Requirements, Project 01-CTS-5, Alexandria,Virginia.
Wallace, S., Higgins, J., Crolla, A., Bachand, A., Verkuijl, S., 2006. High-rate ammonia re-moval in aerated engineered wetlands. In: Dias, V. (Ed.), 10th International Confer-ence on Wetland Systems for Water Pollution Control. IWA Publishing, Lisbon,Portugal, pp. 255–264.
Witter, E., Kirchmann, H., 1989. Peat, zeolite and basalt as adsorbents of ammoniacal ni-trogen during manure decomposition. Plant Soil 115, 43–52.
Wong-Chong, G.M., Loehr, R.C., 1975. The kinetics of microbial nitrification. Water Res. 9,1099–1106.
Related Documents