arXiv:astro-ph/0209419v1 19 Sep 2002 Science Objectives and Early Results of the DEEP2 Redshift Survey Marc Davis a , Sandra M. Faber b , Jeffrey A. Newman a , Andrew C. Phillips b , R.S. Ellis c , C.C. Steidel c , C. Conselice c , A. L. Coil a , D. P. Finkbeiner d , D. C. Koo b , P. Guhathakurta b , B. Weiner b , R. Schiavon b , C Willmer b , N. Kaiser e , G. Luppino e , G. Wirth f , A. Connolly g , P. Eisenhardt h M. Cooper a , B. Gerke a a University of California, Berkeley, CA, b Lick Observatory, University of California, Santa Cruz, CA, c Caltech, Pasadena, CA, d Princeton University, Princeton, NJ, e University of Hawaii, Hononlulu, HI f Keck Observatory, Waimea, HI g Carnegie Mellon University, Pittsburgh, PA h Jet Propulsion Laboratory, Pasadena, CA ABSTRACT The DEIMOS spectrograph has now been installed on the Keck-II telescope and commissioning is nearly com- plete. The DEEP2 Redshift Survey, which will take approximately 120 nights at the Keck Observatory over a three year period and has been designed to utilize the power of DEIMOS, began in the summer of 2002. The multiplexing power and high efficiency of DEIMOS enables us to target 1000 faint galaxies per clear night. Our goal is to gather high-quality spectra of ≈ 60, 000 galaxies with z> 0.75 in order to study the proper- ties and large scale clustering of galaxies at z ≈ 1. The survey will be executed at high spectral resolution, R = λ/Δλ ≈ 5000, allowing us to work between the bright OH sky emission lines and to infer linewidths for many of the target galaxies (for several thousand objects, we will obtain rotation curves as well). The linewidth data will facilitate the execution of the classical redshift-volume cosmological test, which can provide a precision measurement of the equation of state of the Universe. This talk reviews the project, summarizes our science goals and presents some early DEIMOS data. Keywords: Redshift Surveys, Large Scale Structure, Galaxy Properties, Cosmology 1. INTRODUCTION Our theoretical understanding of large scale structure and galaxy formation is well advanced, yet many crucial questions remain. Studies of structure depend on objects that can be seen, namely galaxies, whereas the raw medium from which galaxies formed is a mixture of both dark and baryonic matter. It has become clear that the formation of visible galaxies in the universe is highly uneven and that galaxies are a “biased” tracer of the underlying mass. Thus, to study structure in the universe at high redshift, we must be able to predict how the universe converted matter into luminous objects, requiring a thorough understanding of the physics of galaxy formation and evolution; but those processes depend on the underlying cosmological parameters and structure which we would also like to study! Untangling galaxy evolution from cosmological evolution is extremely difficult with studies restricted to the local universe, which provide us with only a snapshot of the end result of galaxy formation, or those which include only a small number of very distant objects. Our ability to draw conclusions from galaxies in the Hubble (Send correspondence to M.D. E-mail [email protected])

Welcome message from author
This document is posted to help you gain knowledge. Please leave a comment to let me know what you think about it! Share it to your friends and learn new things together.
Transcript

arX
iv:a
stro
-ph/
0209
419v
1 1
9 Se
p 20
02
Science Objectives and Early Results of the DEEP2 Redshift
Survey
Marc Davisa, Sandra M. Faberb, Jeffrey A. Newmana, Andrew C. Phillipsb,
R.S. Ellisc, C.C. Steidelc, C. Conselicec,
A. L. Coila, D. P. Finkbeinerd, D. C. Koob, P. Guhathakurtab, B. Weinerb, R. Schiavonb, C Willmerb,
N. Kaisere, G. Luppinoe, G. Wirthf, A. Connollyg, P. Eisenhardth
M. Coopera, B. Gerkea
a University of California, Berkeley, CA,b Lick Observatory, University of California, Santa Cruz, CA,
c Caltech, Pasadena, CA,d Princeton University, Princeton, NJ,e University of Hawaii, Hononlulu, HI
f Keck Observatory, Waimea, HIg Carnegie Mellon University, Pittsburgh, PAh Jet Propulsion Laboratory, Pasadena, CA
ABSTRACT
The DEIMOS spectrograph has now been installed on the Keck-II telescope and commissioning is nearly com-plete. The DEEP2 Redshift Survey, which will take approximately 120 nights at the Keck Observatory over athree year period and has been designed to utilize the power of DEIMOS, began in the summer of 2002. Themultiplexing power and high efficiency of DEIMOS enables us to target 1000 faint galaxies per clear night.Our goal is to gather high-quality spectra of ≈ 60, 000 galaxies with z > 0.75 in order to study the proper-ties and large scale clustering of galaxies at z ≈ 1. The survey will be executed at high spectral resolution,R = λ/∆λ ≈ 5000, allowing us to work between the bright OH sky emission lines and to infer linewidths formany of the target galaxies (for several thousand objects, we will obtain rotation curves as well). The linewidthdata will facilitate the execution of the classical redshift-volume cosmological test, which can provide a precisionmeasurement of the equation of state of the Universe. This talk reviews the project, summarizes our sciencegoals and presents some early DEIMOS data.
Keywords: Redshift Surveys, Large Scale Structure, Galaxy Properties, Cosmology
1. INTRODUCTION
Our theoretical understanding of large scale structure and galaxy formation is well advanced, yet many crucialquestions remain. Studies of structure depend on objects that can be seen, namely galaxies, whereas the rawmedium from which galaxies formed is a mixture of both dark and baryonic matter. It has become clear thatthe formation of visible galaxies in the universe is highly uneven and that galaxies are a “biased” tracer of theunderlying mass. Thus, to study structure in the universe at high redshift, we must be able to predict how theuniverse converted matter into luminous objects, requiring a thorough understanding of the physics of galaxyformation and evolution; but those processes depend on the underlying cosmological parameters and structurewhich we would also like to study!
Untangling galaxy evolution from cosmological evolution is extremely difficult with studies restricted tothe local universe, which provide us with only a snapshot of the end result of galaxy formation, or those whichinclude only a small number of very distant objects. Our ability to draw conclusions from galaxies in the Hubble
(Send correspondence to M.D. E-mail [email protected])
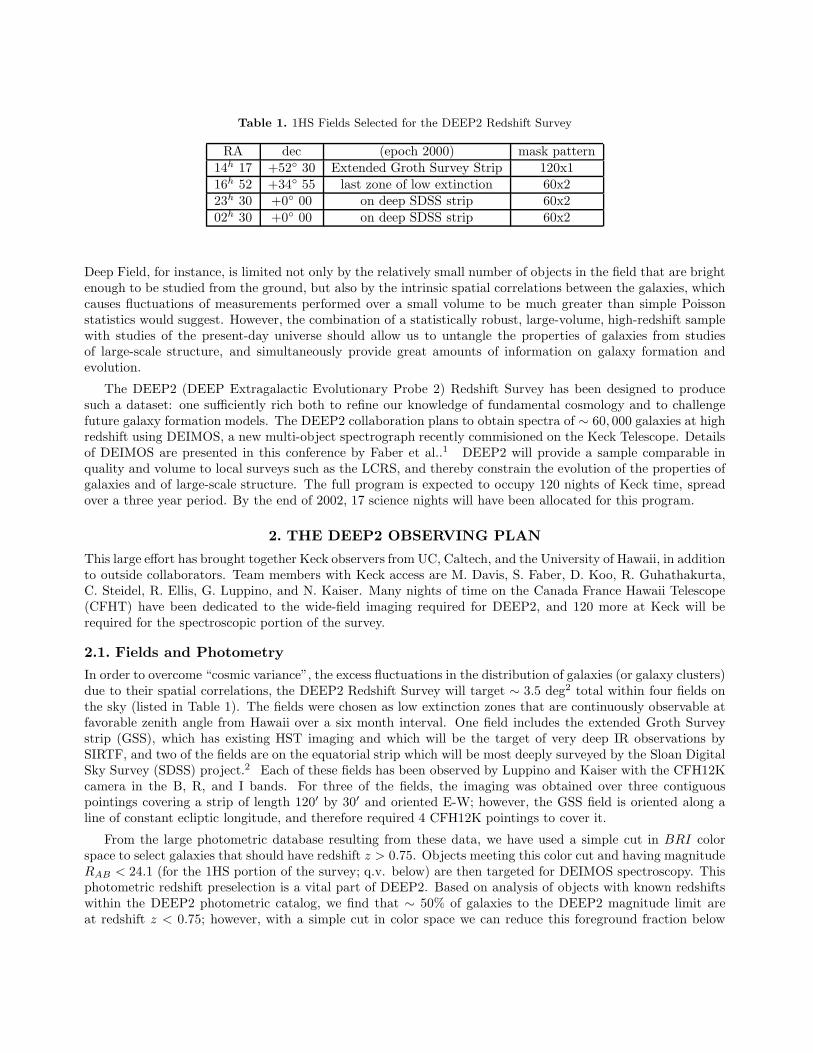
Table 1. 1HS Fields Selected for the DEEP2 Redshift Survey
RA dec (epoch 2000) mask pattern
14h 17 +52 30 Extended Groth Survey Strip 120x1
16h 52 +34 55 last zone of low extinction 60x223h 30 +0 00 on deep SDSS strip 60x2
02h 30 +0 00 on deep SDSS strip 60x2
Deep Field, for instance, is limited not only by the relatively small number of objects in the field that are brightenough to be studied from the ground, but also by the intrinsic spatial correlations between the galaxies, whichcauses fluctuations of measurements performed over a small volume to be much greater than simple Poissonstatistics would suggest. However, the combination of a statistically robust, large-volume, high-redshift samplewith studies of the present-day universe should allow us to untangle the properties of galaxies from studiesof large-scale structure, and simultaneously provide great amounts of information on galaxy formation andevolution.
The DEEP2 (DEEP Extragalactic Evolutionary Probe 2) Redshift Survey has been designed to producesuch a dataset: one sufficiently rich both to refine our knowledge of fundamental cosmology and to challengefuture galaxy formation models. The DEEP2 collaboration plans to obtain spectra of ∼ 60, 000 galaxies at highredshift using DEIMOS, a new multi-object spectrograph recently commisioned on the Keck Telescope. Detailsof DEIMOS are presented in this conference by Faber et al..1 DEEP2 will provide a sample comparable inquality and volume to local surveys such as the LCRS, and thereby constrain the evolution of the properties ofgalaxies and of large-scale structure. The full program is expected to occupy 120 nights of Keck time, spreadover a three year period. By the end of 2002, 17 science nights will have been allocated for this program.
2. THE DEEP2 OBSERVING PLAN
This large effort has brought together Keck observers from UC, Caltech, and the University of Hawaii, in additionto outside collaborators. Team members with Keck access are M. Davis, S. Faber, D. Koo, R. Guhathakurta,C. Steidel, R. Ellis, G. Luppino, and N. Kaiser. Many nights of time on the Canada France Hawaii Telescope(CFHT) have been dedicated to the wide-field imaging required for DEEP2, and 120 more at Keck will berequired for the spectroscopic portion of the survey.
2.1. Fields and Photometry
In order to overcome “cosmic variance”, the excess fluctuations in the distribution of galaxies (or galaxy clusters)due to their spatial correlations, the DEEP2 Redshift Survey will target ∼ 3.5 deg2 total within four fields onthe sky (listed in Table 1). The fields were chosen as low extinction zones that are continuously observable atfavorable zenith angle from Hawaii over a six month interval. One field includes the extended Groth Surveystrip (GSS), which has existing HST imaging and which will be the target of very deep IR observations bySIRTF, and two of the fields are on the equatorial strip which will be most deeply surveyed by the Sloan DigitalSky Survey (SDSS) project.2 Each of these fields has been observed by Luppino and Kaiser with the CFH12Kcamera in the B, R, and I bands. For three of the fields, the imaging was obtained over three contiguouspointings covering a strip of length 120′ by 30′ and oriented E-W; however, the GSS field is oriented along aline of constant ecliptic longitude, and therefore required 4 CFH12K pointings to cover it.
From the large photometric database resulting from these data, we have used a simple cut in BRI colorspace to select galaxies that should have redshift z > 0.75. Objects meeting this color cut and having magnitudeRAB < 24.1 (for the 1HS portion of the survey; q.v. below) are then targeted for DEIMOS spectroscopy. Thisphotometric redshift preselection is a vital part of DEEP2. Based on analysis of objects with known redshiftswithin the DEEP2 photometric catalog, we find that ∼ 50% of galaxies to the DEEP2 magnitude limit areat redshift z < 0.75; however, with a simple cut in color space we can reduce this foreground fraction below

Figure 1. The redshift distribution measured from data obtained during June commissioning for 2 DEIMOS masks;one in the GSS without photo-z preselection, and the other from the 16h field with photo-z preselection designed to keepgalaxies with z > 0.75 . Each mask was observed for one hour. The redshift distribution observed in each case is fullyconsistent with expectations; the fluctuations are consistent with the clustering strength expected for the survey.
10%, while eliminating only ∼ 3% of high-redshift objects (mostly due to photometric errors that cause themto cross the cut line). Applying such a photometric preselection allows us to efficiently target galaxies at highredshift, correspondingly reducing the number of spectra required to perform a survey of distant regions of theuniverse. With two masks observed in early commissioning, one designed with and one without a color cut, wehave already begun to test the efficacy of this method, with the encouraging results shown in figure 1.
Custom milled slitmasks must be designed and manufactured for each pointing of DEIMOS; the masks forthe DEEP2 Redshift Survey typically contain 120 slitlets for galaxies, plus 4 boxes for alignment stars and 8narrower slitlets in blank areas used for non-local sky-subtraction. Each mask covers a field of view of 16’ by4’, and the optical system reimages this mask onto the CCD detector array of 8 MIT-LL CCD’s, forming an 8k

by 8k mosaic.
The MIT-LL CCDs have low fringing, high QE, and exceptionally low readout noise, 2.3 e−; with the1200 l/mm grating and a 1 arcsec slitwidth, the integration time to become sky-noise limited in spectral regionsbetween the OH night sky lines is only 10 minutes. Figure 2 demonstrates the virtues of working at high spectralresolution. The large number of pixels in the dispersion direction allows high resolution with substantial spectralrange, so that we can work between the bright OH sky emission lines while remaining sky-noise limited overthe full spectrum. This ’OH suppression’ capability of DEIMOS suggests that improved SNR for faint galaxiescan be obtained by observing at high dispersion, and later smoothing the data to lower resolution with properaccounting of the variable sky noise.
An added benefit of working at such high dispersion is that corrections for fringing are more stable. Amongother factors, the Fabry-Perot fringing that is ubiquitous in CCD’s in the near-IR has a fringe wavelength (inpixels) which is proportional to the spectral dispersion. If one seeks stable flat fielding, it is important to holdthe instrument’s pixel to wavelength registration to a small fraction of this wavelength. In the case of DEIMOS,this period is ∼ 25 Angstroms (∼ 75 pixels) with the 1200 l/mm grating, and flexure compensation feedbacklimits the motion to .1 − .4 pixels for 180 degree rotation of the instrument. Removing the effects of fringinghas been very straightforward in DEIMOS data. If we were working at resolution 500 rather than 5000, therequirements for instrument rigidity would be 10 times larger for equivalent removal of fringing effects.
We are observing with one arcsec slitwidths and a 1200 l/mm grating tilted so that the wavelengths 6500-9100 A are centered on the detector, thus assuring that the 3727 A [OII] doublet is in range for galaxies with0.74 < Z < 1.44. At the planned spectral resolution, the velocity resolution will be 56 km/s. Such highresolution is unconventional for faint objects but has several benefits: (1) as shown above, most of the spectrumwill be free of terrestrial OH night-sky interference; (2) corrections for fringing are more stable, allowing usto achieve Poisson limited sky subtraction (see figure 3 below); (3) the O [II] doublet will be resolved andwill therefore yield a reliable redshift even if it is the only feature observed; and (4) rotation velocities can bemeasured down to ∼ 25 km s−1. This last feature is unique to DEEP2 and sets it apart from all other distant-galaxy surveys (indeed, most large local surveys such as 2dF and SDSS have much lower velocity resolutionand no capability to measure rotation curves). Work to date at UCSC underscores the importance of this;[OII] linewidths measured from high-resolution spectra do appear to be commensurate with other indicators ofpotential well depth.5 The signal-to-noise ratio in DEEP2 spectra should be adequate to measure linewidthsor even spatially-resolved rotation curves in roughly half of our selected galaxies.
The original plan for the DEEP2 Redshift Survey was to use a lower dispersion grating, 830 l/mm, for whichDEIMOS would yield 3800 A of spectral coverage at a resolution still sufficient to resolve the O [II] doublet.However, for observations in the near IR, this grating must be tilted nearly face-on to the DEIMOS camera.Any light that reflects from the CCD detector will pass through the camera and grating a 2nd time; a fractionof this light will emerge in zeroth order to re-enter the camera a third time, whereupon it will be refocused at amirror point on the detector. These ’ghost images’ are in-focus and have an intensity of ∼ 0.5% of the original.The plethora of bright OH sky lines leads to serious ghost contamination on the opposite side of the camera.We have chosen to avoid dealing with this issue by using the higher dispersion grating, which has no ghosts inthe near-IR.
2.2. Observing Strategy–Target Selection
In each of the four selected fields of Table 1, we will densely target a region of 120’ by 16’ or 120’ by 30’for DEIMOS spectroscopy. We intend to observe 120 separate slitmasks per field; each mask contains ∼ 120slitlets over a region of size 16’ by 4’, with the slitlets mostly aligned along the long axis of the mask, but withsome tilted as much as 30 to track extended galaxies. The mean surface density of candidate galaxies exceedsthe number of objects we can select by approximately 30% (spectra of selected targets cannot be allowed tooverlap on the CCDs). However, this will not cause problems with subsequent analyses if we take account ofthe positions of those galaxies for which we did not obtain spectroscopy.
In the Groth strip region, because of the interests of other collaborative scientific projects, our plan is toconstruct 120 distinct masks each offset from their neighbor by 1’ and to select targets without regard to color,
Rolling 100 Å window
7000 7500 8000 8500 9000Wavelength (Å)
0.0
0.2
0.4
0.6
0.8F
ract
ion
of
sky
cou
nts
(or
pix
els)
on
sk
ylin
esFraction of countsFraction of pixels
Figure 2. The fraction of sky emission contributed by OH lines with flux greater than twice the background level. Thesolid curve shows the fraction of the total flux, while the dotted curve shows the fraction of pixels contributing to thisflux at resolution 5000. Note that only 15-20% of the pixels are contaminated by bright OH emission; observing at highspectral resolution allows the use of ’OH suppression’ to greatly improve the typical signal-to-noise in our spectra.
thereby not imposing a photometric redshift preselection (this will allow us to sample objects at z < 0.75 andhave the added benefit of providing an internal test of the effects of our color selection). Thus, any spot on thesky will be found within 4 masks, giving every galaxy 4 chances to appear on a mask without conflict. In theother three survey fields, we plan to use the color selection, thus halving the source density of targets, and tostep 2’ between masks, giving a galaxy two chances to be selected without conflict. In these fields the maskswill form a pattern of 60 by 2, covering a field of 120’ by 30’. At z ≈ 1, this field subtends a comoving intervalof 80 x 20h−2 Mpc2, and our redshift range translates to a comoving interval of ≈ 800h−1 Mpc (assuming aflat Universe with ΩΛ = 0.7). Figure 1 shows that our photo-z selection method is effective.
Note that this survey differs from the planned VLT/VIRMOS survey3 in that a DEIMOS spectrum will

Figure 3. A histogram of the residuals of sky lines relative to the model sky, in units of the expected RMS. Pointscontributing to this distribution are drawn only from regions with intensity more than twice the background betweenOH lines. The smooth curve is a gaussian of width 1, showing that sky subtraction is working to the Poisson level.
occupy a full row of the CCD array (8k pixels), so the VLT/VIRMOS multiplexing will be higher than ours.The DEEP2 spectra will have resolution 20 times higher than planned for the bulk of the VLT/VIRMOS project,but our volume surveyed will be smaller and thus more sensitive to cosmic variance.
Tests of slitmasks designed for DEEP2 began on the first night of DEIMOS commissioning in early June,2002. On only the second night of commissioning, precision mask alignment was achieved (this is a difficulttask, as tolerances are < 0.2 arcsec over 15 arcmin) and spectra were obtained of DEEP2 target galaxies. Anautomated pipeline now reduces the massive amounts of data obtained in DEEP2 observations (140 MB perDEIMOS frame; each mask is observed multiple times to eliminate cosmic rays, not to mention the calibrationdata required) to sky-subtracted, coadded spectra. We have a working pipeline for reduction of the DEIMOSdata, we and have no difficulty producing fully reduced spectra within a day of observation.
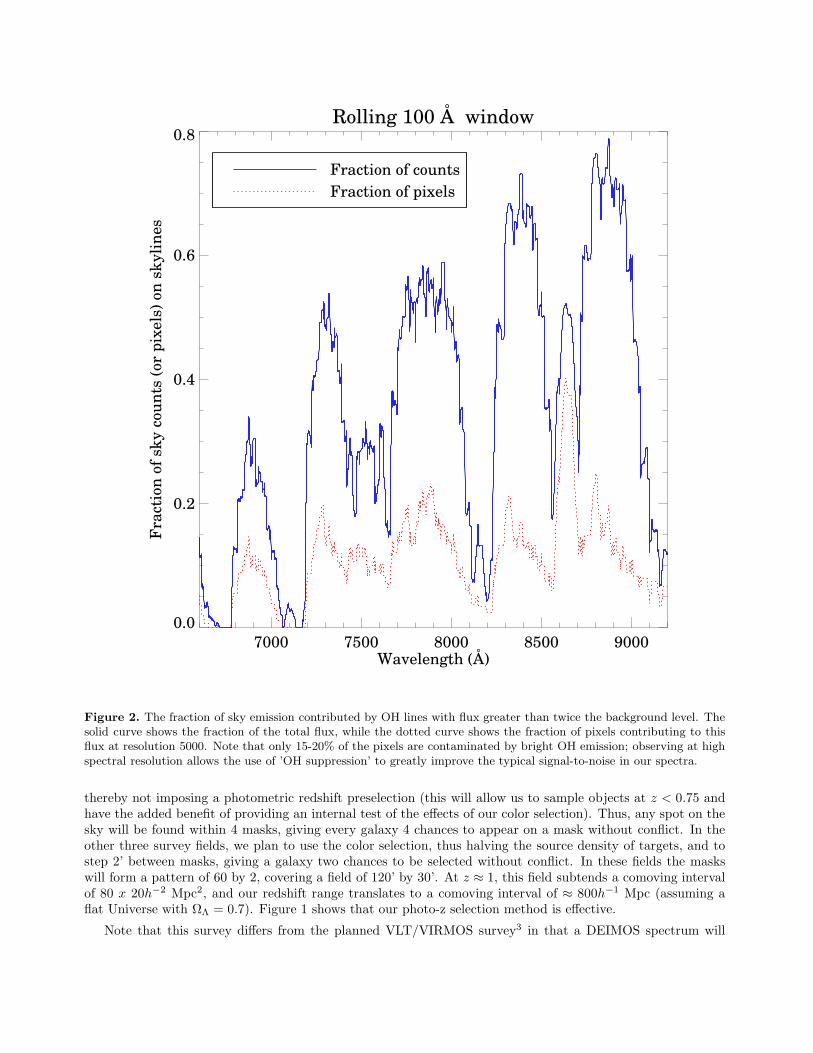
An example of DEIMOS data is given in Figure 4, where we show a small piece of raw data for 3 co-added20 minute exposures taken through a DEEP2 science mask. The tilted sky lines and cosmic rays are prominent.This same section of the mask after pipeline processing is shown in figure 5. For this figure each row has beenaligned in wavelength by shifts in the spectral direction. Note that the sky lines and cosmic rays have beencleanly removed, and that the underlying emission lines of the target galaxies are prominent.
3. THE 1-HOUR AND 3-HOUR SURVEYS
The DEEP2 project is actually subdivided into two surveys, the 1HS (one hour [integration time] survey) andthe 3HS (three hour survey). The 1HS covers a larger area to a shallower depth and will require 90 nights onKeck for execution, while the 3HS covers a small area to greater depth and will require 30 nights of Keck time.The two subsurveys will serve somewhat different purposes, and we describe them in more detail here.
Figure 4. A 700 by 300 pixel section of the coadded raw frames of one mask, with total integration time of one hour.The tilted sky lines indicate the tilt of the individual slitlets. Cosmic rays are prominent, but note as well the sets ofdouble emission lines in the spectra.
The 1-Hour Survey: 55,000 galaxies to RAB = 24.1 over 3.5 square degrees. The 1-Hour Survey(1HS) is the backbone survey that will provide linewidths, spatial distributions, clustering, and environmentalstatistics for tens of thousands of brighter galaxies. Its limiting magnitude is RAB = 24.1 mag, which correspondsto M∗+0.5 at z = 1 for an LCDM universe. Experience to date shows that to achieve the goal of 55,000 measuredredshifts will require targeting a total of 65,000 galaxies. Because it will cover a much larger volume than the3HS (∼ 6 × 10⁶h−3 Mpc vs. a few ×105h−3 Mpc), the 1HS will be greatly superior for studying rare objectssuch as AGN and clusters of galaxies. Spectra and CFHT photometry will be available for every object inthe 1HS, and linewidths will be measured for roughly half of those objects with redshifts. However, the 1HSexposure times are short enough that we will tend to miss redshifts and linewidths for faint red absorption-linespectra, for which we would need more photons to get a redshift than bright, emission line galaxies. Coveringsuch gaps in the 1HS is one goal of the 3HS (see below).
The 3-Hour Survey: 5,000 galaxies to IAB = 24.5. The 3HS is a survey-within-a-survey that comple-ments and completes the 1HS in several ways. The goals of the 3HS are to: (1) obtain redshifts and linewidthsfor absorption-line spectra to the same limiting redshift as the 1HS—crucial for measuring the number densityof large galactic halos, since the deepest galactic potential wells are expected to harbor absorption-line galaxies

Figure 5. A same small piece of a single mask shown in figure 4, now having passed through the reduction pipeline. Thespectra are now aligned in wavelength, and the noisy vertical lines are residuals of the OH forest after sky subtraction.The plot does not capture the fact that these lines have mean zero and noise consistent with their Poisson fluctuation.The double emission lines on the four objects in the middle of the plot are [OII] 3727 A lines at z ∼ 1 (the split of thedoublet is 220 km/s). This is a modest group of galaxies, one of the thousand or so expected within the DEEP2 RedshiftSurvey.
like the local giant ellipticals; (2) aided by HST imaging, measure complete structural parameters and mor-phologies of galaxies at z ∼ 1 down to ∼ M∗ + 1.5; and (3) reobserve a subset of 1HS objects with higher S/Nto obtain definitive completeness statistics for the 1HS.
4. SCIENCE GOALS OF THE DEEP2 REDSHIFT SURVEY
Our team’s principal science goals for the DEEP2 Redshift Survey center on galaxy formation, galaxy biasing,and fundamental cosmology, as detailed below. However, a broad array of projects will be made possible by theDEEP2 data archive, including studies of AGN evolution in the early universe; exploration of the origin of thecosmic infrared background; development of total-matter maps to compare to weak lensing surveys; calibrationof photometric redshifts; measurements of the cosmic evolution of star formation and chemical abundances;and measurements of the number density of very distant galaxies at z > 5. The principal science goals of theground-based portions of DEEP2 Redshift Survey are:

Goal 1: Determine the characteristics of galaxies at z ∼ 1 and their dependence on environment;
e.g. measure the evolution of the “structure function” of galaxies with redshift. DEEP2 will measurea wide variety of parameters of the observed galaxies: not just colors, magnitudes, and redshifts, but also inmany cases linewidths or rotation velocities, equivalent widths of emission lines (and thereby such parameters asmetallicity and O[II]-derived star formation rates), the ages of stellar populations, etc., etc. The distributions ofand correlations between these parameters, along with their evolution to the present epoch, will provide strongconstraints on models of galaxy formation and evolution, whether semi-analytic (e.g. Refs. 6, 7) or based onN-body simulations (e.g. Refs. 8, 9). An example of this sort of DEEP2 science which is critically dependent oncombining ground-based spectroscopy with space-based imaging is the measurement of the “structure function”of galaxies.
In general a set of two parameters, such as a scale radius and internal velocity, are sufficient to characterizethe structure of a typical dark matter halo.10, 11 Current theories for galaxy formation predict different evolvingrelationships between these dark halo parameters and observable galaxy properties such as luminosities (e.g.Refs. 7, 12. The “structure function” is a compact way of characterizing these relationships at any epoch. Eachgalaxy can be represented by its radius, luminosity, and internal velocity—a point in so-called “FundamentalPlane” space. The co-moving number density of galaxies in this space is what we term the “structure function,”by analogy with the familiar luminosity function. A 1-d projection of the structure function onto the luminosityaxis generates the luminosity function, while 2-d projections onto planes generate the Tully-Fisher and Dn-σfunctions. A major goal of DEEP2 is to measure the full structure function at z ∼ 1 in a wide variety ofenvironments (from near-voids to clusters) and compare it to today’s. DEEP2 will measure two parts of thisfunction well: internal velocities of galaxies can be measured spectroscopically down to ∼ 25 km s−1(limitedby the resolution of our spectra); while the ground-based BRI imaging can be used to measure the (rest-frameB) luminosities of the target objects. However, from the ground we can derive radii only for the largest, mostspatially extended (or relatively nearby) galaxies.
Thus, measurement of the full structure function will only be possible with the addition of high-resolutionspace-based images (adaptive optics from the ground is still limited to comparatively tiny fields of view). TheACS instrument recently installed on HST is ideal for this task. With measurements of radii from HST, the3HS would provide complete structural data for about 5,000 galaxies, sufficient to allow subdivision by galaxytype and environment; the 1HS objects in the same fields would provide ∼ 5, 000 more. Most galaxies of the1HS will lack accurate radii (unless HST imaging were eventually obtained for all the DEEP2 fields) but willstill provide excellent data on the luminosity function, N(L), the velocity function, N(v), and the Tully-Fisherfunction, N(L, v). If the cosmic input parameters (Ωm, ΩΛ, etc.) are known from other measurements, thesefunctions N(L), N(v), and N(L, v) will also provide useful tests of the baryonic infall physics of galaxies.
In addition, Palomar K-band imaging will be performed over the full 1HS survey region, which will provideinvaluable information on stellar masses for galaxies at Z ∼ 1. The K-band photometry, combined withlinewidths and HST determined sizes, will also allow us to determine stellar to total mass ratios. This is animportant quantity, but has hardly been attempted at high redshift; DEEP2 should be able to do it for manygalaxies.
Goal 2: Measure the two-point and higher-order correlation functions of galaxies at z ∼ 1 as a
function of other observables. In almost all models of structure formation (e.g., Ref. 13), galaxies are bornas highly biased tracers of the mass distribution, but their bias diminishes with time. Spiral galaxies todayappear to be weakly biased, if at all, while the clustering of z ∼ 3 Lyman-break galaxies requires a large biasfor any reasonable cosmological model.14, 15 Galaxies at z ∼ 1 should have an intermediate degree of bias,with readily observable consequences. With sufficiently dense sampling, determining the higher-order clusteringproperties of galaxies can yield direct measurements of their biasing.16, 17 It will be possible to subdivide the1HS sample as a function of galaxy type, luminosity, etc. and measure the biasing for each sample both inan absolute sense and compared to the other samples. This and other, more sophisticated measures will beexplored as part of DEEP2. The 1HS survey is designed to provide a fair sample volume for analysis of LSSstatistical behavior, particularly for clustering studies on scales < 10h−1 Mpc. The comoving volume surveyedin the 1HS program will exceed that of the LCRS survey,4 a survey which has proven to be an outstandingresource for low redshift studies of LSS.
Goal 3: Determine the evolution of the abundance of dark matter halos and clusters as a function
of internal velocity, N(v, z). By measuring the linewidths of parent dark matter halos from the galaxies visiblewithin them (as per Goal 1 above), we can use the dark-halo abundance as a function of internal velocity andredshift, N(v, z), to perform a classic cosmological test. It is well known that the volume element dV/dzdω(where ω is solid angle) strongly depends on the input cosmological parameters, notably Ωm and ΩΛ. Thus, theapparent number of objects with a given linewidth versus redshift is a sensitive test of the volume element—provided the co-moving number density of those objects is known. In practice, the poorly-known evolution ofthe number density N(L) of galaxies has stymied this test. However, if we have measured real potential-welldepths, we can bypass galaxies and count the more easily simulated dark halos directly. This work will requireus to study a significant fraction of our galaxies with the high resolution of HST to ensure that these objectsare morphologically simple, and thus that their linewidths provide real information about the potential wellsof galaxies. Newman & Davis19, 20 showed that the degree of evolution in the comoving number density ofgalaxy sized halos at fixed velocity is almost totally independent of cosmology. The observed abundance of suchobjects, dN(v)/dz, thus measures the volume element of the expanding Universe and gives us a powerful handleon the cosmic geometry.
In contrast, the time evolution of the comoving number density of groups and clusters of galaxies is expo-nentially sensitive to certain combinations of cosmological parameters – much stronger than the differences involume amongst models. Thus, the detected abundance of clusters provides a separate, very powerful probe ofthe cosmological parameters (e.g. Ref. 18). Based on tests with mock catalogs from simulations, we expect tomeasure the abundance of clusters as a function of their velocity dispersion – which can be predicted directlyfrom models of the dark matter distribution – down to a dispersion of ∼ 400 km s−1at z ∼ 1.21, 22 This providesanother test of the cosmology, complementary to the one provided by counts of galaxies.
Both techniques can place constraints not only on spatially curved models containing matter and possiblya simple cosmological constant, but also on flat “quintessence” models in which the dark energy is assumedto consist of an active field with an effective equation of state P = wρ, with −1 < w < −1/3 (w = −1 fora cosmological constant; cf. Ref. 26). The equation of state parameter w can only be measured via globalcosmological tests; prospects for constraining it from CMB analyses alone are relatively poor.23
Goal 4: Measure redshift-space distortions due to peculiar velocities at z ∼ 1. The clustering ofgalaxies is inherently isotropic in space, with no preferred orientation toward or away from the Milky Way. Theobserved redshift-space clustering of galaxies, however, is distorted by peculiar velocities, producing featuressuch as the so-called “fingers of God” on virialized scales and a flattening of structure on larger scales. DEIMOSwill deliver highly precise redshifts, allowing both of these effects to be readily detectable in our maps (see Ref. 24for details).
A variety of statistical tools have been developed to extract pair- and object-weighted velocity dispersionsas well as measures of the flattening on larger, non-virialized scales. Analysis of these quantities will give usstrong measures of a degenerate combination of Ωm at z ∼ 1 and the bias of the galaxy distribution. Thisdegeneracy can be broken by comparison to the same statistics at z ∼ 0. By these analyses we can get a stronghandle on the bias of the galaxy distribution and can study the success and failures of our paradigm of structureformation. With DEEP2 we can construct at z ∼ 1 the detailed statistics of velocity fields that have onlyrecently been possible at z ∼ 025 !.
5. DATA FLOW FOR THE DEEP2 REDSHIFT SURVEY
The data rate from DEIMOS will be in excess of 1 Gbyte/hour, necessitating automated reduction and analysistools. We have therefore developed a spectral reduction pipeline for DEIMOS based upon the remarkablepipeline developed by D. Schlegel and S. Burles for the SDSS spectroscopic survey. We are extremely indebtedto them for allowing us to study their code and extract its core elements. As shown above, we are routinelyachieving Poisson limited sky subtraction even amidst the OH forest, which is made possible by careful attentionto the 2-d wavelength solution within each slitlet and by the use of b-splines for a precision fit of the sky spectrumwithin each slitlet. Details of this spectral reduction pipeline will be provided elsewhere.

The code for reduction to 1d spectra is a completed package at this writing, though still being revised.Automated redshift determination and rotation curve analysis are in some ways easier tasks; we have begunadapting D. Schlegel’s 1d spectroscopic analysis code to our puroises. The spectra at all stages of reduction arestored as FITS files, while the photometric and spectroscopic databases for the project are stored as FITS binarytables, which become IDL structures when read from disk. Thus the pipeline code and database managementare fully integrated and quite easy to use.
Reduction of a full mask of calibration files and 3 science frames requires ∼ 6 hours on a 1.5GHz linuxworkstation; the UCB group has acquired a modest Beowulf cluster which will be used for all the DEEP2reductions, and we anticipate no difficulty in keeping up with the flood of data that DEIMOS will produce.Although the total raw data will exceed one Tbyte of compressed FITS files, the reduced data will be modestin size by today’s standards, < 100 Gbytes.
6. SCIENCE RESULTS FROM EARLY DEIMOS DATA
The weather for DEIMOS commissioning in June, 2002, was excellent, but the July and August science runsyielded only one useful night out of the 9 nights assigned. Fortunately our luck changed for the Septemberrun, during which 29 masks were completed in a 4 night period. As of this writing, we have collected spectraof more than 4000 high redshift galaxies. Figure 5 is a demonstration that emission lines are prominent in asubstantial fraction of our target galaxies. These spectra have sufficient SNR to estimate the line ratio of thedoublet as well as the internal broadening. In many of our target galaxies, we can trace the rotation curve. Theclosely associated galaxies of figure 4 form a modest group of galaxies, and we expect to observe hundreds ofsuch groups over the course of the survey. Details on these results, and many others, will be forthcoming afterthe close of the 2002 observing season in October.
7. CONCLUSIONS
The flood of data now coming from the SDSS and 2DF projects detailing the local Universe is beginning to becomplemented by data from the VLT/VIRMOS project and by the DEEP2 Redshift Survey providing detailedinformation on the Universe at z ≈ 1, thus continuing the revolution in precision cosmology and large-scalestructure. These results will rapidly expand in the coming months and will keep us all extremely busy. Weintend to share our results with the public and to put our spectra online in a timely manner. Further detailson the survey can be found at the web site http://deep.berkeley.edu/.
ACKNOWLEDGMENTS
This work was supported in part by NSF grants AST00-71048 and KDI-9872979. The DEIMOS spectro-graph was funded by a grant from CARA (Keck Observatory), by an NSF Facilities and Infrastructure grant(AST92-2540), by the Center for Particle Astrophysics, and by gifts from Sun Microsystems and gifts from SunMicrosystems and the Quantum Corporation. DPF is supported by a Hubble Fellowship.
REFERENCES
1. S.M. Faber et al., ”The DEIMOS Spectrograph for the Keck II Telescope: Integration and Testing,” inInstrument Design and Performance for Optical/Infrared Ground-based Telescope, Proc. SPIE 4841, 2002.
2. D. Yorket al (2000), “The Sloan Digital Sky Survey: Technical Summary,” Astron. J. 120, pp. 1579–1587,2000.
3. O. LeFevre, et al, “VIRMOS: visible and infrared multi-object Spectrographs for the VLT,” in OpticalAstronomical Instrumentation, Sandro D’Odorico, ed., Proc. SPIE 3355 , pp. 8–17, 1998.
4. S. Shectman et al, “The Las Campanas Redshift Survey,” Astrophys. J. 470, pp. 172–188, 1996.
5. H.A. Kobulnicky and K. Gebhardt, “Obtaining Galaxy Masses Using Stellar Absorption and [O II]Emission-Line Diagnostics in Late-Type Galaxies”, Astron. J. 119, pp. 1608–1626, 2000.
6. A. J. Benson, C.G. Lacey, C.M. Baugh, S. Cole, and C.S. Frenk, “The effects of photoionization on galaxyformation - I. Model and results at z=0,” M.N.R.A.S.333, pp. 156–176, 2002.
7. R.S. Somerville, “Can Photoionization Squelching Resolve the Substructure Crisis?”, Astrophys. J.Lett.572, pp. 23–26, 2002.
8. H. Mathis, G. Lemson, V. Springel, G. Kauffmann, S.D.M. White, A. Eldar, and A. Dekel, A., “Simulatingthe formation of the local galaxy population”, M.N.R.A.S.333, pp. 739–762, 2002.
9. C. Murali, N. Katz, L. Hernquist, D.H. Weinberg, and R. Dave “ The Growth of Galaxies in CosmologicalSimulations of Structure Formation,” Astrophys. J.571, pp. 1–14, 2002.
10. J.S. Bullock et al. , “Profiles of dark haloes: evolution, scatter and environment,” M.N.R.A.S.321, pp. 559–575, 2001.
11. J.F. Navarro, C.S. Frenk, and S.D.M. White, S.D.M. “A Universal Density Profile from HierarchicalClustering”, Astrophys. J.490, pp. 493–508, 1997.
12. H.J. Mo, S. Mao, and S.D.M. White, “The formation of galactic discs,” M.N.R.A.S.295, pp.319–336, 1998.
13. S.D.M. White, M. Davis, G. Efstathiou, and C.S. Frenk, “Galaxy distribution in a cold dark matter uni-verse”, Nature 330, pp. 451–453, 1987.
14. C. Porciani and M. Giavalisco, “The Clustering Properties of Lyman Break Galaxies at Redshift z∼3”,Astrophys. J.565, pp. 24–49, 2002.
15. J.S. Bullock, R.H. Wechsler, and R.S. Somerville, “Galaxy halo occupation at high redshift,”M.N.R.A.S.329, pp. 246–256, 2002.
16. J. Fry, “The Evolution of Bias,” Astrophys. J. Lett.461, pp. 65–68, 1996.
17. R. Scocciamarro, S. Colombi, J. Fry, J. Frieman, E. Hivon, E., and A. Melott “Nonlinear Evolution of theBispectrum of Cosmological Perturbations,” Astrophys. J.496, pp. 586–604, 1998.
18. Z. Haiman, J.J. Mohr, and G.P. Holder, “Constraints on Cosmological Parameters from Future GalaxyCluster Surveys”, Astrophys. J.553, pp. 545–561, 2001.
19. J.A. Newman and M. Davis, ”Measuring the Equation of State with Counts of Galaxies,” Astrophys. J.Lett.534, pp. 11–15, 2000.
20. J.A. Newman and M. Davis, ”Measuring the Equation of State with Counts of Galaxies. II. Error Budgetfor the DEEP2 Redshift Survey,” Astrophys. J. Lett.564, pp. 567–575, 2002.
21. J.A. Newman, C. Marinoni, A.L. Coil, and M. Davis, “Measuring the Cosmic Equation of State withGalaxy Clusters in the DEEP2 Redshift Survey,” P.A.S.P.114, pp. 29-34, 2002.
22. C. Marinoni, M. Davis, J.A. Newman, and A.L. Coil, “Three-Dimensional Identification and Reconstruc-tion of Galaxy Systems within Deep Redshift Surveys”, Astrophys. J., accepted, 2003.
23. W. Hu, D. Eisenstein, M. Tegmark, and M. White, “Observationally Determining the Properties of DarkMatter,” Phys. Rev. D.59, pp. 3512–3522 , 1999.
24. A.L. Coil, M. Davis, and I. Szapudi “Galaxy Correlation Statistics in Mock Catalogs for the DEEP2Survey,” P.A.S.P.113, pp. 1312–1325, 2001.
25. J.A. Peacock et al. “A measurement of the cosmological mass density from clustering in the 2dF GalaxyRedshift Survey,” Nature410, pp. 169–173, 2001.
26. Wang, L. & Steinhardt, P. J. (1998), “Cluster Abundance Constraints for Cosmological Models with aTime-varying, Spatially Inhomogeneous Energy Component with Negative Pressure”, Astrophys. J., 508,483
Related Documents


![arXiv:0906.0995v1 [astro-ph.CO] 4 Jun 2009 - CMU Statisticsannlee/0906.pdf · our framework to data from the DEEP2 Galaxy Redshift Survey that is matched to ugriz photometry of the](https://static.cupdf.com/doc/110x72/5cada83a88c99333788b91f7/arxiv09060995v1-astro-phco-4-jun-2009-cmu-annlee0906pdf-our-framework.jpg)