Science and Technology Division Effects of Innovation on Employment in Latin America: the microeconomic evidence Comparative results Gustavo Crespi and Ezequiel Tacsir 9 9 th th GLOBELICS Conference. Buenos Aires, GLOBELICS Conference. Buenos Aires, Argentina Argentina November15 November15 th th , 2011 , 2011

Science and Technology Division Effects of Innovation on Employment in Latin America: the microeconomic evidence Comparative results Gustavo Crespi and.
Jan 01, 2016
Welcome message from author
This document is posted to help you gain knowledge. Please leave a comment to let me know what you think about it! Share it to your friends and learn new things together.
Transcript

Science and Technology Division
Effects of Innovation on Employment in Latin America: the microeconomic evidence
Comparative resultsGustavo Crespi and Ezequiel Tacsir
99thth GLOBELICS Conference. Buenos Aires, Argentina GLOBELICS Conference. Buenos Aires, Argentina
November15November15thth, 2011, 2011

http://www.iadb.org
The Inter-American Development Bank Discussion Papers and Presentations are documents prepared by both Bank and non-Bank personnel as supporting materials for events and are often produced on an expedited publication schedule without formal editing or review. The information and opinions presented in these publications are entirely those of the author(s), and no endorsement by the Inter-American Development Bank, its Board of Executive Directors, or the countries they represent is expressed or implied.
This presentation may be freely reproduced.

Employment and Innovation in LAC
• The potential for inclusive growth in the region depends on its capacity to generate good quality employment.
• There are high expectations by regional Policy Makers on the potential of STI to trigger inclusive growth.
• However, we know very little on the transmission mechanisms and dynamics between innovation and job performance.
• Results will help us to better understand a very complex phenomena (very little studied in the region) and to generate inputs for the design of public policies that maximize the employment generation impacts of innovation and at the same time mitigate its negative consequences.

Motivation
Our own work on the link between innovation and productivity research shows that the lack of innovation negatively affects productivity levels. How this affects labor market outcomes?
However, we still lack knowledge on the relation between employment and innovation. Evidence from more developed countries or regions might not be applicable. Need to provide evidence for policy-making.
In Latin America the production structure is strongly dominated by small and medium enterprises (SMEs). Indeed, SMEs’ innovation is strongly dominated by informal search routines and learning from already available knowledge and technologies.
Importance of assessing the effects on employment (level and composition). It is not only quantity what matters, but also quality.

Focus
This paper focuses on the (short term) link between innovation and employment. Based on national country studies performed by different research teams.
Coverage: Comparative research in four countries: Argentina, Chile, Costa Rica and Uruguay.
Novel features (as a project): Emphasis on SMEs, sectoral differences (low/high tech sectors). Extensions of the project during this session and following session. To further increase comparability and homogeneity among countries possibility to use Enterprise Surveys for LAC.

Research questions
(1)How different types of innovations (product, process, organizational) create or displace employment.
(2) How different types of business innovation strategies
(make or buy) influence the capacity of innovation to generate or destroy employment.
(3) To analyze how (1) and (2) might render differential impacts across firms of different size and sectors?
(4) To assess how different types of innovations and innovation strategies affect the quality of employment measured by types of skills.

Employment effects of innovation: A Conceptual framework The relationship between innovation and employment at the firm level
is not straightforward. It is usually believed that– Process innovation destroys jobs by substituting labor– Product innovation creates jobs by an increase in demand
But If process innovation increase productivity firms can reduce prices and
increase the demand for their products If the firm with a new product gains market power, it can be the case
that it is more profitable to increase price, reduce the quantity sold , and employment accordingly.
Harrison, Jamandreu, Mairesse, and Peters (2008) (HJMP, from now onwards) provide an empirical framework to address the issue at the firm level.

Employment effects of innovation: A Conceptual framework
Displacement Compensation
Process Innovation
Productivity effect (-): less labor for a given
output
Price effect (+): cost reduction, passed on to price,
expands demand
Product Innovation
Productivity differences of the new product
(- or +)
Demand enlargement effect (+)
Innovation
activities
Innovation
activities
Depends on competitionDepends on competition
Depends of firms’
behavior
Depends of firms’
behavior

Methodology Data: Research is based on innovation surveys (collected in
several countries in the region, normally repeated cross-sections using similar methodologies). Need to match with other surveys (i.e., annual manufacturing surveys) or register data (social security).
– Argentina: Second Innovation Survey (1998-2001),– Chile: 4 waves of National survey of Innovation (EIT) (1995, 1998, 2001,
2007), and National Annual Manufacturing Survey (ENIA) (1993-2007)– Costa Rica: Innovation survey for Costa Rica from 2006 to 2007. Matched
for performance with Manufacturing survey and social security records– Uruguay: 4 waves of (Manufacturing) Innovation Surveys (MIS) (1998-
2000, 2001-2003, 2004-2006 and 2007-2009) + Annual Economic Activity Surveys (EAS) for the period 1998-2007. Both surveys have the same sample and statistical framework.

Effects on employment quantity the research setting assumes that a firm can introduce: (i) product or process
innovations and (ii) produce new and old products. 2 types of products are distinguished: existing products and the production of
new products. The change in employment is then decomposed into the part due to the increased efficiency in production of old products (related to process & organizational innovations) and the part due to the introduction of new products (product innovations)
HMJP (2008) suggests the following regression to estimate the effects of innovation on employment:
Where l is total employment growth, g1 is the nominal growth in sales of old products, g2 is the nominal growth in sales of new products (product innovations) and d captures the introduction of process innovations in the production of old products. If process innovations in the production of old products displace employment, α1< 0. If product innovations create employment, β>0. β also captures the relative efficiency in the production of old/new products (if <1 new are more efficient than old).
2110 ggdl

Foundations of the empirical model:
, , 1, 2; 1,2itit it it it itY F K L M e i t
– Multiproduct production function (two products, CRS, etc)
– Production function:
K: capital;
L: labour;
M: material;
θjt: technological efficiency;
ωit: unobserved idiosynchratic productivity shocks
η: unobserved firm-specific productivity shocks

Cost function:
Assumption of constant returns to scale Conditional labour demand for old products:
Conditional labour demand for new products
Simplifying assumption: Given that the production of new products at the beginning of the period is nil (
) so we can approximate the employment growth decomposition as follows:
1
11 1
1
1,2t
tt wL t
t
YL c w t
e
22
2222 22 22 22
22
0 0wL
YL c w if Y and L otherwise
e
11 12 22wL wL wLc w c w c w
t
tt
t
itttttttt
Ywc
YwcYYwwC
2
22
1121,2121 ,,,,
11
22
22
11
11
1112
11
1112
Y
Y
Y
YY
L
Ll
021 Y
Foundations of the empirical model:

Foundations of the empirical model:
Decomposition of employment growth into growth of employment due to production of the old products and the new products:
Leads to:
12 11 12 11 11 22 22 11ln ln ln ln
Rate of change in demand for
Efficiency gain in production of
old products (+/-
Starting the p
old products (
u
-)
rod
)
l Y Y Y Y
12 11
depends on efficiencyratio between both te
Productivity shocks (+/-)
ctionof the new product (+
chnologies
)
~12 11 22 12 11 22 12 22
11 11 11 11 11
lnL L L L L L L LL
L L L L L L

Identification strategy
If v is correlated to innovation, OLS estimates are inconsistent. Productivity is omitted and therefore v could be correlated to innovation. Innovations are the result of investment decisions (such as R&D) and those decisions depend on the firm’s productivity. If productivity is in the error term (because it is an omitted variable) the error term will be correlated (hence endogeneity problem).
Productivity can be thought as wit = wi + uit
– If the correlation is through time invariant characteristics wi (e.g. managerial capabilities), endogeneity is less important because the equation is in first differences
– If the correlation is through the time varying part of productivity (productivity shock), uit, timing in the relation innovation-productivity becomes crucial. If investments decisions are taken in advance innovations variables won’t be related with the error term (OLS is consistent). If not, innovation outputs might become endogenous.

Identification strategy
Another source of endogeneity is the presence of measurement error in g1 and g2.
Ideally, we would use growth in real production but we only observe nominal output. Hence, the growth in prices (of both old and new) are left in the error term. Correlation between growth in prices and g2 can create an attenuation bias in the estimation of β
Hence (and since we generally do not have firm level prices), we use industry price indexes and a proxy for the growth in prices of old products. We use IV correlated with real growth in the production of new products but uncorrelated with its nominal growth.
IV methods are used to correct these issues. Variety of instruments (but preferred is the increased range of products). 2 conditions: partially correlated with product innovation but not correlated with the error term.

Descriptive statisticsArgentina Chile Costa Rica Uruguay
1,415 2049 208 2532
36.0 30.7 22.0 48.1
15.0 4.0 4.0 19.4
48.0 53.4 74.0 32.5
233 215 182 91
20.0 12.5 14.9 13.2
64.0 52.0 57.7 81.0
-4.0 -0.2 3.3 -0.7
-6.0 0.8 3.5 -3.4
-3.9 2.1 7.4 1.7
-2.5 -0.5 3.0 1.8
-9.0 6.5 23.7 5.5
-12.5 2.9 27.3 1.7
-8.1 7.1 11.7 9.6
-6.7 8.5 23.7 8.7
-45.3 -5.7 -54.9 -21.2
38.7 14.2 78.6 29.9
-5.0 6.7 20.5 6.2
-6.5 2.1 23.8 5.1
-4.3 4.9 4.3 7.9
-4.2 9.0 20.4 6.9
-2.0 5.0 14.3 6.8
-2.3 3.8 14.1 6.8
-1.9 5.0 11.8 6.8
-1.9 5.6 14.6 6.8
Argentina (AR)-Innovation Survey 1998-2001; Chile (CH): pooled regressions for the innovation
surveys 1995, 1998, 2001, 2007;Costa Rica (CR): Innovation survey 2006-2007 Uruguay: pooled regressions for the surveys 1998-2000,
2001-2003 and 2004-2006.
Process only innovators (non product innovators)
Product innovators
Source: Own elaboration based on country studies
Non-innovators (no process or product innovations)
Process only innovators (non product innovators)
Product innovators
Prices growth (%) (b)
All firms
Non-innovators (no process or product innovations)
All firms
Process only innovators (non product innovators)
Product innovators
Sales growth (%)(nominal growth) (yearly rate)
All firms
Non-innovators (no process or product innovations)
Process only innovators (non product innovators)
Product innovators
of which:
Old products
New products
Labor productivity growth (%)(a)(yearly rate)
Non-innovators (no process or product innovations)
Number of observations
Distribution of firms (%)
Non-innovators (no process or product innovations)
Process only innovators (non product innovators)
Product innovators
Number of employees at the beginning of (each) survey
Foreign Ownership (10% or more) (%)
Located in the capital of the country (%)
Employment growth (%) (yearly rate)
All firms

Descriptive statistics (small firms)Argentina Chile Costa Rica Uruguay
417 652 119 1353
56.0 57.5 29.4 62.2
12.0 3.7 5.9 14.0
32.0 28.8 64.7 23.7
28 26.1 25.7 26.2
6 5.8 6.7 6.2
64 48.2 63.9 76.7
-3.5 1.4 3.6 -3.7
-5.8 1.5 3.7 -5.3
1.5 4.5 5.4 -1.5
-1.2 1.8 3.3 -1.0
-9.7 5.3 20.0 3.6
-12.8 3.1 23.1 1.2
-3 7.6 12.8 9.4
-6.6 8.5 19.3 6.4
-49.2 -5.7 -46.1 -25.1
42.6 14.2 66.1 31.5
-6.2 3.9 16.5 7.3
-7 1.6 19.4 6.5
-4.5 3.1 7.4 10.9
-5.4 6.6 16.0 7.4
-2 3.6 13.5 7.7
-2.2 1.6 14.1 7.4
-1.4 3.3 9.7 9.0
-1.9 6.4 13.6 7.7
Source: Own elaboration based on country studies
Argentina (AR)-Innovation Survey 1998-2001; Chile (CH): pooled regressions for the innovation
surveys 1995, 1998, 2001, 2007;Costa Rica (CR): Innovation survey 2006-2007 Uruguay: pooled regressions for the surveys 1998-2000,
2001-2003 and 2004-2006.
Process only innovators (non product innovators)
Product innovators
Non-innovators (no process or product innovations)
Process only innovators (non product innovators)
Product innovators
Prices growth (%) (b)
All firms
Non-innovators (no process or product innovations)
Product innovators
of which:
Old products
New products
Labor productivity growth (%) (a) (yearly rate)
All firms
Process only innovators (non product innovators)
Product innovators
Sales growth (%)(nominal growth) (yearly rate)
All firms
Non-innovators (no process or product innovations)
Process only innovators (non product innovators)
Non-innovators (no process or product innovations)
Number of observations
Distribution of firms (%)
Non-innovators (no process or product innovations)
Process only innovators (non product innovators)
Product innovators
Number of employees at the beginning of (each) survey
Foreign Ownership (10% or more)
Located in the capital of the country
Employment growth (%) (yearly rate)
All firms

Employment effects of types of innovation (OLS)
Sector
Regression AR CH CR UY AR CH CR UY
Constant 4.139*** 1.997** -1.616 2.662*** 2.739 3.136** -0.845 1.757**
(0.836) (0.825) (5.241) (0.555) (1.685) (1.326) (6.650) (0.775)
Process only innovator (d ) -0.601 -2.780** 8.175 -4.002*** -2.489 -3.346 5.726 -4.127**
(1.004) -1.275 (6.539) (1.06) (2.425) (2.717) (8.770) (1.686)
Sales growth due to newproducts (g2)
0.959*** 0.833*** 0.887*** 0.853*** 0.963*** 0.706*** 0.932*** 0.826***
(0.013) (0.034) (0.042) -0.018 (0.03) (0.084) (0.059) (0.028)
Located in the capital 0.989 -0.13 0.950 NA 3.990* 3.064 10.083 NA
(0.854) (1.231) (5.161) (1.9) (4.309) (8.525)
Foreign owned (10% ormore)
-3.962*** -0.275 6.672* 1.655 -3.441 -2.318 2.112 -3.048
(0.905) (0.889) (3.884) (1.181) (3.682) (1.718) (5.949) (2.51)
2-digit industry dummies Yes Yes Yes Yes Yes Yes Yes Yes
Time dummies - Yes - Yes - Yes - Yes
R-squared 0.83 0.27 0.632 0.441 0.785 0.163 0.615 0.369
Number of firms 1,415 2,049 208 2,532 1,415 652 119 1,353
Notes: (i) Robust standard errors, (ii) Significance level: *** 1%, ** 5%, and * 10%,
Manufacturing small firmsManufacturing

Employment effects of types of innovation (IV)
Sector
Regression AR CH CR UY AR CH CR UY
Constant -0.994 -2.016 -12.160** 1.402** -0.684 -2.125 -7.571 0.267
(3.236) (3.00) (5.170) -0.662 (4.44) (4.701) (6.088) -0.907
Process onlyinnovator (d )
1.398 0.333 18.413* -2.716** -2.542 -3.38 15.415 -2.595
(1.673) (2.572) (10.076) -1.104 (2.691) (2.921) (12.655) -1.772
Sales growthdue to newproducts (g2 )
1.170*** 1.751*** 1.015*** 0.961*** 1.140*** 2.141* 1.051*** 0.998***
(0.125) (0.653) (0.050) -0.04 (0.218) (1.205) (0.068) -0.063
Located in thecapital
1.623 -0.36 1.361 NA 4.690* 5.208 7.194 NA
(0.998) (1.449) (5.503) (2.22) (4.699) (11.113)
Foreign owned(10% or more)
-5.467*** 0.048 6.680* 1.371 -5.412 0.865 -0.319 -3.162
(1.349) (1.04) (3.843) -1.186 (5.132) (3.394) (6.049) -2.502
2-digit industry dummies
Yes Yes Yes Yes Yes Yes Yes Yes
Time dummies - Yes - Yes - Yes - Yes
F test, g2 equation 14.32 35.91 78.16 170.8 6.2 6.94 51.12 89.62
Pvalue 0.002 0.000 0.000 0.000 0.013 0.000 0.000 0.000
Davidson-MacKinnon test of exogeneity for g23.319 2.71 13.79 10.39 0.784 2.23 7.15 10.66
Pvalue 0.069 0.0999 0.00027 0.0013 0.376 0.1354 0.0088 0.0011
R-squared 0.785 0.2471 0.652 0.42 0.724 0.1392 0.583 0.338
Number offirms
1,415 2,049 208 2,532 417 652 119 1,353
Small firms in ManufacturingAll firms in Manufacturing

Employment effects by types of sectors (IV)Sector AR AR CH CH UY UY
Regression Low Tech High Tech Low Tech High Tech Low Tech High Tech
Constant -0.201 5.697** 1.697 -2.733 1.115 1.670*
(1.961) -1.946 (4.206) -3.368 -0.944 -0.929
Process only innovator (d) 0.849 -1.45 -0.517 -0.076 -2.524 -2.897**
(1.884) (1.628) (3.787) -2.835 -1.813 -1.407
Sales growth due to new products (g2) 1.105*** 0.910*** 1.403* 1.695** 0.956*** 0.958***
(0.066) (0.071) (0.846) (0.728) -0.056 -0.056
Located in the capital Yes Yes Yes Yes - -
Foreign owned (10% or more) Yes Yes Yes Yes Yes Yes
2-digit industry dummies Yes Yes Yes Yes Yes Yes
Time dummies - - Yes Yes Yes Yes
F test, g2 equation 8.65 5.17 13.14 23.57 94.37 81.97
Pvalue 0 0 0 0 0 0
Davidson-MacKinnon test ofexogeneity for g2
4.857 0.261 0.4293776 1.98238 4.31788 5.496489
Pvalue 0.028 0.61 0.5125 0.1594 0.038 0.0192
Sargan-Hansen test ofoveridentification
2.451 1.773 4.442 0.49 3.349 3.58
Pvalue (degrees of freedom) 0.874 0.939 0.1085 0.7823 0.646 0.611
R-squared 0.811 0.748 0.2568 0.2464 0.423 0.419
Number of firms 672 743 632 1417 1068 1464

Implications
Results show that the introduction of new products is associated with employment growth at the firm level, with similar efficiency between the production of old and new products. Hence, no evidence that product innovation displace employment (due to increased efficiency) being prevalent the creation effect of employment.
Only in Uruguay (for all firms and in the high tech sectors), process innovations present displacement effects.
In both Chile and Costa Rica, the compensation effects due to new products imply employment growth even when the replacement of old products is taken into account.

Robustness checks
d as endogenous: similar coefficients but with a general loss in precision.
Overidentification by including further instruments: weak instruments are not a concern.
Allowing for change in the slope of product innovation if these innovations were introduced together with process innovation (interaction term between g2 and a dummy): generally, there is evidence that the positive impact on employment growth is weaker when products and process are introduced jointly.

Employment growth decomposition
We decompose the employment growth observed in each country (and type of firm) over four different components. Using our preferred specification, we can write employment growth for each firm in the following way:
– 1st component: measures the change in its employment attributable to the (industry specific) productivity trend in production of old products;
– 2nd component: estimates the change in employment associated with the gross productivity effect of process innovation in the production of old products;
– 3rd component: corresponds to the employment change associated with output growth of old products for firms that do not introduce new products;
– 4th component: gives the net contribution of product innovation (i.e., contribution after allowing for any substitution of new products for old products).
– The last term is a zero-mean residual component.

Employment growth decomposition
Firms employment growth -4.0 -0.2 3.3 -0.7
Productivity trend in production of old products -0.1 0.9 -8.4 1.1
Gross effect of process innovation in production of old products 0.1 -0.1 0.8 -0.2
Output growth of old products for non
?product innovators
-4.6 0.0 2.9 -1.9
Net contribution of product innovation 0.6 -0.9 8.1 0.3
Contribution of old products by product innovators -21.1 -6.0 -51.4 -9.1
Contribution of new products by product innovators 21.7 5.1 59.5 9.4
Firms employment growth -3.5 1.4 3.6 -3.7
Productivity trend in production of old products 3.8 0.8 -6.7 0.3
Gross effect of process innovation in production of old products -0.4 -0.1 0.9 -0.1
Output growth of old products for non
?product innovators
-6.1 0.0 2.8 -3.8
Net contribution of product innovation -0.8 0.8 6.6 -0.2
Contribution of old products by product innovators -15.1 -3.1 -38.8 -7.8
Contribution of new products by product innovators 14.3 3.9 45.4 7.6
Argentina (AR)-Innovation Survey 1998-2001; Chile (CH): pooled regressions for the innovation
surveys 1995, 1998, 2001, 2007;Costa Rica (CR): Innovation survey 2006-2007 Uruguay: pooled regressions for the surveys 1998-2000,
2001-2003 and 2004-2006.
Source: Own elaboration based on country studies. IV estimates
Small firms manufacturing AR CH CR UY
Manufacturing AR CH CR UY

Effects on employment quality: two approaches Based on equation (1), we can split the growth rate of employment
in both skilled (ls) and unskilled workers (lus). Therefore, we can study the impact of both process and product innovation on skilled and unskilled labor growth:
Once again we use instrumental variables as discussed before in order to address the identification problem related to correlation between d and g2 and the error term.
In addition, and as robustness check, we also follow different variations of Berman, Bound and Griliches (1994) to estimate the relative demand of skilled labor:
itit
sit
ssit
sit gdgl 2101 )(
itit
usit
ususit
usit gdgl 2101 )(
iiiiiU
i
Si
i
Si
Si dYYK
w
w
VC
lw
52413210 lnlnlnln
gcrespi
No reportaria esto.
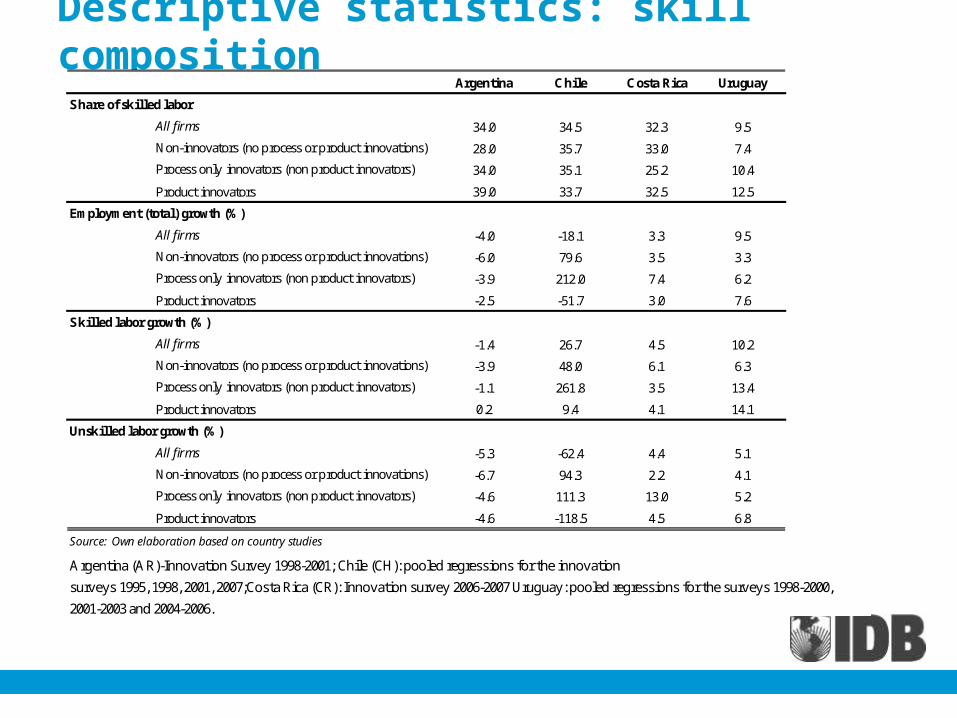
Descriptive statistics: skill compositionArgentina Chile Costa Rica Uruguay
34.0 34.5 32.3 9.5
28.0 35.7 33.0 7.4
34.0 35.1 25.2 10.4
39.0 33.7 32.5 12.5
-4.0 -18.1 3.3 9.5
-6.0 79.6 3.5 3.3
-3.9 212.0 7.4 6.2
-2.5 -51.7 3.0 7.6
-1.4 26.7 4.5 10.2
-3.9 48.0 6.1 6.3
-1.1 261.8 3.5 13.4
0.2 9.4 4.1 14.1
-5.3 -62.4 4.4 5.1
-6.7 94.3 2.2 4.1
-4.6 111.3 13.0 5.2
-4.6 -118.5 4.5 6.8
Source: Own elaboration based on country studies
Argentina (AR)-Innovation Survey 1998-2001; Chile (CH): pooled regressions for the innovation
surveys 1995, 1998, 2001, 2007;Costa Rica (CR): Innovation survey 2006-2007 Uruguay: pooled regressions for the surveys 1998-2000,
2001-2003 and 2004-2006.
Employment (total) growth (%)
All firms
Non-innovators (no process or product innovations)
Process only innovators (non product innovators)
Share of skilled labor
All firms
Non-innovators (no process or product innovations)
Process only innovators (non product innovators)
Product innovators
Product innovators
Skilled labor growth (%)
All firms
Non-innovators (no process or product innovations)
Process only innovators (non product innovators)
Product innovators
Unskilled labor growth (%)
All firms
Non-innovators (no process or product innovations)
Process only innovators (non product innovators)
Product innovators

Effects on skillsSector AR AR CH CH CR CR UY UY
Skilled Unskilled Skilled Unskilled Skilled Unskilled Skilled Unskilled
IV IV IV IV IV IV IV IV
Constant -1.179 -1.975 -6.378 5.873 -11.580** -12.283** 2.934* 0.225
-4.353 -3.848 -6.786 -6.452 (5.873) (6.099) (1.748) (1.100)
Process onlyinnovator (d )
3.048 2.448 14.931 -29.793 10.465 26.260** 2.379 -3.373*
-2.291 -2.01 -28.568 -27.162 (11.446) (11.887) (2.822) (1.780)
Sales growthdue to newproducts (g2)
1.308*** 1.126*** 1.702* 1.54 1.010*** 1.020*** 1.087*** 0.929***
-0.174 -0.153 -1.029 (0.978) (0.057) (0.059) (0.120) (0.075)
Located in thecapital
Yes Yes Yes Yes Yes Yes - -
Foreign owned(10% or more)
Yes Yes Yes Yes Yes Yes Yes Yes
2-digit industry dummies
Yes Yes Yes Yes Yes Yes Yes Yes
Time dummies - - Yes Yes - - Yes Yes
F test, g2 equation
11.47 11.47 32.12 32.12 78.16 78.16 64.87 64.87
Pvalue 0.001 0.001 0 0 0 0 0 0
Davidson-MacKinnon test of exogeneity for g25.992 1.427 0.6661196 0.8668128 17.26771 6.233251 5.370168 1.163053
Pvalue 0.015 0.232 0.5138 0.4205 0.000049 0.0134 0.019 0.28
Number offirms
1,209 1,209 1,973 1,973 208 208 1037 1037
Regression

Effects on skill composition
In Argentina there is weak evidence suggest that product innovations are more skill intensive (one side test. Similar for small firms), the opposite for small firms in Uruguay. In all other countries, there is no evidence of skill bias on product innovation.
In Chile we find a negative effect of process innovation on unskilled employment, except in low tech sector. In Costa Rica and Uruguay there is evidence of displacement effect in the case of unskilled for the whole sample, but not for small firms. No biases from process in the case of Argentina.

Conclusions Relationship between innovation and employment is complex. Innovation
could trigger different effects at different levels of aggregation and the relation depends on the transmission mechanisms.
Idiosyncratic nature of innovation in the region means that the recent evidence in developed countries cannot be simply extrapolated. This project allow to fill the knowledge gap on the effects of innovation on employment (both quantity and quality).
The evidence presented supports the idea that the negative performance in the labor market tend to be related to the lack of product innovators rather than to the introduction of innovations (either process or product).
Considering that innovation positively affect employment generation, these results provide support for the current emphasis to the promotion of firm-level innovation.

Related Documents