Schubel, Peter James (2004) Characterisation of 'class A' polymer composites for the automotive industry. PhD thesis, University of Nottingham. Access from the University of Nottingham repository: http://eprints.nottingham.ac.uk/12572/1/Thesis_Schubel.pdf Copyright and reuse: The Nottingham ePrints service makes this work by researchers of the University of Nottingham available open access under the following conditions. This article is made available under the University of Nottingham End User licence and may be reused according to the conditions of the licence. For more details see: http://eprints.nottingham.ac.uk/end_user_agreement.pdf For more information, please contact [email protected]

Welcome message from author
This document is posted to help you gain knowledge. Please leave a comment to let me know what you think about it! Share it to your friends and learn new things together.
Transcript

Schubel, Peter James (2004) Characterisation of 'class A' polymer composites for the automotive industry. PhD thesis, University of Nottingham.
Access from the University of Nottingham repository: http://eprints.nottingham.ac.uk/12572/1/Thesis_Schubel.pdf
Copyright and reuse:
The Nottingham ePrints service makes this work by researchers of the University of Nottingham available open access under the following conditions.
This article is made available under the University of Nottingham End User licence and may be reused according to the conditions of the licence. For more details see: http://eprints.nottingham.ac.uk/end_user_agreement.pdf
For more information, please contact [email protected]
CHARACTERISATION OF ‘CLASS A’ POLYMER
COMPOSITES FOR THE AUTOMOTIVE INDUSTRY
BY
PETER JAMES SCHUBEL
BENG. (HONS.)
THESIS SUBMITTED TO THE UNIVERSITY OF NOTTINGHAM FOR
THE DEGREE OF DOCTOR OF PHILOSOPHY
OCTOBER 2004
Introduction
P J Schubel i
Abstract
Characterisation of ‘Class A’ Polymer Composites for the Automotive
Industry
by
Peter Schubel
BEng
This thesis addresses problems associated with surface quality measurement and
residual volatile organic compounds for composite laminates intended for use as
cosmetic body parts based on unsaturated polyester resin containing shrinkage control
additives. Surface quality measurement techniques were compared for composite
laminates allowing for rapid characterisation and benchmarked to industrial standards.
Thermal desorption and solvent elution techniques were used for the detection of
residual volatiles with styrene and benzaldehyde being the main focus. The degree of
conversion and residual volatiles were monitored for three peroxide initiators via a
series of statistically developed experiments. This work highlighted the need for
alternative shrinkage control methods. A novel approach was studied through the use
of nano-scale silicates. An exfoliation process was developed with subsequent
characterisation of thermal and mechanical properties for the nanocomposite. Finally,
a series of hybrid matrices consisting of nanocomposite and low profile additive
blends were monitored for effects on surface roughness, residual volatile levels and
mechanical performance.

Introduction
P J Schubel ii
Acknowledgements
The author would like to thank his academic supervisors Professor Chris Rudd and Dr.
Nick Warrior for their outstanding guidance and support during the course of this
work, as well as Dr. Ken Kendall (Aston Martin Lagonda) for his commitment to the
interests of the Polymer Composite Group at the University of Nottingham.
The financial support of the DTI/DfT and the collaborative support of the Ford Motor
Company, Aston Martin Lagonda, Hexcel Composites, Scott Bader Company,
Qinetiq, Tenax, Sotira and Atlas Co are gratefully acknowledged.
The project would not have been successful or as enjoyable without the much
appreciated help from the technical support team of Roger Smith, Paul Johns, Dave
Smith and Geoff Tomlinson.
Introduction
P J Schubel iii
Contents
Abstract i
Acknowledgements ii
1 Introduction 1
1.1 Polymer Reinforced Composites in the Automotive Industry 1
1.2 Moulding Developments in the Automotive Industry 2
1.3 Issues Associated with Polyester RTM 5
1.3.1 Cure Induced Resin Shrinkage 7
1.3.2 The use of Low Profile Additives for a Reduction in Resin Shrinkage 13
1.4 Theme of this Work 17
1.5 References 18
2 Surface Characterisation of Cosmetic Polymer Composites 22
2.1 Introduction 22
2.2 Issues Associated with Coated Polymer Composite Surfaces 22
2.3 Methods for Measuring Surface Quality 25
2.3.1 Surface Roughness 26
2.3.2 Short and Long-Term Waviness 29
2.4 In House Industrial Standards 31
2.5 Experimental Methods 34
2.5.1 Materials 34
2.5.2 Moulding Process 38
2.5.3 Paint Process 41
2.5.4 Surface Evaluation 42
2.6 Results and Discussion 44
2.6.1 Levelling Effects of Paint on Polymer Composite Surface
Structure 44
2.6.2 Validation of Surface Measurement Techniques 48
2.6.3 Tool Surface Study 54
2.6.4 Effects of Tow Size and Resin Shrinkage on Surface Quality 58
2.7 Conclusions 60
2.8 References 61

Introduction
P J Schubel iv
3 Cure and Residual Volatile Assessment 63
3.1 Introduction 63
3.2 Theory and Review of Previous Work 64
3.3 Experimental Method 70
3.4 Results and Discussion 74
3.4.1 Introduction 74
3.4.2 Cure Efficiency 75
3.4.3 Influence of Low Profile Additive on Residual Content 79
3.4.4 Influence of Cobalt Levels on Residual Content 80
3.4.5 Influence of Demould Time on Residual Content 83
3.4.6 Influence of Postcure Temperature on Residual Content 85
3.4.7 Influence of Ambient Storage on Residual Content 86
3.5 Conclusions 90
3.6 References 91
4 Nano-Scale Silicates as an Alternative to Conventional LPAs 94
4.1 Introduction 94
4.2 Nano-Scaled Layered Silicates 94
4.2.1 Molecular Structure of Montmorillonite 95
4.2.2 Dispersion 96
4.3 Experimental Methods 100
4.3.1 Materials 100
4.3.2 Experimental Procedure 102
4.4 Results and Discussion 107
4.4.1 Characterisation of Nanocomposite Structure 107
4.4.2 Material Physical Properties 110
4.5 Conclusions 116
4.6 References 117
5 Characterisation of Low Profile Nanocomposite Laminates 120
5.1 Introduction 120
5.1.1 Experimental Procedure 120
5.2 Results and Discussion 122
5.2.1 Surface Effects 122
5.2.2 Volatile Organic Compounds 125

Introduction
P J Schubel v
5.2.3 Mechanical Properties 127
5.3 Conclusions 130
5.4 References 131
6 Discussion and Conclusions 132
6.1 Introduction 132
6.2 General Discussion 132
6.2.1 Surface Quality 132
6.2.2 Residual VOCs 133
6.2.3 Nanocomposites 134
6.3 Recommendations for Future Work 135
6.4 Major Conclusions 136
Appendix 1 Publications Arising from Thesis 139
Appendix 2 Paint Thickness Distribution 140
Appendix 3 Statistical Evaluation on Subjective SurfaceQuality Trials 141
A3.1 Within Appraiser 142
A3.2 Between Appraisers 142
A3.3 Conclusions 143
Appendix 4 Surface Waviness Characterisation 144
Appendix 5 Calculation of Percentage Mass Compound forGas Chromatography 147
A5.1 Introduction 147
A5.2 Calibration 147
Appendix 6 Effects of Sample Conditioning for GasChromatography 150
A6.1 Introduction 150
A6.2 Effects of Sample Preconditioning on GC Response 150
A6.3 Influence of Sample Mass on GC Response 151
Appendix 7 Dispersion of Silicate Clay using the In-SituIntercalative Polymerisation Method 153
A7.1 Effects of Shear Rate 153
A7.2 Gradient Effects of Nanocomposite Through-Thickness 154
Appendix 8 Surface Roughness Modelling of FabricReinforced Polymer Composites 156
Introduction
P J Schubel 1
1 Introduction
1.1 Polymer Reinforced Composites in the Automotive Industry
The high specific strength and specific stiffness of composite materials have made
polymer-reinforced composites attractive not only in weight sensitive aerospace
applications, but also in marine, armour, automobile, civil structures and sporting
goods. Composite materials are a versatile product and can be engineered to
provide many advantages compared to metals including: weight reduction,
increased structural stiffness, chemical resistance, thermal resistance, diffusional
barrier and dielectic properties and in some cases, reduced manufacturing costs.
The automotive industry has realised the potential benefits that composites offer
over conventional structural materials such as steel and has been a driving force in
the development of material and processing conditions.
Polymer matrix composites can be generalised into thermoplastics (polymers that
soften and can be re-shaped with the addition of heat) and thermoset (polymers
that acquire a final form after an irreversible chemical process), with thermosets
dominating approximately 70 % of the market. By 2003, the world market for
polymer composites was 7.2 million tonnes, with the automotive industry
consuming 25 % of the output [1]. This is a growth of 8 % from 2002 and has
been driven by political, economical, social and technological issues such as
environmental regulation towards lighter, more recyclable materials,
improvements in manufacturing technology, form flexibility leading to popular
new designs and increased steel prices due to tariffs [2].
Traditional micron level reinforcement such as glass, carbon, aramid and various
other natural fibres have been and still are the focus of much research. However,
the push for novel approaches in polymer composite design has led to the rapid
development of materials that utilise reinforcement on a nanometre scale
(nanocomposite). The total worldwide market for nanocomposites, nanoparticles,
nanoclays and nanotubes reached 11 100 tonnes or £50 million, in 2003. This new
Introduction
P J Schubel 2
and innovative sector has a predicted annual growth of 18.4 % to reach £115
million by 2008 [3].
Lightweight body structures are being successfully produced from stamped and
assembled aluminium alloys, which offer controlled dimensional stability,
predictable surface quality, zero residual volatile organic compounds (VOCs) and
excellent recyclability. At high volumes, aluminium alloy becomes cost
competitive with composites due to rapid processability and current joining and
welding techniques. Composite materials must offer benefits beyond the
capabilities of aluminium alloy structures and overcome processing/recycling
issues if they are to sustain strong growth within the lightweight automotive
sector.
1.2 Moulding Developments in the Automotive Industry
The automotive industry utilises a variety of forming and consolidation processes
in order to meet demands from niche markets up to high volume production. The
process undertaken is influenced by production volume (Table 1.1), material type,
component size, mechanical properties, dimensional stability and cost.
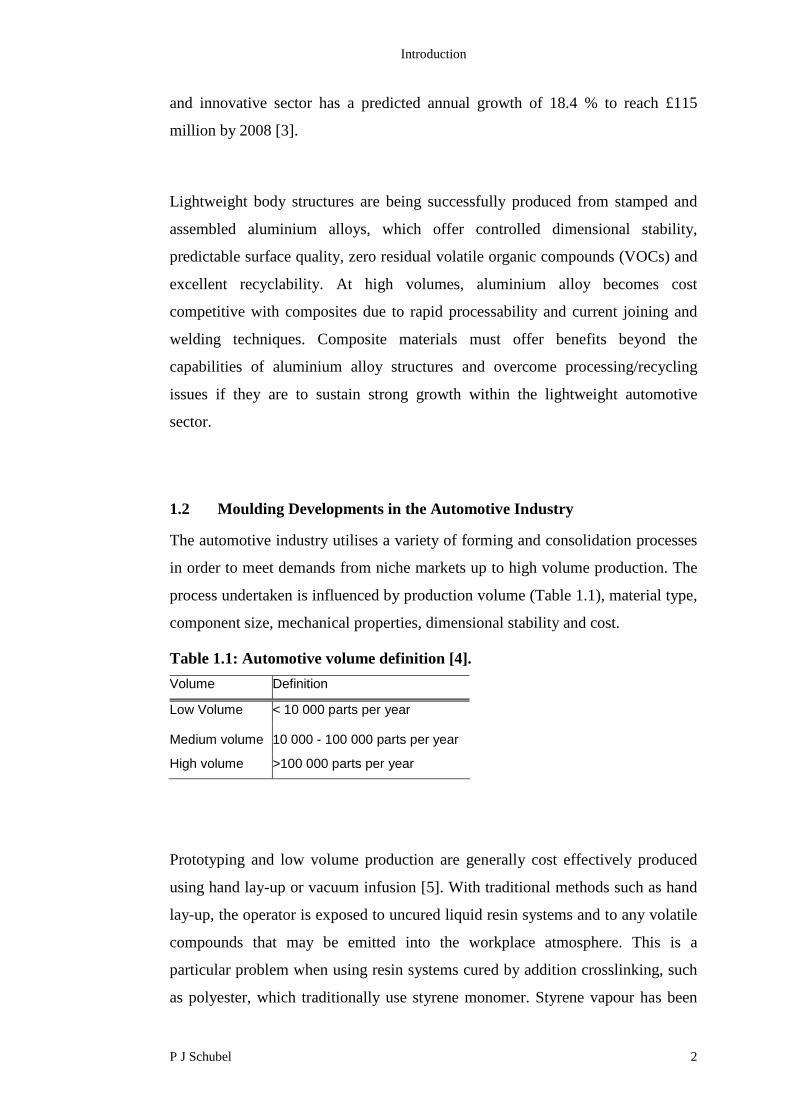
Table 1.1: Automotive volume definition [4].
Volume Definition
Low Volume < 10 000 parts per year
Medium volume 10 000 - 100 000 parts per year
High volume >100 000 parts per year
Prototyping and low volume production are generally cost effectively produced
using hand lay-up or vacuum infusion [5]. With traditional methods such as hand
lay-up, the operator is exposed to uncured liquid resin systems and to any volatile
compounds that may be emitted into the workplace atmosphere. This is a
particular problem when using resin systems cured by addition crosslinking, such
as polyester, which traditionally use styrene monomer. Styrene vapour has been

Introduction
P J Schubel 3
reported to cause detrimental effects in workers; notably depression and fatigue
with slowing of reaction times [6]. The use of sealed moulding assemblies such as
vacuum infusion, structural reaction injection moulding (SRIM), resin transfer
moulding (RTM) and compression moulding utilising sheet and bulk moulding
compounds (SMC and BMC) have been shown to reduce organic volatile
emissions by up to 95 % [7].
Processes which utilise vacuum bagging techniques, such as vacuum infusion
(VI), have been shown to be cost efficient for low volume production (Figure 1.1)
due to the low cost of tooling. However, the necessary consumable costs make
this system impractical for production over 10 000 parts. Further more, limitations
to these processes include low inlet and compaction pressures (approx 100 kPa),
which influence mechanical properties, surface quality and component thickness,
leading to variation in batch tolerances.
Figure 1.1: Component cost for a generic 1 m2 part for carbon systems atlow, medium and high production volumes [8].
To improve cost viability for medium to high production and overcome the
limitations of vacuum bagging, a closed mould, matched tool assembly is
generally employed. A matched tool assembly improves thickness control,
facilitates higher injection and compaction pressures and reduces VOCs being
£-
£20.00
£40.00
£60.00
£80.00
£100.00
£120.00
£140.00
£160.00
£180.00
£200.00
5K 30K 100K 5K 30K 100K 5K 30K 100K
Quantity
Un
itP
art
Co
st
(£
)
Labour
Consumables
Tooling
Materials
VI SMCRTM
Introduction
P J Schubel 4
released into the work environment. Popular processes utilising a matched mould
assembly include compression moulding and RTM.
Compression moulding with matched tooling using sheet moulding compound
(SMC) is currently the most common method for producing high volume polymer
composites due to the reduced cost of production for parts exceeding 100 000 per
annum (Figure 1.1). Tooling capital is high for compression moulding due to the
high moulding temperature and pressures (approx 150 ºC and 5.5 MPa
respectively). However this is justified by low cycle times of one to four minutes
depending on the complexity of the part [9, 10].
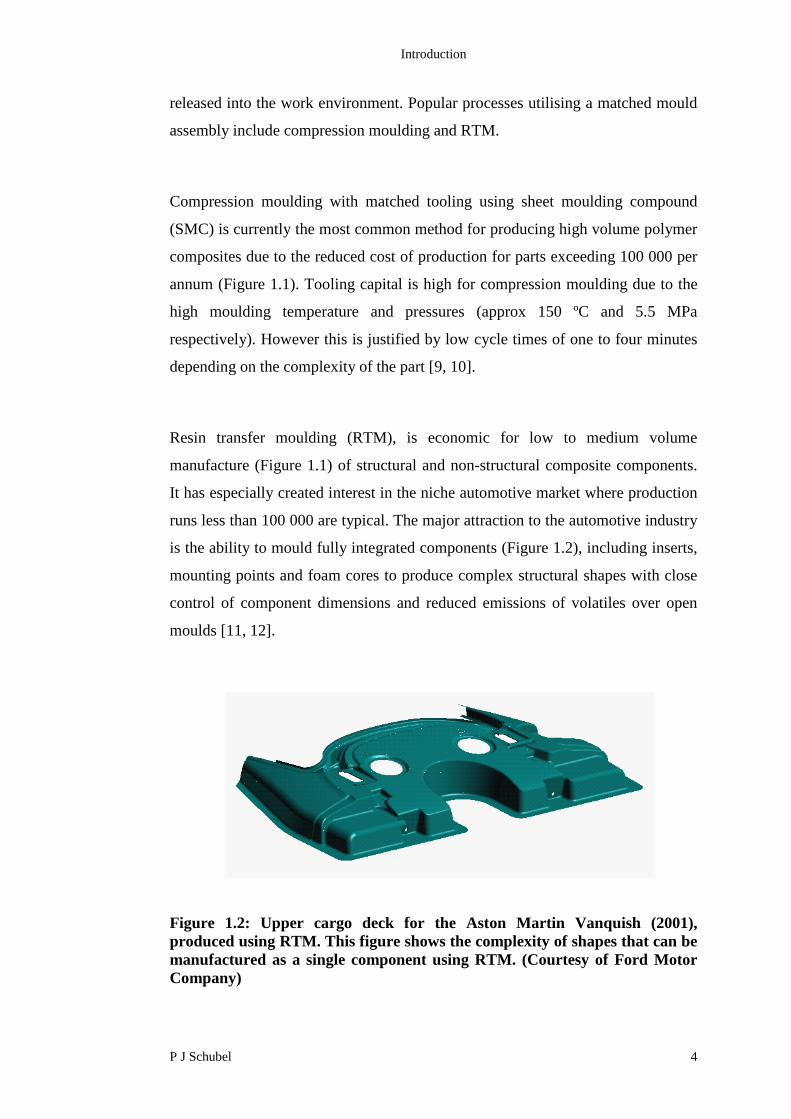
Resin transfer moulding (RTM), is economic for low to medium volume
manufacture (Figure 1.1) of structural and non-structural composite components.
It has especially created interest in the niche automotive market where production
runs less than 100 000 are typical. The major attraction to the automotive industry
is the ability to mould fully integrated components (Figure 1.2), including inserts,
mounting points and foam cores to produce complex structural shapes with close
control of component dimensions and reduced emissions of volatiles over open
moulds [11, 12].
Figure 1.2: Upper cargo deck for the Aston Martin Vanquish (2001),produced using RTM. This figure shows the complexity of shapes that can bemanufactured as a single component using RTM. (Courtesy of Ford MotorCompany)
Introduction
P J Schubel 5
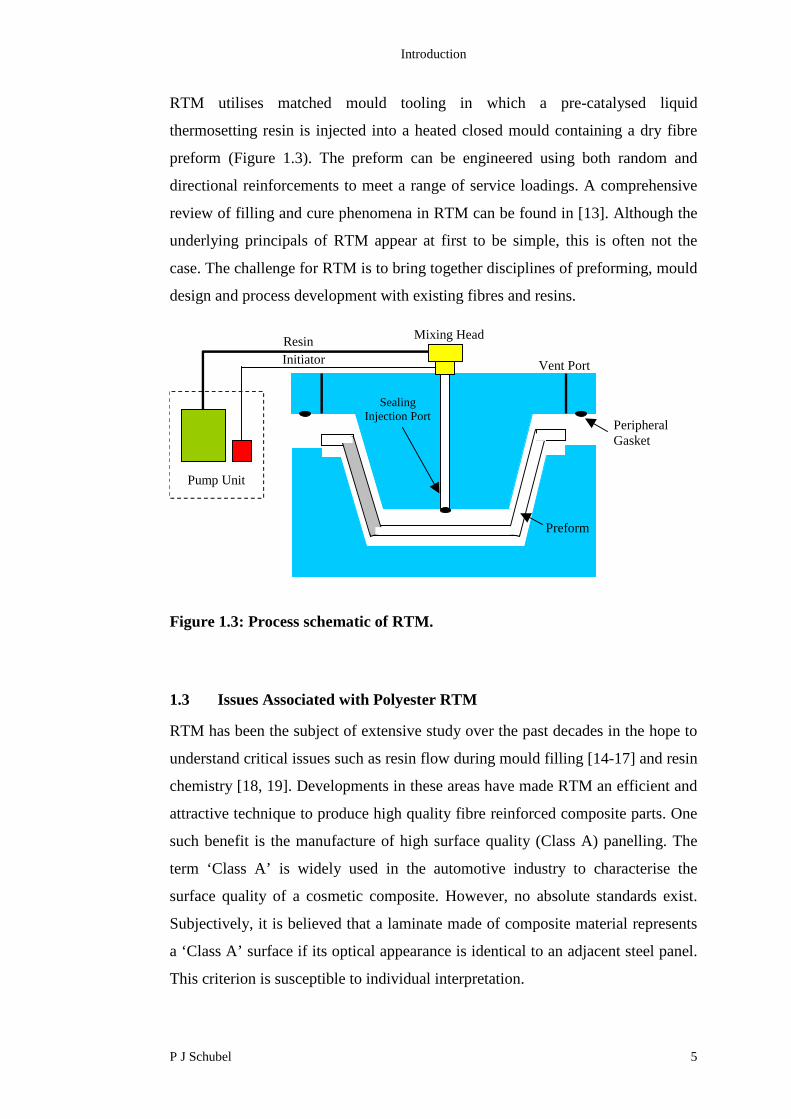
RTM utilises matched mould tooling in which a pre-catalysed liquid
thermosetting resin is injected into a heated closed mould containing a dry fibre
preform (Figure 1.3). The preform can be engineered using both random and
directional reinforcements to meet a range of service loadings. A comprehensive
review of filling and cure phenomena in RTM can be found in [13]. Although the
underlying principals of RTM appear at first to be simple, this is often not the
case. The challenge for RTM is to bring together disciplines of preforming, mould
design and process development with existing fibres and resins.
Figure 1.3: Process schematic of RTM.
1.3 Issues Associated with Polyester RTM
RTM has been the subject of extensive study over the past decades in the hope to
understand critical issues such as resin flow during mould filling [14-17] and resin
chemistry [18, 19]. Developments in these areas have made RTM an efficient and
attractive technique to produce high quality fibre reinforced composite parts. One
such benefit is the manufacture of high surface quality (Class A) panelling. The
term ‘Class A’ is widely used in the automotive industry to characterise the
surface quality of a cosmetic composite. However, no absolute standards exist.
Subjectively, it is believed that a laminate made of composite material represents
a ‘Class A’ surface if its optical appearance is identical to an adjacent steel panel.
This criterion is susceptible to individual interpretation.
Pump Unit
SealingInjection Port
PeripheralGasket
Mixing Head
Initiator
Resin
Preform
Vent Port

Introduction
P J Schubel 6
RTM is adaptable to a range of material types, allowing for flexibility in design,
material properties and component cost. Automotive RTM generally relies upon
low cost resin systems such as unsaturated polyesters. Unsaturated polyesters
account for 11.5 % of the world thermoset resin market, with 2.495 million tonnes
being consumed in 2003 [20, 21]. The strong market share and 3.9 % predicted
annual growth is due to its good mechanical properties, environmental resistance
and most importantly, low cost. They also provide advantages over other
thermosetting resins such as ease of handling, excellent wetting capabilities of
fibre reinforcement and good compatibility to glass fibres, which are one of the
cheapest forms of fibre reinforcement on the market.
Many styles of unsaturated polyester resin are available; including orthophthalic,
isophthalic, terephthalic and bisphenol-fumarate resins [22]. Orthophthalic resins
are the most common and are formed from the condensation reaction between
phthalic anhydride, maleic anhydride, and propylene glycol. The resin is then
diluted with a vinyl monomer, usually styrene, to achieve the desired viscosity
and reactive ratio. The maleic anhydride provides the reactive double bond, which
then reacts with the double bond of the vinyl monomer to form a rigid three-
dimensional network.
Organic peroxides are introduced to initiate the free radical polymerisation
reaction which involves the conversion of double bonds into single covalent
bonds. Chemical decomposition provides exothermic heat for a partial cure. The
initiator can be derived from peroxide compounds that are broken down into free
radicals when subjected to heat or ultraviolet radiation. Most organic peroxides
decompose slowly when added to unsaturated polyester resins and are generally
promoted by using an accelerating system such as a metal oxide (cobalt) or
naphthenate. Several authors have suggested that the type [23-25], amount [25,
26] and cure temperature [27] are critical to the final properties of rigid
thermosets. These curing factors become critical in structural and cosmetic
composites where a balance of properties is required for long-term performance.
Introduction
P J Schubel 7
1.3.1 Cure Induced Resin Shrinkage
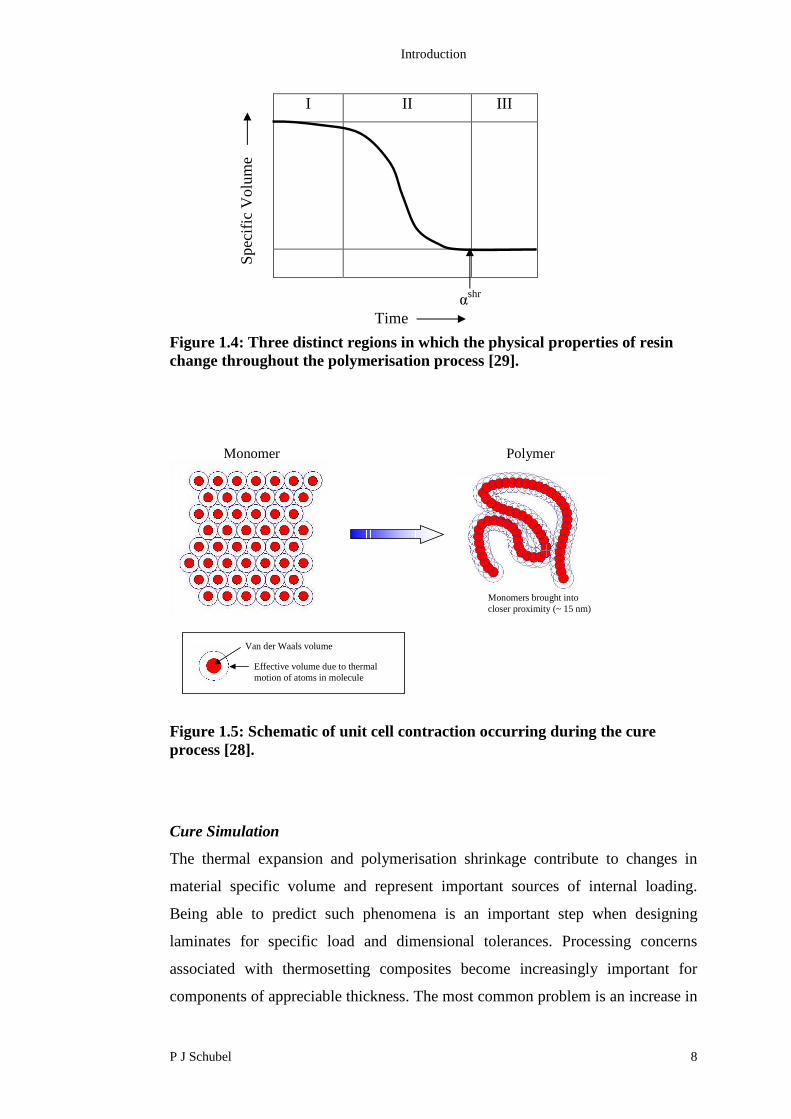
The cure process of a thermosetting resin is commonly described as three distinct
regions (Figure 1.4). In Region I, the resin is uncured and behaves as a viscous
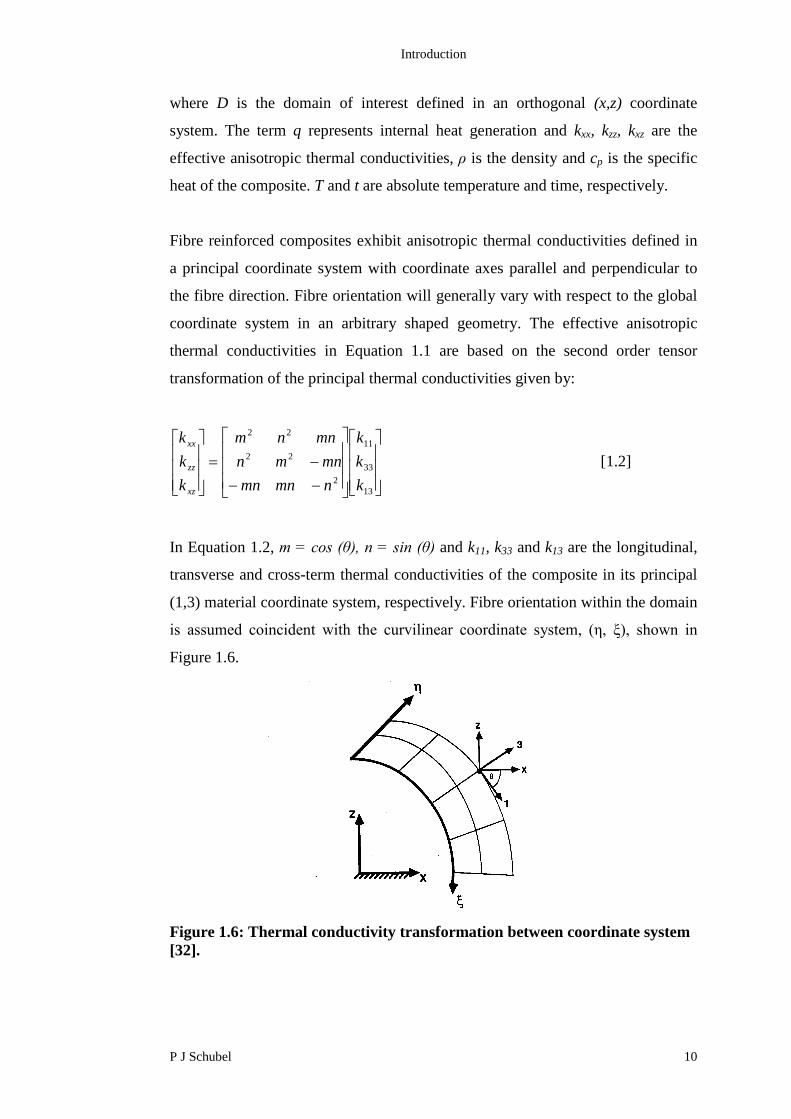
fluid (negligible stiffness). Each monomer molecule can be considered as a
discrete chemical entity occupying a unit volume (Figure 1.5) dictated by its van
der Waals volume (Vw) and thermal energy [28].
Region II denotes the curing stage of the resin, where a significant increase in
stiffness (chemical hardening) and a reduction in specific volume (chemical
shrinkage) begin to occur. In this region the monomer units become joined by
covalent bonds to form repeat units in a polymer chain (Figure 1.5). The
additional bonding means that each polymer unit is more constrained than the
corresponding monomer and has fewer degrees of freedom to store thermal
energy. The reduction of thermal energy means that each polymer unit occupies
less space than it did in the monomeric state. As a result, the density of the
polymer increases in comparison to the monomer. The resin chemical shrinkage is
assumed to occur at the point of resin gelation and is assumed to be completed
once the resin is fully cured or diffusion limitations limit further development
(αshr).
Region III marks the end of the curing process and no further polymerisation
shrinkage occurs. In this region, the resin exhibits viscoelastic behaviour at
elevated temperatures and approaches elastic behaviour at lower temperatures.
Thermal expansion is the only mechanism contributing to changes in specific
volume in Region III.
Introduction
P J Schubel 8
I II III
Figure 1.4: Three distinct regions in which the physical properties of resinchange throughout the polymerisation process [29].
Figure 1.5: Schematic of unit cell contraction occurring during the cureprocess [28].
Cure Simulation
The thermal expansion and polymerisation shrinkage contribute to changes in
material specific volume and represent important sources of internal loading.
Being able to predict such phenomena is an important step when designing
laminates for specific load and dimensional tolerances. Processing concerns
associated with thermosetting composites become increasingly important for
components of appreciable thickness. The most common problem is an increase in
Spec
ific
Volu
me
αshr
Time
Monomer Polymer
Monomers brought intocloser proximity (~ 15 nm)
Van der Waals volume
Effective volume due to thermalmotion of atoms in molecule

Introduction
P J Schubel 9
temperature resulting from the resin exothermic chemical reaction. Significant
effects are also seen with resin systems that exhibit high chemical shrinkage
formed by the process described in Figure 1.5. Processing induced residual
stresses can have a significant effect on the performance of a laminate and can be
high enough to cause cracking within the matrix even before mechanical loading
[30]. This micro-cracking of the matrix can expose the fibres to degradation by
chemical attack [31], with strength being adversely affected since a pre-loading
has been introduced.
Extensive investigations have been centred on understanding the cure kinetics and
associated residual stresses induced in a laminate by thermal and chemical
shrinkage [29-37]. This work has lead to the development of a range of numerical
models which predict cure characteristic of various resin systems and can be used
to accurately predict internal residual stress due to the inherent contraction created
by chemical shrinkage and thermal effects. Analysis of residual stresses in
thermosetting composite laminates are based on thermal expansion mismatch
between adjacent plies, a uniform temperature difference between the cure
temperature and ambient conditions and no stress development prior to
completion of the curing process [33]. This approach is successful in predicting
residual stresses in thin section laminates, where a uniform through-thickness
temperature distribution assumption is justified. However, such an approach is not
appropriate for thick section laminates where complex temperature and degree of
cure gradients develop during the cure process [29].
Various cure simulations have been developed for two-dimensional analysis [32,
34, 35] with the governing equation based on the Fourier and Laplace heat
conduction equation for transient anisotropic heat transfer with constant material
properties and an internal heat generation source term:
t
Tc
z
Tk
zx
Tk
x
Tkq pzzxzxx
2
22
2
2
2 [1.1]
for T(x,z) in D
Introduction
P J Schubel 10
where D is the domain of interest defined in an orthogonal (x,z) coordinate
system. The term q represents internal heat generation and kxx, kzz, kxz are the
effective anisotropic thermal conductivities, ρ is the density and cp is the specific
heat of the composite. T and t are absolute temperature and time, respectively.
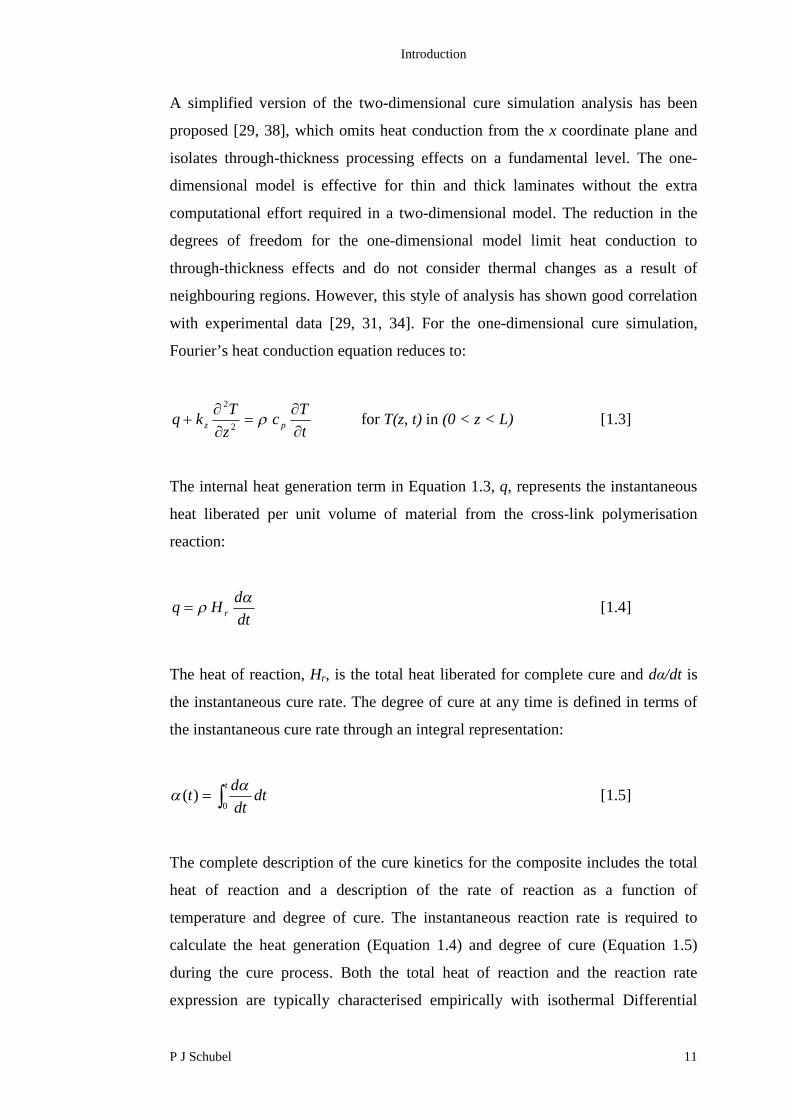
Fibre reinforced composites exhibit anisotropic thermal conductivities defined in
a principal coordinate system with coordinate axes parallel and perpendicular to
the fibre direction. Fibre orientation will generally vary with respect to the global
coordinate system in an arbitrary shaped geometry. The effective anisotropic
thermal conductivities in Equation 1.1 are based on the second order tensor
transformation of the principal thermal conductivities given by:
13
33
11
2
22
22
k
k
k
nmnmn
mnmn
mnnm
k
k
k
xz
zz
xx
[1.2]
In Equation 1.2, m = cos (θ), n = sin (θ) and k11, k33 and k13 are the longitudinal,
transverse and cross-term thermal conductivities of the composite in its principal
(1,3) material coordinate system, respectively. Fibre orientation within the domain
is assumed coincident with the curvilinear coordinate system, (η, ξ), shown in
Figure 1.6.
Figure 1.6: Thermal conductivity transformation between coordinate system[32].
Introduction
P J Schubel 11
A simplified version of the two-dimensional cure simulation analysis has been
proposed [29, 38], which omits heat conduction from the x coordinate plane and
isolates through-thickness processing effects on a fundamental level. The one-
dimensional model is effective for thin and thick laminates without the extra
computational effort required in a two-dimensional model. The reduction in the
degrees of freedom for the one-dimensional model limit heat conduction to
through-thickness effects and do not consider thermal changes as a result of
neighbouring regions. However, this style of analysis has shown good correlation
with experimental data [29, 31, 34]. For the one-dimensional cure simulation,
Fourier’s heat conduction equation reduces to:
t
Tc
z
Tkq pz
2
2
for T(z, t) in (0 < z < L) [1.3]
The internal heat generation term in Equation 1.3, q, represents the instantaneous
heat liberated per unit volume of material from the cross-link polymerisation
reaction:
dt
dHq r
[1.4]
The heat of reaction, Hr, is the total heat liberated for complete cure and dα/dt is
the instantaneous cure rate. The degree of cure at any time is defined in terms of
the instantaneous cure rate through an integral representation:
dtdt
dt
t
0)(
[1.5]
The complete description of the cure kinetics for the composite includes the total
heat of reaction and a description of the rate of reaction as a function of
temperature and degree of cure. The instantaneous reaction rate is required to
calculate the heat generation (Equation 1.4) and degree of cure (Equation 1.5)
during the cure process. Both the total heat of reaction and the reaction rate
expression are typically characterised empirically with isothermal Differential
Introduction
P J Schubel 12
Scanning Calorimetry (DSC). Reaction rate expressions for unsaturated polyester,
vinyl ester and epoxy are different in form due to the inherent differences in the
overall order of the reaction kinetics. Typical reaction rates for various resin types
have been derived and can be found in the following references [29, 33-35, 39].
Cure Dependent Resin Chemical Shrinkage
Chemical resin shrinkage only occurs during the cure process and ceases once
diffusion limitations inhibit further reaction, Region II (Figure 1.4). The
volumetric change of a cubic volume element of dimension l1 by l2 by l3 can be
expressed in terms of its overall dimensions and the finite dimensional changes in
three principal directions, Δl1, Δl2, Δl3, as:
ΔV = l1Δl2l3 + Δ l1l2l3 + Δ l1 Δ l2l3 + l1l2 Δ l3 [1.6]
+ l1 Δ l2 Δ l3 + Δ l1l2 Δ l3 + Δ l1 Δ l2 Δ l3
An associated change in specific volume, Δv, can be defined in terms of the
principal strain components:
Δv =V
V= ε1 + ε2 + ε3 + ε1 ε2 + ε1 ε3 + ε2 ε3 + ε1 ε2 ε3 [1.7]
Assuming a uniform strain contraction for all principal strain components, the
incremental isotropic shrinkage strain, Δεr, of a unit volume element of resin
resulting from an incremental specific volume resin shrinkage, Δvr becomes:
113 rr v [1.8]
The incremental volume resin shrinkage is based on an incremental change in
degree of cure, Δα, and the total specific volume shrinkage of the completely
cured resin, vT, through the following expression:
Δvr = Δα . vT [1.9]

Introduction
P J Schubel 13
Thermal Expansion Strain
Incremental thermal expansion strains are also computed over each time
increment during the cure simulation. They are based on the lamina temperature
increment, ΔT, and the instantaneous effective transverse thermal expansion
coefficient, α1. The incremental transverse strain increment is calculated by:
Δεth = α1 . ΔT [1.10]
This work has led to developments in numerical modelling of the cure kinetics
and associated chemical and thermal expansion strain. The foreseeable next step
in this development is to model the cure kinetics and residual strain to simulate
variations in matrix and reinforcement interactions. Applying this analysis to
simulated fabric weave patterns has the potential for development of surface
roughness prediction. Such a predictive tool would allow detailed studies of the
influence fabric weave style and matrix contraction have on resulting surface
quality.
1.3.2 The use of Low Profile Additives for a Reduction in Resin Shrinkage
To assist in achieving good surface quality and dimensional stability, it is
paramount that the polymerising component does not shrink away from the mould
surface during cure. Standard unsaturated polyester resins shrink between 6 and 9
% [40, 41], which can be reduced, but not eliminated, by the addition of inert
fillers or fibrous reinforcements. The use of low profile additives (LPAs) as
thermoplastic modifiers in unsaturated polyester resin, can substantially reduce
the shrinkage caused by the copolymerisation between unsaturated polyester and
styrene [42, 43]. Other techniques used to address surface quality and shrinkage
related problems include:
In mould coating (gel coat)
Secondary finishing operations
Modification of the moulding process, such as variations to mould
temperature, pressure, initiator type etc.
Introduction
P J Schubel 14
These methods are equipment and or labour intensive and LPA remains a cost
effective alternative for the formation of low shrinkage or zero shrinkage
components.
The function of LPA is to compensate for the thermal and polymerisation
shrinkage of the unsaturated polyester resin. However, the LPA does not
participate in the free radical polymerisation. Several interpretations regarding the
mechanism of volume shrinkage compensation caused by low profile additives
have been proposed [44-50]. However, it is generally agreed that a two phase
structure must be formed between the LPA and crosslinked unsaturated polyester.
Styrene conversion in the initial stage of the reaction causes the LPA to become
insoluble and is precipitated [48, 49]. As the polymerisation process continues, the
temperature and degree of polymerisation increases causing shrinkage of the
unsaturated polyester phase (microgelling). This causes strain relief through
microscopic stress cracking between the two phases. As the polymerisation
process proceeds, the concentration of microgel increases, leading to a macrogel
formation. The increased size of the particles caused by agglomeration causes a
competition for space, which creates microvoids. The elevated temperature causes
volume expansion of the unreacted monomer trapped inside the thermoplastic
shell thereby compensating for polymerisation shrinkage. The coefficients of
thermal expansion of the LPA and unsaturated polyester phases are similar above
the glass transition temperature (Tg). However, once the temperature is below the
Tg, the LPA phase contracts more than the unsaturated polyester, thereby creating
more voids. The subsequent microvoid formation at the interface between the
LPA and the crosslinked unsaturated polyester phase, as well as microstress
cracking formed by contraction of the LPA phase lead to the volumetric shrinkage
compensation [46] (Figure 1.7).
Introduction
P J Schubel 15
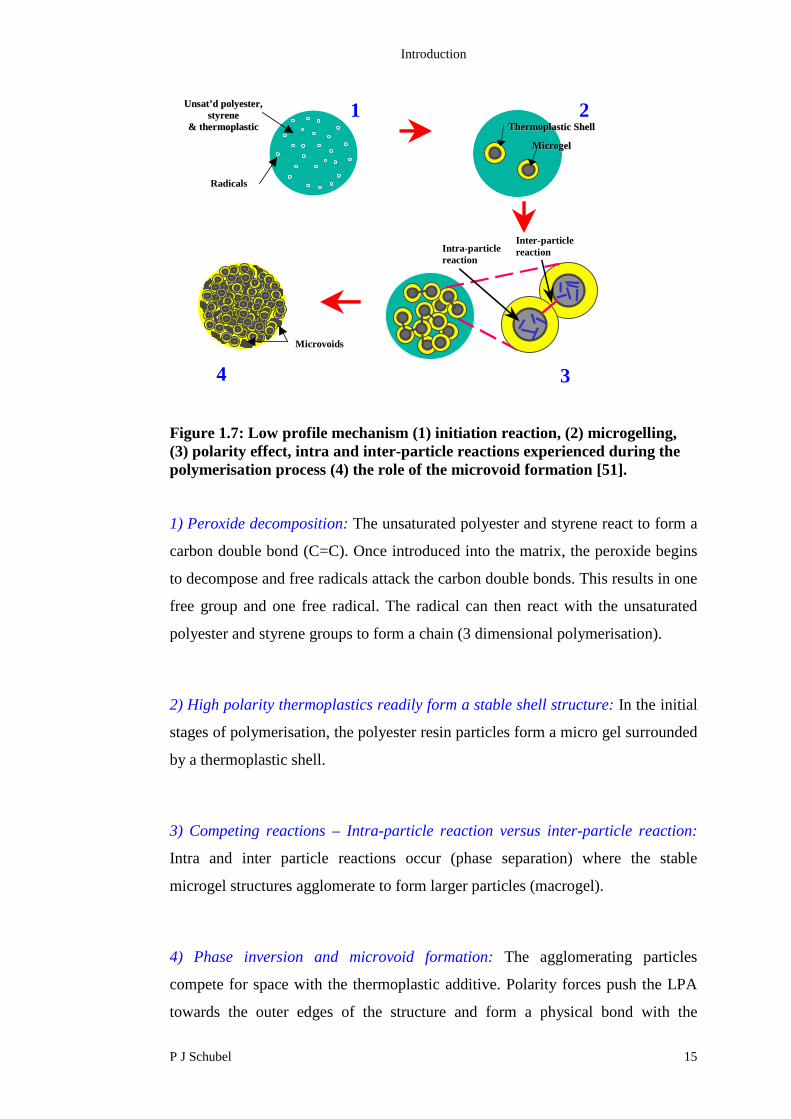
Figure 1.7: Low profile mechanism (1) initiation reaction, (2) microgelling,(3) polarity effect, intra and inter-particle reactions experienced during thepolymerisation process (4) the role of the microvoid formation [51].
1) Peroxide decomposition: The unsaturated polyester and styrene react to form a
carbon double bond (C=C). Once introduced into the matrix, the peroxide begins
to decompose and free radicals attack the carbon double bonds. This results in one
free group and one free radical. The radical can then react with the unsaturated
polyester and styrene groups to form a chain (3 dimensional polymerisation).
2) High polarity thermoplastics readily form a stable shell structure: In the initial
stages of polymerisation, the polyester resin particles form a micro gel surrounded
by a thermoplastic shell.
3) Competing reactions – Intra-particle reaction versus inter-particle reaction:
Intra and inter particle reactions occur (phase separation) where the stable
microgel structures agglomerate to form larger particles (macrogel).
4) Phase inversion and microvoid formation: The agglomerating particles
compete for space with the thermoplastic additive. Polarity forces push the LPA
towards the outer edges of the structure and form a physical bond with the
Intra-particlereaction
Inter-particlereaction
Microvoids
Radicals
UUnnssaatt’’dd ppoollyyeesstteerr,,ssttyyrreennee
&& tthheerrmmooppllaassttiicc
1TThheerrmmooppllaassttiicc SShheellll
MMiiccrrooggeell
2
4 3

Introduction
P J Schubel 16
polymerising particles. Microvoids are formed by two processes; the
agglomeration of particles and polarity of the LPA to the outer surfaces.
Microvoids are not usually seen on the outer edges of the structure due to the high
thermoplastic content.
LPAs are traditionally used in moulding compounds and more recently in RTM
resins. The latter involves generally lower temperatures, which affects the
performance of the LPA as heat drives the thermal expansion mechanism. Several
thermoplastic additives are commercially available; including polystyrene (PS),
polyethylene, poly(vinyl acetate) (PVAc), thermoplastic polyurethane, and
poly(methyl methacrylate) (PMMA). Of these, PVAc, PMMA and PS are
reported to best control volumetric shrinkage [42]. PVAc is miscible with
unsaturated polyester resin and has better compatibility than PMMA.
PVAc has a high viscosity (2.51 Pas), which requires the addition of solvent, such
as styrene, to assist in uniform dispersion within the polyester matrix and to create
a suitable viscosity for injection and fibre wetting purposes. This increases
residual styrene content in the part [52], which has been related to diminished
paint quality and increased volatile organic emissions [52-56]. Residual styrene
also has potential to oxidise and form benzaldehyde [52, 57]. This further adds to
the volatile organic compounds (VOCs) released from a moulded laminate, which
aside from being unpleasant to the human respiratory system, also poses a
potential health risk [6, 58].
Material characterisation, coupled with numerical modelling [46, 59], has
demonstrated the influence LPA has on the cure kinetics of an unsaturated
polyester resin. However, a complete understanding of the influence of LPA on
residual organic volatiles seems to be lacking. The latter is important to efficient
and safe production of low profile laminates. There is also scope for development
of alternative means of shrinkage control in unsaturated polyester resins due to
potential health risks associated with exposure to increased levels of styrene
vapour. Alternative measures such as inert fillers have been employed in the hope

Introduction
P J Schubel 17
of controlling resin shrinkage whilst minimising VOCs [60, 61]. This has met
with limited success as this method only acts as a reactive mass diluent and serves
to reduce the mechanical properties of the moulded laminate. Other avenues have
been explored here, in particular the use of high aspect ratio silicates which form a
nanocomposite structure. The reports of resin immobilisation around the interface
of the silicate platelets [62] warrants further investigation into its potential for
shrinkage control.
1.4 Theme of this work
The work presented has formed part of a DTI and DfT funded research project
entitled ‘Affordable Lightweight Body Structures’ (ALBOS). Several publications
have been produced from this project (listed in Appendix 1). The project was
concerned with developing a low cost process for the manufacture of body skins
for the automotive industry with high specific structural properties, acceptable
cosmetic surface finish and low component cost. The process utilised a
proprietary preforming process and impregnation using RTM.
The aim of this thesis was to address problems associated with surface quality
measurement and residual volatiles for cosmetic automotive laminates based on
low profile unsaturated polyester resin. An initial study into the levelling effects
of paint on a laminate surface was conducted to determine the masking
capabilities of a coating process. Three surface analysis techniques were then
validated for measuring surface quality of bare and painted laminates and
compared to industrial standards.
A variety of process conditions and formulation variables were assessed for cure
efficiency and volatile organic compound emission of unsaturated polyester
impregnated laminates produced using RTM. Thermal desorption and solvent
elution techniques were used for the detection of residual volatiles with styrene
and benzaldehyde being the main focus. Key areas were identified for
optimisation of low profile resin processing which highlight the need for

Introduction
P J Schubel 18
alternative shrinkage control methods. A novel approach using nanoscale silicate
clay was investigated to reduce resin shrinkage within styrene based unsaturated
polyester resin. A suitable exfoliation process was established with investigations
into volumetric shrinkage, glass transition temperature and mechanical properties
of the resulting nanocomposite. This work lead to the study of a series of hybrid
matrices consisting of nanocomposite and low profile additive blends. The
evaluation techniques developed for surface characterisation, residual volatile
detection and mechanical performance were used to demonstrate the effectiveness
of the hybrid matrix in producing a cosmetic laminate.
References are included at the end of each chapter.
1.5 References
1. Trewin, E., The advanced composites industry - Global markets,technology trends and applications 2002-2007. 2003: MaterialsTechnology Publications. p. 290.
2. Benjamin, B. and Red, C., Advanced composites global outlook for 2003,in Composites fabrication. 2003. p. 26.
3. Mc Williams, A., Nanotechnology: A realistic market evaluation. 2004,Business Communications Company, Inc.: Connecticut. p. 146.
4. Rudd, C.D., Long, A., Kendall, K., and Mangin, C., Liquid mouldingtechnologies. 1997, Cambridge: Woodhead publishing limited.
5. Ragondet, A., Experimental characterisation and modelling of the vacuuminfusion process, in Mech. Eng., PhD Thesis. 2004, University ofNottingham: Nottingham. p. 180.
6. Groth-Marnat, G., Neuropsychological effects of styrene exposure: areview of current literature. Journal of Perceptual and Motor Skills, 1993.77: p. 1139-1149.
7. Cao, X. and Lee, J., Control of shrinkage and residual styrene ofunsaturated polyester resins cured at low temperatures: I Effects of curingagents. Polymer, 2003. 44: p. 1893-1902.
8. Warrior, N., Harper, L., Turner, T., Schubel, P., Rudd, C., and Kendall, K.Affordable Lightweight Body Structures (ALBOS) Dti/DfT ForesightVehicle Programme. in JSAE Japan Society of Automotive EngineersAnnual Congress. 2004. Yokohama: Paper No. 20045470.
9. Castro, J.M. and Griffith, R., Handbook of engineering polymericmaterials / edited by Cheremisinoff, N.P. 1997: New York. p. 84.
10. Technology update: compression moulding, in Reinforced Plastics. 2003,Elsevier Science. p. 20-21.
11. Pantelelis, N.G., Optimised cure cycles for resin transfer moulding.Composites Science and Technology, 2003. 63: p. 249-264.

Introduction
P J Schubel 19
12. Thagard, J.R., Okoli, O.I., Liang, Z., Wang, H.P., and Zhang, C., Resininfusion between double flexible tooling: prototype development.Composites: Part A, 2003. 34: p. 803-811.
13. Kendall, K.N. and Rudd, C.D., Flow and cure phenomena in liquidcomposite moulding. Polymer Composites, 1994. 15(5): p. 334-348.
14. Shojaei, A., Ghaffarian, S.R., and Katrimian, S.M.H., Simulation of thethree-dimensional non-isothermal mold filling process in resin transfermolding. Composite Science and Technology, 2003. 63: p. 1931-1948.
15. Bechet, E., Ruiz, E., Trochu, F., and Cuilliere, J., Adaptive meshgeneration for mould filling problems in resin transfer moulding.Composites: Part A, 2003. 34: p. 813-834.
16. Mathur, R., Fink, B.K., and Advani, S.G., Use of genetic algorithms tooptimize gate and vent locations for resin transfer molding process.Polymer Composite, 1999. 20(4): p. 224-236.
17. Spoerre, J., Zhang, C., Wang, H.P., and Parnas, R., Integrated product andprocess design for resin transfer molded parts. Journal of CompositeMaterials, 1998. 32(13): p. 35-45.
18. Cheung, A. and Pochiraju, K., Three-dimensional finite element simulationof curing of polymer composites. Finite Element Analysis and Design,2004. 40: p. 895-912.
19. Rouison, D., Sain, M., and Couturier, M., Resin transfer moulding ofnatural fiber reinforced composites: cure simulation. Composites Scienceand Technology, 2004. 64: p. 629-644.
20. Starr, T.F., Composites: A profile of the worldwide reinforced plasticsindustry, markets and suppliers to 2005. 2003, Elsevier Science. p. 120.
21. Forsdyke, K.L. and Starr, T.F., Thermoset resins market report. 2002,RAPRA. p. 124.http://www.netcomposites.com/netcommerce_features.asp?715.
22. Peters, S.T., Handbook of composites. Vol. 2. 1998, London: Chapman &Hall.
23. Tawfik, S.Y., Asaad, J.N., and Sabaa, M.W., Effects of polyester backbonestructure on the cured products properties. Polymer Testing, 2003. 22: p.747-759.
24. Rot, K., Huskic, M., Makarovic, M., Ljubic Mlakar, T., and Zigon, M.,Interfacial effects in glass fibre composites as a function of unsaturatedpolyester resin composition. Composites: Part A, 2001. 32: p. 511-516.
25. Huang, Y.-J. and Leu, J.-S., Curing of unsaturated polyester resin. Effectsof temperature and initiator: 1. Low temperature reactions. Polymer,1993. 34(2): p. 295-304.
26. Caba, K., Guerrero, P., Eceiza, A., and Mondragon, I., Kinetic andrheological studies of an unsaturated polyester cured with differentcatalyst amounts. Polymer, 1996. 37(2): p. 275-280.
27. Segovia, F., Ferrer, C., Salvador, M.D., and Amigo, V., Influence ofprocessing variables on mechanical characteristics of sunlight agedpolyester-glass fibre composites. Polymer Degradation and Stability, 2001.71: p. 179-184.
28. Tilbrook, D.A., Pearson, G.J., Braden, M., and Coveney, P.V., Predictionof polymerization shrinkage using molecular modeling. Journal ofPolymer Science: Part B: Polymer Physics, 2003. 41: p. 528-548.
Introduction
P J Schubel 20
29. Bogetti, T.A. and Gillespie, J.W., Process-induced stress and deformationin thick-section thermoset composite laminates. Journal of CompositeMaterials, 1992. 26(5): p. 626-659.
30. Stone, M.A., Schwartz, I.F., and Chandler, H.D., Residual stressesassociated with post-cure shrinkage in GRP tubes. Composites Scienceand Technology, 1997. 57: p. 47-54.
31. White, S.R. and Hahn, H.T., Process modeling of composite materials:Residual stress development during cure. Part II. Experimental validation.Journal of Composite Materials, 1992. 26(16): p. 2423-2453.
32. Bogetti, T.A. and Gillespie, J.W., Two-dimensional cure simulation ofthick thermosetting composites. Journal of Composite Materials, 1991. 25:p. 239-273.
33. White, S.R. and Hahn, H.T., Process modeling of composite materials:Residual stress development during cure. Part . Model formulation.Journal of Composite Materials, 1992. 26(16): p. 2403-2421.
34. Lee, S.-Y. and Springer, G.S., Filament winding cylinders: Process ModelI. Journal of Composite Materials, 1990. 24: p. 1270-1298.
35. Springer, G.S. A model of the curing process of epoxy matrix composites.in ICCM-4. 1982. Tokyo.
36. Schapery, R.A., Thermal expansion coefficients of composite materialsbased on energy principles. Journal of Composite Materials, 1968. 2(3): p.380-404.
37. Fahmy, A.A. and Ragai-Ellozy, A.N., Thermal expansion of laminatedfiber composites in the thickness direction. Journal of CompositeMaterials, 1974. 8: p. 90-92.
38. Loos, A.C. and Springer, G.S., Curing of epoxy matrix composites. Journalof Composite Materials, 1983. 17: p. 135-169.
39. Yun, Y.-M., Lee, S.-J., Lee, K.-j., Lee, Y.-K., and Nam, J.-D., Compositecure kinetic analysis of unsaturated polyester free radical polymerisation.Journal of Polymer Science, 1997. 35: p. 2447-2456.
40. Murphy, J., The reinforced plastics handbook (2nd edition). ElsevierScience, 1998: p. 34.
41. Reddy, J., Mechanics of composite materials and structures. 1998, Boston:Kluwer Academic Publishers. 312.
42. Huang, Y.-J. and Liang, C.-M., Volume shrinkage characteristics in thecure of low-shrink unsaturated polyester resins. Polymer, 1996. 37(3): p.401-412.
43. Kinkelaar, M., Muzumdar, S., and Lee, L.J., Dilatometric study of lowprofile unsaturated polyester resins. Polymer Engineering Science, 1995.35(10): p. 823-836.
44. Kinkelaar, M. and Lee, L.J., Development of a dilatometer and itsapplication to low-shrink unsaturated polyester resins. Journal of AppliedPolymer Science, 1992. 45: p. 37-50.
45. Atkins, K.E. and Rex, G.C. The low profile effect, morphology andinternal pigmentation, Part II. in 48th Annual Conference, CompositesInstitute, The Society of the Plastics Industry. 1993. Session 6-D.
46. Huang, Y.-J. and Su, C.C., Effects of poly(vinyl acetate) and poly(methylmethacrylate) low-profile additives on the curing of unsaturated polyesterresins. I. Curing Kintetics by DSC and FTIR. Journal of Applied PolymerScience, 1995. 55: p. 305-322.

Introduction
P J Schubel 21
47. Kinkelaar, M., Wang, B., and Lee, L.J., Shrinkage behaviour of low-profile unsaturated polyester resins. Polymer, 1994. 35(14): p. 3011-3022.
48. Hsu, C.P. and Lee, L.J., Structure formation during the copolymerizationof styrene and unsaturated polyester resin. Polymer, 1991. 32(12): p.2263-2271.
49. Bucknall, C.B., Partridge, I.V., and Phillips, M.J., Mechanism of shrinkagecontrol in polyester resins containing low-profile additives. Polymer,1991. 32(4): p. 636-640.
50. Bartkus, E.J. and Kroekel, C.H., Low shrink reinforced polyester systems.Applied Polymer Symposium, 1970. 15: p. 113-135.
51. Montagne, M., The low profile effect, morphology and internalpigmentation. Dow Chemicals, 2001(www.dow.com/info/poly/lp/e34).
52. Reijnders, H., The influence of cure systems on the formation of volatilecomponents in RTM processed UP articles. 2001(www.akzonobel.de/).
53. Rodriguez, E.L., Residual styrene monomer in cured unsaturated polyesterresins. Polymer Materials Science Engineering, 1988. 58: p. 575-580.
54. Cao, X. and Lee, L.J., Control of volume shrinkage and residual styrene ofunsaturated polyester resins cured at low temperatures. II Effects ofcomonomer. Polymer, 2003. 44: p. 1507-1516.
55. Forrest, M.J., Jolly, A.M., Holding, S.R., and Richards, S.J., Emissionsfrom processing thermoplastics. Annals of Occupational Hygiene, 1995.39(1): p. 35-53.
56. Yang, X., Measurement of residual styrene content in unsaturatedpolyester resin by gas chromatography. Huaxue Shijie, 1993. 34(5): p.220-223.
57. Weir, N.A. and Ceccarelli, A., Photodecomposition of polystyrenehydroperoxide: Part I - reactions in dilute solution. Polymer Degradationand Stability, 1993. 41(1): p. 37-44.
58. Russo, J., Chung, S., Contreras, K., Lian, B., Lorenz, J., Stevens, D., andTrousdell, W., Identification of 4-(N,N-Dipropylamino) benzaldehyde as apotential reversible inhibitor of mouse and human class I aldehydedehyrdogenase. Biochemical Pharmacology, 1995. 50(3): p. 399-406.
59. Boyard, N., Vayer, M., Sinturel, C., Erre, R., and Delaunay, D., Analysisand modeling of PVTX diagram of an unsaturated polyester resin,thermoplastic additive, and mineral fillers blend. Journal of AppliedPolymer Science, 2003. 88: p. 1258-1267.
60. Lucas, J.C., Borrajo, J., and Williams, R.J., Cure of unsaturated polyesterresins: 2. Influence of low-profile additives and fillers on thepolymerization reaction, mechanical properties and surface rugosities.Polymer, 1993. 34(9): p. 1886-1890.
61. Pietrzak, M. and Szalinska, H., Reducing the resin shrinkage and settingdose in polyester resins by addition of metal oxides. Radiation Physics andChemistry, 1984. 23(4): p. 409-411.
62. Tsagaropoulos, G. and Eisenberg, A., Dynamic mechanical study of thefactors affecting the two glass transition behavior of filled polymers.Similarities and differences with random ionomers. Macromolecules,1995. 28: p. 6067-6077.
Surface Characterisation of Cosmetic Polymer Composites
P J Schubel 22
2 Surface Characterisation of Cosmetic Polymer Composites
2.1 Introduction
The term ‘Class A’ has been widely used as a colloquial classification of cosmetic
surface quality for automotive exterior body panels. However, type segment,
market and brand all influence the definition for a ‘Class A’ standard [1]. A
cosmetic polymer composite must compete with existing materials, such as
processed sheet steel and aluminium alloys, which have been refined over the past
century to form cost efficient, cosmetic structures. Traditional materials and
polymer composites exhibit surface characteristics which are induced by material
type and or moulding process. These characteristics are either masked or
emphasised by a painting process, depending upon the severity and nature of the
feature and the gloss of the paint finish.
This chapter seeks to determine the relationship between pre and post-coated
surface characteristics for polymer composites. A review of methods for surface
characterisation was conducted to determine suitable measurement techniques.
The influence of tool surface roughness, tow size and resin shrinkage was also
investigated.
2.2 Issues Associated with Coated Polymer Composite Surfaces
Like all processed materials, polymer composites potentially exhibit a range of
surface characteristics, which can be attributed to manufacturing, the application
of coatings or to a combination of these factors (Figure 2.1). Repetitive features
that occur due to the structure of a material or arising from a manufacturing
process are amongst the most common defects seen. Fibre composites are
susceptible to mould surface effects and the fabric architecture visibility (fibre
strike-through). Reproduction of the tooling surface is normal for polymer
mouldings due to the low viscosity of the resin. Tool surface conditioning through
milling or grinding processes contribute to the repetitive surface defects on the
moulded article. Significant improvements in surface characteristics have been
Surface Characterisation of Cosmetic Polymer Composites
P J Schubel 23
observed when processing with polished tool surfaces (Ra = 0.25 µm) as opposed
to ground flat tools (Ra = 0.63 µm) [2]. Consolidation pressure has also been
found to influence the reproduction of the tool surface roughness [2, 3].
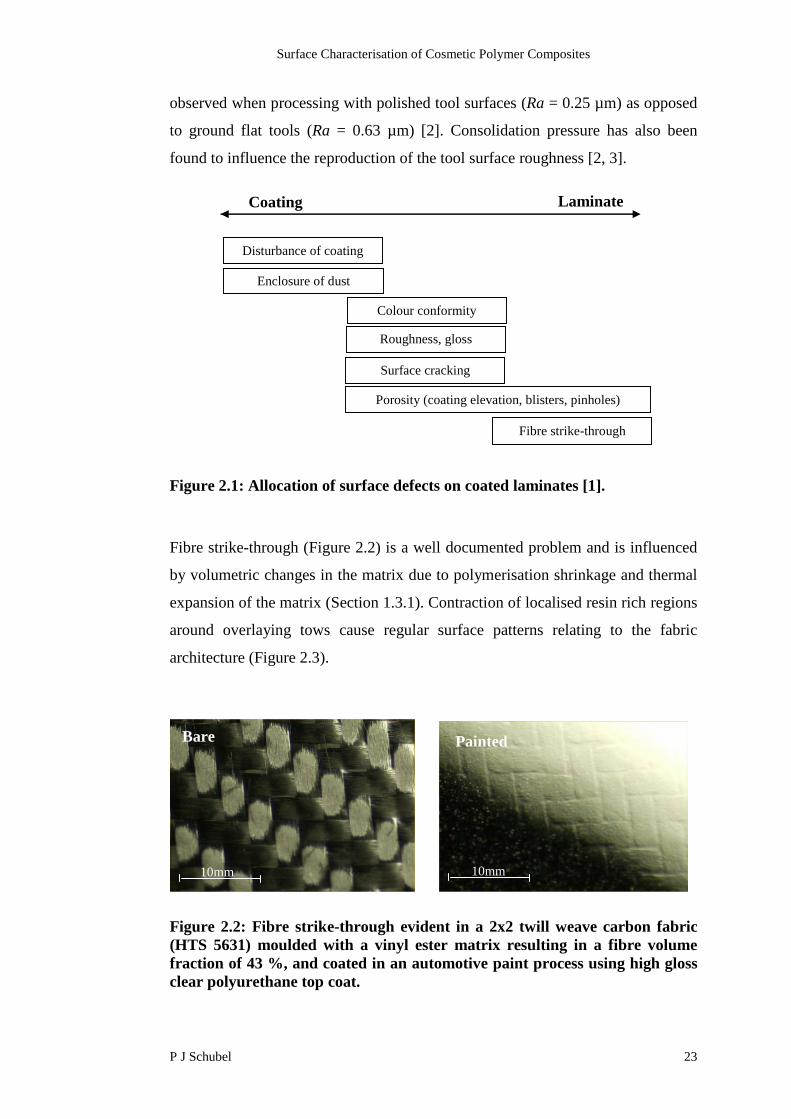
Figure 2.1: Allocation of surface defects on coated laminates [1].
Fibre strike-through (Figure 2.2) is a well documented problem and is influenced
by volumetric changes in the matrix due to polymerisation shrinkage and thermal
expansion of the matrix (Section 1.3.1). Contraction of localised resin rich regions
around overlaying tows cause regular surface patterns relating to the fabric
architecture (Figure 2.3).
Figure 2.2: Fibre strike-through evident in a 2x2 twill weave carbon fabric(HTS 5631) moulded with a vinyl ester matrix resulting in a fibre volumefraction of 43 %, and coated in an automotive paint process using high glossclear polyurethane top coat.
Disturbance of coating
Enclosure of dust
Colour conformity
Porosity (coating elevation, blisters, pinholes)
Fibre strike-through
Surface cracking
Roughness, gloss
Coating Laminate
10mm 10mm
Bare Painted

Surface Characterisation of Cosmetic Polymer Composites
P J Schubel 24
Figure 2.3: Schematic drawing of a woven laminate illustrating the fibrestrike-through phenomenon for a thermosetting matrix.
Porosity is a common manufacturing induced defect in composites. Voids are
formed primarily due to air entrapment in resin rich regions, moisture absorption
and volatile release [4, 5]. Surface voids cause pinholes after painting (Figure
2.4). A pinhole is formed due to a discontinuity in wet or dry film, resulting from
the failure of liquid film former to wet a pinpoint area [6]. Stoving during paint
curing may also promote pinhole formation [1]. Surface air entrapment can also
cause an elevation of the coating or destroy the coating layer due to the expansion
of the entrapped air- blistering.
Figure 2.4: The formation of a pinhole on a painted laminate due to a surfacevoid created during moulding. This picture is of the same area of a laminate,pre and post-painting, moulded using 2x2 twill weave carbon fabric andepoxy resin in an RTM process.
PinholeSurface Void10mm10mm
Bare Painted
Overlayingtows
Laminatesurface
Resin-richarea: highCLTE,chemical resinshrinkage
Fibre–richarea: lowCLTE
Incident light

Surface Characterisation of Cosmetic Polymer Composites
P J Schubel 25
Dimensional distortion may be observed due to matrix shrinkage and this is
amplified by asymmetry in the part geometry or the ply lay-up. [7-12]. This
characteristic not only influences surface quality but also affects dimensional
control. Longwave (λ > 10 mm) characteristics are immediately obvious to the
naked eye and generally require major rework to form a satisfactory body skin
[13].
2.3 Methods for Measuring Surface Quality
Surface quality measurements and specifications impact many automotive
products but particularly bearing surfaces and cosmetic components. Each surface
has a specific characteristic and functionality with some proving difficult to
estimate and quantitatively measure. Hence, a wide range of measurement
techniques and statistical methods for topographic analysis has evolved. Surface
irregularities can usually be classified into three categories, as illustrated in Figure
2.5:
Roughness: irregularities less than 0.8 mm in amplitude.
Short term waviness: surface characteristics less than 1mm in
amplitude and 3 mm in wavelength.
Long term waviness: shape deviations or undulations affecting large-
scale flatness, generally having a wavelength greater than 10 mm.

Surface Characterisation of Cosmetic Polymer Composites
P J Schubel 26
Figure 2.5: Resultant surface profile broken into the 3 main elements:roughness, short-term waviness and long-term waviness.
2.3.1 Surface Roughness
Roughness is a primary measure for surface quality and is extensively used to
characterise engineering components. Measurements are made by passing a stylus
tip or laser over a surface. The resulting roughness profile is derived from a
primary profile by suppressing the longwave component using a profile filter [14].
A filter normalises the primary profile within set boundary conditions to eliminate
the waviness component. Statistical manipulation of the amplitude and spacing for
each point generates numerous surface characterisations [14]. Surface roughness
can be characterised by three general parameters:
Amplitude: measure of the vertical characteristics of the surface
deviations with respect to the mean line.
Spacing: measures of the horizontal characteristics of the surface
deviation with respect to the mean line.
Hybrid: combination of amplitude and spacing parameters.
Roughness can be characterised by ‘R’, which is the average depth of the
characteristic features [15]. A range of roughness parameters [16] are used.
Resultant Surface Profile
Long term Waviness
Roughness Profile
Short term Waviness
0 10mm
10mm
10mm
10mm
0
0
0
Surface Characterisation of Cosmetic Polymer Composites
P J Schubel 27
However, not all are applicable to cosmetic composite surfaces due to their
localised representation or hybrid spacing analysis. The literature suggests that,
potentially, seven parameters are suited to characterisation of polymer composite
laminates [1-3, 15, 17]:
Ra: the arithmetic mean of the departures from the roughness profile
line.
Rz: the average height difference between the five highest peaks and
five lowest valleys.
Rt: the sum of the height between the highest peak and lowest valley
from the mean line.
Peak count (Pc): the number of peak and valley pair cycles per
centimetre along the profile length.
Peak height (Rp): the maximum value of the profile deviations from
the mean line.
Skewness (Rsk): the degree of bias either in the positive or negative
direction from the mean line.
Kurtosis (Rku): the degree of concentration around the mean line of a
roughness profile.
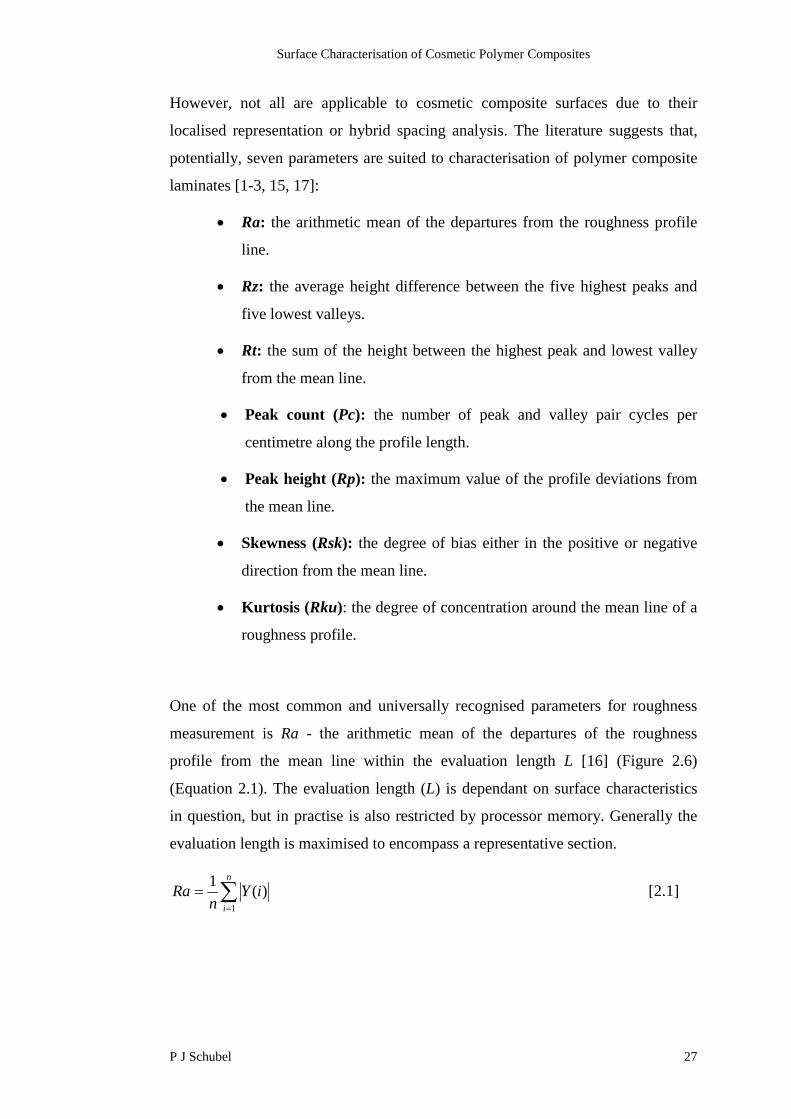
One of the most common and universally recognised parameters for roughness
measurement is Ra - the arithmetic mean of the departures of the roughness
profile from the mean line within the evaluation length L [16] (Figure 2.6)
(Equation 2.1). The evaluation length (L) is dependant on surface characteristics
in question, but in practise is also restricted by processor memory. Generally the
evaluation length is maximised to encompass a representative section.
n
i
iYn
Ra1
)(1
[2.1]
Surface Characterisation of Cosmetic Polymer Composites
P J Schubel 28
Figure 2.6: A roughness profile showing superimposed peaks for calculationof Ra.
Ra is the most widely used parameter for measuring polymer composite surface
quality. It is simple, widely understood and allows cross-referencing of results
with existing metallic and non-metallic materials. However, there is no reported
use of Ra for measuring paint surface quality. Literature has suggested that the
effects of paint are best measured by surface mapping or utilising wavelength
parameters [1, 13, 18].
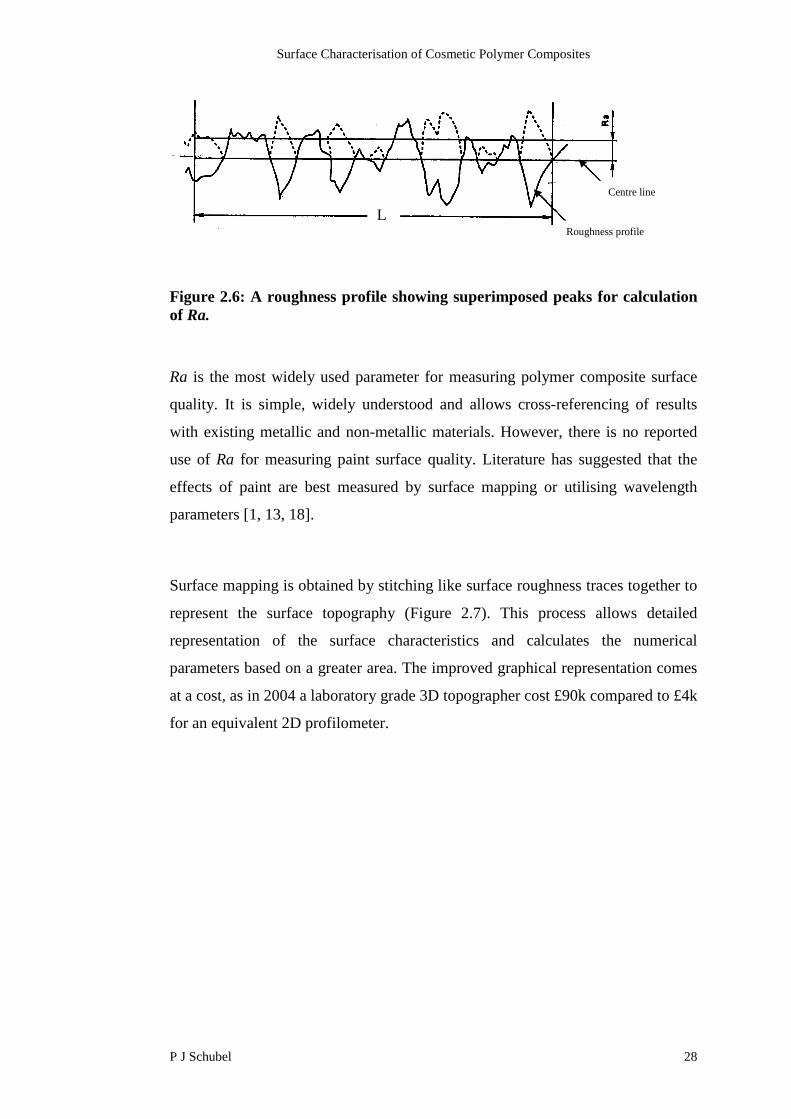
Surface mapping is obtained by stitching like surface roughness traces together to
represent the surface topography (Figure 2.7). This process allows detailed
representation of the surface characteristics and calculates the numerical
parameters based on a greater area. The improved graphical representation comes
at a cost, as in 2004 a laboratory grade 3D topographer cost £90k compared to £4k
for an equivalent 2D profilometer.
LRoughness profile
Centre line
Surface Characterisation of Cosmetic Polymer Composites
P J Schubel 29
Figure 2.7: 3D stylus topography created by stitching 2D fields which showsextensive detail of the surface characteristics. The image is of a 3k, 2x2 twillcarbon fabric with a vinyl ester matrix produced using RTM. (Courtesy ofFord Motor Company).
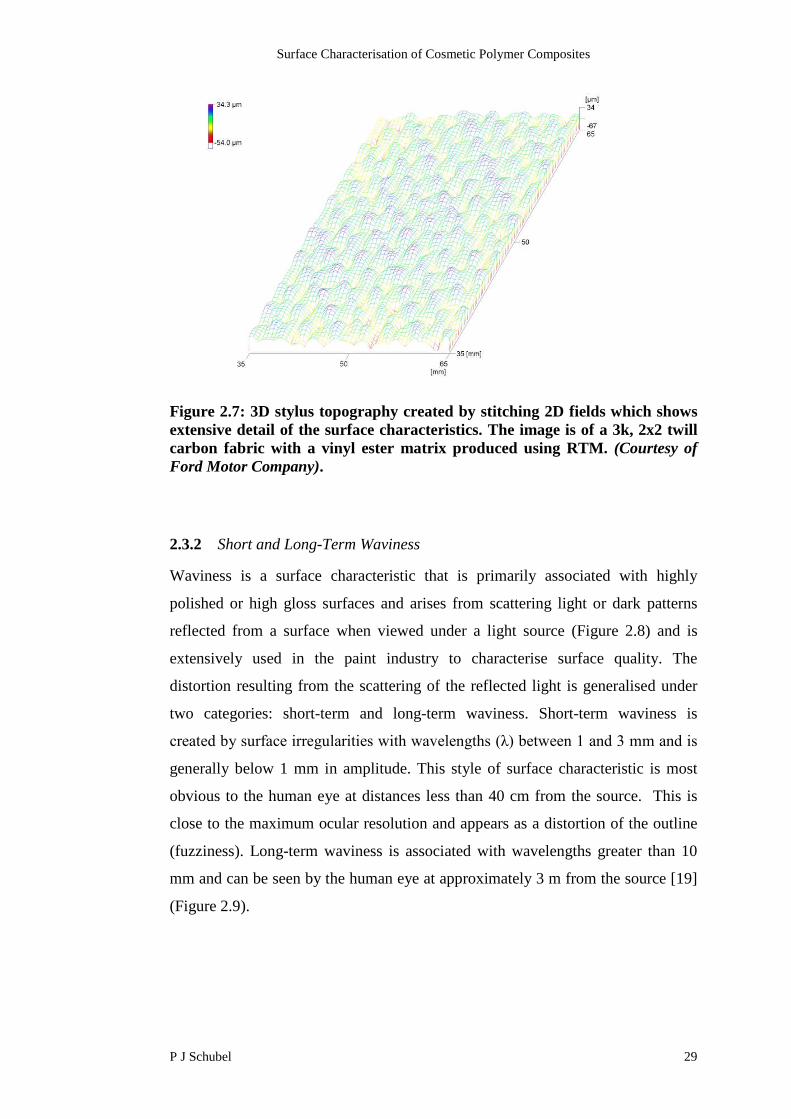
2.3.2 Short and Long-Term Waviness
Waviness is a surface characteristic that is primarily associated with highly
polished or high gloss surfaces and arises from scattering light or dark patterns
reflected from a surface when viewed under a light source (Figure 2.8) and is
extensively used in the paint industry to characterise surface quality. The
distortion resulting from the scattering of the reflected light is generalised under
two categories: short-term and long-term waviness. Short-term waviness is
created by surface irregularities with wavelengths (λ) between 1 and 3 mm and is
generally below 1 mm in amplitude. This style of surface characteristic is most
obvious to the human eye at distances less than 40 cm from the source. This is
close to the maximum ocular resolution and appears as a distortion of the outline
(fuzziness). Long-term waviness is associated with wavelengths greater than 10
mm and can be seen by the human eye at approximately 3 m from the source [19]
(Figure 2.9).

Surface Characterisation of Cosmetic Polymer Composites
P J Schubel 30
Figure 2.8: Schematic representation of the reflected light patterns seen fromand undulating surface.
Figure 2.9: The two types of waviness seen by the human eye: (a) short termwaviness (λ ≤ 1mm), (b) long term waviness (λ ≥ 10mm). The two laminates were painted with a high gloss dark base and photographed under aflorescent light.
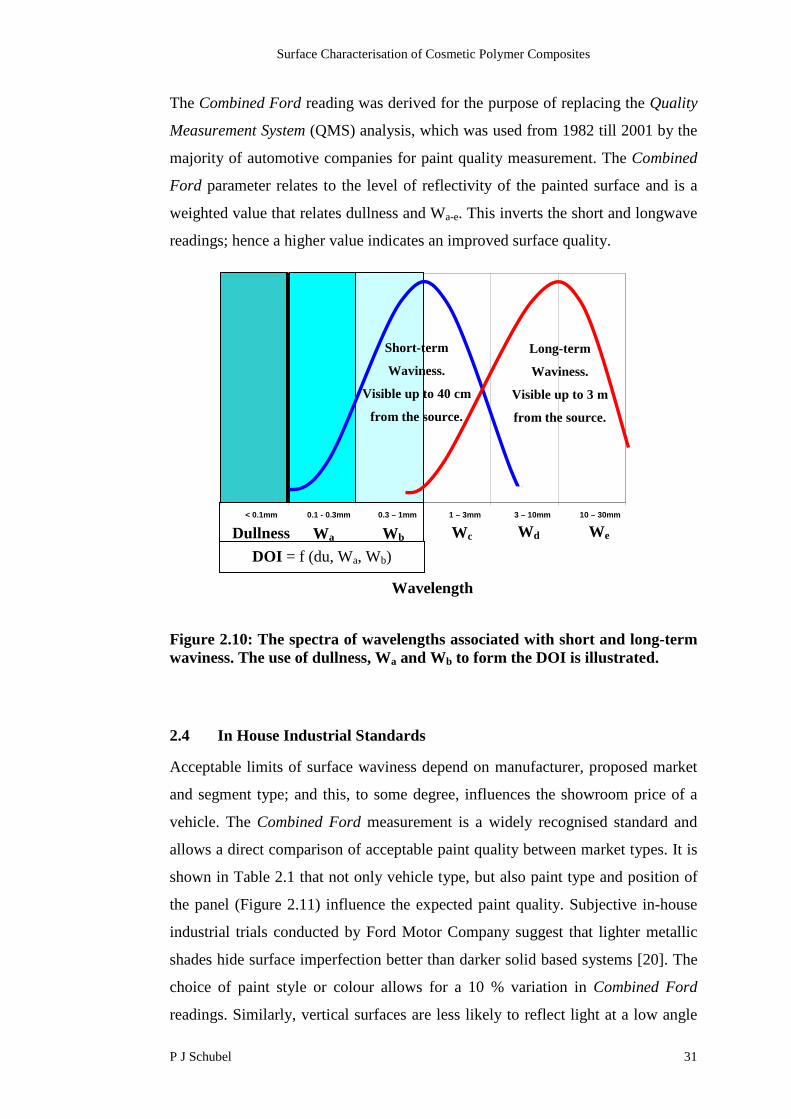
Short and long-term waviness are further divided into five wavelength categories
labelled Wa-e, which span the visible spectrum (Figure 2.10). This is used to
define the spectrum in which both short and long-term waviness lie. Figure 2.10
illustrates that each is associated with wavelengths approximately between 0.3 to
1.2 mm and 3 to 30 mm respectively. In addition to the visible spectrum (Wa-e), a
non-visible wavelength (dullness) is used to assess the sharpness of the image.
Image sharpness is produced by a reduction in contrast due to light scattering by
surface structures below 0.1 mm wavelength. Surface analysis techniques utilise a
combination of the six spectra (Dullness, Wa-e) to create hybrid wavelength
parameters used for characterising the surface structure. Two commonly used
systems include Distinctness of Image (DOI) [13] and Combined Ford (CF) [20].
(b)(a)
Wavy light/ darkpattern
Light source
Reflectedlight
Undulating surface
Viewpoint
10mm 10mm
Surface Characterisation of Cosmetic Polymer Composites
P J Schubel 31
The Combined Ford reading was derived for the purpose of replacing the Quality
Measurement System (QMS) analysis, which was used from 1982 till 2001 by the
majority of automotive companies for paint quality measurement. The Combined
Ford parameter relates to the level of reflectivity of the painted surface and is a
weighted value that relates dullness and Wa-e. This inverts the short and longwave
readings; hence a higher value indicates an improved surface quality.
Figure 2.10: The spectra of wavelengths associated with short and long-termwaviness. The use of dullness, Wa and Wb to form the DOI is illustrated.
2.4 In House Industrial Standards
Acceptable limits of surface waviness depend on manufacturer, proposed market
and segment type; and this, to some degree, influences the showroom price of a
vehicle. The Combined Ford measurement is a widely recognised standard and
allows a direct comparison of acceptable paint quality between market types. It is
shown in Table 2.1 that not only vehicle type, but also paint type and position of
the panel (Figure 2.11) influence the expected paint quality. Subjective in-house
industrial trials conducted by Ford Motor Company suggest that lighter metallic
shades hide surface imperfection better than darker solid based systems [20]. The
choice of paint style or colour allows for a 10 % variation in Combined Ford
readings. Similarly, vertical surfaces are less likely to reflect light at a low angle
< 0.1mm 0.1 - 0.3mm 0.3 – 1mm 1 – 3mm 3 – 10mm 10 – 30mm
Short-term
Waviness.
Visible up to 40 cm
from the source.
Long-term
Waviness.
Visible up to 3 m
from the source.
WaDullness Wb Wc Wd We
Wavelength
DOI = f (du, Wa, Wb)
Surface Characterisation of Cosmetic Polymer Composites
P J Schubel 32
to the observer and are allowed approximately 10 % increase in Combined Ford
value as opposed to the highly reflective and visible horizontal surfaces. It has
been shown that acceptable paint quality threshold (via Combined Ford) can vary
by 20 % depending on the vehicle, paint type and scan position.
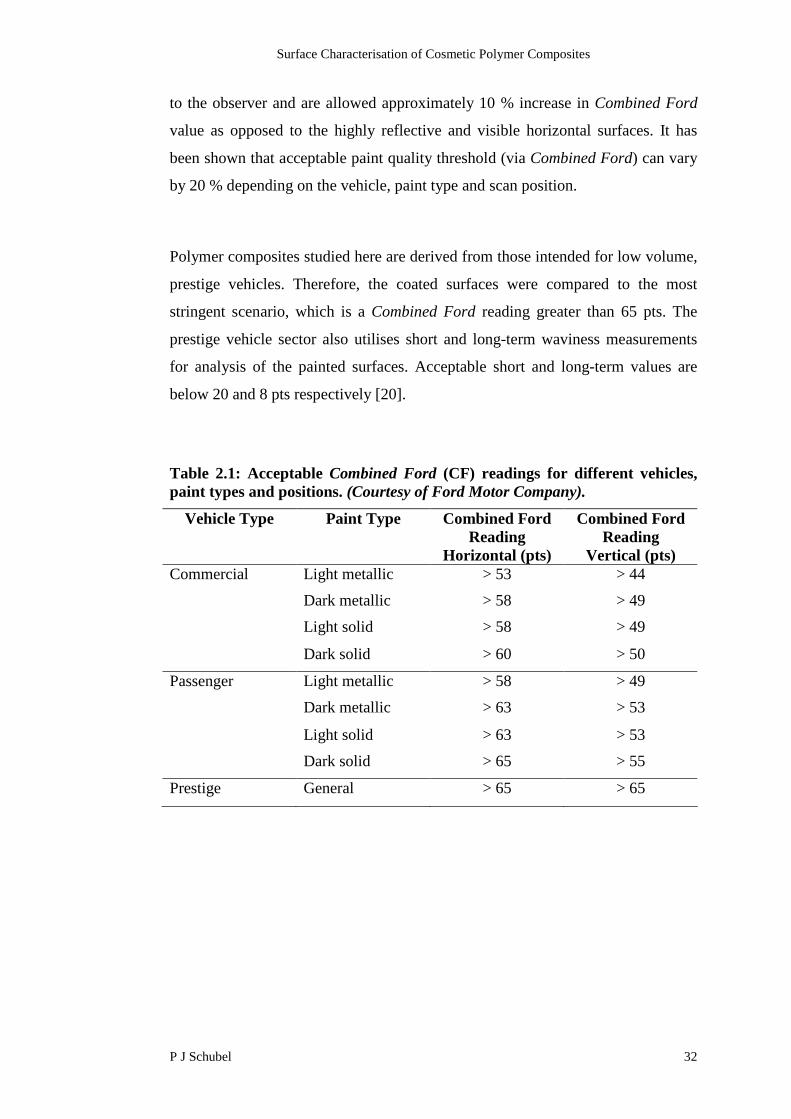
Polymer composites studied here are derived from those intended for low volume,
prestige vehicles. Therefore, the coated surfaces were compared to the most
stringent scenario, which is a Combined Ford reading greater than 65 pts. The
prestige vehicle sector also utilises short and long-term waviness measurements
for analysis of the painted surfaces. Acceptable short and long-term values are
below 20 and 8 pts respectively [20].
Table 2.1: Acceptable Combined Ford (CF) readings for different vehicles,paint types and positions. (Courtesy of Ford Motor Company).
Vehicle Type Paint Type Combined FordReading
Horizontal (pts)
Combined FordReading
Vertical (pts)Commercial Light metallic > 53 > 44
Dark metallic > 58 > 49
Light solid > 58 > 49
Dark solid > 60 > 50
Passenger Light metallic > 58 > 49
Dark metallic > 63 > 53
Light solid > 63 > 53
Dark solid > 65 > 55
Prestige General > 65 > 65

Surface Characterisation of Cosmetic Polymer Composites
P J Schubel 33
Figure 2.11: Measurement positions for a standard automotive paintanalysis. Arrows indicate the scan direction. (Courtesy of Ford MotorCompany).
This section has drawn attention to the prevailing surface quality issues associated
with polymer composites when used in cosmetic applications. The review reveals
a variety of surface characteristics, techniques and some application data relating
product quality against various standards. However, most of the available data
relate to finished painted surfaces. One of the objectives here is to characterise
materials and moulding processes and therefore it was determined to try to isolate
the influence of the paint in determining the final surface profile.
Clearly, mould tool surface quality will influence laminate surface quality, but
studies have not demonstrated the knock-on effects on resulting paint quality. It is
necessary to investigate tool induced defects and the effectiveness of paint
levelling. Hence, it was determined to study a range of tooling surfaces with a
1
3
24
5
20
19
18
17
16
11
12
15
1413
6
7
9
10
8
1
3
24
5
20
19
18
17
16
11
12
15
1413
6
7
9
10
8
1
3
24
5 11
33
2244
55
20
19
18
17
16
2020
1919
1818
1717
1616
11
12
15
1413
1111
1212
1515
14141313
6
7
9
10
8
66
77
99
1010
88
Surface Characterisation of Cosmetic Polymer Composites
P J Schubel 34
varying degree of surface finishes and measure the associated effects on the
moulded and painted article.
Literature has linked fibre strike-through and other prevailing defects to variations
in matrix and fibre expansion. The damaging effect this has on surface quality has
been shown but the degree in which matrix shrinkage (thermal and chemical)
influences surface quality and resulting paint quality is unclear. Similarly, fabric
architecture is believed to influence fibre strike-through and subsequent surface
quality through changes in relative matrix and fibre rich regions. A measure of the
prevailing surface quality and influence of paint on the variations in matrix
volume and fibre structure is necessary to assist understanding of the relative
influences to assist in suitable material selection.
2.5 Experimental Methods
2.5.1 Materials
An extensive range of materials were investigated throughout the surface quality
study. However, a representative selection are presented here. The following
materials were studied due to their existing association with automotive
manufacture either within body panelling systems or structural components. A
summary of materials in Table 2.2 shows a selection of thermoset matrix
composites. Conversion processes included compression moulding, vacuum
bagging and RTM. Strip steel was used as the reference material.
C1
Low alloy automotive strip steel was supplied by Corus at 0.7 mm thickness with
an untreated surface. The elemental analysis was [21]: C 0.06, Mn 0.2, S 0.01, P
0.010, Si 0.009, Al 0.058, N 0.005. The maximum yield stress was 280 MPa and a
ultimate tensile strength (UTS) was between 270 and 410 MPa. This material is
commonly stamped to form body panelling for high volume production. (i.e. for
mainstream passenger vehicles)

Surface Characterisation of Cosmetic Polymer Composites
P J Schubel 35
C2
The system denoted by C2 is a low profile unsaturated polyester matrix with
random E-glass preform processed by RTM (Section 2.5.2). The resin (Crystic®
RT2557) was supplied by Scott Bader Company Ltd with a number average
molecular weight between 800 and 900 g/mol and the equivalent molecular
weight /mol C=C between 200 and 250 g/mol. Styrene to unsaturated polyester
molar ratio was in the range of 1.8 to 2.0. A low profile additive, PVAc (43,043-
9), was supplied by Dow Chemicals and included at 30 wt% to the base system.
This was dispersed by shear mixing at 2000 rpm for 5 minutes. Akzo Nobel
supplied tertiary-Butyl peroxybenzoate (TBPB) initiator in 80 % solution with
acetylacetone (Trigonox® 93). 0.5 % cobalt accelerator G was required for the two
stage peroxide initiator and was supplied by Scott Bader Company Ltd. Calcium
carbonate (CaCO3) filler with a 5.7µm nominal particle size was supplied by
Omya UK Ltd and used at 30wt% of resin. Flat plaque preforms were produced
using a proprietary chop and spray system developed by Ford Motor Company.
The preforms were produced from E-glass fibres (OC R25H 1200 tex) to an areal
density of 2875 g/m2 with 1.6 wt% epoxy powder binder (Pretex 110). Chop-
strand E-glass surface veil (OC 950A-AB 3307 tex) at an areal density of 150
g/m2 per layer was used on both sides of the preform. The structural glass and
surface veil were processed to provide a nominal fibre volume fraction of 25 %
and thickness of 5 mm.
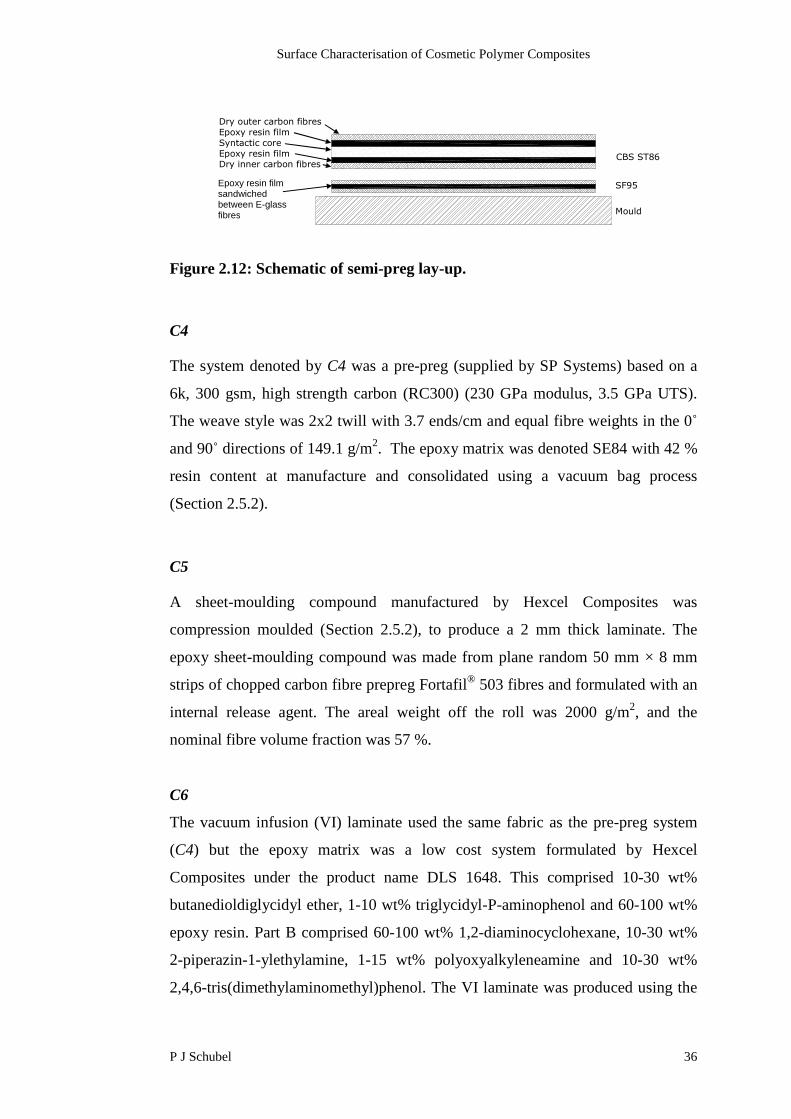
C3
The semi-preg (supplied by SP Systems) was a 6k carbon ST85 epoxy based on
300 gsm high strength carbon (230 GPa modulus, 3.5 GPa UTS). The weave style
was 2x2 twill with 3.7 ends/cm and equal fibre weights in the 0˚ and 90˚
directions of 149.1 g/m2. The epoxy matrix was SE84 with 42 % resin content at
manufacture. The B-stage cured epoxy resin film was laminated between dry
carbon fabric reinforcement (SPRINT® ST85), which sandwiched a 1 mm
syntactic core (Figure 2.12). A sandable E-glass (CBS) surfacing film (700 gsm)
sandwiched with epoxy film and was used on the ‘A’ surface. The semi-preg was
consolidated using the vacuum bag process described in Section 2.5.2.
Surface Characterisation of Cosmetic Polymer Composites
P J Schubel 36
Mould
CBS ST86
SF95
Dry outer carbon fibresEpoxy resin filmSyntactic coreEpoxy resin filmDry inner carbon fibres
Fine glass fibres
Coarse glass fibresEpoxy resin film
Figure 2.12: Schematic of semi-preg lay-up.
C4
The system denoted by C4 was a pre-preg (supplied by SP Systems) based on a
6k, 300 gsm, high strength carbon (RC300) (230 GPa modulus, 3.5 GPa UTS).
The weave style was 2x2 twill with 3.7 ends/cm and equal fibre weights in the 0˚
and 90˚ directions of 149.1 g/m2. The epoxy matrix was denoted SE84 with 42 %
resin content at manufacture and consolidated using a vacuum bag process
(Section 2.5.2).
C5
A sheet-moulding compound manufactured by Hexcel Composites was
compression moulded (Section 2.5.2), to produce a 2 mm thick laminate. The
epoxy sheet-moulding compound was made from plane random 50 mm × 8 mm
strips of chopped carbon fibre prepreg Fortafil® 503 fibres and formulated with an
internal release agent. The areal weight off the roll was 2000 g/m2, and the
nominal fibre volume fraction was 57 %.
C6
The vacuum infusion (VI) laminate used the same fabric as the pre-preg system
(C4) but the epoxy matrix was a low cost system formulated by Hexcel
Composites under the product name DLS 1648. This comprised 10-30 wt%
butanedioldiglycidyl ether, 1-10 wt% triglycidyl-P-aminophenol and 60-100 wt%
epoxy resin. Part B comprised 60-100 wt% 1,2-diaminocyclohexane, 10-30 wt%
2-piperazin-1-ylethylamine, 1-15 wt% polyoxyalkyleneamine and 10-30 wt%
2,4,6-tris(dimethylaminomethyl)phenol. The VI laminate was produced using the
Epoxy resin filmsandwichedbetween E-glassfibres

Surface Characterisation of Cosmetic Polymer Composites
P J Schubel 37
vacuum bag process described in Section 2.5.2 with a cure schedule of 2 hours at
90 ºC.
The 3k, 6k and 12k carbon fabrics were used with unsaturated polyester and
epoxy resin and processed by RTM. The carbon reinforcement was supplied by
Tenax Fibers® with a 2x2 twill weave. The unsaturated polyester resin (HS) was
the same system as the base orthophthalic resin (without PVAc) used in C2. The
epoxy system (LS) was the DLS 1648 used in C6.
Table 2.2: Constituents used in surface quality trials.
Sample
ID
Material Manufacturer Tow Size
(K)
Weave
Style
Areal Fibre
Mass (gsm)
Resin Type Moulding
Process
C1 UncoatedFeP04
Corus - - - - -
C2 E-glasspreform +
E-glasssurface veil
Scott Bader(resin)
Sotira (fibre)
- Randommat
3025 Ortho UP,
30wt% PVAc,30wt% CaCO3
RTM
C3 Sprint®ST85
CBS SF95
SP Systems
SP Systems
6
E-glass
2x2 twill
Continuous
600 ST 86
S2
RFI
C4 RC300carbon
SP Systems 6 2x2 twill 600 ST85 Vacuum bag
C5 Carbon SMC Hexcel 50x8mmstrips
Randommat
- Compressionmoulding
C6 RC300carbon
SPSystems/Hexcel
6 2x2 twill 600 DLS 1648(epoxy)
VacuumInfusion
3k HS Style 452carbon
Tenax Fibers 3 2x2 twill 200 RT2557(polyester)
RTM
6k HS Style 428carbon
Tenax Fibers 6 2x2 twill 285 RT2557(polyester)
RTM
12k HS Style 424carbon
Tenax Fibers 12 2x2 twill 660 RT2557(polyester)
RTM
3k LS Style 452carbon
Tenax Fibers 3 2x2 twill 200 DLS 1648(epoxy)
RTM
6k LS Style 428carbon
Tenax Fibers 6 2x2 twill 285 DLS 1648(epoxy)
RTM
12k LS Style 424carbon
Tenax Fibers 12 2x2 twill 660 DLS 1648(epoxy)
RTM
Surface Characterisation of Cosmetic Polymer Composites
P J Schubel 38
2.5.2 Moulding Process
Resin Film Infusion
The pre-preg and semi-preg systems were processed by vacuum bagging to
consolidate the fabric preform on a 600 x 600 x 5 mm tempered glass plate,
heated by a silicon rubber mat (CAL9500) rated at 750 W. The surface
temperature was controlled by a CAL9500P programmable process controller. A
thermocouple was centrally positioned in the vacuum bag to verify the laminate
temperature. Thermal images of the glass tool taken at 80 ºC and 120 ºC (Figure
2.13) show a working area of 450 x 450 mm without a significant temperature
gradient.
Figure 2.13: Thermal image of glass moulding plate at (a) 80 ºC (b) 120 ºC.
The charge was positioned centrally on the glass plate (Figure 2.14) then covered
by a dry polyamide peel ply membrane (Stitch ply A). This was then covered by a
perforated release film (WL3600 P90), single breather layer (Ultraweave® 606)
and a bagging film (WN1500). The bagging film was sealed using a mastic tape
(AT140). A vacuum of 950 mbar was maintained until the surface temperature
had fallen below 40 ˚C, whereupon the part was demoulded. The average overall
cycle time was 3 hours 15 minutes as shown by Figure 2.15. Both samples were
postcured for 2 hours at 90 ºC using the process described in Figure 2.16.
(a) (b)

Surface Characterisation of Cosmetic Polymer Composites
P J Schubel 39
Mould
Release film
Breather
Bagging film
Sealant tape
Peel ply
Figure 2.14: Schematic of prepreg moulding technique.
Figure 2.15: Representative moulding cycle–pressure, temperature schedule.
Figure 2.16: Postcure process.
20
40
60
80
100
120
140
0 20 40 60 80 100 120 140 160 180 200
Time (mins)
To
ol
Te
mp
era
ture
(ºC
)
0
100
200
300
400
500
600
700
800
900
1000
Va
cu
um
Pre
ss
ure
(mb
ar)
Heat rate2 ºC/min
Vacuum pressure
Naturallycool
Heat rate2 ºC/min
0
20
40
60
80
100
0 2 4 6
Time (hrs)
Te
mp
era
ture
(ºC
)
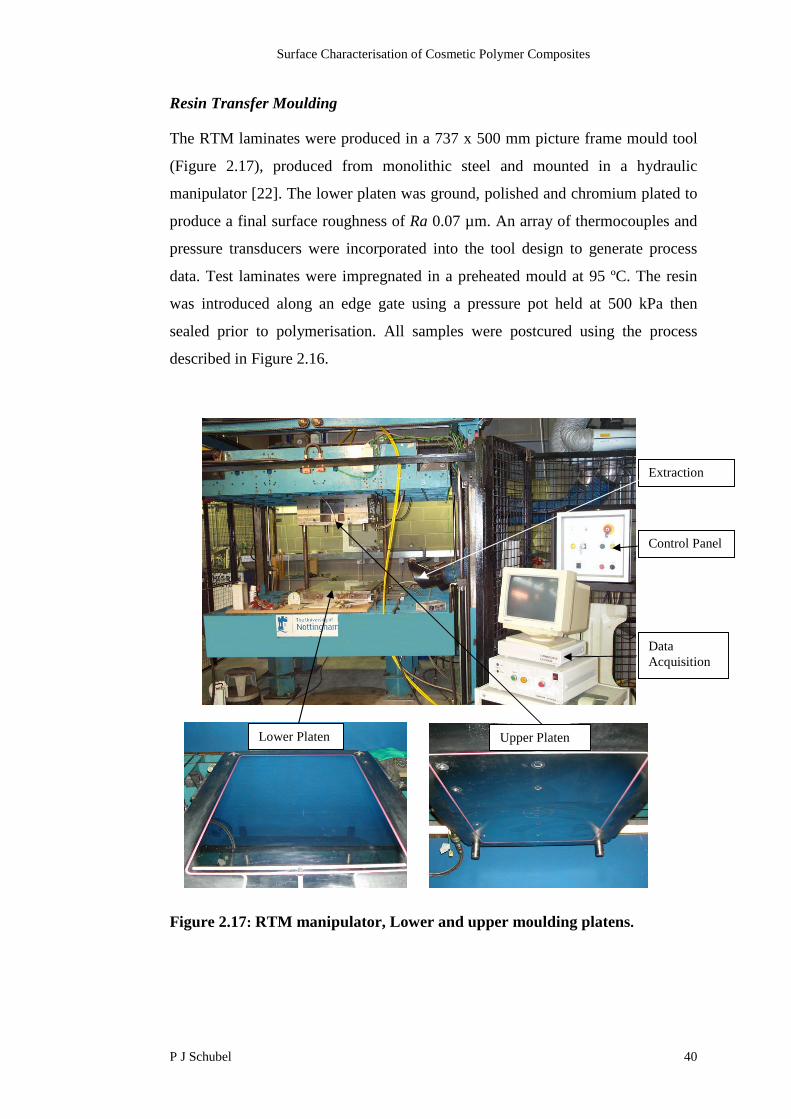
Surface Characterisation of Cosmetic Polymer Composites
P J Schubel 40
Resin Transfer Moulding
The RTM laminates were produced in a 737 x 500 mm picture frame mould tool
(Figure 2.17), produced from monolithic steel and mounted in a hydraulic
manipulator [22]. The lower platen was ground, polished and chromium plated to
produce a final surface roughness of Ra 0.07 µm. An array of thermocouples and
pressure transducers were incorporated into the tool design to generate process
data. Test laminates were impregnated in a preheated mould at 95 ºC. The resin
was introduced along an edge gate using a pressure pot held at 500 kPa then
sealed prior to polymerisation. All samples were postcured using the process
described in Figure 2.16.
Figure 2.17: RTM manipulator, Lower and upper moulding platens.
Control Panel
Extraction
DataAcquisition
Upper PlatenLower Platen
Surface Characterisation of Cosmetic Polymer Composites
P J Schubel 41
Compression Moulding
The SMC was processed by compression moulding in a Bradley & Turton 150
tonne hydraulic transfer moulding press. The steel tool (265mm×125mm) was
ground to 0.53 µm Ra and heating was provided by two 250 W cartridge heaters
per platen [23]. A charge sufficient enough to cover 80 % of the mould surface
was used to account for flow. The compression moulding compound was placed
in the pre-heated press at 120 ºC and consolidated at 5 MPa clamping pressure
based on the tool surface area. It was heated for 5 minutes and then demoulded to
produce a 2 mm laminate.
2.5.3 Paint Process
The laminates were cut to 300 x 210 mm using a water-cooled diamond coated
circular saw. Conventional 3M® masking tape was used to blank half of each
laminate before being put through a representative automotive painting cycle
(Figure 2.18) at Aston Martin Lagonda. A summary of the paint layers and
products are shown in Table 2.3. All products used in the painting cycle were
supplied by PPG Industries. The panel was degreased with solvent (PPG D846),
keyed using a 3M® sanding sponge (P400) then degreased again. Two coats of
high build acrylic primer (PPJ D839) were sprayed to obtain a film build of 80
µm. This was then baked at 80 ºC for 20 mins. Once cooled, the surface was
lightly sanded with P400 paper and an acrylic sealing primer (A3877P6653/SK)
was applied and baked, followed by a light sanding with P400 paper. Two base
coats of dark waterborne paint (PPJ Envirobase colour) and two coats of clear
polyurethane (PPJ ECC 38010/XK) were applied with each clear coat being baked
at 80 ºC for 20 mins. The total average film build was 160 µm with the individual
coating thickness for each panel being detailed in Appendix 2. The panels were
not flattened or polished after the paint process.

Surface Characterisation of Cosmetic Polymer Composites
P J Schubel 42
Figure 2.18: Flow chart of the paint cycle used at Aston Martin Lagonda.
Table 2.3: Coating processes and associated product type.
CoatingProcess
Paint Type Supplier Product Code Average filmthickness
(µm)High buildprimer
Acrylic PPGIndustries
PPJ D839 80
Sealer primer Acrylic PPGIndustries
A3877P6653/SK 28
Dark Base Waterborne PPGIndustries
PPJ Envirobasecolour
10
Clear coat Polyurethane PPGIndustries
PPJ ECC38010/XK
53
2.5.4 Surface Evaluation
Once the paint process was complete, the laminates were analysed to determine
the surface characteristics of the bare and coated sections. In each experiment, an
Cut Sample toSize
Inspect andDegreaseSurface
Mask Half ofSample
Key Surface
2x High BuildPrimer
DegreaseSurface
Paint Booth
Sealing Primer
2 x Base Coat
Key SurfaceOven and Cool
Clear Coat Oven and Cool
EvaluateSurface
Characteristics
1
2
3
4UncoverMasked
Section
1x
Surface Characterisation of Cosmetic Polymer Composites
P J Schubel 43
average of 5 repeats were systematically taken from various locations on the
sample to obtain an average reading.
Optical Microscopy
Optical microscopy using a Zeiss Axiolab microscope was used to assess the
potential levelling effects of paint layers. A 10 x 20 mm sample was cut from the
painted section and mounted using an unfilled polyester resin (supplied by
Reichhold) and was initiated by 2 wt % of Butanox M50 (supplied by Akzo
Nobel). Upon demould, the samples were polished using a Struers® DAP-7
laboratory polisher equipped with an automatic holder (Struers® Pedemin-S). The
cast samples were consecutively ground and washed using abrasive waterproof
papers from 240, 600, 1200 and 2400 grade.
Stylus Profilometry
Stylus profiling was used to measure the surface roughness of the bare and
painted laminates. A Mitutoyo Surftest SV622 profiler with 5 µm stylus (996133-
996153) and auto drive unit was used to measure an evaluation length of 12.5 mm
at a speed of 0.5 mm/s and pitch of 0.8 µm. A cut-off length of 0.8mm was used
to exclude surface waviness and a Gaussian filter was applied.
Light Reflectometry
The surface waviness of the painted laminates was measured using a BYK
Gardner Wavescan DOI with a built–in laser diode light source and an optical
sensor. Scans in the x and y directions were taken over a scan length of 100 mm to
obtain an average value. The Wavescan DOI returned longwave, shortwave,
Combined Ford and the full wave spectrum from Wa-e. The data were
manipulated using Autochart® 2.20 software which normalises all readings to a
scale ranging from 0 (smooth) to 100 (highly structured).

Surface Characterisation of Cosmetic Polymer Composites
P J Schubel 44
Figure 2.19: Laser measurement principle of the BYK Gardner WavescanDOI®.
Subjective Assessment
Visual assessment of the laminates was conducted to characterise paint surface
quality in order to relate human visual perception to machine sensitivity. The
laminates were assessed under fluorescent light to determine the visibility of the
defects on the painted surface as a direct result of imperfections seen on the bare
laminate. The laminates were rated into 2 categories: acceptable and unacceptable
paint quality, by four people (details in Appendix 3) who each had a minimum of
five years experience in the field of automotive coating processes. The appraisers
assessed the painted laminates under the same conditions and each appraiser rated
the surface twice with a three-hour interval between tests. Statistical analysis was
conducted on the observations using MiniTab® software to determine the
repeatability of each appraiser and the reproducibility between appraisers.
2.6 Results and Discussion
2.6.1 Levelling Effects of Paint on Polymer Composite Surface Structure
The levelling effect of paint on the surface characteristics of a polymer composite
was investigated using three-dimensional topography. A carbon 2x2 twill weave
fabric with a vinyl ester matrix, processed by RTM was used as a representative
laminate. Readings were taken from a representative section of laminate before
and after the paint process. A comparison of the plots before and after painting
Laser
Mathematical Filters
60º
Surface Profile
Filtered Spectra
Wa Wb Wc Wd We

Surface Characterisation of Cosmetic Polymer Composites
P J Schubel 45
(Figure 2.20, Figure 2.21) show a significant reduction in trough depth through
the application of the paint layers. The representative traces taken before and after
painting (Figure 2.22) show a significant reduction in short-term waviness for the
painted surface. A wavelength of approximately 4 mm is seen for the bare surface,
which corresponds with the weave parameters of the fabric (insert Figure 2.22).
The coating process reduced valley depth to 2.2 μm, which is a 10-fold reduction
when compared to the bare surface. However, regular patterns of fibre
architecture are still visible on the painted surface (Figure 2.21), indicating that
complete attenuation of the surface characteristics was not achieved.
Characteristics associated with long-term waviness (λ ≥ 10 mm) do not appear to
be reduced by the paint process (Figure 2.22), as wavelengths spanning between
25 and 50 mm are visible on both traces. This supports Halden’s [17] suggestions
of paint being unable to mask structures spanning wavelengths greater than 10
mm.
Figure 2.20: Surface topography of a 3k, 2x2 twill weave carbon fabric,processed by RTM with a vinyl ester matrix. A regular trough depth of 15 to 20μm relating to the weave of the fabric is observed.
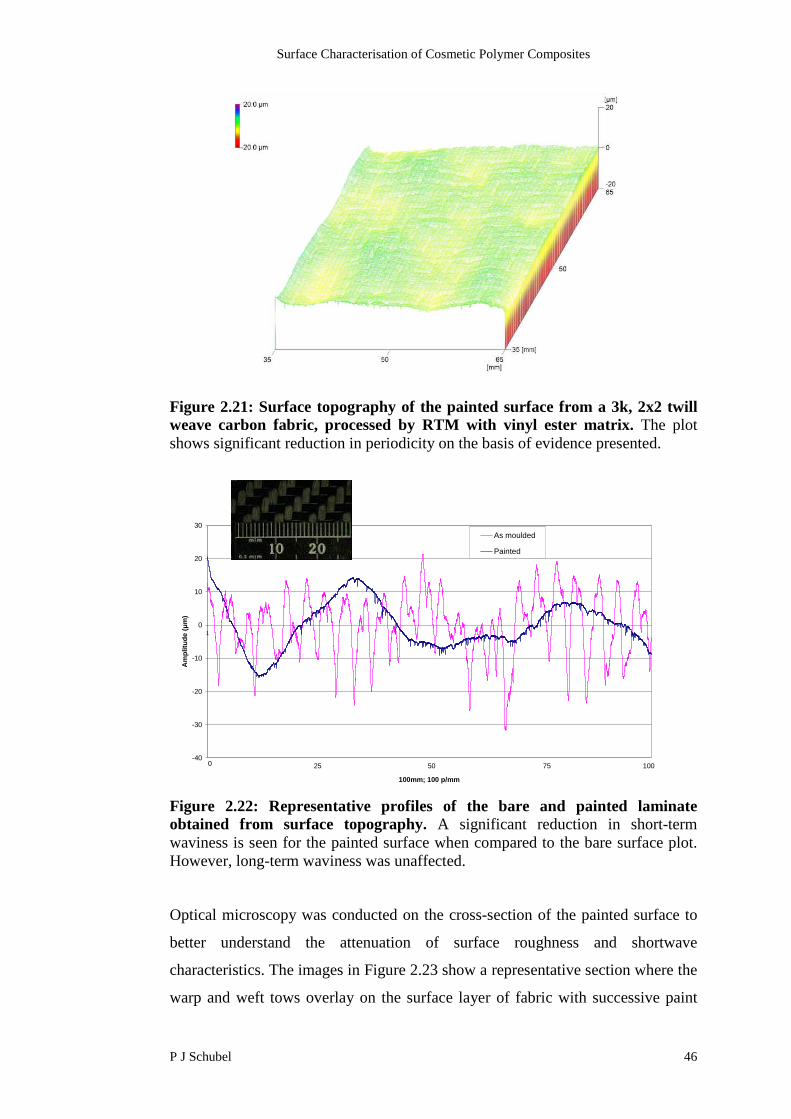
Surface Characterisation of Cosmetic Polymer Composites
P J Schubel 46
Figure 2.21: Surface topography of the painted surface from a 3k, 2x2 twillweave carbon fabric, processed by RTM with vinyl ester matrix. The plotshows significant reduction in periodicity on the basis of evidence presented.
Figure 2.22: Representative profiles of the bare and painted laminateobtained from surface topography. A significant reduction in short-termwaviness is seen for the painted surface when compared to the bare surface plot.However, long-term waviness was unaffected.
Optical microscopy was conducted on the cross-section of the painted surface to
better understand the attenuation of surface roughness and shortwave
characteristics. The images in Figure 2.23 show a representative section where the
warp and weft tows overlay on the surface layer of fabric with successive paint
-40
-30
-20
-10
0
10
20
30
1
100mm; 100 p/mm
Am
plitu
de
(μm
)
As moulded
Painted
0 50 10025 75

Surface Characterisation of Cosmetic Polymer Composites
P J Schubel 47
coatings characterised by variation in pigmentation. The progressive increase in
magnification shows the levelling effects of paint layers on the trough formed by
shrinkage in the resin rich region between the warp and weft tows. At x50k
magnification, it can be clearly seen that a variation in thickness of the high build
primer and successive sealer primer exists where the surface trough was formed.
This phenomenon is shown to fill the majority of the trough with the successive
base coat and clear coat showing no visible evidence of the underlying
characteristic.
Figure 2.23: Optical micrographs (20k and 50k magnification) on the cross-section of the painted surface of a 2x2 twill weave carbon fabric, moulded inan RTM process with vinyl ester resin. The successive micrographs show theeffectiveness of the high-build primer and sealer primer in levelling out the fibrestrike-through effect created by the resin rich region at the overlap of a warp andweft tow.
x50k Magnification
Clear Coat
Base Coat
Sealer Primer
High-buildPrimer
Weft Tow
Warp Tow
Resin Rich Region
100 µm
Warp Tow
Weft Tow
Resin Rich Region
Paint Layers
100 µm
100 µm
Clear CoatBase CoatSealer Primer
High-buildPrimer
x20k Magnification

Surface Characterisation of Cosmetic Polymer Composites
P J Schubel 48
Figure 2.24 shows the surface characteristics of the individual coating layers and
the effect each layer has on the proceeding layer. It is shown that each layer has
its own level of surface roughness, which is generally masked by the successive
layer. This supports Neitzel’s [1] suggestions that the paint process produces its
own characteristic surface roughness. However, there is no visible evidence that
each layer directly influences the successive layer, as surface characteristics were
not seen to transfer from one layer to the next.
Figure 2.24: Optical microscopy of successive paint layers. Each layer has itscharacteristic level of surface roughness. However, the roughness of each layer isnot seen to affect the successive coating surface.
2.6.2 Validation of Surface Measurement Techniques
Visual Subjective Assessment
Subjective assessment was used to provide a reference point against the
quantitative methods. Two scenarios were investigated to study the effect of
appraiser training. The first study (Group 1) utilised 15 appraisers with no paint
quality experience whilst the second study (Group 2) utilised four appraisers with
automotive coating background.
x50k Magnification
Sealer Primer
Clear Coat
Base Coat
High-build Primer
LaminateSurface
100 µm

Surface Characterisation of Cosmetic Polymer Composites
P J Schubel 49
The observations made by the appraisers in the visual assessment were analysed
to determine the repeatability associated with each appraiser and the
reproducibility between appraisers. The statistical analysis detailed in Appendix 3
and summarised in Table 2.4 showed that the paint specialists (Group 2) were
individually repeatable within 3 %, whereas a 9 % error could be expected for
Group 1. More concerning was the 76 % error between appraisers for Group 1
which indicated poor agreement in what was deemed an acceptable surface. The
12 % error in reproducibility between the Group 2 appraisers was considered
acceptable using the Six Sigma process [24] for this type of analysis.
Following these findings, it became obvious that background knowledge plays a
major role in subjective assessment. Due to the low margin of error experienced
by Group 2, it was decided that the average of their observations would be
adopted as the visual assessment for the painted laminates (Table 2.5, Table 2.6).
The prevailing defect observed was fibre strike-through.
Table 2.4: Statistical analysis of subjective assessment. Results show thatGroup 2 are more capable of reproducing their own results and have generalagreement with each other on what is an acceptable painted surface.
Percentage Error (%)
Within Appraiser Between appraiser
Group 1 - inexperienced 9 76
Group 2 - experienced 3 12
Table 2.5: Laminates with acceptable paint quality as determined bysubjective assessment.
Sample ID Material Moulding ProcessC1 Uncoated FeP04 -C2 Random E-glass preform - LS UP resin RTMC3 ST85 6K, 2x2 twill, CBS E-glass veil RFI

Surface Characterisation of Cosmetic Polymer Composites
P J Schubel 50
Table 2.6: Laminates with unacceptable paint quality as determined bysubjective assessment.
Sample ID Material Moulding ProcessC4 6k, 2x2 twill carbon – ST85 (epoxy) Vacuum bagC5 Random carbon sheet compound CompressionC6 6k, 2x2 twill carbon – DLS 1554-2
(epoxy)Vacuum Infusion
Instrumented Waviness Detection
Surface waviness measurements were obtained using light reflectometry on the
painted surfaces of the laminates used in subjective assessment. Results were
unobtainable on the bare laminates due to low reflectivity. The wave spectra (Wa-
e) and hybrid values for all the painted surfaces used throughout the study are
supplied in Appendix 4. However, the results presented in this section relate to the
shortwave, longwave and Combined Ford readings (Figure 2.25) as automotive
standards for a (non-flattened) painted surface already existed. The laminates have
been grouped into two categories in accordance with results obtained from
subjective assessment, i.e. acceptable, unacceptable paint quality. Automotive
industry limits for the three parameters have been included in Figure 2.25. Details
of the automotive paint standards are found in Table 2.1.
The longwave measurements (Figure 2.25) show a slight increase as a progression
is made from the subjective ranking of acceptable to unacceptable paint quality.
However, all values still remain within industry tolerance. Most failures were due
to short-term waviness, which was excessive for the (subjectively) unacceptable
specimens. The laminates which were assessed to have acceptable paint quality
(C1, C2 and C3) are well below industry tolerance whilst laminates C4, C5 and
C6 show approximately 1.5 times the acceptable tolerance for short-term
waviness. As indicated earlier, C4, C5 and C6 laminates showed visible evidence
of fibre strike-through and other related surface features. The Combined Ford
readings (Figure 2.25) also support the subjective assessment results and rate the
‘unacceptable’ painted surfaces as having excessive surface characteristics. It has
been demonstrated that light reflectometry is able to detect the various defects and
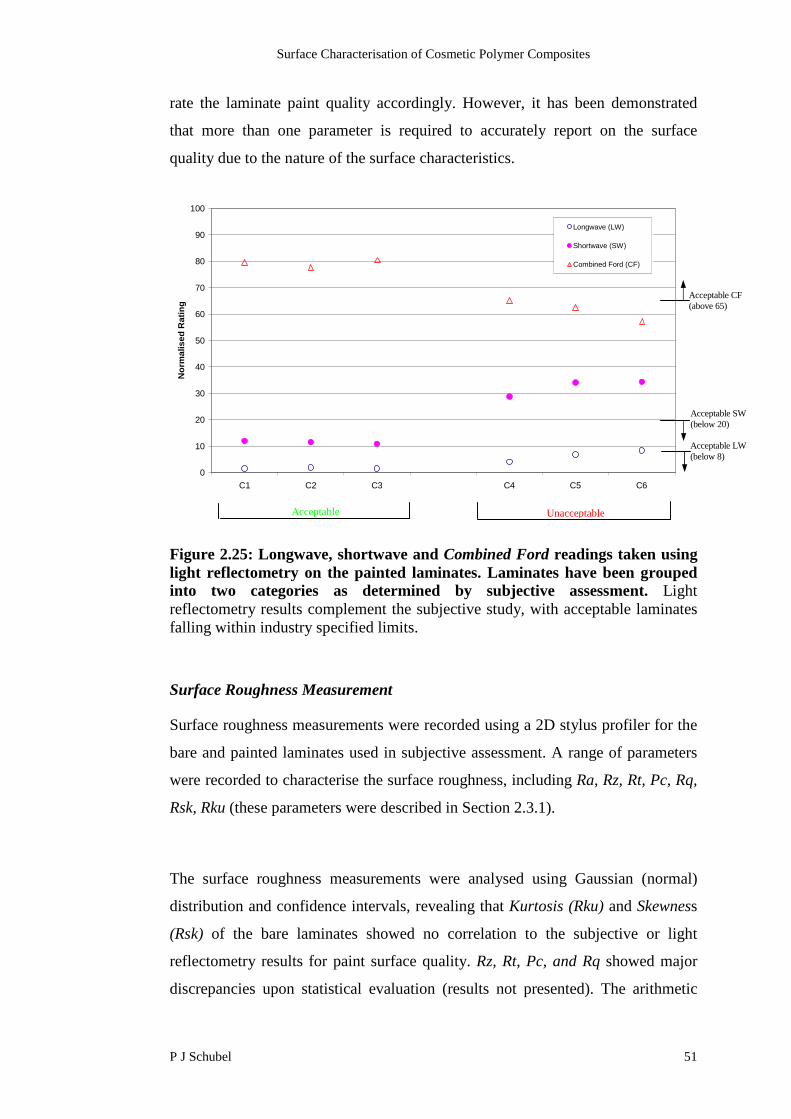
Surface Characterisation of Cosmetic Polymer Composites
P J Schubel 51
rate the laminate paint quality accordingly. However, it has been demonstrated
that more than one parameter is required to accurately report on the surface
quality due to the nature of the surface characteristics.
Figure 2.25: Longwave, shortwave and Combined Ford readings taken usinglight reflectometry on the painted laminates. Laminates have been groupedinto two categories as determined by subjective assessment. Lightreflectometry results complement the subjective study, with acceptable laminatesfalling within industry specified limits.
Surface Roughness Measurement
Surface roughness measurements were recorded using a 2D stylus profiler for the
bare and painted laminates used in subjective assessment. A range of parameters
were recorded to characterise the surface roughness, including Ra, Rz, Rt, Pc, Rq,
Rsk, Rku (these parameters were described in Section 2.3.1).
The surface roughness measurements were analysed using Gaussian (normal)
distribution and confidence intervals, revealing that Kurtosis (Rku) and Skewness
(Rsk) of the bare laminates showed no correlation to the subjective or light
reflectometry results for paint surface quality. Rz, Rt, Pc, and Rq showed major
discrepancies upon statistical evaluation (results not presented). The arithmetic
0
10
20
30
40
50
60
70
80
90
100
C1 C2 C3 C4 C5 C6
No
rma
lis
ed
Ra
tin
g
Longwave (LW)
Shortwave (SW)
Combined Ford (CF)
Acceptable LW(below 8)
Acceptable SW(below 20)
Acceptable Unacceptable
Acceptable CF(above 65)

Surface Characterisation of Cosmetic Polymer Composites
P J Schubel 52
mean (Ra) shown in Figure 2.26, gave the best correlation to the subjective and
reflectometry results.
The laminates used in Figure 2.26 are grouped in accordance to the results
presented for subjective assessment, i.e. acceptable or unacceptable paint quality.
The Ra values for the ‘acceptable’ polymers were below 0.2 µm. This value is
five times lower than that for acceptable strip steel (C1). The higher Ra value of 1
µm, for steel still offers an excellent surface for painting as its roughness profile is
strictly periodic as opposed to a polymer composite which exhibits less regular
characteristics (Figure 2.27).
Figure 2.26: Arithmetic mean (Ra) of the bare and painted laminate surfacesconducted using stylus profilometry. Laminates have been grouped into twocategories as determined by subjective assessment. The graph shows that barelaminates with low Ra values correlate to light reflectometry and subjectiveassessment results. Roughness readings on painted surfaces tend to show paintcharacteristics such as orange peel.
Acceptable Unacceptable
0
0.2
0.4
0.6
0.8
1
1.2
C1 C2 C3 C4 C5 C6
Ra
(µm
)
Painted
Bare

Surface Characterisation of Cosmetic Polymer Composites
P J Schubel 53
-5
-4
-3
-2
-1
0
1
2
3
4
Peak spacing (mm)
Am
plitu
de
(µm
)
0.4 12.96.65
-5
-4
-3
-2
-1
0
1
2
3
4
Peak spacing (mm)
Am
plitu
de
(µm
)
0.4 6.6 12.9
Figure 2.27: Roughness profiles for: (A) C1 - Cold rolled strip steel, (B) C6 -6K 2x2 twill carbon with epoxy matrix moulded using a VI process. Bothsurfaces produce similar extremities in peak height. However, it was determinedby subjective and light reflectometry assessment that the regional variation inprofile “B” produced an unacceptable painted surface.
Figure 2.26 also indicates Ra values greater than 2 μm on the bare surfaces failed
the subjective tests. A statistical analysis using a 95 % confidence interval was
used to determine a threshold for acceptable bare surface roughness. It was
revealed that a laminate resulting in a flawless paint finish had an unpainted
surface roughness less than or equal to 0.16 µm Ra (Table 2.7). Above this value,
it was highly probable that a defect would be visible on the painted laminate as a
result of the bare laminate surface condition.
(A)
(B)
Fibre Rich RegionResin Rich Region Resin Rich Region

Surface Characterisation of Cosmetic Polymer Composites
P J Schubel 54
Table 2.7: 95% confidence interval and range for the two categories of Ravalues for bare laminates. It has been shown that a bare laminate with a Ra equalto or below 0.16 µm will result in a suitable painted surface.
95 % confidence interval (Ra)
Low High Range (µm)
No defects (acceptable) 0.15 0.16 ≤ 0.16
Defects (unacceptable) 0.36 0.37 > 0.16
The surface roughness readings taken on the painted surfaces do not correlate with
subjective assessment. Instead, it is believed that the readings show varying levels
of roughness induced by the paint process. This is supported by the topography of
the painted surface (Section 2.6.1), where surface defects such as fibre strike-
through were evident, but were difficult to isolate and quantify when looking at a
single profile trace. This suggests that profilometry is not suitable for
characterising the range of potential structures on the surface of a painted polymer
composite, although for bare substrates, it appears to be an accurate and
repeatable technique.
2.6.3 Tool Surface Study
Semi-preg (C3) was moulded on four tool surfaces (Table 2.8) using the RFIprocess described in Section 2.5.2. Surface roughness profiles of the four toolsurfaces (
) show the variation in surface geometry ranging from smooth and uniform for
Tool 1 and 2, to irregular changes in amplitude and spacing for Tool 4. The Ra
values of the laminates marginally increased over that of the tool surface
roughness due to superposition of the fabric architecture and tool surface.

Surface Characterisation of Cosmetic Polymer Composites
P J Schubel 55
Table 2.8: Description of tool surfaces used for studies on surface quality. Thesurface roughness (Ra) of each laminate shows a marginal increase over that ofthe corresponding tool surface.
Tool ID(Sample ID)
MaterialType
SurfaceTreatment
SurfaceCondition
Tool SurfaceRa (µm)
Mouldedlaminate Ra
(µm)Tool 1 Glass Tempered Unmarked 0.07 0.15
Tool 2 Steel Ground flat,polished,chromed
Unmarked 0.07 0.12
Tool 3 Steel Ground flat Lightscratches
0.21 0.24
Tool 4 Steel - Heavyscratches,
deepindentations
0.53 0.59
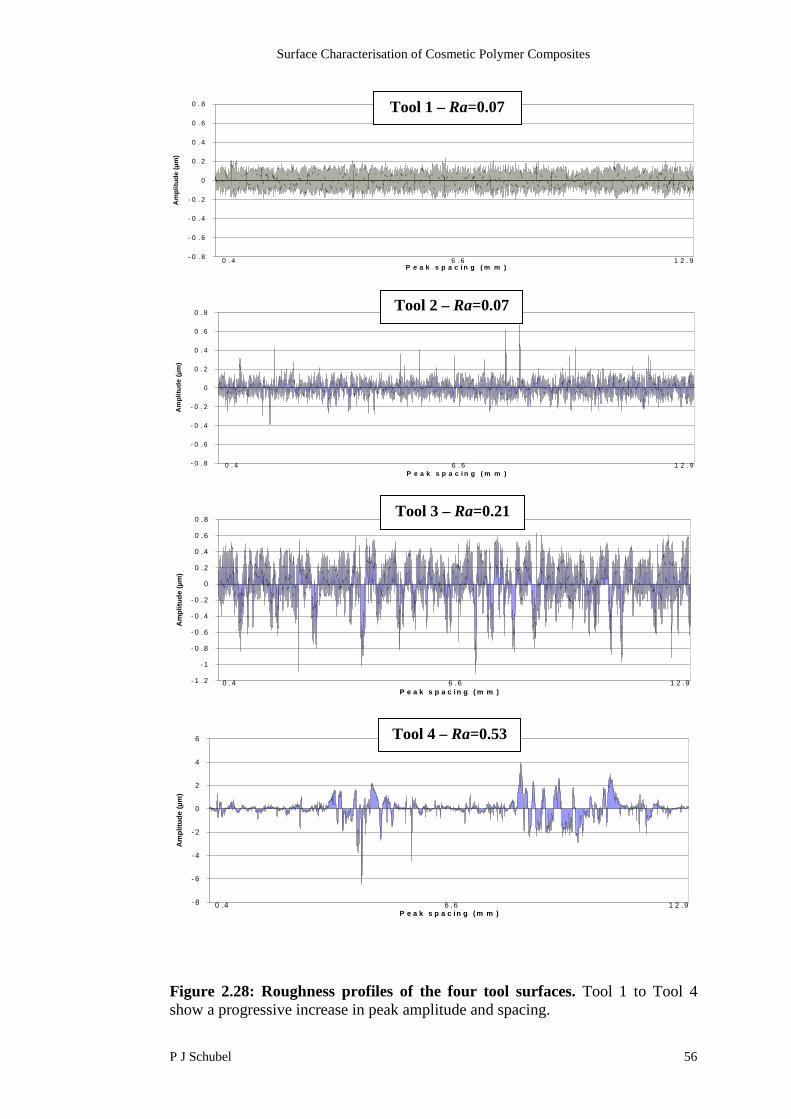
Surface Characterisation of Cosmetic Polymer Composites
P J Schubel 56
Figure 2.28: Roughness profiles of the four tool surfaces. Tool 1 to Tool 4show a progressive increase in peak amplitude and spacing.
- 0 . 8
- 0 . 6
- 0 . 4
- 0 . 2
0
0 . 2
0 . 4
0 . 6
0 . 8
0.4
0.45 0.5
0.55 0.6
0.64
0.69
0.74
0.79
0.84
0.89
0.94
0.99
1.03
1.08
1.13
1.18
1.23
1.28
1.33
1.38
1.43
1.47
1.52
1.57
1.62
1.67
1.72
1.77
1.82
1.86
1.91
1.96
2.01
2.06
2.11
2.16
2.21
2.25 2.3
2.35 2.4
2.45 2.5
2.55 2.6
2.65
2.69
2.74
2.79
2.84
2.89
2.94
2.99
3.04
3.08
3.13
3.18
3.23
3.28
3.33
3.38
3.43
3.47
3.52
3.57
3.62
3.67
3.72
3.77
3.82
3.87
3.91
3.96
4.01
4.06
4.11
4.16
4.21
4.26 4.3
4.35 4.4
4.45 4.5
4.55 4.6
4.65
4.69
4.74
4.79
4.84
4.89
4.94
4.99
5.04
5.09
5.13
5.18
5.23
5.28
5.33
5.38
5.43
5.48
5.52
5.57
5.62
5.67
5.72
5.77
5.82
5.87
5.91
5.96
6.01
6.06
6.11
6.16
6.21
6.26
6.31
6.35 6.4
6.45 6.5
6.55 6.6
6.65 6.7
6.74
6.79
6.84
6.89
6.94
6.99
7.04
7.09
7.13
7.18
7.23
7.28
7.33
7.38
7.43
7.48
7.53
7.57
7.62
7.67
7.72
7.77
7.82
7.87
7.92
7.96
8.01
8.06
8.11
8.16
8.21
8.26
8.31
8.35 8.4
8.45 8.5
8.55 8.6
8.65 8.7
8.75
8.79
8.84
8.89
8.94
8.99
9.04
9.09
9.14
9.18
9.23
9.28
9.33
9.38
9.43
9.48
9.53
9.57
9.62
9.67
9.72
9.77
9.82
9.87
9.92
9.97 10
10.1
10.1
10.2
10.2
10.3
10.3
10.4
10.4
10.5
10.5
10.6
10.6
10.6
10.7
10.7
10.8
10.8
10.9
10.9 11 11
11.1
11.1
11.2
11.2
11.3
11.3
11.4
11.4
11.5
11.5
11.6
11.6
11.7
11.7
11.8
11.8
11.9
11.9 12 12
12.1
12.1
12.2
12.2
12.3
12.3
12.4
12.4
12.5
12.5
12.6
12.6
12.6
12.7
12.7
12.8
12.8
12.9
P e a k s p a c i n g ( m m )
Am
pli
tud
e(µ
m)
0 . 4 6 . 6 1 2 . 9
- 0 . 8
- 0 . 6
- 0 . 4
- 0 . 2
0
0 . 2
0 . 4
0 . 6
0 . 8
P e a k s p a c i n g ( m m )
Am
pli
tud
e(µ
m)
0 . 4 6 . 6 1 2 . 9
- 1 . 2
- 1
- 0 . 8
- 0 . 6
- 0 . 4
- 0 . 2
0
0 . 2
0 . 4
0 . 6
0 . 8
P e a k s p a c i n g ( m m )
Am
pli
tud
e(µ
m)
0 . 4 6 . 6 1 2 . 9
- 8
- 6
- 4
- 2
0
2
4
6
P e a k s p a c in g ( m m )
Am
pli
tud
e(µ
m)
0 .4 6 .6 1 2 .9
Tool 2 – Ra=0.07
Tool 3 – Ra=0.21
Tool 4 – Ra=0.53
Tool 1 – Ra=0.07

Surface Characterisation of Cosmetic Polymer Composites
P J Schubel 57
It has been shown in Figure 2.29 that the application of paint was able to mask
defects associated with a tool surface roughness up to an Ra of 0.21 μm. All
painted laminates show long-term waviness within industry standards. However,
Tool 4 (Ra = 0.53 μm) has approximately double the allowable short-term
waviness. Subjective assessment revealed that the painted laminate moulded on
Tool 4 showed excessive scratches and indentations, which directly related to the
tool surface and was therefore deemed to have unacceptable paint quality.
Combined Ford readings also correlate with subjective assessment in indicating
that a tool surface roughness of 0.53 μm results in an unacceptable paint quality.
Geier’s [1] suggestion of mould surface quality contributing to surface roughness
holds true. However, it has been shown that the paint process is able to mask
irregular patterns and light scratches up to a tool roughness of 0.21 µm Ra.
Figure 2.29: Light reflectometry results plotted against the respective toolsurface roughness of the four painted laminates. It has been shown thatexcessive short-term waviness is obtained on the laminate moulded on Tool 4with a surface roughness of 0.53 μm Ra.
0
10
20
30
40
50
60
70
80
90
100
0 0.1 0.2 0.3 0.4 0.5 0.6
Tool Surface Roughness - Ra (µm)
Lig
ht
Re
fle
cto
me
try
(No
rma
lis
ed
Ra
tin
g)
Combined Ford (CF)
Shortwave (SW)
Longwave (LW)
Acceptable Unacceptable
Acceptable CF(above 65)
Acceptable LW(below 8)
Acceptable SW(below 20)

Surface Characterisation of Cosmetic Polymer Composites
P J Schubel 58
2.6.4 Effects of Tow Size and Resin Shrinkage on Surface Quality
An unsaturated polyester (RT2557) and epoxy resin (DLS 1648) were used to
mould a series of 2x2 twill carbon fabrics to simulate the effects of resin
shrinkage and fabric architecture on the resulting surface quality. Chemical resin
shrinkage for the resin systems (Table 2.9) was measure by a multipycnometer
(Section 4.4.2).
Table 2.9: Volumetric resin shrinkage for epoxy and unsaturated polyesterresin.
Resin Type Sample ID ChemicalShrinkage
(%)
StandardDeviation
Epoxy Low shrink (LS) 0.74 ± 0.24
Unsat’polyester
High shrink (HS) 8.34 ± 0.61
Figure 2.30 shows reflectometry results for Combined Ford, shortwave and
longwave readings of the painted laminates. Subjective assessment and light
reflectometry on the painted laminates show related trends and place the low
shrink system (excluding the 12k fabric style) as exhibiting no visible surface
defects. The 12k low shrink system is shown to have an acceptable Combined
Ford reading but short and longwave measurements are marginally outside the
acceptable region. All other systems exhibit at least 80 % additional short-term
waviness over the industrial standard, with fibre strike-through as the prevailing
defect.

Surface Characterisation of Cosmetic Polymer Composites
P J Schubel 59
Figure 2.30: Light reflectometry results for laminates produced with variousresin shrinkage and fabric architecture. Results show that the low shrinkmatrix coupled with the 3k and 6k fabric produced no visible defects on thepainted surface.
Figure 2.31 shows that both fabric tow size and matrix shrinkage proportionally
affect laminate surface roughness. For both the high and low shrink matrix, it has
been shown that a 2-fold increase in Ra can be expected when comparing the
effects of a 3k tow to a 12 k tow.
It was decided to model the effects of volumetric shrinkage and fabric architecture
on surface roughness (Appendix 8) by applying a predetermined set of equations
to a geometric model of a representative unit cell developed with the aid of
TexGen software. The analysis returned a simulated topography of the surface
plus an Ra value for each set of input parameters. Despite the various assumptions
made to simplify the analysis, the simulated results show good correlation to
experimental data (Figure A8.10).
0
10
20
30
40
50
60
70
80
90
100
3K LS 6K LS 12K LS 3K HS 6K HS 12K HS
No
rmalised
Rati
ng
Longwave (LW)
Shortwave (SW)
Combined Ford (CF)
Acceptable Unacceptable
Acceptable LW(below 8)
Acceptable SW(below 20)
Acceptable CF(above 65)
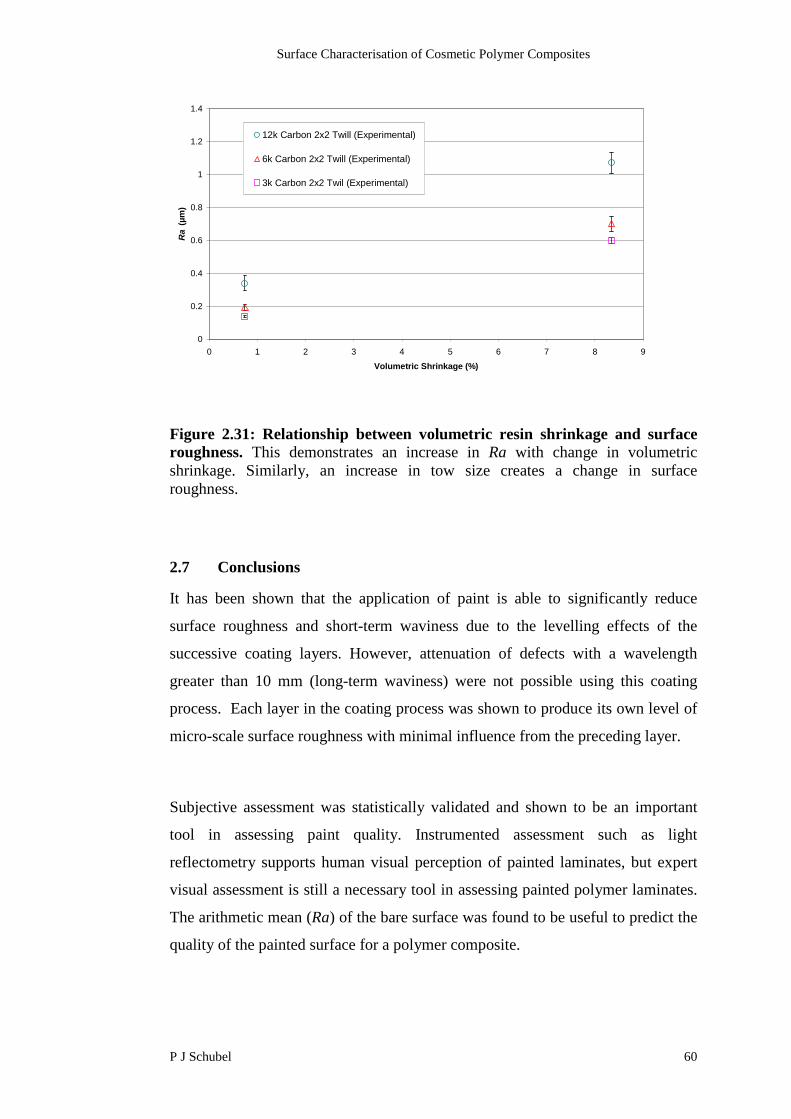
Surface Characterisation of Cosmetic Polymer Composites
P J Schubel 60
Figure 2.31: Relationship between volumetric resin shrinkage and surfaceroughness. This demonstrates an increase in Ra with change in volumetricshrinkage. Similarly, an increase in tow size creates a change in surfaceroughness.
2.7 Conclusions
It has been shown that the application of paint is able to significantly reduce
surface roughness and short-term waviness due to the levelling effects of the
successive coating layers. However, attenuation of defects with a wavelength
greater than 10 mm (long-term waviness) were not possible using this coating
process. Each layer in the coating process was shown to produce its own level of
micro-scale surface roughness with minimal influence from the preceding layer.
Subjective assessment was statistically validated and shown to be an important
tool in assessing paint quality. Instrumented assessment such as light
reflectometry supports human visual perception of painted laminates, but expert
visual assessment is still a necessary tool in assessing painted polymer laminates.
The arithmetic mean (Ra) of the bare surface was found to be useful to predict the
quality of the painted surface for a polymer composite.
0
0.2
0.4
0.6
0.8
1
1.2
1.4
0 1 2 3 4 5 6 7 8 9
Volumetric Shrinkage (%)
Ra
(µm
)
12k Carbon 2x2 Twill (Experimental)
6k Carbon 2x2 Twill (Experimental)
3k Carbon 2x2 Twil (Experimental)

Surface Characterisation of Cosmetic Polymer Composites
P J Schubel 61
The proven assessment methods: subjective, light reflectometry and stylus
profilometry, assisted in further understanding the effects of material and process
changes for polymer composite materials. Measured effects caused by tow size,
resin shrinkage and tool surface roughness provide a valuable predictive tool for
resulting surface quality. This helps to screen materials for surface quality
requirements whilst minimising the overall costs. Creating a highly polished
tooling surface has been shown to be an unnecessary process for the production of
cosmetic laminates. However, increased tooling surface roughness may affect
release of the component and increase residue build-up, which incurs increased
production costs. The use of surfacing layers on the laminate provides a means to
masking textile induced patterns and minor blemishes that have been reproduced
from the tool surface.
2.8 References
1. Neitzel, M., Blinzler, M., Edelmann, K., and Hoecker, F., Surface qualitycharacterisation of textile-reinforced thermoplastics. Polymer composite,2000. 21(4): p. 630-635.
2. Wenger, W., Dickson, G.R., McIlhagger, R., and Miller, P.P., The surface-finish characteristics of composite components. Materials ProcessTechnology, 1992. 33: p. 439-452.
3. Dickson, G.R. and McIlhagger, R., Assessing the surface finish of polymercomposite components. Journal of Machine Tools Manufacture, 1992. 32:p. 51-56.
4. Abraham, D. and McIlhagger, R., Investigations into various methods ofliquid injection to achieve mouldings with minimum void contents and fullwet out. Composites Part A: Applied Science and Manufacturing, 1998.29(5): p. 533-539.
5. Jeong, H., Effects of voids on the mechanical strength ultrasonicattenuation of laminated composites. Journal of Composite Materials,1997. 31(3): p. 276-292.
6. Sharkey, M., Optical imaging has its place in the paint and coatingindustry. Metal Finishing, 1998. 96(2): p. 69-77.
7. Vu-khanh, T. and Do-thanh, V., Predicting shrinkage in polyesterreinforced by glass fabrics. Journal of Composite Materials, 2000. 34(12):p. 998-1008.
8. Fahy, E.J., Modelling warpage in reinforced polymer disks. PolymerEngineering Science, 1998. 38(7): p. 1072-1084.
9. Choi, D.S. and Im, Y.T., Prediction of shrinkage and warpage inconsideration of residual stress in integrated simulation of injectionmoulding. Composite Structures, 1999. 47: p. 655-665.

Surface Characterisation of Cosmetic Polymer Composites
P J Schubel 62
10. Huang, C.K. and Yang, S.Y., Warping in advanced composite tools withvarying angles and radii. Composite: Part A, 1997. 28: p. 891-893.
11. Huang, M.C. and Tai, C.C., The effective factors in the warpage problemof an injection-moulded part with a thin shell feature. Journal of MaterialProcess Technology, 2001. 110: p. 1-9.
12. Kim, P.J. and Lee, D.G., Surface quality and shrinkage of composite bushousing panel manufactured by RTM. Composite Structures, 2002. 57: p.211-220.
13. Nauzin, J.P. and Jacobs, H., Paint finish in automotive bodies. Society ofautomotive engineers, 2002. 2002-01-0038.
14. ISO, Geometrical product specification (GPS) - Surface texture: Profilemethod - Terms, definitions and surface texture parameters. 2002. ISO4287:2000.
15. Geier, M.H., Quality handbook for composite materials. 1994, Chapman& Hall: London. p. 245-252.
16. Mitutoyo, Surftest 211 - surface roughness tester users manual. Vol.4360M. 2000, Malaysia.
17. Halden, M., Characterisation of steel sheet surfaces in order to predictsurface appearance after painting. IBEC, 1997: p. 115-120.
18. Scheers, J., Vermeulen, M., DeMare, C., and Meseure, K., Assessment ofsteel surface roughness and waviness in relation with paint appearance.Journal of Machine Tools Manufacting, 1998. 38(5): p. 647-656.
19. Kigle-Bockler, The new generation for understanding the appearance ofcoatings. 2002(http://www.bykgardner.com/html/byk/index.html).
20. Coulthard, M. On-line measurement of paint appearance on car bodies. inconference procedings from Surcar. 1993. Cannes.
21. Corus, 53544 steel specification. 2004.22. Kendall, K., Mould design for high volume resin transfer moulding, in
Mech. Eng., PhD Thesis. 1991, University of Nottingham: Nottingham.23. Wilks, C.E., Processing technologies for woven glass/polypropylene
composites, in Mech. Eng., PhD Thesis. 1999, University of Nottingham:Nottingham. p. 169.
24. Breyfogle, F.W., Implementing Six Sigma: Smarter solutions usingstatistical methods. 2nd ed. 1999, New York: John Wiley & Sons. 800.
Cure and Residual Volatile Assessment
P J Schubel 63
3 Cure and Residual Volatile Assessment
3.1 Introduction
Organic compounds are released into the atmosphere before, during and after
manufacture of polymer components, creating environmental and surface quality
issues. Such compounds are present in the constituents of the matrix or are
produced as a by-product of the polymerisation process. Unsaturated polyesters
were studied here due to the high styrene content required to act as both a cross-
linking agent and to control viscosity. This problem is compounded when
thermoplastic additives, with styrene as a solvent, are used to reduce
polymerisation shrinkage. Characteristics of low shrinkage polyester systems are
associated with high residual volatile organic compounds, notably styrene and
benzaldehyde.
The objectives of this study were to determine:
1. The effectiveness of residual reactivity detection as a means of measuring
residual styrene levels.
2. The effects of formulation and process conditions on styrene conversion.
3. The factors that contribute to the formation of benzaldehyde.
Three initiators and one low profile additive were tested using different curing
schedules and were characterised by differential scanning calorimetry (DSC),
thermogravimetric analysis (TGA) and gas chromatography (GC). Process
conditions that were investigated include the influence of:
1. Demould time.
2. Postcure temperature.
3. Ambient storage.
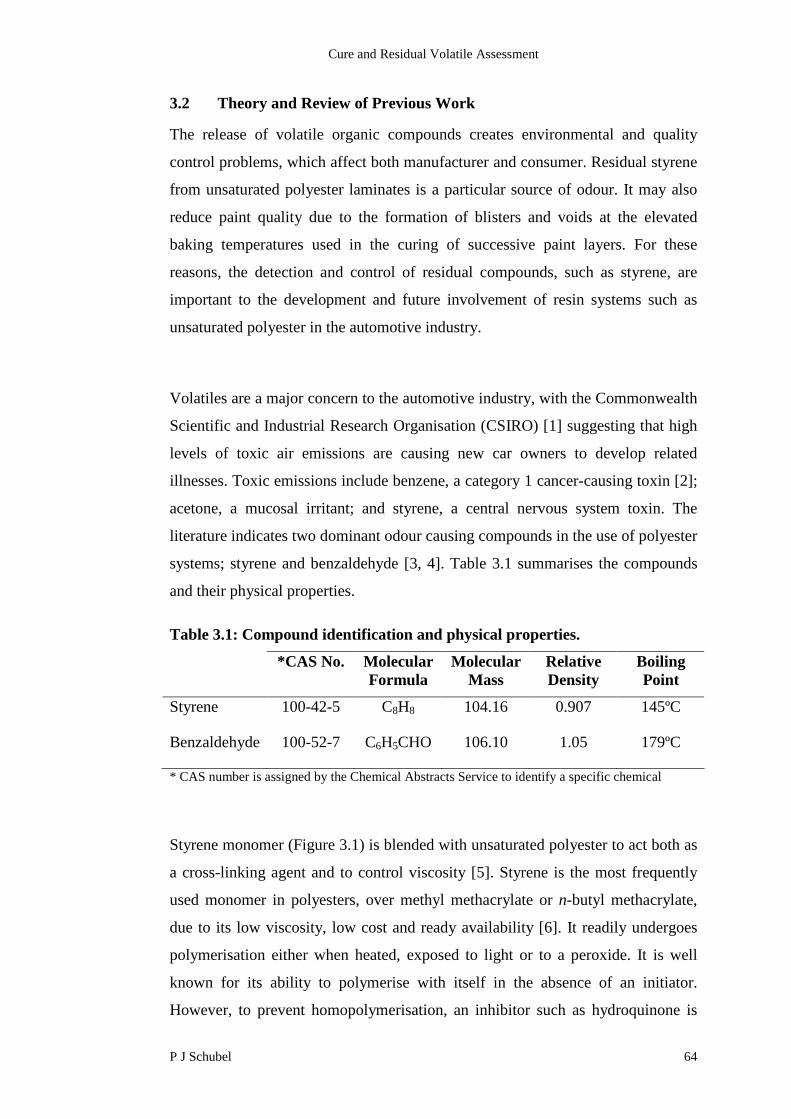
Cure and Residual Volatile Assessment
P J Schubel 64
3.2 Theory and Review of Previous Work
The release of volatile organic compounds creates environmental and quality
control problems, which affect both manufacturer and consumer. Residual styrene
from unsaturated polyester laminates is a particular source of odour. It may also
reduce paint quality due to the formation of blisters and voids at the elevated
baking temperatures used in the curing of successive paint layers. For these
reasons, the detection and control of residual compounds, such as styrene, are
important to the development and future involvement of resin systems such as
unsaturated polyester in the automotive industry.
Volatiles are a major concern to the automotive industry, with the Commonwealth
Scientific and Industrial Research Organisation (CSIRO) [1] suggesting that high
levels of toxic air emissions are causing new car owners to develop related
illnesses. Toxic emissions include benzene, a category 1 cancer-causing toxin [2];
acetone, a mucosal irritant; and styrene, a central nervous system toxin. The
literature indicates two dominant odour causing compounds in the use of polyester
systems; styrene and benzaldehyde [3, 4]. Table 3.1 summarises the compounds
and their physical properties.
Table 3.1: Compound identification and physical properties.
*CAS No. MolecularFormula
MolecularMass
RelativeDensity
BoilingPoint
Styrene 100-42-5 C8H8 104.16 0.907 145ºC
Benzaldehyde 100-52-7 C6H5CHO 106.10 1.05 179ºC
* CAS number is assigned by the Chemical Abstracts Service to identify a specific chemical
Styrene monomer (Figure 3.1) is blended with unsaturated polyester to act both as
a cross-linking agent and to control viscosity [5]. Styrene is the most frequently
used monomer in polyesters, over methyl methacrylate or n-butyl methacrylate,
due to its low viscosity, low cost and ready availability [6]. It readily undergoes
polymerisation either when heated, exposed to light or to a peroxide. It is well
known for its ability to polymerise with itself in the absence of an initiator.
However, to prevent homopolymerisation, an inhibitor such as hydroquinone is
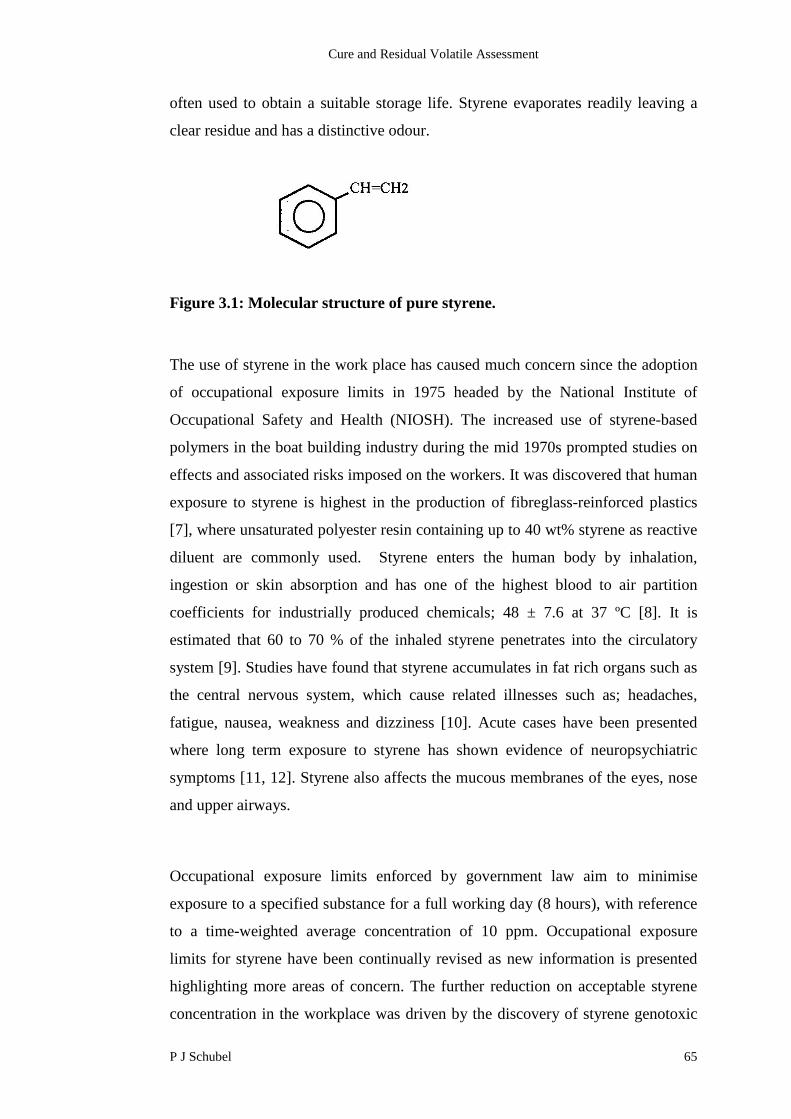
Cure and Residual Volatile Assessment
P J Schubel 65
often used to obtain a suitable storage life. Styrene evaporates readily leaving a
clear residue and has a distinctive odour.
Figure 3.1: Molecular structure of pure styrene.
The use of styrene in the work place has caused much concern since the adoption
of occupational exposure limits in 1975 headed by the National Institute of
Occupational Safety and Health (NIOSH). The increased use of styrene-based
polymers in the boat building industry during the mid 1970s prompted studies on
effects and associated risks imposed on the workers. It was discovered that human
exposure to styrene is highest in the production of fibreglass-reinforced plastics
[7], where unsaturated polyester resin containing up to 40 wt% styrene as reactive
diluent are commonly used. Styrene enters the human body by inhalation,
ingestion or skin absorption and has one of the highest blood to air partition
coefficients for industrially produced chemicals; 48 ± 7.6 at 37 ºC [8]. It is
estimated that 60 to 70 % of the inhaled styrene penetrates into the circulatory
system [9]. Studies have found that styrene accumulates in fat rich organs such as
the central nervous system, which cause related illnesses such as; headaches,
fatigue, nausea, weakness and dizziness [10]. Acute cases have been presented
where long term exposure to styrene has shown evidence of neuropsychiatric
symptoms [11, 12]. Styrene also affects the mucous membranes of the eyes, nose
and upper airways.
Occupational exposure limits enforced by government law aim to minimise
exposure to a specified substance for a full working day (8 hours), with reference
to a time-weighted average concentration of 10 ppm. Occupational exposure
limits for styrene have been continually revised as new information is presented
highlighting more areas of concern. The further reduction on acceptable styrene
concentration in the workplace was driven by the discovery of styrene genotoxic
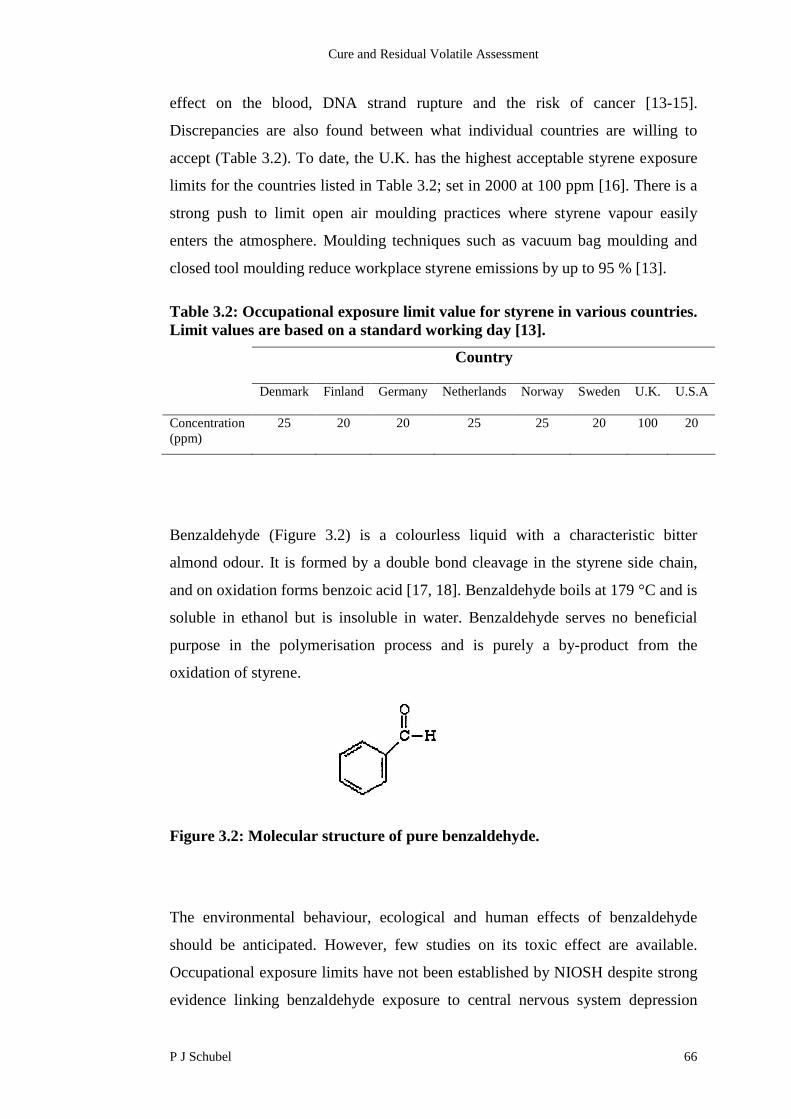
Cure and Residual Volatile Assessment
P J Schubel 66
effect on the blood, DNA strand rupture and the risk of cancer [13-15].
Discrepancies are also found between what individual countries are willing to
accept (Table 3.2). To date, the U.K. has the highest acceptable styrene exposure
limits for the countries listed in Table 3.2; set in 2000 at 100 ppm [16]. There is a
strong push to limit open air moulding practices where styrene vapour easily
enters the atmosphere. Moulding techniques such as vacuum bag moulding and
closed tool moulding reduce workplace styrene emissions by up to 95 % [13].
Table 3.2: Occupational exposure limit value for styrene in various countries.Limit values are based on a standard working day [13].
Country
Denmark Finland Germany Netherlands Norway Sweden U.K. U.S.A
Concentration(ppm)
25 20 20 25 25 20 100 20
Benzaldehyde (Figure 3.2) is a colourless liquid with a characteristic bitter
almond odour. It is formed by a double bond cleavage in the styrene side chain,
and on oxidation forms benzoic acid [17, 18]. Benzaldehyde boils at 179 °C and is
soluble in ethanol but is insoluble in water. Benzaldehyde serves no beneficial
purpose in the polymerisation process and is purely a by-product from the
oxidation of styrene.
Figure 3.2: Molecular structure of pure benzaldehyde.
The environmental behaviour, ecological and human effects of benzaldehyde
should be anticipated. However, few studies on its toxic effect are available.
Occupational exposure limits have not been established by NIOSH despite strong
evidence linking benzaldehyde exposure to central nervous system depression
Cure and Residual Volatile Assessment
P J Schubel 67
[19]. The American Industrial Hygiene Association (AIHA) have realised the
potential hazards of benzaldehyde and have published workplace environmental
exposure limits for a full working day at 2 ppm [20]. The benzaldehyde threshold
concentration is 10 times below that of the general styrene threshold, indicating
the strong volatility of benzaldehyde. On-going research into the effects of long-
term exposure to benzaldehyde will undoubtedly highlight the need for
classification of the compound, allowing for regulated, safe exposure.
Environmental exposure limits are determined by monitoring organic compound
vapours using activated charcoal tube or carbon cloth absorption at respiratory
level during an 8 hour shift (ASTM D3686-95 and D3687-95). Thermal
desorption techniques are commonly used to elute the organic compounds from
the absorption medium, which are analysed by gas chromatography (GC) [21, 22].
This method is a fast and reliable means of environmental compound detection.
However, it does not relate to the total residual compound content within the
sample piece which may be released over the life of the part. A limited amount of
research has been conducted into the effects of resin system, curing agent and
reaction conditions on residual compounds in unsaturated polyesters [4, 23, 24].
Available methods to determine residual compounds (in particular styrene
content) include gas chromatography [4, 23, 25, 26], nuclear magnetic resonance
[27] and infrared spectroscopy [3, 28, 29]; gas chromatography has been the most
commonly used among them. Solvent elution methods based around gas
chromatography detection are primarily used for this purpose (ISO 4901:1985)
[30].
Reported Factors Affecting Volatile Organic Content
The increasing push from the automotive industry to produce cheap polymer
based materials with acceptable surface quality, has led manufacturers to
introduce shrinkage control additives into unsaturated polyesters (Section 1.3.2).
Low profile additives such as poly(vinyl acetate) (PVAc) can contain up to 60 %
styrene as solvent and the use of these additives further increases the styrene
content in the formulations. Also, the reaction exotherm may decrease because

Cure and Residual Volatile Assessment
P J Schubel 68
LPA is a non-reactive component in the system. The presence of excess styrene is
potentially a major source of volatile production in the moulded article. Literature
has also shown the potential for benzaldehyde production through oxidation of
excess styrene. This phenomenon was observed for 4 mm laminates containing
35 vol% random E-glass fibre and saturated polyester LPA [4]. Solvent desorption
gas chromatography showed that the inclusion of a LPA such as saturated
polyester (30 wt% styrene) increased the residual styrene two-fold and the
residual benzaldehyde seven-fold over a storage period of one month (Figure 3.3).
The increased benzaldehyde levels in the LPA based formulation were attributed
to oxidation of excess styrene.
0
0.1
0.2
0.3
0.4
0.5
0.6
0.7
UP UP+LPA
%m
ass
of
ben
zald
eh
yd
e 1 day
7 days
30 days
Figure 3.3: Influence of a saturated polyester LPA on the residualbenzaldehyde levels of a maleic anhydride unsaturated polyester [4].Measurements were recorded over a period of 30 days with the low profile systemshowing a dramatic increase in residual benzaldehyde levels as time progressed.Constituents are listed in Table 3.3.
Table 3.3: Constituents used by Reijnders [4] for the production of laminatesin Figure 3.3.
UP UP+LPAMaleic anhydride polyester(wt%)
100 75
LPA – saturated polyester(wt%)
25
Butanox M-50 (wt%) 2 2Accelerator NL-49P (wt%) 1 1Mould temp (°C) 70 70
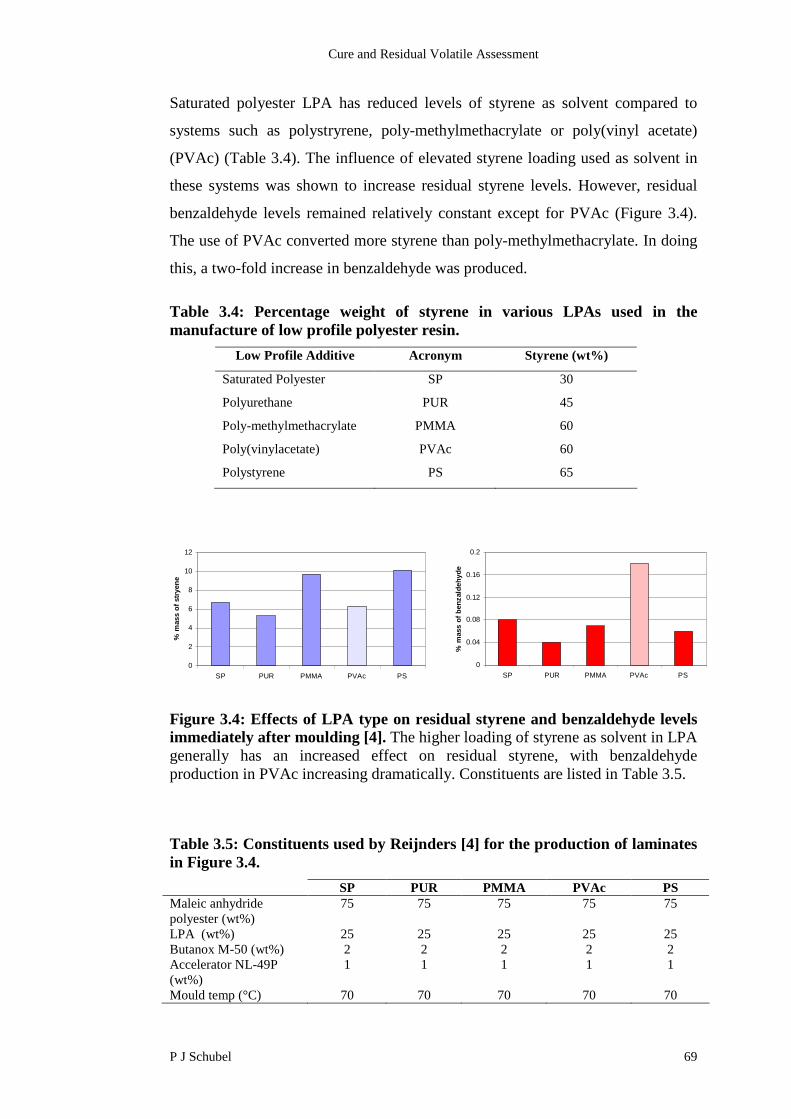
Cure and Residual Volatile Assessment
P J Schubel 69
Saturated polyester LPA has reduced levels of styrene as solvent compared to
systems such as polystryrene, poly-methylmethacrylate or poly(vinyl acetate)
(PVAc) (Table 3.4). The influence of elevated styrene loading used as solvent in
these systems was shown to increase residual styrene levels. However, residual
benzaldehyde levels remained relatively constant except for PVAc (Figure 3.4).
The use of PVAc converted more styrene than poly-methylmethacrylate. In doing
this, a two-fold increase in benzaldehyde was produced.
Table 3.4: Percentage weight of styrene in various LPAs used in themanufacture of low profile polyester resin.
Low Profile Additive Acronym Styrene (wt%)
Saturated Polyester SP 30
Polyurethane PUR 45
Poly-methylmethacrylate PMMA 60
Poly(vinylacetate) PVAc 60
Polystyrene PS 65
Figure 3.4: Effects of LPA type on residual styrene and benzaldehyde levelsimmediately after moulding [4]. The higher loading of styrene as solvent in LPAgenerally has an increased effect on residual styrene, with benzaldehydeproduction in PVAc increasing dramatically. Constituents are listed in Table 3.5.
Table 3.5: Constituents used by Reijnders [4] for the production of laminatesin Figure 3.4.
SP PUR PMMA PVAc PSMaleic anhydridepolyester (wt%)
75 75 75 75 75
LPA (wt%) 25 25 25 25 25Butanox M-50 (wt%) 2 2 2 2 2Accelerator NL-49P(wt%)
1 1 1 1 1
Mould temp (°C) 70 70 70 70 70
0
2
4
6
8
10
12
SP PUR PMMA PVAc PS
%m
ass
of
str
yen
e
0
0.04
0.08
0.12
0.16
0.2
SP PUR PMMA PVAc PS
%m
ass
of
ben
zald
eh
yd
e
Cure and Residual Volatile Assessment
P J Schubel 70
This section has outlined the residual compound issues associated with
unsaturated polyester moulding and the potential effects it creates. Attention has
been drawn to the presence of residual styrene and subsequent benzaldehyde
production in moulded laminates utilising a low profile additive. As mentioned in
Section 1.3.2, PVAc was the most efficient additive in unsaturated polyester for
reducing resin shrinkage and producing a low profile effect. However, Reijnder
suggests that the residual benzaldehyde associated with this system is more than
double that of competing PMMA systems. Current theories of benzaldehyde
production due to styrene oxidisation have been proven, but there is evidence to
suggest there is an underpinning mechanism in LPA that influences the formation
of residual benzaldehyde. Experimental evidence is required to show that LPA
affects residual benzaldehyde content, over that of adding excess styrene. This
will lay the basis to focus future research on the development of alternative low
profiling systems which are inert to producing chemical by-products that are
unpleasant and potentially harmful to human senses. Hence, it has been
determined to study the influence of formulation and process variables and
measure the resulting residual styrene and benzaldehyde content.
3.3 Experimental Method
A resin transfer moulding process (described in Section 2.5.2) was used to
impregnate E-glass preforms with unsaturated polyester resin. The resin system
was formulated to cure at 95 ºC, with initial surface quality results in Section 2.6.2
showing suitable paint quality resulting from a low profile unsaturated polyester
system. There was no evidence of fibre strike-through or textile induced waviness
and the measured surface characteristics were equivalent to semi-pregs and
carbon/epoxy composites produced using RTM.
The base resin was Crystic® (RT2557) orthophthalic unsaturated polyester,
supplied by Scott Bader Company and is described in Section 2.5.1 along with the
reinforcement. Three initiators supplied by Akzo Nobel were used. Each was
designed for moulding between 60 and 95 ºC.

Cure and Residual Volatile Assessment
P J Schubel 71
1. Tertiary-Butyl peroxybenzoate initiator in 80% solution with
acetylacetone (TBPB) (Trigonox® 93)
2. Acetyl acetone peroxide and tert-Butyl peroxybenzoate in solvents
(AAP/TBPB) (Trigonox® 524)
3. Tertiary-Butyl peroxy-2-ethylhexanoate (TBPEH) (Trigonox® 21).
Cobalt accelerator G, supplied by Scott Bader Company, is a mix of 12 % cobalt-
octoate solution in mineral oil, diluted to 1 % with styrene (AAO 17730). Calcium
carbonate (CaCO3) filler with a 5.7 µm nominal particle size was supplied by
Omya UK Ltd and used at 30 wt% of resin. A summary of the test laminate
constituents is set out in Table 3.6.
Table 3.6: Constituents
Constituent Supplier Product Description
Base resin Scott Bader Crystic Orthophthalicunsat’ polyester
Low Profileadditive
Dow Chemicals PVAc with 60wt%styrene
Thermoplastic instyrene
Filler Omya UK BLR2 CaCO3 @ 5.7µm
Initiator Akzo Nobel Trigonox 93 TBPB in solution
Akzo Nobel Trigonox 524 AAP/ TBPB
Akzo Nobel Trigonox 21 TBPEH
Accelerator Scott Bader Accelerator G
Reinforcement Owens Corning OC R25H 1200 tex
Veil Owens Corning OC 950A-AB 3307 tex
Binder Reichhold Pretex 110 Bisphenol A 95%Dicyandiamide 5%
Isothermal DSC analysis was adopted to determine the residual reactivity of three
unsaturated polyester matrices utilising different initiator systems. Analysis of
resin flash from the laminates was performed using a Perkin Elmer Pyris 1
differential scanning calorimeter. ISO 11357-1:1997 was followed in order to
estimate the degree of cure as follows. An initial baseline run was conducted by
placing an empty pan in each sample holder and ramping the temperature at 10 ºC
Cure and Residual Volatile Assessment
P J Schubel 72
/minute to 220 ºC under nitrogen. The baseline was then subtracted from each
individual analysis to compensate for any change in detectable heat flow between
the two heated chambers. 12 ± 1 mg of sample was contained in a hermetically
sealed aluminium pan to prevent weight loss due to evaporation of volatiles. The
temperature was then ramped to 220 ºC under the same settings and the
exothermic heat of reaction was monitored. The degree of residual reactivity (1-α)
at time t was determined from Equation 1.5 as:
dtdt
d
Ht
t
tot
0
1)(1
[3.1]
where (dα/dt) is the DSC output in J/g/min and ΔHtot is the total heat of cure in
J/g. The value of ΔHtot was obtained by DSC analysis on an initially uncured
sample of similar mass.
Thermogravimetric analysis (TGA) was performed on resin flash to determine
mass loss due to residual volatile emission from the sample matrix. This process is
commonly used in polymer matrices for determination of organic compounds, as
it allows variable heating rates that can be manipulated to simulate the
environment and application of intent. However, for the purpose of this
experiment, TGA was used to evaporate all available surface compounds for
detection using a Perkin Elmer Pyris 1 instrument. 10 to 20 mg of the sample was
heated in air from ambient to 250 ºC at a rate of 10 ºC/ min. The composition of
the exhaust was sampled using a Pfeiffer Thermostar mass spectrometer. Any
gases detected could then be overlaid on the thermogravimetric trace to correlate
weight loss with emission composition.
There were concerns that TGA only released surface volatiles and that the
polymer matrix could potentially trap organic compounds within it. To determine
whether this was occurring, a common method of organic compound detection
was employed. Solvent elution gas chromatography (Figure 3.5) was used to
determine the total residual compound content within the resin matrix. Solvent
elution GC was chosen over thermal desorption GC, as solvent solution breaks
Cure and Residual Volatile Assessment
P J Schubel 73
down the polymer, exposing all areas of the matrix for elution of the compounds,
whereas thermal desorption and TGA are part of the same family, and rely on
heating the sample to remove surface compounds. Detection of compounds and
compound intensity was obtained on a Shimadzu GC 17A version 3 analyser with
an automated sampler. A calibration curve was developed to enable the voltage
response to be converted to a percentage mass of compound within the resin-fibre
composite (Appendix 5). This allowed direct comparison of results to published
work. Guidelines of ISO 4901:1985 were followed. Validation of experimental
techniques (Appendix 6) was conducted to ensure suitable sample mass and
solvent desorption time was allowed for sufficient elution of compounds. It was
shown that the polymerised resin/filler/fibre composite cut into samples of
1.5 0.1g and immersed in a sealed 15 mL glass vial containing dichloromethane
for 15 hours resulted in optimal elution of styrene and benzaldehyde compounds.
0.5 μL of eluted solution was injected into the split injector for analysis. The
injected solution was heated from 40 ºC to 270 ºC at a rate of 10 ºC/min and
passed through a DB5 alumina silicate tubing of length 30 m and inner diameter
of 0.25 mm. The column is coated with a stationary phase of 95 % dimethyl and 5
% diphenyl polysiloxane.
Due to the small sample size used in the experimental techniques (10 to 20 mg),
there were concerns with samples not being representative of the entire test
laminate due to their heterogeneous nature. To account for this, at least four
samples were systematically taken from various locations on the plaque.

Cure and Residual Volatile Assessment
P J Schubel 74
Figure 3.5: Gas chromatography equipment.
3.4 Results and Discussion
3.4.1 Introduction
The test matrix of samples seen in Table 3.7 were produced using as-moulded and
postcured samples with three different initiators. The samples were chosen by
degree and nature of odour being emitted. Subjective odour assessment rated
AAP/TBPB the most disturbing odour, followed by TBPEH and TBPB. DSC,
TGA and GC were conducted on these samples to determine cure characteristics,
volatile emissions and total compound content. Table 3.8 is an overview of the
parameter levels that were studied. The work can be split into formulation studies
and process studies.
Table 3.7: Standard moulding constituents and parameters.
Resin Initiator (%) Accr (%) Mould Temp(ºC)
Demould Time(min)
RT2557+30wt%PVAc
TBPEH (1.8) 95 30
RT2557+30wt%PVAc
AAP/TBPB (2) G (1) 95 30
RT2557+30wt%PVAc
TBPB (2) G (0.5) 95 30
SampleHolder
InjectionHead
ChromatographContaining Columnand FlameIonisation Detector
Output Screen
AutomatedSampler
Cure and Residual Volatile Assessment
P J Schubel 75
Table 3.8: Matrix of variables used in the manufacture of test laminates.
Variables Description Range
Initiator system Trigonox 93 2%Trigonox 21 1.80%
Trigonox 524 2%
Low profile additive PVAc 0 & 30%
Fo
rmu
lati
on
Va
ria
ble
s
Cobalt loading Accelerator G 0 - 2%
Demould time 10 - 60 mins
Postcure rates 80 - 110 ºC
Pro
cess
Va
ria
ble
s
Ambient storage 0 - 60 days
3.4.2 Cure Efficiency
Three laminates were moulded using the constituents in Table 3.7 with half of
each laminate undergoing postcure. The residual reactivity of the three laminates
was measured using DSC to determine conversion before and after postcure. DSC
results shown in Figure 3.6 suggest greater than 94 % conversion with only a 3 %
average increase upon postcure for all samples. Assuming that the resin mixture is
not biased towards styrene, this would indicate that the cross-linking reaction has
proceeded to a point where the rate-limiting step is the rate of diffusion of reactive
species. There may be active sites available on the polyester chain but styrene
radicals are unable to reach theses sites. The DSC analysis runs to temperatures
much higher than the cure temperature of the resin (95 ºC) and since diffusion
rates are temperature dependant this may push the cross-linking reaction closer to
completion. However, the higher temperatures also increase the rate of styrene
homopolymerisation and so the true residual reactivity is not clear.
TGA was used to monitor the evaporative loss of residual styrene from the three
test samples. The derivative mass loss (Figure 3.7) shows a distinct decline for the
TBPEH laminate at approximately 145 ºC, which corresponds to the boiling point
of styrene. The total mass loss for the TBPEH sample at 145 ºC was 5.6 % with
AAP/TBPB and TBPB producing smaller losses of 2.0 % and 1.3 % respectively.
Mass spectrometry was ineffective due to the undetectable levels of volatiles
being emitted at each sampling interval over the run period.
Cure and Residual Volatile Assessment
P J Schubel 76
The total content of residual compounds in the three test samples was detected
using GC to determine if the levels of residual styrene matched those via TGA.
Figure 3.8 suggests residual styrene detected using GC was on average 20 %
higher. The TBPEH initiated specimen exhibited a total 7.3 % residual styrene
with a drop in levels for AAP/TBPB and TBPB to 2.5 % and 1.5 % respectively.
Postcuring reduced residual styrene in each case. However, the reduction was not
uniform. Only in the case of TBPB did postcuring reduce the residual styrene to a
negligible level.
GC was conducted on TGA samples taken up to 150 ºC to determine if residual
styrene remained within the samples. The results (Figure 3.8) show that residual
styrene remained within all samples after undergoing the heat desorption of the
TGA process. However, the residual styrene level for TBPB was negligible. A
summation of the TGA and post TGA results from Figure 3.8, equate closely to
the standard as-moulded results. It is unlikely that the discrepancies between the
residual volatiles emitted in TGA and the total residual compound in GC are
related to the variation in sample size, as all results are normalised to a unit mass.
The discrepancies might be attributed to the compounds in the network structure
being unable to evaporate due to physical entrapment (diffusion limited). This
phenomenon has been reported [31, 32], with Zetterlund [31] discovering that
significant trapping of radicals commences after a conversion of approximately 40
%.
The residual benzaldehyde levels of the three systems were monitored by GC
(Figure 3.9). The AAP/TBPB system exhibited the highest residual benzaldehyde
levels in the as-moulded state, with a 100 % increase upon postcure.
Benzaldehyde increase upon postcure was not observed in the TBPEH and TBPB
systems. Reijnders [4] noted an increase in residual benzaldehyde upon postcure
when using a peroxide (Butanox M-50) accelerated with cobalt. The results for
AAP/TBPB (accelerated by cobalt) support Reijnders findings. However, the
TBPB (also accelerated by cobalt) does not. The reason for this is not obvious, but
a study of the oxygen consumption rate for each system may help to explain the

Cure and Residual Volatile Assessment
P J Schubel 77
differences, as increased reactivity with oxygen will promote oxidisation of
residual styrene to form benzaldehyde upon additional heat input.
Figure 3.6: Residual reactivity detected by DSC of resin flash containingRT2557+30wt% PVAc+30wt% CaCO3 with 3 initiator systems. All systemsappear to be well cured with an average reduction of 3 % residual reactivity uponpostcure.
Figure 3.7: TGA on resin flash containing RT2557+30wt% PVAc+30wt%CaCO3 with 3 initiator systems showing mass loss against temperature. TheTBPEH system shows a 5.6 % mass loss corresponding to the evaporation pointof styrene, with lower levels calculated for the other systems.
-0.8
-0.7
-0.6
-0.5
-0.4
-0.3
-0.2
-0.1
0
0 50 100 150 200 250 300
Temp (ºC)
Deri
vative
Weig
htLoss
dW
/dt
AAP/TBPB
TBPEH
TBPB
0
2
4
6
8
TBPEH AAP/TBPB TBPB
Resid
ual
Reacti
vit
y(%
)As moulded
Postcured
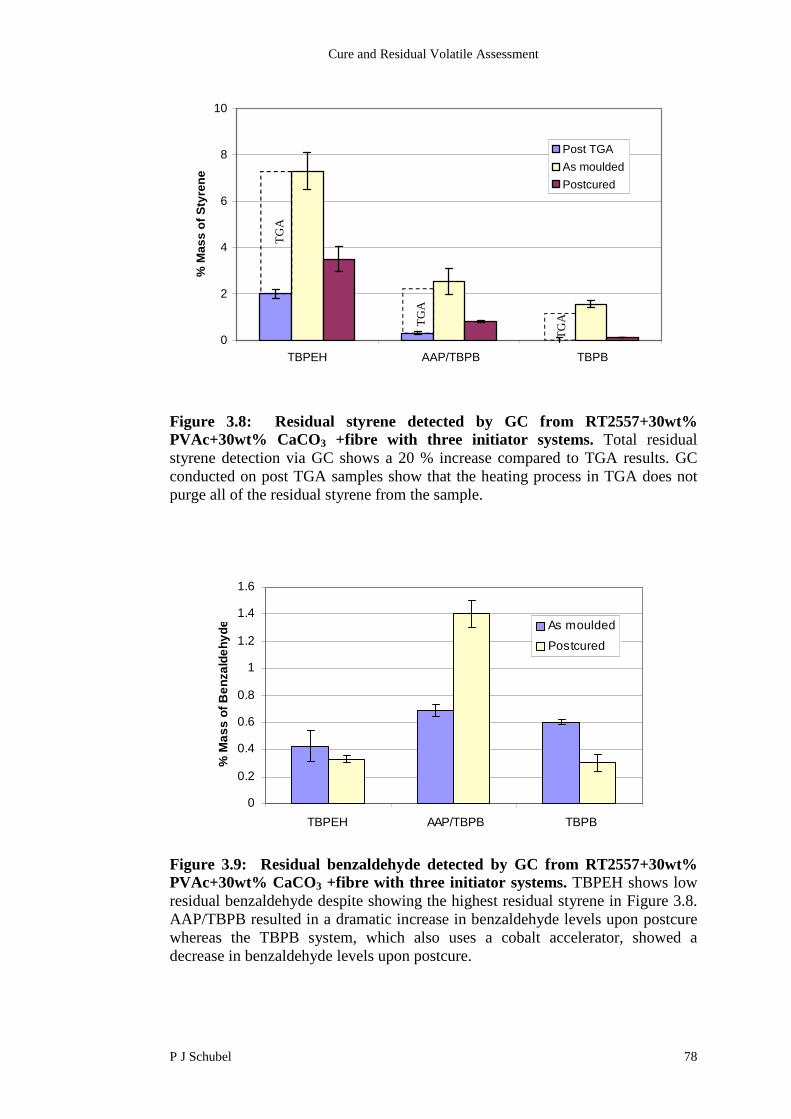
Cure and Residual Volatile Assessment
P J Schubel 78
0
2
4
6
8
10
TBPEH AAP/TBPB TBPB
%M
as
so
fS
tyre
ne
Post TGA
As moulded
Postcured
Figure 3.8: Residual styrene detected by GC from RT2557+30wt%PVAc+30wt% CaCO3 +fibre with three initiator systems. Total residualstyrene detection via GC shows a 20 % increase compared to TGA results. GCconducted on post TGA samples show that the heating process in TGA does notpurge all of the residual styrene from the sample.
Figure 3.9: Residual benzaldehyde detected by GC from RT2557+30wt%PVAc+30wt% CaCO3 +fibre with three initiator systems. TBPEH shows lowresidual benzaldehyde despite showing the highest residual styrene in Figure 3.8.AAP/TBPB resulted in a dramatic increase in benzaldehyde levels upon postcurewhereas the TBPB system, which also uses a cobalt accelerator, showed adecrease in benzaldehyde levels upon postcure.
TG
A
TG
ATG
A
0
0.2
0.4
0.6
0.8
1
1.2
1.4
1.6
TBPEH AAP/TBPB TBPB
%M
as
so
fB
en
za
lde
hy
de As moulded
Postcured
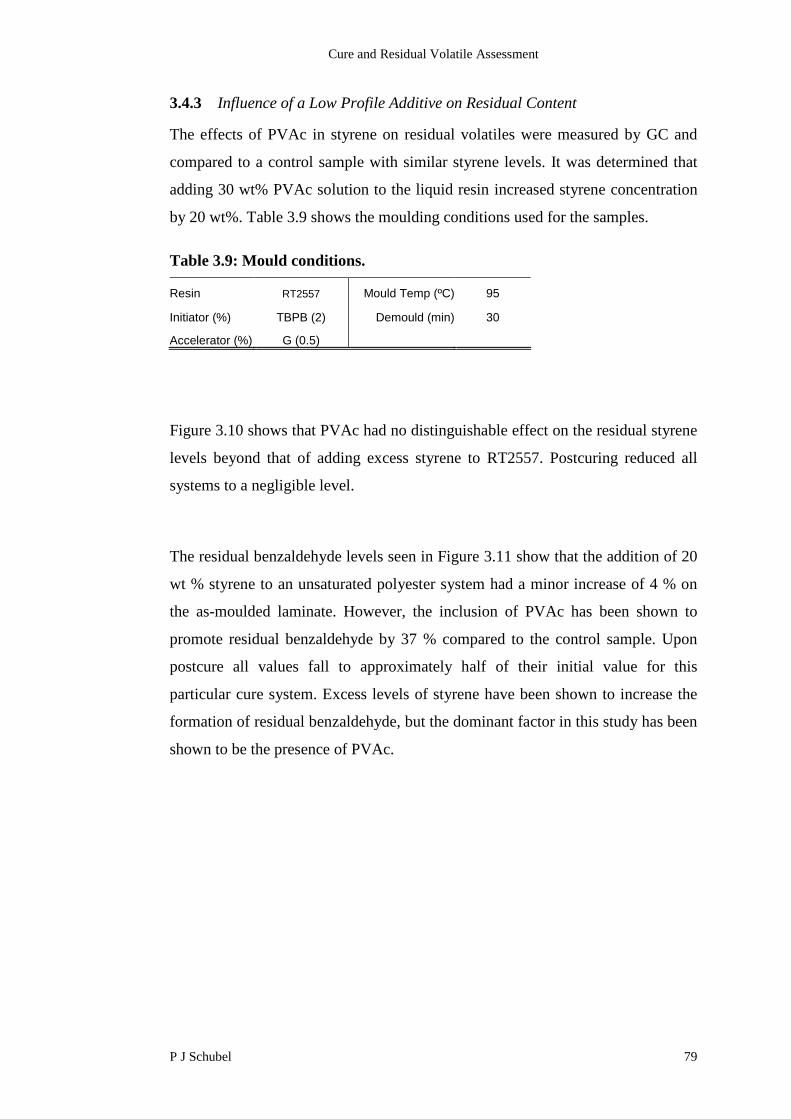
Cure and Residual Volatile Assessment
P J Schubel 79
3.4.3 Influence of a Low Profile Additive on Residual Content
The effects of PVAc in styrene on residual volatiles were measured by GC and
compared to a control sample with similar styrene levels. It was determined that
adding 30 wt% PVAc solution to the liquid resin increased styrene concentration
by 20 wt%. Table 3.9 shows the moulding conditions used for the samples.
Table 3.9: Mould conditions.
Resin RT2557 Mould Temp (ºC) 95
Initiator (%) TBPB (2) Demould (min) 30
Accelerator (%) G (0.5)
Figure 3.10 shows that PVAc had no distinguishable effect on the residual styrene
levels beyond that of adding excess styrene to RT2557. Postcuring reduced all
systems to a negligible level.
The residual benzaldehyde levels seen in Figure 3.11 show that the addition of 20
wt % styrene to an unsaturated polyester system had a minor increase of 4 % on
the as-moulded laminate. However, the inclusion of PVAc has been shown to
promote residual benzaldehyde by 37 % compared to the control sample. Upon
postcure all values fall to approximately half of their initial value for this
particular cure system. Excess levels of styrene have been shown to increase the
formation of residual benzaldehyde, but the dominant factor in this study has been
shown to be the presence of PVAc.
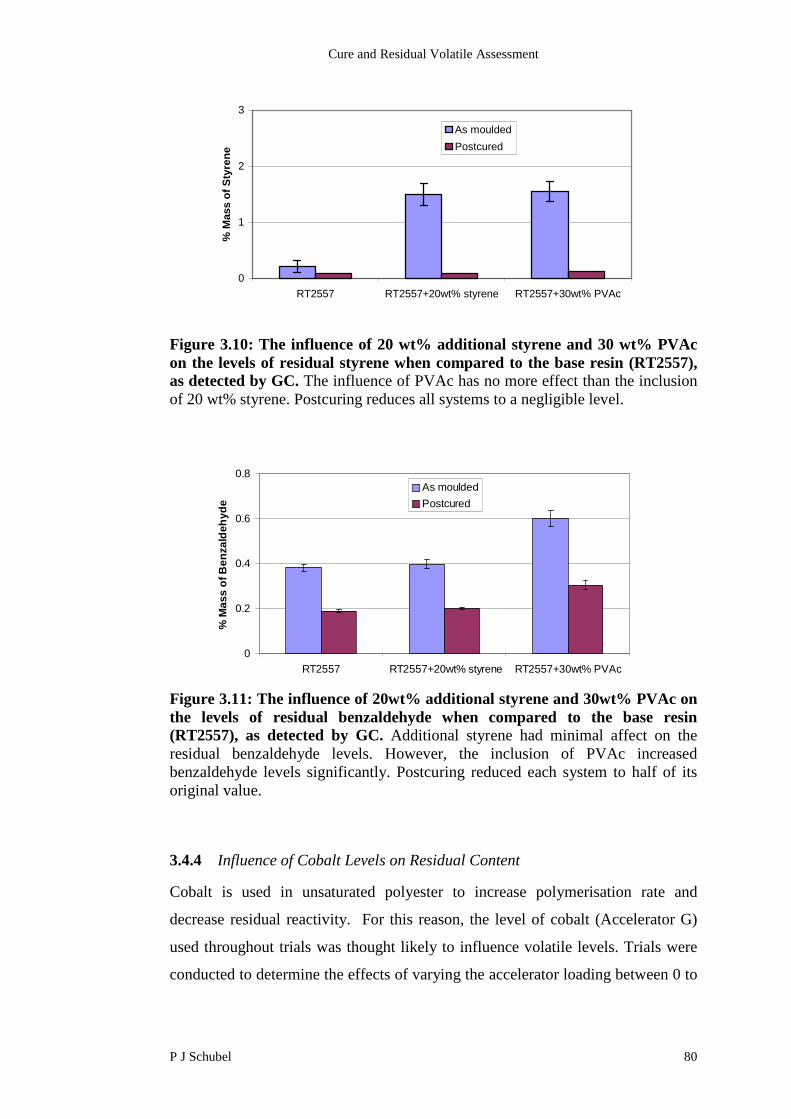
Cure and Residual Volatile Assessment
P J Schubel 80
0
1
2
3
RT2557 RT2557+20wt% styrene RT2557+30wt% PVAc
%M
ass
of
Sty
ren
e
As moulded
Postcured
Figure 3.10: The influence of 20 wt% additional styrene and 30 wt% PVAcon the levels of residual styrene when compared to the base resin (RT2557),as detected by GC. The influence of PVAc has no more effect than the inclusionof 20 wt% styrene. Postcuring reduces all systems to a negligible level.
Figure 3.11: The influence of 20wt% additional styrene and 30wt% PVAc onthe levels of residual benzaldehyde when compared to the base resin(RT2557), as detected by GC. Additional styrene had minimal affect on theresidual benzaldehyde levels. However, the inclusion of PVAc increasedbenzaldehyde levels significantly. Postcuring reduced each system to half of itsoriginal value.
3.4.4 Influence of Cobalt Levels on Residual Content
Cobalt is used in unsaturated polyester to increase polymerisation rate and
decrease residual reactivity. For this reason, the level of cobalt (Accelerator G)
used throughout trials was thought likely to influence volatile levels. Trials were
conducted to determine the effects of varying the accelerator loading between 0 to
0
0.2
0.4
0.6
0.8
RT2557 RT2557+20wt% styrene RT2557+30wt% PVAc
%M
as
so
fB
en
za
lde
hy
de
As moulded
Postcured

Cure and Residual Volatile Assessment
P J Schubel 81
2 wt% (the maximum recommended by the supplier). An unsaturated polyester/
TBPB system was used as a representative matrix (Table 3.10).
Table 3.10: Mould conditions.
ResinRT2557
+30 wt% PVAc+30 wt% CaCO3 Mould Temp (ºC) 95
Initiator (%) TBPB (2) Demould (min) 30
Accelerator (%) G (As specified)
Figure 3.12 shows that residual styrene levels fell dramatically as accelerator
loading increased to 1 %. Thereafter the residual styrene stabilised at 0.35 %,
demonstrating that a stoichiometric loading was achieved. Upon postcure the
residual styrene levels were negligible. The only exception here was the
accelerator-free formulation. This maybe attributed to the two-stage reaction
associated with this initiator, which requires a cobalt accelerator to promote the
first stage. Once decomposition has started, an exotherm is produced which
allows the second stage to complete the polymerisation process (Section 1.3).
Residual benzaldehyde (Figure 3.13) showed a steady increase with additional
cobalt up to 1 wt% accelerator loading. At 0 wt% accelerator loading, the
benzaldehyde levels increased upon postcure, demonstrating that the
polymerisation process in the mould was incomplete and further heating in the
postcure cycle continued the cure process to produce benzaldehyde.
The reaction rate will result in an increase in the reaction temperature Equation
1.1, which was seen when increasing the accelerator content (Figure 3.14). As the
rate of the benzaldehyde side reaction is temperature dependant, we would expect
the residual levels to increase with increased reaction rate. As a result, we see
Figure 3.13 and Figure 3.14 showing related trends.
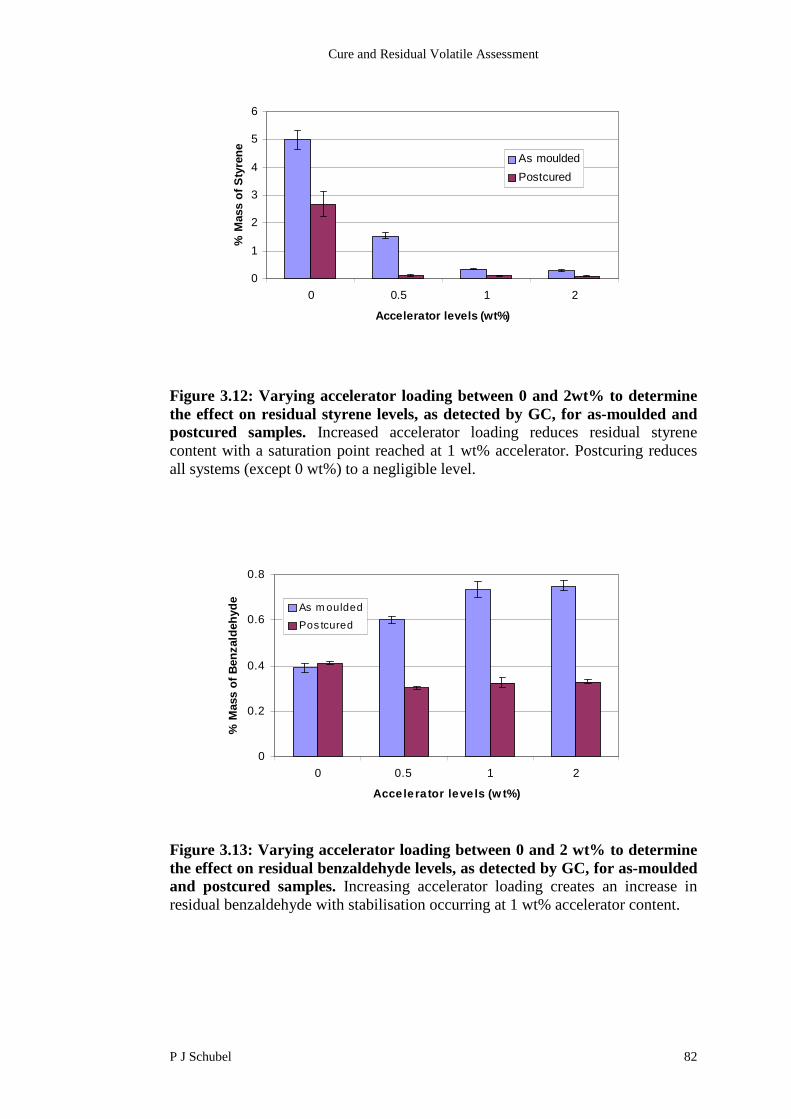
Cure and Residual Volatile Assessment
P J Schubel 82
Figure 3.12: Varying accelerator loading between 0 and 2wt% to determinethe effect on residual styrene levels, as detected by GC, for as-moulded andpostcured samples. Increased accelerator loading reduces residual styrenecontent with a saturation point reached at 1 wt% accelerator. Postcuring reducesall systems (except 0 wt%) to a negligible level.
Figure 3.13: Varying accelerator loading between 0 and 2 wt% to determinethe effect on residual benzaldehyde levels, as detected by GC, for as-mouldedand postcured samples. Increasing accelerator loading creates an increase inresidual benzaldehyde with stabilisation occurring at 1 wt% accelerator content.
0
0.2
0.4
0.6
0.8
0 0.5 1 2
Accelerator leve ls (w t%)
%M
ass
of
Ben
zald
eh
yd
e
As m oulded
Pos tcured
0
1
2
3
4
5
6
0 0.5 1 2
Accelerator levels (wt%)
%M
ass
of
Sty
ren
e
As moulded
Postcured

Cure and Residual Volatile Assessment
P J Schubel 83
Figure 3.14: Peak exotherm temperature for accelerator loading rangingfrom 0 to 2 wt%.
3.4.5 Influence of Demould Time on Residual Content
Demould time was defined here as the elapse of time between the start of injection
and the removal of the part from the mould. Clearly, it is desirable to minimise
this. However, a balance must be reached to ensure that the polymerisation
process is sufficiently complete for dimensional stability. Trials varied the
demould time of the component from 10 to 60 minutes. An unsaturated polyester/
TBPB system with accelerator G was used as a representative matrix (Table 3.11).
Table 3.11: Mould conditions.
ResinRT2557
+30 wt% PVAc+30 wt% CaCO3 Mould Temp (ºC) 95
Initiator (%) TBPB (2) Demould (min) As specified
Accelerator (%) G (0.5)
Figure 3.15 shows an exponential decay in the residual styrene levels as demould
time increased from 10 to 60 minutes for as-moulded samples. A 60 % reduction
in residual styrene is achieved by delaying demould to 30 minutes with a further
8% reduction by extending to 60 minutes total. Postcuring the test laminates
reduced styrene levels to a negligible value in all cases. DSC data (Figure 3.6)
showed 96 % conversion at a demould time of 30 minutes for this particular
system. Anecdotal evidence from industrial end users suggest that suitable
90
95
100
105
110
115
120
125
130
0 0.5 1 2
Accelerator loading (%)
Peak
exo
therm
tem
p(º
C)
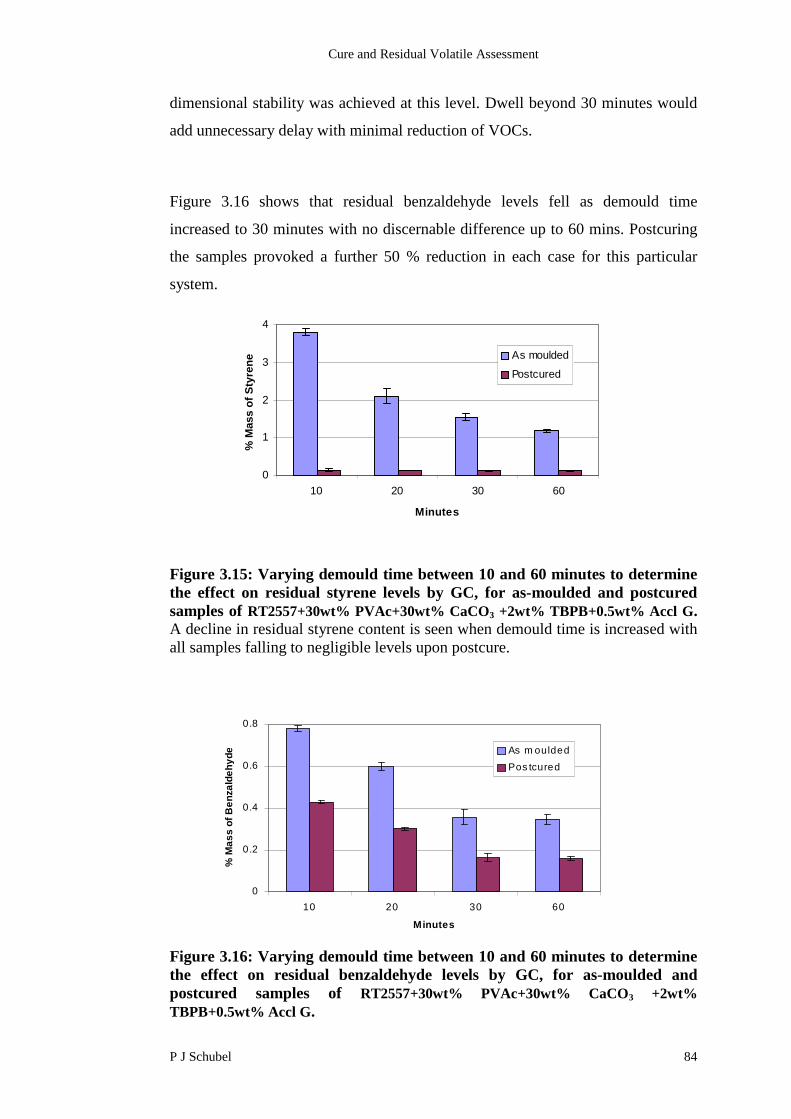
Cure and Residual Volatile Assessment
P J Schubel 84
dimensional stability was achieved at this level. Dwell beyond 30 minutes would
add unnecessary delay with minimal reduction of VOCs.
Figure 3.16 shows that residual benzaldehyde levels fell as demould time
increased to 30 minutes with no discernable difference up to 60 mins. Postcuring
the samples provoked a further 50 % reduction in each case for this particular
system.
0
1
2
3
4
10 20 30 60
Minutes
%M
ass
of
Sty
ren
e As moulded
Postcured
Figure 3.15: Varying demould time between 10 and 60 minutes to determinethe effect on residual styrene levels by GC, for as-moulded and postcuredsamples of RT2557+30wt% PVAc+30wt% CaCO3 +2wt% TBPB+0.5wt% Accl G.A decline in residual styrene content is seen when demould time is increased withall samples falling to negligible levels upon postcure.
Figure 3.16: Varying demould time between 10 and 60 minutes to determinethe effect on residual benzaldehyde levels by GC, for as-moulded andpostcured samples of RT2557+30wt% PVAc+30wt% CaCO3 +2wt%
TBPB+0.5wt% Accl G.
0
0.2
0.4
0.6
0.8
10 20 30 60
Minutes
%M
as
so
fB
en
zald
eh
yd
e As m oulded
Pos tcured

Cure and Residual Volatile Assessment
P J Schubel 85
3.4.6 Influence of Postcure Temperature on Residual Content
The standard postcure procedure described in Section 2.5.2 was varied from 80 to
110 ºC to determine the effects on residual volatiles. A polyester/ TBPB system
with accelerator G was used as a representative matrix (Table 3.12).
Table 3.12: Mould conditions
ResinRT2557
+30 wt% PVAc+30 wt% CaCO3 Mould Temp (ºC) 95
Initiator (%) TBPB (2) Demould (min) 30
Accelerator (%) G (0.5) Postcure (ºC) As specified
Figure 3.17 shows that residual styrene levels fall exponentially as the postcure
temperature is increased from 80 to 110 ºC. Levels at 90 ºC were four times
greater than those produced at 100 ºC postcure and were undetectable via GC for
the 110 ºC postcure cycle.
The residual benzaldehyde level (Figure 3.18) decreased as the postcure
temperature increased. A reduction of 45 % in residual benzaldehyde was seen
when increasing the temperature from 90 to 110 ºC. The curve suggests a possible
benefit from postcuring above 110 ºC. However, structural integrity and
dimensional stability of the composite may be compromised at temperatures near
to the glass transition temperature (157 ºC via DSC).
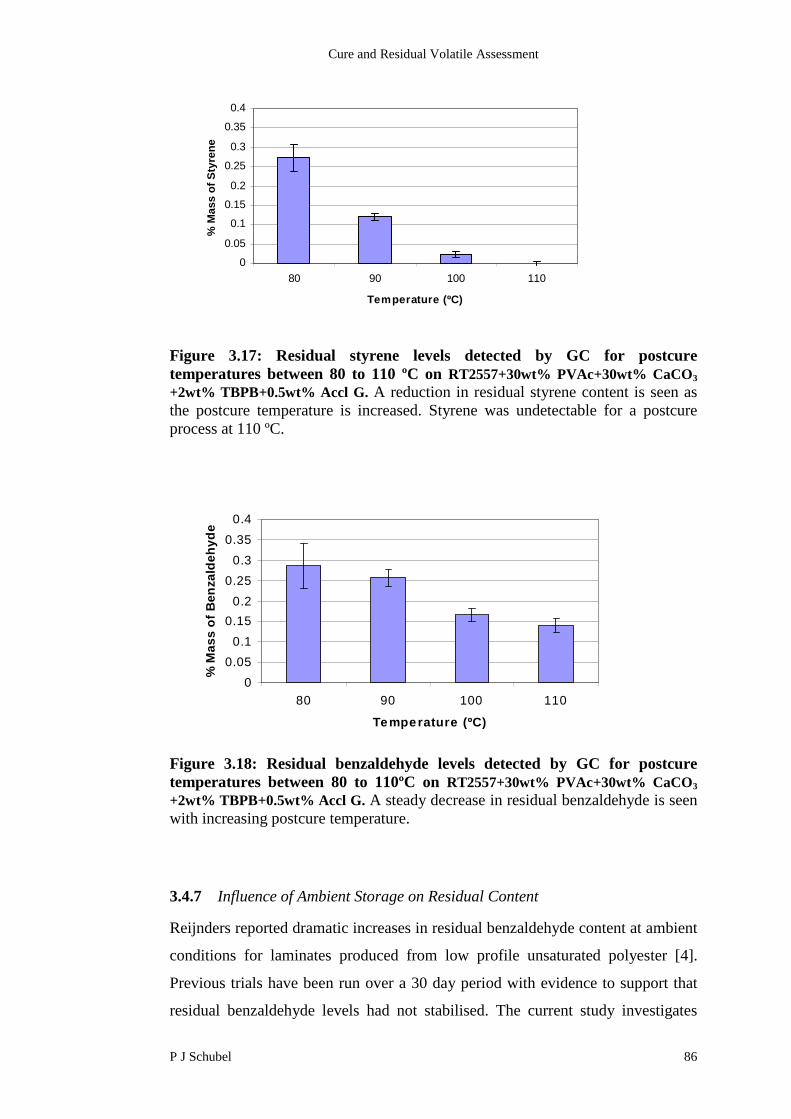
Cure and Residual Volatile Assessment
P J Schubel 86
0
0.05
0.1
0.15
0.2
0.25
0.3
0.35
0.4
80 90 100 110
Temperature (ºC)
%M
ass
of
Sty
ren
e
Figure 3.17: Residual styrene levels detected by GC for postcuretemperatures between 80 to 110 ºC on RT2557+30wt% PVAc+30wt% CaCO3
+2wt% TBPB+0.5wt% Accl G. A reduction in residual styrene content is seen asthe postcure temperature is increased. Styrene was undetectable for a postcureprocess at 110 ºC.
Figure 3.18: Residual benzaldehyde levels detected by GC for postcuretemperatures between 80 to 110ºC on RT2557+30wt% PVAc+30wt% CaCO3
+2wt% TBPB+0.5wt% Accl G. A steady decrease in residual benzaldehyde is seenwith increasing postcure temperature.
3.4.7 Influence of Ambient Storage on Residual Content
Reijnders reported dramatic increases in residual benzaldehyde content at ambient
conditions for laminates produced from low profile unsaturated polyester [4].
Previous trials have been run over a 30 day period with evidence to support that
residual benzaldehyde levels had not stabilised. The current study investigates
0
0.05
0.1
0.15
0.2
0.25
0.3
0.35
0.4
80 90 100 110
Temperature (ºC)
%M
as
so
fB
en
za
lde
hy
de

Cure and Residual Volatile Assessment
P J Schubel 87
residual styrene and benzaldehyde content over a 60 day period for
RT2557+30wt% PVAc + 30wt% CaCO3 with the three initiator systems (Table
3.13) at (20± 2) ºC and (50± 5) % relative humidity.
Table 3.13: Moulding conditions.
ResinRT2557
+30 wt% PVAc+30 wt% CaCO3 Mould Temp (ºC) 95
Initiator (%) As specified Demould (min) 30
Accelerator (%) G (as specified)
Figure 3.19 shows that residual styrene levels fall in each case over the 60 days
storage period for as-moulded laminates. The level of residual styrene in the as-
moulded TBPB after 60 days was still four times greater than that of the sample
immediately after postcuring (Figure 3.20). Postcured samples in Figure 3.20
show the same trend as mentioned for the as-moulded samples. However, the
effect was reduced by the already exhausted levels of residual styrene. The TBPB
system approached equilibrium after postcure and little emission was detected
over the storage period.
Unlike Reijnders [4] trials, the benzaldehyde levels fell during ambient storage for
all initiator types tested (Figure 3.21 and Figure 3.22). All as-moulded values fell
below their respective postcured levels in each case after 60 days storage. This
suggests that postcure promotes evaporation of benzaldehyde, but at the same
time, diffusion limits the compound. It was observed that the benzaldehyde level
directly after moulding matched Reijnders results after 30 days storage. The
discrepancy with Reijnders results cannot be explained easily, but there is a
possibility that high residual reactivity remained in the mouldings produced by
Reijnders, which further polymerised upon storage. It would have been interesting
to see the effects of postcure on residual compound levels in Reijnders trials, as
this would have ruled out effects of an uncured system.

Cure and Residual Volatile Assessment
P J Schubel 88
0
2
4
6
8
10
TBPEH AAP/TBPB TBPB
%M
ass
of
Sty
ren
e
0 days
7days
30 days
60 days
Figure 3.19: Residual styrene detected by GC for as-moulded RT2557+30wt% PVAc+30wt% CaCO3 +fibre with various initiators during ambientaging. Each system shows a reduction in residual styrene content over the 60 daystorage period.
0
2
4
6
8
10
TBPEH AAP/TBPB TBPB
%M
ass
of
Sty
ren
e
0 days
7 days
30 days
60 days
Figure 3.20: Residual styrene detected by GC for postcured RT2557+30wt%PVAc+30wt% CaCO3 +fibre with various initiators during ambient aging.Each system shows a reduction in residual styrene content over the 60 day storageperiod, with TBPB reducing to a negligible level.

Cure and Residual Volatile Assessment
P J Schubel 89
Figure 3.21: Residual benzaldehyde detected by GC for as-mouldedRT2557+30wt% PVAc+30wt% CaCO3 +fibre with various initiators duringambient aging. No increase in residual benzaldehyde was observed over the 60day storage period.
Figure 3.22: Residual benzaldehyde detected by GC for postcuredRT2557+30wt% PVAc+30wt% CaCO3 +fibre with various initiators duringambient aging. No increase in residual benzaldehyde was observed over the 60day storage period. It was discovered that a greater reduction in residualbenzaldehyde could be obtained over the 60 day storage period by not postcuringthe samples.
0
0.2
0.4
0.6
0.8
1
1.2
1.4
1.6
TBPEH AAP/TBPB TBPB
%M
as
so
fB
en
za
lde
hy
de
0 days
7 days
30 days
60 days
0
0.2
0.4
0.6
0.8
1
1.2
1.4
1.6
TBPEH AAP/TBPB TBPB
%M
as
so
fB
en
za
lde
hy
de
0 days
7 days
30 days
60 days
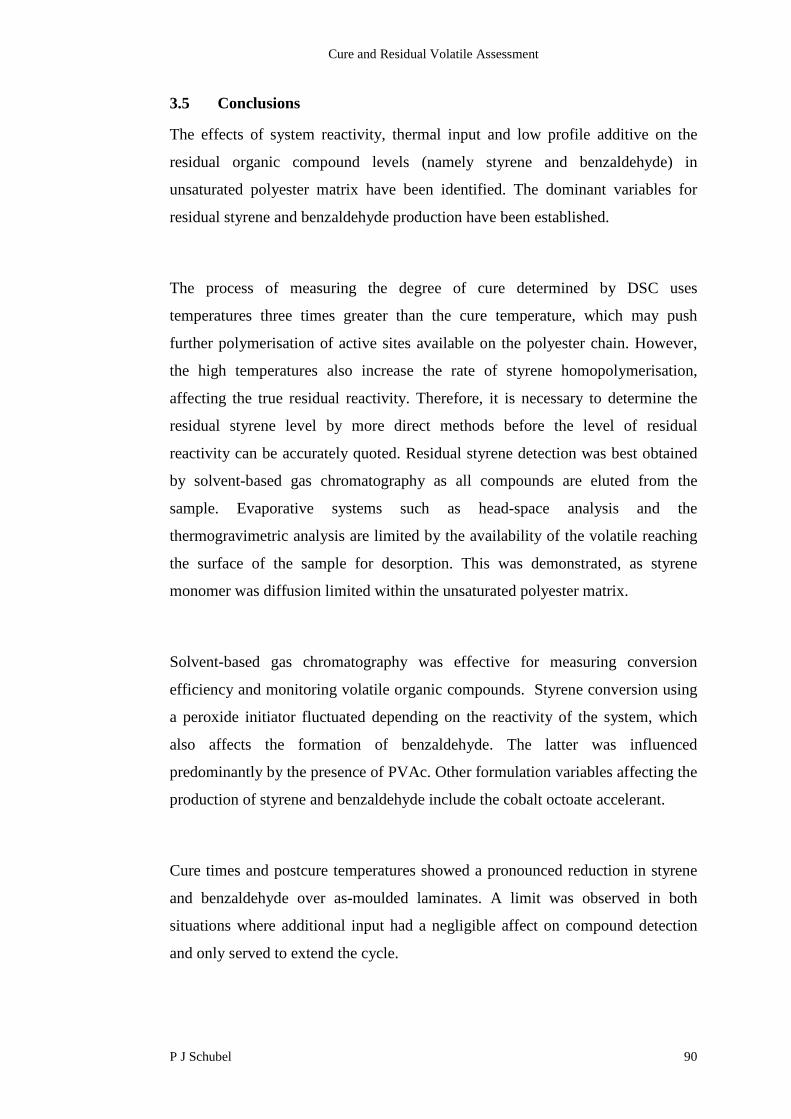
Cure and Residual Volatile Assessment
P J Schubel 90
3.5 Conclusions
The effects of system reactivity, thermal input and low profile additive on the
residual organic compound levels (namely styrene and benzaldehyde) in
unsaturated polyester matrix have been identified. The dominant variables for
residual styrene and benzaldehyde production have been established.
The process of measuring the degree of cure determined by DSC uses
temperatures three times greater than the cure temperature, which may push
further polymerisation of active sites available on the polyester chain. However,
the high temperatures also increase the rate of styrene homopolymerisation,
affecting the true residual reactivity. Therefore, it is necessary to determine the
residual styrene level by more direct methods before the level of residual
reactivity can be accurately quoted. Residual styrene detection was best obtained
by solvent-based gas chromatography as all compounds are eluted from the
sample. Evaporative systems such as head-space analysis and the
thermogravimetric analysis are limited by the availability of the volatile reaching
the surface of the sample for desorption. This was demonstrated, as styrene
monomer was diffusion limited within the unsaturated polyester matrix.
Solvent-based gas chromatography was effective for measuring conversion
efficiency and monitoring volatile organic compounds. Styrene conversion using
a peroxide initiator fluctuated depending on the reactivity of the system, which
also affects the formation of benzaldehyde. The latter was influenced
predominantly by the presence of PVAc. Other formulation variables affecting the
production of styrene and benzaldehyde include the cobalt octoate accelerant.
Cure times and postcure temperatures showed a pronounced reduction in styrene
and benzaldehyde over as-moulded laminates. A limit was observed in both
situations where additional input had a negligible affect on compound detection
and only served to extend the cycle.
Cure and Residual Volatile Assessment
P J Schubel 91
Discrepancies with Reijnder’s study concerning the ambient storage on
benzaldehyde level suggests a need for further research into this field. An
integrated modelling approach is required to relate cure kinetics and mechanistic
models for the competing reactions to compound consumption. This would be a
valuable tool in studying the affects of formulation and process variables on a
range of polymer systems.
3.6 References
1. Manuel, D., New car drivers exposed to toxic emissions. CSIRO,2001(http://www.csiro.au/index.asp?type=mediaRelease&id=newcars).
2. National Toxicology Program. Sixth Annual Report on Carcinogens,1991(http://eagle.westnet.gr/~aesclep/carcinog.htm).
3. Cao, X. and Lee, J., Control of shrinkage and residual styrene ofunsaturated polyester resins cured at low temperatures: I Effects of curingagents. Polymer, 2003. 44: p. 1893-1902.
4. Reijnders, H., The influence of cure systems on the formation of volatilecomponents in RTM processed UP articles. 2001(www.akzonobel.de/).
5. Owen, M.J., Middleton, V., and Jones, I.A., Integrated design andmanufacture using fibre-reinforced polymeric composites. 2000,Cambridge: Woodhead publishing limited.
6. Weatherhead, R.G., FRP technology - fibre reinforced resin systems.1998, Applied Science Publishing: London.
7. Miller, R.R., Newhook, R., and Poole, A., Styrene production, use andhuman exposure. Toxicology, 1994. 24: p. S1-S10.
8. Sorsa, M., Peltonen, K., Vainio, H., and Hemminki, K., Butadiene andstyrene: Assessment of health hazards. IARC Scientific Publications,1993. 127: p. 65-78.
9. Lof, A., Lundgren, E., Nydahl, E., and Nordqvist, M., Biologicalmonitoring of styrene metabolites in blood. Journal of Work Environment& Health, 1986. 12: p. 70-74.
10. Groth-Marnat, G., Neuropsychological effects of styrene exposure: areview of current literature. Journal of Perceptual and Motor Skills, 1993.77: p. 1139-1149.
11. White, D.M., Daniell, W.E., Maxwell, J.K., and Townes, B.D., Psychosisfollowing styrene exposure: case report of neuropsychological sequelae.Journal of Clinical and Experimental Neuropsychology, 1990. 12: p. 789-806.
12. Edling, C., Anundi, H., Johanson, G., and Nilsson, K., Increase inneuropsychiatric symptoms after occupational exposure to low levels ofstyrene. Journal of Internal Medicine, 1993. 50(9): p. 843-850.
13. Frostling, H., The occupational exposure limit value for styrene - a matterof life or death for the reinforced plastic industry. Swedish workenvironment authority,2002,(http://www.av.se/publikationer/rapporter/2002_02eng.pdf).
Cure and Residual Volatile Assessment
P J Schubel 92
14. Somorovska, M., Jahnova, E., Tulinska, J., and Zamecnikova, M.,Biomonitoring of occupational exposure to styrene in a plastics laminationplant. Mutation Research, 1999. 428: p. 255-269.
15. Vodicka, P., Bastlova, T., Vodickova, L., Perterkova, K., Lambert, B., andHemminki, K., Biomarkers of styrene exposure in lamination workers:levels of O6-guanine DNA adducts, DNA strand breaks and mutantfrequencies in the hypoxanthine guanine phosphoribosyltransferase genein T-lymphocytes. Carcinogenesis, 1995. 16: p. 1473-1481.
16. Occupational exposure limits 2000, in EH40/2000. 2000.17. Zhuang, J., Ma, D., Yan, Z., Liu, X., Han, X., Bao, X., Zhang, Y., Guo,
X., and Wang, X., Effect of acidity in TS-1 zeolites on product distributionof the styrene oxidation reaction. Applied catalysis, 2004. 258: p. 1-6.
18. Weir, N.A. and Ceccarelli, A., Photodecomposition of polystyrenehydroperoxide: Part I - reactions in dilute solution. Polymer Degradationand Stability, 1993. 41(1): p. 37-44.
19. Russo, J., Chung, S., Contreras, K., Lian, B., Lorenz, J., Stevens, D., andTrousdell, W., Identification of 4-(N,N-Dipropylamino) benzaldehyde as apotential reversible inhibitor of mouse and human class I aldehydedehyrdogenase. Biochemical Pharmacology, 1995. 50(3): p. 399-406.
20. Threshold limit values (TLVs) for chemical substances and physical agentsand biological exposure indices (BEIs), in American Conference ofGovernment Industrial Hygienists. 2001, ACGIH: Cincinnati, OH.
21. Inoue, O., Kanno, E., Kasai, K., Ukai, H., Okamoto, S., and Ikeda, M.,Benzylmercapturic acid is superior to hippuric acid and o-cresol as aurinary marker of occupational exposure to toluene. Toxicology, 2004.147: p. 177-186.
22. Senzolo, C., Frignani, S., and Pavoni, B., Environmental and biologicalmonitoring of occupational exposure to organic micropollutants.Chemosphere, 2001. 44: p. 67-82.
23. Rodriguez, E.L., Residual styrene monomer in cured unsaturated polyesterresins. Polymer Materials Science Engineering, 1988. 58: p. 575-580.
24. Cao, X. and Lee, L.J., Control of volume shrinkage and residual styrene ofunsaturated polyester resins cured at low temperatures. II Effects ofcomonomer. Polymer, 2003. 44: p. 1507-1516.
25. Forrest, M.J., Jolly, A.M., Holding, S.R., and Richards, S.J., Emissionsfrom processing thermoplastics. Annals of Occupational Hygiene, 1995.39(1): p. 35-53.
26. Yang, X., Measurement of residual styrene content in unsaturatedpolyester resin by gas chromatography. Huaxue Shijie, 1993. 34(5): p.220-223.
27. Newman, R.H. and Patterson, K.H., Solid-state n.m.r determination ofresidual unsaturation in styrene-cured polyester resins. Polymer, 1996.37(7): p. 1065-1069.
28. Tawfik, S.Y., Asaad, J.N., and Sabaa, M.W., Effects of polyester backbonestructure on the cured products properties. Polymer Testing, 2003. 22: p.747-759.
29. Huang, Y.-J. and Liang, C.-M., Volume shrinkage characteristics in thecure of low-shrink unsaturated polyester resins. Polymer, 1996. 37(3): p.401-412.
Cure and Residual Volatile Assessment
P J Schubel 93
30. Smith, R., Before injection- modern methods of sample preparation forseparation techniques. Journal of Chromatography, 2003. 1000: p. 3-27.
31. Zetterlund, P.B. and Johnson, A.F., Free volume-based modelling of freeradical crosslinking polymerisation of unsaturated polyesters. Polymer,2002. 43: p. 2039-2048.
32. Hsu, C.P. and Lee, L.J., Free-radical crosslinking copolymerization ofstyrene/unsaturated polyester resins: 2. Electron spin resonance study.Polymer, 1993. 34: p. 4506-4515.
Nano-Scale Silicates as an Alternative to Conventional LPAs
P J Schubel 94
4 Nano-Scale Silicates as an Alternative to Conventional LPAs
4.1 Introduction
It has been shown in Chapter 3 that LPAs used as modifier in polyester resin
systems have an increasing effect on VOCs, namely residual styrene and
benzaldehyde. LPA also increases the brittleness of the structure due to the
formation of micro-cracking during phase separation. Here, an alternative to
chemical based low profiling systems is studied in order to minimise changes to
physical properties and to reduce residual VOCs without compromising the
cosmetic laminate.
A novel approach is attempted using exfoliated clays to reduce resin shrinkage
within styrene based unsaturated polyester resins via a so-called nanocomposite.
Nanocomposites offer considerable promise for improving matrix functional
properties especially fire retardancy and reduction of gas permeability. Work
conducted in this chapter looks at:
The feasibility of dispersing layered silicates in unsaturated polyester resin
on a nanoscale.
The feasibility of shrinkage control via nanoscale silicates.
The potential for using silicates to replace some or all of the conventional
LPA loading.
Determination of the effectiveness of silicate clays to improve mechanical
properties of existing LPA filled polyester resin.
4.2 Nano-Scaled Layered Silicates
Polymer based layered silicate nanocomposites are new hybrid materials that offer
an interesting alternative to conventionally filled polymers. Nanocomposites
utilise a reinforcement phase thickness of the order of a few nanometers, which is
on the same scale as the radius of gyration of a polymer [1]. The polymer
molecules at the surface of the nanoscale particles are completely immobilised,
Nano-Scale Silicates as an Alternative to Conventional LPAs
P J Schubel 95
with the neighbouring region being partially immobilised [2]. Due to the high
surface area of the nanoscale particles, the effects from reduced molecular
mobility become significant, leading to unique properties of the polymer
nanocomposite [3, 4].
The high aspect ratio (10 to 2000) of the nano-scaled layered silicate plays a key
role in the improvement of the properties of nanocomposites [5, 6]. Improvements
in mechanical properties [7-10], thermal stability [11, 12] and dielectic properties
[13] have been widely documented. Adding clay nanofillers to biodegradable
polymers has also been shown to enhance compostability [14, 15]. Notably, low
concentrations of silicate (1-5 wt%) result in the aforementioned improvements.
4.2.1 Molecular Structure of Montmorillonite
Clay mineral montmorillonite, a member of the dioctahdral 2:1 layered silicate
smectite group, is widely used as a raw material over bentonite and hectorite due
to its powerful catalytic and absorbent properties [16]. Two features of this
material are the nearly unrestricted exchangeability of its intermediate layer
cations and excellent swelling capacity in aqueous solutions. The expansion of the
layers can lead to the disintegration of the crystal network [17]. Montmorillonite
has a chemical structure of:
Mx(Al4-xMgx)Si8O20(OH)4 [4.1]
where M is the monovalent cation and x is the degree of isomorphous substitution
(between 0.5 and 1.3).
The montmorillonite structure (Figure 4.1) consists of two fused silica tetrahedral
sheets sandwiching an edge shared octahedral sheet. The layer thickness is around
1 nm and the lateral dimensions of these layers may vary from 10 nm to several
microns depending on the particular silicate [18]. Isomorphous substitutions of
Si4+ for Al3+ in the tetrahedral lattice and of Al3+ for Mg2+ in the octahedral sheet
cause an excess of negative charges within the montmorillonite layers [19]. These
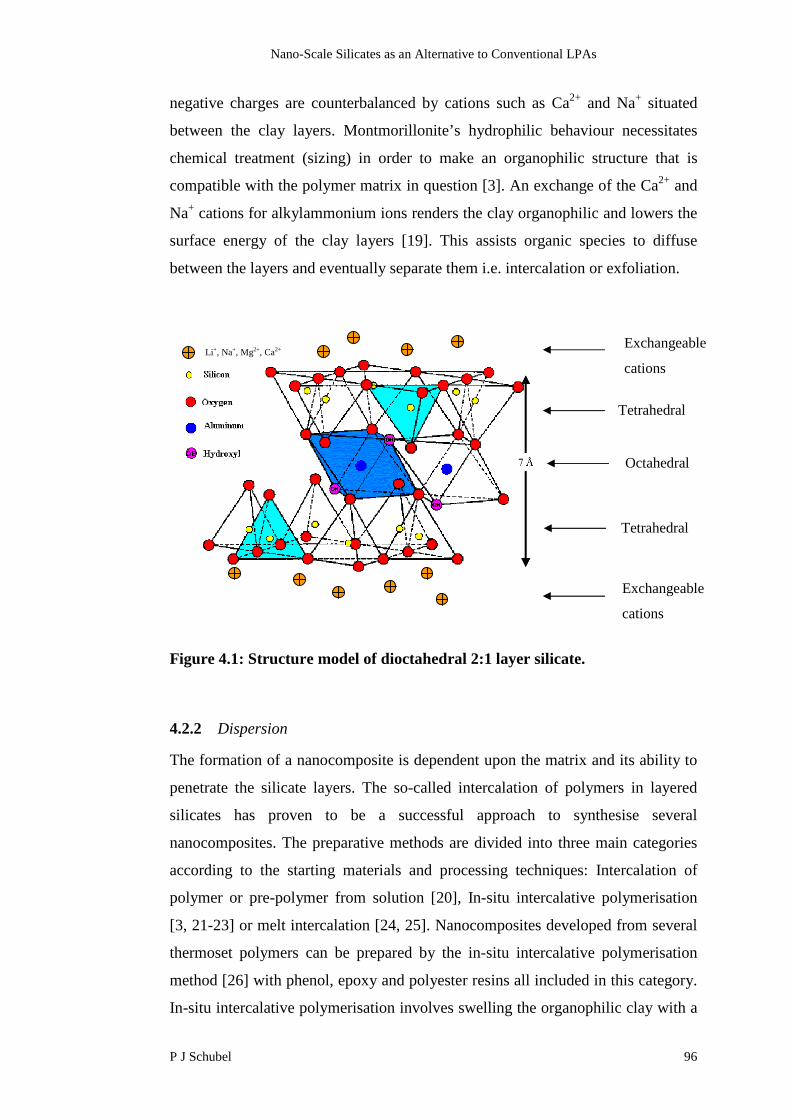
Nano-Scale Silicates as an Alternative to Conventional LPAs
P J Schubel 96
negative charges are counterbalanced by cations such as Ca2+ and Na+ situated
between the clay layers. Montmorillonite’s hydrophilic behaviour necessitates
chemical treatment (sizing) in order to make an organophilic structure that is
compatible with the polymer matrix in question [3]. An exchange of the Ca2+ and
Na+ cations for alkylammonium ions renders the clay organophilic and lowers the
surface energy of the clay layers [19]. This assists organic species to diffuse
between the layers and eventually separate them i.e. intercalation or exfoliation.
Figure 4.1: Structure model of dioctahedral 2:1 layer silicate.
4.2.2 Dispersion
The formation of a nanocomposite is dependent upon the matrix and its ability to
penetrate the silicate layers. The so-called intercalation of polymers in layered
silicates has proven to be a successful approach to synthesise several
nanocomposites. The preparative methods are divided into three main categories
according to the starting materials and processing techniques: Intercalation of
polymer or pre-polymer from solution [20], In-situ intercalative polymerisation
[3, 21-23] or melt intercalation [24, 25]. Nanocomposites developed from several
thermoset polymers can be prepared by the in-situ intercalative polymerisation
method [26] with phenol, epoxy and polyester resins all included in this category.
In-situ intercalative polymerisation involves swelling the organophilic clay with a
Tetrahedral
Octahedral
Tetrahedral
Exchangeable
cations
Exchangeable
cationsLi+, Na+, Mg2+, Ca2+
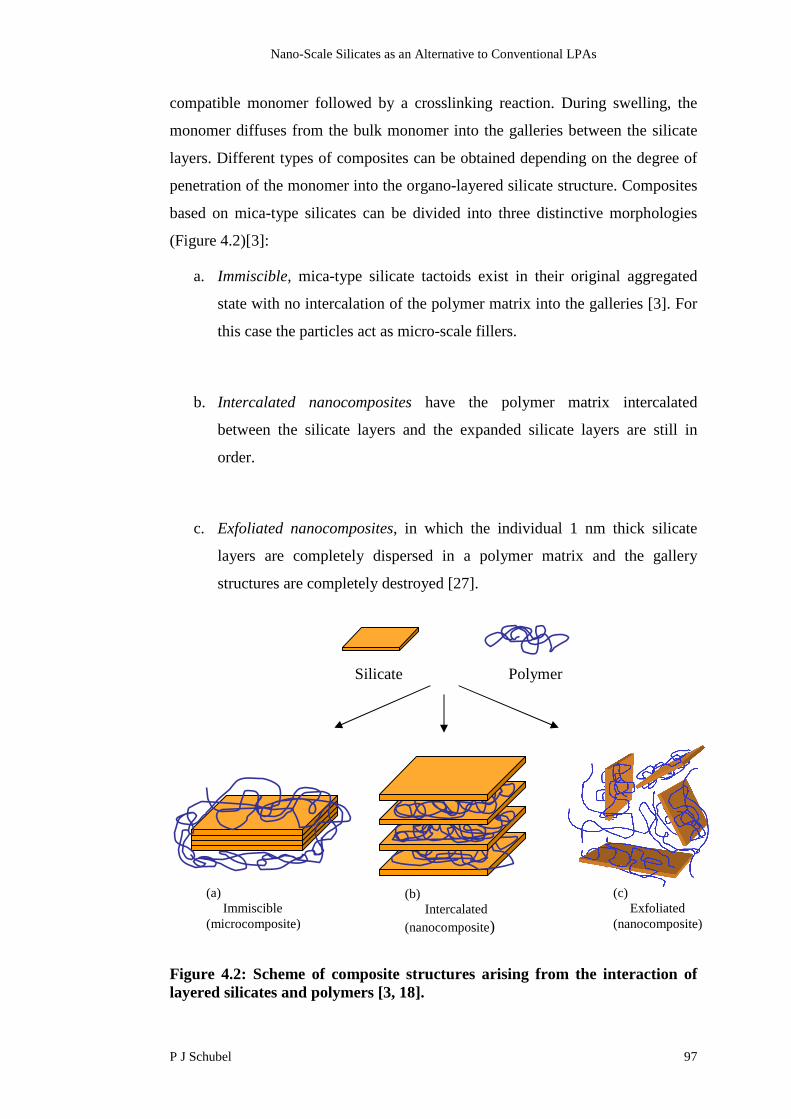
Nano-Scale Silicates as an Alternative to Conventional LPAs
P J Schubel 97
compatible monomer followed by a crosslinking reaction. During swelling, the
monomer diffuses from the bulk monomer into the galleries between the silicate
layers. Different types of composites can be obtained depending on the degree of
penetration of the monomer into the organo-layered silicate structure. Composites
based on mica-type silicates can be divided into three distinctive morphologies
(Figure 4.2)[3]:
a. Immiscible, mica-type silicate tactoids exist in their original aggregated
state with no intercalation of the polymer matrix into the galleries [3]. For
this case the particles act as micro-scale fillers.
b. Intercalated nanocomposites have the polymer matrix intercalated
between the silicate layers and the expanded silicate layers are still in
order.
c. Exfoliated nanocomposites, in which the individual 1 nm thick silicate
layers are completely dispersed in a polymer matrix and the gallery
structures are completely destroyed [27].
Figure 4.2: Scheme of composite structures arising from the interaction oflayered silicates and polymers [3, 18].
Silicate Polymer
(a)Immiscible
(microcomposite)
(b)Intercalated
(nanocomposite)
(c)Exfoliated
(nanocomposite)
Nano-Scale Silicates as an Alternative to Conventional LPAs
P J Schubel 98
The structure of nanocomposites has typically been established using X-ray
diffraction (XRD) analysis and transmission electron microscopy (TEM). The two
complimentary techniques are used for quantitative and qualitative analysis
respectively. XRD is commonly used to probe the nanocomposite structure due to
its ease and availability. By monitoring the position, shape and intensity of the
basal reflections from the distributed silicate layers, the nanocomposite structure
(intercalated or exfoliated) may be identified (Figure 4.3). The intercalation of
polymer chains tends to increase the interlayer spacing in comparison with the
spacing of the organoclay used. This leads to a shift of the diffraction peak
towards lower angle values due to Bragg’s law:
2.d. sinθ = n.λ [4.2]
where: d is the lattice spacing, θ is the angle of reflection, n is an integer and λ is
the wavelength of the incident X-ray beam.
Extensive layer separation (d001 greater than 6-7 nm) and disordering associated
with delamination of the silicate layers in the polymer matrix result in the
eventual disappearance of any coherent diffraction peaks (Figure 4.3). This
phenomenon is characteristic of a disordered, exfoliated nanocomposite.
However, consideration must be given when using XRD to ensure that readings
are representative of the bulk matrix and that grouped areas of disordered layers
are not influencing results. TEM is traditionally used to complement XRD results
and give real time visual analysis of the nanocomposite morphology.

Nano-Scale Silicates as an Alternative to Conventional LPAs
P J Schubel 99
Figure 4.3: Schematic of XRD spectra for various polymer layered silicatecomposites [6].
The collective knowledge of morphology and heterogeneity of layered silicates [1,
28-31] indicates that the formation of an intercalated or exfoliated polymer
layered nanocomposite occurs by a more complex process than simple sequential
swelling and separation of individual layers starting from the surface of the
primary particle. Defect structures, local chemical inhomogeneity, electrostatic
forces, viscoelastic properties of the polymer and stress fields arising from
interlayer swelling will all contribute to mediate polymer transport and layer
mobility and thus final morphology.
The suggestion of using nano silicate particles to address the inherent problems
associated with conventional low profiling systems, such as PVAc, is an attractive
alternative, as monomer concentration will not be increased and benefits in
mechanical properties with loadings as low as 1 wt% are reported. The use of
silicates for retarding resin shrinkage is thought to be viable due to immobilisation
of polymer molecules at the surface of the particles with neighbouring regions
being partially immobilised. Upon polymerisation, residual forces should increase
and restrict movement of the polymer molecules.
2θ
I
ImmiscibleIntercalatedExfoliated
20º0º
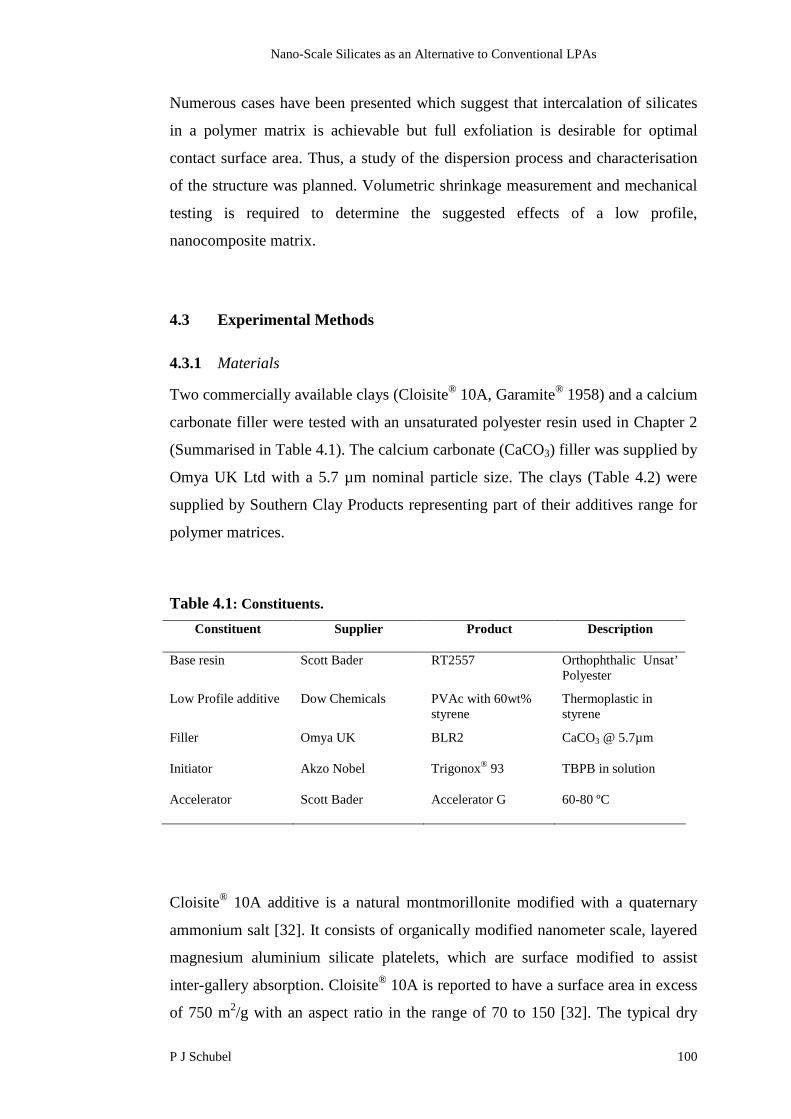
Nano-Scale Silicates as an Alternative to Conventional LPAs
P J Schubel 100
Numerous cases have been presented which suggest that intercalation of silicates
in a polymer matrix is achievable but full exfoliation is desirable for optimal
contact surface area. Thus, a study of the dispersion process and characterisation
of the structure was planned. Volumetric shrinkage measurement and mechanical
testing is required to determine the suggested effects of a low profile,
nanocomposite matrix.
4.3 Experimental Methods
4.3.1 Materials
Two commercially available clays (Cloisite® 10A, Garamite® 1958) and a calcium
carbonate filler were tested with an unsaturated polyester resin used in Chapter 2
(Summarised in Table 4.1). The calcium carbonate (CaCO3) filler was supplied by
Omya UK Ltd with a 5.7 µm nominal particle size. The clays (Table 4.2) were
supplied by Southern Clay Products representing part of their additives range for
polymer matrices.
Table 4.1: Constituents.
Constituent Supplier Product Description
Base resin Scott Bader RT2557 Orthophthalic Unsat’Polyester
Low Profile additive Dow Chemicals PVAc with 60wt%styrene
Thermoplastic instyrene
Filler Omya UK BLR2 CaCO3 @ 5.7µm
Initiator Akzo Nobel Trigonox® 93 TBPB in solution
Accelerator Scott Bader Accelerator G 60-80 ºC
Cloisite® 10A additive is a natural montmorillonite modified with a quaternary
ammonium salt [32]. It consists of organically modified nanometer scale, layered
magnesium aluminium silicate platelets, which are surface modified to assist
inter-gallery absorption. Cloisite® 10A is reported to have a surface area in excess
of 750 m2/g with an aspect ratio in the range of 70 to 150 [32]. The typical dry
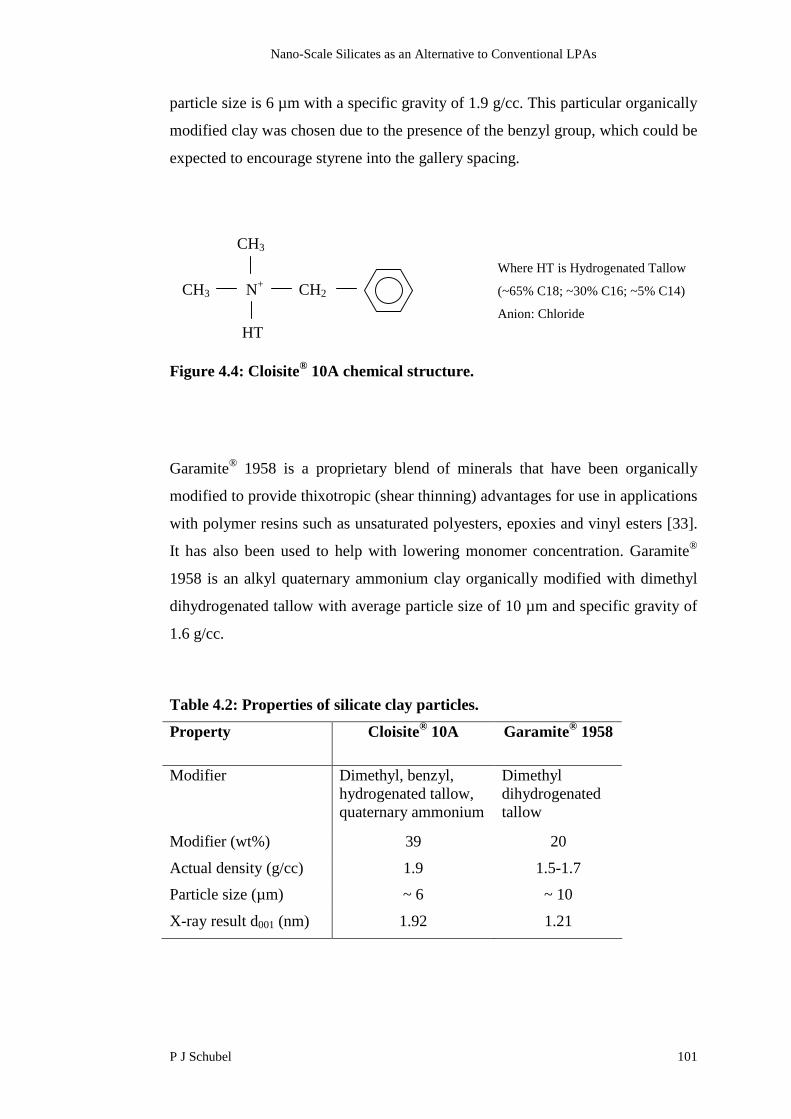
Nano-Scale Silicates as an Alternative to Conventional LPAs
P J Schubel 101
particle size is 6 µm with a specific gravity of 1.9 g/cc. This particular organically
modified clay was chosen due to the presence of the benzyl group, which could be
expected to encourage styrene into the gallery spacing.
Figure 4.4: Cloisite® 10A chemical structure.
Garamite® 1958 is a proprietary blend of minerals that have been organically
modified to provide thixotropic (shear thinning) advantages for use in applications
with polymer resins such as unsaturated polyesters, epoxies and vinyl esters [33].
It has also been used to help with lowering monomer concentration. Garamite®
1958 is an alkyl quaternary ammonium clay organically modified with dimethyl
dihydrogenated tallow with average particle size of 10 µm and specific gravity of
1.6 g/cc.
Table 4.2: Properties of silicate clay particles.
Property Cloisite® 10A Garamite® 1958
Modifier Dimethyl, benzyl,hydrogenated tallow,quaternary ammonium
Dimethyldihydrogenatedtallow
Modifier (wt%) 39 20
Actual density (g/cc) 1.9 1.5-1.7
Particle size (µm) ~ 6 ~ 10
X-ray result d001 (nm) 1.92 1.21
Where HT is Hydrogenated Tallow
(~65% C18; ~30% C16; ~5% C14)
Anion: Chloride
CH3
CH3 N+ CH2
HT

Nano-Scale Silicates as an Alternative to Conventional LPAs
P J Schubel 102
4.3.2 Experimental Procedure
The silicate was processed with unsaturated polyester resin using an in-situ
intercalative polymerisation method. The silicate was dried at 110 ºC for one hour
and then added to 1 kg of unsaturated polyester at loadings ranging from 1 to 10
wt%. Dispersion was by an air driven shear mixer with a 40 mm paddle at 1500
rpm. The speed was established in studies detailed in Appendix 7. Accelerator G
and finally TBPB initiator were then added. The resin matrix was degassed at 700
mmHg for 10 minutes.
The resulting blend was cast using a 250 x 250 x 3 mm aluminium picture frame
tool polished to an Ra of 0.15 µm (Figure 4.5). A 5 mm nitrile rubber seal was
recessed around the perimeter of the upper and lower platen, which sealed against
the picture frame using eight M12 bolts. Coupled to this was the shrinkage bar
cast tool, which was manufactured from machined hydraulic tubing (Ø38.151 ID
x 71.081 mm) capped at both ends and fastened by three M12 bolts. A Ø44 x 2.6
mm thick silicon o-ring was recessed into the tubing to provide a seal once
assembled (Figure 4.6).
The tool was heated in an oven to 95 ºC prior to injection. The resin was injected
at 50 kPa and the vent ball valve was closed after 20 sec of resin run-off. The
chamber was pressurised to 500 kPa and then sealed by closing the injection ball
valve. The tool was left to stand in the 95 ºC environment for a 30 min cure cycle
(Table 4.3). Upon demould, the samples were postcured at 90 ºC using the cycle
shown in Section 2.5.2.
Table 4.3: Conditions for moulding of samples
Resin Initiator Accelerator MouldTemp (ºC)
Mould Pressure(kPa)
DemouldTime (min)
RT2557 TBPB(2 wt%)
Accelerator G(0.5 wt%)
95 500 30
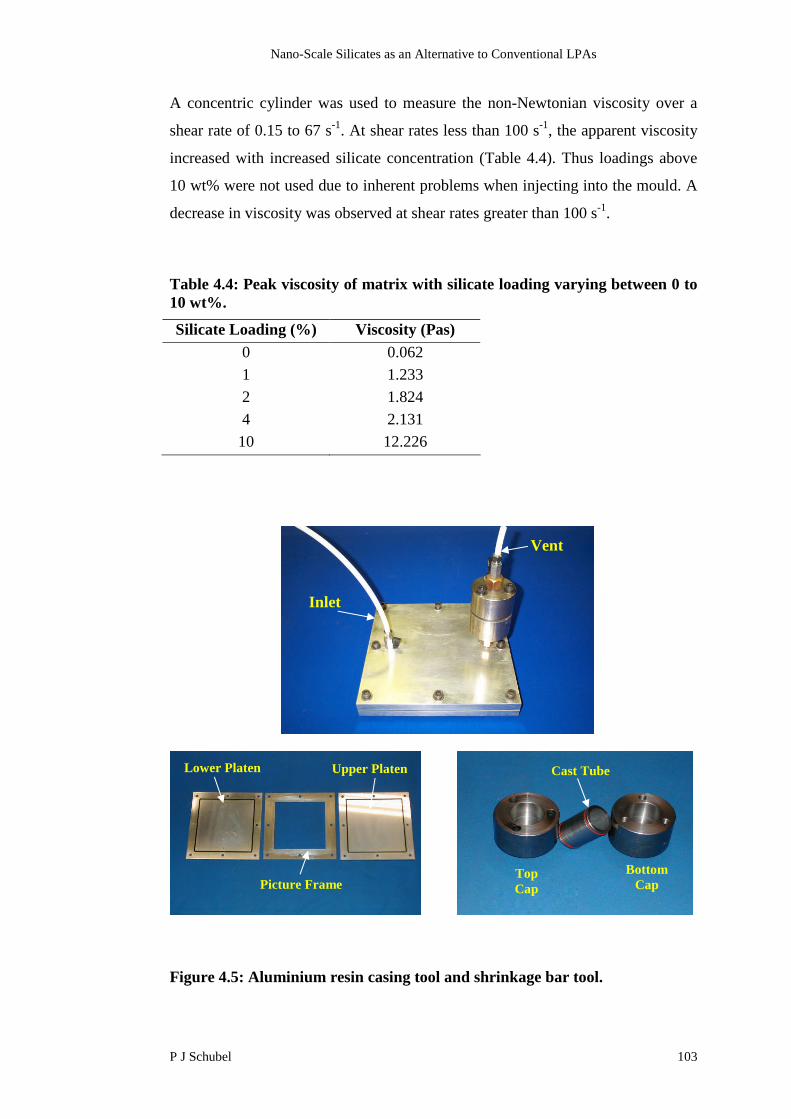
Nano-Scale Silicates as an Alternative to Conventional LPAs
P J Schubel 103
A concentric cylinder was used to measure the non-Newtonian viscosity over a
shear rate of 0.15 to 67 s-1. At shear rates less than 100 s-1, the apparent viscosity
increased with increased silicate concentration (Table 4.4). Thus loadings above
10 wt% were not used due to inherent problems when injecting into the mould. A
decrease in viscosity was observed at shear rates greater than 100 s-1.
Table 4.4: Peak viscosity of matrix with silicate loading varying between 0 to10 wt%.
Silicate Loading (%) Viscosity (Pas)
0 0.062
1 1.233
2 1.824
4 2.131
10 12.226
Figure 4.5: Aluminium resin casing tool and shrinkage bar tool.
Inlet
Vent
Upper Platen
Picture Frame
Lower Platen Cast Tube
BottomCap
TopCap

Nano-Scale Silicates as an Alternative to Conventional LPAs
P J Schubel 104
Figure 4.6: Cross section schematic of the cast tool and shrinkage bar tool.
X-ray Diffraction
X-ray diffraction (XRD) patterns were obtained using a Phillips PW 3710,
equipped with Cu-Kα (λ = 1.5406 Å) radiation source and a Ni Kβ filter. The X-
ray generator operated at 40 kV and 40 mA. The diffraction angle 2θ was
monitored from 2-12 degrees at a scanning speed and step size of 1 º/min and 0.02
degrees, respectively. Specimens were produced from polymerised castings
measuring 50 x 20 x 3 mm. The top 100 μm of the specimens were ground with
1200 grit paper to ensure an even surface for diffraction and were held in position
via a spring-loaded clip (Figure 4.7). The through-gradient effect was monitored
(Appendix 7) revealing no variation in the level of dispersion
Figure 4.7: Sample held in the XRD armature using a spring-loaded clip.
Sample
Spring-loaded clip
Inlet
Vent
71.081
300.0
3.043.0
250.0
Ø38.151 ID
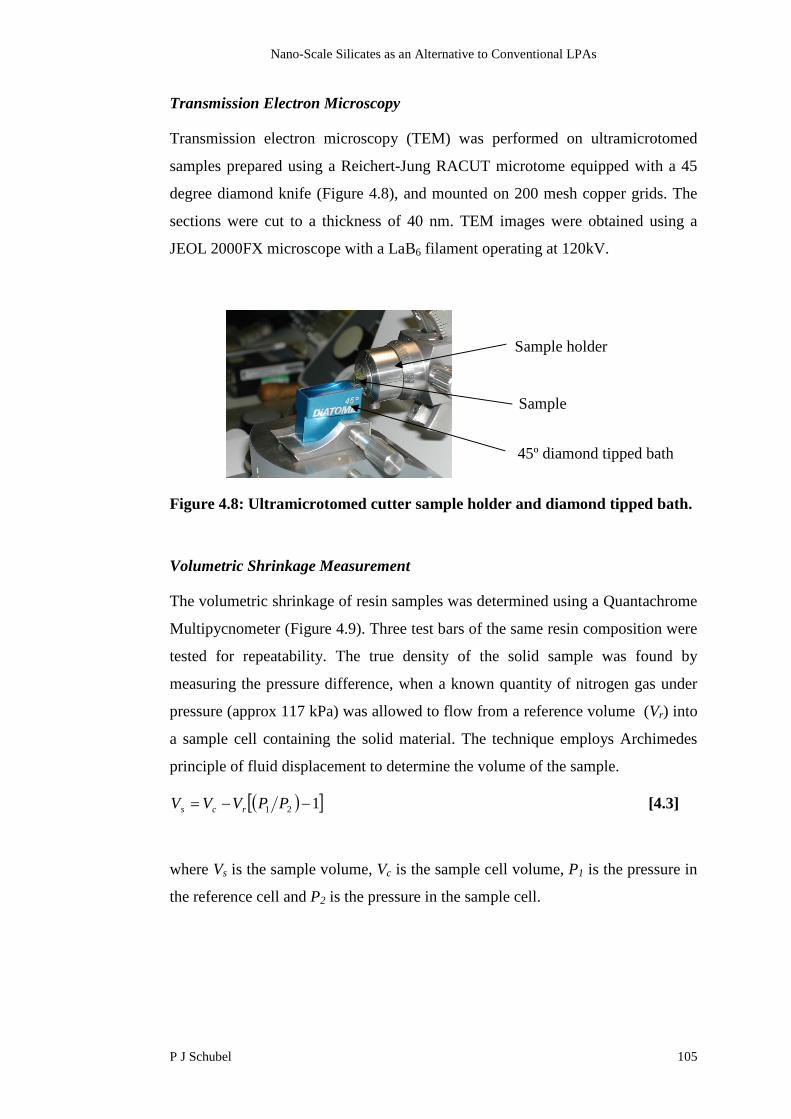
Nano-Scale Silicates as an Alternative to Conventional LPAs
P J Schubel 105
Transmission Electron Microscopy
Transmission electron microscopy (TEM) was performed on ultramicrotomed
samples prepared using a Reichert-Jung RACUT microtome equipped with a 45
degree diamond knife (Figure 4.8), and mounted on 200 mesh copper grids. The
sections were cut to a thickness of 40 nm. TEM images were obtained using a
JEOL 2000FX microscope with a LaB6 filament operating at 120kV.
Figure 4.8: Ultramicrotomed cutter sample holder and diamond tipped bath.
Volumetric Shrinkage Measurement
The volumetric shrinkage of resin samples was determined using a Quantachrome
Multipycnometer (Figure 4.9). Three test bars of the same resin composition were
tested for repeatability. The true density of the solid sample was found by
measuring the pressure difference, when a known quantity of nitrogen gas under
pressure (approx 117 kPa) was allowed to flow from a reference volume (Vr) into
a sample cell containing the solid material. The technique employs Archimedes
principle of fluid displacement to determine the volume of the sample.
121 PPVVV rcs [4.3]
where Vs is the sample volume, Vc is the sample cell volume, P1 is the pressure in
the reference cell and P2 is the pressure in the sample cell.
Sample holder
Sample
45º diamond tipped bath
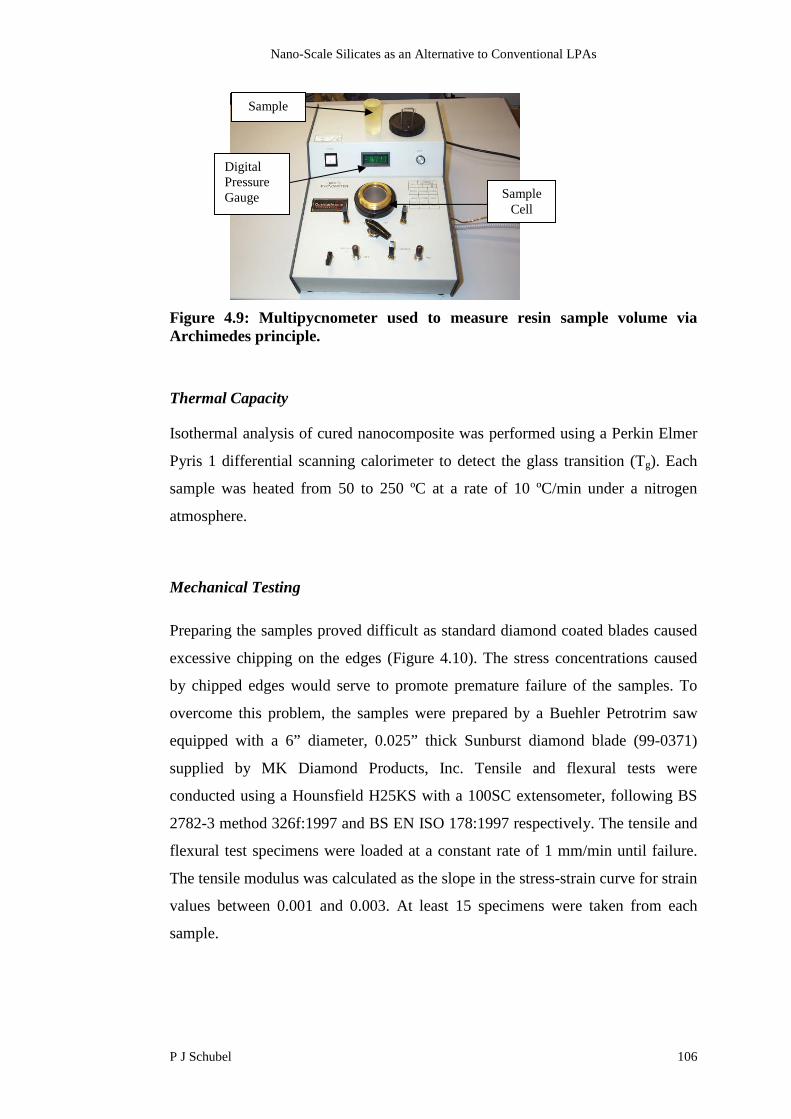
Nano-Scale Silicates as an Alternative to Conventional LPAs
P J Schubel 106
Figure 4.9: Multipycnometer used to measure resin sample volume viaArchimedes principle.
Thermal Capacity
Isothermal analysis of cured nanocomposite was performed using a Perkin Elmer
Pyris 1 differential scanning calorimeter to detect the glass transition (Tg). Each
sample was heated from 50 to 250 ºC at a rate of 10 ºC/min under a nitrogen
atmosphere.
Mechanical Testing
Preparing the samples proved difficult as standard diamond coated blades caused
excessive chipping on the edges (Figure 4.10). The stress concentrations caused
by chipped edges would serve to promote premature failure of the samples. To
overcome this problem, the samples were prepared by a Buehler Petrotrim saw
equipped with a 6” diameter, 0.025” thick Sunburst diamond blade (99-0371)
supplied by MK Diamond Products, Inc. Tensile and flexural tests were
conducted using a Hounsfield H25KS with a 100SC extensometer, following BS
2782-3 method 326f:1997 and BS EN ISO 178:1997 respectively. The tensile and
flexural test specimens were loaded at a constant rate of 1 mm/min until failure.
The tensile modulus was calculated as the slope in the stress-strain curve for strain
values between 0.001 and 0.003. At least 15 specimens were taken from each
sample.
Sample
SampleCell
DigitalPressureGauge
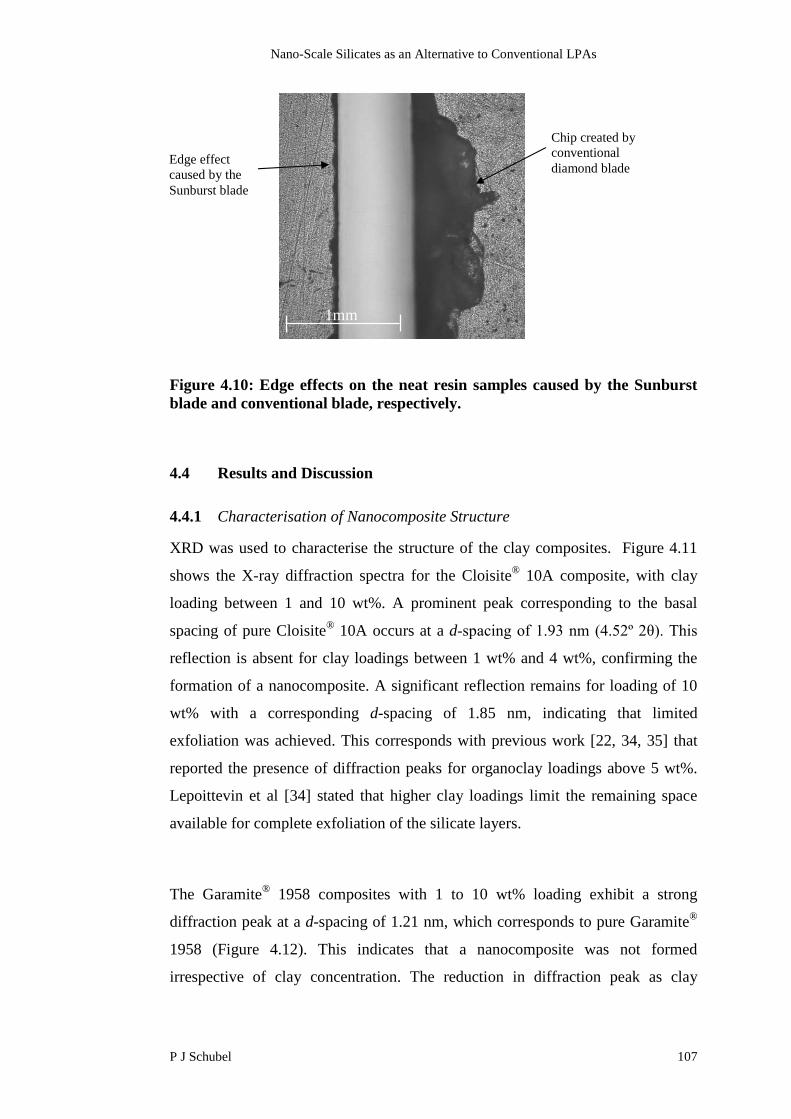
Nano-Scale Silicates as an Alternative to Conventional LPAs
P J Schubel 107
Figure 4.10: Edge effects on the neat resin samples caused by the Sunburstblade and conventional blade, respectively.
4.4 Results and Discussion
4.4.1 Characterisation of Nanocomposite Structure
XRD was used to characterise the structure of the clay composites. Figure 4.11
shows the X-ray diffraction spectra for the Cloisite® 10A composite, with clay
loading between 1 and 10 wt%. A prominent peak corresponding to the basal
spacing of pure Cloisite® 10A occurs at a d-spacing of 1.93 nm (4.52º 2θ). This
reflection is absent for clay loadings between 1 wt% and 4 wt%, confirming the
formation of a nanocomposite. A significant reflection remains for loading of 10
wt% with a corresponding d-spacing of 1.85 nm, indicating that limited
exfoliation was achieved. This corresponds with previous work [22, 34, 35] that
reported the presence of diffraction peaks for organoclay loadings above 5 wt%.
Lepoittevin et al [34] stated that higher clay loadings limit the remaining space
available for complete exfoliation of the silicate layers.
The Garamite® 1958 composites with 1 to 10 wt% loading exhibit a strong
diffraction peak at a d-spacing of 1.21 nm, which corresponds to pure Garamite®
1958 (Figure 4.12). This indicates that a nanocomposite was not formed
irrespective of clay concentration. The reduction in diffraction peak as clay
1mm
Chip created byconventionaldiamond blade
Edge effectcaused by theSunburst blade

Nano-Scale Silicates as an Alternative to Conventional LPAs
P J Schubel 108
content decreased may be due to the clay being broken down in size during shear
mixing. However, the particles do not appear to be intercalated on the nano-scale.
22.
723.
444.
164.
88 5.6
6.32
7.04
7.76
8.48 9.
29.
9210
.611
.412
.1
2θ
Inte
nsit
y(c
ps)
Cloisite 10A
1%(wt)
2%(wt)
4%(wt)
10%(wt)
Figure 4.11: Cloisite® 10A composite with clay loading ranging from 1 to 10wt%. Initial results indicate the formation of an exfoliated nano structure, whichis evident by the disappearance of any coherent diffraction peaks for 1 to 4 wt%loadings.
2
2.7
2
3.4
4
4.1
6
4.8
8
5.6
6.3
2
7.0
4
7.7
6
8.4
8
9.2
9.9
2
10
.6
11
.4
12
.1
2θ
Inte
ns
ity
(cp
s)
Garamite
1%(wt)
4%(wt)
10%(wt)
Figure 4.12: Garamite® 1958 composite with clay loading ranging from 1 to10 wt%. Diffraction peaks corresponding to that of pure Garamite® indicate thatintercalation or exfoliation was not achieved. Hence a nano structure was notformed.
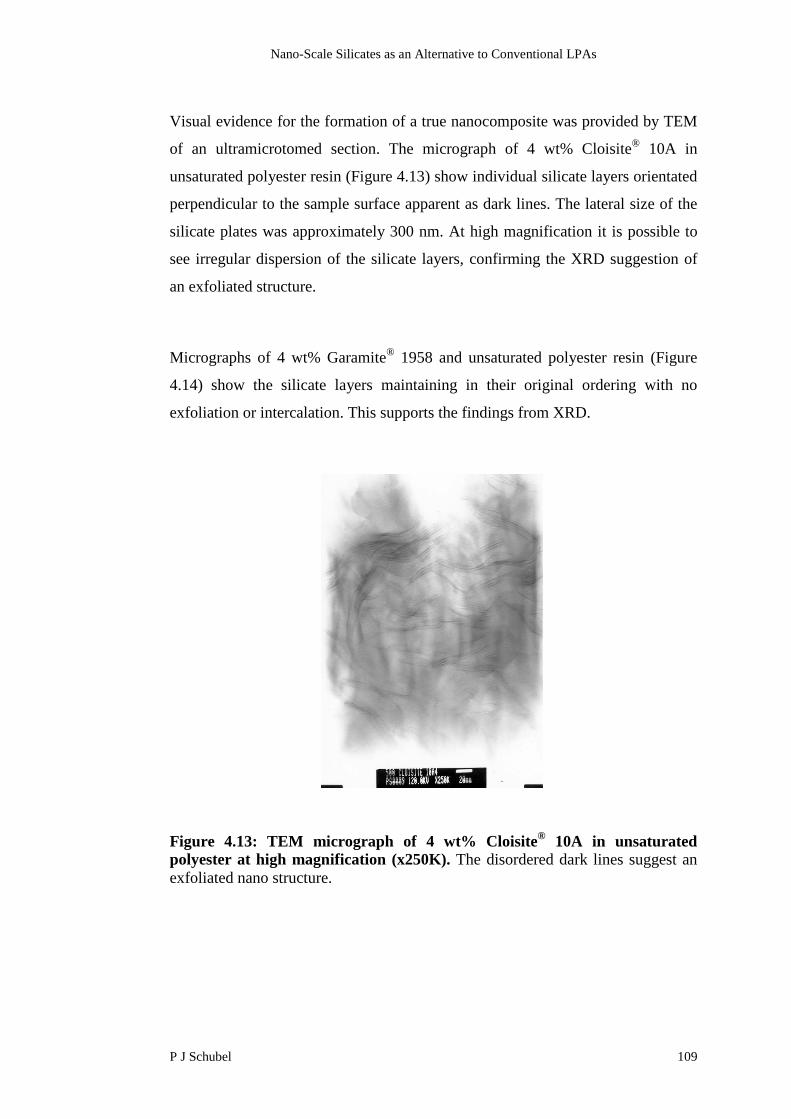
Nano-Scale Silicates as an Alternative to Conventional LPAs
P J Schubel 109
Visual evidence for the formation of a true nanocomposite was provided by TEM
of an ultramicrotomed section. The micrograph of 4 wt% Cloisite® 10A in
unsaturated polyester resin (Figure 4.13) show individual silicate layers orientated
perpendicular to the sample surface apparent as dark lines. The lateral size of the
silicate plates was approximately 300 nm. At high magnification it is possible to
see irregular dispersion of the silicate layers, confirming the XRD suggestion of
an exfoliated structure.
Micrographs of 4 wt% Garamite® 1958 and unsaturated polyester resin (Figure
4.14) show the silicate layers maintaining in their original ordering with no
exfoliation or intercalation. This supports the findings from XRD.
Figure 4.13: TEM micrograph of 4 wt% Cloisite® 10A in unsaturatedpolyester at high magnification (x250K). The disordered dark lines suggest anexfoliated nano structure.

Nano-Scale Silicates as an Alternative to Conventional LPAs
P J Schubel 110
Figure 4.14: TEM micrographs of 4 wt% Garamite® 1958 in unsaturatedpolyester: (a) low magnification (x50K) of large aggregate and (b) highmagnification (x250K) within the aggregate. These micrographs show noexfoliation or intercalation due to the solid uniformity of the dark area.
4.4.2 Material Physical Properties
Volumetric Shrinkage
Volumetric resin shrinkage was monitored for the silicate composites (1 to 10
wt% clay) and compared to an inert filler (CaCO3) and LPA (PVAc). The
volumetric shrinkage of the base resin was 7.5 %. Figure 4.15 shows that CaCO3
filler caused minimal reduction in volumetric shrinkage for loadings as high as 30
wt%. The reduction is attributed to the inert filler acting as a reactive volume
diluent. PVAc provoked little reduction in shrinkage below 4 wt%. Thereafter, the
resin shrinkage was reduced by 6.5 % for loadings up to 30 wt%. Using 30 wt%
LPA is shown to reduce chemical resin shrinkage to the same magnitude seen in
an epoxy system (Section 2.6.4), which produced acceptable surface quality.
Figure 4.15 suggest Garamite 1958 acts as a reactive volume diluent as it follows
the same trend seen for CaCO3. This is due to the ineffective intercalation and
(a) (b)

Nano-Scale Silicates as an Alternative to Conventional LPAs
P J Schubel 111
exfoliation seen in the XRD data and TEM micrographs (Figure 4.12 and Figure
4.14 respectively).
The Cloisite® 10A exhibited a 1.8 % reduction in volumetric shrinkage for
loadings as low as 1 wt%. A maximum mean reduction of 2.5 % was seen at 4
wt% clay loading. However, using a two-tailed, t-test [36] for statistical analysis
of the data sets for the 2, 4 and 10 wt% loading, it was shown that the null
hypothesis (μ2% = μ4% = μ10%) was true at the 1 % significance level, i.e. no
significant difference between the data sets could be concluded. Therefore, from 1
to 10 wt% loading of Cloisite 10A, a mean average of 2.5 % reduction in
volumetric shrinkage could be expected.
Figure 4.15: Percentage volumetric shrinkage for various loadings of CaCO3,PVAc and montmorillonite composites in unsaturated polyester resin.Garamite® and CaCO3 both act as a reactive mass diluent, where as the nano-structure of the Cloisite® 10A assist in reducing resin shrinkage by 2.5 % over thatof the base system.
Glass Transition Temperature
The glass transition temperature of the nanocomposite and CaCO3 filled
unsaturated polyester resin was monitored for loadings ranging between 0 to 10
wt%. Figure 4.16 shows that base resin Tg increased for all concentrations of clay.
A maximum of 11 ºC increase was seen for the nanocomposite structure
0
1
2
3
4
5
6
7
8
9
1 10 100
Loading (wt%) Log Scale
Vo
lum
etr
icS
hri
nkag
e(%
)
CaCO3
Cloisite 10A
Garamite
PVAc
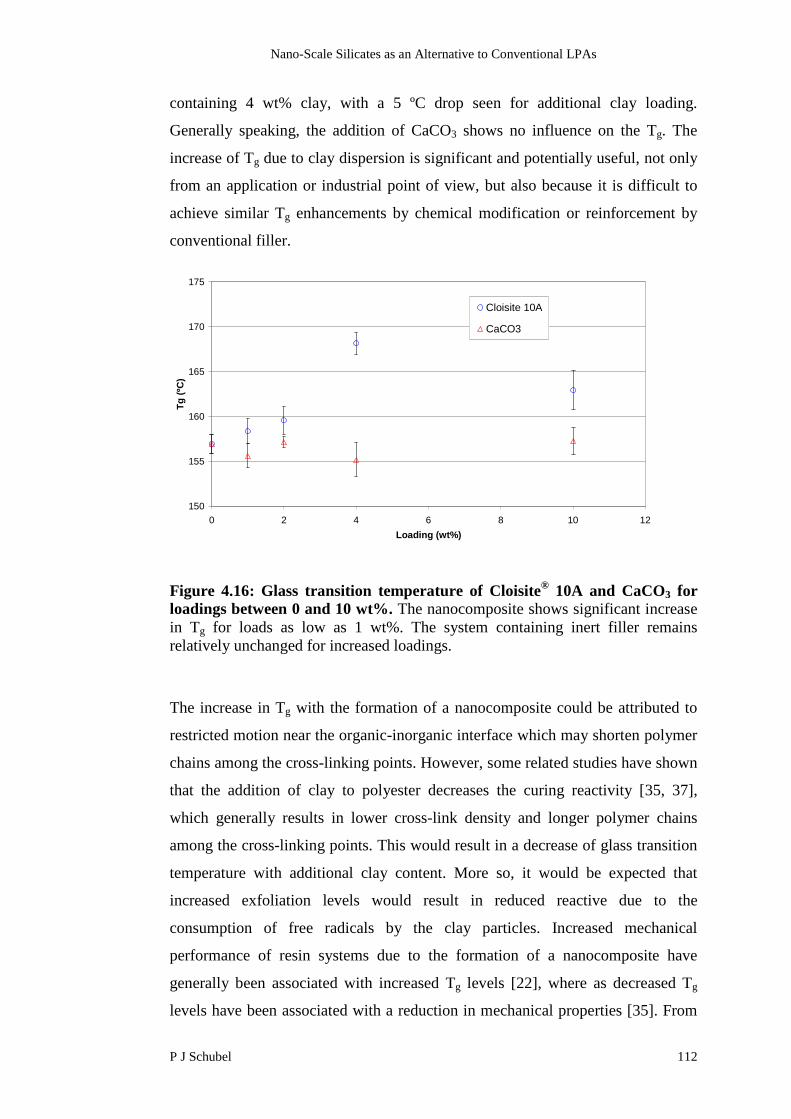
Nano-Scale Silicates as an Alternative to Conventional LPAs
P J Schubel 112
containing 4 wt% clay, with a 5 ºC drop seen for additional clay loading.
Generally speaking, the addition of CaCO3 shows no influence on the Tg. The
increase of Tg due to clay dispersion is significant and potentially useful, not only
from an application or industrial point of view, but also because it is difficult to
achieve similar Tg enhancements by chemical modification or reinforcement by
conventional filler.
Figure 4.16: Glass transition temperature of Cloisite® 10A and CaCO3 forloadings between 0 and 10 wt%. The nanocomposite shows significant increasein Tg for loads as low as 1 wt%. The system containing inert filler remainsrelatively unchanged for increased loadings.
The increase in Tg with the formation of a nanocomposite could be attributed to
restricted motion near the organic-inorganic interface which may shorten polymer
chains among the cross-linking points. However, some related studies have shown
that the addition of clay to polyester decreases the curing reactivity [35, 37],
which generally results in lower cross-link density and longer polymer chains
among the cross-linking points. This would result in a decrease of glass transition
temperature with additional clay content. More so, it would be expected that
increased exfoliation levels would result in reduced reactive due to the
consumption of free radicals by the clay particles. Increased mechanical
performance of resin systems due to the formation of a nanocomposite have
generally been associated with increased Tg levels [22], where as decreased Tg
levels have been associated with a reduction in mechanical properties [35]. From
150
155
160
165
170
175
0 2 4 6 8 10 12
Loading (wt%)
Tg
(ºC
)
Cloisite 10A
CaCO3
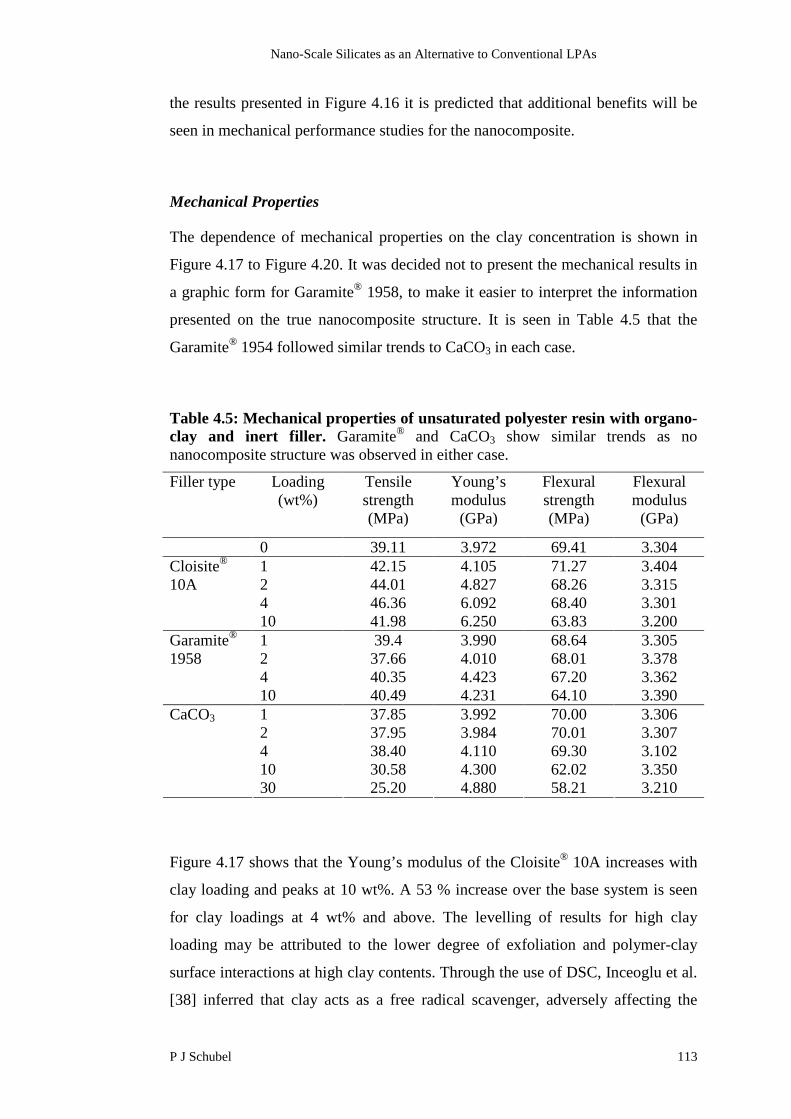
Nano-Scale Silicates as an Alternative to Conventional LPAs
P J Schubel 113
the results presented in Figure 4.16 it is predicted that additional benefits will be
seen in mechanical performance studies for the nanocomposite.
Mechanical Properties
The dependence of mechanical properties on the clay concentration is shown in
Figure 4.17 to Figure 4.20. It was decided not to present the mechanical results in
a graphic form for Garamite® 1958, to make it easier to interpret the information
presented on the true nanocomposite structure. It is seen in Table 4.5 that the
Garamite® 1954 followed similar trends to CaCO3 in each case.
Table 4.5: Mechanical properties of unsaturated polyester resin with organo-clay and inert filler. Garamite® and CaCO3 show similar trends as nonanocomposite structure was observed in either case.
Filler type Loading(wt%)
Tensilestrength(MPa)
Young’smodulus
(GPa)
Flexuralstrength(MPa)
Flexuralmodulus
(GPa)
0 39.11 3.972 69.41 3.3041 42.15 4.105 71.27 3.4042 44.01 4.827 68.26 3.3154 46.36 6.092 68.40 3.301
Cloisite®
10A
10 41.98 6.250 63.83 3.2001 39.4 3.990 68.64 3.3052 37.66 4.010 68.01 3.3784 40.35 4.423 67.20 3.362
Garamite®
1958
10 40.49 4.231 64.10 3.3901 37.85 3.992 70.00 3.3062 37.95 3.984 70.01 3.3074 38.40 4.110 69.30 3.10210 30.58 4.300 62.02 3.350
CaCO3
30 25.20 4.880 58.21 3.210
Figure 4.17 shows that the Young’s modulus of the Cloisite® 10A increases with
clay loading and peaks at 10 wt%. A 53 % increase over the base system is seen
for clay loadings at 4 wt% and above. The levelling of results for high clay
loading may be attributed to the lower degree of exfoliation and polymer-clay
surface interactions at high clay contents. Through the use of DSC, Inceoglu et al.
[38] inferred that clay acts as a free radical scavenger, adversely affecting the
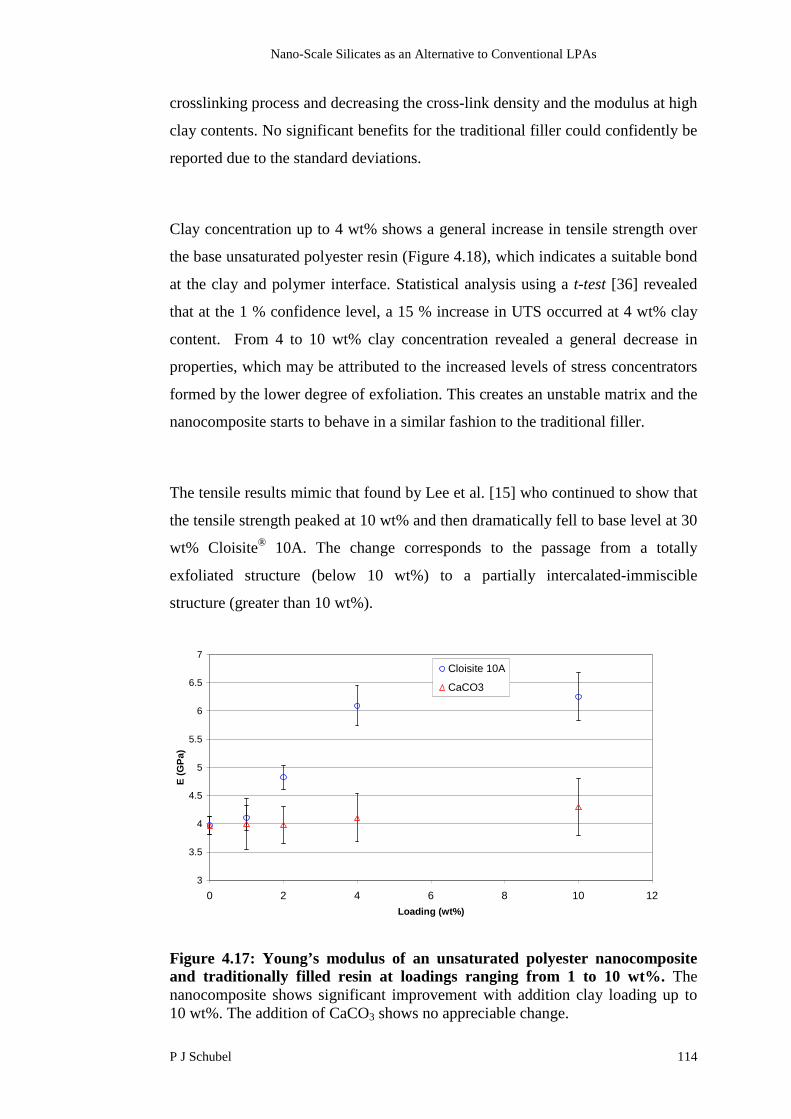
Nano-Scale Silicates as an Alternative to Conventional LPAs
P J Schubel 114
crosslinking process and decreasing the cross-link density and the modulus at high
clay contents. No significant benefits for the traditional filler could confidently be
reported due to the standard deviations.
Clay concentration up to 4 wt% shows a general increase in tensile strength over
the base unsaturated polyester resin (Figure 4.18), which indicates a suitable bond
at the clay and polymer interface. Statistical analysis using a t-test [36] revealed
that at the 1 % confidence level, a 15 % increase in UTS occurred at 4 wt% clay
content. From 4 to 10 wt% clay concentration revealed a general decrease in
properties, which may be attributed to the increased levels of stress concentrators
formed by the lower degree of exfoliation. This creates an unstable matrix and the
nanocomposite starts to behave in a similar fashion to the traditional filler.
The tensile results mimic that found by Lee et al. [15] who continued to show that
the tensile strength peaked at 10 wt% and then dramatically fell to base level at 30
wt% Cloisite® 10A. The change corresponds to the passage from a totally
exfoliated structure (below 10 wt%) to a partially intercalated-immiscible
structure (greater than 10 wt%).
Figure 4.17: Young’s modulus of an unsaturated polyester nanocompositeand traditionally filled resin at loadings ranging from 1 to 10 wt%. Thenanocomposite shows significant improvement with addition clay loading up to10 wt%. The addition of CaCO3 shows no appreciable change.
3
3.5
4
4.5
5
5.5
6
6.5
7
0 2 4 6 8 10 12
Loading (wt%)
E(G
Pa
)
Cloisite 10A
CaCO3

Nano-Scale Silicates as an Alternative to Conventional LPAs
P J Schubel 115
Figure 4.18: Tensile strength of an unsaturated polyester nanocomposite andtraditionally filled resin at loadings ranging from 1 to 10 wt%. An increase intensile strength is observed for clay loadings up to 4 wt%. Thereafter, thenanocomposite acts similar to a traditional filler and reduces tensile strength.
Figure 4.19 shows that the flexural modulus of the nanocomposite remains
relatively unchanged for increased loadings of clay. An increase in flexural
modulus was not seen in these experiments, unlike the reported 34 % increase
claimed by Inceoglu et al. [22] when using unsaturated polyester and silicate clay
(Cloisite® 30B). This could be due to the variation in clay surface treatment or
orientation effects. Similarly, increased CaCO3 levels showed relatively no effect
on the flexural modulus.
The flexural strength of the nanocomposite and traditional filler (Figure 4.20)
remained unchanged for loadings up to 4 wt%. Thereafter, both systems exhibit an
approximate decrease of 7 % in flexural strength for 10 wt% loading. The
reduction in exfoliation for high clay loadings promotes agglomeration of
particles in the nanocomposite, which contribute towards stress concentrations.
This may be one of the factors contributing to the trends seen in Figure 4.20.
These results may also suggest that silicates exhibit poor shear strength as
considerable shear forces are created during flexural testing.
20
25
30
35
40
45
50
0 2 4 6 8 10 12
Loading (wt%)
UT
S(M
Pa
)
Cloisite 10A
CaCO3

Nano-Scale Silicates as an Alternative to Conventional LPAs
P J Schubel 116
Figure 4.19: Flexural modulus of unsaturated polyester resin with clay andCaCO3 loadings ranging from 1 to 10 wt%. No appreciable change is seen foreither system irrespective of concentration.
Figure 4.20: Flexural strength of unsaturated polyester resin with clay andCaCO3 loadings ranging from 1 to 10 wt%. Both systems show similar trendswith decreasing flexural strength associated with increasing additive content.
4.5 Conclusions
It has been demonstrated through changing surface reactant, that the level of
exfoliation is influenced by the strong interaction or miscibility between the
55
60
65
70
75
0 2 4 6 8 10 12
Loading (wt%)
Fle
xu
ralS
tre
ng
th(M
Pa
)
Cloisite 10A
CaCO3
2.6
2.8
3
3.2
3.4
3.6
3.8
4
0 2 4 6 8 10 12
Loading (wt%)
Fle
xu
ral
Mo
du
lus
(GP
a)
Cloisite 10A
CaCO3

Nano-Scale Silicates as an Alternative to Conventional LPAs
P J Schubel 117
polyester and clay surface type. It has been speculated that strong polar-type
interactions such as hydrogen bonding, are critical for the formation of
intercalated and especially exfoliated hybrids via in-situ intercalation [15].
However, Cloisite® 10A suffers from relatively weaker polarity due to the
ammonium cation in the gallery. Through controlled processing, the intercalation
of the monomer into the silicate layers has been shown to effectively exfoliate the
silicate layers and create suitable interactions to form a true nanocomposite
structure. 4 wt% of Cloisite® 10A was found to be the optimum loading in most
test cases. This was due to high levels of exfoliation achieved through maximum
swelling of the galleries from available monomer. Loadings higher than 4 wt%
were starved of monomer and subsequent reduction in exfoliation was seen.
The use of nano-scale silicate clay in unsaturated polyester resin has been shown
to be effective in reducing volumetric resin shrinkage due to the immobilisation of
resin in the regions of contact with the silicate surface. However, the
nanocomposite still needs to incorporate conventional methods of resin shrinkage
control to obtain the level of resin shrinkage seen with epoxy resin (~1 %).
Additional benefits were seen, including an increase in Tg, Young’s modulus and
tensile strength. However, adverse affects were seen to the flexural strength with
negligible change to the flexural modulus.
4.6 References
1. Tolle, T.B. and Anderson, D.P., Morphology development in layeredsilicate thermoset nanocomposites. Composites Science and Technology,2002. 62: p. 1033-1041.
2. Tsagaropoulos, G. and Eisenberg, A., Dynamic mechanical study of thefactors affecting the two glass transition behavior of filled polymers.Similarities and differences with random ionomers. Macromolecules,1995. 28: p. 6067-6077.
3. Kornmann, X., Berglund, L.A., Sterte, J., and Giannelis, E.P.,Nanocomposites based on montmorillonite and unsaturated polyester.Polymer Engineering and Science, 1998. 38: p. 1351-1361.
4. Agag, T., Koga, T., and Takeichi, T., Studies on thermal and mechanicalproperties of polyimide-clay nanocomposites. Polymer, 2001. 42: p. 3399-3408.
5. Chen, C.G. and Curliss, D., Resin matrix composites: organoclay-aerospace epoxy nanocomposites, Part II. SAMPE, 2001(37): p. 11-18.
Nano-Scale Silicates as an Alternative to Conventional LPAs
P J Schubel 118
6. Pinnavaia, T.J. and Beall, G.W., Polymer-clay nanocomposites. 2000,New York: John Wiley & Sons.
7. Kojima, Y., Usuki, A., Kawasumi, M., Okada, A., and Fukushima, Y.,Mechanical properties of nylon 6-clay hybrid. Materials Research, 1993.8: p. 1185-1189.
8. Messersmith, P. and Giannelis, E.P., Synthesis and characterization oflayered silicate-epoxy nanocomposites. Chemistry of Materials, 1994. 6: p.1719-1725.
9. Giannelis, E.P., Polymer layered silicate nanocomposites. AdvancedMaterials, 1996. 8: p. 29-35.
10. Lan, T. and Pinnavaia, T., Clay-reinforced epoxy nanocomposites.Chemistry of Materials, 1994. 6: p. 2216-2219.
11. Lee, D.C. and Jang, L.W., Characterisation of epoxy clay hybridcomposite prepared by emulsion polymerisation. Applied PolymerScience, 1998. 68: p. 1997-2005.
12. Okada, A., Nylon 6-clay hybrid. MRS Proceedings, 1990. 171: p. 45-50.13. Bhattacharya, S.K. and Tummala, R.R., Integral passives for next
generation of electronic packaging: Application of epoxy/ceramicnanocomposites as integral capacitors. Microelectronics, 2001. 32: p. 11-19.
14. Qiaoling, H., Baoqiang, L., Mang, W., and Jiacong, S., Preparation andcharacterization of biodegradable chitosan/hydroxyapatite nanocompositerods via in situ hybridization: a potential material as internal fixation ofbone fracture. Biomaterials, 2004. 25: p. 779-785.
15. Lee, S.R., Park, H.M., Lim, H., Kang, T., and Li, X., Microstructure,tensile properties, and biodegradability of aliphatic polyester/claynanocomposites. Polymer, 2002. 43: p. 2495-2500.
16. Moukarika, A., Cation migration in alkali-saturated montmorillonites.2001, University of Loannina: Loannina. p. 103.
17. Beermann, T., Structure determination at clay mineral single crystals ofthe smectite group by convergent beam electron diffraction (CBED): Tothe crystal chemistry of montmorillonite. 2000, University of Bremen:Bremen.
18. Alexandre, M. and Dubois, P., Polymer layered silicate nanocomposites:preparation, properties and uses of a new class of materials. MaterialsScience and Engineering, 2000. 28: p. 1-63.
19. Kornmann, X., Lindburg, H., and Berglund, L.A., Synthesis of epoxy-claynanocomposites: influence of the nature of the clay on structure. Polymer42, 2001: p. 1303-1310.
20. Musto, P., Ragosta, G., Scarinzi, G., and Mascia, L., Polyimide-silicananocomposites: spectroscopic, morphological and mechanicalinvestigations. Polymer, 2004. 45: p. 1697-1706.
21. Suh, D.J., Lim, Y.T., and Park, O.O., The property and formationmechanism of unsaturated polyester-layered silicate nanocompositedepending on the fabrication methods. Polymer, 2000. 41: p. 8557-8563.
22. Inceoglu, A.B. and Yilmazer, U., Mechanical properties of unsaturatedpolyester/ montmorillonite composites. Mat Res Soc, 2002. 703: p. 387-392.

Nano-Scale Silicates as an Alternative to Conventional LPAs
P J Schubel 119
23. Benfarhi, S., Decker, C., Keller, L., and Zahouily, K., Synthesis of claynanocomposite materials by light-induced crosslinking polymerization.European Polymer Journal, 2004. 40: p. 493-501.
24. Lepoittevin, B., Pantoustier, N., Devalckenaere, M., Alexandre, M.,Calberg, C., Jerome, R., and Dubois, P., Polymer/layered silicatenanocomposites by combination intercalative polymerization and meltintercalation: a masterbatch process. Polymer, 2003. 44: p. 2033-3040.
25. Wang, S., Hu, Y., Zong, R., Tang, Y., Ghen, Z., and Fan, W., Preparationand characterization of flame retardant ABS/montmorillonitenanocomposite. Applied Clay Science, 2004. 25: p. 49-55.
26. Sinha Ray, S. and Okamoto, M., Polymer/layered silicatenanocomposites: a review from preparation to processing. Progress inPolymer Science, 2003. 28: p. 1539-1641.
27. Chen, D.Z., He, P.S., and Pan, L.J., Cure kinetics of epoxy-basednanocomposites analyzed by Avrami theory of phase change. PolymerTesting, 2003. 22.
28. Shen, L., Phang, Y., Chen, L., Liu, T., and Zeng, K., Nano indentation andmorphological studies on nylon 66 nanocomposites. I. Effects of clayloading. Polymer, 2004. 45: p. 3341-3349.
29. Duk Yang, B., Hyun Yoon, K., and Woo Chung, K., Dispersion effect ofnanoparticles on the conjugated polymer-inorganic nanocomposites.Materials Chemistry and Physics, 2004. 83: p. 334-339.
30. Finnigan, B., Martin, D., Halley, P., Truss, R., and Campbell, K.,Morphology and properties of thermoplastic polyurethane nanocompositesincorporating hydrophilic layered silicates. Polymer, 2004. 45: p. 2249-2260.
31. Maiti, P., Nam, P., Okamoto, M., Kotaka, T., Hasegawa, N., and Usuki,A., The effects of crystallization on the structure and morphology ofpolypropylene/clay nanocomposites. Polymer Engineering Science, 2002.42: p. 1864-1871.
32. Cloisite 10A data sheet. Southern Clay Products,2001(http://www.nanoclay.com/).
33. Garamite data sheet. Southern Clay Products,2001(http://www.garamite.com/).
34. Lepoittevin, B., Pantoustier, N., Devalckenaere, M., Alexandre, M.,Kubies, D., Calberg, C., Jerome, R., and Dubois, P.,Poly(caprolactone)/clay nanocomposites by in-situ intercalativepolymerization catalyzed by dibutyltin dimethoxide. Macromolecules,2002. 35: p. 8385-8390.
35. Bharadwaj, R.K., Mehrabi, A.R., Hamilton, C., Trujillo, C., and Murga,M., Structure-property relationships in cross-linked polyester-claynanocomposites. Polymer, 2002. 43: p. 3699-3705.
36. Chatfield, C., Statistics for technology: A course in applied statistics, 3rded. 1986, Chapman & Hall: New York. p. 142.
37. Gu, A. and Liang, G., Thermal degradation behaviour and kinetic analysisof epoxy/montmorillonite nanocomposites. Polymer Degradation andStability, 2003. 80: p. 383-391.
38. Inceoglu, A.B. and Yilmazer, U., Synthesis and mechanical properties ofunsaturated polyester based nanocomposites. Polymer Engineering andScience, 2003. 43(3): p. 661-669.
Characterisation of Low Profile Nanocomposite Laminates
P J Schubel 120
5 Characterisation of Low Profile Nanocomposite Laminates
5.1 Introduction
The use of nano scale silicate particles have been shown in Chapter 4 to assist in
reducing polymerisation shrinkage with additional side benefits in mechanical
properties. Although the main objective of creating a nanocomposite to reduce
polymerisation shrinkage was achieved, it was also shown that the level of
shrinkage control did not match that of a conventional low profiling system such
as PVAc. It was envisaged that a hybrid nanocomposite-LPA system would
produce suitable shrinkage control, resulting in a cosmetic polymer composite.
The potential reduction in problematic residual VOCs due to lower LPA content
and addition mechanical properties warranted further investigation.
5.2 Experimental Procedure
The materials used in this study were based on the low profile unsaturated
polyester, E-glass system described in Section 2.5.1. The low profile and base
resin systems were used as benchmarks throughout this study (Table 5.1). The
preform was made from random E-glass fibres sandwiched between a chop-strand
E-glass veil and moulded using RTM (Section 2.5.2) with unsaturated polyester
(RT2557), initiated with TBPB and accelerated with a cobalt solution
(Accelerator G). 4 wt% Cloisite 10A was included into the matrix using the in-situ
intercalative polymerisation method described in Section 4.4.2. 4 wt% silicate
clay loading was chosen as it was shown in Chapter 4 that a fully exfoliated
structure was formed, the highest reduction in polymerisation shrinkage was
obtained and the optimal improvements in mechanical properties were observed.
PVAc was used as a LPA and added to the resin via shear mixing at loadings
ranging from 0 to 30 wt%. All laminates were postcured in the process described
in Section 2.5.2. The average fibre volume fraction of the composite samples was
determined, by burn-off trials at 625 ºC, to be 25 %.

Characterisation of Low Profile Nanocomposite Laminates
P J Schubel 121
Table 5.1: Constituents used for experimental production of hybridnanocomposites with LPA.
Sample ID Resin Silicate(wt%)
LPA(wt%)
Initiator(wt%)
Accel(wt%)
Reinforce-ment
Benchmark 1 UnsaturatedPolyester
- - TBPB (2) G (0.5) Random E-glass, contin.surface veil
Benchmark 2 UnsaturatedPolyester
- PVAc(30)
TBPB (2) G (0.5) Random E-glass, contin.surface veil
Hybrid 0 UnsaturatedPolyester
Cloisite10A (4)
PVAc(0)
TBPB (2) G (0.5) Random E-glass, contin.surface veil
Hybrid 5 UnsaturatedPolyester
Cloisite10A (4)
PVAc(5)
TBPB (2) G (0.5) Random E-glass, contin.surface veil
Hybrid 10 UnsaturatedPolyester
Cloisite10A (4)
PVAc(10)
TBPB (2) G (0.5) Random E-glass, contin.surface veil
Hybrid 15 UnsaturatedPolyester
Cloisite10A (4)
PVAc(15)
TBPB (2) G (0.5) Random E-glass, contin.surface veil
Hybrid 20 UnsaturatedPolyester
Cloisite10A (4)
PVAc(20)
TBPB (2) G (0.5) Random E-glass, contin.surface veil
Hybrid 30 UnsaturatedPolyester
Cloisite10A (4)
PVAc(30)
TBPB (2) G (0.5) Random E-glass, contin.surface veil
Resin casts were produced for measurement of volumetric shrinkage using the
procedure described in Section 4.4.2. Volumetric measurements of the resin casts
were obtained using a multipycnometer (Section 4.4.2). Surface analysis
techniques described in Section 2.5.4 were employed to characterise the bare and
painted (Section 2.5.3) laminate surfaces. Residual VOCs of the composites were
monitored by solvent elution gas chromatography (GC) on a Shimadzu GC 17A
version 3 analyser with an automated sampler. Details of the method are found in
Section 3.3. The tensile and flexural properties of the composites were measured
using a Hounsfield H25KS with a 100SC extensometer following BS EN ISO
527-4:1997 and BS EN ISO 14125:1998 respectively. The tensile and flexural test
specimens were loaded at a constant rate of 1 mm/min until failure. Tensile
modulus was calculated as the slope in the stress-strain curve for strain values
between 0.001 and 0.003. At least 5 specimens were taken from each sample to
give an average reading. Impact strength was measured on an Avery-Denison
Charpy impact tester with a 15 J capacity, following the ISO 179:1997 standard.
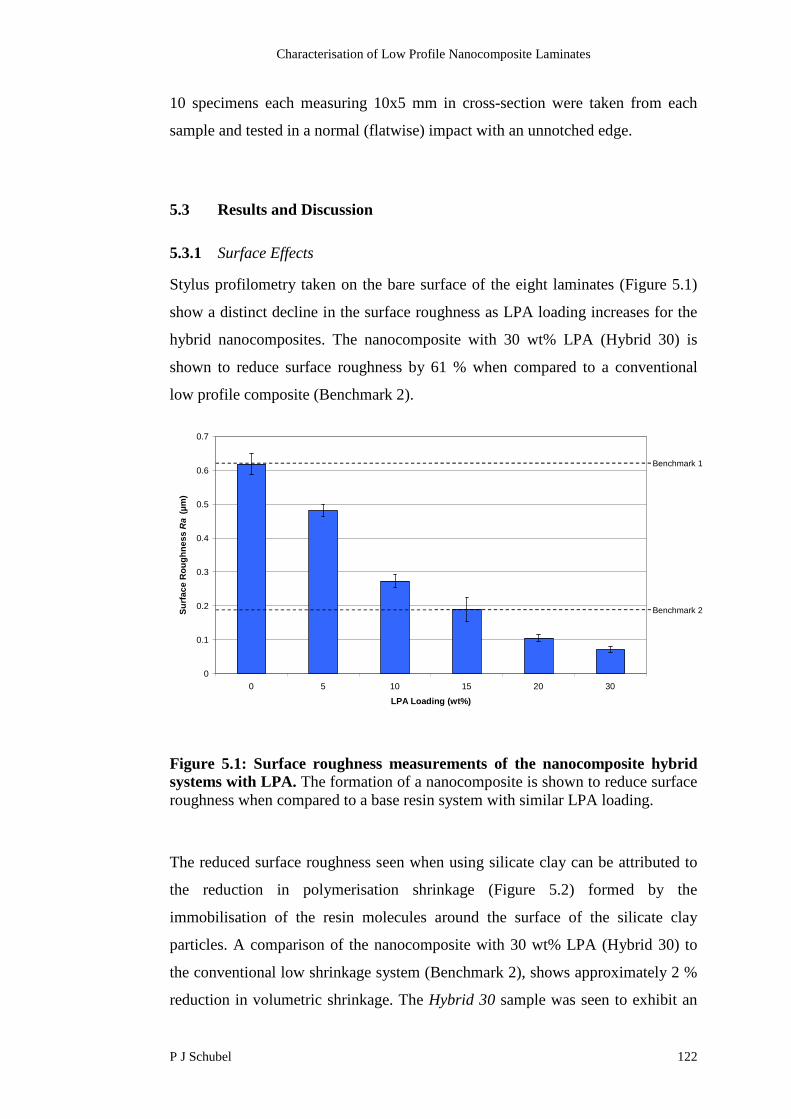
Characterisation of Low Profile Nanocomposite Laminates
P J Schubel 122
10 specimens each measuring 10x5 mm in cross-section were taken from each
sample and tested in a normal (flatwise) impact with an unnotched edge.
5.3 Results and Discussion
5.3.1 Surface Effects
Stylus profilometry taken on the bare surface of the eight laminates (Figure 5.1)
show a distinct decline in the surface roughness as LPA loading increases for the
hybrid nanocomposites. The nanocomposite with 30 wt% LPA (Hybrid 30) is
shown to reduce surface roughness by 61 % when compared to a conventional
low profile composite (Benchmark 2).
Figure 5.1: Surface roughness measurements of the nanocomposite hybridsystems with LPA. The formation of a nanocomposite is shown to reduce surfaceroughness when compared to a base resin system with similar LPA loading.
The reduced surface roughness seen when using silicate clay can be attributed to
the reduction in polymerisation shrinkage (Figure 5.2) formed by the
immobilisation of the resin molecules around the surface of the silicate clay
particles. A comparison of the nanocomposite with 30 wt% LPA (Hybrid 30) to
the conventional low shrinkage system (Benchmark 2), shows approximately 2 %
reduction in volumetric shrinkage. The Hybrid 30 sample was seen to exhibit an
0
0.1
0.2
0.3
0.4
0.5
0.6
0.7
0 5 10 15 20 30
LPA Loading (wt%)
Su
rfa
ce
Ro
ug
hn
es
sR
a(µ
m)
Benchmark 1
Benchmark 2

Characterisation of Low Profile Nanocomposite Laminates
P J Schubel 123
expansion of 1 %, which adds to the initial positive pressure in the mould cavity
created by thermal expansion during polymerisation (Section 1.3.1). This
phenomenon resulted in the laminate surface duplicating the characteristics of the
tooling surface. This is evident by similar surface roughness profiles (Figure 5.3)
and Ra values (Tooling surface Ra = 0.07 µm, Section 2.6.3). The combination of
20 wt% LPA and 4 wt% silicate clay reduced volumetric shrinkage to levels seen
in the low shrinkage unsaturated polyester system and CaCO3 filler used in
surface quality experiments detailed in Chapter 2.
Based on the findings from Section 2.6.2, the results from Figure 5.1 indicate that
suitable paint quality will potentially be obtained from the nanocomposite
laminates only with loadings of LPA greater than 15 wt%. However, ‘Hybrid 15’
is marginally over the roughness threshold of 0.16 µm.
Figure 5.2: Volumetric shrinkage for hybrid composites of silicate clay andPVAc in unsaturated polyester resin. PVAc loadings range from 0 to 30 wt%.A nanocomposite with 20 wt% LPA is shown to have similar volumetricshrinkage to an unsaturated polyester with 30 wt% LPA (Benchmark 2).
-2
-1
0
1
2
3
4
5
6
7
8
LPA Loading (wt%)
Vo
lum
etr
icS
hri
nk
ag
e(%
)
0
Benchmark 2
5
Benchmark 1
30201510
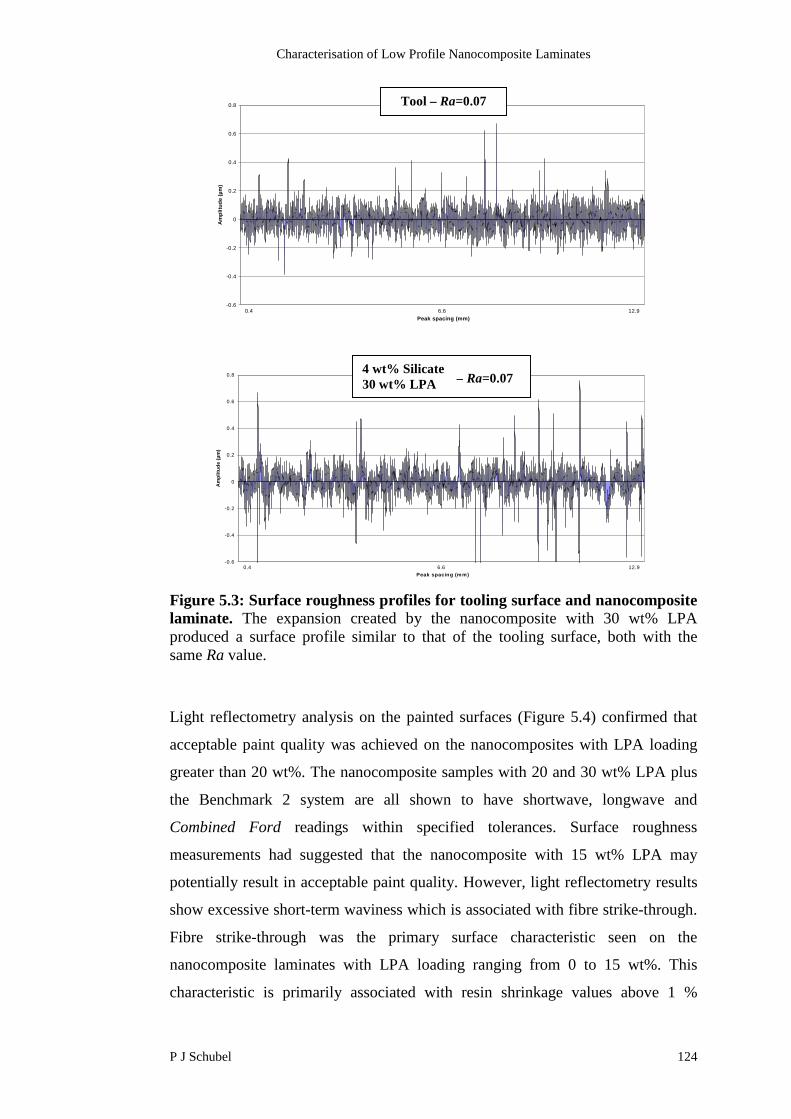
Characterisation of Low Profile Nanocomposite Laminates
P J Schubel 124
Figure 5.3: Surface roughness profiles for tooling surface and nanocompositelaminate. The expansion created by the nanocomposite with 30 wt% LPAproduced a surface profile similar to that of the tooling surface, both with thesame Ra value.
Light reflectometry analysis on the painted surfaces (Figure 5.4) confirmed that
acceptable paint quality was achieved on the nanocomposites with LPA loading
greater than 20 wt%. The nanocomposite samples with 20 and 30 wt% LPA plus
the Benchmark 2 system are all shown to have shortwave, longwave and
Combined Ford readings within specified tolerances. Surface roughness
measurements had suggested that the nanocomposite with 15 wt% LPA may
potentially result in acceptable paint quality. However, light reflectometry results
show excessive short-term waviness which is associated with fibre strike-through.
Fibre strike-through was the primary surface characteristic seen on the
nanocomposite laminates with LPA loading ranging from 0 to 15 wt%. This
characteristic is primarily associated with resin shrinkage values above 1 %
-0.6
-0.4
-0.2
0
0.2
0.4
0.6
0.8
Peak spacing (mm)
Am
pli
tud
e(µ
m)
0.4 6.6 12.9
Tool – Ra=0.07
-0.6
-0.4
-0.2
0
0.2
0.4
0.6
0.8
Peak spacing (m m)
Am
pli
tud
e(µ
m)
0.4 6.6 12.9
4 wt% Silicate30 wt% LPA – Ra=0.07

Characterisation of Low Profile Nanocomposite Laminates
P J Schubel 125
(Section 2.6.4). Subjective assessment of the painted laminates support light
reflectometry results, in suggesting that acceptable paint quality was obtained on
the nanocomposites with 20 and 30 wt% LPA plus the Benchmark 2 system.
Figure 5.4: Light reflectometry results for the painted surfaces of thebenchmark and nanocomposite laminates. Short-term waviness is the primarycharacteristic seen on laminates with less than 15 wt% LPA.
5.3.2 Volatile Organic Compounds
Gas chromatography was used on the samples listed in Table 5.1 to determine the
residual styrene and benzaldehyde content for as moulded and postcured
conditions. The residual styrene content of the benchmark systems (Figure 5.5)
show similar results to the nanocomposites with the same LPA loading (0 and 30
wt%). An 8-fold increase in residual styrene is seen when LPA loading is
increased from 0 to 30 wt%. A 0.44 % reduction in residual styrene is seen when
reducing the LPA loading from 30 to 20 wt% in the nanocomposite system.
However, postcuring reduces all systems to a negligible level.
0
10
20
30
40
50
60
70
80
90
100
Benchmark1
0 5 10 15 20 30 Benchmark2
LPA Loading (wt%)
No
rmali
sed
Rati
ng
Longwave (LW)
Shortwave (SW)
Combined Ford (CF)
Acceptable CF(above 65)
Acceptable LW(below 8)
Acceptable SW(below 20)
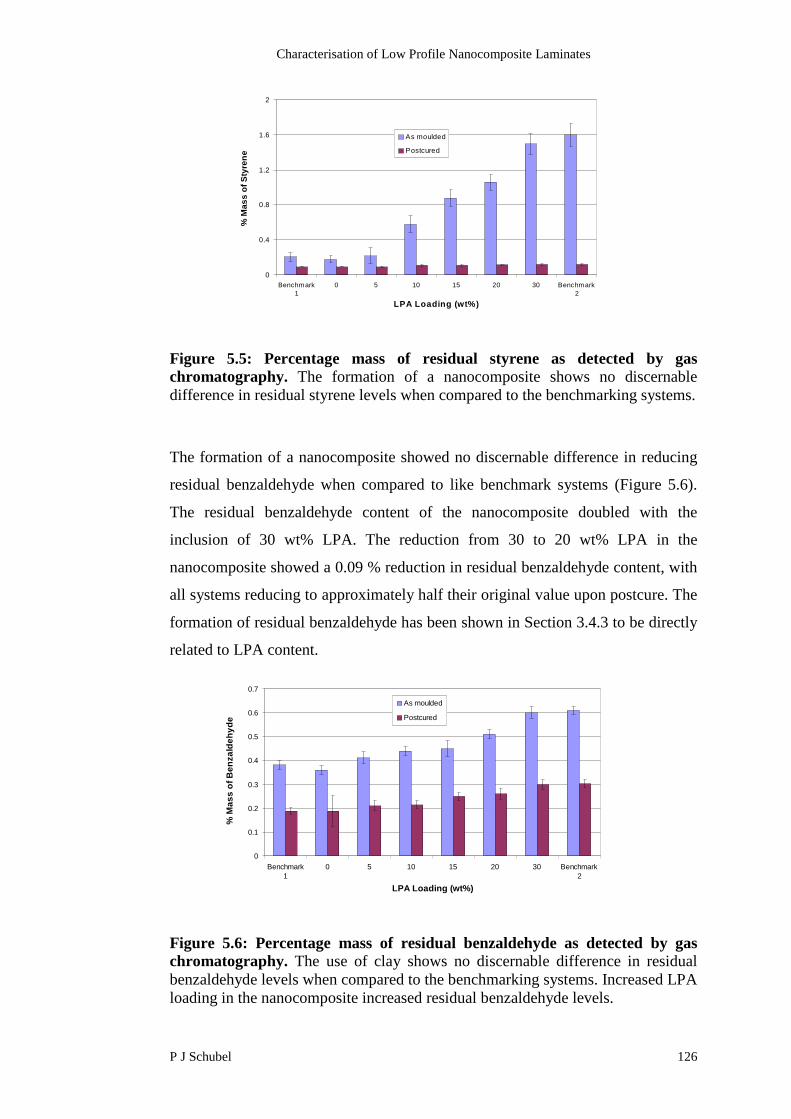
Characterisation of Low Profile Nanocomposite Laminates
P J Schubel 126
Figure 5.5: Percentage mass of residual styrene as detected by gaschromatography. The formation of a nanocomposite shows no discernabledifference in residual styrene levels when compared to the benchmarking systems.
The formation of a nanocomposite showed no discernable difference in reducing
residual benzaldehyde when compared to like benchmark systems (Figure 5.6).
The residual benzaldehyde content of the nanocomposite doubled with the
inclusion of 30 wt% LPA. The reduction from 30 to 20 wt% LPA in the
nanocomposite showed a 0.09 % reduction in residual benzaldehyde content, with
all systems reducing to approximately half their original value upon postcure. The
formation of residual benzaldehyde has been shown in Section 3.4.3 to be directly
related to LPA content.
Figure 5.6: Percentage mass of residual benzaldehyde as detected by gaschromatography. The use of clay shows no discernable difference in residualbenzaldehyde levels when compared to the benchmarking systems. Increased LPAloading in the nanocomposite increased residual benzaldehyde levels.
0
0.4
0.8
1.2
1.6
2
Benchmark
1
0 5 10 15 20 30 Benchmark
2
LPA Loading (wt%)
%M
as
so
fS
tyre
ne
As moulded
Postcured
0
0.1
0.2
0.3
0.4
0.5
0.6
0.7
Benchmark1
0 5 10 15 20 30 Benchmark2
LPA Loading (wt%)
%M
as
so
fB
en
za
lde
hy
de
As moulded
Postcured

Characterisation of Low Profile Nanocomposite Laminates
P J Schubel 127
5.3.3 Mechanical Properties
Tensile tests (Figure 5.7 and Figure 5.8) on the materials listed in Table 5.1
revealed that LPA in the base unsaturated polyester system produced a 25 %
reduction in Young’s modulus. The use of silicate clay to form a nanocomposite
increased the stiffness 2-fold for all levels of LPA loading. Similar trends in
tensile strength were observed, where the UTS of the unsaturated polyester
composite fell by 7 % with the inclusion of 30 wt% LPA (Benchmark 1 and 2).
However, the formation of a nanocomposite increased the UTS by an average of
53 % for all cases. The rule of mixtures [1] was used to calculate the theoretical
Young’s modulus of the unsaturated polyester composite (Benchmark 1) and of
the nanocomposite (Hybrid 0). Calculated properties were based on the Young’s
modulus of the resin cases presented in Table 4.5 with the Young’s modulus of E-
glass being taken as 70 GPa. Predicted values are shown in Figure 5.8 and show
good agreement with experimental data, falling just outside the bounds of the
error bars in each case.
The area under the curves in Figure 5.7 indicate that the formation of a
nanocomposite resulted in higher strain energy at failure over that of the base or
low profile unsaturated polyester system. Measurement of impact strength via
Charpy analysis (Figure 5.9) showed an average of 3 % decrease when using LPA
in unsaturated polyester (Benchmark 1 and 2). The loss of impact strength is
easily compensated by the inclusion of clay, which is shown to improve the
impact strength by an average of 28 %.
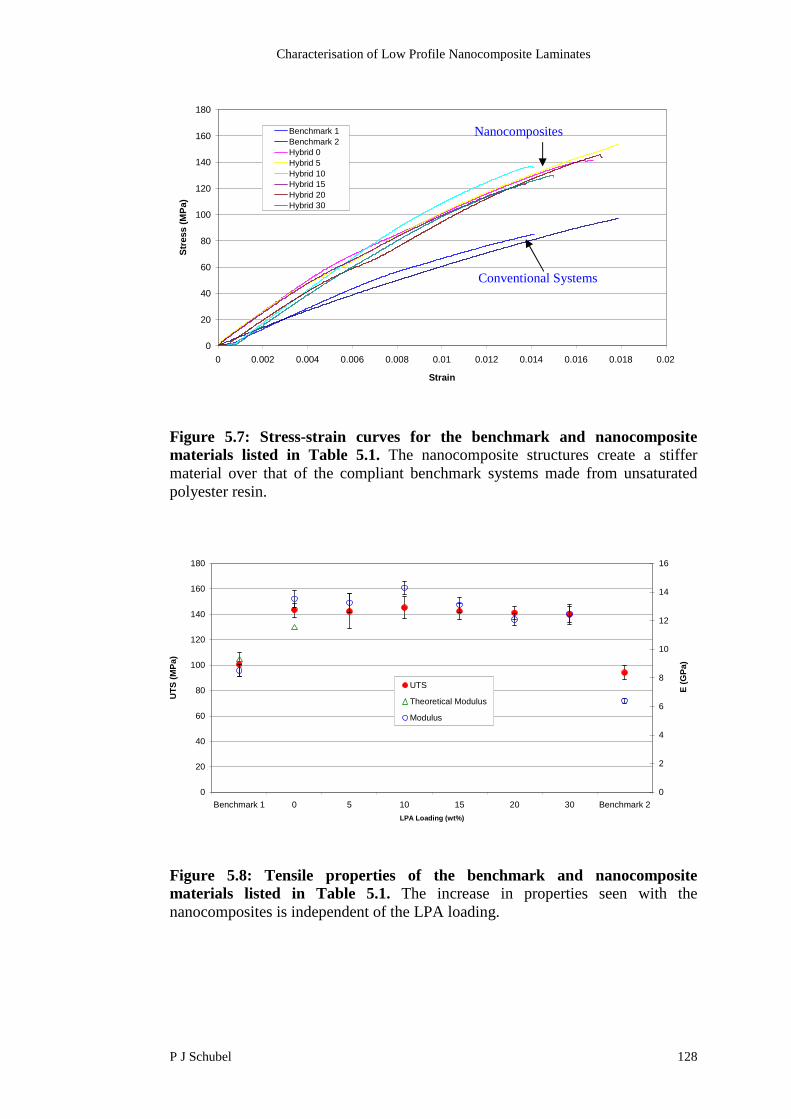
Characterisation of Low Profile Nanocomposite Laminates
P J Schubel 128
Figure 5.7: Stress-strain curves for the benchmark and nanocompositematerials listed in Table 5.1. The nanocomposite structures create a stiffermaterial over that of the compliant benchmark systems made from unsaturatedpolyester resin.
Figure 5.8: Tensile properties of the benchmark and nanocompositematerials listed in Table 5.1. The increase in properties seen with thenanocomposites is independent of the LPA loading.
0
20
40
60
80
100
120
140
160
180
0 0.002 0.004 0.006 0.008 0.01 0.012 0.014 0.016 0.018 0.02
Strain
Str
ess
(MP
a)
Benchmark 1
Benchmark 2Hybrid 0
Hybrid 5
Hybrid 10Hybrid 15
Hybrid 20Hybrid 30
Nanocomposites
Conventional Systems
0
20
40
60
80
100
120
140
160
180
Benchmark 1 0 5 10 15 20 30 Benchmark 2
LPA Loading (wt%)
UT
S(M
Pa)
0
2
4
6
8
10
12
14
16
E(G
Pa)
UTS
Theoretical Modulus
Modulus

Characterisation of Low Profile Nanocomposite Laminates
P J Schubel 129
Figure 5.9: Effect of clay on unnotched, Charpy impact energy ofunsaturated polyester composites. The formation of a nanocomposite structureimproves impact strength above that of a base or LPA loaded unsaturatedpolyester matrix.
Figure 5.10 shows that flexural strength and modulus of the base unsaturated
polyester composite is reduced by 24 and 30 % respectively with the inclusion of
30 wt% LPA. The use of silicate clay to form a nanocomposite has also been
shown to reduce flexural strength and modulus by 20 and 14 % respectively, over
that of the base unsaturated polyester system (Benchmark 1). The flexural
properties of a composite material with LPA were improved with the use of
silicate nanocomposites, but it was not possible here to restore these to the levels
of a conventional (i.e. non-low profile) resin.
0
20
40
60
80
100
120
140
0 5 10 15 20 30
LPA Loading (wt%)
Ch
arp
yIm
pact
Str
en
gth
(kJ/m
2)
Benchmark 1&
Benchmark 2
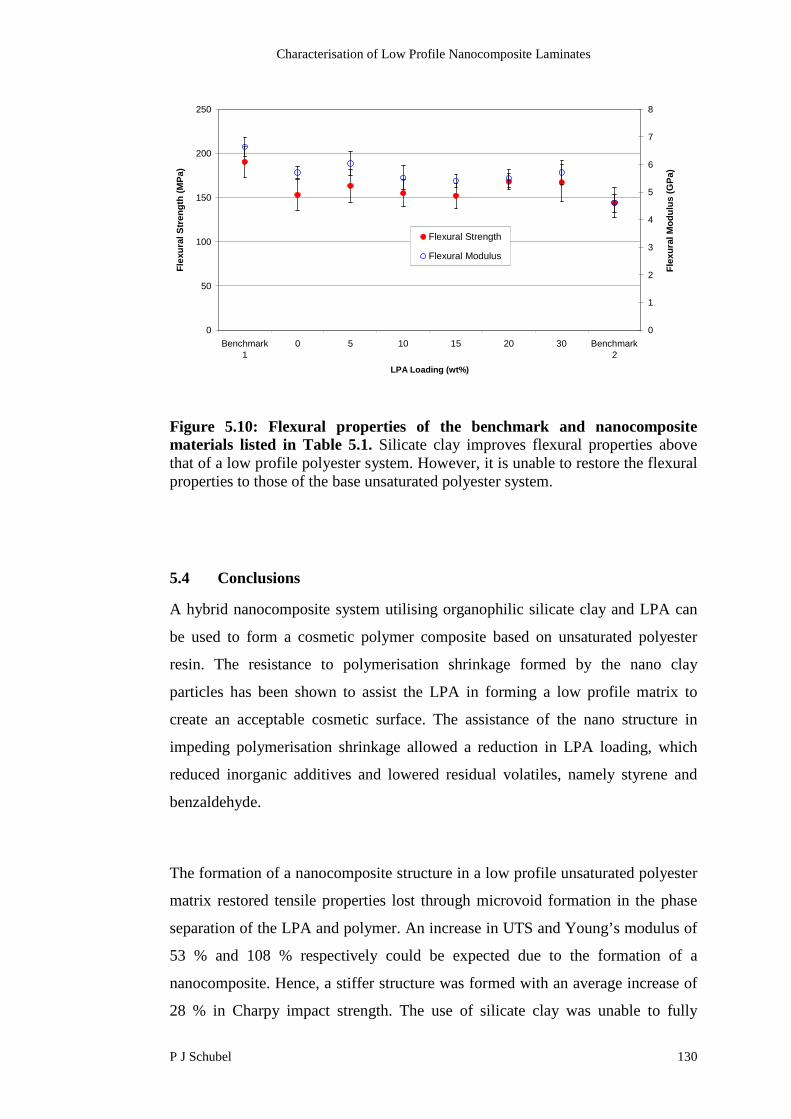
Characterisation of Low Profile Nanocomposite Laminates
P J Schubel 130
Figure 5.10: Flexural properties of the benchmark and nanocompositematerials listed in Table 5.1. Silicate clay improves flexural properties abovethat of a low profile polyester system. However, it is unable to restore the flexuralproperties to those of the base unsaturated polyester system.
5.4 Conclusions
A hybrid nanocomposite system utilising organophilic silicate clay and LPA can
be used to form a cosmetic polymer composite based on unsaturated polyester
resin. The resistance to polymerisation shrinkage formed by the nano clay
particles has been shown to assist the LPA in forming a low profile matrix to
create an acceptable cosmetic surface. The assistance of the nano structure in
impeding polymerisation shrinkage allowed a reduction in LPA loading, which
reduced inorganic additives and lowered residual volatiles, namely styrene and
benzaldehyde.
The formation of a nanocomposite structure in a low profile unsaturated polyester
matrix restored tensile properties lost through microvoid formation in the phase
separation of the LPA and polymer. An increase in UTS and Young’s modulus of
53 % and 108 % respectively could be expected due to the formation of a
nanocomposite. Hence, a stiffer structure was formed with an average increase of
28 % in Charpy impact strength. The use of silicate clay was unable to fully
0
50
100
150
200
250
Benchmark1
0 5 10 15 20 30 Benchmark2
LPA Loading (wt%)
Fle
xu
ralS
tren
gth
(MP
a)
0
1
2
3
4
5
6
7
8
Fle
xu
ralM
od
ulu
s(G
Pa)
Flexural Strength
Flexural Modulus

Characterisation of Low Profile Nanocomposite Laminates
P J Schubel 131
restore flexural properties lost when using a LPA in the polyester matrix.
However, a minor increase in flexural modulus was obtainable.
5.5 Reference
1. Hull, D. and Clyne, T.W., An introduction to composite materials. 2ndEdition. 1996, Cambridge University Press: Cambridge.
Discussion and Conclusions
P J Schubel 132
6 Discussion and Conclusions
6.1 Introduction
This chapter discusses the work included in the main body of this thesis, with
reference to the overall theme described in Chapter 1. The contents of each
chapter are summarised and assessed to evaluate their implications in the
manufacture of cosmetic polymer composites for the automotive industry. Several
recommendations for further work are made, and the overall conclusions are
presented.
6.2 General Discussion
This thesis is mainly concerned with matrix selection for low cost, cosmetic,
automotive body panelling. The overall objective of this research was to identify
the parameters that affect residual VOCs and to use this information to optimise
the curing process and subsequent mechanical properties.
6.2.1 Surface Quality
A repeatable and reliable process for detection of surface characteristics on bare
and painted polymer substrates was presented in Chapter 2. The use of stylus
profilometry for measuring the surface roughness via the roughness parameter Ra,
provided a reliable predictive tool for determining final paint quality. This
technique was found to be useful in measuring surface roughness of bare polymer
substrates but not that of painted substrates. Through the use of microscopy, the
paint process was seen to include its own level of surface roughness, which
influenced the true representation of the paint quality when using profilometry. To
overcome this, light reflectometry was used to measure short and long-term
waviness. This allowed for accurate determination of paint quality and detection
of specific characteristics such as fibre strike-through and textile induced
waviness. These results showed good correlation with subjective assessment of
the painted substrates. An extensive study was undertaken to verify the subjective

Discussion and Conclusions
P J Schubel 133
assessment, which utilised appraisers with no experience in assessing surface
quality (Group 1) and a second group with extensive experience in assessing
surface quality (Group 2). A Sigma Six process and MiniTab software analysis
revealed that the choice of appraisers influenced subjective results and showed
that Group 2 could be statistically justified as an acceptable means for qualitative
assessment of a painted surface. The development of the surface analysis
techniques, allowed further investigation into the effects of tool surface
roughness, chemical resin shrinkage and tow size.
The surface roughness model (Appendix 8) demonstrates potential to simulate the
surface behaviour of laminates by accounting for thermal and polymerisation
shrinkage. There were a number of assumptions made to simplify the analysis,
which inherently add limitations to the accuracy of the model. An interesting
future study could be to expand the thermal analysis in two-dimensions to account
for the strain induced by neighbouring regions. Also, the current simulation has
only been developed for use where the fabric has not suffered any shear
deformation. Utilising the existing analysis principles to model the surface
roughness of a draped fabric with localised shear deformation would be a likely
next step. Despite the clear need for further development, the surface roughness
model presented produces encouraging results.
6.2.2 Residual VOCs
The identified residual VOCs of styrene and benzaldehyde emitted from low
profile unsaturated polyester laminates were investigated in Chapter 3. Initial
investigations utilising a thermal desorption technique (TGA) were proven to be
inadequate for extraction of all available compounds when compared to results
from a solvent elution technique (GC). This highlighted the inability of the
monomer to fully terminate due to physical entrapment. Residual thermal activity
studies using DSC revealed that the substrates were essentially fully cured despite
having measurable levels of residual monomer. This posed the question as to
whether DSC is an accurate means of measuring the residual reactivity of a
polymer composite due to the elevated temperatures used in DSC trials and the
Discussion and Conclusions
P J Schubel 134
ability for homopolymerisation of residual styrene. The development of a suitable
GC method allowed residual VOCs to be monitored for changes to formulation
and process parameters. Various situations were investigated to assist in
optimisation of the cure process with an emphasis placed on the increase in VOCs
produced when using PVAc as a means for controlling shrinkage in the polyester
matrix.
6.2.3 Nanocomposites
A novel approach to reducing the polymerisation shrinkage of unsaturated
polyester resin was presented in Chapter 4 following the discovery of the
problems associated with the use of PVAc as an additive. A variation of the in-
situ intercalative polymerisation method was devised and used to disperse nano-
scale silicate clay in an unsaturated polyester matrix. Characterisation of the
structure via XRD and TEM confirmed the formation of a nanocomposite with
full exfoliation of the silicate particles. A reduction in polymerisation shrinkage
was seen for loadings of clay as low as 1 wt%. The reduction in polymerisation
shrinkage obtained from the formation of a nano structure was not able to meet
the requirements of a cosmetic composite. However, evaluation of an E-glass
preform moulded by RTM with a hybrid matrix of silicate clay and PVAc was
trialled in Chapter 5, which resulted in acceptable surface quality and a reduction
of residual VOCs due to the reduced amount of thermoplastic additive. As well as
reducing residual VOCs, the nanocomposite was found to improve other areas of
physical and mechanical properties that are generally problematic with low profile
unsaturated polyester systems. Tensile properties were improved with the
formation of a nanocomposite. The two-fold increase in Young’s modulus and 53
% improvement in UTS exceeded most reported values in related literature. A
slight improvement in flexural properties and impact energy absorption was also
demonstrated, with a notable increase in the glass transition temperature.
Discussion and Conclusions
P J Schubel 135
6.3 Recommendations for Future Work
In light of the work performed, some important improvements or studies that
could be undertaken when measuring the surface quality aspects of a polymer
composite are:
Investigate the effect that surface roughness has on paint adhesion (ASTM
D3359, ASTM D 3170-01, SAE J400)
Analyse variations in the paint process for changes to the masking ability
of paint on surface defects. Initial parameters to look at would include:
paint type (solvent or waterborne), paint thickness, baking temperatures,
surface conditioning and spraying pressure.
From the surface roughness modelling the following refinements are suggested:
Derive the true reaction rates and obtain thermal parameters of the
polymer composite for accurate determination of thermal heat conduction
throughout the cure process. This will allow the surface characteristics of
the laminate to be determined at any time interval during the mould cycle.
Build on the basic principles used for the current model and formulate an
iterative two-dimensional thermal analysis to account for the strain
induced by neighbouring regions.
Apply the existing modelling principles to investigate the effects that
fabric shear angle has on surface roughness.
Some suggested future improvements and studies that could be performed with
the residual VOC detection are as follows:
An integrated modelling approach is required to relate cure kinetics of a
system to compound consumption/production. This will require a detailed
understanding of the reaction scheme and mechanism of the
polymerisation process. In any free-radical reaction there are a wide
variety of potential products and detailed information on component
reactivity ratios and reaction kinetics are required. In a multi-component,

Discussion and Conclusions
P J Schubel 136
two-stage reacting thermoset matrix, this becomes extremely complex and
merits significant further investigation. Modelling the system is made
particularly difficult by the volatile compounds involved and the variation
in diffusion rate of these compounds through the matrix as the reaction
proceeds (as well as the loss of volatiles during open-air post curing). The
system may also be complicated by the potential for radical termination on
the walls of the metal mould, thus component morphology could affect the
composition of the final product. The aforementioned suggestions are
potentially suited to the polymer chemistry discipline.
The development of nanocomposites for reducing volumetric shrinkage of
unsaturated polyester would benefit from the following research:
An investigation into the influence that sizing agent on the silicate clay has
on the exfoliation and final mechanical properties of the nanocomposite. A
silane (3-(Trimethoxysilyl)propyl methacrylate) or amine ([2-
(Methacryloyloxy)ethyl] trimethylammonium chloride) solution have been
identified as potential modifiers for improving compatibility of silicate to
polyester resin.
6.4 Major Conclusion
This section includes a summary of the major conclusions arising from the work
described in this thesis.
1. The surface quality of polymer composites can be effectively analysed
using instrumented techniques such as stylus profilometry, with thresholds
being developed for each technique. The use of the arithmetic mean
roughness parameter (Ra) provides accurate representation of the laminate
roughness in relation to the final paint quality.
2. Material characteristics such as thermal contraction, polymerisation
shrinkage and fibre architecture influence laminate surface roughness, as
relative matrix rich regions change volume in relation to the reinforcement
during polymerisation. Matrices with high coefficients of thermal

Discussion and Conclusions
P J Schubel 137
expansion and high polymerisation shrinkage produce greater surface
roughness.
3. A good basis for analytical modelling of the surface roughness is to start
from a geometric description of the reinforcement and matrix and produce
a general output, which is independent of the manufacturing process.
4. Paint layers progressively reduce defects associated with short-term
waviness, but is unable to mask features attributed to long-term waviness.
5. The process of measuring the degree of cure determined by DSC increases
the rate of styrene homopolymerisation, affecting the true residual
reactivity. Residual styrene content needs to be measured and accounted
for in the determination of true residual reactivity.
6. Solvent elution techniques are better suited to eluting total residual content
as evaporative techniques are limited by the diffusion rate and compound
entrapment.
7. Process and formulation variables such as postcure rate, initiator type and
cobalt loading influence residual VOCs to varying levels. However, the
dominant variable was found to be the inclusion of PVAc used as a low
profile additive, which increases VOCs over that of just adding additional
styrene.
8. The in-situ intercalative polymerisation method provides an appropriate
means to forming an exfoliated nanocomposite structure within an
unsaturated polyester matrix. A significant influence in reducing
polymerisation shrinkage and increasing glass transition temperature is
achievable with the formation of a nanocomposite due to the
immobilisation of the matrix surrounding the interface of the nano-scale
silicate.
9. The formation of a hybrid nanocomposite with PVAc permits the
reduction of residual VOCs as a result of the decreased levels of LPA
needed to form a cosmetic surface.
10. Tensile and impact strength lost through the use of an LPA are
compensated for with the formation of a nanocomposite. Component

Discussion and Conclusions
P J Schubel 138
thickness can possibly be reduced for a nanocomposite due to a significant
increase in tensile properties over that of a standard or low profile
unsaturated polyester matrix.
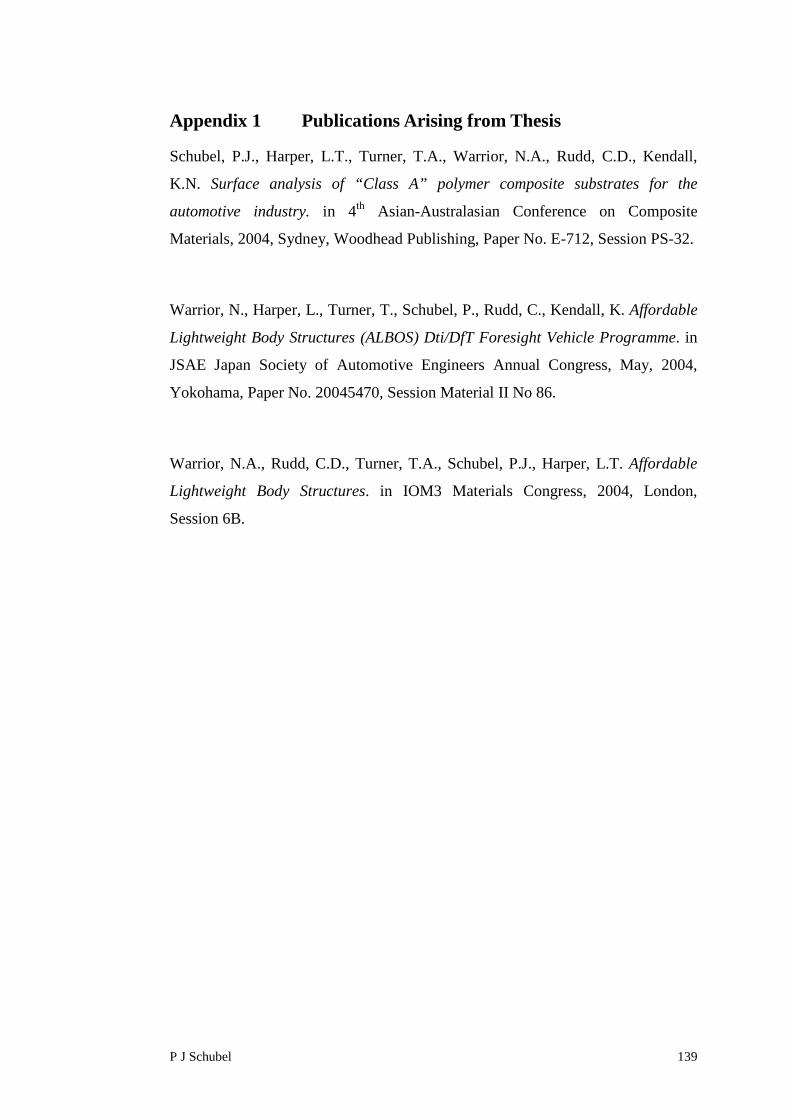
P J Schubel 139
Appendix 1 Publications Arising from Thesis
Schubel, P.J., Harper, L.T., Turner, T.A., Warrior, N.A., Rudd, C.D., Kendall,
K.N. Surface analysis of “Class A” polymer composite substrates for the
automotive industry. in 4th Asian-Australasian Conference on Composite
Materials, 2004, Sydney, Woodhead Publishing, Paper No. E-712, Session PS-32.
Warrior, N., Harper, L., Turner, T., Schubel, P., Rudd, C., Kendall, K. Affordable
Lightweight Body Structures (ALBOS) Dti/DfT Foresight Vehicle Programme. in
JSAE Japan Society of Automotive Engineers Annual Congress, May, 2004,
Yokohama, Paper No. 20045470, Session Material II No 86.
Warrior, N.A., Rudd, C.D., Turner, T.A., Schubel, P.J., Harper, L.T. Affordable
Lightweight Body Structures. in IOM3 Materials Congress, 2004, London,
Session 6B.

P J Schubel 140
Appendix 2 Paint Thickness Distribution
Paint thickness was measured using a Krautkramer CTM20 ultrasonic pulse echo
meter. It operates using a constant sound velocity principle with an active
polyvenylidenfluorid (PVDF) polymer probe and resolution of 1 µm.
Table A2.1 shows the paint thickness for successive coats on all experimental
substrates. On average the clear coat, base and primer are 53, 28 and 80 µm
respectively. The Gaussian distribution (Figure A2.1) shows the total paint
thickness average ranged between 156 and 165 µm with a 1st order standard
deviation between 138 and 183 µm.
Table A2.1: Paint thickness measured by ultrasonic pulse echo.
C1 C2 C3 C4 C5 C6 3K
UP
6K
UP
12K
UP
3K
EP
6K
EP
12K
EP
Clear 54 56 69 46 52 35 43 47 72 48 47 52
Base 17 38 40 38 32 22 21 25 27 22 22 29
Primer 124 52 77 77 68 90 81 109 55 91 98 91
Total 195 146 186 161 152 147 145 181 154 161 167 172
Figure A2.1: Gaussian distribution for total paint thickness.
R2 = 1
0
0.05
0.1
0.15
0.2
0.25
120- 129 129- 138 138- 147 147- 156 156- 165 165- 174 174- 183 183- 192 192- 201
Paint thickness (µm)
Pro
bab
ilit
y(h
isto
gra
m)
0
0.05
0.1
0.15
0.2
0.25
0.3
0.35
0.4
0.45
Pro
bab
ilit
y(c
urv
e)
2exp
2
1)(
2zz

P J Schubel 141
Appendix 3 Statistical Evaluation on Subjective SurfaceQuality Trials
The reproducibility and repeatability (R&R) study on the painted substrates was
conducted using the Six Sigma process and MiniTab® software. The appraisers
were chosen due to their extensive experience in the field of automotive paint
processes. The statistical analysis was conducted by comparing the observations
of the 3 paint specialists to Appraiser 0, who showed 100% reproducibility.
Table A3.1: Personal details of appraisers
ID Name Occupation Company
Appraiser 0 Andrew Hawtin Lead Technician Aston Martin Lagonda
Appraiser 1 Alan Berwick Lead Technician Aston Martin Lagonda
Appraiser 2 Terry Gilbert Technical Advisor PPG Industries
Appraiser 3 Richard Bailey Technical Advisor PPG Industries
Table A3.2: Observations made by the appraisers for 25 substrates.
Appraiser 0 Appraiser 1 Appraiser 2 Appraiser 3Panels Attribute Trial 1 Trial 2 Trial 1 Trial 2 Trial 1 Trial 21 A A A A A A A2 A A A A A A A3 A A A A A A A4 R R R R R R R5 R R R R R R R6 A A R A A A A7 A A R A A A A8 R R R R R R R9 R R R R A A A10 R R R R R R R11 R R R R R R R12 R R R R R R R13 R R R R R R R14 R R R R R R R15 R R R R R R R16 R R R R R R R17 R R R R R R R18 R R R R R R R19 R R R R R R R20 A A A A A A A21 A A A A A A A22 A A A A A A A23 R R R R R R R24 R R R R R R R25 A A A A A A A
A = Accept surface qualityR = Reject surface quality
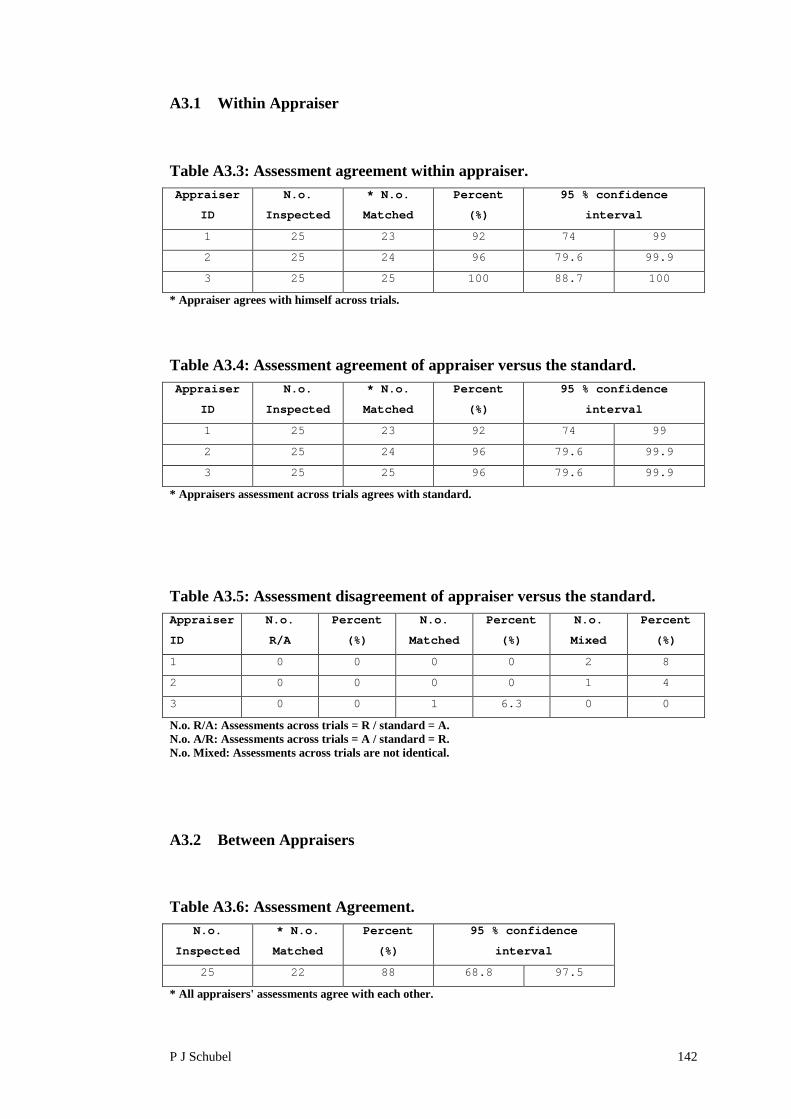
P J Schubel 142
A3.1 Within Appraiser
Table A3.3: Assessment agreement within appraiser.
Appraiser
ID
N.o.
Inspected
* N.o.
Matched
Percent
(%)
95 % confidence
interval
1 25 23 92 74 99
2 25 24 96 79.6 99.9
3 25 25 100 88.7 100
* Appraiser agrees with himself across trials.
Table A3.4: Assessment agreement of appraiser versus the standard.
Appraiser
ID
N.o.
Inspected
* N.o.
Matched
Percent
(%)
95 % confidence
interval
1 25 23 92 74 99
2 25 24 96 79.6 99.9
3 25 25 96 79.6 99.9
* Appraisers assessment across trials agrees with standard.
Table A3.5: Assessment disagreement of appraiser versus the standard.
Appraiser
ID
N.o.
R/A
Percent
(%)
N.o.
Matched
Percent
(%)
N.o.
Mixed
Percent
(%)
1 0 0 0 0 2 8
2 0 0 0 0 1 4
3 0 0 1 6.3 0 0
N.o. R/A: Assessments across trials = R / standard = A.N.o. A/R: Assessments across trials = A / standard = R.N.o. Mixed: Assessments across trials are not identical.
A3.2 Between Appraisers
Table A3.6: Assessment Agreement.
N.o.
Inspected
* N.o.
Matched
Percent
(%)
95 % confidence
interval
25 22 88 68.8 97.5
* All appraisers' assessments agree with each other.

P J Schubel 143
1 2 3 4 5
70
80
90
100
Appraiser
Pe
rce
nt
Within Appraiser
Assessment AgreementDate of study:Reported by:Name of product:Misc:
[ , ] 95.0% CI
Percent
Figure A3.1: Repeatability within each appraiser
A3.3 Conclusions
It has been shown in Table A3.3 that on average, each appraiser from Group 2 can
reproduce their own results to an accuracy of 97 % when asked to reassess the
laminates. Table A3.6 shows that 88 % of the observations matched the standard
(Appraiser 0) observation. This shows that the measurement error within Group 2
is 12 %. Statistically this measurement error is acceptable as denoted by the Six
Sigma process.
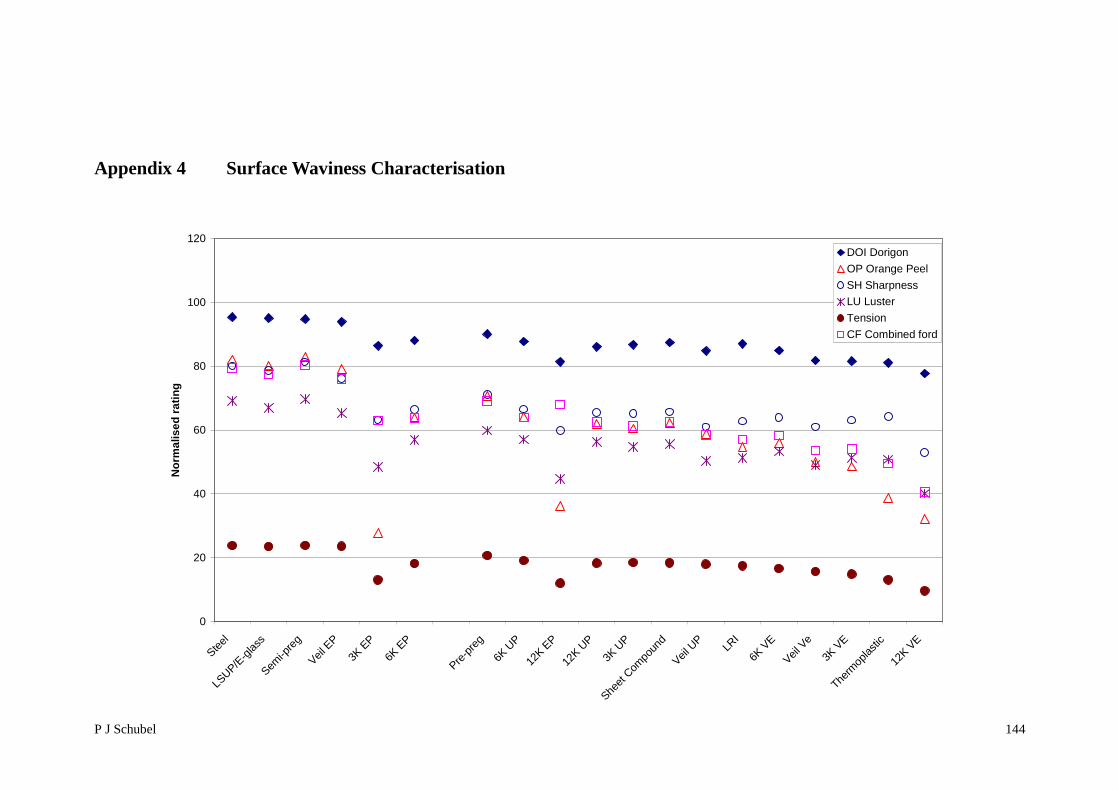
P J Schubel 144
Appendix 4 Surface Waviness Characterisation
0
20
40
60
80
100
120
Steel
LSUP/E
-glass
Semi-p
reg
Veil E
P
3KEP
6KEP
Pre-p
reg
6KUP
12K
EP
12K
UP
3KUP
Sheet
Com
poun
d
Veil U
PLR
I
6KVE
Veil V
e
3KVE
Therm
oplastic
12K
VE
No
rma
lis
ed
rati
ng
DOI Dorigon
OP Orange Peel
SH Sharpness
LU Luster
Tension
CF Combined ford

P J Schubel 145
0
5
10
15
20
25
Steel
LSUP/E
-glass
Semi-p
reg
Veil E
P
3KEP
6KEP
Pre-p
reg
6KUP
12K
EP
12K
UP
3KUP
Sheet
Com
poun
d
Veil U
PLR
I
6KVE
Veil V
e
3KVE
Therm
oplastic
12K
VE
Wavele
ng
th(d
u<
0.1
mm
)[N
orm
ali
sed
rati
ng
]
0
5
10
15
20
25
30
35
Steel
LSUP/E
-glass
Semi-p
reg
Veil E
P
3KEP
6KEP
Pre-p
reg
6KUP
12K
EP
12K
UP
3KUP
Sheet
Com
poun
d
Veil U
PLR
I
6KVE
Veil V
e
3KVE
Therm
oplastic
12K
VE
Wa
ve
len
gth
(Wa
0.1
-0
.3m
m)
[No
rma
lis
ed
rati
ng
]
0
10
20
30
40
50
60
Steel
LSUP/E
-glass
Semi-p
reg
Veil E
P
3KEP
6KEP
Pre-p
reg
6KUP
12K
EP
12K
UP
3KUP
Sheet
Com
poun
d
Veil U
PLR
I
6KVE
Veil V
e
3KVE
Therm
oplastic
12K
VE
Wavele
ng
th(W
b0.3
-1.0
mm
)[N
orm
ali
sed
rati
ng
]
0
5
10
15
20
25
30
35
40
45
Steel
LSUP/E
-glass
Semi-p
reg
Veil E
P
3KEP
6KEP
Pre-p
reg
6KUP
12K
EP
12K
UP
3KUP
Sheet
Compo
und
Veil U
PLR
I
6KVE
Veil V
e
3KVE
Therm
oplastic
12K
VE
Wavele
ng
th(W
c1-
3m
m)
[No
rmali
sed
rati
ng
]
du
WcWb
Wa

P J Schubel 146
0
10
20
30
40
50
60
Steel
LSUP/E
-glass
Semi-p
reg
Veil E
P
3KEP
6KEP
Pre-p
reg
6KUP
12K
EP
12K
UP
3KUP
Sheet
Com
poun
d
Veil U
PLR
I
6KVE
Veil V
e
3KVE
Therm
oplastic
12K
VE
Wa
ve
len
gth
(Wd
3-
10
mm
)[N
orm
ali
se
dra
tin
g]
0
5
10
15
20
25
30
35
40
45
Steel
LSUP/E
-glass
Semi-p
reg
Veil E
P
3KEP
6KEP
Pre-p
reg
6KUP
12K
EP
12K
UP
3KUP
Sheet
Com
poun
d
Veil U
PLR
I
6KVE
Veil V
e
3KVE
Therm
oplastic
12K
VE
Wa
ve
len
gth
(We
10
-3
0m
m)
[No
rma
lis
ed
rati
ng
]
WeWd

P J Schubel 147
Appendix 5 Calculation of Percentage Mass Compound forGas Chromatography
A5.1 Introduction
It was desirable to convert the response area of a GC plot into a value directly
related to a unit mass of compound. This allowed a direct comparison between
samples and relevant literature. The number of moles of any substance is related
to the area of the distribution. For this reason it is possible to create a calibration
curve for a know substance from which all detected values can be based.
A5.2 Calibration
A known quantity of pure concentration (styrene/ benzaldehyde) was injected into
the GC to return the response area. The concentration was varied from 1 to 10
μL/10mL of solution, resulting in linear response (Figure A5.1). The plot of the
number of moles injected against response area was used to calculate the equation
of the line. The subsequent calibration factor was found for the particular
compound with respect to the GC instrument used.
Figure A5.1: Response area of 1 to 10 uL/10mL of styrene solution.
y = 2.9136620E+12x
0
20000
40000
60000
80000
100000
120000
140000
0 1E-08 2E-08 3E-08 4E-08 5E-08
Mols injecte d
Resp
on
ce
Are
a

P J Schubel 148
A calculation of the number of moles injected is given by:
i
r
vi V
M
CM .
.
[A5.1]
where
Mi is the known amount of moles injected into the solution
Cv is the calibration volume in mL/10mL
ρ is the density of the compound
Mr is the molecular weight of the compound
Vi is the injection volume expressed in mL
The calibration factor (Cf) was calculated directly from the gradient of the
calibration graph (Figure A5.1). The number of moles are then calculated by:
f
r
C
Amoles [A5.2]
where
Ar is the response area of the compound
Cf is the calibration factor
The bulk mass of the compound is calculated by:
Irb NMmolesm .. [A5.3]
where
mb is the mass in bulk of the compound
NI is the amount of sample injections per mL

P J Schubel 149
The percentage mass of compound is given by:
100.
m
mpmc b [A5.4]
where
pmc is the percentage mass of compound
m is the mass of the block sample used in the experiment
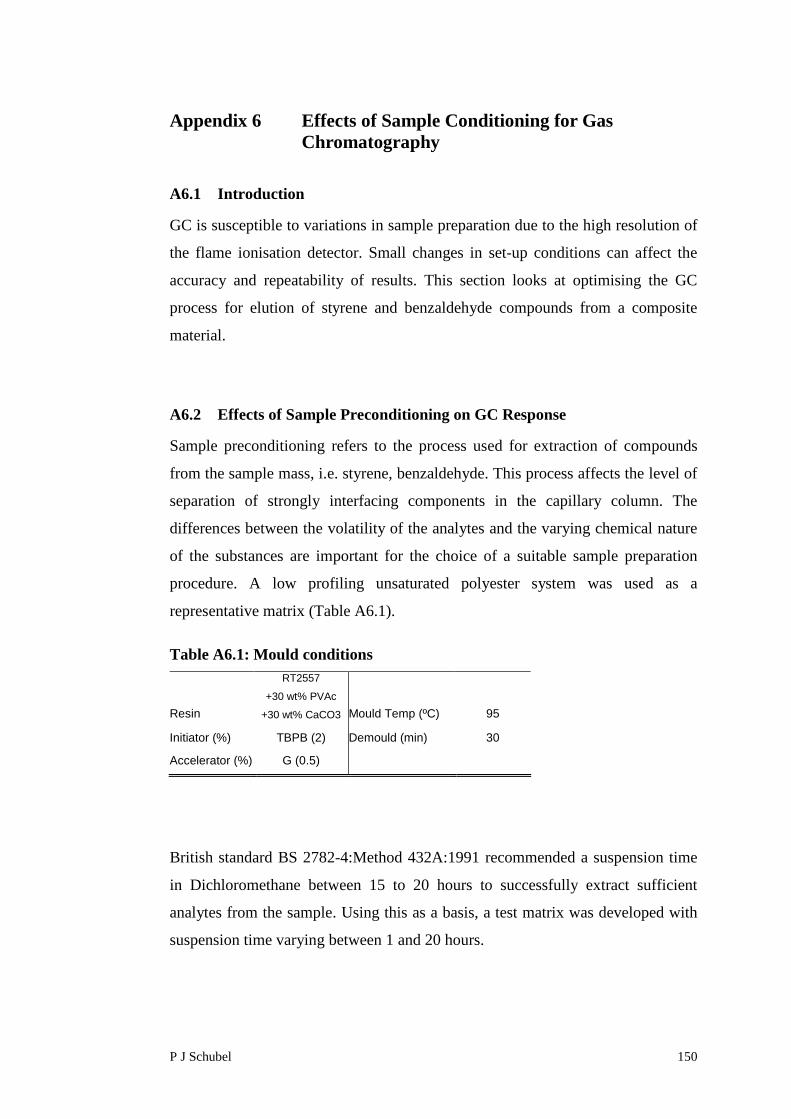
P J Schubel 150
Appendix 6 Effects of Sample Conditioning for GasChromatography
A6.1 Introduction
GC is susceptible to variations in sample preparation due to the high resolution of
the flame ionisation detector. Small changes in set-up conditions can affect the
accuracy and repeatability of results. This section looks at optimising the GC
process for elution of styrene and benzaldehyde compounds from a composite
material.
A6.2 Effects of Sample Preconditioning on GC Response
Sample preconditioning refers to the process used for extraction of compounds
from the sample mass, i.e. styrene, benzaldehyde. This process affects the level of
separation of strongly interfacing components in the capillary column. The
differences between the volatility of the analytes and the varying chemical nature
of the substances are important for the choice of a suitable sample preparation
procedure. A low profiling unsaturated polyester system was used as a
representative matrix (Table A6.1).
Table A6.1: Mould conditions
Resin
RT2557
+30 wt% PVAc
+30 wt% CaCO3 Mould Temp (ºC) 95
Initiator (%) TBPB (2) Demould (min) 30
Accelerator (%) G (0.5)
British standard BS 2782-4:Method 432A:1991 recommended a suspension time
in Dichloromethane between 15 to 20 hours to successfully extract sufficient
analytes from the sample. Using this as a basis, a test matrix was developed with
suspension time varying between 1 and 20 hours.

P J Schubel 151
Figure A6.1 shows the percentage mass of styrene and benzaldehyde for varying
suspension times in dichloromethane at 21 ºC. It can be seen that the percentage
mass of styrene and benzaldehyde increase rapidly from 1 to 15 hours, at which
point both curves stabilise. This suggests that the majority of the available
compound has been eluted from the sample within 15 hours.
It was seen from preconditioning trials that a stabilisation of analytes eluted from
the sample occurred at 15 hours in dichloromethane solution. Because the
objective of the GC test was to make it as simple and efficient as possible, it was
decided to accept the 0.01 % discrepancy between the 15 to 20 hr interval. Thus,
suspension time in dichloromethane solution was set to 15 hr 10 min.
Figure A6.1: Percentage mass of styrene and benzaldehyde forpreconditioning of sample by varying time in suspension of dichloromethane.A linear increase of eluted compound is seen up to a suspension time of 15 hrs. Atthis point, the rate of eluted compound decreases and stabilises.
A6.3 Influence of Sample Mass on GC Response
The sample mass influences the level of elute received by the capillary column
which could potentially skew the results in a positive or negative fashion. Since
the volume of dichloromethane solution had been fixed at 4 mL, the variation in
0
0.2
0.4
0.6
0.8
1 5 10 15 20
Time in solution (hrs)
%M
ass
of
Sty
ren
e
0
0.5
1
1.5
2
%M
ass
of
BZ
Residual Benzaldehyde
Residual Styrene

P J Schubel 152
ratio of sample mass to solution volume could only be altered by varying sample
mass.
A study was conducted on a low profiling unsaturated polyester system (Table
A6.1) with the sample mass varying between 0.45g and 3.2g. The samples were
suspended in dichloromethane for 15 hours before injection into the column. The
results obtained for residual styrene and benzaldehyde (Figure 6.2) show that the
percentage mass of compound continues to increase until stabilisation at
approximately 1.5 g. After this point, a doubling of sample size has negligible
increase in both situations.
It is preferable to have a small sample size to ensure that there is sufficient
material for repeat trials and to reduce the need for reiterating the solution volume
to ensure the sample is completely submerged. It was decided that a 1.5 0.1 g
sample mass provided sufficient compound extraction for 4 mL of
dichloromethane solution. Any small variations in sample size are compensated
for by the calculation of percentage mass compound described in Appendix 5.
Figure A6.2: Influence of sample mass on residual styrene and benzaldehyde.
0
0.5
1
1.5
2
0.45 0.73 1.5 2.3 3.2
Sample Mass (g)
%M
ass
of
Sty
ren
e
0
0.1
0.2
0.3
0.4
0.5
0.6%
Mass
of
BZ
Residual Styrene
Residual Benzaldehyde
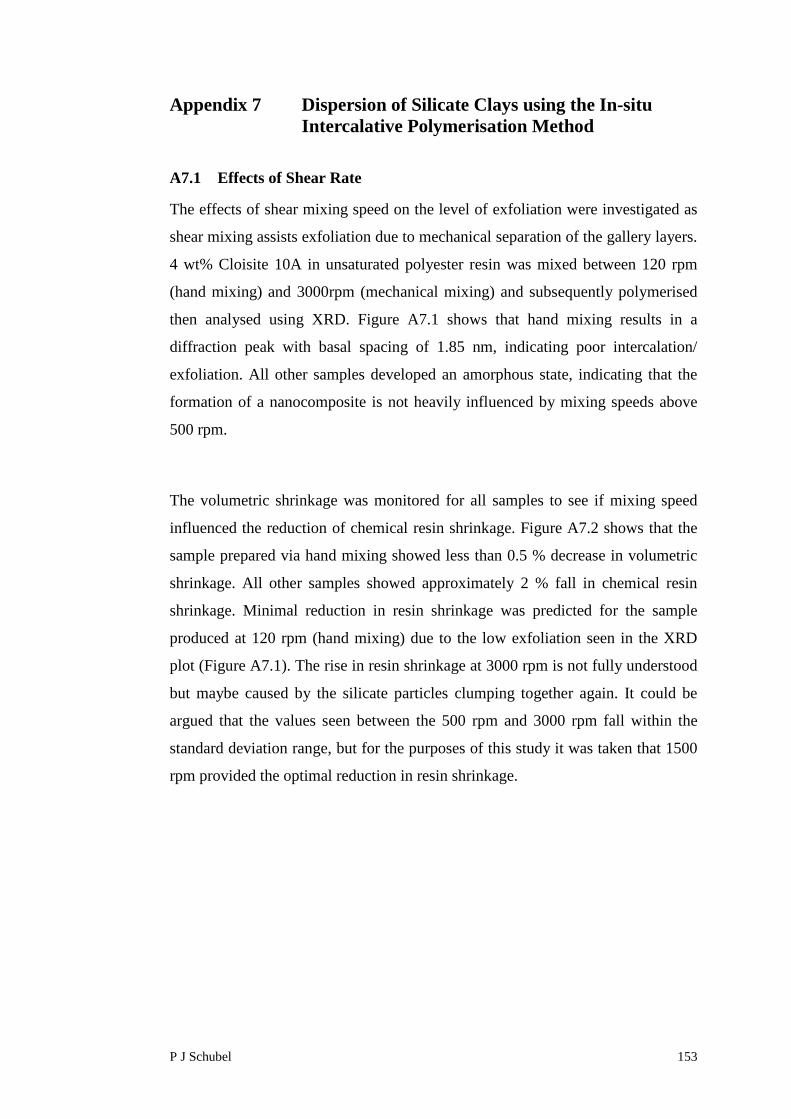
P J Schubel 153
Appendix 7 Dispersion of Silicate Clays using the In-situIntercalative Polymerisation Method
A7.1 Effects of Shear Rate
The effects of shear mixing speed on the level of exfoliation were investigated as
shear mixing assists exfoliation due to mechanical separation of the gallery layers.
4 wt% Cloisite 10A in unsaturated polyester resin was mixed between 120 rpm
(hand mixing) and 3000rpm (mechanical mixing) and subsequently polymerised
then analysed using XRD. Figure A7.1 shows that hand mixing results in a
diffraction peak with basal spacing of 1.85 nm, indicating poor intercalation/
exfoliation. All other samples developed an amorphous state, indicating that the
formation of a nanocomposite is not heavily influenced by mixing speeds above
500 rpm.
The volumetric shrinkage was monitored for all samples to see if mixing speed
influenced the reduction of chemical resin shrinkage. Figure A7.2 shows that the
sample prepared via hand mixing showed less than 0.5 % decrease in volumetric
shrinkage. All other samples showed approximately 2 % fall in chemical resin
shrinkage. Minimal reduction in resin shrinkage was predicted for the sample
produced at 120 rpm (hand mixing) due to the low exfoliation seen in the XRD
plot (Figure A7.1). The rise in resin shrinkage at 3000 rpm is not fully understood
but maybe caused by the silicate particles clumping together again. It could be
argued that the values seen between the 500 rpm and 3000 rpm fall within the
standard deviation range, but for the purposes of this study it was taken that 1500
rpm provided the optimal reduction in resin shrinkage.
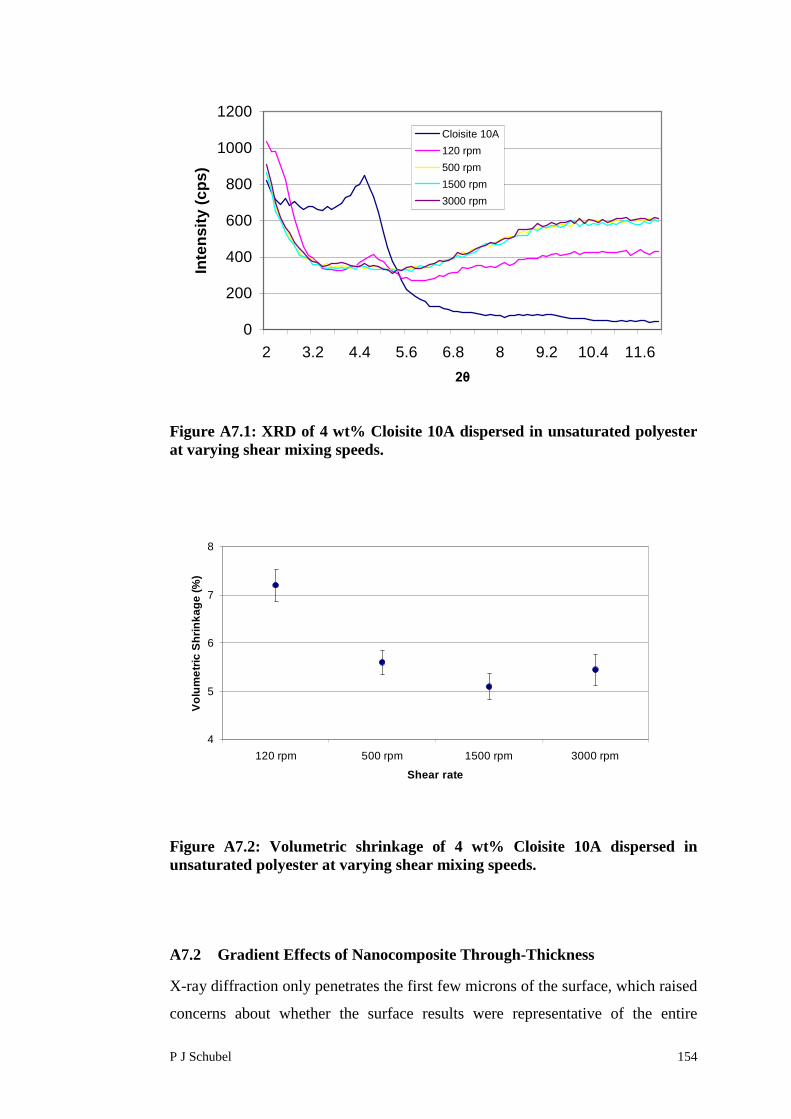
P J Schubel 154
0
200
400
600
800
1000
1200
2 3.2 4.4 5.6 6.8 8 9.2 10.4 11.6
2θ
Inte
ns
ity
(cp
s)
Cloisite 10A
120 rpm
500 rpm
1500 rpm
3000 rpm
Figure A7.1: XRD of 4 wt% Cloisite 10A dispersed in unsaturated polyesterat varying shear mixing speeds.
Figure A7.2: Volumetric shrinkage of 4 wt% Cloisite 10A dispersed inunsaturated polyester at varying shear mixing speeds.
A7.2 Gradient Effects of Nanocomposite Through-Thickness
X-ray diffraction only penetrates the first few microns of the surface, which raised
concerns about whether the surface results were representative of the entire
4
5
6
7
8
120 rpm 500 rpm 1500 rpm 3000 rpm
Shear rate
Vo
lum
etr
icS
hri
nk
ag
e(%
)

P J Schubel 155
sample. A study into the through-thickness effect was undertaken to determine
whether an exfoliation gradient existed in the resin cast samples. Surface layers
were progressively ground on a Struers® DAP-7 laboratory polisher using P1200
grit paper, with XRD analysis between each successive layer removal.
Figure A7.3 shows the XRD results for 4 wt% Cloisite 10A in unsaturated
polyester for successive layer removals of a 3 mm thick sample. No diffraction
peak was observed in each case, indicating that a nanocomposite structure was
formed through the entire thickness of the sample.
2 3.2 4.4 5.6 6.8 8 9.2 10.4 11.6
2θ
Inte
ns
ity
(cp
s)
Surface
0.1mm
0.5mm
1mm
1.5mm
Cloisite 10A
Figure A7.3: XRD on the cross-sectional gradient of 4 wt% Cloisite® 10A inunsaturated polyester.

P J Schubel 156
Appendix 8 Surface Roughness Modelling of FabricReinforced Polymer Composites
Experimental work indicated that critical functions of the surface roughness were
the textile architecture and the level of matrix shrinkage. It was decided to
develop the model around an existing software package (TexGen) developed for
geometric modelling of textiles by Robitaille and co-workers [1, 2]. TexGen
allows a geometric model of the fabric to be created based on idealised yarn
vectors with yarn cross-sections verified via optical microscopy (Figure A8.1).
The measured parameters for a 3k, 6k and 12k moulded fabric were obtained
(Table A8.1) and used to create the input file for the geometric generator.
Figure A8.1: Optical microscopy of a tow (highlighted in red) on the cosmeticsurface of a 6k, 2x2 twill weave fabric moulded by RTM.
Table A8.1: Tow dimensions measured using optical microscopy.
Tow Size Width(mm)
Thickness(mm)
3k 1.8 0.15
6k 2.0 0.18
12k 2.5 0.25
Three separate TexGen files was created for a 3k, 6k and 12k 2x2 twill weave
fabric. Five nodes per vector were assigned and Bezier curves were formed
(Figure A8.2).
Width
1 mm
Rule
Cross-section oftow on thecosmetic surface
Thickness

P J Schubel 157
Figure A8.2: TexGen input file for a 12k, 2x2 twill weave fabric. Five nodeswere assigned to each vector and Bezier curves were formed.
A powered elliptical envelope (Figure A8.3) was created around the Bezier curves
with tow radial dimensions used from Table A8.1. For a geometric model, a
flexible function was required to describe the tow cross-section. Equation A8.1
describes a generalised ellipse [3]:
n
tt
t
ah
xhy
2
2
2
12
[A8.1]
where x and y are the geometric coordinates, ht is the tow height, at is the tow
aspect ratio and n is the shape parameter.
This equation is used to determine the shape of a general ellipse. The tow shape
parameter, n, defines the shape of the curve, with n=0.5 producing a natural
ellipse and n=0 producing a rectangle. For the values in the range 1>n>0.5 a
lenticular shape is generated, although for the cases presented in this thesis, values
in the range of 0.5>n>0 were used exclusively (Figure A8.4).
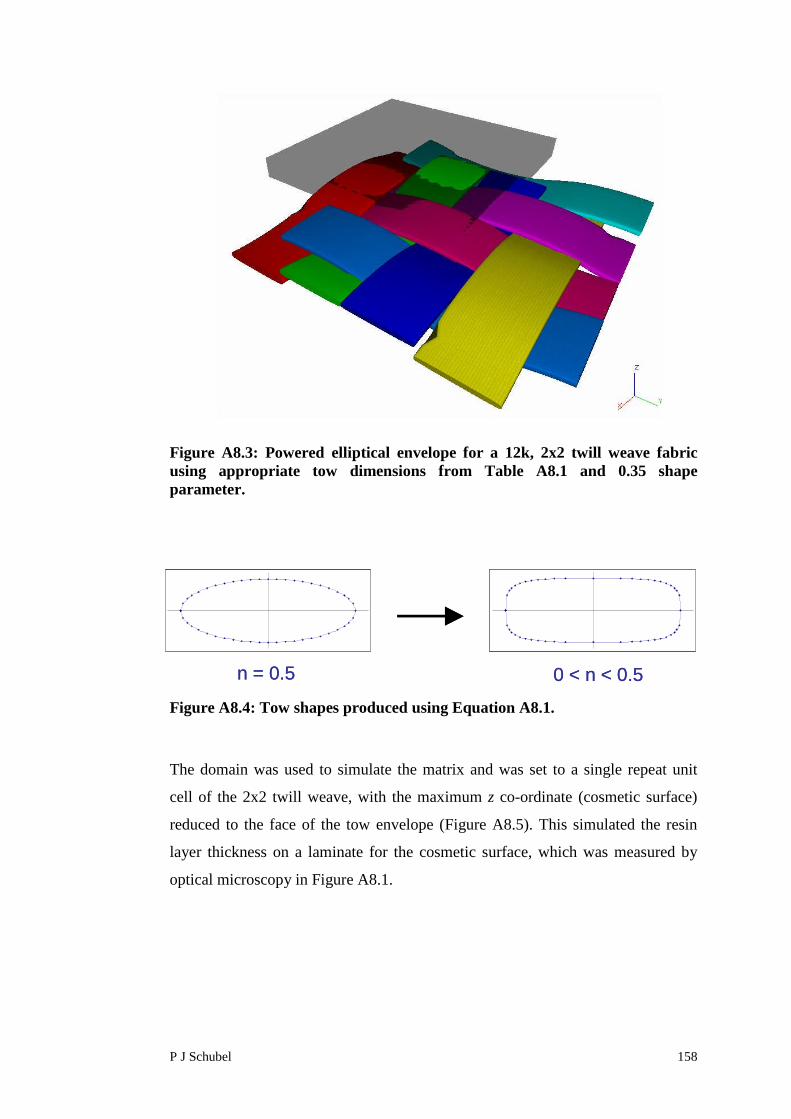
P J Schubel 158
Figure A8.3: Powered elliptical envelope for a 12k, 2x2 twill weave fabricusing appropriate tow dimensions from Table A8.1 and 0.35 shapeparameter.
Figure A8.4: Tow shapes produced using Equation A8.1.
The domain was used to simulate the matrix and was set to a single repeat unit
cell of the 2x2 twill weave, with the maximum z co-ordinate (cosmetic surface)
reduced to the face of the tow envelope (Figure A8.5). This simulated the resin
layer thickness on a laminate for the cosmetic surface, which was measured by
optical microscopy in Figure A8.1.
n = 0.5 0 < n < 0.5n = 0.5 0 < n < 0.5
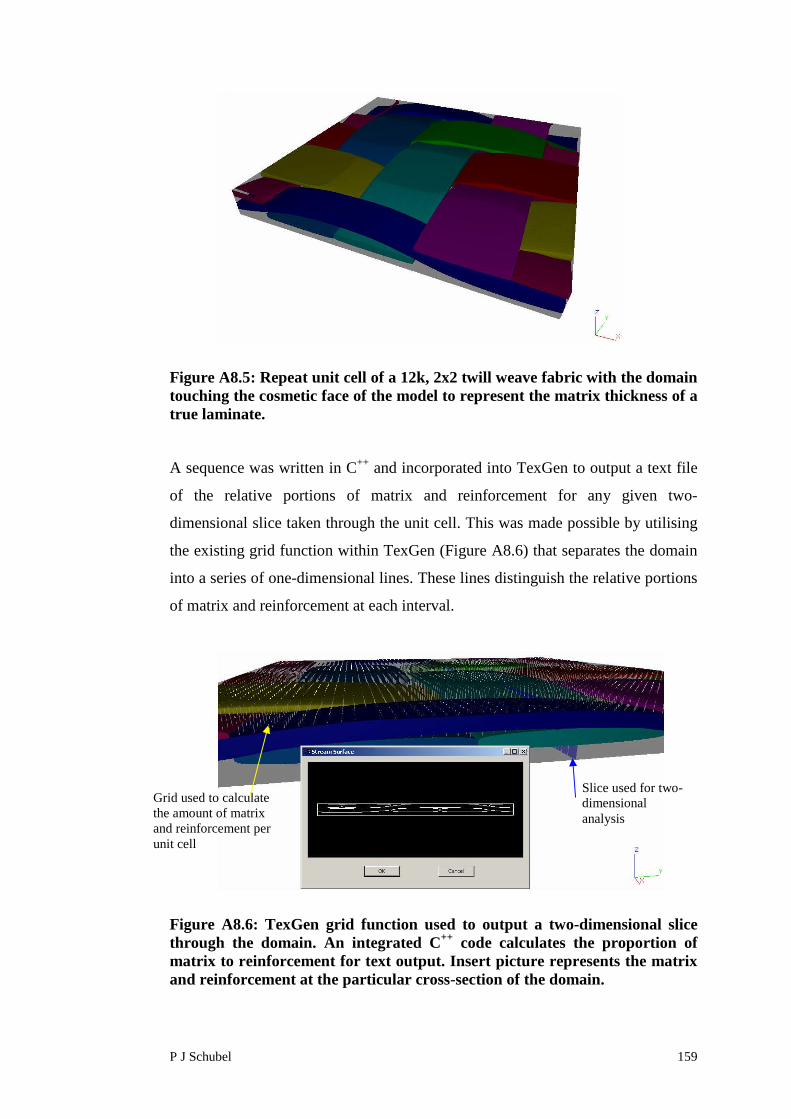
P J Schubel 159
Figure A8.5: Repeat unit cell of a 12k, 2x2 twill weave fabric with the domaintouching the cosmetic face of the model to represent the matrix thickness of atrue laminate.
A sequence was written in C++ and incorporated into TexGen to output a text file
of the relative portions of matrix and reinforcement for any given two-
dimensional slice taken through the unit cell. This was made possible by utilising
the existing grid function within TexGen (Figure A8.6) that separates the domain
into a series of one-dimensional lines. These lines distinguish the relative portions
of matrix and reinforcement at each interval.
Figure A8.6: TexGen grid function used to output a two-dimensional slicethrough the domain. An integrated C++ code calculates the proportion ofmatrix to reinforcement for text output. Insert picture represents the matrixand reinforcement at the particular cross-section of the domain.
Slice used for two-dimensionalanalysis
Grid used to calculatethe amount of matrixand reinforcement perunit cell

P J Schubel 160
The relative matrix and reinforcement thickness, DM and DR respectively, for 0.01
mm intervals along the cross-section were output to a Microsoft Excel
spreadsheet. The following assumptions were made for the numerical analysis to
simplify the calculations:
The tool surface roughness does not influence the surface of the laminate.
The outer reinforcement layer stays in contact with the mould surface
throughout the cure process.
Matrix shrinkage only occurred in the thickness (z) direction [4].
There was no strain induced by neighbouring cells.
The peak exotherm temperature was considered the critical temperature
for thermal expansion.
The reinforcement phase does not experience any thermal or
polymerisation shrinkage.
The analysis was based on the Fourier’s heat conduction equation for a one-
dimensional cure simulation, which was introduced in Section 1.3.1 (Equation
1.3). Equation 1.3 assumes that the thermal properties (kz, ρ, and cp) remain
constant throughout the curing process [5].
A formulation allowing for either convective, insulated or prescribed temperature
boundary conditions was employed on the laminate surface [4]:
0)(
tTTh
z
Tk seff
seff at z = 0 and z = L [A8.2]
The temperature and normal derivative of temperature on the laminate surface are
denoted Ts andz
Ts
respectively. The coefficients keff and heff represent the
effective thermal conductivity and convective heat transfer coefficient on the
laminate surface, respectively. The cure cycle temperature is represented by T(t).
The temperature boundary conditions (keff = 0 and heff = 1) were employed in all

P J Schubel 161
simulations presented in this work to eliminate the complexity of interpreting the
influence of convection on the results [4]. Which reduces the boundary condition
term to:
Ts = T(t) [A8.3]
Region II (Figure 1.5) denotes the beginning and end of the cure cycle and the
peak exotherm temperature in this region was taken as the maximum cure
temperature. For the analysis, the peak exotherm temperature was crudely
measured by a simple gel test conducted in an oil bath at the specified mould
temperature of 95 ºC. A thermocouple placed in the middle of a test tube holding
80 g of sample was used to determine the peak exotherm temperatures (Table
A8.2).
Table A8.2: Values used for calculation of the total matrix shrinkage.
ResinType
Sample ID Peak ExothermTemperature
(ºC)
ThermalExpansivity,
α1 (10-6 K-1)
ThermalShrinkage,
ΔV (%)
PolymerisationShrinkage,
ΔVChem (%)
Epoxy Low shrink (LS) 212 ± 15 60 1.14 0.24 ± 0.10
Unsat’polyester
High shrink (HS) 110 ± 6 150 1.32 8.34 ± 0.61
The process induced thermal shrinkage (ΔV) for each system was calculated using
Equation 1.10. The change in temperature was calculated as the difference
between the peak exotherm temperature and room temperature (22 ºC) whilst the
coefficient of thermal expansion (α1) was obtained from Hull et al [6] for the
respective matrices (Table A8.2).
The volumetric polymerisation shrinkage (ΔVChem) given by Equation 1.6 was
determined by a multipycnometer (Section 4.4.2). The total volumetric
polymerisation shrinkage for the low and high shrink resin systems are listed in
Table A8.2. Volumetric shrinkage needed to be converted into linear shrinkage
since the analysis is only considering the matrix shrinkage in the plane normal to
the laminate surface. It is assumed that every portion of the part solidifies at the
same pressure and at the same time, hence the volumetric shrinkage will be

P J Schubel 162
equally distributed in all directions. Therefore the linear shrinkage will
approximately equal 1/3 of the volumetric shrinkage [7].
The corrected z-coordinate height (DTot), which considers the thermal and
polymerisation shrinkage of the matrix, is therefore calculated at each interval by:
1000.100
100
R
TotMTot D
SDD [A8.4]
where3Chem
Tot
VVS
A representative surface profile (Figure A8.7) for the slice taken in Figure A8.6 of
a 12k, 2x2 twill weave fabric with a low shrink matrix clearly shows the
contraction of the matrix rich areas between adjacent tows and between the warp
and weft tows.
Figure A8.7: Surface profile created from Equation A8.4, which accounts forthermal and polymerisation shrinkage of the matrix.
A series of slices were taken with the matrix being subject to percentage reduction
according to parameters associated with the matrix. The resultant allows for
topological representation of the surface roughness (Figure A8.8 to A8.10). A
comparison of the simulated result against experimental result in Figure A8.8
36
36.5
37
37.5
38
38.5
39
39.5
40
-3.6
-3.2
-2.8
-2.4 -2
-1.6
-1.2
-0.8
-0.4
9.54
E-08
0.4
0.8
1.2
1.6 2
2.4
2.8
3.2
x-coordinate (mm)
Am
pli
tud
e(μ
m)
Matrix shrinkage between adjacent tows Matrix shrinkage between the warp and weft tows
456
452
448
450
458
454
442
444
446

P J Schubel 163
shows good correlation for a repeat unit cell area. The surface characteristics
appear similar with both plots exhibiting amplitudes in the region of 6 to 10 μm.
Similarly, Figure A8.9 shows related trends with amplitudes ranging from 25 to
30 μm for both simulated and experimental plots. The modelling techniques are
not restricted to just a 2x2 twill weave fabric and can be used to simulate the
surface roughness of any style of fabric (Figure A8.10).
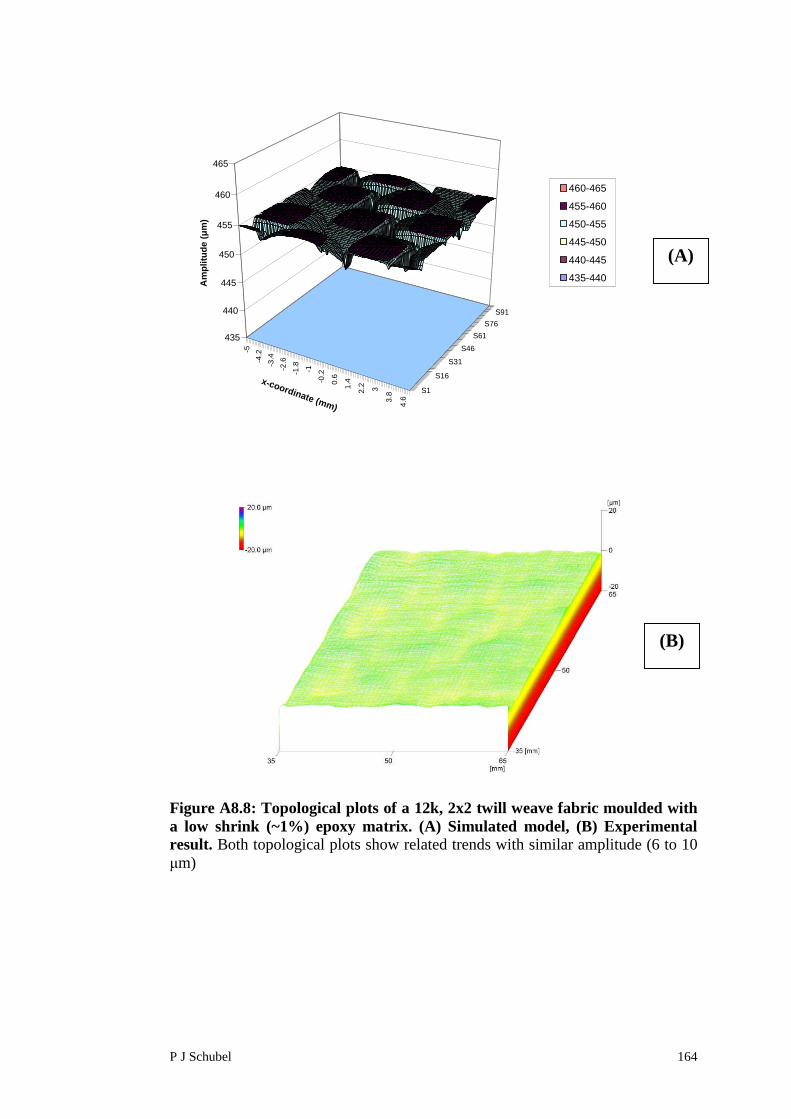
P J Schubel 164
Figure A8.8: Topological plots of a 12k, 2x2 twill weave fabric moulded witha low shrink (~1%) epoxy matrix. (A) Simulated model, (B) Experimentalresult. Both topological plots show related trends with similar amplitude (6 to 10μm)
-5
-4.2
-3.4
-2.6
-1.8
-1
-0.2
0.6
1.4
2.2 3
3.8
4.6
S1
S16
S31
S46
S61
S76
S91
435
440
445
450
455
460
465
Am
pli
tud
e(μ
m)
x-coordinate (mm)
460-465
455-460
450-455
445-450
440-445
435-440
(A)
(B)
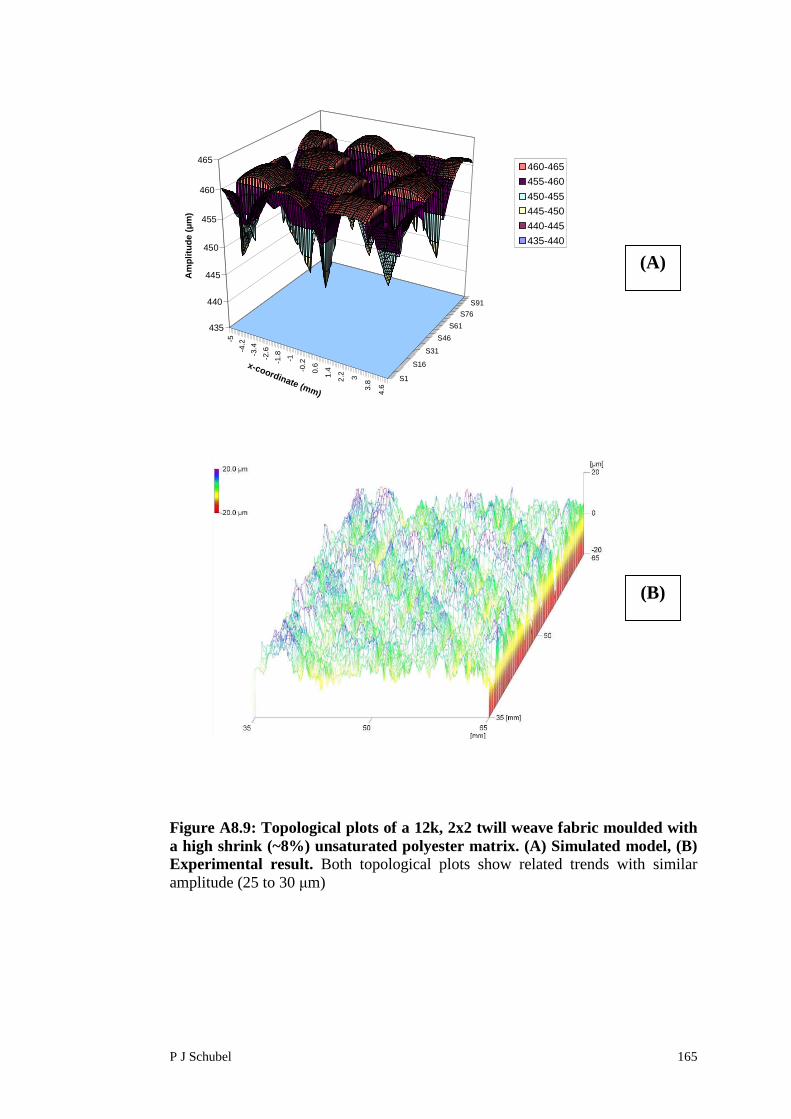
P J Schubel 165
Figure A8.9: Topological plots of a 12k, 2x2 twill weave fabric moulded witha high shrink (~8%) unsaturated polyester matrix. (A) Simulated model, (B)Experimental result. Both topological plots show related trends with similaramplitude (25 to 30 μm)
-5
-4.2
-3.4
-2.6
-1.8
-1
-0.2
0.6
1.4
2.2 3
3.8
4.6
S1
S16
S31
S46
S61
S76
S91
435
440
445
450
455
460
465
Am
pli
tud
e(μ
m)
x-coordinate (mm)
460-465
455-460
450-455
445-450
440-445
435-440
(A)
(B)
12k, 2x2 twillweave, Unsat’ poly
matrix
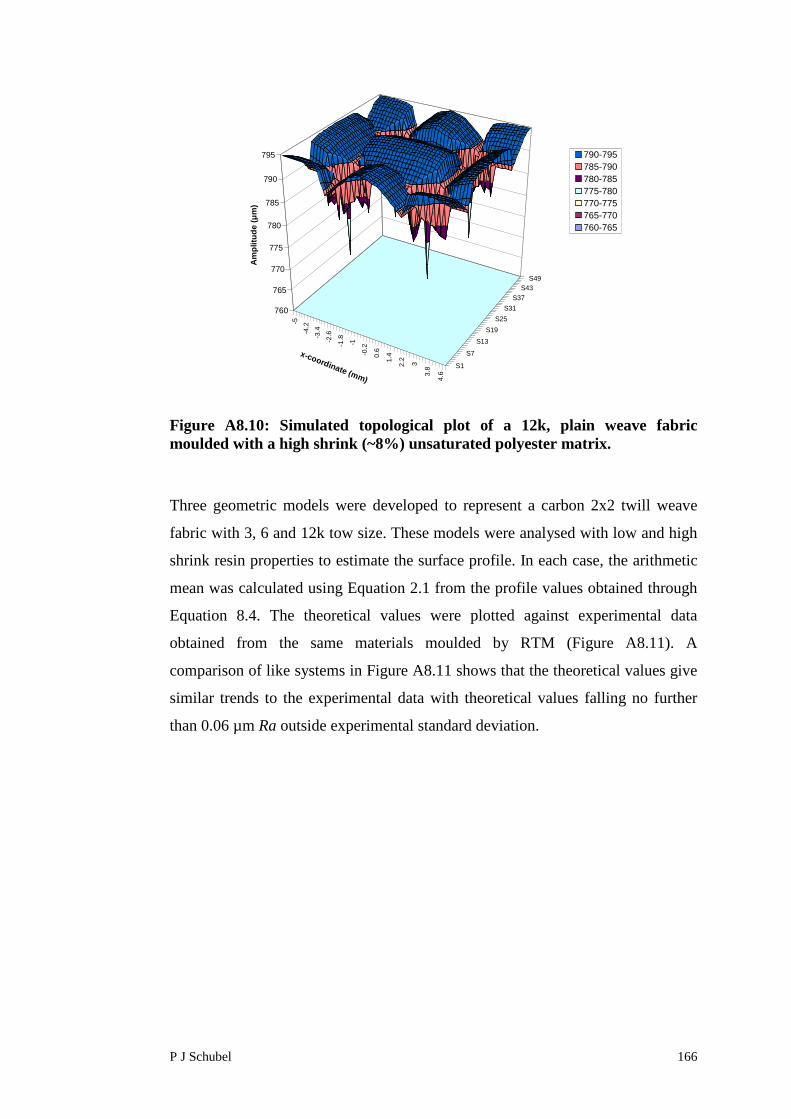
P J Schubel 166
Figure A8.10: Simulated topological plot of a 12k, plain weave fabricmoulded with a high shrink (~8%) unsaturated polyester matrix.
Three geometric models were developed to represent a carbon 2x2 twill weave
fabric with 3, 6 and 12k tow size. These models were analysed with low and high
shrink resin properties to estimate the surface profile. In each case, the arithmetic
mean was calculated using Equation 2.1 from the profile values obtained through
Equation 8.4. The theoretical values were plotted against experimental data
obtained from the same materials moulded by RTM (Figure A8.11). A
comparison of like systems in Figure A8.11 shows that the theoretical values give
similar trends to the experimental data with theoretical values falling no further
than 0.06 µm Ra outside experimental standard deviation.
-5
-4.2
-3.4
-2.6
-1.8
-1
-0.2
0.6
1.4
2.2 3
3.8
4.6
S1
S7
S13
S19
S25
S31
S37
S43
S49
760
765
770
775
780
785
790
795
Am
plitu
de
(μm
)
x-coordinate (mm)
790-795
785-790
780-785
775-780
770-775
765-770
760-765
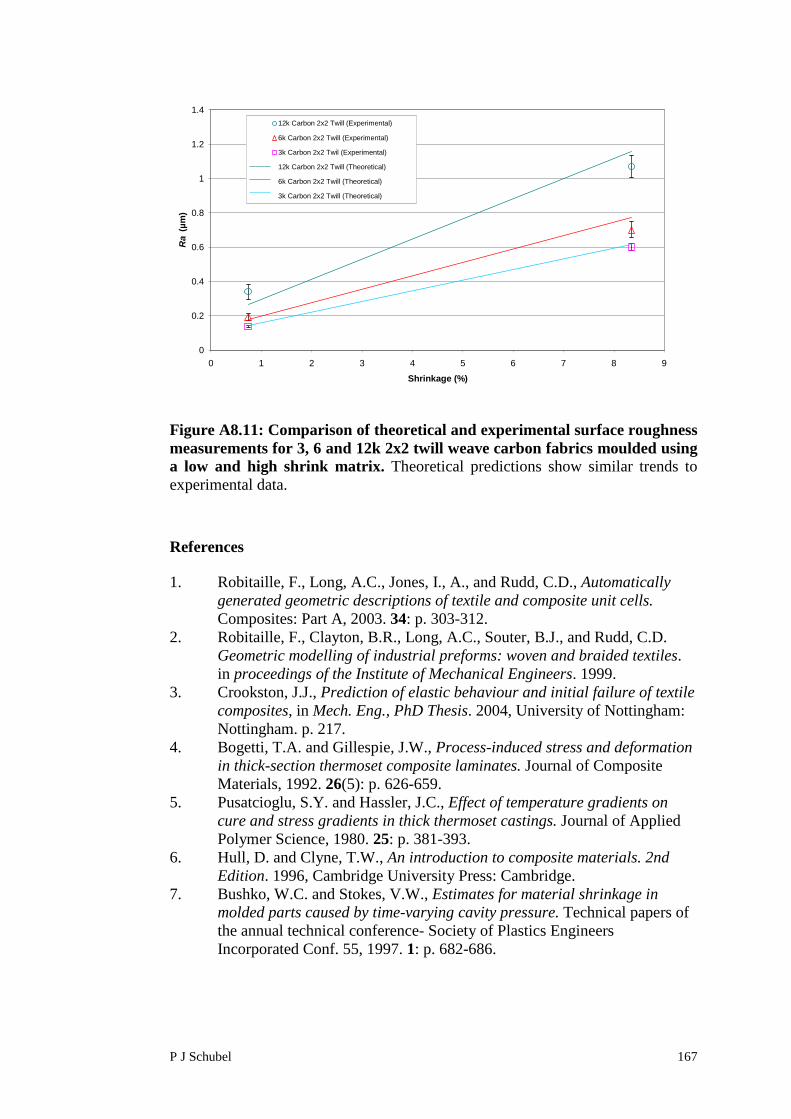
P J Schubel 167
Figure A8.11: Comparison of theoretical and experimental surface roughnessmeasurements for 3, 6 and 12k 2x2 twill weave carbon fabrics moulded usinga low and high shrink matrix. Theoretical predictions show similar trends toexperimental data.
References
1. Robitaille, F., Long, A.C., Jones, I., A., and Rudd, C.D., Automaticallygenerated geometric descriptions of textile and composite unit cells.Composites: Part A, 2003. 34: p. 303-312.
2. Robitaille, F., Clayton, B.R., Long, A.C., Souter, B.J., and Rudd, C.D.Geometric modelling of industrial preforms: woven and braided textiles.in proceedings of the Institute of Mechanical Engineers. 1999.
3. Crookston, J.J., Prediction of elastic behaviour and initial failure of textilecomposites, in Mech. Eng., PhD Thesis. 2004, University of Nottingham:Nottingham. p. 217.
4. Bogetti, T.A. and Gillespie, J.W., Process-induced stress and deformationin thick-section thermoset composite laminates. Journal of CompositeMaterials, 1992. 26(5): p. 626-659.
5. Pusatcioglu, S.Y. and Hassler, J.C., Effect of temperature gradients oncure and stress gradients in thick thermoset castings. Journal of AppliedPolymer Science, 1980. 25: p. 381-393.
6. Hull, D. and Clyne, T.W., An introduction to composite materials. 2ndEdition. 1996, Cambridge University Press: Cambridge.
7. Bushko, W.C. and Stokes, V.W., Estimates for material shrinkage inmolded parts caused by time-varying cavity pressure. Technical papers ofthe annual technical conference- Society of Plastics EngineersIncorporated Conf. 55, 1997. 1: p. 682-686.
0
0.2
0.4
0.6
0.8
1
1.2
1.4
0 1 2 3 4 5 6 7 8 9
Shrinkage (%)
Ra
(µm
)
12k Carbon 2x2 Twill (Experimental)
6k Carbon 2x2 Twill (Experimental)
3k Carbon 2x2 Twil (Experimental)
12k Carbon 2x2 Twill (Theoretical)
6k Carbon 2x2 Twill (Theoretical)
3k Carbon 2x2 Twill (Theoretical)
Related Documents


![GUIDE FOR THE DESIGN AND CALCULATION OF VIA FERRATA · UNE-EN 12572-1 and UNE-EN 12572-2 for artificial climbing structures [24, 25]. Where the installation includes a zip line, standard](https://static.cupdf.com/doc/110x72/5e955ab558564109942f5bee/guide-for-the-design-and-calculation-of-via-une-en-12572-1-and-une-en-12572-2-for.jpg)


