Welcome message from author
This document is posted to help you gain knowledge. Please leave a comment to let me know what you think about it! Share it to your friends and learn new things together.
Transcript
O 1 SEP, 2008
Schroder International Selection Fund Societe d'lnvestissement a Capital Variable (SICAV)
Semi-Annual Report 30June2008
No subscriptions can be received on the basis of periodical reports. Subscriptions are valid only if made on the basis of the current prospectus accompanied by the last available annual report or semi-annual report if published thereafter. This report is based on the current prospectus.
Annual and semi-annual reports, the current prospectus and the Articles of Incorporation of the Company are available, free of charge, at the Company's registered office, 5, rue Hbhenhof. L-1736 Senningerberg, Grand Duchy of Luxembourg.
Contents
Schroder International Selection Fund Semi-Annual Report June 2008 Page 5
Schroder International Selection Fund ................................................ 8
Board of Directors .................................................................................. 9
Administration ...................................................................................... 10
Investment Managers’ Report ............................................................ 13
Notes to the Financial Statements ..................................................... 14
Statement of Net Assets ...................................................................... 61
Distribution of Investments by Industry ........................................... 106
Portfolio of Investments .................................................................... 121
Mainstream Equity Schroder ISF EURO Equity ............................................................................................... 121 Schroder ISF European Equity .......................................................................................... 122 Schroder ISF European Large Cap ................................................................................... 123
Schroder ISF Japanese Equity ..............
Schroder ISF Swiss Equity ................................................................................................ 129 Schroder ISF UK Equity .................................................................................................... 130 Schroder ISF US Large Cap ............................................................................................. 131
Schroder ISF Global Equity ....................................................... Schroder ISF Italian Equity ........................................................
Schroder ISF Japanese Large Cap ............................................. Schroder ISF Pacific Equity .........................................................
................................... 124
................................... 125 ....................................................................... 126
........................ 127
........................ 128
Specialist Equity Schroder ISF Asia Pacific Property Securities .................................................................... 132 Schroder ISF Asian Total Returda) .................................................................................... 132 Schroder ISF Asian Equity Yield ........................................................................................ 133 Schroder ISF Asian Smaller Companies ............................................................................ 134 Schroder ISF BRIG (Brazil. Russia. India, China) ........ .................................................. 135 Schroder ISF China Opportunities ............................. .................................................. 136 Schroder ISF Emerging Asia ............................................................................................. 137 Schroder ISF Emerging Europe ......................................................................................... 139 Schroder ISF Emerging Markets ....................................................................................... 140
Schroder ISF European Equity Opportunities .................................................................... 143
Schroder ISF European Special Situations ........................................................................ 146 Schroder ISF Global Climate Change Equity ..................................................................... 147 Schroder ISF Global Dividend Maximiser .......................................................................... 148 Schroder ISF Global Emerging Market Comrnoditiedb) .............................. Schroder ISF Global Emerging Market Opportunities ................................. Schroder ISF Global Energy .............................................................................................. 151 Schroder ISF Global Equity Yield .......
Schroder ISF Global Smaller Companies .......................................................................... 153
Schroder ISF Hong Kong Equity ....................................................................................... 159 Schroder ISF Indian Equity ................................................................................................ 159
Schroder ISF Korean Equity .............................................................................................. 161
Schroder ISF European Dividend Maximiser ..................................................................... 142
Schroder ISF European Equity ............................................................................ 144 Schroder ISF European Smalle nies ..................................................................... 145
...................................... 151 Schroder ISF Global Property Securities ........................................................................... 152
Schroder ISF Global Technology ....................................................................... Schroder ISF Greater Fhina ..............................................................................
Schroder ISF Japanese Smaller Companies ..................................................................... 160
Schroder ISF Latin American .......................... ........................................................ 161
I*) Schroder ISF Asian Total Return was formerly known as Schroder ISF Asian Absolute Return until 1 June 2008 Ib) Schroder ISF Global Emerging Market Commodities was launched on 13 June 2008

Page 6 Schroder International Selection Fund Semi-Annual Report June 2008
Specialist Equity (cont) Schroder ISF Middle East ................................................................................................. 162
.............................. 163 Schroder ISF Swiss Small & Mid Cap E ............................................. 164
............................................. 164 Schroder ISF US Small & Mid-Cap Equity ......................................................................... 165 Schroder ISF US Smaller Companies ................................................................................ 166
........... Schroder ISF Swiss Equity Opportunities
Schroder ISF Taiwanese Equity(=) .........
Style Equity Schroder ISF EURO Active Value ...................................................................................... 167 Schroder ISF EURO Dynamic Growth ............................................................................... 168 Schroder ISF European Active Value ................................................................................. 169 Schroder ISF European Dynamic Growth .......................................................................... 170
Alpha Equity Schroder ISF Asian Equity AI .............................................. 171
.............................................. 172 Schroder ISF European Equi .............................................. 173 Schroder ISF Global Equity Alpha ..................................................................................... 174 Schroder ISF Japanese Equity Alpha 175
Schroder ISF EURO Equity Alp
..................................................................... Schroder ISF US Large Cap Alpha .................................................................................... 176
Quantitative Equity Schroder ISF Global Equity Sigma .................................................................................... 176 Schroder ISF QEP Global Active Value(d) .......................................................................... 182 Schroder ISF QEP Global Quality(e) ................................................................................... 189 Schroder ISF North American Equity Sigma ...................................................................... 194
Absolute Return Schroder ISF Absolute Return Bond ................................................................................. 197 Schroder ISF Absolute Return Bond R1 ............................................................................ 199 Schroder ISF Emerging Europe Debt Absolute Returdf) .................................................... 199 Schroder ISF Emerging Markets Debt Absolute Returdg) ................................................. 200 Schroder ISF European Absolute Return ........................................................................... 202
Mainstream Bond Schroder ISF EURO Bond ........... .......................................................... 203 Schroder ISF EURO Short Term B ................................. ................... 204 Schroder ISF European Bond ...... .......................................................... 205 Schroder ISF Global Bond ........... ........ .......................... 206 Schroder ISF Global Inflation Linked Bond ........................................................................ 209 Schroder ISF Hong Kong Dollar Bond .............................................................................. 210 Schroder ISF US Dollar Bond ........................................................................................... 210
Specialist Bond Schroder ISF Asian Bond ................ Schroder ISF Asian Local Currency Bond
Schroder ISF Global Corpclrate Bond ............................................................................... 218
Schroder ISF Strategic Bond ............................................................................................ 223
.................... 212
Schroder ISF EURO Corporate Bond ...............................................................
Schroder ISF Global High Yield ......................................................................................... 220
Specialist Bond (Medium-higher risk) Schroder ISF Asian Convertible Bond(') ............................................................................. 225 Schroder ISF Global Convertible Bond) ........................................................................... 226 Schroder ISF Strategic Credit ........................................................................................... 227
IC) Schroder ISF Tatwanese Equity was launched on 18 January 2008 . Id) Schiodei ISF OEP Global Active Value was formerly known as Scnroder ISF Global Quantitative Acrive Value until 1 June 2008 . (4 Schroder ISF QEP Global Quality was formerly known as Schioder ISF Global Quality Growth Equity until 1 June 2008 . 10 Schioder ISF Emerging Europe Debt Absolute Return was formem Wovr as Schrodei ISF Converging Europe Bond until 1 June 2008 (9) Schioder ISF Emerging Markets Debt Absolute Return was formerly Kriuvdii as Schiodei ISF Emerying Mantets Debt until 1 June 2008 . Ihl Schroder ISF Asian Local Currency Bond was launched or1 9 M y 2008 (1) Schroder ISF Asian Convenible B m d was launched on 14 March 2008 . UI Schroder ISF Global Convenible Bond wds launched on 14 March 2008 .

Schroder International Selection Fund Semi-Annual Report June 2008 Page 7
Defensive Schroder ISF EURO Equity Secure 201 0 .......................................................................... 229 Schroder ISF European Defensive .................................................................................... 229 Schroder ISF European Defensive Monthly ....................................................................... 230 Schroder ISF European Defensive 6 Monthly .................................................................... 230 Schroder ISF World Defensive 3 Monthly .......................................................................... 231
,
Liquidity Schroder ISF EURO Liquidity ............................................................................................ 231 Schroder ISF US Dollar Liquidity ....................................................................................... 233

Page 8 Schroder International Selection Fund Semi-Annual Report June 2008
Schroder International Selection Fund
Schroder International Selection Fund (the ’Company’) is an open-ended ‘umbrella’ company incorporated under Luxembourg law, which enables investors to choose from ‘Funds’ (specific portfolios of assets and liabilities within the Company having their own net asset value and represented by a separate class or classes of Share) offering different investment objectives. The shares of each Fund are listed on the Luxembourg Stock Exchange. Prices are also available on Bloomberg and Reuters.
This report covers the period from 1 January 2008 to 30 June 2008. The financial statements are prepared in accordance with Luxembourg regulations relating to undertakings for collective investment. The last day on which prices were calculated was 30 June 2008, the last working day of the year. At the date of this report, 88 Funds are available for investment. Please refer to the current prospectus for the investment objectives of the Funds as well as details of investment restrictions. The Investment Manager’s report for each Fund can be found in the quarterly investment reports, which can be obtained from the Company’s registered office and are also available on the website of Schroder Investment Management (Luxembourg) S.A. (http:/!w.schrOders.lu).
Hereafter, Schroder International Selection Fund will be referred to as the Company and all names of the Funds will be preceded by Schroder ISF, e.g., Schroder ISF Global Equity Sigma.
Schroder International Selection Fund Semi-Annual Report June 2008 Page 9
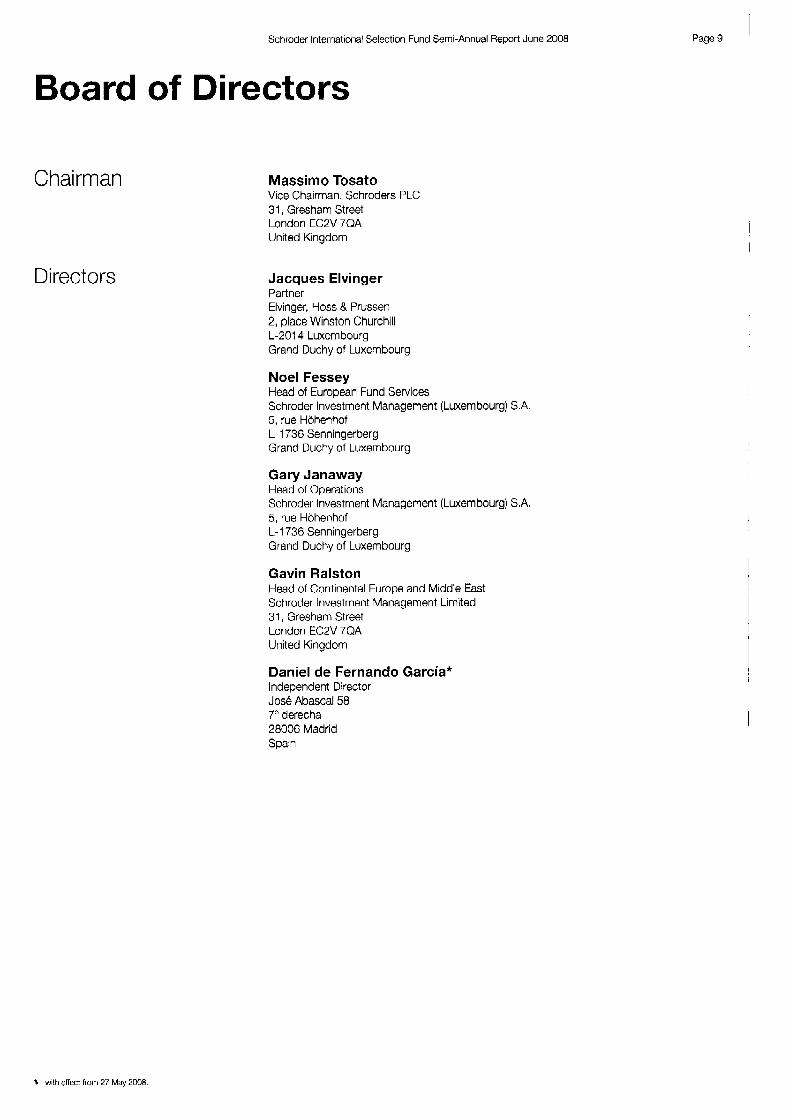
Board of Directors
Chai rrnan
Directors
Massimo Tosato Vice Chairman, Schroders PLC 31, Gresham Street London EC2V 7QA United Kingdom
Jacques Elvinger Partner Elvinger, Hoss & Prussen 2, place Winston Churchill L-2014 Luxembourg Grand Duchy of Luxembourg
Noel Fessey Head of European Fund Services Schroder Investment Management (Luxembourg) S.A. 5, rue Hohenhof L-1736 Senningerberg Grand Duchy of Luxembourg
Gary Janaway Head of Operations Schroder Investment Management (Luxembourg) SA. 5, rue Hohenhof L-1736 Senningerberg Grand Duchy of Luxembourg
Gavin Ralston Head of Continental Europe and Middle East Schroder Investment Management Limited 31, Gresham Street London EC2V 7QA United Kingdom
Daniel de Fernando Garcia* Independent Director Jose Abascal58 7" derecha 28006 Madrid Spain
I
I
with effect from 27 May 2008.

Page 10 Schroder lriterriatiorial Selection Fund Semi-Annual Report June 2008
Administration
Registered Office
Management Company, ' Domiciliary Agent and Principal Paying Agent
Custodian
Principal Legal Adviser
Independent Auditor
5, rue Hohenhof, L-I736 Senningerberg, Grand Duchy of Luxembourg
Schroder Investment Management (Luxembourg) S.A. 5, rue Hohenhof, L-1736 Senningerberg, Grand Duchy of Luxembourg
J.P. Morgan Bank Luxembourg S A . European Bank & Business Centre, 6, route de Treves, L-2633 Senningerberg Grand Duchy of Luxembourg
Elvinger, Hoss & Prussen 2, place Winston Churchill, B.P. 425, L-2014 Luxembourg, Grand Duchy of Luxembourg
PricewaterhouseCoopers S a r.1. Reviseur d'entreprises 400, route d'Esch, BP 1443, L-1014 Luxembourg, Grand Duchy of Luxembourg
i Investment Managers Schroder Investment Management Limited 31, Gresham Street, London, EC2V 7QA, United Kingdom
Schroder ISF Absolute Return Bond Schroder ISF Absolute Return Bond R1 Schroder ISF BRIG (Brazil, Russia, India, China) Schroder ISF Emerging Europe Schroder ISF Emerging Europe Debt Absolute Retuda) Schroder ISF Emerging Markets Schroder ISF Emerging Markets Debt Absolute Returdb) Schroder ISF EURO Active Value Schroder ISF EURO Bond Schroder ISF EURO Corporate Bond Schroder ISF EURO Dynamic Growth Schroder ISF EURO Equity Schroder ISF EURO Equity Alpha Schroder ISF EURO Equity Secure 201 0 Schroder ISF EURO Liquidity Schroder ISF EURO Short Term Bond Schroder ISF European Absolute Return Schroder ISF European Active Value Schroder ISF European Bond Schroder ISF European Defensive Schroder ISF European Defensive 6 Monthly Schroder ISF European Defensive Monthly Schroder ISF European Dividend Maximiser Schroder ISF European Dynamic Growth Schroder ISF European Equity Schroder ISF European Equity Alpha Schroder ISF European Equity Yield
(4 Schroder ISF Emerging Europe Debt Absolute Return was formerly known as Schrcder ISF Converging Europe Bond until 1 June 2008 (b) Scnroder IST Emerging M a e t s Oebt Absolute Return was formerly known as Schroder ISF Emerging Markets Debt until 1 June 20W

Schroder International Selection Fund Semi-Annual Reoort June 2008 Page 11
Ad m i n ist ra t ion (con t)
Investment Managers (cont) Schroder Investment Management Limited (cont) 31, Gresham Street, London, EC2V 7QA, United Kingdom
Schroder ISF European Large Cap Schroder ISF European Smaller Companies Schroder ISF European Special Situations Schroder ISF Global Bond Schroder ISF Global Climate Change Equity Schroder ISF Global Corporate Bond Schroder ISF Global Dividend Maximiser Schroder ISF Global Emerging Market Commodities(c) Schroder ISF Global Emerging Market Opportunities Schroder ISF Global Energy Schroder ISF Global Equity Schroder ISF Global Equity Alpha Schroder ISF Global Equity Sigma Schroder ISF Global Equity Yield Schroder ISF Global Inflation Linked Bond Schroder ISF Global Smaller Companies Schroder ISF Italian Equity Schroder ISF Latin American Schroder ISF Middle East Schroder ISF North American Equity Sigma Schroder ISF QEP Global Active Value(d) Schroder ISF QEP Global Quality(e) Schroder ISF Strategic Bond Schroder ISF Strategic Credit Schroder ISF UK Equity Schroder ISF World Defensive 3 Monthly
Schroder Investment Management (Hong Kong) Limited Suites 3301, Level 33, Two Pacific Place, 88 Queensway, Hong Kong SAR
Schroder ISF Asia Pacific Property Securities Schroder ISF Asian Equity Alpha Schroder ISF China Opportunities Schroder ISF Emerging Asia Schroder ISF Greater China Schroder ISF Hong Kong Dollar Bond Schroder ISF Hong Kong Equity Schroder ISF Taiwanese Equity(‘)
Schroder Investment Management (Japan) Limited 1-1 1-1 Marunouchi, Chiyoda-ku, Tokyo 100-6224, Japan
Schroder ISF Japanese Equity Schroder ISF Japanese Large Cap Schroder ISF Japanese Smaller Companies
(4 Schroder ISF Global Emerging Market Commodities was launched on 13 June 2008. Id) Schroder ISF QEP Global Active Value was formerly known as Schroder ISF Global Quantitative Active Value until 1 June 2008. (e) Schroder ISF QEP Global Quality was formerly known as Schrcder ISF Global Ouality Growth Equity until 1 June 2008. Ir’ Schroder ISF Taiwanese Equity was launched on 18 January 2008.

Page 12 Schroder International Selection Fund Semi-Annual Report June 2008
Administrat ion (cont)
Investment Managers (cont) Schroder Investment Management North America Inc. 875 Third Avenue, 22nd Floor, New York, New York 10022-6225, United States of America
Schroder ISF Global High Yield Schroder ISF Global Technology Schroder ISF US Dollar Bond Schroder ISF US Dollar Liquidity Schroder ISF US Large Cap Schroder ISF US Large Cap Alpha Schroder ISF US Small & Mid-Cap Equity Schroder ISF US Smaller Companies
Schroder Investment Management (Singapore) Limited 65, Chulia Street 46-00, OCBC Cebtre, Singapore 04951 3, Singapore
Schroder ISF Asian Bond Schroder ISF Asian Equity Yield Schroder ISF Asian Local Currency Bond(g) Schroder ISF Asian Smaller Companies Schroder ISF Asian Total Returdh) Schroder ISF Indian Equity Schroder ISF Japanese Equity Alpha Schroder ISF Korean Equity Schroder ISF Pacific Equity
Schroder 8 Co Bank AG Central 2, CH-8021 Zuricn, Switzerland
Schroder ISF European Equity Opportunities Schroder ISF Swiss Equity Schroder ISF Swiss Equity Opportunities Schroder ISF Swiss Small & Mid Cap Equity
European Investors Inc. 71 7 Fifth Avenue, New York, New York 10022, Unites States of America
Schroder ISF Global Property Securities
Fisch Asset Management AG 241 Bellerive, CH-8034, Zurich, Switzerland
Schroder ISF Asian Convertible Bond(') Schroder ISF Global Convertible Bondb)
(8) Schroder ISF Asiari Locd Cuiiency Bond was launched on 9 May 2008 (hl Schiodei ISF Asian Tota! Return 'was formerly known as Schiouei ISF Asian Absolirte Return until 1 June 2008. (I) Schroder ISF Asian Convenible Bond was launched on 14 March 2008.
Schioder ISF tilobal Convertible Bond was launched on 14 March 2008.

Schroder International Selection Fund Semi-Annual Report June 2008 Page 13
Investment Managers’ Report
It has been a challenging environment for global equity markets in general over the past six months. The fallout from the onset of the credit crisis in 2007 continued as we entered 2008 with growing concerns about the slowdown in the US economy and, in turn, the global economy. The Federal Reserve and the Bank of England continued to ease interest rates while most major central banks injected further liquidity into markets by offering short-term funding to banks. The efforts by central banks to stabilise the economy reassured investors in the short term, and markets bounced back in April. However the optimism was short- lived, and by mid-May mounting inflationary pressures served to re-inject uncertainty into the markets.
I
Record food and energy prices fuelled fears of spiralling inflation and re-ignited concerns over the health of the financial services sector. As volatility picked up, virtually all asset classes came under pressure with the exception of a narrow band of stocks, including energy and mining companies which remained supported by the continued strength in emerging market demand and global infrastructure spending.
Banks were amongst the worst hit as investors began to speculate about further write- downs. (Japanese banks were the one exception, aided by their minimal exposure to the problems in the US mortgage market). Auto-makers also bore the brunt of the fallout as
(usually seen as a safe haven) sold off as investors began to focus on the prospect of rising inflation.
input costs increased and consumer demand began to wane, and even government bonds !
During the period, bond markets reversed from pricing in a protracted period of low interest rates to anticipating interest rate tightening in the US, UK and the euro area, to combat rising inflationary pressures. Government bond prices fell and yields rose as the market factored in further rate hikes. Going forward, we take a contrarian view, and continue to believe that there is a strong case for inflation to moderate after a short-lived shock to prices. We have become more positive on high yield corporate bonds, and expect further rate cuts, write-downs of bad assets and fresh capital for financials to stabilise markets in the coming months.
We believe equities are trading on attractive valuations and maintain a constructive view. The continued unravelling of the credit crunch and persistent concerns about inflation present a challenge in the near-term, but we believe we will move into a better phase for equities soon.
We expect global growth to continue slowing overall, with activity in developed economies in particular weakening, while growth in emerging market economies remains healthier. Despite inflation concerns, we believe the economic slowdown will create slack, put pressure on the labour market, and, in turn, this should help alleviate pressure on wage inflation. If this scenario plays out, we anticipate further interest rate cuts once inflation concerns dissipate.
I
I i
The Investment Managers Schroder International Selection Fund 30 June 2008

Page 14 Schroder International Selection Fund Semi-Annual Report June 2008
Notes to the Financial Statements as at 30 June 2008 The Company
The Company was incorporated in Luxembourg on 5 December 1968 as a 'societe anonyme'. Pursuant to an Extraordinary General Meeting of Shareholders held on 31 January 1989, the form and name of the Company, as well as its establishment period, was changed to a 'societe d'investissement a capital variable' ('SICAV') established for an unlimited period under the name of SCHRODER INTERNATIONAL SELECTION FUND. The company qualifies as an undertaking for collective investment (UCI) regulated by the provisions of Part I of the Luxembourg law dated 20 December 2002 regarding UCl's. The Company is UCITS 1 1 1 compliant with effect from 26 April 2005.
I
Classes of Share
At the date of this report, nine classes of shares are available within the Funds: A, B, C, D, I, J, P, A1 & B1 shares. All Funds offer A, B and C shares, apart from the following Funds:
Schroder ISF EURO Equity Secure 2010 (offers only P shares); Schroder ISF European Defensive (offers only A, B & A1 shares): Schroder ISF European Defensive Monthly (offers only A, B & AI shares): Schroder ISF European Defensive 6 Monthly (offers only A, B & A1 shares): Schroder ISF European Equity Opportunities (offers only A, C & I shares); Schroder ISF Japanese Large Cap (offers only A, AI , C and I shares); Schroder ISF World Defensive 3 Monthly (offers only A, B & A I shares):
Shares are generally issued as Accumulation shares. Distribution shares may be issued within any Fund at the Directors' discretion. A list of available Distribution shares may be obtained upon request at the Management Company.
In accordance with the provisions of the current prospectus, the Directors may also offer classes in multiple currency denominations. The respective Investment Managers have the ability to hedge the shares of such classes in relation to the Fund currency. Where hedging of this kind is undertaken, the respective Investment Managers may engage, for the exclusive account of such share class, in currency forwards, currency futures, currency option transactions and swaps in order to preserve the value of the reference currency against the Fund currency.
Where undertaken, the effects of this hedging will be reflected in the Net Asset Value and, therefore, in the performance of such additional share class. Similarly, any expenses arising from such hedging transactions will be borne by the class in relation to which they have been incurred. The classes of share available for each Fund are set out in detail in the current prospectus.
i
I Initial Charge
~
I Distribution Charge
The Management Company and Distributors are entitled to the initial charge, which can be partly or fully waived at the Directors' discretion.
i ~
Distribution charges in respect ot B shares aro payable quarterly. __ Distributjon charges in rsspect oi A ' . E1 and D shares are paid P sucn iriterrals. 55 may be ayreeJ upon from time to time between the Company and thost: Distdaurors that are appointed specifically for the purpose of districuting such shares
Schroder International Selection Fund Semi-Annual Report June 2008 Page 15
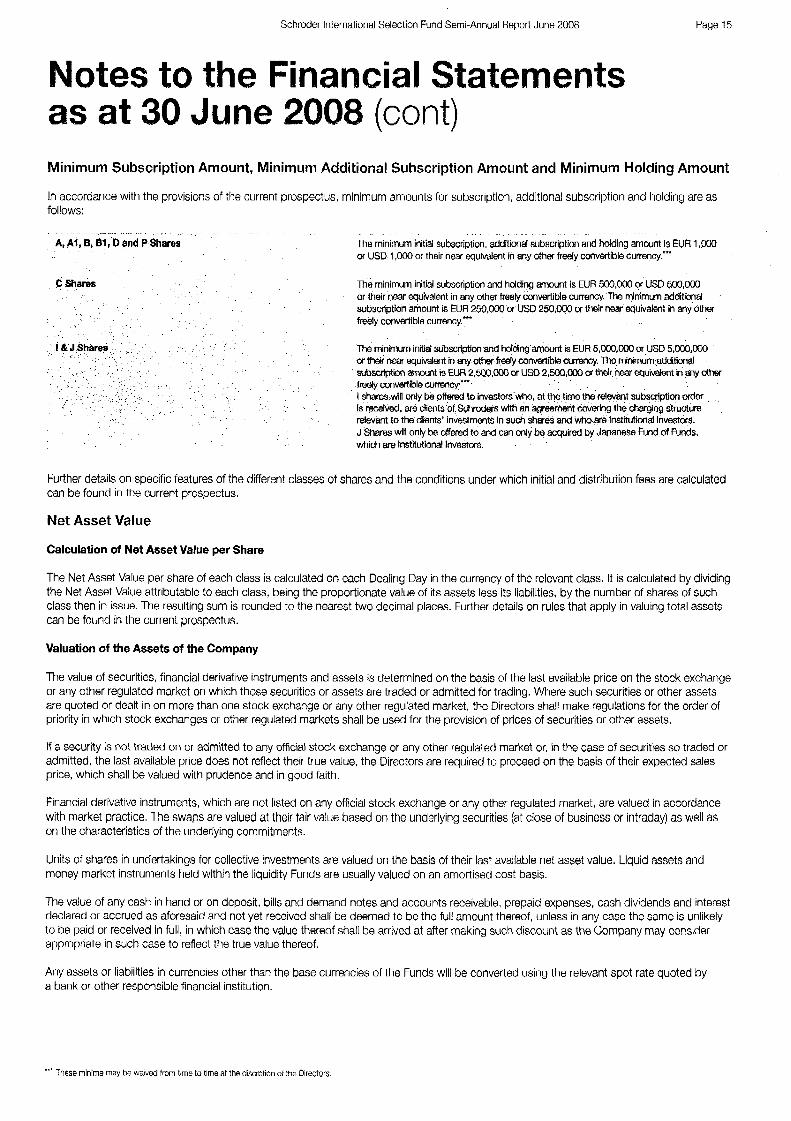
Notes to the Financial Statements as at 30 June 2008 (cont) Minimum Subscription Amount, Minimum Additional Subscription Amount and Minimum Holding Amount
In accordance with the provisions of the current prospectus, minimum amounts for subscription, additional subscription and holding are as follows:
A, Al , 8, El, D and P Shares The minimum initial subscription, additional subscription and hdding amwnt Is EUR 1 ,ooO or USD 1 ,COO or their near equlvalent In any other freely convertible currency."'
me minimum initial subscnptbn and holding amount is EUR 500,ooO or USD 500,oOO or their near equivalent in any other freely convertible currency. The minimum additional subsctiption amount is EUR 250,W M USD 250,000 w their near equivalent in any other freely convertible currsf~cy.*~
The minimum initlal subscrlptlm and hdding mwnt IS EUR 5,000,000 M USD 5,oM3,Mx3 or their near equivalent in any other frwly convertible currency. 7he minimum arlditional subsulptim m t IS EUR 2,5110,oW or USD 2,500,CXXl g~ their near equivalent in any othsr freely mvertible currency*" I shares will only be offered to investors who, at the time the rdwant subscription order is received, are clients of Schroders with an agreement covering the charging structure relevant to the clients' investments In such shares and who are Institutional Investors. J Shares will only be offered to and can only be acquired by Japanese Fund of Funds, which are lnstitutlonal Investors.
C Shares
Further details on specific features of the different classes of shares and the conditions under which initial and distribution fees are calculated can be found in the current prospectus.
Net Asset Value
Calculation of Net Asset Value per Share
The Net Asset Value per share of each class is calculated on each Dealing Day in the currency of the relevant class. It is calculated by dividing the Net Asset Value attributable to each class, being the proportionate value of its assets less its liabilities, by the number of shares of such class then in issue. The resulting sum is rounded to the nearest two decimal places. Further details on rules that apply in valuing total assets can be found in the current prospectus.
Valuation of the Assets of the Company
The value of securities, financial derivative instruments and assets is determined on the basis of the last available price on the stock exchange or any other regulated market on which those securities or assets are traded or admitted for trading. Where such securities or other assets are quoted or dealt in on more than one stock exchange or any other regulated market, the Directors shall make regulations for the order of priority in which stock exchanges or other regulated markets shall be used for the provision of prices of securities or other assets.
If a security is not traded on or admitted to any official stock exchange or any other regulated market or, in the case of securities so traded or admitted, the last available price does not reflect their true value, the Directors are required to proceed on the basis of their expected sales price, which shall be valued with prudence and in good faith.
Financial derivative instruments, which are not listed on any official stock exchange or any other regulated market, are valued in accordance with market practice. The swaps are valued at their fair value based on the underlying securities (at close of business or intraday) as well as on the characteristics of the underlying commitments.
Units of shares in undertakings for collective investments are valued on the basis of their last available net asset value. Liquid assets and money market instruments held within the liquidity Funds are usually valued on an amortised cost basis.
The value of any cash in hand or on deposit, bills and demand notes and accounts receivable, prepaid expenses, cash dividends and interest declared or accrued as aforesaid and not yet received shall be deemed to be the full amount thereof, unless in any case the same is unlikely to be paid or received in full, in which case the value thereof shall be arrived at after making such discount as the Company may consider appropriate in such case to reflect the true value thereof.
Any assets or liabilities in currencies other than the base currencies of the Funds will be converted using the relevant spot rate quoted by a bank or other responsible financial institution.
These minima may be waived from time to time at the discretion ot the Directors ...

Page 16 Schroder International Selection Fund Semi-Annual Report June 2008
Notes to the Financial Statements as at 30 June 2008 (cont) Net Asset Value (cont)
Valuation of the Assets of the Company (cont)
If any of the aforesaid valuation principles do not reflect the valuation method commonly used in specific markets or if any such valuation principles do not seem accurate for the purpose of determining the value of the Company's assets, the Directors may fix different valuation principles in good faith and in accordance with generally accepted valuation principles and procedures.
The Directors are authorised to apply other appropriate valuation principles for the assets of the Funds and/or the assets of a given class if the aforesaid valuation methods appear impossible or inappropriate due to extraordinary circumstances or events.
Fair Value Pricing
In accordance with the provisions of the current prospectus, fair value pricing may be implemented to protect the interests of the Company's shareholders against market timing practices. Accordingly, if a Fund is primarily invested in markets that are closed for business at the time the Fund is valued, the Directors may, during periods of market volatility and by derogation from the provisions above under 'Calculation of Net Asset Value per share', cause the Fund Administrator to allow for the Net Asset Value per share to be adjusted to reflect more accurately the fair value of the Fund's investments at the point of valuation.
The level of adjustment is based upon the movement in a chosen surrogate up until the point of valuation, provided that such movement exceeds the threshold as determined by the Directors for the relevant Fund. The surrogate will usually be in the form of a futures index but might also be a basket of securities, which the Directors believe is strongly correlated to and representative of the performance of the Fund. Where an adjustment is made as per the foregoing, it is applied consistently to all classes of shares in the same Fund.
During the period under review, fair value pricing was applied to six Funds, namely, Schroder ISF Global Equity, Schroder ISF Global Equity Sigma, Schroder ISF Global Technology, Schroder ISF QEP Global Active Value, Schroder ISF North American Equity Sigma and Schroder ISF US Large Cap. The Directors, however, reserve the right to extend the implementation of fair value pricing in respect of other Funds whenever they deem it appropriate.
The Funds in relation to which fair value pricing was applied during the period under review as well as details of the relevant reference indices, thresholds and surrogates are shown below:
Fund
Schroder ISF Global Equity
Schmder ISF Global Equity Sigma Schroder ISF Global Technology
Schroder ISF North American Equity Sigma
Schrodw ISF QEP Global Active Value(w
Schroder ISF US Large Cap
Threshold
0,50%
0.50%
0,50%
0,50% 0,50% 0,50%
Surrogate
SBP 509 Futures S&P 500 Futures
Nasdaq 100 Futures
S W 500 Futures S&P 500 Futures
S&P 500 Futures
Taxation
The Company is not subject to any taxes in Luxembourg on income or capital gains. The only tax to which the Company is subject is the 'taxe d'abonnement' at a rate of 0.05% per annum except in relation to I and J shares and to Schroder ISF EURO Liquidity and Schroder ISF US Dollar Liquidity where the tax is levied at a rate of 0.01 % per annum. The tax is payable quarterly in arrears on the basis of the net assets of the respective Funds at the end of the relevant quarter.
Changes in the Funds
A list specifying for each Fund the total purchases and sales, which took place during the period under review, may be obtained free of charge upon request at the Company's registered office.
Schroder ISF QEP Glcbal Actlve Value was formerly known as Scnroder ISF Global Quaritltatlve Actlve Value uitil 1 June 2008

Schroder International Selection Fund Semi-Annual Report June 2008 Page 17
Notes to the Financial Statements as at 30 June 2008 (cont) Transactions made for a Purpose other than Hedging
In accordance with the provisions of the current prospectus, the Company may, for a purpose other than hedging, purchase and sell futures contracts, options on any kind of financial instruments and equity swaps provided that:
a) The aggregate commitments in connection with the purchase and sale of futures contracts, options on any kind of financial instruments and equity swaps together with the amount of the commitments relating to the writing of call and put options on transferable securities do not exceed at any time the value of the net assets of the relevant Fund; and
b) The total premiums paid for the acquisition of outstanding call and put options on transferable securities may not together with the total of the premiums paid for the purchase of the call and put options outstanding made for a purpose other than hedging exceed 15% of the net assets of the relevant Fund; and
c) The Company will only enter into equity swap transactions with highly rated financial institutions specialised in this type of transactions.
Securities Lending
In accordance with the provisions of the current prospectus, the Directors may, in their sole discretion, allow the Company to lend its securities within the framework of a standardised lending system organised by a recognised securities clearing body or by a highly rated financial institution specialised in this type of transaction. After the deduction of Management Company and agent fees, during the period 1 January 2008 to 11 February 2008, the Company received 65% of the gross income from the securities lending programme, and from 12 February 2008 to 30 June 2008, the Company received 60% of the gross income.
On 30 June 2008, the valuation of the securities on loan was EUR 1,297,239,763, The table below shows the valuation of securities on loan at Fund level on 30 June 2008:
- , ". , ~.., . ~. .....,,._ . . . ... . . . .. .. .
, China)
RO Active Value
F CUR0 Equity Alpha Schrcder ISF EURO Liqllidity
Absolute Return
F European Dividend Maximiser Schroder tSF European Dynamic Growth
SF European Equity SF European Equity Alpha
Schroder ISF European Equlty Opportunities Schroder ISF European Equity Yield Schroder ISF European Large Cap Schroder ISF European Smaller Companies Schroder ISF European Speclal Situations Schroder ISF Global Bond Schroder ISF Global Climate Change Equity
31,198,265 44,530,926
556,422
59,274,480 9,850,676
1,801,403 ,336,181 ,650,433 1,301,379 13,511,033
la) Schroder ISF Asian Total Return was formerly known as Schroder ISF AsIan Ahsolute Return until 1 June 2008

Page 18 Schroder International Selection Fund Semi-Annual Report June 2008
Notes to the Financial Statements as at 30 June 2008 (cont) Securities Lending (cont)
Schroder ISF Global Corporate Bond Schroder ISF Global Dividend Maximiser Schroder ISF Global Emerging Market Opportunities Schroder ISF Global Energy Schroder ISF Global Equity Schroder ISF Global Equity Alpha Schroder ISF Global Equity Sigma Schroder ISF Global Equity Yield Schroder ISF Global High Yield Schroder ISF Global Inflation Linked Bond Schrader ISF Global Property Securities Schroder ISF Global Smaller Companies Schroder ISF Greater China Schroder ISF Hong Kong Equity Schroder ISF Italian Equity Schroder ISF Japanese Equity Schroder ISF Japanese Equity Alpha Schroder ISF Japanese Large Cap Schroder ISF Japanese Smaller Companies Schroder ISF Latin American Schroder ISF North American Equity Sigma Schroder ISF Pacific Equity Schroder ISF QEP Global Active Value(b) Schroder ISF Strategic Bond Schroder ISF SWISS Equity Schroder ISF Swiss Equity Opportunities Schroder ISF SWISS Small & Mid Cap Schroder ISF US Dollar Bond Schroder ISF US Large Cap Schroder ISF US Small & Mid-Cap Equity Schroder ISF US Smaller Companies
Total
Equalisation
EUR 248,164 61 2,747
5,065,797 17,547,4
2,129,508 78561 3
6,995,309 1,104,151
13,565,223
1
98,479,570 60,508,559 17,252,590 7,144,715 6,835,600
9,066,747
7,757,023 10,659,002 14,926 5,i 45,932 1,156,762 3,400,520
10,835510 17,671,277
1,297,239,763
The Company operates equalisation arrangements to ensure that effective yields are paid out by the Funds at year end and to nullify the impact of significant capital changes upon the amount paid per Share as a dividend.
The equalisation amount represe'lts the average amount of income of the fund included in the Net Asset Value of each Share issued during the relevant distribution period. Under UK regulations, it is expected that the equalisation amount will not be taxable as an income receipt of the Shareholder but should be applied to reduce the base acquisition cost of the Shares for the purpose of computing capital gains. The tax treatment of equalisation amounts may, however, differ in certain jurisdictions, such as Germany. Further details on equalisation arrangements can be found in the Fund's current prospectus.
Risk Warning
Those Funds with an investment objective that allows investment in Russian securities may invest directly in Russian securities that are traded on the Russian Trading System Stock Exchange ( R E Stock Exchange) and MICEX - Moscow Interbank Currency Exchange. For details of risk involved in dealing in these exchanges please refer to Appendix I1 of the current prospectus.
The Funds will limit any direct investment in securities traded on the non Regulated Markets of the Commonwealth of Independent States (together with any other securities not traded on a Regulated Market) to f 0% of its net assets.
IbJ Schroder !SF QEP Global Active ValGe was brrnerlv known as Schroder ISF Global Quantitative Active Value until 1 Jure 2qOP.

Schroder International Selection Fund Semi-Annual Report June 2008 Page 19
Notes to the Financial Statements as at 30 June 2008 (cont) Information for Residents of the Hong Kong SAR
Registration of Funds
On 30 June 2008, all the Funds of the Company, except for those indicated in the table below were registered for sale in Hong Kong SAR. In relation to the Funds that are registered in Hong Kong SAR, only A, A1 , B1 and D shares are available for retail investors.
Funds not registered for sale in Hong Kong SAR
Schroder ISF Absolute Return Bond Schroder ISF Absolute Return Bond R1 Schroder ISF Asian Convertible Bond(a) Schroder ISF Asian Total Return(h) Schroder ISF EURO Equity Alpha Schroder ISF EURO Equity Secure 201 0 Schroder ISF European Defensive 6 Monthly Schroder ISF European Defensive Monthly Schroder ISF European Dividend Maximiser Schroder ISF European Equity Schroder ISF European Equity Opportunities Schroder ISF European Special Situations Schroder ISF Global Convertible Bond(c) Schroder ISF Global Dividend Maximiser Schroder ISF Swiss Equity Opportunities Schroder ISF Swiss Small & Mid Cap Equity Schroder ISF US Large Cap Alpha Schroder ISF World Defensive 3 Monthly
Soft Commission Arrangements
Pursuant to the requirements of the Hong Kong Securities and Futures Commission regulations, the following statement is made:
Soft commission arrangements have been undertaken in respect of the Company. Services which are paid for through or by soft commission were in majority limited to the following areas:
a) research, analysis or price information including computer or other information facilities: b) portfolio valuations; or c) performance measurement.
Transactions with Connected Persons
The Company has entered into agreements and arrangements with Schroder Investment Management Limited and its affiliates, under which a management fee, performance fee and a transfer agency fee are payable. These agreements and arrangements have been entered into in the ordinary course of business and on normal commercial terms, The annual management fees are set out on pages 20 and 22. Details on the performance fees are set out on page 22.
In addition, the Management Company is entitled to receive the customary charges for its services as administration agent, coordinator, domiciliary agent, global distributor, principal paying agent and registrar and transfer agent. These fees accrue daily at an annual rate of up to 0.4% by reference to the Net Asset Value of the relevant Fund and are paid monthly in arrears.
Further details on fees payable by the Company can be found in the current prospectus. Details on securities lending are set out on page 17. No transactions of the Fund were effected through a broker who is a connected person of the Management Company, the Investment Adviser. or the Directors of the Fund.
la) Schroder ISF Aslan Ccnvertible Bond was lamchec on 14 March 2008. Ihl Schroder ISF Asan Total Return was formerly known as Schroder ISF Aslan AbFolute Retu-n unlll 1 June 2008 IC) Schroder ISF Glohal Convertible Bond was latrnched OF 14 March 2008.
Page 20 Schroder International Selection Fund Semi-Annual Report June 2008
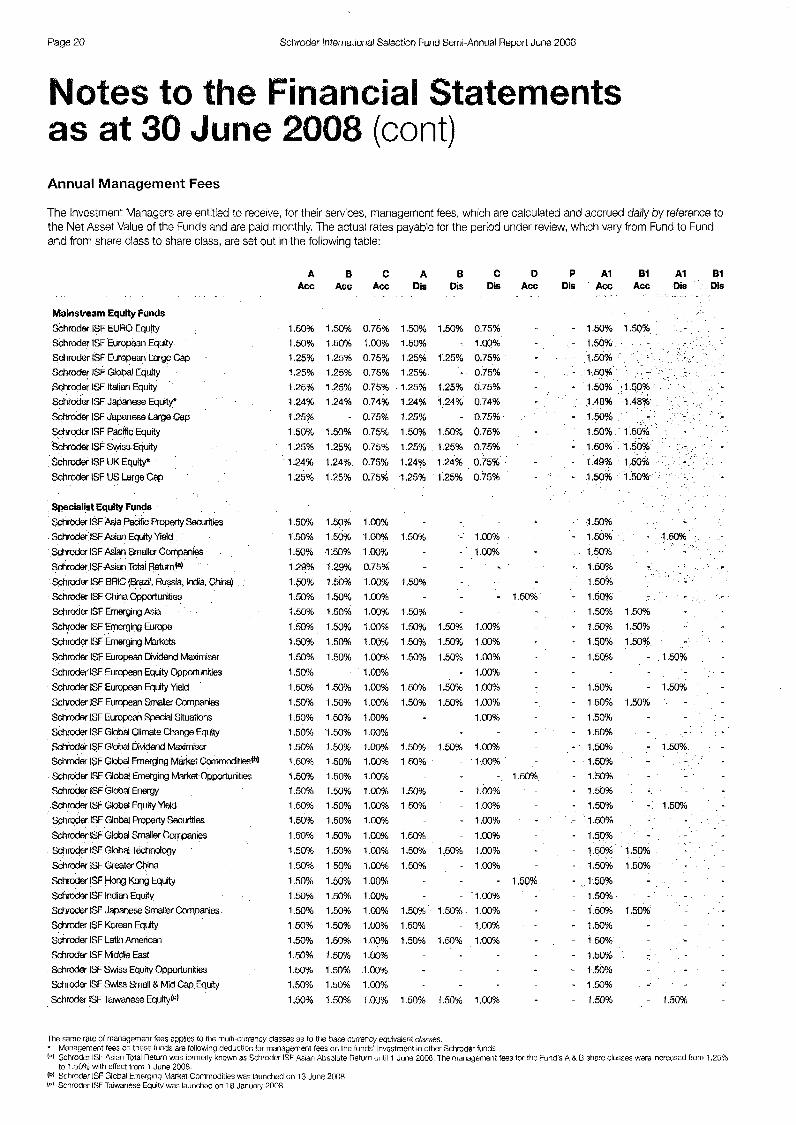
Notes to the Financial Statements as at 38 June 2008 (cont) Annual Management Fees
The Investment Managers are entitled to receive, for their services, management fees, which are calculated and accrued daily by reference to the Net Asset Value of the Funds and are paid monthly. The actual rates payable for the period under review, which vary from Fmd to Fund and from share class to share class, are set out in the following table:
A ACC
B ACC
C Acc
A Dis
B Dis
C Dis
D P A i 01 Ai 81 ACC Dis Acc Acc Dis Dis
Mainstream Equity Funds Schroder ISF EURO Equity
Schroder ISF European Equity
Schroder ISF European Large Cap
Schroder ISF Global Equity Schroder ISF Italian Equity
Schroder ISF Japanese Equrty'
Schroder ISF Japanese Large Cap Schroder ISF Pacific Equity
khroder ISF Swiss Equity
Schroder ISF UK Equityt
Schroder ISF US Large Cep
1.50%
1.50%
1.25% 1.25%
1.25%
1.24%
1.25% 1.50%
1.25%
1.24%
1.25%
1.50% 1.50% 1.25%
1.25% 1.25%
1.24%
0.75% 1.00%
0.75% 0.75% 0.75% 0.74% 0.75% 0.75% 0.75%
0.75% 0.75%
1.50%
1.50% 1.25% 1.25%
1.25%
124%
1.25% 1 50% 1.25%
1.24% 1.25%
1.50%
1.25%
1.25%
1.24%
0.75%
1 .ao% 0.75% 0.75% 0.75%
0.74% 0.75% 0.75% 0.75% 0.75% 0.75%
- 1.50% 1.50% - 1.50%
- 1.50% ~ 1.50% - 1.50% 1.50% - 1.48% 1.48% - 1.50% - 1.50% 1.50% - 1.50% 1.50%
- 1.49% 1.50% - 1.50% 1.50%
- 1.59% - 1.50%
- 1.50%
- 1.50% - 1.50%
1 .W% - 1.50% - 1.50% 1.50% - 1.50% 150%
- 1.50% 1.50%
- 1.5@% - 150%
- 1.50% - 1.50% - 150% 1.50% I 1 .Soyo
- 1.50%
- 1.50% I 1.50%
- 1.50% 1.50% - 1.50%
- 1.50% - 1.5OYo - 1.50%
- 1.50%
- 1.50% - 1.50% 1.50%
- 150% 1.50%
1.50% - 1.50%
- 1.50%
- 1.50% 1.50%
- 1.59%
- 150%
- 1.50% + 1.50% _. 1.50%
- 1.50% - 1.50%
1.50%
1.25%
1.24%
1.25%
1.50% 1.25%
1.24%
1.25%
Specialist Equity Funds
S&lodw ISF Asia Pacjfic Properly Securities
Schroclor ISF him Equity Yield Schroder ISF Man Smaller Cmpanies
Schrodw ISF Asian Total Return@)
Schroder ISF ERIC (Razif. Russia, India. China) SchWr ISF Chim Opportumbes schrcder ISF b g i n g Asia
Schroder ISF Emerging Europe
S c h d e r ISF Emerging Markets Schrcder ISF European Didend Mawimiser
Schroder ISF European Equity Opportunities
Schrcder ISF Europoan Equity Meld Schrwler ISF European Smaller Compmiss
Schroder ISF European Specral Situations Schmder ISF Global Climate Change Equity
sdnodsr ISF Global D v i d d M&ser Schroder ISF Global Emerging Market COmmodities(@
Schrodw ISF Global Emerging Market Opportunities
Smrcder ISF Glchal Energy Schroder ISF Global Eqwty Yield Schroder PSF GIoW Property Securities
Schrodar ISF Global Smaller Companies Schroder ISF Global Techndqy
schrcder ISF Greater China
Schrcder ISF Hong Kong Equity
%rode ISF Indian Equity Schrcder ISF Japanese Smaller Companies
Schrcdw ISF Korean Equity Schrcder ISF Latin Amoncan
Schrcder ISF Uddle East Schroder ISF Swiss Equity Opportunties
Schrcdcx ISF Swiss Small & Mid Cap Equity
Schrcder ISF Tawanese Equity@'
1 .so96 1.50% 1.50% 1.29%
1.50% 1.50%
1.50%
1.50%
1 .!a% 1.50%
1.50% 1.50% 1.50%
1.50%
1.50%
1.50%
1.50% 1.50% 1.50%
1.50%
1.50% 1.50%
1.50%
1.50%
1.50%
1 .Ea% 1.50%
1.50%
1.50%
1.50% 1.59%
1.50%
1.50%
1.50% 1.50%
1.50%
1.29%
1 .!io% 1.50% 1.50% 1.50% 1.50% 1.50%
1 .oo% 1 .oo% 1.00% 0.75%
1.0096
1 .oo% 1 .oo% I .W% 1 .oo% 1 . W O
1 .cQ% 1.00%
1 .OO% 1 .oo% 1 .00% 1 .M)%
1 .oo% 1 .oo% 1 .oo% 1 .oo% 1 .oo% 1 .oo% 1 .00% 1 .cQ% 1 .OO% 1 .oo% 1.00% 1 ,0096 1.0%
1 .oo% 1 00% 1 .oo% 1 .OO%
1.50% 1.00% 1.00%
1 . 5 0 %
1 .a% 1.50%
1.50% 1.50%
1.50% 1.50%
1.50%
1.50% 1.50%
1.00% 1 .0%
1 .Lo% 1 .oo% 1 .OO% 1 .oo% 1 .00%
1 .m 1 .oo%
1 50% 1.50%
1.50% 1 .a% 1.50% 1.50%
1 50% 1.50% 1.50%
1.50% 1.50%
1 .Eo% 1.50% 1.50% 1 .a% 1.5091,
1.50%
1.50% 1 .mom 1.50%
1.50%
1.50?43
1.50% I .50%
1.50% 1.50% 1.50%
1.5096
1.50%
1 .co% 1 .Lo% 1 .00%
1.0%
1 .oo% 1 .oo%
1 .XI%
1 00% 1 .Go% 1 .oo%
1 50% 1.50%
1 .XI% 1.50%
1.50%
1.50% 1.50%
1 50%
1 .Fa%
1 .00% 1.50% 1.50%
The same ialc Of management fees ag,p!ies 10 the mulB-currency classes as to the base cc~riency equivalent classes. =
I;*) Schioder IS1 Asiari Totdl Return was iomerly kncwri as Scthioder ISF 4s1a7 Absolute Roturri iiritil 1 June 2008. l h e mariagemen: f e s tor the Fund's H h Li s twe classes vwe ,ncrecissd fim 125?2
Ih) Schiodei ISF Glcbal Emtirging hl$<et Commodities was launctlod tin 13 June 2008
Managmel;t fee5 on these funds are falloaing deductlor; far manayenmt fsss on the funds' investrn0rht In other Schrodor funds
to 1.51391 with e f f m from 1 June 2008.
Schroder ISF Taiwnriase Equity was launched on 18 Januab 2038.

Schroder International Selection Fund Semi-Annual Report June 2008 Page 21
Notes to the Financial Statements as at 30 June 2008 (cont) Annual Management Fees (cont)
Specialist Equity Funds (cont) Schrodef ISF US Small & Mid-Cap Equity Schrodsr IkF US Smalls Cwnpanies
Absolute ReWn Funds
Schder ISF Absolute Return Bondm
AbsoluteRetun
schrodsc ISF Strategic Bond
A B C A B C ACC Acc ACC Dis Dis Dis
1.50% 1.50% 1.00% 1.50% - 1 .mo
1.50% 1.50% 1.CW 1.50% 1.50% 1.00%
1.50% 1.50% 1.0% 1.50% - l.M)%
1.50% 1.50% 1.00% 1.50% - 1.03% 1.50% 1.60% 1.m% - 1.00% I.&% 1.50% 1.00% f 1.0096
1.50% 1.50% 1.60% 1.50% 1.50% 1.50% 1.50% 1.% 1.50% 1.50% 1.50% 1.50%
1.25% 1.25% 1.26% 1.25% 1.25% 1.25% 1.25% 1.25%
1.00% 1.50% 1 .oo% 1.m% 1.50% 1.00% 1.50% 1 .oo% 1 .00%
0.75% 1.25% 0.75% 1.25% 1.W% 1.25% 1 .oo%
- 1.00%
- l.M% - 1.00% - 1.m
- 1.0096
1.25% 0.75% ~ 0.75% - 1.0056 - 1,0046
0.91% 0.93% 0.57% - 0.57% 0.50% 0.50% 0.40% 1.50% 1.50% 0.90% 1.50% 1.50% 0.90% 1.25% 1.25% 0.75%
0.75% 9.75% 0.50% 0.50% 0.50% 0.20% 0.76% 0.75% 0.50% 0.75% 0.75% 0.5Wb 0.75% 0.75% 0.50% 0.75% 0.75% 0.50% 0.75% 0.75% 0.50%
1.25% 1.25% 0.75% 1.00% 1.00% 0.60% 0.92% 0.92% 0.50% 0.94% 0.92% 0.57% i.00% 1.00% 0.613% l.m% 1.0046 0.6046
1.50% 1.60% 1.50% 1.50% 0.90% 1.25%
0.75% 0.75% 050% 0.50% 0.50% 0.20% 0.75% 0.75% 0.50% 0.75% 0.75% 0.50%
- 0.50% 0.75% 0.75% 0.75% 0.50%
1.25% 1.25% 0.75% 1.00% - 0.60%
0.94% 0.92% 0.59% 1 .M)%
1 .m - 0 . m
D P A I E1 A1 BI ACC Dis Acc Acc Dis Dis
- 1.33% - 1.50% 1.50%
- 1.50% 1.50% - 1.50% " 1.50%
- 1.503b
. ,
- 1.50% ' - , - - 1.50% . . - - 1.50% - 1.50% - . 1 . m o
. .
- 1.wo , - . . .
" 1.50% 1.50% - 1m - 1.50%
- 0.92% ' 0.50% - 1.50% I.@% 1.5046 1.00% - 1.50% 1.00% 1.59% 1.00% - 1.50%
. -
,, . .
0.75% 0.75%
0.75% 0.75% 0.75%
0.75% 0.75% 0.50% O.%.
0,76% 0.75% 0.75% 0.75% 0.75% ' -
- 1.25% 1. 1 .oo% - 1.00% - 0.93% 0.92 - 093% 0.92% - 1.00% " 1W%
The same rate of management fees applies to the multl-currency classes as to the base currency equiqalent classes. fd) Schroder ISF @EP Global Active Valile was formerly known as Schroder ISF Global Quantitative Active Value Bond until 1 June 2008. IC) Schroder ISI' QEP Glsbal Quallly was formerly known as Schrodor ISF Global Quality Growth Eyiiity until 1 June 2008. (0 The management fees for Schroder Absolute Return Bond's A, @ R A I Sham classes 'were decreased from 1 .0@% to 0.7576 and the management fee for Fund's C share Classes wrre decreased
(4 Schroder ISF Emerginy Europe Deb! Absolute Return was formerly known as Schroder 'SF Converging Europs Bond until 1 June 200R. (h) Scnroder ISF Emerging h1a:kets Debt Absoiutc Return was formerly known as Schroder ISF Emergirig Markets Debt until 1 June 2008
li) ?he management fees for Schroder ISF EURO Corporate Bond's A. 0. AI & E1 share msses werg decreased from 1 .OOYb to 0.75% and the management B e for Fund's C shve ClaSS was
Ik) The management f w s for Schroder ISF Global Corporate Bond's A, 6. AI 8 B1 share classes 'wera decreased from 1 .HI% to 0 75% and the management fee for Fund's C share classes were
from 0.50% to 0.50k vith effect from 1 M3y 2008
Schroder ISF AsIan Lwal Currency Bond was launched cn 9 May 2008.
decreased from 0.60% to 0.509b with effect from 1 May 2008.
decreased from 0.609b to 0.50% with effect from 1 May 2008.

Page 22 Schroder International Selectiori Fund Semi-Annual Report June 2008
as at 30 June Notes to the Financial Statements
2098 (cont) A m ua I Ma nag err1 en t Fees (co nt)
Specialist Bond Funds (Medium-higher risk)
Schrcder ISF Asian Convertible Bondrn Schroder ISF Global Convertible Bond('@ Schroder ISF Strategic Credit
Defensive Funds Schroder ISF EURO Equity Secure 20101") Schrcder 1SF European Defwrsive Schroder ISF European Defensve Monthly
Schrdw ISF European Oefenslve 6Mmthly Schrc& ISF World Oefensive 3 Monthly
Liquidity funds
Schrodsr ISF EURO Llqudity
Schroder ISF US Dollar Liquidity
Performance Fees
A B C A Acc Acc A m Dls
1.25% 1.25% 0.75% 1.25% 1.25% 0.75% 1.50% 1.50% 1.00%
1.25% 1.00% - 1.25% 1.25% 1.00%
1.25% 1.00% 1.25% 1M%
0.50% 0.50% 0.20% 050% 0.50% 0.20%
0 c Dis Dis
- 1.00%
D Acc
P AI E l A I E1 Dis ACC ACC Dls Dis
- 1.25% - 125% - 1.50%
0.48% - 1.25%
- 1.25% - 1.25% - 1.25%
- 0.50% 0.50% - 0.50% 0.50%
In accordance with the provisions of the current prospectus, performance fees were applied to 19 Funds. Accordingly, the Investment Managers of the relevant Funds are entitled to receive a performance fee from the Funds, provided that the increase in the Net Asset Value per share of the Funds over the calendar year outperforms their relevant benchmarks. The performance fee is 15% of the outperformance and is payable annually in January. Further details of the calculation of the performance fees can be found in the current prospectus.
The Funds in relation to which performance fees were calculated during the period under review as well as details of the relevant Investment Managers and benchmarks are set out in the following table:
Fund
Sehroder ISF Asian Convertible Bond@)
Schmder ISF A s i n Convertible Bond EUR Hedgedb)
Schroder ISF Asian Equity Alpha
Schroder ISF Asian Smaller Companies
$chmder 1SF Asian Total Return(@ Schmder ISF EURO Equity Alpha
Schmder ISF European Absolute Return Schmder ISF European Active Value Schroder ISF European Dynamic Growth Schroder ISF European Equity Alpha
Schroder ISF European Equity Oppbrtunltles Schroder ISF European Special Situations Schroder ISF Global Convertible Bond0
Schroder ISF Global Convertible Bond EUR Hedged'g Schroder ISF Global Equity Alpha Schroder ISF Global Smaller Companies
Schroder ISF Japanese Equity Alpha Schroder ISF Swiss Equity Oppbrhmities Schroder 1s: US Large Cap Alpha
Investment Manager
Rsch Asset Management AG Fish Asset Management AG SchrOd~ Investment Managwlwnt (Hcq Kang) timitad Smrcder Investment Management (Singapore) Limited S&rcder lnvestmmt Management Limited
Schroder Investment Management Umited Schrcder Inwtment Management Lmited
%r& Investment Management Limited
Schrcder Investment Management Limited
Schrodel Investment Management hmited
Schrder & Co Bank AG Schrcdec Investment Management Limited
Fisch Asset Management AG
Fisch Asset Management AG
Schrcder Investment Management Limned Schdef Investment Managemmt Lmited
Schfcder Investment Managmmt (Singapore) Limited Schroder & Go Bank AG Schrodw Investment Management North America hc.
Benchmark
UBS Cmvwtiblo Asia ex Japan UBS Convertible Euro Sub BBB & NR USD MSCl Daily lR Gross AC Far East (F& Ex Japan USD MSCl aaily TR Gross AC Far East (Free) Ex Japan US0 BBA Libor USD 3 v m t h Act 360 MSCl EMU
BBA tibw 4ur 3 Month A d MSCl Europe MSCl Europe
MSCI Europe
MSCI Europe Net (Total Return)
MSCI Europe
UBS Convertible Global Focus UBS Convertible Global Focus Hedged (EUR) CB
S&P/Citigroup &ended Market WOrM Index
Tokyo Stock Price Index (TOPIXJ Swiss Petfwmance Index (SPI)
S&P 500 Index VR)
MSCI World
Ths same rate of mawgement fees applies tc the multi-currency classes as to the base currency equivalent classes. (1; Schroder I S i A~ian Convertible Forid was :wnched on 14 March 2008, ('1') Schiocler ISF Wbal Conveilibie 63nd was launched or1 14 hl~rc!n 20C8 In) Schrccer ISF Ed92 Fquity Secure 2C10 was launchod ur1 25 0:tebei 2005. The manajernorit fee fur trie lhfe of the fund 15 5.541 for the dSD class and A% f3. the ElJR class. We have already
a'ithdrawi 39b from the USD ~ 1 8 % arid 2% fram tne EUFi class at the launch date lo) Schroder !SI' As:ari Ccrlvenible Bond was launsced ori 1.1 March 2098 (PI Schroder ISF AsIan Convertible Bond EUP Hedged $/as launchi-o on 2H March 2008 I*) Schroder ISF Asm Total Return was furrns:ly known as Schroder ISF Asian Absolute neturn un:ii 1 June 2008
Schroder 6 F Global Ccnve.ertiblc Bond w& launched on I 4 March 2008. Schroder ISI: Glcba! Convenible Bond EUR Hedged was lauriche3 on 28 March 2008

Schroder International Selection Fund Semi-Annual Reoort June 2008 Page 23
Notes to the Financial Statements as at 30 June 2008 (cont) Dividends
Record Ex-Dividend Payment Date Date Date
Dividend Fund Currency per Share
Schroder ISF Asian Bond USD 0.037438
Schroder ISF Asian Bond USD 0.041 527
Schrcder ISF Asian Bond USD 0.036624 Schrcder ISF Asian Bond EUR denominated HJR 0.024762
Schrcder ISF Asian Bond EUR Hedged EUR 0.421 880
Schmder ISF Emerging Europe Debt Absolute Return@ EUR 0.048347 Schroder ISF Emerging Europe Debt AbSOlut8 Return(@ EUR 0.048308
Schrodw ISF Emerging Europe Debt Absolute Return US0 denominated(& USD 0.071447
Schrodw ISF Emerging Markets Debt Absolute Returnp) USD 0.09031 7
ets Cebt Absolute Return@) 0.105518
et$ Debt Absolute Return EUR Hedgedm) 0.127595
ets Debt Absolute Return EUR Hedgedmi EUR 0.135132
USD 0.401984
Schrotler ISF Asian Bond Schroder ISF Asian b n d
Schrcdw ISF Asian Bond
Schroder ISF Asian b n d EUR dmominated Schloder ISFAsian Bond EUR Hedged
Schroder ISF Emerging Europe Debt Absolute Return(*)
Schroder ISF Emerging Europe Debt Absollite Return@) 0.040277
Schroder ISF Emerging Europe Debt Absolute Return USD denominated@) 0.060550
Schroder ISF Emerging Markets Debt Absolute Returnm 0.075028
Schroder B F Emerglng Markets OeM Absolute Return@) 0.087253
Shmder ISF Emerging Markets Debt Absolute Return Elk3 H&g 6.106745
Sduodet ISF Emerging Markets Debt Absolute Return EUR Hedgeoh) 0.1 12154
Schroder ISF Strategic Bond USD 0.332834
Schroder ISF Aslan Bond
SchW ISF Asian Bond
ISF Asian Bond
ec ISF Asian Bond EUR denominated
Schroder 8 F Asian brd EUR hedged EUR I 0.350276 Schrader ISF Asian Equity Yield USD 0.183887
Schroder ISF Asian Equity Yield USD 0.1 57244
0.189989 htoder ISF hlan Qdty Yield
M e r 1SF Emerging Europe Debt Absolute Returnfs)
Schrcder ISF Emerging Europe Debt Absolute Returnf*]
r ISF Emerging Europe DebtAbsdute Return USD denomin 0.032709 Schroder ISF Emergina Markets Debt US0 0.25141 0
Schroder ISF Emerging Markets Debt Absolute R e t ~ n ( ~ ) USD 0.076451
Schrodec ISF Emerging Markets Debt Absolute Return(b) USD 0.087789
Schrcder ISF Emerging Markets Debt Absdute Return EUR Hedged@) EUR 0. IO7408
Schroder ISF Emerging Markets Debt Absdute Return EUR Hedgedm EUR 0112740
la) Schroder ISF Emerging Europe Debt Absolute Return was formerly k n a w as Schroder ISF Converging Europe Gond until 1 June 2008 la) Schroder ISF Emerging Markets Debt Absolute Return was formerly kncwn as Schroder ISF Emerging Markets Debt until 1 June 2008. IC) Schroder ISF Japanese Equity Select was liquidated on 6 June 2008.

Page 24 Schroder International Selection Fund Semi-Annual Report June 2008
Notes to the Financial Statements as at 30 dune 2008 (cont) Dividends (contj
Record Ex-Dividend Payment Dividend Date Date Date Fund Currency per Share
26-Mar48 27-Mar-08 7-Apr98
29-Apr-08 30-Apr-08 0-May-08
28-Hay-08 29-May48 6-Jun-08
Schroder ISF European Dividend Maxlrniser
Schrcder ISF European Dividend Maximiser
Schroder ISF European Dividend Maximiser
Gchrc#er ISF European Dividend Maximiser
Schrcder ISF European Equlty Meld
Schroder ISF European Equity Yield
Schroder ISF European Equity Yield
Schroder ISF European Equity Yield
Schroder ISF European Equity Yield US0 denominated
Schroder ISF Global Dividend Maximiser
Schroder ISF Global Dividend Maximiser
Schroder ISF Gl&al Dividend Maximiser
Schroder ISF Global Dividend Maximlser
Schroder ISF Global Dividend Mimiser GBP denominated
Schroder ISF Global Dividend Maximiser SGD denominated
Schroder ISF Global Equity Yidd
Schrodsf ISF Global Equity Veld
Schrcder ISF Global Equity Yield
Schroder ISF Global High Meld
Schmder ISF Hong Kong Dollar Bond
Schroder ISF Strategic Bond
EUR 1.525829
EUR 1.522345
EUR 1531815 EUR 1.523529
EUR
EUR
EUR
EUR
USD
US0 USD USD
GBP
USD USD
USD
n m USD
Schroder ISF Asian Bond
Schrcder ISF Asian Bond
Schroder ISF Asian Bond
Schroder ISF Asian Bond EUR denominated
Schrcder ISF Asian Bond EUR Hedged
Schrodw ISF Emerging Europe Debt Absolute Returnca)
Schroder ISF Emerging Europe Debt Absolute Return(a)
Schroder ISF Emerging Europe Debt Absolute Return USD denominated(a)
Schroder ISF Emerging Markets Debt Absolute Returdw
Schroder ISF Emerging Markets Debt Pbsdute Returnlb)
Schroder ISF Emerging Markets Debt Absolute Return EUR Hedged@)
Schrcder ISF Emerging Markets Debt Absdute Return EUR Hedge@
Schrcder ISF Strategic Bond
Schroder ISF Aslan Bond
Schroder ISF Asian Bond
Schrodw ISF Asian Bond
Schroder ISF Asian Bond EUR denominated
Schroder ISF Asian Bond EUR Hedged
Schroder ISF Emerging Europe Debt Absollrte
Schroder ISF Emerging Europe Debt Absolute
Schroder ISF Emerging Europe Debt Absolute Return USD denomhated@l
Schroder ISF Emerging Markets Debt Absolute Returnlw
0.038040 USD USD O.Wl710
USD 0.037307 EUR 0.023996
EUR 0.425100
EUR EUR 0.048922
USD 0.076369
USR 0.092565 USD 0.1O5159
EUR 0.129548
EUR 0.135880
US0 0.387570
0.04am
USD
USD 0.035255
USD 0.031625 0.01 9966 EUR
EUR 0.360626
0.041 233 EUR
EUR 0.041260
USD 0.064524 USD 0.077609
la) Schroder ISF Emerging Europe Gebt Absolute Return was formerly known as Schrudsr ISF Conwyiry Europe Bond until 1 June 2008. ID) Schro3er ISF Ernergmg Markets Uebt Absolute Return was torrne<y known as Schroder ISF Emgrging MarKcts Dubt uiitil 1 June 2008.

Schroder International Selection Fund Semi-Annual Report June 2008 Page 25
Notes to the Financial Statements as at 30 June 2008 (cont) Dividends (cont)
Record Ex-Dividend Payment Dividend Date Date Date Fund Currency per Share
Schroder ISF Emerging Markets Debt Absolute Return@) USD 0.088844
Schroder ISF Emerging Ma&& Debt Absdute Refwn EUR Hedgedm EUR 0.108973 Schroder ISF Emerging Markets Debt Absolute Return EUR Hdged@') EUR 0.113410 Schroder ISF Japanese Equity Select(c) JPY 19.126088 Schrodw ISF Strategic Bond USD 0.423399
ef ISF Asian Bond USD O.WO574 USD 0.033731
ISF Asian k n d
er ISFAsian Bond EUR Hedged Schrcder ISF Asian Equity Meld
ISF Asian Equity Meld
ISF Asian Equity Meld
ISF Asian Local Currency Emd(a
ISF Asian Local Currency Band[@
ISF Emerging Europe Debt Absolute Returnbl EUR 0.040331
Rhmder 1SF Emerging Markets Debt Absolute Return@)
Schroder 1sF Emerging Markets DeM Absdute Returnjq
Schroder ISF Emerging Markets Debt Absolute Return EUR Hedgedm
Schrodw ISF European Dividend Maximiser
M r d w ISF European Dividend Maximiser
Schroder ISF European Dividend Maximiser EUR 1.475$&1
European Equity Yield
European Equity Meld US0 denominated
Global Dividend Maxlmiser
roder 1% Global Dividend Maxfmls
ISF Gl~bal Dlvidend ~axlmisw
ISF Global Dlvldbnd Maximiser GBP dbminated
ISF Global Dividend Maximlser SGD denwninated
Schroder ISF Global EQuity Yield USD 0.805871
ISF Global High Meld USD Cr 249875 ISF Hong b n Q Doll8 Bmd HKD 0.074689
US0 0.3001 70
(4 Schrodcr ISF Emerging Europe Debt Absolure Return was formerly known as Schroder ISF Converging Europe Bond iintil 1 June 2008 Schroder ISF: Emurging Markets Debt Absolute Rfiturn was formerly known as Schrnder ISF Emerging Markets Debt until 1 June 2008.
(4 Schroder ISF Japanese Equity Select was liquidated on 5 June 2008.

Page 26 Schroder International Selection Fund Semi-Annual Report June 2008
Notes to the Financial Statements as at 30 June 2008 (cont) Futures Contracts
Futures contracts are valued on 30 June 2008, which reflects the latest available price at close of business. The unrealised profit or loss is shown in the Statement of Net Assets. On 30 June 2008, the following Funds held open futures contracts:
Maturity Date Quantity Contract
Schroder ISF Japanese Equlty Sept 2008 83 Topix Index Future
Schroder ISF Japanese Large Cap
Sspt 2008 100 Toplx index Future
Schrader ISF Asian Total Return Jul2008 25 Hang Seng Stock IndexFuture
Jul2008 37 H-SHARES Index Future
sept 2008 12 SPI 200 Future
Schmder ISF Asian Equity Yield
Jul2008 216 Hang Seng Stock Index Future
Jul2008 298 H-SHARES Index Future
sept 2008 260 SPI 200 Future
Schmder ISF US Small 8 Mid-Cap Equity
sept 2008 186 E-mint SgP MidCap 400 Future
Schroder ISF US Smaller Companies
Sept 2008 162 Russell Mini Future
Schroder ISF North American Equity Sigma
Sept 2008 12 Nasdaq 100 Future
Sept 2008 5 S&P 500 Future
Schroder ISF Absolute Return Bond
sept 2008 39 Euro-BOBL Future
Sept 2008 1 Euro-Bund Future
Sept 2008 2 Euro-Schatt Future
Sept 2M)8 73 US 2 Year Note sept 2008 a7 US 5 Year Note
Sept 2008 109 US 10 Year Note Future
sept 2008 13 US Long Bond Future
Schrodw ISF Absolute Return Bond R1 Sept 2008 2 Euro-BOBL Future
Sept 2008 1 US 2 Year Note
sept 2008 9 US 5 Year Note
Sept 2008 4 US 10 Year Note Future
(Short)/ Unrealised Long Market AppreclatlorV
Currency posltlon Price (Depreci
JFY 859,081,104
JW 1,357,239,000 1.318.50 (38,739,000)
HKD (28,308,750) 22,120.00 M,465
HKD (22,334,250) 11,895.00 42.120
AUD (1,627,500) 5,193.00 68.886 USD !x447l
HKD (244,587,600) 22,120.00 729,777
HKD (180,915,800) 11,895.00 471,888
AUD (35,282,500) 5,193.00
USCI
US0 14,493,389 824.00
USD l814aSS)
USD
USD USD
EUR
EUA EUR
USD
USD US0
USD
EUR
USD
USD
USD
11,573,949 699.00 (250,149)
USD (250,149)
2,388,600 1,862.75 (1 53,300)
1,699,938 1,281.80 (97,888)
USD (250,988)
(3,184,775) 105.61 28,203 (1 11.900) 11 0.29 2.638
(205,874) 102.25 2.181
(1 5,377,953) 105.45 (1 8,203) (9,517,700)
(1 2,327,584)
(1,493,375)
(211,920) 105.61 1,119
(994,623) 110.35 1,359
(452,656) 1 13.75
USD 447
2 1 0,594 105.45 31 3

Schroder International Selection Fund Semi-Annual Reoort June 2008 Page 27
Notes to the Financial Statements as at 30 June 2008 (cont) Futures Contracts (cont)
Euro-BOEL Future
Euro-Bund Future
Eurc-Schatz Future
US 5 Year Note
US 10 Year Note Future
Euro-schatz FutOre ' US 5 Year Note
US 2 Year Npte US 5 Year Note
US 10 Year Note Future
US 5 Year Note
Sept 2008 10 US 10 Year Note Future
sept 2008 1 70 US Long Bond Future
er r$F Asian Bond
280 EureBund Future
Schroder ISF EURO Corporate Bond
Sept 2008 2 Euro-BOBL Future
(Short)/ Unrealised Long Market Appreciation/
Currency position Price (Depreciation)
EUR EUR
EUR USD
USD
EUR
EUR USD
EUR EUR
EUR
USD
US0
EUR EUR EUR
GBP
JPY
USD
USD
USD
USD USD
USD
USD
us0 USD
EUR
EUR
8,757,445 105.81 7,770 22,615,220 110.29 (5,770) (823,495) 102.25 5,535
(27,506,116) 11 0.35 (1 91,909)
(2,946,677) 11 3.75 (6,888)
(5,788,370) 107,58O,D&J
(36,347,367)
{4,117,476)
8,173,185
6 1 20,022)
(8,472,380) 105.61 37,796
4,310,442 1 10.29 (1 4,394)
102.25 5,453 1 225,671)
2.014,5m.m 135.45 163.1 36
34,773,750 105.45 25,781
(1,248,587) 110.35 C15,KQ) (10,839.oOo) 11 3.75 (81 ,030)
USD (184,W
30,348,030 105.45 14,275 15,521,669 I 1 0.35 (45,987)
(9,484,125) 11 3.75 (44,986) EUR (78,858)
21,191.438 11 0.35 327.1 17
1.130,938 11 3.75 6,563
(19,528.750) 115.64 (130,l 57) USD 209,523
(31,446,800) 110.29 891,470
USD 891,470
212,E43 105.61 (1,433)
EUR (1 ps3)

Page 28 Schroder International Selection Fund Semi-Annual Report June 2008
Notes to the Financial Statements as at 38 June 2008 (cont) Futures Contracts (cont)
Maturity Oate Quantity Contract
Schroder ISF Global Corporate Bond Sept 2008
Sept 2008
Sept 2008
Swt 2908 sept 2008 Sept 2008 sept 2008
8 P t 2m
2
5
4
1 19 7 33 3
Schwder ISF Global High Yield
Sept 2m 60
a p t 2008 141
Schmder ISF Strategic Bond
Sept 2008 658
Sept 2008 22 Sept 2008 38 Sept 2008 1.048
Sept 2008 1,032
Sept 2098 81 4
sspt 2008 102
Schroder ISF Strategic Credit Sept 2008 75
sept 2008 16
Sept 2008 40
Sept 2008 1
sept 2005 34
Euro-BOBL Future
Euro-Bund Future
EuroSchatz Future
Japan 10 Year Bond Future
US 2 Year Note
US 5 Year Note US 10 Year Note Future
US Long Bond Future
US5 Year Note
US Long Bond Future
Euro-Bund Future
Euro-Schatz Future
US 2 Year Note US 5 Year Note
U S 10 Year Note Future
US Long Bond Future
Euro-BOBL Future
Euro-Schatz Future
US 5 Year Note
US 10 Year Note Future
US Long Bond Future
Currency
EUR
EUR
EUR
JW
USD
USD
USD
USD
USD
US0
EUR
EUR
EUR
USD
USD
us0 USD
EUR
EUR
USD
USD
USD
(Short)/ Unrealised k n o Market Appreciation/
position Price (Depreciation)
(214,310) 105.61 4,888
558.869 110.29 (1 1,694)
(41 1,748) 102.25 4,362
134,300,Mx) 135.45 10,876
3,998,250 105.45 8,969
759,734 11 0.35 12,727
(3,733,438)
(344,625)
5,530,487
(1 6,197,376)
(69,798,l Bo) (2.481.800)
(3,911,602)
220,854,750
(1 14,150,667)
(91,891.051)
(11,717,250)
8,036,605 105.61 (1 16.230)
1.646.960 102.25 (1 1.040)
11 2,828 11 3.75 585
(3,905,750) 115.64 (16,516)
EUR (161,690)
(4384,920) 11 0.35 (1 8,489)

Schroder international Selection Fund Semi-Annual Report June 2008 Page 29
Notes to the Financial Statements as at 30 June 2008 (cont) Forward Foreign Exchange Contracts
Outstanding forward foreign exchange contracts are valued on 30 June 2008 by reference to the forward rate of exchange applicable to the maturity of the contracts. The unrealised gain or loss is shown in the Statement of Net Assets. On 30 June 2008, the following Funds were committed to outstanding forward foreign exchange contracts:
- , .I
Currency Sold
Dividend Maximlser
JW 4,740,543,800
EUR 501,704
USD 63,277,300 EUR 512,475
USD 14,598,600
us0 1,553,400
SGD 44,741
USD 13
USD 193.378
Us0 5,221 ,EO
GBP 4,931
SGD 39,996
USD 70,578.700
EUR 895,367
HKD 3,788,400
&JR 4,446
Unrealised Appreciation/
Maturity Date (Depreciation)
30-9epO8
30-Sep-08 I JPY
30-Sep-08
30-sapo8
USD
17.300
7-Jut-08 (1 89)
USD (291)
30-Sep-08 83,641
30-&p& 2,W7
USD 6,405,500
EUR 87,195
431,390 GBP 51,544 EUA 15,737
EUR (2,905)
USD 85,738
30-Sep-08 1,079
30-Sep-08 96 HKD 1,175
30-Sep-08 7,591
30-sep-08 204
USD 7.795
1 6-JuI-08 (2.W) 1 MUl-08 133
15-AI-08 (46)

Page 30 Schroder International Selection Fund Semi-Annual Report June 2008
Notes to the Financial Statements as at 30 June 2068 (cont) Forward Foreign Exchange Contracts (cont)
Currency Bought Currency Sold
Schroder ISF PEP Global Actlve Value
EUR 4,425,621 AUD
EUR 8,928,372 CAD
EUR 14,506,63a GBP
EUR 18,537.1 83 JW
EUA 6,l 06,358 SEK EUR 10,981,269 SGD
EUR 48,127,010 USD GBP 1,653,433 EUR
JPY 499,676,358 EUR
SEK 10,179,013 EUR SGD 1,489,519 EUR
USD 7.500,989 EUR
Schroder ISF North American Equity Sigma
us0 4.41 7,330 CAD
Schroder 1SF Absolute Return Bond
EUR 1,893,323 usa EUR 16,667,007 USD
GBP 1,455,253 USD
GBP 21,757.321 USD SEK 1,914,400 USD USD 7,991,874 EUR
USD 2,248,815 GRP
USD 320.000 SEK
Schroder ISF Absolute Return Bond R1
EUR 49,585 USD USD 63,203 EUR
Schroder B F Emerging Europe Debt Absolute Return
CZK 104,450,000 EUR
EUR 10,3Oo,oM1 CZK
EUR 7,500,003 HUF
EUR 14,137.41 6 HUF
EUR 5,000,000 PLN
EUR 5,618,539 PLN
EUR 1 ,m,om SKK
EUR 12,620,915 SKK
EUR 11.611 USD
EUR 5,900,009 USD PLN 5,900,000 EUR
SKK 26,000,000 EUR
7,295,238
13,821,656
11,543.657
2,994,311,093
56,830,465
23,368,690
75,286,670 2,079,026
3,046,299
1,085,727
705,265
4,844,798
4,362,767
3,111,623
26.1 17,200
2,848.1 32
42,944,600
375,290
5.084.957
1,142,CCO
1,914,400
77,700
41 ,ooO
4,263,253
259,848,304
1.914.M3O,OW
3,500,000.000 I 7,688,880
19,100,ooo
32,121,600
382.000,OOO 18,110
9,249,106
1,749,895
857.859
Maturity Date
I ~ - A U ~ - O B
18-Aug-08
18-AUg-oB
18-Aug-08 18-Aug-08
18-Aug-08
18-Aug-08
18-Aug-08
18-Aug-08
18-AUg-08
18-Au~-08
18-Aug-08
Unrealised Appreciation/ (Depreciation)
(6,896) 428,374
(1 18,330)
(1 1.3741
(1 10,464)
USD 1,480,024
18-AUg-08 121,478
USD
1 8-JuI-08
30-Sep-08
1 8-Jul-08
30-Sep-08
18-JuI-OB
1 8-JuI-08
1 8-JuI-08
1 8-JuI-08
129,717
2.935
(15.923)
(24,895)
1.777
USD 201,288
30-Sep-08 92
19-sep-08
us0
2-Jul-08 2-JUI-OB
5-Aug-08
9-sap-08
9-SepO8
19-Sep-08
7-JuI-08
25-Au~-08
9-Sep-08
2-Jut-08
1 1 -Aug-O8
19-Sep-08
i I 2,388
(585,817)
15,405
5,014
3,395
EUR (2,081,063)

Schroder International Selection Fund Semi-Annual Reoort June 2008 Page 3 1
Notes to the Financial Statements as at 30 June 2008 (cont) Forward Foreign Exchange Contracts (cont)
Currency Bought Currency Sold
der ISF Emer$ing Markets Debt Absolute Return Am 46,965,100 USD
OAR 55,142.000 USD
RUS 1,027,168,500 USD RUB 1,002,401,4Ms US0
RUB 722.250,ooO USD
13,M30,000
12,5M1,000
10,850,000
24,000,020
19,ooo,ooo 15,800.000
32,m.m
13,817,681
29,600,W 7,340,050
IT,MM,MM
19,800.Wo 11,000,ooo 18,500,000
15,300,000 58,7M),OOo
48,80,Mx3
40,000,000 21.00(1,000
18,500,000
22,000,000
40,000,000
105,M30,rx30
565,583 104.ooo,wo
i,890,716,9GU
378,865,600
15,7OO,Mx, 13,8M3,ooO 13,000,000 11,400,ooo
20,000,m 58,200,000
40,oM3,Mx3
32.000,Mx)
14,621,240
2a,ooo,m 25.000,000
6,700,000
15,800,003
43,700,000
42,000,000
Maturity Data . .
31-JuI-08
29-Sep-08 1 act-os
1 5 - k - 0 8 17-M~*09
27,-May-N
25-J~l-oB 30-SeP.08
2-oct-08
1 -Aug-o8 8-sep-08
1 I-sep-08 ZGSep-oB
20-NOV-08 20-NW-03 12-oec-08 22-Dec-08 2Q-Dec-08
4Jan-09
23-Jan-09
7-Feb-09
2-Apr-09
3-Apr-09
27-Apr-09
6-May-09 29-May-09
2-JuI-08
28-JuI-08
3-JuI-08
25-Rb-09 31-JuI-OB
17-Mm-09 2-AjW-09
27-May-09 28-Mw-W 25-Jut48 '
3cFSep-08
2-Qct-OB
28-May-09
9-kb-09 27-May-09 1 7-JuI-08
6-AuQ-08
Unrealised Appreciation/ (Depreciation)
(213,944)
(I 07,707)
@3,382)
(765,447) (637,015)
(334,010)
302,443
(375,144)
(296,356)
292,864
152,443
61 2
1,485,130 0,637
1,144.390
(1 ,041 ,851)
11,341 ,m) 199,290
(1b4.W
(561,849) (843,860) (836,732) (361,918)
44,427
(2,&02.431)
(1,155,582)
(361,918)
44,427
(2,&02.431)
(1,155,582)
(253.1 44)
(653,388) 96,433
713,899
30.000.000 15-Sep-08 735,357

Page 32 Schroder International Selection Fund Semi-Annual Report June 2008
Motes to the Financial Statements as at 30 June 2008 (cont) Forward Foreign Exchange Contracts (cont)
Currency Bought Currency Sold
Schmder ISF Emerging Markets Debt Absolute Return (cont) RUB
SAR
SAR SAR
SAR SAR
SGD
TWD
TWD
TWD
W D USD
USD
USD
USD
US0
USD
USD
USD
USD
USD
USD
USD
US0
USD
USD
VND
VND
VNQ
VND
VND
VND
1,605,912,750
88,764,500
72,540,W
38,413,850
49,846.250 5e,467,900
43,902,400
1,261,641,600
1,067,305,40(!
1.619.140.500
1,305,264,000
7,404,413
17,895,706
22,500,000
84,ooo.m 96,000,000
102,481,518
1,653,098
77,180,796
3,122,900
22 ,m,m 29,100,000
50,000,oocl
83,000,oW 76,000,000
76,000,000
32,276,000,003
209.346,840,000
69,204.000,OW
92,400,000,000
137,786,250,00(!
137,712,000,0M3
Schroder ISF European Absolute Return EUA 34,792,533
Schroder ISF EURO Bond
EUR 7,418,904
EUR 55,071,852
GBP 5,801,975
USD 35,497,365
Schmder I!% EURO Short Term Bond EUR 53,400.849
USD
USD
USD
USD
USD USD
USD
us0 USD
USD
USD
CNY
CNY
CNY
CZK CZK
EUR
EUR
EUR
EUR
HUF
KWD
PHP
PLN
PLN
PLN
USD
USD
USD
USD
USD
USD
CHF
GBP
USD
EUR
EUR
USD
Maturity Date
Unrealised Appreciation/ (Depreciation)
67,500,000
18,500,000
19,500,ooo
10,300,ooo
13,500,ooo
15,800,000
32,00O,OM1
42,600,CW
35.800.000
54.500,WO
42,600,000
51,086,750
122,308.200
1531 68,750
1,351,123,200
1,442,655,000
66,714.744
1,059,916
50.400,oM)
1.987.589
3,532,320,000 7,616,925
2,380,848.000
185,511,790
170.1 56,400
170,620.ooO
2,000,m
12,920,ooO
4,380,000
6,000,000
9.050.000
9,060,000
24-NOV-08 610,919
26-sep-08 {I 61,822)
1 -0ct-08 (1W968) 2-Oct-08 > (55,760)
4-Feb-09 (2802Q4
27-May-09
2-Oct-08 1 5-JuI-08
3-Sep-08
2-Oct-08 (743,4051
1 -Aug-o8
13-Nov-08
8-SEP-08
2ESep-08
2-Jul-08
25-hg-08 2-JuI-08 7-JuI-08
2-Sep-08
30-Sep-08 4,657
24-JuI-08 (1,531,355)
27-May-09 339,522 18-Jul-08 , 3,546,981 2-JuI-08 (4,712,467)
1 1 -AUg-o8 (3,695,278)
9-Sep-08 (3,704,979)
1 1 -Aug-08 (83.801)
17-Feb-09
13-Aug-08
9-Mar-09 (51 3,715)
1 2-Mw-09 (888,889) 13-Mar-09 (883,288)
USP (38
55.803.W 31 -Jul-C@ EUR
5,883,002 14-Aug-08 (13,530)
85.514.428 14-hg-08 8 9 4 3 6
731 5,973 1 4-AuQ-08 14,094
22$45,387 14-Aug-08 (373.073)
EUR 321,837
82,507,623 14-Aug-08 935,321
EUR 935,321
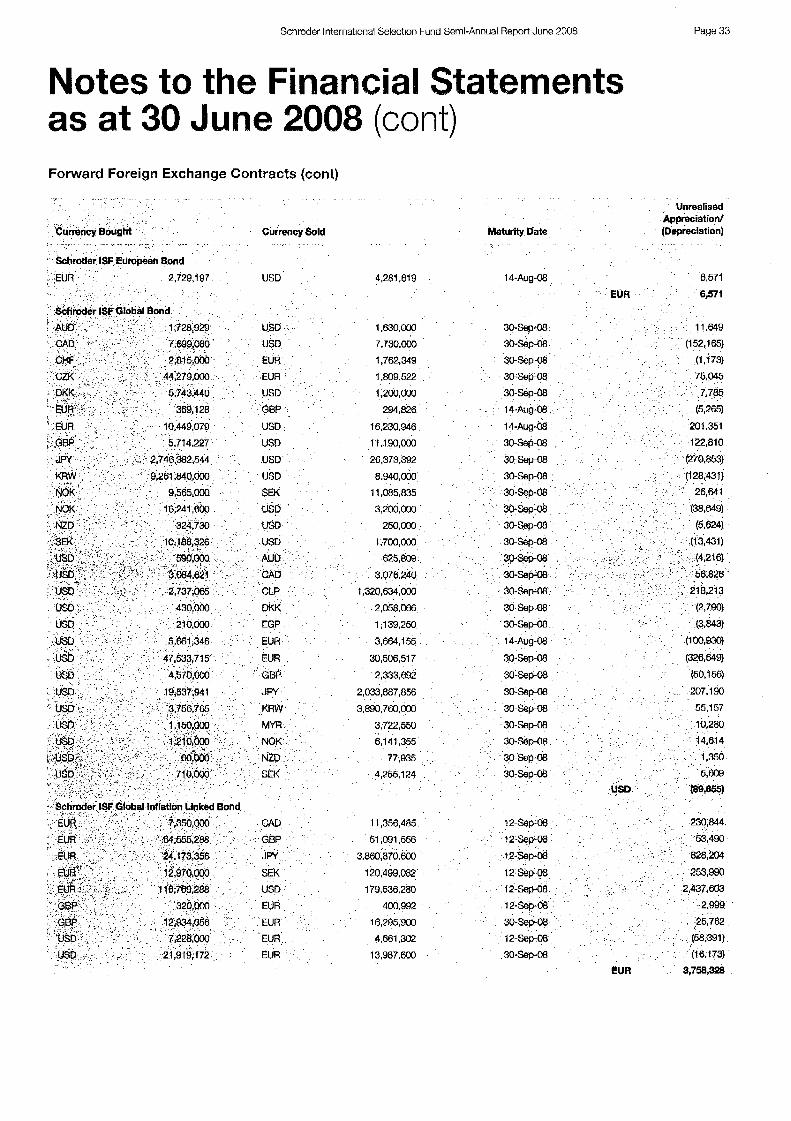
Schroder International Selection Fund Semi-Annual Report June 2008 Page 33
Notes to the Financial Statements as at 30 June 2008 (cont) Forward Foreign Exchange Contracts (cont)
Unrealised Appreciation/
Maturity Date (Depreciation) Currency Sold
4,281,610 14-Aug-08 6.571
EUR 6,571
1,630,MM 30-sep-08 7,730,000 30-Sep-08 1,762,349 3MeP-08 1,809,522 3usep-08
1,200,wo 30-Sep-t)B
284,826 14-AUg-oB
16,230,946 14-Aug-Ck
11.190,oOo 3wsep-08 26,373,392 3D-sep-08 . (270.853) 8,940,000
11,085,835
3,200,000 250,Mx) 3crsep-08
1.700,Mx) 3@seP-08
625,809 sip08 3,076,240
1,320,634,0133 30-Sep-08
2.058.066 30-%Po8 1,139,250 30.sep08
3,664,155 1 4-AUCJ-08
30,50651 7 3O.Sep-08 (326,649) 2,333,692 30-Sep-08 (50.1 56)
2,033,887,856 30-sep-08 3,890,760,m 30-Sep-08
3,722,550 30-Sep-08
6,141,355
77,935
4,255,124
1 1,356,485 51,091,556
3,860,870,600 12-sep-08
120,499,082 i79.536,2ao
400.992
16,205,900
4,881,302
13,967,600 30-Sep-08 (1 6,173) EUR 9,758,328

Page 34 Schroder International Selection Fund Semi-Annual Report June 2008
Notes to the inancia Statements as at 30 June 2008 (cont) Forward Foreign Exchange Contracts (cont)
Currency Bought Currency Sold
Schroder ISF US Dollar Bond EUR 1 13,657 USD
Schroder ISF Asian Bond
EUR 3,000,000 USD
EUR 16,367.&E USD
GBP 27.814 USD
SGO 19,703 USD
USD 487,838,850 EUR
USD 14,641 EUR
USD 124,721,207 KAW USD 133,570,793 MYR
USD 122,833,147 MYR
USD 130,627,032 PHP
US0 168,257,800 SGD
US0 234,004,m SGD
USD 180,742,470 TWD
Schroder ISF Asian Local Currency Bdnd
CNY 120,~0.000 USD
SGD 500,000 USD
SGD 19,567 US0
7HB 10,000,000 USD
TWD 140,000,OM) USD
USD 8,908,823 MYR
USD 13,526,358 SGD USD 8,351,376 THE
Schroder ISF EURO Corporate Bond EUR 2.300.1 15
EUR 3,610,775
GBP 1,378,462
USD 3,964,840
Schmder I S F Global Corporate Bond
EUR 437,000
EUR 4,424,186
GBP 346,879
JPY 69,300,000
USD 9,454,393
us0 3,847,595
USD 870,000
GBP
USD
EUR EUR
USD
USD
USD USD
EUR
GBP
JPY
Unrealised Appreciation/
Maturity Date (Depreciation)
4,671,300
25,848,100 54,900
14,MK)
315,000.000
9,387
128,000,000,000
435,oOo,M30
400.000.oM)
B.Mx),000,000 230,000,OM)
320,000,000 5.450,000,M30
178,100 30-Sep-08 21 1
17,306,me
m , m
14,400
307.598
4,537.752
29.M30.000
18,500,000
2 7 0,030, OOO
1,821,022
5,664,656
1,743,950
2.578,714
684.785
6.932.700
684,144
649,679
5 . 9 8 7 . e ~
1.957.1 78
86,807,817
9-sep-08
18-sep-08
19-sep-08
11 -Sep-oa 1 E-JuI-08
23-Jul-08
24-Sep-08
13-Aig-08
1 8-JuI-08
30-Sep-OB
13-Aug-08
1 5-AUQ-08
19-Sef3-08
18-JuI-08
I ~ - A u ~ - o ~
21-JuI-08
30-ap-m
30-Sep-08
30-Sep-08
21-Jut-08
7-Jd-08
USD
2,070
47
(9,894)
88.369
30,452
(85,498)
313,378
USD 629,049
14-Aug-08 (1,276) 14-AUg-08 - 8,694 14-AUg-08 (2.437)
1 4-Aug-08 (44,806)
EUR (39,8251
1 8-Jul-08 3.404 30-*-08 8.216
1 8-JuI-08 6,487
1 8-JuI-OB 6,314
18-JUl-08 24,657
18-Jut-08 (49,128)
18-JuI-08 4 a . m
USD 48,229

Schroder International Selection Fund Semi-Annual Report June 2008 Page 35
Notes to the Financial Statements as at 30 June 2008 (cont) Forward Foreign Exchange Contracts (cont)
Unrealised Appreciation/
Currency Bought Currency Sold Maturity Date (Depreciation)
Sehrader ISF Qiobal High Yield
EUR 3,013,365 USD 4,874,812 14-Aug-08 64,027 186,401,400 30-S e p -08 220,899
36.628,985 14-Aug-08 (1 79,394)
427,128 30-Sap-08 1 ,ooo 1.485,94? 14-Aug-08 (22,834)
Usp 603,448
M)7,259.300 30*sec)-08 71 5.s5
89,550,203 2 r n . a ~
2aBo62,46r 473,574
91 ,m,ooo 5,5op,oQo 63,oM).000
138,963,ooO 30-Sep-08 419.740
1,993,619
1,895,000 3,700,000 I4,000,oao 1 ,m,OOo
22,421,900 850,000
5,063,800 EUR 3,250,000 29-hg-08 (43,372)
450,000
2,500,000 376,wO.OOo
26,505.000 12-sep-08 11 g,438
26,505,030 EUR 18,998,263 12-sap-08 (1 19,438)
EUR

Page 36 Schroder lriternational Selection Fund Semi-Annual Report June 2008
Notes to the Financial Statements as at 30 June 2008 (cont) Interest Rate Swaps
In order to hedge against interest rate fluctuations, the Company may enter into iiterest rate swaps provided:
a) The commitments deriving therefrom do not exceed the value of the relevant assets to be hedged; and b) The total amount of such transactions does not exceed the level necessary to cover the risk of the fluctuation of the value of the assets
concerned.
Such contracts must be denominated in the currencies in which the assets of such Fund are denominated, or in currencies which are likely to fluctuate in a similar manner and must be either listed on an exchange or dealt in on a Regulated Market.
Interest rate swaps were valued on 30 June 2008 at their intrinsic value, The valuation method involves a current value of each interest rate and capital series converted into the currency of the Fund on the closing date, The result of these revaluations together with any interest receivable/payable in relation to interest rate swaps on 30 June 2008 is shown in the Statement of Net Assets under ‘Unrealised appreciation/ (depreciation) on interest rate swaps’.
On 30 June 2008, the following Funds were committed to interest rate swaps:
Descriptibn
Schroder ISF Absolute Return Bond Pey fixed rate 5.065% Receive floating rate GBP LIBOR 8 Months
Pay fixed rate 5.1 15% Recsive floating rate EUR EURIBOR 6 Months
Pay fixed rate 6.1 05% Receive flbating rate GBP UBOR 6 Months Rece‘Ne fixed rate 4.5225% Pay floating rate USD LIBOR 3 Months
Recehle fixed rate 1.58% Pay floating rate JPY LIBOR 6 Months
Schroder ISF Absolute Return Bond R1
Pay fixed rate 5.065% Recelve floating rate GBP LIBOR 6 Months
Pay tixed rate 5.1 1 5% Receive floating rate EUR EURIBOR 6 Months
Pay fixed rate 6.105% Receive floating rate GBP LIBOR 6 Months
Receive fixed rate 4 5225% Pay floating rate USD UBOR 3 Months
Receive fixed rate 1.58% Pay floating rate JPY LIBOR 6 Months
Schroder ISF Global Bond
Pay fixed rate 5.065% Receive floating rate GBP LIBOR 6 Months
Pay fixed rate 5.065% Receive floating rate GBP LIBOR 6 Months
Pay fixed rate 5.66% Receive floating rate GBP LIBOR 6 Months
Fay fixed rate 5.1 15% Receive floating rate EUR EURIBOR 6 Months
Pay fixed rate 6.1 05% Receive floating rate GBP LIBOR 6 Months
Receive fixed rate 4.5225% Pay floating rate USD LIEOR 3 Months
Receive fixed rate 1.58% Pay floating rate JPY LlROR 6 Months
Unrealised Maturity Appmia tiad
Nominal Currency Date
5,275,000 GBP 20-MWIO
2,3M).oOO EUR
1.870.Mx3 GBP
51 1,303 USD 26-Jun-13 (5.441)
JPY 26-Jun-13 (21,322) 727,000,000
US0 (195,m)
870.000 GBP 26-Fsb-10
158,CCQ EUR 26-Jun-13
128,030 GBP 24-Jun-13
35,100 usu 26-Jun-13
8,920,000
4,130,000
2,900,000
4,200,000
3,410,000
933,000
1,330,000,000
49,8M3,000 JPY
USD
GBP 25-Feb-10 (31 7,814)
GEP 24-Mar- 7 0
GBP 21-May-10
EUR 26-An-13
GBP 24-Juri-13
us0 26-Jun-13
JPY 28-Jun-13
USD
(158,4l Q)
(44,432)
27,686
33,429
(9,933)
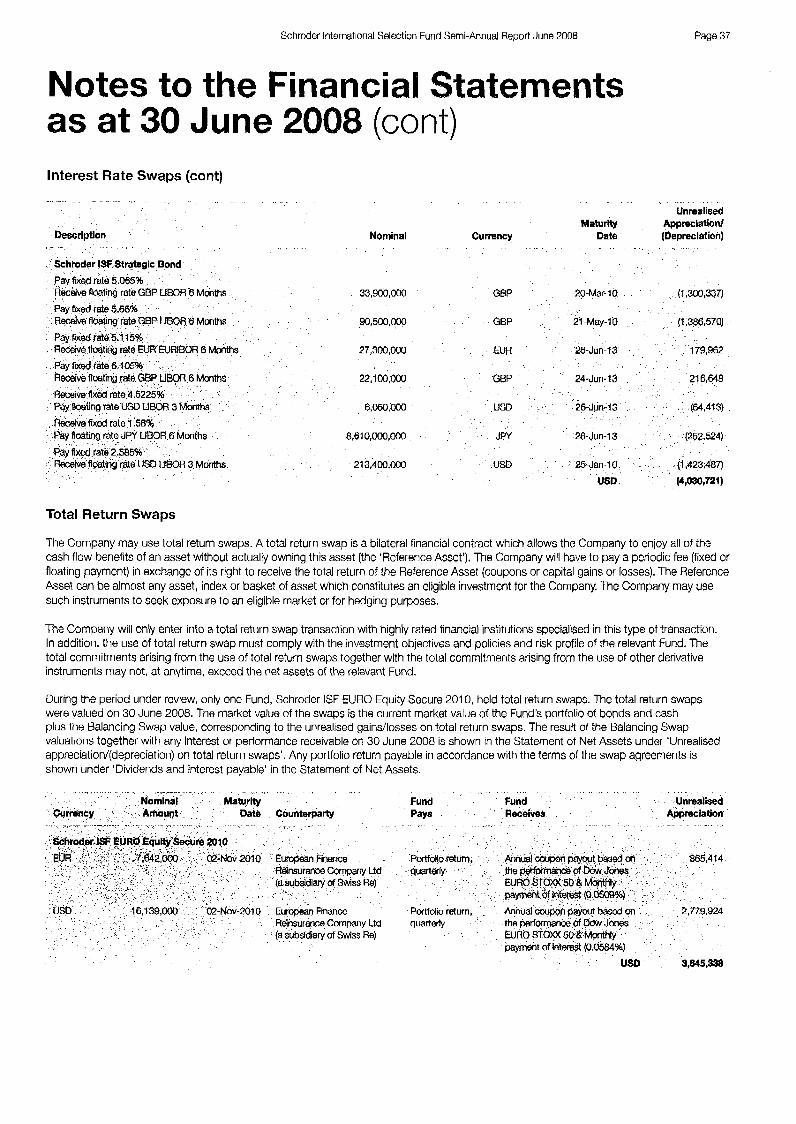
Schroder International Selection Fund Semi-Annual Report June 2008 Page 37
Notes to the Financial Statements as at 30 June 2008 (cont) Interest Rate Swaps (cont)
Description
Schmder ISF Strategic Bond
Pay fixed rate 5.065% Rkeive floating rate GBP LlBOR 8 Months
Pay flxed rate 5.66%
URlBOR 6 Months
Unrealised Maturity Appreciation/
No rn i n a I Cumncy Date (Depreciation)
33,900,000 GBP 20-Mar-IO (1,300,337)
90,500,000 GBP 21 -May-10 (1,386,570)
27,300,003 EUR 25-Jun-13 179,962
22,1M3,ooO GBP 24 Jufl-13 216,648
6,050,000 USD 26-Jun-13 . (64,413)
8,61O,(xM,oOO JPY 26-Jun-13 (252.524)
213,4CQ,oOO USD &Jan-10 (I ,423,487)
USD (4,030,721)
Total Return Swaps
The Company may use total return swaps. A total return swap is a bilateral financial contract which allows the Company to enjoy all of the cash flow benefits of an asset without actually owning this asset (the ’Reference Asset’). The Company will have to pay a periodic fee (fixed or floating payment) in exchange of its right to receive the total return of the Reference Asset (coupons or capital gains or losses). The Reference Asset can be almost any asset, index or basket of asset which constitutes an eligible investment for the Company. The Company may use such instruments to seek exposure to an eligible market or for hedging purposes.
The Company will only enter into a total return swap transaction with highly rated financial institutions specialised in this type of transaction. In addition, the use of total return swap must comply with the investment objectives and policies and risk profile of the relevant Fund. The total commitments arising from the use of total return swaps together with the total commitments arising from the use of other derivative instruments may not, at anytime, exceed the net assets of the relevant Fund.
During the period under review, only one Fund, Schroder ISF EURO Equity Secure 201 0, held total return swaps. The total return swaps were valued on 30 June 2008. The market value of the swaps I S the current market value of the Fund’s portfolio of bonds and cash plus the Balancing Swap value, corresponding to the unrealrsed gainsllosses on total return swaps. The result of the Balancing Swap valuations together with any interest or performance receivable on 30 June 2008 is shown in the Statement of Net Assets under ‘Unrealised appreciation/(depreciation) on total return swaps’. Any portfolio return payable in accordance with the terms of the swap agreements is shown under ‘Dividends and interest payable‘ in the Statement of Net Assets.
Unrealised Fund Fund Pays Receives Appmlatlon
n, any Ltd ss Re)
Portfolio return, Reinsurance Company U d quartrterty (8 subsldiaiy of Swiss Re)
payment of interest (0.0584%) USD 3,845,838

Page 38 Schroder International Selection Fund Sern-Annual Report June 2008
Notes to the Financial Statements as at 30 June 2008 (cont) Credit Default Swaps
The Company may use credit default swaps in order to hedge the specific credit risk of some of the issuers in its portfolios by buying protection. In addition, the Company may, provided it is in the exclusive interests of its Shareholders, buy protection under credit default swaps without holding the underlying assets provided that the aggregate premiums paid together with the present value of the aggregate premiums still payable in connection with credit default swaps previously purchased and the aggregate premiums paid relating to the purchase of options on transferable securities or on financial instruments for a purpose other than hedging, may not, at any time, exceed 15% of the net assets of the relevant Fund.
Furthermore, provided it is in the exclusive interest of its Shareholders, the Company may also sell protection under credit default swaps in order to acquire a specific credit exposure. Such mechanism is set out in more detail in the Company's current prospectus.
The aggregate commitments of all credit default swaps will not exceed 20% of the net assets of any Fund, unless otherwise provided for in the investment policy of a specific Fund.
The total commitments arising from the use of credit default swaps together with the total commitments arising from the use of other derivative instruments may not, at anytime, exceed the value of the net assets of the relevant Fund.
The Company will only enter into credit default swap transactions with highly rated financial institutions specialised in this type of transaction and only in accordance with the standard terms laid down by the International Swaps and Derivatives Association. In addition, the use of credit default swaps must comply with the investment objectives and policies and risk profile of the relevant Fund.
Credit default swaps were valued on 30 June 2008 at their intrinsic value. The valuation method involves the current value of the interest-rate series and the current value of the credit spread traded on the market at the closing date. The result of these revaluations, together with any interest receivabldpayable related to the credit default swaps on 30 June 2008, is shown in the Statement of Net Assets under Credit default swaps at market value. On 30 June 2008, the following Funds were committed to credit default swap agreements:
Protection Position Description
Schroder I S Absolute Return Bond
Ace INA 8 875% 15/08/2029
Ace INA 8 875% 15/68/2029
Ace INA 8.875% 15/08/2029
Adecco Financial Servcce Bermuda 0% 26/08/2013
Alcoa 5.375% 15/01/2013
AKOW flectrmtcs 6.875% 01/06/2018
Arrow El&Wonics 5.875% 01/06/2018
Autozme 5.875% 35/lWZO12
Autozone 5.875% 15/10/2012
Aviva 9.5% 2Q/o8/2018
BWA Senior Finance SAU 4% 22/04/2013
Black& Decker 7.12596 01/06/2011
Black & Decker 7.125% 01/06/2011
Brazilian Government International 12.25% 06/03/2030
Brazilian Government International 12.25% 06/03/2030
Carnival 8.65% 15/01/2028
Carnival 6.65% 15/01/2028
Casino Guichard Perrachon 6% 27/02/2012
CBS 4.625% 151oma1a CDX EM Series 9 20/06/2013
CDX EM Series 9 20/06/2013
CDX NA IG Series 8 20/06/2012
Currency
USD
USD
USD
EUR USD
USD USD
USD
USD
EUR
EUR
USD
USD
USD
USD
USD
USD
EUR
USD
USD
USD
USD
Nominal Amount
63,278
375.000
25,625
300,000
140,625
63.278 25,625
63,276
25.625
125,000
125,000
83,276
25,625 1.41 0,000
300.000 63,276
25,625
125,000
325,000
270.000
7,630,MM
160,000
Interest paid I Maturity Market tqceived % Oate
0.35 20-Dw-201 4 2,541
0.48 20-Jun-2013 898
0.58 20-Dee2013 (44) 2.12 20-DK-2013 (26,231)
1 .M) 20-Dw-2013 23
0.59 20-Dec-2014 1,682
0.76 20-Dsc-2019 89
0.50 20-OK-2014 3
0.78 20-Dec-2013 223 1 .IO 20-Juri-2013 (651)
0.80 20-Jw-2013 (51 3) 0.67 20-DW-2Qt4 3.391 1.M 2CkDec-2013 275
1.74 20-Mx-2013 (45,187)
1.45 20-Apr-2013 (5,124)
0.50 20-Dec-2014 5,803
1 .C4 20-DE-201 3 492
1 .EO 20-Jun-2013 2.379 1.02 20-Jun-2017 11,025
2.65 20-Jun-2013 (1,200) 2.65 20-Juri-2013 (35.620) 0 35 20-Jun-2012 7,015

Schroder International Selection Fund Semi-Annual Report June 2008 Page 39
Notes to the Financial Statements as at 30 June 2008 (cont) Credit Default Swaps (cont)
Protection Nominal Interest paid I MaturlQ Market Position Description Currency Amount received % Date Value
USD 45,000 0.72 20-MX-2012 1 ,308 EUR 125,OOD I .56 20-Jun-201 8.9%
USD 135,000 1 .I 7 20-Jun-201 (9,067)
USD 2,220,000 0.35 17-Feb-2051 173,806
us0 03,276 Q.42 20-Ow-2014 1,345
USD 25,826 (W USD 140.625 1,364
USD 83,276 ’ 866 usu 0.50 20-DeC-ZM3 I 9
USD EUR
USD USD
EUR
EUR EUR 7 2oSep-2013
USD
USD USD
US0 US0
USD
USD
USD 14b.626 0.42 20-Dee201 3 285
anal 5.7% 15/03/2036 Us0 03,276 0.37 211-DeC-2014
USD 25,625 0.42 20-OeC-2
EUR 125.ooO 1.30 20-Jun-2
USD USD 2.62 2(rJUn-2
USD 2.15 20-bC-201
USD 1.04 ~ O - O ~ C - ~ O I EUR 0.62 20-Jun-2013
USD 4.18 ~ o - D ~ c - ~ o I ~
USD EUR
USD
USD USD
EUR USD
USD U$D
USD
USD USD 1.41 0,W 1.46 20-MX-2013 30,869
sell Mexico Govetment Intematmnal7.5% 08/04/2033 USD 820,oOO 1.25 20-Apr-2013 7.045
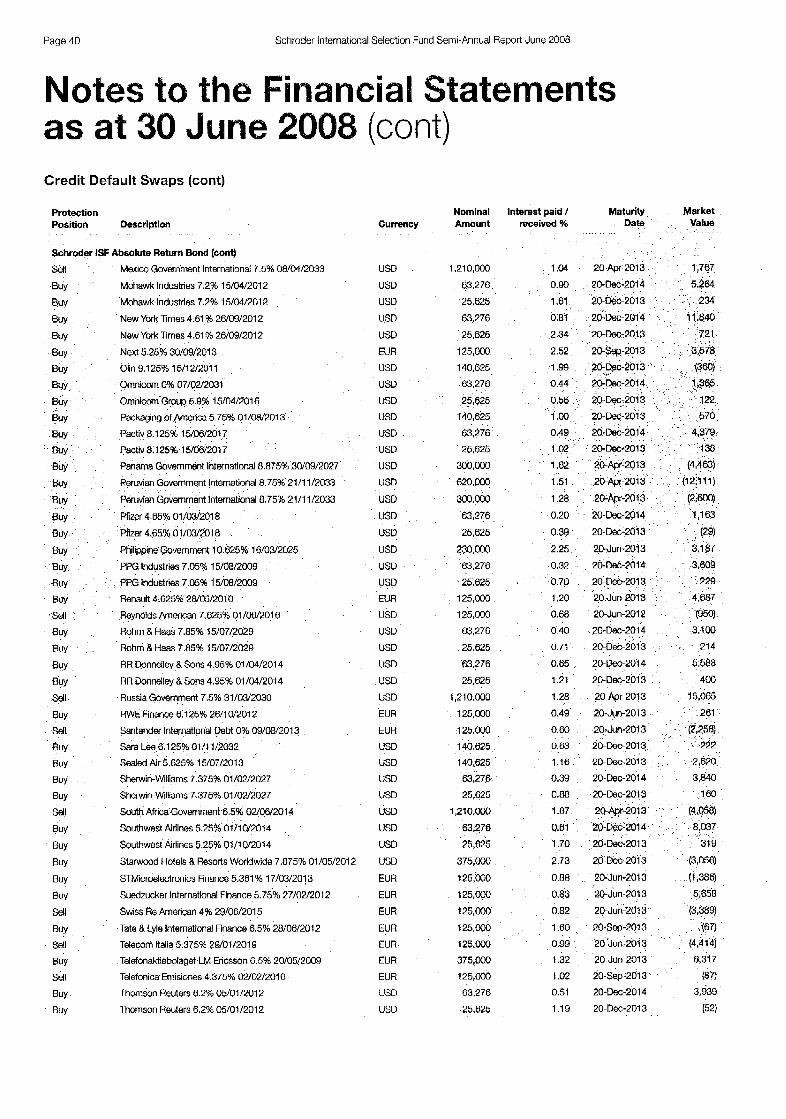
Page 40 Schroder International Selection Fund Semi-Annual R ~ p ~ r t June 2003
Notes to the Financial Statements as at 38 June 2008 (cont) Credit Default Swaps (cont)
Protection Position Descriptlon
SchrodN ISF Absolute Return Bond (cont) Mexico Government International 7.5% 08/04/2033
Mohawk lndustnes 7.2% 15/04/2012
Mohawk Industries 7.2% 15/04/2012
New York Times 4.61 % 26/09/2012
New York Times 4.61 % 26/09/2012
Next 5.25% 30/09/2013 Olin 9.125% 15/12/2011
Ornnicom 0% 07/02/2031
Ornnicom Group 6.9% 15/04/2016
Packaging ofAmerica 5 75% 01/08/2013
Pactiv 8.125% 15/0@2017
Pactiv 8,125% 15/06/2017
Panama Government International 8.875% 30/09/2027
Peruvian Government International 8.75% 21/11/2033
Peruvian Gwernment International 8.75% 2111 1/2033
Ptizer 4.65% 01/03/2018
Ptizef 4.65% 01/03/2018
Philippine Government 10.625% 16/03/2025
PPG Industries 7.05% 15/08/2009
PPG Industries 7.05% 15/08/2009
Renault 4.625% 28/05/2010
ReynMds American 7.625% 01/06/2016
Rohm & Haas 7.85% 15/07/2029
Rohm & Haas 7.85% 15/07/2029
RR Donnelley & Sons 4.95% 01/04/2014
RR Donnelley 8 Sons 4.95% 01/04/2014
Russia Government 7.5% 31/03/2030
RWE finance 6.1 25% 26/1 a201 2
Santander International Debt 0% 09/08/2013
Sara Lee 6.125% 01/11/2032
Sealed Air 5.625% 15/07/2013
Sherwin-Williams 7.375% 01 /02/2027
Shewn-Williams 7.375% OI/M/2027
South Africa Govwnment 6 5% 02/06/2014
Southwest Airlines 5.25% 01/10/2014
Southwest Airlines 5.25% 131/10/2014
Starwood Hotels & Resorts Worldwide 7.875% 01/05/2012
STMicroslactronics Finance 5.361 46 17/03/2013
Suedzucker International Finance 5.75% 27/02/2012
Swss Re American 4% 29/06/2015
Tate &Lyle International Finance 6.5% 28/06/2012
Telecom ltalia 5.375% 29/01/201 g
Telefonaktiebolaget LM Encsson 6 5% 20/05/2009
Telefonica Emisiones 4.375% 02/02/2016
Thomson Reulers 6 2% 05/01/2012
Thomson Reuters 6.2% 05/01/2012
Nominal Interest paid / Maturity Market Currency Amount received YO Date Value
USD USD USD
USD USD EUR USD
usa USD USD USD USD US0 USD USD
USD USD
USD usa USD EUR
US0 USD USD USD USD USD
EUA EUR USD USD
USD USD
USD USD USD
USD
EUR EUR EUR EUR EUR EUR EUR
USD
USD
1.21 0 , m
63,276
25,625
63,276
25,625
125,ooO
140.625
63,276
25,625
i40,625
63,276
25,625
300,000
620.000
303,000 63,276 25,625
230.000 63,278
25,625
125,ooO
125,000
63,276
25.625
63.276
25,625
1,210.M30
125,000
125,OOO
140.625
140.625
63,276
25,625
1,210.000
63,278
25,625
375.m
125,MO 125.000
125,oM)
125,ooO
125.000
375,000
125,ooO
63,276
25.625
1 04 20-Apr-2013 1,367
0.90 20-Dec-2014
1.61 20-Dee-2013 0.85 2a-~ec-2014
2.34 2 0 - k - 2 0 1 3
0.49 20-Dec-2014
(4,463)
(12,111)
( 2 . W 0.20 20-k-2014 1,163
(29) 0.39 20-Oec-2013
2.25 20-Jun-2013 3.187
0.32 20 -k -2014 3
0.70 20-Oec-2
1.20 20-Jun- 4.687
0.68 20-Jun-2012 (950) 0 40 2Q-k-?014 3.100
0.71 ~ o - o ~ c - ~ o I ~ 214
0.65 20-Oec-2014 5,588 1.21 2BDec-2013 4w 1.28 2BApr-2013 15,065
0.49 20-Juri-2013 281
0.60 20-dun-2013
0.63 20-Dec-2013 1.18 ' '20-b~-2013 2,620
0.39 20-D~c-2014 3,840
0.88 20-Dec-2013
1.67 2Mpr-2013
Q.61 20-Dw-2014 ,
1 70 20-0~+2013
2.73 20-IhC-2013 (3,058) 0.88 20-Jun-2013 (1,388) 0.83 20-Jun-2023 5,658
0.82 2CJun-2013 (3,389) 1 60 20-Sep-2013 (67)
0.99 2BJun-2013 (4,414)
1.32 20-Jun-2013 631 7
1.02 20-Sep-2013
0.51 20-Dec-2014 3,939
1 . I9 20-Dee2013 (52)
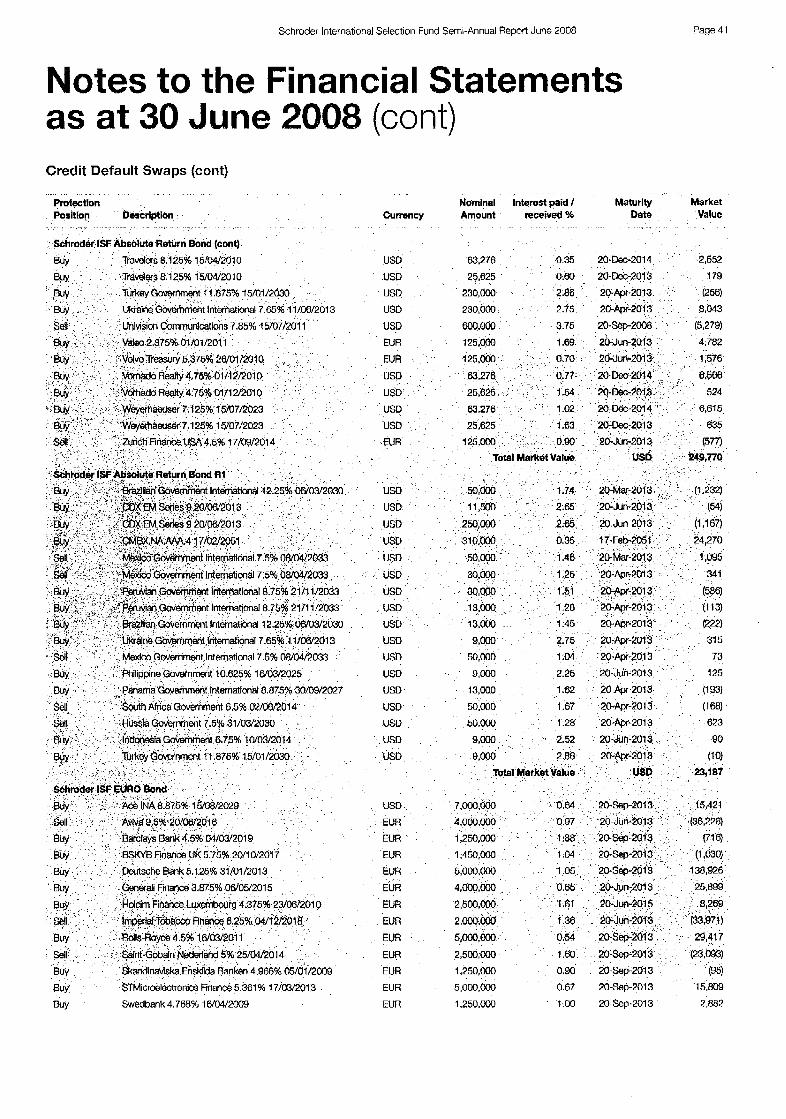
Schroder International Selection Fund Semi-Annual Report June 2008 Page 41
Notes to the Financial Statements as at 30 dune 2008 (cont) Credit Default Swaps (cont)
Protection Position bescriptian
.. . .
velers 8.125% 15/04/2610
nt 6.5% U2/06/2014
75% 20/1 01201 7
Bank5.12596 31/01/2013
ance 3.875% 08/05/2015
Microelectronics Finant% 5 361 46 17/03/2013
BUY Swedbank 4.768% 16/04/2009
Currency
USD
USD
USD
USD
USD
EUR
EUR USD
USD
USD
US0
EUR
USD
USD USD
USD USD
USD
US0
USD
USD USD USD USD
usa USD
USD
USD
USD
EUR
EUR
EUR
EUR
EUR
EUR
EUR
EUR EUR EUR
EUR
EUR
Nominal Interest paid / Maturity Market Amount received % Date Value
83,276 0.35 20-Dec-2014 2,652
25.625 0.60 20-Dee-2013 179
230,O 2.88 20--2013 230,OCQ 2.75 20*-20 BOo.M30 3.75 20-Sep-2
1.69 2OdUn-2
13,000 1.62 2&pPr-2013 (1 93)
50,000 1.67 20-Apr-2013 (1 w 50,000 1.28 20-Apf-2013 623
1.04 20-sep-20
5,000,000
2,500,000
5,0M).oM) 0.67 20-Sep-2013 15.809
1,250,030 1 .OO 20-Sep-2013 2.882

Page 42 Schroder International Selection Fund Semi-Annual Report June 2008
Notes to the Financial Statements as at 38 June 2088 (cont) Credit Default Swaps (cont)
Protection Position Description
Schmder ISF EURO Bond (cont)
BUY
BUY UPM-Kymmene 6 125% 23/01/2012
Schmder ISF Global Bond
Tetefonaktiebolaget LM Ericsson 6.5% 20/05/2009
BUY A C ~ INA a m % 15/0~2029
BUY Alcoa 5.375% 15/01/2013
BY Arrow Electronics 6.875% 01/06/2018 Buy Autotone 5.675% 15/1 W2012
BUY BUY Carnival 6.65% 15/01/2028
BUY
Buy Buy CMBX.NA.M.4 17/02/2051
BUY
&ly Commercial Metals 6.75% 15/02/2009
BUY ConAgra Foods 7% 01/10/2028
Buy Oeere 5.95% 25/04/2014
BUY bell 7.1% 15/04/2028
Buy Dow Chemical 7.375% 01/11/2029
BUY FedEx 7.25% 15/02/2011
BUY Buy Home Depot 5.875% 16/12/2036
Buy Honeywell lntwnational5.7% 15/03/2038
BUY
BUY Kraft Foods 5.25% 01/10/2013
BUY Lowe's 8 25% 01/08/2010
BUY Mack-Cali Realty 7.75% 15/02/2011
Black 8. Decker 7.125% 81/06/2011
CDX EM Series 9 20/06/2013
COX EM Series 9 20/08/2013
Coca-Cola Entwpnses 6.1 25% 15/08/2011
Goodrim 7.625% 1511 21201 2
lntemationa Paper 5 85% 30/10/2012
Marriott International 4.625% 15/06/2012
Masco 5.875% 15/07/2012
Mohawk Industries 7.2% 15/04/2012
New Yak Times 4.61 % 28/09/2012
Olin 9.125% 15/12/2011
Omnicom Group 5.9% 15/04/2016
Packaging of America 5.75% 01/08/2013
Pactiv 8.1 25% 15/06/2017
Pflzer 4.65% 01/032018
PPG lndustrics 7.05% 15/08/2009
BUY
Buy BUY Sara Lee 6.125% 01/11/2032
BUY Sealed Air 5.625% 15/07/2013
BUY Sherwin-Williams 7.375% 01/02/2027
BUY Swthwest Airlines 5.25% 01/10/2@14
Rchm & Haas 7.85% 15/07/2029
RR Donndley &Sons 4.95% 01/04/2014
Nominal Interest paid I Maturity Currency Amount received % Date
EUR
EUR
USD
USD
USD
USD
USD
USD
us0 USD
USD
USD
USD
USD
us0 USD
USD
USD
USD
USD
USD
USD
USD
USD
USD
USD
USD
USD
USD
US0
USD
. USD
USD
USD
USD
USD
USD
USD
USD
USD
USD
Market Value
5,603,000 1.40 20-Sep-2013 48,596 5,oM3,000 2.63 2C-Sep-2013 142,028
Total Market Value EUR 332,114
170.1 25 0.58 2 m e ~ 2 0 1 3 (302)
1 78,l 25 1.03 20-D~-2013 ~ 29
i78,125 0.76 20-Dec-2013 627
178.1 25 0.78 20-h-2013 1,556
178,125 1.M) 20-0%-20
1.04 20-Dec-2013 178.1 25 1 ,42O0,0M3 2.65 20-Jun-2013
5,080,000 2.85 20-Jun-2013
7,740,WO 0.35 17-F8b-2051 178,125
178.125
178,l 25 0.48 20-k-2013
178,125 0.50 20-k-2013
178,125
178,125 0.62 20-OeC- 178.125
178,l 25
178,125 178,125 0.42 20-Dec-201 3 178,125 2.15 20-Dec-2013
178.125 1 .w 20-Dec-2013
178,125 0.62 20-Dee2013 376
178.126 i .ai 20-~~-2013 2,068
178,125 1.53 20-Dec-2013 7,552
178,125 1.99 20-Dec-2013 5,215
178,125 1.61 20-Dw-20 1,825
178,125 2.34 20-Dec-20 5,009 17a,iz5 1.99 20-De~-2013 , (442)
851 178,125 178.125 1 .oO 20-DW-2013 730
178,125 1.02 20-De~-2013 958
(199) i7a,125
178,125 0 71 20-Dec-2013 I ,485
0.56 20-D~-2013
0 39 20-Da-2013
178,125 0.70 20-k-2013 1,592
178,125 1.21 20-De~-2013 2,780 178,125 0.63 20-DeC- 285
178,125 1.16 20-Oec-2013 3,330
178,l 25 0.88 20-Dsc-2013 1,115
178,125 1.70 20-Dec-2013 2,233

Schroder International Selection Fund Semi-Annual Report June 2008 Page 43
Notes to the Financial Statements as at 30 June 2008 (cont) Credit Default Swaps (cont)
" . .
6 2% 05/01/2012
125% 1 W0712023
Nominal Interest paid I Maturity Market Currency Amount received % Date Value
USD 178,125 1 .I9 20-Dec-9013 (351)
USD 1 78.1 25 1.54 20-Dsc-2013 3,654 USD 178,125 , 1.83 20-b2013 4.431
Total Market Value WSD 840,190
US0 170,125 0.60 2c-oec-2013 1,250
USD
USD
USD
USD
USD
us0
USD 4,400, 3,356
EUR
EUR EUR
EUR
EUR EUR
EUR
EUR
EUR
EUR 750,m 0.90 2o-sep-2013 (57) EUR
EUR
ElJR
EUR
US0 USD ' US0 EUR
USD 1.90 20-Dec-20
US0 0.59 20-Dw-20
USD i7,5w 0.78 20-LkG20
USD 12.688 050 20-Dee-2014 681
USD 17,500 0.78 26+0e~-2013 152

Page 44 Schroder International Selection Fund Semi-Annual Report June 2008
Notes to the Financial Statements as at 30 June 2008 (cont) Credit Default Swaps (cont)
Protection Nominal interest paid I Maturity Market Position Descriptlon Currency Amount received % Date Value
Schmder ISF Global Corporate Bond [cont)
. ..
Barclays Bank 4.5% 04/03/2019
Black & Decker 7.125% 01/06/2011
Black 8. Decker 7 125% 01/06/2011
Brazilian Government International 12.25% 06/03/2030
Carnival 6.65% 15/01/2028
Carnival 6.65% 15/01/2028
GBS 4.625% 15/05/2018
CDX EM Seties 9 20/06/2013
CDX EM Swes 9 20/08/2013
CDX EM Series 9 20/06/2013
CMBX.NA.AAAA.17/02/2051
izens Communications 6.25% 15/01/2013
oca-Cola Ent6iprises 6.1 25% 15/08/2011
miat tdetals 6.76% 15/02/2M19
rnercial Metals 6.75% 15/02/2009
C m Q r a Foods 7% 01/10/2028
Deere 6.95% 25/04/2014
k r e 6.95% 25/04/2014
D M Chemical 7.375% 01/11/2029
Oow Chemical 6% 01/1a/2012
FedEx 7.25% 15/02/2011
Gccdnch 7.625% 15/12/2012
Gocdnch 7.625% 15/12/2012
Home Depot 5 875% 164 2/2036
Honeywell International 5 7% 15/03/2036
Honeywell International 5.7% 15/03/2036
Indonesia Government 6.75% 10/032014
International Paper 5.85% 30/10/2012
International Paper 5 85% 30/10/2012
Kraft Fmds 5.25% D1/10/2013
Liz Glaiborne 5% 08/07/2013
DSll?.l% 15/04/2028
Fedb 7.2596 15/02/2011
LOW'S 8.25% oimwzoio LVMH Moet Hennessy Louis Vuitton 5% 29/04/2010
Mack-Cali Realty 7.75% 15/02/2011
Mack-Cali Realty 7.75% 15/02/2011
Marriott International 4.625% 15/06/2012
Marriott International 4 625% 15/06/2012
M ~ C O 5.875% I 5/07/2012
Masco 5.875% 15/07/2012
MeadWestvaco 6.85% 01/04/2012
Mexico Government International 7.5% 08/04/2033
Mohawk Industries 7.2% 15/04/2012
Mohawk lndustnes 7 2% 15/04/2012
New York Times 4.61 % 26/09/2912
EUR
USD
USD
USD
USD
USD
USD
USD
USD US0
USD
USD
USD
USD
USD USD
USD
USD
USD
USD
USD
USD
USD
US0 USD
USD
USD
USD
US0
USD
USD
USD
USD
USD
EUR
USD
USD
USD
USD
USD
USD
USD
USD
USD
USD USD
60,000
12,686
17,500
%,OM)
12,586
17,5W 150,ooO 300,000
42,500
400,000 8m.m
m , w 4 2 , W
12,586 17,5M3
42,500
12,586
17,500
42,500
17,500
. 12,586
12,586
17,520
12,586
17,500
42,500
12,586
17,590
40,000
12,586 17,500
42,5M3
50,000
42.500
40,oOo
12,586
17,500
12,586
17,500
12,586
17.500
200,000 12,586
17,500
12,586
1 .a8 20-Sep-2013 (54) 0.67 20-DeC-2014 735
188
(854 I .M) 10-aeC-2013
I .45 20-Apr-2013
1.04 20-Dm 1.02 20-Jun
2.85 2OJUrl-2
0.50 20-Dec-
0.56 204%~-
0.43 20-DeC-2013 91
1.14 20-D~c-2013 31 2
0.37 20-D~c-2014 194
0.42 20 -B~-2013 , '
2.52 20-Jun-2013
1 .W 20-DH-2013
4.18 20-Dw-
062 20-Dw-
0.81 20-Junb013
0.83 20-Oec-2014
1.81 20-D~c-2013
0.54 20-DeC-2014
1.53 20.Dec-2013 0.95 20-Dec-2014
1.49 20-Dee201 3
2.06 20-Dec-20<3 ' 598
1.04 20-Apr-2013 292
0.90 20-DeC-2014 1,140
1.61 20-D~-2013 160
0 81 20-Dec-2014 2,565

Schroder International Selection Fund Semi-Annual Report June 2008 Page 45
Notes to the Financial Statements as at 30 June 2QO8 (cont) Credit Default Swaps (cont)
. " Protection Nominal Interest pald / Maturity Market PosHion Description Currency Amount reC6ived % bate Value
Schroder ISF alobhl Corpordte Bond (cont)
_ , , _ .-
New York Times 4 61 % 26/09/2012 USD 17.600 2.34 2(TDec-2013 492
Olin 9.1 25% 1 6/12/2011 USD 42,500 1.99 2C-k-2013 (1 09) USD I 2,5m 0.44 20-Dec-2014 294
1 7 , 5 0 0.56 20-M-2013 84
dines 5.25% 01/10/2014 USD 17,500 1.70 20-Dec-2013
50.000 2.73 20-0e~-2013 (407) 50,000 1.32 20-Juri-201
6.2% 05/01/2012 us0
EUR 50,W 0.30 20-!o-aec-XlIl
Total Market Val
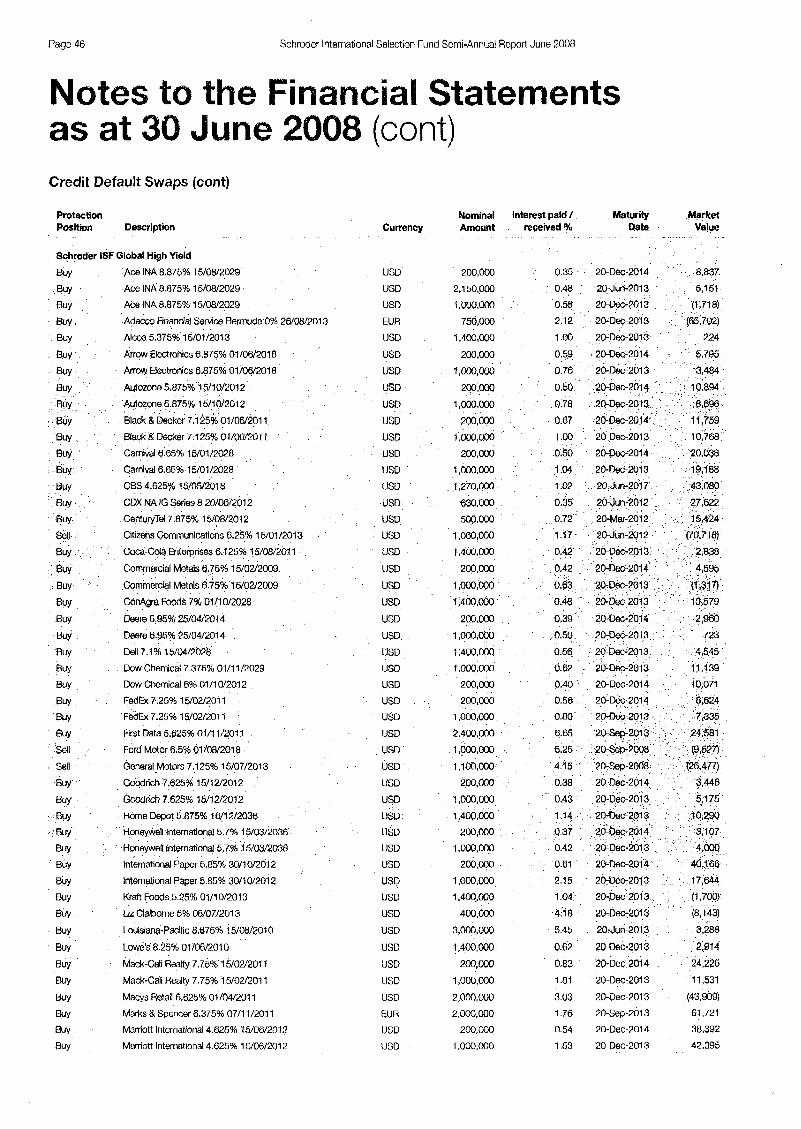
Page 46 Schroder International Selection Fund Semi-Annual Report June 2008
Notes to the Financial Statements as at 30 June 2008 (cont) Credit Default Swaps (cont)
Protection Nominal Interest paid / Maturity Market Position Descrlption Currency Amount received % Date Value
Schmder ISF Global High Yield BUY Ace INA 8.875% 15/08/2029
BUY Ace INA 8.875% 15/08/2029
BUY BUY Alcoa 5.375% 15/01/2013
BUY Arrow Electronics 6.875% 01/06/2018
BUY Anow Dedmics 6.875% 01/06/2018
BUY Autozone 5.07596 15/10/2012
BUY A C ~ INA 8.875% I 5/0w2029
Adecco Financial Service Bermuda 0% 26/08/2013
BUY BUY BUY Buy Carnival 6.55% 15/01/2028
BUY Carnival 6.65% 15/01/2028
BY CBS 4.625% 15/05/2018
&ry CDX NA IG Series 8 20/08/2012
BUY CentutyTel7.875% 15/08/2012
Sell Citizsns Communications 6.25% 15/01/2013
w BUY Commercial Metals 6.75% 15/02/2009
BUY Commercial Metals 6.75% 15/02/2009
BUY BUY Deem 6.95% 25/04/2014
BUY h r e 6.95% 25/04/2014
BUY Dell 7.1% 15fO4/202%
Buy w Dow Chemical 6% 01/10/2012
BUY FedEx 7.25% 15/02/2011
BUY Fedf3 7.25% 15/02/2011
BUY
331 Sell General Motors 7.125% 15/07/2013
BUY Gccdrich 7.625% 15/12/2012
B Y Goodrich 7.625% 15/12/2012
BUY Home Depot 5.875% 1W12/2036
BUY Honeywell International 5.7% 15/03/2036
BUY Hmeyweli International 5.7% 15/03/2038
Buy lnternatimal Paper 5.85% 30/1 Ql'2012
BUY international Paper 5.85% 30/10/2012
BUY Kraft Foods 5.25% 01/10/2013
BUY LIZ Glaibwne 5% 06/07/2013
Buy Louisiana-Pacific 8.875% 15/08/2010
BUY BUY Mack-Cali R ~ a l f y 7.75% 15/02/2011
rn Mach-Cali ReaRy 775% 15/02/2011
BUY Maws Retail 6.625% 01/04/2011
BUY
BUY Marnott International 4.625% 15/06/2012
BUY Marriott International 4 625% 15/06/2012
Black & Decker 7.125% 01/06/2011
Coca-Cola Entefpnses 6.1 25% 15/08/2011
COnAgra Foods 7% 01 I1 012028
Dow Chemical 7.375% 01/1 1/2029
First Data 5.625% O V l 1/207 1
Ford Motor 6 5% Ol/W2018
Lowe's 8.25% 01 /OW201 0
Marks & Spencer 6.375% 07/11/2011
USD USD USD
EUR USD
USD
usw USD
USD USD
USD
USD
USD us0 USD
USD USD USD US0
USD USD
USD
USD
USD
us0 USD USD
US0 USD
USD
USD
us0 USD USD USD USD
USD USD US0
USD
USD
USD USD
USD
USD
EUR USD
US0
200,000
2.1 50,000
I,WO,ooO 750,000
1,4M),oM,
200,000
1,rn,ooo
200,000
1 ,ooo.ooo 2m,m
1.ooO,aoO 200,000
I,oOo,Mx, 1,270,000
630,030 5oo.m
1,060,000 1,4M),oOo
200.000
2(10,000
1 ,ooo,M)o 1.400,Mx)
1 ,ooo.m 200,000
200,000
1 .ooo,oO0
2.400.000
1 ,ooo,o0O 1.1cr0,000
2OO.OW
1 ,OOO,000
1,400'000
2M,000
1,000,oOo 200.000
1 ,000,oOo
1,400,090 400.000
3,000,000 1,400,000
2 m , m
1,000,ooo
2 , o o O , ~
2.000,000 200.000
1 ,000,M)o
0.35 2@D%-2014 8,837
0.48 20-Jun-2013 5,151
(1,718) 2.12 20-0%-2013 (65,702)
1 .oO 20-D-2013 224
0.58 20-Dec-2013
0.59 20-DK-2014
0.50 20-Dsc-2 '
0.78 20-k-2 0.67 20-De2014 1 .00 20-Dew2013
0.50 2@Dec-2014
0.40 20-Dee-2014 10,071
0.42 2cFDec 0.61 20-DeC-
2.15 20-OW-2013 17,644
1.04 20-Dw-201 3 (1 .roo) 4.1 8 20-DW-2013 (8,143)
5 45 20-Jun-2013 3,288
0.62 2&13ec-2013 2,914 0.83 20-Dec-2014 24,225
1.81 20-De-201 3 11,531
3.03 20-DEC-201 3 (43,909) 1.76 20-Sep-2013 61,721
0.54 20-Dec-2014 36,392
1.53 20-DeC-2013 42,395

Schroder International Selection Fund Semi-Annual Report June 2008 Page 47
Notes to the Financial Statements as at 30 June 2008 (cont)
I
Credit Default Swaps (cont)
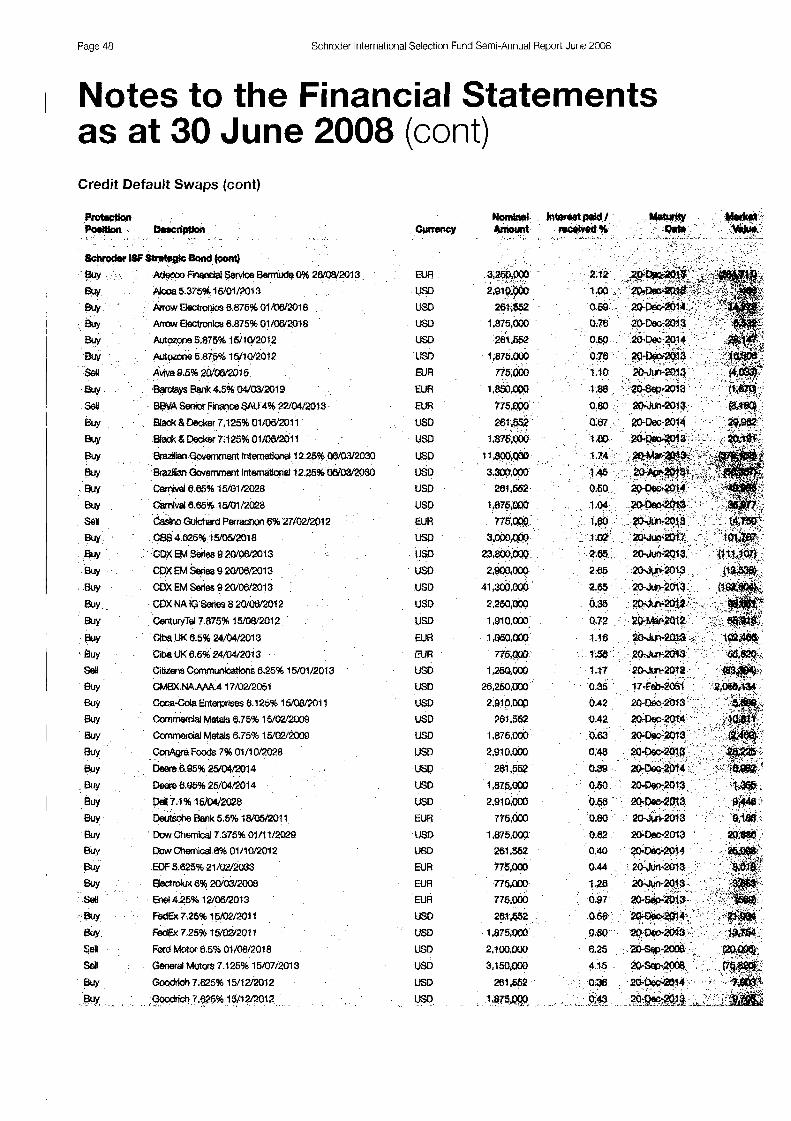
Page 48 Schroder International Selectiori Fund Semi-Annual Report June 2008
I Notes to the Financial Statements as at 30 June 2008 (cont) Credit Default Swaps (cont)
Ew USD
USD USD USD
USD
N R EUR EUR USD urn USD USD USD USD EUR USD USD US0 USD USD USD
EUR N R USD USD
USD USD
US0
USD
USD
US0 USD EUR
Us13 US0
N R EUR EUR
us0 USD
USD USD USD
urn

Schroder International Selection Fund Semi-Annual Report June 2008 Page 49
Notes to the Financial Statements as at 30 June 2008 (cont)
8chmdw I S 8myoEc Wnd {mt)
Home Depot 5.876% 18/12/2036
mtkd 5.7% 15fWZCk38 I M W i 5.7% 15/03/M3B
wal robacco F m e ~.25% wi moie lixmeaie (3amrnm 6.75% 10/03/2014
5% 1 w w 2 0 1 4
3WlM2012 ~ n e t i o o s l Paper 5.85% 3011 OM01 2
WaftF&6.26% OillOmOl3
sell UnUe Finance 6.876% 24/04/2023
w07/2D13
lbcb12010
Meet Hennessy Lwis Wion 6% 29/04/2010
M W - m Realty 7.75% 15/02/2011
wly hkk-call Realty 7.75% 1 m / 2 0 1 1
wry Masye R ~ t d 6.625% 01/04/2011
Buy M&k$& 6.375% 07/11/2011
w hMiott MtsmafiQnal4.62696 15/08/2012
B Y MarrloPt lntematlonal4.625% 15/08/2012
&ly Mssco 5.875% 15/07/2Q12
Sen sell sell Buy Mohawk Industties 7.2% 15/04/2012
BUY Mohawk industries 7.2% 15/04/2012
BY 8w &y Next 6.25% 3Qru&r2M3
Bw ~ a s c o 5.875% 1 m 7 n 0 1 2
wly w- e.%% 01m~2012
Mexico Government lntematlonal7 6% 08/04/2033 Mexico Gwwment International 75% W 2 0 3 3
Meajm Govsrnment International 7.5% 08/04/2033
New Mrk Times 4.81 % 28/08/2012
NSW York Tknes 4.61% 28/09/2012
BUY Ol1n9125%tiV12/2011
Buy mnlcom &cup 5.8% f6K24/2018
ChflkW! 0% 07lQ2fi031 B"y
w pacicaging of Amaica 5.75% 01/08/2013
Buy PaCtiv8,125% 15/os/ml7
Buy pectiV8.12596 15918/2017
suy Panama G w m International 8.875% 3O/OB/2027 $uy penrylan Gwsmhent lnternatlonat 8.75% 21/1 If2033
Buy ~ G u v m f r m t IntematiW 6.76% 21/11/2033
BUY siry w 10,622696 16/03/2926 sw . lndustrlss7.c)59615/o8/2oo9 .w PPG lmluwrlss f.B% iwwm BUY Renaun 4.625% 28/06/2010
USD
uSD USD
EUR USD USD
USD
USD USD
EUR USD
USD EUR
USD
USD
USD
EUR USD
USD USD USD USD
USD USD USD
USD
USD
USD USD EUR USD USD
USD USD
USD
USD USD US0 USD USD
USD
USD USD
USD EUR
2,9l Roo0 281.592
1.875,Mx)
775,00(1
2.986.000 2.500.000
201 ,!E2 1,876.000
2,910,000 775,MM
3,000.m
2,000,000 281,552
1,875,Mx)
2,910,wo
2,500.000
775,000
281 352 1,875,000
281,562
1,875.oM3
3.000.000 11,800,000
8,200,wo 13,200,000
261,552
1,875,rn 261,552
1 B75.000
1,275,000
2,910.wXl 281,552
1,875,000
2,910,00(1 261,552
1,875.m
3,300,000 6,200,033 3,300,000
281.5B2
1 s75.m 2,600,000
281,552
1,876.m 775,001)
1.14
0.37 0.42
1.30 1 82 2.52 a.w 2.15 1 .w 0.62 4.18 0.62
a m 0.83 1 .a1
3.03 7,07
0.54 1.63 0.95 1.99
2.08
1.46
1.25 I .a 0.90
1 .61 0.81 2.34
2.52
1 .w 0.44
0.56
1 .oo 0.49
i .02 1.62
1.61 ' 1.28 0.20
0.39 ' 2.26
0.32 0.m
20-Oec-2013 21,388
2C-Ih-20i.1 7,483
21)-Ck-M13 7,500
20-Jun-2013 (24,107)
20-oec-2011 71,584
I 204~1-2013 25,045
20-Dec-2014 102.420
28Deo-2013 33,063 20-DeC-xJ013 (3,534) 2oJun-2013 6,883 B0ec-2013 P,072l 21)-Deo-2013 6,058
2O-J~tn-2013 w9aOs)
&-W2014 61,136
20-Deo-2013 21,619
(was) 2C-OeP2013
2ChJu%2013 9,703
2D-Dec-Po14 98,187
20-0ec-rn3 79,490
2 6 ~ 2 0 1 4 84,353 2GM2013 w , m 2(t.Oec2MS 35,902 2 0 4 ~ 2 0 1 3 258.333
20-Apr-2013 70,452
20-&+2013 19,279
20-Dec-20%4 40.208
20--2013 17,110
20-Dec-2014 104,334
20-Dec-2013 52,730
MSep-20t3 I 38,493
200-OeL-2013 (7,445)
ZUDeC-2M4 11,603
8,953 2&D&-U313 20-DeC-ZOl3 11,798
20-Ck-2014 37,444
20-DaC-rn3 10,085
2oapr-2013 ( 4 9 # 0
M-Apr-2013 -459s) 2o-Oe(s2&4 ' 9,536
20-0ec-2Oi3 (2,129)
2twun-2013 34.641 2C-Dec-2014 31.624
20-Oec-2013 1 &?Ea 20-JUn-2013 29.061
20.Ap.2013 (121,l 11)

Page 50 Schrodcr lriterriatiorial Selection Fund Semi-Annual Report Jurie 2008
Notes to the Financial Statements as at 30 June 2008 (cont) Credit Default Swaps (cont)
Reynolds Am&an 7.025% 01 /OW201 6 Rohm & Haas 7.85% 15/07/2029
Rohm & Haas 7.85% 15/07/2029
RR Donneley & Sons 4.95% 01/04/2014
RR DonneHey & Sons 4.95% 01/04/2014
Russia Government 7.5% 31/03/2030
RWE Rnance 6.1 25% 2W1 W2012
Wander International Debt 0% 09/08/2013
Saralee 8.125%01/11/2032
Sealed Air 5.625% 15/07/2013
ShefwIn-Williams 7.375% 01/02/2027
Sherwin-William 7.375% 01/02/2027
South Africa Government 6.5% 02/06/2014
Southwest Airlines 5.25% 01/10/2014
Southwest Airfines 5.25% 01/10/2014
Starwood Hotels &Resorts Worldwide 7.875% 01/05/2012
STMicroelectronlcs Finance 5.361 % 17/03/2013
Suedzucker lnternatlonal Finance 5.75% 27/02/2012
Swiss Re American 4% 29/06/2015
Tate 8 Lyle International Finance 6.5% 28/06/2012
Telecom ltalia 5.375% 29/01/2019
Telefonaktiebolaget LM Ericsson 6.5% 2M!5/2009
Tdefonica Ernislanes 4.375% 02/02/2016
Thornson Reuters 8.2% 05/01/2012
Thornson Reutefs 6.2% 05/01/2012
Travelers 8.125% 15/04/2010
Travelers 8.1 25% 15/04/2010
Turkey Government 11.875% 15/01/2030
Ukraine Government International 7.85% 11 /OW201 3
Univisim Communications 7.85% 15/07/2011
V&O 2.375% 01/01/2011
WVO Treasury 5.375% 26/01/2010
Wnado Realty 4.75% 01/12/2010
WMdo Realty 4.75% 01/12/2010
W m a e u s e r 7.125% 15/07/2023
Weyehaeuser 7.126% 15/07/2023
Zurich Finance USA 4.5% 17/08/2014
ITRAXX Europe %ties 6 20/ 1 W2011
Schmder ISF Sbateg k Credit
h Y A C ~ INA 8.~5% 16/08/2029
&rY Ace INA 8.875% 15/08/2029
c u m c y
USD
USD
USD
USD
USD USD
EUR EUR
USD
USD USD
USD
USD
USD
USD USD
EUR EUR
EUR
EUR
EUR
EUR
EUR
USD
USD
USD
USD
USD
USD
USD
EUR
EUR
USD
USD
USD
USD
EUR
EUR
USD
usa
Nominal Amwnt
1,800,000
261.552
1,875.000
261,552
1,875,000
13.200,oM)
775,oMJ
775,000
2,910,000
2,910.MM
261,552
1,875,000
13.200,Mx) 261,552
1,875,000
3,Mx),MH)
775.000
775,000
775,000
7 7 5 . m
7 7 5 . m
3,000,000 775.000
261,552
1,875,WO
261,562
1,875.000
2,500,000 2,500,oaO
3,150.W
775,000
776,MM
261,552
1,875,000
281,552
1,875,000
775,000
2,2~,000
Total Market Value
51 ,ooO 0.35
225.000 0.48
0.88 0.40 0.71
0.65
1.21
1.28
0.49
0.60
0.83 1.10
0.39
0.88
1.67
0.61
1.70
2.73
0.88 0.83
0.82
1.60
0 .a 1.32
1.02
0.51
1.19
0.35
0.m 2.88
2.75 3.76
1.68
0.70
0.77
1.64
1.02
1.63
0.90
0.30
Moalcteu Dam
20-Jw-2012 20-Dsc-2014
20-Rec-2013
2&Dec-2014
2 6 k - 2 0 1 3
20-Apr-2013
20-J~ l -20 t3
204~~1-2013
2 W - 2 0 1 3 20-Dw-2013
20-ow-201 4
20-Dec-2013
20-Apr-2013
20-Dec-2014
20-Om-2013 20-Dec-2013
20-J~l-2013
20-Jun-2013
20Jun-2013
20-sep-2013
20-Jun-2013
20-sep-2013 20-Dec-2014
20-Oec-2D79
20-Dec-2014
20-oec-2013
20-Apr-2M 3
20-Apr-2M 3
20-sep2008
20-Ju~-201 3 20-Jun-2013
20-JUn-2013
20-Oec-2014
20-Dec-2013
20-OSC-2014
20-Dsc-2013 '
2CbJun-2013
USD
20-k-2014
20-JUn-2013
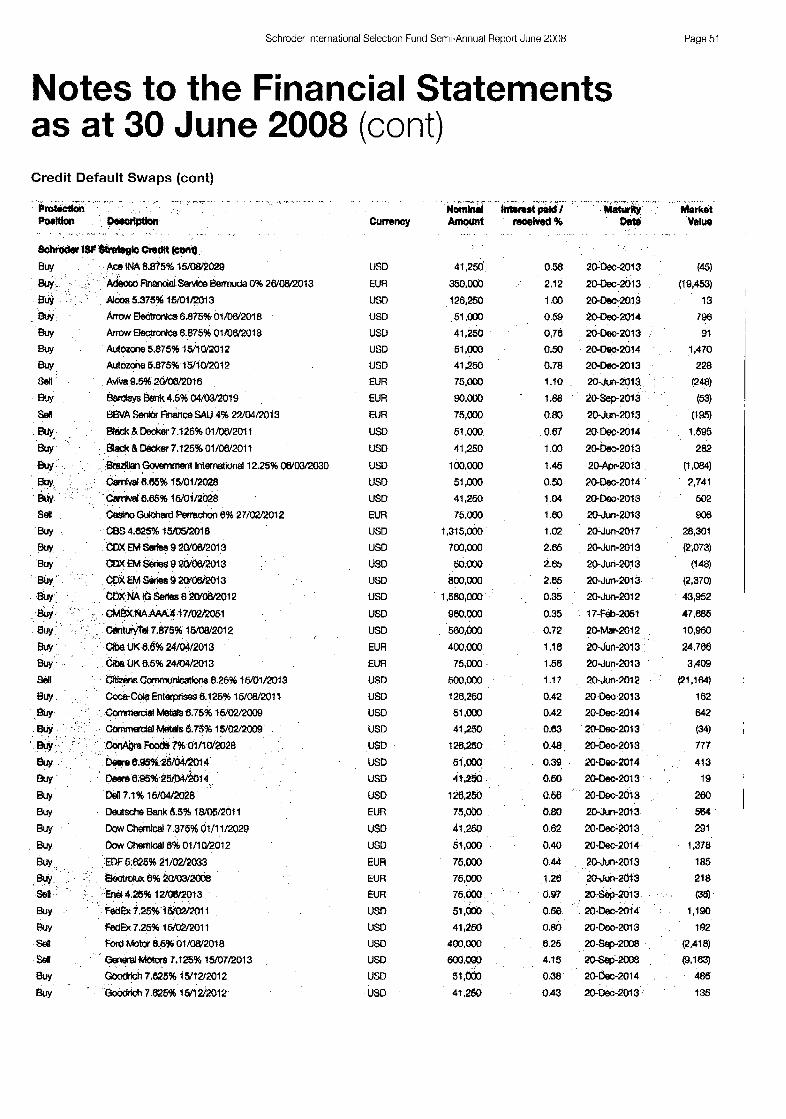
Schroder International Selection Fund Semi-Annual Rennrt June 2008 Page 51
Notes to the Financial Statements as at 30 June 2008 (cont) Credit Default Swaps (cont)
. I .
Prc4kiG- POlwMI DmcllpH#l
~ t u d m l s f ~ k ~ d t t ( C t W I O BUY Ace INA 8.875% 15/0812029
BUV Financial swlde Bermuda 0% 2&rw2013
Buy W 5.37596 16/01/2013
wy Arrow oeetrpnlcs6.875% 01/08/2018
Buy h E l 6 c t r a n i c s 6.875% 01106f20t8
Buy Autotone 5.875% 15/1Qo12
B Y Autme6.875% 15/1W2012 Sdl AvivaQ.596 2#$/2018
BUY M a y a Bark 4.5% 04m019 sell BWA ~enlbr nn&ca SAU 4% 22/04/2013
w E k k t% Decker 7.126% 01/08/2011
Black I% M6r 7.125% 01/06/2011
BrdUw~ GOVW~I%TII International 12.25% WW2030
Camhd 8.55% 15/01/2028
caMValB.Bs% 16/01/1028
SeH @%In0 Gu(chard 6% 27/02/2012
WJ C B S ~ . ~ % i m i a BUY CDX EM Sertes 9 2Q/o8/2013 &ry a EM 9 2Wol3m13
Buy CDXNA IGSefies8 ZW0&20?2
& w.NA.fUA4 i7/02/2061
Buy C<mTd 7.875% 1w08/2012
w cfba UK 8.6% 24/w/2013 Boy cibe UK 86% 24/04/2013
sell Citk1sCcmmunlcaHons825% 15M1/2013
f3uy Coca-cda Ent&"i~~$8.125% 15/08/2011
auy CDXEM setie8 9 2[xowo13
.comnerdsl W#S 8.75% 16/o2/2009
cansnsrctpll Metllls 6.75% I womoo9 COnAgrrr h d S 7% 0111W2028
8uy Deeret3.W26/04/1M4 auv w e 8.8596 2 m A i 4
BUY W ? . l % 16/04/2028
Buy Deutsche h k 6.5% 1&ro5/2011
Buy DOW Chemlcsl7.375% 01/11/2029
BUY bow ChanW 6% 01/10/2012
Buy EDF 5.828% 21/02/2033 Ekrv EkwmlUx 8% 201I13/2m sen EW4.2596 i2hW2013
&Y Fed& 7.26% W02/2011
Buy FdEX 7.25% 15/02/2011
see Fad W 8.6% 01/08/2018
Sel GwWI%I Matae 7,125% 16/07/2013
@UY G w t k h 7.625% 15112/2012
Buy . oooeklch 7.826% 1 m v m 1 2
C m n c y
USD
EUR
US0
USD
USD
USD
USD
R I R
EUR
W R USD
USD
USD us0 USD
EUR
US0
USD
USD
USD
USD
USD
USD
EUR
EUR USD
US0
Us0
USD
USD USD US0
USD
EUR
USD
USD
EUR
EUR EUR
USD
USD
USD
U6D
USD
USD
41,250
3M3,ooo 126,250
61 ,ooO 41,250
61 ,OM)
41,260
75,080
90,m 75,000
51 ,Mx)
41,250
1M),OOO 51 ,# 41,250
75,000
1.31 5,000 700.000
5o.m
1,680,MIo
Q@U,o.Mx)
56o.ooo 400,000
75.000
m,m 128,250
61 ,MKl 41,250
126,2!50
61 ,ooO 4?.290
120,250
7 5 , m
41,250
61.000
75.000 75,000
75.000
ao0,oOo
51 .& 41,2W
400,oM)
600,m 51 .c100 41,260
0.58 2.12
1 .oo 0.69 0.78
0.50 0.m I .IO 1.88
0.80 0.67 1 .m 1.46
0.50 I .w 1 .eo 1 .M 2.85 2.65 2.m
0.35
0.35 0.72
1.10
1.66
1.17
0.42
0.42
0.63
0.48
0.39 0.M)
0.58 OM 0.62
0.40 0.44
1.28
a97
0.66 0.80
8.25
4.15
0.38
20-K%c-2013
20-Dec-2013 20-Dec-2013 2o-Dec-2014 m W 2 0 1 3
20-IM-2014
2 0 - W 2 0 1 3
20-Jw\-2013
20-Sep-2013
20Jun-2013
20-Dec-2014
2 0 - k - 2 0 1 3
20-m-2013 20-Oec-2014 20-Dec-mi 3
20Jun-2013
204un-2011 2 W n - 2 0 1 3
20-Jun-POI 3
20-Jun-2012
17-Feb-2061
20-Mar-201 2 204un-2013 2OJun-2013
2oJon-2012
20-D~IC-2013
20-Dee-201 4
20-oeO.2013
20-0ec-2013
20 -0~-2014
20-Dec-2013
20-Dec-2013 20-Jun-2Cll3
20-Dec-2013
20-Dec-2014
2oJun-2013 2oJul-l-2013
Zosep-2013
20-Ju~-201 3
2 0 - b - 2 0 1 4
20-Dec-2013
2o-ssp-2M)8 aosep-2008 20-Dee-2014
0.43 20-Oec-2013 136

Page 52 Schroder International Selectiori Furid Serni-Annual Report June 2008
Notes to the Financial Statements as at 30 June 2008 (cont) Credit Default Swaps (cont)
Rotectlon Po8ition Description
Schrodsr ISF 8hategk Credlt (cont)
~ ~ l l e ~epot 5.875% 1 w i z/zo3e Honeyweil lntematlonal5.7% 15/03/2036
Honeywell International 5.7% 15/03/2036
lrnpenal Tobacco Fmnca 6.2596 0411 2/2018
Indonesia Government 6.75% 10/03/2014
lndonesla Government 6.75% 1 WW2014
International Papm 5.85% 30/1#2012
Msmational Paper 5.85% W 1 W2012
Kraft- 5.2546 01/10/2013
Linds Finance 6.875% 24/04/2023
Ut Chiborne 5% 08/07/2013
Lowe's 8.25% 01/08/2010
L W Moet Hennessy Louis Vuitton 5% 29/04/2010
Mack-Cali Realty 7.75% 15/02/2011
Macys Retail 6.625% 01/04/2011
Marks & Spencer 6.375% 0711 1/2011
lvlryriott lrUefnational4.625% 15/06/2012
M&tt International 4.625% 15/06/2012
Masco 5.875% 15/07/2012
Masco 5.675% 15/07/2012
MeadWestvaco 6.85% 01/04/2012
Mexico Govemment lntsrnational7.5% 08/04/2033 Mohawk Industries 7.2% 15/04/2012
Mohewk Industrles 7.2% 15/04/2012
New Ywk Times 4.61 % 26/09/2012
Narv York Times 4.61 % 26/09/2012
Next 5.25% 30/09/2013
Olin 9.125% 15/12/2011
Wim Group 5.8% 15/W/2016
paCk&3QhQ O f M C a 5.75% 01/W2013
Pactkr 8.126% 15/06/2017
Pactii 8.125% 15/08/2017
Panama Government lnternaticnal8.8754b 30/08/2027
Peruvian Government International 8.75% 21/1 V2033 pflter 4.65% 01/03/2016
pfrzer 4.65% OlIO3/2018
Philippine Government 10.625% 15/03/2025
PPG Industries 7.05% 15/WZoo9
PPG IndUStlleS 7.05% 15/08/2009 Renauk 4.625% 28/05/2010
Reynolds Amerlcan 7.625% 01/06/2015
Rohrn & Haas 7.85% 15/07/2029
W - C a i l R a y 7.76% 15/02/2011
OmnicWn 0% 07/02/2031
currsncy
USD
USD
USD EUR
USD
USD USD
USD
USD EUR USD USD EUR USD USD
USD
EUR
USD USD USD USD USD USD USD USD USD USD EUR USD USD USD
USD
USD USD USD USD USD USD USD USD USD EUR
USD USD
NOllllMl Amount
126,250
51 ,ooO 41,250
75,000
4 8 0 . m
50,M)o 51 .OM)
41,250
126,250
7 5 , m 225,000
126,260
150,ooo
51 .ooO 41,250
250.000
75,037 61 ,ooO 41,250
51 ,Mx)
41,250
225,000
300,000 51 ,MI0
41,250
51 ,om 41,250
100,ooO
126,260
51 ,OW
41,250
128,250
61 .ooO 41,250
1 cQ,OOo 1oO.Mx)
51 ,OM3 41,250
50,000
51 ,ooO 41,250
75,000
1,250.004
51 .ooO
Interest paid / received%
1.14
0.37
0.42
1.30
1.52
2.52
0.01
2.15
1-04
0.62 4.18
0.62
0.81
0.83 1.81
3.03 1.87
0.54
1.63
0.95 1.89
2.0%
1 .w 0.W 1.61
0.81
2.34 2.52
1.99
0.44
0.50
1 .oo 0.49
1.02
1.62
1.28
0.20 0.38
2.25
0.32
0.70 1.20
0.88 0.40
o m
20-Dac-2013 2BDeC-2014
2@DEc-2013
20-Ju~-2013
20-oec-2011
2OJW-2013
20-Dee-2014
2o.Dec-2013
2 0 - h - 2 0 1 3
20-J~n-2013
20-Dec-2013
2QJun-2013 20-De2014 20-aeC-2013 Mk-2013 20Jw-2013
20-oeC-2D14
2O-Dec-al3 20-Dec-2014
2o-DeC-rn3 20-Dec-2013
20-Dac-2013
20-Apr-Mf 3 20-Oec-2014
20-h-2013
20-Dsc-2014 20-oec-2013
20-sep-2013 20-DeG-2rn3 20-Dec-2014
20-Dec-2013
20-Dsc-2013 20-Oec-2014 20-bc-2013
20-Apr-2013
20-Apr-2013
20-Dsc-2014
20-Dec-2013
20-Jun-20T3
20-Dec-2014 20-Dec-2013 20-JUn-2013
20-Jun-2012
20-Dec-2014
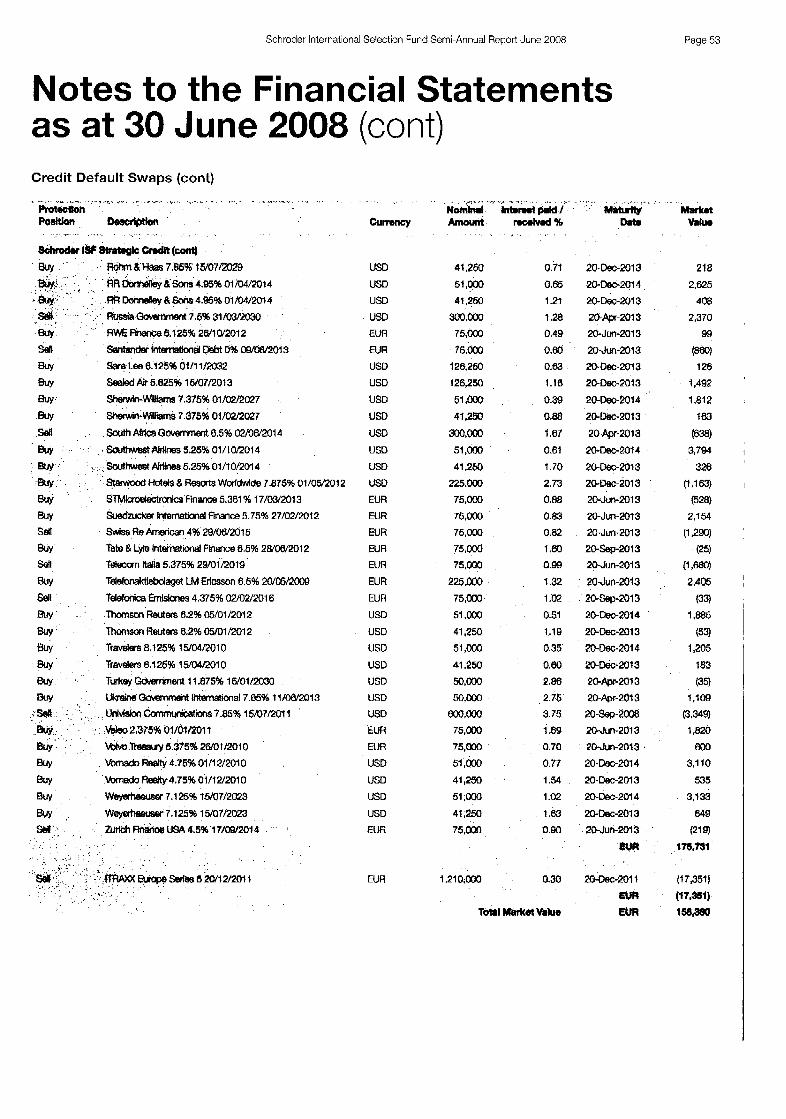
Schroder International Selection Fund Semi-Annual Report June 2008 Page 53
Notes to the Financial Statements as at 30 June 2008 (cont) Credit Default Swaps (cont)
8chrod6r IS? $bptsgh Credit (cat)
Buy ROhmllHaas 7.%% 1 ~ 7 ~ ~ #R -&Sans 435% 01/04/2014
RU ~onner!+y~ F,WIS 4.9~96 0 1 f 0 4 / 2 ~ 4
f?fmh- 7.6% 31/03/2030
RWEFm5.125% 2WlW2012
santander Memetland Debt 096 09/08/2013
sealed Air 6.625% 1 W07/2O13
sen &ly Sara Lee 6.325% 01/11/2032
Buy BUY -wi~iams 7.375% 011w2027
Buy Sherwin-wwiams 7 375% 01/02/2027
sell swth Alrlce Gavemment 6.5% 02fOW2014
wlv ' hthWStAkllns~ 5.26% 01/10/2014
etry kdhwsst AMlneS 6.25% 01/10/2014
wlv syr BUY Sdl
Buy sen Tdeccrn Wa 5.375% 29/01/2019
Buy SI rn Thomm Reuters 62% 05/01/2012
Buy fhomaon Rmers 6.2% 05/01/2012
Buy Travelers 8.12596 15/04/2010
BUY Travelers 8.125% 15/04/2010
Buy TurkeyGavwnment 11.07596 16J01/2030 Buy ukrrtine Govranment lntematlonal7.659k 11/08/2813
sterwaod Hotds & Resa$ Wwldwlde 7.875% 01/05/2012
~lcraslectrcf~lcs Finance 5.301 % 17/03/2013
SuedzuCmSr lntematiatal Rnance 5 75% 27/02/x112
Swiss Re American 4% 29/06/2015
Tete & Lyte Internationel hance 8.6% 28/08/2012
T&Mlebolaget LM Ericsm 6.5% 20/0!5/2OC9 Tdefonica EmwaWs 4.375% 02/02/201 6
,seA UnMSlen COmmWians 7.85% 15/07/2Q1 f
VMW 2.375% OI/M)aol? w kh 'Reasvy 5.375% 26/01/2010
Buy wornedo Reatty 4.?5% 01/12f2010
Buy m a d 0 F w t y 4.75% 01/12/2010
BUY WWAXSUSW 7.1 25% i m r / 2 m
Bvy -7.125% 15/07/2023
Wtldl An&Oe USA 4.5% 17/09/2014
B
Currency
USD
USD
USD
USD EUR
EUR
USD
USD
USD
USD USD
USD
USD
USD
EUR
EUR
EUR
EUR
EUR
EUR
EUR
US0
USD
US0 us13 USD
USD
USD
EUR
EUR
USD
USD
USD USD
EUR
EUR
.. . , 1 - ,
41,250 51 ,Mx)
41,260
~ , m 75.000
76,000 126,250
126,250
61 Po0 4 1 , m
rn,ooo 51 ,ocX, 41,260
225.000
75,000 76,000
75,000
75,oM)
75.000
225.000 75,000
51 .MxI 41,250
51 ,ooO 41,250
50,m am 600,O
75,000
76.000
51 ,ooO 41.2W 51 ,Mx)
41,250
7 5 , m
1,210,000
0.71
0.65 121
1.28
0.49
0.W 0.03
1.16
0.39 0.88 1.67
0.61 1.70
2.73
0.88 0.83 0.82
f .Bo 0.99
1.32 1 .M 0.51 1.19
0.35 0.60 2.88
2.76
3.75 1 .e9
0.70
0.77 1.54 1.02
1 .e3 0.90
0.30
. _ MptUrlIy
oete
20-Dec-2013 20-DeC-2014
20-Dec-2013 20-Apr-2013
20JWm-2013
20-Juri-2013
20-I%-2013 20-Dec-2013
20Dec-2014
20-Dec-2013
20-Apr-2013
20-Dec-2013
20-Oec-2013
MJun-2013 20Jun-2013
20-Sep-2013
20Jun-2013
20-Dec-2014
20-DeC-2013
20-Dec-2014 20-Dec-2013 20-m-2013 20-Apr-2013
20-*-2008
20-Dec-2014
20 JLR'I-2013
204~+2013
20-Sep-2013
20-JOn-2013
20-Jun-2013
20-Dec-2014
20-0ec-2M3
20-Oec-2014
20-k-2013 z 0 ~ u n - 2 ~ 3
BUR
maec-2011 6UA WR

Page 54 Schroder lriterrlatiorial Selection Fund Scrri-Aririual Report June 2008
Notes to the Financial Statements as at 30 June 2008 (cont) Options Contracts
The Market values of options contracts are shown under 'Options contracts at market value' in the Statement of Net Assets. The Company also uses options on swaps ('swaptions') to hedge against a negative view on credit markets. In exchange for payment of a prerniurn, the Company gains the right to hedge against a potential future decrease in the value of underlying assets. Swaptions were valued on 30 June 2008 using an independent vendor valuation that derives its valuation from brokers' quotes available in the market
On 30 June 2008, the following portfolios were committed to outstanding options contracts:
Par Value Subject to CBHWPut Contract
CdlOI-tAkzONabel Strike price 61.79 Expine WI 04-JuI-08
Call on Allied Irish Elanks strike price 18.48 miring on 04-JIJ-08
cdl on Astrazeneca Strike prlCe 32.1 5
Call on Aviva Strike price 9.83 Expirhg on 04-Jul-08
Call on Bank of Irelend Stme price 11.43 Expiring on 04-Jul-08
Call on BASF Strike price 06.86 Expiring on 04-Jul-08
Call on Beigacom Strike pice 31.31 mi r ing on 04-Jul-08
Call on British American Tobacco Strike pice 27.89 Expiring on 04-Jul-08
Call on BT Strike price 3.38 Wring on 04-JJ-08 Call on Cesky Telecom Strike price 22.1 0 Expiring on 04-JuI-08
Call on Credit Suisse Grwp Strike pfice42.32 Expiring on W-Jui-08
ca# on Danske Bank Strike price 28.48 Expi- WI 04-JuI-08
call M Deutsche Post Stdke price 22.74 Expiring ~104-Jul-08 Call on Diageo M k e @ca 15.35 Explring on 04-Ai-08
Call on DnE NOR Strike price 11.06 Expiring on 04-Jul-08
CanonEnd Strike price 7.51 Expiring on 04-Jul-08
Expiring on 04-JuI-08
EUR
EUR
EUR
EUR
EUR
EUR
EUR
EUR
EUR
EUA
fUR
EUR
EUR
EUR
EUR
EUR
3.014
3,873
4,040'
3, tS
3m
2.672
2.804
3,681
3m
2264
2421 I
, .. I . ... .. . " . ..
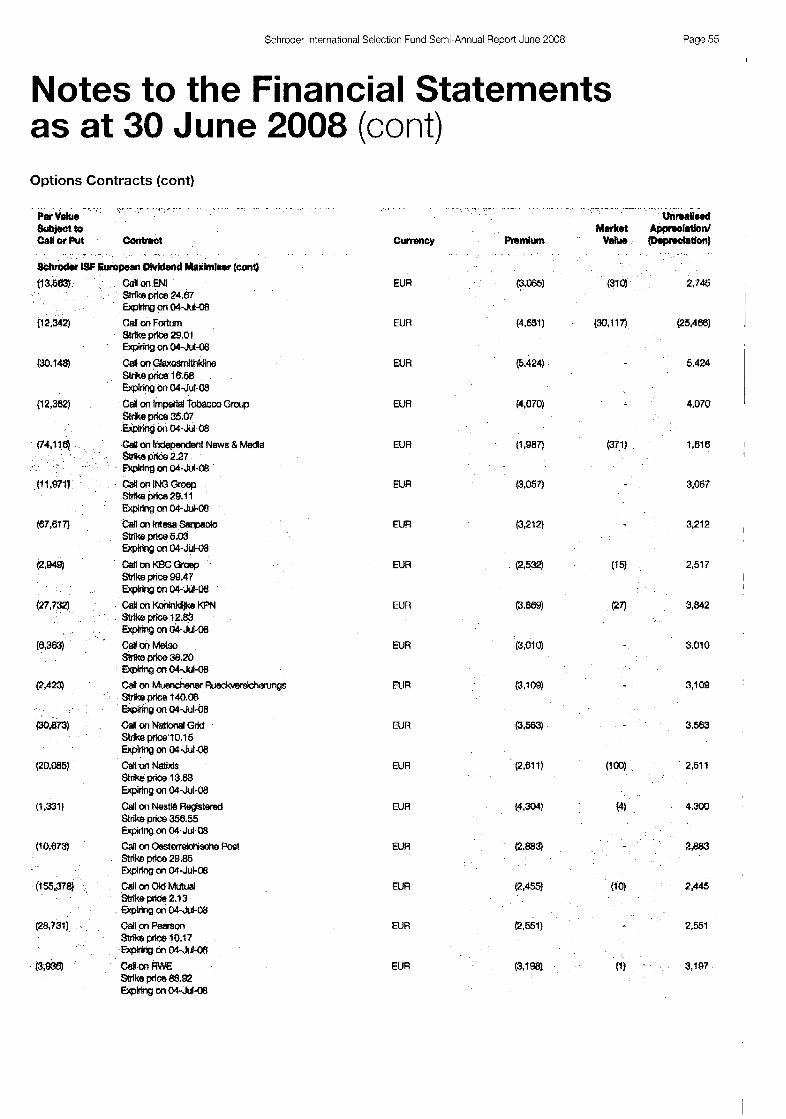
Schroder International Selection Fund Semi-Annual Report June 2008 Page 55
Notes to the Financial Statements as at 30 June 2008 (cont) Options Contracts (cont)
..,-, .. ... . . . . .,-... ̂,: .... :... .: . . . ._. . - " .. .. .... ._..._. .., Unnallsod . . . . . . . .
. , .. .-. . ,....... .1 ..,., I .- . . . ..... ~. , . . ~ .. . . . . . , . . . Par Vhr
currency
EUR
EUR
EUR
EUR
EUR
EUR
EUR
N R
EUR
EUR
N R
EUR
EUR
EUR
EUR
EUR
EUR
EUR
(5.424)
(3.212)
2,746
(25,488)
5,424
4,070
1,818
3,067
3,212
2,517
3,842
3,010
3,109
3.563
2,511
4,300
2,883
2,445
2.551
3,197
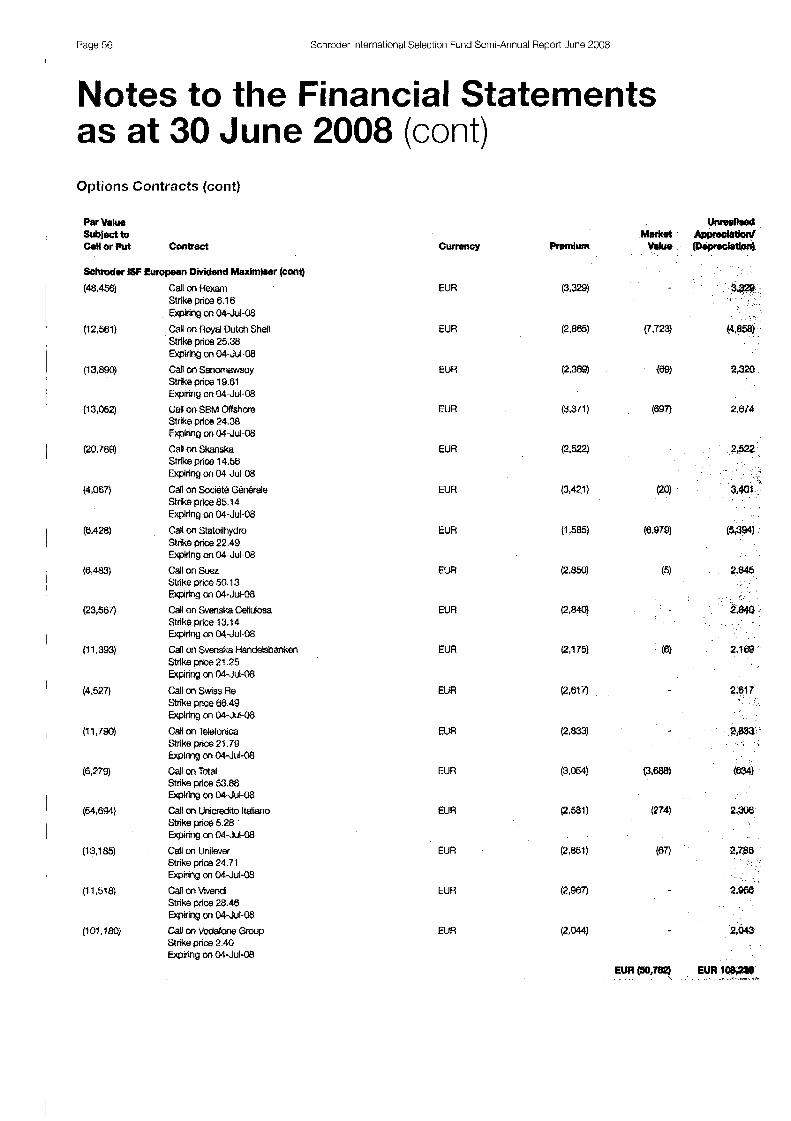
Page 56 Schroder Iriternalional Selection Fund Serrii-Aririual Report June 2008
Notes to the Financial Statements as at 30 June 2008 (cont) Options Contracts (cont)
Par Value subject to CeH or Put Contrect
Schtodr ISF European Dividend Maxlmlaer (cont)
(48.456)
(12,561)
(1 3,890)
(13,062)
(20,769)
(4,067)
(6.426)
(6,483)
(23,567)
(11,393)
(4.527)
(1 1,790)
(6,279)
(54,694)
(1 3,185)
(1 1,518)
(1 01 .I so)
Call m R e m Strike price 6.1 6 Expinns on 04-Jul-08
call on RDyal Dutch Shell Strike price 25.38 Expiring on 04-Jul-08
Call on sanmawsoy Strike price 19.61 Expiring on 04-Jul-08
Call on SBM Offshore Strike price 24.38
Call m Skanska Stnke price 14.56 Expiring on 04-Jul-08
Call on &xi& G4nerale Strike pflm 85.14 Explrlng on 04-Jul-08
Call on Statoilhydro Strike price 22.49 W n g on oll-Jui-08
Call on Suez Strike prim 50.13
CaH on Svenska Cellulosa Strike price 13.1 4 Explllng on WJuI-08
Call on Svenske Handelsbanken strlke price 21.25 Expiring ~1 W-JuI-08
Call on Swiss Re Strike price 68.49 Explnng on 04-Jui-08
Call m Telefonica Strike price 21.78
Call on Total Strike price 53.88
WMQ MI 04-Jd-08
Ewirln~ M 04-Jul-08
E x @ ' I ~ M W-JuI-08
EXplrlng M 04-JuI-08
cdl On UIliCreditO It€diMO Strike price 5.28 Expiring on 04-Jul-08
Call on Unilever Strike price 24.71 Expiring on 04-Jul-a8
Cali on Viendi Strike price 28.46 Exping M 04-Jul-08
Call WJ Vcdafone Group Strike price 2.40 Expirlng on W-JuI-08
currency
EUR
EUR
EUR
EUR
EUR
EUR
EUR
EUR
EUA
EUR
EUR
EUR
EUR
EUR
EUR
EUR
EUR

Schroder International Selection Fund Semi-Annual Report June 2008 Page 57
Notes to the Financial Statements as at 30 June 2008 (cont) Options Contracts (cont)
DMdend Maximiser
Strike price 73.62 Expiring on 10-Jut-08
Unrealised Market Appreciatlonl
Currency Premlum Value (Depreciation)
USD (3.650) 3,650
USD (8,458) (1 60) 6.296
USD (4,073) 4,073
USD (4.590) 4,522
US0
us0
usa
USD

Page 58 Schroder lriternational Selection Fund Semi-Annual Report June 2008
Notes to the Finamcia1 Statements as at 30 dune 2008 (cont) Options Contracts (cont)
Par Value Subject to Call or Put Contract
SchrMer ISF Global Dividend Maximiser (cont)
(9.570)
(1 7,187)
(9,892)
I
(9,356)
( io,w)
(8,119)
(6,270)
(21,789)
(13,627)
(6,579)
(2,049)
(24.1 74)
(140,703)
(24,503)
(8,886)
(7,544)
(1 2,169)
(9,984)
(550,931)
Call on General Electric Strike price 40.98 Expiring on 10-Jul-OB
Call on Glaxosmithkline Strike price 24.51 Expiring on 10-Jul-08
Call on lmperlal Tobacco Strike pnce 51.49 Explring on 10-Jul-08
Call on ING Groep Strike price 44.80 Expiring on 10-Jul-08
Call on International Paper Strike price 31.67 w r i n g on 1@Jul-O8
Call on Johnson &Johnson Strike price 70.01 Expiring an 10-Jul-08
Call on JPMorgan Chase Strike price 52.41 m i r i ng on IO-Jul-OB
Call on KoninWijke KPN Strike price 20.56 Explnng on 10-Jul-08
Call on Kraft Foods Strike price 33.92 Ewpiring on 10-Jul-08
Strike price 57 43 Ewpiring on 10-Jul-08
Call on Muenchener Hueckversicherungs Strike price 220.70 Ekpiring on IO-Jul-08
Call on National Gnd Strike price 15.81 Expiring on 10-Jul-08
Call on Old Mutua Strike pnce 2.98 Expiring on 10-Jul-08
Call on Pker Strike price 23.27 Expiring on 10-Jul-08
Call on Philip Momis International Strike price 53.65 Expiring on IO-Jul-08
Call on Rcgross Energy Strike price 44.64 Expiring (XI IO-Jul-08
Call on Rcyal Dutch Shell Strike price 42.27 Explnng on 10-Jul-08
Call on SBM Offshore Strike pnce 38 72 Expiring on 10-Jul-08
Call on Singapore Post Strike price 0.94 Expiring on IO-Jul-08
Call on Mots0
Currency
u50
USD
USD
USD
USD
usa
USD
USD
USD
USD
USD
USD
USD
USD
USD
USD
USD
USD
USD
Unrealised Market Appreciation/
Value LDmrechtion) Premium
(3,517) (48) 3,469
(5,870)
(4,903)
(9) 5,661
4,903
(3.638)
(3,752)
(5.385)
(3,438)
(1 ) 5.922
(4,139) 4,139
(4,349) 4,349
(4.981) 4,98'1

Schroder International Selection Fund Semi-Annual Report June 2008 Page 59
Notes to the Financial Statements as at 30 June 2088 (cont) Options Contracts (cont)
Expiring On 1&J~l-68 Call on M z o n Communications Stnke price 40.24 Explrlng on 10JuI-OB
Unrealised Market Appreclatlonl
Currency Premium Value (Depreciation)
USD (3.932) 3,932
USD (4,3991 4.399
USD I6,loS) 6,109
USD
USD
us
USD
USD
USD (4,716) 4,716
USD (4.538) 4,537
US0 (4.706l 4,706
USD (651 7) (27) 6,488
EUR S1,OOO EUR 17,180
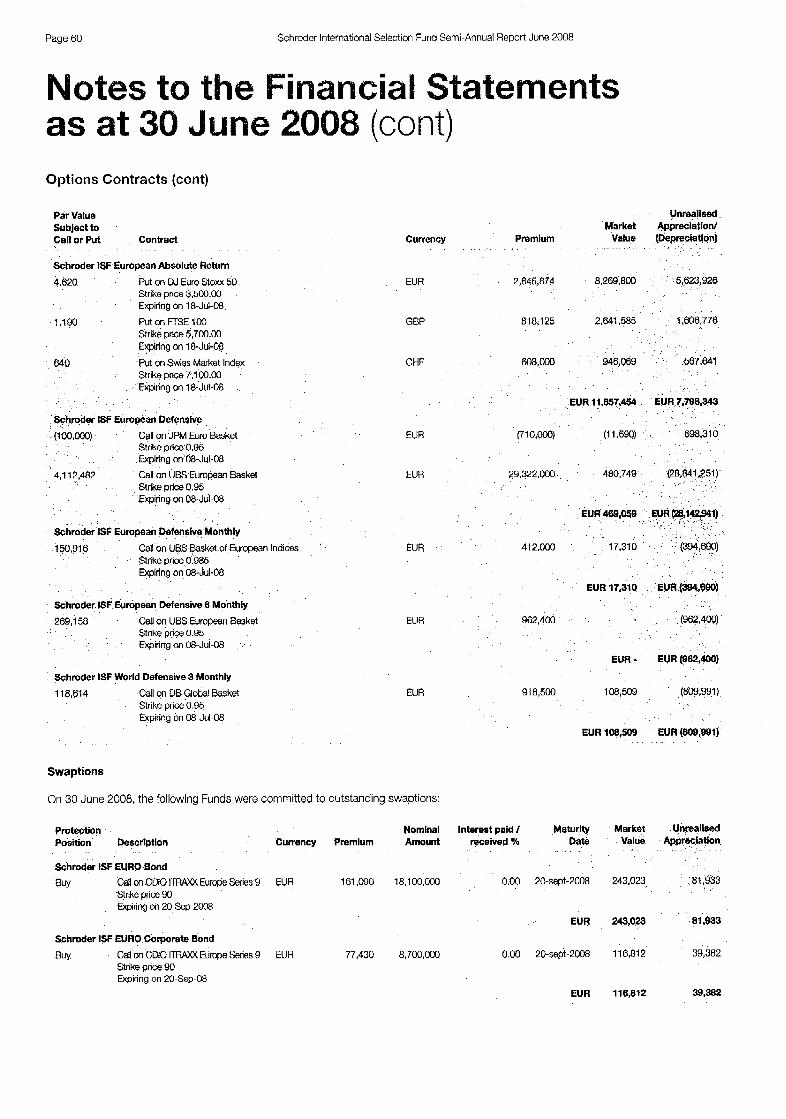
Page 60 Schroder International Selection Furid Semi-Annual Report June 2008
Notes to the Financial !Statements as at 30 June 2Q08 (cont) Options Contracts (cont)
Par Value Subject to Call or Put Contract
Schmder ISF European Absolute Return
4.820 Put on DJ Euro Stoxx $0 Strike price 3,500.00 Expiring on 18-Jul-08
Strik8 pnce 5,703.00 Expiring on 18-Jul-08 Put on Swiss Market Index Strike pnce 7,100.M1 Expiring on 18-Jul-08
1,190 Put on F E E l o 0
640
Schmder ISF European Defensive
~~OU,OOo) Call on JPM Euro Basket Stnke price 0.95 &iring on 08-JuI-08
Call on UBS European Basket Strike price 0.95 Expiring on 08-Jul-08
4,112.482
Schroder ISF European Defensive Monthly
150,916 Call on UBS Basket of European Indices Stnke price 0.985 Expiring on 08-Jul-08
Schmder ISF European Defensive 6 Monthly
269,158 Call on UBS European Basket Strike price 0.95 Expiring on 08Jul-08
Schroder ISF World Defensive 3 Monthly
118,614 Call on DB Global Basket Strike price 0.95 Expiring on 08-Jul-08
Currency
EUR
GBP
CHF
EUR
EUR
EUR
EUR
EUR
Swaptions
On 30 June 2008, the following Funds were committed to outstanding swaptions:
Protection Position Description
Schroder ISF EURO Bond
BUY Call cn CoiO I M Europe Series 9 Strike price 90 Expiring on 2@SeP-2008
Schroder ISF EURO Corporate Bond
BUY Call cn CDlO ITwuo( Europe Series 9 Strike pnce 90 Expiring on 20-Sep-08
Unreallsed Market Appreclatiotd
Value (Depreciatlon) Premium
818,125 2,641,585 1.606.776
~,~ 946,069 567,641
EUR 11,857,4454 7,?08,343
(710,oOo) (1 1.690) 698,310
29,322,000 480.749 (28,841,251)
EUR 469,059 N R ml429al)
412.000 17.31 0
EUR 469,059 N R ml429al)
412.000 17.31 0
918,500 108,509 (809,991)
EUA 108,509 EUR (soS,SSll
Nominal Interest paid / Maturity Market Unrealised Currency Premium Amount received % Date Value Appreciation
EUR 161,090 18,100,000 0.00 20-Sept-2008 243,023 81,933
EUR 243,023 81,633
EUR 77,430 8,700,OM) 0.00 20-~@-2008 11 6,812 39,382
EUR 116,812 39,382

Schroder International Selectinn Fund Semi-Annual Recnrt June 2008 Page 61
Statement of Net Assets as at 30 June 2008
ASSETS
Investments
Securities at cost Urirealised appreciation:(depreciation)
Securities at Market Value
Unrcalised appr~ciation:~deprRciatinn) on forward foreign cxchnnge contracts on futures contracts on irlterest rate swaps on total rcturn swaps
Cash at banks Receivables for securities sold Roceivables lor subscriptions Dividends and interest receivable Sundry receivables and prepayments Options at market value Credit default swaps at market value
TOTAL ASSETS
LIABILITIES
Bank overdraft Payables for securities bought Payables for redemptions Dividends and interest payat)le Management fccs payablc Other payahles and accriials Optioris at market valiie
TOTAL LIABILITIES
TOTAL NET ASSETS
Schroder Schroder Schroder ISF Schroder Schroder Schroder
ISF ISF European ISF ISF ISF EURO European Large Global Italian Japanese Equity Equity Cap Equity Equity Equity
EUR EUR EUR usu EUR JPY
1.207.418.047 24,832,852 89.863.208 49,380,252 241,444,735 84,945.158.558 39,145.1 08 13.70fi.4RR) (1 0,:360,9tiO) (2.01 2.591) (55,026,893) (8,367.533.442)
1,336,563,155 21,126,363 79,502,248 47,376,661 186,417,842 76,577,625,l 16
- (44.058.723) - (28.426.104)
1,336,563,155 21,126,363 79,502,248 47,376,661 186,417,842 76,505,140,289
11 .9f)S,SI 3 12.750 2,884.052 370.725 - 2.828.765.080 25.802.877 484.750 3.9/9,413 192,819 331.639 1.163.434.R73 14,418,537 23.208 70.n13 1.100,190 314,373,040
811.720 58.865 273.871 21.602 - 70.081.274 937,249 21,951 19.850 166 723.068
1,390,533,846 21,704,698 86,682,642 48,032,886 187,849,871 80,670,518,502
2,027.020 /&E41 1 ,766,775,4fd
5,035,174 696,88Y 3.218.693 1 .06n.737 1.428.f9f 376
1,306,360 28.291 65.787 38,917 202.863 50,152,9E4 708.1 11 15.63R 45.51 I 30.175 156,610 32.661.375
666.865 182.321) 1.288.374
7,716,510 923,145 4,688,971 69,392 3,533,871 3,278,286,l 79
1,382,817,336 20,781,553 81,993,671 47,963,494 184,315,800 77,392,232,323
Tthr n:ltc!j or1 pager; 14 tc 50 'crrr an -nteqral parr cf these financial s!atements.
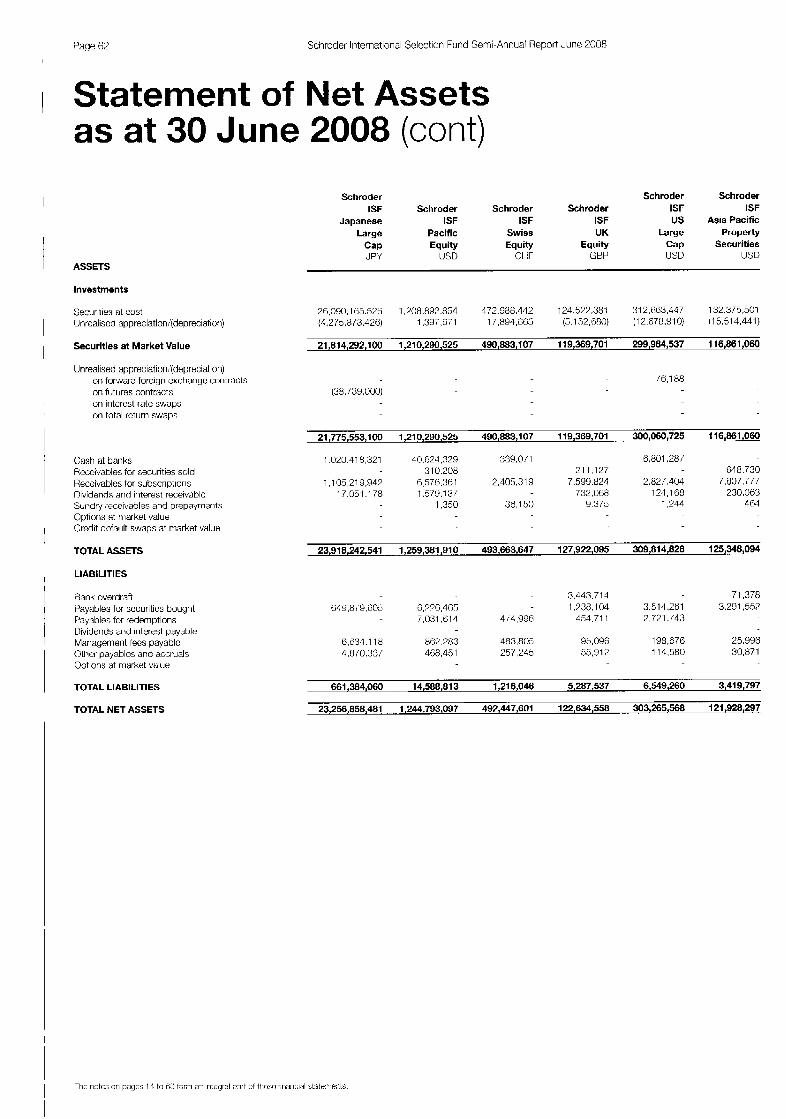
Page 62 Schroder International Solcction Fund Semi-Annual Report June 2008
1 Statement of Net Assets as at 30 June 2008 (cont)
ASSETS
Investments
Seciiritie:; ~t cost Unrcaliscd appreciation:(depreciatiori)
Securities at Market Value
Unrealised appreciatiori:(depreciation) on forward foreign excharige corilracts on futures contracts on iintercst late swaps o n total rcturn swaps
Cash at banks Rcccivables fGr securities sold Rcccivables fGr subscriptions Dividends arid iriterest receii,nblc Sundry receivables and prepayrriwts Optioris at riiarkel value Credit dcfault swaps at market value
TOTAL ASSETS
LIABILITIES
Bank overdrafl Payables for sccuritics bought Payables for redemptions Dividends arid interest paylyat)le Mariagenienl lecs payablc Other payablcs and accruals Options at rriarket value
TOTAL LIABILITIES
TOTAL NET ASSETS
Schroder Schroder Schroder ISF Schroder Schroder Schroder ISF ISF
Japanese ISF ISF ISF US Asia Pacific Large Pacific Swiss UK Large Property
Cap Equity Equity Equity Cap Securities J PY USD CI ir GBP USD IJSD
2E,050.165.528 1,208.8J7.854 472,588,142 124.5W.381 31 2,1763,447 1 Y2.375.501 (1 2 75,813,428) 1,337,67 1 17,894,865 (5.152.680) (12.Ci78.Yl0) i15.514.441)
21,814,292,100 1,210,290,525 490,883,107 119,369,701 299,984,537 116,861,060
16,188 (38.739.000)
21,775,553,l 00 I ,210,290,525 490,883,l 07 11 9,369,701 300,060,725 I 16,861,060
1.020.41 3,321 40,623,323 339 .0 / 1 6,801,281
1.105.219.947 6.575.361 2,405,319 7.5!3'3.824 2,827,404 7,507,777
1,350 36,150 9.375 1.244 464
310.208 21 1.12i 748.730
17.031.178 1.57Y.13 / 732,088 124,168 230,033
23.91 8,242,541 1,259,381,910 493,663,647 127,922,095 309,814,828 125,348,094
3,443.71 4 71,378 ti,l9.8/9.803 0,?76,4fiS 1.738.104 3.514 3 1 3.291.557
7.n31.611 4i4.996 454.71 1 2.721.143
6.631.1 18 862.783 483.805 93.096 198,676 25.99ti 4,810.331 3f8,451 257,245 55,917 111.580 30.871
661,384,060 14,588,813 1,216,046 5,287,537 6,549,260 3,419,797
23,256,858,481 1,244,793,097 492,447,601 122,634,558 303,265,568 121,928,297

Schroder International Selection Fund Semi-Annual Report June 2008 Page 63
Statement of Net Assets as at 30 June 2008 (cont)
ASSETS
Investments
Securities at cost Unrealised appreciation/(depreciation)
Securities at Market Value
Unrealised appreciation/(depreciation) on forward foreign exchange contracts on futures contracts on interest rate swaps on total return swaps
Cash at banks Receivables for securities sold Receivables for subscriptions Dividends and interest receivable Sundry receivables and prepayments Options at market value Credit default swaps at market value
TOTAL ASSETS
LIABILITIES
Bank overdraft Payables for securities bought Payables for redemptions Dividends and interest payable Management fees payable Other payables and accruals Options at market value
TOTAL LIABILITIES
TOTAL NET ASSETS
Schroder Sehroder Schroder Schmder ISF ISF ISF ISF Schmder Schmder
Asian Asian Asian BRlC ISF ISF Total Equity Smaller (Brazll. Russia, China Emerging
Returnfa) Yield Companies India, China) Opportunities Asia USD USD USD USD u50 USD
41.645.005 762.1 27.909 62,068,860 2,777,714,965 1,161,236,159 2.390.612.001 (1,855,931) (26,982,581) (1 4,052,606) 286,078,349 (1 44,466,562) (31 4,227,255)
39,179,074 735,145,328 48,018,PH 3,063,793,314 1,016,769,587 2,076,384,746
17,300 193.471 2.650.852
5,Ol 3
39,972,545 737,813,480 48,016,254 3,063,793,314 1,016,7?4,610 2,076,384,746
1 8.204.191 70,896,191 4,079.872 53,277,297 41,005,941 32.91 7,099 I
i.23a.a4i 4,260,920 17.445.479 4,891,430 1396.090 279,532 28.021.805 5,842,793 21.137.812 18.401 1.31 2,622 35,491 8,964,801 3,946,506 2,179,352 1.070 25,905 7 36
53,087,837 811,844,288 53,849,990 3,154.057,2.17 1,071.830,777 2,150.064.524
1,687,245 6,946.082 2,028,039 100,372 11.787.41 1 4.016.21 6 10,773,539 3.569.745
24,924 658,922 38.937 3.859.650 1,387.1 28 2.757.541 96,057 321,068 35,266 1,943,639 596,717 1,646,990
1,808,226 6,577,774 174,575 17,~90,900 12,948,143 i5,17a,o7o
51,279,411 805,066,514 53,475,415 3,136,486,317 1,0$8,884,634 2,134,886,454
1"' Schroder ISF Asian Total Return was formerly known as Schroder ISF Asian Absolute Return until 1 June 2008 The notes on pages 14 to 60 form an integral pari of these financial statements.

Page 64 Schroder International Selection Fund Semi-Annual Report June 2008
Statement of Net Assets as at 30 June 2008 (cont)
I ASSETS
Schroder Schroder Schroder Schmder Schroder Schmder ISF ISF ISF ISF
ISF ISF European European European European Emerging Emerging Dividend Equity Equity Smaller
Europe Markets Maximiser Opportunities Yield Companies EUR USD EUH EUR EUR EUR
Investments
Securities at cost Urirealised appreciation/(depreciatiori)
Securities at Market Value
Unrealised appreciation/(depreciation) on forward foreign exchange contracts on futures contracts on interost rate swaps on total return swaps
Cash at banks Receivables for securities sold Receivables for subscriptions Dividends and interest roceivable Sundry receivables and prepayments Options at market value Credit default swaps at market value
TOTAL ASSETS
LIABILITIES
Bank overdraft Payables for securities bought Payables for redemptions Dividends and interest payable Management fees payable Other payables and accruals Options at market value
TOTAL LIABILITIES
TOTAL NET ASSETS
262,348,307 1,069,177,309 19.456.305 25,894,099 192,010,689 333,980,101 18,988,687 25.656.438 (4,151,413) (6,294,852) (40,017,676) (42,537,724)
281,336,994 1,094,833,747 15,304,892 19,599,247 151,~3,013 291,442,377
281,336,994 1,094,833,747 15,304,892 19,599,247 151,993,013 291,442,377
8,449,122 33.234.041 1,062,045 1,226,088 5,336,403 6,028,552 3,375,076 12.671.1 53 5,208,540 7,542,812 2,766.61 0 4,999,730 93,049 92,750 165,622 2.325.464 2,868.052 37,404 12.239 309,195 782.924
7,406 21.068 12,121 198,990 148.928
298,253,266 1,148,614,129 16,425,409 20,942,744 163,140,891 308,111,215
877,855 3,322,896 2,173,918 12,366 2,105,083 27,218.602 324,563 609,461
175,620 367,494 1.208.772 15.046 17,987 255.043 674,211 13,128 8,989 96.726 133,323
298.913 530,021 206.1 10
50,782
3,605,455 32,424,481 377,869 26,976 3,331,338 930,770
294,647,811 1,116,189,648 16,047,540 20,915,768 159,809,553 305,180,445
The riOteS on pages 14 t2 BO form an integral part of these finamcia Statements

Schroder International Selection Fund Sem-Annual Reporl June 2008 Page 65
Statement of Net Assets as at 30 June 2008 (cont)
ASSETS
Investments
Securities at cost Unrealised appreciation/(depreciatiori)
Securities at Market Value
t Jrirealised appreciation!(depreciation) on forward foreign exchange (:ontracts on futures contracts on interest rate swaps on total return swaps
Cash at bariks Receivables for securities sold Receivables for subscriptions Dividends and interest receivable Siiridy receivables and prepayments Options at market value Credit delault swaps at rrwrket value
TOTAL ASSETS
LIABILITIES
Bank overdraft Payables for securities bought Payables for redemptions Dividends and interest payable Mariagement fees payable Other payables and accruals Options at market value
TOTAL LIABILITIES
TOTAL NET ASSETS
Schroder Schroder Schroder Schroder ISF Schroder ISF ISF
ISF Global ISF Global Global Schroder European Climate Global Emerging Emerging ISF
Special Change Dividend Market Market Global Situations Equity Maximiser Opportunities Energy
EUR USD USD USD USD USD
I 175,980,347 235.002.046 25.M4,190 11.61 1.736 305,636.514 626,366,561
1.457.121 98,462,372 I I (50,401,349) 1,715,713 (3,709,065) (15.993)
416,578,998 236,777,759 21,845,125 11,595,743 307,093,635 724,828,933
416,578,998 236,785,921 21,844,834 11,595,743 307,093,635 724,828,933
14.506.097 1.351, ti38 ti91515 235.107 85,ti16,518 40.321.087 4.440.542 140.850 17,138.1 9ti 29.404.815
7.776.147 1,222,307 28.163 3.192 3.202279 14.1 94.247 562.866 281.546 125,009 1,070 1,652,821 2,051 145.381 13,762 13.217 22 1,32f
439,569,492 247,095,716 22,702,928 11,975,962 414,733,471 808,752,490
474,696 2.941 , I 12 139.308 1 10.030 2.698.050 5.798.546 1,068,996 4.424 1,943,135 9,151.409
494.585 2aR,579 34,568 7.891 538,247 907.850 191.567 1 93.1 08 20,932 4.855 249,041 379,026
337.838
28.963
6,959,389 4,501,795 426,725 152,054 2,840,453 13,136,335
432,610,103 242,593,921 22,276,203 11,823,908 411,893,018 795,616,155
lbl Schroder ISF Glcbal Crnerginq Markets Cowrnoditles ,$<as launched on 13 June 2008 The notes on pages 13 tc 50 'orrn aq Inteqal part of thwe ?%mc~sl 3tntcrncnts
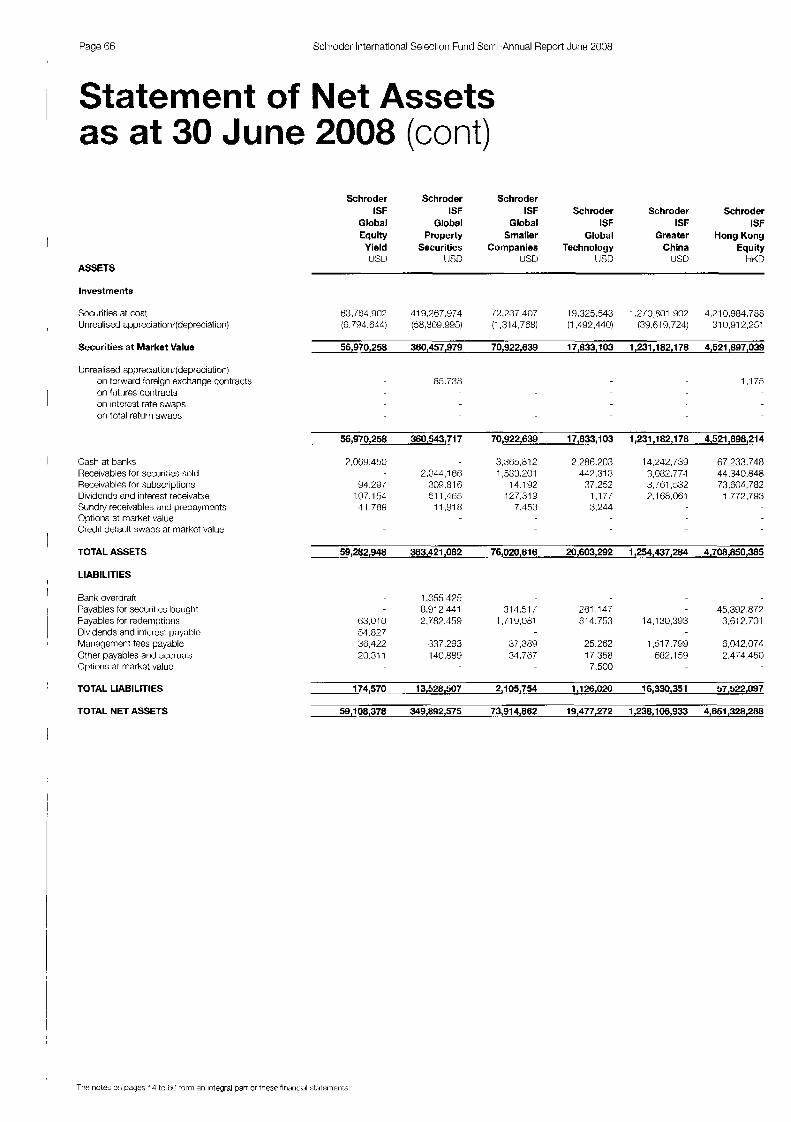
Page 66 Schroder International Selectiiiri Furid Semi-Annual Report June 2008
i Statement of Net Assets ' as at 30 June 2008 (cont)
ASSETS
Investments
Sccurities at cost Unrealised appreciatiori/(depreciation)
Securities at Market Value
Unrealised a~precia~ion:(deprociation) on torward foreign exchange contracts on futures contracts on interest rate swaps on total return swaps
Cash at banks Receivables for se(;urities sold Receivables lor ::ubscriptions Dividends and interest receivable Sundry receivatiles arid prepayments Options at market value Credit default swaps at market value
TOTAL ASSETS
LIABILITIES
Bank overdraft Payables for securities bought Payables for rederriptions Dividends and iriterest pyat)le Mar rayenlent tees payable Other payables and accruals Clptiori:; at market valuc
TOTAL LIABILITIES
TOTAL NET ASSETS
Schroder Schroder Schroder ISF ISF ISF Schroder Schroder Schroder
Global Global Global ISF ISF ISF Equity Property Smaller Global Greater Hong Kong Yield Securities Companies Technology China Equity usu IJSD USD IJSD usv HKD
83.7Fj4.902 418.267,Y74 77,237,407 19,325,543 1.2/0,801.902 4.21 O.t)84,788 (8.784.644) (38,809.995) (1,314,768) (1,492,440) (39.G19.724) 310,912,251
56,970,258 360,457,979 70,922,639 17,833,103 1,23K182,178 4,521,897,039
85.738 1.175
56,970,258 360,543,717 70,922,639 17,833,103 1,231,182,178 4,521,898,214
7,069,450 3,385.81 2 2,286.203 14,242,139 67,233,748 2.044,l 68 1,583,201 447.313 3,082 ,774 44.340.848
94,ZYI r.08.816 14.192 37,252 3,761,332 73,604,782 107.154 5 1 1.485 127,319 1.17/ 7.188.061 1.772.793
4 1,789 11,YIO 7.453 3.244
59,282,948 363,421,082 76,020,616 20,603,292 1,254,437,284 4,708,850,385
1,355,425 8,912,441 314.51 i 281.147 - 45.392.871
63.0 10 2,782,459 1,7 19.081 81 4.753 14,130.393 3,812,701 54.827 38,422 337,293 3/.309 25,282 1,517,799 6,942,074 20.31 1 140.889 34.787 17,350 882.159 2.474.450
7.500
174,570 13,528,507 2,105,754 1,126,020 16,330,351 57,522,097
59,108,378 349,892,575 73,914,862 19,477,272 1,238,106,933 4,651,328,288
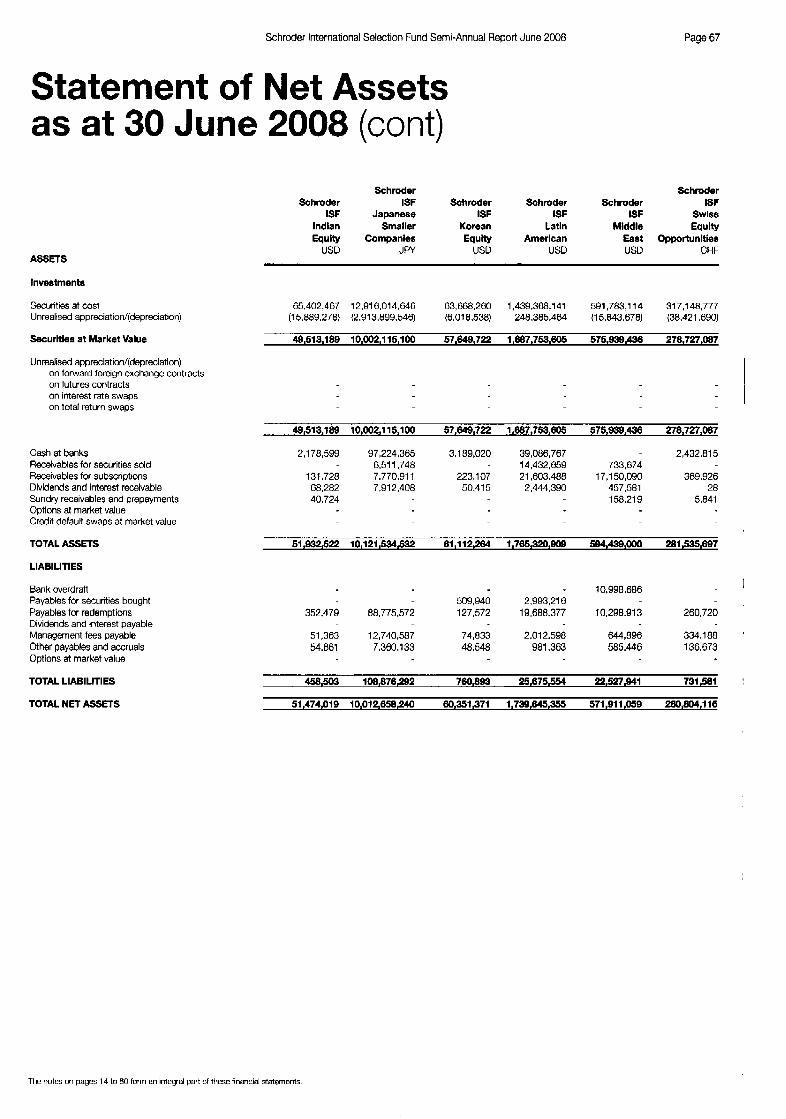
Schroder International Selection Fund Semi-Annual Report June 2008 Page 67
Statement of Net Assets as at 30 June 2008 (cont)
ASSETS
Investments
Securities at cost Unrealised appreciation/(depreciation)
Securities at Market Value
Unrealised appreciatim/(depreciation) on forward foreign exchange contracts on futures contracts on interest rate swaps on total return swaps
Cash at banks Receivables for securities sold Receivables for subscriptions Dividends and interest receivable Sundry receivables and prepayments Options at market value Credit defaun swaps at market value
TOTAL ASSETS
LIABILITIES
Bank overdraft Payables for securities bought Payables for redemptions Dividends and interest payable Management fees payable Other payables and accruals Options at market value
TOTAL LIABILITIES
TOTAL NET ASSETS
Schroder Schmder Schrocler ISF Schroder Schrotler Schmder ISF
ISF Japanese ISF ISF ISF swiss lndlan Smaller Korean Lath Mlddle Equity Equlty Companles Equity American East Opportunities
US0 JPY USD USD USD CHF
40,513,189 10,002,115,100 57,649,722 1,687,753,605 575,-,438 278,727,w17
49,5ia,iw 10,002,1i5,100 57,649,722 i,m,rs,m 575,999~96 278,727,087
2,178,599 97,224,365 3,189,020 39,086,767 2,432,815 6.51 1,748 - 14,432,859 733,674
131 -728 7.770.91 1 223,107 21,603,488 17,150,090 369,926 68,282 7.91 2,408 50,415 2,444,390 457.581 28 40.724 158.219 5,841
51,932,522 10,121,534,532 81,112,284 1,785,320,909 594,498,WO 281,535,697
1 - 10,998,686 509,940 2,993,216
352.479 aa.775.572 127.572 i9.6aa.377 10,298,913 260,720
51,363 12,740,587 74,833 2.012598 644,896 334.188 '
54.661 7,360,133 48,548 981,363 585,446 136,673
458,509 108,876,202 76O&Q3 25,675,554 22,527,941 731,581 !
51,474,019 10,012,658~40 60,3S1,371 1,739,645,955 571,011,WO 280,804,116
The notes on pages 14 to 60 form an integral part of these financial statements.
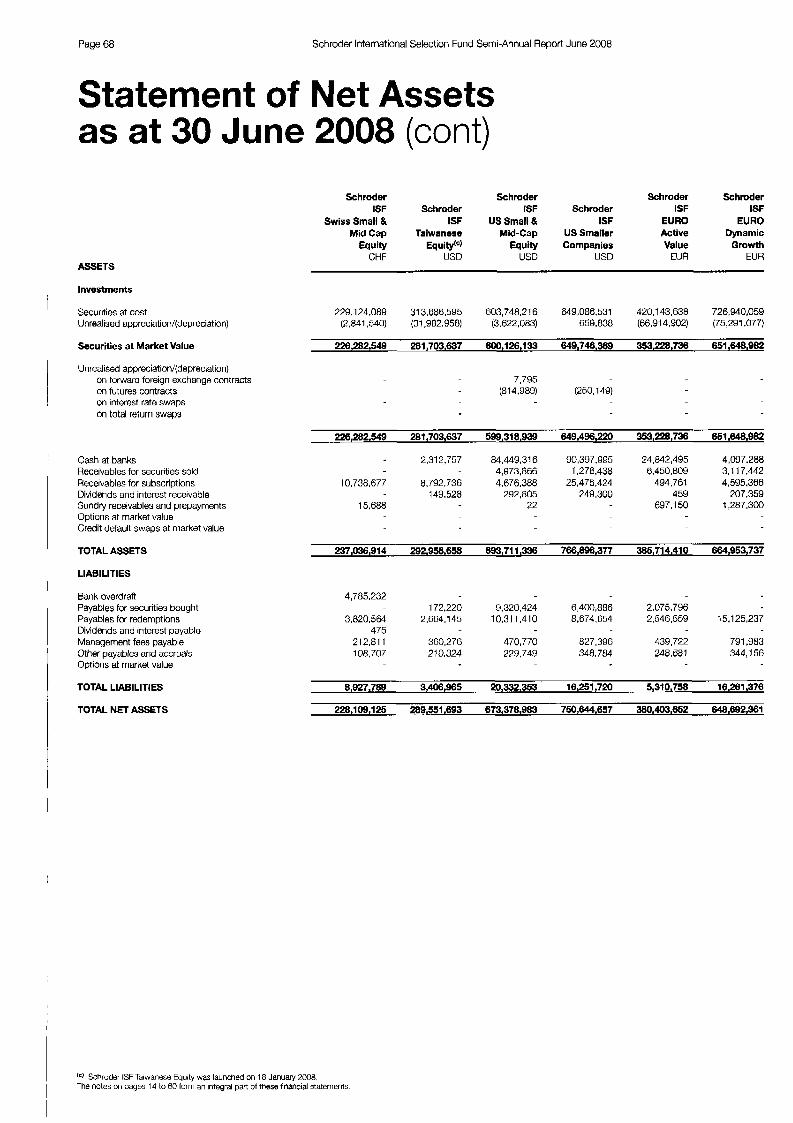
Page 68 Schroder International Selection Fund Semi-Annual Report June 2008
Statement of Net Assets as at 30 June 2008 (cont)
ASSETS
Schroder Schmder Schmder Schmder ISF Schmder ISF ISF ISF Schmder
Swiss Small & ISF USSmallt? ISF EURO EURO Mid Cap Taiwanese Mid-Cap US Smaller Active Dynamic
Equity Equi@ Equity Companies Value Gmwth CHF USD USD USD EUR EUR
Investments
Securities at cost Unrealised appreciation/(depreciation)
Securities at Market Value
Unrealised appreciation/(depreciation) on forward foreign exchange contracts on futures contracts on interest rate swaps on total return swaw
Cash at banks Receivables for securities sold Receivables for subscriptions Dividends and interest receivable Sundry receivables and prepayments Options at market value Credit default swaps at market value
TOTAL ASSETS
LIABILITIES
Bank overdraft Payables for securities bought Payables for redemptions Dividends and interest payable Management fees payable Other payables and accruals Options at market value
TOTAL LIABILITIES
TOTAL NET ASSETS
229.124.089 313,686,595 603,748.21 6 849,086,531 420,143,638 726,940,059 (2,841,540) (31,982.958) (3,622,083) 659.838 (66,914,902) (75,291,077)
226,282,549 281,703,637 600,126,133 649,746,389 353,220,736 651,648.982
7.795 (81 4.989) (250.1 49)
226,262,549 281,703,637 599,318,939 649,496,220 353,228,738 651,648,082
2,312,757 84,449,316 90,397.995 24,842,495 4,097,288 8,450,809 3,117,442 1,278,438
10,738,677 8.792.736 4,676,388 25,476.424 494,761 4,595.366 149.528 292,805 249,300 459 207,359
15.688 22 697,150 1,287,300
4,973,866
237,036,914 292,958,858 693,711.336 766,896,377 385,714.410 664,953,737
4,785,232
3,820,564 2,664,145 10.311.410 8,674,654 2,546,559 15,125,237
21 2.81 1 360,276 470,770 827,396 439,722 791,983 108,707 21 0,324 229,749 548.784 248.681 344,156
172,220 9,320,424 6,400,886 2.075.796
475
8,927.789 3,406,965 20,332,353 16,251,720 5,310,758 18,261,376
228,109,125 289,551,693 673,378,903 750,644,657 380,403,652 648,692,361
1') Schroder ISF Tawanese E w t y was launched on 18 January 2008. The notes on pages 14 to 60 form an integral part of these financial statements 1
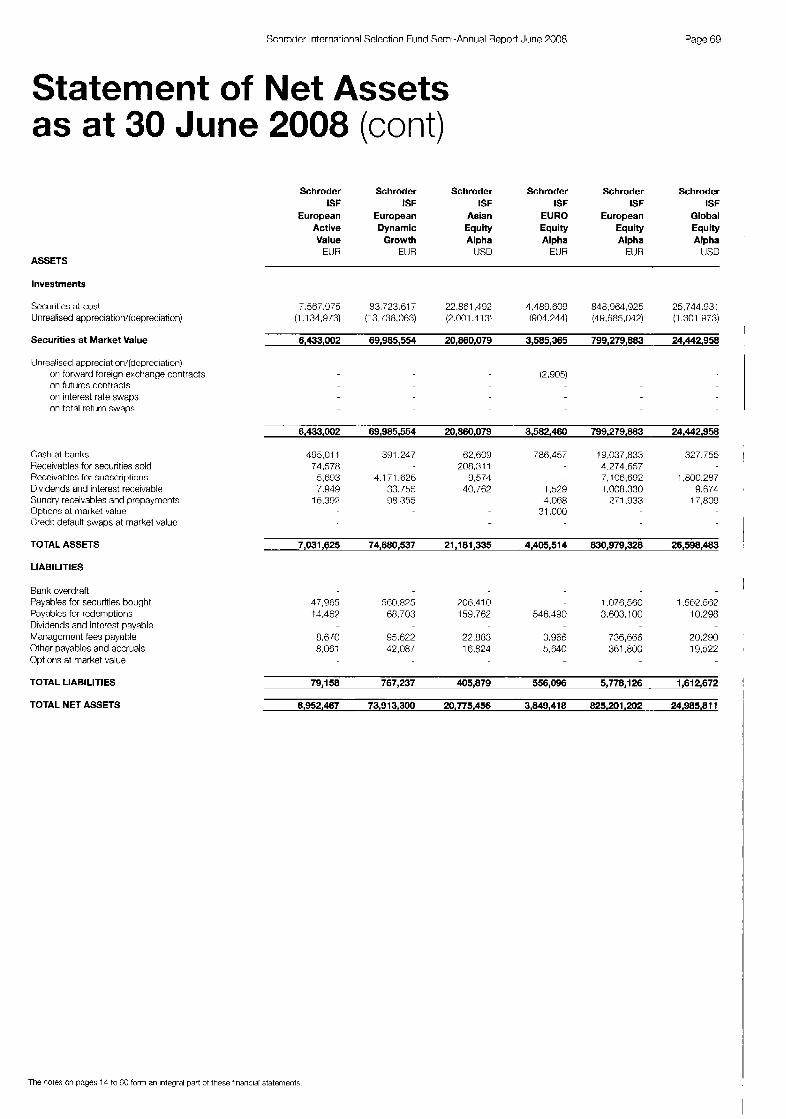
Sctirnrlcr lntcrnatinnal Sclcctinn Fund Scrni-Annual Report June 2008 Page 69
Statement of Net Assets as at 30 June 2008 (cont)
ASSETS
Investments
Securities at cost Unrealised appreciation!(cjepre(:iwion)
Securities at Market Value
Unrealised appreciation/(dcprcciatton) on forward foreign exchange contracts on futures contracts on interest rate swaps on total retim swaps
Cash at tmriks Receivables for securities sold Receikables for subscriptioris Dividends and interest receivahle Sundry receivables and prcpaymcnts Options al market value Credit defai.ilt swaps at market value
TOTAL ASSETS
LIABILITIES
Bank overdraft Payables for securities bought Payables for redemptions Dividends and intcrcst payable Managcmcnt fees payable Other payables and accruals Optioris at market value
TOTAL LIABILITIES
TOTAL NET ASSETS
Schroder Schroder Schroder Schroder Schroder Schroder ISF ISF ISF ISF ISF ISF
European European Asian EURO European Global Active Dynamic Equity Equity Equity Equity Value Growth Alpha Alpha Alpha Alpha
ElJR ElJR lJSD EUR ElJR lJSD
7,567,975 83.723.617 22.861.192 1.189.609 818.964.925 25.744.G31 (1.1 34.9 13) (1 3, /38.063) (2.001 .A 13) (904.244) (49.685.0/12) (1.301.973)
6,433,002 69,985,554 20,860,079 3,585,365 799,279,883 24,442,958
12,905)
6,433,002 69,985,554 20,860,079 3,582,460 799,279,883 24,442,958
405.01 1 301.247 62.609 7863.457 19,037,833 327.755
5,693 4.171.826 0.571 7,106,682 1.800287 1.949 33,155 40,162 1.529 1.008.330 9.6/4
15,39P 90.355 4.068 271,933 17.809
74,578 2OR.311 4,274,6357
31.000
7,031,625 74,680,537 21,181,335 4,405,514 830,979,328 26,598,483
47.065 5Rn.nP5 P06.410 1.076.560 1.562.567 14.467 68.703 159.762 546.490 3.603.100 10.298
8.6t0 95.622 22.883 3.966 736,GtiG 20.290 8.061 42,ORI 16.824 s.li40 361 ,800 19.522
79,158 767,237 405,879 556,096 5,778,126 1,612,672
6,952,467 73,913,300 20,775,458 3,849,418 825,201,202 24.985.81 1
The vies on [1;19e!; 14 to 90 form an integral pan of these ‘inancid s!atements
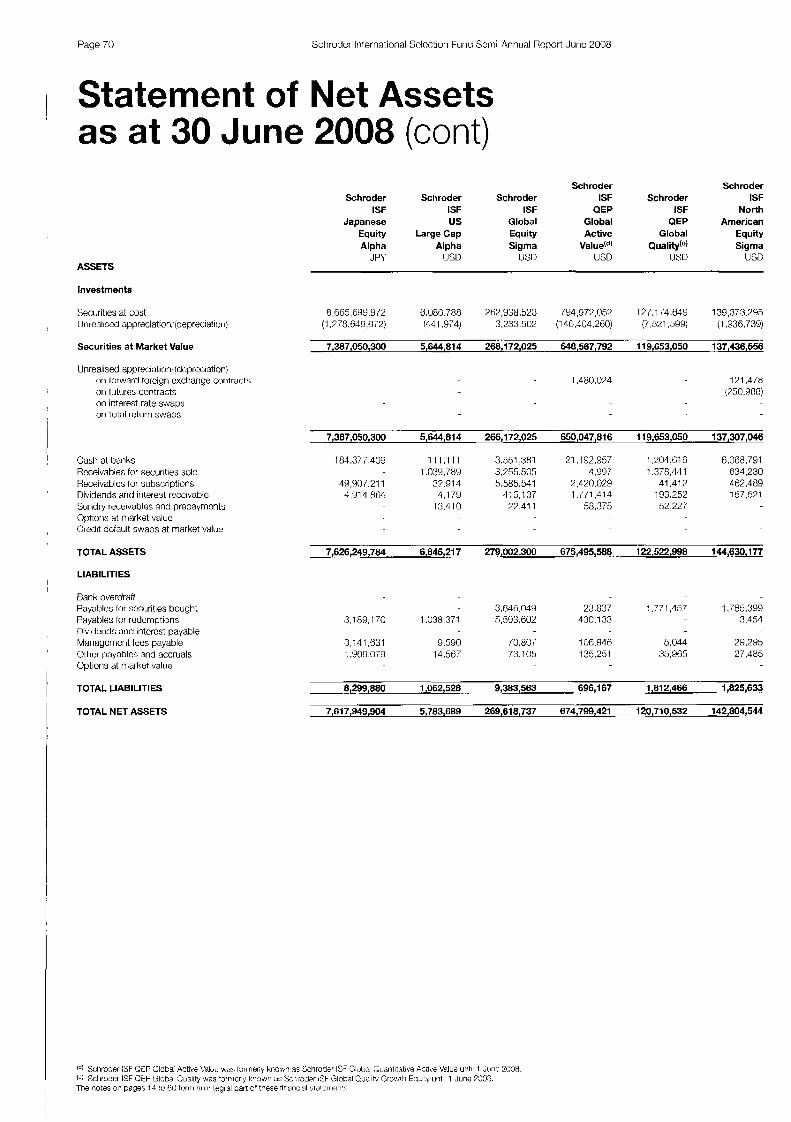
Page 70 Schroder lriternational Sclccriori Furid Serrii-Annual Rcporl Jurie 2000
I Statement of Net Assets as at 30 June 2008 (cont)
ASSETS
Investments
Securities at cost I Jrirealiscd a~preciation:(depreciatlori!
Securities at Market Value
Unrealised apprei:ialiciii:fdeprcciation) on lorward torcign exchange coritracts on tutiiros contracts on interest rate swaps on total retimi :;waus
Cash al banks Rcceivables for securities sold Receivables for subscriptions Dividerids arid iriterest rcccikable Sundry receivables and prepayments Optloris at niarket valuc Credit dcfault swaps at market VAie
TOTAL ASSETS
LIABILITIES
Bank overdraff Payables for securities bought Pdyables tor rodcniptions Dividerids arid intcrcst payable Management fees pdyable Other p;~yables and accruals Options at market valiue
TOTAL LIABILITIES
TOTAL NET ASSETS
Schroder Schroder Schroder Schroder Schroder ISF Schroder ISF
ISF ISF ISF QEP ISF North Japanese us Global Global QEP American
Equity Large Cap Equity Active Global Equity Alpha Alpha Sigma Value(d' Sigma
JPY LJSU ijSD USD {JSD USD
8,665.6:1Y,9/2 0.080.788 2f2.938.523 794372,052 12/.1 T4.049 139,373,295 (1 ,?74.049,D72) (441.974) 3,233.502 (146,404,2013) (7.521.3YY! (1,530,739)
7,387,050,300 5,644,814 266,172,025 648567,792 I 1 9,653,050 137,436,556
1.480.024
7,387,050,300 5,644,814 266,172,025 650.047,816 119,653,050 137,307,046
184.377.409 111,111 3,551,381 21.192.957 1,204,616 6.068.791 1,099,789 3.255.805 1,w 1.378.44 1 634,230
49,901.21 1 37.914 5585.541 2,420.029 41.41 7 462,489 4.Y14,8d.1 4.17Y 415,137 1 .ill ,414 103,252 157,521
13.410 77.41 1 58,375 52,227
7,626,249,784 6,846,217 279,002,300 675,495,588 122,522,998 144,830.1 77
3.04fi.049 23,837 1.77 1,157 1.765.399 3,189,170 1 LM.371 5,593,802 430,133 3,451
3,14l,!i31 9.590 1'0,807 1 OB,(J48 6.044 29,2Y5 1 ,UYj9,137Q 14.567 73.105 135.251 35.965 27,485
8,299,880 1,062,528 9,383,563 696,167 1,812,466 1,825,633
7,617,949,904 5,783,689 269,618,737 674,799,421 120,710,532 142,804,544

Schroder International Selection Fund Semi-Annual Renort June 2008 Page 71
Statement of as at 30 June
ASSETS
Investments
Securities at cost Unrealised appreciation/(depreciation)
Securities at Market Value
Unrealised appreciation/(depreciation) on forward foreign exchange contracts on futures contracts on interest rate swaps on total return swaps
Gash at banks Receivables for securities sold Receivables for subscriptions Dividends and interest receivable Sundry receivables and prepayments Options at market value Credit default swaps at market value
TOTAL ASSETS
LIABILITIES
Bank overdraft Payables for securities bought Payables for redemptions Dividends and interest payable Management fees payable Other payables and accruals Options at market value
TOTAL LIABILITIES
TOTAL NET ASSETS
Net Assets 2008 (cont)
Schroder Schroder Schroder Schroder ISF ISF ISF Schmder
ISF Absolute Emerging Emerging ISF Schmder Absolute Return Europe Markets European ISF
Return Bond Debt Absolute Debt Absolute Absolute EURO
USD US0 EUR USD EUR EUR Bond R I Return(') Return(g1 Return Bond
92,061,853 6,803,886 154,791,933 4,353,712,604 300,007,455 254,998,993 (1,947,794) (74,526) 9,453,769 127,400,180 (41,141,665) (8,253,047)
m,i i 4,050 6,729,360 164,245,702 4,481,112,784 258,865,790 246,745,946
201,288 (1,064) (2,081,063) (38,399,856) (7,651 ) 321.837 , (1 51,286) 447 (1 91,240) (1 95,608) (23,410)
w , r n 8 , 4 ~ 1 6,705,333 162,164,639 4,442,712,928 258,858,139 246,876,543
4,919,024 4,279,280 I 7,033,284 1~ .852 .551 602,926 5,910,311 i - 14.850.197 1,043,750
1.91 6,748 35,232,097 67,529 2.692.833 620.1 73 25,262 2,956,284 48,737,745 547.481 5.264.1 16 109,972 16,552 31 -072 418,708 1 10,443 15,118
- 11.857.454 243.023 249,770 23,187 332.1 14
95,867,392 11,049,614 184,102,027 4,631,954,029 286,894,169 262,377,808
22,982.337 994,342 9.538.082 74,277 2,152.788 15,101,444 1 .I 87,576 2,121,368
30,306 7.91 7.1 79 11,082 27 101,713 3,365,643 330,540 95,654 ' 53.926 11,931 107,919 2,035,373 235.687 93,376
23,121,622 1,006,300 11,930,8WI 28,419,639 1,753,803 2,310,398
72,745,770 10,043,314 172,171.219 4,803,534,390 285,140,366 260.067.410
(0 Schroder ISF Emerging Europe DeM Absolute Return was formerly known as Schroder ISF Converging Europe Bond until 1 June 2008 Schroder ISF Emerging Markets Debt Absolute Return was formerly known as Schroder ISF Emerging Markets Debt untd 1 June 2008.
Tho notes on pages 14 to 60 form an integral pari of these financial statements.

Page 72 Schroder International Selection Fund Semi-Annual Report June 2008
Statement of Net Assets as at 30 June 2008 (cont)
ASSETS
Investments
Securities at cost Unrealised appreciation/(depreciation)
Securities at Market Value
Unrealised appreciation/(depreciation) on forward foreign exchange contracts on futures contracts on interest rate swaps on total return swaps
Cash at banks Receivables for securities sold Receivables for subscriptions Dividends and interest receivable Sundry receivables and prepaymerits Options at market value Credit default swaps at market value
TOTAL ASSETS
LIABILITIES
Bank overdraft Payables for securities bought Payables for redemptions Dividends and interest payable Management fees payable Other payables and accruals Options at market value
TOTAL LIABILITIES
TOTAL NET ASSETS
Schmder Schmder ISF Schroder Schmder
ISF Schroder Schroder Global ISF ISF
Short Term Eumpean Global Linked Dollar Dollar Bond Bond Bond Bond Bond Bond
EUR EUR USD EUR HKD USD
EURO ISF ISF Inflation Hong Kong US
573,358,839 86,330,480 260529.383 305,937,452 264,306,860 427,992,032 (9,383,598) (4,142,655) 2,294.900 (7.646.094) (3,395.133) (4,789,376)
563,975,241 82,157,815 262,824,283 299,291,358 260,911,727 423,202,656
935.321 6.571 (89,655) 3.758.328 (290,430) 38,293 (1 64,531) (76,658)
(508,490)
21 1 203.523
564,620,132 82,202,679 262,081,607 302,973,028 260,911,727 423,406,390
9,401,662
25,003,740 27,717 24,720 11291,341 542,509 1.01 1,815 9,640.91 3 1,883,231 2.632.756 2,249,595 1,512,269 1,886,915
2.392.919 243,986 36.449.91 1 - 33,900,981 526,434
6.289 7,560 3 1,361
640.1 90 920,700
602,663.993 84,385,173 302,335.621 316.513,964 296,868,847 436,627,482
2,634,913 - 28,318.711 5,994,194 - 49.000.104
13.545.487 360.297 833.753 703,950 640,090 2,208,665
239.667 49,529 62.393 169,682 91,047 185,380 182.008 37,505 78,772 138,879 92,968 99,328
167,417
13,967,162 447,332 29,293,629 9,641,628 991,522 51,493,477
588,696,831 83,917,841 273,041,992 308,872,336 295,877,325 385,134,005
I I The notes on pages 14 to 60 form an Integral part of these financia staterrlents
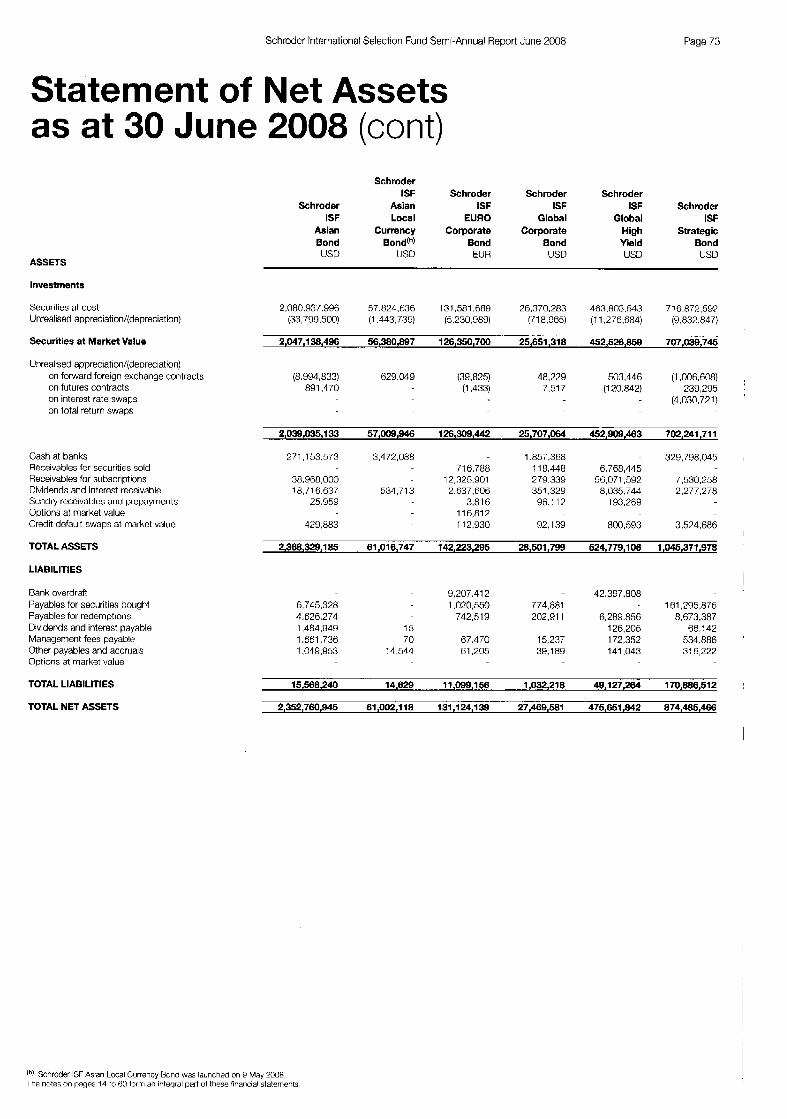
Schroder International Selection Fund Semi-Annual Report June 2008 Page 73
Statement of as at 30 June
ASSETS
Investments
Securities at cost Unrealised appreciation/(depreciation)
Securities at Market Value
llnrealised appreciation/(depreciation) on forward foreign exchange contracts on futures contracts on interest rate swaps on total return swaas
Cash at banks Receivables for securities sold Receivables for subscriptions Dividends and interest receivable Sundry recelvaties and prepayments Options at market value Credit default swaps at market value
TOTAL ASSETS
LIABILITIES
Bank overdraft Payables for securities bought Payables for redemptions Dividends and interest payable Management fees payable Other payables and accruals Options at market value
TOTAL LIABILITIES
TOTAL NET ASSETS
Net Assets 2008 (cont)
Schroder ISF
Asian Bond USD
Schroder ISF Schroder Schroder Schroder
Asian ISF ISF ISF Schroder Local EURO Global Global ISF
Currency Corporate Corporate High Strategic Bond(h) Bond Bond Yield Bond
lJSD EUR USD US0 USD
2.080.93/.996 57.824.636 131,581.689 26.370.283 463,803,543 716.872.59? (33,799,500) (1.443.739) (5.230.989) (718.965) (1 1,276,684) (9.837.847)
2,047,138,496 56,380,897 126,350,700 25,651,318 452,526,859 707,039,745
(8,994,833) 629,049 (39.825) 48.229 503,446 (1,006,608) 891.470 (1.433) 7.517 (1 20.842) 239,295
- (4,030,721)
2,039,035,133 57,009,946 126,309,442 25,707,064 452,909,483 702,241,711
271.153573 3.472.088 1.857.368 - 329,798,046 11 6,788 118,448 6,768,445
38,968,000 12,325.901 279.339 56,071,592 r.530.258 18,716.637 531.713 2.637.606 351,329 8,035,744 2,277.278
25.959 3,81 6 96.117 193,269 11 6,812
429,883 11 2.930 92.139 800,593 3,574,686
9.207.41 2 - 42,397,808 6,745,328 1.020.550 774,881 - 161 295.875 4,626,274 742.519 202.91 1 R.289.856 8.673.387 1,484,949 15 126.205 66.142 1,661.736 70 67.470 15,237 172,352 534.886 1,049,953 14.541 61,205 39,189 141,043 31 6,222
15,588,240 14,829 11,099,1!56 1,032,218 49,127,264 170,886,512
2,352,760,945 61,002,118 131,124,139 27,469,581 475,651,842 874,485,466
(“1 Schrnder ISF Asian Local Currency Bond was launched on G May 2008 The notes on page:: 14 to 60 f3rm an integral part of these flnancral statements
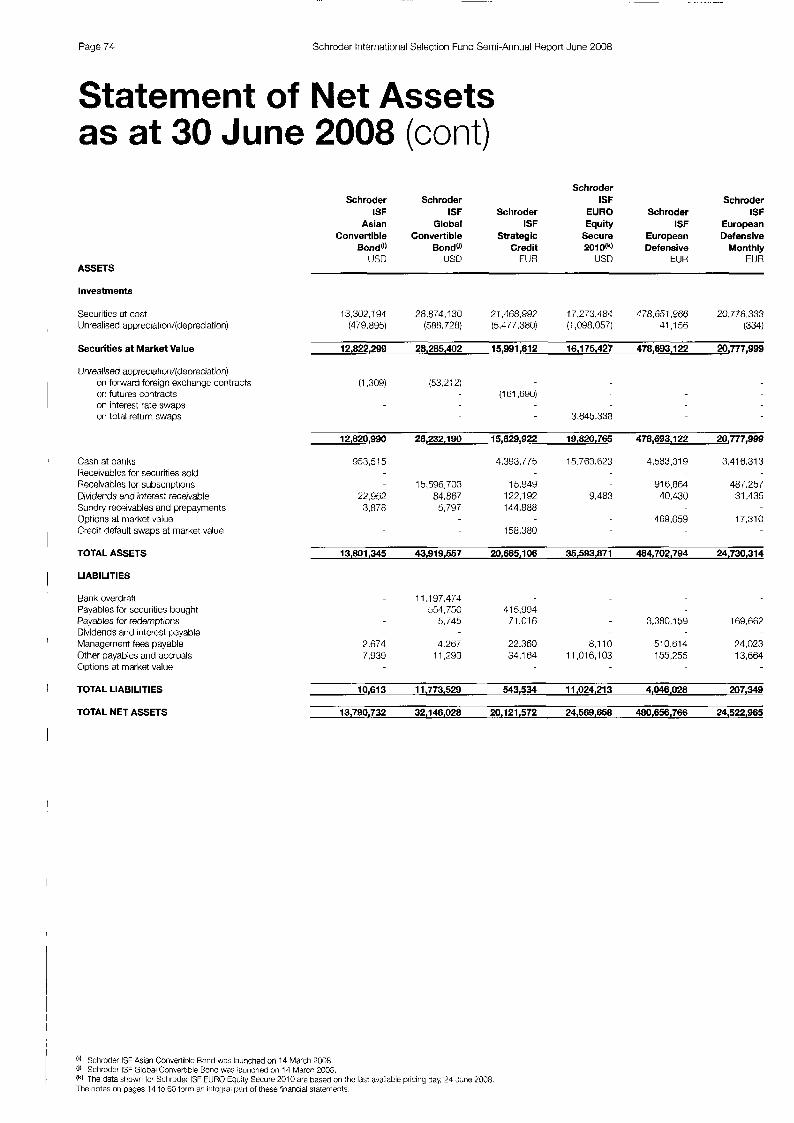
Page 74 Schroder Iriternational Selection Furid Semi-Annual Report June 2008
Statement of Net Assets as at 30 June 2008 (cont)
ASSETS
Schmder Schroder Schroder ISF Schmder
ISF ISF Schroder EURO Schroder ISF Asian Global ISF Equity ISF European
Secure European Defensive Bond(') Bondti) Credit 20i0(k) Defensive Monthly
USD USU ElJR USD EUR EUR
Strategic Convertible Convertible
Investments
Securities at cost Unrealised appreciation/(depreciation)
Securities at Market Value
Unrealised appreciatior i/(deprewation) on forward foreign exchange contracts o r 1 futures contracts on interest rate swaps o r 1 tot:il return swaos
1 Cash at banks I-ieceivables for securities sold Receivables for subscriptior is Dividends and interest receivable Sundry receivables and prepayments Options at market value Credit default swaps at market value
TOTAL ASSETS I
I LIABILITIES
Bank overdratt Payables for securities bought Payables for redernptioris Dividends arid iriterest payable
Other payables and accruals Options at market value
I Managerrierit fees payable
I TOTAL LIABILITIES
TOTAL NET ASSETS
13,302,194 28,874,130 21,468,991 17,273,484 478,661,966 20,778333 (479.895) (588.728) (5.477.380) (1,098,057) 41,156 (334)
12,822,299 28,285,402 15,991,612 16,175,427 478,693,122 20,777,999
(1,309) (53.212) (1 G I ,690)
3645,338
12,820,990 28,232,190 15,829,922 19,820,765 478,693.122 20,777,999
9533 15 4.393.775 15.783.823 4,583,319 3.41 6.313
- 15,596,703 16.949 91 6,864 487,257 22,962 84.867 122,192 9.483 40,430 31.435
469,059 17,310 3.878 5.797 144,888
158,380
13,801,345 43,919,557 20,665,106 35,593,871 484,702,794 24330,314
11,197,474 554.750 41 5.994
5.745 71.01 6 3,380,159 169,662
2.674 4.267 22,360 8,110 510.614 24,023 ($39 11.293 34.164 11,016,103 155.755 13,664
10,613 1 1.773,529 543,534 11,024,213 4,048.028 207,349
13,790,732 32,146,028 20,121,572 24,569,658 480,656,766 24,522,965
('1 SChfOdef ISF AsIan Convenible Bcnd was launched on 14 March 2008. u' 3-hfoder ISF Global Convert.ble Bond WJE :aurictwd o n 14 M a w 2006. (k) The data shotm for Sctirodo: ISF EURO EqiJ:ty Secure 2010 are based ai1 !hi' 1351 The !notes oil pages 14 to 50 form an iritcqa, part gf th&e qnanclal stateme-ts.
:able prlcing day, 24 U'J~C 20G8
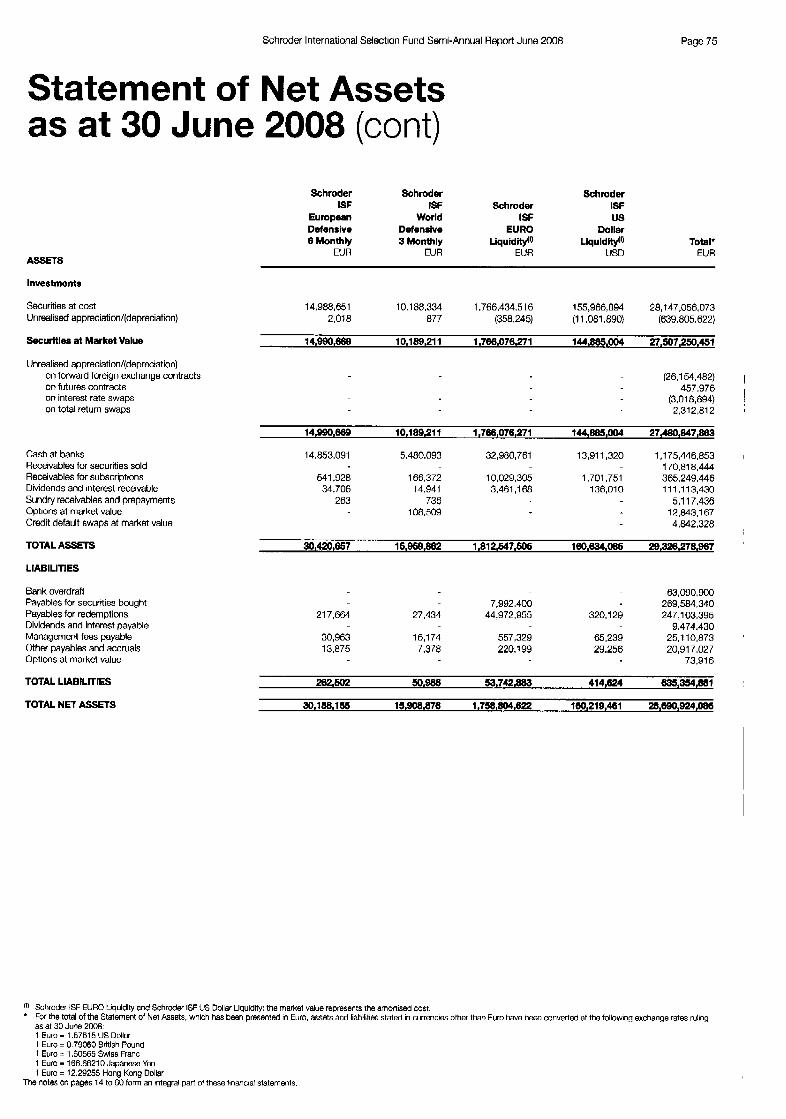
Schroder International Selection Fund Semi-Annual Report June 2008
Statement of Net Assets as at 30 June 2008 (cont)
ASSETS
Investments
Securities at cost Unrealised appreciation/(depreciation)
Securltles at Market Value
Unrealised appreciation/(depreciation) on forward foreign exchange contracts on futures contracts on interest rate swaps on total return swaps
Cash at banks Receivables for securities sold Receivables for subscriptions Dividends and interest receivable Sundry receivables and prepayments Options at market value Credit default swaps at market value
TOTAL ASSETS
LIABILITIES
Bank overdraft Payables for securities bought Payables for redemptions Dividends and interest payable Management fees payable Other payables and accruals Options at market value
TOTAL LIABILITIES
TOTAL NET ASSETS
Page 75
Schroder Schroder Schroder
European World ISF us ISF ISF Schroder ISF
Defensive Defensive EURO Dollar 6 Monthly 3 Monthly Liquidity(') Llquldity(') Total'
EUR EUR EUR USD EUR
14,988,651 10,188,334 1.766.434.51 6 155,966,894 28,147,056,073 2.018 077 (358,245) (1 1,081,890) (839,805,622)
14,990,669 10,189,211 1,766,076,271 144,885,004 27,507,250,451
(26,l 54,482) I
(3,018,894) I 2.312.812 I
457,976
14,990,889 10.189.211 1,768,016,271 144,885,004 27,480,847,863
14.853.091 5.480.093 32,980,761 13,911,320 1,175.446.853 170,818.444
54 1.928 166,372 10,029,305 1,701.751 365,249.446 34,706 14.941 3,461,168 136,010 1 1 1,113,430
263 736 5.1 17.436 108.509 12.843.1 67
4,842,328 I
30,420,857 15,959,862 1,812,547,505 160,694,085 29,326,278,907 '
63,090,900 269,584340
217.664 27,434 44,972,955 320,i 29 247,103,395 9.474.430
13,875 7,378 220,199 29.256 20,917,027 73.91 6
7,992,400
30,963 16,174 557,329 65,239 25.110.873 '
282,502 50,888 5 3 , 7 4 2 m 414,624 635,354,881 ~
30,1~,155 15,808,876 1,756,804,622 160,219,461 28,690,924,088
"I Schrooer ISF ELRO Lqu dity and Schrmer ISF US Dol ar Liqu dily tne mawet vaue represents me amortised cost * For the total of the Statement of het &sets wnicn h a been presenteo fn E4ro. assets and iabtLties stated n currencies othef than Euro have ~ e e n wndenec at the fo lowing exchange rates ruling
as at 30 June 2008 1 Euro = 1 57615 US Doliar 1 Ed0 = 0 79060 BrrIisn Pcwd 1 Euro = 1 60665 Swiss Franc 1 Euro = 166 66210 Japanese Yen 1 Euro = 12 29255 hong Kong Do Iar
Tne notes on pages 14 to 60 form an integral pan of these financial statements

Page 76 Schroder International Selection Fund Semi-Annual Report June 2008
Statement of Net Assets as at 30 June 2008 (cont)
Schroder Schroder
ISF ISF European ISF ISF ISF EURO European Large Qlobal Italian Japanese Equity Equity Cap Equity Equity Equity
EUR EUR EUR USD EUR JPY
Schtwder Schroder Schroder ISF Schmder
Net Asset Value as at 30 June 2008
Shares Outstanding as at 30 June 2008 Class A Dis
Class A Dis (EUR)”” Glass A Dis (GBP)* Class A Dis (GBP)’* Class A Dis (SGD)* Class B Dis Class C Dis Glass C Dis (GBP)’ Class C Dis (GBP)** Class C Dis (USD)** Class I DIS Class P Dis Class P Dis (EUR)”” Class AI Dis Glass AI 01s (EURY Class A I Dis (EUR)’’ Class A1 Dis (USD)’ Class B1 Dis Class B1 Dis (EUR)”’ Class A Acc Class A Acc (EUR)’ Class A ACC (EUR)” Class A ACC (SGD)” Class A Acc (SGD)”” Class A Acc (USD)’ Class A Acc (USD)”” Class B Acc Glass B Acc (EUR)’ Class B Acc (EUR)’* Class B Acc (USD)** Class C ACC Class C Acc (AUD)* Class C Acc (EUR)’ Class C Acc (EUR)** Class C Acc (GBP)”’ Class C ACC (USD)“ Class D Acc Class D Acc (EUR)’ Class I Acc Class I Acc (AUD)” Class I Acc (EUR)* Class I Acc (EUR)** Class I Acc (GBP)** Class I ACC (USD)*f Class J ACC (JPY)” Class A I ACC Class A I Acc (EUR)’ Class A1 Acc (EUR)”” Class AI Acc (SGD)”” Class AI Acc (USD)” Class B1 ACC Class B1 Acc (EUR)”” Class B1 Acc (USOp
1,382.81 7,336
3.809.666
38.959 116.133
19,176,932
7,599.551
18.192.313
9,598,101
1 .I 62,239
492,931 64,952
20,781,553
1,135,686
182.535
171,309
93,880
123
123
36,122
81.993.671
36,096
598 1,699
206.386
83,280
22,434
180.608
10,297
47,963,494
300,667
1524.040
124
579.288
24.51 1
577,394
36.01 8
41,934
184.31 5,800
145,165
13,986 21.01 8
2,557,368
2,941,225
715.418
45
383.867
1,975
77,392,232.323
2,958,205
50,342 1,399,802
25,761,090
135,222
8,727,107
54.824
13,320,454
121,456
29.1 63,981
100
4,324,119
9.476
I 75,928 89.492
37,251
Unhedged multicurrency classes. ** Hedged multicurrency classes - Partially hedged (by Fund Manager) rnulticumncy classes The nates on pages 14 10 60 form ar integral part of these rinancid statements
’

Schrnder lnternaliclnal Selection Fund Semi-Annual Rcport Junc 2008 Page 77
Statement of Net Assets as at 30 June 2008 (cont)
Schroder SChroder Schroder ISF Schroder Schroder Schroder
ISF ISF European ISF ISF ISF EURO European Large Global Italian Japanese Equity Equity Cap Equity Equity Equity
EUR EUH ElJR USD EUR J PY
Net Asset Value per share(') as at 30 June 2008 Class A Dis
Class A Dis (CUR)** Class A Dis (GRP)* Class A Dis (GBP)" Class A Dis (SGD)' Class 0 Dis Class C Dis Class C Dts (GRP)* Class C Dis (GBF')'' Class C Dis (IJSD)** Class I Dis Class P Dis Class P Dis (EUR)** Class A1 Dis Class A I Dis (HJRY Class A1 Dis (ElJri)" Class A1 Dis (IISD)* Class B1 Dis Class B1 Dis (EUR)" Class A Ace Class A Acc (EUR)' Class A Ace (EUR)'* (:lass A Ace (SGD)* Class A Ace (SGD)** Class A ACC (LJSD)* Class A Acc (USDr* Class 0 Ace (.:lass D Ace (EUR)' Class R Ace (EURI** Class t3 Acc (IJ:;DI** Class C Acc Class C Ace (ALID)* Class C ACC (EUR)* Class C Acc (EM{)** Class C A(:(: ((.33P)** Class C Ace (IJSO)** Class 0 Acc Class I) Acc (EIJR)* Class I Am: Class I ACC (AIJD)* Class I Ace (EIJR)* Class I Acc (EUR)" (;lass I Ace (GBP)** Class I Acc (USD)** Class J Acc (JPy)' Class A I Ace Class AI Acr: !ElJR)* Class AI Ace [EUR)" Class A1 Acc (SGD)" Class A I ACC (USD)* Class B1 Acc Class 01 Acc (EUR)** Class B1 Ace (USD)*
71.38 12.78 137.55
134.84 99.39
144.90
137.01
158.49
168.73
139.17
14.93 25.63 (96.69
15.70 25.38 27.74
20.82 21.79 13 OR
729.27 876.45
16.23
22.07 17.97 15.02 2f.62 795.22
85.74
20.90
23.81
17.74 14.76
16.05
25.97 729.14
84.47
877.03 13.5? 31 3 6
87.25
25.45 13.98
12.76
16.53 33.38 931.22
89.41
21 3 4 14.75 26.49 753.41
84.41
33.63 19.97
7. i? 689.31 24.67
6.52
' IJn!Wged riiulticurroncy ~ 1 8 5 ~ ~ s . ** Hedged rnulticurrency classes. *-' Pfirtially Wdgcd (by Fund Vanager) rnultcurrencb classes 'I) The Net Asset Value pfr r;harr. IC stated In the currency of the share class. T$e no:es on pages 14 to 53 f c m an Ir?tsgral part of t k s e financial stateTents
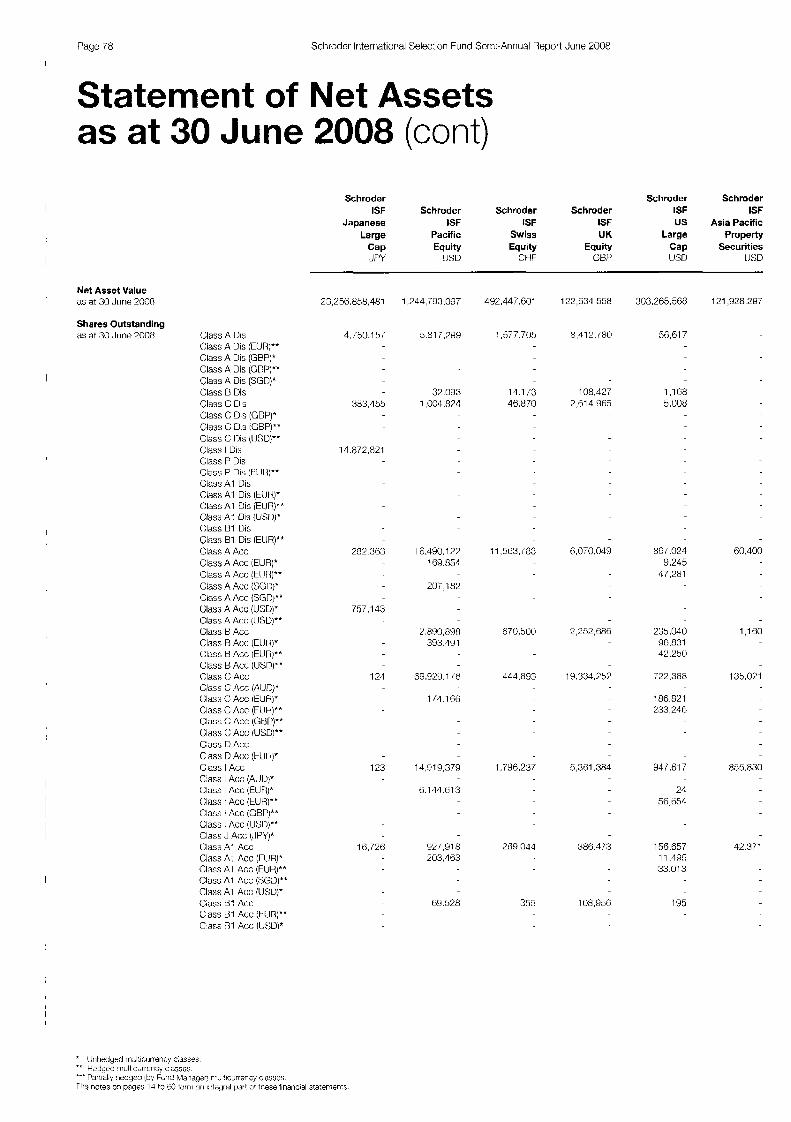
Page 78 Schrndcr lriterriational Selec:ion Fund Scrni-Aririual Report June 2008
Statement of Net Assets as at 30 June 2008 (cont)
Net Asset Value as at 30 J1.m 2008 I Shares Outstanding as at 30 June 2008 Class A Dis
Class A Uis (EUR]** Class A Dis (GRP)* Class A Dis (GBP)** Class A Dis (SUI)* Class B Dis Class C Dis Class C Dis (GBP)* Class C Dis iCBP)*- Class C: I3is (lJSU)--
Class P Dis !trlJl i)" Class AI 01s Class AI Uis (t1Jlp- Class AI Dis iEUR)** Class A7 01:; (lJSU]* (:la:;<; HI U l S
Class B1 Dis (EUR)** Class A Ace (:lass A Acc iEUR)* Class A Ace ( t L J n ) * * Class A Ace (SI))' Class A Ace (SGD)** Glass A ACC (I.)SD)* Class A A(:(: (LJSDY Cla:;s H Ace Class R Acc: (ELJf7)* (:lass tl Ace (EUR]** Class R Ace (USll)x* Class C Acc: Class C Acc (AIUDf (:la:;s C Acc EUH)* Class C Ace (FOR)** (.:lass (; ACC (car')-* Class C Acc (USD)** C:ass D Am; C ass D Ace (k UI {)* C ass I Acc C:ass I Ace (AIJII)" (:lass I Acc (EUH)* Cla:;s I Acc (EUR)** Class I Acc GBP!** Class I Ace ilJSD)** Class J Acc (.IPY]* (..I. .. ,<i.,s AI Acc
Class At Acc (EUR)** Class A1 Ace !SC;D)**
CIXS AI ~ c c (ruw
Cass 01 Ace (FUR)** C ass Dl A c c (LJ:;D)*
Schroder Schroder Schroder ISF Schroder Schroder Schmder ISF ISF
Japanese ISF ISF ISF US Asia Pacific Large Pacific Swiss UK Large Property
Cap Equity Equity Equity Cap Securities JPY IJSU CHF GBP USD I JSD
23,258,858,481
4,i50,157'
383,155
232.383
757.143
124
123
1 G,72B
I ,744,793,097
5.817.2'38
37,093 1.004.RP4
18,490.177 163.054
207,182
2.890.098 393.1'31
60.92Y.1 /ti
114.156
14,G19.379
8.144.ti15
E2/,Yl8 203,153
83.S28
4Y2,44 i.ooi
1.577.705
14.1 i 3 46.870
11,5ti3.183
870.500
444.893
1,796,237
209.044
355
122,631,558
8,412.180
108,427 7,61 4.9(-jL5
0,070.049
2,252,886
19,334,757
5,361,384
386.4~3
108.956
303.265568
5r?,G17
1.168 5,000
861.024 9,245
47,281
235.040 90,331 42.250
722.388
186.821 233.248
94 1.61 7
21 56,851
158.657 11.496 33.013
195
121,928.2W
00.400
1 , l B O
153,011
855,830
42.3/1
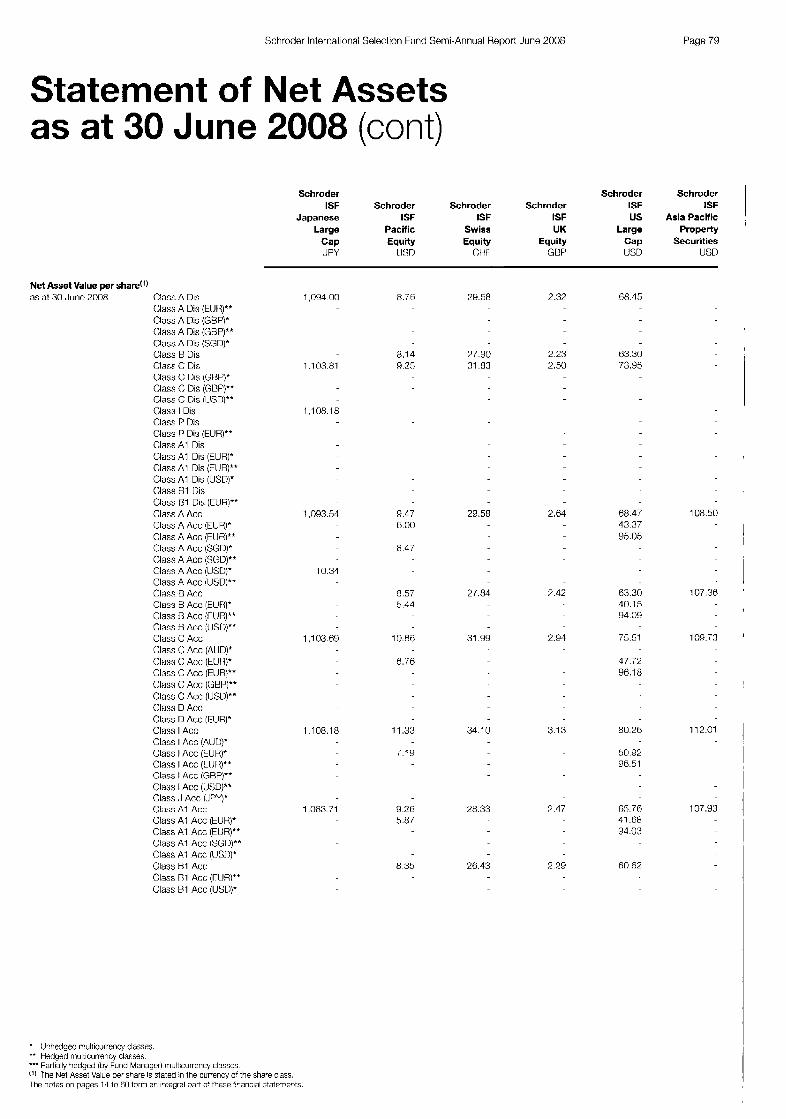
Schroder International Seleclion Fund Semi-Annual Report June 2008 Page 79
Statement of Net Assets as at 30 June 2008 (cont)
Schroder Schroder Schroder
Japanese ISF ISF ISF US Asia Pacific Large Pacific Swiss UK Large Property
Cap Equity Equity Equity Cap Securities JPY I 1m CHt GBF' USD USD
ISF Schroder Schroder Schroder ISF ISF
Net Asset Value per share('] as at 30 .lune 2008 Class A Dis
Class A Dis (ElJR)** Class A Dis (GBPP Class A Dis (GRP)** Class A Dis (SGD)* Class B Dis Class C Dis Class (.; Dis (GRP)*
Class C U s (JSD)** Class I Dis Class P Dis Class P Dis (EUR)" Class A I Dis Class A I Dis (EUR)* Class A1 [lis (EIUR!** Class A I Dis (USDY Class HI Ilis Class nl Dis (CUR)** Class A Acc Class A Acc <CUR!* Class A Acc <EIJR)**
Class C DlS (GBPY
Class A Acc !SGO)" Class A Ace i,SGU)** Class A Ace (USD)' Class A Acc ;USD)** (:lass B Act Class B Acc (EUR)' class n ACC ;ruR)** Class I3 Acc jUSU)** Class C Acc (:lass C Acc (AIJD)' Class C Acc (tlJl4)' Class C Acc (EUR)*' Class C Acc (GBP)** Class C Acc (LlSll)** Class D Ace Class D Acc IFIUH)" Class I Acc Class I Acc (AUD? Class I Acc (EM)* Class I Acc ( H J l 4 ) " ' Class I Acc (GRP)** CIRSS I ACC (IIC;D)** Class J Acc (JPY)* CIRSS A I Acc: Class A1 Acc (EM)* Class A I Acc (EUR)"* Class A I Acc (SGO)** Class A I ACC (U8))* Class R1 ACC class ni ACC (rim)** Class R1 Acc (USDY
1,094.00
1.1 03.81
1.108.18
1.093.54
10.31
1 .I 03.68
1 ,108.1 8
1.083.71
8.76 29.58 2-39 68.45
8.14 9.25
?7.90 2.23 31.83 2.50
63.30 73.95
9.47 6.00
8.47
29.58 2.64 68.47 43.37 95.05
108.50
- 1 I 1 1
107.36 ' 8 . 5 i 5.44
2/.84 ?.42 63.30 10.15 94.09
2.94 75.51 109.73 I 10.66 31 .9n
6.16 47.72 96.1 8
11 3 3 34.10 3.13 80.26
50.92 96.5 1
7.18
28.33 ?.47 G5.76 41.68 94.03
9.26 5.87
8.35 26.43 7.29 60.62
' :!?heclged i y Itlcuiisncy CIasSCS. '' Hedged mdtlcuriency cla: SBS
*-* Partially hedged (by Fund Managed multlcurrency classes 1'1 l h e Net Asset Value per share IS stated 8n the currency o'the shave class. I he nctes on pages 1.1 tc BO torm aT: integral part o' these +-ancial ytateTe"ts
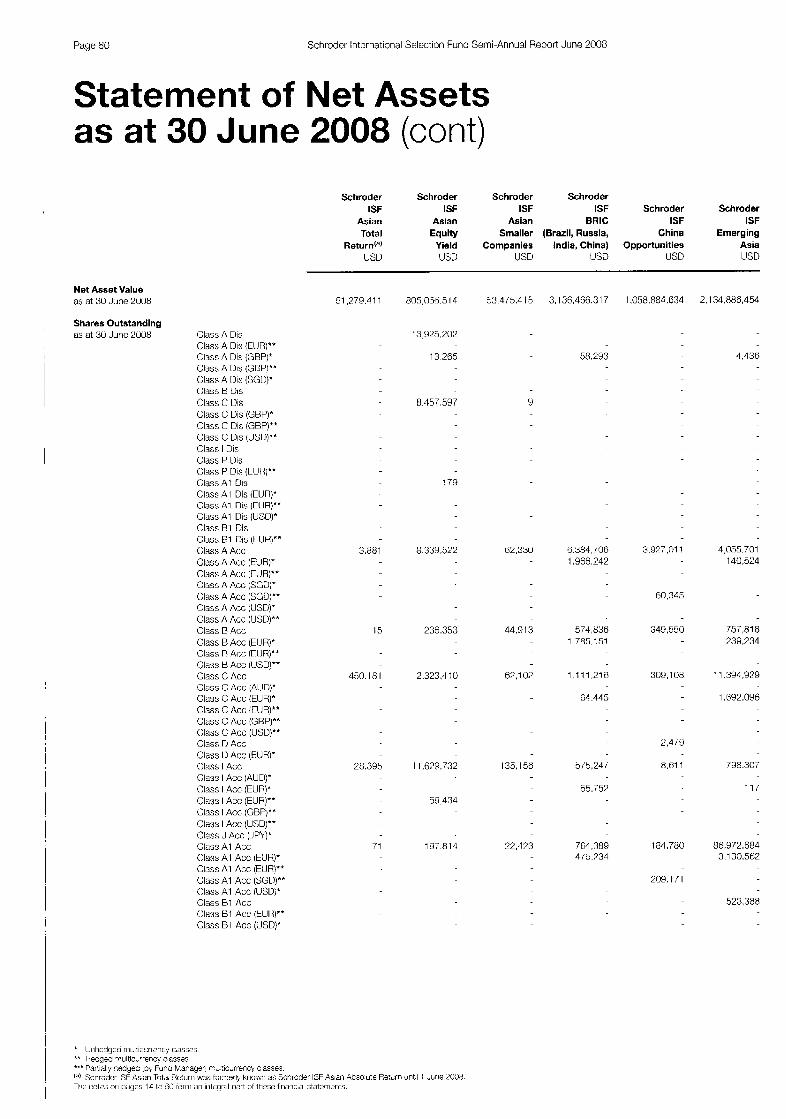
Page 80 Schrodor lntcrriatiorial Selection Furid Semi-Annual Report June 2008
Statement of Net Assets as at 30 June 2008 (cont)
Schroder Schroder Schroder Schroder ISF ISF ISF ISF Schroder Schroder
Asian Asian Asian BRIG ISF ISF Total Equity Smaller (Brazil, Russia, China Emerging
Return(") Yield Companies India, China) Opportunities Asia USD usri USD USD USU USD
Net Asset Value as at 30 June 2008 51.279.41 1 8O5,OS~j.514
13,925,202
Y9.4/5.415 3.138.400.317 1,058.884.834 2,134,886,454
Shares Outstanding I as at 30 Junc 2008 Class A Dis
Class A Dis !ClJRl** CIiss A [lis (GBPj* Chss A Dis (GnP!'*
Clsss C Dis (GBP)** Clsss C DlS lUSO)*A Class I Dis Class P Dis C l ~ l S S P ui:; (tUI<)" Class A I 01:; Cliss A1 Dis iEUR)* Class A1 Dis (CUR)*" Class A1 Dis (USO)*
I
CIM A A(;(; (rot?)** Class A Acc (SCD)*
Class A Ace (USD)* Class A Acc (USD)** Class B Acc Class B Ace (EIJRj*
Class C Acc Class C Acc (AlJD)* Class C Ace iEUR)* Class C Acc ICLIH)"" Class C Acc (FRP)** (:la:;s C Acc (USU)*' Class D Acc
Class I Acc (EURY Class I Acc (ElJR)** Class I Ace (GBP)**
Class A I Ace (M;s AI Acc [ tUt i )* Class A1 Acc (EUR)** Class A1 Acc (SGD)** ( X i s AI Acc (USD)' Class B1 Acc CIHS:; 61 A(:(; l t U l Class B1 Acc (US[))*
1.136 13.255 58,793
8,457,597
179
3,881 8.339.522 62.330 8.384. /06 1,966,242
3.927,01 1 4,055.701 140.524
60,345
15 238.353 44.913 571,836 1.7R5.151
349.650 757.818 239.234
450.181 2.323.1 10 309,108 11 3Y4.929 I
04.445 1 ,692,IJYS
2.4iY
135,156: 3 h . 2 4 i
55.757
8.01 1 798.307 28.3Y3 11,679 732
11/ 59.434
22 .43 704,389 4/3.734
71 137.814 181.780 88.Y12.684 3.130.562
209.1/1
523.388

Schroder Internatiorial Selection Fund Semi-Annual Report June 2008
Schroder Schroder Schroder Schroder ISF ISF ISF ISF Schroder Schroder
Pagc 81
Statement of Net Assets as at 30 June 2008 (cont)
Net Asset Value per share(') as at 30 .lune 2008 Class A Dis
Glass A Dis (FUR)** Class A Dis (GRP)* (:lass A Dis (GBP)** Class A [lis (SGD)* (:lass B Dis Class C DIS Class C Dis (CBPj' Class C Dis (GRP)** (:lass I: Dis (IJSD)** Class I Dis Class P Dis Class P Dis (FIR)" Class A I Dis Class A I Dis (EIJR)' Class A I Dis (EIJRY* Class A1 Dis (IJSD)' Class R1 Dis Glass D1 Dis (CUR)** Class A Acc C I ~ S S A ACC (rim)* I:lass A Acc (E1111)" Class A A m (SGD)' Class A Acc (SGD)" Class A Acc (US[)!* Class A Acc (tUSD)** Class B Acc Class 0 Acc (EUR)* Class 0 Acc (EUR)** Class I3 Ace (UStl)** Class C A x Class C Acc (AIJD)' Class C Ace iEIJR)* Class C Ace (LUH)** Class C Acc (GRP)** Class C Acc (USD)** Class D Acc: Class D Acc (EUR)' Class I Acc Class I ACC (AUD!+ Clas:: I Acc (EIJI7)* Class I Acc (EUR)** Class I A(:(: (GBP)** Class I Acc (US[))** Class J Acc (JPY)* Class A I ACC
Class A I Acc (EUR)** Class A I Acc (SGD)'* Class A I Acc (USD)' Class B1 Act: Class B1 Acc ( H J t l ) * * Class f3l ACC (tUS13)*
(y , A S S . . A I A(:(: (EIJR)*
105 48
105.96
106 16
108.08
105.76
15.63
8 00
16 24
14 98
18.37
17.Y4
18.78
19 84
155 60
18.08
159.35
159.02
I53.fd
160.06
l71.m
157.15
111.18
726.95 144.01
222.1 1 141.14
231.36
14fi.77
238. /a 151.47
226.35 143.62
771.19
f .36
218.11
224.73
220.29
231 .?7
219.13
7.85
9.52
19.63 12.45
- I
19.10 12.12
70.77 '
12.85
21.10
13.30
19.33 12.26
18.71
* Lln!-?dged md!icurrency c'asses *' Hedged mlllticurfency classes. *=* Part ally hedged !by Fund NanageQ multicurrency classes. ('1 The Net Asset Value per v a r e is staled in the currencv of :he share class la) SchrodFtr ISF Ason Total Return was formerly knovrn as Schroder ISF As:an Absolute Returi until 1 Juir 2008. The nctes on paaes 14 t c 60 +arm an tntegral part of !hSw tinancinl ?;i:rinimt%

Page 82 Schroder International Selection Fund Serrii-Aririual Reporl June 2008
Statement of Net Assets as at 30 June 2008 (cont)
Net Asset Value as at 30 .Jurw 7004
Shares Outstanding as at 30 Jurie 7008 Class A Dis
Class A Dis (EUR)**
Class A Uis (SCD)' Class B Dis Class C: Dis Class C [lis (GBP)* Class C Dis ((;Et')** Class C Dis (USO)** Class I 01s Class P 111s Class P Dis (FUR)*+ Class A1 Dis (:la:;s A I UI:; (tll l $* Class A I Dis (EUR)**
Class A Acc Class A Acc (EUR)* Class A A(:(: (CUR)** Class A Acc (SCD)* Class A Acc @ X I ) * *
Class A Acc (USD)** Class B Acc Class B Acc (EUR)*
Class B Acc (USD)** Class C Acc: Class C Acc (AUD)-
Class C Ace (FUlg'* Class C Acc (CHP)**
class c A ~ C (rw*
Class I k c (FUR)* Class I Ace (CUR)"* Class I Acc (GBP!** Class I Acc (USD!*' Class J Acc (JPT,*
Class A i Acc (FUR)*+ (;lass A I Acc (SGU)** Class A1 Acc (USD!* (:lass E31 A(:(: Class [31 A(:(: (CUR)** Class B1 Acc (USU:'
Schroder Schroder Schroder Schroder Schroder Schroder ISF ISF ISF ISF
ISF ISF European European European European Emerging Emerging Dividend Equity Equity Smaller
Europe Markets Maximiser Opportunities Yield Companies EUR USD HJH EUR EUR CUR
2Y4.64/.811
188,397
4.821
30.719 1,518
5,178,881
1.909.1 23
90~1.002
S / . Y 13
2,938,374
451,007 127.i82
1 .I 1 5.1 89,648
7.0f7.838
41,869 4,059,344
14,900.35ij 3.0.1'3.095
2.4.17 .0Y ti 777.6.13
13.080.4Y2 4,691,504
185,142
7.677.732 1.432.743
187,618
25.788.800 3.0G7.917
183.656
I R,047.540
303
2.08/ 200,154
10
5,033
6.470
7 . 3 3
15
7.851
20.91 5. /ti8
45.507
15
212.875
1 1.670
I 5Y.809.553
2,764,853
1.334
54.650 2.C43.340
100
12
7,138,422
1,376,752
652,040
110
98.21 1
331
305,140,445
741,448
53,(325 777.678
1,865 531
2230.048
8/Y.085
/,Y71.337
1.61 1,925
100,395 51.610

Schroder International Sclcction Fund Semi-Annual Reoort June 2008 Page 83
Statement of Net Assets as at 30 June 2008 (cont)
Net Asset Value per share(') as at 30 .lime 2008 Class A Dis
Class A Dis (EIJR)** Class A Dis (CBP)' Class A Dis (GRP)** Class A Dis (SGDY Class R Dis Class C Dis Class C Dis (GRP)* Class c T)is (GRP)** Class C Dis (USD)** Class I Dis Class P Dis Class P Dis (EUR)*' Class A I Dis Class A I Dis (EURY Class A1 Dis (EUR)** Class A1 Dis (USD)* Class R1 Dis class RI Dis (rim)** Class A Acc Class A Acc (EURY Class A Acc (EUR)** Class A Ace iSGD)* Class A A(;(: [X;Dr* Class A Acc (US[))* Class A Acc (USU)" Class B Acc Class B Acc (ELJR)' Class B Acc (EIJR)" Class B Acc (USD)" Class C Act: Class C Acc (AIJD)* Class C A(:(: (ElJR)* Class C Acc (FlJRY* Class C: Acc (GBF')" Class C Acc LED)" Class D Ace Class U Acc IEUH)" Class I Ace Class I Ace (AUT))* Class I Acc (tUH)' Class I Ace (FIJRY* Class I Acc (GBP)'* Class I Acc (USD)** Class .I Acc (JPY)' Class A1 Act: Class A I Acc (EUR)' Class A I Ace (CUR)** Class A I Acc (SGD)** Glass A1 Acc (LIST))* Class B1 Acc Class R1 Ace (FUR)** Class 81 Acc (160)'
Schroder Schroder Schroder Schroder Schroder Schroder ISF ISF ISF ISF
ISF ISF European European European European Emerging Emerging Dividend Equity Equity Smaller
Europe Markets Maximiser Opportunities Yield Companies EUR IJSD ELJR EUR EUR ELJR
22.80
18.00
?I .83 24.04
23.23
22.10
24.61
7B.02
22.90
36.08 21.72
17.55
12.00 12. /4
13.03 8.77
12.15 7.70
13.95 14.51 8.85
15.08 15. / 2 9.57
12.63 A 01
11 .R3
70.71
70.43 71.13
10.57
74.90
71.66
75.30
78. 10
74.79
76 79
16.00
76.60
77 75
10.27
8.29
9.80 10.92
10.91
17.21
11.73
10.78
13.06
13.98
11 3 0
17.85
18.59
17.16 19.16
18.71
17.1 6
20.29
21 -51
18.21
P8 69 I 6.58
* Urihdged riiul!lcurreincy c'x,':e$ ** Hcrlged rnulticr!rrmcy r:a!;!x:;. ** Part ally hedged (by h m r l h"ninL]cr] rniiIt~i:i~rrr~ri::y c:i,i!;:;e:;
The Net Asset Value per s%re IS s:ated 11 the cuTrency ot ?he share r;19!;!; Thc riotm on pay:'; 14 k) Gi' 'orin iiii 7nteyr;il [xiit of !he!,e I nawa l s:a!ements
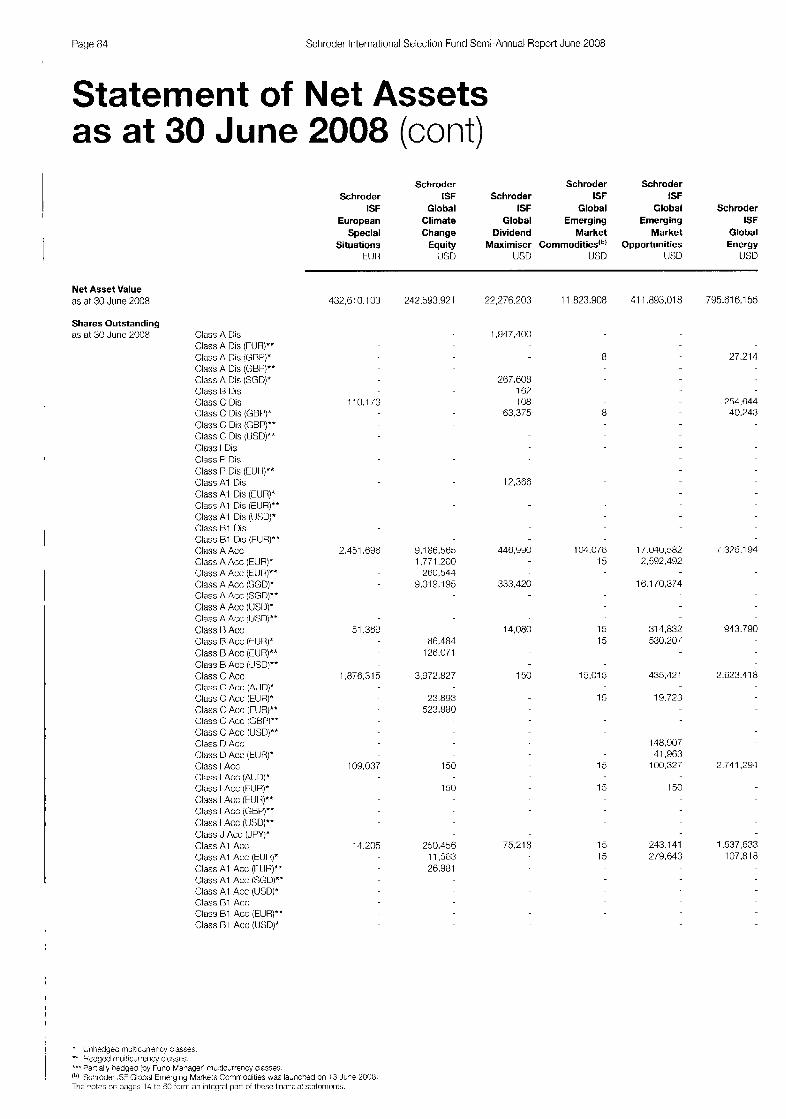
Page 04 Schroder Intertiatlorial Selection Fund Serni-Annual Reourt June 2008
Statement of Net Assets as at 30 June 2008 (cont)
Net Asset Value as at 30 June 2008
Shares Outstanding 85 at 30 Junc 2008 Class A Dis
Class A Dis (TUR;"" Class A Dis ((.;RP;* (:las:; A Dis (GBPj" Class A Dis (SGD!* Class R Dis Class C Dis (;laus C Uis (GBI ')*
Class C Dis (USD)** Class I Dis Class P Dis Class P Dis (CIJH)"* Class A I Dis Class A I Dis (CUR!' Class A1 Dis (ELIR)** Class A I Dis ((J>;U)* <;lass B1 Uis Class E41 Dis !FIIR)**
Class A Ace (EUR!* Class A Acc; (E-LJM)** C'I, , d.,s ,.. ., A A m (SCD)' Class A Ace (SGD!** Class A Acc (USI1)-
CI,. , dss . , C Dis (GBP)"
Class B Acc (CUR)** Class R Acc (USD!** Class C Acc
Class c AI;(; jnmy Class C Acc ICBl'l**
(:lass I Acc: (AUU)"
Class J Acc (JPYP Class A1 Acc
Class AI Acc (l-lUH)*r
Class A1 Acc (USDJ*
Class E31 ACC iEUR)m* Class nl Acc illSD)*
Schroder Schroder Schroder Schroder ISF Schroder ISF ISF
ISF Global ISF Global Global Schroder European Climate Global Emerging Emerging ISF
Special Change Dividend Market Market Global Situations Equity Maximiser Commodities@) Opportunities Energy
H J l I USD US0 USD U:;U LJSU
4X?,tilO.103 242.593.921 22.276.203
1,947,400
110,l ;3
2,451.69u 9.1 86.565 1 , T 1.200
2 ti0 ,544 Y.O1 a.195
51.359 86,484
12ti.011
1,878,315 3,972.827
23.893 523.880
109,037 150
150
14.205 250.436 11,563 26,981
2 ti7 ,BUY 167 108
83.375
17,383
448.9'30
333.420
14,080
150
75,218
11,023.908
8
8
I04.07U 15
15 15
15.01 5
1 5
15
15
15 15
41 1,893,018
17.040,382 2.542.492
1 ti.1 10,374
314.832 530,201
435.121
19.723
148,907 41.963
100.327
150
243.141 2/9.643
795.61 6.1 55
27.214
254,044 40.743
;,376.194
943.790
2523.418
2.71 1.234
1.637.833 107.81 8

Schroder Iriternational Selection Furid Serrii-Aririual Report Jurie 2008 Page a5
Statement of Net Assets as at 30 June 2008 (cont)
Schroder Schroder Schroder Schroder ISF Schroder ISF ISF
ISF Global ISF Global Global Schroder European Climate Global Emerging Emerging ISF
Special Change Dividend Market Market Global Situations Equity Maximiser Commoditieslb) Opportunities Energy I
EUR USD USD USD USD USD ~
Net Asset Value per share('] as at 30 June 2008 Class A Dis
Class A Uis (ELJR)** Class A [)is (OW)' C l ~ s s A Dis (GnP)** C l ~ s s A Dis (%31)* Class El Dis Class c DlS
Class C Dis (GW)* Class C Dis (GRPj*' Class C Dis (USD)" Class I Dis Class P Dis Glass P Dis (FUR)** Class A I Dis Class A I Uis (EIIf?)* Class A I Dis (EIJR)** Class AI Dis (IJSD)" Class R1 Dis Class B1 Dis (FUR)** Class A Acc Class A Ace (EIIR)* Class A Act: iEIJR)** Class A Acc (SCD)' Class A Ace (SGD)** Class A Acc (USD)* Class A Acc (USD)** (:lass R Ace Class n Acc IEUR)* Class R Acc (EUR)** Class B Acc (USDY Class C Acc Class C Acc (Al ID)+ Class C Acc iEUf3)' Class C Acc (EUR)** Class C Acc (GBP)** Class C Acc (USD)** Class D A(:(: Class D Ace (EIKt)* Class I Acc Class I Acc (AUO)' Class I Acc ( tLJ l<)* Class I Acc (EURY* Class I Acc (GBF')"' Class I Acc (USD)** Class J Acc (JPY)' Class A I Acc Class A1 Acc (EUR)* Class A I A(:(: (EIJR)4* Class AI Ace (%XI)** Class A I Acc (LJSU)' Class B1 Ace Class B1 Acc (EUR)'* Glass E1 Acc (USD)'
7.30
101.22 25.22
7.18 7.44 7.36 3.77
93.68 51 3 3 ?5.W 101.74
7.28
93.09 10.36 8.88 9.1 5 9.55
7 . K 99.12 96.54
12.33 10.1 1
50.60
7.60 11.05
99.10 96.61
91 .YO 8.81 ij.1 1
7.83 12.21 10.01
49.99
94.53 10.43 7.94 99.15 12.45 51.2'3
8.98 9.19
96.67 10.15
17.74 10.01 17.66 97.73 10.57 9G.71 52.57
9.07 96.73 10.41
50.22 31.87
92.58 10.32 8.87 % I ?
7.85 99.10 96.62
12.27 10.01

Payc 86 Schroder Irilernalional Selection Fund Serrii-Aririual Hep0r.l June 200H
Statement of Net Assets as at 30 June 2008 (cont)
Net Asset Value as at 30 June 2008
,
Shares Outstanding as at 30 June 2008 C1;lss A Dis
Class A nis jrLJR,!**
Class A Dis (GRP)** Class A Dis (SGO)" Class E? Dis
(;ids:; A UE wr3)-
(:lass c; UI:; (GBP)*' Class C Dis (USD)** Class I 111s
Class P DIS (t-:UHj'* Cluss A I Dis Closs A1 Dis (EUR)* Class A1 Dis (EUR)** (:lass A I Dis (USD)* Class 81 Dis
Class A Acc: Class A Acc (EUR)* Class A Acc: ,:Ell1 I)** ('I,,..., I daJ A Acc (SCD)* Class A Ace (SGD)**
I Class I-' IJis
class BI DIS ( ruR)**
Class E Acc (:la:;s t3 Acc (EUHY Class E Acc (EUR)** Class E3 Acc (USD)** Class C Acc Class C Acc (AUD)* Class C Acc (kUl i)*
Class C Acc (USUP* Class D Acc (-1,. .. , db:; U Acc (EUH)- Class I Acc Class I Acc (AlJDj" Class I Ace (EUR)* (:lass I Acc: (tUli1" Class I ACC iGRP)** Class I Acc (USD)** Class J Ace ( J P Y Class AI Acc
(Xis:; AI Ace (EUH)** Class A1 ACC (SGD)** Class A1 Acc (USD)* Class BI Acc Class B1 Acc (tUti)** Class El1 Ace (IJSD?
Schroder Schroder Schroder Schroder
Global Global Global ISF ISF ISF Equity Property Smaller Global Greater Hong Kong Yield Securities Companies Technology China Equity LJ:.;D US0 IUSD USD USD HKU
Schroder ISF ISF ISF Schroder
59.108.378
68.555
1.375
1 G
16
I T
11 8.035 7.816
1.841 3,973
50,302
0.325
239.8fi8
15
3.844 1.775
349,892,575
8.02 1
336.880
331 , I 29
i 5.088
2 i.439
1,042,047
.I:! r ,I 44
273.050
85
57.01 5
5,291
73.914.882
17
I5
145.640
2,470
15
500.289
70.883 17
19,477.272
38,198
10.681 14,408
64.1.758
626.858
333.507
513,513
5.058
1.238.108.933
33,232
138
2 1,4491 46 a5
2.920.925
3,141,127
7,897,118
1.565.875
213.746
4,851,328,288
52.333
325
1.54Y.4tj0
3,230
100.473
73
1,745,336

Schrnder International Selection Fund Semi-Annual Ream June 2008 Page 87
Statement of Net Assets as at 30 June 2008 (cont)
Schroder Schroder Schroder ISF ISF ISF Schroder Schroder Schroder
Global Global Global ISF ISF ISF Equity Property Smaller Global Greater Hong Kong Yield Securities Companies Technology China Equity usn I JSD IISD USD IJSO HKD
Net Asset Value per share(') as at 30 June 7008 Class A Dis
Class A Dis (EUH)" Class A Dis (GRP)' Class A Clis (GBP)** Cla:;s A Dis (SGD)* Class B Dis Class C Dis Class C: Dis (GBP)* Class C Dis (GBP)** class c: 111s (llS13)** Class I Dis Class P Uis Class P [lis (EUR)** Class A1 Dis Class AI Dis (EUR)' Class A1 Dis (FIUR)** Class A1 Dis (USD)* Class R1 Dis Class R l Dis (FIUR)** Class A ACC Class A Acc (tUI4)' Class A Acc (EUR)** Class A Acc ISGDY Class A Acc (SGD)** Class A Acc (USD)* Class A Acc (LJSD)** Class R Acc Class E? Acc (EUR)* Class B Acc (EUR)** Class B Acc (USDY' Class C Acc Oass C Acc iAUD)* Clas:; C Acc iEIJR)* Class C Acc (EUR)" Class C Acc (GBP)** Class C Acc iUSD)** Class D Ace Class D Acc (EURY (lass I Ace Class I Acc (AUD)' Class I Acc (ELIF{)* Class I Acc (EUR)** Class I Acc (CRP)" Class I Acc (LED)** Class J Acc (JPV Class A1 Acc Class A1 Acc (EURY Class A1 ACC (EIUR)** Class A1 Acc (SGDI" Class A1 Acc (USD)* Class R1 Acc Class B1 Acc (EURI" Class B1 Acc (USD)*
104.20
53.01
IflS.RR
114.78
105 00
117.57 71 3 0
1 10.59 70.17
115.11
73.03
11 a ? l
75.65
111.54 70.89
116.51
11 5.97
102.05
114.1!>
100.59
118.1 i
103.76
177.06
106.90
114.85
101.20
114.34
1 15.89
114.81
112.95
1 16.01
120.21
11 3.79 72.13
8.95
8.51 9.57
8.95
8.52
9.59
0.74
R.27
14.80
15.76
32.13 20.4 1
31.20
33.61
35.32
31 .R1
30.56
228.77
219.96
84.96
238.40
85.56
227.24
210.93
223.95
* Clihxlcrged mu!ticurrency ciasses. -' Herlyeri iii i iItir:iirreiir:~~ ~:I~~L;sRL; *** Pnrt,ally bcdgcd (,by Fund Monage:; rnult currency classes ('1 The Net Assel Value per share IS ::laled In llie cmency (I: the :;h:i'e CI&S The notes or pages 14 to BO f v m an integra' pan cf tbese I~anc1al stat?nf-ts

Page 8B Schroder International Selection Fund Serrii-Arirlual Report June 2008
Statement of Net Assets as at 30 June 2008 (cont)
Net Asset Value as at 30 June XJ18 I Shares Outstanding as ;It 30 h i e 2008 Class A [lis
Class A Dis (EUR)** (:la:;s A Uis (GBF')' Class A [lis (GRP)**
CI. I dSS " (: DI:;
Class (I: Dis (GRPY
Class I Dis (;ldss P ui:; Class P Dis (l.lUHj"* Class AI Dis
Class B1 Dis Class B1 Dis (ELIR)** Class A Ace (;kiss A ACC jtUti)* C l ~ s A Ace 'EURY*
Class A Ace (USD,!x Class A Acc ( U C U ) * *
(;lass R Acc (EUR)**
C ass C Ace (EUR!* Class C Acc (EUR)** Class C Acc (GBP)" Class C Ace iUSO)** (;I;Ls:; D Acc Class D Ace IF~JR)* (;lass I Am; Class I ACC tAUD)- Clas:; I A(;(: (ElJl<)' Class I Acc \EUR)*'
Class A 1 Ace (EURY Class A I Ace (LUH)"" Class A1 Ace (SGD)** Class A1 Ace (USD)*
Class HI A m NJSD)'
Schroder Schroder ISF Schroder Schroder Schroder ISF
ISF Japanese ISF ISF ISF Swiss Indian Smaller Korean Latin Middle Equity Equity Companies Equity American East Opportunities
IUsn JI'Y USD LJSD usu CHF
Schroder
51,474,019
8,091
103.537
163.294
59,067
130.1I5
31.890
10.01 2.838.240
9YB,Y49
81.824.537
18,247,080
15,9.j9.999
055,858
51 ,03!4.863 3/3,344
1,389,989 65,340
60,351,371
3 801
72.YY /
41 0.503
30.1 38
4 4 2 3 4
487.708
1,199,543.355
I.761.383
18,082
49.432 370,777
T .5i13.5 1 4 372,fi13
2 ;ti,sw2
1.429.756 649,029
10.809.945
505.201
8.E34.215 448.730
571.91 1,059
21.831.lfi.5 2,407,105
15.070.239
335.638 138.848
4,031,087
Yi0.253
9798.584
150
4,T51.439 000.86 1
4.280
280.804.1 16
1,881,353
36,102
85,120
242.041
22.380
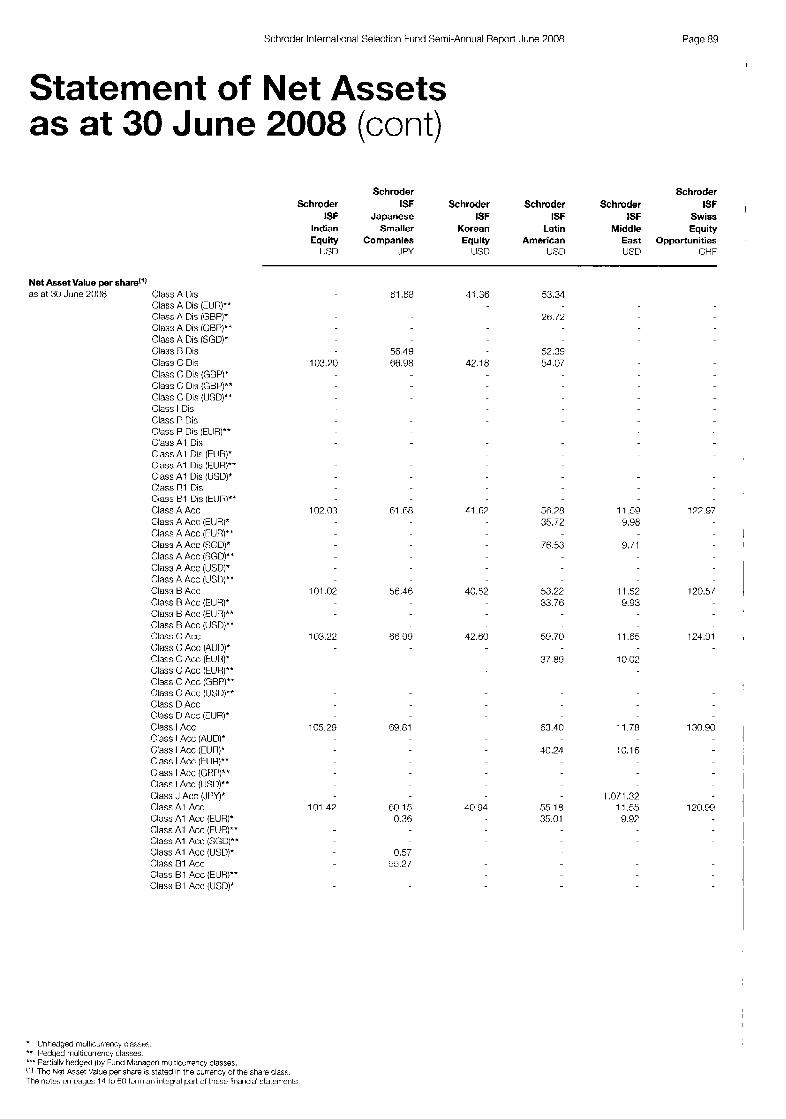
Schroder Interna6nnal Selection Fund Serni-Annual Report June 2008 Page 89
Statement of Net Assets as at 30 June 2008 (cont)
Schroder Schroder
ISF Japanese ISF ISF ISF Swiss Indian Smaller Korean Latin Middle Equity Equity Companies Equity American East Opportunities
L J X I JPY LIST) LlSD USD CHF
Schroder ISF Schroder Schroder Schroder ISF ,
Net Asset Value per share(') as at 30 .lime 2008 Class A DE
Class A Dis (EUR)" Class A Dis (GBPY Clas:; A Dis ((;DPj*+ Class A Dis (SGU)" Class n Os Class C Dis Class C Dis (GBP)* Class C, Dis (GBP)** Class C Dis (LJSD)"" Class I Dis Class P Dis Class P Dis (EUR)** Class A I Dis Class A1 Dis (EUR)' Class A I Dis :FIJR)*+ Class A I Dis (USU)* Class nl Dls Class tll Uis ( t l J f l J * t Class A Acc Class A A m (EIJR)* Class A Acc (FUR)** Class A Acc (SGUj" Class A Ace (SGDp* Class A Acc (IJSD)" Class A Acc (lUSll)** Class t3 Acc: Class R Acc (EUH)* Class tl Acc (EIJR)** Class R Acc (VSD)" Class (; Ace Class C Acc (Allll)' Class C Ace (tUl3r Class C Acc (EURY' Class C Acc (SRP)'* Class C A(:(: (M;Dj"* Class D Acc Class D Acc (LURj* Class I Acc Class I Acc (AUD)* CI,. . . 1 ~ S S I Ace (EUR)* Class I Ace (HJt4)" Class I Acc (GRP)** Class I Acc (USU)** Class , I Acc (JPY)* Class A1 Ace Class A1 Acc (EUR)' Class A I Ace (EURj*' Class A I Ace (SGD)** Class A I Ace (USD)* Class 81 A(:(; Class R1 Ace (EUH)" Class D1 Acc (IIST)j*
61.68 41.36 53.34
26.72
56.19 103.70 66.98
102.03
101.02
103.22
105.29
101.47
61 .E8
56.46
66.99
69.81
60.15 0.36
0.57 55.2 I
52.30 42.18 54.07
41.67
40.52
12.60
40.94
56.70 11.59 35.72 9.98
76.53 9.11
53.22 11 5 2 33.76 9.93
59.70 11.65
37.89 10.02
63.40 11.78
40.21 10.16
1.071.32 55.18 11.55 35.01 9.97
177.97
- I - I
124.91
130.90 - 1 - I
- t 'nhdged mulllcurrenc.) ~la~:;eii *- t :edged rnult,currency classes. '*I Far:lall) htdywl [I)! Furi(i Mc;iregnrl rnulticuwncy classsc. ('1 Tho Nct A 5 w t Value per share IS stated In the currevcy of the share class The notrir; r'ri r?ogcs I D to 90 fxrn an integral pari of these fimnc,a' staterrents

Page 90 Schroder Internatioinal Selection Funtl Serrii-Annual Report June 2008
Statement of Net Assets as at 30 June 2008 (cont)
Schroder Schroder Schroder Schroder ISF Schroder ISF Schroder ISF ISF
Swiss Small 8. ISF USSmall& ISF EURO EURO Mid Cap Taiwanese Mid-Cap US Smaller Active Dynamic
Equity Equitylc) Equity Companies Value Growth C H t LED USU USD tUH EUR
Net Asset Value as at 30 June 2008 , 289551.693
3.513.042
750,844,657 380.403.652 648,892,361
Shares Outstanding as at 30 June 2008 Class A [lis
Class A 01s (HJI I]" Class A DIS ((;BF)* Class A Uis (GHP)" Class A Dis (SGtI)* Class B Dis Class C, Dis Class C Dis (GBPj* Class C DE GBP)**
Clsss I Dis C13ss P DlS
(;lnss t' Dis (EUR)** Class A1 Dis Class A I [lis IEIJR)*
Class A1 Dis (LED)* Clas:; B1 Uis (::lass B1 Dis (EUR)** Class A Acc Class A A(:(: itUH]* Class A Acc jtUlp*- Class A Acc ISGO)* Class A A(:(: [X;Ujx* Class A Acc (USD)* Class A A(:(: (IJSDI" (lass B Acc (;lass B Acc (EURj* Class B Acc (EUR)** Class R Acc (lJSD)** Class C Ace Class C A(:(: (AUUj* Class C Acc (EUR)* Class C Acc (EUR)** Class C Acc (C;DF)** Class c ACC (u:;o)** Class I3 A(;(; Class 0 Acc (FIJR!* Class I A(:(: Class I Acc (AUD). (-1,. .d.,s ,.. Cla::s I Acc (EUR)** Class I Ace (GBPY Class I Acc jU>.;U)** Class J A(:(: (.lt'Y]* Class A1 Acc Class A I Ace (EWW Class A1 Ace (CUH)** Class A1 Acc (:X;D!**
Class B1 Ace Class 01 Acc itLJli)** Class 81 A(:(: (USDj'
(:la:;s C UlS (USUJ**
Class A I UlS (EUH)**
I Ace (EUH)*
class AI ~ c c iusry
1.215.072 2545,386
13,373
160 150
55.773 361.075
12.438 7.w4 T0.,1 75
??,R12
1.500
14. 128.438 1 .(?DY,YU:! 25.457 32.202
4,354,526 5.0BY.851 124.060.1 54
837.3.10 150
424.016
27.1.25ti 35.881
100
504.081
1 .:jNJ.918
1,700.1 4 i 14,634,698
2,013,352 774,059
1 1 2. 199 9.202
1.31 8.20 1 28.448.728
2.91 3,081 1,318,529 1 .Hi 3.307 898.781 1.31 3,393 13.4'38,313
4,197,433
1 .I
1.653.357 215.101 1.502
100
1,842,202
14,149
1.28 1,82 1
58

Schroder International Selection Fund Semi-Annual Report June 2008 Page 91
Statement of Net Assets as at 30 June 2008 (cont)
Schroder Schroder Schroder Schroder ISF Schroder ISF Schroder ISF ISF
Swiss Small & ISF USSmall8 ISF EURO EURO Mid Cap Taiwanese Mid-Cap US Smaller Active Dynamic
Equity Equity(c) Equity Companies Value Growth I CHt USD USD USD ElJR ElJR
Net Asset Value per share'') as at 30 .lune 7M8 Class A Dis
Class A Dis (tUI <r* Class A Dis (GRP)' Class A Dis (GnP)** Class A Dis (SGD)+ Class B UlS
Class C 131s Class c DIS ((.;np)* Class c, Dls (GBiJ)** Class C Dis (IJSD)** Class I Dis Class P Dis Class P Dis (EUR)** C:lass A I Dis Class A I Dis (tUI1)' Class A1 Dis (EURP Class A I Dis (IISD)* Class B1 Dis Class I31 Dis (EUR)** Class A Acc Class A Ace (ElJRj- Class A Ace (WR)** Class A ACC (SGLl)* Class A Acc (SGD)** Class A Acc (USD)* Class A Acc (USD!** Class n Ace Class B Acc (EIJR)* Class B Acc (EUR)" Class B Acc (USD)** (-1, .. Class C ACC (AIJI))* Class C Acc (ElJRj* Class C Ace (EUR)** Class (; A(:(: ((;BPI** Class C Acc (USD)'̂ Class D A(;(; Class D Acc (EUHY Class I Acc Class I Acc (All[))* Class I Acc (FUR)* Class I Ace (EUR)" Class I Acc (GBP)" Class I Acc (USD)** Class J Ace (JPY)* Class A I A(;(: Class A1 Acc (EUR)' Class A1 Acc (tUfl)A* Class A1 Acc (SGD)+* Class A I Act: clJSD)* Class R1 Acc Class R1 Acc (CUR)'' Class I31 ACC (USD)'
j d b ~ C Ace
9.75
9.73 9.78
9.84
139.75 70.54
64.50 145.04 16.31
3.39
22.47
23.10
9.74
22.88 9.15 141.28 89.51 93.23
10.52 35.21 3.42
- I
22.06
23.86
9.73 138.30 8/.14 95.02
14474
M.50 33.99 3.25
9.78 76.1 1 36.70 3.63
91.82 95.59
75.67 9 84 151.44
96.09
87.36 38.70 3.77
139.61 88.56 95.06
34.45 3.34 22.39 9.14 68.10
82.18 33.28
* Orihcdged mii l twrrwCv ClassFs *= Pedgea mu:'cuire-cy classes. *" Pnrtially hedgs3 !b:: rtincl hlanaqer) rn Acui ie icy classes ('1 7% NP! Asw! Valire ow share I!; :;toted 11 the c x e n c y ct the share class IC) Scbrader ISF Talriavese Equty m s l a o m k l 3n 1R Jririua.., 2908 The rote;:; nn rag?? 14 :3 60 forrn an 'ntegral oart oi!hese finamal st2tements

Page 92 Schroder International Sclcctiori Furid Semi-Annual Rcporl Jurie 2008
Statement of Net Assets as at 30 June 2008 (cont)
Schroder Schroder Schroder Schmder Schroder Schroder ISF ISF ISF ISF ISF ISF
European European Asian EURO European Global Active Dynamic Equity Equity Equity Equity Value Growth Alpha Alpha Alpha Alpha
EIJR EUH lJSU EUR EUH IJSD
Net Asset Value as at 30 JUW 2008
Shares Outstanding as at 30 June 2008 Class A Dis
Class A Dis ( t l J l < ) ” * Class A Dis (GHP)’ Class A Dis (GHP)” Class A Dis lSGD!* Class 0 Uis Class C Dis Class C Dis (GRP)* Class (: Di:; (GW)** Class C Dis (USDJ’* Class I Dis Class P Dis Class P Ui:; jtUH)** Class AI n s Class AI Uis (EUH)” Class A1 Dis (rVRj** Class AI 111s (USD)* Class E1 Ills Class R1 Dis (tUl<j** Class A Acc Class A Acc (EUR)” Class A Ace (,CUR)** Class A Acc (SGW Class A Acc (SCD)** Class A Ace [I KU)* Class A Acc IUSU)** Class B Acc Class R A(:(; ( t l J l < ) * (:la:;s B Acc (EUH)** Class 0 Acc (IKlY* Class C A(;(; Clxj:j C Acc (AUC))*
Class C Ace (rlJf?j** Class C ACC (GBP)**
class c ~ c c (turv
Class D ACC ( t um- Class I Ace Class I Ace (AIJDP Class I Acc (EIJRP Cass I A(:(: (tUH!**
Class I Acc (IJSD,!”’ Class .J A(:(: !JPY)* <;lass A1 Acc Class AI A(:(: kUli)- Class A1 ACC iEUR)** Class A1 A(:(: (SGU!” C:ass A I Acc (IJSD)* Cass D l ACC: C’ass B1 Acc (l’IJR)‘* Class R1 Acc iUSD)*
Csass I ACC (GBP)**
0.957.4fi7
25.20Y
23.320
23.%60
34
/3.913,300 20,7/5.456 3.839.418 825201,202
1.1 18,228
74,985,811
17
50.840
15
1,372 4.139
1 .I ti2 7.185
32,888
9 1.480
12
1 5
6.300 1.761
1.143
12
12
50.34/ 5.600 23,562
281.881
40[3,30t) 604.032 425 8,204,183
24.348 102.223 15 1.228.721
228.1 13 49.8Yti 354 2.05Y ,090
5,4Y 7.557
795,398
15 30.430 221.38Y 15
10.158 10,1735 27.Y31 71

Schroder Interrvational Selection Fund Semi-Annual Rcport June 2008 Page 93
Statement of Net Assets as at 30 June 2008 (cont)
Schroder Schroder Schroder Schroder Schroder Schroder ISF ISF ISF ISF ISF ISF
European European Asian EURO European Global Active Dynamic Equity Equity Equity Equity Value Growth Alpha Alpha Alpha Alpha
EUR EUR USD EUR tu13 lJSU
Net Asset Value per share(‘) as at 30 June 7008 Glass A Dis
Class A Dis (FUR)** Class A Os (GBPY Class A Dis (GBP)** Class A Dis (SGDY Class n DlS
Class C Dis Class C Dis (GRP)* Class C DlS (GRP)** Class C Dis (US[))** Class I Dis Clas:; F Dis Class P Dis (EUR)” Class A I Dis Class A I Dis (CUR)* Class A I Dis (EIJR)** Class A1 Dis jUSD)* Class 01 DlS
Class R1 Dis (EURY* Class A Acc Class A Acc (tUH)* Class A Acc (EUR)** Class A Ace (SGD)* Class A Ace (SGD)*- Class A Acc (USD)* Class A Acc (IJSD)** Class B Acc Class B Acc (EUR)* Class n Acc (FUR)** Class E! A m (lJSD)+* Class C Acc Class C Ace (AUDY ~ia:;s c A[:(; (ruR)* Class C Acc (EURY Class C Acc (GBP)** Class C Acc (USD)’* Class D Acc Class D Acc (EUR)’ Class I Ace Class I Ace (AUD)’ Class I Ace (ElJR)* Class I Acc iEUR)” Class I Ace (GRP)** Class I Acc (USD)** Class J Act: (.IFY)+ Class A1 Acc Class A I Acc (EIJR)* Class A I Acc (FUR)** Class A I Ace (SCD)” Class AI Acc (USDY Class R1 Acc Class R1 Acc (EUR)’* Class 01 Acc iUSD)*
82.54
83.48
82 2B
84 titi
07 14
82 73
1W.77
105.80
104.34
102.60
10ti.10
111.74
103.1B
9.30
9.45
19.77
19.34
20.43
21 5 1
19.55
39.05
67.5)
75.14
74.83
74.41
75.63
76.00
74 BO
30.52
43.73
39.24
37.97
40.61
44.93
38.48
127.63
131 .8G
124.72 79.09
123.70 78.47
1?7.91
80.90
132.97
84.36
124.32 78.88
- llnhwgea mirllicwrt?rl:;y ~GYX:S.
’* Fedqed rnult:currexy classes. ’** Periinlly hr:dgcd (hy Ci.mrl Managen rnu1:icurrercv classes
The UPI Asset Value per share is StatQd in the currency of !hE share class The i l O l E ~ oil pages 14 t 3 !Y! b r r r l 011 iritogral Dart oi these finaicial s:a!ernen!s

Page 94 Schroder International Sclectiori Fund Serni-Annual Report June 2000
Statement of Net Assets as at 30 June 2008 (cont)
Schroder Schmder Schroder Schroder Schroder ISF Schroder ISF
ISF ISF ISF QEP ISF North American Japanese us Global Global QEP
Equity Large Cap Equity Active Global Equity Alpha Alpha Sigma Qualityle) Sigma
.IPY USD L J X I USD I JSD USD
Net Asset Value as at 30 June PO08 i,iil7,949.904 5,T33.689 269,G15.737 ui.l./Y9.4>1 120.710.532 142.804344
Shares Outstanding as at 30 June 2008 Class A nis
Class A Llis (I-IJHj** Class A Dis (GBPY
Class A Dis (SGL),!" Class 0 Dis Class C Dis
I Class P Dis jEUl I,!-- C;lass A 1 Dis Class A I Dis (HJI {)' (;Ids:; A I Ui:; (tUH)** Class A1 Dis iWDi' Class I31 Ui:; Class 01 Dis (I IJH)"" Class A Acc Class A Acc (E.IJlJ)* Class A Acc (EUR!** Class A Ace (SGD)" Class A Acc (SGD)** Class A Acc (USD)* Class A Acc (IUSD)*' (;lass B Acc Class 0 Ace (FIJRj*
lass H Ace 'lJSD)**
Class C Ace (/\UD)* Class C Acc (FIJH)" Class (; Acc (tUF()'* Class C: Acc, (GBP)**
Class I Acc (EUR)** Class I Acc: ((;BP)'*
Class A1 Acc: (EIJn)* Clas:; A 1 Acc (EUH)** Clas:; A I Acc (SCD)** Class A1 Acc (US[))* Class B1 Acc Class 81 Acc (EUR)** (;lass B I Acc (US[))*
204,483 268 104,941
13.637 8,908 28.105 .56.718 7 46.508 15
73.054 23,374 15
168.7?8 11,012 1.45?,128 147, /15 2,m9
679 +++
1 13,092
15 23.307 15
302 2.842 929.808
I 5 11.041
15
1 .tY 5,532 13.159 1 .GOO.B70
53,308 89 I0.908 .**
3,837,074 1.1 11,248,075 1255,757 1,061,857
809.2P4 1.004.130 '++
15
5,01 I 150 650 44B.4 13 31 1.385 4.022
15 15
5.831 147

Schmrler International Selection Fund Semi-Annual Report June 2008 Page 95
Statement of Net Assets as at 30 June 2008 (cont)
Schroder Schmder Schroder Schroder Schroder ISF Schroder ISF
ISF ISF ISF QEP ISF North Japanese US Global Global QEP American
Equity Large Cap Equity Active Global Equity Alpha Alpha Sigma Value(d) Qualityce) Sigma
JPY lJSU IJSU IJSD I K D llSD
Net Asset Value per share(') as at 30 .liine 7008 Class A L31s
Class A Dis (HILI)** Class A Dis (GHP)* Class A Dis (GRP)**
CIA:;:: B Dis Class C Dis Class C Dis (GRP)' Class C Dis (GRP)** Class C Dis IUSD)*' Class I Dis Class P nis Class P Uis (EIJR)** Class A1 Ois Class AI Dis (EUR)* Class AI Dis (EIJRj*' Class A1 Dis (USD)' Class R1 Dis Class R1 Dis (EUR!** Class A Acc Class A Acc (EUR)' Class A Acc (EURI" Class A Acc ( S O ) * Class A Ac:c (:.;GDI** Class A Acc (USD)' Class A Acc (USDY* (:lass R Acc Class H ACC (FUR)+ Class B Acc: (EIJR)** Class R Acc (US[))" Class C Acc: Class C Acc (AUU)* Class C Acc (EUR)' Class C Acc (tUH)** (y .. Class C Acc (USD)** <:lass D Acc Class U Acc (t lJI1Y Class I Acc Class I ACC (AUD)* Class I Acc ( E M ) * Class I Acc (EUR)** Class I Act: (GRP)** Class I Acc (USD)" Class >I A(:c (JPY)* Class A I Acc Class A1 Acc (FUR)̂ Class A1 Acc (EUR)" Class A1 Acc (SCD)*' Class A1 Acc (USD)' Class B1 Act Class R1 Acc (EIJRj" Class B1 ACC (USD)*
Class A Dis (Sc:D)*
I dbb C ACC (GRP)**
15.45
14.31 101 .06 16.13
130.09 m u 4
96.92
88.94
85.96
98.34
103.98
86.73
K . 7 4
128.89 89.59
1.121.4.5 133.63 84.72
77.71 *"
89.42 80.40
10.81
1.092.31 99.19 14.32 130.77 82.89
17.24 '**
80.05 80.06
1.158.94 101.20 11.08 136.5/ 89.71
6.81 86.65 78.06 *++
80.87
1.230.24 102.75 18.21 142.82 90.46
90.66 83.00 *"
R1.3?
1.110.70 99 48 15.03 131.4? 83.38
R9.01 80.05
13.66
' Un W g c d riid:icurrenq classes. ** Hedged rntilticur'ency classes. *-' Parllzl'y lhfsgecl ;t)y Furiij Mxvsgcrl riiulticur-encv cIaxs5. ( I ' The Ne1 Asset V;IILI~ per sharr 13 r:tated i r i the c i ixncy cf the share class. Id] Schroder 1st O W Global Active Value was fo:!rerly known le) Schrodcr ISF CEP Global C!oaliP; vias tormerly 4rown as Schroder ISF Cilobal Ouallty Growtli Eqility unt I I Jme 2008 The rictes 01 paqes 14 to 80 f3rm ar; integral part 0' these f,-ar,clal statmwts.
SChrCdcr ISF Glnhal Qmitltdtl-e ACII<?R Wiluf ;.r1111 1 .!me 7CCR
Page 96: Schroder International Sclcdiori F u i ~ i Serni-Annual Report June 2008
Statement of as at 30 June
Net Asset Value as at 30 .Jurie 2008
Shares Outstanding a:; at 30 Junc 2008 Class A Dis
Class A Dis (GBP)* Class A Dis iCBP)** Class A Dis (SGD)* Class B Dis (;lass C Dis Class C Uis (GBP)* Class C Uit; (GBI ')**
Class P Dis (FUR)** Class A1 L)is (;la:;s AI Uis EUR)'
Class Bl DE ( t l J tg *= Class A Acc Class A Ace (I UHj* Class A ACC (tlJH!**
Class A Ace i X D j * " Class A Acc WXN* Class A Acc iUSU)** Class B Ace Class 0 Ace (FIIR)* Class B A(:(: (tlll I)'* Class B Ace (USD)**
Class C Acc (AIJD)* (.;la:;:; C Acc (EUR)' C;lass C Acc (EM)** Class C ACC (GRP,**
CldSS A ACC (SGD)'
Class I Acc (/IUD)* Class I Ace iEUR)* Class I Ace iELIR)** Class I Atic (Gtjl')**
Class AI Acc (L.IIH)*' Clavs AI Acc (XU)** Class A1 Acc (USD)" Class nl A(:(: Class R1 Acc (rLJR)"* Class B 1 Ace (CIS[))'
Net Assets 2008 (cont)
Schroder Schroder Schroder Schroder ISF ISF ISF Schroder
ISF Absolute Emerging Emerging ISF Schroder Absolute Return Europe Markets European ISF
Return Bond Debt Absolute Debt Absolute Absolute EURO Bond R1 Return(') Returd'J) Return Bond USD IUSD EUR IJSD EUR EUR
72.745.770
15
5.399
12.476
12,835
3/.04:3
3.380
7,357 100
15
75.002 213.136
3,977
15.ld.l
10.04:3.314
15
100
15
100
15
100
100,015
100
15
100
172.171.219
21,990
448
BY1 ,097
393.065
289,802 68.554
2,130,543
1,257,855
806.R81
4.736.284
547.623
249.189 15Y ,050
4, 803,334.390
2,579,521
491,358
9.674 2,881,705
1.38 1.708
1.748.728
9.048,152
/.BO1 ,045 1,080.704 6,930.1 10
7,445,762
1,267.163
2.758,l 50
5,721,603
7.29'3.54'3
18,844,685
17,692,839 5,684,854
13,3Y/.3Y:!
2,283,987
478.700 193,058
?n5,140.358
6'3
4,811 .0?0
6,965,403
88,113
53
1 .Y50.051
280.087.410
1.918,ti14
9,930 284,004
4,262,461
2,228,552
1348,458
8,597,788
1 .ci00.523
1.61 7,760 47.209
Schroder lriternational Selection Fund Semi-Annual Report June 2008
I
Statement of Net Assets as at 30 June 2008 (cont)
Net Asset Value per shard'] as at 30 June 2008 Class A Dis
Class A Dis (EUR)** class A DIS (c;nP)* Class A nis IGRP)** Class A 131s W D ) * Class B Dis Class C Dis Class C Dis (CRW Class C Dis (GnP)** Class C Dis !lJSDl*' Class I Dis Class P Dis Class P Dis (EUR)" Class A1 Dis Class A1 Dis [EUtiy Class AI Dis (EUR)" Class A1 Dis ((JSD)' Class B1 Dis Class E1 Dis (EURP Class A Acc Class A Acc ( t U l V Class A Acc (FUR)" Class A Ace (SGD)* Class A Ace pSGD)** (-1, . . , A S S A Ace (!JSD)+ Class A Ace (USDY' Class R Acc Class B Act: (EIJR)* Class B Acc (EUR)** Class 0 Acc (LED)** Class C Ace Class C Acc (AUD)* Class C Acc (EUR)' Class C Acc (EUR)** Class C Acc (GBP)'* Class C Acc (USD).* Class D Acc Class D Acc (EUR)* Class I Ace Class I Acc (AIJDP Class I Ace (EUR)' Class I Acc (EUR)^* Class I Ace (GRP)** Class I Act: (l!SD)** Class J Acc (JPW Class AI Ace C;IRSS AI Acc (FUR)* Class A I Act: (EIJR)**
Class A I Ace (USD)* Class B1 Acc Class B1 Acc (EUH)" Class R1 Ace (USD)*
class A 1 ACC (sGnp*
Page 97
Schroder Schroder Schroder Schroder ISF ISF ISF Schroder
ISF Absolute Emerging Emerging ISF Schroder Absolute Return Europe European ISF Markets
Return Bond Debt Absolute Debt Absolute Absolute EURO Bond R l Return(') Return(g1 Return Bond USD USD EUR USD EUR EUR
13.11
12.77 95.00
98.9R
97.14
98.04
(26.22
98.9:2
98.05 100.75
101.09
99.22 102.04
98.04
afi.77
14 .95
13.13
20.60 12.99
98.99 15.75
98.Y3
88.58 14.63
98.56
99.1 1 16.16
99.08
99.58
'30.55
17.31
15.15
73.85 14.69
- I!nhmgeo mlrlticwency c l ~ ~ s e s . "" I ledqed rw:!#currenc;. classes - Pa.hally hodged Ihy h n d Manager: rnulticurreicv classes 1'' T!Y Nr.' A'iki!: Vrlliic pcr .;hart: i!j ?toted i r i the currency cf the s5are GIZSS. ('1 Schrcrder ISF Emeqng Exope Debt Absolux Seturn ,)<as for?lerly k n m n as Schroder ISF Converging Eu'op Gontl u-til 1 Jilw 2008 (Y) S(:twrji!i ISF Fm-rgirig Markcts Dsbt Absolute Heturn vms tarrner!y k rmm a5 Schrzder IS1 C-mrging Markef? I?ebt until 1 June 21!W The -otes cn paqes 14 !o 51) form an integral pa? of theze financia statements
13.83
23.25
17.55 18.00
73.45
26.78
13.86
19.3/
15.76 20.24 23.26
25.28
??.W
24.68
75.03
26.26
28.77
27.69 76.76
22.00
24.94
21.89 24.68
16.66
21 -34
?0.77
72.38
34.60
20.75
6.89
8.91 9.02
12.11
11 fd
12 48
12.96
11.15
18.52 11.06

Page 98 Schroder Interriatiorla1 Seleclion Fund Semi-Annual Report Jurie 2008
Statement of Net Assets as at 30 June 2008 (cont)
Net Asset Value as at 30 .JUIW 7008
Shares Outstanding as at 30 Jurie 2008 pi, , 00 A Dis
Class A Dis (EO1 4,!*r (:lass A Uis (mry Class A Dis iGRP)** Class A Dis (SGDj* Class R Dis Class C Dis
Class I Dis Class P [lis
Class A1 Dis ([USD,!* Clas:; t( I uis pi,. ,.,,> I A=., B I Uis (EURj** Class A Acc: <;lass A Acc (EURj* class A A<;C (FUR)** Class A Acc (SGD!* Class A A ~ C (XU)** Glass A AcC; (LJSDj* Class A Acc (IJ:;D)** Class Li Acc Class n Acc ( t l J l i)"
Class 0 Ace (IIST))*' Class C Acc (:lass: C; Ace (AUUj'
CIXS B A ~ C (rim)**
Class I Acc (AUDY Class I Acc (kIUtJj* Class I Acc (F.LJlg'* Class I Acc (C;nP)*" Class I Acc (USD)**
A1 Acc (EURY*
Class A I Acc iUSDj* Class R1 Acc Class B1 Acc (EUH)^* Class R1 Acc (I)SD)*
. A I A(:(: \SGD)*'
Schroder Schroder ISF Schroder Schmder
ISF Schroder Schroder Global ISF ISF EURO ISF ISF Inflation Hong Kong us
Short Term European Global Linked Dollar Dollar Bond Bond Bond Bond Bond Bond
Ei in EUR lJSU EUR I IKD lJSD
5RR,t',S1'1.83 1
1.272.763
1 fi5,:<09 188.53/
36,562.880
94,085,603
16.773,107
1,552.1 11
I,d29.603
35.422
83,Yl 1,841
3iO.434
8.304 1.ti77
(j,x?n,313
2,237,664
16.558
988.21 2
1 ,tiiin.333
773,041,992
749,247
95,933 41 2,801
3,201,963
794.1 1 1
2,961,654
5,485.1 18
1,073,388
3.9007.04 7
305.8 ,'2,336
386,550
583,784 440,377
ti.469.1:jR
422.39? 1.793.739
43.841 2.392.212
7.717
51.769
757.0?4
295,877,325 385.134.005
2,241,492 2,307,301
n,455 9Y4.618
1 84
709
3,599.1 84 5.510.t)31
100
7.440.15/ 3,755.272
100
5.714 2,987,201
13.5fil
Schroder International Selection Fund Semi-Annual ReDort June 2008 Page 99
Statement of Net Assets as at 30 June 2008 (cont)
Schroder Schroder
ISF Schroder Schroder Global ISF ISF Schroder ISF Schroder
EURO ISF ISF Inflation Hong Kong us Short Term European Global Linked Dollar Dollar
Bond Bond Bond Bond Bond Bond EUR EUR USD EUR HKD I JSD
I I
I
!
I
I
I
I
I ! I
I
~
Net Asset Value per share(') as at 30 June 2008 (:lass A Dis
Class A Dis (FIJR)** Class A Dis (GBP)' Class A Dis (GBP)** (.:lass A Dis (SO)* Class B Dis Class C Dis Class C Dis (GRP)* Class C: Dis !(;nP,!** Class C Dis (LJSD)** Class I Dis Class P Dis Class P Dis (EIJR)'* Class A I Dis Class A I Dis (EUHY Class AI Dis (EUR)*' Class A1 Dis (USD)* Class R1 Dis Class E l Dis (FUR!** Class A Ace Class A Acc (EUR!' Class A Acc (EUR)" (:lass A Ace (SGO)* Class A Acc (SGIJ)'* Class A Acc (IJSU)" (:lass A Ace (lUSDi** Class B Acc Class B Acc (EIJR)' Class B Act (CIJR)** Class B Acc (IJSD)'" Class C Act: Class C Ace (AIJD)' Class C: Acc (ELIR)* Class C Acc (ELJIIY Class C Ace (C;RF)** Class C ACC (U%l)** Class 0 Ace (;lass D Ace (EUR)' Class I Acc Class I Acc (NO)* Class I Acc (tlJH)* Class I Acc I'EUR)** Class I Ace (GBF)* Class I Acc (USD)** Class J Acc (JPY)* Class A I Acc (;lass A I Acc (EUR)- Class A I Acc (tUH)** Class A I Acc (SGD)*' Class A I Acc (USD)* Class E1 Acc Class R1 Acc (EUR)" Class R1 Acc (USD)*
4.31 5.52 6.8/
5 (9 5 05
8 98
8 14
9 66
9 14
105 87
R 74
14.62 10.87
23.48 10.88 11.11
4.31 6.4? 3.21 5.71
21.75 23.98
6.01 7.4? 73.47 1 /.4r 15.44
104.19
23.98 22.95 6.95 7.00 16.96 14.68
103.57 23.77 23.73 6.20 7.73 17.82 16.02
104.59
24.28
6.30 8.04
7.19
24.38 11.92 15.59
105.32
14.91 5.86 22.88 17.05
5.52 7.78 14.07
* Clnhedged rnulticurrency classes " HWyed rnulticuTwicj c'asses '-' Parllallv heclgorl ;by Fiirirl Ma:~ayr! rnulticurrency cla?ses ('1 The Net Asset Value Fer share IS stated 11 the cunency 0' the ! i l i i~e d~!;!; The r i ~ t ~ s or1 pages 14 to $5 tcrrn a- inteqral part 3'these 5-ancla! statemeits

Page 100 Schroder International Selection Furid Serrii-Annual Remrt June 2008
I
I
Statement of as at 30 June
N et Assets 2008 (cont)
Schroder ISF Schroder Schroder Schroder
Schroder Asian ISF ISF ISF Schroder ISF Local EURO Global Global ISF
Asian Currency Corporate Corporate High Strategic Bond Bond'") Bond Bond Vield Bond lJSD USD ElJH USD us11 lJSD
Net Asset Value as 111 30 .luna 2008
Shares Outstanding as at 30 Junc 2008 Class A Dis
Class A 015 (GBPJ* (-1, , dbb .. A [3lS (tlJl ji**
Class C Dis
Class C Dis (GtX'i" Class C I1is (IJSD)" Class I 111s Class P Dis Class P [lis iF(UR)** Class AI Dis Class A1 [)is rEUR)*
Class c DE (GHP)*
class A I DIS (rim)**
(;law Bl Uis (EUH)** Class A Acc Class A Acc: (ElJR)' Class A A(:(: ( t U I)** Class A Acc (SGD!* Clsss A Acc (SGD)*' Cljss A ACC (IJSD!. (;lass A Acc (US[))** Cldss H ACC Class 0 A(x jrlJIi)* Class B Ace iEUH)** Class B Ace (USD)"* Class C Acc Chss C Ace jAUO)* (:la:;% C Ace (EUH)' Class C k c (FUR)** (;iLlSs c: ACC ( ce ry
Class I Acc Clut;s I Acc iAUC))* Class I ACC (tlJHi* Class I A(;(: ( t l J l i i " Class I Acc (GHP)-' Class I Acc (USD)*' Class J Ace (JPV* Class AI .Ace
Class A1 Ace (:;GD!** Class AI A(:(; ilJSU)' Clsss B1 Ace Class HI A(:(; (tUI tj-* Class Ell Acc (US[)!*
2.352.780.845
25.41 4.1 tid
?b ;
3.57'3 38,957,138
1 1,928,132 482.6'33
114
4.184.804
37.2T1,023
5,054
2.000
1,030.843
152,830
13. BY 1 ,u 10
100
32.1 55.451 2%0.6?4
100
1,270.427
dl .00?.118 131,121.13Y
15
15
15
2,000
10
1.033
614.083
15
3,089.1 89
1,275.1 11
4,350,037
384.263
~71.141
29,l 54
2/.439.541
fi2,639 33,813
io0 1 !j0.772
1.203.164
1.723
802.310
3.338
2'30.70 i
293.948
346.304
6,959
2Y3
47.',.i:51.842
506,498
137.127
31 1.409
125.648
:j83,21 1
2,307,073
3,2n9.204
2,985,581
334.841 831.786
51.525
140,145
874,485,466
220.347
13.799
25.151
146.338
1,057,802
73.236:
547.185
240.988
1,071,072 353,415
478.009
647,569 53.921
97.415
31 3,808

Schroder International Selection Fund Semi-Annual Report Junc 20OH Page 101
Statement of Net Assets as at 30 June 2008 (cont)
Net Asset Value per share('' as at 30 June 2008 Class A Dis
Class A Ui:; (tlllq)" Class A Uis (GBP)' Class A Dis (GBP)" Class A Dis (SGD)* (-1- . .
I ASS n nis Class C Dis Clns:; C Dis (GBP)" Class C Dis (GBP)*- Class C Dis (USD)** Class I Dis Class P Dis Class P Dis (EUR)** Class A1 Dis Class A I Dis (EUR)' Class A1 Dis iEIJR)'* Class A I Dis (USD)' Class 01 Dis (:lass 61 Dis !ElJl7y* Class A Acc Class A Acc (FIIR)* Class A Acc (CUR)** Class A A(:(: (SGD)* Class A Acc (SGD)" Class A Acc (USD)* Class A ACC (lJSbt** Class B Acc Class D Acc (tUIq* Class B Acc (CUR)** Class B Acc (%D)** Class C Acc Class C Acc (AUD)* Class C Acc (ElJn)' Class C Acc (CIIR)** Class C Acc (GBP)** Class C Acc (USD)** Class D Acc Class U Acc (EUHI' Class I Acc Class I Acc: (AIJD)* Class I Acc (EUR)* Class I ACC ( t l J l i ) * * Class I Acc (C;RPJ*' Class I Acc (LED)** Class J Acc (JPy)' Class A1 Acc Class A1 Acc (EUR)' Class A1 Acc (FUR)** Class A1 Acc (SGU)** Class AI Acc: (LJSD)* Class B1 Acc Class R l Acc (FIR)** Class B1 Act: (USDJ'
Schroder ISF Schroder Schroder Schroder
Schroder Asian ISF ISF ISF Schroder
Strategic Asian Currency Corporate Corporate High Bond Bond 1 ) Bond Bond Yield Bond USD uso ElJR USD USD USD
ISF Local EURO Global Global ISF
* ~ J i h ~ I g o d milticurremy classes ** t ledced rnulticurrency classes *=* Partial'y hedged :by Fund Mar'agcrl riiiiltic~ir:cricy (;IR!;!:C:I 1') The Ne1 Axe1 Valde per sbare IS stated In the currency cf the share ~13% lh1 Schrcder ISI- Asian Local ,Zurrcricy R x i d via!; I;iiinchra 011 C Kay 2G09. 1 he nctes on cages 14 to $0 <arm an inteoral part of ttiiiRc t w u c a S1aIRi"RmS
7.92
10r.70
8.71 8.69
7.85 4.98
99.48
8.74
12.04
102.4:2
8.88
11.47
17.83
102.90
13.55
103.54
11 3 7 7.53
102.28
11 .?A
98.45
98.51
an.98
9.87
'38.93
09.03
99.14
98.93
4.97 89.49
4.98 5.39
12.83 6.85
101.12
17.33
13.36
14 00
12.52
12.00
6.47
'38.85
7.26
7 55
6 68
98.60
i? 24
19 68
24 48
23.35
24.02
22.85
25.06
23 76
25.83
?4 54 109.97
21.12
105 A6
'38.32
07.91
100.74
110.97
105.351
108.92
103.43
117.98
107.39 107.81
110.14
1 10.34 106.85
109.17
103.74

Page 102 Schroder Intcmattonal Sclcction Fund Sctni-Annual Rcport Junc 2008
Statement of Net Assets as at 30 June 2008 (cont)
Schroder Schroder Schroder ISF
ISF ISF Schroder EURO Schroder Asian Global ISF Equity ISF
Convertible Convertible Strategic Secure European Bond('' Bondti' Credit 201 Olk' Defensive
USD USD EUR USD EUH
Net Asset Value as at 30 June 2008
Shares Outstanding as at 30 Juric! 2008
13.190.132 32.1 IU.i)28 20.121 .s i2 24.569 ti58 480,856.786
5.4 14.873 Class A Dis iEUHj"* Class A Dis ((.;nP)* Class A Uis (CHI 'J"
c ass C DlS (;.ass (; 111s (c;ry!* Class C Uls ((&PI** Class C, Dis (US))*- Class I UlS Class P Dis Class P 13is il.lJFij** Glass A I DIS Cla:;:; A1 Dis (ElJR)* Class AI a s (FUR)** (XI!;!; AI Di:; (LJSD)*
Class A Acc (EM)** (Xis:; A A(:(: (:;GO)* C'ass A Acc (SCU)**
Ciass H A(;(; (ElJR)" Class t3 Acc (t-IJH)**
Class C Acc (AUDj* Class C Acc (EUR]' Class C Acc iEUR)-* Class C Acc CAP)** Class C Acc jUSU!--
D Acc D Acc (FIIR)* I Acc
Class I Acc (AUD)- (:lass I A(;(; ( ~ L J R ~ Class I Acc (EUH)*-
Class .J Acc (.IF'Y)* Class A I Acc Class A1 Acc iEUH)* Class A1 Acc !EUR)** Class AI Acc (SGD)** Class AI Acc ilJSU)' Class R1 Acc
Class B1 Acc (LJSUY
(?I, ,dss , . I31 A(;(; (I-IJR)**
13.799 6.898
1.458
100
15
100
02.494
15
100
23.0ti7
53.658 11,775,951
100
15 1.429
10.588 42.083
100,o 1 5
100
100,015 28.533
100,000
15 15 31 ,no4 961.688
100 100
Schroder International Selection Fund Semi-Annual Rcport June 2008 Page 103
Statement of Net Assets as at 30 June 2008 (cont)
Net Asset Value per share(') as at 30 June 2008 Class A Dis
Class A Dis (EIJR)** Class A Uis (GBP)' Class A [)is (GBP)** Class A Dis (SGD)* Class B Dis Class C Dis Class C Dts (GBP)* Class C Dis (GBP)** Class C Dis (llSD)** Class I DIS Class P Dis Class P Dis (TlJR)** Class A1 Dts Class A1 Dis iEUR)* Class A I Dis (FIJR)** Class A I Uis :IJSUY Class 01 Dis Clas:; B1 Dis (EIJri)** Class A Ace Class A Ace (EIJR!* Class A Ace !FIJR)** Class A Ace (3GD)' Class A Acc (SGD)** Class A Acc (USDI' Class A Ace (IJSO)** Class B Ace Class B Acc (EUR)* Class B Acc (EIJR)" Class B Acc (IJSD)" Class C Acc Class C A m (AIJDY Class C Acc (EURj* Class C Act: (FAIR)** Class C Ace GBF')" Class C Ace (rJSDp* Class U Ace Class D Ace (FIURY Class I Ace Glass I Acc (/IUD)* Class I Acc (EUR)* Class I Acc (EM)** Class I Acc (GBP)" Class I Acc (lJSDr* Class .I A(:(: (.IPYI* Class A I A(:c Class A1 Acc (EIJH)' Class A I Ace (EUHj" Class A I Ace (SGD)** Class A1 Ace (USD)* Class R l Ace Class B1 Ace (HJH)" Class B1 Acc (USD)*
Schmder Schroder Schroder ISF
ISF ISF Schroder EURO Schroder Asian Global ISF Equity ISF
Convertible Convertible Strategic Secure European Bond'') Bondh) Credit 201 O(k) Defensive
USD USD FIJR I JSD EUR
95.73
96.65
96.f=d
06.58
07.02
Rfi.89
07.29
97.14
G6.67
96.60
98.40
98.70
88.32
98.57
98.61
98.91
99.00
90.18
tl8.36
86.77
96.33
95.23
98.50
101.71
96.96
10.83
1.028.05 966.67
10.84
10.56
10.76 ~
* Ihhsdclged rnulticurre-cy ciasses +' Hed:ed ~,>iiItii:iiiieim:y ~l i~ee: ; "* Part ally bedged (b) Fund Manager! rnulticurrency classes. ('1 Tht: hlpt A b w t Wuc p? S ~ W P I$ W:ed 111 !he currencj cf thS $hxe claw ('1 Schwiei :SF Asian Cmverinle Bard was mnched cn i d '4arr.h 2608. (i) Sch'oder ISF Global Convertible Don3 gb>as launched on 14 March 2306 (k) The 3at:i show: for ScPiodeq ISF EVRG Equip; S e u e 20: S are based cn :he las! aba#lable pricing day 21 Jure 7008 [he notes cn pages 14 to 83 tc'm an iptegral part of these financial statevepts
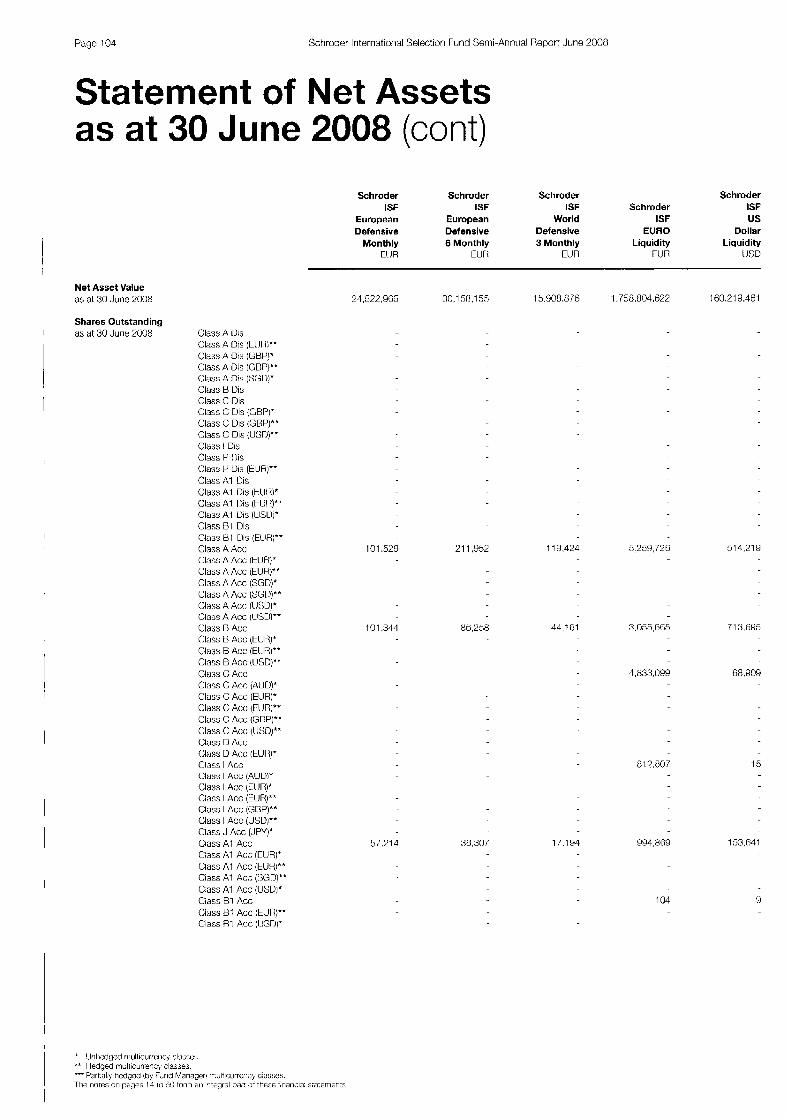
Page 104 Schrodur lriterriatiorial Selectiori Fund Semi-Annual Report June 2008
Statement of Net Assets as at 30 June 2008 (cont)
Net Asset Value as at 30 June 2008
I
Shares Outstanding as at 30 Ju re 2008 Class A llis
Class A DE ( tUlj;Ax (;lass A Di:; (GBP)" Class A Dis iGBP)** Class A Di:; (SGD;* Clx;:; tl U l S Class C: DIS Class C Dis (GBPJ* Class C Dis tGDP)**
I
Class A1 111s (tIJ1 {)*- Class A I Uis (UsUJ* Class R1 Dis Class B 1 Uis (EUH;*-
Class A Ace iEUR)** Class A Ace iSGD)* Class A Ace (SGD)** (:lass A A(:(: (USU)' Class A Ace (USW'
ass H Acc IElJR)" Class B Acc iUSD!-- Class C Acc Class C Acc (AUU? Class C Acc I'EUR)* Class C Acc (FIUR)**
Ciass I Acc iEUH)** Class I Acc (GnP)A* Ciass I Acc (USUJ** Class .I Acc (JPY)* Class A1 Ace C:ass AI Acc (CUR)* Class A1 Acc (EUR!** Class AI Acc (:.XD)** C.ass A I Acc iUSD]* Ciass R1 Acc Cias:; HI Acc (tu1 {)*- Ciass R1 Acc jlUSn)"
Schroder Schroder Schroder Schroder ISF ISF ISF Schroder ISF
Defensive Defensive Defensive EURO Dollar Monthly 6 Monthly 3 Monthly Liquidity Liquidity
ELK! EUH EIUR FIJR I K D
European European World ISF us
24522.965 30.1 58,l 55 15,509.8(6 1,758,804,822 160,219,461
101.529 21 1,952
101.341
57.?14 30,307
1 18.424
44.101
17.194
5.258,726 514 2 1 9
3.0:75,665 71 3,895
1 ,B33,0Y9 68.Y09
817,807 15
Y94,8Ii9 153.841
1 04 9

Schroder Intsrriational Selection Fund Semi-Annual Report June 2008
Statement of Net Assets as at 30 June 2008 (cont)
Net Asset Value per share'') as at 30 June 2008 Class A Dis
Class A Dis (EUR)** Class A Dis (GRP!* Class A [)is (CBP)" Class A Dis (SGD)* Class B Dis Class C Dis Class C Dis (GBP)' Class C Dis (GBP)" Class C Dis (LI.SO)** Class I Dis Class P Dis Class P Dis (EURI" Class A1 Dis (:lass A1 Dis [EI!R)* Class A1 Dis (EURr* Class A1 Dis iUSD)* Class HI Dis Class 81 Dis {WHY* Class A Acc Glass A Ace (FUR)* Class A Acc (tUli)" Class A Acc (SGDY Class A Acc (SGD)** Class A Acc (USD)- Class A Ace (USD)-* Class R Acc Class B Acc (EUR)' Class B ACC (EUR)" Class 0 Ace (USD!** Class C Acc Class C Acc (AUD)' Class C Acc (EUR)* Class C Acc (tUlil" Class C Acc (GRP)*' Class C: Ace (USD)** Class 0 Acc Class D Acc (EURi* Class I Acc Class I Acc (AIJD)* Class I Acc (t.UH)* Class I Acc (EURY' Class I Ace (GBP)**
Class .I Acc (,lPY)' Class A1 Acc Class A I Ace (FUR)* Class A1 Acc (EUR)" Class A1 Acc (SGD!** Class A I Acc (L!>SD)* Class B1 Acc Class R1 Acc (EUR)** Class B1 Acc (USD)*
(-1,- ,&s . . I Acc (lJ.(;U)**
Page 105
Schroder Schroder Schroder Schroder ISF ISF ISF Schmder ISF
European European World ISF us Defensive Defensive Defensive EURO Dollar
EUR ELlR r u R r u R I!SD Monthly 6 Monthly 3 Monthly Liquidity Liquidity I
I
84.52
04.22
91 .00
G0.28
90.00
89 /9
88.1 1
87.87
87.62
11 6.97
116.19
11 a53
120.93
113.11
107.81
I
1 10.94
i 110.32 I
* C!nheclgEd m,iltlcii.~enq classes *+ 3i:dgrrl riiultmr;urrcr7:;.j (;m!;f?,. =*= Partially hedged iby Fan3 h4anager: rnulticarrency classes. ('l ii:e Net Asset Value per share IS stated In the cu'reo'cy of tbe share c:ass Thr nctfs on pages 14 to 50 trrm 3n in'egral nart ot these tina-c,al Statement5

Pagc 106 Schroder Inter-national Selection Fund Semi-Annual Rcport June 2008
Distribution of Investments by Industry
Bonds, Commercial Papers, Assets and Mortgage Backed Securities Money Markets Instruments -Assimilated to Cash
Other Securities Advertisirig Advertising Ser+es Aerospacc & Military Technology Airport Services Aqricultural 0 iPrdtiori5 Aiipliariw:; & \&&h Ouratile:; Ap IiMtion Soltwarc Aul)on;obilcs Banking Bwcraycs & Tobacco Broadcasting & Cable TV Buildinq Materials & Components Business & Public :;ervices Ct ien iicnk (;ornmercial Services Cornpuler Sollware 8, Services Computer Stora c & Pcriphcrals Construction & Joysing Consumcr Elcctronics Consumcr Financc Data Processiri(1 I I Heproduclion Department Stores Divcrsified,Metals & Mining Llruq Helail rleitrical & Clectroriics Electroriic Corripurierits & Iristrurrier-its tneryy Equipment & Scrviccs tneryy Sources tirr. : c dn~ial .,ervices tood & Housetiold Ik'roducts Food Retail Forest Products & Paper Cold Mines Health & Personal Care I leavy Flectrical E(~~iit irrieil l I lotels
Iinvestmcnt Funds IT Consultirig & Services I eisiire & Tourisrri Machinery & En ineeririg Meal F'oultfy & i s h Merchandisin Metals - Steep Misc. Matcrials & Commoditics Motofc cIe Manufactutcrs Multi - h i s t r y Multi - Uilities Office :.hip )lies & Forrris oil & as 6rilling Oil 8 Gas Exploration 8, Production Packa(]in(] & Containers Ptiarrriat:e~itic:als Photo tqui riient &Supplies Publishin Printing Real Esta?e Recreation Restaurarits Retail Sernicoriductors Soft Dririks Systems Softwarc Iblccommuriications lextile I I Apparel Iradiny Corripanie:; K Uistritiiitors Trarisportatiori - Airliries
Transportation .- S h i p : TrdriSportdt!ori - k d d ,& Rail
utilities - rlectricdl
Schroder Schroder Schroder ISF Schroder Schroder Schroder
ISF ISF European ISF ISF ISF EURO European Large Global Italian Japanese
Equity Equity Equity Equity Equity Cap D 9.c <I,. "j
0.71
1.19 1 .95
15.96 0.81 2.91 3.31
6.32
0.74
1.01
1.30 6.02
8.44
5.26
4.98 1.73
0.21
3.42
0. ?7
11 .d0
12.05
0.62 0.10
11.OY 1.14 3.23 1 .?I5
5.97
0.51
1.11
?.47
5.84 1 .a8
10.20
1.15
3.49
2.86
0.05 12.93
1.51 10 1%
1.09
1.73
ti.38
2.80
8.35
1.59
0.83 1 .05
1 / .12 1 .0Y 1 .80 1.45
7.59
0.49
2.09 1.72
1.20 6.07 3.9/
5.79
2.67
1 .72 1.29
1 1 .Y5
10.14
0.6ii
0.65
Is49
0.74
/.4Y
1 A8
1.01
0.76: 2.56 ?.6? 6.19
1 .R4 2.54
2.48
2.23
3.36
2.49
5.31 3 49 1.44
6.37
0.81
5,fLi 0.6Y
7 93
3.75
2.84 / /:3 0.99 7.27
1 03
0 79 2 53
1 .00 1 85 1.30
1.67
5.83
13.10
0 01 20 G t i 2.28
I .70
103
0.92
4.89 2.78
1.33
9.89 1 .R0 7.03
1 .66
4.68
9.34 10 59
9 gcj
1 .09
X l 5 2.34
0.35 0.00
10.71
1 .59 9.75 9.91
0.81 1 .Y2
9.08 0.28 2.81 0.94
1 .18
9.93 2.98 1.80
2.49
0.29
0.39
1.37
1.19
0.98 8.33
5.8:)
0.71
5.24 2.39
3.27
0.79 1.46
4.26 1 .AT 7.27
3.87 1.05
Investments portfolio as a percentage of Net Assets 96.66 101.66 96.96 98.78 101.14 98.95
Other Net Assets/(Liabilities)
Total Net Assets
3.34 (1.66) 3.04 1.22 11.14) 1.05
100.00 100.00 100.00 100.00 100.00 100.00
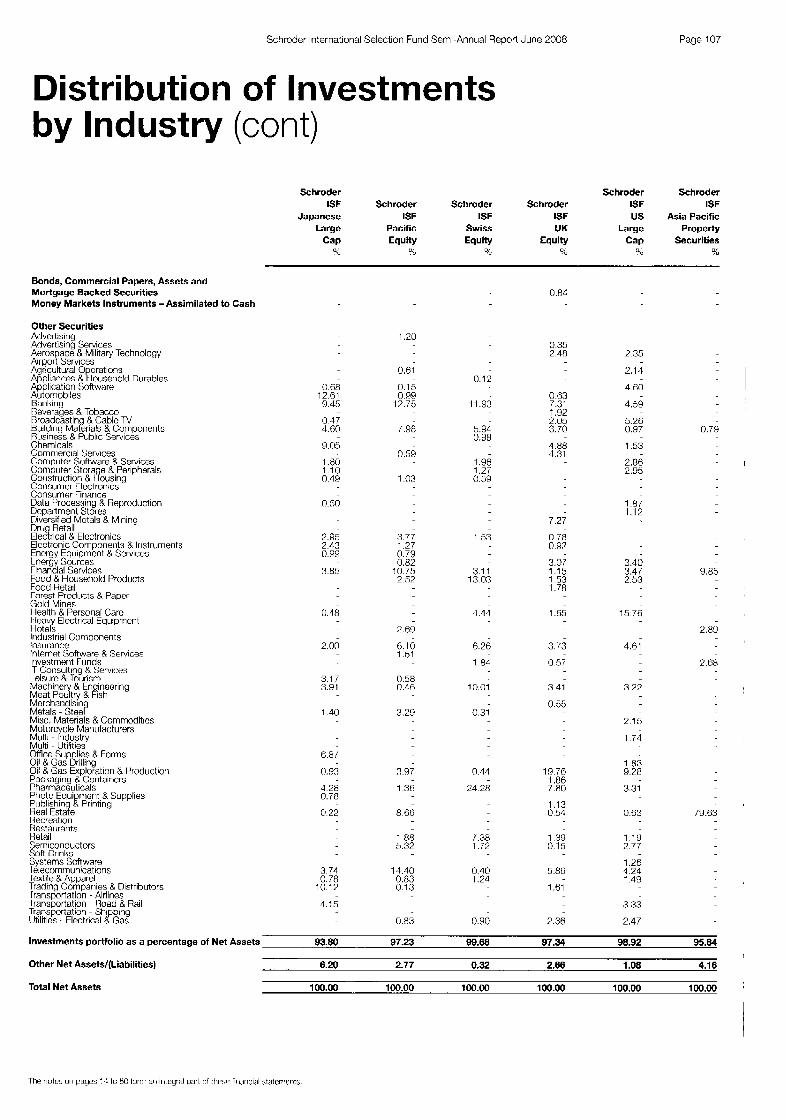
Schroder Iriternatiorial Selectiori Fund Semi-Annual Report June 2008 Page 107
D i st vi but i o n of I nvest men ts by Industry (cont)
Schroder Schroder Schroder ISF Schroder Schroder Schroder ISF ISF
Japanese ISF ISF ISF US Asia Pacific Large Pacific Swiss UK Large Property
Equity Equity %
Securities 96
Bonds, Commercial Papers, Assets and Mortgage Backed Securities Money Markets Instruments -Assimilated to Cash
Other Securities Advertisirig Advertising Services Aerospace 8 Military Technology Aireorl Services Agricultural 0 crations Appliaqces K flousehold Durables Aonlication ::oftware Aiiiomobiles Bxikiriq Heverabes & Tobacco Rroadcasting & Cablc TV Biuilding Materials & Cqmponents Rusiriess & Public Sermes Chemicals Comniercial Services Conipiiter Software 8 Services Computer Stora e & PeriDherals (;oristriiLTion & &using .;onsiinier r!ectronics >onsumer Firlarice jata Processing R Relmdiiction kpartrnenl Stores 3iversified Metals & Mining !rug Retail :lectrical & Elcctronics :Icctronic Components B Iristrurnients %orgy Eqiiipmenl & Services Inergy Sources 'inancial Services Food & Hoiisetwld Products Food Hetail Forest Products & P a m ;olcl Mines lealth & Pergonal Care leaw Electrical EaulDment -ioteis ndustrkl Cornponents nsiirance iterriet Software 8 Services ivestment Furids T Consulti!lg 5 :;ervic:es
Leisurc 8, lourism Machinery 8, En inoc Meat Poultry & ash -'ring Mcrchandisin Metals - Stee? Misc. Materials & Commoditics Motorcycle Manufacturers Miilti - lridustty Multi - Utilities Office Sup lips 8, Forms oil l as B i i i i g Oil & GRS Exploration & Production Packagiriy 8 Containers Pharmaceutical:; Photo Equi mcnt 8 Supplies Publishin Printing ea^ Estiiqe Recreation Hestaurarits ?@tail ..,emiconductors Soft Drinks Svstems Software t Q1econ;rriuinications Textile 8 Apparel Tradino Comvariies & Distributors
0.68 12.R1 9.45
0.47 4.60
9.05
1 .80 1.10 0.49
0.50
2.95 2.43 0 . E
X85
0.48
2.00
3.17 3.81
1.40
6.8/
0.'13
4.28 0.78
0.22
3.74 0.78
10.17
1.15
1.20
0.61
0.15 0.W
17.75
I .98
0.59
1 .n3
3.77 1.27 0.79
10.75 2.52
0.82
7 69
6.10 1.51
0.58 0.16
3.29
3.97
1.36
8.66
1.88 5.32
14.40 0.83 0.13
0.83
0.12
11.93
5.94 0.98
1.96 1.27 0.59
1.53
3.1 1 13.03
1.11
6.26
1 .84
10.01
0.31
0.44
24.28
7.38 1.72
0.40 1.24
0.90
0.84
0.35 2.48
0.63 7.31 1.92 2.05 3.70
1.88 4.31
7.27
0.78 0.97
3.07 1.15 1.53 I .7a
1.65
3. /3
0.57
3.41
0.55
19.78 1.86 7.80
1.13 0.51
1.39 0.15
5.86
1.61
7.36
2.35
2.14
4.60
4.59
5.26 0.97
1.53
2.86 2.95
1.8/ 1.12
3.40 3.47 2.53
0.79
- 1
9.85
15.76
2.89
4.61
2.68
3.22
2.15
1.74
1 .R3 9.28
3.31
0.63 70.63
1.19 2.77
1.26 1.24 1.49
3.33
2.47
Investments portfolio as a percentage of Net Assets 93.80 97.23 99.68 97.34 98.92 95.84
Other Net Assets/(Liabilities)
Total Net Assets
I
6.20 2.77 0.32 2.66 1.08 4.16
100.00 100.00 100.90 100.00 '100.00 100.00 '

Page 108 Schrodcr lriterriatiorlal Selection Fund $mi-Aririual Report June 2008
Distribution of Investments by Industry (cont)
Schroder Schroder Schroder Schroder ISF ISF ISF ISF Schroder Schroder
Asian Asian Asian BRlC ISF ISF Total Equity Smaller (Brazil, Russia, China Emerging
Return'") Yield Companies India, China) Opportunities Asia "r u.* SG % 9"
Bonds, Commercial Papers, Assets and Mortgage Backed Securities Money Markets Instruments -Assimilated to Cash
Other Securities Advertising Adwrtising Serdices Aerospace & Military lechnoloyy Airport Services Agricultural 0 eratioris Appliances 8 &o;ischold Durables Ap licatiori Software Aukmobiles
14.34
2.17
0.82
1.03 10.38 1.01 0.77 1 .ci7
0. 11
1.04
(1.84
0.3! 1 O.33
0.04
0.34
1.44
1 .77
0.72 1.07
1.04 3.31
1.38
13.79 0.03
3.80
2.18
2.28
0.55 7.48 0.59
6.42
0.67
1.28
0.1 9
1 .52
6.84 1 . I 5 0.13
1.38 0.71
0.26 0.52 0.71
3.30
4.98
0.60
0.38 1.32
3.95
1.15
2.05
2.49
0.59 0.w
10.23
2.65 8.03
13.82 1.53
0.38
0.36
0.48 1.82
5.57
3.35 1.47 1.94 0 .K 1 .08 2.80
0.61 1.16
12.49 0.89
1.13 10.15 3.2'3 2.1 1 3.93
0.73 13.38 Banking
Beverajes & Tot!at:c:o Rroadcastiriy & Cablc TV Buildiny Materials & Co.mponerits Business & Public Services
1.29 1.08 0.53
1.1 3
5.1 1
3 00 6.W
Chcmicals Commercial Services Computer Software & Serbices Computer Storac e & Peripherals Construction & doyr ig Consumcr Electronics Consumer Finance Data Processing & Reproduction Uepartmcnt Stores Uiversified Metals & Mining Dru Retail Fle%ical'& Elcctronics Electroriic Corriponents & Instruments Energy Equipment & Services Encrgy Sources Financial Serviccs ~ o o d a I iousetiuld Products
1.30
0.6'3 0.1 7
1 43 1.29 1 .YY 1 ti8
0.69 1 60
1.33 5 07
2 ?e
4.88
3.43 0.91
1.10 12.26
2.33 0.76:
22.78 0.76
6.30 4.22 3.09
roocj n e ~ i forest F'roducts & Paper Cold Mines Hcalth & Persorial Care Hcavv Electrical Fauiarrierit
7.00 1.28
1 32 1.35 0.88 , .
Hotels Industrial (;orriponenLs Insurance Internet Softwire & Services Iriveslnient funds 1.1 Consulting 6 Scrvices Leisure & lourism Machinery & En inccring Meat Poultry & {sh Merchandisin Metals .. Steep Misc. Materials 8 Con-imodities Motorc cle Manufacturers Multi - ridustry Multi - Utilities Office Supfilgs & I orms Oil & Cas rilling Oil R Gas Exploration & Productiori Pacltaying 4 Containers I 'harmaceuticals Photo r q u merit R Supplics Publistiiri k Piintiny Real EIsl:fe necrcation Hcstaurants Retail Semiconductors %)It Drinks Systems Sofpmrc Telecommunications Textile 8 Apparel Trading Compaiies,& Distributors lransportation - Airlines Trarisporlalinn Road & Rail Trarisportalion . Slni ing utilities - rlectrical88as
3.33 1.69 4.93
1.04 3.10
2.88 0.u3 1.20 7.68 0.74
1.87 1.13 1 29
2.94
3.0? 70.14 12.79 2.94
1 .8H 0.51 1.84
3.18 1.04
1 4 .U8 0.31 3.50
2.52 0.83
1 .10
15.31 0.91 7.51
0.1 1 1.35
2.19 2.12 1 .09 0.88 2.20 0.74
10.00 17.41 l.lE 1.01
0.93 0 4 4 2.81 1 82
Investments portfolio as a percentage of Net Assets 77.57 91.31 89.79 97.68 96.02 97.26
Other Net Assetsl(Liabi1ities) 22.43 8.69 10.21 2.32 3.98 2.74
Total Net Assets 100.00 100.00 1w.00 100.00 100.00 100.00
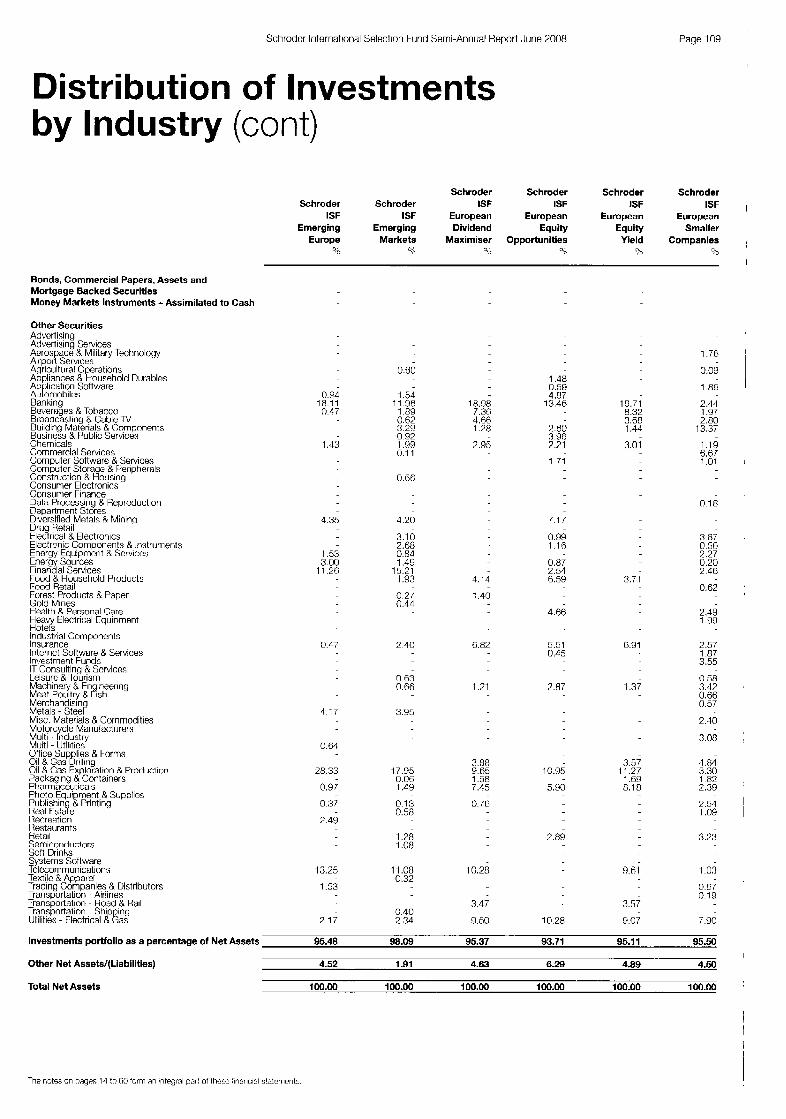
Schroder International Selection Fund Semi-Annual Report June 2008 Page 109
Distribution of Investments by Industry (cont)
Bonds, Commercial Papers, Assets and Mortgage Backed Securities Money Markets Instruments -Assimilated to Cash
Other Securities AdvcrIlsing Advertising Services Aerospace & Military Technology Airport Services Aqricultiiral 0 erations AbpltanFes & fiousehold Durablas Ar)r)lication Software
Consumer Finance Data Frocessing R Reproduction Department Stores Divcrsified Metals R Mining Dru I-Wail H e 3 rical & Electronics Electrcnic Components R Instruments Energy Equipment & Services Energy Sources Financial Services rood & Household Products Food Retail Forest Products R Paper (.;old Mines Health R Personal Care Heavy Electrical rquiprnent Hotels Industrial Components lnstirance lnternct Software & Services In\/estment Funds IT Consulting & Scmices Leisurc & lourism Machinery R Fn ineeriri(l Meat P<ry R fisk1 Merchandisin Metals - Steep Misc. Materials 8 Commodities Motorc cle Manufactiirers Multi - {Idustry Multi - Utilitics Oftice Sup lies A Forms Oil Gas Erilirq Oil & Cas Exploration & Prorhittiori Packaging 4 Containers Pharmaceuticals Photo EauiDment & Suoolics
I lestaurants Hetail Semicorich ictors Soft Urinks Svstems Soltware Te ecornmJnirat on5 Texri c 8 Apparel Trauino CornDan es 8 D siribdors TransEorIation . Airlines
Schroder Schroder Schroder Schroder Schroder Schroder ISF ISF ISF ISF
ISF ISF European European European European Emerging Emerging Dividend Equity Equity Smaller
Europe Markets Maximiser Opportunities Yield Companies 9; 41 n,; Y" YO
0.94 18.11 0.47
1.43
4.35
1.53 3.00
11.2h
0.47
4.17
0.Gl
28.33
0.97
0.37
7.49
13.25
1.53
7.17
0.80
1.54 11 .96
1 .89 0.62 3.29 0.92 1 .G9 011
0.66
4.20
3.10 2.68 0.84 1.49
15.2 1 1 .93
0.2 I 0.44
2.40
0.63 0.56
3.35
17.95 0.OG 1.49
0.13 0.58
1 .?8 1 .OR
11.08 0.32
0.40 7.34
1.48 0.50 4.87
18.98 13.46
4.6b 1.7$ 9.60
3.96 7.95 7.71
1.71
7.3c
4.14
1.40
6.82
1.21
3.88 9.65 1.58 7.15
0.76
10.28
3.47
9.60
7.17
0.99 1.16
0.87 2.51 6.59
4.66
5.51 0.45
2.87
10.95
5.50
1"Tj 8.32 3.68 1.44
3.01
3.7 1
6.01
1.37
3.57 11.27 1.69 8.18
2.89
9.61
3.67
10.28 9.07
1.76
0.09
1 .8c 2.11 1.97 2.80
13.37
1 .I9 6.67 1.01
0.18
3.87 0.56 2.27 0.20 2.48
0.62
2.49 1.99
2.57 1.87 3.55
0.58 3.42 0.66 0.57
2.40
3.08
4 84 3.30 1.82 2.30
2.51 1.09
3.23
1.03
0.67 0.19
7.90
Investments podfolio as a percentage of Net Assets 95.48 98.09 95.37 93.71 95.1 1 95.50
Other Net Assets/(Liabilities) 4.52 1.91 4.63 6.29 4.89 4.50
Total Net Assets 100.00 100.00 100.00 100.00 100.00 100.00
The mtss cn pages 14 :o EC 'nim an ntegial ax: of l h c x 'Inancl31 s!aternerlts.

Page 110 Sctiroder Irilernatinnal Sclectiorl Fur id Semi-Annual Report June 2008
Distribution of Investments by Industry (cont)
Bonds, Commercial Papers, Assets and Mortgage Backed Securities Money Markets Instruments -Assimilated to Cash
Other Securities Advertising Advertising Services Aerospace & Milltab Iectiriology Airporl Scrviccs Agricultural Operatioris Appliances & I-loiisehcild Durables Ap lication Software Aukmobiles Bankina Heisera& R Tobacco Eroachsling B Cable TV Building Mate@ & Comporierit:; Business & Public Services Chemicals Coiiimerci$ Services Computer ..mftware & :;erviccs Computer. :;torn e B Peripherals Constructiori I I IYousiny Consumer rlectroriics Consumer ririar i(:e Data Processiriij t ieproduction Departmerit Stores Divcrsified Metals & Mining Dru lietnil ne3 ricnl 8, Elcctronics Electronic Corriponents R lnstrun Encrgjr Equiprrierit & Services Energy Sources tinancial Services Food & I loiisehold t'roducts Food Retail Forest Products I I Paper Cold Mines Health & Persorial Care I i e a y Eleclricul tquiprnent Hotels Industrial Components lnsi irarice Iritern(3t Soitware it Services
net
Investment Funds 1.1 C:onsultjng & Services ILeisiire B rourlsm M ric,hincry .. & En ineering Meat k ) t J l t ~ & &h Mert:tiandisin Metals - Stee? Misc. Matcrials & Commodities hlolorc cle Manufacturers Multi - h i s t r y Multi - Utilities Office Sup lies & rorni:; 011 cas Erilling Oil B Cas Exploratiori & Prodiiclion Packaging & Containcrs Pharrriaceulic;nls Photo Fqu )rwrit &Supplics Publistiiri h Piritiny Real rstaye Ret:realioi.i t4e:;Laurants Helnll Semiconductors Soft Drinks
Transfortation - Airliries Trarispoftation - Road & Rail 1r:insportation - Ship ing Utilities - Electrical &Ea&
11
Schroder Schroder Schroder Schroder ISF Schroder ISF ISF
ISF Global ISF Global Global Schroder European Climate Global Emerging Emerging ISF
Special Change Dividend Market Market Global Situations Equity Maximiser Opportunities Energy
0 ?? ?J
1.20 1.92
5.90
6.12 :3.79 3.275
2.12
l . / i
1 .OD
1.10 2.70 3.18
3.78
.l.l2
3.29
2.33 3.9% Y .Y5
8.08
I , %
9.25
1 .SB 6.46
1.51
0.50
5.13
5.80
12.U
4.24
5.76 7.22
2.82 1.12 0.07 4.30 2.70
1 00
5.88
1 c.02 1.62
0.89
3.43
2.8; 1.14
4.71
10.45
15.50 9.45 1.53 1.07
2.04
1 .F5 3.25
1.16
2.36
6.72
2.B2
l . l G
3.47 12.753
7.1 I
1 .70
9.75
3.83
10.59
1 3 4
0.75
1.11
3.18
15.38
5.64 16.55
1.05
1.87 5.70
12.03
32.87
10.58
2.38 10.42
0.Y8
1.43 1.18
4.26
1 .u5 1 54
5.13 2.07
0.71
3.47
11.47
1.75
3.37
5.86
1.55
3.36
3.00
Investments portfolio as a percentage of Net Assets 96.29 97.60 98.06 98.07 74.56 91 .IO
Other Net Assets/(Liabilities) 3.71 2.40 1.94 1.93 25.44 8.90
Total Net Assets 100.00 100.00 100.00 100.00 100.00 100.00

Schroder International Selet:tiori Funtl Serni-Annual Rcport Junc 2008 Page 11 1
Distribution of Investments by Industry (cont)
Schroder Schroder Schroder ISF ISF ISF Schmder Schroder Schroder
Equity Property Smaller Global Greater Hong Kong Yield Securities Companies Technology China Equity
?,; Yo Yo "b
Global Global Global ISF ISF ISF
Bonds, Commercial Papers, Assets and Mortgage Backed Securities Money Markets Instruments -Assimilated to Cash
Other Securities Advertjsing Advertisirig Services Acrospace & Military rechnology Airport Scrviccs Agricultural Operations Appliances & Household Diirables Ap lication SoIiware Aufomobilcs Bankina
Chemicals Commercial Services Computer Software R Services Computer Stora e & Pcripherals Construction dousing Consumer Electronics Consiinier Finance Data Processing & Rcproduction Oepartmcnt Stores Diversified Metals & Mining Dru Retail ElecTrical & Elcctronics Electroriic Corriponents & Instruments Encrgy tqiiipnient R :;en,ices Encrgy Soiirces Financial Services Food & Household Products Food Retail Forest Products & Papcr Gold Mines Health & Personal Care Hcavy tlectrical Eauitmierit Hotels Industrial Components lrisurance lnternct Software & Services Investment Funds IT Consuking & Services Leisurc R Tourism Machiriery & En ineering Meat Poultry R fish Merchandisinc Metals - 3 e e t Misc. Materials & Commodities Motorc cle Manufacturers Multj - Lduatrv Multi - Utilities' Office :hip lies & Forms oil & Cas Erijlijg Oil & Gas Exploration & Production Packaging B Containers Pharmaceuticals Photo Equi mcnt & Supplies Publishin Printing Real Estaye Recreation Restaurants Retail Semiconductors
textile 8. Apparel lradirig Companies,& Distributors TransDortation - Airlines Transportation - I3ond 1, Rail Transportation Utilities - Elec+ri2?X'E
0.12 13.95
18.35 7.80 1 .YO 1.34
3.27
2.09
1.13 3.34
1 .PR 2.05
3.87
3.33
1.15
1.39
3.12 12.46
7.18
1.56 1.16 76.37
3.50
9.64
2.34
3.20
8.14
0.41 1.69 0.27 0.05 0.37 2.00 2.06 2.52 0.64 0.78 6.33
3.21 4.80 1.48 0.26
0.23 0 28
1 . B i 1.92 7.16 1.26 0.26 2.R0 1 .80 0.67
0.31 R.19 0.66 0.16
2.91 2.84 2.03 0.16 1 .R3 4.61
0.23 0.61 1.66
0.86 0.54 0.08 1.94 4.92 0.52 2.61 0.19 1.28 3.51 0.49 0.18 2.11 2.20
2.66 1.02 0.64 0.31 1 .oo 0.31 3.a7
1.68
15.27
1.84
4.87 .i.R6
8.85 1.05
3.79 6.54
3.20
1.69
17.95
5.10 13.87
0.48
1.03 7.71 0.43
5.47 0.34 0.84
8.12 1.26
7.60 9.3a 1.81 0.65 1.49 1.W
1.61
4.86
0.85
0.25 1 . I 4
1.32
5.43
0.63
6.88
0.57
7.95 2.19 0.29
1.93
1.85
1.11 9.86
1.88 1 .98
I
7.47
1.55 1.20
0.98 17.10 7.09
0.73 '
3.33
2.49 0.80 4.32
1.63
2.21 4.99
20.27
9.61
1.19
?.57
Investments portfolio as a percentage of Net Assets 96.38 103.02 95.95 91.56 99.44 97.22
Other Net Assets/(Liabilities)
Total Net Assets
3.62 (3.02) 4.05 8.44 0.58 2.78
100.00 100.00 100.00 100.00 100.00 100.00
The notes on pages : A to RP ' o r an inlcgral part of t t k x firiancial staterents

Page 11 2 Schruder Interinational Selectiuri Fund Semi-Annual Report June 2008
Distribution of Investments by Industry (cont)
Schroder Schroder Schroder ISF Schroder Schroder ISF Schroder
ISF Japanese ISF ISF ISF Swiss Indian Smaller Korean Latin Middle Equity Equity Companies Equity American East Opportunities
?i r; ?,2 0,; ?a
Bonds, Commercial Papers, Assets and Mortgage Backed Securities Money Markets Instruments -Assimilated to Gash
Other Securities Advertisiricj Advertising Services Aerospace & Military lechriology Airport Services Agricultural Operations Appliances K Household Durables Ap lication Software Aukmobiles
Other Securities Advertisiricj Advertising Services Aerospace & Military lechriology Airport Services Agricultural Operations Appliances K Household Durables Ap lication Software Aukmobiles Banking Beverages B Tobacco Broadcasting & Cable TV Buildinq Materials & Components Business & PuSlic :>f?rL,icf?s Cherriical:; (.hrrirriercial Scrviccs (hmputcr Software & Services Computer Stora e & Peripherals Coristruclio!> I( dousing Corisumer tlectronics Corisurner Financc Data Processiny 8 Reproduction Departriierit Stores Diversiiicd Metals 8 Minincj Dru l.letail tlec%cal B Elcctronics Electrorw Components &.Instruments rneryy Eqiiipniont B Services Crieryy Sources Financial Services Food & Household Prodiic;ts Food Retail Forest Products & Paper Gold Mirigs Henllh & l’crsonal Care Heavy Flectrical Eqiipment Hotels Industrial (;orripcjnsrnts Insurance internet Software & :.;ervic:e:; Investment Funds I1 Consulting & Services Leisure & Tourisrri Machinery & Eric irieering Meat Poultry & dsh Mert:haridisiri Metals - StceP Misc. Materials & Commodities Motorcycle Manufacturers Mulli Industry Muiti Utilities Uflice Supplies 8, Forms Oil & Gas Urilliny Oil &Gas Explxatiqri I I Production F’ackaying & Contairiers Pharmaceuticals Photn Equi ment & Suppl~es Publishin Priritiri(j Tieal Est& kcreation Hcstaurants Retail :;erriic:oncluctors
Trans&tation - Airlines lransportation - Road & Rail Iransportation - Shi inq lltilities - Elcctrical ?!%as
5.82 1.17 8.1 I 4.76 1.81 3.99
6.51 1.39 1.12
3.97
0.3 1 1.36 0 57
8.24 5.32
3.34
11.14 1.14 2.44
3.07
0.76
1 :I9 7.07 0.37
4.52 4.57 8.19
2.59
13.03 0.4 1
0.99 0.50
2 . w 1.13
0.88
1.47 1.28 7.43
0.73 1 .ii 1 .ti:
13.80
12.02 4.74
2.02 7.75
8.2ij 1 .0/
8.33 1.0‘1 5.68
2.14
0.97
6.01 6.63 3.91
4.98 7.82 4.60
1 Ai
10.Y8 12.12
5.36 3.03
2.48
7.61
1.14 7.69
i .31
2.76 1 .07 1.30
1.78
7.10 2.25 1.15 0.77
1,;; 1 .Y4
0.23
15.88 5.79 1.67 3.77 1.38 1 .80
5.32
1 1 5
1 .41 1.89 7.07 1 .Y6 0.01 1 .05
0.35
8.5’3
9.91
1 . io
7.7$
10.14
1 .ti3
5.27
1 .78 74.76
1 7 7
5.18
Y.20 2 66
12.51
0.83
10.34
1.39
1 .3 1
9.1 1
0.64 8.44
10.10
1 .OH
1.76
10.94
1 .u3 4.72 4.27
3.85
1 . i o
7.41 10.54
6.24
5.00
4.YY
13.29
1.87
8.60
2.03
6.00 0.50
1.01
2.96
Investments portfolio as a percentage of Net Assets 96.19 99.89 95.52 97.02 100.70 99.26
Other Net Assetsl(Liabi1ities)
Total Net Assets
3.81 0.1 I 4.48 2.98 (0.70) 0.74
loo.w 100.00 100.00 100.00 100.00 100.00

Schroder International Snlcctiori Furirl Serni-Annual Report June 2008 Page 113
Distribution of Investments by Industry (cont)
Schroder Schroder Schroder Schroder ISF Schroder ISF Schroder ISF ISF
Swiss Small & ISF USSmall& ISF EURO EURO Mid Cap Taiwanese Mid-Cap US Smaller Active Dynamic
Equity Equity(c) Equity Companies Value Growth Vo 96 Sb % 46
Bonds, Commercial Papers, Assets and Mortgage Backed Securities Money Markets Instruments -Assimilated to Cash
Other Securities Advertising Advertising Services Aerospace & Mililary let:tinology Airport Services Agricultural Operations Appliances & Household Durables Ap lication Software Aufomobilcs Rankina
Chenitcals Commercial Scrviccs Computer Software & Services Computer Stnra e & Peripherals Constnictiori 8 \Sousing Consumer Electronics Consumer Finance Data Processirig R Reproduction Departrrient Stores Diversified Metals R Mining Dru Rctail Elecyrical R Electronics Elcctrcnic Components X Instrurrierits Energy Eqiiipmenl B Sewices Energy Sources Financial Scrviccs Food & Houschold Products Food Retail Forest Products & Paper Gold Mines t 14 th R Personal Care Heaw Electrical ruuinrnerit Hotels lridustrial Components Insurance Internet Software B Services Investment Funds IT Consulting & Services I eisure B Tourism Machinery & En inccring Meat Poultry & ash Merchandtsina Metals Steer Misc. Materials B Commodilies Mntorc (’IP M d ~ ~ i f ~ ; t ~ r e r s Mulli kk& Multt - Utilitics’ Office Sup lie- & Forms 011 R Gas RrilliGg Oil R Gas Exploration & Production Packaging & Containcrs Pharmaceuticals Photo Equi ment & Supplics Publishincr Printina Real Estafe Recreation Rostaurants Retail Semiconductors Soft Drinks Svstems Software T&lecommunications Textile &Apparel Tradiriq Commnies & Distributors Transobrtation - Airlines Transportation - Road 8 I {ail Transportation - ;hi uri itics - E cctr cal Z E ‘
2.04
5.85
1.52 7.89
4.57 3.66
3.28
5.78 3.70
7.60 9.47 4.59
5.09
5.99
14.57
1.63
9.61
3.24
7.18
1.57
7.87
3.1 1
3.47
6.42
0.67 3.47
0.55
8.71 7.01
7.52 3.75
0.54
1 .84
1.3a
0.78
1.77
6.91
70.91
8.50 4.15
1.12 0.73
0.65
2.81
0.58 0.06 3.41 5.02 2.13
1.18
0.46
0.61 1.74 7.78
0.88 0.66 0.73
0.76 8.12
4.07 4.39 0.77
3.00 2.33
0.15 1.81
1.55
1.27 8.07 3.49 2.43
2.21 2.10
0.40 4.87
8.40 1.35
2.48
0.91
0.89
1.11
3.36
2.72 6.34 1.52
0.76 0.9f 1.75
1.02 2.81 0.84
1.16 2.14
0.77 9.41
0.53
3.80 5.10
0.w 3.27 1 . I4
0.83
0.82 1 . I O 0.40 0.90 8.94
2.08
0.12 3.31 0.65
0.23 4.42
4.15 1.14
0.18 0.51 1.23 2.40
1.04 0.87
5.32 16.08
1.46
3.33 1.04
6.84
2.79
1.89 1 .R7
1.07 1.06
3.22 6.88
1.99
6.67
0.99
14.42 1.11 1.93
4.18
0.51
4.37
1.48
1.14
12.39
2.60 5.55
10.73 0.30
1.40
2.41
3.21 2.39 3.21
0.74
9.34
1 .E3
0.59 1 .ti7
0.49
3.44 6.58
1.11
1.98
6.97 0.30
20.06
Investments porlfolio as a percentage of Net Assets 99.20 97.29 89.12 88.56 92.86 100.46
Other Net Assets/(Liabilities) 0.80 2.71 10.88 13.44 7.14 (0.46)
Total Net Assets 100.00 100.00 100.00 100.00 100.00 100.00
Scbroder IS1 lawanese t m t y was launched cr 1 e Januay 2008 The riotes uri pages 14 to 51) ‘arm an integral oart cf these tina-c,al sta!emen:s

Page 114 Schroder lnterriatiurial Selection Fund Serni-Aririual Report June 2008
Distribution of Investments by Industry (cont)
Schroder Schroder Schroder Schroder Schroder Schmder ISF ISF ISF ISF ISF ISF
European European Asian EURO European Global Active Dynamic Equity Equity Equity Equity Value Growth Alpha Alpha Alpha Alpha
-,u ?a q:, "0 0
Bonds, Commercial Papers, Assets and Mortgage Backed Securities Money Markets Instruments -Assimilated to Cash
Other Securities Advertisiriy Advertisiriy Services Aertispace B Military Tcchnoloyy Airport Serwe:; Ayric:ullural Opcrations Appliances & Household Durables Application Software Automobiles Hanking Reveraqes K loh.acco Rroadcastiriy i!i (:able I V Buildinq Materials X Components Ousiriei:; & Public Scrviccs Chemicals Commercial Service:; Computer Software & Se,lvices Computer Stora e & Peripherals (:oristriiction 8 dousin,
Dcuartment St6res Diiersified Metals & Miriiriy Drug Retail Electrical & rlectrtiriics Electronic Comuorierits & Irlstruments Encryy Equipment & Serxes Energy Sources ririaricial Seriwes Food K Household Products Food Retail Forest Products B Paper Gold Mines Health B Personal Care Heabv Electrical Fqiiipment Hotels Industrial Componerits 1nsi.iraric:e Iriternet Sottware & Services Invcstmcnt Funds IT Consulting & Sewices Leisure & Tourisrri Machiriery 8 tn inccriny Meat Poultri & pisti
Hotels Industrial Componerits 1nsi.iraric:e Iriternet Sottware & Services Invcstmcnt Funds IT Consulting & Sewices Leisure & Tourisrri Machiriery 8 tn inccriny Meat Poultri & pisti Mercharidish Metals - Steef Misc. Materials K (hnimoditics Motort: ( IP Mdriutacturcrs Multi . bikst,. Mi.ilti . lltililies Oilice Sup Aics & Forms Oil & Gas hrilli;icj Oil &Gas ExplGktiuri B Producticn Packaging 6 Containers Pharrriaceuttcals Photo Equi rnent 8 :hip[)Iie:; Publishin( Priritiriy Real Fstaje ReCrCdtiUr 1 Restaurants Retail Scmicqnductors Soft Dririks Svsterns Software i~1et:omrnunications Tcxtile &Apparel Tradina Cornparlies & Dislribulors Transportatiori - Airliries Transportatiori I b i d B Hail Transportatiori .- r > 11 ) m y Utilities - rle(;tri(;i:i [;;is
0 9? 0.79
2. i 3 13.56
1 . I 5 4.83
3.21
0.98
1 .on
5.83
2. (3
2.00 4 8 1
1 .Yd 7.06
7.09
4.46
11./3
4.51
4 01
0.8/
::H30
1 .00
1 3 0
0.35
8 29
0.52 7 2'3
H 31
1.03
1 .10
2 11
2.38 1.21 2.09
12.26 1 .01 1.08
0.14 2.00
0.8Y 1.53
1.35 10.39
3.85
2.UY
0.41
4.78
1 .E2 13.13
3.1 7 19.33
3.74
1.28
1.03
4.68
1.35 4.03
15.03
7.54
7.93
0.73
1.67
2.38 7.38
7 97
2.20 4.7%
9.37 1.1G
0.74
10.59
0.85 13.85 0.84
2.22
1.09
0.YB
5.74 2.05
4.53
6.43 0.08
1 .ut?
4.76
0.60 6.4i
1.40 0.04
10.22
0.16 0.85
11 93
0.53
0.97 12.92 0.76 1.80 2.56
5.30 3.20 7.94
2.39
0.30
8. 18
8.59
2.13
1.11 1 .7Y
1.16 11.87
10.71
0.78
9.1 I
7.80
1.94
0.01
3.02 3.50 5 . E
1.94 3.82
3.93
3.65
4.13
i.ii
2.R5 2.93 7.47
3.71
1.47
5.09 1.28
3.84
7.67
8.79 1.75 9.05
1.43
1.15 1 3 0
5.91 1.67 7.05
2.08
2.04
Investments portfolio as a percentage of Net Assets 92.53 94.69 I W.41 93.14 96.86 97.83
Other Net Assets/(Liabilities) 7.47 5.31 (0.41) 6.86 3.14 2.17
Total Net Assets 100.00 100.00 100.00 100.00 100.00 100.00

Schroder Iriterriatiorial Selection Furid Senii-Annual Report June 2008 Psgc 115
Di st r i but i o n of I nvest men ts by Industry (cont)
Schroder Schroder Schroder Schroder Schroder ISF Schroder ISF
ISF ISF ISF PEP ISF North Japanese us Global Qlobal QEP Arne r i c a n
Equity Large Cap Equity Active Global Equity Alpha Alpha Sigma Quality(f) Sigma
0.1, B Plh ?D
Bonds, Commercial Papers, Assets and Mortgage Backed Securities Money Markets Instruments -Assimilated to Cash
Other Securities Adwrtising Adwrlising Services Aerospace 6 Military lechnology Airoort Services Airicultural 0 erations Appliances & [ousehold Durahles Application Software Aidomohiles Barikinq Beverages 8 Tohacco Hroadcasting & Cable TV Building Matwials R Components Business & I’ublic Services Chemicals Comrrercial Services Computer Software R Sewices ComDuter Storaae B PeriDherals Construction R Housing Consumer Eleclronics Consumer I tnance Data Processing & Reproduction Departrnent Stores Diversified Metals & Mining Dru nmil Elcc%cal & tleclronics Electrcnic Comooncnts 8 Instruments rnergy Equipment & Senkes rnergy Sources Financial Services Food 8 I lousehold Products Food Retail Forest Products R Paper Gold hlines Health & Personal Care Heavy Electrical Equipment Hotels Industrial Comooncnts Insurance ’
Internet Software & Services Investment Funds IT Consulting B Services Leisurc R Tourism Mactiiriery B Frit ineering Meal Poiiltw R dsh Merchandish Metals - Steep Misc. Materials & Commodities Motorcvcle Manufacturers Multi - hdustry Mutt - IJtilities Office Sup lies & Forms oil & Gas &ling Oil & Gas Exploration & Production Packaging & Containers Pharmaceuticals Photo Eqtti ment &Supplies Puhlishin ! Printing Real Estayc Recreation Restaurants Retail Semiconductors Soft Drinks Systems Software Telecommunications Textile & Apparcl Tradino ComDanics & Distributors TransKortation - Airlines Transportation - Road & Rail Transportation ; ShpEn? Utilities - Electrical ad
7.03
9.48
1 .eo 11.25
7.12
10.60 n.no
4.22
7.85
3.13
3.63 3.62
3.0A
3.99 2.12
3.18 7.40 6.3?
3.77
2.67
2.39
3 27
6.76 1.39
2.10
1.11 3.1 1
1.91
3.28 2.21
15.i6
5.10
3.13
1.57
3.78
2.50 10.61
5.03
2.23 4.99
7.05
5.1 2
1 .s2
0.20 0.14 1.55
0.06 0.34 1 .09 2.59
10.10 3.60 0.89 1.41 0.79 2.1 1 0.44 1.28 1.03 0.56
0.05 1.73 0.05 3.05 0.22 0.83 1 .94 0.73 5.80 2.91 2.75 0.67 0.19 0.93 5.49
0.28 4.98 1.03 0.31 0.07 0.44 2.39
0.11 0.90 1.06 0.08 0.38 0.17 0.29 0.39 7.22
3.92 0.06 0.33 2.14 0.04 0.75 1.21 1.39 0.00 0.44 7.47 0.66 0.77 0.31 1.23 0.32 2.77
0.01
0.12 0.03 0.05 0.78 0.04 3.12 9.82 1.60 0.79 2.84 0.0? 3.33 0.24 0.70 0.51 0.04 0.07
0.82 0.21 1.88 0.05 ?.04 1.30 0.59 0.23 3.00 0.83 0.62 1.11 0.03 0.33
9.43 0.20 0.09
0.54 0.96
0.81 0.17
0.11 0.22 0.77 0.48 8.88 0.12 3.00 0.09 0.77 5.24 0.15 0.03 1.73 0.13 0.19
13.27 0.52 0.81 1.74 0.45 1.70 7.32
0.17
2.09 0.05 0.1 6 0.1 7 1.04 2.1 1 8.07 3.1 1 2.58 1.67 I.?? 4.25 1.18 0.49 0.43 0.09 0.02
1.27 0.34 1.88 0.81 1.93 2.3R 0.61 4.25 3.17 4.81 0.89 0.1 8
8.62
0.27
4.84 0.20
0.39 4.52
0.98 0.38 0.20 0.19 0.24 0.72 0.31 4.96 0.13 2.95 0.07 0.76
0.17 0.64 1.73 1.17 0.19 0.39 4.43 2.29 1.15 0.39 2.44
4.19
0.29
2.50
0.69 0.14 2.13 0.56 6.63 3.81 1.88 0.96 0.03 1.59 0.68 1.45 1.40 0.1 1
0.04 3.01
0.55 0.17 0.52 1.48 0.82
10.13 3.08 2.09
0.13 0.29 9.15
3.95 1.58
0.05 0.12 2.63
0.24 0.69 2.34 0.16 0.32 0.1 7
0.66 4.40
3.50
0.22 0.90 0.16 0.33 7.74 2.58 0.15 0.82 5.98 0.87 0.51 0.09 2.03
2.28
Investments portfolio as a percentage of Net Assets 96.97 97.60 08.72 96.11 09.12 96.24
Other Net Assetd(Liabi1ities)
Total Net Assets
3.03 2.40 1.28 3.89 0.88 3.76
100.00 100.00 100.00 100.00 100.00 100.00
Id) SchrndPr ISF OED Glnhnl Acti,;e V:iIut! wos forrrlcrly know1 iis Sctlruder ISF Glohal Quantitative Active Valuo urit I 1 Jurc 2008 Ir) Schrcdw ISI: C?Es Global Llaal#ty ‘$,as fcrrmerly knocn as ScVoder iSF Olobal @ual#ly 3 o f m EUU ty untll I June 20C6 The notes on paqEs 3 to BC fer- an integral part cf these financ al statements.
I
I I
I
I I
I
I I I
I !
I
~
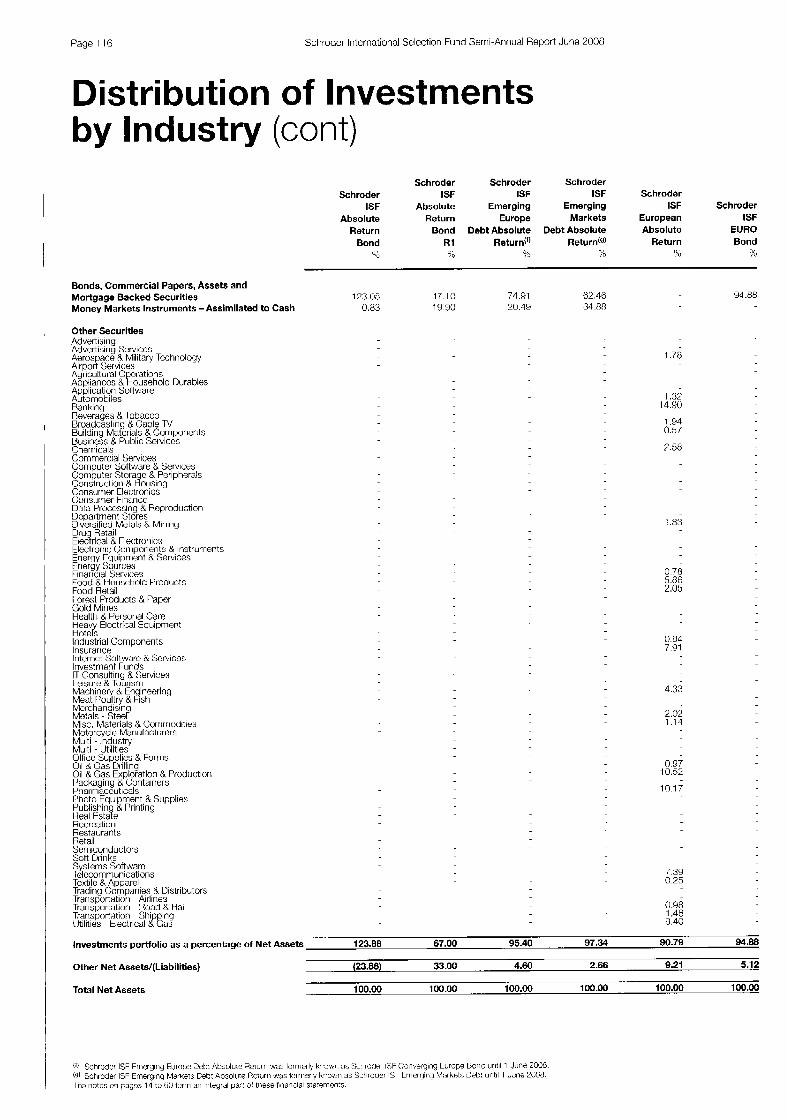
Page 116 Schroder Irilernational Selection Fund Serrii-Aririual Report June 2008
Distribution of Investments by Industry (cont)
Bonds, Commercial Papers, Assets and Mortgage Backed Securities Money Markets Instruments -Assimilated to Cash
Other Securities
Automobiles
Cherriicals
Schroder Schroder Schroder Schroder ISF ISF ISF Schroder
ISF Absolute Emerging Emerging ISF Schroder Absolute Return Europe Markets European ISF
Return Bond Debt Absolute Debt Absolute Absolute EURO R1 Return('' Return(Y) Return Bond
?I> 96 B Y O
Bond ";
173.115 47.10 74.91 0.83 19 !30 20.4Y
62.16: 34.88
1.78
1 x2 14.90
1.94 0.3/
?.58
Corlstrucll(Jrl & Housing Corisurrier Clectrtir iics I:r>r~ul ~ r n u r t l nnnnr
1.83
ConimerL,i+ Serb (:ts C'aii-lpLtri @ 1 ~ 3 r t 9 Sen (:ts C ( ~ i i ~ ~ i . t ~ .&ita c 8 Pcrpnerds
Corisurrier Clectrtir iics Corisurner Finance Data Processing & Reproduction Ucpartnient Stores Diversified Metals & Miriirig Dru Retail Elecgrical 8 rle(:trorii(::; Electroriic (;oniponent:; &.Instruments Energy rquiprrient K Services Frierqy :;otirt:es Firiarkial Services Food R tioii:;etiuld Products Food Retail kore:;l Products & Paper tiold Mines Health & Persurial Care Heavy Electrical Equipment Hotels Industrial Comuonents
Corlstrucll(Jrl & t%1sirng
lnsurarice ' lriterriet :;oltwarc & Scn.iccs lrivestriieiit Funds IT Consiiltirici 8 Services
Mcrchandisin Metals - %tee$ . . . .. . . . . . Misc. Materials 8 (hrrirriodities Motorcycle Mariulat:lurer:; Multi - lndustrv Multi - Utilities' Office Sup lies & Forms oil & Cas &illins 011 &Cas Exploration R Produc;tiori Packaging & Coritairiers Ptwinaccuticals Photo Eauiument & Suuulies Publistiin & Printing
Recreatior I Restaurants Ret@ Serriicqriductors Sott Drinks Swdeins Softmrc
Heal Fsta?e
hhcommunications Textile &Apparel Tradiriq (.:orn[xme:; K Uislributors TrarisF)Ortati(lli Airlines Tr;lrisr)orlatiori I ~JNI X Hail
0.78 5.8R 2.06
0.34 7.91
4.33
2.02 1.14
0.97 10.52
10.17
7.39 0.25
0.98 1.46 9.40
94.88
Investments portfolio as a percentage of Net Assets 123.88 67.00 95.40 97.54 90.79 94.88
Other Net Assets/(Liabilities) (23.88) 33.00 4.60 2.66 9.21 5.12
Total Net Assets 100.00 100.00 100.00 100.00 100.00 100.00
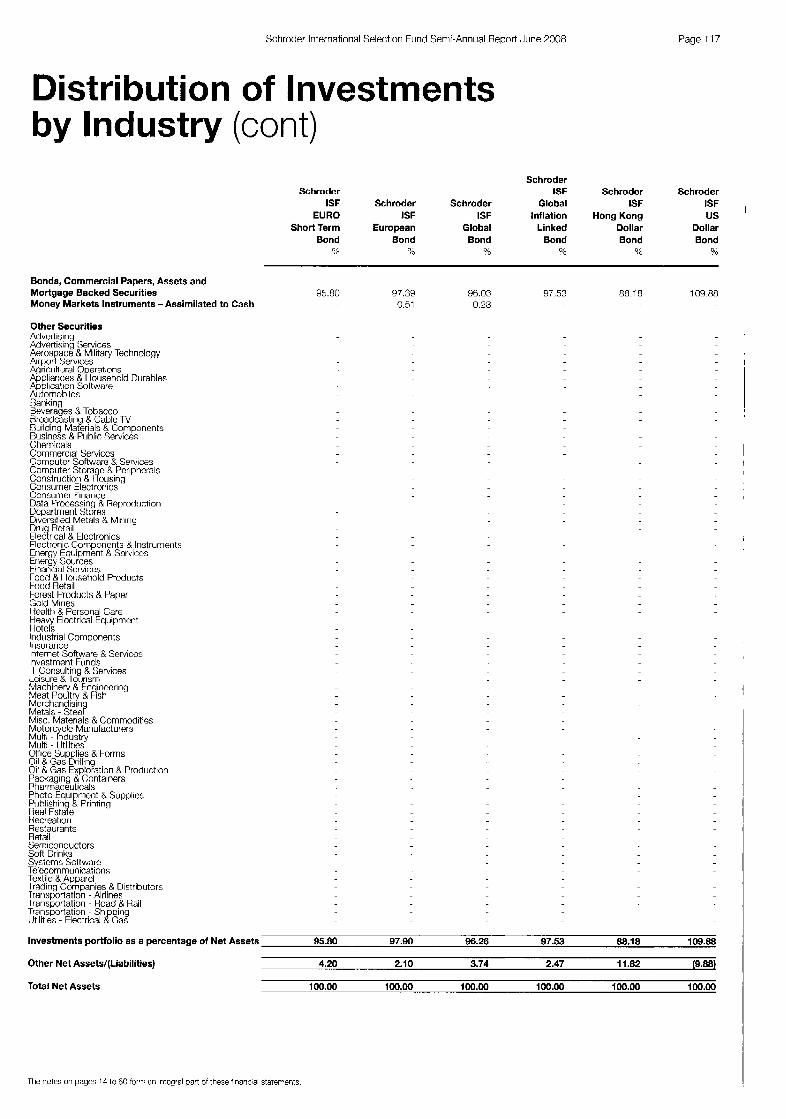
Schroder Iriterrliitiorial Selectiori Furid Serrii-Annual Report June 2008 Page 11 7
Distribution of Investments by Industry (cont)
Schroder Schroder ISF Schroder Schroder
ISF Schroder Schroder Global ISF ISF
Short Term European Global Linked Dollar Dollar Bond Bond Bond Bond Bond Bond
?'O ?h YO QO
EURO ISF ISF Inflation Hong Kong us
0'
Bonds, Commercial Papers, Assets and Mortgage Backed Securities Money Markets Instruments -Assimilated to Cash
Other Securities ArivPrticinn ........... Advertisirii Services Aerospace & Military Techriologv Airr)ort Services
Autornohilm
Cornrnerc ai Smiccs Computer Sofrv.aro CC Sen c w CornDutet Sioraoe X r l m m r a :: Constructiori 8 t'k)iisinti '
Consumer E@ctr&iks .' Consiimer Firiance Data Frocessinu & Rer)rochc:ticiri Dcpartment Stoics '
Diversified Metals 8 Miriirig Dru Hctail Elechal & Electronics Flectrcnic CornDoncnts & lnstrumerits
Food Retail Forest Products & Paper Gold Mtries Health & Personal Care Heavy Elcctrical Equipment Hotcls lr idi istrial Components lrisurance Internet Software & Serviccs lnvostment Funds IT Cnmi ilhng R Services - ......... Lcisure & Tourism Machinety & En incering Meat Poultry & &h Merchandisin Metals - StecP Misc. Materials & Commodities Motorcvcle Manufacturers Multi - hdustry Multi - Utilitics Oftice Sup lies & Forms Oil & Gas hl l ing 011 8 Gas Exploration & Production Packaging 5 Containers Pharmaceuticals Photo Equ ment & Supplies Puhlishiric Printing I k a l FstaL t Wreatiori Restaurants Retail Semiconductors Soft Drinks Systems Sollw~re Tebconiiiiunicst.[ )I IS Teni e d Apparc'i Iradiriq Companies,& Distributors 1rafisC)orIat on - Arltnes Trarisportal on - Road & RJi TransDortal on ,- Sn ~ t I I FS - Eircrrica. 8%
Iradirici CcimDanies & Distributors 1rafisC)i)rIat 6n - Arlines Trarisportal on - Road & RJi TransDortal on ,- Sn ~ t I I FS - Eircrrica. 8%
95.80 t17.39 96.03 97.53 0.51 0.23
88.18 109.88
Investments portfolio as a percentage of Net Assets 95.80 97.90 96.26 97.53 88.18 109.88
Other Net Assetsl(Liabi1ities) 4.20 2.10 3.74 2.47 11 .E2 (9.88)
Total Net Assets 100.00 100.00 100.00 100.00 100.00 100.00
The nc tw on pnyf!: 14 to GC for..; ail irituyal part of these tinancsal stater-ems.

Page 118 Schroder Intcrnational Selectiori Fund Seini-Annual Report Jurie 2008
Distribution of Investments by Industry (cont)
Bonds, Commercial Papers, Assets and Mortgage Backed Securities Money Markets Instruments -Assimilated to Cash
Other Securities Adbertisiiig Advertising Services Aerospace & Mlitary Techrioloqy Airport Szrviccs Agricultural Operations Appliances & Housetiold Diiratile:; Ap lication Softflare Aiikrnntiiles
Corrirriercial Services Computer Software & Services Computer Stora e & Periuherals Coristruclion B #ousina
[)epartmerit St&s '
Diversified Metal:; K Mininy Druq Retail rledtric:al 8, tlectronics r1et:troriic: Coinuoiiciits & Instruments Friryy tquipmbnt & Services t-rieryy Sources ririaricial Services Food & Hoiisehold F'roducts rood R~KIII rarest Products B I'apcr Gold Mines I ieallti 8 F'ersonnl Cnrc Heavy Clec:tric:al Equipment I lotels lridustrial Components Insurance Intcrnct Software & Serices Investment Funds IT Corisulling 8 Scrbiccs LelSlJfe B Tourism Machinety & En irieeririg Meat Poultry & asti Merchandisiric Metals - :;tee? Misc. Materials & (hriniodities Motorcycle Manufacturers Multi - Industry MI ilti - I Itilltiw Office $;iipgie.s B Forms Oil R (;as rilliriy Oil 8, Gas Exuloration & Production I 'ackaging &' Containers Pharmaceuticals Photo rqui )rriPrit & :;lipplies Publishiri h Phlinp Hcal Es& Recreation 1-jestaiiraiits Retail Semicoriductor:; Soft Drinks Svstenis Software T&lecommunications Textile &Apparel Tradino Cornaariies R Distritiiilors: Trarisrhatit<ri Airlirics Iramportation - Road & Rail Transportation - 1> 11 m g Utilities - ~ I e ( : t r i ( : ~ ~ i L i s
Schroder Schroder ISF Schroder Schroder
Schroder Asian ISF ISF ISF Schroder ISF Local EURO Global Global ISF
Asian Currency Corporate Corporate High Strategic Bond Bond(h) Bond Bond Yield Bond
% ?a YO ?>
54.07 ii.?) 32.94 15.15
96.38 93.3n 95.14 6?.l? 13.73
Investments portfolio as a percentage of Net Assets 87.01 92.42 96.36 93.38 95.14 80.85
Other Net Assets/(Liabilities) 12.99 7.58 3.64 6.62 4.86 19.15
Total Net Assets 100.00 100.00 100.00 100.00 100.00 100.00
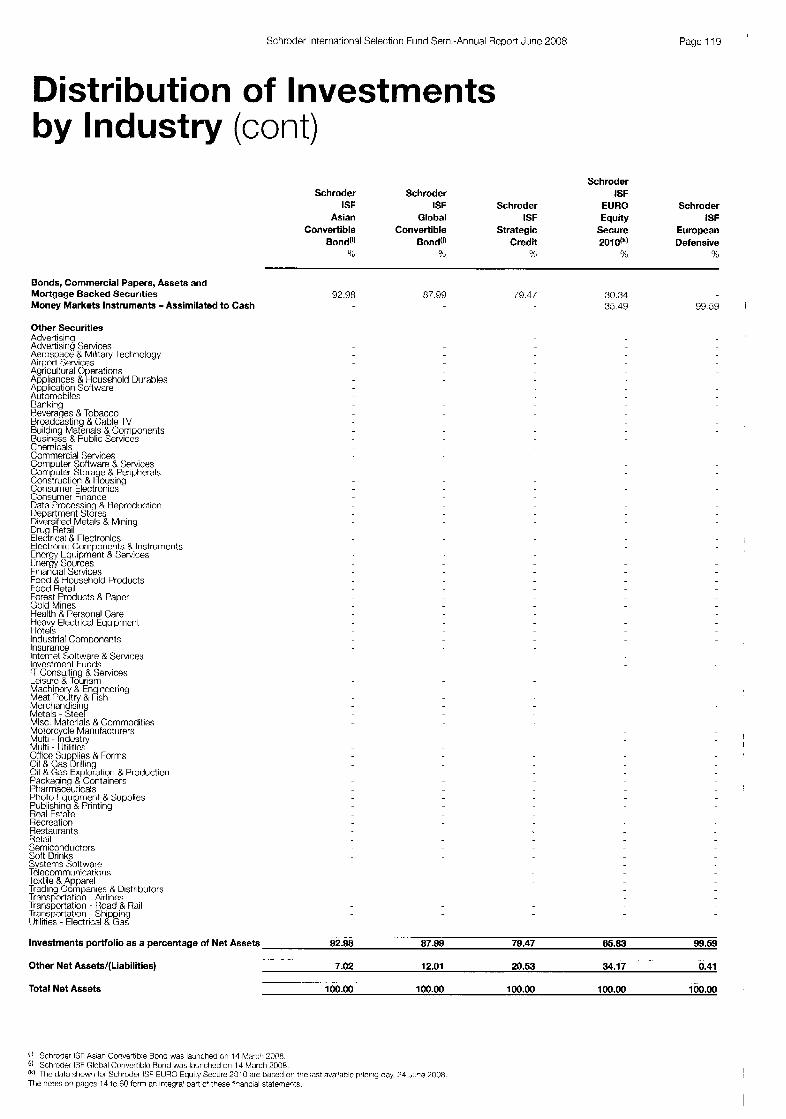
Schroder lnlerriatiorial Selection Fund Serni-Annual Report June 2008
Distribution of Investments by Industry (cont)
Bonds, Commercial Papers, Assets and Mortgage Backed Securities Money Markets Instruments -Assimilated to Cash
Other Securities Advertising Advertisirig Servjces Aerospace & Military Technology Airport :.;enices Agricullural Operatioris Appliances & Household Durahles Application Software Automobilcs Bankiriu
Commercial Services
Consumer Electronics - :onsumer Finance lata Proccssing 8, Heproduction kpartment Stores hersified Metals & Mining ?rug Retail :let:tric:al & Flectronics :lectroriic: (hiriporients 8lnstri.iments :ncrgy tqiiipnient 8 .T;en,ices :nergy Sources 'inanctal Services 'ood & tiousehold Products -clod Retail 'orest Products & Papcr ;old Mines iealth R Personal Care ieavy Electrical Equipment i0teIs ndustrial Components
Insurance lntcrnel Soltware & Servic:es lnvcstmenl hinds IT Consulting 8, Services Leisurc & Tourism Machincry & En inwring Meat Poultry & t s h ' Merchandtsin Metals - Stee? Misc. Materials & Commodities Motorc rlp Manulachirers Multi - &bustry Multi - Utilittcs Office Sup lies & Forms (lit R, (.;as Kriiing Oil & Gas Exploratiori & Production Packaging 8 Containers Ptharrriaceuticals Photo rqu rnent 8 Supplies Publishin Printing Real Estaye Recreation Restaurants Hetail Semiconductors Solt Drinks Svstems Soltware
Page 119
Schroder Schroder Schroder ISF
ISF ISF Schroder EURO Schmder Asian Global ISF Equity ISF
Convertible Convertible Strategic Secure European Bond(') Bondu) Credit 2010(k) Defensive
4; ?, ?A ?& Sb
92.08 n7.90 m 4 / 30.34 35.49 99.59
I
Investments portfolio as a percentage of Net Assets 92.98 87.89 79.47 65.83 99.59
Other Net Assets/(Liabilities) 7.02 12.01 20.53 34.17 0.41
Total Net Assets 100.00 100.00 100.00 100.00 100.00

Page 120 Schrndcr Iriterriatiorial Selection Fund Scmi-Aririual Repurl June 2008
Distribution of Investments by Industry (cont)
Schroder Schroder Schroder Schroder ISF ISF ISF Schmder ISF
European European World ISF us Defensive Defensive Defensive EURO Dollar
Monthly 6 Monthly 3 Monthly Liquidity Liquidity ulu ?> 0% Yo 96
Bonds, Commercial Papers, Assets and Mortgage Backed Securities Money Markets Instruments -Assimilated to Cash
Other Securities Advertising Advertisiriy Servic:es Aerospace & Military lechnology Airport Senices Aqricultural (Ipeiati(-)in:; Abpliances B I Ioi~seliold Uurablcs Applicatiori :.;oftware Automobiles
84.73 27.84 77.16 49.88 71 87 84.05 23.25 40.56
Chemicals Cornrnert:ial Sewices Corriputer Soll.>//are B Scrvices Computer Stora e & Peripherals Coristructioi! K A w i n g Consurrier Elec:trcJnics Consumer Firiarice Data Processing & Reproductiori Department Stores Diversified Metals & Minina Druq Retail Eleitrical R Clet:lronics Electroriic Corrir)onenls B Instruments
Food Ijctail forest Products & Paper Gold Mines Health & Persorial Care Hcavy Electrical Fquiprrierit Hotels Indiistrial Components lrisiirariw Iriterriel Software X Services Investment rurids IT Consulting & Sen,ices L.eisiire B TourJsm Machiriery 8. tiigineering Meat Poult9 & fish Merchandisina
Packaoina & Contairiers
Recreatiuri Restaurants Retnll Semiconrluctors Soft Drinks Systcnis Software relecommunications Iextile B Apparcl liading Companies & Distributors Trarisrjortatiori Airlines Transportatiori - H w d 3 Rail Transportatiori Stypr ig UtiliLie> - tlcctrical Ias
Investments portfolio as a percentage of Net Assets 84.73 49.71 64.05 100.41 90.43
Other Net Assets/(Liabilities) 15.27 50.29 35.95 (0.41) 9.57
Total Net Assets 100.00 100.00 1w.00 100.00 100.00

Schroder International Selection Fund Serni-Annual Reuort June 2008 Page 121
Portfolio of Investments as at 30 June 2008 Schroder ISF EURO Equity
Number of shares Transferahle Securities and Market *'3
or Prircipal Money Market IIistrurrierits Admitted Valuc Nct Amount to an Official Exchange Listirig EUR Assets
Austria 645.256 EVN 785,188 RI I I
Belgium 3.485 Fluxys
148.042 Groupe Bruxelles 105.81 1 Croupe Bruxelles
WPR 256.333 InBev 447.380 Umicore
Finland 750,635 Elisa
2.305.588 Nokia
France 168,l 16 AIstorr 540 26? DNF Farihas
ambert arnhert Strip
353,853 Compagnie Generale de GQophysiqiie-Veritas
1 297.488 France Telecom 582.689 Groupe Danonc 295,101 Lafargc 694,521 Sanofi-Aventis 11 6.1 20 Societe Fonciere FinanciQrr! et de
Participations 229,H16 SociBtA Gknerale
1.311.286 Suez 1.147.91 9 Total 1 ,675,777 Vivendi
Germany 429.072 Allianz 141.548 Axel Springer 398,458 BASL 263,334 Continental 255.977 Dairriler 246.136 Dcutsche Bank 475.554 E.ON 430.639 LINDC 200.157 Merck K G M 342,5 /3 Rheinrnetall 163,124 RWE 464,578 SAP 466.252 Siemens
1.208,BI 8 Syiririse 231,007 Wincor Nixdori
Greece 1.058. /29 National Bank of Greece 4,301,336 Technical Olympic
Ireland 2.080.495 Anglo Irish Rank 5,730,846 (;lanhia
Italy 1,186.233 ACEA 1,505,495 EN1
12,755,825 Gcmina 5.840.606 lntesa Sanpaolo
473.983 ltalrnobiliare 'RNC' 8,404,120 Telecom llalia ' H N C 6.754.023 IJniCretiit
37,865,317 13.995.602 23,889,715
44,685,244 8,381,880
11,119,434
1,058 11.232.51 2 13.940.360
45,388,359 10.020.977 35.367382
357,237.487 24.457.5 16 30.975.922
10,558.I174 21,356,449 25.888.877 78.308278 29,329,677
6.851.080 12.690.440 56,317,155 67,254,347 10,238,832
336,638,894 4 / ,687.062 3,979,134
11,460,430 16,919.210 10,02f).179 13.553.980 60,599.846 38.447.450 17.006.1 16 15,679,566 12,9G6,089 15,521 5 5 1 32.642.303 16,1)1f),030 10,177,948
33,180,419 30.639.617 2.520.802
39,587,373 12,732,629 26.854.744
130,966,949 14.317.832 35.650.1 22 9,879,232
21,069,986 lL5.390.228 8,589,020 26,070529
2.74 1.01 1.73
3.23 0.61 0 no
0.00 0.81 1.01
3.28 0.72 2.56
25.83 1.77 2.21
0.76 1.76 1.87 2 05 7 17
0 50 0.92 4 07 4.56 2.91
24.34 3.15 0 72 1.26 1.22 0.73 0.98 1.38 2.78 1.30 1.13 0.94 1.12 2.36 1.23 0./4
2.40 2.22 0.18
2.86 0.92 1.94
9.47 1.04 2.58 0.Il 1.52 1.11 0.62 1.89
Nrimbcr of shares Transferahle Securities and Market 95 or Principal Money Market Instrimerits Admitted Value Net
FUR Assets Amount to an Official Exchange Listing
Luxembourg 1.092.176 ArcelorMittal
Netherlands 355.465 AkLo Nobel
2.063 888 IN(; GroeIi 2.832315 Royal KPN 1,701,228 Unilever
Spain 3,504.1 RR Banco Mhao Vixaya Argentaria 2543,317 Banco Santander 3,039.3Z Telefonica
Total Transferable Securities and Money Market Instruments Admitted to an Official Exchange Listing
Numbcr of sharcs or Priricipal Other Trarisferatile Seciirities
68,651,102 4.96 8R.ti51.19? 4.96
116,356,902 8.57 15.452.064 1.13 41.360.316 2.99 30,987,714 2.24 30.55R.ROR 7.71
123,949,300 8.97 43,101,488 3.13 79.756.809 7.15 51,091,003 3.69
1,336,487,436 96.65
Market % Vahe Net ElJH Assets Amount not dealt on anothEr Reoulated Market
Italy 7,571,884 Parmalat cinanztaria
Total Other Transferable Securities not dealt on another Regulated Market
Total Investments
Other Net Assets
Net Asset Value
75,719 0.01 75,719 0.01
75,719 0.01
1,336,563,155 96.66
46,254,181 3.34
1,382,817,336 100.00 I

Page 122 Schrndcr lnterriatiurial Selection Fund Semi-Annual Report Julie 2008
Portfolio of Investments as at 30 June 2008 (cont) Schroder ISF European Equity
Nunlher ot sharcs Transferable Securities arid Market 7:; Number of shares Trarisferatlle Securitics and Market B Value Net or Principal Money Market Irislrumcnts Admitted Value Net or Principal Money Market Instruments Admitted EUR Assets Amount tu ari Ollicial Exchange Listing EUH Assets Aniourit to an Official Exctiarige I istiriy
Belgium 701 Groupe Bruxslles 1Larrit)ert Strip
WPR 5.405 InBev 3.1 13 KBC Crocp 7.3i8 Umicore
Cyprus 2 1 .708 ProSafe
Denmark 11,269 Uanskc Hank
France 2.737 Air Liquide
7,178 Carrcrc /.I96 lpsen 3,360 LLafarge 4.2W Sanofi-Aventis 2.950 Sctirieider tlectric 8.570 Societe GAnBrale
15,100 Suez 11,100 Suez Strip WPR 20.071 Total 18.254 Vivendi
25.215 AXA
Germany 2,031 Alliariz
10.408 Rayer 12.520 Oeutsche Post 40.872 Ucutschc Tclckoni
7.712 t.C)N 5,381 RheinrrieVall 3.834 SAP t3J332 :;ierrieris 7.204 Symrise
Ireland 2 1.41 8 Anglo Irish Dank Pij.738 Bank of Ireland
Italy 7,239S hat
340.535 Marlagernen! & Capitali 89.149 UriiCrcdit
Luxembourg 9.448 ArcclorMittal
Netherlands 8.266 Akzo Nobel
32.240 ING Gruel) 14.396 Koninklijke Philips Electronics 21,451 k e d Elscvict 28.113 Royal Dutch Shell 15,251 IN1 27,969 Unilcvcr
Norway 7.077 Aker Solutions
Spain 13.748 Eanco Hilbao Vizcaya Aryerilaria 20,l 28 Banco Santander
7.831 Enagas 3.920 Reti Electrica dc tspana
11 .~55 R ~ ~ S O I wr 12.595 Telefhnica
686,166
7 236.8.17 21 9.41 4 229,898
135,142 133.1 47
207,757 207.757
4,177,204 w 7 . w r) 413,994
0 232,935 3:'l ..m 181.251 202,209 363,237 u4/.035
141 l,Ot30,042
438.4fl1
2,793,822 309,080 551,7923 203.954 127.1 12 345.590 246.m3 129.782 478,308 101,000
276,830 1 3 1 .o ;)I 14a./52
666,081 82.229
239.737 344.1 15
593,429 593:12t)
3,108,920 359.323 640,250 3 10.3i8 226.737 125,379 335.369 501 :l84
105,843 105.843
1,280,215 189.100 305.671 140.615 161 .987 2Y1 ,010 21 1.739
3.30
0.00 1.13 1 .0G 1.11
0.65 0.65
1 .oo 1 .00
20.10 1.10 2.29 0.00 1.17 1.55
0.87 0.91 1 .?5 3.1 1 0.00 3.LA 2.1 1
13.44 1.18 2.G5 0.99 2.06 1 .uti 1.19 0.02 2.30 0.49
1.33 0 . Z 0.70
3.21 0.10 1.15 1 .ti8
2.86 2.88
14.96 1.74 3.1 1 1.48 1 .0Y 3.51 1 .61 2.41
0.51 0.51
6.16 0.81 1 .17 0.88 0 78 1.40 1 .02
- , ,
Sweden 15,299 Swnska Handelsbanken 27,909 TeliaSoriera
Switzerland 13,3 18 Credit Suisse Registered 24.81 0 Neslli. Ijegistercd 17,132 Novartis Registered 6,284 Hochc
United Kingdom 29.387 Bart:lays 35/61 OG 86.1 1 1 Centrica 2531 1 GlaxoSmithKline
252.006 Legal & General 48.350 Marks & Spcncer 17.827 National Grid
144,552 Old Mutila1 30,091 Pearson 30.081 Pruderitial 64.1 87 Hexar~l
11 7.724 I i o y A Bank of Scotland 144.990 :Sports Direct
799,573 Vodatonc 75.480 Tesco
Total Transferable Securities and Money Market Instruments Admitted to an Official Exchange Listing
N,imt)er ot sharcs or Principal Amount Derivalive:;
United Kingdom 0.797 Barclays Rights 17:07/2000
Total Derivatives
Total Investments
Other Net Liabilities
Net Asset Value
358,073 1.72 228.328 1.10 128.745 0.62
2,420,530 11.65 385.784 1.80 713.424 3.43 613.890 2.95 707,632 3.41
4,315,658 20.77 108,053 0.51 581.238 2.80 334.051 1.61 367.3Y3 1.77 318.551 1.63 192.733 0.93 106.107 0.51 168.210 081 232,141 1.12 707.607 0.97 313.180 1.51 318,048 1.52 161,344 0.81 348.779 1.68 558.523 Y.69
21,125,670 101.66
Market "Ib VAiie Nct t l l l l Asscts
693 0.00 693 0.00
693 0.00
21,126,363 101.66
(344,810) (1.66)
20,781,553 100.00
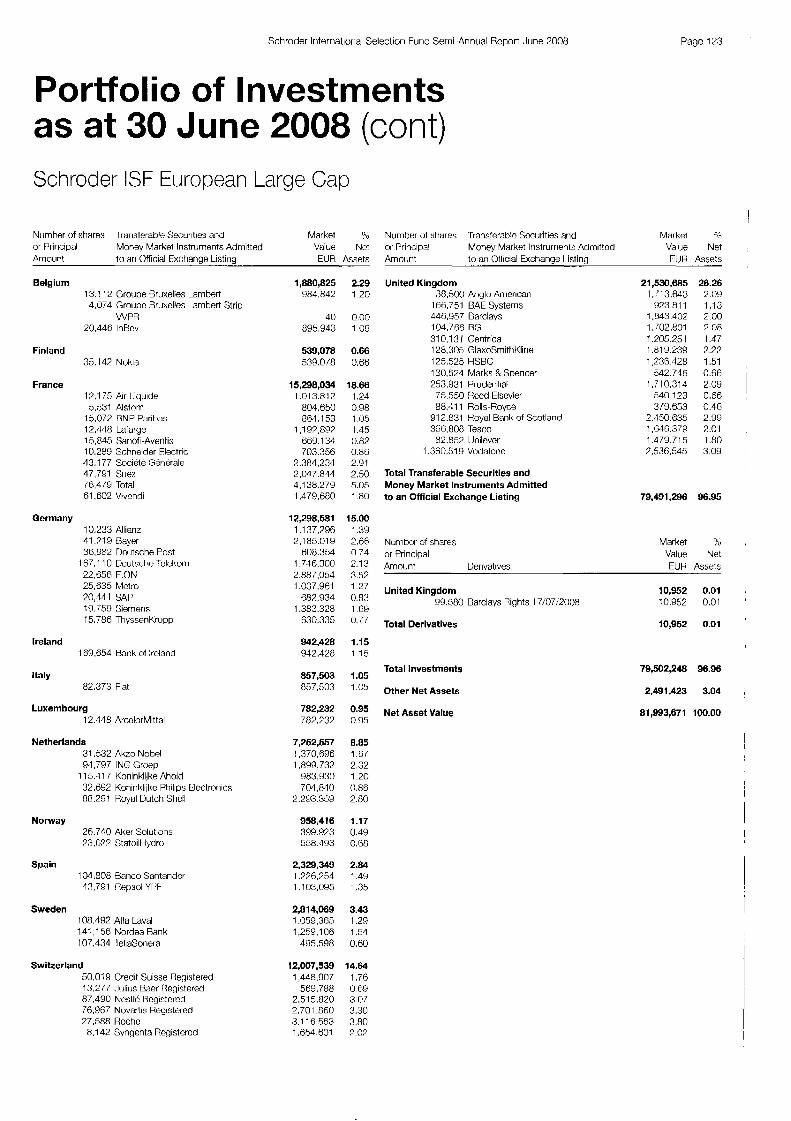
Schroder lriterriatiorial Seleclion Fund Semi-Annual Report June 2008
Portfolio of Investments as at 30 June 2008 (cont) Schroder ISF European Large Cap
Page 123 '
Nirrriher of shares Trarisferahle Securities and Market *.6 or Principal Mopey Market Instruments Admitted Value Nct Arnount to ari Official Fxchanue Listina EUR Assets
Number of shares .Transferable Securities and Market 96 or Principal Money Market Iristruments Admittod Value Net Arnount to an Official Exchanae Listina TLJR Assets
Belgium 13.1 12 Groupe Rruxelles Lambert 4,074 Groupc Bruxcllcs Lambert Strip
WPR 20,446 InBev
Finland 36.147 Nokia
France 17.1 75 Air Liqiiide 5.531 Alstom
15.077 RNP Pxit)as 12,118 Lafarge 15.845 :;driofi-Averlti:; 10.289 Schneider Electric 13.1 77 Societe Generale 47.791 Siiez 76.4/9 Total 61.602 Vivendi
Germany 10.233 Allianz 41 7 1 9 naver 36,982 Dcutsche Post
22.656 E.ON 25,635 Metro 20,111 SAP 19.769 Sierwris 15,786 ThyssenKrtrpp
167.1 10 Deutsche Telekoni
Ireland 1 B9,854 Bank of Ireland
Italy 82.373 Fiat
Luxembourg 12.118 ArcclorMittal
Netherlands 31.532 Akzo Nobel 94,797 ING Groep
115.41 7 Koninkliike Ahold 32.682 Koniriklijke Ptiilips Electroriics 88.291 Royal Dutch Shell
Norway 26.740 Aker Solutions 73,677 Statoill l ych
Spain 1 M.808 Banco Santandcr 43,791 Rep:;ol YPk
Sweden 108,192 Alfa Lava1 141 , I 56 Nordea Rank 107,434 leliaSonera
Swiizerland 50,019 Credit Suisse Regstered 13.277 .Iiiliiis Baer Ijegistered 87,490 Nestle Hegistercd 76.967 Novartis Reytstered 27,588 Roche 8.1 42 Syngcnta Registcrcd
1,880,825 "84,842
40 885,943
539,078 539.0/8
15,298,034 1.01 3.8 12
804.650 861.153
1 ,I 97,897 669.1 31 703.358
7..7n4,234 2.04 7.844 4,138.279 1,479,680
12,298,581 1 ,I 37,796 2.185.01tl
608.354 1.746.300 2,887,054 1,037,961
687,934 1.383.328
630,335
942,428 842.428
857,503 n57,503
782,232 787.737
7,252,557 1,370,596 1.899.732
983,930 704,840
2.293.35G
958,416 399.Y23 558.493
2,329,349 1.226754 1.103.095
2,814,069 1,059,365 1,25G.106
495,598
12,007,539 1,448,907
569,788 2.515.820 2,701.860 3,116,553 1.654.601
2.29 1.20
0.00 1.09
0.66 0.66
18.66 1.24 0.98 1.05 1.45 0.82 0.86 2.91 2.50 5.05 1 .80
15.00 1.39 2.86 0.74 2.13 3.52 1.27 0.83 1.69 0.77
1.15 115
1.05 1.05
0.95 0.95
8.85 1.67 2.32 1.20 0.86 2.80
1.17 0.49 0.68
2.84 1.49 1.35
3.43 1.29 1.51 0.60
14.64 1.76 0.69 3.07 3.30 3.80 7.07
United Kingdom 38,500 Ariglo American
1 66,751 BAE Systems 446.957 Barclays 104,766 n(.; 310,131 Centrica 128.305 GlaxoSmithKlirie 125,525 HSRC 130,521 Marks & Spencer 253,931 Prtideritial
75.550 Hccd Elsevier 88.11 1 Rolls-Royce
G I 2.831 Hoyal Bank of Scotland 355,808 Tesco 52.852 Unilever
1 .:3B0.519 Vodafone
Total Transferable Securities and Money Market Instruments Admitted to an Official Exchange Listing
21,530,685 1, I 1 3.643
923.81 1 1 1,702.801 .E43 402
1.205.251 1,819,239 1236128
542 71 ti 1.710.314
540 123 319.653
2 450 635 1.646.379 1 479.715 7,536,545
26.26 2.09 1.13 2.00 7.08 1.47 2.22 1.51 0.66 2.09 0.66 0.46 2.99 7.01 1.80 3.09
79,491,296 96.95
Numbcr of shares Market :h or Principal Value Net Amount Derivatives EUR Assets
United Kingdom 10,952 0.01 99.580 Barclays Rights 17/07/7008 10.952 0.01
Total Derivatives 10,952 0.01
Total Investments 79,502,248 06.06
Other Net Assets 2,491,423 3.04
Net Asset Value 81,993,671 100.00
I
I
i 1
I
~
I
i
I
I
I
1 I
i I I

Paye 124 Sctirotler Iriterrratiorial Seleclion Fund Semi-Annual Report Junr: 2008
Portfolio of Investments as at 30 June 2008 (cont) Schroder ISF Global Equity
Nurriber of shares 1rarisferat)le Securities and Market $5 or Principal Money Market Instruments Admitted Value Net Arnoiint to an 0ffic:iaI Ext:tiariue LIS~II.ICI USD Assets
Bermuda 20.439 MF (;lot,al
Brazil 22,3013 Rcdccard
Canada 20.054 0arriet:o
China 6,991 Ctrip.corri Iriterriatiorial ADR
Denmark 18,821 Daiske Bank
France 23,296 . M A 0, 002 Groi ipe IJar io1 ie
15,175 Sucr 13.E359 lobdl
Germany 1,263 Adidas
3,lOY I h d e 7,01 8 Siemens
3.891 €.ON
Hong Kong SAR 318,000 China Unicorn 85C.000 Ueriway Motors 39.500 Jardine Strategic
I66,OOO Shangri-La Asia 44,500 Swire Pacific;
Israel 80.953 Maktileshim Ayan Industries 15.870 Teva Pharmaceutical lridustries Al l<
Italy 79.201’1 lntesa Sanpaolo
Japan 13 Central Japan Railsay
27.200 Honda Motor 18.900 Mitsubishi !X,000 Sekisiii (;liem(A 8.300 Sony
16,300 :;quare trl lx 42,tillC Siiiwtorno Electric: I imhsLr iu
80.000 loray lndustrics 32,700 Ustilo
74 Sumitomo Mitsui Financial
Luxembourg 15. jus ArcelorMittal
Netherlands 21.299 ING Groep 19,91 0 :;EM Offshore
16.594 llnilever 8,W2 TNT
Norway 78.733 Telenor
181,725 181,/%3
422,986 422,986
804,215 804,915
329,136 329,138
546,990 540.990
3,344,449 0W.318 452.32/
1.074.890 1.164.914
2,451,436 458.823 781.503 137.491 //4,410
2,440,272 590.407 328,051 fl79.400 387.378 455.036
1,470,375 /53.0:,1 7 17,324
450,362 450.36?
5,731,185 475.790 9mfl17 iii5.591 t i /O.O/S 364.2 11 m4,0:3ti 54 1.801 559,164 4311,490 631.404
1,561,099 1,581,009
2,036,245 672,751 ti1 ti.502 778.039 488.953
492,527 192.527
0.38 0.30
0.88 0.88
1.68 1.68
0.69 0.BY
1.14 1.14
6.97 1 43 0.96 2 14 2.43
5.10 0.Y5 1 .B3 0.Y 1 1 .61
5.09 1.23 0.04 1.42 0 81 0.95
3.07 1.57 1.50
0.94 0 94
11.95 0 98 1 94 1.30 1 .40 0.78 1.01 1.13 1.1: 0.s0 1.30
3.25 3.25
4.25 1.40 1.29 (1.58 (1.98
1.03 I .E3
Niirrher ot shares Transferable Securities and Market 0 or Principal Money Market Iristriirrierits AhMted Value Net Arrioi irit to an Oflicial Exchange Listing USD Assets
Sing a p o r e 138,000 Kcppcl Land
South Korea 14,020 Ddewuo Shipbuilding & Marine
Engineering
Spain %0.00:! Telefbnica
Switzerland 1 F.430 Nestle Hcgistcred
44.091 9 Microclcctronics 3,134 Roche
United Kingdom 40.386 Adnwal 62,038 Rexarri
6730 Rio Tinto 69,296 RUIIS-HU~IX 43,566 Royal Barik UI Scolland
152.256 Sage 95.1 ti3 Tesco
250,640 Vodalurie
United States of America
B,ti18 Apache 1?.454 AGCO
35.031 Applied Materials 13,755 Avon Prodiicls 8.387 Baker Hughes
10.331 Baxter 11 ,771 Colg;lte Palrnolive 42.232 Comcast 9.599 Conocol’hillips
12.1 : I Covidieri 13,32!? Electronic Arts I 1 , f w L~LI~CI 1 1,188 Exelon 11.084 JP Morgari Gtiase & Co 38,064 Microsoft
122.7 I 2 National City 15,903 Orririicom S3.?90 :;(:tietiny Plouytn 44.1 18 TD Ameritrade 11.325 Travelers 7.581 M a C’ctrolcunn
17.481 Wyeth
Total Transferable Securities and Money Market Instruments Admitted to an Official Exchange Listing
503,239 1.05 503,239 1.05
547,102 1.14
547,102 1.14
529,955 1.10 529.955 1.10
2,118,979 4.42 744,057 155 YI4,lYd 1.Y1 400,189 0.98
4,657,901 9.71 fG2,0R3 1.36 4//.092 0.99 805,418 1.88 4BY,014 0.98 192.809 0.40 632,878 1.32 (5!.)2,087 1 . I4 i36.522 1.54
16,366,157 34.12 631.410 1.33 007,328 1.Y0 752.968 1.57 487.477 1.02 744,734 1.55 050,552 1.36 802.900 1.67 700.782 1.84 879.052 1.83 577,088 1.20 505,Fitj 1.22 539.143 1.12 999.458 2.08 5Y8./Y4 1.25
1.078.575 2.24 587.790 1.23 711,023 1.48
1.046.733 2.18 806,036: 1.88 631.598 1 3 2 753.750 1.57 805.700 1.88
46,986,335 97.96

Schroder International Selection Fund Semi-Annual Report June 2008 Page 125
Portfolio of Investments as at 30 June 2008 (cont) Schroder ISF Global Equity (contl
Number of shares Market ";
or Frir.c:ipal Other Transferahle Seciirities Value Net Amount not dealt on a Rcgulatcd Market USU Assets
United Kingdom 12,395 0.03 6,217.344 Rolls Royce ' I 3 12,395 0.03
Total Other Transferable Securities not dealt on a Regulated Market 12,395 0.03
Number of shares Market 9s or Principal Value Net Amount Derivatives USD Assets
India 377,931 0.79
18'01:2013 377.931 0.70 54.055 Shriram Transport Finance Warrants
Total Derivatives 377,931 0.79
Total Investments
Other Net Assets
Net Asset Value
47,~6,661 98.78
586,833 1.22
47,963,494 100.00
Schroder ISF Italian Equity
Number of shares Transferable Securities and Market 0.0 or Frint:ipal Money Market Ir1strmieiits Admitted Value Net Amount to an Official Exchange Listing EUR Assets
France 30.0 15 Rodriguez
Germany 43.31 8 Fielrriariri
Italy 257.190 ACEA 190.61 7 Assicur,uioni Generali 131.758 Autostrade Meridioriali 548.993 Azimut 293.141 Banca llalcasc
577.245 Banco Popolare 1,322,653 Rialetti Industrie 3,l 56.285 CIR-Compagnic lndustriali Riunite
97.713 Rarica Popolare di Milano
19/.916 Dada 191,040 Davide Carnpari-Milario
1,450.788 tnel 789.385 EN1 53,867 ERG
tV3.781 Espririet 731.600 FNM
19543.112 Gemina 1,321,852 Gruppo Coir1
1.18S.657 Hera 2,306.0?4 I Graridi Viayyi
4,110955 lntcsa Sanpaolo 2.430.461 lride
194.292 Gruppo MutuiOnlinc
380.553 IMMSI
(36.1 09 lstituto Finanmrio Industriale Preference
82.053 ltalcementi 2.961 ILandi henzo
lf5.113 Luxottica
278,592 MARR 244,284 Mediobanca
2.559.068 Parmalat 96.1 09 Promuda
18.41 1 .I 18 Mariagerrienl & Capitali
1 16,950 SAES Getters 158.493 Saipem 935.074 SAVE 17.446 Tod's
3,429.1 09 IJniCredit 201 51 0 Uniorie di F3anChe Italiane 480.553 Unipol Gruppo Finanziario 21 fl.047 Viariirii Lavori
Luxembourg 326.775 D'Amico Interriatiorial Shippirig 350.756 Tcnaris
Total Transferable Securities and Money Market Instruments Admitted to an Official Exchange Listing
288,745 0.16 288./45 0.16
2,007,790 1.09 2.007.790 1.09
174,714,537 94.79 3,104,28:3 1 .B9 4.616.744 ?.51 I.R97,315 1.03 3,024,951 1.64 1.816.009 0.99
580.1 15 0.31 f,459,372 3.50
878,564 0.48 5,510,874 7.99 2.487.804 1.35 4.208.333 2.28
18,892,637 10.14 877,010 0.45
2,520.075 1.31 fd7.917 0.35
15.1 36.14O 8.21 4.21 7,027 2.29
8?7.684 0.45 3.074.171 1.67
333.981 0.18 14,830,270 8.05 4,719.955 2.56
1,214,818 0.66 974,841 0.53 11.637 0.01
2.460.1 34 1.33 12,961,427 7.03 1,794.132 0.97 2,618,724 1.42 1.242.935 2.30
136,859 0.07 1,694,606 0.82 4.885.053 2.51 9.149.699 4.96 1.R51.121 0.90
13,236,361 7.18 2,982,348 1.62
?11,?18 0.39 2,164,116 1.1/
9,399,793 5.10 777.725 0.12
8.622.088 4.88
8,849,795 4.80
2,767,228 1.50
186,410,865 I01 .I 4

Pagc 126 Scliroder International Sclectiori Furid Serrii-Aririual Report June 2008
Portfolio of Investments as at 30 June 2008 (cont) Schroder ISF Italian Equity con^) Schroder ISF Japanese Equity
Number of shares Market Vc Nuriitwr 01 shares Transferable Securities and Market "L or Pririupil Other Iranstcrablc Seculities Value Nel or Principal Money Market Iristrurrients Admilled Value Net Amount not dealt on a!iother Reyiilated M x l M EUH Assds Aniourit to an Official Exchange Listing JPY Assets
Italy 697.708 Parrrialat ririarimria
Total Other Transferable Securities not dealt on another Regulated Market
Total Investments
Other Net Liabilities
Net Asset Value
6,977 0.00 Japan 5,977 0.00
6,977 0.00
186,417,842 101.14
(2,102,042) (1.14)
184,315,800 100.00
364.800 Aica Kngyo ,337,000 Air Waler , 155,000 Asahi Glass 980,000 Asics 763,700 A:;tellas Pharnia 225,800 Bridgestone
180,600 Capcorn
,437,000 Cliiba Bank
474.700 C>JrlOll
2.232 Central Japan Railway
37 1 Orccd Office Investment 453 DA Ollice lrivcwicnt
299.000 Daifuku 347.800 Daito Trust C:oristruc:tiori
1.479.000 IIOWA 507.200 FUJlFlLM
2Y5.?00 I Iikxi Tsustiici 422,400 I lorida Motor 283, 100 HOYA 285,800 lsetan Mitsukoshi
260,000 ,Jkk 512,700 JSH
7 13,400 K':;
2.0/8,000 Fukuokd ririaricial
2.81 5,000 lsuzu Motors
5.482 Jupiter T~lecOrrirriuriiCati(li.is
3.450 KDDl 2.943 KK DaVirici
6/.400 Kobayashi Ptiarniaceulical 1 06.200 Koei ;4?.400 Korrialsu 943.000 Makirio hlilliriy Mat:hirie
1.57 ;.000 Minehea 462.200 Mitsubishi
80!3,000 Mitsui & Co. 538.000 Mitsui OSK I iries
4.242 Mi/uho Finarncial 1 Y8.800 Nafco 633.1 00 Narrico I Iaridai 199.400 Nichi iko Pharmaceutical 822,500 Nippon Mining 51 7.000 Nissan Chemical Industries 495,200 Norriurd Hesearch Institute
188,800 Otsuka 75.300 OZEKI
897.000 I Ilcoh /1Y,O00 Sankyu
1,059,000 Sompo Japan Insurance 76,100 Square Enix
289,300 Sumitorno Electric Iridustries 2.440.000 Sumitorno Heavy Industries
3.454 ,C;iiinitonio Mitsui Financial .1'3,980 Suniitorno Heal Estate Sales 71,700 3Gsrriex
P73.500 Takcda Pharmaceutical 191 ,100 Totioku:;tiiri:;tia hlni
75,655,192,200 341,265.600
1,671,250,000 1,483,020,000 1.134.840.000 1.191.150.000
366,148,800 2,589.1 31.000
559,860,000 2.61 1.440.000 1,813,128,000
R8. 748 .000 19 /,0:36.000 312,455,000
1.79 1,170.000 1.143.267.000 1,851,280,000
YY5.362.000 1.033.200.000 1.524.8ti4.000 895.0 10.500 324.954.800
1,138,185,000 1.391 .000.000 1.081.797.000 449,522,800 480.363.800
~.763,200.000 21 3,956.1 00 22Y ,834,000 152,078.400
2,198.B88.000 830,867,000
1 ,01 7,939,000 1.51 7.700.000 1 ,185.0 13 ,00(:) 7.131.606.000
81 3,991,000 2.1 03,032,000
324,885,000 160,986,200 535,389,000 546.982.500 ti75.202 .no0
1,23:3.018.000 /28./35.000
1.928,874.300 2 i0.255.000
1,221.178.000 ~ 3 . ~ 1 ,m
1 .910.757,000
897.160.300 ,056,882,000 239,896,000 38Y.976.400 ,754,300.000 ,759,746,000 205,917.600 290. /06.000 ,476.900,000 19Y,ciY9,500
97.76 0.13 7.10 1 .Y2 1.47 1.54 0.4/ 3.35 0.72 3.37 2.34 9.09 0.25 0 40 2.31 1 4 8 2.39 1.29 1.34 1.97 0.Y0 0.42 1.88 1 .80 1.40 0.58 0.62 2.92 0.28 0.30 0.20 2.R4 0.82 1 . 3 2.09 1.53 2.75 1.05 2.72 0.42 0.98 0.69 0.7 1 0.87 1.59 0.94 7.49 0.35 1.58 0.29 2.47 0.50 3.05 2.01 1.1u 1.37 0.3 I
2.27 3.57 0.27 0.39 1.91 0.2t1
0.x

Schroder International Sclcction Fund Semi-Annual Report June 2008 Page 127
Portfolio of Investments as at 30 June 2008 (cont) Schroder ISF Japanese Equity (cant) Schroder ISF Japanese Large
Cap Market 0.6 Number of shares Transfcrable Securities and Market % Number of shares Transferable Securities and
of Principal Money Market Instrumonts Admitted Valiie Net or Principal Money Market Instruments Admitted Value Net Amount to an Official Cxctiange Listing .Jw Assets Amount to ari Official Fxctiange Listing JPY Asscts
Japan (cont) Japan 841,100 Toyota Motor
227,200 Tsufniira B Go 464,500 Yamalake
756,600 ioyoia rsustlo
1.071.100 Zensho
Total Transferable Securities and Money Market Instruments Admitted to an Official Exchange Listing
Nurrit)er of shares or Principal Operi-erided Collective Amount lnvcstmont Schemes
4.213.91 1,000 5.44 1 .883,!)34.000 2.43
621.392.000 0.80 1.286.665.000 1 .66
609.455.9CO 0.79
75,655,192,200 97.76
Market ?i Value Net .IPY Aswt.;
Japan 922,432,916 1.19
Smaller Companies Fund 972.432.916 1.19 15.300.000 Schroder Inslittitinrial .Iap;lriese
Total Open-ended Collective Investment Schemes 922,432,916 1 .I 9
Total Investments 76,577,625,l 16 98.95
Other Net Assets
Net Asset Value
814,607,207 1.05
77,392,232,323 100.00
453,000 Asahi Glass
181,700 Rridgestcne 173.800 Cariori
389 Central Japan Railway 584.000 Chiha Rank 115,000 naiwa House Induslry 351 ,000 Dcnki Kagaku Kogyo KK
127 East .lapan Railway 404,000 Fukuoka Financial
75.1 00 Astellas Fharma
27,000 Hamamatsu Photonics KK
30.500 liitachi Construction Machinery 3.~138500 Haseko
77,700 HOYA
852,000 ITOCHU 5.700 Idemitsu Kosan
34.000 1toctii.i rectino-Solutions 43.100 JFE 61.000 JGC
120.800 JSF 1.31 7 Jupiter Telecommunications
21 6,000 Kaneka
11 5,500 Komatsii 101.000 Konica Minolta 24.900 Makita
1.326 KOUl
1.366.000 Mwda Motor 108.000 Mitsuhishi Electric 179.000 Mitsui R Co.
743.000 Nippon Mining 120.000 Nissan Chemical Industries 130.000 NOK 63,300 Norriura Research lristitute 87.000 OKUMA 3/.880 ORlX 31.900 Otsuka
264,000 Ri~ot l 36,800 Rynhin Keikaku
105.500 Sankyo 493.000 Sarikyu
761 Mizuho hancial
49,000 Seiko Epson 600 Seven Bank
27.800 Shiniarriiira 09.200 Shin Elsu Chemical 41 ,200 Stiinko rlectric Industries
467.000 Sompo Japan lnsurancc
305.800 Surnitomo 19fR.f00 Siurnitomc Tlectric Industries 336,000 Sumitorno Heavy Industries
1 .I n5 Sumitorno Mitsui Financial 11 3.000 Suniitomo Trust & Banking 121 .I 00 .Takeda Pharmaceutical
105,000 Shimadzu
1.997;~OO Sojitz
58.200 Square tnix
40,200 TDK 71.100 THK
840.000 Tokai Tokyo Securities 284.700 Tokyo Steel Manufacturing
337.500 Toyota M&r /4.000 Tokyo Tatemono
21,814,292,100 93.80 581,652,000 2.50 342,450,000 1.47 294,899,100 1.27 918.948.000 4.08 455,130.000 1.96 434.106.CQO 1.87 11 4.770.000 0.49 177,894,000 0.7R 109.855.000 0.47 193.516.000 0.83 74,385,000 0.37
488.26i.000 2.10 90.737500 0.39
190,753,500 0.82 53.694.000 0.23
9R3,612,000 4.14 11 /,300,000 0.50 230,585,000 0.99 127,490,000 0.55 754,888,000 1 . I O 108,389.1 00 0.47 156.lRH.000 0.67 869.856.000 3.14 341.880.000 1.47 IH1,003.000 0.78 108,066,000 0.46 /52.666.000 3.21 226.710.000 0.97 41 9,755.000 1 .80 377.456.000 1.53 161.585.000 0.60 156,720.000 0.67 219.440.000 0.94 157.61 7.000 0.68 86,510.000 0.37
577,359,700 2.46 233,827,000 1.01 505.824.000 2.18 209.024.000 0.90 736.980.000 3.17 263.755.000 1.13 143.080.000 0.62 162.150.000 0.70 11 0.985.000 0.48 181.812.000 0.78 657,i36,000 7.81 54.013.200 0.23
707,185,800 3.04 486.066.000 2.00 182.748.000 0.79 426.591.CQO 1.84 259.060.800 1.1 6 241 584.000 1.04 948,615,000 4.07 83,846,000 0.36
553,940.000 2 81 255,672,000 1 . I O 152.E46.000 0.66 323.400.000 1.39 321.786.900 1 .10 50.838.000 0.22
1,665,825,000 1.1 6
I
I
I
I I
I I
I
I I

Page 128 Schroder lntorriatiorial Selection Fund Senii-Aririual Report June 2008
Portfolio of Investments as at 30 June 2008 (cont) Schroder ISF Japanese Large Cap (CW t )
Schroder ISF Pacific Equity
Number of stwcs Transferable Securilie:; and Market ql Nimiber of st tire:; Tralsferable Securities and Market
or Priricipal Money Market Iristrurrwnts Admitted L'Aiw Net or Priricipal Moncy Market IristriirrieIils Admitted Value Net
Amount to ari Official txchange Listing JPY Assets A~IIOUI.I~ to ari 0ffic:irrl txcliangc Listing USU Assets
Japan (cont) 99.D00 1oyota IsUsho
82,400 Yamatake 760 west .lapan Hallway
107,000 Yaskawa Electric
Total Transferable Securities and Money Market Instruments Admitted to an Official Exchange Listing
Total Investments
Other Net Assets
Net Asset Value
China 2-18.004.000 1.07 8,875,000 Chiria (:orllrrlunications Construction 135.160.000 0.58 'H' 172.845.000 0. /4 38.T38,OM (;tma Construction Bank I I' 11 1,387,000 0 18 3.485.500 China Merctiarils Bank 'H.
5.81 6.000 (;hina National Building Material 'H. 7.8/4.000 Ctiir&> Petrolcum &Chemical I I'
21,814,292,100 93.80 2.60?.000 China Shenhua triergy H 11,332,000 Doriyleny Motor 'H' 10.71 8.000 Huaneng Power IrWrnational 'H 7,044.500 Piny An Insurance (.;roup Co 0 1
21,814,292,100 93.80 China 'H'
1,442,566,381 6.20 Hong Kong SAR 1.4Nj,000 ASM Pacific Technology fi.845.000 BOC Hori(1 Koriy 4.W4.000 Cthina Mcngniu Dairy 4,427,000 China Mobile
11 .;i98.000 (Iiina Overseas Land & lrivestrrieril 1 1 ,134,000 Chiria Ilriicum 16,453.000 CNOOC
23,256,858,481 100.00
4.4ij9.000 COSCO Pacitic 2,467,000 Hang Lury 3.967.00(3 Hongkony Larid 1 ,140,800 .Jarthe Matheson 2,609.000 Kerry Properties
10.K 6.000 Shangri-La Asia 532.800 I I 8 Fung
4.276,500 Swire P:iclll(:
India 485.070 Bharat Heavy Clectricals
1.01 3,425 Hiart Airtel 385,224 Housing Dewlopirienl Financc
2,401 ,817 lhlrnstructure Developrrierit Firinrice 1 ,392,805 IVHCL Infrastructiures R Prujecls
540.800 Maruti Su/i.iki India 1,395,700 Ranbaxy I aboratorics
83.300 Reliance Industries 180.534 3 ;~ ly i~ Computer Services 471 ,ti84 Sobha Developers
2,960,438 Unttecti
Indonesia 11.7OY.500 Rank Rakyat lridoncsia 6.71 7,000 Pcrusahaan Perkebunan London
9,902,000 Semen Crcsik Persero 1 K476,OOO lclckomunikasi 1ridoriesi:i 3,554,500 (Jnited Trxlors
Sumatra 1ridoriesi:r
Malaysia 3.1i'2.s00 Durriipiitra Commerce Holdings 2,ti31.200 Uursd Malaysia 5.094.ti00 Geritiriy 2./14.600 :hie Uarby 4.1 6ti3,O(3(3 SP Setia
Philippines 25.B99.680 Ayala Larid
18,339 800 Mctropolitari Rarik K lrust 5,880,000 First Philippine
112,818,465 9.06
13,180,277 1.23 30.808.149 2 47 10.888.480 0 87 11,185,906: 0.90 7.370.108 0.59
10,209,024 0.82 4.51 1.321 0.33 /.434.752 0.60
15,204,447 1 22
322,135,462 25.88 11,212,973 0.91 18.123.7f10 1.46 12.252.747 0.98 59,487,582 4./8 18.005.072 1.46 20,871 .t357 1.86 28,3110,864 2.27
7,323,130 0.55 10,900.438 0.88 16,857,360 1.36 35.022560 2.81 13.698.831 1 .I0 1.605.416 0.13
24.773.575 1.99 43,725.51 7 3.51
11 1,336,648 8.94 15,6:1/,:39n 1.28 16,8 /8 . /%~ 1.38 1 1,580.01 1 1.41 5.778.510 0.46 9.824.524 0.79 7.744.2RR 0.62
16,955,543 1.36 4.160.618 0.33 1,831.15i 0.15 3.083.673 0.95
11,785,808 0.95
39,428,648 3.17 8.133.845 0.88
7.ti41.331 0.82 4234.481 0.34
11,623,745 1.17 4,735,245 0.38
34,666,716 2.78 8.502.892 0.68 5,99921 I 0.48 8.731.373 0.10 7.6:84./90 0.82 3.740.444 0.30
21,880,979 1.76 5.488.088 0.45 2,510,211 0.23
13,467349 1.08
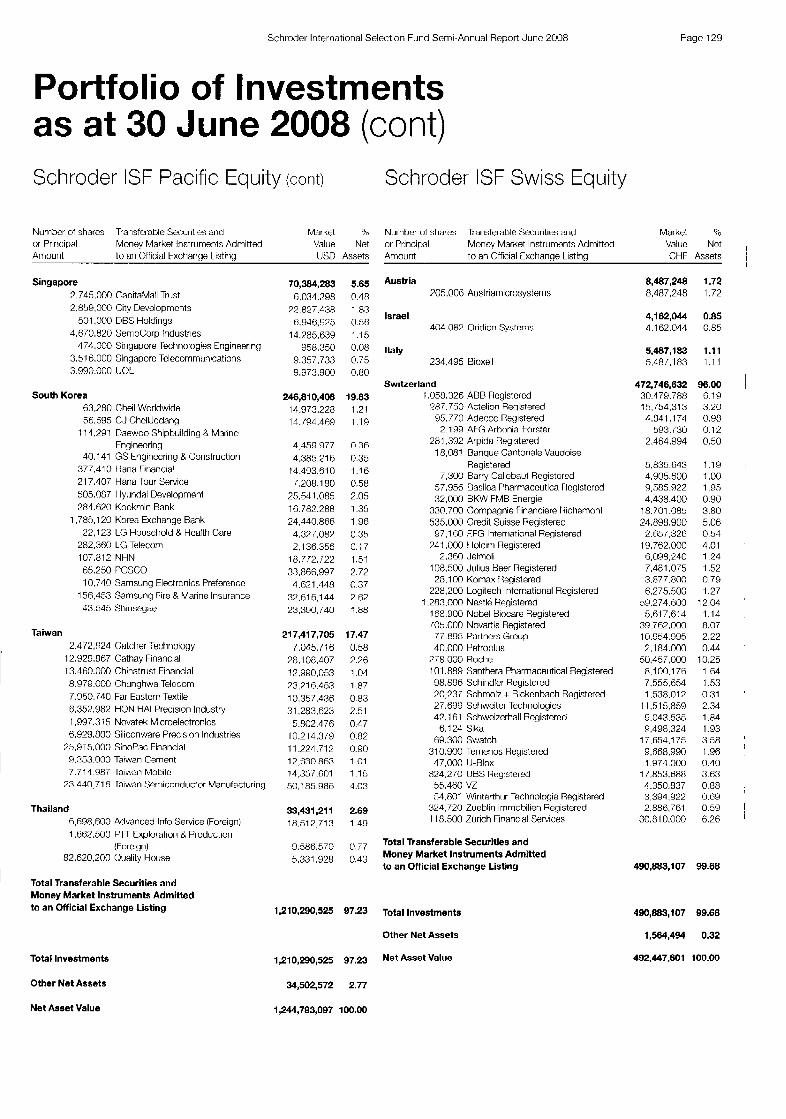
Schrnder lnternatinnal Selection Fund Semi-Annual Report Junr: 2008 Pagc 129
Portfolio of Investments as at 30 June 2008 (cont) Schroder ISF Pacific Equity (cant)
Number of sham Transferable Securities and Market 'h or Priri(:ipaI Monev Market Instruments Admitted Value Net Amount to an Dlticial txchanoe Listinu USD Assets
Thailand 6,698,600 Advanced Info Service (Foreign) 1.687.500 PIT Lxploratiori & Production
(Foreilgri) 82,620,200 Ouality Hoiise ' Total Transferable Securities and
Money Market Instruments Admitted
Singapore 2,745,000 CapitaMall Trust 2.859.000 City Developmcnts
501.000 DES Holdings 4.670.820 SerribCorp Industries
174,000 Singapore lechnoloyiss Eriyirissriri<g 3.51 6,000 Singaporc Telecommu?ications 3.990.000 IJOL
South Korea 63.?80 Cheil Worldwide 56,695 CJ ChcilJcdang
11 4.291 Daewoo Shipbuilding & Marine
40.141 GS Lngineering & Construction Enginecring
377,410 I laria ririancial 2 17.107 Hana Tour Service 505.087 Hyiindai Development 281.620 Kookmin Bank
1,785.120 Korea Exchange Bank 22,123 LG Household & Hcalth Care
282.3RO L G Telw;orri 107.812 NHN 65.250 POSCO 10.740 Samsung Electronics Prefercncc
156.453 Samsunq Fire & Marine Insurance 43.545 Stwisegas
Taiwan 2,472,924 Catcher Technology
12.Y29.867 Cathay Financial 13.460.000 Chinatrust Financial 8.979.000 Chunghwa Telccom 7.950.710 Far Eastcrn Textile 6,352,982 HON HA1 Precision Industry 1.997.315 Novatek Microelectronics 6.Y29.800 Siliconware Preci:;ion Indiistries
25.915.000 SinoPac Financial 9.353.000 Taiwan Cement 7.714.987 Iai'smn Mobile
23.440.71 5 Taiv&~ :;erriic:oridi.idor Manufacturing
to an Official Exchange Listing
Total Investments
Other Net Assets
Net Asset Value
70,384,283 6,034.2G8
77.827.438 0,946,975
14.785.639 958.350
9,357,733 9.973.900
246,810,408 14,973,228 1 4, :94.469
4,459.977 4,385,916
14.4O3.810 1,208.1 80
25541,085 16.782.288 24.440.866 437.087 2.136.356
18. ?/2,1'22 33.866.997 4.621.448
32.61 6,144 23,390,740
217,417,705 7.045.716
?8,108.407 1 2,990,053 73,716.453 10.357.436 31,283,623 5.802.478
10.214.3/9 11.224.712 12,830.863 14,357,601 50,185,086
33,431,211 18,512,713
9.586.570 5.331.928
5.65 0 48 1 03 0.56 1.15 0.08 0.75 0.80
19.83 1.21 1.19
0.36 0.35 1.16 0.58 2.05 1.35 1.96 0 35 0.1 7 1.51 2.72 0.37 7.62 1.88
17.47 0.58 ?.?6 1.04 1.87 0.83 2..5 1 0 47 0.82 020 1.01 1.15 1.03
2.69 1.49
0.77 0.43
1,210,290,525 97.23
1,210,290,525 97.23
34,502,572 2.77
1,244,793,097 100.00
Schroder ISF Swiss Equity
Nurrit)er of shares Trxisferatjle Seciirities arid Market 5'0 or Principal Money Market lnstrumcnts Admittcd Valuc Nct Arriourit to an Official Cxchanne Listina CHF Assets
Austria 705.006 Ausiriamicrosystems
Israel 404.087 Oridiori Systems
Italy 234.495 Bioxell
Switzerland 1.058.326 ARB Rcgistcrcd
287.750 Actelion Re(1istered 95,770 Adecco Recgistered
2.1 99 AFG Arbonia korsler 281.392 Arpida Registered
18,081 Barique Cantoriale Vaudoise
7,300 Barry Callcbaut Rcgistercd Registered
57.956 Rasilca Pharmaccutica Rcgistcrcd 32.000 RKW FMB Energie
330.700 Compagnie Financiere I lictiemonl 535,000 Credit Suisse Registered
741 ,000 I Idcirri Registered
108,500 Julius Haer Registered
228,200 Logitech lntcrnational Registered
168.900 Nobel Biocarc Registered 105.000 Novartis Registered
40,000 Petroplus
97.1 60 FFG lnterriatiorial Registered
2.360 Jelmoli
28,l 00 Komax I<egistered
1.283.000 Nest16 Registered
77.695 Partners Group
?78.000 Roche 101,889 Santhera Pharmaceutical Registered 98.896 Schindler Registered 20,237 Schrnolz t Bickcnbach Rogistered 27.699 Schwciter Technologies 42.1 61 Schweizsrhall Registered
6.124 Sika 69.300 Swatch
47,000 Id-Rlox
55.460 VZ 54.801 Wiriterthiir .Technologic Registered
310.900 Temenos Registered
824.270 LJBS Regstered
324.720 Zueblin lrnrnobilien Registered 11 8.500 Zurich Finaricial Services
Total Transferable Securities and Money Market Instruments Admitted to an Official Exchange Listing
Total Investments
Other Net Assets
Net Asset Value
8,487,248 1.72 8,407,248 1.72
4,162,044 0.85 4.162.014 0.85
5,487,183 1.11 5,48/.183 1.11
472,746,632 96.00 30.479.788 6.1 9 15,754,313 3.20 4.341.171 0.98
583.730 0.12 2.464.994 0.50
5.835.643 1.1 9 4,905,600 1 .OO 9,585,822 1.95 4.438.400 0.90
18.701.085 3.80 24,898,900 5.06 2.657.326 0.54
19,762.000 1.01
7,481,075 1.62 3.877.800 0.79 6.275.500 1.27
59.274.600 12.04 5,617,614 1.14
30.762.000 8.07 10.954.995 2.22 2,184.000 0.44
50.457.000 10.25 8.100.176 1.64 7.555.654 1.53 1.538.012 0.31
11 515,859 2.34 9.043.535 1.84 9,498,324 1.93
17.654.175 3.58 9,668,980 1 .96 1 .971.000 0.10
1 /.n53.88n 3.83 4,350,837 0.88 3,394.922 0.69 2.886.761 0.50
30.810.000 6.26
6,098,240 I 2 4
490,883,107 99.68
490,883,107 99.68
1,564,494 0.32
492,447,601 100.00

Page 130 Sctirodar linternattonal Selectiori Furid Serni-Annual Report June 2000
Portfolio of Investments as at 30 June 2008 (cont) Schroder ISF UK Equity
Number of shares lianslerable Securities and Market Y or Principal Moriey Markel Instruments Admitted Valuo Nct Ai riounl to an Official txchariye I isling GI3P Asset:;
Canada 27.030 First Quantum Minerals
Netherlands 245.193 Royal Dutcti Shell 93.043 Royal Dutch Shell .E'
Switzerland 60,853 Xstrata
United Kingdom 40,703 3 1 88,903 Anglo Arriericari
lY3.105 Astra7erieca 246.498 BAE Systems 423.2 10 Barclays
83.808 Bcllway 484.895 BG 127.475 Rl IF Hilliton 718.650 HI' 12/.278 nritisti Arrierican lobacco 553,BUY ET 340.01 3 Riirizl
I, I 12.154 Cable & Wireless 10,t?4G Cairn Encrgj 31 ,On9 Cape
633,858 Catillion 443.831 Centaur Media 444.540 centricn
40,893 Chernriny 477.1 78 Chloride 2 M 138 Cookson 289.570 Croda Inlernational
339748 Daily Mail & Gcncral Trust 1 0C.5i4 Darw Petrolwm
801,278 IK I
66.559 CSH
2.159.831 Elementis
56.330 tierri Iliamonds
296,048 Grainger 37.706 Grwne King
2Y5,l I 3 Headlam 354.588 Homc Retail tilT.018 HSRC 184.31 7 ICAt' 308.31 1 Inchcape 361,717 Iriternational Power 397.907 I r i\,ent;ys 859,482 I l t 110,813 Jardine I lokd Ttiorripson 271.400 John LVood
80.8i5 Johnson Matttiey 1,444,276 Leyal & Ceneral
710,san Lloyd:; ISH 195.921 Melrose 202,807 Michael Page
1,1)85.0!?2 Old Mutual 23!j.331 Pearson 304.793 Pruderitial 1 9 1 , T 1 0 Rccd Elsevier 453..1 18 Hcnobo
1.078.51 2 Heritokil lnilial 5Gl.438 Hexam
30.1 22 Rio Tinto 196.285 Royal Uank (:if Scotland
1 841.632 Signct
919,630 0.75 YlY.830 0.75
6,888,585 5.62 5,024,004 1.10 1,864.581 1.52
2,441,422 1.99 2,441,472 1 .Y5
108,l 60,323 88.1 9 408.807 034
3.175.493 2.58 4.1 1 6.998 3.36: 1 .OIY.OGl 0.88 1,730,250 1 .00
315.8icl 0.31 rj.230."01 5.08 2.433.4'38 1 3 8 4,133,849 3.39 2,104 2T3 1.IY 1,103,375 0.90 2.215.185 1.81 1 ,679.080 1.36:
532.305 0.52 88.497 0.07
7.1 15.501 1.73 2'3'3,586 0.24
1,366,771 1.1 1 961.402 0.78
1,125,886 0.97 1,668,999 1.38 1,844,581 1.50
180, /08 0 15 1.05.1.05i 0.88 1.900.8.19 1.35 1,673,871 1.35
fXY.UB/ 0.55 t i l 9,tiYU 0.51 775.01 I (3.63
5,448,755 4.44 607.588 0.51 162,311 013
1 .000.D36 0.82 l i3.002 0.63
4,005,028 3.92 1.004,528 0.82
90.492 0.79
1,142,826: 1 18 532,572 0.~13
1 ,33,999 1 .09 1,489,718 1 2 1 1.138.943 1.1 7
055.558 0.53 955.351 0.21 4j4.061 0.39 875,885 (1.80
1.463.650 1.15 1 ,320,360 132 1.083.503 0 88
180.734 0.15 1,070,423 0.87 2,281,477 1.86 1,808,225 1 :I l
Number of shnrcs Transferable Securities and Markel :b Value Net or Priricipal
Amount to an Otticial Exchange Listing GBP Assets Money Market lristrurrierils Adrnitted
United Kingdom (cont) 329,8/4 Srriith & Nephcsv 181 ,889 Srniths 32,l 85 Soco Iriterrlatiori;il
11 7.814 Spirax-Sarco Engineeririil 130.447 Staridard Chartcred 105.825 :;VG 0q)Ikdl
597.480 lesco 133.287 Unilcver 187.429 Venlure Prodiiction
2.9'38.229 Vodaforie 183,940 VT 196.1 (37 Wellslream 89.181 WPP
170.982 WSP 791.743 Yule Catto 8, Co.
1,050.000 SVG Oapitul 8.25?< 05:08:2016:
United States of America 1 ,ij33.745 Leed Petroleurr>
Total Transferable Securities and Money Market Instruments Admitted to an Official Exchange Listing
1,842,878 1,959,850
630,434 1.201.469 1.851.043
098,974 1.025.325 2.17!1.563 1,882.01 ? 1,454,121 4.41fi.442 1,149,825 1.373.025
428.893 000.970 971.805
1.50 1.59 0.51 0.98 1.51 0.57 0.84 1.78 1.53 1.19 3.80 0.94 1.1? 0.35 0.73 0.7Y
951,656 0.78 951.656 0.78
119,361,816 97.33
Number of shares Market 9; or Principal Value Net Amount 13erivalives CBP Assets
United Kingdom Y0,i387 13arc:lays niyhts 1 1':0i?2008
7,885 0.01 7.885 0.01
7,885 0.01 Total Derivatives
Total Investments 119,369,701 97.34
Other Net Assets 3,264,857 2.66
Net Asset Value 122,634,558 100.00

Schroder International Sclcctinn Fund Semi-Annual Report June 2008 Page 131
Portfolio of Investments as at 30 June 2008 (cont) Schroder ISF US Large Cap
Number of shares Transferable Securitics and Markct ”; or Prircipal Moncy Markct Instruments Admitted Value Nct Arnount to an Official Exchanqc Listinq USD Assets
Bermuda 78.383 ACE
United States of America 108,866 Abbott Laboratories 1 97.G46 American International 47.470 Apache 34.138 Applc
1 8B.372 Applied Materials 230.792 ATRT 158.71 7 Avon Products
108,084 Baxter iriternatiorial 84,508 Bank oi New York Mellnri
49,173 Becton Dickinson Fi Co. 59,479 Burlington Northern Santa Fe
759.447 C:iticjroup 153.925 Coach 161.073 Cognizant Technology Solutions 289.534 Comcast 87.738 Cori:~coPtiilli~~s
188,511 Corning 98,674 Covidieri 72,WO Danahcr
118.008 Dcan Foods 59.374 Deere R Co.
139.038 URll 106,213 Ecolab 85,051 Electroriic: Arts 44.848 Exelon
55.636 FedEx 119.301 Exxon Mobil
248.389 Gerieral Electric 177,823 Hewlett-Packard
741.068 Intel 142,Ol 0 iStar Financial 108.161 Johnson R Johnson
78.968 1-lorieywell
97.813 JPMorgan Chase & Co. 99.043 Kellogg 82.221 Kohl’s
97,060 Lexmarlc
97.722 Marathon Oil 69.189 Medtronic
313.215 Microsoft 50.608 Monsanto 14.049 Morgan Stanlcy
587,699 National City 11 6.203 NctApp 347.989 News 85.547 Noble
179.367 Oracle 176,652 F’rocter & Gamble 67.462 Prudential Financial
108,247 Oiiicksilver Res(.xir(;es 177.8S2 Reliant Energy 272.568 Schcring-F’lough 69,337 State Street
366.046 Time Warner 81.924 tw lelecom
11 3.440 TJX
149.554 Lchrnan Brothers
141.813 Lowe’s
4,329,877 I .43 4.329.8/7 1.43
295,654,660 97.49 5,769,898 1 .89 5.354.252 1 .16 5.816.605 1 .92 5.808.532 1 .9l 3.709.316 1.06 ;.560. (45 2.49 5.607.033 1.85 3.764.544 1 .OR 6.6i2.486 2.20 3,934,484 1 79 5,793,765 1.91 4.475.461 1.48 4,508.463 1.49 5,797,691 1.75 5.394.018 1.78 8,040,310 2.65 3,975,033 1.31 4.878.181 1.51 5,537,715 1 .F13 2.908.357 0.96 4,238.1 16 1 .40 3.093.596 1,02 4,639,384 1 53 2,858,341 0.94 3.901.776 1.29
10.375.607 3.40 4.29/.881 1.42 6.522.1 70 2.1 5 5,898,349 1.88 3,881,595 1 28 5.180.551 1.71 1.919.975 0.63 6.875.795 2 27 3.428.346 1 13 4.750.102 1.57 3,402305 1 12 3.327.577 1 .I0 3.746.657 1 .07 2,955,463 0 . 9 7 5.005.321 1.65 3,575,988 1 18 8.654,l 30 7 R5 0,445,031 7 14 2.718339 0 90 2.791.128 092 7.509.748 0.85 5,202,320 1.75 5,540,024 1.83 3.818,61 I 1.26
10.685.67G 3.52 4.301.377 1.47 4.219.468 1.39 3.602.236 1.19 5,353,736 1.77 4,137,941 1.46 5,278,383 1.74 1,325,530 0.44 3.613.0M 1.19
Number of shares Transferable Securities and Market ?,, or Principal Moncy Market Instruments Admitted Value Net Amount to an Official Exchange Listing USD Assets
United States of America (cont) 50.695 Ultra Petroleum 52.768 Unitcd Technologics
141,655 Waste Management 101.540 Wyeiti
Total Transferable Securities and Money Market Instruments Admitted to an Official Exchange Listing
Total Investments
Other Net Assets
Net Asset Value
5,063,785 1.67 3.226.783 1 .06 5.275.232 1.74 4.879,97? 1.54
299,984,537 98.92 I 299,984,537 98.92
3,281,031 1.08
303,265,568 100.00

Page 132 Schroder Intcrnntiorial Selection Fund Semi-Annual Report June 2008
Portfolio of Investments as at 30 June 2008 (cont) Schroder ISF Asia Pacific Property Securities
Schroder ISF Asian Total Return
Number of shares Transferable Securities and Market '<b Number 01 shares Transferable Securities and Market 96 Moriey Markel Irmtrumcnts Admitted Value Net or Priricipal Money Market lnstrumerits Adriiilled Value Net or Principal to ari C)lliciai txchange Listing lJSD Assets Arriour it to an Official Exchariqe I istiny UXJ Assels Amount
Australia 2,173.900 nexus Property 1,322.420 GPT 1 .I 17,640 Macquaric CountiyWide Trust
838.170 Maqiiarie Cllicc Trust 8; 1.74 1 Westfield
Hong Kong SAR 2.976.000 Chainpior1 HElT
21k000 Cheung Konq 331 ,000 I-far& Lur-ig
1.~148,000 Honykong Land 298.500 Jardirie Strategic 21 4,000 Kerry Properlies
1 ,SI 2,000 Shnnyri-La Asia 8 10,000 Sun Hung Kai Propertie:; 309.600 Swire Pacitic 700,625 Wti:irl
Japan 330.500 Daibiru
580 Japari Prirrie Ilealty Invcstment 149 Japan Hcal Estate lnwstriieril
462.000 Mitsubistii rstate 489,000 Milsui Fudosan
15i.000 Surnitorrio Rea1l.j B Uevclopmcnt 314,000 Tokyu Land
17B Nippon Building Fund
Malaysia 8(JO',lO(J SP Setia
Philippines 7.837.2ii8 SM Prime
Singapore
1,730,000 Ascendas Real Cstate hwslincrnt
7,%/,UOO Cambridge Iriduulrial lrusl
1.499.000 CapitaMall Trust 4,374,000 k)rlune Heal Estatc Investment Trust 1 . /I 3.000 Sai7eri Real Estale Irivestrncnt Trust 3,1!?8,000 Smtec Real Estate lnvestrrierit .lrus1
Trust
1.01 1.000 Capital arid
1.073.000 YArllCJrd Land
Thailand 4,303,300 Land B Houses (Foreign)
Total Transferable Securities and Money Market Instruments Admitted to an Official Exchange Listing
Total Investments
Other Net Assets
Net Asset Value
17,893,229 14.60 7.8>37,983 2.37 2,871,?77 2.32
986,841 0.79 026,739 0.51
10.595.553 8.69
38,691,154 31.73 1,354,389 1 .I 1 3,355,503 2 75 1,470,574 1.21 1.485.410 3.ti8 5.134.7'00 4.21 1.123,630 0.92 3.528,40/ 2.89
10.988.191 9.01 3.982.847 3.2 / 3,267,993 2.88
35,304,156 28.95 3,585,017 3.02 1,722,338 1 .A 1 1.5/8.211 1 39
10,617,174 8.71 10.497,730 8.61 2.080.5/5 1.;1
2.419 2.73 l,/YO,B37 1.47
725,305 0.60 725.305 0.00
1,220,351 1 .OO 1,220.331 1 .OO
22,062,168 18.09 r,06,8'jfi 0./4
7,510,940 2.39 :3,;74,9Rti 3.06 4.73tX12 3.48 3,295,292 7. /o 2.548.515 2.0Y
881.594 072 2.197.738 1 3 0 1.459:135 1.20
964.697 0.79 96-1.697 0.79
116,861,060 95.84
5,067,237 4.16
121,928,297 100.00
Australia 14,?90 Australia and N e w Zealand Earikiriy
1 75.930 Austr:ili:-lri Phammccutical Industries 54.530 nrarritiles
124,8 17 Consolidated Media I 7.002 (:SL 59.1120 Jarncs Hardie Industries 19,490 (>rim 49.880 Rcsmed 3,l 10 Rio Tirito
1 9.360 Suncorp-Metway
China 160,500 China Merchants Darik 'H' 296.000 China Oilfield Serviccs 'H'
1 ,366,000 Frdristiic.irl Propertics China 452,900 Hangzhou :.;teafTl lurblIl@ 378.000 PetroChiria .ti
Hong Kong SAR 26 1.500 ROC I loriy K c J ~ ~
1 , I 08.000 Champion RrlT 50.000 Cheuri!] Korig
391,000 CNOOC 504.400 Dah Siriy Bariltiny 56,600 Dairy Farm Iriterriatiori:il
51.400 Esprit
20,800 Horig Korig Aircraft Enginccrg
1,374.000 Denway Motors
1 ./EiO.000 hrsl t'acitic
.O(Xj Horiykoriy Land ,800 Jardine Mattiesori
122.000 .Jardine Strategic 737,000 Midland 128.000 Noble
7ti,000 Swirc Pacific 'K 3/1.500 :;Wire Paulic 'B'
Malaysia 424.157 AMMB 3)1 ,000 Giiinncss Anchor 27 I, 100 Honq I eoriy Barik 283,900 Lafarge Malayari (:emem 760,r?00 Tradewinds kintation
Philippines 22.830 Globe Ielecor11
557.700 International Container Terrri Service2
Singapore 234,000 Asccndas Real Estate Irikeslrnerll
Trust 1.2 15,000 Carribridye Iriclr~s~rial Trust
386000 CapitaMall Trust 189,000 First I<esuurccs 850.000 Fortune Real M a l e Investment Trust
508.000 Rickrriers Maritime 790.000 Suntec Real Cstate Iriveslment Trust
797.000 M I L
53.000 Jardine Ckcle & Carriage
57.000 United Overseas h i l t
South Korea 4 I , 1 B0 Korea Exchar ige thnk
Taiwan :390.00(3 C;hungtiwa Telecom
3,431,389 6.70 257.078 0.50 123.420 0.21 457.649 0.89 395,837 0.77 583.299 1 .I4 243.745 0.48 548.786 1.01 174,003 0.34 404.970 0,/9 212.609 0.48
2,681,210 5.23 504,193 0.98 531,343 1.04 596.353 1 , I 6 559.803 I .OY 489,518 0.9u
13,431,679 26.20 892.384 1.35 517.464 1.00 673.796 1.31 d/2,796 1.31 895.090 1.75 371,077 0.64 530.284 1.03 533,831 1.04
1.110.28:! 2.17 370.304 0.63 980,120 1.91
1.338.520 2.61 2,0.38.100 4.09
434,268 0.09 739,477 1.44 7//.141 1 .G 774.448 1.51
2,077,055 4.05 412.828 0.80 515.781 1.01 405,388 0.95 345.675 0.67 317,425 0.6%
959,972 1.87 594.003 1.18 Y65.YtiY 0.71
5,877,568 11.45
380,208 0.71 598,500 1.17 848.539 1.65 158.409 0.31 494,801 0.96 882,427 1.79 422.042 0.82 I'89.913 1.54 ;8l1.311 1.52 742.4 18 1.45
563,540 1.10 563.540 1 .IO
1,008,389 1.97 1.008,3YY 1.97

Schrodcr International Selection Fund Semi-Annual Rcport June 2008 Page 133
Portfolio of Investments as at 30 June 2008 (cont) Schroder ISF Asian Total Return (cotlt)
Niirriber of shares Transferable Securitics and Market % or Principal Money Market Instruments Admitted Value Net Amouit to an Official Exchanoe 1 istina USD Assets
Thailand 170.800 Electricity Generating iForegnj
1.81 0.300 I lorne Product Center (Foreign) 742.500 Major Cineplex Group Toreign) 93.200 PTT Exploration & Production
(Foreign) 436.400 Stiiri (Toreign)
638.200 1 i sm Bank (Foreiljn) 15.000 Siarn Commercial Bank (Foreign)
Total Transferable Securities and Money Market Instruments Admitted to an Official Exchange Listing
Nuniber of shares or Principal Anioi.int
Money Market Instruments other than ttiose dealt in on a Reaulated Market*
2,394,430 4.66 431.210 0.81 265,112 0.52 323,887 0.63
537.125 1.05 315.521 0.67 104,198 0.20 387,077 0.75
32,425,242 63.23
Market D.b Value N b IJSD Asset:;
Time Deposit 7,353,832 14.34 SGD 10,002,314 CMR London 0 70% 01:07:?008 7.353.832 14.34
Total Money Market Instruments other than those dealt in on a Regulated Market*
Total Investments
Other Net Assets
7,353,832 14.34
39,779,074 77.57
11,500,337 22.43
Net Asset Value 51,279,411 100.00
Schroder ISF Asian Equity Yield
Numtw of shares Trarisferahle Seciirities and Market 9b or Principal Money Market Instruments Admitted Value Net Amount to an Official Exchanae Listina USD Asscts
Australia 332.510 Australia and New Zealand Ranking
215.321 RHP Rilliton 8.1 39,8R0 Habcock & Hrown Corrirriiiriities
5.349.770 Corisolidated Media 1.084.700 Crown
9 1 1,130 Lion Natkan 265.440 National Australia Bank 368,190 Orica
fi,fi12,390 Telstra 88,700 t4io 1 into
China 13.221 .000 China Construction Bank 'H' 2,928,000 China Shipping Development 'H
Hang Kong SAR 9.088.000 BOG I long Korig
18.322.000 Champion RElT 704.500 China Mobile
10.195,000 CNOOC 23.384.000 Denway Motors
1 , I 10.000 Esprit 17.884.000 Franshion Propertics China 3.900.000 Hongkong Land 4.603.000 Hopewell ?.050.000 Hutchison Whampoa
940.251 Jardinc Matheson 1,770.500 .Jardine Stratcgic
10.450.000 Swirc Pacific '0'
India 321.600 Oil 8 Natural Gas 213,853 Sobha Developers
Malaysia 5.358.SOO AMMB
3.779.500 Public Bank (Foreign) 3,224,600 Taniong
22,287.300 Plus Exprcssways
New Zealand 4.030,340 Fisher & Paykel Healthcare 1,556.1 00 Fletcher Building
Philippines 9.873.900 First Philippinc
21 3,320 Globe Telecom
Sing a p o re 3.112.000 Asccndas Real Estatc lnvostmcnt
Trust 26,261.000 Cambridge Industrial Trust 15.607.000 CapitaCommercial Trust 1 6,4C5.000 Cityspring Infrastructure liusl 14.61 3.000 Fortime Heal Estate Investment Triist 20.01 1,000 Hyflux Water Trust
147.000 Rickmers Maritime 7.675.000 Singapore Press 3.742.1)00 Singapore Telecommunications 8,843.000 Suntec Real Estate Investment Triist 4.fA9.000 1101
South Korea 1.082.820 Korea Exchange Bank
971.110 KTRG
102,901,204 12.78 5.982.908 0.74 3.363.634 0.47
10,302.553 1.28 16.964.140 2.11 9.683.865 1.20 7.486.345 0.93 6.759.828 0.84
10,381,131 1.21) 1 1.550.1 15 1.43 70.4?3.685 ?.54
19,430,842 2.41 10,645,828 1.32 8.785.014 1.09
221,570,904 27.52 24.062.674 2.90 8.480.776 1.05 9,466,682 1.18
17.547.657 7.18 9.067321 1.13
11.5?8.?53 1.43 6.810.463 0.85
16.692.000 2.07 10.348.438 2.03 20.660.076 2.5/ 28,865,708 3.59 30,607,400 3.80 21.438.371 2.66
7,477,043 0.93 6,088,029 0.16 1.389.011 0.1 7
48,662,236 6.04 5.215.005 0.65
17.666.138 2.19 12,280,964 1 5 2 13,520,129 1.68
14,781,485 1.84 7,234,178 0.90 1.547.287 0.94
10,488,306 1.30 4.886.982 0.60 5.599.324 0.70
107,527,976 13.36
6,031.335 0.75 12,935,978 1.61 21,W 6.237 2.72 9,166,489 1.14 8,50R,497 1.06 9.Y30.835 1.23
122,128 0.02 8.358.453 1.04
10.096.783 1.25 8.842.025 1.10
11.671.218 1.44
33,a12,010 4.20 14,825.367 1.84 18386.643 2.35

Page 134 Schroder IrXernational Selection Furid Serni-Annual Report June 2008
I
Portfolio of Investments as at 30 June 2008 (cont) Schroder ISF Asian Equity Yield (c;ont)
Number of shares lrarister~ble Securities and Market 9; or Principal Moriey Market Instruments Admitted Value Net Amount to ari Ollicial Exchangc Listing USD Assets
Taiwan 2,826,000 Acer
1.21 6.97 I Chunghwa Telecom ADR 6,595,830 Far tastern Textile 6.354.1 GO Tar ras.rorie lelecommunications 1.482,688 Nan Ya Printed Circuit Doarti O,f3G.O00 lalwan Ccmcnt
9.701.000 TSHC
10,l 12,000 Asia Cement
18240,628 Taiwan Motlile
Thailand 2,713.800 Advariced Info Sen,ice (Foreign) 2.97S.200 tleclricity Cencrating
10.35:3,400 Kiatnakin Bank (Torely)) 080,YOO P V (roreigri;
5, /2!2.000 Ratctiahri tlectricity Ccinerating iforeign)
3,282.200 lisco Dank (Foreign)
Total Transferable Securities and Money Market Instruments Admitted to an Official Exchange Listing
Total Investments
Other Net Assets
Net Asset Value
129,604,482 16.10 5,566,355 0.70
15,151.8// 1.88 29.888.80D 3.71
7,289,893 0.91 10,098,471 1.23 /.323.07ii 0.91 8,981,660 1 .11
30.223.830 3.75 13,0Y/.C;00 1.88
38,890,860 4.83 7,500,045 0.!33 3 I327.917 0.10 (.i33.343 0.96 8.949.7fS I , 10
:.189.0Cd 0.8s 1 ,990.ijU7 0.25
r .I
735,145,328 91.31
735,145,328 91.31
69,921,186 8.69
805,066,514 100.00
Companies Schroder ISF Asian Smaller
-
Number 01 shares or Principal Arriount
Transferable Securifies and Money Markel lrislruments Admitted to an Official Cxcharige I isting
China 2.300.000 China Eastern Airliries H 1,050.000 Chiria Molybdenm 'H' 1.141.10i) 2.u70.000 Epure 1,185,000 Great Wall Autorriotlile 'H 1 ,~00.000 1 iciadmn I'owcr 2,830,000 Sharighai Forte Land 'H' 9.350.000 Un-President Ctiiria 1,800,000 Warit Want Cliina
Hong Kong SAR Y50.000 Agilc Property 400.000 China Agri-iridiistries 530.000 China Everbright 403,000 China Insurance
780,000 Giordano 680,000 GOME Electrical Appliances 778.000 Jiritiiii
1.700.000 Midland 7.1 10,000 Miriqyuari Medicaro Development 2,900.000 Minmctals Land 3,l 1 W O O Minmctals Resources 2 ,2?2 ,000 Prime Succcss
1 ,440.000 Shouqang Concord Iriterrialional
1,538,000 Chuang's Corisortiurri
10,400.000 Hexcapital Firi;incial
I l r iterprises 100.000 Television Rroacit
53,170,000 lown Health
India 1133,438 Fiolta lridia 20,171 Tata Tea
260,800 lJriiled Phosphorus
Indonesia !)ij,200.000 Ccntral Proteinaprirria
Malaysia 3.748.800 Rexit
1 ,054,800 Tradewinds Plaritaliorr 1 ,0:3/.t30(3 WC I
444.800 Surlwxy M y
Philippines 30.240 Philippine Stock Cxcharige
Singapore 2,713.000 ARA Asset Mariayerrierit 1,508,000 First Resourt:es 1 ,009.000 Godpack
1,22/,000 llriisteel lechnoloyy 450.000 SC Global Uevelopments
South Korea 4,000 L J CheilJcdang 9,000 I-iyuridai Departmcnt Store
21 369 Hyunlin Materials ld.OOO Jirisuriy LkC. 15.541 JVM 2.450 KCC
12.000 Kumho Industrial 34,460 I IG Non-Life Insurance 1.000 Lotte Shopping 8.500 Sarrisuri!] tngineering
10.000 Snmsuny Techwin 27.951 TK
Market 4; Value Net USD Assets
,651,619 14.31 122.519 1.35 896,642 1.68 ,221,828 2.29 ,040.400 1.95 785,533 1.47 306.200 0./4 805.551 1.51 .08/.754 2.03 692.388 1.29
I ,593,365 21.69 828,301 1.55 79.341 0.55
1.022,08/ 1.Y1 YB1.111 1.80 165.434 0.31 114.885 0.21 322,601 0.60 468.81'3 0.88 144.701 1.39 984,575 1.84 334.038 1.04
1.098./1 ; 9.05 1,227,939 2.30 1 ,040,120 1 3 5
170,824 0.88 676.990 1.08 71Y,8/2 1.35
3,112,998 5.82 1.048.095 1.96
354,908 0.8u 1 ,709,995 3.20
1,401,496 2.62 1.401.498 2.G2
4,405,867 8.24 1.789.787 3.35
359.371) 0.8/ 1.704,80r? 2.40
Wl.tlY5 1.89
552,908 1.03 552.900 1.03
5,915,115 11.08 1.41 1,399 7.64 1,2ti3.910 2.38 1.134.493 ?.I.?
400.323 0.75 1,701,981 3.1Y
8,444,747 15.79 1252,552 7.34
727.316 1.36 YS8.251 1.79 235.092 0.44 577.542 1.08
1.022.1 64 1.91 97r -jrr * I , > .m 0.51 821,964 1.54 297.204 0.56 ti35.008 1 , 1 Y 442,229 0.83
1 ,?00.072 2.21

Schroder lntcrnatrnnal Sclcction Fund Semi-Annual Report June 2008
Portfolio of I nvestrnents as at 30 June 2008 (cont) Schroder ISF Asian Smaller Companies (cont)
Nunitwr of shares or Principal Amount
Taiwan
Transferable Securitics and Money Markct Instruments Admitted to an Official Exchange Listing
577.900 Chicony Elet:troriics 409.197 Chroma ATF
1.465.424 Far Eastern Intcrnational Bank 137.100 lntcrnational Games :;:/stern 817,624 K Y t Syslems 180.000 Synnex Technology
Market Sh Value Net USD Assets
4,881,413 9.12 1.081.'390 2.03
855,863 1.60 4w.530 0.90
1.018.31 6 1 .YO 1.088.160 2.00
370,554 C.N?
Total Transferable Securities and Money Market Instruments Admitted to an Official Exchange Listing 47,959,528 89.68
Nurnbcr of shares Markct 55 or Principal Value Net Amount Dcrivativcs LlSD Assets
Singapore 56,726 0.11 308.525 Goodpack Warrants 1 fi!07:2009 56.726 0.11
Total Derivatives 56,726 0.11
Total Investments 48,016,254 89.79
Other Net Assets 5,459,181 10.21
Net Asset Value 53,475,415 100.00
Page 135
Schroder ISF BRIC (Brazil, Russia, India, China) Number of shares Transferable Securities and Market ?b or Principal Money Market lnstrumcnts Admitted Value Net Amourit to an Official Eichanae Listina USD Assets
Brazil 2,745.1 56 Banco Bradesco AUR 2,431.700 Bradespar Preference
439.900 Companhia de Rebidas das
1,685.100 Companhia de Concessoes
1.723.537 Companhia Eriergetica de Minas
3 , O l 8.1 48 Conipxihia Vale do Rio Doce ADR 1 ,969,480 Eletropaulo Metmpolitana de Sao
Americas AUII
I'lochviarias
Gerais Preference
822.400 Gerdau AUK
35/.100 Telc Norte Lestc Participaqdcs 388.500 lele Norte Leste Participaqoes ADR
431,543 Ultrapar ParticipaCOes Preference 5r6.400 Unibanco - Llniao de Rancos
4,726,828 Petrole0 Brasileiro ADR
1.357.175 1 irlr Participaqoes
F3rasileiros GDR 1 .i)33.500 Usinas Sidcrurgicas de Minas Gerais
309.900 Usinas Siderurgicas de Minas Gerais Prcference
1.856.336 weg
China 13.61 7.000 China Coal f.nergy 'H' 11.009.000 China Communications Construction
13,502.000 China Communications Services 'H' 97.371.000 China Construction Bank 'H' 11.261.000 China Natioval Building Material 'H. 27,502,000 China Petroleum & Chemical 'H' 9.976.000 China Shipping Development 'H'
22,574.000 Golden Eagle Retail 157.8G8.000 Industrial & Commercial Bank of
'H'
Chirva 'I I ' 3.003.500 Parksori Retail /.108,b00 Ping An Inswarice Group Co of
China 'H. 17,0f0.000 :.;irio-Ocex~ ILancj
Hong Kong SAR 4,740.000 Belling Enterprises 8,430,000 China Mengniu Dairy
12.37 1.000 China Mobilo 17.1 75,000 Ctiiria Uriiconi 52,834,000 CNOOC 83.264.000 Oenvb,ay Motors
India 780.521 Rharat Hcavy Electricals
1,599.881 Bharti Airtcl 784,l 06 Housing 13evelopment Finance 71b,l54 IClCl Rank
2,594,500 Infrastructure Development Finance 1.51 8.404 IVRCL Irifrastruc:tiires 8 Projects
295.193 Maruti Suzuki India 1.31 2.310 thnbaxy Laboratories
355,028 I Ieliance Industries 87 Reliance Indiistries GDR 144A
14 /.263 Roliance Industries GDR 144A
83G,351 Satyam Computer Services ADR (I uxemboiirg)
884,525,571 28.20 56,550,714 1 .A0 54.967.625 2.07
?7,8?3.675 0.89
33346.614 1 .OR
41,512,915 1.33 116.133.907 3.70
46,465,242 1 4 8 19.013.008 0.61
?67.680270 R 53 10.438567 0.33 17,184,960 0.55 6,11I,ti02 O l f i
16,493,952 0.53
73,i 16,340 2.33 49.37G.709 1.57
15,526,657 0.50 ?3.2?7.434 0.74
422,489,598 13.47 23,815,040 0.76
18,830.386 0.80 9.850.673 0.31
78,405.185 2.50 21,564,038 0.69 23,742,022 0.82 29.931.454 0.85 71,939,679 0.70
107.909.418 344 ?1.91?.676 0.70
52,664,177 1.69 9.6P4.700 0.31
360,556,884 11.50 15.497.942 0.19 23.887.756 0.76
166,234,668 5.30 31.889.382 1.02 90.912.064 2.90 32.135.072 1.03
180,435,462 5.75 25,007,309 0.80 26.800.933 0 85 35,783,316 1.14 3.149.229 0.10 6,339,937 0.70
10.710.470 0.34 4.227.180 0.13
15.R42.851 0.51 17,276,435 0.55
8.456 0.00
14,313,964 0.45 70,975,387 0.67

Page 136 Schroder Internatiorial Seleclion Fund Semi-Annual Heporl June 2008
Portfolio of Investments as at 30 June 2008 (cont) Schroder ISF BRlC (Brazil, Russia, India, China) ((:orit)
Number of shares Iraristerahle 3miritics and Mxkct y: or Priricipal Moncy Market lnstrumerits Adrriitled Value Net Amourit to an Official Exchange Listirig USD Assets
Russia 908,tiOO Lukoil AUH 493.700 Mechel A13H
1.471.230 MMC Norilsk Nickel ADR 2,023.30(5 Mobilc Telesysterris 155,900 Mobile Telesysterris A131
4.624.022 OAO G;liLprom ADR 3.8/1 .6:iO Rosrieft Oil GUIi
22.896.2/2 Sberbarik 508.001 Scvcrstal GER 470.800 Vinipcl-Communicatioris ADR
Total Transferable Securities and Money Market Instruments Admitted to an Official Exchange Listing
623,960,571 89.878.82il 74.043.1 90 :h5.998,449 23,924,941 33,407,701
2ti9.l 15.080 45.068.003 /2,:A<1 , I 82 13.202.94u 14.039,.?>6
19.89 2.86 0 . i B 1.18 0.76 1 13 8.38 1 .44 2.31 0.4% 0.45
2,471,968,086 78.81
Nurriber 01 stiare:: Market 46 or Principal Valuc Net Amount Uerivatives lJX1 Assets
Brazil 11 5,CY)/ MSCI Daily T l i Net t i r u i l Warrants
19 1,725 MSCl Daily TR Net Brazil Warrants 23;01;2009
15:04:2010
China 23.958 MSCl Daily TR Net Emergiri(j Markets
China LVarrarits 23:04,'2009 570.308 MSCl Daily TF Net I rrieryiny Markcts
China Warrants 11:00:2010 301,321 MSCl Daily TR Net Friieryirig Markcts
China Warrants 30:0d!2010
India 4.347.143 M X Uaily TR Net Emerging Markets
India Warrants 3 li07:2008 1,340,214 M X Daily I I i Net tmcfging Markets
India Warrants 30:10:7000 974.463 MSCl Daily TR Net Ernei-(]iri(j Markets
Iridia Vdarraritr; 21:l 1:20C8 18,154 MSCl Daily TR Net Errieryiny Markets
lridia Warrants 28;l 1'2008 1.444.370 MSCl Daily 1 I4 Ne1 tmerging Markets
India Warrants 09/04:2009 50,846 MSCl Daily TR Net Emergincj Markets
India Warrants 00:04:2009
Russia 40.997 M X Daily I I1 Net tmcfging Markets
Russia Warrarits 23:04:200'3 81.47 1 MSCl Daily TR Net Emerging Markets
I 4~1:jsi~ Warrants W3;08;2009
Total Derivatives
Total Investments
Other Net Assets
Net Asset Value
230,394,065 7.35
88,3Y4,019 7.76
144.000,048 4.59
130,501,753 4.15
1,8/7.390 0.25
24.044.185 0.78
WSY0,l 18 3.14
97,572,216 3.12
37.Ci85.801 1.20
1 1.185.634 0 3;
8,?93,G!37 0.2G
7.481.285 0.21
12.2ti2, /01 0.40
20,33S,0Y4 0.65
133,357,194 4.25
44,8X./69 1.43
8fC727.425 2.82
591,825,228 18.87
3,063,793,314 97.68
72,673,003 2.32
3,136,466,317 100.00
Schroder ISF China Opportunities Nurriber ut stiarti:: Transferable Securities arid Market Y2
or Principal Money Market Instrumcnts Admitted Value Net Ariini 1111 to an Official txt:hanue Listinu OS13 Aswts
Australia 3,483,010 Aluniiria
124.950 BHP Billiton
China i3.808,000 AAC Acoustic Technologjl
281 ,800 AirMecjia AUI 1 01,220,000 Apac Resources ij.6/5.500 Asia Ccmcnt China
&2,012,000 Oarik 01 China 'H' 3.370.500 Reijiriy Erilerpriscs 6,847,000 BYD Flectrtiriic:
8,490,000 Chiria Coal tncryy 'H' 17,795,000 Ccntral China Real F-sliile
24.075.000 China Corrirriuriicatioris Construction
32,844,000 Ctiina Communicatioris Services .t i ' 58,847,000 Ctma Construction Bank I I' 10.015.000 Ctiiria Hiyti Spccd Transmission
'H'
Equiprrieril 0.1 39.000 China Insurance 9,350,000 China Litc Insurance 'I 1' 8,885.000 Chiria Menyniu Uairy 3.L355.500 China Mert;harit:; 'dnnk 'H' 0.31 0,500 China Mobile 3.430.000 Ctiina National Building Material '1-1
17.808,000 China Oilfield Serwe:; H' 10,034,000 China Overseas L arid & Irivestnienl 41 ,030,000 Ctiirin Petroleum &Chemical 'H'
49.971?.000 (:him lclccoin 'H' 10.142.000 Chiria Unicorn 36314.000 CNOOG 14,BiiO.OOO Cripc I long Kong 8,344,000 Cosco International
24.R74.000 Dalian Port PDA I I' lY.230.001J Doriyleriy Motor 'H'
440.500 E-House Chiria 27.21 4,000 Fraristiiori Properties China
6,718.000 China Sherihua trieryy 'H
,000 GCL l'oly Energy ,009 Guanyilong Investment ,000 I lairiari Meilun International Airport
'H' 4.3/4.683 I IariyAiou Stcam lurbine
19, ;h5,000 Iiidili Industrd International C)evelopmerit
2ti,6so,ooo Huatjlan rwvcr 'H' 17,634,000 Huancng Power Internatiorial 'li. 1 .86i3.i310 tiuarigshwi lourism Developmcnt 2.605.094 Humin Cement 8i'.i309.000 Iriciiistrial B Commercial Rank of
Ctma 'H'
5,906.000 Lianhua Superrriarket ' t 1 20.530.000 PetroChina 'H' 10,470.400 Shandong Chenminc] Paper ti.~08,000 :;tiaricloriy Chcnming Paper 'H' 3. I Y Y . 0 0 0 Shariy:ii hidustrial 5.01 6,700 Shanghai Zherihua Pori Machinery
1,570,880 ZTE 'H' 1 8,000.000 7ijiri Miriiriy
Hong Kong SAR
4,OOti.OOO Shangri-La h i a
21,112,961 15,865,598 5.24 1.363
906,l 95,556 1 1,543,404 3.808.896 8.90/.669 4,305,338
18.092.1 1 1 11,020.214 4.0ii4.77n 5,316,299
14.848.329
41.093.652 23.9S2,042 4 7,384 8 4 1
70,069,051 19,410,624 32,756,780 25.1 77.072 1 2.476.761 84. /9/,015 6.59u.913
38,423,023 26.350.272 27.16'3.578 19,943,860 63.518.339 6,917.31 1 3,890,124
13,782,088 7 .G92,888 4,825,250
10.363.450 3.218.702
11.998.01 1
5,053,883 5,407.283
6.855,97B 598U,30ti
59,873,058 12,309,481
7.55/.523 76,594,556 8,872, 640 5.801.618
10.97fl1,5O7 7,289.265
13.6(31 ,xi9 1.533.037
17,329,359 3.2/1.904 4,703.043 9,318,412
1.99 1.50 0.49
85.58 1.10 0.36 0.05 0.41 1 . / / 1.04 0.38 0.50 1.40
3.88 2.26 4.47
1 .Y3
3.09 2.38 1.17 8.01 0.62 3.02 1.59 3.63 2.49 2.5/ 1 .88 6.00 0.65 0.36 1.30 0.73 0.44 0.?8 0.30 1.13
0.48 0.51
2.10 0.61 1.16 0.63 0.57
5.63 1.16 0.71 2.51 0.82 0.55 1.04 0.69 1.28 0.71
1.64 0.31 0.45 0.88
I .a3

Schroder International Selection Fund Semi-Annual Report June 20OR Page 137
Portfolio of Investments as at 30 June 2008 (cont) Schroder ISF China 0 p po rt u n i t ies (coni)
Numbct of shares lranslerable :;ec:iirities and Markct ?c
or Principal Money Market Iristruments Admitted Value Net Amount to an Official Exchanoe Ltstino USD Assets
Schroder ISF Emerging Asia
Number 01 shares Transferable Seciirities arid Market 9; or Principal Money Market Instruments Admitted Value Net Amount to an Official Exchanao Listino lJSD Assets
Taiwan 8,086.000 Chunghwa Telecorn
20,536,000 SirioPac Financial 12.959.000 Taiwan Cement
Total Transferable Securities and Money Market Instruments Admitted to an Official Exchange Listing
47,315,972 4.47 20.907.177 1.97 8,907.869 0.84
17,500,626 1.66
991,953,848 93.68
Nurriber of shares Market 46
or Principal Value Net Aniourit Derivatives lJSD Assets
China 24,815,749 2.34 21.996.000 China 50 FTr Warrants 10/06,2013 7.162615 0.67
03:06/2009 3,771,744 0.36
Warrants 78'1 2i2012 13,881.390 1.31
Total Derivatives 24,815,749 2.34
969,600 Guangzhou Friendship Warrants
11,567,825 Shanghai Tunnel hgirieeririg
Total Investments 1,016,769,597 96.02
Other Net Assets 42,115,037 3.98
Net Asset Value 1,058,884,634 100.00
Australia 3.531.210 Alumina
80.975 Incite(: Pivot 289.720 Rio Tinto
China 1 .I 05.1 00 AirMedia ADR 8.570.000 Anta Sports Products
77.57R.000 Aupii 6.822.000 Belle
22,326.500 BYV tlectronic Inlernatiorial 4,540.000 China Coal Energy 'H' G.403,000 China Communications Construction
'I I'
Fquiprrierit 3,288.000 China Life Insurance 'H' 3.752.000 China Narional Building Material 'H.
18.747.000 China Hioh Speed Transmission
17.754.000 China Telecom 'H' 15,844,000 Donyteny Motor 'H.
882,200 E-House China ADR 70,508.000 I lirltli Industry International
Uciscloprncnt 11 .612,000 Hiiarierig Power Iriterriatiorial .I I' 15,679.000 Industrial & Commercial Bank of
13.1 16,000 Zilin Miriing China 'H'
Hong Kong SAR 18.894.000 M C Acoustic Technology 7.482.001! Chen Hsony 3.50 1,000 Cheung Kong
5,376.000 China Mengniu Dairy 3.886.500 China Mobile A.?98.OOO China Unicorn
3.812.000 Hopewell 1.288.500 Jardine Strategic 3,045,500 Kerry Properlies /,5/0.000 Lung Kee (Bermuda)
16.1 17,000 China Infmslruclure Machinery
18.1 85.000 CNOOC
19,280,000 Mirig Ari 14.872 000 :;hanyri-l.:a Asia 3,704.500 Swire Pacific
India 443.450 Bharat Heavy tlectrical:;
2,322,513 Bharti Airtel 46fi.770 I inrc Rank
3.171.960 Hindustan Lever 177.490 lnfosys lechnologios
1.301,650 IVHCl Infrastructures & Projects 1.103,W5 Parsvnath Dcvclopcrs 1.045.097 Hanbaxy Laboratories
389.350 Reliance Capital 147.190 Reliancc Industrics
Indonesia 2,409500 Astra
15.R38.000 lridocemerit Tiriggal Prakarsa 11 , I 77.000 Telekomuriikasi lndoriesia
Malaysia 8.560.100 Bursa Malaysia
5.965.500 IJM 20,HXH,700 Genting
35.586.000 Samling Global 13.125.200 Sirrie Darbv Bhd
68,207,331 16.0fi5.l56 14.396.1 40 37,726,035
213,336,750 16,090,256 6,674,770
ti. 140.509 13,313.677 7.940.096
16,083,387
33.320. /68 1 1509.328 7,216.217 9.552.006 6.738.378 9,263.100
35.781.665 8,064,894
10.i15.220 11.149.887
331,114,750 15,795,269 3,194,607
47.179.1 75 14,982,274 15.233.758 52.224.641 15,406,270 31,291,136 13.539.049 22,162,200 20.71 6,265 3,445,718 3.358.541
34.705.338 37.880.509
154,083,838 14,207,806 38.906.34 1 10.6/5.796 15,261.2 13 19,261.51 7 9.181.538 3.967.567
12,6ati.272 8,164,549
21,751,239
23,707,261 5,029,044 9.831.827 8.846.590
103,535,293 14.Yf0.90Y 35,800,087 10,041,393 5,566,658
37.156.266
3.71 2.582
3.19 0 75 0.6/ 1.77
9.99 0.76 0.31 0.1 / 0.29 0.67 0.37
0.75
1.56 0.51 0.34 0.15 0.32 0.43
1 68 0.38
0.50 0.52
15.51 0.74 0.1 5 2.21 0.70 0.71 2.45 0.72 1.47 0.63 1.04 0.97 0.1 6 0.1 6 1.63 1.77
7.22 0.m 1.87 0.50 0.71 0.90 0.43 0.19 0.59 0.38 1.02
1.11 0.24 0.46 0.4 1
4.85 0.70 1.68 0.47 0.76 1.74

Page 138 Schroder Iriterriatiunal Selection Fund Scmi-Annual Repurl June 2008
Portfolio of Investments as at 30 June 2008 (cont) Schroder ISF Emerging Asia ( c m
Nurrlber 01 shares Transferable Securities arid Market % N.imber of shares Market B or Principal Money Market Instrurrierits Adrnittcd Yalue Net (11 I--’rincipal Operi-er ided Collective Value Net Amount to a r i Oflicial txchange Listing USU Assets Amourit Irnvcstment Schemes USD Assets
Philippines GG9.800 Globe Telecrm
7Gfl.580 Pliilippinc Long Distance Telephorie 9.392.600 Mctro Bank &Trust
Singapore 6.97T.000 CapitaLarid
103.000 Capital Wail China Trust .90ti,000 City neveloprrleril:;
3.00i,000 Keppel 6,287.000 Kcppcl Land
7,793,000 Yarilord Land 10.%01 .000 SerribCorp Industnes
South Korea 137.71 5 Uieil (:oirii~iuriicatiotis 801,040 Hsna Financ,al 21 1,214 Hana Tour Service 328,830 Hyundai Departrrierit Store 841.232 Hyiindai Dcvclopment 677.300 Kookmin Bank
2.837.880 Korea Exchange r.3arik 8.095 Korean Reinsurarice
147.020 KTBC
884.41 0 Sarnsurig (.;arc 220,380 Samsung Fire & Marine Irisiirarice
/i.Y00 FOSCO
44.390 Shinsegae
Taiwan 26.1 93,103 Adwriced Serriiconductor
t n yineering 8M.083 Catcher Tectirioloyy
20,922.707 Calllay Financial 19.585.000 Chunghwa Telec:orii
19,998,640 Far Eastern Textile 16.91)5,71‘6 Far EasTorie Te1ecoriirriunication:j
13.351.008 HON HA1 Precision Industry 40,7 1 (5.000 KGI Securities
605,000 MediaTek
405.000 Ctiurigtiw Ielecom ADH
1.754.550 Foxconn Tectirioloyy
1 .:3/9.480 I argali Pret:isiori
4,883.0ii2 Nan Ya Printed Cirt;iiit Bmrd 1 7,040,000 I;iliconware Precision Industries 2;,04H.000 SirioFac: firnancial 22,125,000 Taiwan Ceriierit 13,763,058 Taiwan Mobile 53.674 .8l 3 Taiwan Semicoriductor Mmilactuting
Thailand 8,583,800 Advanced Info Service (roreigrl) 1.003.300 Baripu
37.000 Haripii i k m g n j 4.972.400 Kasikornbank (Foreiyri) 3,299,800 Kiatnakin Rank 2,220,100 Kiatnakin Bank (Foreigri)
Total Transferable Securities and Money Market Instruments Admitted to an Official Exchange Listing
39,465,663 1 8.368,(580 8,894,801
1 4.202.1 82
153,813,690 29,238,ij13 12,Ol 8.16‘3 73.902.70ti 74.f2R.151 ZY28.330 31.199.518 10.599.603
372,625,704 32.585336 30.80G.601 8.197.433
26.573.70ti 42,532,162 39,936,208 38.854.flC3
93.068 12,d24.558 40,483,925 30,11iR,t331 45.943.16’4 73,044.fi43
546,518,256
23,551.88; 7,4til,897
4,5.484.118 50,974,150 9,946,800
28.032247 27.01 0,743 0.1 19.701i
53, /J3,600 29,838,459 17,t?2Y.462 ti.974.fi38
24.43 1,470 26,000.988 11.715:151 313,204,090 YS.BI 3 , rm
114.91 0.431
57,220,380 23. /22, i f31 16.877.379
605,859
4,70555: 1.858.2/d
1.85 Hong Kong SAR 12,755,830 0.60 0.86 836,000 Hang Seny Irivestrrieril Index Funds 12,755,630 0.60 0.32 0.6i Total Open-ended Collective
7.20 1.37 0.56 1 09 Total Investments 2,076,384,746 97.26 1.15 1.07 Other Net Assets 58,501,708 2.74 1.46 0.50 Net Asset Value 2,134,888,454 100.00
Investment Schemes 12,755,830 0.60
17.45 1.54 1.44 0.38 1.24 1 .Y9 1 8 7 1.82 0.00 0.59 1 90 1 :I 1 ?.I5 1.12
25.61
1 .OY 0 1 1 2.1 3 2.30 0.1 / 1.22 1.27 0.35 3.08 1.39 0.83 0.33 1.15 1.97 0.55 1 :12 1.20 5.33
2.68 1 1 1 0 71 0.03 0.50 0.22 0.08
2,063,628,916 96.66

Schroder International Sclcction Fund Semi-Annual Report June 2000 Page 139
Portfolio of Investments as at 30 June 2008 (cont) Schroder ISF Emerging Europe
Number of sti:ires Trarisferat)le :;et:iirities arid Market ?G Nurriber of shares Market :h or Principal Money Market Instruments Admitted Valuc Nct or Principal Value Net Amoiinl 10 an Official Fxctiarige I istirig CUR Assets Arriourit Derivatives ElJR Assets
Czech Republic 112,808 CEZ
5.881 Korriercrii Barika 70.982 Telefonica 02 Czech Republic
Hungary 70.794 Richter Fedeon 1 1,771 MOL Hiingarian Oil and Gas 1.400 MOL Hungarian Oil and Cas ADR 9.540 Mol t lurigarian Oil and Gas ADR
(I oridori)
Israel 7 13.059 Makhteshim Agan Industries
Poland 151 ,810 Bank Pekao
125.354 KGHM Polska Miedz 212.0'39 Polski Koncern Nallowy Orlen GDR 71 1 ,626 Powszechna Kasa Oszczednosci
95,400 Central Europcan Distribution
Rank Polski 1.085.615 lelekomunikacja Polska
Russia 467.300 crc M~CIIR 128,(ilO Lukoil ADR 179.200 Mcchcl ADr3 806.130 MMC Norilsk Nickel ADR 351,722 M(hle Telesystems ADR
36.050 NovaTek OAO GDR 804.215 OAO Garprom A1JR
1.900.100 Rosneft Oil GDR
272,598 :;everstaI GDR 310.259 Sistema GDR
76.782 Tatncft GDH
13.01 8.027 St)erbarik
1.775.0211 Surgtitneftegaz ADR r'rcfcrcncc
257.750 Vimpel-Conrniuriications ADR
Turkey 250.058 Anadohi Efes Riracilik Ve Malt Sanayii
551,822 Eregli Dcmir vc Cclik Fahrikalari 473.776 I laci Omer Sabanci
1,452,826 I iurriyet Gazetecilik 545,054 KO(:
1.098.351 Anadolu Hayat Emeklilik
74.817 CXokar Otobus Karoseri Sanayi 1.734.068 Tofas Turk Otomobil Fabrikasi
128.1 59 Tupras Turkiyc Pctrol Rafine 23,574 Tiirkcell Iletisim Hizrnet 193,300 Turkcell lletisim Hizmct ADR
2,427.152 Tiirkiye Garanti I3arikasi 355,161 Tiirkiye t lalk Rankasi
2.010.573 Turkiye Is Rankasi I
Total Transferable Securities and Money Market Instruments Admitted to an Official Exchange Listing
8,703,337 6,389,249
071 .8% 1,142.1Y2
4,321,225 2.850.934 1.003,816
59.695
2.95 Russia 7.1 6 0.30 0,49
I .47 0.97 Turkey 0.34 0.02
23,407,658 1.94
05:08/2009 11.214.612 3.80 16,257 Ciligroup Global Markets Warrants
17.575 MSCl Daily TR Net Emerging Markets Russia Warrants 23:04:200!1 12,19:3,04fi 1.14
5,369,898 I .e2 39.591 .IP Morgan International Derivatives
Warrants 12/12/2008 5,363,898 1.82
106.780 0.11 United Arab Emirates 4,410,350 1.50
4,208,424 1.43 1 2/01 :20 I O 4.1 10,350 1.50 4.700.474 143
Total Derivatives 33,187,906 11.26 36,802,992 12.49
1.487395 2 54 4,537,595 153 3.788 830 1 2') Total Investments 281,336,994 95.48 4.7f3.107 1 4 5
2,052,815 Aldar Properties Warrants
Other Net Assets G,841,449 3.34 A.RPS.616 7.34 Net Asset Value
168,972,978 57.35 7.334.983 2.49
26.839963 9 11 5,530.936 1 un
12.82/.295 4.35 17.180.520 5.83 1 .B67.008 0.67
79,695.976 10.08 14.697.055 4.99 76.187.245 8.89 4.495.018 1.53 5.91 1.289 2 01 4.166.850 141 7,355,951 2 50 4.i81.908 1.61
25,140,134 8.53 1.373.435 0.48 1,388,649 0.47 2.973.677 1.01
922.211 0.31 1,099,076 0.37
948.943 0.32 469.049 0.16
2.289.1 09 0.77 1,859.382 0.63 1.001.977 0.34 1.833.477 0.62 3fd7.173 1.24 1,104.175 0.37 4,229,678 1.44
248,149,088 84.22
13,310,817 4.52
294,647,811 100.00
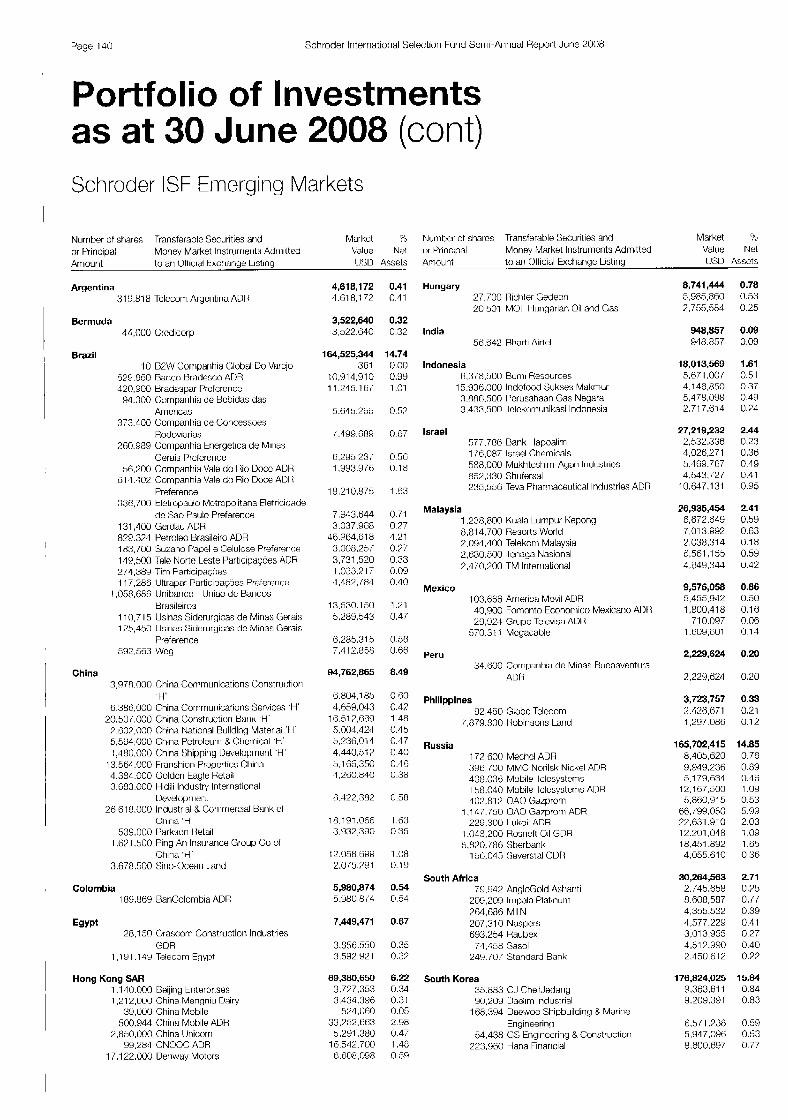
Page 140 Schroder Iriterriational Selection Fund Semi-Aririual Heport June 2C)O8
Portfolio of Investments as at 30 June 2008 (cont) Schroder ISF Etnerging Markets
Nurriber of shares Transterablc Securities arid Market ?> Numher ot shares Transferable Securilies arld Market ?G
or Principal Money Market Instrurrierit!; Adrililtcd Value N%t o r Principal Moriey Market In:;trumcnts Admitted Value Net
Amount to ari Official Exchange Listiny U:;D Axets Amount to an Ollicial Exchange Listing LJSD Assets
Argentina 319,818 Telecom Aryeritirta AUII
Bermuda 44,(100 Crcdicorp
Brazil 10 B2W Corriparihia Global Do Varcjo
529.050 Rarico Bradesco ADR 420,500 Bradcspar Preference 94.31)O Corripiritiia de Hcbidas das
373.400 Companhia de Concessoes
?60.989 C;ompanhia Energetica de Mirias
Amcricas
Rodoviarias
Gerais Prcfcrence 56,200 Comparitiia Vale do rib Docc ADR
6 14.402 Companhia Vale do Rio Doce ADH
330,700 tlehopaulo Mctropolitana Eletricidade
131 ,400 Gerdau ADR 820.374 Petroleo Brasileiro ADR 183,700 Suzano Papel e Celulose Pi-efererice 149,500 Tele Norte Leste Participarpes ADR
Preference
de Sao Paulo Preference
1 .05O,68ti LJriitxirico I h a o de Bancos Hr. - &I eiros
1 10,7 15 Usinas Siderurgicas de Mirias Germ 175,450 Llsirias Sichurgicas de Minas Gerais
Preference 592.563 wcy
China 3.97R.000 China Communications Coristructiori
8,38ti.000 China Corrirriuriicatior-is Services 'H'
7.607.000 China National Building Materia, '1 I 5,584,000 China Petroleurri 8 Chernicol 'H' 1 ,.l80.000 Ctiiria Shippirig Ilevelopinent 'H'
13,584,000 Franshion Praperties C:tiirna 4.384.000 Coldcn Eagle Retail 3.G53.000 Hidili Industry Iiiternational
Developrrieril
Cthria 'H
'H'
20.50, ,000 China Coristructiori Barik 'H'
25,518,000 Industrial & Corrirriert:ial Uarik 01
539,000 Park;ori I letnil 1 .ti21 .dIO Pirig Ari lrisiirarice Group Co of
3.678.600 Sirio--Ocean I.and China 'H'
Colombia 189.889 RanColombia ADR
Egypt 28,150 Ora:;com Construction Industries
GDR I , 19 1.149 Teleconn Egypt
Hong Kong SAR 1.140.000 Deijiriy triterorise:; 1,2 12.000 China Mengniiu Dairy
500.944 Ctiiria Motiile ADH 39.000 China Mobile
2,850,000 China Uriicorri 99.284 CNOOC ADR
17,l 22,000 Deriway Motors
4,618,172 4,618,172
3,522,640 3,322.840
164,525,344 361
10.514,9 10 1 l.245,16(
5.843255
i.499.c1119
8.2'35,23,' 1.993.97t7
18,210.R75
7 ,PJ13.644 3.037.908
46.964.818 3.008.25/ 3,731520 1 .0:33,P17 4 ..182, /84
13.530.150 5289.533
8,285.315 7,4 12.838
94,762,865
U.804.18b 4,659,043
16.51?.0ij9 5.004.424 3,236,014 4.440.517 3,185,350 4,230.840
13,422,382
18.191.056 2,390
12.058.899 2.075.791
5,980,874 5.980,3/4
7,449,471
69,380 3,777 3,433 524,060
33,752, f f3 5.291.380
16.542.700 6 .608, 093
0.41 0.41
0.32 0.32
14.74 0.00 0.99 1.01
0.57
Hungary 27.700 tkhler Gedeon 20,501 MC)I I lurigarian Oil and Cas
India 58.542 Rhart Airtel
Indonesia 6378,500 Bum Resources
15.936.000 lndofood Sukses Makmur 3,880,500 I 'crusahaan Gas Negara 3.433.500 Iclckonnunikasi Indonesia
0.c: Israel
0.58 0.18
1.53
577.786 Bank Hapoalim 1 /6,087 Israel Chemicals 588.000 Makhteshirn-Agar1 1ridiistrie:j 852,330 Shufersal 295,556 Teva Pharrriaceulical Industries ADR
Malaysia 1,238,400 Kuala Lumpur Kepong 8.01 4.700 Fiesorts World 2.oY4.400 Telekorri Malaysia 2,830500 lenaya Nasional 2,4 /0.200 TM Iriterriational
0.27 4.21 0.77 0.33 0.09 c.40
1.21 0.47
0.56
Mexico 103,666 Arrieric:ti Movil ADR 40.900 Fomcnto Econorriico Mexicano A13L 25,W.l Grupo Televisa AD1 i
570.31 1 Megacable
Peru U.di?
8.49 34.800 Corriparihia de Minas Bucnaventura
Allt i
O."O Philippines 0.41 92.450 Globe Telecom 1.43 0.45
/,879.900 I Iobinsons Land
0.47 0 40 0.40 0.38
0.58
1 .ti3 0.35
1.08 0.19
0.54 0.54
0.67
0.35 0.37
Russia 172,600 Mechcl ADR 396.700 MMC Norilsk Nickel ADR 43t3.03C Mobile lclcsysterns 138.040 Mobile Iclcsystenis AOR 402.81 9 OAO GaLprom
225.300 I ukoil ADR 1 , I 47.750 OAO Ga7prw1i ADFi
1,043,200 Rosneft Oil GDFi 5,W0,/8fi :;t)erbarilc
1 bd,045 :;evert;tal CUH
South Africa 79.942 AngloGold Ashariti
209.209 Iriipala F'latinum 264,686 M1-N 207,310 Naspers 893,254 Raubex
74.458 Sasol 249.70: Standard Bank
6.22 South Korea 0.34 35.883 CJ CheilJetlariy 0.31 90.209 Uaclinn Industrial 0.05 2.38 Engineerinq 11.4: 1.48 223.580 Hana Firiaricial 0.53
108.394 Daewoo Shipbuilding & Maririe
54.438 GS Engineering & Constructiori
8,741,444 0.78 5.985.860 0.53 7,755,584 0.25
948,857 0.09 948.857 0.09
18,013,569 1.61 5.8/1 ,00/ 0.51 4,146,830 0.37 5,478,098 0.49 2,717614 0.74
27,219,232 2.44 2,532.336 0.23 4,028,271 0.36 5.469.767 0.49 4,643,727 0.4 1
10.047.131 0.95
26,935,454 2.41 8,872,848 0.59 7,013.892 0.63 7,030,314 0.13 3,561,153 0.59 4,649,344 0.42
9,576,058 0.86 5,455,942 0.50 1,800,418 0.18
710.097 0.06 1 .809.801 0.14
2,229,624 0.20
2.22L3.621 0.20
3,723,151 0.33 2,426,671 0.21 1,297.086 0.12
165,702,415 14.85 8,405,620 0.76 9,919,238 0.89 5,179,634 0.46:
12.167.500 1.09 5.850.915 0.53
66./Y9.050 5.9s W,ci:jl,910 2.03 12,201,048 1.09 18,451.892 1.85 4,055.610 0.36
30,264,563 2.71 2.145.658 0.X 5,608,587 0.// 4,355,532 0.39 4,577,229 0.41 3.01 3.955 0.27 4,,517,990 0.40 2,450,812 0.77
176,824,025 15.84 9,363,611 0.84 9.209.391 CJ.03
ti,5/1.738 0.59 5,947,096 0.53 8.600.6U7 0.77
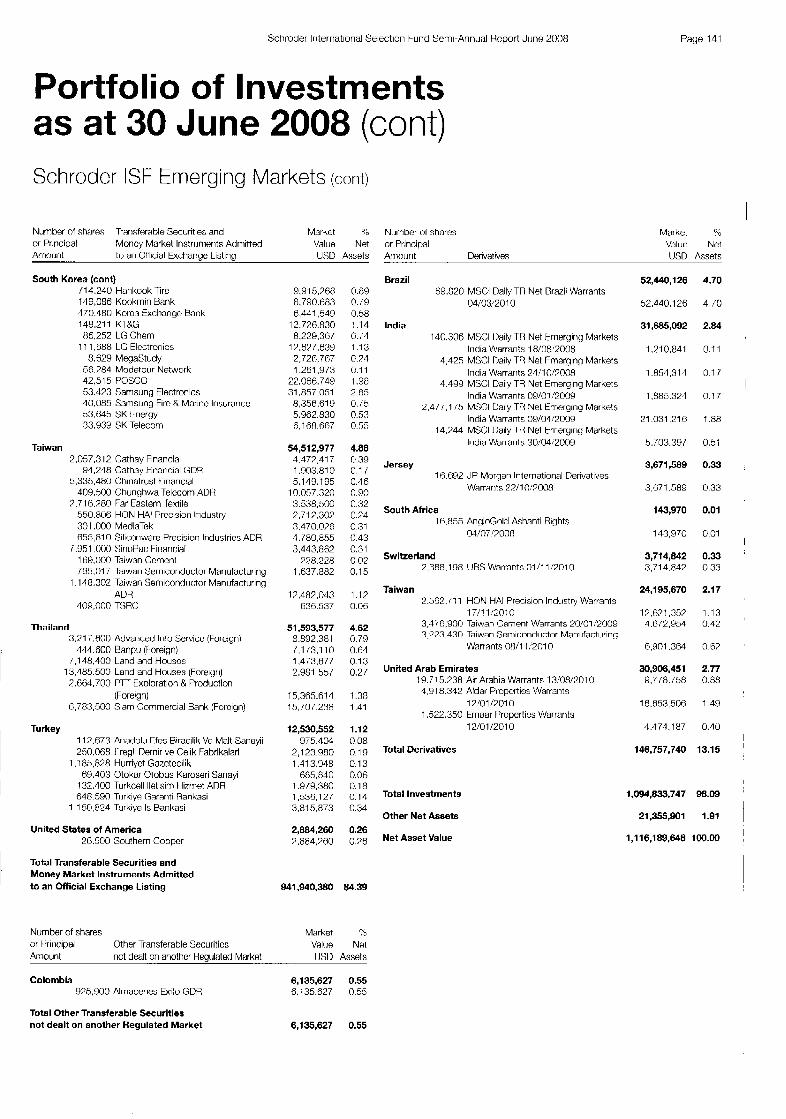
Sctiroder Iriterriatiorval Selection Fund Semi-Annual Rcport June 2008 Page 141
Portfolio of Investments as at 30 June 2008 (cont) Schroder ISF Emerging Markets (cont)
Number 01 shares Trarisferable Securities and Market 4b Number of :;hare:; Market 0.6 or Principal Moncy Market lnstriinierits Admitted Value Net or Principal Value Net Amount to an Official Exchange Listing USD As:;els Arrioiint Derivatives USD Assets
South Korea (cont) 114.240 Hankook Tirc 149,086 Kookinin Bank 470.180 Korea Exchange Bank 148.211 KTRG
1 1 1,688 LC Elcctronics 8.629 MegaStudy
86.252 LG Chem
66.784 Modetour Network 42.515 POSCO 53.473 Samsung Electronics 10.085 Samsung Fire & Marine lrisiirarice 53,645 SK Fnergy 33.93s SK Telecom
Taiwan 2.057.312 Cathay Financial
5,335,480 Chiriatrust Financial 91.248 Cathay Financial GDR
409.500 Chunghwa Telccom AVH
550.806 HON HA1 Prccision Industry 301.000 MediaTek 855.810 Silicori,Jvare Precision Industries ADR
r.951 ,000 SinoPar: Financial 1 ti9.000 Taiwan Ccmenl 755.01 7 Taiwan Serriiconductor Manufacturing
1 ,148,302 Taiwan Seniic:ondiic:tor Manufacturing
P,Tlfi.780 Far Eastern [extile
ADR 409,000 TSRC
Thailand 3.71 7.600 Advanced Info Sewicc (Forcign)
444.600 Hanpii iforeigrr) 1,138,400 Land and Houscs
7.6fjA.700 PTr Exploration & Production
6,743,500 Slam Commercial Bank (Forcign)
13.485.500 Land and Houses (Foreiyi)
(Foreign)
Turkey 112,873 Ariado1i.i rfes Biracilik \/e Malt Sanayii 250.088 IFregli krr i i r ve Celik Fahrikalari
69.403 Otokar Otobus Karoseri Sariayi 1,183,828 Hurriyet Gazetecilik
132,400 Turkcell Iletisim t lizrriet ADR 648.590 Turkiye Garariti Rankasi
1 .I 50,824 Turkiye Is Rankasi
United States of America 26.500 Sou?hern Copper
Total Transferable Securities and Money Market Instruments Admitted to an Official Exchange Listing
Number of shares of Prirrcipdl Other Transferable Securitics
R.915.?68 8.790.683 8,441,549
12.776.fl30 8.229.36/
17.677.639 2,726,787 1.261,973
22.066.74G 31.857.051 8,356,619 5.962.830 8.1 RR.RR7
54,512,977 4,477,417 1.903.81 0 5.119.195
10.057.320 3.538.500 P,il 7.307 3,470.076 1,180,855 3,443,862
P78.228 1.637.882
17,482,043 636.537
51,593,577 8.8'32.381 1.1 i3.110 1.473.677 2.981.55/
15.365.61 4 15.707.238
12,530,552 075.404
2,123.980 1.41 3.948
fN6,H40 1,919,380 1,535,127 3.815.873
2,884,260 7.884.760
0.89 0.19 0.58 1.14 0. I 4 1.13 c.34 c.11 1.98 2.85 0. i5 n.53 0.55
4.88 c.39 c.1 1 0.46 0.90 0.32 0.74 0.31 0.43 0.31 0 02 0.15
1.12 0.06
4.62 0.79 0.61 0.13 0.2 1
1.38 1.41
1.12 0.08 0.1 fl 0.13 0.06 0.18 0.14 0.34
0.26 0 76
941,940,380 84.39
Market '3 Valiie Ne1
Amount not dealt on another R q i i l a t d Market IJSO Assets
Colombia 975.900 Almacenes Exito GDH
Total Other Transferable Securities not dealt on another Regulated Market
6,135,627 0.55 6,135,827 0.55
6,135,627 0.55
Brazil 69.820 MSCl Daily TR Net Rr,uil Warrants
04/03:2010
India 140.306 MSCl llaily Tri Net tmerging Markets
India Warrants 18/08:2008 4,425 MSCl Daily Tn Net Fmergincl Markets
I r i h Warrants 74:l 0:700R 4.499 MSCl Daily TR Net Emerging Markets
India Warrants 09/01 :2009 2,477.175 MSCl Daily Tri Ne! Emerging Markets
India Warrants 0P/W12009 14.744 MSCl rlaily I I1 Net F'merging Markets
lridia Warrants 30/04;2009
Jersey 16.692 JP Morgan International Derivatives
Warrarits 22:10:7008
South Africa 1 (i.855 AngloGnld Ashanti Rights
04!07/7008
Switzerland 2,388,195 IJBS Warrants 01~11:2010
Taiwan 2582.11 1 HON HA1 Precision Industy Warrants
3,476,900 Taiwan Cement Warrants 20:01:2009 3.223.430 Taiwan Serriic:cmrliictnr Manufactiiring
17/11/2010
Warrants O X i l 1:2010
United Arab Emirates 19.i15238 Air Arahia Warrants 13:08/2010 4.9 18.342 Aldar Properties Warrants
1.522.350 Emaar Propcrtics Warrants 13/01,'3010
1 2!0 1 E01 0
Total Derivatives
52,440,126
52,440.1 26
31,685,092
171 0.841
1 ,854,314
1,985,324
21.031.218
5. /03.38/
3,671,589
3,871,589
143,970
143.970
3,714,842 3,714.847
24,195,670
17.6?1.35? 4,672,954
6.901.364
30,906,451 9. - /1a .m
16,653,608
4.471.187
146,757,740
Total Investments
Other Net Assets
Net Asset Value
1,094,833,747
21,355,901
4.70
4 / 0
2.84
011
0 1 /
0.17
1.88
0 51
0.33
0 33
0.01
0 01
0.33 0 33
2.17
1 1 3 0 42
0 67
2.77 0 88
1 49
0 10
13.15
B8.09
1.91
1 ,I 16,189,648 100.00
I i
I
I
I
I I
I
! I
I

Page 14% Schroder lriterriatiorial Selection Fund Semi-Aririual Report June 2008
Portfolio of Investments as at 30 June 2008 (cont) Schroder ISF European Dividend Maximiser
Number of shares Trarisferable Securitics and Markct % or Priricipal Money Market lnstrumerits Adrr:illed Value Net Amount to ari Official Exchange Listing EUR Assets
Austria 1 1.436 0esterrw;tiisctie Posl
Belgium '3,933 Bclgacom 4.881 l r i k v 4.71 B KBC Groep
Cyprus 45.082 ProSafo
Czech Republic 16.226 Teleforiica 0; Cm;h ljepuhlic
Denmark 14,346 Oanske narik
Finland 13.224 rortllrll 6.818 Metso
14.883 Sanoma-WSOY
France
6.946 Suez 8.059 Iota1
17,341 Viveridi
Germany 6.012 BASF
2,396 Munchener Riickversic:herunys 4.217 I l W t
I ti.960 neutschc r w
Greece 15.31 3 EFC Eurobank Frgasias
Ireland 2C,049 Allied Irish Banks 28,830 Dank ot Ireland 7241 6 Independent News & Media
Italy 32.467 Encl 13.9W FNI
65.8 18 UniCredit 2.452 Intesa Sanpsolo
Netherlands 4.8% Akzo Notxl
12,826 ING Groep 13,458 Royal r)ut(;fi :;hell
14.120 (Iriilever
Norway 38.1 76 DnB NOR
1.493 Statoill lydro
Spain 20.094 Banco Santander 10,13/ Repsol YPF 15.41 9 Teleforiica
Sweden 77,275 C;kan:;ka 25.25p Svenska CeI I~k~si l 12.207 Svenska t4andelst);lrikeri
278,467 1.74 77R,407 1.71
783,375 4.88 2/2,810 1.70 213885 1.33 296.ij80 1.05
299,331 1.87 229.331 1.87
329,675 2.05 399.975 2.05
264,485 1.65 704.485 1.65
827,165 5.15 418804 2.61 194.790 1.21 21 3.571 1.33
1,424,878 8.88 134.090 0.90 ?40.f49 1.50 797.63f-j 1.85 436,012 2.7? 296,431 1 65
1 , I 66,874 7.27 2ti3,44R 1.64 2i8.222 1.74 788.4fi8 1.80 335.968 2.02
232,145 1.45 232,145 1.45
477,190 2.97 195.478 1.22 160,20ij 1 .00 l?l,XJti 0.75
1,060,012 6.61 198.039 1.24
1.0'34 2.06 1.371 1.63
2ii3.493 1.68
1,717,338 10.70 209.786 1.31 757.033 1.60 348.789 2.17 325.082 7.03 323.333 7.01 253.315 1.58
488,329 3.04 31 1 , l / 3 1.94 177.158 1.10
749,527 4.67 235.100 1.37 255.351 1.59 259.076 I .61
Nurriber oI :;hares Transferable Seciiritie:; nnd Market "k
or Principal Moriey Market Instrrimcnts Admitted Value Nct Arwir i l to an Official Fxchanue Listino FIJI4 Assets
Switzerland 1,242,975 7.75 8,327 Credit Suisse Registeretl 241.209 1.50
410,034 2.56 11,430 Novartis Hegislered 401.942 2.51 1.52; Swiss Reirisurance Registered 189.770 1.18
14,2G0 Nest16 Registered
United Kingdom 12,464 AstraLeneca 75,318 Aviva 12.690 Rrilish American Tobacco
22.51 6 Uiageo 32.303 GlaxoSniithKline 18,l 25 Imperial Tobacco :33.081 National Grid
1iX.489 Old Mutual 30.786 Pearsori 51.921 Rcxarn
100.41 5 Vodafonc
103,856 BT
Total Transferable Securities and Money Market Instruments Admitted to an Official Exchange Listing
3,349,820 335,843 165,597 276.719 261.875 33.435 158,025 42?.5MJ 273.651 193./38 238,117 253,332 202.178
20.87 2.09 1.03 1./3 1.63 1.64 2.05 2.66 1.71 1-21 1 .A8 1.58 1.20
15,304,892 95.37
Total Investments 15,304,892 95.37
Other Net Assets 742,648 4.63
Net Asset Value 16,047,540 100.00

Schrodcr lntcrnatinnal Sclectinn Fund Semi-Annual Report June 2008 Page 143
Portfolio of Investments as at 30 June 2008 (cont) Schroder ISF European Equity Opportunities
Number of shares Transferable Securities and Market Cb Number of shares Trarisferat)le Seciirities and Market % or Principal Money Market Instrunierits Adrriitted Value Net or Principal Money Market Instruments Admitted Value Net Amount to an Official Exchange IListirig EUR Assets Amount to an Official Exchange Listing t l J l 1 Assets
Belgium 80.000 Nyrstar
Cyprus 76.200 Bank ot Cyprus
Finland 10,750 Fortum
13.300 rnr 5,680 Latargt? 6.500 SeLoger.com 9,160 ::lie2
18.500 Total
France
Germany 14,000 Dayerische Motoren Werke 13,000 Beiersdorf 6.810 Continental 4.900 L O N 2.500 Ilatiorial
33.000 Symrise 23,000 Wackcr Construction Eqiiipemerit
Greece 37.685 EFG Eurobank Ergasias 11 . W O Folli - Follie
Ireland 55.800 Anglo Irish Rank 27,800 Bank of Ircland
Italy 10.000 Uioxell 60,000 Hulgari 14.810 Fiat
Netherlands 20,800 ING Groep 23.780 Royal Diitch Shell 10.060 Smartrac 7,000 TornTom
Portugal 107,799 Banif 1 50.000 Some 20.000 Sonac Capital
Spain 13.000 Clinica Bavicra 25,000 EDI-' Henovaveis
Switzerland 15,700 Actelion Registered 22,420 Adecco Registered
20.000 Credit Suisse Registered 15,500 Nestle Registered 8,000 Newave Energy 5, (54 Partners Registered 4,900 Hoche
1 8,4t30 Ternenos Registered 9,950 Wiriterthur Technologie Registered 4.540 Zurich Financial Services
2.310 Basilca Pharmaceutica Hegistered
672,600 3.22 United Kingdom 672,600 312 ?0.000 r3G
598,932 2.86 17.400 Reckitl Berickiser 598,232 2.86 10,900 Hio I into
340,453 1.63 21,000 Unilevcr 310.153 1.63
14.560 Dana Petroleum
140,000 Royal Bank of Scotland
2,824,185 782,01 5 544.314 94.315
3'32,505 1,001,035
3,081,384 426,860 603.590 43 /34? 624.407 31 0.125 462.660 P I 8.700
13.50 Total transferable Securities and 3.78 Money Market Instruments Admitted 2.60 to an Official Exchange Listing 0.45 1.88 1.79
14.73 Total Investments
2.04 Other Net Assets
2.09 Net Asset Value 7.99 1.18 2.21 1.03
2.89
790,331 3.70 571.305 7.73 219.026 1.05
495,925 2.37 341.496 1.83 154.4?9 0./4
684,417 3.27 14.5,645 069 384.800 1 84 151.172 0.71
1,364,573 6.52 416.832 1.99 616,303 2.95 707.538 0.99 123.900 0.59
343,238 1.64 194.038 0.93 123.200 0.59 28.000 0.12
311,780 1.50 130.780 0.63 181.000 I).H7
5,282,945 25.26 535,011 2 56 705.101 3 3 / 740,896 1.15 579,313 2.77 445.710 2.13 241.994 1.16 504.973 ?.42 553.544 2.65 357.719 1.71 383.657 1.83 734,fK 3.51
2,808,484 13.43 325.058 1.56 348.0t38 1 6 6
827.628 39R 375.851 180 375,055 1.71)
556.814 2.66
19,599,247 93.71 I
19,599,247 93.71 ,
1,316,521 6.29 I
20,915,768 100.00
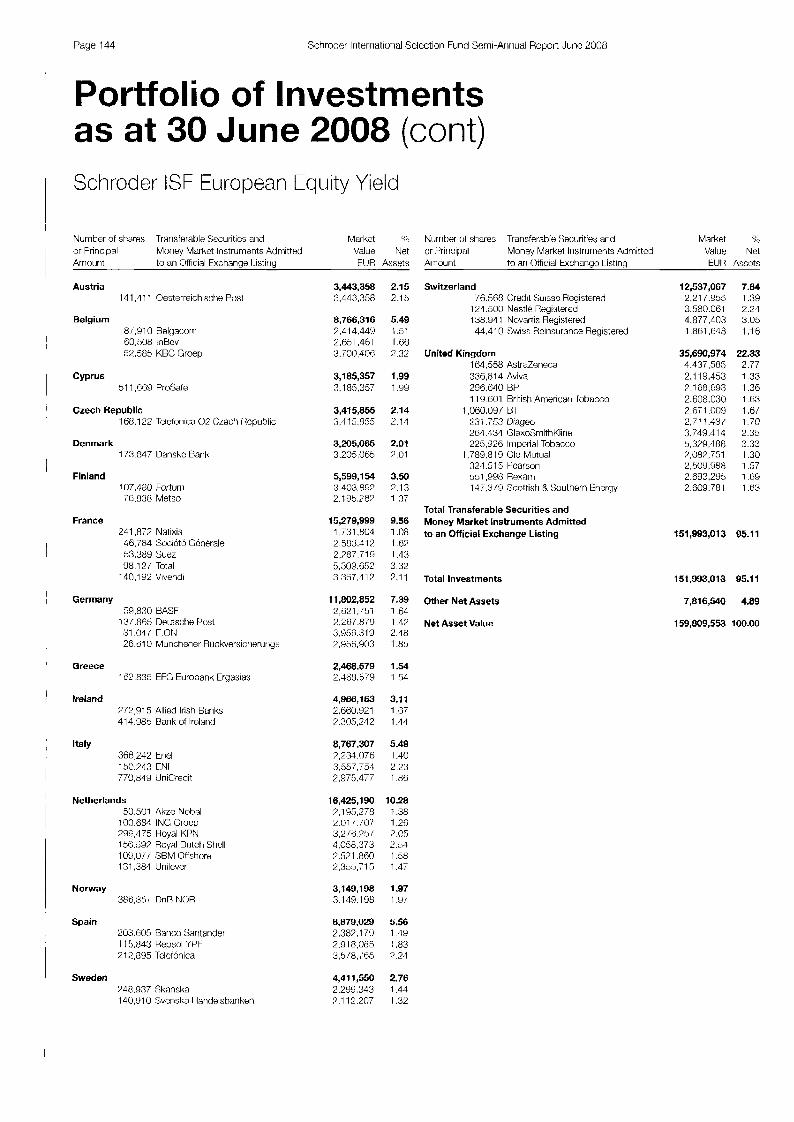
Page 144 Sclirodor Iriterrialiunal Selection Fund Scrrii-Aririual Report June 2008
Portfolio of Investments as at 30 June 2008 (cont) Schroder ISF European Equity Yield
Number of shares Irarislerahle Securities an3 Markct S; Nurritier 01 shares Transferable Securities and Market 90 or Princiual Monev Market Instruments Adriiitted Value Net or Priricinal Monev Market Irislrunients Admitted VdlUt. NRL
~
Arrioiirit to an Official Exchange IListiriy ELIR Assets Ar:iount to ari 0tfic:ial txctianyc Listinq
Austria 1.1 1.4 11 Oesterreictiisshe Posl
Belgium 8i.910 Relgacorri 80.508 InBev 52,585 KBC Groep
Cyprus 51 1,869 ProSale
Czech Republic 168.122 Teleforiica 0 2 (:Lectl licpuhlic
Denmark 173.847 Uanskc Hank
Finland 107..180 Fortum 78,838 Metso
France 241.872 Nalixis 48.784 Socictc Ccnerale 53,389 Suez 98.12/ Total
140,l 92 Vivendi
Germany 5<!,830 BAASF
31.04/ T.ON 26,610 Munchener Ruckversictieriiriys
13/.85S nel.ltsctle P0:;t
Greece 162.835 EFC Eurobank Erqasias
Ireland 772,915 Allied Iristi Banks 414,983 Barik of Ireland
Italy 368,242 triel
770,849 UniCredtt 13P.743 ITNl
Netherlands 50.501 Akzo Nobel
100.884 INC Croep 29G,475 Hoyal KPN 156.597 Royal Uutcti Sticll 102.U// SBM Offshore 131.381 Unilcver
Noway 38rj.35; DnR NOR
Spain 203.605 Darico Saritander 11 5.843 Hepsol Y P I 21 2,895 Tclcfonica
Sweden 748.937 Skanska 140,910 Senska I laridelstxiriken
3,443,358 3,443,358
8,766,316 7.414 449 2,651,461 :3.700,40B
3,185,357 3,185,357
3,415,855 3,415,855
3,205,065 3.205,065
5,599,154 3,403,897 2,195.TG7
15,279,999 1,731.804 2.583.412 2.?87.71<4 5,309,452 3.367,112
11,802,852 2,s21.:51 7.2ti7.879 :3 ,!-35ti.319 2,S56.903
2,468,579 2.-1e~s.i<)
4,966,163 2.6ti0.921 2,305,242
8,767,307 7,234,076 3.557.75.1 2,u75.477
16,425,190 7,1 !X,278 2.01 1.107 3.2/d.75/ 4,058373 7.5?1.8t?O 2,355.715
3,149,198 3.149.158
8,879,029 7.387.1 75 2.Y 18,085 3.5/8.,‘56
4,411,550 2,239,343 ?,I 12.207
2.15 2.1 5
5.49 1.51 1 .GG 2.32
1.99 1 .Y9
2.14 2.11
2.01 7.01
3.50 2.13 1 3 7
9.56 1 .U8 1 .G? 1.43 3.32 2.1 1
7.39 1 64 1,12 2.48 1.85
1.54 1 54
3.11 1.67 1 .I4
5.49 1.40 2.23 1.85
10.28 1.3s 1.26 2.05 2.54 1.53 1.47
1.97 1,9/
5.56 1.4Y 1.83 ?.24
2.76 1.44 I ,32
Switzerland 16.560 Credil C;uissc Registered
124.500 Nestlk Registered 138.94 1 Novartis Reyistered 34.41 0 Swiss Reinsurance Registered
United Kingdom l(i4.558 Astrderiecd 336-3.814 Aviva 296.610 BP 1 It).601 British Arriericari k)hacco
1 ,060.097 DT 231.763 ulqeo 261.134 Glaxo:;niittiKlirie 225,926 Imperial Tobacco
1.78y.815 i31d Mutual 324.51 5 I-’carson 331.99t3 Rexarr.i 14/,3/9 Scottish 8 Soulhern Encrgy
Total Transferable Securities and Money Market Instruments Admitted to an Official Exchange Listing
Total Investments
Other Net Assets
Net Asset Value
ElJli Assets
12,537,067 7.84 2.217355 1.39 3.580.081 2.21 4,877,403 3.05 1.881.648 1 . I 6
35,690,974 22.33 4.437.585 2.77 2.119.453 1.33 ?.108.693 1.36 2.F08.030 1 .63 2.671 ,009 1 .6/ 2.711.18/ 1.70 3.749.414 2.35 3.379.4t38 3.33 ?.08>,751 1.30 2.50Y.988 1.57 2.693.295 1.69 2.009.78 1 1 .63
151,993,013 05.11
151,993,013 95.11
7,816,540 4.89
159,809,553 100.00

Schroder International Selection Furid Scmi-Annual Report June 2008 Page 145
Portfolio of Investments as at 30 June 2008 (cont) Schroder ISF European Smaller Companies
Number 01 shares Transferable Securities and Market l o
or Principal Money Market Instruments Admittcd Vahs Net Amount lo an Official Exchange Listing EtJL Assets
Austria 155,000 Kapsch TraiiicConi
Equiprncnt 82.800 Schoeller-Bleckrnann Oilficld
Belgium 22,055 EVS Broadcast Eqiiiprrierit
895 kluxy:;
Denmark 192.7R7 Irigori Agri 66.000 TrygVesta
Finland 637.255 leleste 470.000 YIT
France 12.168 Altamir Amboisc
177.000 f3ourbon 212.917 Carrere
37,500 Gucrbct 18.000 tiuyeririe et Gascogne 67,800 Ipseri 76.190 Les Nouveaux Constructeurs
lnvestissement 171.000 Nexity 74.840 Rutiis
261.718 Saft 85,926 Sporevct
279.676 Store tleclroriic: 2fS.337 Sword 93.454 Virbac
Germany 46.000 Bilfingcr Rerger
199.770 casti.life 27.187 I lawesko
400,000 IDS Scheer 23.451 Invision Software
262.000 MTU Acro Engines 170,400 W~einrnetall 136,10R steico
Greece 380.000 Hahis Vovos lriternational
1 81.500 Greek Postal Swings Bank 185.000 JUMBO
Construc:tiori
Ireland 450.000 DCC
Israel 466.000 Oridiori Systems
Italy 642.081 ACEA 830.000 A7ir1iiit
4.445.000 CIH-Compagnic lndustriali Hiunite
Luxembourg 407.81 0 Transcom Worldwide
Netherlands 28.600 Accell
41 0.000 Arcadis 11 8,000 Fugro 693.480 lnnosoncepts 259,344 X3M Offshore 164.000 Smartrac 324,141 Tcn Catc
10,071,248 1.5/2.50(1
5,498,748
3,394,209 1,239,048 2.1 55.1 60
3,263,666 28 1.430
2.982.22 1
10.665,012 3,151.1 12 7.510.600
44,636,807 77.631
6.917.150 0
4.61 7.000 1.42A.300 2,194,686
289,522 3.0P4.120 4.02'3.386 7.184.150
91 7.260 3,632,991 5,233,218 5,091,374
20,722,068 7,541,500
393 347 58 1,258
3,008,000 429,498
5.3t-i8.380 1,799,208
600.677
12,830,160
1.888.800 1.822.260 3.119.100
7,245,560 7.245.560
2,987,461 2.987.451
18,982,260 7.749390 3.471.300 7 760,970
1,261,367 1 ,?61,36/
35,482,291 69?.336
5.181 ,000 6.313.000 6.061.01 5 5.9'36.033 3,383,320 7,325,507
3.30 1.50
1 .E0
1.11 0.40 c.7 1
1.07 0.00 0.98
3.49 1.03 7.46
14.63 0.04 2.27 0.00 1.51 0.47 0.72
0.09 0 c'9 1.32 2.35 0.30 1.19 1.71 1 .R7
6.79 0.87 0.13 0.19 0.99 0.14 1.7Fi 2.56 0.20
4.20
2.58 0.60 1.02
2.37 2.37
0.98 0.98
6.22 2.54 1.14 7 54
0.41 0 41
11.63 0.71 1 .89 2.0/ 1.99 196 1.11 2 40
Market O/b Number of shares or Priricipal Money Market lnstrumcnts Admitted Value Net Amount to an Official Exchange Listing t l J l { Assets
Transfcrablc Socurities and
Norway ?,.:370.1387 SlepSlone
Spain 240.795 Carripufrio Alirrieritacion 205.161 Enagas 114.839 Red Electrica de Espana
Sweden 47?,1 OR Swedish Match
Switzerland 196,700 Bank Sarasin R Cic! Registered f6.911 EKW TME rriergie 13,000 Financicre Tradition 18.300 Helvetia
63.460 Schweizerhall Registered 31 0,000 Mobilezone
4.18O Sika
United Kingdom 180.000 Atkiris WS 81 0.273 Ralfour Reatty 520.184 BPP
1 578.2% Carillion 200.000 Charter 702.675 Chrysalis
1.188.R67 (:rawstiaw 3.741 521 Dart
1 .iM0,680 Eco Animal Hcalth 2.01 8.824 tvolution
9?7.3/4 Findel 900.000 Gulfsands Petroleum 21 7.889 Holidayhreak 280,000 Homeserve 592.330 lrriagiriatiori Techriologies 300,000 Imperial Energy 51 1.513 Inchcape 3!!3.61(! lnforma 345,385 Laird
189.1 71 Rensbiurg Sheppards
300.000 SIG 100.000 Venture Production 386.754 Victrex 51 9.790 Wetherspoon L1.D.)
358,452 Domino Printing Sciences
1,059,492 PV Crystalox Solar
1 .900.000 Shanks
Total Transferable Securities and Money Market Instruments Admitted to an Official Exchange Listing
Niirrit)er of shares or Principal Other Transferable Securities
4,432,543 4.432.543
10,448,607 2.920.270 3,680,080 4,738,257
5,436,129 5.436.129
31,109,927 6,313,359 5, I i 7.208 1.367.443 4.458.404 1.389.22/ 8,411,066 4.035220
60,473,062 3,73991 4355.728 3,083.976 6.662.712 2,150,252
926.555 472,803 579.729
3.083.71G 1,394.089 2,285,399 1,74?.307 7.458.877 1 .I 60.267 5,964,041
556.067 3.464.436 7,042,869 3.078.403 1.710.313 2.637.865 1.76/.816 5.562,2 60 2.028.194 1.098.526 3,644,446 1.321.402
1.46 1.46
3.42 0.66 1 .?I 1.55
1.79 1.79
10.19 1 .83 1.89 0.45 1.48 0.16 2.78 1.32
22.44 1.74 1 .11 1.01 2.1 8 0.10 0.30 0.15 0.19 1.01 0.16 0.75 0.57 0.81 0.38 1.95 0.18 1.14 0.67 1.01 0.56 0.86 0.4? 1.82 0.66 0.36 1.19 0.43
291,442,377 95.50
Market 45 Value Net
Amount not dealt on a Heoulated Market t l J H Assets
United Kingdom 500.000 Carter & Carter
Total Other Transferable Securities not dealt on a Regulated Market
Total Investments
Other Net Assets
Net Asset Value
0 0.00 0 0.00
0 0.00
291,442,377 95.50
13,738,068 4.50
305,180,445 100.00

Page 146 Schrodcr Iriterriatiorial Seleclion Fund Semi-Annual Report Jurie 2008
Portfolio of Investments as at 30 June 2008 (cont) Schroder ISF European Special Situations
Number of shares Transferable Securities arid Market '% Numtier of shares Transferable Securities and Market 46 or Priiicipal Money Market IristruiiieriIs Admitted Value Net or Principal Money Market Irislruments Admitted Value Net Arrioiirit to an Otticial Exchange 1 istirig EUR Assets Amourit to an Official Exchange I istirig EUH Assets
Austria 89.5B5 Raiffeiscn International Barik
Belgium 294,592 Umlcore
Finland 403.054 Nokia
France d2. 130 Alstorri
125,302 RNP Paribas 180.902 Bourbon
1 61 ,509 Carrelour 251.158 Cie Generale d'Optiqiie ts:;ilor
330.YS5 Cie Gerlerdle de Geopt iy::iquo-\icritas
61 32 I Oureau Veriias
lrilerr laliurlal
Y5.908 lrrierys 4d.3X I afarge
150,848 Neopost
172,668 Suez 154,472 lolal 154.214 Viria
Germany fi7.133 Ueutschc Boerse
1 17,523 E.ON 182,916 Fielniann 1B,432 Siemens
ti57.306 Symrisc 142,572 Wincor Nixdorl
Ireland 5135,015 laws
1.741.504 United rlrug
Italy 308,053 rNI 499,885 Fiat
2,178,337 Hera
Netherlands
Koninklijke Philips Electroriics Royal Clutch Shell
1 ,I 6cl.014 l4oyal KPN 3 17.982 SBM Offshor? 388.123 IN1
Norway 1,020,047 UriB NO1 i
Spain 4 T W 8 8 lndta Sistemas (jti4,tiYJ Tclcfonica
Sweden 1UU.084 Getinge 321,398 Lindab lriterriatiorial 30c',000 S'jsterriair
7,206,400 7,206,400
9,179,487 9,179,48/
6,182,848 6,182.818
97,899,474 9,125,960 1,184,190 7.0d9.650 2,204,431 5.797.096
3,850,060 9,875,697
f.378.959 7.398.824 8.355.480 5,946.492
46,984,363 4.767.788
11.975,950 8.4?9,547 3,250,1w 9,215 130 6.294 910
14,056,565 7,943.886 6,112.d/9
18,080,724 i,294.Y3i 5 203.803 5.581.r?80
64,088,013
7,663,825 5,3; / ,205
1 ?.T5r?.I!x 7.351 .T14 8.440.815
8,314,410 R.314,410
18,944,l I 9 7,771.302
l l . lT2.81T
16,802,OOl 10,828.ti40 4.91 1 .YO0 1.883.447
1.67 1.67
2.12 2.1 T
1.43 1.43
22.63 7.1 I 1.86 1.63 0.53 1.34
2.28 2.28 1.02 0.9G 2.33 1.1: 1.7 I 1.93 1.38
10.86 1.10 3.45 1.96 ci.76 2.13 1.16
3.25 1.84 1.41
4.18 1 .G9 1.20 1.29
14.81 0.43 2.22 2.54 1.11 1 .24 2.95 1 :/0 1.98
1.92 1.92
4.39 1.80 2.58
3.88 2.30 0.93 0.45
Switzerland 493.825 Actelion Registered 1 iG,2C14 Credit Suisse Registered Y8.233 I Iolcirn Ikgistered
405,820 Nestle Hcgistered 1 orj.509 I k)cIhe 55.098 Syngerita Re(jis1ered 42.2 14 Zurich Financial Services
United Kingdom 1 ,01 3.258 BP
118.238 Cairn rriergy 952,335 lntcrtek 280.tii4 Johrisori Mallhey
5.290.520 VotJalolle
Total Transferable Securities and Money Market Instruments Admitted to an Official Exchange Listing
Total Investments
Other Net Assets
Net Asset Value
68,814,919 15.91 16,828,148 3.89 5.191.028 1.20 5,065.769 1 . I 7
11.669.562 2.70 12.032.117 2.78 11.198.90Y 7.59 8.831.388 1.58
40,025,675 9.25 7,407,785 1.71 4./31.043 1.09
11,949,284 2.70 6.073.343 1.41 9.883.fi20 2.28
416,578,998 96.29
416,578,998 96.29
16,031,105 3.71
432,610,103 100.00
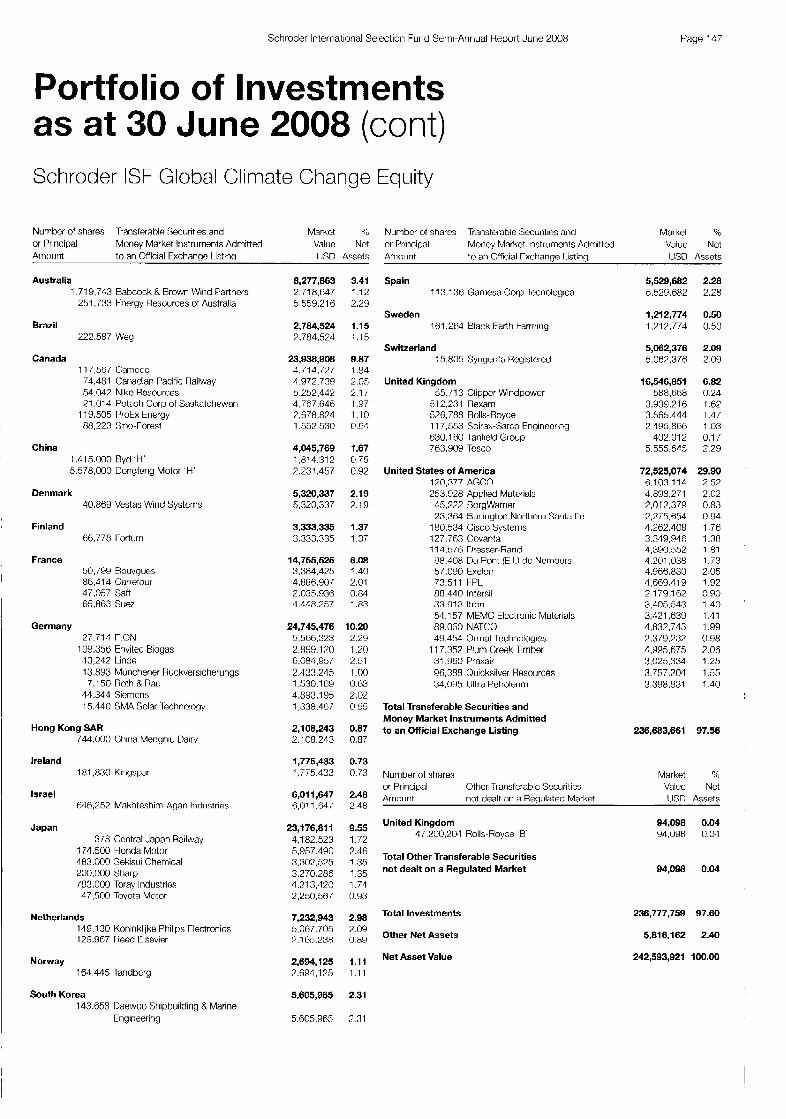
Schroder International Selection Furid Serni-Annual Report June 2008 Page 147
Portfolio of Investments as at 30 June 2008 (cont) Schroder ISF Global Climate Change
Number of shares Translerable Securities and Markct 4;
or Principal Money Market lristrurnents Admitted Valiic Nct Amourit to an Official Exchanac Listina US0 Assets
Australia 1.71 9,743 Babcock & Brown Wind Partners
251.733 Fnergy Resources of Australia
Brazil 222.587 Weg
Canada 117,567 Camcco 74.481 Cariadian Pacific Railway 54.047 Niko Hesources 71.014 Potash Corp of Saskatchewan
1 19.505 ProEx Energy 88,223 Sine-Forest
China 1 .4 15.000 Byd 'H' 5.578,OOO Dongfcng Motor 'H'
Denmark 40.869 Vestas Wind Systcms
Finland 66.778 rorttlrri
France 50,799 Rouygues 86,414 Carrelour 47,057 :;aft 86.fl63 sile7
Germany 27.714 r.ON
13,242 Linde 13.893 Munchener Ruckversicherungs
44.344 Sicmcns 15,440 SMA Solar .Technology
1 OG.356 Envitec Biogas
7,150 Roth R h i
Hong Kong SAA 744.000 (;hiria Mengniu Dairy
Ireland 1 nl.830 Kirigspan
Israel M6.252 Makhteshim Agan Inchistries
Japan 3 / 8 Central .Japan Railway
171.500 Honda Motor 483.000 Sekisui Chemical 200.000 Sharp 183,000 Toray Industries 47.500 Toyota Motor
Netherlands 149.1 30 Koninklijke Philips rlectronics 129.967 fleed Elsevier
Norway 161,415 Tandbcrg
South Korea 143.658 Daewoo Shipbuilding & Marine
Engineering
8,277,863 3.41 2,718,647 1.12 5,559.216 2.29
2,784,524 1.15 7.784.524 1.15
23,938,908 9.87 4.714.777 1.94 4,972,730 2.05 5,252,442 2.1 7 4,787.646 1.87 7.678.824 1.10 1.552.530 0.51
4,045,769 1.67 1.814.312 0.75 7,231,457 C.92
5,320,337 2.19 5,320.337 7.1 9
3,333,335 1.37 3.333335 1.37
14,755,525 6.08 3,384,425 1.40 4,886,901 2.01 2.035.936 0.84 1.118.257 1.83
24,745,476 10.20 5566.323 2.29 2.R99.170 1.20 6.084.05i 2.51 2.433.245 1.00 1.530.169 0.63 4.893.195 2.02 I ,338,457 0.55
2,108,243 0.87 2,108,243 0.87
1,775,433 0.73 1.775.433 0.73
6,011,647 2.48 6.01 1 .@I I 2.48
23,176,811 9.55 4.182.523 1.72 5.957.490 2.46 3.302.575 1.35 3,270,286 1.35 4.213.420 1.74 2,250,567 0.93
7,232,943 2.98 5,067.705 2.09 7,165,238 0 89
2,694,125 1.11 7.694.125 1 11
5,605,965 2.31
Equity
Number of shares Transterable Securities and Market 7'6
or Principal Money Market Instrumenls Admitted Value Net Anioiirit to an Ofticial rxchange I isting USD Assets
Spain 11 3.1 36 &mesa Corp lecnologica
Sweden I f l . 2 6 4 Black Farth Farming
Switzerland 15,805 .(;yrigerith Registered
United Kingdom 55. / I 3 Clippcr Windpowcr
512.231 Rexam 576,788 Rolls-Royce 1 17,553 Spirax-Sarco Enginccring 630.1 60 lanfield tiroup 763.908 Tesco
United States of America 120,377 AGCO 253.928 Applied Materials 45.777 RorgWarner 23.364 Eurliriyton Norttierri :>anta r e
180.534 Cisco Systems 127,763 Covanla 114.5/6 Dresser-Rand 98.408 Du Pont (E.1.) de Nemours S/.000 Exelon 73.511 FPL 88.440 lntersil 33.913 Itrori 51.1 57 MEMC Electronic Materials 89.050 NATCO 49,454 Orrriat Techriologies
31 350 F'raxair 96.388 Quicksilver Resources 34.095 llltra Petroleiim
Total Transferable Securities and Money Market Inslrurnents Admitted to an Official Exchange Listing
11 7.352 Plum Creek Timber
Number 01 shares or Princioal Other Transferable Securities
5,529,682 5.529.682
1,212,774 1,717.774
5,062,376 5,067,376
16,546,851 588.668
3,939,216 3.565.444 2 195.866
402.012 5.555.545
72,525,074 5.1 03.1 14 4.808 271 2.012.379 7,775,654 1262.408 3349,946 4.3UO.552
2.28 2.28
0.50 0.50
2.09 2.09
6.82 0.24 1.67 1.4/ 1.03 0.1 7 2.29
29.90 2.52 2.02 0.83 0.94 1.76 1.38 1 .81
4.201.038 1.73 4.966.830 2.05 4.669.419 1.92 2.179.162 0.90 3.405543 1.40 3,421,639 1 .A1 4,632,743 1.99 7.379.737 0.98 4.995.675 2.06 3,025,334 1.25 3.757.204 1.55 3.398.931 1.40
236,683,661 97.56
Market "0
Value Net Arrioiirit riot ckalt or1 a Regiilatec Market llSD Assets
United Kingdom 17.200.20.1 Rolls-Royce 'B'
Total Other Transferable Securities not dealt on a Regulated Market
Total Investments
Other Net Assets
94.098 0.04 94.098 0.04
94,098 0.04
236,777,759 97.60
5,816,162 2.40
Net Asset Value 242,593,921 100.00
5.605965 731

Page 148 Sctiroder International Selectiori Fund Semi-Annual Report Jurie 2008
Portfolio of Investments as at 30 June 2008 (cont) Schroder ISF Global Dividend Maximiser
Number of sharcs Transferable Securities and Markel :b or Principal Money Market lrist rwi ierlls Admitted Value Net Amount to an Official Cxctiariye Lisliny lJSD Assels
Australia 16.540 Australia and New 7eakrld Oarikiny
Belgium 2,850 KBC Groep
China 210,000 PetroChina I I'
Cyprus
Denmark
41 , I 37 ProSafe
12,400 Danskc Bank
Finland 6,692 Metso
France 3,ci413 Socictc Ccnerale
7,543 Total 8.996 Vivendi
8.754 %le7
Germany 13.125 Deutsche Post 1,720 E.ON 2,084 Munchener fiuckversictierunci:;
Greece 12,953 EFG Eurobarik Lryasias
Hong Kong SAR 139.000 BOC Hong Kong 38,000 SJvire Pacilic
Ireland 70,tXS Allied Irish Banks 30.702 Rank of Irelarid
Italy 10.fl97 ENi 4Y.364 IJriiCrecjit
Netherlands 4.239 Akzo Nobel 9.5 17 ING Crocp
12,370 I loyal Dutch Shell 22.1 54 Royal KPN 10,166 SOM Otf:;tiore 11.073 LJriilewr
Singapore 561 , O W Singapore Post 121 ,000 Singapore Press I loit-liriy 140,000 Singapore Techriolo(lies triyineariny 145.000 Sinyaporc TClecommuni(;Btioris
Spain 9.238 Reusol YPF
Sweden 15.307 Skariska
Switzerland 4.692 Swiss Heirisurancc! Registered
297,553 1.34 297,553 1.34
316,104 1.42 318.104 1.47
310,005 1.40 30,805 1.40
403,645 1.81 403.645 1.81
360,320 1.62 3ti0,320 1.97
301,345 1.35 301 345 1.35
1,732,131 7.78 317.3YO 1.47 422.383 1 .YO ti31.c(37 2.93 310.581 1.5:<
1,066,312 4.79 355.857 1 .GO 345.4d0 1.55 34 ,995 1.63
295,168 1.32 295.108 1.37
736,155 3.30 368.036 1.85 3fi8.119 Lti5
586,903 2.63 318.091 1.43 7 i m 1 2 1.20
699,575 3.14 399.247 1./9 300.328 1.35
2,178,858 9.78 290.438 1.30 300.dii4 1.35 505668 7 . n 302.170 1.72 370,091 1 .titi 329.883 1.48
1,500,753 6.74 453.101) 2.04 3i8.0113 1 . i o 283,057 1.2: 385.91 3 1 .1:3
366,778 1.65 363.778 1.05
237,403 1.06 237.403 1 .uti
310,008 1.39 310,008 1 39
Number of shares rransterahlc Sccurities arid Markct 95 or Principal Money Markct Instruments Adrriitted Valuc Net
USU Assets Amount to an Oliicial Exchange I isting
United Kingdom - - , t , (30 Astra7eriec:a
26,l c)3 Aviva 80.850 Hi 17,483 GlaxoSrnithKline 1 8 3 G i Impcrial Tobacco 24.590 National Grid
143,176 Old Mutual 122.132 Vodafoiie
United States of America 1 R,OR9 Allria 10,885 AT&l- 6.348 ConocoPtiillips 6,954 1311 Ponl (E.1.) dc Nemours 4.1% Eritergy /,331 FPI. 9,854 Gerieral tleclric
8.259 Johnson & Johnsori 8./91 JP Morqari Chnse 8 Co.
8,526 Lorillard
9.019 Philip Morris 7,374 Progress Energy
10.BS9 LJS Bancorp 10.7 12 Vcrizon Coniriiuriicatiorx
1 1,038 Interriatiorial Paper
13.832 Kraft Foods
24,925 I 'tizcr
9,701 Vdyeth
Total Transferable Securities and Money Market Instruments Admitted to an Official Exchange Listing
Total Investments
Other N e t Assets
Net Asset Value
2,934,469 328.552 ?59.706 32 1,076 390. 11 5 BY 1.448 320.008 28:!,50Y 359.775
7,210,840 384.391 356.593 581,731 297.2YLi 48%5,i 1 3 4G:5,665 258.766 258.132 323,0?6 308.125 393.542 5 19,59 1 430,104
318.931 302.889 367.207 447.119
440.4 17
13.17 1.17 1.17 1.44 1.75 3.10 1.44 1.18 1.62
32.37 1./3 1 .BO 2.61 1.33 2.18 2.0Y 1.16 1.16 2.36 1.38 1.77 2.00 1.93 2.02 1.43 1.38 1.85 2.0 1
21,845,125 98.06
21,845,125 98.06
431,078 1.94
22,276,203 100.00

Schroder International Selection Fund Semi-Annual Report June 2008 Page 119
Portfolio of Investments as at 30 June 2008 (cont) Schroder ISF Global Emerging Markets Commodities
Nurnbcr of shares Transferable Securities arid Market 96 Numher of shares lransferahle Securities and Market or Principal Money Market Instruments Admittcd Value Net or Principal Money Market Instruments Admitted Valuc Nct Arnount to an Ofttcial txchange 1.istirig USD Assets Amount to an Olficial txchange Listing IISD Assets
Brazil 12.600 Cornparihia Vale do Ria Docc 16,700 Corvparihia Vale do Rio Ooce
Prcfcrcncc 4.800 Gerdaii Preference 8.200 JRS 6.800 Magnesita Refratarios
16,200 Pctroleo Brasileiro 21.700 Petrnleo Brasileiro Preference 13,500 Suzano Papel c Cclulose F'relerence
1.600 Ullrapar PartiqmqOes Preference 6.100 IJSIIXI!! :;icjeruryic:as de Minas Gerais
Chile 2,500 Vim Cnnc:tia y foro ADR
China 43.000 (:hiria Coal Fnergy 'H'
98.000 Hidili lndustty International 118,000 China Petroleum R Chemical 'H
Development
Hong Kong SAR 796,COO CNOOC
Hungary 580 MOL Hunyariari Oil arid Gas
Israel 5.553 Israel Chemicals 4.062 Makhteshim Agar Iridustries
Luxembourg 2.500 Tenaris ADR 1,700 Terniurn ADR
Malaysia 33.900 KNM 29,500 Kuala Lumpur Kcpong
Mexico 41.300 Ccmcx
1?5.100 Grupo Mexico
Peru 2.000 Cia dc Minas Buenaventiira ADR
Poland 6.155 KGHM Polska Miedz
14.778 Polski Koncern Naftoik?! Orlcn
Russia 19.900 Gazprorn OAO ADR 6.800 Lukoil AUH 5.100 Mechel AD11 8.500 MMC Norilsk Nickel ADR 1,600 Polyus Cold ADH
37.750 Rosneft Oil CUR 1.950 Severstal GDR 1 .I g? Taneft GDR
850 Uralkali GDR
South Africa 5,227 AngloGold Ashanti 2,789 African Rainbow Minerals
?4,164 lllovo Sugar 17.89% Impala Platinum 5,80!! Sasol
2,951,704 445.386
494.045 1 1 1,615 41,790 93.274
560.113 61 7.051 771.075
61.15~1 305.768
88,475 88.175
356,545 75,204
11 0.44s
170.8!??
509,331 509,331
77,959 7 /.Y59
164,757 126.971 37.786
251,815 18(1.775 70.890
224,779 65,881
1 sn.nan
397,383 109.357 288.026
128,880 1?8.880
543,108 307.51 1 235.597
3,068,328 1.158.180
671,160 248,370 21 3.1 80 4R.?40
43G.410 50.681
179.992 fil,115
1,236,889 170,525 1 00212 82.807
522.251 352.091
24.96 3 77
4.18 0.0.1 0.34 F78 1 . 7 1 5.23 187 c.52 2.50
0.75 ti.75
3.02 C.64 c.03
1.45
4.31 4.31
0.66 0.66
1.39 1.07 0.32
2.13 1.53 0.60
1.90 0.58 1.34
3.36 0 02 2.44
1.09 1.09
4.59 2.60 1.09
25.96 9.80 5.68 2.10 1 .80 0.39 3.7? 0.13 1.52 0 57
10.46 1.51 0.85 0.70 1.42 2.98
South Korea 500 LG Chern
3.400 po:;co ADR 480 SK Energy
Taiwan 1,150 China Steel GDR
Thailand 8.500 Banpu (Foreign)
13.000 P n Chemical (Foreign) 33.200 P n Exploration R Production
(Foreign)
Turkey ?3.355 Eregli Oemir ve Celik Fabrikalari 1 1,353 Tiipras Tiirkiye Petrol Rafine
Total Transferable Securities and Money Market Instruments Admitted to an Official Exchange Listing
Total Investments
Other Net Assets
Net Asset Value
529,459 4.48 47,705 U.11
428.400 3.62 53.354 0.45
239,188 2.02 , 239.188 7.07
369,383 3.12 137.138 116 , 10.783 0.31
141.442 1.62
457,980 3.87 198.367 1.67 759.613 7.70
11,595,743 98.07
11,595,743 98.07
228,165 1.93
11,823,908 100.00

Page 150 Schroder Intcrnatiorial Selection Fund Semi-Annual Report Jurie 2008
Portfolio of Investments as at 30 June 2008 (cont) Schroder ISF Global Emerging Market Opportunities
Number (it shares Transferable Securities arid Market 46 or Priricipal Money Markct lnstrurrierits Admilled Value Net Amount lo air Otticial Exchange 1 istirig USD Assets
Brazil 293.953 Cnmpanhia de Concessoes
167.006 Corripanhia Encrgctica de Mirias
257.00i) Companhia Vale do I lio Uocc
233.800 Eletropaulo Metropolitdria de :.;;io
156,828 Perdigao
21Y.819 Tirn Participa~De:; ?flR,500 1rat:lebel Encrgia
I lodovlarlac,
Gerais AUI 1
Preference ADR
Paulo Prefereric:e
0?,500 Iele Norle Lcstc Participacoes
51,100 Unibanco - Uriiao de Hancos Brasileiros GDR
Chile 340.203 Empresa Nacional de
TelecOrIiuriiCaCinrres
China 8,480.000 China Cori:str.ic:liorr Bank ‘H 7.068.000 Golden Eagle Retail
Colombia 2 15,145 RanColorr ih AUI i
Hong Kong SAR 2,020,000 Bcijing Enterprises 1,98fi,000 China Unicorn
1 6.!~140.000 Dcnway Motors ~1,061,000 CNOOC
India 350.4YG Btytlrti Airtel
iY.609 Hoi.isirig Developrnenl hnarnce
Israel 787.64‘3 Makhteshim-Agari Iridustrie:; 159.1Ot: Teva Pharniaccutical Industries ADR
Malaysia 8,079,100 Phis FxpressJdays
Poland 37.165 Grupa Kety
Russia 15R,300 Mcchcl ADR 9C.775 Mubile Ielgsysteins ADR
261,150 OAO GazproT ADR 654,250 Rwriefl Oil GI)C4
1 C.17? >>bert-,ank GDR
South Korea lG.068 CJ ChciUodang
147.210 Hana Financial ?14,?20 Hankook I irc 2BP.1 80 Korea Excharige f3arik 46,924 KT&C b8,025 I.(; Eleclroriics
11.370 Sarnsiing Electrotiics 7,444 POSCO
40,816,878 9.90
5.904.00i 1.43
4.031,Y65 0.98
7.61 7.480 1.85
>,:)lSKGl 1.34 4.313.201 1.05 1.826.988 0.44
877.733 0.20 4,294,628 1.04
6:182,035 1.57
4,762,493 1.16
4,767,493 1,l ti
13,697,714 3.33 6,028,275 1 .Su 6.t169.439 1 .t37
6,795,968 1.65 R.7!35.9G8 1 .ti5
25,366,170 6.16 8,604,009 1 .60 3,887,256 0 90 0.530.449 2.07 6,537.057 1.3.1
9,398,174 2.28 6.038.116/ 1.4/ 3,359,207 0.81
14,518,558 3.52 /,32ti,957 1.78 7.lt)l.5(31 1.74
6,364,306 1.55 ii.3ti4.306 1.55
1,712,834 0.42 1,712,834 0.42
43,698,672 10.61 ;,;09.210 1.87 0.9F1F1.767 1 .i’U
15,198.P,Y0 3.W 7,964,670 1 . I33 5.837.095 1.42
37,519,214 9.11 4.IP2.919 102 5.634.432 1.07 2,973.858 0.U 3,685,188 0.89 1.029.348 0.90 6,334,281 1.54 3.8d3.fi97 0.94 17,785,493 1.65
Niimbcr of shares TrdrislerRhle Securities and Market q: or Principal Moriey Market Instruments Admitted Value Net Ari iount to ari Official txchanyc Listing LJSD Assets
Thailand 23,071,634 5.60 509.300 Haripu (Foreign] 8.PIB.Yfl 1.99
2.844.100 Siarri (:orrimercia Bank (Foreign) 6.123.820 1.4Y
1,514.1 00 P n Exploration & Prodiictiori iforeiyi! 0.730.843 2.12
Turkey 13,653,904 3.31 1,4/2.631 Ariadolu Hnynt Emeklilik 2.934.570 0.71
322.51 2 trcyll Demir ve Celik rat)rikalari 2.139.791 0.G7 1 14,002 Olokar Otobus Karoseri Sanayi 1.12856f5 0.27 2Y9,105 Tupras lurkiyc Petrol Rafine R.853,477 1.66
Total Transferable Securities and Money Market Instruments Admitted to an Official Exchange Listing 241,376,519 58.60
Number of shares ~lransferablc Securities and Market % or l’ritncipal Moriey Market Instruments dealt Value Net Anourit on another Re(yilatetj Market LKD Assets
United States of America 43,572,718 10.58
U X I 20.902.000 US Treasuv 4.775% 15,08.’2013 71,787,479 5.2’3 LJSU 22.025.500 US Treasury 3.1255: 30:04:2018 21.805.245 5.2Y
Total Transferable Securities and Money Market Instruments dealt on another Regulated Market 43,572,718 10.58
Nurriber 01 shareu Market 46 VAue Net or Priri(:ipa Other Transferatile Securilics
not dealt ori a Heyulated Market USU Assets Arrivurit
Colombia 6,997,710 1.70 1 .055,(J93 Arnaceries C-xito GUI < 0,997,710 1.70
Total Other Transferable Securities not dealt on a Regulated Market 6,997,710 1.70
Number of shares Market 0.3
or Priricipal Value Nct Amount Derivatives LJSD Assets
Switzerland 7,170,203 1.74 1,609,581 UnS Warraritv 01:l 1:2010 7,170,203 1.74
United Arab Emirates 7,976,485 1.94 7,714,/00 Air Arabia Warrants 13~08;7010 3,578,491 0.8/ 1,230,876 Aldnr I’roporties Warrants
12’01 ,XJl I J 3,3!47.9!44 1.07
Total Derivatives 15,146,688 3.68
Total Investments 307,093,635 74.56
Other Net Assets 104,799,383 25.44
Net Asset Value 41 1,893,018 100.00

Schroder International Selection Fund Scmi-Annual Report June 2008 Page 151
Portfolio of Investments as at 30 June 2008 (cont) Schroder ISF Global Energy Schroder ISF Global Equity Yield
Number of shares Transferable Securities and Market Number of shares lransferahle Securities and Market Sh Vahe Net or Principal Money Market Instruments Admitted Value Net or Principal
Amount to an Official Exchange Lisling IJSD Assets Amount to an Official Exchange Listing USD Assets Money Market Instruments Admitted
Bermuda 5,481,075 Dockwise 3.1 68.682 GeoPark
Canada 11.998.696 Rankers Pctrolcum
779.878 Niko Resources 1.790.313 ProFx Energy
!380.395 Tanganyika Oil
Cyprus 1.838.774 ProSafe 2,809,460 Prosafe Production Public
France 7fi5,774 Total
Italy 3,319.529 Mairc Tccnirnont
Netherlands 593.520 SBM Ottshorc
Norway 1.01 0.963 Aker Soluliorw;
Spain 693,332 Repsol YPF
United Kingdom 593.960 Dana Pctrolcurn
5,692,195 Gulfsands Potroleurn 1 .I 75.834 Imperial Energy 1,330,753 Ventiire Production
United States of America 239,383 Apachc 336.999 Baker Hughes 781,385 ConocoPhillips 869.139 Della Pelroleuni
1.696.275 Casco Energy 636.732 Marathon Oil 482,547 NATGO 413.436 Noble 557.089 Quicksilver Resources
287.665 Ultra Petroleum fil7.607 Valero knergy
33,295 Range Hesourccs
Total Transferable Securities and Money Market Instruments Admitted to an Official Exchange Listing
Total Investments
Other Net Assets
Net Asset Value
45,587,723 5.73 70.888.079 2.63 74,699,644 3.10
102,032,220 12.82 21,280,572 2.67 2i.196.999 5.12 28323.658 3.63 24.630.991 >?.I0
33,990,422 4.27 18.042.424 2.27 15.947.998 2.00
65,262,494 8.20 65,262,494 8.20
22,367,123 2.81 22367.173 7.81
21,628,218 2.72 21,628.218 2.72
23,831,289 3.00 i13.n.71.7na 3.00
27,527,512 3.46 27,527,512 X16
91,334,668 11.48 22379.842 2.81 24.51 1.593 3.08 21.402.022 2.69 23.041 2 1 1 2.90
291,267,264 36.61 32.819.409 4.13 29,571,682 3.72 25.786.122 3.21 21,641.561 2.72 18 644.212 2.34 32.613.413 4.10 76.18/,826 3.79 26.771.1 15 3.37 21,715,329 2.73 2,156,915 0.27
28,677,324 3.60 24.679.376 3.10
724,828,933 91.10
724,828,933 91.10
70,787,222 8.90
795,616,155 100.00
Belgium 6.1 15 KBC Groep
China 672.000 PetroChina 'H'
Cyprus 97.175 ProSafe
Denmark 26.947 Danske Bank
Finland 18.572 Metso
France 10,228 Socikt6 Ccneralc 18.053 Suez 17.831 lotal 29.624 Vivendi
Germany 27.047 Deulsche Post 4.658 Miinchener I {ijckversicherungs
Greece :34,78 1 EFG Eurohank Ergasias
Hong Kong SAR 419.500 l3OC t lorig Kong 19.900 Hang Scng Rank 65,500 Swire Pacific
Ireland SI ,707 Allied Irish h n k s 77.500 Rank of Ireland
Italy 33.278 EN1
137,Rl 4 t JniCredil
Netherlands 11 , I 37 Akzo Notiel Xl.877 ING Groep 77.406 Royal Dutch Shell 60,889 Royal KPN 24.341 SHM Offshore 30.430 Ilnilever
Norway fiR,570 DnB NOR
Singapore 1.172.000 Singapore Post
295.000 :hiyapore Pres:: 396.000 :;irigapore .Technologies Engineering 344.550 Singapore Telecommunications B83.000 Suntec Real Estate Investment Trust
Spain 73.173 Repsol YPF 32.3 12 Telefhnica
Sweden 54.651 Skariska
Switzerland 17.1 43 Credit Suisse Hegistered
678,237 678.237
870,254 870.254
956,444 956.144
783,028 783.028
836,308 836.308
4,616,646 890.1 91
1,084,188 1,520.725 1 .I21539
1,517,076 701,266 815,810
831,072 331,072
2,833,001 1 ,I 10.778 1.052,500
669.773
1,473,157 794.fi05 878.552
2,079,278 1,242,043
837.235
5,338,857 7 63,054 659,422
1,119,.C104 1.049.91 4
887.000 859, Bfi3
880,933 880.933
4,512,812 1,190.457
921,773 800,847 917.010 682,925
1,776,152 920.w3 R56. 10'1
794,172 794,172
782,690 782.690
1.15 1.15
1.47 1.4/
1.62 .I 6 2
1.32 1.32
1.41 1.11
7.81 1.51 1.83 2.57 1.90
2.57 1.19 1.38
1.41 1.11
4.79 1.88 1./8 1.13
2.49 1.34 1.15
3.52 2.10 1.42
9.03 1.29 1 .I2 1.89 1.18 1.50 1.45
1.49 1.49
7.64 2.02 1.56 1.35 1.55 1.16
3.01 1.56 1.45
1 .a 1.34
1.32 1.32

Page 152 Schroder International Sclcctiori Furid Serrii-Annual Report Junc 2008
Portfolio of Investments as at 30 June 2008 (cont) Schroder ISF Global Equity Yield (coI-~~) Schroder ISF Global Property
Securities Nunibcr of shares Transferable Seciirilies and Market 3 Number of shares Trarisferat)lc: Securities and Market 7" or Principal Money Market lnstrurrierits Adniilted Value Net or Principal Money Market Iristruments Admitted Value Net Amount to an Official rxt;hariye Li:;LiIiy USD Assels Amount tu ari (3Hic;inl txclianyc Listing USD Asset:;
United Kingdom 188.B89 BT tiu,66/ ~lax[)~.~rIiittiKli~ie 41,181 Imperial Tobacco
341,306 Old Mutual
United States of America 49.681 Altria 32.910 ATST
17,729 Doininion Resources 21.337 Du Porit (r.1.) (le Nemours 1 1.71 2 Enterny 21,447 FT'L 75,81 ii General Electric 32,302 lriterriatiurial Paper 24.639 Jutirisor tl. Johnson 21.399 JPMorgan Chase & Co. 39.235 Kralt Foods 14.959 Lorillard .;3,?70 Pfizer 21 ,010 Philip Morris Iriterriatiorial 23.78 I Progress Energy 27.483 02 Baricorp 30.61 6 Vcrizon Cornrnunicatioris 37,3M Wyeth
18,469 ConocolJlillllps
Total Transferable Securities and Money Market Instruments Admitted to an Official Exchange Listing
Total Investments
Other Net Assets
Net Asset Value
4,396,351 7.44 749,331 1.27
1,409,891 2.52 1.531,19ti 2 . K
625.993 1.06
21,013,790 35.55 1.01 1,008 1 .72 1.078.1 32 1.82 1 .fi92.499 2.86
819,080 1.39 1.1 07.017 1 .a7 i , w 8 . / 3 i p.33 1,362,313 2.30 677.'328 1.1 5 750.947 1.28
1.50F.301 2.65 ;'50.033 1.27
1.1 13.967 1 88 1.010.913 1 72 1,265,345 2.11 1,049,918 1.78
988.338 1.61 778.045 1.32
1,0~19,51 i 1.78 1 .451,750 2.52
56,970,258 96.38
56,970,258 96.38
2,138,120 3.62
59,108,378 100.00
Australia 300,000 Stockland
France 1 12,000 Eurosic 55,269 ICADF
189 767 Klcpierre 64,700 Nexity
11 8.900 Unibail
Germany 1 ?0,ij:50 UIC Asset
Hong Kong SAR 4,740,000 China (herseas I and & lnvestmont ?,G34,5DO Hang Lung Properties 1,960.000 Honykong Larid 3.049.737 Hywn Development 1254,082 Kerry Propertie:; 3,450,000 Litcstyle Internatlorial 3,029.800 Shangri-La Asia
Italy 2,083.200 Immobiliare Graride Distrit)riziorie 1,251,959 Risariarrierito
Japan 4tj0.700 Aeon Mall 774.000 Claiwa I Iuiise Inrjuslry 510.000 Mitsui Fudosan
Luxembourg BY,9/1 Orco ProperPj
Philippines 43.000.000 Megmorld
Singapore 2,27.1.000 Capital and
Spain 004.700 Sol Melia
Sweden 450.000 (;astelluni
United Kingdom 344,200 British Land 568,/YB Great Portlarid tsldle:; 767.424 Seqro
United States of America 51.000 Alexandria Heal Estate Equities
n3,900 Boston Properties
5?,800 tssex Property Trust
112.800 AvalonRay Commuriities
152.300 Equity Orie
110,100 tederal Hcalty Investment Trust 21 6.300 Gerieral Growth r'ropcrties 1 17.400 Health Care R t l 1 30'3.000 Host I lutels & Resorts 134.800 Kimco Realty 107,700 I aSak Hotel Properties 74,900 Macerich 30.000 Mayurc! Properties /.623?~ perpetual
1,553,937 0.44 1.553.937 0.44
49,949,412 14.28 3.146.01? 144 ti.35Y.3i:' 1 .W 8.582.504 2.45 1,758,682 0.50
2i.422.862 7.84
3,080,632 0.88 3,080,532 0.88
51,192,802 14.83 7,487,033 7.14 8,444.885 2.41 8.388.800 2.40 8.368.1'33 2.39 6.584,WKI 1.88 4,848,232 1.39 7.070.349 TO?
7,832,076 2.24 6,15Y,/25 1.76 1.072.351 0.48
31,934,461 9.13 13.680.70i 3.91 7,305.201 2.09 10.948.5YY 3.13
4,039,732 1.15 4.03!3,732 1.15
1,166,945 0.33 1,166,945 0.33
22,765,749 6.51 Y.5Xl.684 2.72 8.383.ti34 ?.40 4,852.431 1.39
6,462,004 1.85 6.162.004 1.85
4,379,981 1.25 4,379,981 1.25
14,746,252 4.21 4.81 1,104 1.37 3.866.775 1 . I 1 6.0W.373 1.73
112,417,856 32.13 5,003,610 1.44 li.950.088 ?.84 7.556.8/3 7.16 3,110.05R 0.81) 5,838,928 1.61 7,6331,031 2.18 7.596.456 2.17 5.?30.1 70 1.49 4784,200 1.22 4.68B.Y9)6 1.34 2,747,427 0./9 4,551 ,790 1.33
425,340 0.12
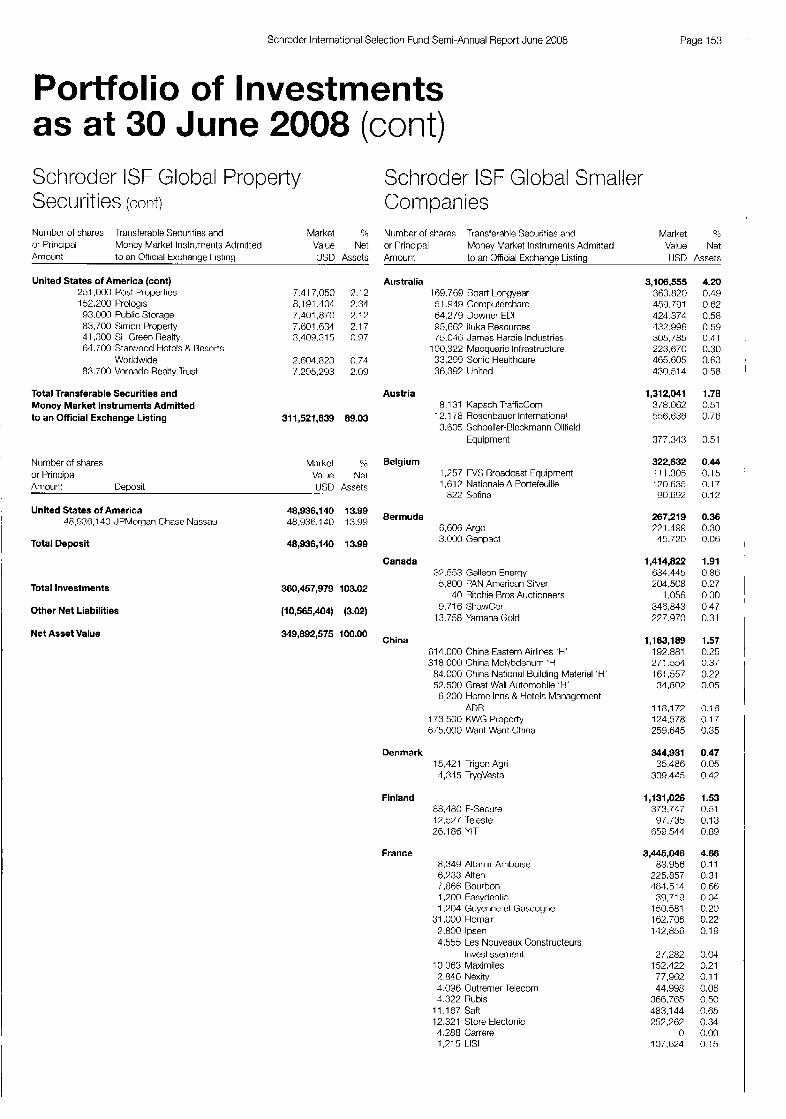
Schrnder lntcrriational Selection Fund Semi-Annual Report June 2008 Page 153
Portfolio of I nvestrnents as at 30 June 2008 (cont) Schroder ISF Global Property Securities (cont)
Numbcr of shares Transferahle Seciirities and Market 4/, or Principal Moncy Market Instrumenls Adrriitted Value Net Amount to an Ollicial Ext;t>arige I isting USD Assets
United States of America (cont) 251,000 Post Properties 152.200 Prologis 93.000 Public Storage 83,700 Siniori Property 41,300 SI Green Realty 64.700 Starwood Hotels 8, I7esorts
83.700 Vnrnado Realty lrust Worldwide
Total Transferable Securities and Money Market Instruments Admitted to an Official Exchange Listing
7.41 7,050 2.1 2 8,191.404 2.34 7.401.870 7.l? 7.601.634 2.1 7 3.409.31 5 0.97
2.504.823 0.74 7.295.293 2.00
31 1,521,839 89.03
Number of shares Market ",A or Principal Value Ne1 Amount Deposil USD Assets
United States of America 48,938,140 JPMorgan Chase Nassau
48,936,140 13.99 48.936.1 40 13.99
Total Deposit 48,936,140 13.99
Total Investments 360,457,979 103.02
Other Net Liabilities (10,565,404) (3.02)
Net Asset Value 349,892,575 100.00
Schroder ISF Global Smaller Companies Niimher of shares Transfewhle Securities and Market ?&
Money Market Instrmenls Admitted Value Net or Principal Amount to an Official Exchange LListirig USD Assets
Australia 109.700 Ouart Lorigyear 51.919 Computershare 64,2/9 Downer ED1 95.663 Iluka Resources (5.046 James Hardie Industries 100,322 Macquaric Infrastructure 33.290 Sonic Healthcare 36.392 llnited
Austria 8.1 31 Kapsch Trafficcorn
3.605 Schocller-Blcckmann Oiltield 12.1 78 Roscnhaucr International
Equipment
Belgium 1.757 TVS nroadcast rqutpment 1.61 2 Nationale A Portefeuille 822 Sofina
Bermuda fi,606 Argo 3.000 Genpact
Canada 3.553 Galleon Energy 5,800 PAN American Silver
9.716 ShawCor 40 Ritctiie Bros Auctioneers
13.758 Yaniaria Gold
China 014.000 China Eastern Airlines 'H' 318,000 China Molybdenum 'H' 84.000 China National Huilding Material 'li' 57.500 Great Wall Automobile 'H' 6,200 Home Inns & Hotels Management
ADH 173.500 KWG Properly 675.000 Want Want China
Denmark 15.42 1 Trigon Agri 1,315 TrygVesta
Finland 88.480 F-Secure 17.577 Ieleste 26.186 YIT
France 8.349 Altarriir Anitioise 6.?33 Alten i.866 Rourbon 1,200 Easydentic 1204 Chyenne et Gascogne 31.000 Homair 2.800 lpsen 4,555 Les Nouveaux Constructeurs
lrivestissenierit 10,063 Mnximiles 7.846 Nexity 4.096 Outrenier Telecorn 4.322 Rubis 11.167 Saft 12,321 Store tlectonic 4.288 Carrere 1 ,?I 5 LIS1
3,106,555 363.820 459.791 424.374 432.996 305.785 223.6370 3ti5.fi05 430.514
1,312,041 3/8.062 556.636
377,343
322,632 11 1.305 120.635 00.6'32
267,219 221.499 15.720
I ,41 4,822 634.445 204.508 1.056
346.843 227.970
1,163,189 192.881 27 1.551 161 357 31.802
118,172 124.578 259.645
344,931 35.488 309.445
1,131,026 373.717 97.735 059.544
3,445,046 83.956 225.857 481.5 1 1 39,71a 150.581 162.706 142.856
2/.282 152.422 77,962 44,998 366.765 483,144 ?5?.?6?
0 107,624
4.20 0.49 0.62 0.58 0.59 0.4 1 0.30 0.63 0.58
1.78 0.51 0.76
0.51
0.44 0.15 0.17 0.1 2
0.36 0.30 0.06
1.91 0.86 0.27 0.00 0.47 0.31
1.57 0.25 0.37 0.27 0.05
0.1 8 0.1 7 0.35
0.47 0.05 0.42
1.53 0.51 0.13 0.89
4.66 0.1 1 0.31 0.66 0.04 0.20 0.22 0.19
0.04 0.21 0.11 0.06 0.50 0.65 0.34 0.00 0.15

Page 154 Schroder Iriterriational Selection Fund Serrii-Annual Report June 2008
Portfolio of Investments as at 30 June 2008 (cont) Schroder ISF Global Smaller Companies (,cant)
Nurriber ot :;hares or Priricipal Amount
France (cont)
Transferable Securities arid Money Market Iristrunienls Admitted to ari Official txchanyc Listing
6,93I Sword 5.000 Vifhac
Germany 3,216 Bilfinger Berger 3,320 Euro-Kai KGaA Preference 3.263 Hawesko
11,950 IUS :;cheer 2.368 IriVisiori Soltware
12,100 MIUAcro Engines 8,339 Rtieirirrietall
1 1,385 SFC Smart F.iel Cell
Greece 1 :3.693 Batii:; Vuwx Intcrnattonal
Christruction 9,400 Fourlis
11,912 JUMBO
Guernsey 1 1,000 Amdocs
Hong Kong SAR 747,000 Agile Property 180,000 China rvertmght 222,000 China Foods 11 9,000 China Insurance Internatiorial 290,000 Cnpc Hon(j Korig 90.400 Dati Sing Banking
7.000 Hony Kong Aircraft Fn(jirie?rg 51 ,000 I lopewell
840.000 Minrrietals Resources
638,000 SHE 1.100 Seaspari
35.000 lelevisiori Broadcasts
Ireland 18,197 DCC
Israel 3424Fi Oridiori Systems
Italy 22.300 ACEA 20.528 Amiut
28,000 Hera 1 YS,l68 CIR-Corripayriie Iriduslriali Hiunite
Japan 17.500 Aica Kogyo 10,400 Arcs 36.000 Chugoku Marine Pairits 37.000 h d o Steel 2 /.000 Daihatsu Diesel Mariulxluriny 34.000 DC 34.000 DOWA
16.100 hjihura Kasci 28.000 kurukawa-Sky Aluminum
3.600 Excdy
4, /00 I 11:; Y ,000 Hisaka Works 3,000 lcorn 6.000 Japan Aviation Electroriics 1ridu:;try
7 , M I<oito Mariulactunng 3,900 Lintec 8,T00 MlSUMl
14.800 Mtisa:;hi Seinnitsu lndustpj 6.500 Nichi-iko Pharmaceutical
16,900 \IW
Market % Valiie Net USU Assets
21 3,055 129,343
2,159,693
363.786 109.957 14 1 .v35 R8.339
3Y0. I13 R15,007 189,136
1,038,687
443.04 i 274.092 31 !i.548
323,510 3?3.510
2,178,057 2 10,99u 308.548 107.473
2813.057
283.8W 13'3,336 1 /1 .Of38 1 1 T.W4 131,138 715.6R7 1 G5,832 t38.716
201.945
453,737 453.737
346,038 346.W8
1,304,806 474.73R 230.385 537,094 113,OW
5,628,242 154.908 220.238 249,215 201,500 308.41 2 100.000 248,553 YS.138
1.1 1.232 75.733 70,629
192.359 76.FJS-1 52,/14
1,13,384 97.w15 d8.049
182.498 340.81 7 1 8S.031
0.29 0.58
2.92 0.38 0.49 0.15 (J.19 0.09 0.53 0.83 0.26
1.41
0.61 0.37 0.43
0.44 0.11
2.95 0 29 0,42 0.14 0.38 0.18 0.73 0.1 fl 0.23 0.31 0.23 0.09 0.27
0.61 0.61
0.47 0.4 i
1.77 0 58 0.31 O.T3 0.15
7.61 (>.?I 0.30 0.34 0.28 0.42 0.14 0.34 0.13 i l l 9 0 10 0.10 0.20 0.10 0.07 0.1Y 0.13 0.09 0.77 0.36 0.22
Number of shares ~Iransterablc Securities and Markct ?J or Principal Money Market Instrurrierits Adrriitled Value Net ArrloIJrlt to an Official rxctiarige Listmy tJSD Assets
Japan (cont) 8.1 (10 Nidcc Copal 8.800 Nifco
10,000 Nihon r'arkerizing 27,000 Nippon Thonipsori
l 0 , i 0 0 Nitta 040 OtK
8.100 0% 7,100 Ryosan 6.000 sat0
7,000 Nishirnalsuya Chain
48,000 Shinmaym lridustries 8.300 :;lJrIll(~>l 5.100 Tokyo lorriin Bank
11,900 lrusco Nakajrama 6.900 Tsumura & Co. 2,000 lsiiruha 5,700 Tsutsurrii Jewelry 5.100 Union Tool
Luxembourg 19,239 Transcorri VWdWide
Netherlands 1,800 Accell
15,700 Arcadis
29,345 Irirlocoriccpbs I155u SBM Offshare 7,247 Smartrac
l:j,k&' Teri Gate
ri.574 Fugro
New Zealand 158,214 Fisher 8 Paykel Hcalthcare
Norway 141.0t30 Stepstone
Singapore 113,000 CapitaMall Trust 753,000 Goodpack 98.000 Parkvdsy
109.000 SembCorp lndustnes 249,000 SMRT 751,000 Suntec Real Estate 1rive:;trrienl Trust 228.000 Uriisteel Icchnology 54.000 Yarilord Land
South Korea 278 CJ C;theil.Jcdang
7.336 t~~Ul lJ in Materials 4YY KOC
4,635 Kumho Industrial 71 4 Lotk Contcctioncty
7.028 Samsung Engineeririg 4.500 TK
Spain i t1 ,3~9 rrlagas 8,065 Red Electrica de Espana
Sweden '3.1 ti5 Saab
17.797 %Jedish Match
Switzerland 12.403 Bank Sarasiri & C e I jegistered 4.330 BKW FMR Enercjie 2, l 50 F i ~ i a i i ~ i e f ~ Tradition
751 Helvctia
78.745 0.11 208.474 0.28 281.4/2 0.36 113.173 0.23 W.890 0.09
234 25Y 0.32 141.842 0.19 91,924 0.12 45.281 0.06 87.885 0.09
190,f6t? 0.28 11Y.18T 0.16 99.1 15 0.13
1/9.051 0.74 170,471 0.21 83,822 0.09
114.280 0.16: 149.035 0.20
93,789 0.13 93.789 0.13
2,624,575 3.55 61.735 0.08
348,912 0.4/ 354.346 0.75 111.131 0.50 530:129 0.12 233.643 0.32 182.379 0.65
283,983 0.38 283.983 0.38
415,648 0.56 415.648 0.58
2,017,138 2.73 348.406 0.33 288.453 0.39 lti7,158 0.23 333.375 0.45 340,507 0.46 250.977 0.34 318,818 0.43
13,448 0.10
1,502,137 2.03 255.208 0.36 329.41i 0.45 207,311 0.28 106,356 0.14 259,103 0.35 151,505 0.20 1 93,207 0.26
1,045,316 1.41 520.833 0.10 521.183 0./1
592,171 0.80 731.020 0.31 361,151 0.49
3,452,233 4.67 667.883 0.75 589.171 0.80 358.433 0.48 288.251 0.39

Schroder International Selection Fund Semi-Annual Reoort June 2008 Page 155
Portfolio of Investments as at 30 June 2008 (cont) Schroder ISF Global Smaller Companies (conti
Niirriber of shares Transferable Securities and Market % or Principal Money Market Instruments Admitted Value Net Amouit to an Oflicial txchanue Listiriu IJSD Assets
Niirriber of shxes Transferable Securities and Market 36 or Principal Money Market Instrimerits Ahiitted Value Net Amount to an Official Exchancre Listina USD Assets
Switzerland (cont) 66 Jelmoli
52,500 Mobilezone 1.908 Newave rnergy 3.231 Schweizerhall Registered
231 Sika
United Kingdom 10.000 Albernarle R Bond 35.000 AssetCo 8.757 Atkirrs (WS!
10,000 Hahcock Interriatiorial 16.341 nalfour Reatty 80.000 Bloorrist)iiry Publishing 50,000 Rodycote 47.940 Booker 15.000 Rovis Homcs 20.000 BF'I-' 20,000 BSS 25,001 Carilliori 13,000 Chloride 25,000 Consort Mcdical 17.500 CSR 21.100 Dcchra Pharmaceiiticals 33.145 DTZ 30.000 E2V Technologies 18.305 Eco Animal Health 15,000 Fidessa 50.000 Findcl 14,l 60 Goldshield 30.000 Grainger 2,000 Greggs
20,000 Hamworthy 1.343 Homcserve
?I .36G lnchcape 18.846 Laird
11 1736 LMS Capital 25,000 Luminar
1 12.762 Management Con:;ultir;y 30.609 Meggitt 50,000 Mitie 10.000 Morgan Siridall 87,l 01 Nestor Healthcare
3.378 Premier Oil 17,500 Shaftesbury 10.187 9 G 15,000 United Rusincss Media 10,000 Ventiire Production 14.73/ Victrex 15.000 Vitec 19.625 Welherspoori L1.D.)
United States of America 5.924 Actuant 5.200 Adtran 8,400 Advariced Medical Optics 4,800 AH Relo 1 ,ROO Air Methods 4.35/ Airgas 3.100 Alhany Interndtiorial 6,200 Albcmarlc
1,800 AllianceBernsteiri
1,600 Amphenol 6,200 Amsurg 5.500 Anadigics
13,556 Annaly Capital Management 9.81 1 Apollo Investment
13,800 Aspen Technology
400 Alexion Pharmaceuticals
11.900 Ambassadors
1 R7.307 310,825 80.860
ti79.8G4 351.480
6,509,228 163,076 1 10.281 184.251 121.1 10 138.454 2 16.8M Xl3.846 2 1.982 97.786
186,888 i33,Rm 166.318 395.480 794.056 94.721
204.304 134.?17 157.594 38.31 7
252.838 156.964 79.042
134,8627 145.932 215.109 145.004 134.51 3 147.092 154.1 23 131.951 65.193
128.601 21 0.325 151.514 65.1 17
11 0,579 134.755 108.551 182.080 173.144 21 1,452 137.769
78,610
0.23 0.50 c.12 c.97 C.48
8.81 0.22 0.15 0.25 0.16 0.1 9 0.28 0.28 0.03 0.13 0.75 0.lr3 0.22 0.54 0.40 0.13 0.28 0.18 0.21 0.05 0.34 0.23 0.1 1 0.1 8 0.20 0.29 0.20 0.18 0.20 0.21 0.18 0.09 0.17 0.28 0.20 0.09 0.15 0.18 0.15 0.22 0 23 0 29 0 19 0.1 1
25,876,738 35.01 186.77/ 0.76 128.648 0.1 / 162.540 022 27.360 004 42.111 0.06
272.835 037 89,993 0.12
254.076 0.34 29.116 0.04
102.456 0.14 185.759 0.25 67.920 0.09
152,6244 0.21 51.150 0.01
210.796 0.29 148.34? 0.?0 101,130 0.76
United States of America (cont) 7.900 atheriahealth 3.913 Bank of Hawaii 4,300 Barr Pharmaceulicals 4.500 Relden ?.300 Rerkshire liills Bancorp 7.500 Rroadridge Financial Solutions
16.300 Brocade Communications Systems 8.700 Brush Engineered Materials
14,600 Cabot 7.200 CARBO Ceramics
11,400 Casual Male Retail 6.1 00 Cbeyond
21.900 Cenlral Garden & Pet 6.500 Central Garden & Pet 'A' 5.933 Cepheid 5,400 Cheesecake Factory 6,700 Childrens Place Retail Stores 8,100 Chimcrn Investment 2.500 Clean Harbors 9,859 Clear Chaririel Outdoor
3.300 CommScope 400 Commercial Metals
700 Concho Resources 73.831 Coriseco :WOO Consolidated Cornmiinication 3,200 Constant Contact 8.900 Cooper 7,400 Corrections Corp of America 6,800 Crown 5.1 07 Cullen!Frost Rankers 1.000 Curks Wright 8.867 CVR Financial 5.600 DRVltil
2.1 00 Dick's Sporting Goods 4.800 Digital Realty Trust 3.100 Diamond Foods 1.500 Uover
60 Dialysis Corp Of America
16.1 73 Dresser-Rind 800 Dim R Bradstreet
33.257 Emulex 2,300 ESCO Technologies
15.1 24 Euronct VJorldwide 2.400 txterran
15,384 F5 Networks 11,800 FEI 4.600 Flotek Industries
2.100 Forest City Entcrprisos 3.1 00 Forest Oil
10.706 Gartner 1.800 Gen-Probe
13.700 Geo 6,500 Georye 2.600 Glohal Payments 1 .ROO Goodrich Petroleum 7.628 H&E Equipment Services 3.000 Haemonetics 1.335 Hcalth Care RElT 1.500 Health Net 4.100 HMS 6,100 Horizon Lines 3.500 I iuron Consulting 9.906 IDEX 2.836 lmmucor 4.500 IMS Health
10.81 6: lnformatica 9,600 Integrated Device Technology
530 FMC
8/.696 192.246 193.070 153,405 56,810 54,050
131,638 222,159 368.650 410.832 50.2562
108,092 98.331 26.000
170.697 86.994
243.1 1 1 77.112
179,625 17/.659
15.101 173.382
9,w 5 26.600
236.165 57.330 6o. 704
327.698 200.762 177.140 262.857 83,714 88.138
301.61 6 436
37.905 1(31,Y28 74.698
215.685 619,749 69.75?
393,430 10R.789 260.133 174.840 445.059 276.474
40.683 77.808
228.842 223,220 86.310
307.291 1 1 7,000 170.900 136.Z4 Y2.351
173,750 1 (33,124 37,200 89,298 61,854
155,575 353.218 77.01 1
103,950 170,1362 95,904
92.184
0.12 0.26 0.26 0.21 0.08 0.07 0.18 0.30 0.50 0.56 0.07 0.15 0.13 0.04 0.73 0.12 0.33 0.10 0.25 0.74 0.02 0.24 0.01 0.04 0.32 0.08 0.08 0.11 0.27 0 ?4 0.36 0.1 1 0.12 0.41 0.00 0.05 0.26 0.1 0 0.29 0.84 0.09 0.53 0.14 0.35 0.24 0.60 0.37 0 12 0.06 0.1 1 0.31 0.30 U.12 0.42 0.1 6 0.1 6 0.18 0.13 0.73 0.26 0.05 0.12 (1.08 0.21 0.18 0.10 0.14 0.23 0.13

Paye 15F Schroder Iriternalional Selection Fund Serrii-Arinual Report June 2008
Portfolio of Investments as at 30 June 2008 (cont) Schroder ISF Global Smaller Companies ( > c m )
Nurriber ol :;hares Transfcrable Securities arid Market “’2
or Principal Money Markel Instrumcrits Admitted Valuc Nct Amount to ari 0ltic;inl Exchange Listing USD Assets
United States of America (cont) 4.400 Interface
6,200 lriterpublic 4,900 Inlersil
17,800 Intervmvcn 3.000 Invcmess Medical Inricwatiori:; 1.100 Irivesiment Technology 5.600 Iriwstors fieri1 tstate Trust
800 Jacobs Engineeririy 2.598 Kansas City Southerri 5.400 Krioloqy
17,000 KV Pharmaceutical 3.300 Larriar Adverli:;iny
13.91 3 Lexicon Pharmaceuticals
1 1.800 lnternap Network Services
11,500 LK(1 4,400 I iurriiriex 9,300 Macrovision Solutioris 1.100 Mantech Interriatiori;il 8,000 MEMSIC 2.500 Mcrodith 4,400 Microsemi 5,900 Natiorial Hetail Properties 3.000 NeuStar 3,100 NII 1,300 Northeast Utilities 5,900 NorthWestem 8.800 ON Serriicoricjiic:lor
1,483 Orrriat lechriologics Y , ! m Pactlv
5,fiOO I’arallcl Petroleum
3.9L)L) Patterson 6,500 Perriyo 8.3% Pinnacle rritertairirrienl 6,900 Porlland Gcncral Electric
2.834 Psyctiialric Solutions
1.700 Range r{esourccs 8.137 Regis
15,736 Reinsurance :;roup of Ariiericn 3.:300 Reril A Center 4,368 Repihlic Aimays 5,500 Republic Seviices 4,921 RightNaw Technologes
4.500 Ross Stores 2.500 Ruddick 1,100 liPC
10.800 Online Resources
10.700 P m r c
14.877 Paranelric Technology
17.100 PSS Vdorld Nedical
76,800 ClLoylC
7.000 Rofiri % n u r lochnologics
4.900 >SAIC 25,706 Scientific Garries
Y./00 Serntech 7.500 Sierra Pacific Resourw:; 9.500 Skilled Hcaltlicarc Y,400 Skyworks Sululioris 6,100 Soriic
8.776 St. Mary Land & Exploratiori 1,000 Slaridard Micrwbystcms 5,752 :;Larichrd Parking 7.100 Sun Healthcare 1,000 SVB Financial 8.100 Synivctsc
12.500 tw telecom
17,l 16 SornicWALL
11.935 TI ICI
7.700 IJIL. 3,300 Unisourcc Energy
56.80.1 56,95G 53.441
120./36 156.920 101,31[)
53.384 54.53fl
11 3.091 58,860
321,810 123.0135 24209
206.540 (J1.1TU
140,406 53,7ti8 23.840 71.450
1 14,444 173.900 78.084
113.359 109.822 149,051 82,720 91.1 5? 71.317
207.1 08 ii9.229
11 2 ,8M 254.283 11 o.nti4 21 1 .575 09.921
I56.tiY0 286,055 107.94/ 391,012 110 126 21 8,885 684,359
G8 109 39 719
81,211 60.710
163.755 8/.1 15 18.114
10:3.488 781,462 138,710 Yti.150
125.685 89.964 M,748 I 12.623 556.047 43.440 ...,, 380 91.199
188,840 128.828 x35.71 ti 2u2.250 79.704
102.527
37.noo
r
0.08 0.08 0.0/ 0.10 0.21 0 14 0.05 0.01 0.09 0.1 5 0.08 0.54 0.1 i 0.03 0.78 0.12 0.19 0.0 i 0.03 0.10 0.1 0 0.1 / 0.1 1 0.20 0 15 0.20 0.1 1 0.1 2 0.1 0 0.28 0.05 0.15 0.34 0.16 0.29 0.12 0.21 0.39 0.1 5 0.53 0.15 0.30 0.93 0.09 0.05 0 22 0.09 0.08 0.22 0.1 2 0.02 0.14 1 .OB 0.19 0 13 0.1 I, 0.12 0.1 3 0.1 5 0.15 0.05 0.13 0.13 0.77 0.1 I 0.32 0 77 0.1 1 0.14
Number of shares or Priri(:ipal AriioiinL
Trarislerablc Sccurities and Money Market Iristrurrierits Admitled to an Official tx(;hanoe Listina
United States of America (cont) 8,000 United Natural roods 1.1 00 I J S Ccllular
34.6 15 Valueclick 7,641 Veeco Iristrurwnts 3,500 VeriSign
100 Vlad
1.500 Volcano 7.818 Voltcrra Semiconductor 5.000 W.14. Bcrklcy 1.600 ‘idabtec ;.403 Waste Connections 3,7(5 1 Watson Wyatt L\Jorl(lvdide WOO ‘&ll(:are Hcalth Plans 5,700 West Pharrririueulical Scrvices 5,195 Westariierica Bnricorporation
18,300 Vishay Iritenechnology
Total Transferable Securities and Money Market Instruments Admitted to an Official Exchange Listing
Number of share:; or Principal Other Transferable Securities Anourit not dealt on a Reciulatetl Market
Markct Y! Value Net W U Assets
161,040 0.22 61.215 0.08
527.533 0.72 129,209 0.17 1:37,titi:J 0.19
2.613 0.00 170.556 0.23 54.315 0.07
136,033 0.18 121,850 0.17 70.544 0.10
239.487 0.32 ?01,9lfG 0.27
78.510 0.11 293.882 0.40 292,279 0.40
70,353,185 95.18
Market B Value Ne1 US;n Assels
United States of America I .I ,000 Hruker 10.725 IAC Acquisition
Total Other Transferable Securities not dealt on a Regulated Market
182,515 0.24 181.580 0.21
935 0.00
182,515 0.24
Number of stidre:; Market SS or Priricipiil Open-ended Golleclive Value Net Amount Irivestrrieril Scncmos USD Assets
United States of America 376,380 0.51 5.400 ishares Russell ?On0 Iridex h i i d 3 K 3 8 0 0.51
Total Open-ended Collective Investment Schemes
Number of shares or Priri(;ipiI Amaunt Uerivatiws
Japan 13,000 Oowa Miriirig Right:; 2!3,’01:2010
Singapore 31.6?5 Goodpack Vvarrants 16U7:2009
Total Derivatives
Total Investments
Other Net Assets
376,380 0.51
Market U& Value Net US0 Assets
4,746 0.01 4.746 0.01
5,813 0.01 5.813 0.01
10,559 0.02
70,922,639 95.95
2,992,223 4.05
73,914,862 100.00 Net Asset Value

Schroder lntcrnntionnl Sclection Fund Semi-Annual Report June 2008 Page 157
Portfolio of I nvestrnents as at 30 June 2008 (cont) Schroder ISF Global Technology
Nurnbcr of shares lranslerable Set:iirities arid Market qt Number of sharcs Market ?& or Principal Money Market Instrunients Adrriitted Value Net or Principal Othcr Transfcrablo Securities Value Net Amount to an Official Exchange Listing lJSD Assets Amount not dealt rn another Regulated Markot USD Assets
Bermuda 70.690 Marvel1 Technology
China 12.1 25 Focus Media ADR
Finland 22.382 Nokia ADR
Germany 28.607 Aixtron ADR
Japan 3,800 Nidec 4,655 Nintendo ADH 6,600 Nitlo Uenko
South Korea 954 Samsung Elcctronics GUII 144A
Taiwan 40,810 HON HA1 Precision 1ndi.istry 22,000 Richtek Technology
United States of America 34,160 3PAR 33.948 Advanced Micro Devices
11 ,603 Arritech Systems
23,187 Applied Materials 25.81 8 Brocade Communications Systcrns
37,729 Cisco Systems 14.156 Citrix Systems 15.075 Cognizarit Technology Solutions 12.042 Corrirrivaiilt Systems 21.564 Corning 73.078 Dell
7.402 Aknrnai Technologies
1,591 Applc
8.526 Ciena
5.280 Dolby Laboratories 6.110 eBay
10.572 Electronic Arts 35.144 Forrrifactor
695 Google 15.525 Hdett-Packard 12.136 Intel 18.143 Keriexa ij.960 I am Research
13,40/ I exmark International 7.385 MEMC Elcctronic Materials
10.821 Microsolt 12.670 Moriolittiic Power Systems
1.300 National Scrniconductor 31.117 NetApp 28.249 Oracle 8.558 QUALCOMM 7,408 Ri.ibicori Technology
18,032 SanDisk 48.077 Sonus Networks 19.648 Taleo 18.81 4 lgssera Tec:hnologies 10,671 Ultimate Software
Total Transferable Securities and Money Market Instruments Admitted to an Official Exchange Listing
365,799 1.88 United States of America 336,975 1.73 114 000
1 A.041 Maxim Integrated Products 336.851 1.73 365.799 188 11,415 I-Web 144A Frefererice
327,981 1.68 377,981 1 68 Other Transferable Securities
not dealt on another Regulated Market 338,975 1.73 s 7 . m 2.76 537.839 2.78
318,396 31 8,396
837,847 254.075 379.1 09 254.662
282,623 ?W.6?3
371,972 200,950 171,014
14,453,671 294.41 7 ?01.991 255.81 3 124.152 211,123 417,277 213.257 ?03.7/1 890,782 421.840
205.315 505,676 513.486 207.768 168.597 464.534 483.404 367.000 692.1 05 267,250 357.961 258.355 448,4M 468.684
1.376.554 272.532 149.577 694.630 601,471 390.673 157,526 346.755 172.751 384.865 307,707 391,732
495.817
1.63 Total Investments 1.63
Other Net Assets 4.30 1.30 Net Asset Value 1 .69 1.31
1.46 1.46
1.91 1.03 C.88
74.21 1.50 1.03 1.30 0.63 1.39 2.30 1.09 1-03 4.57 2.1 / 2.55 1.05 2.60 7.64 1 .oi 0.87 2.39 3.38 1.88 3.55 1.37 1.84 1.33 ?.A0 2.40 7.07 1.40 0.77 3.57 3.09 2.01 0.81 1.78 0.89 1 98 1.58 2.01
17,496,128 89.83
17,833,103 91.56
1,644,169 8.44
19,477,272 100.00

Page 158 Scttroder International Selectiori Furid Serni-Annual Rcport Jurie 2008
Portfolio of Investments as at 30 June 2008 (cont) Schroder ISF Greater China
Numbcr of shares Traristerable :Securities and Market 3: or Principal Money Markel In:;lrunwnts Admitted V k ~ e Net Amount 10 an Oiticial &change I istirig USD Assets
China 31.088.000 Advdriced Serniconductor
Manutacturing 'H' 407,200 AirMedia AUI {
0.200.000 AnLa Sports Products 8.44 1,500 Asia Cement Ctiiria 12.294.000 Reijirig Jirigkelong 'H' 12,729,500 UYL) tleclronic International
660.000 China Coal Energy 'I I' ll/H,000 China Corrirriurticatioix Construction
'H' 21 .i89.000 (:hiria (;onstruction Bank 'H' 8.55ii.OOI3 Ctiiria I Iiyh Speed lransmission
4.1 /0,000 Chiria Life lrisurnncc 'H' Equipment
62.000 China National Ouildiriy Material 'H' 33.000 China I 'etrolcum & Chemical 'I I /Y.ocK, Ctiiria Strerrhua triergy 'H'
28.890.000 China Teiecorri I I' 31,873,000 Uongfeng Motor ' t I ' 7.360.000 Franstiion Properties China 8.(32(3,023 Guangdong Clectric Povw
Oevelopinent 6,287,473 Hangzhou Stearri Ttirbirie 7,849,000 Hidili lndustb Iriterrialiorial
Deveioprrierit 40.81 0.000 Huadian Power Interriatiorial
000 I luarieriy Power International 'H' 998 I luarigshari Tourism Ucvclopment
2,089.477 Humin Cement 29.841.000 Industrial & Commercial l3arik 01
Ctriria I1 5.084.000 Jiangsu Fxpr3ssway I 1. 9.4f2,000 PetroChina 'H' 14,396.500 Sharidong Chcnming Paper 'H. 23.38ti.000 7ijin Miriiriy 1,974.7tiO TTE 'H'
Hong Kong SAR 24.940.000 AAC Acoustic Techrioloqy 32.00ti.000 Apac Resources
10,/83.300 BOG I lorig K ~ i y 17.13?.000 Ctieri I Isoriy
4,1?6,000 Ueijirig Enterprises
?,til iri.000 Cheuriy Koriy 5258.000 China Ir1frastruc;ture Machinery 3,950.000 China Insurance Interriatiorial f,458.000 China MCIIYIIIU Dairy /.58d1.000 China Mobile
3.r-ifJ7.000 Ctiiria Ilesvurccs Enterprise 842.000 China Ovcrscas Land & Iribestrrienl
20.856.000 China Tirig 12,100.000 Ctiiria lhiicorri 23.B40,000 CNOOC
i4.756,OOO Dynasty Finc Wines 978.000 Dah Sing Firiariual
8.654.000 Fubon Bank Hong Koriy
1,377,000 Hopev:cll
3.536.600 istiares Asia Irust - [Shares FKE:
702.00ti Hang Lung
391.000 Hutchisori Vdtlarripoa
Xinhua A50 China Tracker 71 7.430 Jardine Mathcson
2.195.000 Kerty Properlies 19,517.777 Kingway Brcnerg 11.784.500 Lurig Kee iBCrmUdaJ 2, /4Y.300 Ports Uesiqri 7,780.000 r'ublic Financial 8,530.000 Shangri-l a Asia 1 .O62.000 Sur-) Hung Kai Prouerties
312,139,523 25.21
995.94Y 0.07 5.928.832 0.41' 4.85/.22/ 0.38 5.444.313 0.44 4.039.3 12 0.65 7.558.!!/3 0.61 9.8Y8.886 0.80
22,369.314 1.81 17,544,963 1.42
17.552,iYb 147 14.59D.681 1 .I8 12.620.047 1 02 14.352./0/ 1.19 13,549.371 0.89 14.618.815 1.18 12,/31.871 1.03 2,802,785 0.73
3.(jYo,836 0.30 i,//1,564 0.63
13.687.01 5 1.1 1 10./26.443 0.87 9,453.10u 0.7u
4.801.618 0.39
70,050.414 1.52 Y.35Y.814 0.70
487,aa7,37~1 39.40 2o,838.688 I .FD 3,ii10.673 0.29 13.4G3,'342 1.09 28.551,91!3 2.3 1 5,180,028 0.42
:35,252.9!31 2.85 4.887.808 0.39 9..120,318 0.{6 18,299,7T8 1.48 101.6?7.419 8.2 I
1 .33(!.082 0.1 1
7.174 0.27 27.465,15ci 1.31 40.6//.617 3.29
/,88/,5(J? 0.64 2,592,058 0.21 7 ,(?95.<Hl 0.57 3.1 18,860 0.2tj fi,nufi,>2u 0.54 3,970.700 0.37
8.529.861 0.53 22.025.101 1.78 11.5~5,080 0.93 2.727.739 0.22 5.384,077 0.43 I.tldl.rj57 0.63 5,127,412 0.41
IY .YO5.53J 1 .B1 14.4GG.739 l . l B
Nurriber ot shares Transferable Securities and Market :b or Priricipal Money Market lrisIrurrien1% Admitted Value Ne1 Arnuunt to ari 0ffic:ial txchar-igc Listing LJSU Asscts
Hong Kong SAR (cont) 7,855,500 %dire Pacific 3.2U8.000 1 ingyi (Cayman Islands)
3.1 39.000 LthLhou CSR Times Electric 453,000 Win{] I lariy Bank
Malaysia 40.926.000 Samling Global
Singapore 4 ,SI 8.000 Yarilorti L:l~.id
Taiwan 2,007 ,-<-
3.863.91 8 Cak;hcr Technology 1 8.820.oY2 Cathay I-irlaricial 8,3D7.000 Chinatrust Firiaricial 14.1 76,000 Chunghwa Telecom
8,583,000 Far Eastern Tcxtile 4.31 7.000 Formosa Plastics
5.238.000 KGI Securities
, d t ) Advanced Semiconductor Engineerincj
24/.500 (;tiurlytwa -rciecom ADR
10,542,894 HON HA1 Precision Industry
61 :3.640 Largan Precision 140,000 Mediilck
3,123.290 Nari Ya Printed Circuit Roard 2.940.707 Nov:ilek Microelectronics 15.64S.000 SiIi(:orr~&~re I 'recision Industries 45,519.000 SinoPac ririarwil 1 cj,t314,000 laiwair Cement 1 6.835,Ol 1 liliwan Mobile 4 1 ,0/4.4Y> T;liweri Semiconductor Manufactuririy 14,5[37.000 Yuanta ririaricial
Total Transferable Securities and Money Market Instruments Admitted
2Y.199.026 2.36 4.078.480 0.33 G.000,MB 0.48 2,s04.051 0.21
6,401,985 0.52 6,401,985 0.52
6,281,145 0.51 6.281.145 0.51
412,296.524 33.30
1,803,195 0.16 10.980.366 0.89 38,131,722 2.92 8.0/4,872 0.35 38.854.018 2.96 6,078600 0.4Y 11,181,082 0.90 10,408577 0.84 51.915.768 4.19
7.447.:303 (Hi3 8,530.Yti2 0.69
15,637,025 1.26 8,513,161 0.69 23,061,874 1.86 19.715.904 1.59 22,438,361 1.81 31,329,233 2.53 87,939,159 1.10 10,21G.939 0.83
3.81~.905 0.31
1,225,008,555 98.94 to an Official Exchange Listing
Number of shares Market % or Principal Value Net
USD Assets Amount Ilerivntives
Hong Kong SAR 6,175,623 0.50 18.!3D5.000 China 30 ETF Vdarrarits 10/0t3,'2013 8.1 /5.673 0 50
Total Derivatives 6,175,623 0.50
Total Investments
Other Net Assets
Net Asset Value
1,231,182,178 99.44
6,924,755 0.56
1,238,106,933 100.00

Schroder International Selcction Fund Scmi-Annual Repnrt June 2008 Page 159
Portfolio of Investments as at 30 June 2008 (cont) Schroder ISF Hong Kong Equity
Nurriber of shares Transferable Securities and Markct ?? or Principal Money Market Instruments Admitted Value Net Amount to ari Cmicial Exchanae Listina HKD Asscts
China 3.337.000 China Coal Energy 'H' 3.502.000 China Communications Construdion
3.01 8.000 China National Building Material 'H' 7.334.000 China Oilfield Services 'H'
'H'
101.8W Clrip.com Interriatiorla! ADR 458.800 E-House China AOR
76.378.000 Franshion Properties Chtria 4.1 88.950 Hanghou Slearri Tiirhrie 7,342,000 Jianqsu Expresswy 'H' 5.150,000 Shandong Chenming Paper 'H.
Hong Kong SAR 11,088,000 AAC Acoustic Technology
951,500 ASM P;lc:ific Technology 5,752,000 ROC Hong Kong
13,790,000 Champion H t l l 10,660,000 Chen Hsong 1.775.000 Cheung Kong 6,228,000 China lnsurancc lntcrnational 4.40/.000 China Mengniu Dairy 3.730.500 China Mobile 6.500.000 China Overseas Land & Investment 7.484.000 China Unicorn
5,659.200 Dah Sing Banking 588.800 Dah Sing kinancia1
17,299,000 CNOOC
17,730,000 Denway Motors 1.420.000 Esprit
17.450.000 First Pacifir: 3.01 1.000 Hang Lung 1 .I 00,300 Hang Seng Rank 1,302.000 Hongkong Land
836.000 Hutchison Wharripoa 921,218 Jardine Matheson
1.879.000 .Jardine Strategic 2.327.500 Kerry Propcrtics 2,357,000 Li & Fung 4,657.000 Mandarin Drierital lriterriatiorial 4.873.000 M 1 H
10.020.800 Noble 6,908,000 Public t inancial 5.000.000 Shangri-La Asia 2.626.000 Sino Land
2.5/1.500 Swire Pacific
1.947.000 TclcJision Broadcasts
425.000 Sun Hiing Kai Properties
420.500 Wing Hang Hank
Singapore 1,124,000 CapitaLand 6,463,000 Capitanetail China Trust 3.879.000 Yanlord [.and
Total Transferable Securities and Money Market Instruments Admitted to an Official Exchange Listing
Total Investments
Other Net Assets
Net Asset Value
514,501,852 45,516.680
46,716.680 45.270.000
102,676,000 37.379.090 37,571384 78,342,660 40,381.478 46.915.380 33,732,500
3,873,752,449 72,293,760 55.995.7i5
118.778.800 49.781 300 35.407.800
134.002.500 115.810.800 97,394,700
334,556,400 80 ,080,000
108,368,320 232.1 52.580
78.323328 37,035,520
1 15.020,000 85354.000
104,33 1 ,150 1 RO.YYY.350 143,601,397 65,709,000
220.569.409 245.350.327 95.31 1.125 55.389.500 83,855,787
119,632,150 135.020.276 35,507,130 91,000,000 40,703,000 44.965.000
205.555.625 88,352.01)c) 87,615,000 43.437.850
133,642,738 46,541,731 45.952.963 41.148.044
51 ,862.300
4,521,897,039
4,521,897,039
129,431,249
11.06 0.98
1 .on 0.97 2.2 1 0.80 O.81 1.68 c.07 1.01 0.73
83.29 1.56 1.71 2.56 1 .08 O.(/ 2.88 2.49 2.09 7.78 1.77 2.33 4.99 1.68 0.80 1.11 2.47 1 .85 2.24 3.89 3.09 1.41 4.14 5.77 2.05 1.19 1.37 2.57 2.90 0.76 1.96 0.88 0.97 4.42 1 .YO 1.88 0.93
2.87 1 .oo 0.09 0.88
97.22
97.22
2.78
4,651,328,288 100.00
Schroder ISF Indian Equity
Numbcr of sham Transferablc Securities and Market %
or Principal Money Market Instruments Admitted Value Net Amount to an Official Exchanae Listina USD Asscts
India 3.630 Aban Offshore
21 3,300 Asahi India Glass 784,000 Asccndas India Trust
11.600 Rajaj Holdings and lnvcstmcnt 14.600 Dajaj Finserv
140,171 Hharat Forge 13.81 6 Rharat Heavy Electricals 89.515 Hharli Aifiel
288.948 Cairn India 56,500 DLF 15.500 Dr Reddy's Laboratories 97,000 OS Kiilkarni Developers
6,870 rducomp :Mitioris 101.200 Glenmark Pharmaceuticals 94.800 HOFC Bank 01 ,730 I lousirig IJeveIopmenl finance 93.250 IClCl Rank 71,055 IClCl Hank ADR 83.51 1 lnfosys Technologies
61 2,000 Infrastructure Development Finance 561.240 ITC 189.01 1 IVRCL Infrastructures & Projects 13.020 Larsen & Toubro
105.080 Mahindra R Mahiridrd 58.300 Maruti Su7iiki India 77.000 Nayarjuna Construction 78.520 Nicholas Healthcare 7.852 F'iramal Lifc Sciences
282.1 09 Ranbaxy Laboratories 14.1 80 Reliance Capital
170.71 0 Heliarice Commimcation 108.1 20 Ileliance lndustrics 184,260 Satyam Computer Services 88.920 Sobha Developers 44.090 Sterlite Industries India 20.300 Tata Power
391 ,510 Oriitech 301 .I 00 Zee Entertainment Enterprises
United States of America 72.090 Coynizanl lechnology Solutions
Total Transferable Securities and Money Market Instruments Admitted to an Official Exchange Listing
Total Investments
Other Net Assets
Net Asset Value
48,786,649 212.878 272.725 521.618 147.119 187.386 765.398
2,365.009 1,499,540 1.843549
520,186 707.836 223.820 399,627
1.496,55? 2.218.128 3,720.81 5 1,.764,o09
624.46 1 3.368.759 1,471.899 2,448,052 1,333,240
660.662 1,192,355
834,859 221.253 556.233 4/..?80
3,427,177 916,441
1,755,670 5.261.355 1,869,562
577.551 7 14.5 14 498,365
934.154
726,540 726.540
I ,558,583
49,513,189
49,513,189
1,960,830
94.78 0.17 0.53 1.0.1 0.29 0.35 1.49 4.59 2.91 3.58 1.01 1.30 0.44 0.78 2.91 4.31 7.25 2.65 1.21 6.54 2.86 4.76 7.59 1.78 2.32 1.62 0.44 1.08 0.09 6.66 1.80 3.41
10.27 3.63 1.12 1.39 0.97 3.03 1 .SI
1.41 1.41
96.19
96.19
3.81
51,474,019 100.00

Portfolio of Investments as at 30 June 2008 (cont) Schroder ISF Japanese Smaller Companies
Numtwr of shares Transfcrable Securities arid Markct % or Principal Money Market lnstrurrierits Atlrriilled Value Net Amount Lo a r i Ollicial txclhangc Listing .IPY Assets
Japan 48.500 Aeon Fantasy
80 000 Airporl facililics 59,100 Alptia;Japari
86.700 As One
47.700 Atriiim 35.600 Hank of the Rykyus 3 1,000 Canon Machiiery 20.500 Capcorri
226.000 Ctiiiyoku Marine Paints 1U.000 (:reate SO
141 .ooo riai-nan 58. 100 Daihiru
13/.000 Daitiatsu Diesel Mariiitricluriny 155,700 DC 445.000 nsriki Kagaku K o y j . ~ KK
107,000 DOWA
78 200 Enplas 28.900 Exedy 83.500 Ferrotec
266 900 Aim Kogyu
11 B.500 Arcs
156.000 Asics
I nlsco
2at3 tnOLeca
286.400 Fujikura Kasei 430.000 Furukawa-Sky Aluminum
88.700 Hakuto 184.800 Hard Off 53.200 Hi-LEX 19.700 HIS
42.400 lcorri 1 8.Uio0 Iriaba Deriki :;ilriyyo
100.800 Hudson Sotl
853 Intelligence 147,000 Japan Aviation Electronics lridustv 187,000 .ICH I’harrnaccuticals 49 ,000 Kissei Pharrnaceutical 45.800 Koa 4ij,500 I intec 80,900 Maxvalu Tokni
1,332,000 Minato Bank 40.400 Mirai Iridiistry
281,000 Mitsui Home 10~1,500 MlSUMl
1 fiS Money Partners 80.90(:) Musashi Seirriitsu Iri(liisLry
11 0,000 Nafco (32,000 Nagasc & Co. 96,300 Nichi iko t’harmaccutical 3/,200 Nichiha
100.100 Nidec C:ol)al 32.000 Ninon Parkcrizing
200.000 Nippori Chcmiphar 138.000 Niplion I hompson 14/.600 Nishirriatsuya Chairi lf4.200 Ni:jhio Rent All 11~.000 Nissa). D ~ v J ~ tierieral Irisurarice 12s.500 Nisshin FudosaWJapari 43,?00 Nissiri I lealttimre foocj Seriwx
105.800 Nissin Kogjo 4Y.400 Nitta 69,700 PlOlaX
15.200 Ryosan 22.400 Sakai Moding Sewice 13,000 Saltata INX 50.100 Sanci-International
173.000 Sanki tnginccring 301,000 Sariyo C;pet:ial Steel 125.400 Sato
2i1,400 rmnd
9,978,183,100 57,00‘j.000
249.81 8.400
1 ti5.4:30.000 154.T41.000 180.648.000 50.757.800 30.881.600
1 OG.950.000 63,550,000
1 d54W.000 56.64?.000 7 1,063,000 ti8.4G9.900
lY8.400,000 18,422,700
1 /5.724.0 120,781 ,(I 8271 1 ,0 62.1 fi0.000 9!J,/9a.000 80.7/5.300
126.085.000 283.23Y.ij00 124.890.000 86.~182.500 12,841,600 /B.B0Y.000 31.303.300
181.137.ti00 113.420.000 5 1,48i).000 52,535,000
13ti..‘,f3.000 94, ti12.000
1 16,375,000 35.014.800 85,792,500 !W.058.000
277,056.000 33,313,600
706,387,500 150.335.000 16,830,000
198.99 1.500 181.500.0L‘0 102.948.000 238.5635.500 34.782.00ti
13ti.336.500 55.29ti.000
1 00,000,0(30 9 3.5ij4.000
I ~10,220,000 232.333.000
tiT,850,000 R5,134,500 50.544.000
170.443.800 11~1,381,000 144,279,000 5Y.268,000
103,056.000 57. ,144.000 5 .:,04.000
83.1 iiii.000 14Y.d3!,.000 1 il.5/0,000
99.65 0 58 2.51 0.58 11.50 1 .rib 1.55 1.80 0.51 (1.37 1 .UT 0.63 1 .a5 0.37 0. 11 0.fi8 1 .t38 0.48 1.76 1.21 0.83 0.62 0.96 0.81 1.26 ? 83 1 .P5 0.85 0.73 0.77 0.31 1.81 1.13 0.51 0.52 1.36 0.95 1.16 0.38 0.86 0.!39 2.7/ 0.53 2.08 1.50 0.1 : 19 ; 1 .8l 1.03 7.58 0.35 1.36 0.55 1 .oo 0.un 1.40 7.x 0.88 065 0.50 1.70 1.14 1.44 0.59 1 .03 0.57 0 .K 0.83 1.3!3 1 .i’l
148,878,401) 1.30
NLrriber of share:; or Friricipa Amount
Japan (cont)
Iran::ferablc Securities and Money Market Instruments Admitted to ari 0ffic:ial t x d w i y c Listing
40.500 Sccom Techno Service 10.900 Sthima Sciki Manufacturing 11,900 Siurriicla
139,000 Sumitomo Osaka Cerrierit X.700 Sysmex 40.600 T&K Toka 17,500 Taiyo lrik M;inulacturing
134,700 ?dnkel tluilding 108,300 lokyo l b n k Bank 57.100 low 98.400 Traricorri
51.900 Tsuruha 62.000 Union Tool 82.600 Yamatake 68.100 Yarnato lnternatiorial
i5.900 Zukeri
11 8.500 Trusco Nakaynmn
331,000 Yokoyawa Bridge
Total Transferable Securities and Money Market Instruments Admitted to an Official Exchange Listing
Nurriber of shares or Friricipal Amount Uerivativcs
Markel $b Value Net
JPY Assets
121.500.000 1.21 31.501.00o 0.31
114.513.000 1.14 100.531.000 1 .00 107,476,000 1.07 53,795,000 0.54 40.425.000 0.40 90.767.800 0.91
218.852.000 7.18 31,405.000 0.31
13B.Y48.000 1.57 188,333,500 1.88 180,812,000 1.80 151,580,000 1.91 P78.576.000 2.28 35,978300 0.37
236,331,000 2.36 18,431,300 0.76
9,978,183,100 99.65
Market db Kluc Net
.IVY Assets
Japan 620.000 Doma Miriirig Rights 29:01;2010
Total Derivatives
Total Investments
Other Net Assets
Net Asset Value
23,932,000 0.24 23.t)32.000 0.24
23,932,000 0.24
10,002,115,100 99.89
10,543,140 0.11
10,012,658,240 100.00

Sc!iroder Iriterrratiorial Selection Fund Seriii-Annual Report Junc 2008
Portfolio of Investments as at 30 June 2008 (cont) Schroder ISF Korean Equity Schroder ISF Latin American
i
Number of shares Transferable Securities and Market 70 Nurriber of shares Transferable Securities arid Market 0.6 or Principal Monev Market lnstrumcnts Admitted Value Net or Principal Mnriey Market Iristrmierits Atlrriitted Value Net Amourit to an Official Exchange Listing USD Asscts Amount to an Olticial Exchange Listing I J W Assets
South Korea 2,400 Atnorepaciltc 7.003 CJ CheilJcdang
8.000 Doosan Heavy Industries and 52.300 Dongbu
Construction 30,000 Doosan lnfracore 20,745 Hana Tour Sewicc 30.000 Humax 50.000 t-lyriix Serriiconductor 17,000 Hyundai Engineering X Conslructinri
15,000 I lyiiridai Mohis 35.W6 Hyundai Motor 45.000 Kookmin Bank 40.007 Korca Electric Power 60.030 Korea Exchange Bank
9.863 Koreari Air Lines 7,113 Koreari Reirisurarice
6.500 Hyiindai Heavy Iriciiistrtes
27.470 KI&G 17.770 LG 17.000 I G Chem 34.860 LG Electronics 50.000 LG Fashion 40.000 LG Inlernational 15.660 LG Life Sciences 30.000 LIG Non-Lifc Insurance
13,000 Mirae Asset Securities 5.000 MergaStudy
150.000 ON'Media 8,500 POSCO
20.000 Samsung CB I 30.000 Sarnsuriy Elet:tro-Mechanics 11 , I 13 Samsung Electronics
30,000 Samsung Heavy Iridustries 25.965 Shinhan Financial
2.000 Shinsegae 15.000 SK Energy 4.933 SK Ielecorri
50.000 Woori hnance
4.009 Sarnsung Fire & Marinc lnsurancc
11 0,000 Synopex
Total Transferable Securities and Money Market Instruments Admitted to an Official Exchange Listing
Total Investments
Other Net Assets
Net Asset Value
57,649,722 95.52 Argentina 1,483,828 2 45 813.011 Telecom Argentina ADR 1.877.477 3 07
99799ti 184 Bermuda 200.134 Credicorp
755,653 867,284 Ei87.805 377.102
1.192.834 1,137,770 ?.I109.350 1 21 2.1 93 2.1 11.7 18 2,653.373 1 .I 73.758
821.897 462,900 24,293
1.151.210 1,621,983 3,941,332 1.350.603
875.8/1 735.914 71 5.581
1.580,002 1.271.348
523.089 4.41 1,793 1 ,080,050 1,110.581 5,626,872
835.765 1,067,646 1,171,762 1.074.375 1,557.303
896.610 643,354 794.293
7,358,840
1.25 1.44 Brazil 1.14 0.67 1 .YB 1 .07 3 33 2.01 1.00 4.40 1.94 1.36 0.77 0.04 3.91 1.91 2.89 F.53 2.25 1.45 1.30 1.19 2.62 2.11 C.87 7.31 1.79 1 84
1 C.98 1.35 1.77 1.94 1.78 2.76 1.49 1.07 1.37
57,649,722 95.52
57,649,722 95.52
2,701,649 4.48
60,351,371 100.00 Chile
3.832.329 Banco Bradesco ADR 505,687 Banco ltau Holding Financeira ADR 40.700 Corriparihia de Retiicfas das
Americas
3.1 34,66:, Rradespar Preference
2.005.936 Camargo Correa Dosenvolvimento
434.063 RR Malls Participacoes
15.033 Brasil Brokers Participacoes
lrnobiliario
Americas Preference ADR
Rocioviarias
Gerais
Gerais ADR
392.945 Companhia de Bobidas das
1 .I 93.1 78 Companhia de Con
537.659 Cornparihia Energetica de Minas
1 ,081,282 Cnmpanhia Energetica de Minas
2.346.425 Companhia Vale do Rio Doce ADR 3.31 U.629 Confab Industrial Preference 1,684,239 Eletropaulo Metropolitana Eletricidade
de Sao Pai.11~ Preference 147.000 Emprcsa Brasileira de Aeronautica
ADR 3,167,936 Gertlau ADR
7.374.601 lrivestimenlos Ilau Preference
3.045.807 Petroleo Rrasileiro ADR 708.800 Perdigao
948.1 00 Suzano Fapel e Celulose Preference
731 300 Tele Norte Leste ParticipaCbes 950,100 Tele Norte Leste Participaqoes
67.485 Tam ADR
Preference 1,198.281 Tim Participaqdes 1.150.854 lractebel Encrgta
4,700,669 IJnibancc - IJniao de Rancos 573,600 I Jltrqmr ParticipaCiies Preference
Brasilciros 51 7,675 IJsirias Siderurgicas de Minas Gerais 11 4.325 Usinas Siderurgicas de Minas Gerais
103.91 6 Votorantirn Celulose e Papel AIIR 763.976 Weg
I 'retcrencc
231.787 Banco Saritander Chile ADR 60.825 Centros Corrierciales Sudarnericanos
R.122.442 Empresa Nacional de tlectricidad 108.266 Empresa Nacional de Electricidad
796.952 tmpresa Nacional dc
201.600 Socicdad Quimica y Mincra de Chile
3!3,303 Snciedad Quimicn y Minera de Chile
ADR
Telecomuriicaciories
ADR
Preference 3.375.416 Vina Concha y Tor0
Colombia 727.170 BanColombia ADR
12,607.1 46 12.607.14E
16,046,747 16.046.747
971,089,952 78,945,977 10.285.674
2.438.49)9 4.7R4.010
83,748.71 1 13. 102.8/6
11,417,051
24.553.771
23.G64.820
1 1,089,481
26.123.773 69,548,037 14.35 1.408
39.735.653
3,945,480 73.242.880 18.832.048
325. i69 48,451,989 19,488,449
172,384,050 15.526.01 3 1,281.540 6.775.860
73.845.94 1 4,512,075
17, 131,682 20.012.497
60.075.185 24.493.667
35.789.220 2,809,887 9,557.204
55,685,966 9,684,081
186.675 8,925,870
8.66025'3
10.900.1 88
a.525.fi00
1.836.603 5.965.71 0
22,905,855 22,905,855
0.72 0.72
0.92 0.92
55.82 4.54 0.59
0.1 4 0 75 4.n1 0.19
0.6f1
1.43
1.38
0.61
1.50 4.00 0.83
7.78
0.23 4.21 1.07 0.03 2.67 1.12 9.91 0.89 0.07 0.39
1.37 0.26 0.98 1.15
3.45 1.41
2.06 0.16 0.55
3.20 0.55 0.01 0.51
0.50
0.63
0.55
0.1 1 0.34
1.32 1.32

Page 162 Schroder Iriternalior-ial Selectloti Fund Serrii-Aririual Report June 2008
Portfolio of Investments as at 30 June 2008 (cont) Schroder ISF Latin American (cotlti Schroder ISF Middle East
Number of shares .Translerable Securities and Market B NLrnber ot shares Transferable Securities and Market (41
or Principal Moriey Market Instturncnts Admitted Value Net or Priricipal Moncy Market lnstrurrierits Adniitled Value Net Amount L o an Ollicial Exchange Listing US0 Assets Arrioiirit to an Official rxchariye Lisliriy USD Assets
Luxembourg 456.022 Icnaris AOH
Mexico 2.690.9tiY America Mo~i l ADR 7,771,052 Cernex ?.784.587 (.:oritroladora Comercial Mexicaria 3,533,849 h r p MoCtCml~a 2.257.600 Corp GEO 1,577,887 Uesarrolladora Homex 2,277,150 Empresas ICA 1.31 0,486 Forrierito Ecoriorriico Mexican0 ADR
3,377,912 Grupo Finariciero Uariorte i 2 Crtipo Mexico
1 ,97!70 800 Grupo Modclo 113.430 Grupo Televisa AUti
3.772.i58 Megacable
7,181.327 LVaI-Mart de Mexico
2.252.457 (;fll~Jo timbo
?9 Teleforios de Mexico ADH
Peru 300.34d Comparihia de Mirias Huenavcntura
ADR 3.460.348 Volcan Cia Minera
United States of America USD 91.181 Goldrriari %(;tis Lero Coupon
14:05:?010 21 1,900 Southern Copper
Total Transferable Securities and Money Market Instruments Admitted to an Official Exchange Listing
Numbcr of shares or Principal Ott ier Iranslcrablc Securities
32,965,830 32,985,530
369,752,025 141,325,303
19,05(3,3i9 8,405,837 8.239,2ti0 7.488,4 i?
15,715,559 11,163,858 57.087594 1 4 .61 5.1 8 ti 13.61 0.722
168 9.722.829
1 8.400,954 10,841.932
881 28.3;13.7nD
26,084,605
19,3tG7.184 5,71:.421
91,997,702
68.934.506 23,0ti3.196
1,599,115,828
Market
1 .E9 1 .80
21.25 8.14 1.10 0.48 0.47 0.43 0.90 0.81 3.32 0.84 0.90 0 00 0.56 1 .uti 0.01 a.00 1 .B3
1.50
1.1 1 0.39
5.30
3.57 1.33
91.92
Value Net Arriounl not deat on another Regulated Market I J X Assets
Colombia 11,268,687 0.65 1,700,507 Al~iia(;eri~ Exito GDR 11,2B8.687 0.83
Total Other Transferable Securities not dealt on another Regulated Market
Number of shares or Principal Amount Derivatives
11,268,687 0.65
Market % Value Net lJSD Assets
Brazil 77,369,090 4.45
04!0:35'010 i / .36G 990 4.45
Total Derivatives 77,369,090 4.45
103.01 1 MSCl Daily TR Net Brazil Warrarits
Total Investments
Other Net Assets
Net Asset Value
1,687,753,605 97.02
51,891,750 2.98
1,739,645,355 100.00
Bahrain 1 AI-Ktialeej Development
2,742,000 Gulf ririaric:e Housc 83.574 Gulf Finance House GDH
Egypt 337.378 Commercial Iriterriatioria Bank 259.438 Commercial Iriterriational Bank CDR 1 13.339 C)rascorri Construction Industries
c;IlI4 4.0 15.032 Telecorii Egypt
Israel 1.481.569 Bank t-lapoaltnl 1.547.033 Bank I eurrii I. e- Israel 8,797.938 Bczeq Israeli TelecorrirriLiIiic~itio~~
371 ,815 Delek Automotive Svsterns I , I2 1 830 Israel Cherriicals 1 .2/7.78? Maktilesllim-Again Industries I , 152.408 Teva Ptiarrriat:eutical Industries AOR
Kuwait 2.948.1 25 Corrirriertxl Bank of Kuwait 0.109.000 Kuwait Finance House 5,701,831 Kuwait kiriaricial Center 1.1?2.:500 Kuwait Investment Projects 2.308,Wl Mobile TelecorIirriuiIiC81ioins 4.405.275 National Hank of Kuwait
Oman 3.751 370 National Rank Of Orriari
Qatar 284.1 16 (hrrirncrcial Hank of Qatar 302.1 12 Iridustrie:; Cl~tar 1 ijl,703 Oatar Islamic karik 1 ~ 5 . 7 5 0 Ontar National Bank
14.784 (Mar Iclccom 0-Tel
Switzerland 57.51 2 Orascorn Developrrierit
Turkey 849,219 Ariadolu ties Biracillk Ve Malt Sanayii
93fi.801 Eregli Derriir ve Celik kahrikalari
60 Otokar Otobus Karoseri Sanayi
1 ,805.951 Anadolu Hayat Erneklilik
1,541,800 Tufas lurk (3tomobil Fabrikasi 328.800 Tupras Ttirkiye Petrol I (atinc 911 .?OO Turkcell Iletisim Hizmet 320.1 ti? Tiirkc:ell Ilelisim Hizmet ADR
3,7 78,900 Turkiy e Char it i Bankasi 792.295 lurkiyc Halk Bankasi
3,551.400 Turkiye Is Binkasi
United Arab Emirates 12,379.250 Air Arabia 4,656,877 Aldar Properties 3.583.186 Arabtec 4,773.970 Uepa 9.544.150 DP Wurld 8.700.850 Emaar Properties 2,638.050 Sorouh Real Estate
Total Transferable Securities and Money Market Instruments Admitted to an Official Exchange Listing
14,461,977 2.53 2 0.00
11 ,IR1,1'1135 1.96 3.280.280 0.67
36,840,052 6.44 5.2/3.4?8 0.92 3.9??,703 0.1'113
15,530.183 2 , i l 12,110.738 2.12
126,322,162 22.1 0 6.493.460 1.14 7.ti56.752 1.34
11.281.107 3.02 5.28~1.755 0.9%
25.650.907 4.49 11,888,341 2.08 52.088.842 (3.1 1
104,997,020 18.36 16.380.5:35 2.88 3,580,485 5.87 8.135.891 1.07 4.577.481 0.80
13.94Y.252 2.44 30,213,315 5.30
7,220,169 1.26 7,220,189 1.28
47,213,190 8.25 11.550.224 2.07 15.103.318 2.84 6.8.;1.339 1.20 5.786.948 1 .I1 3,901,381 0.68
6,866,347 1.20 6,836,347 1.20
69,980,087 12.23 7,279,7(32 1.27 3.598.775 0.63 7.955.173 1.39 3.833.B46 0.04
361.786 0.06 4 ,95398 0 .m 7.518.804 1.31 5,710,812 1.00 4,786.422 0.84 8,949,986 1.56 3.882.3/? 0.w
11,775.8.1 1 2.06
85,482,080 14.95 ti.lo1.466 1.08
15,910,898 2.78 15.812.045 2.11 8,828./17 1.19
6.664.880 1.17
499,383,084 87.32
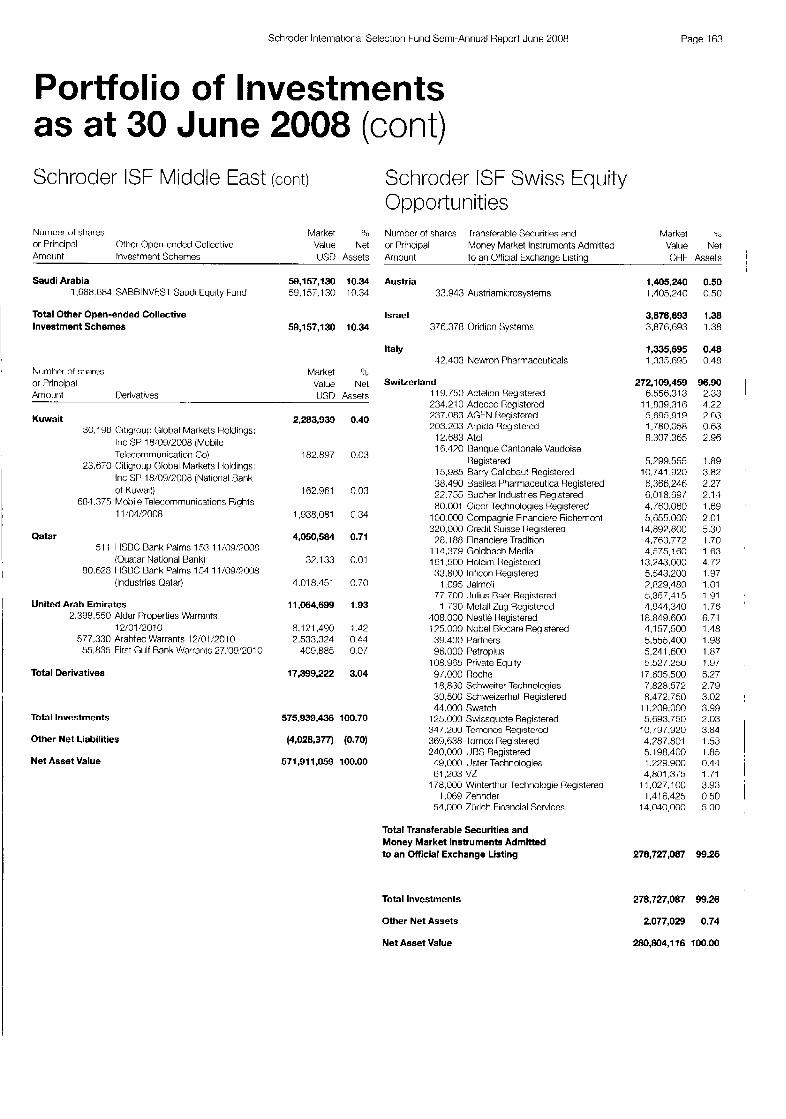
Schroder International Selection Fund Semi-Annual Renort June 2008 Page 163
Portfolio of Investments as at 30 June 2008 (cont) Schroder ISF Middle East (cont)
Nurritw of shares Market SO or Principal Ottier Operi-ended Collective Value Ne1 Amount Investment Schemes US0 Assets
Saudi Arabia 59,157,130 10.34 1.688.ti84 SARHINVFSI Saudi Equity Fund 5‘3.157.130 10.34
Total Other Open-ended Collective Investment Schemes 59,157,130 10.34
Nuniher of stwres Market % or Principal Value Net Amoiirit Derivatives LISD Assets
Kuwait 30,196 Citigroiil) Global Markets Holdings:
l r i c SP 10:09/2008 (Mobile Telecommunication Co)
23.670 Citigroup Glohal Markets I loldirigs: Inc SF’ 18!09:2008 (National 13arik
684,375 Mohile Telecommunications Rights Of Kuwalt)
11 /04!2008
Qatar 51 1 HSRC Rank Palms 153 1 1;09,’7000
(Uuatar National Bank) 80,628 HSBC Bank Palrris 154 11:09:?008
(Industries Clatar)
United Arab Emirates 2.398550 Aldar Properties Warrants
12/01 :2010 577,330 Arahtec LVarrants 12/01!2010 55.835 First Gulf Bank Warrants 27:09:2010
Total Derivatives
Total Investments
Other Net Liabilities
Net Asset Value
2,283,939
182,897
1 ti2.961
1 ,Y38.081
4,050,584
37.133
4.018.451
11,064,699
8.1?1.490 2,533,324
408.885
17,399,222
0.40
I! 03
I: 03
0 34
0.71
0 01
0 70
I .93
147 0 44 0 0/
3.04
575,939,436 100.70
(4,028,377) (0.70)
571,911,059 100.00
Schroder ISF Swiss Equity Opportunities Number at sharcs Iransferable Securities and Market 5: or Principal Money Market lnstrumcnts Admitted Value Net Arriourit to an Official Exchange Listing CHF Assets
Austria 33.943 Austriamicrosystems
Israel 376.378 Dridion Systems
Italy 42.403 Ncwron Pharmaceuticals
Switzerland 11 9.750 Actelion Registered 234.21 0 Adccco Rcgistcrcd 237.083 AGtN tiegistered 203.203 Arpida Regislered
12,683 Atel 16.470 Hanque Cantonale Vaudoise
15,985 Barry Callebaut Registered 38.490 Basilea Pharrnaceutica Registered 22.756 Bucher Industries Registered 80.001 Cicor Technologies Registered
I legislered
100.000 Compagnie Financierc Richemont 320.000 Credit Siiisse I legislered
114,379 Goldbach Media 161,500 Holcim I legistered 33.800 lnficon Registered
1.095 Jelmoli 77.700 .Mius Baer Reyistereu 1,730 Metall Zug Registered
408,000 Nestle I legistered 175.000 Nobel Riocare Registered
33.1 88 Financiere Tradition
39,400 Partners 96,000 Pctroplus
9/,000 Roche 18,830 Schweiter Technologies 39,500 Schweizerhall Rcgistered 44.000 Swatch
108.965 Private Equity
125.000 Swissqucte Registered 347.200 Tcmcnos Registcrcd 369,538 lorno:; Registered 240.000 URS Registered 49,000 Uster Technologies 61,203 VL
178.000 Winterthiir Techriologie Registered 1.069 7ehnder
51.000 Zurich Financial Scrvices
Total Transferable Securities and Money Market Instruments Admitted to an Official Exchange Listing
Total Investments
Other Net Assets
Net Asset Value
1,405,240 1.105.24u
3,876,693 3,976,693
1,335,695 1.335.695
272,109,459 6,556,313
11 ,R39,31 6 5,695,971o 1.780.058 8.307.365
5,799,556 10.741.920 6,366,246 6.018.69/ 4.760.060 5,655.000
14,397,800 4,763,772 4575,160
13.943.000 5.543.200 7,829,480 5.357.415 4,941,310
lR.849.600 4,157,500 5.555.400 5,241,600 5.527.250
17.605.500
8.472.750 11,209,000 5.693.750
10.797.920 4,787,801 5.1 98,400 1.229.9M3 4.801375
11.027.1 00 1.41 6.425
14.040.000
7,828,572
0.50 0.50
1 .38 1.38
0.40 0.48
96.90 2.33 4.22 2.03 0.63 2.96
1.89 3.87 2.27 2.14 1.69 2.01 5.30 1.70 1.63 4.77 1.97 1.01 1.91 1.76 6.71 1.48 1.98 1.87 1.97 6.27 2.79 3.02 3.99 2.03 3.84 1.53 1.85 0.14 1.71 3.93 0.50 5.00
278,727,087 99.26
278,727,087 99.26
2,077,029 0.74
280,804,116 100.00

Pagc: 1 ti4 Schroder Intcrriiltiorial Selection Fund Scrrii-Aririual Report June 2008
Portfolio of Investments as at 30 June 2008 (cont) Schroder ISF Swiss Small 8 Mid Cap Equity Number of shares Transferable Seciirihes and Marltct "s or Principal Money Markkt Irislruments Admitted VJue Net Anmint to ari Oiticial Exchange Listing CHF Assets
Austria 88.583 Austriamicros~sterris
Israel 382.734 Oridion Systems
Italy 11 1,000 tjloxcll 68.825 Newron Pharmaceuticals
Liechtenstein 13.121 Verwalt & Privat-Hank
Switzerland 204.000 Acteliori FieyiaLercd
83.256 Arpida Rcgistered
12,987 Banquc Cantonale Vaudoive
10,800 Barry Callebai.it f7egi:;lered 30.01 0 Basilea Pt%xmaccutica Registered 17.000 RKW FMB tncryic 16,802 Bucher Industries Registered 40.559 Cicor lcchnoloqies Registereci 47.777 Crealogix Registered 50.401 Daetwyler
23,19 1 Financiere Traditiori 59,800 Geberit Registered 88,420 Coldbach Media 76.600 Gottex hirld Management
41,550 Inficon Registered
%!3.400 L o u w
6.205 Atcl
I {egislered
125.859 Day Sottware Registered
5,439 Hucgli
303.342 Logitcch lnternatiorial Registered
1,630 Metall Luy Hcgistered 100.53a Newave Frieryy 49.534 Partners
135.500 Petroplus 73,000 I'rivatc Equity 11 . C W Raelia trieryic 32.788 :;aritthera Pharmaceuticals Registered
123.78Y Schindler 40.774 :;ctiiriolL & Bckcnbach Registered 19.044 Schweiter Te!;hrioloyies 46.430 SchweiLerhall Registercd
47.100 Sulzcr Registered 70.330 Swissquote Registered
335,363 lerrierins Registered 223,BBY Tornos Fkgisterec
120,722 Winterlliur Techriologie r7egisicrcd
5,819 Silta
63,449 vz
3.004 Lchndcr
Total Transferable Securities and Money Market Instruments Admitted to an Official Exchange Listing
Total Investments
Other Net Assets
Net Asset Value
3,584,578 1.57 3,584,578 1.57
3,736,160 1.64 3,7363.1 60 1.6~1
4,765,388 2.09 2.591.400 1.14 2,151,988 0.95
4,738,642 2.08 4,738,642 2.08
209,457,781 91.82 11.1G9,000 4.89
729,323 0.37 3.i164.275 1.78
1.1Y1.354 104
I.Yti3.834 9.18 2.357.~00 1 .ix ~ . i i W B I 1 .oii
7,173,200 3,12
4.443.1 29 1 .05
3.531.198 1.55 3,742 274 1 .64 3.955 1 19 1.73 3.919.279 1.72 8,981,720 3 $94 3,456,800 1.52 2.40Y.0/0 1 .08 3.344.985 1.47 6,830,600 7.99 8.341.905 3.X 4.645,200 7.04 4,858,549 7.04 4.888.001 2.14
,398,300 3.21 3,i02.625 142 5 936.535 2.60 2.606.840: 1.14 Y.43?.722 4:14 3,705,821 1.83 7.917.543 3:17
5,Y58.150 2.01 3,703,887 1 .i10
10,537.89Y 4.37 7,394,:>49 1 .1 4 4,9/1,!)74 2.18 1.4/8.777 3.28 3.980,29Y 1.14
226,282,549 99.20
226,282,549 99.20
1,826,576 0.80
228,l OB, 125 100.00
Schroder ISF Taiwanese Equity
Nurriber 01 sharcs Transferable Securilier; and Markel 9: Valiie Net or Priricipal Money Market Iristriirrienls Admitted
Artiounl to ari Official txchange Listing usn Assets
Taiwan 3.787.000 Acsr 5.1 51,377 Arh,ariccd Semiconductor
Engineering 80/.000 Asiistek Computer
7,401,333 AU Optronics 953.400 hvea Mccliantronic
3.751.100 Bank of Kalotisiung 2.208.000 Capital Seciiritie:;
8,129,832 Cathay Financial ti3/,604 Caktwr .Technology
62.700 Cathay Financial GDR 630,600 Chicony Electronics
1.42,4,000 China Steel 1,853.1 16 Chiria Slecl Chemical 2,455.000 Chinatrust Firiartcial 2.776,4rj2 Chroma ATr 4.082.000 Chunghua Telecwr i
5,553,000 Coritinentnl Engineering 7,920.000 Kindorri CorislrucLion 1.71 1.000 farglow Land Developrrierit 1 ,913.000 rpistar 1,484.000 Far rasterri Department Stores
7,81 /.SI$! Tar tastcrn Textile 2.05rS.lW Far EasTorie .lele:cclriimiinic.ati~ii~ 5.48T ,000 Forrr tom Pla:;tics
1.840.000 rubor1 Einnncial 4.783.61 F HON HA1 Precisiori lridustry
4,772,000 KGI Securities
1,530,000 LES Fnpharits
FIfi.JIK) ChurlqhrJLi 1el~X)rK ADH
14,863,000 Far Easterri Iriterrralional Bank
421,050 Foxconn Technology
142.000 I ION HA1 Precision Industry GDR
750.032 McdiaTek Y83,760 NXI Ya Printed Circuit Board
1,723,735 Novalek Micfoclcctronics fi.751.015 Polaris :;et:uritics
238.000 President Chairi Store 4.1 G8.000 I 'rcsident Securities d.8?8.000 Silicornv4arc Precision Industries
73,100 Silicuriware Precision Industries ADR 1 7.4f8.000 SinoPac Financial 2.824,iYO Siriyi Realty 6.121,000 Standard Foods 7.437.000 Taiwan Cement 4582.978 Taiwan Mobile
12.81 1.889 Taiwari Serriiconductor Manufacturirig 145.700 Taiwan Semicoriductor Manutacturing
ALlH 1.3fj2,000 lust Hcscarch
1,408,000 TSRC 4,555,000 Uni-Prwderit Eriterpriscs
9.01 5.000 Yuarita ririaric:iul
Total Transferable Securities and Money Market Instruments Admitted to an Official Exchange Listing
557,000 lripod Teclinoloqy
824.000 Youngtek Electroriicv
Total Investments
Other Net Assets
Net Asset Value
281,703,637 ;.45!3,742
4.637.122 1.851.458 3,898.537 1,580,137 1,749,688 1,410,909 1.816.625
1 7.673.545 1,2ti6',530 1,183,933 2,303,617 5,353,039 2.309.285 5.807.221
10.602,81',6 2,121,984 3.1 82.549 3,821,731) ,7.3:37.013 3,452,978 1,578,827 4,890,851
I O , 183.889 3.206.750
13,229,526 1,948535 1,878,188
23,555,685 1,405.800 3.473,88!1 5.127.581 1,084,519 8,646,814 4.Y22. I / I 5,012,048 4,0.17,05 1
785.112 7,/31.989 9,769,532
569,349 5,400.33ti 7.469.758 5,2 9.205
10,036,627 8.715.028
27,412,779
1,583./5!4 2.1 30,979 1,392.500 2.191.305 5,597,629 1.590.997 6,304,907
281,703,637
281,703,637
7,848,056
97.29 2.57
1.59 0.56 1.34 0.54 0.80 0.49 0.63 6.10 0.44 0.41 0.7t1 1.85 0.B2 2.01 3.63 0.13 1.10 1.32 1.84 1.19 0.55 1 .BY 3.52 1.13 4.37 0.87 0.65 8.14 0.49 1.20 1 . i 7 0.37 2.99 1 .io 1./3 1.40 0.27 0.91 3.37 0.20 1.87
1 .a2 3.47 3.0 1 9.48
0.55 0.74 0.48 0. /6 1.93 0.55 2.18
2.58
97.29
97.29
2.71
289,551,693 100.00

Schmder Intornational Sclcctiori Fund Scmi-Annual Report June 2008
Portfolio of Investments as at 30 June 2008 (cont) Schroder ISF US Small 8 Mid-Cap Equity
Numher of shares Transferable Securities and Market 96 or Principal Money Market Iristrurrients Admitted Value Net Amount to an Official Fxchange Cistirig USD Assets
Bermuda 188.700 (.;enpact
Canada 904.3/6 Galleon Energy 88.200 PAN American Silver 14,440 Ritchie Bras Auctioneers
230.114 Sha>A,cOr 305,121 Yaniana Gold
Guernsey 639.400 Arndocs
United States of America 264900 Adtran 239.300 Advariced Medical 0p:ics 388.400 Albemarle 104.500 Alliancebernstein 75.500 Alexion Pharrnaccuticals 90,700 Amphenol
350.100 Annaly Capital Management 109.100 Bank 01 Hawaii 278.100 Barr Pharrnaceiitic:als 158,800 Rroadridgc Financial Solutions 030,800 Brocade (:orrirriirriications Systems 779.600 Cabot
27.400 Commercial Metals /5.400 ComrnScope 46,000 Concho I lesoirrces
304,700 Conscco 480.200 Correctioris Corp of America 394,100 Crown 159,100 Cullen:Frost Rankers 1 1 1,200 Chrtiss-Wright 367,900 DaVita 149,100 Dick's Sportirq Goods 254,000 Dover 333,800 Dresser-Hand
814.600 Fmulex 146,800 rxterran 340.400 F5 Networks 154.900 Foresl City Friterprises 204.500 Forest Oil 113,300 Gen-Probe 163,000 Global Payrrients 99.400 Health Care H H I 87,200 Health Net
768.700 IMS Health 501,000 Integrated Device Technology 385,200 Intcrpublic 764.200 lntersil
50.400 Dun & Bradstreet
316.100 I D M
48,700 Jacobs Engineering 2 11.500 Lamar Advertising 601 ,700 Macrovisiori Solutions 167,000 Meredith 228.000 NeirStar 185.900 NII 275.100 Northeast lltilities 505.700 ON Serriicoriductor 632.300 Pa& 304.520 Parametric Technology 232.200 Patterson 1 20,100 Perrigo 152.800 Portland General Electric 501 ,800 DLoyic
2,875,788 0.43 2,875755 0.43
34,758,415 17.R25.931 3,109.932
381.077 8.S35.915 5.105.565
18,804,754 1 8,804.7 54
543,687,176 6.553.526 4,630,455
15,916,632 S.948.140 1 ,856,l 45 4,106,896
3.433.256 7.762.718 7,050,900 4 .1 14.140 1.034.624 3.961.516 1,782.200 3.01 9.577
12,485,226 10,766.305 8.204.318 4,899,472
19545.794 2,691,255
17,174.770 12. I91 21 6 4.394.3/6 9.B3R,718
1 0, B94 380 9,847.7/7 5.021.858
15.006.100 5.432.735 737'3,500 4,428,770 2.162.560
11,777,l 26 6.1 u5.470 5.004.990 3.1 48.024 6,609,888 6,571,842 5,213,506 3,912394 7.543.965 Y .278,2 14 4,772.860 4,945,320 8.71 8.851 7.033.7 16 1,748,880
13.227.71 6 6,594,518 6,910,272 3,909,755 3,468,560
5.16 7.61 0.m 0.06 1.27 0.75
2.79 ?.79
80.74 0.98 0.70 2.36 (1.88 0.78 0.61 E81 O.80 1.85 c.51 1.15 1 .05 0.66 0.15 0.59 0.26 0.45 1.85 1.57 1.22 0.73 7.90 0.40 1 .81 1.90 0.65 1.43 1.59 1.46 0.75 2.21 0.01 1.13 0.66 0.32 l .6 l 0.92 0.74 0.4 / 0.97 0.98 0.77 0 58 1.12 1.38 0 71 0.73 1.29 1.04 071 1.06 0 98 103 0 58 0.57
/.321.262 1.09
Page 165
Nurnher of shares Transferahle Securities and Markel Yo or Principal Moncy Markct Instruments Admitted Value Net Amount to an Official Exchange Listing 160 Assets
United States of America (cont) 109.000 flanye fier,oiirces 180./00 Rcgis 387.000 Reirisurarice Group of America 351,750 Republic Services 250.500 Ross Stores 141.400 Ruddick 307.200 SAlC 661.100 Scientilic Games 481 ,600 3erra Pa!;tfic Resources 607.500 Skyworks Solutions 628.900 tw telccov 61,700 US Cellular
775.900 Valueclick 225,500 VeriSign 301.400 W.R. Rerkley 91.700 Wabtec 93.300 Watson Wyatt Worldwide 64.300 Wellcare Health Plans
126,300 West Pharrnaceiitical Services 100,300 Wcstamcrica Bancorporation
Total Transferable Securities and Money Market Instruments Admitted to an Official Exchange Listing
Total Investments
Other Net Assets
Net Asset Value
7.061.0?0 1.05 4,86(1,830 0.72
16.830.630 2.50 10.443.458 1 5 5 9,115,605 1.35 4.930.618 0.73 8,488,064 0.96
20.197.780 3 00 6.1 14.112 0.92 5.759.900 0.86
10.175.602 1.51 3.133.605 0.51
11.062.71 6 1.64 8.R23.120 1.28 7,525,958 1.12 4.386.928 0.65 5,010,210 0.74 7,295510 0.34 5.539.518 0.82 5.334.956 0.79
600,126,133 89.12
600,126,133 89.12
73,252,850 10.88
673,378,983 100.00

Page 166 Schroder Internatiorial Seleclion Fund Semi-Anriual Repurl June 2008
I
Portfolio of Investments as at 30 June 2008 (cont) Schroder ISF US Smaller Companies
Number of shares lrarisferable Securities and Markct “6 or Priricipal Money Market lristruriierils Admitted Value Net Amount 10 an Otticial Exchange Listiricg USD Assets
Bermuda 233.033 Argo Group International
Canada ~ 7 . 9 5 7 (;aileon tneryy 151 ,000 PAN Arriericxri Sllvcr 189,041 ShawCor 350.764 Yamana Gold
China 209,200 Hornc Inns & Hotels Mariayerrient
ADR
Hong Kong SAR 251, /00 Seaspari
United States of America tY8.100 Actuarit I69,400 Advanced Medical Optics 1G1,500 AH Belo
153,277 Airgas 107 153 Albany International 4 1 6,500 Ar r i ba:;sathr s 222.000 Arnsurg 184.000 Anadiyics 283.750 Aririaly Capilal Management 348.459 Apollo Irivestrrieril 462.000 Aspen Technology 100,500 athcnahealth
155,500 Heldern
304.600 Brush Eriyineorcd Materials 333.900 Cabot 24 1.300 CARBO Cerarriics 497,GoO Casual Male Retail 205.800 Cbeyor1d T 8 Y . IO0 Central Garderi and F’ct 231,700 Central Garden arid Pet ‘A‘ 703.800 Cepheid 730,200 (;tiildrens Place Retail Stows 332.900 Chimera Irivestrrienl
377.081 Clear Chnnncl Outdoor
660.353 Conseco 158,700 Consolidated Corrirnunications
31 8.500 Cooper
31 1.870 CVR Financial 1 0ti.500 niarrioric r o o k 168.100 Digital Realty Trust 340.1 97 Dre:;:;er I3and 633.100 Crriiilex
521,912 Euronet Worldwide 317,088 F5 Networks 118.100 FEl
3 1,052 FMC 158,900 Flotck Industries 358.565 Cartncr 40?.500 Geo 222,200 GeoEye
255,789 I I&C Iquipnienl Sewices
54.500 Air Melhods
77,Ii l Bank of Havwi
85.!)00 Bcrkshire Hills Haricorp
85.800 Clean Harbors
74.300 CommScopc
11 2,600 h ls?d r l t (.:OI>klCt
i i.091 Cu1leri:Frost Bankers
70.700 tSCO Technologies
G0,700 Coodrich Petroleurri
99,700 Haenionetics 99.68 1 Health Care RElT
13i.900 HMS
7,813,596 1.04 7.81 3,595 1.04
3O,i23,456 4.01 12,238,-,. I. 93d 1.63 5.321.260 0.71 G,748.101 0.90 3,817,159 077
3,987,352 0.53
3.a07.352 0.53
6,259,864 0.84 6,255.8ti.1 0.84
595,385,641 79.32 6,212,410: 0.83 :3.?77,890 0.43
9 m 5 5 0 0.1 2 1 ./135.530 0.19 3.59820ti 1.28 3.1 10,47ti 0.4 1 6,501,585 0.87 5,465.640 0.T3 1 ./11 ,?OO 0.23 4.412.313 0.59
,700 0.70 ,700 0.85 ,120 0.40 .88Li 0.31
5,300,995 0.71 1.627,73(j 0.22 7 , m . w 1.04
3.545.T53 0.4/ 9 ~ t i i m 0.1 2
5.853.370 0.78 8.581.14ti 1.14 3.05G.022 0.41 0,164,730 0 82 S,809.416 0.91 3,903.7?7 0.52 f.544,098 0,8/ 2,337,890 0.31 2,136 022 0.28
3.967.874 11.53 3.098.000 0.41 2.339.805 0.30 li.82f.541 0.91
13,342.906 1.78 7.489.5/3 1 .00 3.ti53.041 9.49 8,976.886 1.20 9.190,/14 1.22 9,003112 1.31 7.3K3.552 0 32 3,144,976 0.42 i . 4 3 4 3 0 0.53
10,822.413 1.44 3.999.600 0.53 4,593.77ri 0.61 3,097,805 0.41 3,737,6375 0.77 4,440,789 0 5Y 3.003.462 0.40
i i . a : , i i o 1.56
Number of sharcs lrarisferable Securities and Market 7; or Principal Money Market Iristrurriernls Admitted VdlUe Net
tu an Ollicial Exchange Listirig USD Assets Amount
United States of America (cont) 292.300 I lowon Lines 120.800 Hurori (;oiisultiny 151,iOf I L E X 99,600 Immucor
362.039 Informatics 234.100 Interface 390.000 Intcmap Network :.;ervic:e:; 433,800 Iriterwoven
18?,500 Inwstors Heal Estate Trust
1 iY.800 Krioloyy 580,500 KV Pharrriaceulical 586.803 Lexicori Phmrmaccuticals 303,700 LKO 156.S00 Luminex
?96,,j00 MtMSIC 149.500 Microsemi 20 t.000 National I Wail Properties 21 2.300 NorthWesterri 308.700 Online Resources
356.1 00 F’AETEC 180.S00 Parallel I’ctroleum 291,352 Pararrielric lechnology 142,600 Perrigo 278.497 t‘iiinacle Entcrtainmerit 152,500 t’ortland General rlectric: 586,800 PSS World Medical
00Y.500 clL.oyic 181,3titi ReqY 341,354 Heirisiirance Croup of America 11 3,300 Ijent-A-Center 149.510 I<cpublic Airways 165.142 RiyhtNow Icclhnologies
5 1 .OW Investmerit Tectirioloyy
87.150 Kansas City Soiithern
52,401) Mantech Iriterriatioiial
59,959 Clrrrlat lechnologics
96.274 Psychiatric Solutions
78.000 Rofin-Sinar Techriologies 38,200 HI’C
494.870 Scicntitic Games 334.700 Serrited i 304,700 Skilled I leaitticare 7fj2.800 Sonic 65Y.000 SoriicVdALL 305.636 St. Mary Land 8 Exploration
?09,748 Standard Parkirig 248.300 Suri I Iea1ttic:are 137.1 00 C;VB Financial 295,600 Syniverse 421.131 THO 1 50 000 tw telecom 93.500 UIL
113.300 Ilriisourcc Energy 270;100 United Natural Foods 161 ,070 Valueclick 275.000 Veeco Ir1struirient:s
020.400 Vishay Intertechrloloy;,iri(iIogj 1 f3 ,GOO volcano 26I.81 9 Volterra Semiconductor 755.278 Waste Connections
61.800 Standard Mic:rosystcms
14,500 Vlad
99.135 Walson Wyatt Worldwide 34.1 00 WcllCare Health Plaris
142,700 West Pharmaceiutical Services 1.12.0 /Y Westan-ienca Bancorporation
Total Transferable Securities and Money Market instruments Admitted to an Official Exchange Listing
2,965,350 5,369,580 5,409,836 2.fi12.508 5.094.873 3,022,231 1.91 1.846 5.3 18.388 1.743.680 1, 159,300 3.808.609 1,959.820
10,988,865 1,021.037 (250.452 3,761,951 2,561,312
8ti3.86D 3.888.4 J 3 4 i ,0 5.382.898 3,280,098 2.885,l 0 Y %.303,Yfi7 3.808.??4 5,000,11/
G41 ,G30 007.560 461,750
9.648.0!32 3.667.077 8.894.004 4,878,745
1 4 ,&I 5,485 2.348.709 1 ,:kXJ,:>41 2,265,693 7.368.RBO
639,408 1 3.044,04R 4.786.210 4,031,181 3,784,832 4,33ti,220
1 9,365,097 1.759.320 3,817.414 3.4 12.91 i ti.808.306 4.694.128 8.317.337 7.427.000 2.700.120 3,540.0ti5 5.443.152
12,067,470 4,650,250
383.235 5,782.128 1,9774,652 4, titi0 .05 1 8.758.243 5.355.170 1 .?17.370 6,258,822 7,55 / , 1 82
0.40 0.72 0.72 0.35 0.76 0.40 0.26 0. 11 0.23 0.23 0.51 0.X 1.46 0.14 0 97 0.43 0.34 0.1 2 0.52 0.58 0.71 0.44 0.38 0.31 0.51 0.67 0.62 0.40 0.48 1.29 0.49 1.18 0.65 1.98 0.31 0.18 0.30 0.32 0.09 2.00 0.84 0.54 0.51 0.58 2.58
0.51 0.46 0.91 0.63 1.11 0.32 0.37 0.47 0.13 1 .GI 0.62 0.05 0 .7 / 0.26 0.82 1.10 0.71 0.16 0.83 1.01
0.m
643,569,909 85.74

Schroder International Selection Fund Semi-Annual Report June 2008 Page 167
Portfolio of Investments as at 30 June 2008 (cont) Schroder ISF US Smaller Companies ( c m )
Number of shares Market '3 or Principal Other Transferahle Securities Value Net Amount not dcalt on another RfguIated Markel 1.183 Assets
United States of America 6,176,460 0.82 473.500 Bruker 6.141,295 0.82 629,078 IAC Acquisition 35.165 0.00
Total Other Transferable Securities not dealt on another Regulated Market 6,176,460 0.82
Total Investments 649,746,369 86.56
Other Net Assets 1 W.898.288 13.44
Net Asset Value 750,644,657 100.00
Schroder ISF EURO Active Value
Nurriber of shares Transferable Securities and Market ?O or Priricipal Money Market Instrunients Admitted Value Net Arriount to an Official Exchange I istirig TLIR Assets
Austria 9f?,785 Crste narik Der 0esterreic:tiisctieri
127,421 OMV 152.015 :;ernperit 91.076 Voestalpine
Belgium 1 1.000 D'iotcrcn 8.333 Groupe Rruxelles Lambert Strip
WPR
Finland 164,999 Cargotec 750,655 Neste Oil
France 254.058 AXA 14?.340 RNP Parihas 93.643 Rouygues 90.1 67 Compagnie de Saint Gohain
125.368 Lafarge 53.442 Nexaris
190.088 Publicis 69.774 Renault
1 73,904 Sariofi-Averitis 93,862 Schneider Electric 85,150 SociQte GQneralt?
130.000 Suez Strip WPR 408.415 Total
230.865 Vivendi ?0.016 Vallourec
Germany 67.008 AllianL
189 450 BASF 135.384 Rayerische Motoren Werke 54.531 Continental
1 19,129 Dairnlcr nl.998 Deiitsche narik
?37.343 Deutsche Post 160.299 Henkel Prcfcrcnco 21 0.874 .lungheinrich Preference 109.660 Klocckner & Co. 11 1,694 MAN 160.036 MTlJ Aero Engines
103.16/ Software 750.900 ThysseriKrupp
68.1 80 Munchencr Ruckversicherungs
Greece 1?9,710 National Rank of Greece
Italy 408.369 Ruzzi IJnicem 921,724 Enel 819.353 TNI 389.518 Fiat
1.535785 lntesa Sanpaolo 1.802.385 UriiCredit
Luxembourg 167,328 ArcclorMittal
22,786,454 6.00
3 , R l 1,393 1 .02 4.212.495 1 .I 1 8.368.652 1.67 3,779,093 0.99 4.fi14.821 1.21
1,922,993 0.51 1,922,910 0.51
83 0.00
8,353,085 2.20 3.700.928 0.98 4,652,157 1.22
I 15,573,578 30.38 4,790,264 1.25 8.161.0W 2.14 3.958.290 1.04 3,590,450 0.94
15.88i.704 4.18 12.014.015 3.16 4.194.0fi3 1.10 3.953.830 1.01 3.635.225 0.96 7.343.966 1.93 6.416.406 1.69 4.701.983 1.24
1,300 0.00 26.969.236 7.09 4.41 0.306 1 .I 6 5,545377 1.46
83,698,336 22.00 7..117.260 1.05 7,425,298 1.94 4,133,956 1.08 3,160.61 I 0.99 4,587,174 1.23 4.609.890 1.19 3.904.292 1.03 4,044,344 1.06 3,721 ,926 0.98 7.181.770 1.89 /.834.21/ 2.06 3.291.432 0.87 7..i76.162 1.99 3.938.916 1.04
10.700.777 7.70
3,739.337 0.98 3.139.33I 0.98
43,301,649 I I .38 6.460.398 1.69 5,622.516 1.47
14.666.303 3.88 4.054.882 1.07 5540,344 1.46 6,957,206 1.83
10,514,892 2.76 10,514,892 2.76
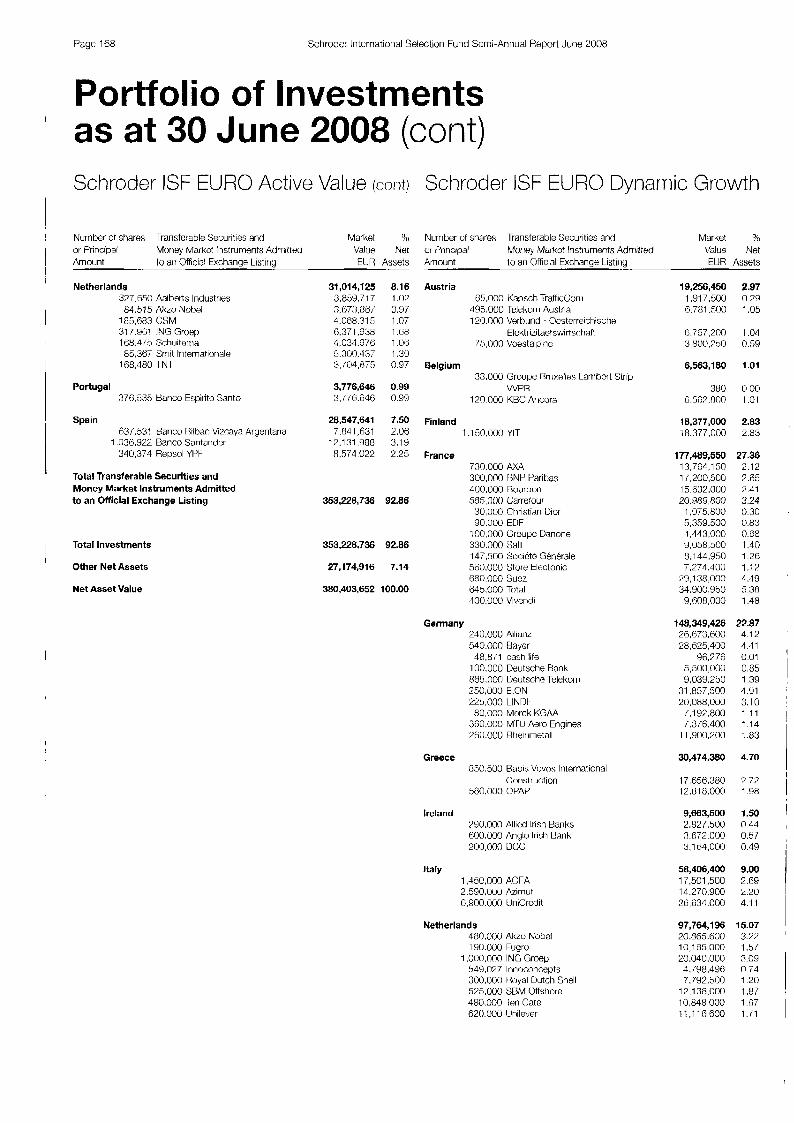
Pagc 168 Schrodcr Interriatiorial Selection Fund Scmi-Aririual Report June 2008
Portfolio of Investments as at 30 June 2008 (cont) Schroder ISF EURO Active Value mt-m Schrocler ISF EURO Dynamic Growth
Nurriber ot shares or Principal Amount
Transferable Securities and Moriey Markct Instruments Adrriilted lo an Official Exchange Listiriy
Netherlands 327,650 Aalberts Industries 81.515 Akzo Nobel
186,683 CSM 31 7.Yu1 ING Groep 188.4/3 Schutterria
168,480 TNT 85.367 Smit Internatioriale
Portugal 37K535 Banco Espirito Santo
Spain u3/.531 Earico I Mbac Vi~caya Argentaria
340,374 Repsol YPF 1.036.922 Banco Santarider
Total Transferable Securities and Money Market Instruments Admitted to an Official Exchange Listing
Total Investments
Other Net Assets
Net Asset Value
Market 40 Nurriber of shares Transferable Securities and Market % Value Net
10 an C)fficial Exchange Listing EUR Assets Value Net Or I’rmapal Moriey Market Instruments Adrriitted EUH Assets Amount
31,014,125 8.16 3.859.717 1.02 3,673,88/ 0.97 1.088.315 1.07 !i,371.938 1 .88 4,034,978 1 .0u 5,300,437 1.35 3,104,875 0.97
3,776,646 0.99 3,Ifld.840 0.99
28,547,641 7.50 7,851,631 2.08
17.131.988 3.19 8,574022 2.25
353,228,736 92.86
353,228,736 92.86
27,174,916 7.14
380,403,652 100.00
Austria 65,000 Kapsch TrafficCorri
4Y5.000 Telekorri Austria 120.000 Verhund - Ocsterreichische
E1cktrizitaetswirtst:t iafl 15,000 Voestalplnc
Belgium 38.000 Groupe nriixelle:; Lnnibcrt Strip
WPR 120.000 KBC Ancora
Finland 1.150,000 Y I l
France :30.000 MI 300,000 L3NP Paribas 400,000 noiirt)ori 585.00(1 Carrefour 30.000 Ctiristiari Uior !30.000 EDF
100.000 Groupc Danone 330.000 3all 14i,500 Societe Generale 5u0.000 Store tlectonic 0n0.000 Suez ti45.000 Total 400.000 Vivendi
Germany 240.000 4111an~ 540.000 Hayer
100,000 Deutsche Hank 805.000 Deutsche Telekom 250,000 E.ON 223,000 LIN131
360.000 M LU Aero Engines 280.000 Rt ieir imetall
48,871 cash.life
80,000 Mcrck KGAA
Greece 850.500 Babis V(ivos Inlernational
:180. 0110 0 PAt’ Corislructton
Ireland P90.000 Allicd Irish Banks 600.000 Anglo Iristi Barik 200,000 ucc
Italy I ,450,000 ACFA 2.590.000 Azirnut G.YO0.000 LJniCrcdit
Netherlands 480,000 Altzo Nobel 1 50.ci00 Fugro
1,000,000 INC Groep 545.027 Innoconcopts 300,000 I loyal Dutch Shell 525.000 SDM Offshore 480.000 len Cate 620.000 Unilever
19,256,450 2.97 1.917.500 0.29 6.781 ..500 1 .05
6,757,200 I .04 3,800,700 0.59
6,563,180 1.01
380 0.00 ii.507.800 1 .0 I
18,377,000 2.83 18.377.000 2.53
177,489,550 13,704,150 11.200,500 15.632.000 20.989.800
1 ,575,800 5,359,500 4.443.000 ‘.3.058.300 8,144,950 7,274,400
79,138,000 34.900.Y30
a, 608,000
148,349,426 26,673,600 28,625,400
9ii.776 5,500,000 Y.OLI9.230
31,857,500 20,088,000
/.l9?.n00 ;.3/6.400
1 1 .[300,200
30,474,380
17,658.380 12.81 8.000
9,663,50 2.82/.500 3.R72.000 3.1 ti4.000
58,406,400 17,501,500 14,270,900 2ti,634.000
97,764,l 96 20.885.600 10,185,000 20.040.000 4./Y8,49R 7.7Y2.500
12,138,000 10,848,000
27.36 2.12 2.85 ?.41 3.24 0.30 0.83 0.58 1.40 1.28 1.1? 4.49 5.38 1.48
22.87 4.12 4.41 0.01 0.85 1.39 4.91 3.10 1.11 1.14 1.83
4.70
7.72 1.88
1.50 0.44 0.57 0.49
9.00 2.69 2.20 4.1 1
15.07 3 . 7 P 1.5/ 3.09 0.74 1.20 1.87 1.67
11.11F.600 1 . / I

Schroder International Selection Fund Semi-Annual Report June 2008 Page 169
Portfolio of Investments as at 30 June 2008 (cont) Schroder ISF EURO Dynamic Growth (cont)
Number of shares Transferable Securities and Market Sb or Principal Moncy Market Instrunwnts Admitled Value Net Arriourit to an Official Exchange Listing FUIi Assets
Spain 1.400.000 Darico Santarider 1.1 20.000 Enagas
1,750,000 Telefonica 470.000 Red Fledrica de Espana
Total Transferable Securities and Money Market Instruments Admitted to an Official Exchange Listing
85,304,900 13.15 16.380.000 2.53 20,115.200 3.10 19.322.200 2.99 29.41 7.500 4.53
651,648,982 100.46
Total Investments 651,648,982 100.46
Other Net Liabilities (2,956,621) (0.46)
Net Asset Value 648,692,361 100.00
Schroder ISF European Active Value
Number of shares Transferable Securities and Market 9; or Principal Money Market Iristruments Admitted Value Net
EUR Assets Amount to an Official txchange I..isting
Austria 1,789 Erste Bank Der Oesterreichischen
2,436 OMV Sparkassen
1.639 Voestalpine
Belgium 347 D’ictcrcn
Finland 2.858 Cargotec
France 3.956 AXA 1 .I 66 RNP Paribas 1,727 Bouygues 1,442 Corripagriie de Saint-Gobair) 9.382 France Wecom 1773 ILafarge 1.044 Manitou RF 3.081 Putk is 1 , l 16 Rcnault 1.655 Sanofi Avcntis 1.589 Wineider Flectric: 1.323 Societe Generale 6,009 Total 3.316 Vivcndi
Germany 80!> Allianz
1.630 BASF 1.107 Coritiriental 1,031 Deutschc Bank 3,883 Deutsche Post 2.066 Hcnkcl Preference 3.864 Kloeckner & Co. 1.938 MAN 2.69i MTU Aero rngines
1.745 Software 7,605 ThyssenKrupp
52 I Munchener Ruckversicherunqs
Italy 5,277 Rutzi Unicem
11.433 tnel 5.369 EN1 5,942 Fiat
15.758 lntesa Sanpaolo 17.942 UniCredit
Luxembourg 1.860 ArcclorMittal
Netherlands 5.861 Aalbcrts lndustrics 1,767 Ak7o Nobel 3.224 ING Groep
1.1 13 Smit lnternationale 3 . 0 f i R TNT
12.187 Royal Dutch Shell
Portugal /.621 Banco Espirito Santo
Spain 2.21 8 ACS Actividades Con:;truccion y
Servicios 5.236 Banco Bilbao Vizcaya Argentaria 8,028 Banco Santandcr 3.689 Repsol YPF
275,250 3.95
70.151 1.01 121.751 1.75 83.048 1.19
60,659 0.87 60.650 0.87
64,105 0.92 61.105 0.82
1,424,875 20.50 74.590 1.07 66.853 0.Y6 73.000 1.05 57.4PO
176.194 1?1 .99?
16.229 R4.085 58,144 6’3.801
108.624 13,056
325,14 I 79.850
976,143 67,681 71.427 71 .I25 56.705 63,875 74.832
138,988 135.931 55.?6? 69.672 66.621
104,018
468,339 83.487 69.760
15’7,138 61,856 56.847 69.256
123,166 123.166
662,839 68.043 76.81 1 64.609
31 5.049 69.1 06 67,421
76,439 76.439
321,219
69.734 64.403 93.004 93.178
0.83 2.53 1.75 1.10 0.92 0.84 1.01 1.56 1.05 4.68 1.15
14.05 0.9t 1.03 1.02 0.82 0.92 1.08 2.00 1.90 0.79 1 .00 0.06 1.50
6.74 1.70 1 .oo 1 .83 0.89 0.8? 1-00
1.77 1.77
9.53 1 .00 1.10 0.Y3 4.54 0.99 0.97
1.10 1.10
4.62
1 .oo 0.w 1.35 1.31
I
I
i
I i I
I
I
I
I

Paye 170 Schrodcr Interriatiorial Seleciion Fund Scmi-Annual Heporl June 2008
Portfolio of Investments as at 30 June 2008 (cont) Schroder ISF European Active Value (con t I Number of shares 1rari:;lerable Securities and Market UJ or Priricipal Moncy Marker Instrurnerits Ahl i l ted Value Net Arriourit to an Official Excharlye Listiny EUH Assets
Sweden 7,5 16 Nordea Bank 3.818 Sven::ka Handelsbanken
Switzerland 0.939 Novartis Registered 1.130 %;tiirider
439 Swiss I ife Reyi:-:Lered
427 Ziiricti hnancial Sewices 2.481 Xstrata
United Kingdom 4.P31'1 Anglo Amcrican 8,105 BHP Billiton
50,163 RP 1Y.38/ HSBC 1.21 6 Rio Tirito
45.095 IW Insurance 77.261 Vodafone
Total Transferable Securities and Money Market Instruments Admitted to an Official Exchange Listing
124,273 1.79 67.04? 0.97 57.231 0.87
594,699 8.55 243.588 3.61 82,335 1.18 73.775 1.0s
123,YOl 1.81 E5.100 0.99
1.280,Y!K 10 14 188,345 2.7? 202.940 2.82 371,121 5.34 190.7X 2.74 42,330 1.33 71,241 1.02
143.045 2.07
6,433,002 92.53
Total Investments 6,433,002 92.53
Other Net Assets 519,465 7.47
Net Asset Value 6,952,467 100.00
Schroder ISF European Dynamic Growth Nurriher of :;harts Transferable Securilies: nnd Market 0 o r "rincipal Moriey Market Instruments Admitted VWe Nct Amount 10 ar-i Official Exchange Listing EUR Assets
Austria 45,000 161ekOnl Austria 8,000 Verburid - Oesterreichischc
Flektrizitaelswir Lschatl 10,000 Voestalpine
Belgium 7,900 EVS Broadcast Equipment 5,187 Grourie nriixelles Lambert Strtp
WPH 10.000 KRC Ancora
Denmark 175 AP Muller - Maersk
Finland 120.000 YIT
France 44.000 AXA 19,000 BNP Paribas 40.000 Bourbon 43.000 Carrefour 1o.500 ED+ 20.000 :;aft
!51.000 sue/ 40.000 Iota1 16,000 Viwridi
~.000 Sociele Generalc
Germany 17.000 alllarlz 4ij.000 Bayer
56.000 l)eut:;che Tclckorn 10.000 €.ON 22,000 LINDE
70,000 MTU Acro Engines P0,O(X) Rheinrnetall 8.000 Siemeris
2.000 Deutsche Brink
6.300 Merck KGaA
m o o rlpp2.i
Greece l8.000 JIJMRO 70.000 OPAP
Ireland 20,000 Allied Irish Hanks 45.000 Anglo Irish I h k
Italy 72,000 ACEA
PPO.OOO Azimut 350,000 UniCredit
Netherlands 30,000 AkLo Nobel 25.000 Fugro 7B.ti00 ING Groep
40.000 Royal KPN
4.500 Smartrac 50,OOi) Terl (;ale 50,000 Uriilever
100,000 Royal Dutch Shell
87.500 SRM C)ffSh(Jrc!
Norway 400,000 StcpStone
1,461,060 1.98 61 8,500 0.83
337,830 0.18 506,/00 0.69
940,212 1.27 3'33,280 0.53
52 0.00 536.800 074
1,342,150 1.82 1.347.150 1.82
1,917,600 2.59 1.91 7.800 2.59
11,748,410 15.89 829.620 1.12
1.089,3ti5 1.47 1,58::i200 2.1 1 1,347,440 2.09 625.2/5 0.85 513,000 0.14 338.540 0.52
2,813.850 3.54 2.164.400 2.93
384.320 0.52
10,833,275 14.66 1.889.380 2.56: 2.438.460 3.90
110.000 0.15 585.200 0.79
1.2/4.300 1.72 1.964.1 60 2.W
581,115 0./9 409,800 0.55 915.400 1.24 500.0F10 0.76: 10>,080 0.14
1,850,480 2.50 303.480 0.1 1
1,547.000 2.09
470,400 0.64 195.000 0.27 775.300 0.37
3,432,240 4.64 869.040 1.17
1.21 2,200 1.64 1.351.000 1.83
11,770,961 15.93 1,738,800 2.35 1.337.500 1.81 1.523.040 2.06 2,5Y1,686 3.51
437.800 0.5Y 2,023.000 2.74
Y2.835 0.13 1 ,130.000 1 33
RSG,SOO 1.21
747,799 1.01 747.799 1.01
i
I
I I I I
i I i
I I

Schrnder International Selection Fund Semi-Annual Report June 2008 Page 171
Portfolio of Investments as at 30 June 2008 (cont) Schroder ISF European Dynamic Growth (cant)
Number of shares lianslerable Securities and Market % or Principal Moncy Market Inslriiments Adrriitted Value Net Arrioiirit to an Official Exchange Listing ElJR Assets
Spain 40,000 Banco Santarider
54.000 Red Electrica dc Espana 90.000 Tclcfonica
1 1 0,000 Enagas
6,184,540 8.37 468.000 0.63
1.975.600 2.67 7,778,040 3 07 1.517.900 2 05
Switzerland 7,104,114 9.61 3,000 Hank Sarasiri & Cie Registered 85,613 0 1 1
20,000 Roche 2.259.362 3.06
1,300 Slka 1.254.373 1.70 15.000 Xstrata 761,189 1.03 12.000 Zurich Financial Services 1,041,931 ?.63
5.000 .(;chweizerhall Registered 801.046 1 .OR
United Kingdom 400,000 BP 525,000 Carillion 11 0,382 HSBC
740.000 Prudential 1.000,000 Legal R, Gerieral
60,000 Standard Chartered
Total Transferable Securities and Money Market Instruments Admitted to an Official Exchange Listing
10,182,313 13.78 2,924,343 3.% 2.216.262 3.00 1.087.268 1.47 1.261.050 1.7 1 1.618.484 7.19 1,07ri.R87 1.45
69,985,554 94.69
Number of shares Market Qb or Principal Other Transfcrablc Sccurities Value Net Amount not dealt ori another Rmulated Market EUR Assets
United Kingdom 144.1 18 Carter & Carter
Total Other Transferable Securities not dealt on another Regulated Market
Total Investments
Other Net Assets
Net Asset Value
0 0.00 0 0.00
0 0.00
69,985,554 94.69
3,927,746 5.31
73,913,300 100.00
Schroder ISF Asian Equity Alpha
Number ot shares lranslerable Securities and Market '?o or Principal Moncy Market Instruments Admitted Value Net Arrioi.int to an Official Exchange Listing USD Asscts
China 896,000 China Communications Services 'H' 276,000 China Oilficld SCrViCOS 'H' 773,000 I lorigguo lriterriatiorial 104,700 Shanghai Zhenhua Port Machinery
Hong Kong SAR 382,000 AAC Acoustic Technology 126.000 ROC Hong Kong 770.000 China lnsmnce Interrratiorial
140,000 China Overseas Land & Investment 535.000 Citic International Financial
244.400 Dah Sing Ranking
28.500 China Mohile
287.000 CNCIOC
1.050.000 Denway Motors 21.000 Esprit 85.500 Jardine Strategic
54.500 Swire Pacific 226.000 Shangri La Asia
India 14.500 Oharti Airtel 39.840 IVRCl Irifrastructures R Projects
Indonesia 121,500 Astra International 734.000 Hank Hakyat lntfonesia 51 0.000 First Itesources
1 .I 55.500 lndika Energy
Malaysia 402,200 AMMR
371,600 MMC 26.775 AMMR (Kuala Lumpur)
Philippines 31 1 .I 00 First Philippine
2.1 77.400 f3ohinsnns Land
Singapore 970.000 Camhridgc Industrial Trust 12/.000 UOL
South Korea 1.670 Chcil Worldwide 6.040 Daewoo Stiipt)iJilding i% Marine
7.080 Hyundai Dcvclopmcnt 10,510 Kookmin Rank 43,370 Korea Exchange Bank
553 Korean Reinsurance 11.830 Modctour Network
670 P0:X;o
850 Shinsegac
Engineering
3.040 Samsung Fire R Marinc Insurance
Taiwan 170,000 Cathay Financial 321.000 Chinatrust Financial P58.000 Churighua Telecom
137.31 9 HON tIAl Precision Industry 2 I9,OOO Siliconware Precision Industries 940,000 SinoPac Financial 790.000 Taiwan Cement 255.559 Taiwan Semiconductor Manufacturing
1.376.000 Financial One
1,548,486 7.45 653,696 3.15 495,442 2.38 241,219 1.19 152.129 0.73
6,415,336 30.88 319.360 1.54 333,615 1.61 643.920 3.10 387.967 1.84 221.151 1.06 408.156 1.06 493.844 2.38 133.703 2.09 405.239 1.95 718.107 1.05
1,170,600 7.08 527,394 2.54 55/.2G2 2.68
523,924 2.52 242,902 1.1 7 281.022 1.35
1,497.229 7.21 253,592 1.23 406.877 1.95 427.453 7.06 410.307 1.97 '
763,375 3.67 ' 473.433 7.04 26,058 0.12 I
313,884 1.51
512,396 2.41 163.976 0.74 , 358.470 1.73 '
795,280 3.83 477,815 2.30 31 7.465 1.53
3,917,977 18.86 3G5.153 1.91
235.699 1.13 358.019 1.72 525,606 3.01 593.798 7.86
6.358 0.03 265.217 1.28 347.753 1.67 633,756 3.05 356.588 2.70 '
4,156.703 20.01 369.565 1.77 315,583 1.52 667.095 3.21 374.312 1.80 661.571 3.14 .I 11,240 1.98 407.148 1.96 391.634 1.89 568,555 2.74

Page 172 Sctiroder Inlernatinnnl Sclcctiori Fur id Serrii-Aiinual Rcporf Jurie 2008
Portfolio of Investments as at 30 June 2008 (cont) Schroder ISF Asian Equity Alpha Schroder ISF EURO Equity Alpha
Market ?SO Nurriber 01 shares Transferable Securities arid Market L;b Nmber of shares rransfcrable Securities arid Value Net or Principal M C J W ~ Market lnstrurrierits Adrriilted value et or rlrincipal Morwy Markct Instruments Adrriitted
Ariioiiril to an Official Fxctiariye Li:;tiny tJSD Assets Amount Io an Official Exchange L-istiriy EUR Assets
Thailand 1 .G?8,200 LPN Uevdopmcnt
752,500 Tisco Darilc
Total Transferable Securities and Money Market Instruments Admitted to an Official Exchange Listing
Total Investments
Other Net Liabilities
Net Asset Value
I
I
729,373 3.51 Austria 2i9.118 136 703 Roetiler llddeholm 449.655 2.1 ti
Finland 5.583 Nokia
20,860,079 100.41 France 15 ANF
2.831 A M 1 .0.10 RNP Paribas 2,201 Carrclour
203 Aufcminin.com
20,860,079 100.41
(84,623) (0.41) 1.1 / / Cie Gerierale d.Optique Essilor Ii-ilcrnational
20,775,456 100.00 1 .si 3 r w 1 ,1 Y 3 Eurofiri:; Scieintilic
23,895 FlO 1.000 Groupe Llarione
1.093 Orpea
1.789 Suez 3.076 Total
791 V i m
574 I afxye
ti45 Societe Generalc
Germany 882 Allianz 21 8 Baycrische Motoreri Werke 945 DeiJtsc:tie Bank '315 €.ON
4 0 I I N K 483 Muncherier Riic;Ic~ersichuruiiy~
1,024 :;iarncns
1,051 t ieliiiann
Greece 1,155 National Rarik ot Greece
Italy 8.Y24 h l C 0 P(J[J<JlXC
30.798 CIH Compagnic lndustriali Hiuriile 6.065 Uavidc Campari-Mlario
3.~131 EN1 1,783 F ib
373.G30 Ccmina 7.857 Gruppo Coin
:13,/57 Iride 2.000 I clxottl(:a
70.000 Parnialat 776 Saipcm
12.031 :avr- 3.646 LJniCrcdit
7.000 rrlei
Luxembourg 7.1 13 ArcelorMittal
Netherlands 333 ING Groep
3,3ti2 IJnilever
Spain /, / 3 / RariCo Hilbuo Vizrxiya Argentaria
/.%E; Iberdrola 1T),til9 Banco Santander
9,000 Tclcfonica
50,405 1.31 50,105 1.31
85,643 2.22 85.W43 2.22
975,051 25.33 1,652 0.04 3.777 0.09
53.4Y2 1.39 59,fi28 1.55 /8.9?:, 2.05
45.d% 1.18 90,099 2.34 65.558 1.10
134.529 3.50 44,430 1 .I 5 55.006 1.43 33.632 0.87 35.u17 0.93 75,659 1.99
166.432 433 30.501 0.79
493,283 12.81 910,025 2.55
ti.647 0.17 51,Y/5 1.35
120,421 3.13 49,114 1.27 12.140 1.09 63.671 1.3'3 71.ti90 i.m
33,426 0.87 33.476 0.87
1,003,953 26.08 93.145 2.42 53,773 1.40 32.266 0.84 12.700 1.11 82.667 2.15 18,501 0.18
789.60U 7.52 95.004 0.B5 ti5,55ti 1.70 29,B20 0./7
110,OTsO 3.02 1?.939 0.60
117.919 3.06 14.074 0.36
132,717 3.45 13?.717 3.45
68,958 1.79 8.677 0.W
80.281 1.51
434,554 11.29 95,165 2.47
124.?4? 3.23 63.857 1.66
151.290 3.Y3
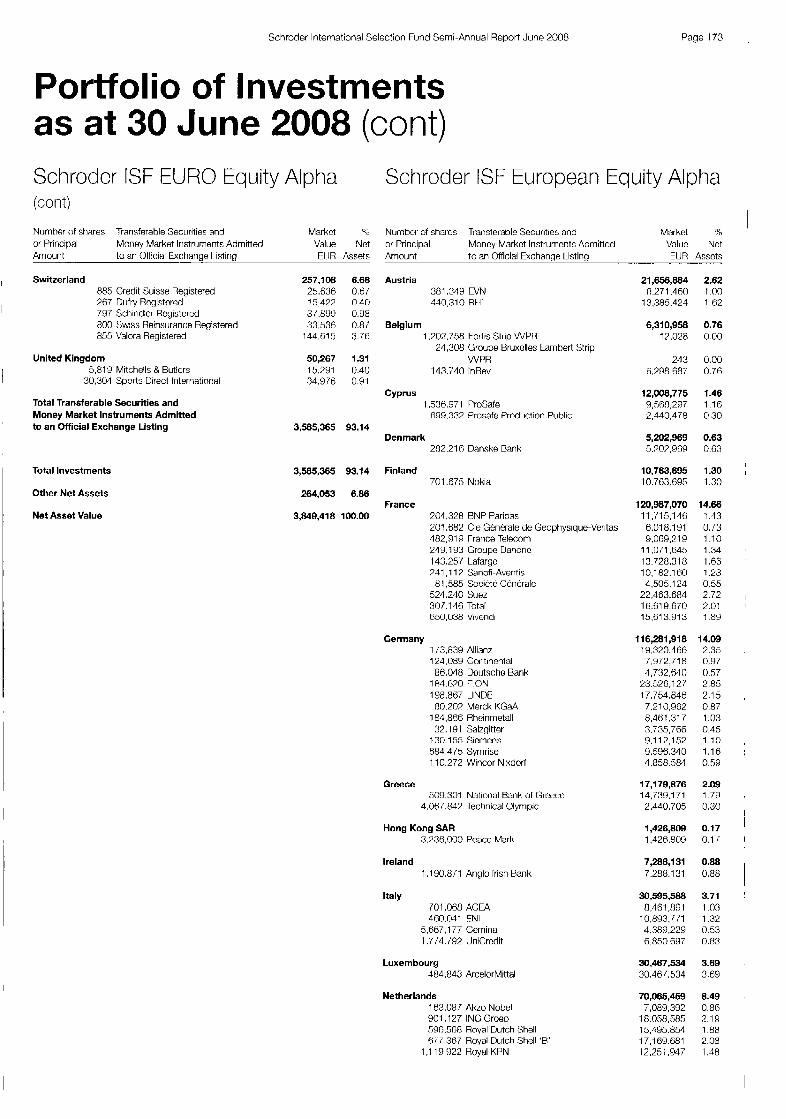
Schroder International Selection Fund Semi-Annual Report June 2008 Page 173
Portfolio of I nvestrnents as at 30 June 2008 (cont) Schroder ISF EURO Equity Alpha Schroder ISF European Equity Alpha (cont)
Numtjer of shares Transferable Securities and Markct 4; Number of shares Transierable Securities and Market Ph or Principal Money Market Instruments Admitted Value Net or Principal Money Markct Instruments Admitted Value Net Amount to an Ollicial Exchmlge I istirill ELIR Assets Amount to an Ofticial Exchange Listing EUR Asscts
Switzerland 885 Credit Suisse Registered 267 Dufry Rcgistcred 797 Schindler Registered 800 Swiss Reinsurance Registered 855 Valora Registered
United Kingdom 5.818 Mitchells & Butlers
3030.1 Sports Direct International
Total Transferable Securities and Money Market Instruments Admitted to an Official Exchange Listing
Total Investments
Other Net Assets
Net Asset Value
257,108 6.68 Austria 25.638 0 6 / 15472 040 3/.899 0.Y8 33,538 0.8t Belgium
144.615 376
50,267 1.31 15.791 040 34.9/6 091
Cyprus
3,585,365 93.14
381.319 EWN 440,310 Rt II
,702,758 korlis Slrip WPII 21,308 Groupe Bruxclles Lambert Strip
WPR 143.740 InBev
,536,971 ProSafe R99.33:! Prosafe Production Public
Denmark 282.21 6 Danske Barik
3,585,365 93.14 Finland 701.675 Nokia
264,053 6.86 France
3,849,418 100.00 204,328 RNP Paribas 201,682 Cie Generale de Geoptiysique-Veritas 482,91 9 Frarice Telecom 219.lY3 Croupe Danone 143.251 Lafargc 741 .I I ? Sanofi-Awritis
521.240 Suez 307.146 Total 650.038 Vivendi
81,585 Socictc Gdndralc
Germany 1 /3.839 Allianz 124,089 Continental
If34.670 T.ON 198.867 LLINDC 80.207 Merck K&aA
181.866 Rheinmetall 32.191 Salzgittor
130.155 .(;lemens 884,4/5 Symrise 110,272 Wincor Nixdorl
86.048 Deutscho Rank
Greece 509.301 National Bank of Greece
4,061,847 Technical Olympic
Hong Kong SAA 3.P36.000 Peace Mark
Ireland 1.190.8/1 Anglo Irish Rank
Italy 101,068 ACEA 460.041 EN1
5.667.177 Ccminn 1 .//4.iY2 UniCrcdit
Luxembourg 484.843 ArcelorMittal
Netherlands 163.08 7 Akzo Nobel 901.127 INC Groeo 598,568 Royal Dutch Shell 6/7.367 Royal Dutch Shell ‘R’
1.1 19,922 Royal KPN
21,656,884 2.62 8.27 1 ,460 1 .OO
13.385.424 1.62
6,310,958 0.76 1?.0P8 0.00
213 0.00 8,298,587 0.76
12,008,775 1.46 9,568,297 1.16 2.440.478 0.30
5,202,969 0.63 5.70P.969 0.63
10,763,695 1.30 10.763.895 1.30
120,987,070 14.66 11,115,146 1.43 6,018,181 0.73 9,089,219 1.10
11,071,645 1.34 13,728,318 1.66 10.182.160 1.23 4,505.124 0.55
22,463.684 2.72 16.619.670 2.01 15.513.913 1.89
116,281,918 14.09 19.320.468 2.35 7,972,718 0.97 4,732,640 0.57
23.526.121 2.85 17,754,846 2.15 7.210.962 0.87 8.461317 1.03 3,735,766 0.45 9,112,152 1.10 ‘3.596310 1.16 4.858.584 0.59
17,179,876 2.09 14.739.1 71 1.79 2.440.705 0.30
1,426,809 0.17 1,426,809 0.1 r
7,m8,131 0.80 7.288.131 0.88
30,595,588 3.71 8,461,891 1.03
10.893.7/1 1.32 4,389,229 0.53 6.850.6‘37 0.83
30,487,534 3.69 30,461’334 3.69
70,065,459 8.49 7,089,392 0.86
18,058,585 2.19 15.495.854 1.88 17,169.681 2.08 12,251347 1.48

Page 174 Schroder Irilerriational Selectiori Furid Serni-Annual Rcport Jurie 2008
I
Portfolio of Investments as at 30 June 2008 (cont) Schroder ISF European Equity Alpha (curl t)
Number of shares Transfcrablc Securities arid Markel '?, or Priricip;il Money Market Iristrurrierik Admittcd Valiie Nct Arrioiint to an Official Exctianyc Listing EUR Assets
Russia 1 ,014,336 C o r i i : x i r Unitcd Telesysterris GUI 1
300.671 OAO Guprorn AOR 233.533 PIK GDR 290.9?2 Sisterria GUH
Spain 1.191.5T6 Barico Ililbao Vizcaya Argentaria 1 ,091,958 Bdrlco Santandcr
865,235 Telefonica
Switzerland 715.752 Credit Suisse Reqistered
538.553 Novartis Reyi:itered 21 3.477 Roche
5,l 77 Slkd
1,150.980 Nestle I ieyislcrcd
45, I 1 9 Syrigerita Reyi:;Lcrcd 1,003.524 Tcmcnos Resistered
92,146 Ziiric:ti kinnncial Scwices
United Kingdom 38:Y.510 AstraZerieca
2,820.512 RP 7,409,599 C;ape 1 .I 07,033 GlaxoSmithKline
786.1 fi3 HSBC 1,598,852 Old MUtUal 3,713,338 ncjyai Bank of Scotlarid
559,864 Ilnilevcr I 1 0.91 9 Vedarita I iesources
9,180.789 Vodafone
Total Transferable Securities and Money Market Instruments Admitted to an Official Exchange Listing
Number of shares or Priric:ipal Other Transferable :.;ec:iirilies
27,263,121 3.30 5,544,!2:34 0.79
I 1 ,102.403 1.35 4.072.018 0.4Y 5.532.865 0 67
41,952,794 5.09 14.730.185 1.79 12.818,109 1.56 14.376.500 1.71
130,918,880 15.87 6,?49,717 (1 76
33.097.01Y 4.01 18.835221 2.78 74,l 16.087 2.92 4.9Y2,tidl 0.61 '3.290,82/ 1.1 3
19.475.280 2.35 1.1 3 1 1.167 1.81
145,475,367 17.63 9,037,498 1 .20
2(?.!Y2!),381 2.50 26.383.004 3.20 18,830,960 7.G4 7.743.748 0.94 5,351.528 0.66 9,969,023 1.21
11,785.000 1 43 19,737.834 2.39 17,116,617 2.0:
795,845,828 96.44
Market 7" \/slue Net
Amount riot deal1 on anothcr Hcgulated Market EUR Assets
Italy 150,900 I 'armalat Finaniiaria
United Kingdom 583,333 0r1t ioniimetics Equity 62 I 800 Sphere Medical
Total Other Transferable Securities not dealt on another Regulated Market
1,509 0.00 1.509 0.00
3,432,546 0.42 2.21 3.493 0 . x 1,719,053 0.15
3,434,055 0.42
Total Investments 799,279,883 96.86
Other Net Assets 25,921,319 3.14
Net Asset Value 825,201,202 100.00
Schroder ISF Global Equity Alpha
Number ut shares Transferable Securilies and Market B Value Nct or Priricipal Money Market Irisiruments Admitted
to ari (1llic:ial Exchange Listing USD Assets Arrioiint
Bermuda ?9.312 Mk Global
Canada 15.873 Canieco
China 6.788 Ctrip.mm lntcrnational ADR
Denmark 10,416 Ddriske Bank
France 10.504 A M G.771 sue^ 7.38Y Total
Germany 3.240 Liridt. 3.%5 Siemens
Hong Kong SAR 202,000 China Uniconi 890.000 Denway Motors 152,000 Shariyri-l..a Asia 46,500 Swire Pacific
Israel 5u.622 Maktileshim-Agan Industries 11.423 leva Pharmaceutical lridustries Allt i
Italy 48,808 Irites:i 5anpaolo
Japan 41 Central Japan Railway
1 t?,300 Honda Motor 15.500 Milsubishi 73.000 Sekisui Cherriic:al 13.900 Square Enix 15,000 Toray Industrics 26,900 Ushio
Luxembourg 6,740 ArcelorMittal
Norway 26.028 Telerior
Singapore 98.000 Keppcl Land
South Korea 11 ,640 Uacwoo ShiphiJil(hy K Marine
rrigirieeriiiy
Switzerland 1 ti,l 80 Nestle Regislered 3.383 Roche
35.895 STMicroelectroriics
United Kingdom 34.763 Admiral 56.7 1 3 Rcxam
34.094 Tesco 1,351 Rio 1 irili:)
91 2.035 Vodafone
187,304 0.75 187.304 r1.75
636,547 2.55 6363,547 2.55
319,579 1.28 319,579 1.78
304,413 1.22 304.413 1.72
1,602,249 6.41 312,131 1.25 659.914 2.61 830.1 14 3.62
895,658 3.58 455.928 1.82 439.730 1.16
1,548,720 6.20 375.038 1.50 343,488 1.38 354.101 1.42 475.481 1.90
I ,043,036 4.17 526.718 3.11 516.320 2.06
277,520 1.11 2 / i . m 1.11
3,346,458 13.40 520,049 1.08 :55G,488 2.23 513,051 2.05 409.139 2.00 412.787 1.65 403,584 1.62 441.380 l , / /
667,246 2.67 667,246 2.87
488,287 1.95 488.287 1.95
357,372 1.43 357.372 1.43
454.228 1.82
154.Y28 1.n2
1,709,425 6.84 732.420 7.93 602,359 2.41 374,546: 1.50
2,776,425 11 .I 1 554,428 2.22 336.111 1.75 544,645 7.18 618,132 2.47 6323.079 2.4Y

Schrodar International Selection Fund Semi-Annual Report June 2008 Page 175
Portfolio of Investments as at 30 June 2008 (cont) Schroder ISF Global Equity Alpha (cont)
Number of shares Transferablc Sccurities and Market ':A or Principal Money Market Instruments Admitted Value Net Arnount to an Official Exchangc Listing LIS0 Assets
United States of America 10,258 AGCO 1.021 Apache
13,375 Avon Products 26,019 (:orrimst
5,790 ConomPhillips 1 1.359 Electronic Arts 9,805 Estee I aider 8,798 JP Morgan Chase & Co
77.707 Microsoft 93.47/ National City 10.825 Omnicom 30.243 ::cheririg-Ploiigh
9.149 Travelers 5.310 LJltra Petroleum
1 1,929 Wyeth
Total Transferable Securities and Money Market Instruments Admitted to an Official Exchange Listing
7,530,545 520,081 551.690 474.01 0 181.731 484.776 499,l 14 152.207 308.370 753.387 447.755 483.986 583.972 405,301 529.354 549.808
30.18 2.08 2.71 1 90 1.91 1.94 2.00 1.81 1.23 3.02 1.79 194 2.38 1 .e7 2.12 2.20
24,153,012 96.67
Niurriber of shares Market "b or Principal Other Transferable Securities Value Net Amount not dealt or1 ariother Regulated Market USD Asscts
United Kingdom 1,499,814 l3olls 1 ioyc:e
Total Other Transferable Securities not dealt on another Regulated Market
Nurriber of shares or Principal Amount Derivatives
2,990 0.01 2.980 0.01
2,990 0.01
Market 96 Value Net LJSD Assets
India 286,956 1.15
18!01~7013 286.056 1.15
Total Derivatives 286,956 1.15
41.043 Slirirarn Transport Finance harrants
Total Investments
Other Net Assets
Net Asset Value
24.442,958 97.83
542,853 2.17
24,985,811 100.00
Schroder ISF Japanese Equity Alpha
Numher of shares Transferahle Securities and Market B or Principal Money Market Instruments Admitted Value Net
JPY Assets Amoiint to an Official Exchange Listing
Japan 140,700 Hridgestone 240.600 CKD
75.600 FUJlFlLM 73.700 HOYA
100.700 lriso Electronics 350,000 JFE Shoii
4P7.700 Kyokuto Kaitiiltsu Kogvo 130.100 Lintec
369 KODl
9)f,000 Mitsiihishi Estate 69.730 Mitsubishi UFJ Lease & Finance 86.000 Mitsui & Co. 49,400 Murata Manulacluring
1G4.800 Narriiira Stiiphiiiklirig 82.000 Nippon Electric Glass
109.300 0% 51 7.000 Sakai Chemical Industr) 100.200 Scvcn & I
51 6.000 Shinmay*va Industries 28.000 Shimamura
19.300 SMC 570,900 sOJlt7
33.400 Sony 51.500 Squarc Enix 88.200 Sumco
431.000 Sumitorno Ctierriical 373.000 Sumitomo Heavy Industries 51 1.000 Sumitomo Melal Industries
133,000 Tokai Carbon 52 1,000 Tokyu 64.400 Union Tool
140,000 l Jshio
51.200 Takeda Ptiarrnaceutical
Total Transferable Securities and Money Market Instruments Admitted to an Official Exchange Listing
Total Investments
Other Net Assets
Net Asset Value
7,387,050,300 96.97 PP8.358.100 3.01 158.489500 2.08 275,940,000 3.62 180,933,500 2.38 777.701 ,000 3.58 278.950.000 3.66 242.0fd4.000 3.18 2/i.252,800 3.64 740.034.500 3.1 5 733.780.000 3.06 32 1.455300 1.22 201,670,000 2.65 247.000.000 3.24 137,334,000 1.80 150.fi34.000 1 .98 131,i60,000 1./2 71 1.453.000 P.78 303.606.000 3.99 183,120,000 2.40 216,720,000 2.84 224.459.000 2.95 202.098.600 2.65 154,876,000 ?.03 161.710.000 2.12 207.270.000 2.72 288.339.000 3.78 268,187,000 3.52 238,)f37,000 3.13 2/6.480.000 3.63 143.773.000 1.89 287.071.000 3.77 198,996,000 2.61 242.900.000 3.19
7,387,050,300 96.97
7,387,050,300 96.97
230,899,604 3.03
7,617,949,904 100.00

I Page 176 Sthroder International Selcrtiori Furid Serni-Annual Rrporl Jurie 2006
Portfolio of Investments as at 30 June 2008 (cont) Schroder ISF US Large Cap Alpha Schroder ISF Global Equity Sigma
! Numhcr of shares Trarisferdble Securities and Markct 5,2 NLrriber 01 shaics Transferable Securilies and Markel 56
Value Net or Principal Money Market Iristrunients Admitted Value Nct or Principal Moncy Market Instruriierits Admirted Amount to an Official rxctimye Listing LEX Asscts Amourit to an Official Cxcharige Listiny IJSD AssW
Cayman Islands 2.663 ACE
United States of America 3,4 i 3 Arriericliri Iriternalional 6,Wu Applicd Materials 4.042 Avon Products 3,303 Baxter 1 ,SI6 Bectori nickirison B Co. 1.834 Burlington Ncrtherri :;Rrila Fe 5.582 Citigroup 4.048 I:oach 4.198 Cognizant Techriology :Solutions 6.887 Corrlcasr 1 ,899 ConocoPhillips 3.471 (:ovlcjieri 2.583 Danaher 3.172 Ecolab 1.458 tlectronic Arts
3,437 General Electric 3.661 Hehlett-Packard 7.19:; Intel 2.701 Kellogy 2.ti74 Kohl's 4,191 Lehman Brothers 3.905 LLexmark lntcrnational 3.836 I.0we's 3.070 Marathon Oil 1,205 Morisarito
15,191 Nalional City
1 ,520 w r x
6,500 New:; 2.237 Noble 4.1 1 1 Procter & Garrible 1. i 1 7 Pruderitial I ir;anciaI 3.1 95 Quicksilver Resources 5,321 Ikllanr tncrgy 8.81 0 Scheririy Plough 1.81 2 State Street
1 1,263 Time Warner 4.050 I JX 1.589 llltra Pelroleurn 5.832 Wastc Management 3,404 LVyetl1
Total Transferable Securities and Money Market Instruments Admitted to an Official Exchange Listing
Total Investments
Other Net Assets
Net Asset Value
147,104 2.54 Australia 147,104 2.54
5,497,710 G6.378
133.90n 1 6'1.5 12
125.765 178,032 9B,2(.)0
1 13,55u 138.077 128.303 1 /4,024 164,491 198,555 139,563 64.065
llT.420 90.91 2
163,207 15-1 ,821 129,540 110,650 93.750
132,596 80.288
157.245 154.650 /2./65
100.295 144.SB8 738.674 1 0S.47B 124.541 1 10,890 133.866 11 5.986 1 67,412 128.9Y3 158,l 08 21 i.184 15/,121
2 0 7 . m
95.06 1 .tii 2.32 P.84 3.60 2.1; 3 0'3 1 6 1 2.05 2.39 2.22 3.01 Y.84 3.43 2.40 1.11 2.03 1.57 2.82 7.67 Austria 2.24 1.91 1 .u1 7.79 1.39 7.72 Belgium 2,u; 1.26 1.73 2.51 4.30 1.89 2.15 1.9% 2.31 2.01 Bermuda 2 81 ? ?\3 2 1 3 3.7G 7.77
5,644,814 97.60
5,644,814 97.60
138,875 2.40
5,783,689 100.00 Brazil
10.407 ASX 28,421 Australia B NCVJ Zealand Rxikiriy 17.888 Gabcock R Brown
44.382 BHt' Billiton 16.705 David Jories 14.453 Felix Rcsources
uti6 FKP Property 9,454 C;loucester Coal
554 lncitec Pivot ( '255 Mactluarie
153,730 B c x h Petroleum
808 oxl;lna 127.1 38 Qaritas Air$wiys 16.379 (1Ht liistirancc
1 ,84 1 Rio Tinto 34,938 Stockland 3.381 :;Lockland New
~17,058 TARGORP 97.70.1 Telstra 28,933 Weslpac Banking
5.585 Andrit7 8.818 IMMOFINANZ 1 .09ti OhlV 2.1 64 Hailleisen International Rarik
8.2.12 Belgacorri 2 , l 14 Colruyl
18.939 Uexia 3.277 Euronav 7,849 GimV 5.610 IriDeL, P.54? !;olvay S.?m thiicore
20.1C0 Accenture
13.41 7 Aquarius Platii-ium 0,900 ACt
3,000 Arch Capital
1,700 Central Europeari Media l-rilerpri:je:j 3,100 Endurance Specialty 3,600 rveresl I le I.700 Frontline
7?.577 Hiscox 2 1,011 Lancashire
Y.800 AXIS ( ; ~ ~ ~ J l h
5.200 Max Capital 8.400 Nabors Industries 3.900 I {enaissanceRe 6.500 XI Chpital
11,500 Baricu do Brasil 1,900 Ceritrais tletricas Brasileiras
Pretercncc 5.400 Companhia de Sariearnento Basico
do Estado de Sao Paillo AUR 4.000 CPFL Encrgia ADK
360 Investiriierilos Hail 15,300 Iriwstirrierilos ltau Prefet-ence 6.000 Metalurgica Gerdau Prefererlce 4.200 Usinas Siderurgicas de Minas Cerais
Preference
6,458,102 314.035 51 1,291 128.927 204.40?
1,863,833 12E, 133 236.1 19
3,138 11 7.200 110.271 339.12 1
2.042 371,426 352,381 213.G84 180.972
1 1.51 3 443.835 398,109 51 1,652
808,800 358.161 91.869 85.338
2 74 .J 32
2,700,445 356,788 570,486 305.970
1 80.BB8 387.1 tis 331.854 405.123
3,728,469 830,934 491.636 2 15.583 198.840 295,392 108.936 90,751
288.504 120.772 c3.732
129.558 11 3.100 41 5.044 11'3,734 154.505
1,388,765 193.31 1
130,611
269.676 279.440
2,250 07.833
205,375
2 10,429
1.7~7 778 \IL>.
2.40 0.1 1 0.19 0.05 0.08 0.69 0.05 0.09 0.00 0.04 0.04 0.1 3 0.00 0.14 0.1 3 0.08 0.07 0.01 0.1 6 0.15 0.19
0.30 0.14 0.03 0.03 0.10
1 .oo 0.14 0.21 0.1 1 0.0t1 0.07 0.14 0 12 C1.15
1.38 0.31 0.1 8 0.08 0.07 0.1 1 0.04 0 04 0.1 1 0.04 0.03 0.05 0.04 0.1 5 0.07 0.06
0.52 0.07
0.05
0.10 0.10 0.00 0.04 0.08
0.08

Schrndcr lntcrnatiornl Selectinn Fund Semi-Annual Report June 2008
Portfolio of I nvestrnents as at 30 June 2008 (cont) Schroder ISF Global Equity Sigma (cont)
Number of sharcs lranstcrable Securitie:; arid Market Qb or Principal Money Market Instriinwits Adrriitted Value Net Amount to an Official Exchange I isting USD Assets
Canada 7.900 Agnico-Eagle Mines 9,000 AltaCas Income lriist 1.300 h r i k of Nova Scotia
1 1 ,100 Canadian National I3ailway 13.100 Cariaciiari c)il Sands Trust 5, /00 Canadian Pacific Railway
20.000 CGI 5,600 Davis & Hendcrson Income h i n d
8,/00 FnCana 8.435 Enerplus Hesources Fund
7.300 Uut?dcc
12.200 tnergy Saviriys Iri(:nme riind 800 Fairfax hnaricial
9.100 Husky tnergy 3,900 Manitoba Tclecorri Serices
19,300 Manillife Financial 12.000 Mullcn Group Income Furrd 21.981 Penn Wcst Energy Trust
1 ?.300 Pow,er Corp of Canada 10.900 Power rinaricial
1.800 Potash Corp of Saskatctiwari
8,800 Research In Motion 5.600 Hogcrs Commwlicatioris
70.1 00 Royal Rank of Canada 76.600 Shaw Communications
6.800 Shoppers Urug Marl 1 6. 105 Tcck Cominco 2.100 TELUS
11,100 Toronto-Dominion Barik 14.500 Trinidad Ilrilling 5.700 Vcrmilion Energy .lriist
21,081 Yamana Gold
Cayman Islands 4.900 Herbalifc
22.700 Seanate Technology
Chile 1.400 Administradora de Fonths de
Perisiories Provida ADR
China 120,000 YanLhou Coal Miriirig '1 I'
Denmark 13,400 Oanskc Rank 10.632 Novo Nordisk
Finland
France
1,685 Kone 9.625 Neste Oil
61 5 1 3 Nokia 9.360 Outokumpu 1.30/ Rautaruukki
15,362 :Sampo
1 1.408 BNP Paribas 5,478 nouygues
14.221 Carrefour 2 1,807 Credit Agricole
15.061 Etablissements Maiirel et Prom
37.31 6 France Telecom
3,167 Dnssault Sysiemes
3.547 Fonciere Des Regions
1.941 Gecina 5.294 COreal 1 ,668 ILafarge
13,221,684 4.90 680.799 0.73 230.299 0.09 60.523 0.02
530.446 0.20 686,688 0.25 300.662 0.14 152.137 0.07 87,457 0.03 !x1.630 0.03
770.219 0.79 ,433 0.15
171,298 0.06 195,R81 PO7 129.132 C.16 155.324 LO6 67G.845 C.25 274.66/ 0.10 746.255 0.28 08.383 0.15 77.793 0.14 54.956 0.13
218.063 C.08 911,477 0.34 518.fi86 0.19 361,573 0.13 761.160 0.28 G9.982 0.04
700.736 0.26 201 ,163 0.07 248.522 0.08 319.312 0.13
631,483 0.23 189.287 0.07 442,laR 0.16
36,064 0.01
35.034 0.01
,103 0.08 ,103 0.08
1,092,651 0.41 389.3i8 0.15 703.773 0.76
2,368,718 0.88 69,llfi 0.03
781.563 0.10 1,245,4R9 0 46
33/.39!B 0 1:i 59.978 007
385.226 0.14
9,036,685 3.65 1.030.925 0.37
334,866 014 804,230 0.30 450, 605 0.17 193,028 0.07 351.328 0.13 433,778 0.16
1.104.557 0 41 236.821 009 566.317 071 251 0.05
Page 177
Number of shares Transferable Securitics and Market "/a
or Principal Money Market Instruments Admitted Value Net Amount to an Official Exchangc Listing VSU Assets
France (cont) 10.883 Natixis
Rhone
9,889 Thalcs
1.8 10 Socidtk Dcs Autoroutes Paris Iqhin
78 SocietG Gknerale
26.1 17 Total 81 2 Unibail-Rodamco
2.144 Vallourec
Germany 5,575 Allianz
14.226 BASr 7,244 Rayerische Motoren Werke
17.759 Daimler 8.0(57 Deiitsche Bank
18.81 5 Deutsche Post 47.365 Ueutsche Ielekom
6 E96 E.ON 6.81 3 I lanriuver Rtickversicherung 5.7 1 6 Hypo Heal Estate 1,049 Merck KGaA 2.983 Miinchener Ruckversictler~ing:; 4.343 Norrideutsdw Afherie 7.720 Porsche Automobil Preference 7,407 ThyssenKrupp 1,651 Volkswayen 1.469 Wacker Gherr~ie
Greece 5.015 Coca Cola I lelleriic Bottling 2.457 National Bank of Greece 3.366 DPAP
Hong Kong SAR 13,000 Cheung Kong
60.000 Hang Lung
80.000 Hongkong Land
770,000 Cnpc I long Korig
808,000 Henderson lnvostment
358,000 tiutchisori Telecorrirriuriicatioris International
R7,000 I iysan Development 9,600 Jardirie Nathesori
17.068 Jardine Strategic
33.000 Swire Pacitic $0.000 Wharf 87.000 Wheelock & Co.
120,000 New World Development
Hungary 2,188 MOL Hungarian Oil and (.>as 7.159 OIF'Barik
Indonesia 447.000 Aneka Tarnbang 507.000 Hank Ccntral Asia 267,000 International Nickel Indonesia 747.000 Telekomunikdsi Indonesia
Ireland i.401 Kerry 4.31 5 Paddy Power
Israel 70.200 Check Point Software Technologies
123,946 0.05
171.455 0.06 6,789 0.00
561.116 0.21 2.757.906 0.84
187,278 0.07 744,821 0.78
9,472,356 3.51
982.546 0.36 348.124 0.13 /8/.914 0.29 599.314 0.26 187.829 0.18 780.138 0.29
1,344,684 0.50 334,l 16 0.12 161.987 0.06 148,656 006 527.448 0.19 235.133 0.09 418.424 0.16 463.165 0.17 469.181 0.1 I 308.846 0.11
389,119 0.14 160.026 0.06 111.845 0.04 117.748 0.04
3,514,609 1.30 175,187 0.05 127.399 0.04 266.569 0.10 76,665 0.03
342.400 0.13
U/6,591 0.3/
607.684 0.19 938.720 I).OY 294./20 0.11 283.570 0.11 244.336 0.09 337,443 0.13 376.774 0.14 233.142 0.09
593,702 0.22 294.094 0.11 299,688 0.11
654,099 0.24 152.158 0.06 135.054 0.05 175.144 0.06 191.543 0.07
352,838 0.13 219,537 0.08 133,301 0.05
483,992 0.18 483.992 0.18

Page 178 Sctirotler Irilernational Selection Furid Serni-Annual Report Juric 2008
I
Portfolio of Investments as at 30 June 2008 (cont) Schroder ISF Global Equity Sigma (cont)
Number of shares Traristerable Securities and Markct 9; or Principal Moriey Markpt Instrumcnts Admitted Value Net Amount to ari Ollicial Exchange Listing USD Assets
Italy 26,177 TNI 95,869 Inte%i Sanpaolo 82,548 Telecorri ltalia 39,927 lerns ttetc Elottrica Naiioriale 31 ,450 IJriiCredit
Japan 18.100 ADEKA 36.400 Aeori 83,000 Ajinomoto
12.600 AOC
18,500 Asah Rrcwcries 73 Asset Managzrs
1?5.000 All Ntppon Airmys
1,025 Ardepro
(3,000 Atrium 23,200 Rridgestorie 17,400 Chubu Eledr c Power 6,000 Chugoku Electric Powcr
11,000 COMSYS 20 Creed
1 1,000 milo Paper 51,000 naiwa I1011se Industry
T.OOO Denso 172 Oentsu 154 Fuji lelevision Nctwork
4. i00 r(J.JIrII M 35,000 Fujikura 36.000 t-lilachi Cable
12,400 Honda Motor 78,000 IHI 11,600 JS 17.100 JTEKT 65,000 Kajima
6.400 Hitachi Intormation Systems
50 KDDl 4 i Kerietlix
1,200 Keyeriw 7,600 Kornatsu
5,100 Kiiroda Eleclric 1.100 Kyokuto Securities
10.500 Matsumotokivoshi 41,000 Matsusttila tleclric Works 39,000 Mazda Motor 11,000 Milo Seciiritics 1 8.330 Mil<jubislni 38,OOO Mitsubisht I4ayc.m
14.000 Mitsui & Co. 32.000 Mitsui Chemicals 78,000 Mitsui Minirig I I Srriellin!]
144 Mizuho ririaricial 94,000 NCC
24,000 NHK Spring 900 Niriterido
9 1,000 Nippon Express til ,000 Nippon Light Metal 71,000 Nippon Minirig 13.000 Nippon Oil
94 Nippori I 'aper
8.000 Nippon Thompsori
12.000 Kubota
199,200 Milsubishi I JF.1 Financial
4.300 NEC I easiriy
122 Nippo~) leleyraph & Tclcphone
50.000 Nippori Yiisen KK 5 t ,800 Nissan Motor 63.000 Nisshiri Steel 10,000 Nittctsu Mining 16,000 NOK
2,029,630 909.218 5.15.107 125,002 1tiY.121 1'31,3i8
27,401,447 149.093 45 1.299 598.1 84 -1 BY 3 1 2 129,885 18.2i4
346.T66 23.473 90.582
35ti,O!Xi 428,196 128.323 9/.3/l 21.833
138.284 537.980 241 .D30 365.d9? 233,024 162.238 152,972 133,843 149,801 423,340 158.5'37 280.7Y4 2i2.337 228,03Y 31 0.1 95 57,783
287.006 712,748 158.748 76.206: 31.209
223.Y08 481.370 %03.7?5 34,121
ti1 5,6:til 183.753
1.712.il5 31 (1,479 158.273 230.887 676.4fi8 191.26:Y
B6.773 192.01 8 509.835 4D8.040 100,318 405.387 789,547 257.80)
51.?UO 482,T88 429.596 21 5.08.1 13,881
255:l 19
0.75 0.3; 0.70 0.05 0.00 0.07
10.16 0.05 0.16 0.2 1 0 16 0.04 0.01 0.1 3 0.01 0.03 0.1 3 0.18 0.05 0.04 0.01 0.05 0.20 0.09 0.15 0.09 u.uu 0.06 0.05 0.00 0 . 1 li 0.08 0.10 0.10 0.08 0.1 2 0.0) 0.1 1 0.08 0 00 0.03 0.01 0.08 0.1 8 0.08 0.01 0.73 0.0i 0.50 0 12 0.06 0.0'1 0.25 0.1 8 0 . w 0.07 0.1Y 0.16 0.04 0.17 0.1 1 0.10 0.22 0.c2 0.1 8 0.lii 0.08 0.0? 0.09
NurrltJer of sharcs Transferable Securities and Markel 4; Moriey Markel Instrumcnts Admitted V;ilue Net or Principal
Ari iount to ari Officidl kxchainge Listing lJSD Assets
Japan (cont) 5,200 Norriura
2.110 OHlX 289 NTT DoCoMo
1 18,000 Osaka Gas 16 Pacific:
22.000 Hicoh 5,000 Hohm
10.000 San Ai Oil 12,000 San-In Godo h i l t 4.700 Sanei-lnternatiorial
13.600 ';ellto tpson 35,000 Sharp 40.000 Shirriizu 71.000 Slwnsei Bank 40.600 Showa Shcll Sekiyu KK 29,000 Sompo Japari lrisuraiice 1 Y,.100 Soriy lti,Y00 Surriw 10,200 Surriitonio Electric Industries
GO Siirriilomo M i tw Financial 1 18 Suricity
9,260 Takefiiji 4.900 TDK :3.X)0 10~810
3.700 Toyota Iricliistries: 13.000 loppan Printing
32.200 Toyota Molor 125 I V Asah
28.400 Urbari 16.000 Wood One 19,000 Yodogavda Steel Works 38.300 Yokoyawa Electric
90 Zephyr
Luxembourg 3.348 're1 inr is
Malaysia 70.200 Malayan Earikiriy !3ti.400 Malaysian Bulk Carriers
1 15,UOO Scorrii 139.200 Tenaga Nasiorial 29.400 Y I L
Mexico 43.400 tirupo Garso $8.500 Grupo Mcxico
Netherlands 7.962 Arcadis
11.838 ASML (i,OW Roskalis Weslmirnster 7.33Y Corio 7,699 Heinckcn 8.139 I leiriekeri Holdiny
24.991 ING Groep 1 200 Nutreco
1 1,974 Randstad 44.796 I hyal Dutch Shell 43.417 Royal KPN
1 .82 1 Smit Interriatioriale
Norway 1 1.350 Aker Sulutioris
21.000 StatoilHydro 3.570 Fred Olscn Energy
6.607 Yara International
77,35G 128.367 350.518 854,833 32.U31
398.838 288.91 G 43.787
105,315 73,785
3i3.563 572.300 1'30.278 244,411 446.548 ?73.709 807.4 14 375,591 130,032 702.133
13.871 120,346 294,723 3/.%99
143,770 118.571
1.525.848 179.886 83,529 91.545 98.488
351.705 6.250
126,119 128.119
690,022 151,461 107.960 22.642
347.201 d0.733
409,021 203.261 203.760
6,086,681 170.945 289.579 318.u17 572.700 393.1 67 281.087 789,387
19.3?4 415,202
1.809.441 783,043 178.200
1,833,137 267,552 21 0.899 782.580 312.126
0.03 0.1 6 0.13 0.74 0.01 0. I5 0.1 1 0.02 0.04 0.03 0.14 0.21 0.07 0.09 0.17 0.10 0.30 0.14 0.05 0.26 0.01 0.05 0.1 1 0.02 0.05 0.04 0.51 0.07 0.03 0.03 0.04 0.1 3 0.00
0.05 0.05
0.26 0.06: 0.04 0.01 0.13 0.02
0.1 5 0.07 0.08
2.26 0.07 0.1 1 0.12 0.21 0.15 0.10 0.29 0.03 0.1 5 0.67 0.29 0.01
0.68 0.10 0.08 0.29 0.21

Schroder International Selection Fund Semi-Annual Report June 2008 Page 179
Portfolio of Investments as at 30 June 2008 (cont) Schroder ISF Global Equity Sigma (cont)
I Number of shares Transferable Securities and Market 96 Number of shares Transferable Securities and Market ?O
or Principal Money Market lnstrumcnts Admitted Value Net or Principal Money Market Instruments Admitted Value Net Amount to ari Official txchanne Listiria USD Assets Amount to an Official Exchanoe Listina US0 Assets
Peru 1.600 Companhia de Minas Bueriaveritiir;l
ADR
Philippines 3.710 Chhe lelecorri
788.000 Metropolitan Rank &Trust
Poland 10,481 Polski Koricern NaftovJy Orlen
Portugal 8,092 (;alp Friergia
23.990 Portugal Tclecom
Singapore 99,000 Capital and 82.000 Mapletree Logistics Trtist 44.000 Singapore Petroleum
South Africa 11 1.973 rirstRaritl 13,762 Northam Platinum
South Korea 2.220 Hanyang Sccuritics
11.290 I lynix Semiconductor 4.093 s-Oil 3.530 ShiFhan Financial 1,000 Shinhan Financial ADR
Spain 7.800 Acerinox 6.203 ACS Actividades de Construccion y
Scrvicios 85.31 1 Ban::o Saritarder
13.584 Repsol YPF 65.91 4 Telefonica
2.1 06 Metrovxesa
Sweden 1.000 Atlas Copco
10,600 Allas Copco 'A 9.600 Getinge 9,000 Investor 9.300 Kinnevik Investment
21 ,400 Kiirigslederi 17,200 Scania 73.000 SKF 46.8% Telefonaktieholaget LM Ericsson 53.048 TeliaSonera 70.600 Volvo 5.11 1 Vostok Nafta lnvcstment 5,500 Witilhorgs rastigheter
Swilzerland 17.662 ABB Rcgistered 4.500 Addax Petrolelm 3.300 Alcon
1,781 Geherit I.iegi:;tered 5.762 Holcim Rcgistcred
52,820 NestlA Registered 29.411 Novartis Registercd
18,931 Credit Suisse Regislered
9.759 Rochc 1.489 Syrithes 1,757 URS Registered 9.868 Xstrata 1.902 Liirich Financial Services
296,424
2013.424
308,793 97.382
211.111
167,093 167.093
451,580 1 /8,559 773.001
679,631 114.881 51,744
213.506:
31 0,436 191,144 11 9,792
814,109 34,94c!
269.207 262.427 16G,308 88.130
4,540,702 119,861
307.384 1,513,216
194.315 539.329
1.7413.397
2,930,464 83.173
155.641 733.998 187,553 173,303 158.445 739.672 353.01 9 483.751 385.704 238.208 127.565 100.432
10,115,717 499.010 714.913 531.762 864.324 263.302 463,515
2,393961 1.530.Rl 2 1.737.635
204,941 37,334
78G.275 485.133
0.1 1
0.11
0.1 1 C.03 C.08
0.06 0.06
0.17 0.0/ 0.10
0.25 0.15 0.07 0.08
0.12
0.04
0.30 0.01 0.10 0.10 0.06 0.04
1.68 0.01
0.1 1 0.58 0 01 0.20 0.135
1.09 0 03 0.06 0.09 0.07 0.08 0.05 0.09 0.13 0.18 0.11 0.09 0 05 0.04
3.75 0.19 0.08 0.20 0.32 0.10 0.1 7 0.89 0 130 0 &l 0.08 0.01 0.29 9.18
0.08
Taiwan 78.000 Asustek Conipiter 52.000 Formosa Petrochemical
194.000 Grand Pacific Petrochernical 151,000 Prcsidcnt Securities
137.000 UPC Tcchnology 17,300 Silicoriware Precision Industries ADH
Turkey 13.079 Tupras Turkiye Petrol Rafirie
United Kingdom 19.999 3i
22.042 Antofagasta 27.702 Astrdencca 40.263 Aviva
107.407 Barclays 27.157 Beazlcy 35,074 BG 31 ,894 RHP Rilliton
218,020 RP 24,1388 British American Tohacco 13.584 British Land
n,8 17 Anglo American
154.266 B1 ,775 Diageo ,845 GlaxoSmithKlinc
125.354 HBOS 99.669 I ISDC 3 1,774 Imperial Tobacco 11.1315 Kazakhmys 16.518 Land Securities
57,990 Lloyds TSB
48,505 Marl 34.414 Marks & Spencer 13.832 National Grid 15.1 32 Heckitt Bcnckiser 35,656 Reed Elsevier 13,302 Rio Tinto
23.020 SAEMiller 79.399 Segro 2 1.247 Standard Chartered 11.400 Subsea 7
9.588 Liherty International
4,070 Lonmin
286.466 tioyal Bank ot Scotland
138.841 Tesco 8.683 Vedanta Resources
14.049 Venture Production 16.157 Victrex
603.003 Vodafone
United States of America 5.100 nuckle
13.317 3M 19,700 Ahhott Laboratories 7,000 Ahercromhie 8, htch
11 ,900 Aetna 5.900 Aftliated Computer Services
11.500 Aflac 12,900 Alcoa 11.31 1 Alliant Energy 2.500 Alliarit Techsystems 8.400 Allis Chalmers Energy
1,900 Alpha Natural Resources
6,000 Amazon.com 6.000 Ambassadors
1 6.900 Allstate
16.684 A h a
705,441 717.713 137.365 57.893 08.976
176.117 72.877
28g.083 299.083
27,695,141 327,931 478.245 289.584
1,177,433 399.335 ti22,455 60.231
898.517 1 ,?I 3.81 6 2,857,936
848.518 190.1 09 612.629
1,026,536 1.47 1.52 1
686.61 6 1,547,777 1,18 1,378
0.26 0.0: 0.05 0.02 0.04 0.05 0.03 '
0.12 0.12
10.28 0.1 3 0.18 ,
011 0.44 0.15
0.02 0.33 0.45 ,
1 .uti 0.31 0 01 0.23 ,
0.38 0.55 0.25 0.57 0.11 I
I
0 . 2 3 ,
3139,101 0.14 106.360 0.15 161.577 0.06 42 1.206 0.1 6 262,162 0.10 598,087 0.22 225.548 0.08 180.344 0.01 763.220 0.28 401.740 0.15
1,591.928 0.52 1.212.157 0.15
526.848 0.20 232.742 0.09 601.060 0.22 290.005 0.10
1.009.742 0.37 791,570 0.11 243.250 0.09 239.969 0.09
1.:71.961 0.66
120,120,300 44.56 234.090 0.08 925.665 0.33
1.044.100 0.39 448,700 0.17 479.689 0.18 309.832 0.11 725.075 0.27 468.407 0.17 381.746 0.14 248.800 0.09 147.840 0.05 786,188 0.29 195,3/7 0.0/ 339.619 0.13 447.860 0.17 93,660 0.03

Page 180 Schrorlcr Internatiorial Seleclior-i Fund Semi-Annual Report Jurie 2008
Portfolio of Investments as at 30 June 2008 (cont) Schroder ISF Global Equity Sigma (cont)
Number of sharcs Transferable Securities and Market 95 or Principal Money Market Instriiments Admitted Value Nct Amount to ari Official txchanyo Listing lJSU Assets
United States of America (cont) 2.400 Arrtedisys 5.000 American Capital Strategies
18,100 American Electric Power 7,230 American Financial
11 , I 11 American Intcrnational t i300 AriieriLredit
17.294 Ariiyeri 8.888 Anadarko Petroleurri 3,300 Ariixter Iriterriational
11,866 Aprile 22 838 Applied Materials
7 400 Arbor lieally Trust 4.300 Arcti Chemicals 5.200 ArCher-Ddrlif3k Midland 5.700 Asset Acceptance Capital 6.300 Assuranl 4.800 Asta I uridirig
4,000 Automatic Data Processing 2,000 Autozone
75.193 AT&T
60,436 Bank of Arrienca
6.000 Becton Dickinsori 8 Go. 10 000 Bed Bath & Eeyond 13.600 Best Buy 11 ,400 nJ :;er/ice:; 1.400 BlackRock 3.285 Ooeiriq 3.800 Boston Properties 7.900 Elurger King 3.700 Burlington Northern Sarila k
17.100 Capital One Financial 12,882 Caterpillar 9,700 Gt iesapealtc! Encryy
25.01 ti Chcvron 6.600 CtNJbb 9.000 Ciriminnli Financm
10.400 ClCCO
27.892 Coca-Cola 4,S00 Cotieri K Steers 2.600 Colgate-Palrnolive 6.200 Colonial Properties Triist
5,500 Corn Products International
!3.000 Costco VVholcsale 5,200 Coventry I lealth Care 4,300 CSX 3.900 (;V:.X;arenvi:k 8.200 Cypress Semicoriductor
1 1.920 ConocoPIiillips
2Y,200 Corriinq
11.700 Ueere & Go. 35.700 Ilell
G,20O Denbury Resources 1.208 Devon rriergj 3,100 Diamond Offshore Drilliriy
1 1,700 UIHECTV 11,758 Discover hnancial Sen,ices 15.400 DlSl I Network 2.ti00 Dorniriiori R ~ s o ~ I I ~ : ~ : ; 5.500 Uonaldson
?4.700 Uow Ctiemical 1.200 DST Systerris
10,100 Dii Forit (t.1.) de Ncmours & Co 5,000 Eastrnari Ctierriical 6.500 Ecllpsys
120.557 124,750 il6.398 196.670 308,330 75.032
801,923 660,912 1 35.657
?,01 8.233 440.535
72.372 14.1.652 171.184
(0.823 475.124 40.940
7.303.388 1 (ju.Sd0 240,260
1,486.1 71 192.028
,072 .GOO
280.800 544.580 36G,282 248.840
212.71/ 3ti0,380 li55.101 950,785 621,673
2:146.563 330,198 234.8 I9 733,413 339,458 2-13.152
1 .445.4(j3 133.91 7 11/.346 123,132
I ,092,349 267.025 084.740 632 3.10 163.800 767.202 1 55,l 03 204.257 835.146 794.325 218.6/4 828.055 -12/.418 299,286 159,556 450,004 1 ?(>,I 20 250.910 860 30 I 231.882 687.309 343.550 l?l.550
0.04 0.05 0.27 0.07 0.1 1 0.03 0.30 0.75 0.07 0.75 0.lfi 0.03 0.05 0.06 0.03 0.1 ti 0.02 0.91 0.08 0.09 0.55 0.07 0.20 0.13 c1.1 1 0.20 0,l4 0 09 0.08 0.1 3 0.08 0.1 3 0.24 0.35 0.23 0.91 0.12 0.09 0.27 0.74 0.l& O.%l 0.05 0.07 0.0.5 0.41 0.10 0.25 0.23 0.OfJ 0.10 0.06 0.08 0.31 0.29 0.08 0.31 9.1 :? 0.1 1 0.06 0.17 0.04 0.09 0.32 0.09 0.25 0.13
N\.mbcr of shares Trarislerable Secliritics and Markel Sb or Principal Money Market Instruments Adrriitted Valuo Net
USD Assets Amount 10 an Otticial Exchange Listing
United States of America (cont) 7,810 Eli Lilly X Co.
6,tiUO FrriFiIoyer:; 3.800 I riergiier 5.300 ENSCO Iriterriatior<il 2.200 Enterqy 5.200 Exelon
3 , 5 2 2 €xxori Mobil 4,000 Fair Isaac 4.700 Fidelity National lnforrriatiori Ser 7.000 k e n , 3.000 Flowserve 3.1 00 Franklin Resources
1 P.459 Genctntcch -4,800 Gerieral Cable 6.200 General Dyriarriics
90,068 General Electric 7.800 General Mills
15.400 Genworlti t iriarmal 2.400 Geriryme
21 ,915 Gerdaci Amcristcei 1 G.382 Cilcad Sciences 5.400 Goldman Sachs 5.100 Goochicti 3,100 Goo(]le 7.200 Crarnercy Capital 5.904 Halliburton 3,3/5 I larley-13abitl:;orn 5.500 Harris 4.500 I larsco 5,400 Hartford Firiaricial Services
18,300 Emerson Eiedric
33.218 I lewlett-Fat:ltnrd 12.500 Honeywell Iriterriatiorial 6.600 I lorace Mnnn Educators 8.500 Humana
1 1 , I00 Illinois Tool L?,orks 83.877 Intel 7.800 Inter Parfums 3.700 InterUigital
1 /,041 Interrialiorml Business Machines 700 Intuitive .Surgic:aI
7.300 IXYS 5,700 .John Wilcy & Sons
38.083 Jotirisoil R .ICJhn90li 52.336: JPMorgari (;tia:;e 8, Co. 9.500 Kelloqg
19,000 Keycorp 17.500 Kroycr G.000 Lam Research
19,000 I ehman Brothers 7.700 Lexniark International 5.800 Lincoln National 6.000 Locktieed Mxtin
3.500 Manitowoc 9.288 Marathon (311
19,700 McUonald's 13.248 McGraw Hill 10,424 Medtroriic: 8.127 Mcrck & Co.
108.051 Microsolt 1?.900 Miraril
10.500 National City 10.1 00 National Semiconductor
14.900 Lowe's
1,000 MTS Systerri:;
8.200 Nike 8.300 Nordstrom
0.05 7.800 Nortolk Southcrn
:356,211 0.13 881,511 0.33 133.718 0.05 281.770 0.10 4>7.604 0.18 238,884 0.10 452,400 0.17
5.497.R29 2.04 81.240 11.03
173./58 0.06 321.020 0.12 414,420 0.15 295,887 0.11 90B,018 0.34 285,792 0.1 1 516.336 0.19
2,365,188 0.88 466,986 0.17 277.043 0.10 174.120 0.06 422.980 0.16
1 ,637,017 0.51 86,324 0.03
312.847 0.17 204,212 0.08 281,490 0.10 244.845 0.09 361,800 0.13
1.480.709 0.55 615.375 0.23
350.i95 0.13 553,676 0.24
1.802.51 / 0.07 113.128 0.04 91,908 0.03
?.045.772 0.7ti 1H8./13 0.07 89,392 0.03
258,495 0.10 7.483.298 0.W 1.835.428 0.68
4/0,11on 0.1: 271.686 0.08
.3/5 0.19 ,120 0.08
422,750 0.16 25/.565 0.10 2U8.656 0.10 597.720 0.22 310.983 0.12 112,835 0.04 475.731 0.18
1.08.1.800 0.40 539.459 0.20 634,126 0.20 500,536 0.1 1
2.(330,18Y 1 .OY 490.230 0.19 144.320 0.05 50,114 0.02
20B.949 0.08 484./88 0.18 257.881 0.10
90.228 0.01
,17B.112 0.78
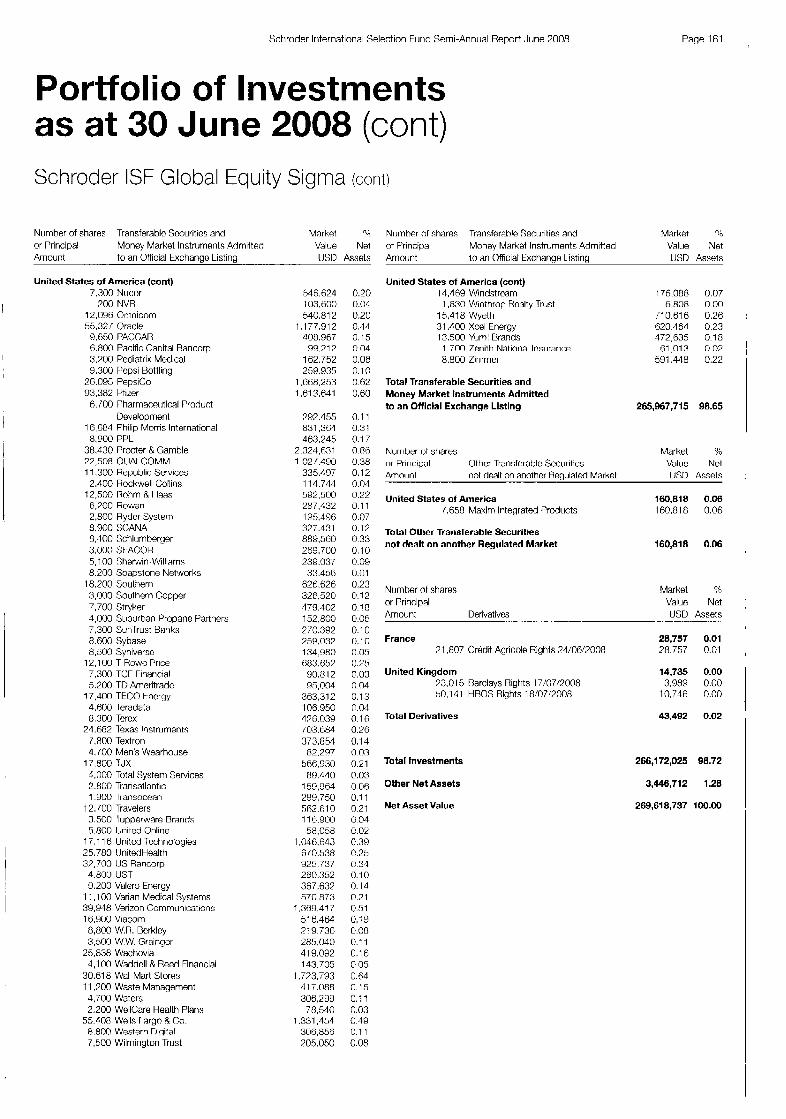
Schroder International Selection Fund Serni-Annual Report June 2008 Page 181
Portfolio of Investments as at 30 June 2008 (cont) Schroder ISF Global Equity Sigma (coni)
Number of shares Transferablc Securities and Market "A
or Principal Money Market Instrrimenls Admitted Value Net Amount to an Official Exchange Listing IWO Assets
United States of America (cont) 7.300 Nucor
700 NVR
55,32/ Oracle 12,096 Omnicom I
9.ti50 PACCAR 6.800 Pacific Capital Rancorp
9.300 Pepsi Bottling I 3,700 Pediatrix Medical
26.095 PepsiCo 03.382 Pfirer 6.700 Pharmaceutical Product
16,884 Philip Morris International
36,430 Procter & Gamble
11.300 Republic Services 2.400 Rock.mIl Collins
12,500 I7ohni R, H 6.700 Rowan 2.800 Rydcr System 8.900 SCANA 8.400 Sctilumberger 3.000 SrACXJR 5,100 Sher~~in-Williarris 8.200 Soapstone Networks
18.200 Soultiern 3,000 Southern Copper 7.700 Stryker 4.000 Suburban Propane Partners 7.300 Sunlrust Banks 8.800 :;ytlaSe 8.500 Syniversc
12,100 T Rowc Price 7,300 T U rirraricial 5.200 TU Ameritradc
17,400 TECO t nergy 4.600 Teradata 8,300 Tcrcx
21,682 lexas Instruments 7.800 Textron 4.100 Men's Wearhouse
4,000 Total Systern Services 2.800 Transatlantic 1 .900 Iransoceari
3.500 lupperware Brarick 5.800 United Online
17.1 16 United Tcchnalogies 25.780 IJnitedHealth 37,700 tJS Rancorp
Development
8.900 PPL
22,508 OtJAl COMM
17.800 TJX
12.100 Travelers
4.800 UST 9.200 Valero Energy
11,100 Vrian Medical Systems 39.948 Verizon Communications 16.900 Viacom 8,800 W.R. Rcrklcy 3,500 W.W. Graingcr
4,100 Waddoll R Reed Financial 25,838 Wachovia
30.618 Wal-Marl Stores 11.700 Waste Management 4.700 Waters 2,200 WellCare Health Plans
55.408 Wells Fargo B Co. 8.800 Western Digital 7,500 Wilmington Trust
546,624 I03.60C) 540.81 2 ,177.9 12 408.967 90,212
162.752 259.o35 ARR.253
1.61 3,641
7w.455 831,3M 463.245
2.324,631 1,02/.490
335.497 114.744 592,500 287.432 1 u5.49f5 327.431 889,560 269.700 239.037 33.456
626.628 326.520 179.402 152.800 ?70.392 259.032 134,980 flm,fi57 90.8 12 935.004
363,312 106.050 476.039 103,684 373.854 82.297
Sti6.930 89.410
159.964 289,750 5R2.610 11 6.900 58,058
1,041i.ti33 610.538 925.737 280.352 387.637 570.873
1.3ti9.417 51 6.46'4 219.730 285,040 418.092 143.705
1.773.793 11 7.088 306,299
78.540 1.331.454
306.856 705.050
0.20 0.04 0.20 0.44 0.15 0 04 0.06 0.10 0.62 0.60
0.1 1 0.3 1 0.1 7 0 86 0.38 0.12 0.04 0.22 0.1 1 0.07 0.12 0.33 0.10 0.09 0.01 0.23 0.12 0.18 0.05 0.10 0.10 0.05 0.75 0.03 0.04 0.13 0.04 0.16 0.26 0.14 0 03 0.21 u.03 0.06 0.1 1 0.21 0.04 0.02 c.39 c.25 c.34 0.10 0.14 0.2 1 0.51 0.19
0.1 1 C.16 c 05 0.64 0.15 0.1 1 0.03 0.49 0.1 1 0.08
c.08
Nurnher of shares Transferable Securilies and Market ",A or Priricipal Money Market Instruments Admitted Value Net
L J X Assets Amoiint to an Official Exchmqe I istinq
United States of America (cont) 14.168 Windstrcam
15.418 Wyeth 31.100 Xcel Energy 13.5M) Yum! Brands
1,830 Winthrop Rcalty Trust
1 .700 Zeriith Nalional Irisiirari(:e 8.800 Zimmer
Total Transferable Securities and Money Market Instruments Admitted to an Official Exchange Listing
176.088 0.07 6.808 0 00
/10.616 0.26 520.464 023 472,635 0 18
61,013 0 07 591.418 0.22
265,967,715 98.65
Nurriber of shares Market 96 or Pririciwal Other Transferable Securities Value Net Amount not dealt on another Heaulated Market USU Assets
United States of America 1.658 Maxim Integrated Products
Total Other Transferable Securities not dealt on another Regulated Market
160,818 0.06 160,818 0.06
160,818 0.06
Number of shares Market or Principal Value Nct Amount Derivatives USD Assets
France 28,757 0.01 71,807 Credit Agricole Rights 74:06:7008 78.757 0.01
United Kingdom ?3.015 Rardays Rigtits 17/07/7008 50.141 HBOS Rights 18!07:2008
Total Derivatives
14,735 0.00 3.989 0.00
10.746 0.00
43,492 0.02
Total Investments 266,172,025 90.72
Other Net Assets
Net Asset Value
3,446,712 1.28
269,618,737 100.00
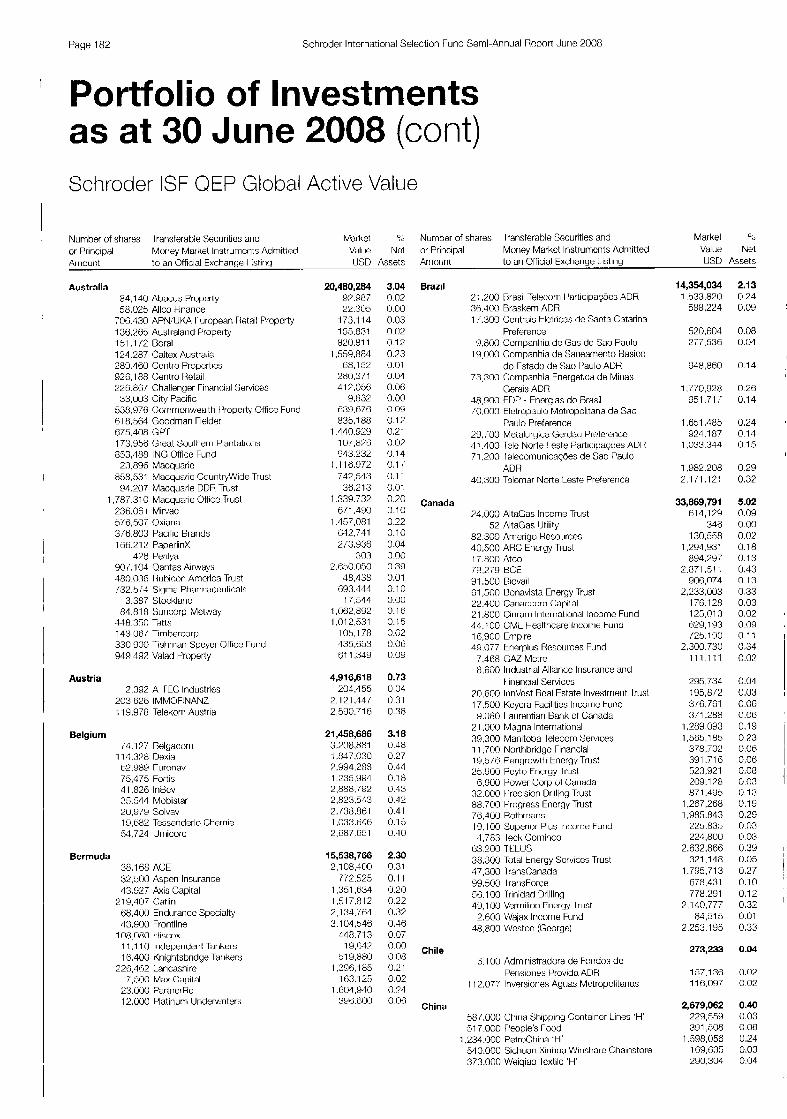
Page 182 Schrodcr Iiiternatiorial Selection Fund Semi-Annual Rcport Jurie 2000
Portfolio of Investments as at 30 June 2008 (cont) Schroder ISF QEP Global Active Value
Number of shares Iranslerable Securities and Market 5; or Principal Moriey Market Instruments Admitted Value Not Arriount to an Official Exchange 1 istiriy USD Assets
Australia 84,140 Abacus Properly 58.025 Allco Finance
706.430 APN:UKA t urolx:in M a i l Property 1362F5 Auslraland Property 151.1 12 Roral 121.287 Caltex Austra.ia 289.130 Centro Properties 92G.188 Ceritro Iietail 226.8i!i/ Challenger ririaric:ial Services 33.003 City Pacific
530.971j (:otrir~ioriwealtll I 'roperty Office Fund 81 8,364 Goodmari Fielder
853,188 INC Office Fund
858.531 Macquario CountyVdide Trust 23,896 Macquarie
(21.207 Macquarie DDR Trust 1,787 310 Macquarie Oitice Trust
233.061 Miriac 5713,507 Oxiaria 316.803 Pacific Brarids 186.21 2 PaperlinX
470 Perilya 90/.104 Qaritas Airw 480.036 I hibicon Amcrica Trust 132.5;4 Sigma Ptiarrriaceiiticals
3.387 Stockland 04.81 8 Suri(:orp Mel,"q
334.350 Tatts 143.06/ Tirnbercorp 330,500 Tishman Speyer Office rurid 949.497 Valad Property
Austria 2.392 A TEC Industries
203.626 IMMOFINANZ 11 9.978 Telekorri Austria
Belgium ;4,177 klgacorii
114,323 nexia 82.Y89 ruroriav 75.475 Fottis 41,826 InBcv 35,544 Mobistar 20,9(Y Solvay 19,682 Tessenderlo Chernie 54.724 Umicotc
Bermuda 38,168 ACE :Y2.500 Aspen Insurance 43.927 Axis Capital
68.4(10 Endurance Specialty 43.900 Frontline
11.1 10 Irideperiderit Tariker:; 18.400 Knightsbridge tiriker:j
219.407 Catliri
1 0a.000 tll:;c:ox
226,462 Lancashirc
23.000 PartnerRe 12.000 Platinum Unclewriters
7,::KJO Max (hpilal
20,480,284 3.04 97.987 002 22.305 0.00
173.114 0.03 155.831 0.02 Y20.811 0.19
1,559,884 0.73 88,152 0.01
280.371 0.01
G39.07G 0.05 833180 0.17
1.1 18972 0.1 742,513 0.11 38,213 0.01
1.335.732 0.20 8/1.390 0.10
1,457,081 0.22 632.741 0.10 2i3.936 0.04
303 0.00 2.ij!>0.050 0.39
48,438 0.01 093.444 0.1 0
17,544 0.00 1 ,062,852 0.1 8 1.012.531 0.15
103,174 9.G2 135.553 0.03 61 1,343 0.09
4,916,618 0.73 204,155 0.04
2.121.~14i 0.31 2,590.716 0.38
21,458,686 3.18 3.704.881 0.48 1 .w7.o3o 0.27 7.934,?09 0.44 I .235,9Y4 0.18 2,386,792 0.33 2,823.543 0.12 2.138.861 0.41 1 .V33,ti48 0.15 2.687.851 0.40
15,538,768 2.30 2,108,400 0.31
/i'2.525 0.11 1,351,834 0.20 1.51 7.812 0.22 %.133.781 0.32 3.104345 0.46
34n.713 0.07 19.M7 0.00
51Y,880 0.08 1 396.1 85 0.2 1
163 125 0.02 1,804,940 0.?4
39ti.000 0.06
Number of shares Iransterable Securities and Markel B or Principal Moriey Markct Instruments Admitted Value Net Ariioiiril to an Official Fxcharige L. i:;tiriy USD Assets
Brazil
Canada
Chile
China
21,200 Drasil Telec:oni Participar;&x ADH :3!3.3(30 Braskem ADR 1 /.300 Ceritrais Helricas de Santa Catarina
2.800 Curnpanhia de Gas de Sao Paulo 19.000 Companhia de Sariearnenlo Rasico
73.300 Companhia Energetica de Mirias
58,900 EDP - Energias do Brasil i0.000 Eletropaulo Mctropolitana de Sao
Paulo Preference 29,100 Metalurgica Gerdaii Prelerencc 41.100 Tele Norte I este PartiupaqOe:; AUI 1 71.200 lelecomunicaqoes de Sao Paulo
40.300 Telcmar Norte Leste Pre1ereric:c:
Prefererice
do Fstado de Sao Paulu ADti
Gerais ADR
ADR
74.000 AltaGas Income Trust 52 AltaGas IJtility
82 300 Arrierigo Hesources 40.500 ARC Energy Trust 17.800 Atco 72,779 W E Y1.500 Oiovail 01,500 Bunavista Energy Trust 22.400 Cariac:c:orc Oapilal 21 ,800 Cirirarri Iriterriational Income Fund 41.100 CML Healthcare Iricorrie h i r i d 16,900 Empire 49.077 tnerplu5 Hesources Fund
7.408 GAZ Metro 8,600 Irichi:;trial Alliance Insurance and
t iriancial Services 70.600 InnVest Real Estate lrivestrrierit lrusl 17.500 Keyera Facilities Iricorrie hind 9.080 I aiureritiari Bank ot Canada
2 1.000 Magria Interriatiorial 3!3,300 Manitoba Telecom Sen,ices 11,700 Northbridyc Financial 1 cj,s/fj Periyrowtti tncryy Trust 25.Y00 Peyto Frieryy lrust
6,900 Power Corp of Cariath 32.000 I'rccision Clrilling Trust 88.700 Progre:;s Energy Trust 78,400 Rothrriaris 19,100 Superior Plus lri(:orrie Furid
63.200 TLLUS 38.300 Total trieryy Services Trust 47,300 1ran:;Canada 99.500 IrarisForce 50.1 00 Irinidad Drilling 4Y.100 Verrriiliori trieryy lrust
2.600 Viajax lrwonw Fund 38,800 LVeston (George)
4,783 leek Cominco
8.100 Adrniriistradora de Wld[is de Perisiorie:; Provida ADH
1 12,077 Inverwme:; Ayiia:; Mctropolitanas
j8/.000 Chiria Sliippiny Container Lines 'H' 51 7.000 People's Food
1.234.000 PetroCtiiria 'H ' 510.000 Sichuari Xinhiia Wiri:;hare Chainstore 373.000 Weicjau Textile 'H'
14,354,034 1.~33.870
588.224
520,604 277.536
948,860
1 . i i o , w t j 051 711
1 ,851,185 924.107
1.033.344
1.982.208 2.1 11.121
33,869,791 814,129
343 130,558
1,294.Wl 894.797
2.871 5 1 1 900,074
2.233.003 176,128 125.01 3 829.193 125.190
2.300.730 111,111
295.734 195,812 316,761 371.288
1,289,093 1.565.185
378.702 391.71 6 623,521 209.1m 871.4Y5
1,267,268 1 ,9fl5.843
223.83s 221.800
2.632.866 321,118
1.7%.713 678.431 778.291
7,140.777 83,515
2.253.195
273,233
157.1 38 11 f.097
2,679,062 229,559 391,504
1,598,056 1 09,G3.'1 290.304
2.13 0.24 0.09
0.08 0.04
0.14
0.26 0.14
0.24 0.14 0.1 5
0.29 0.32
5.02 0.09 0.00 0.(1% 0.1 8 0.1 3 0.43 0.13 0.33 0.03 0.02 0.09 0.1 1 0.34 0.02
0.04 0.03 0.06 0.08 0.19 0.X 0.06 0.06 0.08 0.03 ii.i:j 0.19 0.29 0.03 0.03 0.39 0.05 0.27 0.10 0.12 0.32 0.01 0.33
0.04
0.02 0.02
0.40 0.03 0.06 0.24 0.03 0.04

Schroder Iriterrratiorial Selectiori Furid Serrii-Arinual Report June 2008 Page 183
Portfolio of Investments as at 30 June 2008 (cont) Schroder ISF QEP Global Active Value (cont)
Number 01 shares Trarisferatk? Securities and Markct S or Principal Money Markct Instruments Adrnitted Valiie Net Amount to ari Official Exchange Listing USD Assets
Czech Republic 1,700 Philip Morris
Denmark 4.350 Amagcrbanken
22.000 Danskc Rank
Finland 13.282 Atria 74,583 Elisa 94,300 Huhtamaki 20,155 Kcmira 98.222 Neste Oil 35,l E4 Orion 11.80/ PKC
France 9 , 2 8 3 Air Francc-KLM 81 Bti0 AXA 23,961 BNP Faritias 19.577 CNP Assurances 98.203 Credit Agricolc
84.701 France Telecom 21,010 Gecina
100,174 Natixis 18.616 Nexity 34,107 Ralljle 20.262 Renault 82,182 Rcxcl 32,986 ::a1 iofi -Aventis 53,725 X O I 7
1,701 Csso Societe Anonyme Franqaise
1,820 IMS-lntl Metal Scrvice
2,481 Ste Industricllo d'Aviation Latecoere 33.684 Thomson 47,059 Total
68.848 Vivendi 256 Total Gabon
Germany 15.374 Alliariz 49,022 Rayerische Motoren Werke 17.963 Deutsche Rank
69.552 Deutschc Post
79.006 Epcos 58320 Hannover niickversic:heruriII 15,370 HCI Capital 31.850 t leidelberger Druckmaschinen 14.533 Hypo Real Estate 10.128 lndus 14.1 1 8 Miirictierier Rijckversicherungs 4R.268 Norddeutsche Affincric 17.786 ProSieben Sat.1 Mcdia Prctcrence
1 16,255 Deutsche Luttharisa
121.71? lleulsche Telekorri
Greece 6.433 Eurobank Properties Real M a t e
Investment 76.638 I-iellenic Petroleum 39.535 I iellenic Telecommunications
Orgariiratiori 77.997 Motor Oil Hellas Corintn Hefineries 51.576 Viohalco
Guernsey 23,215 Mapeley
505,117 505,l 17
801,073 161./95 B39.778
6,618,906 296,850
1569.346 789,730 255.091
7,873,377 705.544 179,573
33,453,153 7.734.826 2,432,141 2.1 65.321 2,213.373 2,031,060
449.1 40 2.507.158 2,673,234
262.903 1.133.873
51 0.7 79 2,026.1 30 1,663.863 1,150,237 2,105,575 1.227.81 1
31,088 176.2ti2
3.587.022 I81 ,;;4
2,598353
24,679,375 2,693,114 7,365,841 1.557.181 2.501.162 1.803.321 2,004,805
470.436 2.890.014
187,437 652.103
?,117,704 335.54/
2,172,652 2.504.984
128,574
3,044,059
77,059 1 .Ofi7.810
981.517 475.454 479.219
608,601 608.601
0.07 0.07
0.12 11.03 0.09
0.98 0.04 0.23 0.1 ? 0.04 0.43 0.10 0.07
4.96 0.32 0.35 0.32 0.33 0.30 0.07 0.37 0.40 0.04 0.1 7 0.08 0.30 0.25 0.1 7 0.33 0.18 0.00 v.03 0.53 c.03 0.31)
3.66 0 39 0.35 0.73 0.37 0.21 c.30 C . 0 I 0.43 0.03 0.10 0.31 0.05 0.37 0.37 0.07
0.45
0.01 0.16
0.15 0.07 0.06
0.09 0.09
Numbcr of shares Translerable Securities arid Market B or Principal Money Market Instruments Admitted Value Net Amount Io a n OWcial txchange 1.isting USD Assets
Hong Kong SAR 848,000 Cathay Pacific Airways R80,000 CCT Telecorn
1.28/.000 Champion RElT 1.000.500 Champion lechnology
158.000 Chinese Estates 1.760.000 Cnpc Hcng Korig
732.000 Fountain SET 5ti.000 Gl.lOC0
4 838,000 Henderson Investment 174.000 Hung Hing Printing 214.500 Orient Oversea:; lnternatiorial 475.000 Pacific Century Premium
Developments 822.000 Silver Grant Interriatiorial
1.881.000 Sinolink Worldwide 1 008,000 Solorrrori Sy:;tech Iriterrwtinrial 1,874,000 Stiriligtit Real rstate lrivestment Trust
4 1.500 Swire Pacific 1,204,000 TPV Technology
70,000 lruly International 21 1.000 Vtech
Hungary 281.41 3 Magyar Telekom Telecommunications
3.436 MOIL Hungarian Oil arid Gas
Indonesia 1.649.500 Hank Negara Indonesia Persero
508,500 lnlernalional Nickel Indonesia
Ireland
Israel
Italy
36.907 Allied Irish Ranks 80.718 Bank of Ireland 46.744 Irish I ife 8 Perrriarierit 77,730 Mclnernev
349,401 Dank I lapoalirri 415.491 Rank I eumi I e-Israel 855.572 Bezeq Israeli Telecommunication
14,400 Blue Square-Israel 31.029 Clal Industries and lnvostments 25.303 Clal Insurance
28.370 IDB 36.71 6 IDB Developmerit
93,394 Mi7rahi Tefahnt Rank 18,300 Partner Communications ADR
1.383 Uelek
186.952 Migdal lnsiirance R Firiaricml
33,153 Aedes
01.624 Banco Popolarc 885.865 Ranca Monte dei Paschi di Sicna
131,322 Banca Popolare di Milano 201,290 CIR-Compagnie lndustriali Riunite 167.440 Cofide 131.231 Encl 82.959 EN1 55.305 ERGO Previdenza 62.002 Fondiaria-Sai
1.787 GreenergyCapital 46956 Intksit 95.210 ltalcementi 12.469 Italmobiliare
41.353 Mcdiobanca 178,780 KMt-
1 15.738 Milano Assicurationi
9,013,764 1,615,735
92.01 1 585.719 255,878 243.105 830,455 92.918
567.60.1 459,043 16.182
1.077.674
170.533 178.584 272.535 48.46/
461.346 07.147
828.770 65,251
1.271.557
1,820,541 1,358,101
461.840
549,964 21 6.404 333.560
1,835,438 561.258 706.736 500./3/ 83.707
10,393,i 79 1,531.3w 2.056.396 1,380,533
159.556 142.656 512.171 573,l 32 650.463 R87,468 ??9,649 723.149
1,146,642
23,427,429 52.097
1.91 6.659 1.61 5.983 1,229,480
553.912 1 83.8146
1,2til.722 3.096.298
322,525 2.052.214
1,915 515.848
1,589.1 91 979.506 251,492 698.714 592.122
1.34 0.24 0.01 0.09 0.04 0.04 0.17 0.01 0.08 0.07 0.01 0.16
0.03 0.02 0.04 0.01 0.01 0.01 0.09 0.01 0.19
0.27 0.20 0.0/
0.08 0.03 0.05
0.27 0.09 0.10 0.0/ 0.01
1.54 0.23 0.30 0.75 0.07 0.02 0.08 0.10 0.10 0.13 0.03 0.1 1 0.17
3.47 0.01 0.27 0.24 0.18 0.08 0.03 0.1 9 0.46: 0.05 0.30 0.00 0.08 0.24 0.15 0.04 0.1 0 0.09
I
I
I
I
! ! I
I I I
i

Page 184 Schrntler lriterr rational Selection Furid Serrii-Annual Report June 2008
Portfolio of Investments as at 30 June 2008 (cont) Schroder ISF QEP Global Active Value ( w r i t )
Nurnher ot sharcs Transferable Sewritie:; nnd Markel :‘b or Principal Moriej Market Instruments Admitted Value Net Amount to a11 Ollicial Exchange Listing US0 Assets
Italy (cont) 13,402 Recordati
4,.’30.100 Seal t’aginc Gialle 1 ,1 14.534 Telecorri ltalia
259,9?3 lJriiCredit 81 .ti10 Unione di Banctie Itdliarie
Isle of Man 31.391 Davmay Day Carpalhian
Japan 28,100 ADEKA 4 . N 0 Ahresty 1.397 Arealink
133.100 Arnest One 322,000 Asatii Kasei
532 Asset Manager:; 3ti.350 Belluna 60.700 Hrolher Industries 1 6,000 Canon Finctcch
126,000 Celltrdl ~ ~ I l I ~ W X
181,000 Central Glass 25,600 Cerituy L.ea:;~ny System
17.000 Commuturc 7‘3 Creed Office Intestrrierit 35 UA Cltlice Invcstment
15.000 Taihei nerigyo Kai:;tia 8.800 Duskin 1.35: Dynacity
14,900 Eizo Nanao
304.000 Dairiippon Scrccn Manufactuririq
1/.000 Q):;orl loyocon, i,j;00 rxt;ei
924 Fintcch Global ti4.000 Furukwa-Sky Alurriiriiini 3.900 h i y o General Lease
5,490 Gullivcr International 21 4,000 God(.) Steel
80,500 Honda Motor 858 titx,srers
13,100 IBJ Loasing 10.000 Iida Honie Max 3) ,000 1st iiLiika (;lass 11 ,60[) Itoc:t1c1 €Ilex 52,000 lwatani Iriterrwtiorial D3.000 Japan General Fstate 20,000 Jidosha Buhin Kogyo 39.200 Joint
7 2 Joint Reit Investrrierit 68.000 Juki
19,000 Kamei 38.700 Kansai Eledr c Pcwer 54.700 Kanto Auto Works
11,300 Kagd klKlrOiwS
23.000 Kasai Kogyo
Manulactiiring 19.000 Kawasaki Kirkai Kisen Kaistia 17,000 Keihanshiri Real Estate 19.100 Keiliin 88,100 Koa
8.DO0 Kot iriai i S t iuji
12 1.000 Krosaki I iarirria 433,000 Mazda Motor
26.900 Meiv~a Estate 41 MID Heit
24.000 Mikuni
353.86fi 147,3/4
2,227.4(51 1 5 8 1.356 1.903.718
80,964 80.5164
68,627,859 ?31.465 60,937
11 3.ti20 557.590
1,6(33.131 171,061 749,575 830,WdY 21 6278 3 16.966 741 ,18E 274.787 80.499
114.674 106.109 140,458 113.654
1.227.Bl5 138,027 152,1381 21.103
31 9,869 258, 94.520 83.01 5
173.104 ll4,0b3 ti4 1,533 145.895
2.731.954 190,582 235,141 55.230 60 828
/Y.818 1 G7.223 1 IY.0111 195.4c!1< 149.292 81.757
WY,480 112.849
i2 .86/
9.1.tidj 80,859 79,582
290.63ti 531.047
1 tG9.938
60,148 134.1 59
0.03 0.07 0.33 0.23 0.28
0.01 m11
10.17 0.04 0.01 0.02 0.08 0.25 0.03 0 04 0.1 7 0.03 0.05 0.1 1 0.04 0.01 0.02 0 02 0.02 0.07 0.18 0.02 0.02 0.00 0.05 0.04 0.01 0 0.1 0 03 0.02 0.10 0.02 0.4 1 0.(X 0.03 0.01 0.01 0.01 0 02 0.OC 0.01 0.03 0.03 0.03 0.02 0.01 0.13 0.1 1 0 01
0.01 0.01 0.0 I 0.04 0.09 0.02 0.05 0.36 0.03 0.02 0.01
Number of shares rransferahle Securities arid Market % Value Net or Prirwipal IJC;U Asscts Arriount
Money Markel Irislruriwnts Admitted to ari OHic:ial txchange Listing
Japan (cont) 189.000 Mitsubishi Materials 512,000 Mitsutiistii Iinyon 46,000 Mitsui Ctierriicals 19,000 Mitsui t lortie
501,000 Mitsui Mining & Smeltiri(] 37.200 Mitsurrii Flectric 53.000 Nakayama Steel Works 75,300 NEC Leasing
1 1.100 Nihori rsleacj 230.000 Nictiirrio
5,500 Nippo 225,000 Nippori Chemi <;on 38G.000 Nippon Minlng
12.(300 Nippo~.i Pilar Packing 19 1 Nippon Resideritial Inve:;tment
290,400 Nissan Motor ?3.000 Nis:,an Shatai 14.900 Nisshin rudo:jari 36.000 Nissiri 24.000 Nittctsu Miriirig
1.089 N- DoCoMo 32,000 Obayashi Road 31,000 Okabe
143,000 OKK 1,300 Oriokeri
315 Pac:lfl(: 21,900 Osalta Steel
25.000 Pacific Industrial 11J4.000 Pacitic Metals
18.000 Sala
15,500 Sarioh Industrial 37,700 Sunsthin Elcctronlcs ti. 100 Satori Electric 4,100 Scnshu Electric
150.000 San-Ai Oil
32.100 Shinko Shoji 89.000 Shiriniaywa Industries 94,500 Showa
182.000 S h o w Shell Sekiyu KK 45.500 Sodick
53R.100 Sojitz 120.000 Sumikin Hussan 193,700 ~ ~ ~ I I ~ i i k J ~ ~ K
14.1WJ :Surriitorriu Uonsctsu 80.100 Sumitorrio rleclric Industrics 56.000 Siirriitomo Light Metal Industries
,000 Siirriitomo Osaka Cement ,800 Surriitorrio I jubbcr Industries 575 Suncity
48.000 .laihei Koyyo 652.(100 Taihebo Cerrierit 898,000 Taisei
1 6,000 Takara Lehen 43.900 Takeda Pharmaceutical
26.000 1 t3K 220 Tay h o
2,550 lokcn ,000 Tokyo lckko ,000 Topy Industries
556,000 Tosoh 1.59.000 luyo Ink Manufacturing 32,000 loyota Motor 29.000 Uchida Yoko
1.000 Unidux 1 /.io0 Uriipres
81 1,481 1 .t322.002
777.520 103,499
1,483,005 832,022 14Ui.860 392.075 80.480 91,963 31,209
819.226 2.42 i.oo8 80.828
578.21 5 9,401L657
180,537 73.133
103.13Y 105.315
2.491.810 50.539
171,108 286, 103 128,131 1 15.044 1 B 1.008 104.265 88Y.BI 6
2.409.949 888,304
33.526 82.501
856.800 100.41 1 33Y.556 40.t312 78,579
350.:332 274.068 t i6932
2.001 .759 775,908
1.801.4/0 4/5.5(j8
2.518.89/ 91.531
1.021.135 68.319
178.752 545.277
67.593 167.959
1.31 3.377 2.1 48.61 0
71.118 2241.914
18.228 11 1.386 109,003 208.493 63 1.805
1,912.ti54 542.831
1,316,172 1 10.252
4.7fjG
0.12 0.24 0.03 0.02 0.22 0.12 0.02 0.06 0.01 0.01 0.00 0.12 0.3G 0.01 0.09 0.36 0.03 0.01 0.02 0.02 0.37 0.01 0.03 0.04 0.02 0.08 0.07 0.02 0.13 0.36 0.10 0.01 0.01 0.10 0.01 0.05 0.01 0.01 0.05 0.04 0.10 0.30 0.03 0.27 0.07 C.38 0.01 0.15 0.01 0.03 0.08 0.01 0.02 0.19 0.32 0.01 0.33 0.00 0.02 0.02 0.03 0.10 0.28 0.08 0.22 0.02 0.00
187.143 0.03
I
I
i
i i
I
~
I I I
I
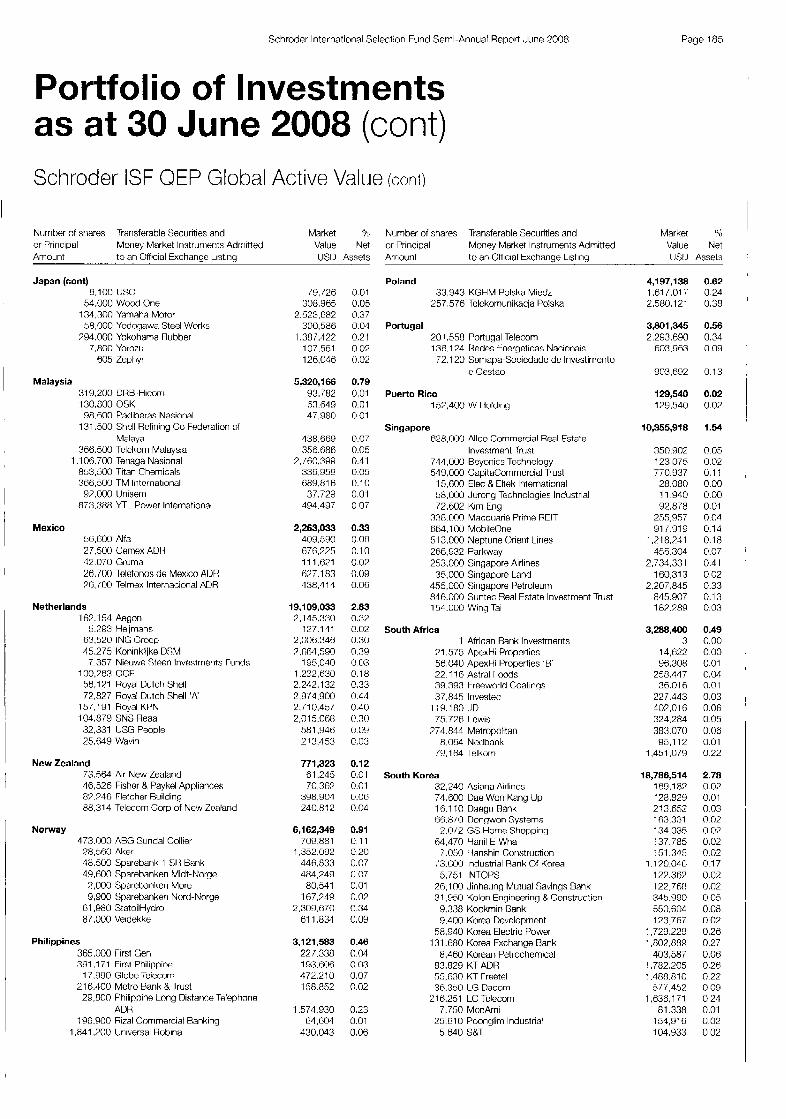
Schroder International Selection Fund Semi-Annual Report June 2008 Page 185
Portfolio of Investments as at 30 June 2008 (cont) Schroder ISF QEP Global Active Value (cont)
Niimher of shares Transferable Securities and Market SS Number of shares Transferable Securities and Market % or Principal Money Market Instruments Admitted Value Net or Principal Money Market Instruments Admitted Value Net Amount to an Official Exchange Listing Us[) Asset$ AnlOiirll to an Official txchange L.isting LIS0 Assets
Japan (cont) 6.100 L J X
54.000 Wood One
58,000 Yodogawa Steel Works 134,300 Yamaha Motor
794.000 Yokohama Rubber 7,800 Yorozu
605 Zephyr
Malaysia 31 9,200 URB Hicorri 130,800 OSK
131,500 Shcll Rcfining Co Federation of Malaya
366.500 Tclckom Malaysia 1 .I 06.700 Tenaga Nasinnal
853.500 Titan Chemicals 366.500 TM International
873,388 YTL Power International
98.600 F'adiheras Nasiorial
97.000 t m e m
Mexico 56.600 Alfa 27,500 Cemex ADR 12.070 Gruma 26,700 Telirfonos de Mexico ADR ?6, 100 Telmex lnternacional ADR
Netherlands 167.1 54 Aegon
5.793 Heijmans 63,520 ING Crocp 15.275 Koninklijke DSM
7.357 Nieu,sce :;teen limestiwrits rtlnds 1 0O.?t33 OCF 56.1?1 Royal Dutch Shell 72.827 Royal Dutch Shell 'A'
157.19 1 Royal KPN 104,879 SNS Reaal 32,331 USG People 75.fX9 Wawi
New Zealand 73.564 Air New Zealand 46,526 Fisher R Paykel Appliances 87.?4B Fletcher Ruilding 88,314 Telecom Corp of New Zcaland
Norway 473.000 A0G Sundal Collier 78.560 Aker 48.500 Sparebank 1 :SI1 Bank 49,600 Sparebanken Midt-Norge 3.000 Sparebankeri More 9,900 Sparehanken Nortj-Norge
61.980 StatoilHydro 87.000 Veidekke
Philippines 365,000 First Gen 391.171 First Philippine
17.990 Globe Telecom 2 16,100 Mctro Rank & Trust 29,800 Philippine Long Distance Teleptiorie
ADR
1,841,700 Lhiwrsal Robiria 196.900 Rizal Conimercial Ranking
19, (26 308,965
2523,682 300.588
1,387,422 107.551 126,046
5,320,166 93.782 63.649 47.980
138.669 356.f86
2.160.399 336.959 689,81 6 37.729
494.497
2,263,033 409.590 676,225 11 1.Wl ci27.183 138.114
19,109,033 2.145.330
127.111 2.006.346 7 ,664,590
195,040 1,232,630 2242.132 2374.900 2.71 0.457 2,015,068
58 134R 213.453
771,323 61.245 70,36?
3(38.901 240.812
6,162,349 709.881
1.352.092 446.833 484.249
80.541 167,?49
2.309.670 61 1.831
3,121,583 22/.338 193.606 472.210 158,852
1.574 930 61,601
430.043
0.01 0.05 0.37 0.04 0.21 0.0? om 0.79 0.01 0.01 0.01
0.07 0.05 0.41 0.05 0.1 0 0.01 0.07
0.33 0.06 0.10 0.07 0.09 0.06
2.83 0.32 0.02 0.30 0.39 c.03 0.18 c.33 0.44 c.40 0.:30 (: 0:) C.03
0.12 0.01 0.01 ti.06 0.04
0.91 c.11 c.20 0.07 0.07 0.01 0.0? 0.34 0.09
0.46 0.04 0.03 0.07 0.02
0.23 0.01 0.06
Poland 33,943 KGHM Polska Miedz
257.576 Tclckomunikacia Polska
Portugal 201,558 Portugal Telecom 136.1 24 Ijedes tnergeticas Nacionais 72.1 20 Somapa-Sociedadc dc lnvestirnento
c Gestao
Puerto Aico 157.400 W I loldirig
Singapore 628.000 Allco Commercial Real Estate
711.000 Rcyonics Technology 519.000 Capitacornmcrcial Trust
15,000 Elet: R Cltek International 58.000 Jurong Technologies Industrial 72.602 Kin1 Eng
338.0fl0 Mac:quarie Prime FIEIT fiti4.100 MohileOne 51 3,000 Neptune Clrierit Liries 266.932 Parkway 253,000 Singapore Airlines 35.000 Singapore Land
455,000 Singapore Petroleum 846.000 Suntec Real Estate Investment Trust 154.000 Wing Tai
1nve:;tment IrusL
South Africa 1 African Rank Investments
71.575 ApexHi Properties 56,WO ApexHi Properties '0' 22.1 1'6 Astral foods 38.393 Freeworld Coatings 37,845 Investec
75.776 I ewis 119.180 .ID
774.844 Metropolitan 8.064 Nedhank
70,lfd Telkom
South Korea 32,240 Asiana Airlines 74,600 Dae Won Kang Up 16.1 10 Daegu Hank 55.8 10 Dongwon Systems
2.012 GS Home Shoppinq 64,470 Hanil t Wha
7.050 I ianshin Coristrwtion 13.6WJ Industrial Rank Of Korea 5.751 INTOPS
26,100 Jinheung Mutiial Savings Bank 31,950 Kolon Engineering R Construction 9.338 Kookrniri Bank 9.400 Korea Development
58.940 Korea Electric Power 131.680 Korea Fxcharige Rank
8,460 Korean Petrochemical 83.829 KT ADH 55,630 KT Freetel 36.350 LG Dacom
216.251 LG Tclccom 7.750 MonArrii
5.640 S&T 25.610 Poonglim Industrial
4,197,138 1.61 1.01 7 2.580.12 1
3,801,345 2.293.690
li0:3,9fi3
903.602
129,540 179.540
10,355,918
350.902 123,075 770.937 28.080 11.940 W.878
255,957 91 1.919
1 2 1 8,741 455.304
2,734.331 160.31 3
2,207,845 845.907 1 87.?89
3,288,400 3
14,622 96.308
258.117 36.01 6
227.413 407.01 B 324.284 38:3.070 95.1 12
1.451.079
18,786,514 159.1 87 128.821) 213.652 163.331 134,035 137.785 161.345
1.1?0.046 177,367 122,768 345.990 560,604 123,767
1.729.229 1.807.H89
403.687 1,782,205 1.4R8.810 5 17.452
1.636.1 71 81.338
154,916: 104.933
0.62 0.24 0.38
0.56 0.34 0.09
0.13
0.02 0.07
1.54
0.05 0.02 0.11 0.00 0.00 0.01 0.04 0.14 0.18 0.07 0.41 0.02 0.33 0.1 3 0.03
0.49 0.00 0.00 0.01 0.04 0.01 0.03 0.06 0.05 0.06 0.01 0.22
2.70 0.07 0.01 0.03 0.02 0.0? 0.02 0.02 0.1 7 ().(I2 0.02 0.05 0.08 0.(12 0.26 0.27 0.06 0.26 0.22 0.09 0.24 0.01 0.02 0.02
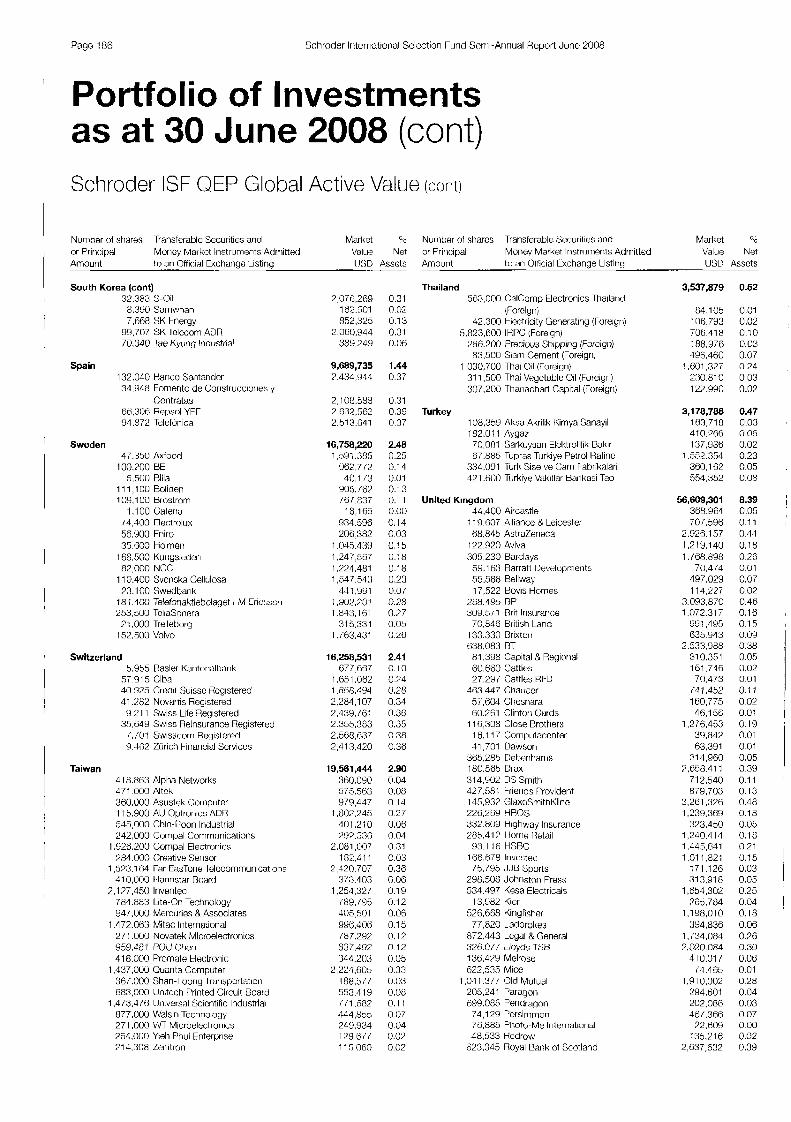
Paye 186 Schroder lriterrialiortal Selection Fund Scnii-Aririual Heport June 2008
Portfolio of Investments as at 30 June 2008 (cont) Schroder ISF QEP Global Active Value ( c m )
Number uf shares Transferable Securities and Market % or Priricipal Money Market Instruments Adrriitteti Value Net Amount to an Official Ext:tianyc Listing {JSD Assets
South Korea (cont) 32.383 S-Oil 8.3Y0 Samwhan 7.668 SK hiergy
99,707 SK lolecorii ADR 70,340 lae Kyiurhg Industrial
Spain 132,040 Hanco Santandcr
Contratns 06 ~ e p s o i wr
91.872 Telefonica
31,918 Fomento de Coristrucciorie:; y
Sweden 47.350 Axfood
100.700 BE 5.500 Bilia
1 1 1,100 Boliden 109.1 00 Broslrom
1.100 Caleria 14,400 rlet:troliix 56,900 Fniro 35.600 Holmen
168,500 Kurigsleden 82.000 NCC
11 0.400 Svenska Cellulosa 73.1 00 :hedbar ik
184.100 TelefonaMiebolaget I M Cric:ssor i 253,500 TcliaSonera 71.000 Trelletmrg
152.500 Volvo
Switzerland 5,955 Rasler Karitorialtxirik
57915 Ciba 40.925 Credil Suisse Registered 41 2 8 2 Nobanis Registered
35.u49 Swiss Reinsurance Registered 9.21 1 Swiss Life Reystered
1.101 S’nisscorri Regislered 9.452 Airich hiiancial Scrviccs
Taiwan 4 18.883 Alpha Networks 471 .000 Altek 380.000 Asiistek (;orriputer 11 5.900 AIJ Optroriics AD11 545,000 Chin-Poon Industrial 242.000 Cornpal Corrirriiiriic:alio~hs
I.928.200 Compal Electroriics 784.000 Creative Serisor
1 ,:17>3,1 fl4 Tar Ea:;7brie lelccominuiiications 410,000 I larinstar noard
2,177,450 Inventec 784.883 Lite-On TechriolocJj. 947.000 Mercuries B Associates
27 1.000 Novatek Microelectroriics 959.481 PUIJ Ctteri 41 8.000 Promate Electronic
1,437,0130 Quanta Computer 3ti/.OOU Shari-l oori(] Tr~iri:;~)ort~iti~)ii 683,000 Unitech Printcd Circuit Board
1.473.4763 IJiiiver:;al Scicntitic Industrial 877.000 Walsin Technology 27 1,000 W Microelectronics 251,000 Yieh Phui Enterprise 71 4.308 Lenitron
1.472.0ti8 Mitac Internakmnl
389.249
9,689,735 7.434,:!.1.1
2,108.588 9.f32,5632 2,513,541
16,758,220 1.391.3t35
!)82.7/2 40,l i
903, /ti 787,837
18.165
1 ,045,439 1,247,567 1,224,481 1,547.543
441 3 5 1 1,902,POl 1 ,843.1 51
31 5.33.1 1. ;63,431
16,258,531 977.Gti7
1,851.0Y2 1,853,494 2,284,107 2,439.m 2,355,383 2.500.037 2,413,420
19,561,444 360.090 575.563 979,447
1 ,807.345 101.210 997.536
2.08i.ooi 182.41 1
2.420.707 3 i::$ ,403
1,254.32 / /8U,/95 405.501 (398,JO(i 787.292 837,492 344.208
2,224,603 188.577 553:1 19 771 .C82 ‘144,833 24 9 ,Y34 129,ti;; 11 5.060
0.3 1 0.02 0.1 3 0.31 0.08
1.44 0.37
0.31 0.39 0.37
2.48 0.25 0.14 0.01 0.1 3 0.1 1 0.00 0.14 0.03 0.15 0.18 0.18 0.23 0.0/ 0.28 0.77 0.03 0.20
2.41 0.10 0.74 0.28 0.35 0.30 0.35 0.38 0.3ij
2.90 0.04 0.08 0.14 0.27 0.06 0.04 0.31 C.03 0.38 L O G 0.19 0.12 0.06 (),I5 0.1 2 0.12 0.05 0.33 0.03 0.08 0.1 1 o.oi 0.04 n.0) 0.02
Nurrlber (-11 stiarcs Transferable Securities and Market OSC
or Prir icipal Money Market Iristrurrierits Adniilted Value Net Amount to ari Ollicial Exchange Listing USLl Asscts
Thailand 503.000 C:alC;omp Electtonics Thailarid
42.300 Hectricity Generating (Foreiyri) (Foreign,
:i.r123,6300 IHPC (Foreign) 286.200 Precious .C;tiipping (Forcign)
83.500 Slam Cement (Foreiqri] 1 .030,T00 Thai Oil Koreigri)
31 1,500 Thai Vegetable Oil (Foreign) 307.200 Thanachart Capital (Foreign)
Turkey 108,339 Aksa Akrilik Kiniya Sanayii 182.01 1 /1yga7 70,081 Sarkuysan Elektrolitik Oakir 67.885 Tupras Tiirkiye Petrol Hnline
334.091 Turk Sise :‘e Carri Fatirikalari 421 ,800 Tiirkiye V;ikillnr Baiikasi Tao
United Kingdom 44.400 Aircastle
(38.845 AstraZerteca 11 9.007 Alliance 8 Leicester
1 22,L)20 Aviva 305.230 Barclays 59.1 83 Rarratt Developments 55.588 Bellway 17,522 Bovis Homes
2U8.493 r3P 30Y.3il Brit lrisiirariw 70,846 British Land
133.330 nrixtori 838,083 nT 8 1.398 Capital & Regiorial ti0,6ti0 Cattlss 2T,2Yl Cattles RI-U
493.447 Chauccr 5/.d04 Ctiesriara 80.251 Cliritori Card:;
11 fi,308 Close Brothers 16.1 17 (hniputaccnter 41,701 Lhwson
313,285 rkberitiarris 180.585 Draw. 314,t)W DS Smith 427.581 Friends I’rovident 145.933 (;laxnSmithKline 228.28Y HROS 332.809 Highway Insurance 283.41 7 I lorrie I Mail 93.1 1 ti HSRC
298,508 Johristori Pre:;:; 534.497 Kesa Electricals
13,982 Kier 526,608 Kingfisher
77,820 kdbrokes 672.443 Legal & General m : . o / / t.ioytis r:;B 136.424 Melrnse 622,535 Mice
1,01 1.377 Old Mutual 205,241 Paragon u9Y ,085 Peritlrayon 74,l -- 29 Persimmon I u.885 Photo-Me Interriatimal 48.533 Hedrow
823.345 Royal Bank ot Scotland
3,537,879 0.52
84.105 0.01 10(5,7Y3 0.02 708.418 0.10 188.976 0.03 4Yti.4150 0.07
1,001,037 0.24 2Y0.810 0.03 122.990 0.0?
3,170,788 0.47 1633,718 0.03 410.P66 0.06 137,936 0.02
1.552.354 0.23 360,102 0.05 554.352 0.08
56,609,301 8.39 368.964 0.05 m / , 3 ! x 0.11
2.926.1 57 0.44 1.213.140 0.18 1. /U8.898 0.20
70.474 0.01 497,029 0.07 114.227 0.02
3.093.870 0.16 1.072.317 0.18
991,495 0.15 835.513 0.09
2.533.988 0.38 310.351 0.05 161.T.18 0.02 70.473 0.01
/41.452 0.1 1 100,775 0.02 4ti.156 0.01
I ,2i6.453 0.19 39,842 0.01 63.391 0.01
314,960 0.05 7,658.41 1 0.39
712.540 0.11 879.703 0.1 3
3,281,328 0.48 1,239.3139 0.1 8
323,430 0.05 1,240.4 1 1 0.18 1,445.641 0.21 1.01 1.82 I 0.1 5
171.126 0.03 313,918 0.05
1,654,302 0.25 765.704 0.04
l,lY8,010 0.18 394.836 0.06
1,734,084 0.76 ?.om084 0.30
410.017 0.06 14.485 0.01
1.91 0,002 0.28 294.601 0.04 202,088 0.03 4u/.366 0.07
92,ROB 0.00 135,Yld 0.02
2,637,632 0.39

Schroder lriternational Selection Fund Scmi-Annual Renort June 2008 Page 187
Portfolio of Investments as at 30 June 2008 (cont) Schroder ISF QEP Global Active Value icont)
Number of shares Transferable Seciirities arid Market 4;
or Principal Money Market Instruments Admitted Value Net Arriourit to an Official Exchange Listing tJSn Assets
United Kingdom (cont) 260,219 Segro
1.567.103 Signet 52,l 83 Severri Trent
35.1 16 Songbird Estates 14,450 Stolt-Nielsen
801.41 7 Torrikiris 274.534 7 electronics 98.791 William Hill
562.334 Woolworths 234.021 Yell
168.485 Wolscley
United States of America 9.400 A.C. Smith
35.500 Advance America Cash Advance Cer iters
8,100 Advanta 22.500 AH Belo 44.700 Alaska Communications Systems 37.41 6 Alliant tnergy 58,500 Allstate 29,000 Ameren 94,900 American Capital Strateyes 8,500 American Mortgage Acceptance
900 American National Insurance 68.300 Anthracite Capital 68.700 Apollo Invcstment 40.300 Arbor Realty R9.800 Ares Capital
84.000 Ashiry Ailtomotive
95.300 Atrnos Energy 66.400 Avnet 57.000 Rank of America 69.500 RR&T 16,300 Eeazer Horncs USA
21.200 Big 5 Sporting Goods 75.300 Black Hills 1 1.200 Bon .Ion Stores 5200 Rooks-!-Million
43.400 RRT Rcalty Trust 9,900 Brunswick
77.900 Building Materials 7.200 Capital Trust
12.300 Cascade Bancorp 41.300 Cathav General Rancorp 7i.300 Cat0 3.Y00 CRS
10,800 Centerlinc 43.900 Ctiubb
8.700 Armstrong World Industries
150,300 Ashford Hospitality Trust
11?,500 Relo
152.638 Citizens ConlntiirIicatioris 9,600 Citizens Rcpublic Bancorp
54.400 Cleco 38.500 Colonial RancGroup 26.500 Colonial Properties Trust 59,800 Corncrica 33.800 ConocoPhillip:; 77.800 Consolidated Communication 59.000 Consolidated Edisori 68.400 Corus Bankstiares 5.1 00 Crystal River Capital
i f ,302 Dccrfiold Capital 6.050 Discover Financial Scrbices
7 1.600 Dow Chemical 60,300 D T t Energy
140,800 Duke Eriergy
2,055,636 1,337.852 1577,709
79.458 330.693
2.424.517 637.144 624.331
1,2/5.549 (20.8 18
31 6,084
143,160,616 31 0.858
183.890 54.756
128,250 528.354
1.262.790 2,121,120 1,190,440 2.367.755
5,100 1313.740
31 5.665 1,038,144
394,134 942,900 258.303 850.560 f97.397
7,554,040 1,820,320 1,401,630 1.648.540
96.1 70 830.750 163,240 81 7,696 59.584 41,23f
54/.274 11 1.375 51,057
142,992 Y5,448
458.3rj5 398.034
16.869 20.304
7,196,317 1,674,439
78.734 1,271,877
187,880 576.290
1.608.620 3,097,432
408.660 2,266,780
326.268 20,655 46.346 87.099
2,493,828 2,499,435 2,403,456
0.30 0.20 0.23 0.01 0.05 0.36 0.09 0.09 0.lY 0.0 1 0.05
21.22 0.04
0.02 0.01 0.02 0.08 0. 1 <.)
0.40 0.18 0.35 0.00 0.01 0.08 Cl.15 0.05 0.14 0.04 0.13 0.10 C.38 C.27 ( 2 1 c: 74 c.01 0.17 0.02 0.17 (X)l 0.01 C.08 c.02 0.01 0.02 0.01 0.07 0.06 0.01 0.00 0.33 0.25 0.00 0.1 9 0.03 0 08 0.24 0.46 0.06 0.34 0.05 0.00 0.01 0.01 0.37 0.37 0.36
Number of shares lransferahle Securities arid Market 46 or Principal Money Market Instruments Admitted Value Net Amount to an Official Exchange Listing IJSD Assets
United States of America (cont) 63.600 Emharq
813.900 Energy Last 54.400 Fidelity National Financial 38.1 00 Fifth Third Daricorp 49,539 First I lori7ori National 18,900 First Marblehead ?1.500 FirstMerit 12.800 FNB 52.000 Foot Locker 80,000 Fricdman Billings Ramscy 12,200 FTD 46.800 Gannett 67.400 General Maritime 27.300 Ccvtty HR 44.400 Gramercy Capital 9K044 Great Plains Energy 5,000 Great Southern Bancorp 9.700 Grew Rarikstiares
12,500 Groiip 1 Automotive 35.500 Hancock Fabrics 31.300 Hartford Financial Services
30,400 Hercules Technology Growth Capital 11,700 I IickotyTecti 23.500 HON Industries 7 1.400 Hospitality Properties Trust
22.200 ItlRSlS
23.800 lrriperial Sugar
58.000 irifoGROtJF 19,000 lngles Markets 8 1,400 International f’aper 46,500 Iowa Telecommiinications Sewices 63,400 iStar Financial 72.000 JP Morgan Chase & Co.
80,900 Keycorp f3.600 KKR Financial 8,900 LCA-Vision
27,900 Lee Criterprises 44. (00 Lincoln National
6.600 Lilhta Motors 45.600 I orillard 10,800 Lubrizol 65.300 Macy’s 49.900 Marattiori [)it 78.100 Marshall R llsley
5,200 rrnc lrisi.irari(:e
169.900 Hcalth Managcment Associates
167.700 HRPT Properties Triist
1 18.000 IndyMac Bancorp
9.100 KR tiorrie
135.500 Masco 10,400 McClatctiy
11 6,800 MCC; Capital 7,100 Media Gcneral 7.600 NACCO Industries
11 7,800 National City 4,500 National Presto Industries
187.500 New Century Financial 8.000 Newcastle Investment
30.200 Nicor 78.300 NiSource 40.400 NorthStar Rcalty Finance 9.900 OfticcMax
1 15,300 (>Id Reputilic: International 15.600 One Liberty Properties 18.500 Pacific Capital Rancorp 8.400 PacWcst Bancorp 8.000 Patriot Capital Funding
108,816 Pepco
2.88a.076 128.7OLl
2.71 1.540 898.864 389,763 377.487 17.489
376.035 156,037 661.440 139.730 1 W.877
1,030,536 1,782,056
139.778 537,356
2.426.071 46.168
135,700 257,875 42.800
7,0!37,100 1,124,738
288.4516 93,072
433.105 677.051
1.15P.099 73.926
3 14.1 36 95,580
?31.040 161,510
1.903.1346 81 1.425 857.168
2,523,600 161.252 901,226 667,800 43.254
177, 160 2,070,504
35,574 3.099.888
501.120 1.275.309 2,555,878
445,94 7 2.1 57,l 60
74,776 471.872 03.507
188.650 564.262 797,950
2,738 59,810
1,275,346 1.3/9.616
347.440 13n.1386
1.408.966 756.1 52 269.915 128,520 54,400
7, 10 1342
0.43 0.02 0.33 0.10 0.06 0.06 0.01 0.06 0.07 0.10 0.02 (107 0.1 5 0.26 0.02 0.08 0.36 0.01 0.02 0.04 0.01 0.31 0.1 7 0.04 0.01 0.05 0.10 0.1 7 0.01 0.06 0.01 0.04 0.07 0.2R 0.12 0.13 0.37 0.02 0.13 0.10 0.01 0.0T 0.3 1 0.01 0.46 0.07 0.19 0.38 0.07 0.32 0.01 0.07 0.01 0.03 0.08 0.04 0.00 0.01 0.19 0.20 0.05 0.02 0.21 0.04 0.04 0.02 0.01 0.40
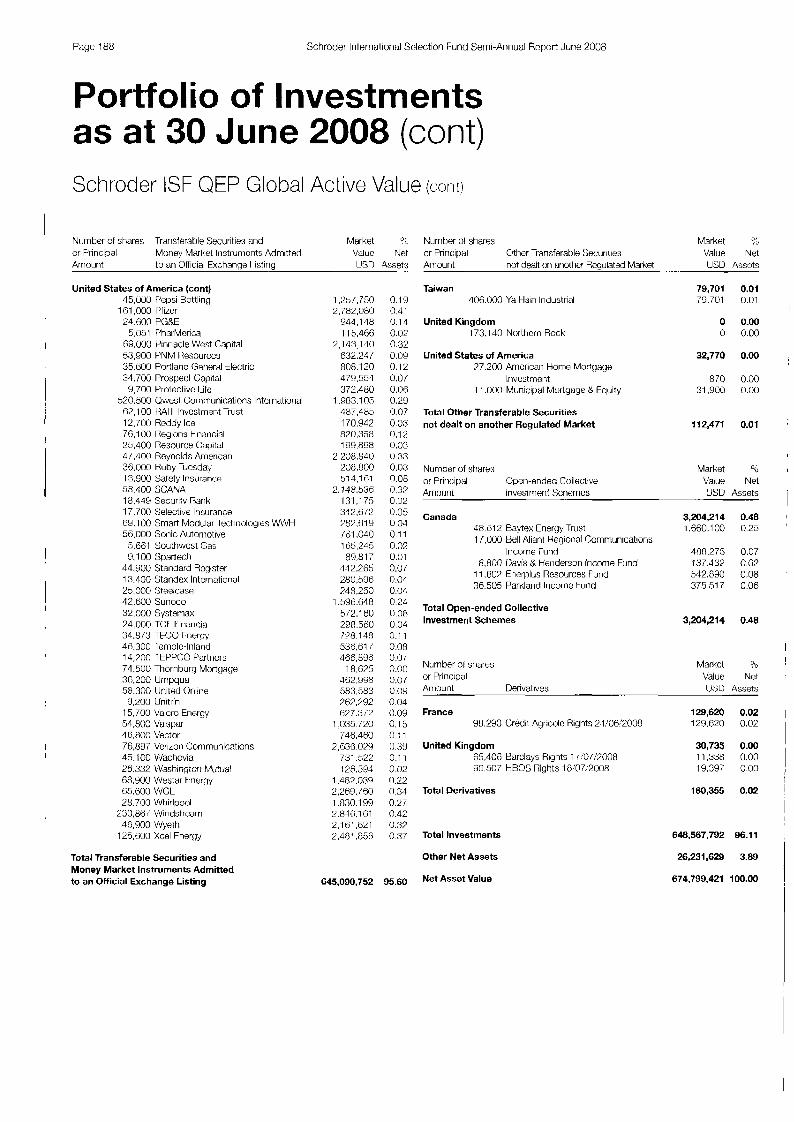
Pagr: 188 Schroder International Sdection Fund Semi-Annual Rcport Jurie 2008
Portfolio of Investments as at 30 June 2008 (cont) Schroder ISF QEP Global Active Value ( c w
! Nuinher of shares Trarisferable Seciirities and Market 9:: or Principal Moriey Marltsl Instruments Admitted Value Net Arrioiirit to an Official Exchange I istiriy USD Assets
t
United States of America (cont) 45,000 Pepsi Bottling
24,600 PC;aE 1 B1.OOO I 'tizcr
5,051 PharMerica 69,000 Pinriacle West Capital 53.900 PNM I bxourccs 35.800 Portland Gerieral tleclric 34.700 Prospect Chpital 9,700 Protective Life
520.500 Uwest (;orrirriunications lntctnational 02,100 HA1 I Investment Trust 12.700 Reddy Ice 76.1 00 liegions: hi>aincial 25,400 Resource Capilal 47,400 Reynolds American 38.000 Huby Tucsda! 13,900 Safety Insui-anco 58.400 SCANA 18,439 Security Rarik 17.700 Selectiw Insurance 89.100 Smart Modular Tectirxiloyies W1VH 5C7,OOO Sonic Automotive 5.681 Southwest Cas 9.1 00 Spartech
44.900 Standard Register 13:100 Standcx International 25,000 SteelCdSc! 42,800 Sunoco 32,000 Systemax 24.000 T(3 I iriaricia 34.8/3 T K O Fnerg) 46.300 Icmplc-Inland 14,700 1 tPPCO Partners 71.500 Thornburg Mxtqage 30,200 unipqua 58.300 IJrlllecl C)l~lllne
Y.200 Unitrin 15.700 Valcru Energy 64,800 Valspar 16,800 Vector 76.097 Verimi Commiinications
68.900 Westar t-nergy 85.800 bVGL 28.700 Whirlpool
233.88/ Windstrearri
123,tiUO Xcel Fnergy 46,900 Wyelh
Total Transferable Securities and Money Market Instruments Admitted to an Official Exchange Listing
1.25/,750 0.19 2,782,080 0.41
944.148 0.14 113,466 0.02
479.554 0.01 372.480 0.06
1.983.105 0.29 18T.483 0.07 170,942 0.C3 820,358 0.1% 99.8% 0.03
08.800 0.03 514,161 0.08
2.148.538 0.37 131,175 0.02 312.8/2 0.05 782.019 0.04 /d1.040 0.11 165,245 0.02 89.817 0.01
442,265 0.07 280.596 0.04 34.5.250 0.04
1 .SYd.048 0 24 5i2.160 0.08 298.530 0.04 ZVj.148 0.11 5.38.81 / 0.08 4G6,YYB 0.0i
18,675 0.00 462,928 0.0i 583.583 U.U9 78>,2Y2 0.04 827.3/2 0.09
1 .035 720 0.15 T3ti.480 0.1 1
2.630.024 0 39 731.322 0.11
1.030.1 99 0.27 2.846.101 0.42 2.161.821 0.32 2,481 .D5fi 0.37
645,090,752 95.60
Nurriber 01 shares Market ?; or Priricipal Other Iansferable Sewrities Value Net Arnount not dealt o r 1 :iriothcr Rcgulated Market LJSU Assets
Taiwan 406,000 Ya H:N Industrial
United Kingdom 173.1 40 Northern Rock
United States of America X200 American Home Mortgage
1 1.000 Municipal Morlyayc &Equity Inwstrnent
Total Other Transferable Securities not dealt on another Regulated Market
Nurriber of share:; or Priric:ipal Open-ended Collet:tive Arnount lrivesirrier~l Sctlemcs
Canada 48.131 2 Baytex Energy Tru:;t 1 1,000 Bell Alianl Hegional Communications
lncorrie T u r d 8,800 Davis & Henderson Income Fund
11.003 Enerplus Resources Fund 313.505 Parklarid Iricoine kunrl
Total Open-ended Collective Investment Schemes
79,701 0.01 79.701 0.01
0 0.00 0 000
32.770 0.00
870 0.00 31.900 0.00
112,471 0.01
Market ",o
LJSO Assets
3,204,214 0.48 1.660.100 0.25
Vdllle Net
488,275 0.07 137.432 0.02 542.890 0.08 375.517 0.08
3,204,214 0.48
Number of shares Market 9;, or Principal Value Net Arriounl Derivatives lJSD Assets
France 129,620 0.02 Y8,293 Credit AyriCoIe Rigthts 21;08:2008 129.020 0.02
United Kingdom 05,406 Bnrclays Rights 1 /!0I;%00U 90.507 HROS Rights 18:07:2008
30,735 0.00 11.338 0.00 19,397 0.00
Total Derivatives 160,355 0.02
Total Investments 648,567,792 96.1 1
Other Net Assets 26,231,629 3.89
674,799,421 100.00 Net Asset Value
,
I
I !
I
I I
~
I
!

Schroder International Sclcctton Fund Serrii-Annual Reporl June 2008 Page 189
Portfolio of Investments as at 30 June 2008 (cont) Schroder ISF QEP Global Quality
Number of shares Transferable Securities and Markct % or Priricipal Moriey Market Instruments Admitted Value Net Amount to an Otticial txchanoe L i ~ l i ~ i o IJSD Assets
Number of sharcs Transferable Securities and Market ?" or Principal Money Market Instruments Admitted Vali.ie Net Amount lo an Olticial Exclnainae Listina USU Assets
Australia
Austria
Belgium
Bermuda
27.439 AMP
20.584 Australia and New Lealand Hankirig 12.954 BHP Billiton
5.353 Aristocrat Leisure
6.097 Cahchargc Australia 2.278 Campbell Brothers
2,740 Cochlear
1,741 Corporate rxpress Australia
37,006 Cot:a-Coh Arriatil
22,511 Computershare
13.374 CSI 15.384 David Jones 7,897 Kagam Linr: 7778 I eigtiton
2ti,ia:3 Lion Nathan 4.120 Macquarie 5.51 5 Monadelphous
14,889 Dxiana
23.709 Primary I lealth Care 78,500 (jaritas Airways 25,456 OBE Insurance 10.96/ Ramsay Health Care
1.903 Reece Auslralia 0,734 Seek 8.641 Severi Network
13.080 St George Bank 8.948 West Aiistraliari Newspapers
75,917 Westpac Banking 8,421 Woodside Petroleum
23,500 Woolworths
2 14 Perpetual
3,263 Andriti
5.023 Uniqa Vcrsichcrungen 4.918 Verburid - Oesterreichische
rlekt ri7itaetsvirtschaft 4.139 Vieriria lrisurance 3.213 Voestalpirie
15.273 Telekorn Austria
1.445 Colru).t fi.0fi.7 hnev 3,973 KRC Froep 3.2 10 Mobistar
15,000 Accentlire 13.050 Aqudriiis Platinum 25,447 Hiscox 4,400 Max Capital
Brazil 8,800 AES Tiete Preference 4.300 Banco do Brasil 1,900 Bradcspar Preference 4.300 Cornparha de Concessoes
1,900 (.:orriparitiia de Transmissao de
7,762 Companhia Energctica dc Minas
Rodoviarias
Frierya rletrica Paulista Preference
Gerais AUI 1 11.000 CPrl rnergia 21.200 Natura Cosrncticos 9.100 Soiiza Crio
5.200 Tractebel Energia 100 Tclecornunicaqhes de Sao Paillo AllR
21,000 weg
6,117,923 17ti.408 33.026
370.304 541.012 48.046 59.712
249.295 1 11.037 199,741
8.800 157.1 16 41.543 34.909
111.31t' 21 5,l 83 102.58 1 59,641 3/.631 11.267
229.351 547.976 01.797 38,404 40.777 62,529
340.7 69 67.932
108.029 516.638 554.781
1 1 a . m
1,647,794 200,085 329.794 142.506
436.487 274,321 256.601
1,488,050 379.1 87 418.753 435.1 14 254 996
1,031 ,I 34
670.1 00 208.686 105.648 9.5.700
1,729,830 91,499 72.282
130.913
8G.365
61.058
187.5:30 264.31 1 71 5.898 260,343
19.488 77,407
762,706
5.07 0.15 0.03 0.31 0.15 0.04 0.05 0.21 0.0G 0.1 0 0.01 0.38 0.03 0.03 v.09 0.18 C.l( i 0.06 C.03 C.01 c.10 c.19 0.45 0.08 n.03 0.04 0.05 0.28 C.06 c.4 1 c.45 c.40
1.37 0.1 7 0.28 0.12
0.36 (1.23 0.21
1.23 0.31 0.35 0.36 0.21
0.85
0.51 0.17 0.09 0.08
1.43 0.08 0.08 0.1 1
0.07
0.05
0.1 5 0.22 0.18 0.21 0.02 0.06 0.P7
Canada 3.000 Astral Media 4,300 Rank of Nova Scotia 5.600 tncana 2,800 Cildan Activewear
14.700 Great West Lifeco 1 1.400 Husky Energy
700 IGM Financial 8.600 lmpcrial Oil 3,700 Iridustrial Alliance Insiirarw? and
Financial Services 13.200 Manulile Financial 4.400 Pason Systems 0 .4 00 Pet ro- Canada
10 700 Power Corp 01 Canada 10,600 Power Firiaricial 2,400 Reitrnans Cariada
5,600 Ritchie Bros Auctionoers 10.500 Rogers Communications 4,700 Rothmans
10.500 Royal Bank of Canada 9.600 Saputo
14.400 Stiaw Communicaiions 8,100 Shoppers Drug Mart 3,600 TELUS: 6.000 Toromont Industries 1.000 TSX
800 Research 111 Motiori
Cayman Islands 4.000 Herhalite
Chile 15.647 Aguas Andinas 2,398 Banco de Credito e lnversiones
29,389 Ranrnedica 10.844 Corriparihia Cervecerias IJnidas
?9.966 Compantiia Gerieral de tlectric:irlad 53,595 Ernbotelladora Andina Preference ?2.333 rrripresa Nacional de
1,300 Cornpanhia Ccrvcccrias Unidas ADR
leleconiunicacioncs 4.952 La Polar
23.677 Lan Airlines
China 12.000 I Ierigari International
Czech Republic 5,000 CEZ
Denmark 1.350 Coloplast 8,100 Novo-Nordisk 2.050 Novozyrnes 2.375 William Dernant
Egypt 1.981 Fgyptian (:o for Mot)ile :<RTVII:BS
Finland 3.092 Alma Media 4 ,1 15 Konocrancs 1,659 I-assila R Tikanoja 7 . 9 4 Ramirent 2.345 Uoonor
6,848.893 95.270
200,192 495.773 72.890
1 1 8,303 537.581 ?8.760
51 7.884
127,234 464.072
77.054 51 1.725 324.300 345,187 34.833 90.107
149.808
122,166 176.116 265.51 6 280.792 443.748 149.973 167,130 41.630
154,520 154,520
1,107,385
64,427 29,879 84.234 38,20/
195,443 135.71 0
305.156 20.899
24 1.262
35,389 35.389
446,352 446,352
994,096 11 7,828 535,189
154.840
60,146 00.1 46
324,597 41,424
181,113 40.687 ;76.?56 34.81 7
4oa.868
5.868
185,639
5.67 0.08 0.1 7 0.4 1 0.06 0.35 0.15 0.07 0.43
0.10 0.39 0.06 0.12 0.27 0.29 0.03 0.08 0.12 0.34 0.10 0.39 0.22 0.23 0.37 0.1 2 0.14 0.03
0.13 0.13
0.92 0.01 0.05 0.03 0.05 0.03 0.1 6 0.1 1
0.25 0.02 0.21
0.03 0.03
0.37 0.37
0.82 0.10 0.44 0.15 0.13
0.05 0.05
0.27 0.04 0.13 0.03 n.02 0.03

Page t 90 Schrodcr Iriterriatiorial Selectim Fund Sm-Aririual Report June 2008
Po rtf ol io of I nvest men ts as at 30 June 2008 (cont) Schroder ISF QEP Global Quality ( I m )
Number of shares Trarisfewble Securities and Market "s
Arriour>l to an Official Fxcharicw Listiriu iisr) Assets ur Principal Money Market Iristruiiienls Adniittcd VdlUe Ne1
France
Germany
Greece
3,610 Air Liquide
2.384 Benctcau 1.757 BioMcrieux 7,377 (:le Genernlc d'optique Essilor
270 April
International 169 trarriel 633 Esso Societe Anonyme rrHrl<aise 415 Iliad 189 L.aurerit Perrior
2,025 LVMH Moet Heririessy I oiiis Vuitton 1,184 Mariitou H I 1,581 Ncopost 2,832 Societe Des Autoroutes Paris Rhin-
Rt 1 0 1 IC!
14 Sorrify 5,9fi0 Total
108 Total G:ibori
583 AMB Generali 539 Ucutschc Boerse 345 HririgKlinyer
5,184 EnBW Eneryle IVaderi Wuerltemberg 1,356 ructis Petrolub C'relcrcncc
448 Rational 10.53ii SAP Y.8iY TakM 3.008 ThysseriKruLp 2.872 Uriited Internet 1.888 Winr;or Nixdorf
10.545 Alptla Harik 9,714 EFG Eurobarik rryasia:; 1.141 JIIMRO 2,485 National Ran< of Greece 5.805 OPA'AP 7,789 Piraeu:; Bnnk
Hong Kong SAR 2.1.000 Cafe de Coral
19,000 China Mobile 66,500 CLP 22.500 Dairy rarrii Internalional 35,100 Esprit 25.000 Hang Senq Rank
10.500 Hony Kong Exchanges & Clexirig
108,000 Cliina Insurance International
125,OW Hong Konq R China Gas
11 4,500 Hopc.~cll Highway Infrastriuctiire 6.800 Jardine Matlioson
18.000 Li tc Futyj 12.000 Iclcvision Broadcasts 78,000 Texwiric:a 38.800 Transport Iriterriatiorial
6.000 Vtech
Hungary 1.628 MOL Hungarian Oil arid Gas
Indonesia 360,500 Irilerrialioiinl Nickcl Indonesia 146.500 Telekorriuriikasi Indonesia 11 9.500 lJriilever Indmesin
2,874,413 481 573
15.444 52.530
199722
430.091 167,520 15Y,K3 39.079 25.82'3
21 0,706 35.1 77
184,818
268.288 17.741
30ti.301 I tl,t,86
1,832,542 105.409 80,333 32.3.1'3
413,343 128.449 81.203
554.817 71.144
1 89,310 56,991
131,112
952,911 31 2,798 739.1 11 :<ii,xz
1 13.350 202,205 62,128
3,268,032 43,087
251,368 255.317 36'9,579 1 10.700 384.542 527.304 29/,150 153,479 86,788
208.780 34.93; BB.23Y iifi,OO8
169.1 40 38.1 53
218,823
7- ?,
218,823
439,890 238.1 7 i 11 5.955 87.458
2.38 0.40 0.01 0.04 0.1 7
0.37 0.14 0.1 3 0.03 c.02 0.18 0.03 0 14
0.22 0.02 0.47 0.oa
1.52 0.09 0.04 0.03 0.34 0.1 1 0.07 0.40 0.06 0.1 8 0.05 0.1 1
0.79 0.26: G.19 0.03 0.0s 0.1 ; 0.03
2.71 0.04 0.21 0.21 0.47 O.O!i (1.30 0.44 0.25 0 1 3 0.0; 0.1 1 0.O:i
0.05 0.14 CJ.03
0.18 0.18
0.36 0.19 0.lC 0.01
o.06
Nurriber of :stiare% Transferable Securities arid Market ?b Money Market Instruments Admitted Value Net or Principal
Amount to a r i 0Ric:inl txcliangc Listing LJSU Assets
Ireland
Israel
Italy
Japan
Malaysia
74.7f i Ariylo Iribli Bank 2.848 rBD Holdings I .53 i Paddy Power
19,850 Uriited 13riiy
I.063 Delek AUt0li~OtlVC Systems 1 1,904 Israel Ctiomicals 13,361 Partrier (:ommunications
11.225 Assicurarioni Generali
13,Bil EN1
59. i Y ? Irite:;a :;aripaolo
253 Credit0 Bergarnasco
gj.285 &ox
/.410 Recordali
9,200 Aisin Saki 11 ,200 ( . h i o r 1
54 Central Japari k l , r ~ a y 8.200 Uaikin Industries
14.700 Deri:;o 1 ,800 D1:;CO 2.100 Exedy 5,300 Fariuc 1 .YO0 Fuji Mactiirie Manufactur-iny 3.600 t-iariximntsu Pliotcnics KK 5.T00 Hisaniitsu Ptiarrriaceutical
13,700 HOYA 1.700 lbiden
10,500 JSIi 31 KDUl
14.500 Korriatsu 4.700 MlSlJMl 3.600 Mori Seiki 4,800 Nidec 3.000 Nikon
3.200 Nissiri Koyyo 2.100 Nitori
13.000 NTN 5. i00 Oracle Cor[) Japan
1,300 Otsuka 1.070 Point 9,700 Stiiri-l:+xi Chemical 5,000 Stanley Electric
2,400 Sysiiiex 5.700 lerumo 3.100 Tokai Rika 5.200 Tokai Rubber Industries 6.400 lokyo Electron 4.700 Toyota t3o:;tioltu 9,500 Toyota Motor 1.520 USS
380 Yahoo! Japan
1 1,000 Nissari Ctierriical Industries
800 OSAKA I itarwiin Technologies
10,000 Suzuki Motor
19,300 t3erjay:ll.a Sports Toto 33.400 Digi.Com 4.900 Nestle Malaysia
6'8.600 Petrona:: Cas 97.200 Tcnaqa Nasioria
521,465 238.871 125.203 47,482
109.818
832,219 115.518 393.374 323.297
1,440,644 428,507
Y ,842 51 0.748 Y4.320
330.075 57.754
8,601,177 302,180 578.321 697.503 415.661 507.121 T8.133 63.439
519.775 38,093 93,T98
249.045 31 8.077 07,058
209,523 182.32 1 405.901 R7.785 00,97G
370.938 87.Y52
135.882 48.754
123,927 86921
233.412 31 .6B3
103,98 I 30,7 62
603,613 121,594 23/,3/b 94,814
2Y2,1ti9 Ij4 .35 1 6 / 3 4
312.540 128.456 450.1 13 100.768 146.983
857,080 1 1 T,Y4Y 244.303 43.189
208.89i 942,442
0.43 0.20 0.10 0.04 0.09
0.69 0.09 0.33 0.27
1.19 0.35 0.01 0.42 0.08 0.28 0.05
7.13 0.25 0.48 0.50 0.36 0.42 0.06 0.05 0.43 0.03 0.08 0.2 I 0.28 0.05 0.1 7 0 16 0.34 0.07 0.05 0.27 0.07 0.1 1 0.04 0.1 0 0.07 0.19 0.03 0.09 0.03 0.50 0.10 0.20 0.08 0.24 0.05 0.08 0.7G 0.11 0 37 0.08 0.12
0.71 0.10 0.20 0.04 0.1 7 0.20
I
I
I
I
I
I I
I I
I I
I I
i i I
i
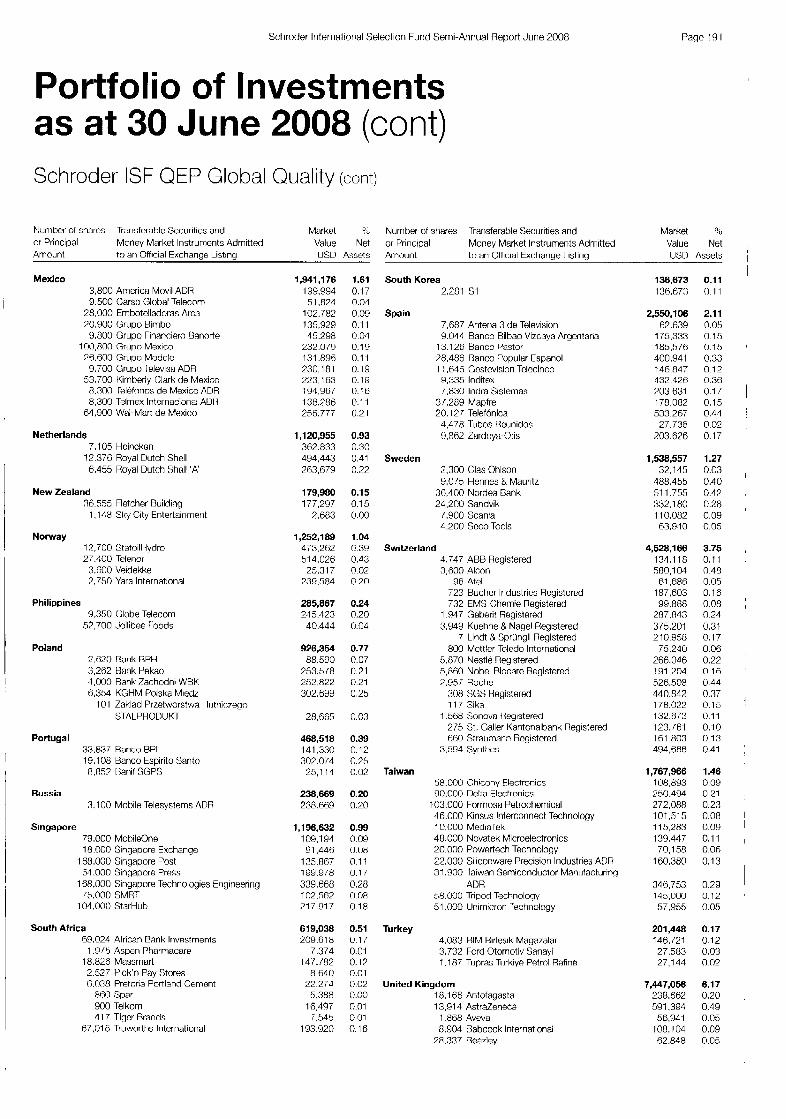
Schroder International Seleclicm Fund Semi-Annual Report June 2000 Pagc 191
Portfolio of Investments as at 30 June 2008 (cont) Schroder ISF QEP Global Quality (cont)
Number 01 shares Trarisferd)le Securities and Market % or Principal Money Market lnstrumcnts Admitted Value Net Amount to ;in Official Exchange Listing USU Assets
Mexico 3,800 Amcrica Movil ADn 9.500 Carso Glohal Telecom
28,000 Embotclladoras Arca P0.900 Grupo Bimbo
100,800 Grupo Mexico 76.600 Grupo Modelo
9.700 Grupo lelevisa ADR 53.700 Kimberly Clark de Mexico 8.300 Ieleforios de Mexico ADR 8.300 Telmex lntcrnacional AUI 1
9.800 Crupo Financiero Banorte
61.000 Wal-Mart de Mexico
Netherlands 7.105 Hcinckon
6,455 Royal Dutch Shell ' A 12.376 Royal Dutch Shell
New Zealand 36.555 Fletcher Building
1,148 Sky City Entertainment
Norway 12,700 Statoill iydro 27.100 Tclenor
3.600 Veidekke 2,750 Yara International
Philippines 9,350 (;lobe Telecom
57.700 Jollibee roods
Poland 2.620 Rank RPti 3,262 Bank Pekao 4,000 Rank Zachodni WHK 6,354 KGHM Polska Miedz
101 Zaklad Prretworstwa tiutriic:7ego STALPRODUKT
Portugal 33,837 Ranco BPI 19.108 Banco Espirito Santo 8,857 Hariif SGFS
Russia 3.100 Mobile Telesystems ADR
Singapore 70.000 Mobileone 18.000 Singapore Exchange
168.000 Singapore Post bl.000 Singapore Press
168,000 Singapore Technologies Engineering (5,000 SMRT
104.000 StarHub
South Africa 69.024 Alrican Bank Irivestrrients
18.826 Massmarl 1 .Y 15 Aspen Pharmacare
2 527 Pick'n Fay Stores f.03R Pretoria Portland Cement
860 Spar 900 .Telkorn 1 1 7 Tigcr Brands
87,01 6 Truworths International
i , w i , i r 6 199,994 51.824
102.782 135,920 45.298
232.079 131.895 730,181 223,l 63 191,967 1363.786 256.777
1,120,955 362.833 494,443 263.679
179,080 177.297
?.6R3
1,252,189 473.262 514,026
25.3 17 239.584
285,867 215.423 40.444
926,354 88.500
253.5/8 252.822 302,699
28.665
468,518 141.330 302.014 25,l 14
238,669 238.669
1,196,832 109.1 94 9 1.446
135.867 199.978 339.668 102.56? ?17,917
619,038 209.618
7.374 147 .M
8,MO 22,274 5,388
16,497 i.545
193.920
1.61 0.17 0.01 0.09 0.1 1 0.04 0.19 0.1 1 0.19 0.19 0.16 0.1 1 0.21
0.93 0.30 0.41 0.22
0.15 0.1 5 0.00
1.04 0.30 0.43 0.02 P.10
0.24 0.20 0.04
0.77 0.07 c.21 c.21 C.25
0.03
0.39 0.12 0.25 0.02
0.20 0.20
0.99 0 09 0.08 0.1 1 0.17 0.28 0.08 0.18
0.51 0.17 0.01 0.1? 0.01 0.02 0.00 0.01 0.01 0.16
Number of shares Trarisferatile Se(:iirities arid Market ?3
or Principal Money Market Instruments Admitted Value Net Amount to ari (1ffic:ial Exchange I isting IJSO Assets
South Korea 2,281 SI
Spain 7,687 Ariterva 3 de Televisiori 9.014 Ranco Rilbao Vizcaya Argentaria
13.126 Banco Pastor ?8.486 Ranco Popular Fspanol 11,646 Gcstcvision Tclccinco 9,335 lnditex 7.830 Indra Sistemas
31.289 Mapfre 20.1 27 Telefonica 4,478 Tubos Helinidos 9.8B2 Zardoya-L?is
Sweden 2.300 Clas Ohlson 9.075 Hennes & Mauritz
36,400 Nordea Earik 24.200 Sandvik
1.900 Scania 4.200 Scco Tocls
Switzerland 3.747 ARB Rcgistered 3,600 Alco11
96 Atel 723 Bucher Industries Rcgistcrcd 732 EMS Chernie Registered
1 347 Geberit Registered 3.949 Kuehne 8 Nagel Registered
7 Lindt & Spriingli Registered 800 Mcttlcr Toledo International
5.870 Nestle Regstered 5,860 Nobel Riocarc Registered 7.957 Roche
908 SGS Registered 11 7 Sika
1.568 Sonova Ilegistered 275 St. Galler Kantonalbank Registered 660 Straumann Rcgistcrcd
3.594 Syrithes
Taiwan 58.000 Chicony Electronics 90,000 Delta Electronics
46.000 Kinsus Interconnect .Technology 10.000 Mediarek 48.000 Novatek Microelectronics 20.000 Powertech Technology 22.000 Siliconware Precision Industries ADR 31.900 faiwan Semiconductor Manufacturing
58.000 Tripod Technology 51 .000 llnimicron lechnology
103.000 Formosa Petrochemical
ADR
Turkey 4.083 RIM Rirlesik Maga7alar 3.732 Ford Otomotiv Sanayi 1.187 Tupra:; Tiirkiye Petrol Rafirie
United Kingdom 18.1 66 Antofagasta 13.914 Astrdeneca
1.868 Aveva 8.904 Rabcock International
18.337 RBR71ey
130,673 136.673
2,550,106 67.639
175,333 185,576 400.941 146.847 432.426 ?03,631 178.082 533.267 27.738
703.6P6
1,538,557 32.145
488,455 51 1.755 332,180 1 1 0.082 63.040
4,528,166 131.1 18 580.1 04 61,686
187.603 99,888
287,843 375.201 210.958
75.210 266,046 191,204 526.508 440.842 178.022 132,673 123.161 161.803 494.666
1,787,968 108.893 %50.494 272,088 101.515 1 1 5,283 139.447 70.1 58
160.380
3413.753 145.000 57.955
201,448 146.121 27.583 27.144
7,447,056 238.662 591,394 56,941
108.104 62.848
0.1 1 0.1 1
2.1 1 0 05 0.15 0.15 0.33 0.12 0.36 0.1 7 0.15 0.41 0.02 0.1 7
1.27 0.03 0.40 0.4? 0.%8 0.09 0.05
3.75 0.1 1 0.48 0.05 0.16 0.08 0.24 0.31 0.17 0.06 0.22 0.1 6 0.44 0.37 0.15 0.1 1 0.10 0.13 0.41
1.48 0.09 0.21 0.23 0.08 0.09 0.1 1 0.06 0.13
0.29 0.12 0.05
0.17 0.12 0.033 0.02
6.17 0.20 0.49 0.05 0.09 0.05

Page 192 Schroder International Sclcctiari Furid Serni-Annual Rcport Jurie 2008
Portfolio of Investments as at 30 June 2008 (cont) Schroder ISF QEP Global Quality (CCN It)
Number of shares Transferable Securilies and Market 4;) or Principal Money Market Irislrunients Adflitted Value Net Arriouril to an Official Excharige Listing IJSD A:;:;el:;
United Kingdom (cont) 20.999 RC 44,634 Briti:;ti Sky Broadcasting
21.382 Capita 7.850 Rurberb
6,332 Dc La Hue 24.044 Di:igeo 23. I1 7 (;laxti:;rriiltiKlinc
5.13 Crcggs 10,?01 Hallurds 29.303 Halnna 16.905 Irriperial lobrcco 10.979 lntertek 26.8U7 Marl 17,201 Marks L1 Spencer 6.407 Micro h : u s Intcrnational 7.00/ Ncxt
19.143 Petrofat: 8,988 Reckitt Rerickiser 6,475 Rotork
13,330 Scottish & Southern Crierqy 8.0Y1 Spectris XU88 Spirax-Sarco Crigirieerir-ig
5,612 Ultra Flectroriics 3.72 1 Victrcx
6/,/33 Tesco
United States of America 6,900 3M
10,000 Abbott Laboratories 1.200 Aftliated Managers &000 All;lc: 5.u00 Air Products & Ctieniicals 1.300 Airyas 2.200 Allegheny Technologies
1.900 Arrietek 7,900 Amphenol
3,500 Apat:he 2,300 Applied Industrial Technologe:; 9.500 Applied Materials 2.100 Assurant 4,!100 Automatic Data Processirig 3.000 Autozone 2,500 Bank of Hawaii 9.000 naxter 8,700 Bcclon Dickinson & Co.
6.500 BJ Services 1,500 Black & Decker 7,700 BMC Sollv/arc 3.500 Boeiriy
1.200 Buckle
5.500 Caterpillar 5.930 (;I I Robirisori Worldwide
5.200 Chevron 6,100 Chubb 8.400 Clorox 3.800 Coach 4.100 Cohen & Steers 7,500 Colgate-Palmolive 3,800 CH &ad 4,400 Danaher
3,600 Delphi ririaric:ial
400 Alliant Tcchsystems
6,900 AI1hCUsCf-Husch
3,800 Rest nuy
800 Rrowri R Urowri
1 ?.700 C:arllpbell %:up
1 ( J . X J 0 Charles :;c:ti~;mtr
1 1,200 Dell
537.947 0.45 417.32i 0.:35
70.776 0.05 334.1 00 0.28 111,520 0.09 3433'31 0.3; 530034 0.44
39,tjPC! 0 03 54.0Y~ 0.04
123.655 0.10 628.53'3 9.52 21 1.120 0.18
!.18\5 0.2/ 1 1 % . /33 0.09 33,980 0.03
136,479 (1 1 1 276.685 0.25 453.337 0 . 3 141,500 0.12 311.598 0.47 115,331 0.10 85.584 0.05
492.559 0.41 1 :Xi.730 0.13 s3.205 0.05
49,249,743 40.81 437.513 036 530.000 0.44 109,600 0.09 504.100 0.42 657.272 0.48 93,f130 0.08
132.880 0.11 39,808 0.03
479.850 0.40 56.396 0.05
183.233 0.1 5 161.957 0.13 204 0.1: 360 0.30 122 0.10 ;jt->o. 190 0.1 7 534,680 0.44 157,190 0.13 208.845 0.17 87.615 0.07 98.331 0.08
234.220 0.1Y 14,632 0.01 53,080 0.00
308,686 ci.3'1 405,825 0.33 375,033 0.2; 211.344 0 I: 508,560 0.42 305,183 0.25 331.548 027 I1 1.302 0.09 112.053 0.09 51 l . 5 i3 0.47 334,970 0.28 338,220 0.28 21'3.200 0.21 85.600 0.0:
--
Number ot shares Transferable Securities and Market % Value Net or Principal
Amount 10 an Otticial Exchange 1 istirig US0 Assets Moncy Market lnstrurrierits Adniilled
United States of America (cont) 9.900 Uwon Encrgy 2. (00 Diarriorid Olktiore Drilling 3,200 DISH Network
5.600 D0rlaltJ:;on 2.000 Eaton
10,400 tccllab
600 Dolby Laboratories
-1Od Eaton Vance
3,400 EII LIII~ a GO. 8.400 trnerson Electric 3:100 Energeri 1.500 I riergier 2,100 EOG Resources 2.100 Equifax 5.300 Exelori 4,400 Fxpeditors lnterriatrorial of
Washington 100 txprcss Scripts WJ rxxorl Mobil
1 .YO0 Factset fiesearch Systcms 1 ,I 00 knstcnal 8.1 00 Federated lrivestors 5,700 k d E x 7.400 Frarikliin Hcsources 3,900 Frontier Oil 5.700 Ccncntech 6.400 Gencral Dynamics 8,400 tieriuirie Parts 1,300 Goldrriari Sactis 5.100 Graco 6,R00 Harley-Davidsori
5.100 I larri:; 3,100 Harte-l larik; 3.400 Hcnry Schein 3.400 I lerriiari Miller 6,400 I Iw&H Packnrd
800 I larrriari Ir-ilernational Industries
800 Holly
7.1 00 t lorrriel t-oods 2,300 Hubbell 1.700 ldexx I aboratorie:;
10.300 Illinois Tool Works 1.700 International nusirless Machines 7.400 Intornational Flavors & rragrarices 8,800 Iriterrialior~ia Garnc Technologf 7,400 Jack Hcnfy &Associates 1,900 J13 Hun1 Iransport Services 7,000 .Johnson & Johnson
1,500 Joy Global
i.400 Kimberly-Clark 1,400 Kinetic Concepts 2,l 00 1.-3 C:orrirriiiriicnlions 3.800 Laboratory Carp of America 1,200 I ariclslar Sfstein 1 ,7W 1 incolri r1ec:tric 5.1OC Lockheed Martiri
14.300 Johnson Controls
11.000 Kelloyy
71.700 LOWC'S 12.300 Marriott International
800 Marlin Marietta Materials 1.800 Matthcws lnternatiorial 5,700 McCotmick & Co. 6.400 McDonald's
10.800 McCraw-Hill 0.600 MUU Hcsources
1 ci.300 Medtroriic
333.152 372.278 239 S 3 ? 23.61 0
255.472 168,400 16,184
454 2 / 2 428.73.1 452,/98 255.374 1 11.225 773,309 90.936:
481,100
188,540 318,954 562.575 109.459 4Y.192
284,633 4 4 0 3 5 51 i.158 11S,885 414.504 532.99? 33.5.928 228.Y28 195.993 241.750 33,240
261 .o 18 35.030
114,794 110.024 285,3 I 2 29.696
255,YYti 243.31 7 31,/70 85.4763
477.500 5634,935 95.304
159.388 52.440 (Y2, 700
483.132 424,316 113,0ti6 527.560 443,038
55.378 191 ,079 2BLi.264
64,932 105,728 >08.06? 432,879 3 8 , 2 8 7 84.720 82.31 4
204.SIu 361 ,GO0 439, iX 281.3Y2 527,772
0.?8 0.31 0.20 0.07 0.21 0.14 0.0 I 0.38 0.38 0.37 0.2 1 0.09 0.23 0.08 0.38
0.1 6 0.26 0.47 0.0Y 0.04 0.24 0.30 0.43 0.10 0.34 0.44 0.28 0.19 0.18 0.20 0.03 0.22 0.03 0.14 0.0Y 0.24 0.02 0.21 0.20 0.08 0.07 0.40 0.47 0.08 0.14 0.04 0.05 0.40 0.35 0.09 0.44 0.37 0.05 0.1 8 0.72 0.05 0.1 1 0.42 0.38 0.27 0.0/ 0.07 0.1 7 0.30 0.38 023 0.11
I i
I
I I
,
I
!
I I

Schroder International Selection Fund Semi-Annual Report June 2008 Page 193
Portfolio of Investments as at 30 June 2008 (cont) Schroder ISF QEP Global Quality (cotlt)
Number of shares Transfcrablc Securities and Market or Principal Money Market Instruments Admitted Value Net Arnount to an Official Exchanoe Lislina LIST) Assets
United States of America (cont) 1,300 Meredith 2.100 Meridian Rioscicnce 3.500 Microchip lechnoloyy 1.800 Micros Systems
14.800 Microsofl 1,500 Monsanto 1.400 Moody's 1.200 M:SC Inrliistrial Direct 8.200 Nike 2.000 Nordstrom 7.100 Norfolk Souttrerri 2.400 Nucor 5.600 Occidental Pctroleum 3.800 Omnicom
1,300 Packaging Gorp 01 America 6,100 Parker Hannifin 2,500 Patterson 3.100 Pattcrson-U 1 I tnergy 8.400 Paychex 8.300 Pepsi Eottling 7.600 PepsiCo
fi.400 P W Industries 5.900 Praxair 2,100 Precision Castparts 7,100 Procler & (>amtile 8.300 QUALCOMM 3,100 Ouest Diagnostics 6,600 Oiiestar 9.7(X) Repihlic Services 5.200 Robert Half Intcrnational 3.900 Rockwell Automation 7,200 Hockwell C:ollins 5.500 Rohm & Haas 0.1 00 Iqollins 3.700 Roper Industries 2.700 Hoss Stores 2.000 Schliiniberger 6,100 SEI Investments 5.800 Sherwin-Williams 6.600 Sigma-Aldrich 4.500 Smith 4.000 Southern Copper R,D00 St Jude Medical 2,100 St. Mary ILand & Exploratiorl
1 1 , I Do Oracle
300 Philadelphia Consolidaled
15,100 Staples 15.500 Start)ii(:ks
5,600 Strykcr
9.100 1 R o w Price 1 .ROO Tcchnc
300 Strayer Fdi.ication
1 6.700 sysco
16,500 lexas Instrurrierits 11 .I 00 TJX 4,200 Torchmark 3,700 Torc, 7,000 Total System Services 1.500 Iransatlaritic: 6.300 IJGI 6,900 IJnited Technologies
10,600 UnitedHealth 15,700 US Rancorp 6,100 Valero tnergy 3.900 Varian Mcdical Systems ?.?00 VCA Antech ~ ~ . i o o w.r. Berkley 4,000 W.W. Grainger
37.151 75.1fifi
108.045 55,710
408,924 197,510 48,fi?? 54,120
494.788 67,140
433,384 179, 11 2 495.3?0 169.898 236.319 160.746 437.734
74.400 11 0.163 265.272 231 .OR5 485.868
10.31 1 365.760 558.494 767.435 429.17'3 378.895 117.808 462,858 28 T I 993 1?3.084 171,788 311.232 260.700 131.880 735.349 98.253
2 1 1,800 159.1 25 2/1.846 358,994 359.1 YO 435.380 243.240 133,056 376.1 77 253.425 67.185
348.656 471 .?74 51 4,150 141,570 470.4 15 353.535 247.632 124.578 156.520 85.605
175.077 421.935 775.706 444.467 243.756 300,677 62.128
375.760 227.22r
0.03 0.06 0.0G 0.05 0.34 0.1 6 0.04 0.01 0.41 0.05 0.38 0.15 0.41 0.11 0.20 0.13 0.36 0.06 0 09 0.22 0.19 0.40 0.01 0.30 (746 @.22 0.3U fi.31 (3.12 C.38 (j.24 0.1 0 C.14 C.28 0.22 0.1 1 0.19 0.08 C.18 0.1 3 c.23 c.30 0.30 0.36 0.2n 0.1 1 0.31 0.21 0.06 0.29 0.39 0.43 0.12 0.39 0.29 0.21 0 10 0.13 0.07 0.15 0.35 0.73 0.37 0.20 0.1 7 0.05 0.19 0.77
Number of shares Transfcrsble Securitics and Markel "4 or Principal Money Market Instrurncnts Admitted Value Net
to an Official Exchange Listing USD Assets Amount
United States of America (cont) 9.1 00 Wal-Mart Stores
14.600 Walgreen 18,400 Walt Disncy
900 Waters 800 Western Digital
1,700 WM Wrigley Jr. 4.200 Wolverine World Wide 7.015 Xm Energy
13.600 Yum! Rrands
8,100 Waste Managerrierit
Total Transferable Securities and Money Market Instruments Admitted to an Official Exchange Listing
517.330 181,362 517.748 221,164 58,653 27.896
508.675 113,610 177,563 476.1 38
0.47 0.40 0.43 0.19 0.05 0.02 0.50 0.09 0.40 0.39
Number of shares Market B or Principal Other Transferable Sccuritics Value Net
OSD Assets Amount riot dealt o n another RegiilatMd Market
Brazil 3.000 ArcelorMittal lnox Basil
Total Other Transferable Securities not dealt on another Regulated Market
178,652 0.14 178.652 0.14
178.652 0.15
Total Investments 119,653,050 99.12
Other Net Assets 1,057,482 0.88
Net Asset Value 120,710,532 100.00
I

Page I94 Schroder Irilernational Solcctiori Furid Serni-Annual Rcport Jurie 2008
Portfolio of Investments as at 30 June 2008 (cont) Schroder ISF North American Equity Sigma
Nurnber of stwes Transferable Securities arid Market :h or Priricipal Money Market lnstrurrierits Admitted Value Net Arrioiint to an Official rxctianqe Li::tina I J S U Assets
Bermuda 7,100 Acccnture 6.712 ACE 1,200 Allicd World Assurarw 1.800 Asperi Ir.isurillcc 4.000 Axis Capila
1.600 Endurance Specialty 1.000 tverest Hc 3.100 Max Capital 7,300 Nabors Industries 1.100 Partriertie 2.000 Platinum (.Jriderwriters 2,200 HenaissanceRe 3,300 XL Capital
500 Central European Media tntcrpriscs
Canada 1,600 Ayriico taglc Mines I. i00 AltaGas lricorrie Irusf 2.tio0 n(:E 1.700 noriavista Erieryy lrust 3.300 Carneco 5.000 Canadian National Rail'wdy 3. ;00 Cariacjiari Ri:;i:itic Hailwaf 2.200 Cathedral Energy Services Iricomc
Trust 12,600 Celestica 1.500 Oundee
400 EnCana 3,385 Enerplus Resources Fund 4,000 hisign tnergy Scrvices
400 tairtax Financial 990 rirsi Oiiaritum Mincrals
1,900 Fordirig Cariadian Coal Trust
3,500 Husky Encrgjr 1.500 IGM ririaric:ial 4.800 Methanex 1.500 National Banr of Canada S.400 Nexeri
10.773 tierdaii Anwristeel
800 Northbridge Financial 13,500 Norlhyntc Minerals 10.1 GA Periri West tncrgy Trust 6.300 PeiTo Trier(]:' IrusL 5.800 Progt-ess Frierqy Trust
900 Research In Motion 5.100 Rogers Cornrnuriicatioris
11.000 :;haw Communications 3,500 Sherritt lnterriatiorial 3.000 Shoppers Drily Mart 3,700 Sur 1 it8 Financial 1.175 Teck Corninco 2.300 Tororito-L)urriiriic,n Rank 2.700 Vcrnmilion Energy Trust 3.703 Yamaiia (;old
Cayman Islands 000 Garnitn
3,200 Hert)alite 8,600 Seagate Te(;tirioloyy
Israel 10,6(K) Check Point Software Techiolocjies
South Korea 8.400 Arrikor lechnology
Switzerland 2,400 Addax Petroleurri 1,500 Alcori
1,853,671 293.514 377.428 49,704 .I 2 7 8 6
123.080 35.390 49.!?:30
128.224 07.325
350.093 75.i58 tic, 100 99,132 78 431
4,581,375 I10.183 170.2B7 '31.173 43,571
132.338 238,940 217,031
33.304 105.528 55,888 35.417
158.689 85,959 9/.941 6 1,304
170.053 201.91Y 1 ti5.0>1
G I .61ij 125,141
13.1 55 248,395 25,894 51,951
345.204 127,440 54,291
108.1 88 210.775 232.044
53, iXO 154,351 132.7 i1
10.0G3 145.198 ll{,;?l 82.353
326,440 35.296
.I 23.6 1 6 1 ij7.528
253,976 253.976
91,224 9 I ,22,1
356,330 1 14.O20
I .30 0.22 0.E 0.03 0.03 0.09 0 03 0.03 0.09 0.05 0.25 0.03 0.05 0.07 0.05
3.21 0.OY 0.08 0.0: 0.w 0.09 0.1 7 0 1 1
0.02 0.0: 0.04 0.02 0.1 1 0.06 0.07 0.04 0 , l2 0.1 5 0.1 2 0.04 0.05 0.05 0.1 1 0.02 0.04 0.24 D.09 0.04 0.08 0.1 5 0.16 0.04 0 12 0.09 0.05 (1.10 0.00 0.04
0.23 0.0) 0.09 0.12
0.18 0.14
0.06 0.08
0.25 0.08
241.710 0.17
Number of shares Iransfcrable Securities arid Market 96
Money Market lnstrurrierits Adriiitted Value Net or Principal USU Assets Ariourit to an Official rxchariye Listing
United States of America 11.874 3M 24,ti41 Abbott Laboratories 4.300 Abcrcrombie & Fitch 1,200 Aciirarit 8,500 Acxiurri 7.1 00 Advance America (:asti Advancc
Ceriters 4.4W Adwrice Auto Parts 8,300 Aetna 5.200 Affiliated (:omputcr Services i,700 Aflac
14.000 Alcoa 4.0i0 Alliarit triergy
500 Alliai-It Techsystems .I 2.021 Allstate 1,500 Alpha Natiiral Hcsources 8.200 Altera
17.717 Alfria 4,900 Amazon .coni 1.i300 Ambassadors 1.700 Arriedisys 5.200 Amereri 7.500 Amcrican Capital Strategies 1,500 Arriericari tcology
12.100 Artwrican Electric Power 1 1,5u/ Arriericari txpress 73,71 G American lnternatiorial 7.900 ArricriCrcdit 2.000 AMErilGROUP 4.700 Amerisafe 3,300 ArrierisourceBcrgen
12,886 Arngeri 3,700 Amphcnol 2.000 Arrisury 1. 107 Ariadnrku Pctroleum 9,480 Anhcuscr-Rusch 1,300 Anixter Internatic.)rial 3200 APP Pharmaceuticals 9,904 Apple
2 , 7 3 9 Applied Materials 3,500 Arbor Really lrust 2.400 Arch Chemicals
14.800 Archcr-I3aniels-Mitjl~ri(j W2.184 AT87
1,800 Atlaritic TeIe-NeLwork 1.300 Atla:; Air Worldwide
7.600 A ~ l o ~ o n e 9.200 Automatic Ddtd Pro(
61,788 Bank of Amcrica 19.000 Bank of New York Mellori 1.300 Basic tncrgy Services 6,900 Baxtcr International
6.800 Becton Dickirisorl K, Co. 18.300 BR&T
11,700 Bed Bath tc Beyond Y.349 sesl Buy ii.i34 RJ Sewices 2.800 Black tc Decker
800 BlackHock 4,Y00 Rhieyreeri 1,954 Roeing 1,900 Bois d'Arc Energy 2.200 Boston Properties 7.400 Broadridge Financial Solutioris 3.1 00 Bronco Drilling 7.400 F3iic:kle 3,800 Burger King 6.000 Burltngtori Northerr Santa Fc ~1,300 Caderice Uesiyn Systems
129,643,267 90.78 821.886
1,305.973 215,630 37.632 75.765
36.778 173.360 334,573 272.8'16 485.485 495,320 137,383 49.700
:5:59,2 17 154,245 171.790 360.54 1 365,834 24.976 80.9 I t3
215,072 1 87,125 11.505
4i8,YIU 440,009 658.1 19 26.21 0 42.620 75,247
129,393 597.521 144.896
1 Y ,24u 572,/21 5Y0.125
77,077 51.392
1.604.571 'l8ti.860
34,230 80,730
480.632 2.71 1.349
39.842 65.213
383,088 312.338
1.307.072 733.970 40,Y>4
390,047 434.076 642.040 540 .ow 374.42i 216.363 163.548 142.080 3 1 ,605
130.762 40.151
190.1 54 l59,Y86 5U,668
110.160 102,334 584.400 43,802
0.57 0.91 0 19 0.03 0.05
0.03 0.1 2 0.23 0.19 0.34 0.35 0.10 0.03 0.3Y 0.1 1 0.1 2 0.75 0.20: 0.02 0.04 0.1 5 0.13 0.03 0.34 0.31 0.46 0.02 0.03 0.05 0.09 0.42 0.10 0.03 0.40 0.41 0.05 0.04 1.18 0.34 0.02 0.06 0.34 1 .YO 0.03 0 05 0.21 0.22 1 .OF 0.5 1 0.03 0.27 0.30 0.38 0.24 0.70 0.15 0.1 1 0.10 0.0) 0.09 0.03 0.14 0.1 1 0.04 0.07 0.07 0.41 0.03

Schroder International Selectiori Fund Scmi-Annual Report June 2008 Page ID5
Portfolio of Investments as at 30 June 2008 (cont) Schroder ISF North American Equity Sigma jcotlt)
Niirrit)er of shares Transferable Securities arid Markct % or Principal Moncy Market Instruments Admitted Va l~e Net Arriourit to an Official txcharige Listing USD Assets
United States of America (cont) 7.428 Capital One Financial 3 000 Capital Triist
10.792 Caterpillar 1,600 Central Pacific: ririaricial 3.300 CenluyTeI 1.600 Ceradyne
1 ,900 CH Energy 2.600 CH Robinson Worldwide 8.500 Chesapeake Crieryy 27.151 Chewon 8.200 Chuhh 2,600 Church R Dwight 7.800 Cibcr 2.900 Cimarcx Encrgy 6.000 Cincinnati Financial
500 CF Industries
18.613 Cisco Systems 50,014 Citigroup 8.537 Citi7ens Communications 1,900 City BankLynnwood 2.000 Clem 3.700 Clorox
12.500 CNrT Networks 7i,695 Coca-Cola
1,900 Colonial Propertics .Trust 22,820 Comcast
3,600 Comerica 2,400 Commercial Metals 5.400 Complete Production Services
77.946 ConocoPhillips 10,778 Consolidated Edison 31,300 Corning
6,800 Corus Eankshares 10.300 Costco Wholesale 5.050 Cowntry I lealth Care 1.600 CSF Systems International 7.700 CSX 4,100 CTS
71 045 CVS:Caremark 1.900 Cyrner 4.400 Cypress Semiconductor 0.660 Deere R Co.
4.336 Devon Energy 1.200 Diamond Offshore Drilling 3,000 Diodes
12.600 L>IHLCTV 6.803 Discover Financial Services 4.800 DKFI Network
19.117 Dow Chemical 5.700 DTr rnergy 7.800 Du Pont (E.1.) de Ncmours
3.000 Eastman Chemical
31.619 Dell
16,200 E'Trade Financial
10.337 Eli Lilly & Co. 15.624 Emerson Electric 7,300 Energy Transfer Partners 1.000 ENSCO Internatiorial 2.500 Entcrgy 3.500 t W Scripps 8.942 Exelon
68.993 Fxxori Mobil 2,800 Fair Isaac
10.534 Fcdcral National Mortyaye Association
5.100 re(irX 5.100 Fidelitv National Information Serviccr
284.567 59.580
/95.910 17.068
117.117 60.1 12 78.475 65,075
143.676 544.765
2.685.001 110.246 145,288
107,519 15ii.540
1.147.753 862,742 93.851 16./39 45.760
191,734 143.250
1,435,709 37.734
425.137 96.810 '30.824
197.370 2,102.771
414.091 133,985 32.436
723,fiiR 159.075 17.808
478.178 42.025
868.776 52.003
109,604 618.151 703.523 490,l 20 165.156 84.630
31 8.750 P7.317
134.596 677.339 236.2G5 337.987 50.220
20G,l30 4/1.4/1 752.608 1 01 ,936 322.720 794,300 115,650 603.054
5.97 1.344 58.868
219.10/ 303.975 188.547
49,842
0.20 0.04 0.56 0.01 0.08 0.04 0.05 0.05 0.10 0.38 1 .88 0.29 0.10 0.03 0.14 0.1 1 0.80 0.60 0 07 0.01 0.03 0.13 0.10 1 .0l 0.03 0.30 0.07 0.08 0.14 1.47 0.29 0.51 0.02 0.51 0.1 1 0.01 0.31 0.03 0.C 0.04 0.0O 0.43 0.49 0.35 0.12 0.06 c.77 c.05 0 09 0,47 0.1 7 0 9 3 0.04 0.14 c.33 c.53 0.07 c.23 0.91 0.10 0.42 4.18 0.04
0.15 0.28 0.13
900 Flowscrvc 124.326 0.09
Numher of shares Transferable Securities and Markel % or Principal Money Market Instruments Admitted Value Net Amoi.int to an Official Exchanae Listina LJSU Assets
United States of America (cont) 2.600 Frxiklin Resources 3.41 7 Freeport-McMoRan Copper & Gold 1.500 kronlier Oil 2,400 ri.iltor1 Financial 4.594 Gannett 1,100 Genentech 2,100 General Cable 5.900 (;enera1 Dyiiarriics
11 2.611 General Electric 8.800 Gerlerdl Mills 9,200 Geriworth Firiaricial 7,000 Geniyme
1 /,368 Gilead Scicnces 5.804 Goldmar Sachs 5.600 Coodrich 2.900 Gooyle 1,300 Gramercy Capital 5,339 I lalliburton 6,099 I larley-hvidson 1 ,100 Harris 4.200 I larsco 3,400 Hartford Financial Services 2.900 t - l a s h 7.900 HCC Insurance 6.200 Headwaters 1 .I 00 Heartland Payment Systems 2.000 Helix Enprgy Solutions 1 .500 I Ielnierich R Payne 2.400 Henry Schein
34.038 Hewlett-Packarcl 30.700 t iorne Depot 13,601 Honcywell lntcrnational 1,700 Horace hlann Educators 7.400 tiormel Foods
13.200 Host Marriott R Resorts 11.900 I-iuntington Rancshares 9,800 Illinois 1001 Works 3.700 infoGRDtJP
80.351 Intel 19,374 International Business Mactiines
300 Intuitive Surgical 1 ,805 Iowa Te1ec:orrirriiiriic:ations Services 3.200 iStar Financial 3,700 IXYS 4.800 .IB Hunt lransport Services 5.900 JER Investors Trust 2.800 John Wiley 8 Sons
40.435 Johrisori & Jotinsori 1.500 .IOS A Bdrik Clothiers
50.744 .IP Morgan Chase R Co. 6.200 Kellogg
13,600 Keycorp 8,700 King Pharmaceuticals
10.600 Kroner 5,500 Kulicke & Soffa lndustrics 3,800 Laboratory Corp of America 1.300 Lam Research
1 1.698 Lehman Brothers 3.500 Lexmark Intcrnational 2,600 Lincoln Nalional 4.400 Linear Technology 7.1 18 I ockheed Martirl
1.400 Lufkin Industries 2.400 M8T Rank 4.700 Manitowoc
11,700 Marathon Oil 400 Mastercard
23.448 Lowe's
219.002 397.431 106.425 21.812
101.160 79,997
1?5.034 491.352
7357.953 40i,l16 165.508 507,850 91 8.072
1.013.146 270.648
1,531.403 15.587
278.482 223.406 58,798
228.522 227.800 101,906 61,914 71.114 76.367 81.740
107.835 123,384
1.51 1.414 725.404 669.577 24.786
253.598 182.160 72.709
454,378 16.983
1,728,743 7,375,849
80,877 31.49/ 43,264 14.696
158,400 39.47 1
126,980 2,570,453
49.000 1.778.577
297.352 151.501 87,01 3
303.690 38.940
749.408 18.256
2B0.281 11 7,075 1P0.432 142.648 io9.095 489.360 11 7.600 171.768 151,293 5!3!3.?74 108,688
0.17 0.28 0.07 0.02 0.07 0.06 0.09 0.34 7.07 0.29 0.12 0.36 0.64 0.71 0.19 1.07 0.01 0.20 0.15 0.04 0.16 0.18 0.07 0.04 0.05 0.0? (1.08 0.08 0.09 1.06 0.51 0.47 0.02 0.18 0.13 0.05 0.3 0.01 1.21 1 .63 0.06 (lo? 0.03 0.03 0.1 1 0.03 0.09 1.80 0.03 1.75 0.21 0.1 1 0.05 0.2 1 0.03 0.17 0.03 0.1 8 0.08 0.08 0.10 0.50 0.34 0.08 0.12 0.1 1 0.42 0.08
I
I I
I I
I
I
I
I
i

Page 196 Schroder Irilernational Selection Furid Serni-Annual Report J i m 2000
I
’ Portfolio of Investments as at 30 June 2008 (cont) Schroder ISF North American Equity Sigma (cotlt)
Nunlher of shares Transfet-able Securilie:; and Market % or Priricipal Money Market lristrurrlerlts Admitted Value Net Arrioiiril to an Official Fxcharicie Lisliriu OS0 Assels
Number of stiilres Transferable Securities arid Market ?O
or Principal Money Market lnstrurrierits Adrriitled Value Net USU Assets Amount to an Ollicial Exchanqe L.istino
United States of America (cont) 11,300 Mallel 3,YW McCorrnrck 8 Cu. 1,300 EvlcDermott Iriterriational
16,777 M[;Uor%il(f:; 9.600 M(;Graw Hill
15.385 Mcdtronic 22,547 Mcrck 8: Co. 11.300 Met1 ife 7,800 Micrel 8.400 Micrt:rchip Technology
103.3 13 Microsoft
4.700 Mirarrl 1.800 Molitia Hcalthcare 3.900 Morisarito 7,306 Morgan Stanley
700 Morningstar 4,200 MPS 1,000 M 1 S Systcms
2,000 National Health Irivestors 6.500 National Semiconductor 3.000 Natural I<esourcc r’artncrs 1.300 NctFlix 3.594 Newmont Mining 4,300 Newporl 6.990 Nike 3.800 Noble Energ) 1 ,600 Nord::on 9,026 Norclstrorri
5.000 Northern Trust 8,900 NorthStar Realty Tiriarice 2.300 NTELOS 3,400 Nucor
300 NVR 8.91 8 Occidcntal Petroleurii 8,200 Ocwcn Financial 0.1 66 Omnicom
7,425 PACCAI 1 6.400 Paraii iemc Iccthtnology
3.300 Pattcrson 3,700 I’attcrson-UTI Energy 4.300 Paychex 3.600 Penn Virginia Resource Pdrtners 7,500 Pepsi Rottliriq
600 MicroStratcgy
13,300 National City
900 Nortolk :;oulhern
53,215 Oracle
300 Patriot (h i1
24,307 PopsiCo 85,920 Pfizer 5.200 Ptiarriiaceulical Product
Devdopn terl 466 I ’harMcrica
2C.710 Philip Morris Inlernational ?,ROO Piririxle Wpst Capital 4,l 110 Piorieer Drilling 1,000 Plexus 4.200 Plum Creek -irritjer 2,500 t’NC hiancial Services 7.000 Pt’L 1,000 Praxair
42.868 Proctcr 8, Gamble 5.700 Progress Encrgy 6.300 Prologis
7.700 Quicksilver Resources 1.500 Hanica-Gershenson Properties
22.925 QUALCOMM
800 Range Resources
200.236 139,932 80,RGO
‘345.018 3r,O,tl I2
79.384 253.308
2.854,:53($ 10.$’80
18 1,890 44. /I56
500.526 2158,203 51,513 43,444 38.080 63.707 5 1. :flo
133.1 05 119.700 50.
189. 50.
421.777 3/1 ,528 1 17.536 780.438 54.!43B
344.900 78.540
05 404.352 15b,.400 788,797 3 ~ 8 a
44,730 98.%08
132,201 135.794 98,552 709.823
1.553.94/ 1.553.518
776 10
1,031.97C; 86.868 80.72’3 28.120
178,793 t 4 5,0w 361,350 94.r7tjn
2.580.98i 236.892 339.060
1.048.523 105,240 90,823 31.874
0.14 0.10 0 06: 0.66 0.21 0.55 0.58 0.43 0.05 0.18 2 00 0 03 0.1 3 0.03 0.33 0.19 0.04 0.03 0.03 0.04 0 04 0.09 0.08 0.04 0.1 3 0.04 0.30 0.26 G.08 0.20 0.04 0.24 0.05 0.04 0.28 0.1 1 0.55 0.03 0 25 0 7:3 0.22 0.(18 0.03 0.07 0.02 0:10 0.07 0 15 1.09 1 S I 9
11.15 11.01 (1.12 0.05 0.06 0.02 (3.13
0.26 0.07 1.81 0.1 i 0.24 0.73 0.07 0.02 0.04
o.io
United States of America (cont) 1 8.9ti0 Reyioris Financial 3.a00 l’lcpublic Airways 8.000 Republic Sewices 1.800 Reynolds Arnericnn 8.100 Hockwell Colliris 7,300 I4otirn 8, Haas 4.400 Ross Storcs 4.200 Rowan 6.800 I IN; 2.000 Fiyder Sislani
111.400 :;ateway 10.884 Sctilurritwryer 1
1.500 SEACOF 3.100 StlRIWIII Willlams 1.DOO Simon Property 2.400 :.;kywe:;l 7.147 Smart Modular Tectiriolouies WWH
182,182 34.580
237,520 714.360 ?91 ,G41 316.020 160.116 lg4.712 1 05.4d2 139,B40 305.552 , I 52,6 1 s 134.8:50 25:. 159 177.558 31.704 29.21 1
3.900 >;milti Intcrnational 9.200 Soapstor is Nelworks 7,800 South Financial 5.7110 Suuthcrn 1.700 :;oultncrn Copper 1.867 Spansiori
13.1 00 Sprint Ncxtci 1 1 ,800 St .Jude Medical 2.000 Standard Parkiriy 2,300 Stanley Works 3.900 :;vale Strcct 5.400 Stryker 2.gW Suburban Propane Parlriers 2.200 Sunoco 3,054 SuriTrusl Banks 1.800 Sybasc 4.700 Syriiversc 5,800 T Rovx Price 4.500 I C f financial 1,400 Tectnne 2.900 lecti,well 5.11110 Terex 7,800 Terra Industrics
21.588 Texas Iristnmerils 7.600 Textinn
7.Y00 Total Systerri Services 4.102 Iransoccan
?.GO0 lrico Marine Sewices 1 ,900 Tupperware Brands 7.700 Union Drilling 7,700 I J tiionBanCal
1,f$00 Unitcd Online 7.531 United Parcel Service
14.1 00 Travelers
700 Unit
15.658 United Tet:thrioloyics 18.784 IJriitetWeullti 3 1 ,46Y IJS Raricori) 4.400 USA tvfobility 4.f00 IJSI 8.300 Valero Erieryy
4,800 Vafian Mcdical Systems 3Y.320 Veri7ori (:orrirnunicatiotis 14.1 00 Viaconn
500 Valmont Industries
5,200 Viropharma 1,900 w. H ~ I I ~ I ~ ~
??.?YG Wachovia 31,378 Mil Marl Storcs
31 1.2913 13,050: 30,888
198.251 185,028
4.294 110,121 478.372 30.400
130.123 249.83Y 331’1,204 110.780 8P.456
187.200 34,216 66,696
327,707 55.Y80
110,110 3s.902
256.650 140,980 701.31 7 3ti4.208 3U.007 304.195 176.844 640.805 624,630 72. ,‘00 G3,460 47.828
11 2,968 58,753 18.018
454.571 957,487 475.567 890,887 33,610
249,504 339.660 51,300 246.864
1 348.06 1 430.896
57.044 47.443
3ti1,641 1,766,469
0.13 0.02 0.17 0.15 0.20 0.?4 0.1 1 0.14 0.07 0.10 0.91 0.81 0.09 0.1 9 0.12 0.02 0.07 0.72 0.01 0.02 0.14 0.1 3 0.00 0.08 0.33 0.03 0 08 0.1 7 0.24 0.08 0.05 0.1 3 0.04 0.05 0.23 0.04 0.08 0.03 0.18 0.10 0.49 0.26 0.28 0.28 0,12 0.45 0.44 0.06 0.04 0.03 0.08 11.04 imi 0.32 0.67 0.33 0.62 0.02 0.1 7 0.24 0.04 0.1 7 0.94 0.30 0.04 0.03 0.75 1.24
I
I
I
I i
I I
j
i I
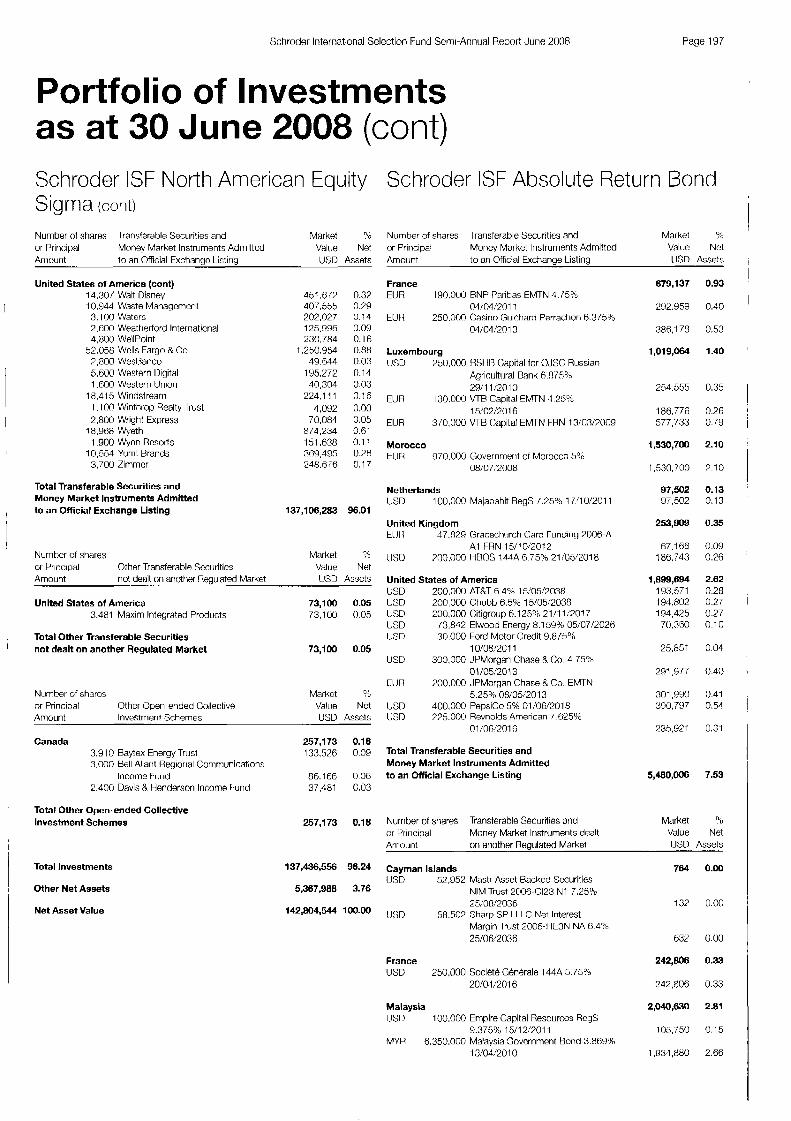
Schroder International Selection Fund Semi-Annual Rennrt June 2008 Page 197
Portfolio of Investments as at 30 June 2008 (cont) Schroder ISF North American Equity Schroder ISF Absolute Return Bond Sigma (cont)
Number of shares lrarisferable Securities and Market ?C Number of shares Transferable Securitics and Market 75 or Principal Money Market Instruments Admitted Value Net or Priricipal Money Market Instruments Admitted Value Net Amour it to an micial Exchange Listing IJSD Assets Amount to an Official Exchango Listing lJSD Assets
United States of America (cont) 14.307 Walt Disne\j 10.944 Waste Managcmcnl 3.1 00 Watcrs 2.ti00 Weatherford lnternaticnal 4,800 WellPnint
52.058 Wclls Fargo B Co. 7,800 LVesl3arico 5,600 Western Digital 1.600 Western Union
1,100 Winthrop Realty trust 2.800 Wright Express
1,900 Wynn Resorts
3.700 Zimmcr
18.41 5 Windstrearri
18.968 Wyeth
10,5+i Yitirn! Brands
Total Transferable Securities and Money Market Instruments Admitted to an Official Exchange Listing
Number of shares or Principal Other Transferable Sccuritics Amount
United States of America
not dealt on another Rqpilated Market
3,481 Maxim Integrated Products
Total Other Transferable Securities not dealt on another Regulated Market
Number of sharcs or Principal Othcr Opon-ended Collective Amount Investrrierit Schemes
Canada 3.91 0 Baytex Energy Trust 3.000 Bell Aliarit Reglorial Communications
Income h i t i
2,400 Davis & Henderson Income I urid
Total Other Open-ended Collective Investment Schemes
Total Investments
Other Net Assets
Net Asset Value
461.877 0 . 3 407,hSS 0.79 202.027 0.14 125.996 0.09 230,784 0.1 A
1.250.954 0.88 49.644 0.03
195.272 0.14 40,304 0.03
224.1 11 0.16 1,092 0.00
70,084 0.05 874,234 0.61 151.838 0.11 369,4$5 0.76 248.676 0.17
137,106,283 96.01
Market 3 Value Net USD Asscts
73,100 0.05 73.100 0.05
73.100 0.05
Markct "L. Value Net USU Ass&
257,173 0.18 133.526 0.09
86.166 0.06 37.181 C.03
257,173 0.18
France EUR
tUt4
190.000 RNP Paribas EMTN 4.759
250.000 Casirio Guctiard Perrachon Fi.37572 04/04/1011
04/04!2013
Luxembourg IJSD 750,000 HSI I l l Capital for OJSC Russian
Agricultiiral Bank 6.875% 29/11/2010
130,000 W B Capital EMTN 425% 15/02/2016
3/0,000 VTB Capital EMTN FRN 13:03:7009
ELF
EUR
Morocco t t J l < 970,000 Governmerit of Morocco 5%
08/07,'2008
Netherlands IUSD
United Kingdom
100,000 Majapahit Regs 1.254'2 17/10/2011
t l l l i
IISTI 700.000 HHOS 1 4 4 ~ ~.75:/~ ~ I M W O I ~
United States of America USD 200.000 AT&T 6.4% 15/05/2038 USD 200,000 Chtibb 6.5?0 15/05/2038 LJSD 200.000 Citigroiip 8.12596 21/11/7017 USD USD
USD
Tt JR
lJSD 400,000 PepsiCo 5% 01:06/2018 tJSD 775.000 Reynolds American 7.@5%
/3.842 Elwood Energy 8.1 59% 05/07/2028 30.000 Ford Motor Credit 9.815%
10!08:2C11
OliO5:2013
5.2S?h 08/05/2013
300.000 JPMorgarr Chase R Co. 4.75%
700.000 JPMorgan Chase R Co. EMTN
01 /OR;2nl 6
Total Transferable Securities and Money Market Instruments Admitted to an Official Exchange Listing
Number of shares or Princi[)al
Transferable Securities and Moriey Market Iristruments dealt
679,137
292.859
386.1 78
1,019,064
254.555
186.776 577.733
1.530,700
1.530,700
97,502 97,502
253,909
67.lti6 186.743
1,899,694 193,571 194.802 194.425 70.360
25,851
291,977
301,?90 390.797
735,971
5,480,006
Market Value
0.93
0.10
0.53
1.40
0.35
0.26 0 79
2.10
7 10
0.13 0.13
0.35
0 on 0.26
2.62 0 28
0 27 0 10
0.04
0 40
0 41 0.51
0.31
0.21
7.53
U'U
Net Amount on anottier Regulated Market lJSD Assets
137,436,556 96.24 Cayman Islands 764 0.00 IUSD 52.952 Mastr Asset Backed Securities
NIM Trust 2006-C123 N1 7.25?4 5,367,988 3.76
142,804,544 100.00 25/08,'2036 137 0.00
58.507 Sharp SP I I I C Net Interest Margin Irust 2006-Ht3N NA 8.4% 25!06:2036 63% 0.00
France 242,806 0.33 USD
20!01!2016 242.806 0.33
Malaysia 2,040,630 2.81 IJSD
9.375% 15/1 2/7011 105,750 0.15 MYR
250,000 Societe Generale 144A 5.75?<
100.000 Empire Capital Resourccs RcgS
6.350.000 Malaysia Sovcrnmenl Bond 3.869% 1 3/04/2010 1,934,880 2.66
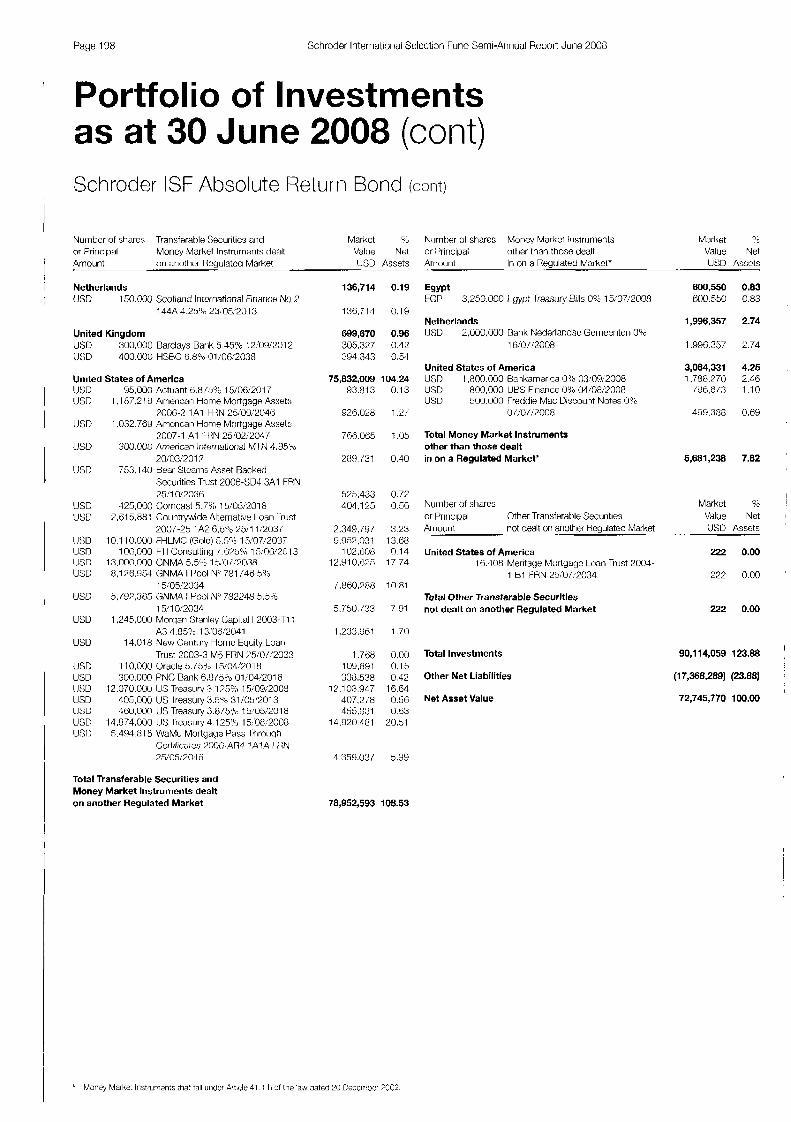
Page 198 Schruder Internatlorial Selectix Fund Semi-Annual Reporl June 2008
Portfolio of Investments as at 30 June 2008 (cont) Schroder ISF Absolute Return Bond icont)
Number of shares Trarisferatile Securities and Marhct % or Pririq)al Moncv Market Instrurrierits cleul! Value Net Amount or1 another I kyulatcd Market US0 Assets
Netherlands USD 150.000 Scotlaid International Firiarrce NO 7
144A 4.25% 23,'05120 13
United Kingdom US11 300,000 Barclays Barik 5.45% 12:0'3:2012 [JW 400.000 HSBC 6.8% 01:0&'2038
United States of America [JSD 95,000 Actuant 8.8/:& 15:Oii:2017 USn 1 .I 87.21 0 Arriericnn Home Mortgage
?006-7 1 A l HiN 25:0'3:20 IJSD 1,032.769 Amcncan Home Mortgage
2007-1 A I H IN 25,W?204 / IJSU
20:'032017 USD
Securities Trust 2005-SL34 3A1 FHN 25.'10:2038
300.000 American Iriterriulitlnal MI N 435%
753.140 Bear Slcarns Asset Backed
LJSD 425,000 Corricast 5.756 15:052018 US0
L J W tJSD
7,515,881 Countryvide Alterriative I om .Inist 2001-23 1x2 6.6% 75:l 1:2037
10.1 IO.000 FHLMC (Gold) 5.5"s ; 15:07:2037 100,000 11 I Consulting i.U%?,,, 15:0fi!2013
tm I ~ . ~ O G . O O O CNMA 5.5". 15xi;7030 US0 0,196,954 (;NMA I 1'001 Nu 781 143 3%
15:05:2034
131 0/2034
A3 4.85"~ 13'06/2041
USD 5,/9P.:365 GNMA I Pool N' 782218 5,>h
LJSU
USD
1,245,000 Morqari Stariley (hpital I 2003-T11
14.018 New ( . h i t i i r ) Home Equity Loan Trust 2003-3 M5 FRN 75:0/:2033
LED 405,000 US lrvdsuiy L J X 460.000 US Treasury USD IUSI)
14,874,000 IJS Ireasury 4.125?; 15:08:2008 5.494.815 WaMu MortSage Pass I hfoiigh
Certificatsy 200O-AR4 IA IA FHN 25:05:204u
Total Transferable Securities and Money Market Instruments dealt on another Regulated Market
136,714 0.19
136.714 0.19
699,670 0.96 305.327 0,42 394.343 0.54
75,832,009 104.24 93.013 0.13
926.028 12i
756.065 1.05
281). i31 0.40
525,433 0.77 404.125 0.56
2,349,797 :3.23 9,952,031 13.88
102,3013 0.14 12,910,<575 17.74
i,860.248 10.81
1.2Li3.Ytil 1.70
1.758 0.00 10'3,891 0.13 308.538 0.47
1%.103.947 16.64 407.2/8 0.56 455.031 0 53
14.920.481 20.31
78,952,593 108.53
Ni.irrit)er oI %harm of Principal Ariioiirit
Money Market Iristruments ott ier than those dealt in on a Reyiilated Markel'
Egypt FGP
Netherlands lJSD
3,250,000 Lyypl k e m q Bills 0% 15:07:2000
2,000,000 Uarik Nedeflandsc Gerneenteri 0% 1 8:0/:2008
United States of America USD 1,800.000 Bankamerica 01; 03:09:2008 US0 800,000 IJBS Finance 0'J.i 04/08:%008 USU 500.00(:) rreddie Mac Uiscount Notes 0%
0/,0i:?000
Total Money Market Instruments other than those dealt in on a Regulated Market*
Market B Value Net I K D &Sets
800,550 0.83 ROO.550 0.83
1,996,357 2.74
1.996.357 2.74
3,084,331 4.25 1.704.270 2.46 /96.8/3 1.10
449.388 0.89
5,681,238 7.02
Number of shares Markct 96 or Priricipal Other Trarisferable Securities Value Nct Arriour i t not dealt or1 ariolher tieyulatcd Market tJSD Assets
United States of America 222 0.00
1 Bl CHN 25.'0/:2034 222 0.00 15:108 Meritage Mortynye Loan Trust 2004-
Total Other Transferable Securities not dealt on another Regulated Market
Total Investments
Other Net Liabilities
Net Asset Value
222 0.00
90,114,059 123.88 I (17,368,289) (23.88) '
I 72,745,770 100.00
I
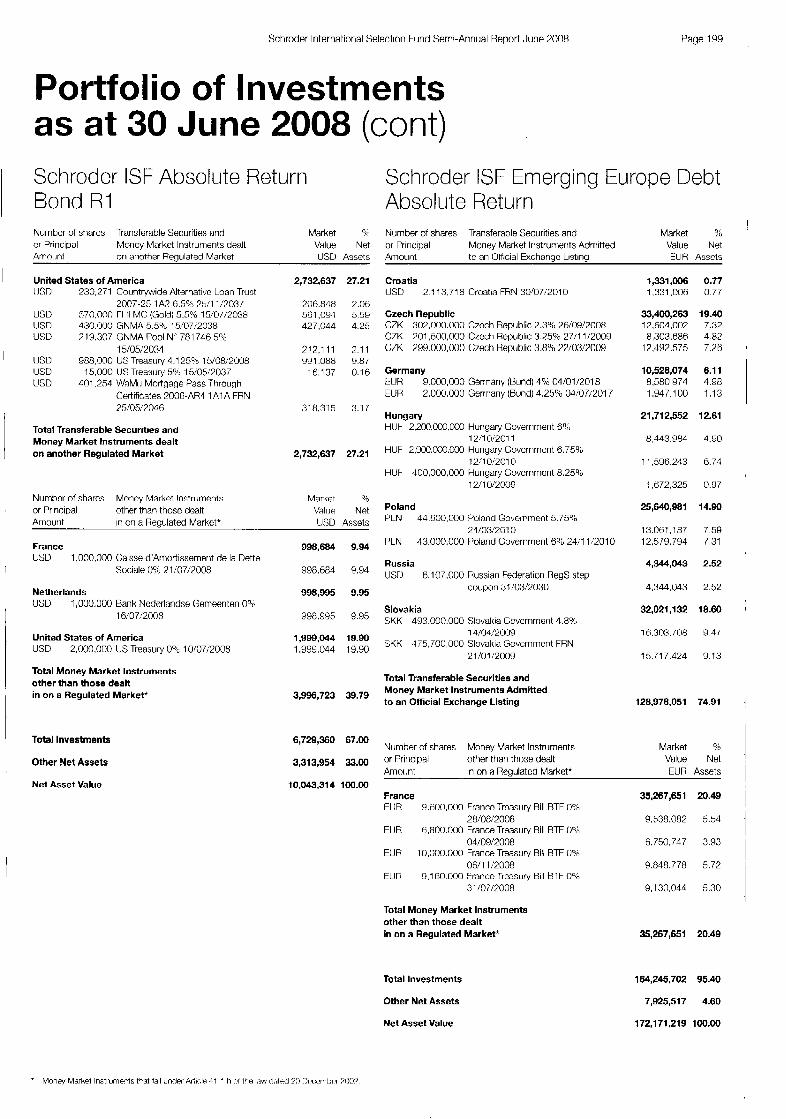
Schroder International Selection Fund Semi-Annual Report June 2008 Page 199
Portfolio of Investments as at 30 June 2008 (cont) Schroder ISF Absolute Return Schroder ISF Emerging Europe Debt Bond R1 Absolute Return Number of shares Transferable Securities ancj Market ?C
or Principal Moncy Market Instruments dealt Valire Net Amounl o r1 ariother Regirlated Market USD Assets
Numher of shares Transferable Securities and Market 46 or Priricipal Money Market Iristruriierits Admtted Value Net Amount to an Official Exchangc Listing EUH Assets
Croatia USD 2 11 3.71 8 Croatia FRN 30'07:2010
1,331,006 0.77 1.331.006 0.77
33,400,263 19.40 12.ti04.002 7.32 8,303.686 4.82 12.492.575 i.26:
United States of America t JSD 730.271 Countiyjdide Alternative Loan Trust
2007-25 1A7 R.54i ?t:11,'703/ usu 570.000 ri ti MC: (c;[M) 5.50.6 i~i:o/:2038 tJS0 430.000 GNMA 5.5% 15!07!2038 lJSD
tJSI1 USD USD
719.307 GNMA Pool N' 781 746 5'.6
988,000 US Treasury 4.1 259.0 15/08:2008 15,000 1 6 Treasiiry 5% 16'05:?037 401.254 WaMii Mortgage Pass Throtioh
15/05/2034
Certificates 2006-AR4 I A I A FRN 25/05/7046
Total Transferable Securities and Money Market Instruments dealt on another Regulated Market
2,732.637
206.848 581.0'31 427.044
212.1 11 99 1.088 16,137
318.315
27.21
2.06 5.59 4.25
2.1 1 9.87 0.16
3.1 7
Czech Republic CZK 302,000.000 Czcch Republic 2.3% 26/09/2008 C7K 901,600,000 Czech Republic 3.3504 27:l 1!2009 C7K 29~1.000.000 Czech Republic 3.8% 22i03:2000
Germany tUH EUR
Hungary HIJF 2.200.000.000 Hungary Government 6%
HUF 2.'%32.000.MK) Hungary Covcrnmcnt 6.759:
HUF 400,000,000 Hungary Covcrnmcnt 8.259;
9.000.000 Gerrnariy (Bund) 4% 04/01/2018 2.000.000 Gerrnany (Burid) 4.25% O4:07:2017
124 0901 1
12:10!2c10
12/10:2009
Poland PLN 44.600.000 Poland Government 5.7%
PLN
Russia tJSE
21/03:2010 13.000.000 Poland Government 64: 241 1 :2010
6.107.000 Russian Federation Regs step coupon 31 :03!7030
Slovakia SKK 493.000.000 Slovakia Govcrnmont 4.896
SKK 475,700,000 Slovakia Government FRN 14/04/2009
21!01/2009
Total Transferable Securities and Money Market Instruments Admitted to an Official Exchange Listing
10,528,074 6.1 1 8580,974 4.98 1.947.100 1.13
21,712,552 12.61
8,443,984 4.90
1 1,596.243 6.71
1,672325 0.97
25,640,981 14.90
13.061.187 7.59 12,579,794 1.31
4,344,043 2.52
2,732,637 27.21
Numhcr of shares Money Market Instruments Market or Principal other than thosc dcalt Valuc! Net Arriourit in on a Regulated Market' US0 Assets
France USD 1 ,000.000 Caisse cl'Amortisserrierit de la Dette
Sociale 096 71 /07:7008
Netherlands USD 1,000,000 Bank Nedcrlnndse Gemeenten 0%
16/07:2008
United States of America USD
Total Money Market Instruments other than those dealt in on a Regulated Market*
2.000.000 LIS Treasury 0% 10!07;2008
998,684 9.94
990.604 9.94
998,995 9.95
G98.995 095
1,999,044 19.90 1.999.044 18.90
4,344,043 2 52
32,021,132 18.60
16,303,108 94/
15.717.424 9.13
3,996,723 39.79 128,978,051 74.91
Total Investments
Other Net Assets
Net Asset Value
6,729,360 67.00
3,313,954 33.00
10,043,314 100.00
Number of shares or Priiicipal Amount
Money Market Instruments other than lhose dealt in on a Rcoulatcd Market*
Market ?b Value Net EUR Assets
France EUH
EUFi
EUR
E1117
tl.ii00.000 Francc Treasury Bill BTF 09:
6,800.000 France Treasuty Bill BTF 0%
10,000.000 France Treasury Bill BTF 0%
9.1 80.000 France Treasury Bill B I F 0%
28:08:2008
04/09!2008
06/11 :2008
31 /07/7008
Total Money Market Instruments other than those dealt in on a Regulated Market*
35,267,651 20.49
9,338,082 5.54
6,750,747 3.93
9.848.778 5.72
9,130,044 6.30
35,267,651 20.49
Total Investments
Other Net Assets
Net Asset Value
164,245,702 95.40
7,925,517 4.60
172,171,219 100.00

Page 200 Schroder lriterriatiorial Selection Fund Semi-Aririual Report June 2008
Portfolio of Investments as at 30 June 2008 (cont) Schroder ISF Emerging Markets Debt Absolute Return
Nurriber of stiares Iranstcrablc Securities and Market ?5 or Priricipal Money Market lnstrurrierits Adriiilted Value Net Arnount to an Official rxctiarige Lislirig IJSO Assets
China El JR 57,900,000 Peoples's Hepublic of China 4.238
78:10:T014
Czech Republic CZK 805,500.000 Czech Republic 2 . 3 5 26:'09:2008 CZK 537.000.000 Czcclh Hcpublic 2.33% 18.'10:2010 CZK 1.93o.ooO.003 Czech Republic 3.25% 2 CZK 1.855.ooO.003 (.:7ectl He~Xhlic 3 8% 22
Hong Kong SAR HKD
t1KD
50.000.000 Hony Kong Covcrnment 3.59~
42,000.000 Hong Kong Goverrirrierit 3.51 ?C
22,'0u:2015
08:12:2014
HKD
HKD
HKU
I IKD
HKU
HKD
t K D
80,000,000 t-ioriy Koriy Government S./HYb
50,000,000 Hong Kong Government 4.0495
80.00C.000 Hong Kong Goverrirrierit 4.339,
50.00C.000 Hong Kong Government 4.82?'0
80,000.000 Honq Korig Goverrirrieril 4.83Ct
72.00ci.000 Hong Korig Goverrirnent 4 85%
49.G88,000 Hong Kong Governmerit Reg:;
06; 1 2:20 1 ti
30/05:20 1.1
0/;1?:7015
c)7/06/7014
07,0D;2016
w/06:2017
5.1 25?3 01 m '7014
Hungary HUF 223S.Oi~0.500 I lurigary Gowrrirrierit 6,5c,u
17:08;7008 tUH
0211 1 /2012 1.fi:K) Hungab Go-errirrierit FI IN
Indonesia IUH 1dYiX.KXK Indonesia Foverririieril 10%
15'07:'20 1 7 IDR .YX;(XK1 lndoncsia Government 10.75??,
15:07:2022 IDR
1 5 1 1 :2020
15,08:2023
15m:7O13
15;08:202 1
15:06:2022 Indonesia Hccapitalization Bond 13 1 ° C ' 1'
Indonesia Recapitalizatiori Rcmd
187~iYl~lk'jtKC lridoriesia C;ove~~.in~rht 1 1 ?;
.LOX Indonesia Goverrirrierit 11 .75%
!-Wl Indonesia Goverrirrierit 12 5%
IDH lS~Vil?CW.CK Indonesia Goverrirrwnt 12.8%
W X X ) lndoncsia Government 17.9%
L . LJ,U d:o1:2012
i 3.1 753 i 5 ; o i : m 2
Malaysia
1 3:o7:mi 1 tJSU 5.855.000 Malaysia Government 8.7
USD 5.720.i)00 Prime Venture I.at)wiri 19'0
tJSD
111 ;00,2009
16.400.000 Rafflesia Capital variable 04A 0;2011
84,454,807
84,454.007
335,666,378 5P,985.422 33,865.21 u
126.658.057 177.15R.088
129,694,989
u.4 77, ti90
5.347.fl70
10,32i.9UU
10,55?,3iji
6.575.548
1 0,9~0,Gl5
6.94?,84:?
11,2!29,l8l
10.?30.G54
30,812,990
89,303,963
18.BF7.915
70,636,048
173.91 5,632
16,873,281
A,Or?9.556
17,289,039
13.421.831
41,750.312
19,327,797
Y. 142.Ei70
37,472.360
10.362.777
80,902,454
I 1 .0tiY.400
33. IYH.070
i .1 OK772
7.855.000 19.052.212
1.83
1.83
7.29 1.15 0. i 4 2.75 2.u5
2.82
0.14
0.12
0.22
0.73
0.13
0.24
0.15
0.23
0.22
1.10
1.94
0.41
1.53
3.78
0.37
0.18
0.38
0.29
0.90
0.4 1
0.71
0.81
0.23
1.76
r m
0.73
r).i5
0.1 i 0.41
Nurrit)er 01 :;hares Transferable Seciirities arid Market $0
or Principal Money Market Iristrurneints Adniittcd Value Net Amount to ari Official txchanac Llstlna LJSD Assets
Mexico EUR
t U f i
FUR
USD
10,000,000 IJnited Mexican States 5.37546
21.400.000 United Mexican States 8%
34,500.000 Uriited Mexican States 8 25%
20.000.000 IJriiteti Mexican Statcs 8,3/5%
1 0:00:2013
23Xl7/7008
?4/02:2009
13:01 i2011 USU 5.000.000 Ilriiteri Mexica~) States 9.875%
08:03:2010
Poland W? 31.500.000 Poland Fowrrirrierit 5.5?;
PILN 508.000,000 Poland Government 5.75c/~
PLN 260.000.000 Poland Government 8?5 24:l 1:7010 t l J l i 37,000,000 Polarid (;ownment EMTN 3.8/5%
17m3:2012
24:03,'?010
15:01/2009
Singapore <;GD 9.400.000 Keppel ILarid 2.5
South Korea USD
KljL'V 79 0 @ O . c ' C X K Korea lreasury Bond 1,75?"
5,500,000 I lyriix :;emiconductor Zero Coupon 29:09:201 1
10~12:200Y Korea Treasury Uorid 5% 10;09:2018
10:09:2012 Korea Trcasury Borid 5.5% 10!0Y/201 I
64,300,000 Hepublic of Korea ,1.25ut 01!06:2013 LJSD
Taiwan lJSD 7.ti33,000 Advarir;ed Semiconductor
IJW tJSD USD t J X
Engineering O?G 75~09i2008 6.;60.01i0 AU Optroriics HegS 096 26:l 1;2009 1 ..150.000 Chi Mei,Taiwari 0% 18;12:201 1 9,t;DO.OOO Compal Electronics 0?0 19/08:2010 1 ,925.000 lnterriatiorial Bank 0 1 raipcl 0%
22:1 2:2009
17~06:200(3
74:01 :2010 I wD 1,755.000 000 laiwan Govcrnment 1.8/546
rrirrierit 2 % 20,'07:20 I O
USD
Total Transferable Securities and Money Market Instruments Admitted to an Official Exchange Listing
5.8t70.000 Walsin Lihwa 0% 14:l 1 :7011
96,594,771
15,506,952
17,779,305
28,300,275
21 ,823,000
5.448,000
8.13G.23Y
462,200,790
49.822,45!5
?34.481.753 119.888.014
58,008,467
6,945,792 G,945,792
232,701,719
5.8~13.186
71,891,34Y 37.470.043
22.654.970
29,008,806: 67,830,359
295,250,569
8.791.420 7.225.088 1,675,455
1 1 .01 7,066
2.037, 102
1,794.604
12,803.185
55,t765,649 135,339,201
37.897.925 5,843.862
1,987,631,864
2.10
0.34
0.31
0.g1
0.18
0.12
0.1n
10.04
1 .0Y
5.09 2.60
1.26
0.15 0. I5
5.05
0.13
1.63 0.81
0.48
0.63 1.36
6.42
0.19 0.1 t7 0.04 0.74
0.04
0.04
0.28
1.21 3.38
0.71 0.13
43.18
I
I
I
I
i I
I I i
I I I

Schroder lnternabonal Selection Furid Semi-Annual Report June 2008 Page 201
Portfolio of Investments as at 30 June 2008 (cont) Schroder ISF Emerging Markets Debt Absolute Return (CotIt)
Nurritm of shares or Principal Arnount
Money Market Instruments other Ihan those dealt in on a Requlated Market*
Market % Value Net USD Asscts
Number of shares Transferable Securities and Markel :h or Principal Money Market Iristrurnents dealt Valuc Nct Arrioi irit on another Regulatcd Market IJSD Assets
British Virgin Islands USU 1,855,000 Beijirig rriterprises Investment 0%
21!12,’7010
Malaysia MYR 21 5 000.000 Malaysis Goverrirnent 3.81 4%
MYH 230.600.000 Malaysia Governrncnt 3.869%
MYH 256.000.000 Malaysia Goverrirrierit 4.30595
MYR 170.000,000 Malaysia Govcrnmcnt 6.45%
MYR 4?2.000.000 Malaysia Govcrnrncnt 7%
15:07/2017
13iO4i2010
27i02/2009
01!07:?008
15/03/2009
Mexico I K D 9,000.000 IJnited Mexican States 4.625%
ow1 0;2008
3,146,637 0.07
3.116.637 0.07
397,134,244 8.63
61.610.406 1.34
77.707.715 1.50
18.673577 1.71
52.027.511 1.13
132.110.902 2.87
9,027,450 0.20
!?,02;,450 0.20
47,015,537 1.02
13,425.465 0.29
14.316.980 0.31
19,273,097 C.47
422,364,407 9.17
143.589.078 3.12
45,185,075 0.W
122.705,4t30 ?.R5
11 1,384.774 7.47
United States of America (cont) USD 11 0.000,000 I I:; Treasury Bill On& O N 1 1 /XI08 109.319.?46 P.3i tUSD 11 3.000.000 US Treasury Bill 09” 13:1 1:2008 112.172.130 2.11
Total Money Market Instruments other than those dealt in on a Regulated Market. 1,605,783,258 34.88
Nurritier of shares Market % or Principal Other Transferable Securities Value NeI Amount not dealt on another Regulated Market USD Assets
British Virgin Islands 9,009,387 0.19 5.866484 O . l ? CI iF
ElJn 15.000.000 NK Debt MTN 0% 12:03:2010 3,142.903 0.07 73.000.000 NK Debt rMTN 0% 1?/03QOIO
Total Other Transferable Securities not dealt on another Regulated Market 9,009,387 0.19
Philippines PHP 800.000.000 Philippinc CovcrnmenI5.5%
PHF’ 601 ,000,000 Ptiilippine Goverrirrierit 8.5%
PHP 81 0,000,000 Philippine Government 8.75%
21;02;2010
03,’03,’7011
03:03:2013
Singapore SGD 197,700.000 Singapore Government 2.375%
01 ’10,?009 SGD fi0.000.000 Singapore Government 2.62595
01 :04:2010 SGD 163.000.000 Singapore Chverrirnerit 4.375%
1 5iO 1 :2009 SGD 151 500,000 Singaporc Governmerit 5.D25%
01 :07:2008
Total Transferable Securities and Money Market Instruments dealt on another Regulated Market
Total Investments 4,481.1 12,784 97.34
Other Net Assets 122,421,806 2.66
Net Asset Value 4,603,534,390 100.00
078,688,275 19.09
Number of shares or Prirwpal
Moncy Market Instruments other than those dealt
Market ?> Value Net USD Asscts Arnouit in on a llegiilated Market*
36,855,735
3R,855.735
248,l 05,586 90.701 ,951
157.903.635
1,320,821,937 113.903.267 749,581,375 227,553,732 100,710.71 1 209.487.301 86.590./?1 102,173.151
0.80
0.80
5.39 1.96 3.13
28.69 2.4 I 5.47 4. $91 2.39 4 55 1 .A8 2.23
France EUR 23,500,000 r-rarlce Treasury Bill BTF 045
11,’08:2008
Mexico MXN 99,000,000 Mcxico Cetes 0% OR:04/2009 MXN 172.000.000 Mexico Cetes 04.0 12:02;2009
United States of America USD 114.000.000 US Ireasury Dill 0% 17/07;2008 USD 250,000,000 US Trcasury Bill 0% 31!07:2008 IJSII 228.000.000 US Treasury Bill 0% 07/08:2008 IJSD 11 0.000.000 IJS Treasury Bill 06 0/1:09!2008 USD 210,000.000 US Treasury Bill 0?C. 11:09’2008 US0 87.000.000 US Ireasury Bill 0% 1R:10:20Ot3 IJSII 103,000,000 US Treasury Bill 040 23i102008

Page 202 Schrodcr lnterriatiurial Selection Fund Scmi-Anriual Heport June 2008
Portfolio of Investments as at 30 June 2008 (cont) Schroder ISF European Absolute Return
Nurniber of share:; lranstcrablc Securities arid Market SO or Principal Money Market Iristrurrierit:; Admitted Value Ne1 Arriounl to an Official rxc:h;rriye Li~l i f iy TLJR Asselt;
Belgium 29,5H/ Grwpe Druxslles Lambert
Denmark 544 AI' Moller Macrsk
Finland 204,502 Nokia
France 42,359 Alslorr 71,892 BNP Paribas 75.488 t w 17,100 Lalarye
10 1 X2 1 Societe Generale 143 878 Suez 155.?94 lola1 729.943 Vivendi
Germany 76.1 33 Allianz 54.930 Deutsche m4I !k
170.157 Deutsche Post 488.i)Jl Oeutsche Telekom
50.981 t.ON 97.20C Arcandor 26,104 MAN 82,083 Metro 88,380 Siemens
Ireland 313.823 Bank of Irclard
Italy 380.YYij Fiat
Luxembourg 91.713 ArcelorMittnl
Netherlands 69.183 Akzo Nobel
753.849 INC Crocp 2 1 1 ,Y% Koninkltlke Ahold 480.331 Royal Dutch Shell 119.273 SBM Oitshore
Spain 568,599 k 3 r l ( : O Sarilandei
Sweden 332,189 Alfa Lava1 388.157 Nordw Bank 158,516 Tele:!
II137.Y07 TeliaSonera
Switzerland 306,610 Nestle Registered 275.808 Novartis Registered 78,609 Roche 21 . Y / i Syngenta Registered
775,770 UBS Registered
United Kingdom 11 7.11'3 Anglo American 91 5,4$10 BAt Systems
342.850 RG 1.845.?0? nart;l;rys
37'3,523 EP 1.233.593 (;srilr!ca
/33,16l (;laxo:;rriittiKline
2,222,280 0.78 7.222 250 0.78
4,172,l 68 4.172.188
3,138,595 3.1 38.595
42,803,553 tj,lfi2.387 4 .ZY 3.93:3 4.1t15.31 0 1,538.593 3.589.474 6,158.31 I 8.944.058 5.523231
38,724,914 8.161,422 3,021 150 2,199,083 4.870.024 7.515,!349
715.,138 1,830.935 3.3W.731 ~, 188.1 04
1,743,287 1.713,28/
3,757,968 3. ;5/ .$It38
5,763,245
25,366,955 3,007.385 S.08/.134 1.808.8P5
12.707,519 2.757.597
6,652,608 5.652.B08
14,605,675 3,243,545 4.175 0.13 1,930,870 3.24Y.71 i
35,434,275 8.010.777 9, 882 .000 8,880.308 4.344.193 Y./11.047
74,436,781 5,22i,881
4,794.089
1.46 1 ,A8
1.10 1.10
15.02 2.16 1.51 1 .!jf< 0.5; 1 9G 7.1 ij 3.14 1.94
13.58 2.96 I .08 0.90 1.71 2.84 0.25 O.(i4 1.17 2.1 7
0.61 0.K
1.32 1.32
2.02 2.02
8.90 1 .06 1.70 0.63 4.36 (I.!>/
2.33 2.33
5.12 1.14 1 .48 0.68 1 .R4
12.43 3.10 3.40 3.1 1 1.52 1.30
26.10 1.83 1 . i 8 2 38 1 .95 0.9i 1.58 3.86
Ni.niher ot sharcs Transferable Setxrilies and Market 96 or Principal Moriey Market Instruments Admitted Valuo Net
tUH Assets Amount to a r i Ollicial txchange Listing
United Kingdom (cont) 43FJ.JDB Lcyal &General
2,414,558 Royal Bank of Scotland 385.995 Prudentid
?I 6,131 Scottish &Southerr1 rriergy 548.221 Tesco 3.10.1 83 Uriilever
3,158,693 Vodafone
Total Transferable Securities and Money Market Instruments Admitted to an Official Exchange Listing
5,723201 7-01 3,273348 1 .I 5
3.82/.238 1.34 2.520.386 0.88 0.075.597 2.13 5,889,051 2.07
6,482,245 2.27
258,822,304 90.77
Number of shares Market ?! Value Net or Principal EUR Assets Amount Uerivatives
United Kingdom 43,486 0.02 395.400 Barclays Rights 1 /!07:2004 43.488 002
Total Derivatives 43,486 0.02
Total Investments 258,865,790 90.79
Other Net Assets 26,274,576 9.21
285,140,366 100.00 Net Asset Value

Schroder Iriterrmtional Selection Fund Scmi-Annual Repnrt June 2008 Page 203
Portfolio of Investments as at 30 June 2008 (cont) Schroder ISF Euro Bond
Numbcr ot share:: Trmsferatile Securities and Market ?b or Friricipal Money Market lnstrumcnts Admitled Value Net Amount to an Official Cxchange Listing EUH Assets
Austria EIJR 17.950.000 Republic of Austria EMTN 3 5%
15:09!202 1
Cayman Islands EUR 1.010.000 Hutchison Whampoa Linance 03;l 3
5.875% 08/07:2013
Denmark EUR
Finland l l JR 15.000.000 Finland Government 4.25".
1.450.000 Dong Energy vdriable perpetual
15/09'?017
France tun
FUH
EUR
ElJH
t t l l i ElKl FUR
EUR
EUR
EUR
5.000.000 Ranques Poptilaires Covered Bond
4.500.000 BNP Parihas Covered Ronds EMTN
1.750.000 Casino Guichard Perractron I-MTN
3.000.000 Compagnie de Financemcnt Foncier
4,200,000 rrarice Treasury Bill 4 4 25!04:2055 18,000,000 France Treasury Bill 4% 2 5 1 0:2013 2,200,000 France Treasury Bill 4.25%
kM 1 N 4.625% 07!05/7011
4.758 28305/7013
4.875?4 10/04'2014
EMTN Xfl75% 11/07,?011
25:1 0:201 7 11,300,000 France Treasury Bill 5.5%
25:04:2029
05/07:2011
28:'35;20 13
51 5,000 1 PSA hirofirwrice Frarlce 4.625%
800.000 Veolia Environnement EMTN 4.875%
Germany EUH 15,000,000 Riiridesobligation 4.254; 12:10?2012 EUR EUH
Greece FlJH
EtJR
3,730,000 Germany (Bund) 4.25"; 04:07:7039 6.200.000 Germany (Bund) 3.5% 04/01/7016
17,285.000 Hellenic Republic Government Bond
11 .:300.000 Hellenic Republic Covcrnmonl Bond 3.94:" 70;08,'7011
4 3?" 70:07:2017
Ireland EUI l 1,700.W0 Provide Mortgages Loans France
2001 B FI 3N 2211 2/2038
Italy EUR
FtJH
EUR
EUR
1.600.000 lntnsn Sanpaolo FMI N variable 28;05/2018
15/03/20 1 1
01 /03:2010
17:03:2055
20.000.000 Italy Buoni Poliennali Del Tesoro 3.57h
22,000.000 Italy Huorii Polienriali Gel Tesoro 4 %
2,000.000 Telecom ltalia EMTN 5.25%
Netherlands EUR
EUR EtJH
EUR
kUH 5.500.000 Netherlands Gnwnment 4%
1,000,000 E.ON International Finance rMTN
1,400,000 ING Bank EMTN variatile 79):05;7073 1,800,000 I eo-Mesdag 2006-1 D FRN
1.023.000 Linrle Firnarice rMTN 4.75?,6
5.75% 07:05;2020
29;08/2019
24:w 20 1 7
15!01/2037
11,127,676 4.28
11.127.676 4.28
979,129 0.38
979.129 0.38
1,326,446 0.51 1.326.446: 0.51
14,672,190 5.64
11,672,190 5.61
49,876,366 19.18
4.873.M5 1.87
4,365.461 :.68
1,584,555 0.61
2,892,358 1.1 1 3,472,213 1.34
17.339,364 6.67
2.108,843 0.81
11.977.479 4.60
499,124 0.19
768,374 0.30
23,854,589 9.17 14.733.593 5.67 3.362.256 1.29 5,756,740 2.21
27,232,555 10.47
16587.423 8.42
10.545.132 4.05
1,686,757 0.65
1,686,757 0.65
43,886,542 16.88
1.534.359 0.59
1G.263.380 7.41
21.693.815 8.31
1.384.988 0.54
15,955,148 6.14
984.483 0.38 1.310.1~5 0.51
1.352.723 0.52
942,292 0.36
4.693.497 1.80
Nurritier of shares Transferahle Securities and Market C.; or Principal Money Market Instruments Admitted Value Net Anroiint to an Official rxchange Listing EUR Assets
Netherlands (cont) EUR 5.300.000 Netherlands Government 4?+
H J H
Norway FUR
15!07/2018 1.780.000 Uriilever LMlN 4.87556 21:05:2013
7.700.000 L3nH NOR Bank EM1 N 5.875?6 20/06:2013
Spain Et JR
ElJR
t l J l 1
1 .000.000 Santander lssiuances FMTN variable
1,250,000 Telefonica Emisiones EM1 N 4.674?0
1,350,000 relefuriica tniisiornes rMTN 5.5895
24;10;2017
07:02:2014
12,'06!20 13
Sweden EUR 1,100.000 Svenska tiandelsbanken tMTN
variable 20!04/2016
United Kingdom kt114 7.050.000 Farclays Hank FMINvanable~rpetuaI EUR
TlJR
HJR
EUR
1.300.000 BAT International Finance 5.37546
1 .0!?0.000 ILloyds TSR Rank FMTN variable
1.500,000 Royal Rank of :.;cotlarid FMTN 5.75%
1,130,000 Severn Trent Utilities Finance EMTN
79):06:2017
05;03;2018
1 5105i7013
5.25% 11 :03;2016
United States of America t l l l l
EUR
IJSD
ElJR
2.380.000 Ahold Finance USA Holdings EM.rN 5.875% 14/03'2012
3.172.000 Chase Credit Card Master Trust 1998-1 A2 5% 15:08;2008
3,000.000 Pemex Project Funding Master Triist
2 740,000 Zurich Finance USA EMTN variable 5.761'0 01/03!7018
02/10:2023
Total Transferable Securities and Money Market Instruments Admitted to an Official Exchange Listing
Number of shares or Friricipal Amount on anotlior Rcaulatcd Market
Transtcrable Securities and Money Market Instruments dealt
4.956.777 1,709,186
2.1 89.336
7 1n9.33ti
3,449,753
954,089
1,174.2T7
1,321,387
1,035,488
1 035.488
6,128,270 1,363.91 3
1.196.299
1,051,73fi
1.478.489
1,087.833
9,831,905
2,350,726
3.169.542
1.748.971
2.562.666
1.91 ' 0.66
0.84
0.84 I I
I .33
0.37
0.15
0.51
0.40 ,
0.40
2.35 0.52
0.46
0.40
0.42
3.77
0.89
1.22
0.67
0.99
213,232,150 81.99
Market % Value Net tun Assets
International Agencies 3,937,177 1.51
15/10i2013 3.937.177 1.51
United States of America 29,576,619 11.38 lJSD
0.625% 15/04/2013 29.576.619 11.38
EUR 4,200,000 European Investment Bank 3.625%
46,800,000 Us Treasury Inflatiori Indexed Dorids
Total Transferable Securities and Money Market Instruments dealt on another Regulated Market 33,513,796 12.89
Total Investments 246,745,946 94.88
Other Net Assets 13,321,464 5.12
Net Asset Value 260,067,410 100.00

Page 204 Schroder Intcrriational Selection Fund Scirii-Anriual Report June 2008
Portfolio of Investments as at 30 June 2008 (cont) Schroder ISF EURO Short Term Bond
Number of shares Iranstcrablc Securities arid Market ?5 or Principal Money Markel IrlSLrumeiits Admitted Value Net Amount Lo an Otticial Exchanne I istiriq EUR Asset:;
Finland EUR
tUH
40.000.000 I-irllanrl Gowmment 2. is?; 15:09:2010
26:03:2014 2,000.300 Nordea Barik hrlland EMTN variable
France CIJH 4.000.000 BNP Paribas CMTN 4.753,0
28: 05/20 I3
EUR 40,000,300 Frdrlce 131AN 2.54'. 12:07:2010 tll l l EUR
10,000.000 France RTAN 3''s; 12:01:2010 37,000,000 France Cowmment Burid (]AI 5.
25: I0?2010
Germany
FUR
Greece EUR
EUR
40,il00,000 Hundcsobliqation 3.53 0G:I W200t)
40,000.000 Hellenic, Republic Goverrirrierit Bond
40.000.000 Hellenic Hcpublic Goverrirrierit 13orld 3.1% 20!04Xl10
3.4"s; 21:03,,2009
Italy EUR
FUR
7.500.000 Intesa Sanpaolo EMTN variable
2,550.000 Intcsa Sanpaolo rMTN variatile 08:05:7014
0Y:Otii2015 oliennali Del Tesoro 3.5%
TlIR 40,000,000 Italy Buoni Polienriali Del Te:;oro 1 :., 01;03:2010
Netherlands TU14 40.000,000 Netherlands Goverrirrienl 3.754;
ELJR 40.000.000 Netherlarlds Govertnmcnt 4% 15:07:2009
15:01:2011
United Kingdom E N t 9,500,000 Bank of Friqlaritl t i i r r , Note 3%
27/(31:2009 ,333 Holmes ririaric:iriy 8 3A HiN
15,'04:2020 lU.985.000 Network llal V I N Finance EMTN
3.1 25% 30:03:3009 EUR
EUR 3.300.000 VodRlorW tMTN 5.875% 18~062010
United States of America CUR 13,490,000 Chase Credit Card Master lrusl
Total Transferable Securities and Money Market Instruments Admitted to an Official Exchange Listing
40,339,790 6.85
38.342.280 6.31
1 ,YY 1.510 0.34
139,909,170 23.77
3.~80.410 0.66
7.230.898 1.23 R.R18,0til 1.50 33.313.WJ 6.31 3n.a91,020 6.02
.12.ti,'5,003 7 25
40,342,467 6.85
Y11.!.>47 (3.15 39,430,970 6.70
78,225,760 13.29
38.iZ/,Y80 0.53
3Y.157.IY0 8.71
82,901,634 14.08
9.496.895 0.43
2.434379 (? 4 1
30,413,300
78,918,080 13.41
3U.64G.940 6.75
39.271.140 M I
33,753,616 5.73
Y.403.100 1.39
1.327.5/8 0.23
1!3,124.795 3 35 3.298.145 0.36
13,479,545 2.29
13.47'3.515 2.29
507,870,062 86.27
Nunbcr of shares Moriey Mnrkct Instruments Market $0
Value Nct other than those cjenll or Priri(:ipa Arrount i r i o r 1 tl licgulatcd Market* EUH Assets
Sweden 3,966,909 0.67 t U R ~1.000.000 rrarriliderl Pilblrc, Housing Finance
N ' 5 TRN 21 :09/20 1 7 3,966,909 o.6i
United States of America 52,138,270 8.86
0.f25"; 15:04~2013 52,138.2/0 8.86 IJSO 82,500.000 US Ireasurj Inflation Indexed Rorids
Total Money Market Instruments other than those dealt in on a Regulated Market*
Total Investments
Other Net Assets
Net Asset Value
56,105,179 9.53
563,975,241 95.80 I
24,721,590 4.20
588,696,831 100.00

Schrtxler International Selection Fund Semi-Annual Re~ort Juric: 2008 Page 205
I
I
I
I I I I
I I I
Portfolio of Investments as at 30 June 2008 (cont) Schroder ISF European Bond
Number of shares Transferable Scctirities and Market G.I or Prmncipal Money Market Instruments Admitted Mlue Net Amount to an OlficiRI txc:hanne I istino EUI< Assels
Ausbia FVR 3.805.000 Rcpublic of Austria HATN 3.545
15~09;2021
Denmark DKK 8.100.000 Kingdom of Dcnmark 5%
15:11/2013
Finland ElJR 5,3/2.000 Finland Covcmment 4.25%
15/09:?012
France tu13
EUR tUH ElJR EUR
ElJn
1 .OOO.OOO Cornpagnie de Financcmcnt koncier
1.750.000 tRAP EMTN 3.750.6 ?5/04:2010 1,699,000 France Troasury Bill 45'0 P5!04/2055 4,701.000 France Treasury Bill 4% 25:10/2013 1,455,000 France lreasury Rill 4.25%
5.015.000 rrarice Treasury Rill 5,5%
EMTN 3.875% 11/07.'7011
251 0/201 I
?5;04:?0?9
Germany Ell1 1 EUR 3.872.000 Hun&sobligation 4.25St 12!10/2012 EUR EUR
Greece EUH
EUI 1
7,700.000 Bundesobligation 496 13,'04;2012
4.900.000 Germany (Bund) 3.5% 04;01!201 R 1.694.000 Gewiariy (nurid) 4.254s 04:07!2038
B,115.000 I lelleriic Republic Governmcnt Bond
5.000.000 Hellenic Republic Government Bond 3.9% 20:08:2011
4.3% 20:07/2017
Italy EUR
ElJR
7.432.000 Italy Buoni Poliennali llel rem0 3.6%
?.286.000 ltalv Rttonl Pollennali Del Tesoro 4% 15/03:7011
01 :03;2010
Netherlands EUI< 3.R20.000 Netherlands Governmcnt 1Sb
EUt3 1.701.000 Netherlands Government 18 15:07;2O1 R
15/01 :2037
Norway NOK 3.500.000 Norway Treasury Rill Zero Coupon
1 7:0!~:2008
Poland PILN 5.393.000 Poland Government 4.75%
24!05!20 1 1
Sweden SEK 9.120.000 Swedish Government 5.5%
08:l 0:7012
Switzerland CHF 1.650.000 Switzerland Govcrnmcnt Bond 2 5%
12!03:201 R
United Kingdom GRF GBP GOF GUP GBP
1,285,000 UK Trcasury 4.25?i, 07/03i?011 1,000,000 IJK Ireasury 4.?5% 07:06;2032 1,030,000 UK Treasuly 4.25% 07il2!2048 3.000.000 UK Treasury 1.75% 07/09!2015
654,(H)O IJK Treasury 8% 07!06/2021
3,289,560 3.90
3,269,560 3.00
1,088,335 1.30
1.088.335 1.30
5,254,600 6.26
5.P54.600 5.76
16,273,522 19.39
961.119 1.15 1.714623 2.04 1,404593 1.67 4578.464 5.40
1,394,712 1.68
6,287.01 1 7.47
12,028,983 14.33 9,147,503 2.55 3.803.231 4.53 4551.262 5.42 1,526,987 1.82
10,569,580 12.60
5,903.592 7.04
4,665.988 5.56
9,412,457 11.22
7.158.272 8.53
2.254.185 2.69
4,913,942 5.86
3.385.569 4.03
1.578.373 1.83
431,159 0.51
431.159 0.51
1,500,503 1.79
1,500.503 1.79
991,123 1.18
901.123 1.18
975,428 1.16
975.128 1.16
9,738,074 I 1 60 1,586,548 1.89 2,184,462 2.60 1,779,242 : .46 3,699526 4.41 1,038,296 1.24
Numbcr of shares Transferable Securities and Markct 96 or Principal Moncy Markct Instrumenis Admitted Value Net Arrioiirit to an OYicial Exchange Listing ElJR Assets
United States of America 1,755,263 2.09 E M
321.375 0.38 EUR
340.000 HA Credit Card Trust 4.5% 1 7/01 1?014
1,435,000 Chase Credit Card Master Trust 1998-1 A2 595 15/08:2008 1,433.888 1.7 1
Total Transferable Securltles and Money Market Instruments Admitted to an Official Exchange Listing 78,202,529 93.19
Number of sharcs Transferable Securities and Market % Valuc Nct or PriricipA
Amount on another Regulated Market FUR Assets Money Market Instruments dealt
International Agencies t l J l 3 1.350.000 furopeari Irivestrnent Rank 3 625%
15/10:2013
United States of America IJSD 4.1 M O O 0 US Trcasury Inflation Indexed Bonds
1.625% 15/01!2018
Total Transferable Securities and Money Market Instruments dealt on another Regulated Market
Total Investments
Other Net Assets
Net Asset Value
1,265,521 1.51
1.265.521 1.51
2,689,765 3.20
2.tiRR.7ti5 X20
3,955,286 4.71
82,157,815 97.90
1,760,026 2.10
83.91 7,841 1Ml.00

Page 206 Schrnder lriterriatiorial Selection Fund Serrii-Annual Report June 2000
Portfolio of Investments as at 30 June 2008 (cont) Schroder ISF Global Bond
Number of slrares Transfcrable Securities arid Market B Number of shares Iranstcrable Securities arid Market 9; or Principal Moriey Market Instruments Adrriitted Value Net or Principal Moriey Markel Instruments Admitted Value Net Arnoiirit to an Ofticial Fxchariye Lisliriy IJSU Aiscts Amount to an Official Fxchariye Lisliriy IJSD Assets
Austria Fur{ 9.005.000 Republic 01 Austria EMTN 3 . 9 :
13:09:2071
Canada USD
Cayman Islands EUR
31 0.000 Petrti-(:ariXla 6.05':i 15:03,'%018
37,000 Hutchison Wharripoa ririaiw 031 j: 5.87556 08:0/'2013
Denmark EUR
Finland EUR 3,X0,000 hriland Government 4.29"
400,000 Ilong Eneryy variable 29:08:3005
15i092012
France EUR
r o R
EUR
E!JH
t l l l l
EIJR
E!Jl TIJR
El in
1,000.000 Banqucs Populaires C:overetl Bowl
950.000 BNP Paribas Coverecl Borids tMTN
100.000 C;asino Cuichard Perrachori t M I N
500.000 Corripayr lie de tinancement Foncier
EMTN 4.6>5% 02/05:201 1
4.7545 ?0:05:2013
4.8753.;) 10/01:2014
EMTN 3.876:5 11:02:201 1 I , 100,000 Frarice treasury Bill 4% 25:04:2055 4,000,000 Frarice treasury Bill 4% 251 0201 3 2,230,300 France treasuty 0111 5.25'4
75:l 0:2017 2.500.000 France treasury Bill 5.5% 25;04,'20:W
55.300 Veolia Environrierrierit EM 1 N 4.875% 2FJ:05:20 13
Germany CUR t l J l i tUI+
Greece FUR
4.1 75,000 Bundesobligatiori 4 75% 12: 10:2012 730.000 Gerniariy ( h r i c j ! 4.25% 01/0/:20:3d
2.800.000 Gerriiariy (Burldl 3.54:' 04:01:201iri
3.800.000 Hellenic Republic Goverrirricnt Bond 3.5% 20~08:2011
Guernsey t111l 50.000 Credit Suisse Group Financc
Giiemiey variable 23/01:2018
Italy EUR
FOR
EUR
FlJR
EUR
450.000 Baric:o Popolarc EMTN 3% 1'3:10:2010
Y8iOS'701 R
15/03:2011
01 :03:2010
17:03:2055
1,150.000 lntesa Sanpaolo CMTN vari;:itlc
4,600,000 Italy Buoni Poliennali Del 1e:ioro 3.54;
4.550.000 Italy Buoni Poliennali Del 1e:ioro 4 %
700.000 Telecorrl IlAla EMTN 523%
4,069,834
4,0139.831
304,874 30.1 .Y i 4
56,535
56,535
576,739 5 (6,739
5,010,541
3.010.541
19,040,394
1.538.31'3
1,452,076
132.!14
759.798 1.433.33'1 17.0;3.209
3.36'j.i 78 4,174.873
98.393
11,599,834 8,363,555 1,037.152 4,059.127
9,768,335
5,787316
3,988,079
68,143
68,133
17,256,690
dP4,1102
1,738.2 I 1
6,963,755
7.071.573
1.49
1.49
0.1 I 0.1 1
0.02
G.07
0.21 0.71
1 .84
1.84
6.97
0.5/
0.53
0 05
0.28 0.52 2.22
1.73 1.53
0.04
4.25 2.37 0.38 1.50
3.58
2.12
1 46
0.02
0.0:)
6.32
0 25
0 . a
2.w
2.59
0.78
Japan JPY
JP"
JpV
.IPY
JPY
344 000,000 Developrrient Hank of Japan 1.7%
637.700.000 Japan Governrrlerit Five Year Bond
l , l 5 4 L ( . ; . J ! K Japan Gowrrirrierit .Tell Year Bond
20Y.2G0.000 Japan Gowrnment Teri Year Hond
20/'09'?077
i .4u5 ~0:~1:~:2oi I
1 .ti?" ?0.03:201 D
1.8% 21 :09'2009
1.1 % 20,03:20:33 71,050,000 Japan Covornrrierit 1 hirly Year Bond
Luxembourg IJX 295.000 Telecorri ltalia Capital i . 121 3b
04:OB;703R
Netherlands EUR 700,000 E.ON lnterrlatiorial Firfiance EMTN
5. I!i% 07:05:2020 ELlR tiOO.OOO ING Bank rMTN variable 2'3:05:20:23 EUR 200.000 Leo-Mesdaq 700ti 1 U tHN
EUR lW,000 Linde Finarice TM 1 N 4.75%
TIJI I , 100,000 Netherlarids Government 4%
EUR 550.000 Netherlands Goverrirrieril 4%
EUR
Norway EIJR
79/0fi:201'3
21;04!2017
15:01 'X137
15i07?2018 350.000 Ilnilcvcr EMTN 4.875% 71 :05;2013
D00.000 DnH NOR Rarik CMlN 5.875% 20:05;2013
Spain EUR
EUR 3:jO.000 lelctonica Emisiories CMTN 5.58?4
GEP
ti50.000 Santander Issiiari(:e:i t M I N variable 24'1 0:7017
17:06:2013
31 :01:2014 300.000 Tclefonica rrriisiorier; t M I N 5,888?>
Sweden EUR 50.000 Svenska Handelsbariken EMTN
variable 20;0W2015
United Arab Emirates USD n30.000 Abu Dhabi Corrirriercial Bank FRN
09:0.',;2016
United Kingdom ELR
ELR tL!H
400.000 Arklo Master Issuer 7006-1X 5Al
500,000 Aviva variable 14:l 1:7021 200.000 Darc:layr; Bank EMTN variable
FRN 1 ;,112;2052
perpetual LUH 500.000 BAT Iriterriational Finance 5.37536
23,422,058 8.58
3.137.707 1.15
0,109,636 2.24
11,882,736 4.2/
2,003,645 0.73
508.333 0.19
303,189 0.11
303,188 0.11
4,551,225 1.67
3 10.338 0.1 0 88G,080 0.93
236.899 0.09
788,909 0.1 1
1,1/9.531 0.64
810.743 0.30 535,775 0.20
941,106 0.34
941,106 11.34
2,083,851 0.76
'377.4ti2 0.35
539.9ti0 0.70
568.429 0.21
74,186 0.03
73.185 0.03
759,616 0.28
759,Ule 0.2n
6,515,306 2.39
011.507 0.21 754.015 0.28
209.730 0.08
725.210 0.27 163.400 0.06 ld3.400 0.08 158.858 0.06
243.331 0.09
900,605 0.33
I i I ~
!
i !
I
i
i

Schrnder lnterriatiorial Selection Fund Scrni-Annual Report June 2008 Page 207
Portfolio of Investments as at 30 June 2008 (cont) Schroder ISF Global Bond (cont)
Market 4: Number of shares Transferable Securities and Market "i, Number 0' sham Tiansferable Securities and or Pmcipal Money Market Instruments Admitted Value Net or Principal Money Market Instruments dealt Value Net
USD Assets Amount to ari Official Exchangc Listing USD Assets Amount on anothcr Regiilated Markel
United Kingdom (cont) EUR
GRP GRP
United States of America
200,000 S e w n Trent Utilities Finance EMTN
765.000 UK Treasury 4 759'0 07/03:2036 450.000 IJK Treasuw 4.7555 07!09/2015
5.258 11!03/2016
FUR
USD USD FUR
I JST, I JSD IJSD USD USD
I U X
USD
USD I60 IJSD usu USD
USLl
EUR
4&3.000 Ahold Finance IJSA Holdirigs CMTN 5.8l5?0 14:0'312012
21 0,000 ATRT 6.4?0 15,'05/2038 320.000 BellSouth 4.7546 15'1 1;2012 228.000 Chase Credit Card Master Trust
1998-1 A2 5% 15,'08~2008 320,000 ChUbb 6.5:b 15:0
175,000 CSX 7.45:s; 01/04/2038 375,000 Citigroup 6.125°&
410,000 Florida Power 5.65?'0 15:06:2018 605,000 General Flectric Capital 5.6259:
01 ;OW201 8 215,000 General Electric: Capital MTNA
5.8/5?0 15,'02;2012 550.000 JPMorgan Chase & Co. 4 75%
370,000 Kroyer 5"s; 15:04!2013 ?80.000 ONEOK Partners 6.1575 Ol:l0/7010 3 10.000 Pep:;iCo 5?A 01 /06!2018 305,000 Philip Morris International 6.375?&
550.000 Time Warncr Cable 5.85%
01 '05'201 3
1 0;05!2038
01:05:?017
15!04:2013 1.030.000 Verizon Communications 5,2535
500.000 Zurich kindrice USA EMTN variable 07il0/70?3
Total Transferable Securities and Money Market Instruments Admitted to an Official Exchange Listing
Nunitier of shares or Principal
Transferable Securities and Moriey Market Instruments dealt
303,467 1.407.132
874.651
7,825,165
700,344 ?03.?49 3 1 7,909
359.084 311.681 364.548 177,Al 7 4i4.630
554.08 1
753.823
535.292 363.522 278,059 302,887
791i.77a
523.921
1.079.686
737.070
114,227,621
Market
United States of America 41 0,000 American International MTN 4.95%
'" USD Value Net
USD Amount on another Regulated Market USU Assel:;
Canada I JST, 425.000 Canadian Natural Resources 5.99t
01 a2201 8
France USD 860.000 Societe Generalc 144A 5.75%
20!04!2016
International Agencies EIJrl 750,000 European Investment Bank 3.6254/,
154 0:?01 3
Malaysia MYR 9,550,000 Malaysia Government 3.863b
13;04QOIO
Netherlands L E X USD
495,000 ING Bank 144A 5.125% 01;05/7015 590,000 Scolland International Finance No 2
144A 4.25?6 23:05:2@13
United Kingdom USD USD
31 5,000 Barclays Dank 5.4596 12:09:2012 475,000 HSDC Holdings 6.8Oh 01/06/2038
420,605
420,605
835.254
835.254
I ,I 08,139
1 , I 08.1 39
2,909,937
2,909,937
1,019,429 481,688
537.741
788,877 370,594 468.283
0.15 USD
0.15 lJso
0.31 IJSD
0.31 usD
Oa4' USD
0.41 USD
1 .DB I JSD
1.06 LJSD
0.37 0.17
0.20
0.29 0.12 0.17
I U X
USD
20~03/2012 195.000 Assured Guaranty US Holdings
variable 1511 2!20fi8 750.000 Rank of New York Mellon MTN 4.596
01/04/2013 132.1 78 Citigroup Mortgage Loan Trust 2003-
145.914 Citigroup Mortgagc Loan lrust 2003 1 WA2 6.5% 25!08/2031
UP3 A2 14'~ 25'09:2033
15/11f015 95.000 Colorado lntcrstate Gas 8.8%
/40,000 Corncast 8.49; 15/05!2038 1,455,314 Countrywide Alternative Loan Trust
91 4,513 Couniry?~ide Alternative Loan Trust 2007-75 1 A7 0.5"); ?5,'11:203./
2005-6SCR 1A1 5.5% 25/01:2036 78,530,000 FHLMC 5.596 15:07!2038
915.698 FHLMC {Gold) Pool No B130f7 4.5% 01 /03:2019
0 1 ,'12/2028
01 !08:7033
01/07/2032
01/10:?03f
0 lI05?2037
53.1 i n ri-ii MC [Goid) POOI N I cootigo ti%
2.806.153 FHLMC: :Gold) Pool N' GO1598 546
~ 7 0 ~ ri ii MC i ~ o i d ) POOI N' ~ 0 1 4 3 3 6.59:
435,554 FHLMC (Gold) Pool N' G023.18 5 5%
3.065.930 FHLMC (Gold) Pool N ' GO2793 5%
1.129.879 FHLMC Gold) Pool N' GO2975 5.5% 01:05:2037
0111 0/2032
01/07/?029
01:1272W8
01 /12:2029
01/0//2033
0 1 ! 1 0!2033
01/01/P033
15:OI !2034
15:05!2034
15/1 0/?034
20/09;2037
FRN 25;06!2033 500.000 JPMorgan Chase Bank 5.875%
13/06/201 ti 550,000 I R-IURS Commercial Mortgagc Trust
2003 C5 A3 4.254% 15/07/20?7 550.000 MBNA MTNF 7.5% 15/03/2012
1, /60.000 Merrill Lynch Mortgage Trust 2002
?,I 30.000 Merrill Lynch Mortgage Trust 2004
524.030 rNMA Pnnl N. ?544?/ 5.5%
107.416 FNMA Pool N'. 186203 ti46
108.763 FNMA Pool N' 535128 6%
45.353 FNMA Pool N' 515259 7.50.:
1,958.256 FNMA Pool N'.' 555592 5.5%
101.358 FNMA Pool N.' 555783 4.
606.210 FNMA Pool N' 677018 5.5%
1.077.082 GNMA I Po01 N' 604946 5.551
5,673,786 GNMA I Pool N' 781746 59t
3.1 56.268 GNMA I Pool N. 782248 5.5%
2 419,fiOR GNMA II Pool N' 4028 63"
15.270 Home rquity Asset Trust 2003-1 02
MW1 A4 5.619°/c 12/07/2034
RPCl AS variable 12/10!2011
104,750,340
395,966
140,161
?44.417
172,637
145.207
98.356 688.117
1307.281
864,867 28.084.2 1 9
883.363
53.fi00
2.687.168
66.6/9
128.759
2.936.5R6
1,112.224
515.847
108.221
109.579
47.833
1927,658
371 ,ti37
596.738
1.019.100
5.43s,25R
3.1 33.582
7.449.853
67 2
4 B3,395
540.01 2 581.814
1,762,689
2,066,723
38.37
0.15
0.05
0.09
1n4
0.05
0.04 0.?5
0.48
0.37 10.25
0.37
0.07
0.98
0.02
0.16
1.08
0.41
0.1 9
0.04
0.04
0.02
0.71
0.14
0.22
0.37
1.99
1.15
0.90
0.00
0.18
0.20 0.21
0.65
0.76

Page 208 Schroder Internatinrial Selecticn Fund Scnii-Aririual Report June 2008
Portfolio of Investments as at 30 June 2008 (cont) Schroder ISF Global Bond (,corit)
Nuniher of shares Trarisferdble Seciiritics and Market % or Priricipal Money Market Iristnimsnts dealt Value Net Amount or1 aiiotlier I iegulatcd Market USD Asset:;
United States of America (cont) USD
USD
USD
U X 680,300 Oracle 5.75% 15;01:2018 IJSD
805.000 Micjarrwrican Energy Holdirigs 144A
700.000 Morgan Stanley Capital I 2003-TI 1
9.467 Option One Mortgage Loan Trust
5.T546 01:04:701R
A3 4.85% 13.08.204 1
9002 3 M2 FHN 25:08:703:'
215.000 Pernex Project hinding Master Trust
0.5% 01 /06:20r8 USD IJSU 5,362 Sdloriion Brothers Mortgage
250,000 PNC Bank 6.8759; 01:01:2018
LJSD Loan Trust 2033-ECI 1 M4 HiN 2 x 1 0/700:(
20.634 Structured Asset Irivestrrterit Loan Trust 2004 1 M1 FHN 25:0>:71334
30:1 0:20 1 .I
US0
t J X
USD 13.700.000 US Treasub 7.6 USD 95.000 LJS Ireasury 2.5 USL) 5,740,000 US Treasury 3.8 LJSU 1 .Y00,000 IJS Treasury 4.7 US0 USD
LJSD
USD 480.000 Viacorn 8.75% 05'1 0:2037 US[) 7,000,000 Wactiovia Bank Cornrrierc;ial
800.000 US Rdrtk:Cirictnnati 1 .Ij5'%
520.000 IJS Treasury 59; 15:05:2037
0.ti25% 15m:2013
2.375% 15:01:2027
10,520,000 US Treasury lrtflatiori IriUoxcd Bcnds
3,645,000 US Treasiiq Iritlaliorr Indcxed Rcnds
Mortgage Tru:;! 2005-C 1 Y AS 4.661 "L. 15:05:2043
Total Transferable Securities and Money Market Instruments dealt on another Regulated Market
Nurriber 01 shares or Priricipal
Money Market lristrumerils other than those deal1
Amount i r i on a Hcgulated Market*
Egypt CGP
United States of America USD 5,000,000 Bankamerica 0% 03:08;2008 USD USU
US11 USD
Total Money Market Instruments other than those dealt in on a Regulated Market"
3,300,000 Egypt Treasuty Rills 0% 15:07:2008
6,000,000 Citigroup Funding O?b 1 n:07:2008 8,000,000 Freddie Mac Uiscount Notes ( : P h
14:07:2008 11,000.000 Toyota Motor (;redilO?:? i)'J:09?2008 ii,000,000 UBS Finance 0% 04:08:2008
805.058
ti(23.7Y3
4,HY4 BTY.322
243. :75
821.245 25T,1 15
5,126:
20.960
3,931
i85,7r?3 13,6133.5/8
95.334 5.68/.991 201 1,875
559,4015
10,478,006
4,077,387 4X3.305
1.97fj,25ti
11 1,832,581
Mar kct v<3luc
0.2Y
0.25
0.00 0.75
0.09
0.30 0.09
0.00
0.01
0 . x
0.29 5.07 0.03 2.08 0.74 0 .m
3.84
1.49 0.17
0.7 1
40.96
?I N b
wr1 A:;:;t?LS
618,213 0.23 618,213 0.23
35,893,991 13.14 4.97ti.973 1 ,& 5.997.800 2.19
l.9S3.336 2.93 10.945.330 1.01 5.985.44D 2.19
36,512,204 13.37
Number of shares Markel q: or Principal (Ilher Transferable Securities Value Net Amount not dcalt on another Reyiilnled Market IJSD Asscts
United States of America
USD USD 755.000 ITC 143A 5.875% 30i092016
100,000 lwin Reefs Pass-Through lrust 144A FRN perpelual
Total Other Transferable Securities not dealt on another Regulated Market
Total Investments
Other Net Assets
Net Asset Value
251,877 0.09 247.877 0.09
4.000 0.00
262,824,283 96.26
10,217,709 3.74
273,041,992 100.00
1

Schrnder International Selectiori Furid Serrii-Annual ReDort June 2008
Portfolio of Investments as at 30 June 2008 (cont) Schroder ISF Global Inflation Linked Bond
Page 209
Numher of shares Transferable Securities and Market oh Number of shares lransferable Securities arid Market 96 or Principal Money Market Instruments Admittcd Value Ne! or PrimpA Money Market Instruments dealt Value Net Amount lo an 0ffic:ial rxchange Listing EUR Assets Amount on another Regiilated Market ElJR Assets
I France t I J R
EUR
EUR
FUR
7,745,000 France Governmcnt Bond OAl 1";.
4,945,000 France Gnwrnrrierit nond OAT 1 .ti?; 25'07/2017
25:07:2011 13.765.000 France Goverrirrierit Dond OAT
3 16',6 25/07!2032
75/07:2029 135,000 Francc Government Bond OAT 3.4%
Germany TIJR 32.885.000 Bundcsobligation Inflation Liriked
ElJR 16.775.000 Deutsche Bundesrcptiblik Inflation 2.25"~ 15:04/2013
Linked 1.5?'~ 15/04/2016
Sweden S t K 91,165.000 Swedish Government 3.58
01 ;I 21201 5
United Kingdom GBP GnP GRP GBP 3.223.000 IJK Ireasury 2.5 GBP 3,778.000 IUK Treasury 2.5 CXP GBP
United States of America USD
USD
IJSD
t JSD
6.505.000 IJK Treasury 1.7545 22'1 1!2017 2.740.000 UK Treasury 1.25% 22:l 1/2027 8.653.000 UK Trcasury 2% 26:01:2035
81 5,000 UK Treasury 2.5% 17;07:2024 2.060.000 IJK Iremiry 4.17593 22:07:2030
7,450,000 US rreasury lreasury lnflatiori
10.613,OOO IJS Treasury Treasury Inllaliori
7.8.50.000 IUS Treasuv Treasury Inflation
2,555,000 US Trcasury Treasury Inllation
lridexed Rorids 3% 15,'07:2012
Indexed Bonds 3.37596 15~01?2017
Indexed Bonds 3.55 15:01!2011
Iridexed Ronds 4.25% 15:01!2010
Total Transferable Securities and Money Market Instruments Admitted to an Official Exchange Listing
Numher ol shares or Priicipal
Trarisferable Securities and Money Market Instriiments (iwlt
25,704,731
7.147559
5.371,05:3
18.000.927
185.092
51,888,719
34.716.124
17,1T2..595
8.38
0.70
1.15
5.87
0.06
16.91
11.31
3.60
United States of America USD
USD
lJSD
IJSD
t K D
USU
USD
E.0/5.000 U S Treasury Treasury Inflation
2?,.442.000 IJS Ireasury Ireasury Infla!ion
16.760.000 IJ:: IrRasiiry Ireasury Inflation
28,195,000 US Treasury Treasury Inflation
5.721 ,000 IJS Treasury Treasury Inflation
8.0.10.000 US Treasury lreasury Inflatiori
21.4U0.000 US Trcasun. Trcasury Inflation
Indexed Bonds 1.625% 15/01,'2015
Indexed Bonds 1.8754b 15/07/2013
Indexed 13onds 7% 15/01 !2016
Irickxed Roritfs 7.375% 16:01/7017
lndcxcd Bonds 2.37594 15/01:2025
Indexed Bonds 2.375'h 15/01!%W7
Indexed Bonds 3.875% 15/04/2029
12,523,831 4.08 Total Transferable Securities and Money Market Instruments dealt
1*.523.*31 L O R on another Regulated Market
65,280,917 9,036.771 4,015.402
17.77fi.40R 11 . / 8 / . 8 2 / 10.241.534 2.f387,910 G.735.265
21.27 2.94 1 31 Total Investments 5 79 3 84 Other Net Assets 3 34 0 88 Net Asset Value 3.1 i
19,831,869 6.46
6,197,684 2.02
8,985,972 2.93
2,429.1 03 0.79
2.219.1 I O 0.72
175,230,067 57.10
Market 3 Value Net
Arriount on another Regiilated Market FIJR Assets
Canada 7,539,l 15 2.46 CAD
01 :I 717031 4211.913 1.38 CAD 2.833.000 Canadian (hverrinierit 4.75%
0 1 : 1 2;2026 3.377.?0? 1 .OR
Japan 23,716,551 1.73
3.61 0.000 Canadian Covcrnrncnt 4 %
JPY 1 . E . @ O C . ? O O Japan Government 0.5% 10:06;2015 8.630.390 2.81 JPY 2.385 800 333 Japan Govcrnment 1 . I 9h 10:091:201 ti 15,080.1 GI 4.97
92,805,625 30.24
4,478,359 1.45
18,379.052 5.99
12.130.834 3.95
20.W7.600 6.73
4,344,592 1.42
6,415,857 7.09
26.409.31 1 8.61
124,061,291 40.43
299,291,358 97.53
7,so.wa 2.47
306,872.336 100.00

Page 210 Schroder International Selection Fund Semi-Annual Report Jurie 2008
Portfolio of Investments as at 30 June 2008 (cont) Schroder ISF Hong Kong Dollar Bond Number of shares Transferable Securities and Market % or t’rincipal Money Market lrrslrurnients Admitted Value Net Air iourit to an Official rxctiariue Li:;tinu I IKU As:;ets
Hong Kong SAR HKU
HKU
HKU
HKD
HKD
I IKII
I IKl)
HKD
5,000,000 Cheung KoriIj ririmx Oayman 8.38”s 12:01:2010
80.000,000 Hong Koricl Goverrirnent 1.52% 15102:2010
35.U00.000 Hong Konq C;cJverrirriernL 1 .77?>- 17:05,2010
38.000.000 I Ion(] Korig (;overnmcnt 2.88?s 17,’12:2012
28.000.000 I ioriy Kor-iy Govcrnnient 4.2s’% 17:08?2009
20.000.000 Hong Kong Mortqage 3.ol% 10:01 201 1
~0.000.000 Kowloon Cantclri Hailway FMTN 4.65% 10:08:2013
10,000,000 Sur1 I Iurig Kai Propertics 3.94% 16/01 12013
Total Transferable Securities and Money Market Instruments Admitted to an Official Exchange Listing
2 14,537,347
5,362,715
59,262,895
34.577.602
37,190.738
28.tiS8,YOU
19.904.000
1G.831 . i89
9,711,000
72.50
1.81
20.0)
11 .<<$I
12.3;
G.70
8.73
6.70
3 2d
214,537,347 72.50
Number of shares Transferable Sec;urities and Market !’. 01 Principal Moriey Market Inslrurncnts dealt Valuc Net Amount o r 1 ariottier Hcyulated Market HKD Assets
Hong Kong SAR 18,958,200 6.41 HKD
13:17:7010 18.%8.200 8.41 19,000,000 Hong Kong Mortgage 3.68%
Total Transferable Securities and Money Market Instruments dealt on another Regulated Market 18,958,200 6.41
Number of shares Market ‘7,; or Principal Other Transferable :;et:urilics Value Nct Anlourit not dealt or1 arwltier I kyulatcd Market HKU Assets
Hong Kong SAR HKD
I-1KD
10,000,000 C1.P Power Hong Kong Finaricirig
17.000.000 MTR Cayman lslarids TM I N 4.15% 5”o 30,‘09,20’3
1 3! 1 1 ;200!)
Total Other Transferable Securities not dealt on another Regulated Market
27,416,180 9.27
10.193.140 3:15
1 /.223.040 5.87
27,416,180 9.27
Schroder ISF us Dollar Bond
Number 01 share:; Transferable Securities and Market ’% or Principal Moncy Market lnstrurrierits Adrriilted Value Net Amaunt to arr (3dicial Exchanae I istiri~i USD Assets
Luxembourg USD 835,000 lelecom ltalia Capital 7.771 ‘3h
04:0ti,’?i338
Serbia L.wU 424,824 Republic ol .C;t?r!rbia HcgS stcp coupon
01 :11,202.1
United Arab Emirates USD 3,045,000 Abu Dhabl Commercial Barik tI iN
09:03;?01 fi
United Kingdom US0 l l S U 835.000 HSRC 6.5% 15:09:203/
United States of America USU 805,000 AT&T 6,4% 15~05/2038 IJSU USD 1,020,000 Chubb 85% 1 U S ) 1 ,725.000 Citigroup 8.12
1,140.000 tIU0S I54A B73% 21:052018
2.375.000 BellSouth 4.75% 1 5 ’ 1 1:2012
lJS3 81 0,000 CSX 7.45”’~ 0 1,’04;2088
1153
USD
(IS0 US0 US3 905,000 PcpsiCo 5% 01:0F:7018 USD
1305:2038 USD
0 1 :oti:201 B LJSU
5.90% 1 ?:01:2015 USD 1.540.000 I imc Warner Cable 5.85%
ol:o:s:P017 USD 2.985.000 Verizon Cor~irIiiiriicaLioI1s 5.25%
15:04:;?013
1.5i)5,000 Gerieral Elcctric Capital MTNA 5.875?? 15;02;2012
1,895.000 JPMorgari Chase K Co. 4.75% 01 :05:?013
1 .10U,UOU Nevada Power 5 875% 15:01;2015 1,845.000 ONEOK Partners 0.15% 01:10,’201rj
985.000 Philip Morris Iriterrraliornal (5.375YL
1 ,ti00.000 Hcynolds /!meriCdri 7.f25”,6
I ,900,000 Stingray Pa:;t; I through Trust 144A
Total Transferable Securities and Money Market Instruments Admitted to an Official Exchange Listing
Number of shares or t’rincipal Amount or1 arioltier Reaiilatcd Market
Trarislerable Securities and Moriey Market Instruments dealt
858,180 0.22
O58.180 0.22
392,282 0.10
382.282 0.10
2,786,784 0.73
2.Xol.784 0.73
1,657,820 0.43 1.064.43/ 0.28
593.383 0.15
22,634,896 5.88 585.553 0.16
2,359,479 0.81 993,492 0.26
1,190,856 0.31 823.038 0.21
2.103.498 0.55
1,559,198 0.40
1.844323 0.48 1,083.889 0.28 1,832,213 0.48
884.177 0.23
958.45 1 0.25
1.877.859 0.54
285.000 0.07
1.438.‘380 0.38
2.Y84.091 0.77
28,329,962 7.36
Market ?O Value Net USD Assets
Total Investments
Other Net Assets
Net Asset Value
260.91 1,727 88.18
34,965,598 11.82
295,877,325 100.00
Netherlands IJSU
United Kingdom LJSU USD 1.3G0.000 HSBC ti.84:, 01:06:2038
United States of America US[)
IJSU
US13 360.000 Bank of Arrieri(;a 6.1 15:08?201 / IJSU
1 ,~130.000 INC; f3arik 154A 5.125% 01:057015
1 .090.000 narclRys Bank 5.45>‘> 12:0!3:2017
1 .180.000 Amcrican lnternatiorial M I N 4.95%
1.2/0,000 Assured Guaranty US variable 20:wd:20 12
15:12:2066
132.359 Citigroup Mortgagc Loan Trust 2003- 1 h‘A2 8.59:. 25,’06/7031
1,391,543 1,39 1.543
2,450,123 1,109,338 1.340.767
382,555,539
1.1 39.609
(312,844 354.855
401.148
0.36 0.36
0.64 0.79 0.35
94.13
0.30
0.74 0.10
0.10
!
I
I i
I
I
!
I
I
I I I
i i

Schmder International Selection Fund Serni-Annual Report June 2008 Page 21 1
Portfolio of Investments as at 30 June 2008 (cont) Schroder ISF US Dollar Bond (cnnt)
Number of shares Transferable Seciirittes and Market ?!, or Priricipal Money Market Instruments dealt Value Net Arnomt on anolher Regulated Market I IS[) Assets
Unitei IJSD
IJSD
L J X I USD
USD
USD USU
I K K J
LJSD
USD
USD
USD
USU
USD
Iusn
USD
USD USD
IJSD
LED
t I:;D
IJSD
USD
USD
LJSD
IJSI)
IJSD
USD USD
USD
IJSD
USD
usu
IUSD
I JSD
d States of America (cont) 1.71(2.181 Citigroup Mortgage I oan Trust 2003-
IJF3 A2 755 25:09:2@33
15~11:?015 534.000 Cclorado lntcrstate Gas 6.8?,,
7,415,000 Corncast 6.1% 15/05/2038 9.560.RR1 Chiintrywide Alternativc Loan .Trust
10,720.1 22 Coiiritryide Alternativc Loan .lrLlsi
49,100,000 FHLMC 5.5% 15!07/'7038
2007 25 IA? 6.5% 25:11:2037
2005 65CB 1A7 5.5% 25,'012038
2,553.080 FHI MC (Gold) Pool N ' A66324 ti.58
4,416.747 FHLMC (Gold) Pool N- R13067 4.5Y 01 A 0;2037
01 /03:20 1 9
01:'08:2033
01 .'05!2037
01 :I 0:2032
01:12:2028
01 :I 2'2028
0 1 /07:2033 842.851 FNMA Pool N.' 555783 4.596
01:1 0!2033 2,327,498 FNMA Pocil N' 6//018 5.5%
01 ;01:2033
1 1,748.1 1 A FHLMC (Gold) Pool N C01598 5%
11.776,920 FI II MI: (Gold) Pool N C027Y3 5?;
2.01?,510 rNMA Pool N. 251177 5.5%
512.546 FNMA Pool N" 5351 26 6%
178,574 rNMA Pool N' 545259 7.596
12,231,399 FNMA Pool N^
715,000 I-TI Consulting 7.62591 15/06/2013 62.768 GNMA I Pool N' 351 158 7%
15/08/70?3
15/09:2023 ,366.533 GNMA I Pool N" ti04949 5.5%
1 mi /7(334 106.801 GNMA I Pool N' 604564
15/01 :2034
15:01 :2035
15!05:2034
15:1 0/7034
20;093:2037
FRN 25;06/2033
88.411 GNMA I Pool N' 35?079 7%
300.793 GNMA I 1:'001 N' 637386 5.5"b
21.149.78R GNMA I Pool N' 7817465%
23,850.287 GNMA I Pool N 182248 5.54:
11,1/R. 757 GNMA 11 Pool N' 4028 R7h
31.631 Hornc Eqiiity Asset Trlust 7003-1 82
1.800.000 LB LJBS Commercial ust 2003-C5 A3 4.254%
3.985.000 MRNA MTNF /.5?0 1 11.285,000 Merrill Lynch Mortgage lrusi 2002
10.090,000 Merrill I ynch Mortgage Trust 20M
2,675,000 Michrierican Fnergy 144A 5.75% 01?31:2018
3,770,000 Morgan Stanley Capital I 2003 I1 1 A3 4.85% 13:06!2041
20.512 Option One Mortgage I oan Trust
MWi A4 5.6198 123:07'?0:34
HPC 1 A3 variable 1 ?;I 0/7041
2002-3 M2 FFiN 25!08;703? 770.000 Pcrncx Project Fiinding Mdsier Trust
l44A 5.75% 01MW2018
6.5iSh 01 ;05/2018 1 .I 60.000 Plairis All Arnerican Pipeline 144A
1,/40./18
55?.86? 2,245, ti8 1
8,588,342
10.138.1 64 48.628,l 25
?.5?7.279
4.318.662
10,773,588
11,280,082
1.981,070
316,391
135.608
12,043,237
780.42 I
2,291.131 733,649
65.887
103.335
1.35ti.711
106.033
29R.631
20.455.791
23.678.858
11,318.491
1.391
4.7 1 2.832 4,247.879
11,302.2313
8,780,253
2.6/5.192
3,736.573
10,547
766.150
l.lti1.7ti2
0.45
0.14 0.58
2.23
2.63 12.63
0.68
1.12
7.80
2 93
0.51
0.13
0.M
3.13
0.20
0.59 0.19
0.02
0.03
0.3h
0.03
0.08
5.31
6.15
2.94
0.00
1.22 1.10
2.93
2.51
0.68
0.97
0.00
0.20
0.30
' Mole). M;irk(:t Iri!;trw-wnt5 that fa'l tinder Artlclt J 1 1 h c' the 13); dated 20 D f m m t ~ r ~ 70W
Nmher of shares Iransferable Securities and Market "G or Principal Money Market lristrurnents dealt Value Net Arnount on another Reoulated Market I J X Assets
United States of America (cont) t K D I JSD
850.000 PNC Bank 6.87555 01!01:2018 19.330 Salornon Brothers Mortgage
Ckiirities VI1 7001-CPI31 A FRN 25:12/2330
Loan Triist 2003-RC11 M4 FRN 2 5 1 0,'2033
USU 83.555 .(;triic:tiireci Asset Investment
IJSD
US[) USD USD USD USD IJSD USD
IUSn USD 11,110.000 Wachni,ia Bank Cnrnmercial
41 ,267 :.3riicti.ired Asset Investment Loan lrust 2004 1 M4 FRN 25:0?/?034
4,000,000 US Treasury 2.125% 30:04:2010 49.045.000 IJS Treasurv 2.6257'0 31:05/?010
4 1 60,000 US Treasury 3.5% 31 /05/2013 31.080 000 LJS lreasiiry 3.875% 15/05:7018 20.365.000 US Treasury 4.5?!, 30:11:2011
4?0.000 US Treasuy 5% 15/05/2037 18.725.000 US lreasury Inflation Indexed Bonds
2.375% 15!01/2027 1,705.000 Viacom 5.15% 05'1 0/'2037
Mortgagc Trust 2005 CIS A5 4.661 :h 15/05:2044
Total Transferable Securities and Money Market Instruments dealt on another Regulated Market
Number 01 shares or Principal
Money Market lristriirnerits other than those dealt
874.190 0.23
18.482 0.00
45.146 0.01
1.80'2 0.00 :!,SR5,R%5 103
49.022.010 12.73 4.183.400 109
30,798,338 8.00 21,781,425 5.53
451.828 0.12
18.709.000 4.86 1.636.469 0.42
13,589. (38 3.53
366,397,205 95.13
Market C s b
Value Net Arnount in on a Regulated Market* lJSD Assets
United States of America 26,900,740 6.98
USU 18.000,000 Toyota Motor 08 09/09/?008 17.913.025 4.65 USD 9,000,000 Barclays U.S. 0% 21/07:2008 8.9R7.715 2.33
Total Money Market Instruments other than those dealt in on a Regulated Market' 26,900,740 6.98
Number 01 shares Market "b or Principal Other Transferable Securitics Value Net Amoiint riot dealt or1 ariother Regulated Market USD Assets
Uriited States of America 1,514,7413 0.41 USD 1.620.000 ITC l14A 5.8W4 30:09:2016 1574.749 0.41
Total Other Transferable Securities not dealt on another Regulated Market 1,574,749 0.41
Total Investments 423,202,656 109.88
Other Net Liabilities
Net Asset Value
(38,068,651) (9.88)
385,134,005 100.00
I

Page 21 2 Schroder Internntiorial Seleclion Fund Snmi-Aririual Report June 2008
Portfolio of Investments as at 30 June 2008 (cont) Schroder ISF Asian Bond
Number of shares Trarisferable Securities and Market 4 or Priricipal Money Market Irislrunients Admitted Value Net Amount to ari Ollicial Exchange Listing USD Assets
Bermuda
I J S L I tJSU
l K D
tJSD
USD 18,300.000 Asia AltlrTiinulll RcgS 8% 23;l?;?fil 1 10.000.000 BW ReyS 6.675% 28:08:201 I 7,500,000 Harig rimy (;(!Id lechnology 9.2a0,c
13.500.000 Hopson Developrrieril tleyS 8.125%
10.7'30.000 Titan Petrocherriicals I iegS 8.59;
17/10:20 14
09,11:2012
18/03:2012
British Virgin Islands lJ:.;0
USD
Canada USD 1,930.000 Sino-Forest RegS 9.125%
15.600.000 Galaxy Entertairirrierit kiriancc Hc9S
17.600.000 URC Philippines 8.25% 7O:Ul?%O12 9.075?2 151 2'20 I2
17:08:201 1
Cayman Islands USD USU
EUR
ClJR
USD USD
10.000.000 Agile Property RegS S% 2 5,000,000 Greentowri Ctiiria IicgS '3
6,000,000 Hulchison Whampoa Firiarice 05
15,000.000 Hutchison Whariipoa Firiaricc 06
08; 1 1 ~'20 13
G00,000 Parkson Retail i.1759; 3'3:05'2012 3.800.000 : ; t i i r r i x ~ Prupcrty Reg3 8%
01:12?2016
China EUR 25.500.000 Peoples'% Republic of China 4.25%
28:l 0:201 .I
India lJ:313 US[)
15,700.000 IClCl Rank RegS variable 1) 4.500,000 Reliurice Industries HegS Y.
24:0ij!~Ow
Indonesia IUH . :3.0Km.333XG Barik Uanamcn Indonesia 10.tP~
19:0,1:2012 Iridoriesia Covcrnnient 10% 1 >:0/,2017
13:0ti:2015 Indonesia Rewi)italiLaliori Hurnd 13.15% 15/01,2012
1 ;,500.000 I ippo KardVb,>l::l ~ l I l X ~ K 8.875% 09:03120 1 1
1 Indonesia Gowrrirrieril :
USD
Kazakhstan IJSl)
Netherlands 1.193
LJSU USD lJSD 5,000,000 CcntcrCrcdit International Reg:;
USU
ti.OOO.000 ATF Bank Regs 9.25% 17/04:7012
5,200,900 Arpeni Pratarria (kedri I irie Investmerit Reg:; 8.75% 03,
5,400,200 ATF Capital Reg:; 9.25% 21 8.200.000 BIT Firiarice HegS 7.5% 15:05:2014
8.625?5 30:01:7014
31:10:2011
2 1 .'Oi:20 10
3,200,000 Fajar Paper ririarice 10.75:h
USD 14,OOO.OOO C; 1 2005 BONDS 10.25";
USD ti.800.000 KazMunaiGaz ririarice :;ut) I ieyS 9 175% 0707:2018
47,086,800 17,522,230 8.3F11i.750
ti.225.0'30
8,302,500
ti. 150.300
27,429,671
14.381.2YY 13.045.377
1 ,558,950
1 ,YS8,950
44,230,706 8.58M40
3,573,375
K217.384
20,GGO,E07 530.500
2,880,000
37,195,l 22
37,195,122
18,843,l 75 13,187,715
S.ij55.9DO
102,987,190
11,846.YDB
7ri.992.451
32,050,390
15.294.S37
1E.7'3,1,52Y
6,193,680 6.1 Y3.580
65,488,355
4,147,000
5,471,885
4.60ti,140
3.04i.588
5,483.709
12,705,000
2.00 0.75 0.38
0.20
0.35
0.20
1.17
0.w 0.55
0.08
'3.00
1.88 0.37
0.15
0.35
0.88 0.02
0.1 1
1.58
1 5 3
0.80 0.5G
0.24
4.38
0.51
1.15
1.35
0.65
0.il
0.26 0.26
2.78
0.18 0.23 0.23
0.20
0.13
0.54
6,777,014 0.29
Number of shares Trarislerable Securities and Market Sb or Priri(;ipiI Money hlarket Irislrumcnts Admitted Value Nct Amount to ari Otiicial Exchange Listirig USD Assets
Netherlands (cont) t JSU
US0
USD
I.860.714 Media Nusantara Citra 10.75?0 12:0I);201 1
14:l 1 :2011
25:04:?013
10.000.000 Pakuwori Jati F-iriarlce 12%
7,000,000 ruranAlem Firiarice HegS 7.757''
Pakistan lJSD 4,200,000 Paki:;tnn Mobile Communicatioris
HcyS 8.95VC 13,,11:2013
Philippines USD
USD
USLl
4,973,500 CE Casecriarl Water & Energy 1 1 .Y5?, 15:1 1 :2010
1.5ijO.000 Develuprrienl Hank of Philippines variable perpetual
9,100.000 Metropolitan Hank & Trust variable
15'03?201 d
Singapore US3
lJS3
7.000.000 Uavomas Interriatior ial hnancc Reg3
9. i00,000 GITI 1 ire 12.25 11 "% 09:05:20 1 1
South Korea lJ:.;D
EUFI
12.000.000 H,riix :.;erriic:onductor HegS /.8/51b
ii,BOO.OOO Korea Expressway t M I N 4375% 27:08:2017
2 //09/2010 Korea. Trcasury Bond 5.75% 1 0:09:2015 Korea Treasury Uorid 5.54: 10:09:20 1 7 Korea l i c a s u ~ Bond 5.750.6 10,'12:701C
07:1 1 :201 5 EUR lB.100.000 I-lcpublic of Korea 3.f2515
Taiwan IViD 200,000.000 Taiv:ari C;owrnrncnt 1.13%
W;0 170,000.000 laiwan Goverrirrierit 2 9 20:07:201 1 I w D .: -16 OCC 332 laiwan Covernmerit %.375%
000 Iaiwdrn Government 9 376%
TVK 7?5.0(30,000 .laiwdrn Government 3.025%
0ti:01:~011
10;01:%013
21:09:201 I
08:03;2017
Thailand lJ$D IJSO
Total Transferable Securities and Money Market Instruments Admitted to an Official Exchange Listing
8,600,000 G Steel 10.516 04:10!2010 4.200.000 .True Move Regs 10.75'70 1 &'I 2;20 13
7,584.107 0 32
'3.701 ,000 0.41
5,963,712 0.25
3,444,000 0.15
3,444 000 0.15
48,151,063 2.05
5,172,410 0.22
1,533,745 0.07
9.199.536 0.39
32245.342 1.37
15,642,208 0.66
7,057,708 0.:30 8,584,500 0.36
165,706,103 7.04
9210.000 0.38
18,552.4GG 0.79
20.58u.88/ 0.88
85,8fj0.910 3.65
22,414,631 0.YS
190,513,240 8.10
6,494,572 0.28 5,530,655 0.24
171.1/8.442 5.15
32514.007 1.38
24.794.904 1.05
11,267,881 0.48 7.600,880 0.32 3,66/.701 0.1 6
786,138,144 33.41
I
~
i I
I
I
I
I
i i I
I
I
I I
i I
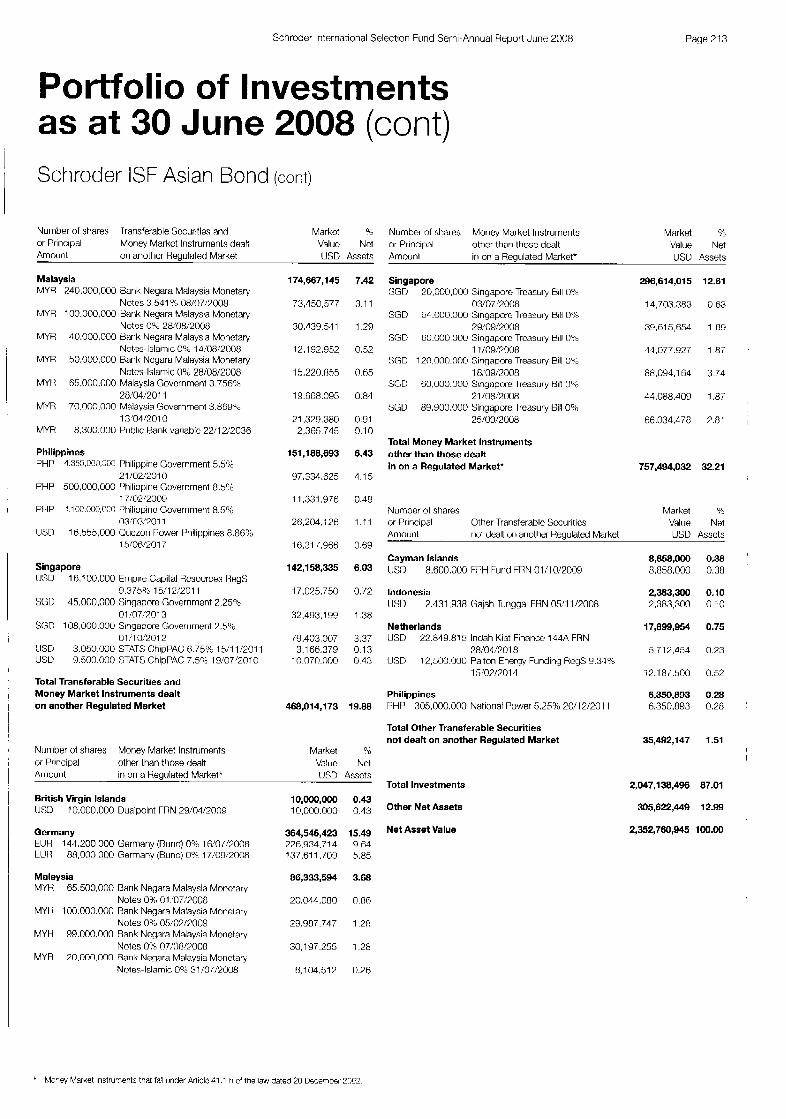
Schroder International Selection Fund Semi-Annual Report June 2008 Page 213
Portfolio of Investments as at 30 June 2008 (cont) Schroder ISF Asian Bond (cont)
Number of shares Transferable Sccurities and Markct 4;
or Principal Money Markct Instruments dealt Value Net Amount on anothcr Reaiilated Market USD Assets
Malaysia MYR 240,000,000 Bank Nsgara Malaysia Monetary
Nctcs 3.541 OS 08:07:?008 MYR 100,000,000 Bank Negara Malaysia Monetary
Notcs 0% 28:08:2008 MYR 40,000.000 Bank Negara Malaysia Monetary
Notes-lslainic 0% 14:0Ri2WR MYR 50.000.000 Bank Ncyara Malaysia Monetary
Notes-Islamic 0% 28!08!2000 MY1 1 R5.000,000 Malaysia Govcrnrnent 3.756Yn
28!04:2011 MYR 70.000.000 Malaysia Government 3.869%
MYR
Philippines PHP 4.3:;5,0?17.300 Philippine Government 5.591
PHP 500,000,000 Philippine Goverrirnent 8.5%
PI IP ' 1 0 C . O f i f l P f i Philippine Governrrierit 8.5%
lJSD 16,555,000 Quezon Power Philippines 8 85%
1 3'04/?010 8,300.000 Piiblic Rank variable 221 2:2036
21:02/2010
03:03:?011
13/0fi:2017
Singapore lJSU
SGD 45,000,000 Singapore Government 2.25%
SGD 108.000.000 Singapore Goverrirnerit M 0 . 6
USD USU
Total Transferable Securities and Money Market Instruments dealt on another Regulated Market
1fi,l00.000 Empire Capital Resources ClegS 9.3759b 15/12:2011
01 ;072013
0 1 !I 0!2012 3.050.000 STATS ChipPAC: 6.75"; 15:11~2011 8.500.000 STATS ChipPAC 7.5% 19:07;2010
Niimher 01 shares or Principal Amount
Money Market Instruments other than those dealt in on a Heaiilated Market*
174,667,145
73,150,577
30.139.541
12,192,952
15,220,855
19.668.095
21,379,340 2,365,745
151,188,693
97.334.625
11.3,:11,976
2R,204,11R
1Fi.31 1.955
142,158,335
17.075.750
32,483,189
/9.403,007 3.1 65,379
10.070.000
46a.oi4.173
Market Value
7.42
3.1 1
1.28
0.52
0.w
0.81
0.91 9.10
6.43
4.15
3.48
1.11
0 69
6.03
0.12
1.38
3.37 0.13 0.43
19.88
0,;
Net
British Virgin Islands LEX1 10,000.000 Dualpoint FRN 29!04:2009
Germany EUR tu11
Malaysia MYR 65,500,000 Bank Negara Malaysia Monetary
MY1 1 100.000.000 Rank Negara Malaysia Monetary
MYH 99.000.000 Bank Negara Malaysia Monetary
MYR 20.000.000 Balk Negara Malaysia Monctab
141,200.000 Germany (r3i.irid) 0% 16!0/:2008 88,000,000 Germany (Bund) 0% 17:09;2008
Notes 0% 01!07:7008
Notes On,$ 054Y/?009
Notcs 09h 07!(38:7008
Notes-Islamic 0% 31 :07;2008
10,000,000 10.000.000
364,546,423 226.934.71 4 137.61 1 .I09
86,333,594
20,044,080
29.987.747
30.197.255
R.ID4.51?
0.43 0.13
15.49 9 M 5 85
3.68
0 86
1 28
1.28
0 76
Number of shares or Principal Amoi.inl
Singapore SGD 20,000.000 Singapore Treasury Bill E?,;
03/07:2008 SGD 54.000.000 Singapore lreasury Bill 0%
?9:09:2008 SGD 60.000,000 Singaporc Treasury Bill 0%
1 1/0W?X)R SGD 120.000.000 Singapore Treasury Bill 05,
18:09!2008 SCD 60.000.000 Sinyapore Ireasury Rill 0".6
21 ~08!%008 SGD 89.900.000 Singapore Treasury Bill 07"
25/0'3/2iK18
Money Market Instruments other than those dealt in on a Regulated Market*
Total Money Market Instruments other than those dealt in on a Regulated Market*
Market .?j
Value Net US13 Assets
296,614,015 12.61
14,703.383 0.63
35,615,654 1.69
44.077.927 1.87
88,094.1 64 3.74
44.088.409 1.87 ,
66,034,470 ?.81 I
757,494,032 32.21
Number 01 shares Market % or Principal Other Transferablc Sccuritics Value Net Amoiinl riot deab clli another Reaulated Market USD Asscts
Cayman Islands US0 B.tiOO.000 FPH Fund FRN 01;10~2009
Indonesia USD
Netherlands USD
tJSD
2.431.938 Gajah runggal FHN 05!11/2008
22.819.815 Indah Kiat Finance 144A FRN
12,500.000 Paiton Energy Funding RcgS 9.34°,; 28!04:2018
15:07/7014
Philippines PHP 305.000.000 National Power 5.25% 20!12:2011
Total Other Transferable Securities not dealt on another Regulated Market
Total Investments
Other Net Assets
Net Asset Value
8,858,000 0.38 8.858.000 0.38
2,383,300 0.10 2383,300 0.10
17,899,954 0.75
5,712,454 0.23
12.18/.500 0.52
6,350,893 0.28 6.350.893 0.28
35,492,147 1.51
2,047,138,496 87.01
305,622,449 12.99
2,352,760,945 100.00
' M c ~ y hkket Instru-ents that fa'l lrndef Afll~I:: A1 .I t1 c' the iav! dated 20 Uecembef 2 3 W

Page 214 Schrodcr lntcrriatiorial Selection Fund Scmi-Anriual Report June 2OC)H
Portfolio of Investments as at 30 June 2008 (cont) Schroder ISF Asian Local Currency Bond
Number of shares or Principal Amour iI
Hong Kong SAR HKU
HKU
I IKO
I IKD
HKD
I IKD
Iraiisterahle Securities arid Moncy Market lnstrumerits Ahlit led to an Official Excharlye Listing
70,000,000 Hong Kong Governmerit 1.52?5
23,000.000 Hong Koriy (;oi,ernincrnt 1.7
19.000.000 Hong Kong Goverrirrierit 2.03:1
28.000.000 Hong Konq Goverrirrierit 2.09'-
73,000.000 Hong Kong Goverrirrieril 3.33%
14.000.000 Hong Kong Goverrirrieril 3.70%
15:02:2010
17:05?2010
10/03:2013
71:1 2,2009
14:06?010
20~09i2010
Indonesia 00 Indonesia Goiernmerit 9.516
03 Indonesia Goverrirnerit 17.5% 15:0ti:2015
15;03:2013
Thailand THB 100,000.000 Batik 01 I Iiailand 3.825%
02:05:2011 TI I13
13:1)8:2010 TI-lD
1 :3:03:2013
55,000.000 Thailand GoverrirriwL 4.25%
11 0.000,000 Thailand Goverrirrierit 4.75%
Total Transferable Securities and Money Market Instruments Admitted to an Official Exchange Listing
Number of shares or Priricipal Amount o r 1 arioltwr Hcuulated Market
Transfxablc Securities arid Money Market Iristrurtieri1s dealt
Market 3; Value Net USD Assets
17,228,477 20.24
3.540.C42 5.81
2.21 3.406 4.78
2,313,141 3./9
3,618.382 5.93
7,997,210 4.51
1.841.955 3.02
8,327,840 13.65
1,004,106 2.98
2.690.623 4 38
3,8ti1.111 0.33
7,610,713 12.48
2.a09.021 4.71
1.621.28Y 2.x
3.1 16,tiOU 5.11
33,167,030 54.37
Market !% Value Net USD Asset:;
Malaysia 6,831,998 11.20 MYR 11,200.000 Malaysia Governrnerit 3.833%
28:09:m11 3,388,827 5.55 MYR 11.300.000 Malaysia Goverrirrierit 3 869?>
1 :5:04;2010 3:1~13,171 5.ij4
Singapore 7,136,668 11.70
01 ,04/2010 3.B14.t108 5.92
01 :07:2010 3,523.0iY2 5 . iB
SGD 4.000.000 Singapore Gomnmerit 7.825%
SGII 4.500.000 Singapore Government 4.623+
Total Transferable Securities and Money Market Instruments dealt on another Regulated Market 13,970,666 22.90
Number of shares Moriey Market Instruments Market 96
or t'rincipal other than those dealt Value Net in on a Regulated Market' USD Assets Amourit
Malaysia 2,267,048 3.72 MY3
Notes 0% 13'1 1 :XI08 7,787,048 3.72 1.500.000 Brmk Ncyara Malaysia Monetary
Singapore S G D
S G D
8.700.000 Singapore 1rw:;ury Bill 0%
800.000 Singapore Trea:;ufy Bill 0% 21:08:2008
28:08/2008
6,876.1 53 11.43
3,38$,088 10 47
58/.08> 096
Total Money Market Instruments other than those dealt in on a Regulated Market* 9,243,201 15.15
Total Investments
Other Net Assets
Net Asset Value
56,380,897 92.42
4,821,221 7.58
61,002,118 100.00
I

Sctirodcr lntcrnational Selection Fund Semi-Annual Report June 2000
Portfolio of Investments as at 30 June 2008 (cont) Schroder ISF EURO Corporate Bond
Nurnbcr of shares Transferable Securities and Market '% or Principal Moncy Market In:itriirnents Admitted Value Net Amount to an Official Exchange Listing EUR Assets
Belgium EUIi
tlJR
EUIi
FUR FlJH
Bermuda IJSD
750.000 Rarry Callebaut Services W.5
300,000 Fortis Bank EMTN 4.375%
300,000 Fortis Rank EMTN variable
300.000 korlis B~r iq i ie variable perpctual 250.000 Fortis Bank Regs variable perpetual
13:07:201/
01 :02:2017
23/03/2021
440,000 Pctroplus Finance Reg:.; 7% 01 /05:2017
Denmark t I JR
FlUR
EUR EUR EUR
600,000 Danskc Bank t M l N 4.75%.
1 .000.000 Danske Barik rMTN variable 29.'06,2012
18:08:2011 250.000 Dong t-riergy 3.50.; 29!06!2012 250,000 Dong Energy variablc 29/06/3005 250,000 Nordic Telephone Regs 8.25%
01 ,'05'701 6
France EUR
tLUR EUti
El JR ElUR
t IJR
I IJR
ElJR rl JR
EUR
CUR FUH
EUR
EUR
ElJli C l JR
EUl7 nm rl IR
FlJR
EUR
EUR
ELJR
EUR
EUR
2.000.000 Autoroiites du Sud de la France 5.6?5 '7'0 04/07/2022
1,000,000 AXA variable 15:17:2020 2,000,000 nanques Populaircs Covered Boricj
EMTN 1.6258 0205!2011
2.000.000 BNP Paritms rMTN 4.755 250.000 BNP Paribas 4.875?; perpetual
01:M901 1
17i17;?017_
0 /:09;20 1 7
?50,OOC BNP Paribas t M 1 N 5.25%
300.000 BNP Paribas EM I N 5.431 ?5
750,000 BNP Paribas variable 31 ;17/?049 2,000.000 Caisse d'Amorlissement de la Clette
2.000.000 C R I S S ~ Refinancement de I'Habitat Sociale 3.1 25% 1%!07/7010
4.375% 11/1 0/2010 250,000 Carrefoiir FM 1 N 5.12546 10/10!2014 350,000 Casino Guichard Perrachon 6.3759.5
CM:04:2013
4 1'6% 21/07/2011
1 1 :04!2017
1.750.000 Casirio tiuichard Perrachon EMTN
250,OW Cie de Saint-Gobain EMTN 4.154;
210.000 CMA CGM RegS 5.58 1f/05/7017
500,000 Crown Europcan 6.25% 01/09:7011
750.000 France leleconi EMTN 3?,&
150,000 France Telecorn EMTN 4.3759:.
250.000 rrarice Telecorn EMTN 4.75%
750.000 France Telecom EMTN 5.625%
500,000 France Telecorn EMTN 7.25%
250,000 rrarice Telecom EMTN 8.125%
250.000 GIk S i w Alliance EMTN 5.5";
250.000 EDF 5% 05/02/2018
11:1 0:2010
2 1 /02!20 1 2
21 :02/2017
T7;05/?018
28/01 i2013
28;01:2033
2 3 1 1;2012
1,233,341 0.95
736.875 0.18
272.828 0.71
255.865 0.20 277.2?0 0.?1 190.553 0.15
247,058 0.19
24/.058 0.19
2,139,349 1.63
480.412 0.37
970,324 0.71 231.1R5 0.18 228.898 0.17
778.750 9.17
22,682,196 17.29
1,875,138 1.39 907.iRK 0 76
1.949.158 1.19 165.833 0.13
1,956,525 1.49
24f.813 0.19
790.190 0.22 208,383 0.1 6
1,929.ml 1 .4 /
1,955.585 1.49 242.928 0.19
343.019 0.28
1,195,203 0.91
215.437 0 1 f 176.080 0.13
9ffd.l?0 0.14 3/0.000 0.36 210.195 0.18
/10.562 0.54
142,397 0.1 1
230.311 0.18
741.8Cd 0.18
523.160 0.40
207.641 0.23
219.236 0.10
Page 215
Number of shares Transferable Securities and Market % or Priri(:ipaI Money Market Instruments Admitted Value Net
EUR Assets Amount lo an Official Fxchanoe Listinn
France (cont) EUR 2.250.000 Klepierre 4.fi25% 15'07~2011 FUR EUR
EUR
?50.000 Pernod-Ricard 4.625% 06!1 2/2013 150.000 Ilemy Coinlreau ReyS 5.7%
250,000 Societe Ccnerale t M l N 5.25?,; 1 5!01 i2012
28:03/2013 ElJli 250.000 %mete Gerierale EMTN 5.62%
13!02!2012 ElJR EUR
ElJR 500,000 Vivendi 3.875".6 15;02:2012
Germany FUR 250.000 Allianz EMTN variable perpetual EUR 250.000 Bayer tM1-N f ? L 10,04!701? ElJR 500,000 Bayerische Landesbank EMTN
4.375% 22:01/2014 FUR 500,000 Bayerische Landesbank EMTN
5.375?0 12/0;/:2011 EUR 250.000 Baycrischa Landesbaiik t M I N
5,/5% 23!10:'2017 EUR 500,000 Bcrtclsmann EMTN 3.625%
06!10!2015 EUri 2,000,000 Kreditaristalt fuer Wiederaufbau
lMTN 3.54; 15:07/2009 EUR 1,000,000 Muenchener Rueckversicherungs
EUR 250,000 Muenchener Rueckvcrsicherungs
TlJR
1,250.000 Societe Chierale variable perpetual 500.000 Veolia Environnement EMTN 4.87515
28/05!2013
variablc 21/06/2023
variable perpetual
26:10:'2012 7~0.000 RWE Finance EMTN 6.125%
Ireland EUR
FUR
CUR
ElJR
ElJR
EUR
FlJR
EUR
Italy EUFi
EUR EUR
EIJIi
LUH
EUR
t I J l 4
t l l t l
750.000 GE Capital European Funcling tFMTN
SO0.00c) GE Capital Europcan Funding tMTN
250.000 GE Capital European Funding EMTN
250.000 GF Capital Furopean Furidinn EMTN
250,000 GF Capital European Funding EMTN
250,000 GE Capital European Funding EM 1 N
?50.000 GE Capital European Funding EMTN
250.000 GE Capital European Funding EMTN
3.3759; 08'0272012
4.125?5 05:02'2010
4,125:': 27; 1 0/20 1 6
4.75% 06/07:2014
4.75% IR/01/?011
4.75% 28/09;2012
4.8757; 0R/03/7013
5.375% 16/01:2018
500.000 Banca Montc dci Paschi cJi Siena EMTN 5% 7 5 1 0/7017
500.000 Enel 5.25% 20/06!7017 2.000.000 lntesa Sanpaolo EMTN 5%
2,850,000 lritesa :.;arip;lolo FMTN variable 28!04/2011
28:05!2018
31/03/2066
28/01 :PO1 1
17/03/2055
28:01:2019
250.000 Lottornatica RcgS variahle
1.000,000 Tclccom ltalia EMTN 4.5%
1.500.000 Telecom ltalia EMTN 5.25%
1 .?00.000 Telecom ltalia EMTN 5 .3 /546
2,141.1 1 1 1.63 225,505 0.1 7
138,750 0.11
242.566 0.18
246436 0.19 976,583 0.74
480.202 0.37 161.200 0.35
5,540,946 4.23 7?9.704 0.17 252.268 0.19
478.370 0.37
499.554 0.38
230.510 0.18
421,533 0.37
1.973.701 1.51
983.809 0.75
211.662 0.16
255.827 O.%L
2,624,253 2.00
703.925 0.54
490,3H1 0.37
224.779 0.17
232.427 0.18
245.485 0.15
?41.554 0.18
241.931 0.18
243.771 0.19
10,170,422 7.76
480.230 0.38 487,702 0.38
1,959.932 1.49
7,733.077 7.08
228.250 0.17
861.882 0.73
1,046.241 0.80
1,052,092 0.80

Page 216 Schroder Inkrinatinnal Selecttori Fur id Semi-Annual Report June 2008
Portfolio of Investments as at 30 June 2008 (cont) Schroder ISF EURO Corporate Bond ( c m )
Number of shares or Priricipal Arriourit
Italy (cont)
liansferablc Securities arid Money Market lnstruriierits Admilled to an Official Excharige Li::tiny
t l J l 1
EUR FIJf3 LlJ1-4
230,000 Telecorri ltalia tM.lN ti.25U,
500.000 UniCrcdit EMTN 4 375% 29:01:2020 250,000 UniCredit CMTN 4.8759: I2;02X)13 300,000 UniCredit I-M I N 5.75% 2ti!G9:2017
01/02:2012
Jersey FlJR
clln 250.000 HSRC Capital Furidiny:Jcrscy
250.000 HSBC Capital rtiridiriy LP:.Jcrscy Chaririel Islarid:; vatiablc perpetual
(;harirw Islands mriable perpetual
Luxembourg EUH
EUR
tUR
EUR
FUL
EUII
ELIR
FUR
760,00T! Coderc hnance LuxerniboiJry Reg3
150.000 Gaz Capital EMTN 4.59%
250.000 Ga7 Capital tM-IN 6.ti03'4L
500.G00 Gar Capital for Gazprorii CMlN
8.25"i 13:06:?015
09:i 2!20 12
13:02/2018
5.304'% 3 1 / 1 C:2014 3,000,000 Holcim Firiarice Ihxembourg EMTN
250.000 I ighthouse Iriterriulional HcqS 8'%
250,000 Iclcconi ltalia Finance CMTN 7.25::-
250.000 Wind Acquisition ririari(:e Regs
30/01:20 14
20:04:7011
9.75% 01:17:2015
Netherlands
EIJFt
EUR tUH
FlJR
FUR
EUR 750,000 ABN Amfo Hank 4.;3% 04:01:2014 S0@,000 ABN Arriro Hank FhlTN tj"5
250.00@ ABN Amro Bank variable perpelual 500,000 Alliari7 rir1aric;e II t M I N IUS
11'?01F 500.000 Allian~ Finance II FMTN
06;03;2013
14!@4:?010
1,000.000 Allianz Finance II variable 31 ;05/2022
CUR
EUR
EUR
ElJl 1 3. /54; 18:l 2'7013
EUR 4% 15:02:201?
EUR 4.6255; 13:UY;2012
t l l H 500,000 Deutsche Telekom International Finance ti.625% 11/07:7011
ElJrI 250.000 Deutsche Telekorri Iriterrialirlrrnal F-lrlarlc:e 8.1 25% 29:05:2012
tUH 250.300 Deutsche Telekoni Inlernational Finarice t M I N 3.25% lY!0l,'Xll0
EUH 250,000 Deutst:he TelekorTi Inlcrndional hnancc EMTN 4% ld:01:%015
EUR 250.000 Deutsche Telekorii International
EUR
ElJl 1
250,000 Rank Nederlaridse Geriieerilern tMTN
500,000 Harik Nedcrlandse Gemeeriteri rM1 N
1,000,000 Barik Nedcrlandse Gerneenteri CMTN
250,300 Bank Nederlaridse Gerrieentcn EMTN
500.000 Harik Nederlandse Gemeeriteri CM.1 N
50~1,000 Bank Nedurlandsc Gemeenteri rMTN
34, 15:04:?010
3.1255: 15:04?2011
xu:.;*,; rii:0~;2015
h r i ~ ~ ~ EMTN 4.3% 25:10:?013
5.175"5 02:10:2012
3.1 25's; 07:05:7013
7h0,000 C.ON Irilerrial onal Finance EMTN
120,000 E.ON lnternatiorial rir iarw t M IN
248.314 443532 230,502 290,851)
433,562
21 1.912
221.550
4,717,185
215.000
324.167
225,547
430.931.3
?,91F,3lli
19I.500
256.051
25 1.5ti3
22,044,123 i28.207
50'1.432 183,01 8
446.78 1
487.29P 985.704
235.767
741.3D0
4i3.80c'
907.231
734.784
481.867
191.3i'B
51 0,153
266.274
211.610
224.Y28
233.20I
24d.554
41 3.508
0.19 0 34 0.18 0.22
0.33
0.16
0.17
3.60
0.1 i
0.17
0.1 7
0.34
2.22
0.1.1
0.20
0.19
16.81 0.57
0.38 0.14
0.34
0.3/ 0.75
0.18
0.18
0 36
0. t iG
0.18
u.3 i
0.37
0.39
0.90
0.1 t3
0.1 7
0.1 8
e.19
0.32
Number of shares rransfcrable Securities and Market B 3r Principal Money Market lnstrurrier its Admitted Value Net Amwit to an Official rxt;tinnye Listing tlJH Assets
Netherlands Icont) roii
EUH
EUR
rm run EUR tUH tlJH
tl!l< rlJn
ClJI1
EUR
CUH
t l J H EUH
EUR
EUR
EU4
EU3
EUH
El JR
FlJr 3
Ell3
FUR
tl Jl-3
25;.006 F.ON Irilernational Finance EMTN 5.5?c: 02;10:201 /
1,700.000 Fortis Finarice T'M I N 5.54; 1 5:04:2U11
31;01:2016 250.000 Fresenius ririarice Kegs 5.5%
500.000 ING Rank t M I N 5,5?4 04!01:7017 250.000 ING narik EM IN 5.875% 2:1:07~2011
1,780,000 INC Rank FMTN vxiable 2Wl52023 2>0.000 IN(; Croep EMTN 4.759h 31:05:2017 30L'.000 IN(; Chcp EMTN 6.1?5'%
01;01:2011 250.000 ING Groep EMTN fl3b perpetual 300,000 KONINKLIJKt KI'N EMTN 4.545
1 n:03;2013 250,000 KONINKLIJKE KPN EMTN 4.5%
21 :07:2011
131 1 :2012
2~1!04'2012
1,1300,000 KONlNKLlJKr KPN EMTN 5%
250,uuO Lnde r iriarice EMTN 1.3/5%
230,000 L.ir idc Finance Variable 3:07:2049 1,000,000 Metro Finance EMTN 4.G259h
1.000.000 Metro Finance rMTN 4.75% 26:05201 1
29/05:2012
19~07:2010
18I01'70lG
15:07:2011
04;04/7012
1 G:01 2 0 1 7
(;mG:2022
250.000 Rabobank Nederland EMTN 3.1 25"G
250.000 Rabobarik Nederland EMTN 3.3/5%
250.000 Rabobank Nederlarid FMTN 3.fi25%
500,000 Rabobarik Nederland EMTN 4.1 25'3;
1,500,000 Habobanlc Nedcrland EMTN 4.75%
230.000 Rabobarik Nederland EMTN 4.75%
250,000 Siemens Firiaricieririysniaatscliappij
500,000 Syngerita ririarice t M TN 2 4.1 25Td
580,000 Uriilever tMTN J.BI3C:L 21!05:'2013 22:04;20 I5
Norway ELIR
CIJ I I
1 ,ti00.000 DnR NOR narik t M I N 5.875% 70:06:2013
20:09/2010 250.000 Eksportfiriaris M I N 4375%
Spain EUH
r IJI 4
tlJH
rui i
FUR
EUR
ClJl 3
EUR
500.000 Altadis Crriisiories hnancicras 4%
500.000 Rarico f31lbaci Vizcaya Argentaria
300.000 OOVA Senior Finance EMTN 446
2,000,000 Instittito de Credito Oficial EMTN
1 1 / I 2.231 3
variable 20: 10:201 Y
97:04;2013
3.51, 30:06:2009
5.125"s- 11:04:2011
74:i 0:2017
02:02,'201 1
07:02f1114
500.000 Santander Iriterriatiorial Ocbt EMTN
250.000 Santander Issuaricw tMTN variable
250.000 Te1eforiic:a tniisiorics EMTN 3.15%
2.750.000 Telefonica Erritsiories FMTN 4.8744:)
248.160
1,671,886
230.000 493,531) 253,847
1,1373.447 93),270
509,695 24/.939
2/fl.231
238.774
949,226
239,280 238.100
909,495
960,206
23Y.titi5
210.706
737.71t3
475.440
1 .38 I637
233.200
251,126
45Y ,411 I SB3.255
1,837,l 76
1,592,245
744,931
7,098,768
47/.50G
412,811
4 66.4 88
1,969,818
490.422
238.522
23T.2Y0
2,583.409
I
0.19
1.28
0.18 0.38 0.19 1.28 0.18
0.39 0.19
0.21
0.18
0.72
0.18 0.18
0.74
0.73
0.10 I
0.1 /
0.18
0.3d
1 .00
0.18
0.19
0.35 ,
0.43
1 .40
1 .?I
0.19
5.41
0.33
0.34
I
i
!
0.36
1.50
0.37
0.1D
0.18
1.97

Schrnder lnternabonal Selectinri Fund Semi-Annual Report June 2008 Pago 21 7
Portfolio of Investments as at 30 June 2008 (cont) Schroder ISF EURO Corporate Bond (cotlt!
Niurnber of sharcs Transferable Securities and Market SO Number of sharcs lranslernble Sectirities and Market 0.6 or I'rincipal Money Markct Instrumenis Admitted Valuc Net or Principal Money Market lnstrumcnts Admilled Value Net
FUR Assets Amount to ari Official Exchange Listiny EUR Asscts Amount to an Official Exchange Listing
Spain (cont) ElJR 750,000 Tclcfonica tiirope fMTN 5.1 25%
14/02/2013
Sweden EUR 3.750.000 Svmska Handelsbanken tMTN
variable 20!04:2016
Switzerland EUrl
F lJR
FlUR
760,000 Credit Suissc EMTN 4.75?h
250.000 Credit Siiisse rMTN 5.1 255'-
500.000 Credit Stiisse EMTN 5.125U-
24:09:?010
(41!M:2011
1 8:09/2017
United Kingdom EUR tun
FlJH EIJR
FUR
EUR HJR
EUR
EUH
EUI i
El Jn
EUI i
lJSD GBP
ELJR EUR EUR
tun
FUR EUti ElJR EUR
EUR
EUR
t-IJR
El Jri
EUR
EUR
EUR
2,i00,000 Abbey National variahle perpetual 4.000.000 Anglian Water Scrvices Fir,;iricirig
1 .000.000 Aviva variahle 14!1 1;2021 3.250.000 Rank of Scotland FMTN 3.375%
1,000.000 Barik of :;cotland EMTN 5.625%
t M l N 4.675% 07/10/2013
23:06;2010
73:05:2013 250.000 Barclays Dank EMTN 6% 23/01:201 8 250.000 Barclays Bank EMTN variable
750.000 Bardays Rank EMTN variable perpetm
750.000 BAT International Finance EMTN 3.GP50.b ?9;06/2012
R50.000 EAT International kinanc:e FMTN 5.875?,A 12:03:2015
750,000 GlaxoSmithKline Chpital FMTN 5.l?h% 1:3/12;2012
250.000 FlaxoSmithKlino Capital EMTN 5.625% 13A 2/2017
150,000 HBOS RegS 6.75% 21/05,'2018 250,000 HSRC Rank EMTN 4.75%
250.000 I 1SEC Holdings variahle 79/06/2020 500.000 I loyds TSR 5.87546 08:07!2014 550,000 Lloyds TSD Rank EMTN variable
?.000.000 Nationwide Building Society FMTN
perpetiial
21:03!2046
05/03!2018
500.000 Prudential EMTN variahle 1 9!1 ?/XI21 250.000 Rexam FRN variable ?9,'0&2067 300.000 I?oy;ll narik of Scotland EMTN 4.
500,000 Royal Rank of Scotland EM 1 N 4 75% 23,'01:2017
26!01!2016
10!05:2013 250.000 Royal Bank of Scotland EMTN
6.934% 09/04!7018 450.000 Royal Rank of Scotland Group EMTN
750,000 Royal Rank of Scotland Groiip f-Ml N
250,000 Royal Rank of Scotland Group 5.5%
250.000 Royal Bank of Scotland Group
1,000.000 Royal Rank ot Scotland EMTN 6%
5.23% 15/05:2013
5.15% perpetual
perpetual
variable perpetual
United Kingdom (cont) FIJR
ElJR
1,000,000 Scvcrn Trent lltilities Firlarice rMTN
1 ,000,000 Standard Chartcrcd 4.875% 242.50:2 0.18 5.25% ' 1/03/2016
3,530,072 2.69 11!03:2011
3530.072 2.69 FUR 125,000 TVN Finance RcgS 9.5% 15!12/%013 FRP 250,000 TCSCO t M I N 4.8751: 24/03/?04?
EUR 3,000,000 United lJtilities Waler CMTN 4.25% 966.682 0.74 74/01 !2070
244.954
245,008
476.720
26,542,932 2,381,251
3,731,146 95ti,781
3.082.441
963.090 238.360
197,367
498,993
??7,984
629, Y 05
744.971
247,188 88.777
256.859 208.193 493,004
530.693
1,857.983 1.2?4.9/8
180.1 12 195,930
262.039
477.770
981,841
248,443
428,51 7
187.300
185.800
214.280
0.1 9 United States of America EUR
EUR
ElJR
1.82 EUR EUR
2.85 EUli 9.73 EUR
0.19
0.36
20.24
2.35 rim
0.73 ELlR 3.18
EUH 0.15
1738 EUR r o R
r o R 0.17 EUR
0.48 EUR EUH
EUH 0.19
EUR 0.19 0.01 ElJR
0.70 EUR 0.16 0.38 ELJR
0.10 EUll
1.47 rm
0.37 r u R 0.93
0.15
0.70
0.36
0. :5 ElJI4
0.19 EUR
0.33 ElJR FOR
0.14 FlJR
0.14 TlIR
0.lR
FUR
TlJR
ElJR
250,000 Ahold Firiarice USA EMTN 5.875%
500.000 Air Products & Chemicals 4.825% 14/03/2012
15/03/7017 1,000.000 American Express Credil EMTN
3.0750,; 13:l 0:2009 200,000 ATRT 4.375B 15/03/?013 250.000 AI&[- 6.125% 02/04/201b
2,000,000 karik of America 4.2590 21!10:2010 500.000 Bank of America FMI N 5.125%
500.000 Rank of Amcrica EM I N variahle
750.000 UNP Paribas Capital Trust VI variable
250.000 Chesapeake Fnergy 6.25%
250.000 Citigroup 3.87596 21/05!201 0 750.000 Citigrwp 5% 0?/08!2019 450.000 Citigroup EMTN 3.9546 1 Oil 0'201 3 250.000 Citigroup EM IN 4.3 250.000 Citigrmiup FMTN 6.4 250.000 Citigroup EMTN variahle 31/05:?017 250.000 Dairnler N d h America EMTN
250,000 Goldmarl Sachs EMTN 6.3759"
500.000 HSRC Finance EMTN 3.375%
550,000 IiSRC Firidrice EMTN 4.87595
300,000 .JPMorgan Chase Rank variable
250.000 JPMorgari Chase EMTN 4.625%
850.000 JPMorgan Chasc EM IN 5.254
500.000 Pemex Project Funding Master lrust
250.000 Proctcr & Gamble 5.125%
s00.0@0 Procter & Gamble EMTN 3.375%
500,000 Procter & Gamble EMTN 4.556
750.000 RRS Capital Trust A variablc
250.000 SanPaolo IMI variable perpetual 1,000,000 Schering-Plough 5.375% 01!10/2014
750.000 SG Capital Trust 111 variable perpetiial 250.000 Unicrcdito ltaliano Capital Trust 111
750.000 Zurich Finance USA EMlN variable
76/09'7014
28/03;2018
perpetual
15/01!2017
1.375% 16/03/2010
15!022013
08!06:2012
30!05/7017
30:1 1:m?1
31;01/2011
OR/05:?013
Regs 8.375% 05/08/2016
24:10:201 1
07!12!2012
12/05!2014
perpetual
variable perpetual
0?!10/20?3
Total Transferable Securities and Money Market Instruments Admitted to an Official Exchange Listing
96?.685
967.714 261.573 1 32,180
2,493,198
13,91 1,723
246.925
459.909
968.550 187.432 249.411
1.932.784
4 18,012
433.484
234.385
237.396 741.493 673.638 399.247 218.356 217.138 225.258
744,140
235,374
468.552
500.091
251.371
?43.?57
811.300
501.935
243.281
459,350
477.848
230.45R 251,981 976,547 715.677
195,251
233,819
0.13
0.74 0.20 0.10
1.90
10.61
0.20
0.35
0 74 0.14 0.10 1.47
0.:36
0.33
0.18
0.18 0.18 0.51 0.30 0.17 0.1 9 0.17
0.19
0.1 8
0.35
0.38
0.19
0.19
0.62
0.38
0.19
0.35
0.36
0.18 0.19 0.71 0.16
0.1 5
0.18
125,719,788 95.88

P a y 21 8 Sctiroder International Selection Fund Somi-Aririual Heport June 2008
Portfolio of Investments as at 30 June 2008 (cont) Schroder ISF EURO Corporate Bond (cont)
Number of shares 'Irdrlstefable Securities arid Markel uI o r Principal Moriey Marltct Instruments dealt V r h e Net Amourit on another Regulated Marltct EUR Assets
United Kingdom USD
Total Transferable Securities and Money Market Instruments dealt on another Regulated Market
770,000 HSHC 6.8% 01 :06:>038 481,624 0.37 481,C24 0.37
481,624 0.37
Nurriber 01 sharcs Market "k
or Principal OLlier I mnsferable Securitie:; Value Net Arriwr it not dealt or1 amtlier I lqulatcd Market EClR Assets
Bermuda 149,288 0.11 US0
01 :05:2T)14 14!4,?W 0.1 1 260.000 Pctroplus Finaxe KeyS 6.i59t
Total Other Transferable Securities not dealt on another Regulated Market 149,288 0.11
Total Investments 126,350,700 96.36
Other Net Assets 4,773,439 3.64
Net Asset Value 131,124,139 100.00
Schroder ISF Global Corporate Bond Nurriber 01 shares Transferable :;ecurities and Market 9b or Priricipal Money Marltel Instruments Adrriitted Value Net ArIiOunt tu ;in Oflicial Eichariqe I..isling U X I Assets
Austria rw IOO,OOO Rephilc; 01 Austrla EMTN 3.59
15/(3'1):2021
Canada US0 400.000 Petro-Cariada 6.05% 15:05:201U
Cayman Islands EUR 50,000 Hutchisori Whampoa Firiarice 05
.1,125"0 %8:06/2015
Denmark FUR
Finland EUH
100.000 Dorig trieryy variable 29:00:3005
150.000 Nordea Rarik ririlarid EMTN variable ?fj:03:2011
France tUR
EUK
EUR
EUR
ro!l
t l J +
EUR
ru l
200.000 Hanques Populaires Covered Bond
150,000 BNP Paribas Covered Bonds LM 1 N
350.000 Caisse Helinaincemcnt de I'Habitat
1 09.000 Casino Guichard Perrachori 6.375%
100,000 Casino Guichard Perrachori tMTN
100.000 Conipagnie de ririaric;ement Foncier
100,000 Credit Lo(jerrieril IHN 15:0ti?291 7 14.000 TPSA turotinance France 4.625%
100,000 Veolia tnvironnernent TMlN 4.8754;
EM IN 4.B25Yc 07:05,2011
4.75% 28;05/?013
EMTN 3.75-1, 2dLti,2011
04:04;?013
.1.875U, lij;04;2014
EMTN 3.$75:5 1 1 ;02:20 1 1
@5:87,'?(11 1
%84)0;2013
Germany EUR EUE 170.00i) Bayerisclie Hypo-und Vereinsbarilc
50.000 Bayer EMTN 4.5% 23;05:2013
EMTN 6.675% 12;10:2010
Ireland mil d).OO0 Allied Irish Banks CMTN wiablc
03:07:2023
Italy Cll l l
FUR
tUR
EUR
CBP
150.000 Darico Popolare EMTN 5%
150,000 lntesa :;aripaolo EMTN variable
?00.000 Intcsa Sanpaolo rMIN variablc
100,000 Tclecotn ltalia CM I N 5.25'3;
100,000 Tclccm ltalia TM-IN 3.375%
19: 10:2010
00:0ti:2015
78.'03?2018
17/03'2055
24~06.?01!2
Jersey G W 50,000 HStK Capital FundinqJersey
Channel Islands Reg:; variablc perpet i ial
Luxembourg EbR 200.WU Telecurri ltalia Finance EMTN 7 58;
20,'04/2011
Mexico CCI l 25,090 Uriited Mexlcan States GMTN 4.258
1 ii:0%'201:5
135,436
135,438
393,386 393.386
68,478
68.4 78
144,185 143,185
236,129
?30.129
1,830,701
307,264
229,354
5Zi.361
154.471
142.71 4
151 .Yu0 144.81 I
2 1.38U
1 5 1 .9 I1
346,187 74.804
271.383
96,956
96.96f
1,051,192
23 1,331
225.731
302.2<iH
109,'336
181,893
100,045
100.045
322,863
327,803
35,907
0.49
0.49
1.43 1.43
0.25
0.75
0.52 0.52
0.86
0.88
6.66
1.17
0.83
1.92
0.56
0.52
0.55 0.53
0.00
0.55
1.26 0.27
0.99
0.35
0.35
3.83
0.85
0.87
1 . io
0.40
0.69
0.36
0.36
1.18
1.18
0.13
33.907 0.13

Schrnder Internaticmal Selectiorl Fund Semi-Annual Report June 2008
Portfolio of Investments as at 30 June 2008 (cont) Schroder ISF Global Corporate Bond (cont)
Number of shares Translerable Securities and Market " s b
or Principal Moncy Market InsIrufrients Admitted Valuc Net Amount to ari Official Exchangc Listing USD Assets
Netherlands EUI i
EUR
EUR r u R
E M 100.000 Netherlands Government 1 %
GPP cBr) FOR
Norway FUH
Philippines IJSI)
300.000 Rank Nederlandsc Gcmeenkn EMTN 3.12!75 15!04/2011
50.000 t.ON Iriterriational Finance EMTN 5.75?7 07:05R0?0
100,000 ING Bank FMI N variable 29/05/2023 73.000 Lindc Finance EM I N 4.75?0
21.'04:2017
15/01 203 7 100.000 Royal KPN tMTN 5.75% 18:03,'2016 55.000 Royal KPN rMTN 646 29,'05:2019 60.000 Unilevcr EMTN 4.875% 21/05%013
81,000 DnR NOR Bank variahle perpetual
58.000 CE Casecnan Water R Energy 1 1.9546 1 5 1 1 ;2010
Spain LUH
FlJR
GBP
100.000 Santander lwances EMTN mriable
150,000 Tclcfoiiica trnisiories CMTN 5.587,
?50.000 Telefonica Emisioncs EM 1 N 5.888%
24: 10:2017
17:06:7013
31 :01/2014
Sweden FIJR 100,000 Svenska Haftdelst);lrikeri FMTN
variable 20'01/20 16
United Arab Emirates USD 630.000 A h Dhat)i Commercial Rank FRN
0'3:05:'7016
United Kingdom FIJR GRP
rim
Ellt i
USD (;np
GHP FUR
GBP
r u R
GRP
EUR
GRP
GHP GBF' GRP EUR
GBP
gO0.000 Avvi-a variable 14/11/2021 50,000 Bank of Scotlarid 9.37540
15!05!202 1
23!05/2013 140,000 Bank of Scotland EMTN 5.fi?5%
1 00,000 RAT International Finaicc EMTN 5.875% 12:03/7015
200.000 HBOS 144A 6.75% 21/05/2018 50,000 HSRC Bank EMTN variahle
15.000 Kelda WX25°,c 17/04:2031 50,000 Lloyds 1 SB Bank rMTN variable
75,000 Norlhtintbriari Water Finance 5.625%
100,000 Royal Bank 01 Scotland rMTN 5.257,
75,000 S e w n lrerlt Utilities Finance 6.25:::
150.000 Severri Trent Utilities Finance EMTN
250.000 Standard Chartered Rmk rMTN
29/09:?070
05:W3/20 1 8
29!04:2033
15!05;2013
07/06:2029
5.?5?6 11/03/2016
variable 25!01:2018 05.000 UK Treasury 18 07/00/201 R 50.000 IJK Treasuty 4. 15% 07/122038 60.000 UK Treasury 5% 07/03:2025
100,000 tlnited lltilities Water EMTN 4.2545
100,000 Liirich kinarwe IIK EMTN variable 24/81 /2020
perpetual
1,286,966 4.69
449.959 1.64
77.585 0.28 148.180 0.54
105,982 3.39
134.503 0.49 180.388 0.66 98.530 0.38 91.839 0.33
123,389 0.45 123.389 0.45
60,030 0.22
60.030 0.22
853,815 3.11
150.379 0.55
231,412
472.021
148,371
148,371
576,576
5/6.576
3,540,576 754.01 5
11 1,240
212.516
152.712 186.744
87.271 I 53.377
(6,041
133.801
150.101
144.340
227.600
467.91? 156.725 100.51a 11 1,831
130.G88
17R.Nk
0.84
1.72
0.54
0.54
2.1 1
2.1 1
12.89 2.13
0.40
0.77
0.56 0.68
0.32 0.56
0.28
0.49
0.55
0.53
0.83
1./0 0.57 0.37 0.43
0.48
0.64
Page 219
Number of shares Transfcrable Sccuritics and Market ?6 or Principal Money Market Instruments Admitted Value Net Amount to an Olftcial hchanae Listina l l X J Assets
United States of America USD
USU USD IJSC I JSll USD
USD
FUR
IISD
EUR
EUR
IJSD USD EUR
lJSD LJSO
t JSD
USD
USD
usu
EUR
usr) 310.000 A[BI 6.4% 15/05/2038 530.000 BellSouth 4.753; 1 5 1 1:2012 150.000 Chiibb 6.5"~b 15/05/7038 145.000 Citigroup 6.125% 21il1/2017 160,000 CSX 7.45?0 01/04/2038 140.000 Florida Power 5.66% 15/06/2018 500,000 General Electric Capital MTNA 4.75%
13/09:2010 7 1'0,000 General Electric Capital MTNA
5.875% 15:0P:2012 100.000 General Electric Capital RcgS variable
15/09/2066 300.000 JPMorqan Chase & Co. 1.759-
01 :05/2013 50.000 JPMorgan Chase & Co. EMTN
5.259b 08:05/2013 60,000 KBC Bank Funding Trust IV HegS
variablc pcrpctual 705.000 Kfoger 5% 15!04!2013 l00.000 Nevada Power 5.875% 15/01/2015 40.000 Pcmcx Proiect Funding Master Trust
Regs 6.625% 04/04/2010 120.000 PepsiCo 5% 01 /O6!201 R 160,000 Philip Morris International 6.375%
16!05/2038
01:06:2016
5.902% 12/01!2015
01!05/201 1
15/W/2013
O?:l W7023
45,000 Reynolds Arriericxi 7.6754:-
300.000 Stingray Pass-Through Trust l41A
51 0.000 l imc Warncr Cable 5.85Yb
455.000 Veriron Comniiinicatioris 5.2
200.000 Zurich Financc USA EMTN variable
Total Transferable Securities and Money Market Instruments Admitted to an Official Exchange Listing
Numbcr of sharcs or Principal
Transferable Securities and Money Market Instruments dealt
5,369,614 19.54 300.034 1.09 526,536 1.93 146.102 0.53 140.958 052 162575 059 141,379 0.51
504.688 184
797.729 2.90
132.552 0.48
7!?1.9// 106
75.108 0.27
95.980 0.35 201,411 0.73 187.735 0.68
63.843 0.23 117.739 0.43
155.687 0.57
47.184 0.17
15.000 0.16
185.818 1.77
454,861 1.66
294.828 1.07
16,720,802 60.87
Market S Value Net
Amoiint on another fiegcilated Market USD Assets
Canada LJSD 310,000 Canadian Natiiral Ijesoiirces 5.9%
01 !02/2018
France LJSD 300.000 Societe Generale 144A 6.75?'0
?0:04/201 B
Luxembourg USD 305,000 Gaz Capital 144A 6.21295
7?;11 /?01 0
Malaysia IJSO 100.1100 Empire Capital Resources Regs
9.37536 15:17/~011
Netherlands USD lJSD
230,000 ING Rank 144A 5.125% 01/05/2015 160,000 Scotland International Financc No 2
144A 4.?5?'0 ?3:05/2013
306,794
306.794
291,368
291.368
283,359
283.359
105,750
103,150
369,643 223.815
145.828
1.12
1 I ?
1.06
1.06
1.03
1.03
0.38
0.38
I .35 0 82
0.53
I

Page 220 Schroder International Selectioi Fund Semi-Aririual Report June 2008
Portfolio of Investments as at 30 June 2008 (cont) Schroder ISF Global Corporate Bond (curit)
Nur1it)er 01 sharcs Transferable :;et:urilics and Market % or I-'rincipal Moriey Market Instruments dealt Value Ne1 Amount on anothcr Renulated Market IJSU Asscts
United Kingdom USD 145.000 Barclays Bank 5.45% 17:OG:2012 LJSU 233,000 I l:.W; 0.U'X OI4X/20Y8
United States of America USD
L J W
I J:SU
USD
USD
USD USU USD LJSU
u:;u
LJSD IJSI)
USD
USU [JSU
LJSU
USU
usn lJSD IJSD USD
USD
490.000 American Internatiorial M I N 4.:15%
260,ONJ Assured Guararily LIS variable
160,000 Rank of Nevi York Mcllon MTN 4 51:.
20'03201 2
1511 2:?0G6
01:04:7013
13;11:7015 81 ,001) Colorado Interstate Gas 58%
300,000 Comcast 6.44:: 15:05:2038 45.755 (;oiinlrywidc Asset-Racked
Ccrtlficates 2005.9 N 5.5"~ 75:10:203r?
780,000 FHLMC 5.b3: 15:07:2030 200.000 rrl (;orluulllny 7.825 53:5,000 MBNA MTNr 7.5% 1 2Y3.000 Midarriericnn Encrgy I :l'%
01 :04:PO 18
,201 3 12 -?
650.000 Morgan Stariley Capital I 2003-T11
400.000 Plains All Americari Fipelirie 1 M A
Y53.000 FNC Brink 0.875% 01:04;9018 301.11iY Quest Triist 2005-x:! MU 8%
24,YtiD :.;truc:lureij Assct Investmerit
0.59: 01 '"5,', I I ,2318
25:12'2035
L.oan Trust 2003-RC11 M4 b l {N 25: 10:2033
350,000 IJ:; BarikCincinnati 3 30:10:2014
213.300 USr reasu~ 7 1 315,000 US Treasuv 3.t3 195.000 US lreasury 5% 480.000 IJS Irea::ufy Inflation Indexed Hond::
230,000 Viacom li. fb?: 05,'10,'2037 2.3759; 15:0':2027
Total Transferable Securities and Money Market Instruments dealt on another Regulated Market
Niimber of shares or Principal Olher I ranstcrable Securities
379,252 147.575 231.677
6,834,685
345.754
.186.882
136.427
83,861 371 955
13 i 707.81 3 205.710 568.88'3
295,07 1
(344.237 451,548
f4.825
4a0.:20 %W767
9.037
13.436
343,771 2 1 9,152 312.115 209.777
514.687 720.755
8,570,851
Market Vallle
1.38 0.54 0.84
24.88
1.62
0 V D
0.57
0.31 1.33
0.00 2.80 0 75 2.07
1 .07
2.35 1.55
0.27
1 .T5 0.95
0.04
0.05
125 0.70 1.14 0.76
1.87 0.80
31.20
?6 Ne1
Amount not dedt ori ariollncr Hegulated Market USD Assets
United States of America 359,665 1.31 IJSD 370,000 ITC 144A 5.8753 30iOY:2016 355.683 1.31
Total Other Transferable Securities not dealt on another Regulated Market
Total Investments
Other Net Assets
Net Asset Value
359,665 1.31
25,651,318 93.38
1,818,283 6.62
27,469,581 100.00
Schroder ISF Global High Yield
Nuinbcr of shares Trarislerablc Securities arid Market '7"
Value Net or Plincipal USD Assets Ammrit
Moncy Market Instrurrierits Admittcd to an Official Exchanyc Listing
Belgium EUR 1,400,000 Barry Callebaiil Seniccs 6%
13~07:2017
Bermuda USD 7,770,000 I'ctroplus firlarice I leg:; 7?'>
01 /03:2017
Canada LJSD U:;D
2,880,000 Hombardier 144A 8% l5~11?2014 5,910.000 Sirio Forest 144A Y.1258
1 /:08;701 1
Cayman Islands I K L ) 2.ti50.000 :;eagalc Icchnoloq). I IDD G.375%
0 1'10;2011
01 :I 0:201 ti IJSD 1,450,000 Seagale Icchnology HDD t i . 1 3 8
China l!SD USD
2.000.000 AAia Aluminum Reg:; 8% 23'12'201 1 3,425,000 Galaxy Criterlainment Finance Reg3
Y.B/b:b 15:12:2012
Denmark
Fur< EU4 1.800.000 ISS Global FMTN 4.75"'; 19'09:2010
1 .000.000 Nortjic; lelephone Regs 8.254h GI :05:701 G
1-iiri 5oo.000 I I C EMTN t i . ~ c . ~ is:04:7017
France EU3 tL!: i r U l tUH
2,250.000 CMA CGM Reg:; 5.59( 18:'05:2012 1 .500.000 Cruwin European 6 75% 01 :09,20 1 1 1,100.000 Perriod I ka rd 1.ti2SUk 06:1?:2013 1,600,090 Ileriiy Cointreau Re;j:; 5.28
l5;01:?017
Germany tUF t l J H
2,930,000 FLHI I icgS 5.62'3% 15:12~2011 230.000 Uriily Mcdia secur Reg:; 8.758
15:02:2015
Italy Ell1 i
EUR 5o0.000 lclccom ltalia rMTN 5 25%
2.000.000 I ottonialica HegS variable 31 ~03:X)iiki
11:0:1:2055
Liberia lJ:XJ 5370.U00 RoyA Caribbcan Cruises /'?,,
13:06:?013
Luxembourg CUI l 2,500,000 Codere hnancc Luxembourg Reg:;
8.255, 1 5:0U:li)l5 USD B.700.W Evra7 (;rOlI[J 144A 9.5'?l 24r'04~7010 ElJR
ELI4
2.000.000 Liyhthouse Internatiorial I leg:; 8% 30!04:20 14
1 ,750.0C)O Wirid Acquisition Finance Reg:; 9.75?,, 01:12:2015
Netherlands EIl!I7
tUH
ELK
ELK
1,000.000 rreseriluu finance Regs h'h
1,300,000 Frewiiius Finance Reg:.; 5.5%
5.B00.000 Indo Inte(]ratetj Erieryy 8.5%
31:01'2013
31:01,'X)lO
01:00:7012 400.000 Linde ririxiw wriablc 3:0i:2WY
2,090,763 0.44
2.0Y0.IB3 0.44
1,964,700 0.41
1.984.700 0.41
9,018,374 1.90 7,977,057 0.63
6.04 1,31 I 1.27
3,933,977 0.82
2,592,227 0.54
1,341.750 0.28
5,289,397 1 .I1 1.915,000 0.40
3,374.39i 0.71
4,865,181 1.02 2,[336,838 0.68
1,442,177 0.30 756,158 0.16
9,519,006 2.00 2.973526 0.67 7,777,372 1.990.406 0:17 0.42
2,332.702 0.49
3,886,071 0.82 3,517.607 0.74
368.464 0.08
3,402,510 0.72
2.852.832 0.60
54Y.818 0.12
4,775,767 1 .OO
4.775.787 1 .OO
15,211,700 3.20
3.388.723 0 . I l 6,683,230 1.41
2.365.225 0.50
2.775.507 0.58
11,442,373 2.41
1,481.581 0.31
2,175,087 0.4C
5.87Y.852 1.24 600.450 0.13

Schroder International Selection Fund Semi-Annual Report June 2008 Page 221
Portfolio of Investments as at 30 June 2008 (cont) Schroder ISF Global High Yield (cont)
Number of shares Transferable Securitics and Market 96 or Prmcipal Mowy Market Instruments Admitted Value Net Arriount to an Official Exchange Lisling lJSD Assets
Netherlands (cont) EUI 1
EUR
Philippines t K D
400.000 I inde Finance variable 14/07/2066
250,000 IJFC Regs 8% Olil li2016 EUR 250.000 IJPC, RegS 7.75?0 15!01,'2014
15?.?50 CE Casecnan Watcr & Encrgy 11.95% 15illi2010
Sweden FlJR 1.029.31 8 Corral Finans I3egS variable
16:01/7010
United Kingdom tUI1 t u n EUR
United States of America
1 ,000.000 Alliance Roots 5.5% 26!05:2000 2,i 00.000 Rexarn FRN variable 29/06!2067
250.(100 TVN Finance HegS 9.576 15:l 2/2013
US0 EUR
GRF'
USD tusn
tlSD
IJSC) Et JR
FtJR
IJSD
USD
USD
USD tJSD USD t JSD USD 1JSD t J X I US0
t JSD
C1SD
USD
USD
USD
USD USD USD
USD
USD
lJSD
tun
1.355.000 AtS 8% 1 5 1 0/2017 750,000 Ahold Firlarice USA EVTN 3.8/54;
500.000 Ahold ririance USA EMTN 6.5"r 14!03:2012
14:03:7017 5.61 0.000 AK Steel 1.75% 15!06/2012 2.91 0.000 Allicd Waste North Anierica 7.?5?n
15:03/2015 1,950,000 Allis-Chalmcrs tnergb 9%
15:01/2014 3.930.000 Belden 7% 15103:20 17
960,000 Central European Distribution I 1egS
300.000 Chesapcakc tncrgy fi.25pi,
6,355,000 Chesapeake Energy 7.25%
1 ,755.000 CiliLens ~DrrirriiiriicatiCns 995
4.365.000 Community Health Systems 8.8759;
2.135.000 Ilyriegy 144A 8.375% 01:05!201 ti 5.750.000 Dynegy 7.75% 01/06;2019 3.:395.000 El Paso 6.8755b 15/06:'2014 1.955.000 El Paso 7.259,; 01/06;2018 5.988,588 E lnmd rriergy R.l5Y% 05:07:'2028 ?.930.000 Encore Acquisition 6% 15/07/2015 ?.930.000 Ford Motor 7.15'4b 16/07;2031 6.850.000 ford Motor (:redit 7.8754~
?,320,000 Ford Motor Crcdit 9.87596
4,680,000 Treeport-McMoRan Copper & Gold
3,130,000 Gcncral Motors Acceptance 7.2%
3.(305.000 Markwest trieryy Partriers !Mark
4,890,000 MGM Mirage 8.7545 01 /04:2013 1.7?0.000 Millipore RegS 5.875% 30i06/2016
675.000 Nevada Powor 5.875% 15/01 i2015 225,M)O Nevada Power 6.5?; 15/05:?01 8
8?,i, ?5:07:2012
15:oi 1201 7
15:l 7:201 8
15:08:2031
15;07/2015
15/06:7(:)10
10:08;201 1
8.758 01/04:2015
15/01!2011
Energy Finance 8.5% 15/07/2016
3.950.000 Ne\yfield rxploration 1.1 25Y~ 15!05/2018
2,015,000 Pioneer Natiiral Resources 6.8/34~ 01/05/2018
2.980.000 r'lains txploration & Prochir:ttori /.625"6 01:06!2018
6,310,000 Quicksilver Resources 7.75"/6 ol!OH;2015
61 3.867 313.798 34 7,738
157,579
157,579
1,452,012
1.452.012
4,926,592 1.91 5350 2594.047 1 1 6.895
121,668,816 1.342.:<10
1.187.573
937,082 5.66R,570
2.947.0633
1.888.377 3,787,807
1,513,104
439,547
6.256.781
1,590,007
4.371.425 2.078.239 5,2Rfi,l11 3.3I8.650 1,947,599 5,708,229 2,761,521 1.707.931
6.000.480
1,999,133
1.900.!!54
2.409.143
3,983,100 4.246.673 231 7,886
RR0,95S 228.2/0
3.83?.978
2.787.054
2.995.888
6.286.736
0.13 0.07 0.C7
D.03
0.03
0.31
0.31
1.04 0.40 0.55 O.O!!
25.59 0.79
0.74
0.1 !.I 1.19
0.62
0.40 0.80
0.32
0 09
1.32
0.33
0.92 0.44 1.11 0.71 0.41 1.20 0.58 0.35
1.26
0.47
1.03
0.51
0.84 0.89 0.49 0.1 4 0.05
0.81
0.55
0.63
1.32
Nurriber of shares Transferable Securities and Market % or Principal Moriey Market Instruments Admitted Value Net Amount to an Official Exchange Listing LJSU Assets
United States of America (cont) tJSD d.RO0.000 Chest 7.075?6 15/06/?015 4,675.868 0.98 USD 2.91 5.000 Range Resources 7.5% 16:05/7016 2,987,302 0.63 USD 2,000,000 Reliant Ennrgy 7.8755 15/06~2017 7,844,386 0.60 USD 2,915,000 Reynolds American 7.62590
01 /06/2!3 16 3,058,485 0.64 US0 7.805.000 Sprint Capital 8.375% 15/03/2012 7.725.5fd 1 .R7 USD
5.9025 12/01 /2015 105.000 0.02 US13 2.755 000 Williams 7.5% 15:01 '2031 7,847,479 0.60
700.000 Stingray Pass Throrigh Trust 144A
Total Transferable Securities and Money Market Instruments Admitted to an Official Exchange Listing 203,604,818 42.82
Numher of shares Transferable Securities and Market ?j
Moriey Market Iristriimerits dealt Value Net or Priricipal on another Regdated Market USCl Assets Amoiint
Bermuda IJSD
British Virgin Islands IdSD
450.000 lntelsat Derrnuda 9,250,& 15:06/2016
3,900,000 FTL Trade Finance 144A 7.25% 20/1 0/2017
Canada USD 4.855.000 Kinder Morgan Finance 5.7")~
5,275000 Nova Chemicals 6.54; 15/01/2012 06/01 :701 6
Malaysia t lS0 4.100.000 Fmpire Capital Resources Fte Re$
9.375% 1511 71701 1
Mexico USD 1 ,900,000 Kansas City Southern de Mexico
7.625% 01 !1 2/20 13
Singapore I JSrl
United States of America
1,350,000 S 1Al S ChipPAC 7.556 19107/?010
tusn USD IJSU
IJSD
IJSD
lJSD
USD USD
IUSD
m r 3
usu
usu
USD
1,835,000 Actiiant 5.8/5% 15/06/2017 7,815,000 AES 144A 84t 01106~2020 3,885,000 Anrerican rower 144A 7?A
2,920,000 Amerigas Partners 7.25%
8,885,000 Amkor Technology 7.125%
4.875.000 Atlas Pipeline Parlners 144A 8.75%
1.950.000 Rristow 7.50/0 15:09,'2017 5,855,000 Rroadview Networks 11.37596
P.470.000 Ruffalo Thunder Development
1.1 95,000 Centenn'al Cornmimications 1 0?h
1,050.000 Centennial Communications FRN
5.750.000 Chesapeake tnergy
3.885.000 Complete Production Services 8%
191 0/201 /
20/05/2015
15:03/2011
15/06/2018
01 /09/2012
Authority 141A 9.3754b 15/12/2014
01 10 1 :2013
01 /o 12013
6.54b15/38/201 I
15/1 7/3016
455,625 455.625
3,922,156
3,9?7,15B
9,143,172
4,377,928 4,765,814
4,335,750
4,335,760
1,862,000
1.862.000
1,431,000 1,431.000
218,827,658 1.812.063 7.637.853
3,850,824
2,755,984
8.542.167
1.764.7 16 1,069,424
5.503.700
1,867,250
2.250.651
1.891.500
5.41 1,203
3,892.071
0.10 0.10
0.82
0.87
1.92
0.92 1 .00
0.91
0.91
0.39
0.39
0.30 0.30
46.00 0.37 1.61
0.81
0.58
1 .80
1 .OO 0.41
1.16
0.35
0.47
0.40
1.14
0.82
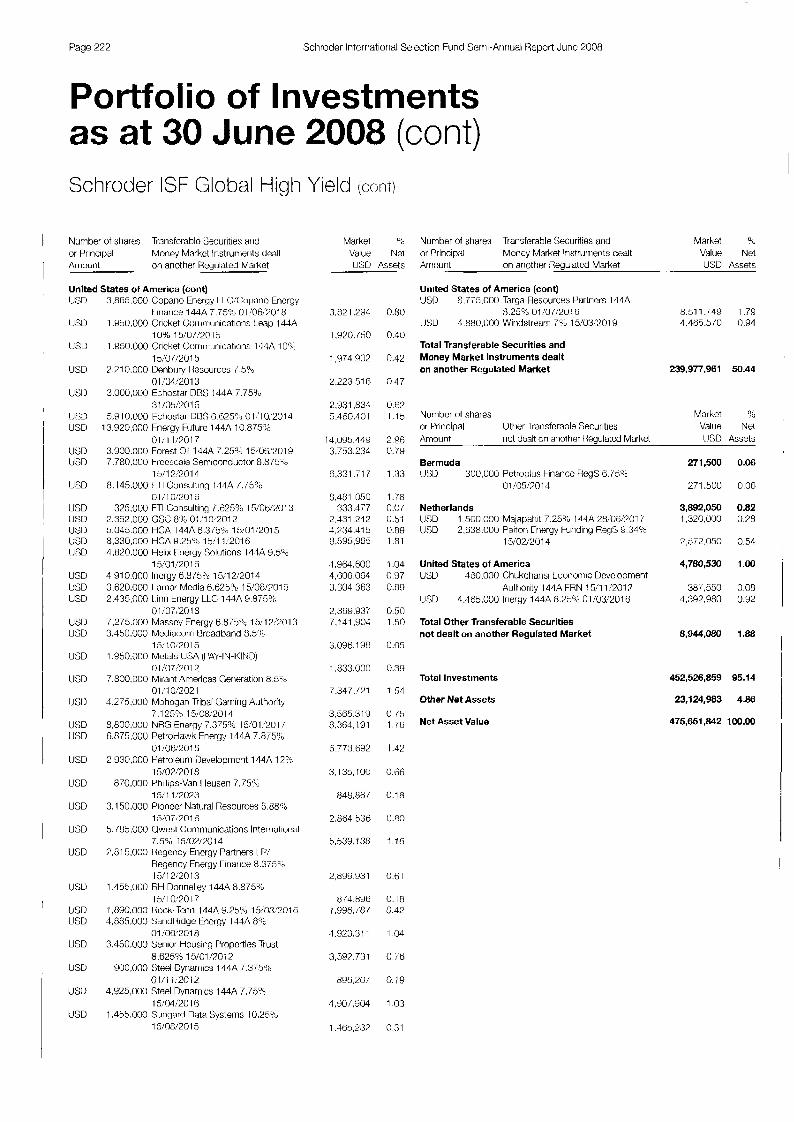
Page 222 Schroder Intcrriatiorial Selection Fund Serrii-Arinual Report Junc 2008
Portfolio of Investments as at 30 June 2008 (cont) Schroder ISF Global High Yield ~ C O I I I )
Number ot strafes Transfcrablc Securities arid Markel ?: or Principal Money Market Instrurrierits ciealt Value Net Ariioiint on another Regiilaled Market USU Assets
United States of America (contl {JSD
LJSU
LJSU
USD
US13
t J X USD
I K D IJSTI
US0
USD [JSU lJSD USD IJSU
USD USD USD
us13 USU
US0
IUSD
IJSI)
LJSD LJSD
lJSD
USD
USD
USD
USD
I JSLl
us0 USD
USD
USD
us1 1
USD
. I
3,885,000 Copano Enerqj I I (;:(>opar.io Energy
1 .Y50.000 Cricket (;orririiiinications Leap 144A
1 ,950.000 Cricket (:orrirr.iiriications 14JA 1 O0,c
2 2 1 0.000 Uerhiry Iicsources j.53s>
3.000,000 Echostar DD:.; I44A 7.75%
5.910.000 Fchostar DB:; D.G25:'.; 01,'10,'2014
Firiariw 14JA 7.75T4 01:06?701fi
109t 15;07:2015
15:07:2015
0 1 :0112013
31/05:2015
13,920,000 Energy Fiitiire 144A 10,8757; 01:11:?017
3,900.000 Forest Oil 1444 7 25% 15:08,'2019 7.780.000 krccscale Semlcondi.ictor fl.875c,e
8.145.000 r I I Cmsiilting l14A ;,is@,; 15:1 2'201 4
0 1; 1 0:201 8 325.000 FTI Consulting /.d250/6 15~0tj:7013
2,352,000 GSC 8% 01:10~2012 5,045.000 HCA 144A (j.3i5?,, 15:01:2015 8,330.000 HCA Y.25Cv 131 1:201 G 1.820.000 Helix Friergy Solutions l44A S,5%
15:01:20 1 t i 4,910.000 Iiicrgy U.8/5% 15:12:2014 3,620,000 I airiar Media ti.ti'23% 15/0D?701S 2.435.000 L irin Energy LLC 144A 9.87596
7,275.000 Masscy Energy G 8758 15'1 2'291 3 01/0:.'2018
1 .9:,0,S00 Metal:; LJSA [I 'AY-IN-KIND)
7.800.000 Mirant Americas Gerieratiori 5.5",
4.275.i)OU Mohcgan Tribal Garriing Authority
5,800,300 NRG Energy 7.37516 l5:01?2017 0,875,900 PetroHawk Eneryy 144A 7.87590
2,930.000 Petroleurn rlmlopmcnt 144A 12%
01:07?2012
01 :I 0:202 I
7.1 25% 15,08:20 I1
01 :0tj:2015
15/0?,'701.S
15: 1 1:2023
15'07,201 t3
870,000 t'hillips-Van Heusen 7.75"~~
3.1 50.000 Pioneer Natural Resources 5.08%
Regency Energy rir1aric:e 8.375% 1 3 1 2:2013
1,155,000 RH Doririelley 144A 8.8754; 1 5:10:?017
1 .t390.000 I lock Tcnn 144A Y.73% 4,865,000 :;ar ic j lM$ tncrgy 144A
01/OG:2018 3,450,000 Seriior Housir'g Properties Trust
8.625?5 15~01~7012
01:11:2012
15:04:20 1 8
15;08:20 15
900,000 Steel D ~ ~ M I I I ~ > l11A 7.375%
4,925,000 Steel Dynarriics 144A 7.75"sc
1,435,000 Si.irigartj Daki Systems 10.2595
3,821 2 Y . 2
1 ,920. i ! iC
1.974.002
2.223516
7,931,831 5.'lt30:101
lJ,ULE,4-lS :3.:53.234
fi,331.;17
H . ~ O I ,050 333.477
2,431 212 4,?:34.415 U.5!35.9G5
4.8U4.600 4.00G.064 3,304,363
2,3tis;.w 7.141,S04
3,09B.l9fi
1,833.000
7347,171
3.585.318 !3,:Jfi4,191
ti.7iY.tiU2
3,135,100
84H.86/
2,884,333
3,339,138
2,895231
fi74.896 1 ,OYti, / 8 /
4.32331 1
3,597,731
81)8.20i
4 .w/,904
1,483,237
0.80
0.40
0.42
0.47
0.82 115
2.UG 0.7Y
1.33
I .:m 0.07 0.51 0.89 1.81
1.04 0.97 0.69
G.50 1 50
0.m
0.39
1.54
0.15 1.78
1.4%
0.U6
0.18
0. wc
116
0.ti1
0.18 0.42
1 04
0 7ti
0.19
1.03
0.31
Number of st lares Transferable Securities and Market %: Value Net or Principal USD Assets Arrioiirit on ariother I7egulatcd Market
Moncy Market Iristrurrierit:: dealt
United States of America (cont) US0
I J:;U 4,880,000 Wiridslrewr 7% 15,'03:201 U 1.185.5/0 0.94
fi.775.000 Targa Resources Psrlners I44A 9.25'30 01:07:201 ti 8.51 1. ;49 1.79
Total Transferable Securities and Money Market Instruments dealt on another Regulated Market 239,977,961 50.44
Number oi shares Market ?: or t'rincipal Other I rniisfcrable Securities Value Ne1 Amourit not dealt on ariother I kgulatcd Market LJSU Assets
Bermuda US11 30L'.000 Petruplius hnancc HegS u , /5%
01:0:5'7014
Netherlands USD USD
1.500.i)00 Malapahit 7.23'' 1 -144 28&u:;/01 I 2.838.000 Paitori Crieryy kunding Re@ 9.34?0
15/02:2014
United States of America USD 430,000 Chukcharisi Cconomic Ucvcloprnent
USU
Total Other Transferable Securities not dealt on another Regulated Market
Aultiority 144A FRN 15:11:2017 4,483,000 Irierqy 144A 8.25% 01!03/2010
Total Investments
Other Net Assets
Net Asset Value
271,500 0.06
271.500 0.08
3,892,050 0.82 1,320,000 0 78
?,:jT2.050 0.54
4,780,530 1.00
387.550 008 1,392,980 0 92
8,944,080 1.88
452,526,859 95.14
23,124,983 4.86
475,651,842 100.00
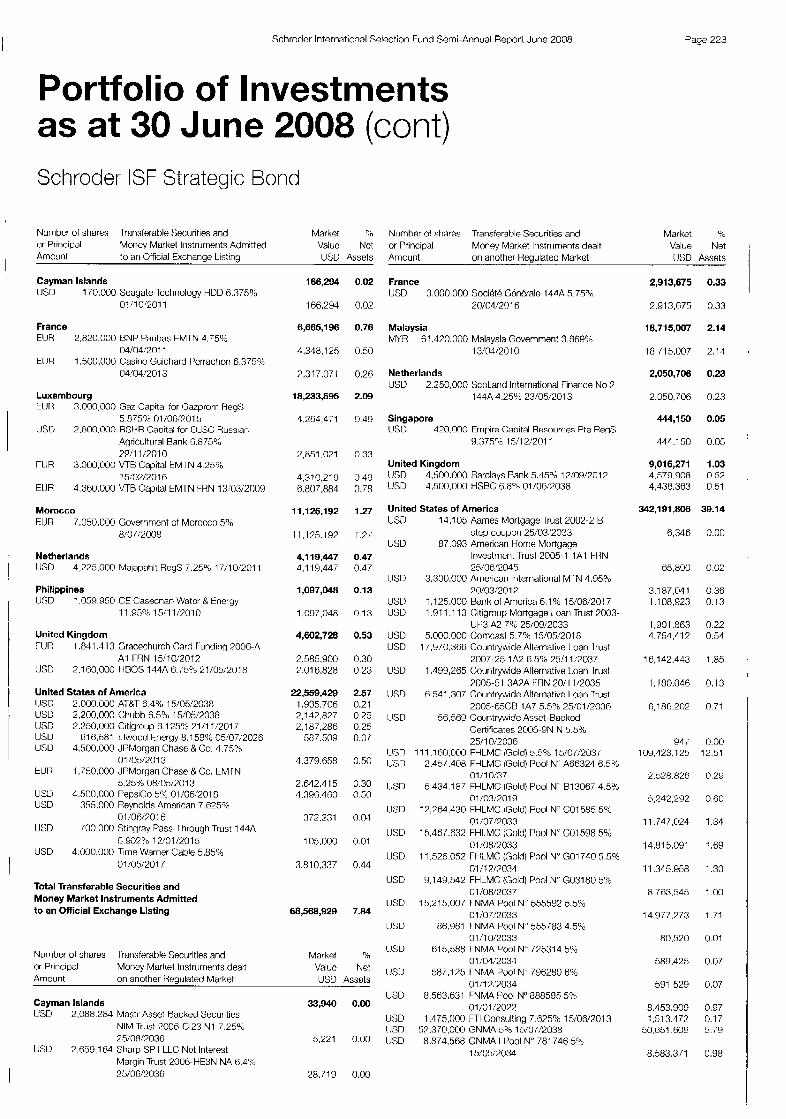
Schroder lnternatinrlal Selection Fund Serni-Annual Reporl June 2008 Page 223
Portfolio of Investments as at 30 June 2008 (cont) Schroder ISF Strategic Bond
Number of shares lranslerahle Se(;urities and Market 7" or Principal Moncy Market Instriiments Admitted Valuc Nct Amo,inl to ari Official Exchange Listing USD Assets
Cayman Islands IJSII 170.000 Seagate Technology HDD 5.3759;
01!10'2011
France EUR
t l J R
2.820.000 BNP Faribas FMTN 4.759b
1.500.000 Casino Guichard Pcrrachon 6.375% 04/04:2011
04/04;2013
Luxembourg H J l I
USD
3,000,000 Gaz Capital for Gazprom Reg:: 5.575% 01/06:?015
2.800.000 R 3 i R Capital for OJSC Russian Agricultural Bank 6.87546
3.000.000 VTB Capital t M I N 4.25Y0
4.360.000 VTB Capital EMTN FRN 13:03/2009
79/11/7010
15:02/20 1 6 TLJR
EIJR
Morocco FUR 7,050,000 Government of Morocco 5"h
8:0/:2008
Netherlands USD
Philippines USU
4,.775.000 Majapahit RegS 7.258 17/10:2011
1,059,950 CE Casecnan Watcr & Energy 11.95% 15:11:7010
United Kingdom IWR 1.841.41 3 Gracechurch Card F undlrlg 7006-A
A1 FRN 1310:2017 USD 2.180.000 tlnos 144A 6./5?5 21/05/2018
United States of America IJX 2.000.000 AT&T 6.4% 15!05,'203n USD 2,200.000 Chubb 6.5?0 15/05!2038 LED USD USD
tUI1
USU 4.500.000 PepsiCo 5% 01/06/2018 USD 355,000 Reynolds American 7.62596
USD
USD
2.250.000 Citigroup 8.1 257, 71 11 1/2017
4.500.000 JPMorgan Chase 8 Co. 4.75%
1,750.000 JPMorgan Chase & Co. t M I N
fl6,581 rlwood Energy 8.159% 05!07:2026
01 /05;2013
5.25% 08!05,7013
01 TW70l 6
5.90??0 12:01/2015
01 :05:2017
/00,000 Stingray Pass 1 hrouyh Trust 144A
4.000.000 Time Warner Cable 5.85%
Total Transferable Securities and Money Market Instruments Admitted to an Official Exchange Listing
166,294 0.02
166,294 0.02
6,665,196 0.76
4,348,125 0 50
7.317.071 0.26
18,233,595 2.09
4,264,471 0.49
2.851.021 0.33
4310.219 0.49 6.807.884 0.78
11.125.192 1.27
11,125.182 1.2;
4,119,447 0.47 4,119,447 0.47
1,097,048 0.13
1,097,048 0.13
4,602,728 0.53
2.585.900 0.30 2.01 6.828 0 23
22,559,420 2.57 1,935,706 0.21 2,147,677 0.75 2,187,286 0.25
5n7.509 0.07
4.379.858 0.50
2,612,415 030 4.396.460 0 50
372.231 0.04
105.000 0.01
3,810,337 0.44
68,568,929 7.84
Number of shares or Principal Amount on another I4eoulatetj Market
Ir;lmsferat)le Securities and Moncy Market Inslrunients dealt
Market S Valuc Net
. . USD Assots
Cayman Islands 33,940 0.00 USD 2.088.284 Mastr Assel Racked Securities
NIM Trust ?006-C123 N1 7.25"; 25/08/7036 5.221 0.00
Margin Trust 2006-HE3N NA 6.4';i, 25/06/3336 28.719 0.00
IJSU 7.659.1Ed Sharp SP I LLC Nct Interest
Numtjer of shares Transfersble Securities and Market 9h or Principal Money Market Instrurnerits dealt Value Net Amount on another Regulated Market IJ.C;LI Assets
France USD 3.000.000 Societe CCtnbrale 144A 5.75%
20/04:2:)1 6
Malaysia MYR 61.4?0.000 Malaysia Government 3.868?5
13/04/2010
Netherlands USD 2.250.000 Scntland Internatiorial ririarice No 2
144A 4.254, 23,'05/2013
Singapore USU 420.000 Ernpire (:spital Resoiirces Pte Regs
!4.375% 151 2201 1
United Kingdom USD USD 4.500.000 HSBC 6 . 8 O ~ 01/06/7038
United States of America USD
U S U 87.093 American Honie Mortgage
4.500.000 Barclays Bank 5.45% 12:0'3!2012
14.105 Aames Mortgage lrust 2002-2 B step coupon 25!03:2033
Investment Trust 2005-1 1A l H3N 25:06!2045
3.300.000 American International MTN 4.95% ?0/03/201?
1,125.000 Bankof Amcrica 6.146 15/06/2017 1.91 1 .I 13 (.:itigrt.)up Mortgage 1 oar1 Trust 2003-
IJSD
USD USD
USD 5.000.000 Comcasl 5.7% 15/05/2018 USD
USD
USD
IJSD 55.568 Countrywide Asset-Backod
UP3 A2 7% 25/09;2033
17.5170,3fi6 Countrywide Alternative I oan Irust
1,499,285 Cotintrywide Alternative Loan Irust
6.541.307 Coiintryvide Allernative I oari Trust
2007 25 1A2 6.5% 25!11:7037
7005-51 3A7A f'RN 20/1 1 /2035
2005-65CB 1A7 5.5"L 25/01/2036
Certificates 2005-9N N S.S?G 2 9 1 0/2036
(USD IISD
11 1 .I 60,000 FHLMC <Gold) S 5 S t 1 W7!2@37 2.45/.408 FHLMC iGold) Pool N' A66324 6.5%
01/10,'37
01 /03/2019 IJW 5,434.187 FHLMC (Gold) Pool N 813067 4.5%
I K D
USD
1?,?64,430 FHLMC Gold) Pool N' C01585 54:
15,46/.632 FHILMC (Gold) Pool N'- GO1598 5% 01:07:?n33
01:08/2033
01 !I 717034
01 /08/2037
01/07:2033
01 :10:2033
0 1 /04/2034
01 /17:p034
01/01 2077
USD 1 1525.052 FHLMC (Gold) Pool N" Go1 740 5.5?'0
USD
IJSD 15,215.007 FNMA Pool N' 555592 5.5%
lJSD nR.961 FNMA Pnol N" 5SS/83 4.5%
1JSD
IJSII
9.14R.542 FHLMC Gold) Pool N ' GO3180 5%
Rl5.588 rNMA Pool N ' 775314 5%
587.175 rNMA Pool N' 796280 646
USD 8.563.1331 FNMA Pool N" 888595 5%
USD 1.475.000 FTI Consulting 7.625% 15i06/2013 IJSD 5?.370.000 GNMA 5% 15/07!2038 lJSD 8.874.588 GNMA I Pool N" 781 746 5%
15:05/7034
2,913,675
2.913.875
18,715,007
16./15.007
2,050,706
2.050.706
444,150
444.1 50
9,016,271 4.579.908 4,438,363
342,191,806
8,346
65,890
3.1 87.04 1 1 .I 08,923
1,901.883 4.754.41 2
16.142.443
I , I 80.046
R,1 8ti.202
94 I 109,123,125
2.528.826
5,742,292
11.747.024
14.815.091
11.345.858
8 783.545
14.977.773
80,520
589,425
591,529
8,453,909 1.51 3,472
50.651.600
8.583.3 / I
0.33
0.33
2.14
2.14
0.23
0.23
0.05
0.05
1.03 0.52 0.51
39.14
0.00
0.02
0.36 0.13
0.22 0.54
1.85
0.13
0.71
0.00 12.51
0.29
0.60
1.34
1.69
1.30
1.00
1.71
0.01
0.07
0.07
0.97 0.17 5.79
0.98
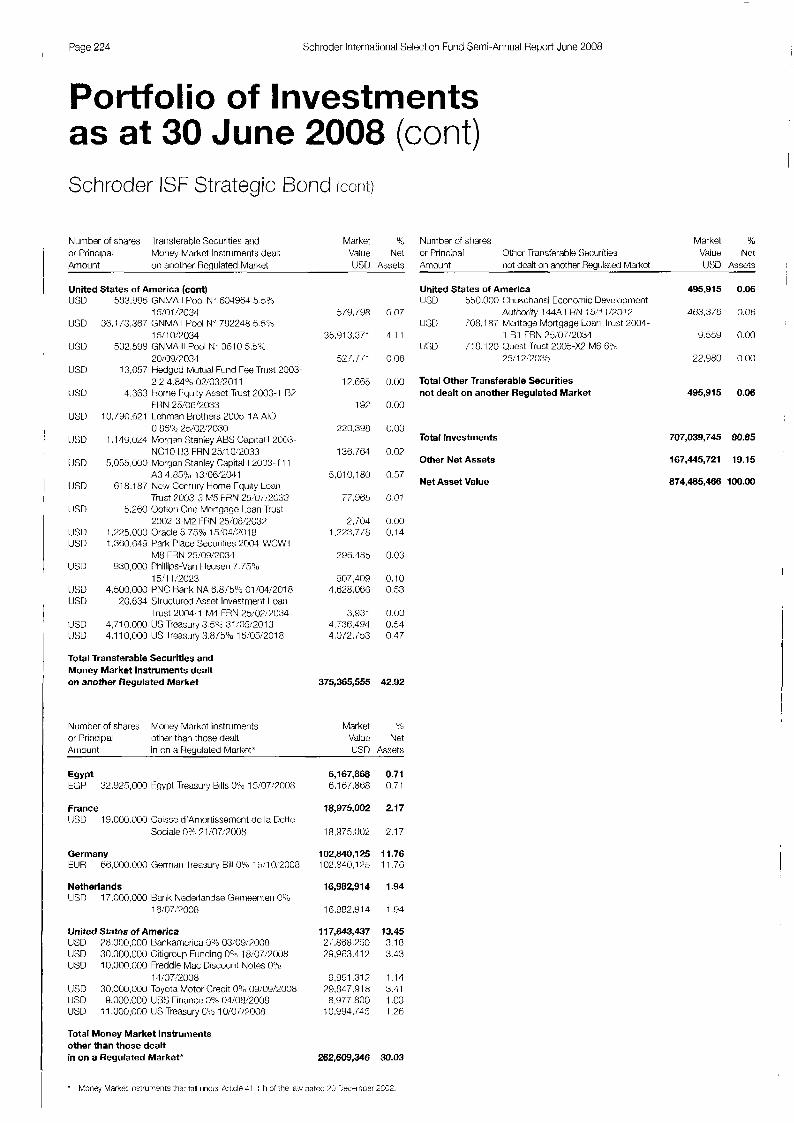
Page 224 Schroder International Selectiori Furid Semi-Annual Report Jurie 2008
Portfolio of Investments as at 30 June 2008 (cont) Schroder ISF Strategic Bond (curit)
Number of shares Iransterabls Sccurities arid Market Number of stiares Markel u/; Value Net or Principal Moriey Market lnstrumerits dealt Vaiue Net or Principal Other Transferable Securities
Amount or) another Regulated Market USD Asset$ AmDunt not dcalt on mother Regtilaled Market USD Assets i
United States of America (cont) LJSU 583.W5 GNMA I Pool N' ti04Yti4 5.535
1 5;oi :2034
1 5: 10:2034
20:09!?034
2 2 4.84% 02.:03:2011
USD
lJW
USD
LJSU
USD 10.790.fi2 1 Lchman Brothers 2006 1A AIC
IJW
USD
USD
IJSD
IJSU US0
U X
IJSD USD
USD USD 4.110,000 US Ireasury:3.8/oB 15:05:2018
3ti,l i3.367 GNMA I Pool N' 782248 5.5:5
532,SY8 GNMA II Pool N- 3610 5.5'4,
13.057 Hedycd Mutual Fund Tee Trust 2003-
4,383 t-lrmw F qiiily Assct Trust 2003-1 r37 F I4N 25'062033
0.85% 25:02:7030 I , 115,024 Morgan 3ariley ABS Capital I 2003-
NC10 H3 FHN 204 0:2033 5,055,000 Morgan Stanley Ca[)ital I 2003- 1 1 1
f l f l .187 Nc.f~ Centuty Home rqiiity Loan
5.260 Option One Mortgage Loan Trust
A3 4.859 13,06,'2011
Trust TWJ3 3 M5 tHN 25Xli:2033
2002 3 M2 FHN 25~08/203? 1.225.000 Oracle 5.75?,, 15:03:20 18 1.3f0.049 lJark h c e Securities 7004 WC\nIl
M8 TRN 25:09:203.1
1 5; 1 1 :2029 930.000 Phillips-Van I leiiseri 7.754;
4.500.000 PNC Hank NA ti.8/Su5 01/04/2018 20.634 Slruclured Assct lnvestrrierit I oa!)
Trust 2004-1 M4 FHN 25:,:02:2034 4.710.000 US Rcasurf 3.5% 31:r)5:2013
Total Transferable Securities and Money Market Instruments dealt on another Regulated Market
Nunnbcr of shares or Priri(:iwI
Moriey Mnrkct Instruments other than those ciealt
s/9,;9fl
35.91 3.371
52/./ /1
17.665
1 S?
220.398
136.764
5.010.1 80
77,965
2.1'04 1.223,7:8
2(26.'183
907,409 4,628,060
;i,YJ31 4, T30.4S.S 1 ,0 72.753
375,365,555
Market VkK!
United States of America USU 550,000 (:liukchansi Econorriic Developmeint
USD 70R,lR7 Mcritaye Mortqa(je ILoari Irust 2004-
W L ) i18.1?0 Clue:;t frust 2005x7 MF 09h
0.07
1 . 1 1
0.06 75:i 2.:2035
Authority 144A TRN 15'1 12012
1 B1 TRN 35:07:2031
o.oo Total Other Transferable Securities
0.00 not dealt on another Regulated Market
0.03
0.03
0 57
0 01
Total Investments
Other Net Assets
Net Asset Value
0.00 0.14
0.03
0.10 0.53
495,915 0.06
4ti3.376 0.06
5.55Y 0.00
22.980 0.00
495,915 0.06
707,039,7fi 80.85
167,445,721 19.15
874,485,466 100.00
0.00 0.51 0.47
42.92
"3
Net Air iount in or1 a Regiilnted Market' LSD Assets
Egypt 6,167,868 0.71 ECP 32,925,000 Fgypt Treasurj Bills 0% 15!07:7008 8 . 1 6 7 , ~ ~ ~ 0.71
France 18,975,002 2.17 IJSU
Sociale 0 3 21~007?2008 18,975.0W 2.17
Germany 102,840,125 11.76 EUH titi;.000.0110 Gerrilari Ireasufy Hill 0% 15'1 0:2008 102.840.1~.i 11.7C
Netherlands 16,982,914 1.94 US0
18:07:?00R 10.982.Y 14 1 .!?4
United States of America 117,643,437 13.45 USD ?8.000,000 Bnnkanrcrica 9% 03:09:?008 2;.8tiU.750 3.18 USD 30,000.000 Citigroup Funding 0% 18:07:700H 29.9c?3.417 X43 USD
14:07:2008 9.991.311 1.14 lJSD 30,000.000 Toyota Motor Credit 0% 09:09:2008 23.R47.918 3.4 1 LJSD Y.000,000 URS r-iriarw 095 04:008:2008 8.377.800 1.03 USD 11 .000.000 US Treasury (20 10;07;?008 10.U94.745 1 26:
15,000.300 Caisse d'Arriorlissemcnt de la Dette
17,000.000 Bank Nederlandse C~eriieenlc?n CL;b
10,000.000 Freddie Mac Discourit Notes 0%
Total Money Market Instruments other than those dealt in on a Regulated Market* 262,609,346 30.03

Schroder International Selection Fund Serrii-Annual Report June 2008
Portfolio of Investments as at 30 June 2008 (cont) Schroder ISF Asian Convertible Bond
Nurnber of shares Transferable Securities and Market % or Principal Moncy Market Instruments Admitted Value Net Anlourit to an Official Exchange Listing LJSD Assets
Bermuda CNY
USD
USD HKII
British Virgin Islands IJSD
British Virgin Islands HKD 350,000 Shanghai Industrial Investment
3.500.000 GOMI I lectrical Appliances 046 10/05~7014
2 1 ! 1 2i20 1 2 300.000 Hongknng 1 and Cn 7005 7.7541
3GO.000 Noblc Group 0% 13:06/2014 1,300,000 Yiie Yuen Industrial 095 17:l 1:2011
350.000 PB Issuer 3.3% 01/02:2013
Treasury 0% 16!03!7009
Cayman Islands CNY
USD
CNY I IKD
I IKD
I IKD
China HKD
400,000 China High Speed Trdnsrnisslon Equipment Group 0% 14:05:2011
400.000 Chinn Overseas Finance Investment Cayman O?b 14!05!2014
500,000 Country Cardcn 2.5% 22/02/2013 700,000 Golden Eaglc Rctaii Group o".,
600.000 Hengan lntcrnational Group 0%
450.000 HKR Intcrnational 0% 26:04:2010
2 3 1 0:2011
1 f/05/2011
5.800.000 China Petroleum & Chcmical 0% 24.'04:2014
Hong Kong SAR I IKD 2,700,000 Gainlead International Ou5
HKD 3.000.000 Shcrson O0,k 04:0ti!2014 22/02:2012
India USU I JSD
LJSD
USD
rusn USD USD IJSD USD
200,000 Jiihilarit (Irganosys O0k 20/05:2011 100.000 Mahindra R Mahindra OQb
300.000 Ranbaxy Laboratories O"s5
800.000 Rcliancc Communications 0%
100,000 Stcrling Riotcch 0% 16/05:2012
250,000 Surlon Energy 0:; 17~0ti:7017 ?50.000 Tata Motors 1% 27/04;2011 500,000 lata Sled 1 :b 05'09201?
14,'04/7011
18!03/?011
01 .:03:2012
80.000 Slerling Hiotecti 0.5"s; 30:09:2010
Malaysia USD IUS0 USD IJSD
Singapore SGD SGD SGD USD
500.000 Cheratiri<l Capital ??,; 05/07/2012 300,000 IO1 Resources 0% 15:01/201:3 200.000 Faka Oapital 0% 17:(!3:?013 400,000 Rafflcsia Capital variable 04:10!2011
500,000 Capital arid 7.1 4:, 15/11/2016 500,000 CapitaLand 3.125% 05:W,'X 18 200.000 Kcppcl Land 2.5% 23:0ti;2013 200.000 Wilrnar lriternatinnal f)% 18/1 ?/71)1?
South Korea USD 400,000 Hynix Semiconductor 4.535
tJS0 700.000 ILG Display 045 18/0/1:2012 lJSD 100.000 SK .Tilecorn 0% 27;05:2009
11:12:2012
1,385,585
458./45
351.015 405,308 110.438
307,430 307,430
48,749
48,749
821,718
57.170
114931 69,029
1 12,598
1c)1.981 66,056
798,570
798.570
71 0,378
359.473 340.905
2,761,510 222.250
104.708
330,451
832.792 98.500 06,523
252.586 243.450 571.14/
1,440,307 508,750 280.125 186,500 464.937
1,096,416 362.852 362.521 147.783 2%3,260
695,610
373.n41 207,910 11 3,859
10.06
3.33
2.55 2.94 1.24
2.23 2 23
0.35
0.36
5.96
0.41
3.01 0.50
0.82
9.74 fi.48
5.79
5.79
5.15
2.68 ?.47
20.02 1.61
3.76
2.45
9.04 0.71 9. i o 1.03 1.77 4.14
10.44 3.69 2.03 1.35 3.37
7.95 2.63 2.63 1.07 1.62
5.05
2.71 1.51 0.83
Page 225
Number of shares Transferable Securities and Market ?'3
or Principal Money Markct Instruments Admittod Valuc Nct Amount to an Ofticial Exchange Listing USD Assets
Taiwan USD US0 IJSII USD
IJSD
USD
USD USD USD
45,000 Asustek Computer 046 1 5:01 :2009 250.000 Chi Mei 096 18/12!2011 300.000 Compal Electronics 0 8 1 "!OW201 0 250,000 International Rank of Taipei 0%
22/12~2000
17/06:21)09
30/06;2011
50.000 Powerchip Semiconductor Regs 0%
1 15,000 Powcrchip Scmiconductor HcgS 04b
300.000 Quanta Computcr 0% 26:07;2010 1 10,000 Shin Kong Financial 0% 17/06:2009 150.000 Walsin Lihwa 0% 1 4 1 1 /2011
United States of America lJSD 40.000 Tata Chemicals 1 B 01 i02i2010
Total Transferable Securities and Money Market Instruments Admitted to an Official Exchange Listing
Number of shares or Principal Amour it
Transferable Securities and Money Market Instruments dealt on another l4eoulaled Market
1,663,073 12.06 57.359 0.42
280,252 2.03 342,145 2.48
261.550 1.82
45,021 0.33
108,860 0.79 305,319 2.21 109.941 0 8 0 119.58/ 1.08
52,700 0.38 h2.100 038
11,782,046 85.44
Market ?, Value Net UStJ Assets
India IJSU
South Korea USD LJSD USD
Total Transferable Securities and Money Market Instruments dealt on another Regulated Market
100.000 JSW Steel OO:: 28:06:2012
300.000 KCC: Series A 0% 30!10:?012 200,000 KCC Swies B 0% :30!10!2012 500.000 KCC Series C 09" 30/10:2012
Total Investments
Other Net Assets
Net Asset Value
112,959 0.82 112.959 0.82
927,294 6.72 772.831 1.98 185.755 1.34 468.708 3.40
1,040,253 7.54
12,822,299 92.98
968,433 7.02
13,790,732 100.00

Page 226 Schroder Iriternatioiial Selectioi Fund S(wii-Aririual Report June 2008
I
Portfolio of Investments as at 30 June 2008 (cont)
I
Schroder ISF Global Convertible Bond
Number of shares or Principal Amount
Belgium EUH EUH
Bermuda (.:I lr
CNY
LJSD
USD
British Virgin Islands LJSD HKD 800.000 Sherson 0?, 04:06:2014
Cayman Islands CNY
t JSD
JPY
China HKD
Iransierable Securities and Money Market lrislriinients Adnnittcd to an Official Exchariye Listing
250.000 rortis Uarik H {N perpetual 500.000 Sagerpar 2 958 27:04;2012
130,000 Adccco Financial Service krrri i idd
'300.000 GOME Electrical Appliances 0':'.
200.000 Hongkong Land (;n 2005 2.75Pb
100.000 Noble Gruup C% 13.'08,'2014
0% 76AX5'2013
1 8:05:2014
21/12:2012
200,000 PB Issuer 3.340 01:02:2013
800.000 China High Speed Transmissiori Equipment 14:05:2011
300.000 China Overseas ririarico Iriw;lrriont Cayrriari 095 14;05:201.1
40.000,OOO Keystone Capital 0.1 U.0 04:04:7011
1 ,600,000 China Petrt.)leurri & C;tieii-iical 0% 74!04:2014
Finland EUR
France FUR FINI ELJR 160,000 Corripaqriie GeriBrale des
200,000 Nokiari Herikaat 0% 27:06::2014
2X.000 Cap Gemini 1 % 01:01:201? 600,000 Cap Ccmini 2.5% 01:01~7010
Elablissemcnts Michelin 0% 01:01 :701 7
10.000 France Telecorri 1.6% 01 :91,20(3<! tLJI( EUH 400.000 Ttieolia 2% 01:01~2011
Germany USD t l l l i
03;02:2010 EUR 400.000 Kreditan:;LnIt tucr Wicdcraufbau
3.254; 2i:06:::201 3
:j00.000 Oresdrier narik 0% 22:06,'2009 100.000 Kreditanstalt fuer Wieckraiilbaii 0.5":
Guernsey CHI. 40~1,000 EMS-International Firiarice Guernsey
2.5% 23:04:2010
Hong Kong SAR HKD 2,800,000 Gainlead International 0:s
02:2012
India US0 200.000 .Jubilant Orgalnos); USD 200.000 Reliarice (:ornrr i i i r
USD USD 100.000 lata Motors 096 12:01:2012 LJSU
Japan JPY 10.000.000 Asahi Breweri JPY 10.000.000 Asahi Glass 1
JPY 10.000.000 Citi7eri 0% 07'1 0:200'3 .JPY 20.000.000 hkuyama Tfmsporting I).Ol'i:-,
:IO,o!r),2025
01:03:%01:' 200,000 Suzlon Energy 0 h 11/10/2012
200,OX Tata Steel 1 '% 05!09/701 7
JPY 18.000.000 Uarik 01 Kyoto 0% 31:03:2014
Market %,
USD Assets 'PdIUe Net
1,086,642 794,543 792.099
1,021,454
128,487
11 7.503
234.01 0 530,s t 4
266,582 175.674 90,C.OR
816,308
114.730
31 1.200 3'30,888
220,295
220.2'35
325,169 375,l 69
1,436,065 182,5134 4U1.381
2X.3D5 400,728 133.02:
1,606,l 69 353,769
642,489
810.411
461,274
151.2/4
383,157
3Wd,l3/
946,237 222.250
208, i 98 1(,15.580 90.750
228.459
3,316,567 102.022 110.196 187.149 104.70f
176.d22
3.38 0.52 2.13
3.18
0:lU
0.37
0.73 1 .Bs'
0.83 0.55 0 28
2.54
0.35
0.97 1.27
0.69
0.65
1.01 1.01
4.47 0.3/ 1.53
0.71 1.75 0.1 1
5.00 1.10
2.00
1 .90
1.43
1 . 4
1.19
1.19
2.94 0.88
O.Fj5 0.81 0.28 0.71
10.32 0.37 (1.35 0.58 0.33
0 FT J3
Nurriber 01 shares or Principal Amount
Transferable Securities and Money Markct Instruments Adrriitted to ari Ollicial Exchange Listing
Japan (cont) JPY JPY JPY 20,000.000 Mitsiitii:;tii (Iieiiiical 0 .IFY JPY 1 8,000.000 Nidec i)B 17:l 0:2008 JPY 15,000,000 Nippon Sheet Glas:; 0% 13.05:201 I JPY 10,000.000 Nippon Yusen 0% 24;09:202t? JPY 10,000.000 Norriiira ne:;enrch Institute
JPY 70.000,OOO NTN 0% 19:03:2009 Jt 'Y 40.000.000 Sharp 0% 30iO92013 JPY
40.000.000 H20 Hctailing 0% 15~08:7011 3C1.000,000 Koiiica Minolta 0% 01
8.000.000 Mitsui OSK Liries 0% 25'03201 1
31i03?2014
30.000.000 Suzuki Motor 0% 29:03:201 3 JPY 21.000.000 Tok+ 0.2?4 31:03:2009
Malaysia US0 USD
Netherlands tll l i 300.000 Pargesa Netherlands 1.7%
rt I H
400,000 IO1 Resources 0% 15'01~20 I3 700,000 Rafflcsia Capital variable 04:l O:2O 1 1
27;04:2013 200.000 Portugal Telec:oni International
rirlarlct! 4.12591 28:08/~14
Portugal EUR 400.000 ~nrpublica-Participacoes Publicas
SGPS 3.257; 1m2:2014
Singapore
IJSD
South Korea
250.000 C:;>pilnLalld 3.1 23% 05:03:2010 200.000 Wilniar Internatiorial 0% 18:12,'2012
IJSD 200,000 I lyriix Seiiiiccinductor 4.5% 14;l 2:2012
LJSU 250.000 Iriterriatiorial Hank of Taipei 0% 27:1 7:7009
United Kingdom GRP
United States of America US3 US3 11.500 C:itiyroup ti.S% perpetual US7 180.000 Gcnzyme (31:17:2023 US0 USO
USE 100 Wactwvia 7.5% perpetual
Total Transferable Securities and Money Market Instruments Admitted to an Official Exchange Listing
500,000 3i Group 3.6253 29:05!701 1
500 Bank ot Anicrica (.25',n perpetual
Number of shares or Principal
.lrar.islerahle Securitics and hloncy Market lnstrunierits dealt
Market 75 Value Net tJSU Assets
4 2 2 3 2 1.31 295,985 0.92 170,938 0.53 105.208 0.33 165.127 0.51 1SY.740 0.50 124.248 0.39
91,545 0.28 200.071 0.65 377,568 1.17 302.284 0.94 214,488 0.07
605,966 1.89 373.500 1.17 232.466 0.77
574,465 1.79
27ti,3i3 0.46
297.892 0.Y3
587,935 1.83
58/.835 1.83
404,521 1.26 181.261 0.57 223.?00 0.39
186.921 0.58
156.921 0.38
547,732 1.70 112.101 0.35 171,072 0.53
204,559 0.82
973,774 3.03 973.774 3.03
1,664,204 5.18 447.500 1.40 508,345 1.58 200.i00 0.62
41,726: 0.13
370.941 1.17 B0.YY2 0.?8
17,431,437 54.24
Market % Value Net
011 anothcr Regulated Market US0 Assets Arrourit
Canada 222,750 0.69 US[>
15!03:2028 222.150 0.69 200,000 Kiriross Gold 144A 1.75%

Schroder lnternalonal Selet;tion Fund Semi-Annual Report June 2008
Portfolio of Investments as at 30 June 2008 (cont) Schroder ISF Global Convertible Bond (cont)
Numbcr of shares lrarisferablc Securities and Market Sb or Principal Moncy Market Instruments dcalt Value Net Amount on another Regulated Market USD Assets
Cayman Islands USD USD 800,000 TransocAan 1.62595 15:12/2037
Israel USU
100.000 I.DK Solar 144A4.7591 15/04:2013
500,000 Tcva Pharmat:eutical Financc 1.75% 01 :02/202 ti
South Korea USD 300,000 KCC 0% 30!10:2012 IJSI)
United States of America
200.000 KCC, 0% Series A 30,'102017
OSD USD
IJSD IJSD USD
USD
USD IJSD US0 IJSD
USU US0
I IS0 I JST) US0 USD USD USD USD
560.000 Amgeri 0.375% 01/02/2013 600,000 Archer-Daniels-Midland 0.8 15%:
400.000 Reckman Coulter 2.5'70 15:12:2036 200.000 Best Ruy 2.25?/5 15!01!2077 340.000 Boston Properties ?.8/S%
800.000 EMCIMassachiisetts 1 ,75%
15;02;2014
15i072037
01:12'2011 500,000 ERP Opcraling 3.fl5% 15:08;2026 100,000 Gilead Scienccs 0.62576 01/05:2013 400,000 Intel 2.05% 15!12:2035 240.000 Inlernatiorial Game Tcchnolog; ?5?k
800.000 Medtronic 1.675% 15!04;2013 200,000 Molson Coors Brewing 2.5%
800.000 Nabors lndustrios 0.94% 15/05/2011 320,000 Newnivnt Mining 1.25% 15:07/2014
800,000 Prologis 144A 7.7546 160,000 Rayonier TRS 3.76% 15!10!201:! 160.000 Vornado Realty 3.875% 15!04;2025 160,000 Xilinx Xl25Y0 15:03!2037
15'1 2:2035
30f072013
1,000,000 Omnicom 0% 01!07:2038
Total Transferable Securities and Money Market Instruments dealt on another Regulated Market
Total Investments
Other Net Assets
Net Asset Value
1,029,000 11 9.000 81 0.000
555,000
555,000
483,115 281,776 181,XH9
8,584,100 487,900
610.500 447.000 208.500
315.350
68/.150 4;5.450 148.750 392,000
731.000 855.000
243.750 088.000 419.200
1 .wt i250 54 9.000 161,600 180.800 151 .800
10,853,965
28,285,402
3,860,626
3.20 0.37 2 83
I .73
1.73
I .44 0.87 0.57
26.69 1.52
1.90 1.37 i1.66
0.98
2.11 1.48 0.46 1.77
0.72 2.60
0.78 3.0/ 1.30 3.22 1.71 0.50 0.56 0.47
33.75
87.99
12.01
32,146,028 100.00
Schroder ISF Strategic Credit
Pagc 227
Nurnher of shares Transferable Securities and Market 70 or Prinapal Money Market lnstrurnents Admitted Value Net Amount to an Official Exchange Listing tUn Assets
Cayman Islands USD 30,000 Seagatc Tcchnology HDD 6.375";
01:10:2011
France EUR
EUR
1'30,000 BNP Paribas EMTN 4.75%
150,000 Casino Guichard Perrachcm 0.37546 04/04:2011
04/04/7013
Netherlands OS0
Philippines USD
050.000 Mqapahit RegS 7.25Tb 17:l 0!2011
147.700 CE Casccnan Water & I-nergy 11.95% 15:ll!~010
United Kingdom EUR 119.577 Gracechurch Card Funding 2008-A
A I FRN 15/10/7012 USD 200,000 I IBOS 144A 6.75sb 21/05/7018
United States of America
LJSD 150,000 C h h b 6.5% 15!05:2038 USD 150.000 Citigroup 6.125% 21~11:2017 USD 700,000 Dynegy 7.7596 01/00:2019 IJSD IJSD
EUR
USD USD USD 300.000 PepsiCo 504 Oli06/2018 IJSD
USD
I IS0
IWI I 150,000 ATRT fi.4qh 15!05/?038
284.282 Elwood Energy 8.1 6946 05;0i!2026 300.000 JPMorgan Chase & Co. 4.7596
100.000 JPMorgan Chase R Co. t-MTN
750.000 Nevada Power 5.87556 15!01!2015 200.000 Nevada Power f 3 5 % 15/05/2018
31 0,000 Rcynolds Americari 7.67572
100,000 Stingray Pass-Through Trust 144A
300,000 1 inw Warrier Cable 5.85%
01/05:2013
5.259.; 08/05;2013
01:06!2016
5.902% 12/01 l2015
01:05Q017
Total Transferable Securities and Money Market Instruments Admitted to an Official Exchange Listing
18,619 0.09
18,619 0.09
332,878 1.65
185.8KI 0.W
147.008 0.73
525,816 2.61 525.016 2.61
119,972 0.60
119.972 0.60
225,016 1.12
106.535 0.53 118,481 0.59
1,743,913 8.67 9?,109 0.47 92.6'35 0.46 82.516 0.46
1 16.R54 0.58 171.n87 0.85
185,247 0.92
95.800 0.48 156,724 0.78 128.736 0.84 185.958 0 . 9
206,778 1.02
38.067 0.19
181.317 0.90
2,966,214 14.74
Number of shares or Principal AmOiJnt on another Rewlated Market
Transferable Securities and Money Market Instruments dealt
Market $6 Value Net EUR Assets
I
France t J : X 1 15,000 Societe Generak 144A 5.75%
?0/04/2L'Iti
107,835 0.54
107.835 0.54
Netherlands 86.739 0.43 tJSD
144A 1.25'% 23/05/2013 86,739 0.43 150.000 Scotland lriternational Finance No 2
United Kingdom 381,363 1.90 OSD 300,000 Barclavs Bank 5.45"; 12:00/2012 193,711 0.97 USD 300,000 HSBC 6.8?0 01/06!2038 187,546 0.93

Page 228 Schroder Internatiorial Selection Fund Serni-Annual Report June 2008
Portfolio of Investments as at 30 June 2008 (cont) Schroder ISF Strategic Credit (cant!
Number ot shares Transferable Securities arid Market 0'.
or Principal Money Markel Instruments deal1 Value Net Amourit on ariother K4egiilated Market EUR Assets
United States of America USD
USD
USD
USD usu
USD L J X USD
USD
usu
USD
US0 US0
US1 1 US0
USD USD IJSD USD
225,000 Americari Irilernational MTN 4.!354
225,000 Rarilc 01 New York Mellori M I N 4.5',0 20:03:201?
01:04:201;1
Securilies Trust 2006-:SD4 3AI FRN 2 5 1 0:2035
2,255.850 Bear Stearns Asset Backed
375.000 Comcast 5.777 15.:05:2018 :iD.fiOS Countrywide Assel -Backed
Certific:ntes 2005-YN 6. 25: 1 0:20w
fiB0,OOO FHLMC (Gold) 9 530,000 k I I Consulting 7 347.082 t-lorrie kqiiity As
FRN 2 3 1 0:2033
NC10 R3 TRN 2 5 1 UT033
Trust 2003 3 M5 FRN 75:07:2033 59.075 Ncw Centuy tiomc Equity I oar1
00,000 Oracle 5.75% 15;0~1:2018 100.000 Phillips Van Hcusen 7.75%
300,000 PNC Bank NA Ei.87596 I)1~04;2010 3fiR.485 Uuest Trust 2005-X:! MCi e?:, 300,000 US Rarik 4.957; 30:10:X14
3.815.000 US Iremiry 2.5,',, 31:05:2013 1.91 5,000 US Treasury 3.875% 15:03:2018 3.340.000 US Treasury 4.75'3; 15'08:701i
15:1 1:20xj
75'1 2:2035
Total Transferable Securities and Money Market Instruments dealt on another Regulated Market
Numbcr of shares or Princirm
Moncy Market Irislrumcnts other thari ttiow dcalt
9,457,967 47.00
137.83d 0.69
139,5!i5 0.BY
YY8,514 4.88 19fi.071 0.97
001 0.00 412.1Y9 2.05 358.053 1 . i 8
9,488 0.05
70R.21 1 3.81
48.206 074
.1,72/ 0.02 fiO.'Oti 0.75
ijl.905 0.31 195,754 0.9/
Y .S I1 0 05 186,950 0.93
2.434070 12.10 1,203375 5.98 7,243,384 11 . I 5
10,033,904 49.87
Market '4;
Value Net Arriount i r i or a Hcgulated Market' FUR Assets
United States of America 2,405,737 1 I .95 (JSO UOl l .000 Barclays U.S. 0% 21!07;2L'08 340.145 1.88 LJSD 1,000.000 Citigroup I unding 0?C 18:0717008 1,013,915 5.04 US11
07;07:701)8 83.417 0.32 USD 700.000 Toyota Motor Credit 0% 09:09:2008 441.845 7.20 USU 800.000 UBS Finance 0% 04:08:2008 500.314 2.51
100,000 I reddio Mac Discoiiril Notcs 0%
Total Money Market Instruments other than those dealt in on a Regulated Market* 2,405,737 I I .95
Number of Shares Market % or Principal Other Trarvjtcrable Securitic?:; Value Net
EUR Assets Amwi t not deal1 on another Rmjulated Market
United States of America USD 805.1 4 5 Asset l3at;lted Securities Gorp
Home rqiiily 2003-HE5 M5 H{N 15;0Y:2033
USU 160,000 Chukchansi C(:onomic Develop,rrieril Authority 144A FRN 15'1 1 :2012
USD 272.125 I Ioiiw Equity Asset Iru:;t 2003-8 03 FI IN 25;04:7004
LJS2 573.1 28 Master Hewcuritizatiori lrust 2008'- IC1 N2 7,759: %0:07:2035
US3 GY3.71 1 Moryan Stanley An:; Capital I 2003- NCG E33 FRN 2,5'013:2033
USD 747.450 Morgan Stanley Dear) Witter Capital I 7003 NCI R1 FRN 25'1 1;2032
IJSD 51 1,944 New Ceritury Homc Equity Loan lrust 2003-6 MR FHN 25:01/2034
Total Other Transferable Securities not dealt on a Regulated Market or Listed on a Stock Exchange
Total Investments
Other Net Assets
Net Asset Value
585.757 2.91
fiti.191 0.28
85.525 0.43
17.265 0.08
21Ci.Y/3 1.08
42.385 0.21
18.9ii9 0.09
148.449 0./4
585,757 2.91
15,991,612 79.47
4,129,960 20.53
20,121,572 100.00

Schroder International Selection Fund Semi-Annual Report June 2008
Portfolio of Investments as at 30 June 2008 (cont) Schroder ISF EURO Equity Secure 201 0 Ni.irriber of shares Transferable Securities and Market 5 or Prirwipal Money Market Instruments dealt Value Net Amount o n another Regulated Market USD Assets
United States of America USD
lJSD
1,326,937 Countrywide Home Eqiiity I . ox Trust
1.774.058 First Franklin Mortgage Loan Asset 2005-M A3 FRN 15:02:2036
Hacked Ccrtificatcs 2GM-kF3 M I FRN 75:05:7034
921.285 Mastr Asset Rackcd Securities Trust 2005 NC2 A2 FRN 25:i 1 :2035
1 11.845 Morgan Stanlcy ABS Capital I 2005 HE5 A2R FRN 25~004035
2,800,000 SLhl C;iiident I om Trust 7007-A A2 FRN 16/17/2030
I.lX
USD
USD
Total Transferable Securities and Money Market Instruments dealt on another Regulated Market
Number of sharcs or Principal Amount
Money Market Instruments other than those dealt in on H Reciiil;ltecj Market*
5,457,021 22.21
1 .I t53.714 4.74
1,054,909 4.29
915.991 :3 73
177,782 r; 72
2.144.625 8.13
5,457,021 22.21
Market 4 Value Nct
United States of America IJSD USU l J X J
Total Money Market Instruments other than those dealt in on a Regulated Market'
1,000 000 FHLMC 095 14'07:08 1,000 000 FNhlA 0% 07/07:?008 R 150,000 IJS Treasury Rill 0% 04!09:2008
Total Investments
Other Net Assets
Net Asset Value
10,718,406 43.62 1,000,000 4.07
999,302 4.06 8.719,101 35.19
10,718,406 43.62
16,175,427 65.83
8,394,231 34.17
24,569,658 100.00
I Page 229 ' I
Schroder ISF European Defensive
Number of shares Money Market Instruments Market 96 or Principal other than those dealt Value Net Amount in or1 a Regulated Market* FUR Assets
Certificates of Deposit TVR EUR
tUH
EUR EUR HJH
EUh EUR EUR 28.800.000 Kommunalkredit lriterriatiorial Udrlk
096 09/07:2008 TIUR CUR
EUH
EUR EUH
57.fi00.000 Alliarice & Leicester 0% 09/07:7008 5/.600.000 Banco Popolare di Novara 046
9,000,000 Hanco Santander (London) 0%
8.800,000 Rank of Ireland 0?6 09/07/2008
0 9 0 /:2008
09/07/7008
28.800.000 RCP Finance 0% 09/07:2008 78.800.000 CommerAmnk Fiirope (Ireland) 0%
57.600.000 DZ Rank (Ircland) 0% 09:07:2008 29.C)00.000 HSH Nordbarik 0% 09/07!2008
09/07:7M18
57.600.000 Macqi.iarie Barik 08 09/07/7008 29.000.000 Nationwide Building Society 0%
28.800.000 Swedish Housing Financc 0%
20,900,000 Ulster Balk Ireland 0% 09!07:7008 29,000,000 Unicrcdito ltaliano (London) 0%
09/01/2008
09/07;2008
09/07/2008
Total Money Market Instruments other than those dealt in on a Regulated Market*
Total Investments
Other Net Assets
Net Asset Value
478,693,122 99.59 67,539,073 11 9fl
5/.539.0/3 11.96
8,990,480 1 f36 8,790,691 1 .H3
28.769.536 5.99
78,769,537 5 99 57,530,073 1 1.97 28.969.325 6.03
28,169.53/ 5.99 57.539.073 11 97
?8.969.375 6.03
28 769.537 5.99 78.789.537 5 99
78,969,325 6 03
478.693.122 99.59
478,693,122 99.59
1,963,644 0.41
480,656,766 100.00
I

Page 230 Schrodcr Internatiorial Seleclion Fund Semi-Annual Report Jurie 2008
Portfolio of Investments as at 30 June 2008 (cont) Schroder ISF European Defensive Monthly Numtxr of sharcs or Principal Amount
Money Market Iristrurrwits other thari ttwse deall in or1 a Heuulated Market*
Certificates of Deposit EUR EUR
EUR
EUR EUH FUR
EUR tUH
08:07:2008 FUR 1.200.000 Kommunalkredit Internatiorial Uarik
0% 0Wl7'2008 EUR t U h
tUH
EUH FOR
?.400.000 Allinrice & Lciccstcr 0% OY:Oi,VOGG 2.400.000 Rarico Populare cji Novara 09L
1.000.000 Harl~o Sarilandcr (Lot1dOt1) 0?a
1.20C.000 Rarik of Ireland 0% 09:07:2008 1,20c.000 RCP ririarice 0% 09:07;2008 1,20C..000 Commerzbank Europe ilrelarici) CJ?%
2,4CC.,000 UZ Bank (Irelandj 046 09!07:2000 1 ,00L',000 HSH Nordbarik (Luxenlboury) 04;
09:07/2008
09:07/2008
09:o /:?OOD
2.400.000 Macquarie O,aik 0% 09:07:2008 1,000,UOO Nationwide Buildirig Sociely 0%
1,200,000 Swedish I lousiriy hriance 0%
1,200,000 Ulster Bank Ireland 035 09:07;2008 1 .000.000 Unicredito ltaliano (London) C!%
09:0/:20013
OY:Oi:?OO8
09:o i:70oo
Total Money Market Instruments other than those dealt in on a Regulated Market*
Total Investments
Other Net Assets
Net Asset Value
20,777,999 84.73 2,397,462 9,:8
2397.461 (3.78
W8.542 4.01 1.1!X%731 4.89 1.198.7:31 4.89
1,1G8,731 4.89 2,:337,4til Y.?8
W8,9l2 4.0;
1.1 98,731 4.80 7,397,431 '3.77
YY8.942 4.07
1.198.731 4.89 1,188.731 4.89
9W942 407
20,777,999 84.73
20,777,999 04.73
3,744,966 15.27
24,522,965 100.00
Schroder ISF European Defensive 6 Monthly Number of shares 1rari:;lerahle Sccurities and Market % or Principal Moriey Markct Instruments Admitted Value Net Amount to an Official Exchange Listiriy EtJR Assets
Germany 7,198,920 23.87 FUR 7,200,000 Deutsche Rundesreput)lilc 0%
04:0;:7(300 1,194,920 23.87
Total Transferable Securities and Money Market Instruments Admitted to an Official Exchange Listing 7,198,920 23.87
Numbcr of shares Moriey Market Instruments MRrhet ?'d
o r I'rincipal other t t ia r i Ltiosc dealt Value Net Amount in on a Regulated Market* EUR Assets
Certificates of Deposit FUR 2.200,000 AIB 0% 09:07,7000 EUR 2,200,000 HFMC O',> Otri01'2008 EUR 2.200.000 Unicrcdito ltaliario iloridori) 0%
09~07?2008
Norway EUR
Total Money Market Instruments other than those dealt in on a Regulated Market*
1 .7110.000 DNH Norskc Bank 0% 09:07:7008
Total Investments
Other Net Assets
Net Asset Value
6,593,019 21.87 2.19/,673 7.29 2,1(37.6/3 7.29
2.1Y i .6 /3 7.19
i,iga,730 3.97 l,lr,8,730 S.Y/
7,791,749 25.84
14,990,669 49.71
15,167,486 50.29
30,158,155 100.00

I
Sctiroder Iriterriatiorial Selection Fund Semi-Annual Rcport Junc 2008 Page 29 1
Portfolio of Investments as at 30 June 2008 (cont) Schroder ISF World Defensive 3 Monthly
Schroder ISF EURO Liquidity
Number of sharcs Moncy Market Inslriiments Market % Number of sharcs Transferable Securities and Market rh or Principal othcr than those dealt Value Net or Principal Money Markct Instruments Admitted Valiie Net Amoiint 111 or1 a Regulated Market* tllli Assets Anioimt to ari Ofticial Exchange Listing EUR Assets
Certificates of Deposit kU11 EUR
EUII
EUII ElJR EUR 500,000 Commer7barik Europe Oo,;
EUR EUR
ElJR 500,000 Kornmunalkrcdit International Rank
FUR EUR
FtIR
EUR t IJR
1,300,000 Alliance R Leicester 0% 08!07/2006 1,300,000 Banco Populare Di Noma 09b
5n0.000 Banco Santander (London) 0%
500.000 Rank of Ireland 0% 09,'07/2008 500,000 BCP Bank (Ireland) 0% 09X)7/2008
09:07:7008
09!07:2008
09/07/7008 1.300.000 DZ Bank (Irelancl) 08 09:07!2008
500,000 HSH Nnrdbank (Luxembourg) 0% 09:07:2008
0% 0W07/2008 1.300.000 Macquarie Bank 0% 09i07:70n8
500,000 Nalionwide Biiilding Society 0%
500.000 Swcdish Housing Ftriilrice 00.6
500.000 Ulster Rank Ireland 0?,b 09;0T:2008 500.000 Unicrcdito ltaliano (London) O?h
08:07:2008
09/07/2008
09:07:2008
Total Money Market Instruments other than those dealt in on a Regulated Market*
Total Investments
Other Net Assets
Net Asset Value
10.189.211 1.298 625
1,298,625
488.171 499,471 499.47 1
499.471 1,298,625
198.471
499 471 1,298.625
499.4 I 1
409.4i1 495,472
4W.471
64.05 0.1 7
8.16
3.14 3.14 3.14
3.14 8.16
3.14
3.14 8.16
3.14
3.14 3.14
3.14
Australia ClJR
EUR
3,900.000 St George Rank FMT FRN
1.500.000 Westpac Banking EMTN TRN 10/08:2009
22;12/2009
Austria FlJR 3.001).000 Erste Bank der Oeslerreichischeri
Sparkassen EMTN FRN 23/11!2010
Belgium EUR
Cayman Islands TtIR
TtJR
10,000,000 Fortis Rank EMTN FRN 14:05;2010
1 .000.000 RCP Finance Rank EMTN FRN
3.000.000 BCP Finance Rank EMTN FRN 0tii07/70119
7011 0!70119
Denmark 3,000,000 Dariske Oxik CMTN TRN
01:12:20i)9
France ElJR EUR
10,000,000 RNP Paribas EMTN FRN 14!04:2010 7.000.000 BNP Paribas FRN 14:04:2010
10,189,211 64.05 ''IR
EUR
t l l l l
EUR
EUH Ell14
10,189,211 64.05
5,719,665 35.95
15,908,876 100.00
Money Mo:it:t Ir'r;triirnonts that t3ii under Aq~cle r l l I h cf :he la'/, dared 2r Dw:ornt;cr 7CC7
4,00L'.000 Caisse Nationalc des Caisscs d'Epargnc et de Prcvoyance EMTN FRN 06!0RD010
4.000.000 Credit Agricole EMTN FRN 05/01:2006
9,250.000 (;rBdit Agric:ole:l oridon KMTN FRN 1 5:04G010
4,000,000 Credit Agricole/London EMTN FRN 2 i/o4:2012
7.500.000 G t Capital fCC FliN 10/0R!2010 5.000.000 Societe Generale FRN 16:04:2010
Germany [IUR 10.000.000 Deutsche Rank EMTN FRN
18/03:2011
Ireland FtIR fIUR
2,750,000 Allied Irish Banks FRN 29/09/2008 0.000.000 Rank of Ireland EMTN FRN
01 :07:2010
Italy ElJli
ElJR
EUFi EUR EUR
4.000.000 Barim Popolare FMTN TRN
2,200,000 Locat Swiiritisatiori Vehicle ?006-4
7 500.000 IJniCredit t M l N FRN 78:06:7010 3,500,000 UniCrcdit EMTN FRN 05i07/2010 3.000.000 Unione di Banchc ltaliane FI7N
1 Y:l 0/2009
A2 FRN 12!12:2028
26/01 ;2009
Luxembourg EUH
Netherlands ElJR
EUR ElJR 1.000,0OO KBC Internationale
1 .I 10.367 Silver Arrow 2A FRN 15:08/2014
3.000.000 RMW Finance FMTN FRN 10/1 In008
14,000.000 ING Bank EMTN FRN 71/05,'7010
Firiaricieririgsrriaatschappij EMTN FRN 08:01/2010
4,465,484
2,979,150
1,388,325
2,970,000
2.070.000
10,010,918 10.010.918
3,971,593
996.760
2.9r4.833
2,989,118
2.909.116
50,778,595 10,035.810 7.01 7.500
3.979.104
3.996.200
9,286,075
3,939.292 7.509.000 5.015.814
10,033,910
10.033.n10
10,734,558 2,740,958
7,993.600
20,096,282
3,982,220
2.128.09fi i.SlS.f50 3,476.083
2.992.533
1,103,816 1.103.816
18,017,333
2.988.000 14,035,000
994.333
0.25
0.1 7
0.00
0.17
0.17
0.57 0.57
0.23
0.06
0.17
0.17
0.1 7
2.90 0.67 0.40
0.23
0.23
0.53
0.22 0.43 0.29
0.57
0.57
0.61 0.16
0.45
1.15
0.23
0.12 0.43 0.20
0.17
0.06 0.06
1.02
0.16 0.80
0.06
I
I
I i
I
! I
!
I
i I I
1

Page 232 Schroder Internatinnal Selection Fund Scnii-Aririual Report June 2000
Portfolio of Investments as at 30 June 2008 (cont) Schroder ISF EURO Liquidity (cant)
Nurriber ot shares or Priricipal Amourit
Transferable Securilies and Money Market Instruments Admitted to an Official Fxt:hariye Listii.iy
Noway HJR
EUR
EUR
1.800.000 Driti NOH Bank EMTN rRN
10,000,000 Dritl NOH Bank EMTN TRN
2.000.000 DnB NOR Bank EM IN FI'IN
03:06:2009
07/04:2011
97:11:201 1
Portugal EUR 5.000.000 Baiico Espirito Santo rMTN H1N
3 1 :05.'%010
Spain r l l l l
F I E
ElJR
3.000.000 RBVA Seriiur hnancc EMTN FRN
10,000.000 Santander Interriatioiial Ucbt EhlTN
2,00C,000 :.;aritander International Debt I MI N
1 1 :01:2010
FRN 28,W:2010
I-HN 10!l 1/2010
Sweden TlJR
Swiherland Flll i
c1.350.000 Nordea Rxik EM I N H iN 27;05,':703D
10.000,0L'0 Credit :;uisse:London EMTN FRN 00:04:2010
United Kingdom FlJR
EUR
EUR
3.750.000 Bank of Scotlarid EM IN ERN
2.000.000 Nationwidc Buildinq :;oc:iely t M TN
8:50.000 Nationwide Ruildirig Society EMTN
?3:00:2009
FRN 0:Yl 1 ;2008
FRN 09:08:2009
United States of America TlJH ElJR FUR t l J l 1
TlJR
5.000.000 Citigroup r M l N H1N IL'A 1:2008 850,000 Citigroup EMTN FRN 30~07~20T)U
2,500.000 Goldrriari Sac;h:; H iN 2 1;10:2008 1,050,000 Merrill I yrich B Co. EMTN FRN
7 000,000 Morgan Stanley t M I N FRN 09:02:2009
15,,Ol :2010
Total Transferable Securities and Money Market Instruments Admitted to an Official Exchange Listing
Market ?i Value Net tUH Assets
13,804,780 0.78
1 ,156,730 0. i o
10,035.380 0.5i
I . Y i 2 , c l w 0.1 1
4,921,200 0.28
4.921.200 0.78
15,019,412 0.85
2 , Y / U , i X 0.1 T
1 O,I148,300 0.57
1.991.1G7 0 . 1 1
9,347,663 0.53 9.3.1i,u83 0.53
10,026,000 0.57
10.026.000 0.57
6,573,287 0.37
3, (39.301 0.21
1 .(JY2./40 0.1 1
941.746 0.05
16,164,827 0.92 4,980,125 0.x
840.G58 0 (15 2,490,393 0.14
1.04(;1.493 O.0G
U.813,7Td 0.39
21 1,028,774 12.00
Number of SIIBIR:; or Principal
Moncy Markst Iristrurwnl:; other thari those dealt
Arriounl in on a Regulated Market' ~~ ~
Market J:l
Valuc Net EUR Assets
Cayman Islands 64,915,430 3.69 HJ l i 65.000.000 BCP Firlarice Hank 0% 11:0/:2000 64,915,430 3.09
France 50,885,377 3.35 TUH 59,000,000 Societe Geriarale 0's. 17:0/?2008 58.8Y5,3ii 3.35
Germany 162,256,889 9.23 ELlR 25.000.000 Allianz 0% 2J:01!7009 94,407.435 1.39 EUR 40.000.000 Allinnz 0% 1 (;03:2009 3&748,201 2.20 tUH 60,000,000 F3ayerist:he Landcsbank 0%
1 u:07:2008 59.8.30.21 1 3.41 EUR 40,000,000 Landcsbank Hesseri-Ttiiierinyen 0?<
28:l 12008 39.71 1,012 2.23
Numbcr of shares Money Market lnstrurrierils Markel % Value Net or Principal FlJR Assets Arriourit
other than those dealt in on a lieyulatcd Market*
Ireland
tUI3 rVI3 50.000.000 CorrirrierLbanlc 0% 04:08:7008
Italy EIUH
Luxembourg EUR
ELlR ELlR
EUR 50,000.000 Atlglo Irish BJIik 4.968 15~W~2008 50,000.000 Bank of lrcland 4.Y3% 11:08:2008
iX).0OO,WO Uriicrwjil Cunicrc 4.71 '20 03:042009
00,000.000 Dz Rank Iriterr~iational 0% Of/04:2000
f0.000.000 HSt I Nortitiarilc 0?< 07:l 0P2008 50.000.000 Mot-qari :.hiley Intcrnational Finarice
0% 07:07!2008
Netherlands EUR F:lJIi EUR
Norway t U H
Spain r l JR
EUR I-lJrt EUR
Sweden ELlR 50,000,030 Swedharik 0% 12:09:2008
United Kingdom tUR CUH I 111 1
TIJH EUR
r1.m
ri.ji4 ~5.ooo.000 IJ~:; 0.- O Y , ' O ~ , Q W ~
12,000,000 ADN AIIIIO Bank 040 21:07:2008 55,000,000 IN(; Bank 0% 12:08:?008 d0,00O.000 Standard 1 ife 0% 07:07:2008
50.000.000 UNI3 Nor Bank 0% 29iOP2008
55,000,000 Raric:o Bilbao Vizcaya Argeritaria 096
50.000.000 Banco Popolare 0% 15:08?2008 30,000.000 Haricx Santander 0% ?7:1 40.000.000 Banco Saitarider 0% 18:O
1 8:09:200Y
!j0.000.000 Allinncc & Leicester 0% 05:09:2008 50,000,000 Bank 01 Scotland 4.81 b 24'1 1 :7008 40,0U0.000 narcl;-iy:; Bank 0% 15;09/7008
50.000.000 HSnC Hank 4.3% 03:03:2009 60,000,000 Nationwide Buildirig Society Ou'.
~O.OOO,OOO ROYA Barik ot Scotland 00;~
EUR 35,000.000 Barclays bdrik 0"s 00/01:2009
20: 1 1 :2008
2'3:05:2009
United States of America EClR /0.000.000 Ucxia Financial Products 0%
08:08:2000
Total Money Market Instruments other than those dealt in on a Regulated Market'
Total Investments
Other Net Liabilities
Net Asset Value
159,728,051 9.08 5 0 . W . W 2.04 50,000,000 2.84 59./28,051 3.40
60,000,000 3.41 60.000.000 3.41
167,111,308 9.50
5,'.905,l69 3.29 59.215.3/3 3.37
49.960.500 2 84
136,639,428 7.77 21 .Y4/,854 1.25 54,736,103 3.11 59,955.17 1 3.41
49,652,781 2.82 49,852,781 2.82
172,243,432 9.79
54.417.089 3.10 49,488,283 9.81 29,598,052 1 .u8 38,739,408 2.20
49,512,306 2.82 4'3,5l2,30ti 9.82
404,451,062 23.00 59,470.885 3.39 30.000.000 2.84 39.629.441 2 25 34,179,496 1.94 50,000.000 2.84
50.873.1 i 2 3.33
47,830,475 2.12 d4.467.597 3.67
69,651,433 3.95
t39.651.433 3.95
1,555,047,497 88.41
1,766,076,271 100.41
(7,271,649) (0.41)
1,758,804,622 100.00

Schroder Internaburlal Selection Fund Semi-Annual ReDort June 2008
Portfolio of Investments as at 30 June 2008 (cont) Schroder ISF US Dollar Liquidity
Numtw of shares Transterahle Securities and Markct :h or Principal Money Market lnstriirrierits dealt Valiue Net Arrioiirit on another Regulated Market USD Assets
United States of America USD
USD
USD
USD
tJS11
tJ:.Tl
USD
US0
OSD
USD
USD
IJSD
USD
IJSD
USD
L J X J
IJSO
um
lJSD
lJSD
1.006.733 American Home Mortgage lnvcstmerit Triist ?005-1 1Al H3N 25/08;?045
7259,704 American Home Mortgage Investment Trust 2006-2 I A FRN 25/02/2038
FRN 25:04:2034
?005-14 2A1 FIiN 25!05/?035
303.41 6 Bear Stcarn:; Alt-A Trust 2001-3 A I
575.686 Countfywide Allernative Loan Trust
5.285.065 Coiintrywide Altcrnative Lnan frust
1565.125 Chintrywide Alternative I oan Trust
84,533 Countrywide Alternative Loan Trusl
2,979,l 68 Countrywide Alterriative Loan Trust
2005-51 3A2A TRN 20/1 1,2035
2005 56 2A3 FRN 25'1 1 Q035
2005-J4 1Al FRN 25:07:7035
200t3 I IYl? A4 FRN 25/08/2036
Ccrtilicates ?006-SD2 2AIA FRN 25/11:7036
25;04;2035
25!08!2035
2005-HE1 A2 FRN 25/12/2032
358.803 CoiuntVNidc Assel Backed
3.094.053 lrnpac CMB lriist 7005-1 1Al FHN
2,133,793 lrnpac CMB Triist 7005-3 AI FRN
1 60,360 Lake Country Morlgage Loan Trust
11?.854 Mastr Adjustable Rate Mortgages
3.884.839 Residential Accredit L.oaris 2005-
2,641,973 Structurod Asset Mortgage
Trust 1004-9 2A1 FHN 251 1/?034
0 0 2 AI TRN 25/09!2C45
IriL,estments 2005 AR7 SA1 FRN
541.193 Structured Assct Securities ?005- GEL2 A FRN ?5!04/2035
21 2.1 64 Wachovia Loan Trust 7005-SD1 A FRN 25/05/2035
952,207 Wablu Mortgage Pass 1-tirough (hrtificates 2005-AI71 3 A1A2 FRN 25:10/2045
4,838,587 WaMu Mortgage PASS Through Certilicates 2006-AR7 1A tHN 15:07:7046
8,784,628 WaMu Mortgage Pass Through Ccrtilicates 7006-AR7 2A FI iN 75/0 //20.16
Total Transferable Securities and Money Market Instruments dealt on another Regulated Market
31,728,891 19.80
761.646 0.41
487.873 031
254,222 (?. 15
399.1?9 0.25
4.159.784 2.60
1.262.922 0 7s
62,711 0.04
2,506,647 1 fj?
351,918 022
2.365.382 14R
1.593.233 0 99
159,881 0 10
105.674 001
3 185.568 1 P 9
2.104.043 1.31
482.006 0.30
199.896 0.12
759.980 0.47
3.575.?46 2.23
6,850,640 1.28
31,728,891 19.80
Ni.irriber of shares or Principal Amount
Money Varket Instruments other than those dealt in on a Reuulated Market*
Pagr: 23.7
112,836,702 70.30 United States of America USD 7.800,000 Citigroup Funding 08/09/2008 7.761.878 4.83 USD
07/07/2008 24.991 ,?50 15.60 USD 15,000.000 royota Motor Credit 0 5 09/09/2008 14,926,500 9.37 USD 30,000,000 US Treasury 09b 10/07/20O8 29,986,814 18.72
25,000.000 Freddie Mac Discount Notes 0°K
tJSD 35.000.000 US Treasiity 04; ?4:07/2008 04.970.260 21.83
Total Money Market Instruments other than those dealt in on a Regulated Market* 112,636,702 70.30
Number of shares Market YO or Principal Mher Transferable Securities Value Net Arrioiirit not dcalt on another Regulated Markct tJSD Assets
United States of America 519,411 0.33 USU 250,000 Ameriqucst Mortgage :;ec:iirities
2003-AR1 M3 FRN 25/01/2033 18/.500 0.12 LIST)
10,509 0.01 FRN 18'1 1 !2011 1 6 D
25/01i7035 27.073 0.02 lJSD
USD
10.556 FEP Receivables Rust 01-1 A2L 14
44,158 lrnpac CMB Triist 7004-9 MI FRN
404.465 lrnpac ChlB Trust 2004-10 1A2 FRN
707.567 lrnpac Securcd Assets CMN Owner 25/03/2035 !83,308 0.11
Trust 2005 2 A I M FRN 25:03:2036 111.021 0.07
Total Other Transferable Securities not dealt on another Regulated Market 519,411 0.33
Total Investments 144,885,004 90.43
Other Net Assets 15,334,457 9.57
Net Asset Value 160,219,461 100.00
1 !
i
I I
I i
1 I
I I
I
I i
i

Related Documents