Schroder Global Equity Fund Annual Report and Accounts 15 December 2021

Welcome message from author
This document is posted to help you gain knowledge. Please leave a comment to let me know what you think about it! Share it to your friends and learn new things together.
Transcript

Schroder Global Equity FundAnnual Report and Accounts
15 December 2021
Contents
2Schroder Global Equity Fund Annual Report and Accounts15 December 2021
Fund Information{
1} 3
Review of Investment Activities{
1} 4
Risk Profile{
1} 5
Statement of the Manager’s Responsibilities 6Report of the Trustee 7Independent auditors’ report to the Unitholders of Schroder Global Equity Fund 8Comparative Table 10Portfolio Statement{
1} 16
Financial Statements 19Notes to the Accounts 20Distribution Table 28Remuneration 30General Information{
1} 31
1 Collectively these comprise the Manager's report.

3Schroder Global Equity Fund Annual Report and Accounts15 December 2021
Fund Information
Investment objective and policy The Schroder Global Equity Fund (the ‘Fund’) aims to provide capital growth in excess of the MSCI World (Net Total Return) (GBP) index (after fees have been deducted) over a three to five year period by investing in equity and equity related securities of companies worldwide. The Fund is actively managed and invests at least 80% of its assets in equity or equity related securities of companies worldwide. The Investment Manager seeks to identify companies that it believes will deliver future earnings growth above the level expected by the market typically on a 3-5 year horizon (this is referred to as ‘a positive growth gap’). The Fund may also invest directly or indirectly in other securities (including in other asset classes), countries, regions, industries or currencies, collective investment schemes (including Schroder funds), warrants and money market instruments, and hold cash. The Fund may use derivatives with the aim of reducing risk or managing the Fund more efficiently (for more information please refer to section 6 of Appendix I of the Prospectus).
Fund characteristics The Fund’s performance should be assessed against its target benchmark, being to exceed the MSCI World (Net Total Return) (GBP) index. The Investment Manager invests on a discretionary basis and is not limited to investing in accordance with the composition of the benchmark. The target benchmark has been selected because it is representative of the type of investments in which the Fund is likely to invest, and it is, therefore, an appropriate target in relation to the return that the Fund aims to provide.
Significant eventsEffective from 1 March 2021 a transparent “all in one” fund management fee was introduced. This is a single percentage based fee to cover certain elements of the separate charges and fees, which were previously charged and are now replaced with a single charge named “Schroders Annual Charge”. Previously all expenses were directly charged to each Fund as incurred. This structure consisted of the Annual Management Charge, plus other fees and expenses, including the Trustee fee, Custody fee, Transfer Agent fee, Audit fee and certain costs and administrative expenses paid by the Manager in relation to the management and operation of the funds, as disclosed in the Prospectus.

Review of Investment Activities
4 Schroder Global Equity Fund Annual Report and Accounts15 December 2021
From 15 December 2020 to 15 December 2021, the price of I Accumulation units on a dealing price basis rose 23.78%. In the same period, the MSCI World Index generated a net total return of 23.48%1 in sterling terms.Global equities achieved a positive performance in the 12-month period. This was initially sparked by the vast fiscal and monetary support measures by governments and central banks in response to the Covid-19 pandemic. The news towards the end of 2020 that several vaccines had proven highly effective against Covid-19 led global equity markets to rally. This strong performance continued through 2021, supported by the successful roll-out of Covid-19 vaccines and news of further US fiscal stimulus. However, emerging market shares underperformed in the third quarter amid a sell-off in China. The emergence of a new Covid-19 variant – Omicron – in November also led many equity markets lower.The portfolio marginally outperformed the benchmark during the period under review. Stock selection was the contributing factor as sector allocation marginally detracted from relative returns. The positions in the healthcare, consumer staples and materials sectors made the biggest contributions to gains. Conversely, our allocations to consumer discretionary, industrials and financials weighed on returns. By region, North America, Continental Europe and Japan made the biggest contributions to gains. Emerging markets detracted during the period. ASML Holding was a strong performer in the period as the company increased capacity in response to the global shortage of computer chips. Demand for ASML’s lithography systems for use in semi-conductor production remains strong as their EUV lithography systems are the key enabler for advancing high performance computing allowing semi manufacturers to further shrink chip sizes. The Netherlands-based company said it expects sales growth of 35% for full-year 2021 on the back of the soaring demand. Danish wind turbine supplier Vestas Wind Systems was a weaker performer. The company announced disappointing third-quarter results and cut its guidance for the full year margin to around 4% from 5%-7%. Supply chain constraints and higher raw material costs will continue to add pressure in 2022. Although the company faces a number of short-term challenges, we remain confident of its long-term growth potential given its leading position within the expanding wind energy market and the likelihood of increased policy support for renewables. We bought new positions in Johnson Controls International and Toronto-Dominion Bank during the period. We also sold our positions in a number of stocks. These included Alibaba Group Holding and Dollar General Corp.Since the end of the reporting period, Russian armed forces have invaded Ukraine. Western counties have responded by imposing wide-reaching financial and trade sanctions on Russia. At the time of writing, fighting is intensifying and a major humanitarian crisis is unfolding. We have no direct exposure to Russia in our portfolios but the impact of the conflict on global economies and markets has already been substantial. Spiking energy and commodity prices present a threat to global growth, with many emerging countries likely to be hardest hit. Further escalation in the conflict could be catastrophic and there is a real risk of unintended consequences. The outlook for investors clearly remains highly uncertain: we continue to focus on areas of the market that offer a degree of stability and transparency.
Fund Manager:Alex Tedder
Joined Schroders in 2014 Investment career commenced in 1990 Currently Head of Global Equities, Portfolio Manager. Based in London Alex joined Schroders from American Century Investments in New York, where he was Senior Vice President and Senior Portfolio Manager (Global and Non-US Large Cap Strategies) Prior to this, he was with Deutsche Asset Management Ltd, where he worked in various capacities including Managing Director and Head of International Equities/Portfolio Manager Alex initially joined Schroders in 1990, working in the UK and Germany where he was responsible for promoting European Equity mandates alongside Schroders’ Private Equity operation MA in Economics and Business Administration, University of Freiburg/Fribourg, Switzerland
1 Source: Refinitiv Eikon Datastream.Past performance is not a guide to future performance and may not be repeated. The value of investments and the income from them may go down as well as up and investors may not get back the amounts originally invested. Exchange rate changes may cause the value of any overseas investments to rise or fall.

5Schroder Global Equity Fund Annual Report and Accounts15 December 2021
Risk Profile
Risk and reward indicatorLower risk Higher riskPotentially lower reward Potentially higher reward
< >1 2 3 4 5 6 7
The risk category was calculated using historical performance data and may not be a reliable indicator of the Fund’s future risk profile. The Fund’s risk category is not guaranteed to remain fixed and may change over time. A Fund in the lowest category does not mean a risk-free investment. The risk and reward indicator changed from 6 to 5 with effect from 4 October 2021 for S Income and S Accumulation units.For specific risks, including the risk and reward profile, please refer to the Key Investor Information Document available on the following website www.schroders.com.
6 Schroder Global Equity Fund Annual Report and Accounts15 December 2021
Statement of the Manager’s Responsibilities
The Financial Conduct Authority’s Collective Investment Schemes sourcebook requires the Manager to prepare accounts for each annual and half yearly accounting period, in accordance with United Kingdom Generally Accepted Accounting Practice, which give a true and fair view of the financial position of the Fund and of its net revenue and the net capital gains on the property of the Fund for the year. In preparing the accounts the Manager is required to: ¯ select suitable accounting policies and then apply them consistently; ¯ comply with the disclosure requirements of the Statement of Recommended Practice for UK Authorised Funds issued by the Investment Management
Association (now the Investment Association) in May 2014; ¯ follow generally accepted accounting principles and applicable accounting standards; ¯ prepare the accounts on the basis that the Fund will continue in operation unless it is inappropriate to do so; ¯ keep proper accounting records which enable it to demonstrate that the accounts as prepared comply with the above requirements; ¯ make judgements and estimates that are prudent and reasonable.
The Manager is responsible for the management of the Fund in accordance with its Trust Deed, the Prospectus and the Collective Investment Schemes sourcebook, and for taking reasonable steps for the prevention and detection of fraud, error and non-compliance with law or regulations.The Manager's report and accounts for the year ended 15 December 2021 were signed on 8 March 2022 on behalf of the Manager by:
P. Truscott J. RainbowDirectors
7Schroder Global Equity Fund Annual Report and Accounts15 December 2021
Report of the Trustee
Statement of the Trustee’s responsibilities in respect of the Scheme and report of the Trustee to the unitholders of the Schroder Global Equity Fund (‘the Fund’) for the year ended 15 December 2021.The Trustee of the Schroder Global Equity Fund must ensure that the Fund is managed in accordance with the Financial Conduct Authority’s Collective Investment Schemes Sourcebook, the Financial Services and Markets Act 2000, as amended, (together ‘the regulations’), the Trust Deed and Prospectus (together ‘the Scheme documents’) as detailed below. The Trustee must in the context of its role act honestly, fairly, professionally, independently and in the interests of the Fund and its investors. The Trustee is responsible for the safekeeping of all custodial assets and maintaining a record of all other assets of the Fund in accordance with the regulations. The Trustee must ensure that: - the Fund’s cash flows are properly monitored and that cash of the Fund is booked in cash accounts in accordance with the regulations; - the sale, issue, repurchase, redemption and cancellation of units are carried out in accordance with the regulations; - the value of units of the Fund are calculated in accordance with the regulations; - any consideration relating to transactions in the Fund’s assets is remitted to the Fund within the usual time limits; - the Fund’s income is applied in accordance with the regulations; and - the instructions of the Authorised Fund Manager (‘the Manager’), which is the UCITS Management Company, are carried out (unless they conflict with the regulations). The Trustee also has a duty to take reasonable care to ensure that the Fund is managed in accordance with the regulations and the Scheme documents of the Fund in relation to the investment and borrowing powers applicable to the Fund. Having carried out such procedures as we considered necessary to discharge our responsibilities as Trustee of the Fund, it is our opinion, based on the information available to us and the explanations provided, that, in all material respects the Fund, acting through the Manager: (i) has carried out the issue, sale, redemption and cancellation, and calculation of the price of the Fund’s units and the application of the Fund’s income in accordance with the regulations and the Scheme documents of the Fund; and (ii) has observed the investment and borrowing powers and restrictions applicable to the Fund in accordance with the regulations and the Scheme documents of the Fund.
J.P. Morgan Europe Limited Trustee Bournemouth 5 January 2022

Independent auditors’ report to the Unitholdersof Schroder Global Equity Fund
8 Schroder Global Equity Fund Annual Report and Accounts15 December 2021
Report on the audit of the financial statementsOpinionIn our opinion, the financial statements of Schroder Global Equity Fund (the “Fund”): ¯ give a true and fair view of the financial position of the Fund as at 15 December 2021 and of the net revenue and the net capital gains on its scheme
property for the year then ended; and ¯ have been properly prepared in accordance with United Kingdom Generally Accepted Accounting Practice (United Kingdom Accounting Standards,
comprising FRS 102 “The Financial Reporting Standard applicable in the UK and Republic of Ireland”, and applicable law), the Statement of Recommended Practice for UK Authorised Funds, the Collective Investment Schemes sourcebook and the Trust Deed.
We have audited the financial statements, included within the Annual Report and Accounts (the “Annual Report”), which comprise: the Balance Sheet as at 15 December 2021; the Statement of Total Return and the Statement of Change in Net Assets Attributable to Unitholders for the year then ended; the Distribution Table; and the Notes to the Accounts, which include a description of the significant accounting policies.
Basis for opinionWe conducted our audit in accordance with International Standards on Auditing (UK) (“ISAs (UK)”) and applicable law. Our responsibilities under ISAs (UK) are further described in the Auditors’ responsibilities for the audit of the financial statements section of our report. We believe that the audit evidence we have obtained is sufficient and appropriate to provide a basis for our opinion.
IndependenceWe remained independent of the Fund in accordance with the ethical requirements that are relevant to our audit of the financial statements in the UK, which includes the FRC’s Ethical Standard, and we have fulfilled our other ethical responsibilities in accordance with these requirements.
Conclusions relating to going concernBased on the work we have performed, we have not identified any material uncertainties relating to events or conditions that, individually or collectively, may cast significant doubt on the Fund’s ability to continue as a going concern for a period of at least twelve months from the date on which the financial statements are authorised for issue.In auditing the financial statements, we have concluded that the Manager’s use of the going concern basis of accounting in the preparation of the financial statements is appropriate.However, because not all future events or conditions can be predicted, this conclusion is not a guarantee as to the Fund’s ability to continue as a going concern.Our responsibilities and the responsibilities of the Manager with respect to going concern are described in the relevant sections of this report.
Reporting on other information The other information comprises all of the information in the Annual Report other than the financial statements and our auditors’ report thereon. The Manager is responsible for the other information. Our opinion on the financial statements does not cover the other information and, accordingly, we do not express an audit opinion or, except to the extent otherwise explicitly stated in this report, any form of assurance thereon. In connection with our audit of the financial statements, our responsibility is to read the other information and, in doing so, consider whether the other information is materially inconsistent with the financial statements or our knowledge obtained in the audit, or otherwise appears to be materially misstated. If we identify an apparent material inconsistency or material misstatement, we are required to perform procedures to conclude whether there is a material misstatement of the financial statements or a material misstatement of the other information. If, based on the work we have performed, we conclude that there is a material misstatement of this other information, we are required to report that fact. We have nothing to report based on these responsibilities.Based on our work undertaken in the course of the audit, the Collective Investment Schemes sourcebook requires us also to report certain opinions as described below.
Manager’s ReportIn our opinion, the information given in the Manager’s Report for the financial year for which the financial statements are prepared is consistent with the financial statements.
Responsibilities for the financial statements and the auditResponsibilities of the Manager for the financial statementsAs explained more fully in the Statement of the Manager’s Responsibilities, the Manager is responsible for the preparation of the financial statements in accordance with the applicable framework and for being satisfied that they give a true and fair view. The Manager is also responsible for such internal control as they determine is necessary to enable the preparation of financial statements that are free from material misstatement, whether due to fraud or error.In preparing the financial statements, the Manager is responsible for assessing the Fund’s ability to continue as a going concern, disclosing as applicable, matters related to going concern and using the going concern basis of accounting unless the Manager either intends to wind up or terminate the Fund, or has no realistic alternative but to do so.
Auditors’ responsibilities for the audit of the financial statementsOur objectives are to obtain reasonable assurance about whether the financial statements as a whole are free from material misstatement, whether due to fraud or error, and to issue an auditors’ report that includes our opinion. Reasonable assurance is a high level of assurance, but is not a guarantee that an audit conducted in accordance with ISAs (UK) will always detect a material misstatement when it exists. Misstatements can arise from fraud or error and are considered material if, individually or in the aggregate, they could reasonably be expected to influence the economic decisions of users taken on the basis of these financial statements. Irregularities, including fraud, are instances of non-compliance with laws and regulations. We design procedures in line with our responsibilities, outlined above, to detect material misstatements in respect of irregularities, including fraud. The extent to which our procedures are capable of detecting irregularities, including fraud, is detailed below.

9Schroder Global Equity Fund Annual Report and Accounts15 December 2021
Independent auditors’ report to the Unitholdersof Schroder Global Equity Fund (continued)
Based on our understanding of the Fund and its industry, we identified that the principal risks of non-compliance with laws and regulations related to breaches of the Collective Investment Schemes sourcebook, and we considered the extent to which non-compliance might have a material effect on the financial statements, in particular those parts of the sourcebook which may directly impact on the determination of amounts and disclosures in the financial statements. We evaluated management’s incentives and opportunities for fraudulent manipulation of the financial statements (including the risk of override of controls), and determined that the principal risks were related to posting inappropriate journal entries to increase revenue or to increase the net asset value of the Fund. Audit procedures performed included: ¯ Discussions with the Manager, including consideration of known or suspected instances of non-compliance with laws and regulation and fraud; ¯ Reviewing relevant meeting minutes, including those of the Manager’s board of directors; ¯ Identifying and testing journal entries, specifically any journals posted as part of the financial year end close process; and ¯ Designing audit procedures to incorporate unpredictability around the nature, timing or extent of our testing.
There are inherent limitations in the audit procedures described above. We are less likely to become aware of instances of non-compliance with laws and regulations that are not closely related to events and transactions reflected in the financial statements. Also, the risk of not detecting a material misstatement due to fraud is higher than the risk of not detecting one resulting from error, as fraud may involve deliberate concealment by, for example, forgery or intentional misrepresentations, or through collusion.A further description of our responsibilities for the audit of the financial statements is located on the Financial Reporting Council’s website at: www.frc.org.uk/auditorsresponsibilities. This description forms part of our auditors’ report.
Use of this reportThis report, including the opinions, has been prepared for and only for the Fund’s unitholders as a body in accordance with paragraph 4.5.12 of the Collective Investment Schemes sourcebook and for no other purpose. We do not, in giving these opinions, accept or assume responsibility for any other purpose or to any other person to whom this report is shown or into whose hands it may come save where expressly agreed by our prior consent in writing.
Other required reportingOpinion on matter required by the Collective Investment Schemes sourcebookIn our opinion, we have obtained all the information and explanations we consider necessary for the purposes of the audit.
Collective Investment Schemes sourcebook exception reportingUnder the Collective Investment Schemes sourcebook we are also required to report to you if, in our opinion: ¯ proper accounting records have not been kept; or ¯ the financial statements are not in agreement with the accounting records and returns.
We have no exceptions to report arising from this responsibility.
PricewaterhouseCoopers LLP Chartered Accountants and Statutory Auditors Edinburgh 8 March 2022
Comparative Table
10 Schroder Global Equity Fund Annual Report and Accounts15 December 2021
**,*** I Accumulation units I Income units
Financial year to 15 December2021
pence per unit
2020 pence per
unit
2019 pence per
unit
2021 pence per
unit
2020 pence per
unit
2019 pence per
unitChange in net asset value
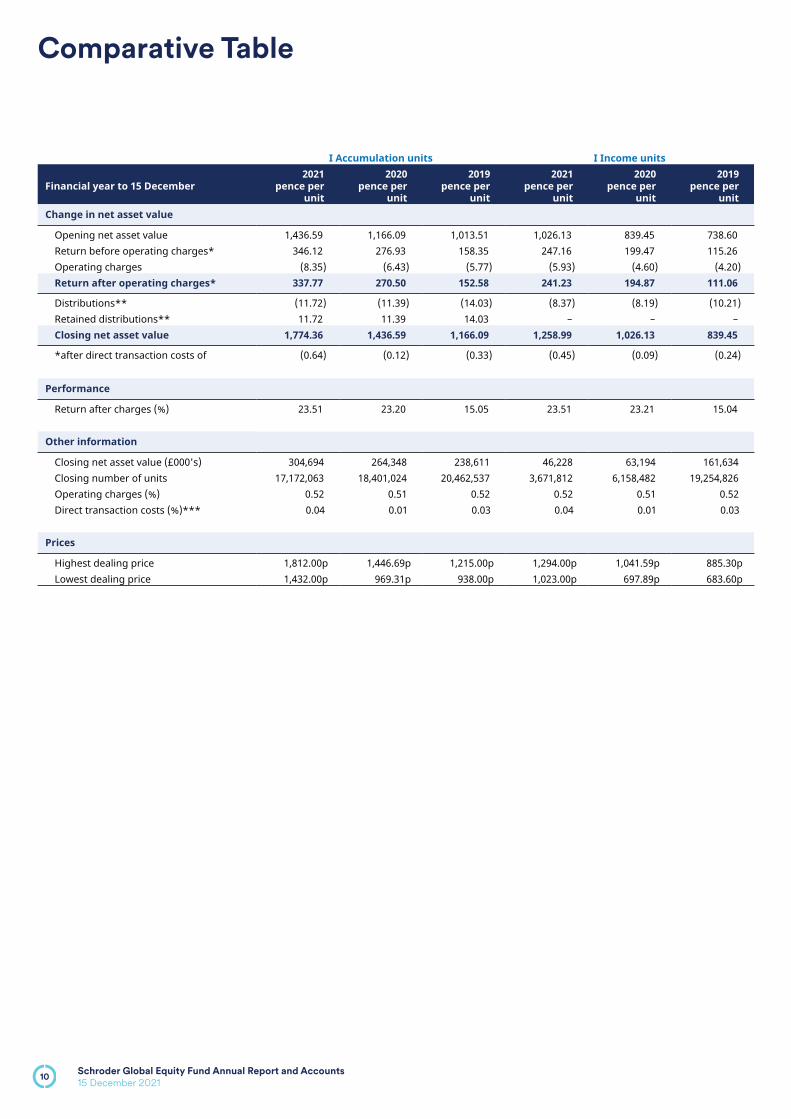
Opening net asset value 1,436.59 1,166.09 1,013.51 1,026.13 839.45 738.60Return before operating charges* 346.12 276.93 158.35 247.16 199.47 115.26Operating charges (8.35) (6.43) (5.77) (5.93) (4.60) (4.20)Return after operating charges* 337.77 270.50 152.58 241.23 194.87 111.06
Distributions** (11.72) (11.39) (14.03) (8.37) (8.19) (10.21)Retained distributions** 11.72 11.39 14.03 – – –Closing net asset value 1,774.36 1,436.59 1,166.09 1,258.99 1,026.13 839.45
*after direct transaction costs of (0.64) (0.12) (0.33) (0.45) (0.09) (0.24)
Performance
Return after charges (%) 23.51 23.20 15.05 23.51 23.21 15.04 – – – – – –Other information
Closing net asset value (£000's) 304,694 264,348 238,611 46,228 63,194 161,634Closing number of units 17,172,063 18,401,024 20,462,537 3,671,812 6,158,482 19,254,826Operating charges (%) 0.52 0.51 0.52 0.52 0.51 0.52Direct transaction costs (%)*** 0.04 0.01 0.03 0.04 0.01 0.03
– – – – – –Prices
Highest dealing price 1,812.00p 1,446.69p 1,215.00p 1,294.00p 1,041.59p 885.30pLowest dealing price 1,432.00p 969.31p 938.00p 1,023.00p 697.89p 683.60p
11Schroder Global Equity Fund Annual Report and Accounts15 December 2021
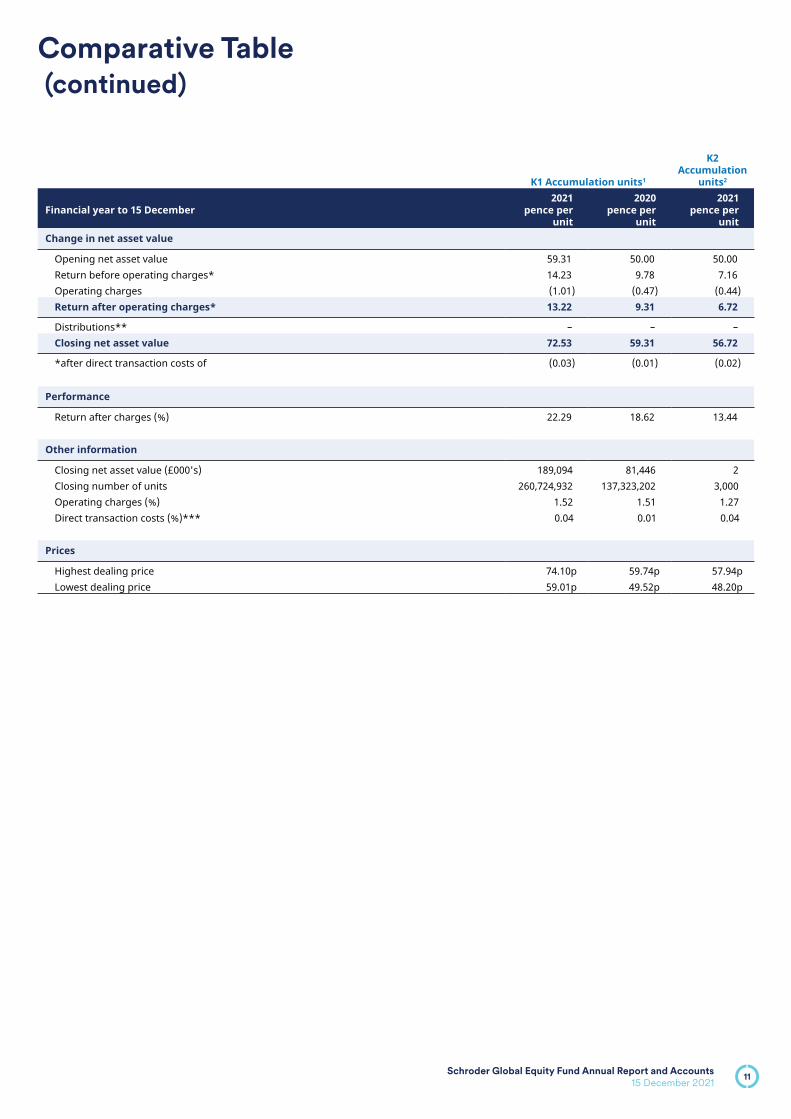
Comparative Table (continued)
**,*** K1 Accumulation units1
K2 Accumulation
units2
Financial year to 15 December2021
pence per unit
2020 pence per
unit
2021 pence per
unitChange in net asset value
Opening net asset value 59.31 50.00 50.00Return before operating charges* 14.23 9.78 7.16Operating charges (1.01) (0.47) (0.44)Return after operating charges* 13.22 9.31 6.72
Distributions** – – –Closing net asset value 72.53 59.31 56.72
*after direct transaction costs of (0.03) (0.01) (0.02)
Performance
Return after charges (%) 22.29 18.62 13.44 – – –Other information
Closing net asset value (£000's) 189,094 81,446 2Closing number of units 260,724,932 137,323,202 3,000Operating charges (%) 1.52 1.51 1.27Direct transaction costs (%)*** 0.04 0.01 0.04
– – –Prices
Highest dealing price 74.10p 59.74p 57.94pLowest dealing price 59.01p 49.52p 48.20p
12 Schroder Global Equity Fund Annual Report and Accounts15 December 2021
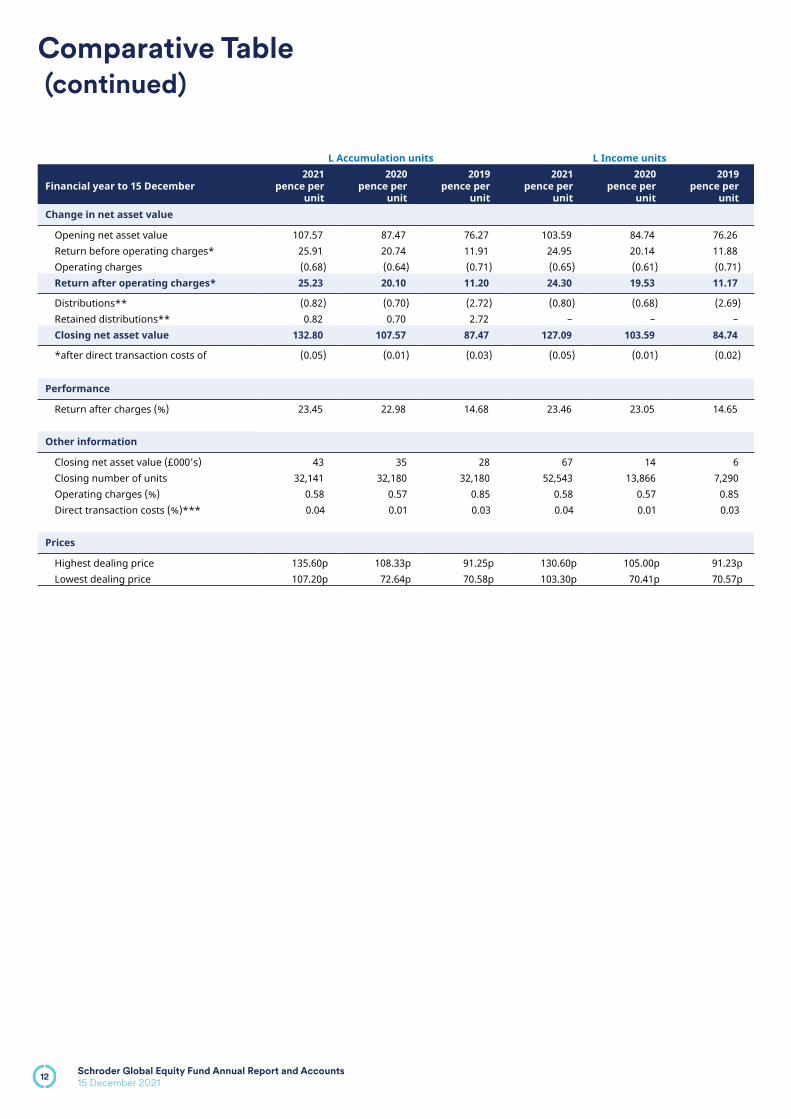
Comparative Table (continued)
**,*** L Accumulation units L Income units
Financial year to 15 December2021
pence per unit
2020 pence per
unit
2019 pence per
unit
2021 pence per
unit
2020 pence per
unit
2019 pence per
unitChange in net asset value
Opening net asset value 107.57 87.47 76.27 103.59 84.74 76.26Return before operating charges* 25.91 20.74 11.91 24.95 20.14 11.88Operating charges (0.68) (0.64) (0.71) (0.65) (0.61) (0.71)Return after operating charges* 25.23 20.10 11.20 24.30 19.53 11.17
Distributions** (0.82) (0.70) (2.72) (0.80) (0.68) (2.69)Retained distributions** 0.82 0.70 2.72 – – –Closing net asset value 132.80 107.57 87.47 127.09 103.59 84.74
*after direct transaction costs of (0.05) (0.01) (0.03) (0.05) (0.01) (0.02)
Performance
Return after charges (%) 23.45 22.98 14.68 23.46 23.05 14.65 – – – – – –Other information
Closing net asset value (£000's) 43 35 28 67 14 6Closing number of units 32,141 32,180 32,180 52,543 13,866 7,290Operating charges (%) 0.58 0.57 0.85 0.58 0.57 0.85Direct transaction costs (%)*** 0.04 0.01 0.03 0.04 0.01 0.03
– – – – – –Prices
Highest dealing price 135.60p 108.33p 91.25p 130.60p 105.00p 91.23pLowest dealing price 107.20p 72.64p 70.58p 103.30p 70.41p 70.57p
13Schroder Global Equity Fund Annual Report and Accounts15 December 2021
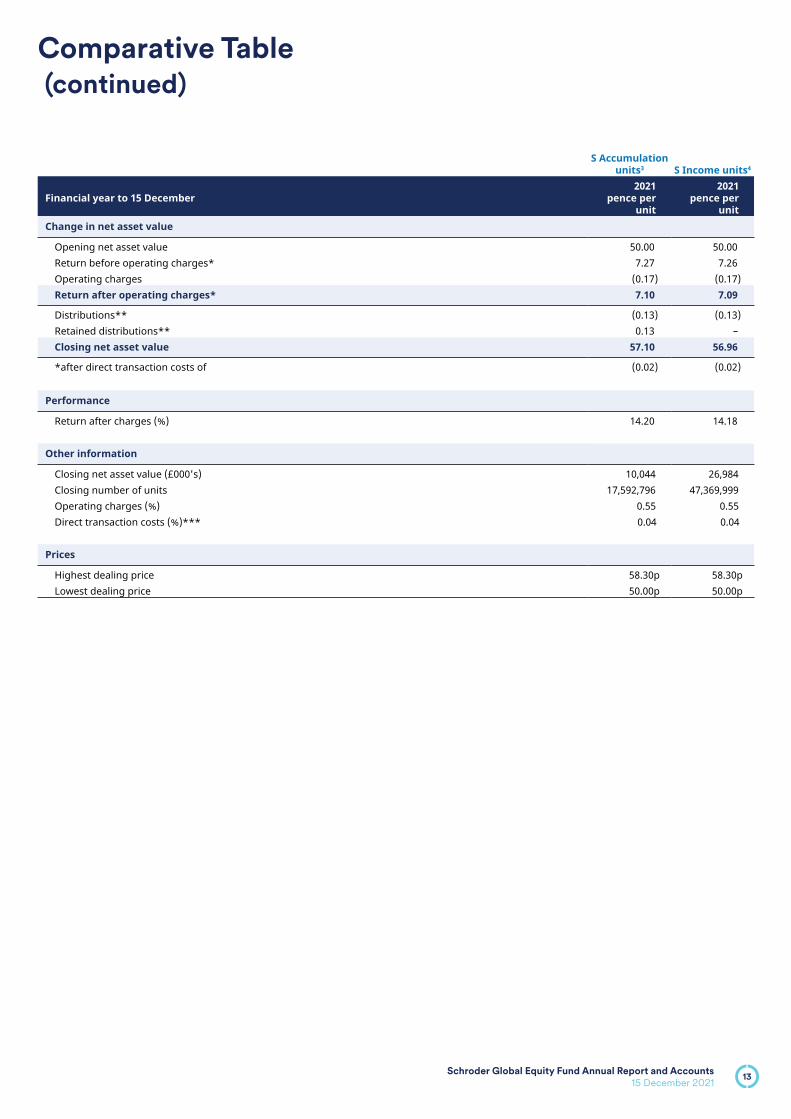
Comparative Table (continued)
**,***S Accumulation
units3 S Income units4
Financial year to 15 December2021
pence per unit
2021 pence per
unitChange in net asset value
Opening net asset value 50.00 50.00Return before operating charges* 7.27 7.26Operating charges (0.17) (0.17)Return after operating charges* 7.10 7.09
Distributions** (0.13) (0.13)Retained distributions** 0.13 –Closing net asset value 57.10 56.96
*after direct transaction costs of (0.02) (0.02)
Performance
Return after charges (%) 14.20 14.18 – –Other information
Closing net asset value (£000's) 10,044 26,984Closing number of units 17,592,796 47,369,999Operating charges (%) 0.55 0.55Direct transaction costs (%)*** 0.04 0.04
– –Prices
Highest dealing price 58.30p 58.30pLowest dealing price 50.00p 50.00p

14 Schroder Global Equity Fund Annual Report and Accounts15 December 2021
Comparative Table (continued)
**,*** X Accumulation units5 Z Accumulation units
Financial year to 15 December2021
pence per unit
2020 pence per
unit
2021 pence per
unit
2020 pence per
unit
2019 pence per
unitChange in net asset value
Opening net asset value 54.16 50.00 107.13 87.16 76.05Return before operating charges* 13.09 4.17 25.81 20.67 11.88Operating charges (0.01) (0.01) (0.73) (0.70) (0.77)Return after operating charges* 13.08 4.16 25.08 19.97 11.11
Distributions** (0.75) (0.16) (0.77) (0.64) (0.73)Retained distributions** 0.75 0.16 0.77 0.64 0.73Closing net asset value 67.24 54.16 132.21 107.13 87.16
*after direct transaction costs of (0.02) (0.01) (0.05) (0.01) (0.03)
Performance
Return after charges (%) 24.15 8.32 23.41 22.91 14.61 – – – – –Other information
Closing net asset value (£000's) 490,677 526,818 129,697 30,989 31,500Closing number of units 729,793,831 972,624,812 98,101,252 28,926,869 36,139,894Operating charges (%) 0.02 0.01 0.62 0.61 0.92Direct transaction costs (%)*** 0.04 0.01 0.04 0.01 0.03
– – – – –Prices
Highest dealing price 68.63p 54.54p 135.00p 107.88p 90.95pLowest dealing price 54.03p 49.18p 106.80p 72.37p 70.38p

15Schroder Global Equity Fund Annual Report and Accounts15 December 2021
Comparative Table (continued)
**,*** Z Income units
Financial year to 15 December2021
pence per unit
2020 pence per
unit
2019 pence per
unitChange in net asset value
Opening net asset value 103.11 84.38 74.27Return before operating charges* 24.83 20.01 11.57Operating charges (0.69) (0.66) (0.75)Return after operating charges* 24.14 19.35 10.82
Distributions** (0.75) (0.62) (0.71)Closing net asset value 126.50 103.11 84.38
*after direct transaction costs of (0.05) (0.01) (0.03)
Performance
Return after charges (%) 23.41 22.93 14.57 – – –Other information
Closing net asset value (£000's) 10,994 3,162 1,259Closing number of units 8,690,972 3,067,264 1,491,419Operating charges (%) 0.62 0.61 0.92Direct transaction costs (%)*** 0.04 0.01 0.03
– – –Prices
Highest dealing price 129.90p 104.45p 88.79pLowest dealing price 102.80p 70.07p 68.72p
** ***
These figures have been rounded to 2 decimal places.Direct transaction costs have been stated after deducting the proportion of the amounts collected from dilution adjustments.
1 K1 Accumulation units launched on 26 May 2020.2 K2 Accumulation units launched on 22 April 2021.3 S Accumulation units launched on 28 May 2021.4 S Income units launched on 28 May 2021.5 X Accumulation units launched on 1 September 2020.The Operating charges are represented by the Ongoing Charges Figure (OCF) which is the European standard method of disclosing the charges of a unit class of a Fund based on the financial year’s expenses and may vary from year to year. It includes charges such as the Fund’s Annual management charge, Registrar fees, Safe custody fees, Trustee’s fees and Audit fee but ordinarily excludes the costs of buying or selling assets for the Fund (unless these assets are units of another Fund). Where published, the Key Investor Information Document (KIID) contains the current OCF. For a more detailed breakdown please visit www.schroders.com.Past performance is not a guide to future performance and may not be repeated. The value of investments and the income from them may go down as well as up and investors may not get back the amounts originally invested. Exchange rate changes may cause the value of any overseas investments to rise or fall.

16
Portfolio Statement
Schroder Global Equity Fund Annual Report and Accounts15 December 2021
Holding at 15.12.21
Market Value £000's
% of net assets
Equities 98.70% (99.28%)Australia 1.35% (1.95%)BHP Group 168,558 3,691 0.31CSL 17,890 2,852 0.24Macquarie Group 88,688 9,710 0.80 16,253 1.35Austria 0.84% (0.77%)Erste Group Bank 310,020 10,186 0.84 10,186 0.84Belgium 0.00% (0.28%)Brazil 0.31% (0.00%)B3 SA - Brasil Bolsa Balcao 2,353,397 3,710 0.31 3,710 0.31Canada 0.65% (0.00%)Toronto-Dominion Bank 140,751 7,838 0.65 7,838 0.65Cayman Islands 1.37% (3.35%)China Mengniu Dairy 1,193,000 5,220 0.43JD.com A 144,150 3,978 0.33Sea ADR 11,362 1,856 0.16Tencent Holdings 126,500 5,472 0.45 16,526 1.37China 0.00% (0.20%)Denmark 0.61% (1.35%)Vestas Wind Systems 329,761 7,321 0.61 7,321 0.61France 2.56% (3.34%)Legrand 143,634 12,227 1.01LVMH Moet Hennessy Louis Vuitton 6,091 3,691 0.30Schneider Electric 107,227 15,063 1.25 30,981 2.56Germany 4.89% (4.27%)adidas 15,332 3,289 0.27Bayerische Motoren Werke 185,103 13,931 1.15Daimler 58,309 3,531 0.29Daimler Truck Holding 129,264 3,633 0.30Deutsche Post 116,112 5,299 0.44Infineon Technologies 67,604 2,266 0.19Merck 26,934 5,178 0.43SAP 57,215 5,915 0.49Siemens 104,945 13,277 1.10Zalando 47,755 2,807 0.23 59,126 4.89Hong Kong 0.48% (0.60%)AIA Group 765,200 5,859 0.48 5,859 0.48India 0.74% (0.84%)HDFC Bank ADR 185,780 8,914 0.74 8,914 0.74
Holding at
15.12.21Market Value
£000’s% of net
assets
Indonesia 0.82% (0.83%)Bank Central Asia 25,750,200 9,901 0.82 9,901 0.82Ireland 3.11% (3.02%)Accenture A 39,445 10,986 0.91Johnson Controls International 145,339 8,518 0.70Kingspan Group 55,109 4,705 0.39Linde 44,192 11,244 0.93Medtronic 27,115 2,158 0.18 37,611 3.11Italy 0.61% (0.95%)Intesa Sanpaolo 3,930,812 7,396 0.61 7,396 0.61Japan 3.29% (3.61%)Bridgestone 178,800 5,877 0.49Daifuku 34,600 2,241 0.19Keyence 18,600 8,943 0.74Murata Manufacturing 43,600 2,660 0.22Nabtesco 74,300 1,596 0.13Recruit Holdings 172,800 7,879 0.65SMC 15,800 8,041 0.67Terumo 79,900 2,475 0.20 39,712 3.29Jersey 0.34% (0.41%)Ferguson 32,765 4,166 0.34 4,166 0.34Luxembourg 0.29% (0.57%)Spotify Technology 21,340 3,520 0.29 3,520 0.29Netherlands 2.10% (2.32%)Airbus 56,986 4,851 0.40ASML Holding 30,254 17,479 1.45Stellantis 218,992 3,041 0.25 25,371 2.10Norway 1.60% (1.20%)DNB Bank 203,728 3,248 0.27Equinor 838,729 16,060 1.33 19,308 1.60South Korea 1.85% (2.36%)Samsung Electronics 243,849 12,022 1.00Samsung SDI 24,096 10,318 0.85 22,340 1.85Spain 0.76% (0.33%)Iberdrola 420,624 3,503 0.29Industria de Diseno Textil 245,491 5,733 0.47 9,236 0.76Sweden 0.81% (1.41%)Hexagon B 469,613 5,242 0.43Sandvik 193,595 3,772 0.31Volvo B 48,392 793 0.07 9,807 0.81Switzerland 3.52% (3.39%)Chubb 47,479 6,948 0.57

17Schroder Global Equity Fund Annual Report and Accounts15 December 2021
Portfolio Statement (continued)
Holding at
15.12.21Market Value
£000’s% of net
assets
Nestle 210,493 21,569 1.78Roche Holding 30,270 9,181 0.76Sika 16,007 4,897 0.41 42,595 3.52Taiwan 1.57% (1.92%)Taiwan Semiconductor Manufacturing 1,163,000 18,918 1.57 18,918 1.57United Kingdom 5.94% (3.22%)AstraZeneca 42,576 3,529 0.29Barclays 3,771,865 6,657 0.55Bunzl 189,292 5,541 0.46Burberry Group 95,177 1,643 0.14Croda International 45,657 4,709 0.39Diageo 335,941 13,197 1.09GlaxoSmithKline 378,210 6,082 0.50National Grid 310,331 3,286 0.27Reckitt Benckiser Group 118,053 7,255 0.60Royal Dutch Shell A 1,248,237 19,935 1.65 71,834 5.94United States of America 58.29% (56.79%)Abbott Laboratories 44,309 4,488 0.37Activision Blizzard 25,562 1,144 0.09Adobe 30,056 13,809 1.14Advanced Micro Devices 67,150 6,943 0.57Alphabet A 24,466 52,705 4.36Amazon.com 12,049 30,189 2.50American Express 58,942 7,225 0.60AMETEK 29,648 3,193 0.26Anthem 23,426 7,808 0.65Apple 102,464 13,444 1.11Ball 53,542 3,726 0.31BlackRock 16,062 10,987 0.91Booking Holdings 8,885 14,150 1.17Bristol-Myers Squibb 130,259 5,992 0.50Charter Communications A 12,286 5,762 0.48Churchill Downs 24,428 3,983 0.33Comcast A 312,265 11,408 0.94ConocoPhillips 219,121 11,608 0.96Costco Wholesale 35,115 14,626 1.21Coterra Energy 536,766 8,176 0.68Danaher 43,143 10,105 0.84Deere 23,401 6,079 0.50Dexcom 8,980 3,651 0.30Edwards Lifesciences 63,066 5,617 0.47Eli Lilly 67,947 14,037 1.16Equinix REIT 4,399 2,694 0.22Estee Lauder A 13,987 3,797 0.31First Republic Bank 60,307 9,353 0.77Fortive 68,683 3,855 0.32
Holding at
15.12.21Market Value
£000’s% of net
assets
Fortune Brands Home & Security 40,429 3,201 0.27HCA Healthcare 32,534 6,199 0.51Honeywell International 21,448 3,380 0.28Intuit 18,885 8,955 0.74Johnson & Johnson 84,551 10,947 0.91JPMorgan Chase 191,562 22,995 1.90Lowe's 78,632 15,234 1.26MercadoLibre 4,811 4,249 0.35Merck 68,660 3,903 0.32Meta Platforms A 48,594 12,106 1.00Microsoft 214,780 52,943 4.38Morgan Stanley 274,643 20,572 1.70MSCI 10,826 4,844 0.40Nasdaq 56,535 8,579 0.71Netflix 12,043 5,368 0.44NextEra Energy 169,129 11,619 0.96NIKE B 58,178 7,142 0.59Nordson 12,949 2,615 0.22NVIDIA 53,533 11,451 0.95NVR 1,366 6,033 0.50O'Reilly Automotive 7,566 3,920 0.32Otis Worldwide 70,746 4,480 0.37Parker-Hannifin 17,702 4,131 0.34PayPal Holdings 21,646 3,030 0.25PepsiCo 85,000 11,005 0.91Procter & Gamble 72,728 8,752 0.72salesforce.com 31,296 5,984 0.50SBA Communications REIT 12,308 3,405 0.28Sherwin-Williams 27,695 7,152 0.59SolarEdge Technologies 19,865 4,367 0.36Teradyne 33,729 3,956 0.33Texas Instruments 118,188 16,872 1.40Thermo Fisher Scientific 24,092 11,678 0.97Tractor Supply 49,976 8,860 0.73Trimble 42,619 2,728 0.23Union Pacific 98,028 18,238 1.51UnitedHealth Group 57,124 20,967 1.74US Bancorp 171,984 7,445 0.62Visa A 111,262 17,612 1.46Vulcan Materials 45,455 7,018 0.58Walt Disney 43,467 4,903 0.41West Pharmaceutical Services 10,990 3,627 0.30Wyndham Hotels & Resorts 66,318 3,951 0.33Zebra Technologies A 7,758 3,427 0.28

18 Schroder Global Equity Fund Annual Report and Accounts15 December 2021
Portfolio Statement (continued)
Holding at
15.12.21Market Value
£000’s% of net
assets
Zoetis 23,368 4,046 0.34 704,443 58.29Equities total 1,192,872 98.70Portfolio of investments 1,192,872 98.70Net other assets 15,652 1.30Net assets attributable to unitholders 1,208,524 100.00
The comparative percentage figures in brackets are as at 15 December 2020.Unless otherwise stated, all securities are admitted to official stock exchange listings.
19Schroder Global Equity Fund Annual Report and Accounts15 December 2021
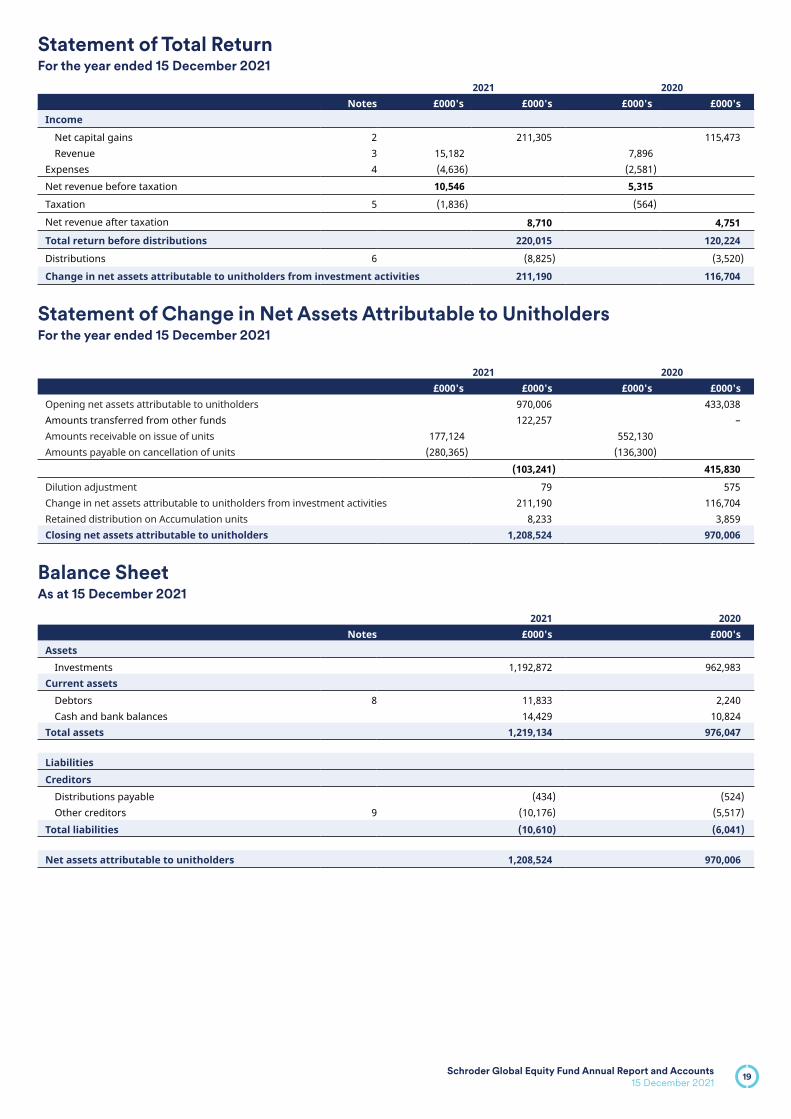
Statement of Total ReturnFor the year ended 15 December 2021
2021 2020Notes £000's £000's £000's £000's
Income
Net capital gains 2 – 211,305 – 115,473Revenue 3 15,182 – 7,896 –
Expenses 4 (4,636) – (2,581) –Net revenue before taxation 10,546 – 5,315 –
Taxation 5 (1,836) – (564) –
Net revenue after taxation 8,710 4,751
Total return before distributions 220,015 120,224
Distributions 6 (8,825) (3,520)
Change in net assets attributable to unitholders from investment activities 211,190 116,704
Statement of Change in Net Assets Attributable to Unitholders For the year ended 15 December 2021
2021 2020£000's £000's £000's £000's
Opening net assets attributable to unitholders 970,006 433,038Amounts transferred from other funds 122,257 –Amounts receivable on issue of units 177,124 – 552,130 –Amounts payable on cancellation of units (280,365) – (136,300) –
(103,241) 415,830
Dilution adjustment 79 575Change in net assets attributable to unitholders from investment activities 211,190 116,704Retained distribution on Accumulation units 8,233 3,859Closing net assets attributable to unitholders 1,208,524 970,006
Balance Sheet As at 15 December 2021
2021 2020Notes £000's £000's
AssetsInvestments 1,192,872 962,983
Current assetsDebtors 8 11,833 2,240Cash and bank balances 14,429 10,824
Total assets 1,219,134 976,047 – –
Liabilities – –Creditors
Distributions payable (434) (524)Other creditors 9 (10,176) (5,517)
Total liabilities (10,610) (6,041) – –
Net assets attributable to unitholders 1,208,524 970,006

Notes to the AccountsFor the year ended 15 December 2021
20 Schroder Global Equity Fund Annual Report and Accounts15 December 2021
1 Accounting policies Basis of preparationThe accounts have been prepared under the historical cost basis, as modified by the revaluation of investments, and in accordance with the Statement of Recommended Practice for UK Authorised Funds issued by the Investment Management Association in May 2014 and in accordance with United Kingdom Generally Accepted Accounting Practice, including Financial Reporting Standard 102 (The Financial Reporting Standard Applicable in the UK and Republic of Ireland (FRS 102)).
RevenueDividends and real estate income distributions receivable from equity investments are recognised net of attributable tax credits and are credited to revenue when they are first quoted ex-dividend. Dividends from US Real Estate Investment Trusts are initially accounted for at an estimated 70% revenue and 30% capital split when the security goes ex-dividend. Following the end of the calendar year, US Real Estate Investment Trusts publish the split between revenue and capital of the dividends they have previously declared. When this information is received the initial estimated allocation is adjusted to reflect the published split between revenue and capital. The ordinary element of stocks received in lieu of cash dividends is recognised as revenue of the Fund. Any enhancement above the cash dividend is treated as capital. Interest receivable from bank balances is accounted for on an accruals basis.
Special dividendsSpecial dividends are treated as revenue or capital depending on the facts of each particular case.
ExpensesExpenses of the Fund are charged against revenue except for costs associated with the purchase and sale of investments which are allocated to the capital of the Fund. All expenses except for professional fee are accounted for on an accruals basis.
TaxationCorporation tax is provided for on the revenue liable to corporation tax less deductible expenses. The tax effect of different items of revenue or expenses is allocated between revenue and capital using the marginal basis. Deferred taxation is provided for on all timing differences that have originated but not reversed by the balance sheet date, other than those differences regarded as permanent. Any liability to deferred taxation is provided for at the average rate of taxation expected to apply. Deferred tax assets and liabilities are not discounted to reflect the time value of money.
DistributionsThe revenue available for distribution is the total revenue earned by the Fund, less deductible expenses and taxation charged to revenue. For Accumulation units this revenue is not distributed but automatically reinvested in the Fund and is reflected in the value of these units. The ordinary element of scrip dividends is treated as revenue and does not form part of the distribution.
Dilution adjustmentIn certain circumstances the Manager may apply a dilution adjustment on subscriptions and redemptions of units. If applied, the dilution adjustment is paid to the Fund. See Prospectus for further details.
ValuationAll investments held by the Fund have been valued at market value at 18:00 on the last working day of the accounting period. Market value is defined by the Statement of Recommended Practice as fair value which generally is the bid value of each security and the offer value for short positions.
Foreign currenciesTransactions in foreign currencies are translated into sterling at the exchange rate prevailing on the date of the transaction. Assets and liabilities valued in foreign currencies have been translated into sterling at the exchange rates prevailing at the balance sheet date.
2 Net capital gainsThe net capital gains during the year comprise:
2021 2020£000's £000's
Non-derivative securities 211,502 114,222Forward foreign currency contracts (6) (491)Foreign currency (losses)/gains (185) 1,759Transaction costs (6) (17)Net capital gains 211,305 115,473

21Schroder Global Equity Fund Annual Report and Accounts15 December 2021
Notes to the AccountsFor the year ended 15 December 2021 (continued)
3 Revenue 2021 2020
£000's £000'sUK dividends 680 305Overseas dividends 13,995 7,519Real estate income distributions 43 47Scrip dividends 464 –Bank interest – 25Total revenue 15,182 7,896
4 Expenses2021 2020
£000's £000's
Payable to the Manager, associates of the Manager and agents of either of them:Annual management charge 616 2,432Administration charge 11 54Schroders Annual Charge1,2 3,950 –
4,577 2,486Payable to the Trustee, associates of the Trustee and agents of either of them:
Trustee's fees 17 54Safe custody fees 17 13Dividend expenses 4 –
38 67Other expenses:
Audit fee2 2 9Professional fee 18 17Interest payable 1 2
21 28Total expenses 4,636 2,581
1 Fees such as the Annual Management Charge, Administration fee, Trustee fee and Audit fee were paid separately to 28 February 2021. From 1 March 2021 these fees were replaced with the Schroders Annual Charge.
2 Audit fees including VAT for the financial year ending 2021 were £9,647 (2020 – £9,959). 5 TaxationCorporation tax has not been provided for as expenses payable by the Fund exceed the revenue liable to corporation tax.
(a) Analysis of the tax charge for the year 2021 2020
£000's £000'sOverseas withholding tax 1,897 881Prior year adjustment (61) (317)Total current tax (Note 5(b)) 1,836 564
22 Schroder Global Equity Fund Annual Report and Accounts15 December 2021
Notes to the AccountsFor the year ended 15 December 2021 (continued)
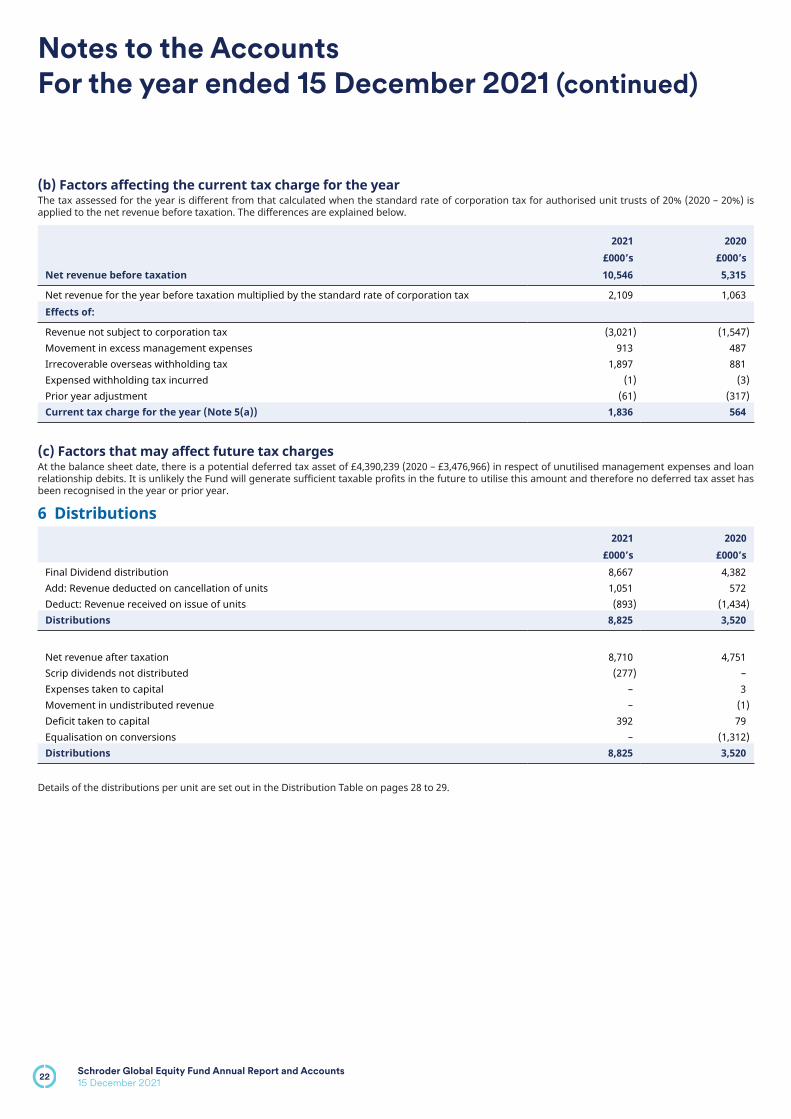
(b) Factors affecting the current tax charge for the year The tax assessed for the year is different from that calculated when the standard rate of corporation tax for authorised unit trusts of 20% (2020 – 20%) is applied to the net revenue before taxation. The differences are explained below.
2021 2020£000’s £000’s
Net revenue before taxation 10,546 5,315
Net revenue for the year before taxation multiplied by the standard rate of corporation tax 2,109 1,063Effects of:
Revenue not subject to corporation tax (3,021) (1,547)Movement in excess management expenses 913 487Irrecoverable overseas withholding tax 1,897 881Expensed withholding tax incurred (1) (3)Prior year adjustment (61) (317)Current tax charge for the year (Note 5(a)) 1,836 564
(c) Factors that may affect future tax chargesAt the balance sheet date, there is a potential deferred tax asset of £4,390,239 (2020 – £3,476,966) in respect of unutilised management expenses and loan relationship debits. It is unlikely the Fund will generate sufficient taxable profits in the future to utilise this amount and therefore no deferred tax asset has been recognised in the year or prior year.
6 Distributions2021 2020
£000’s £000’sFinal Dividend distribution 8,667 4,382Add: Revenue deducted on cancellation of units 1,051 572Deduct: Revenue received on issue of units (893) (1,434)Distributions 8,825 3,520
Net revenue after taxation 8,710 4,751Scrip dividends not distributed (277) –Expenses taken to capital – 3Movement in undistributed revenue – (1)Deficit taken to capital 392 79Equalisation on conversions – (1,312)Distributions 8,825 3,520
Details of the distributions per unit are set out in the Distribution Table on pages 28 to 29.

23Schroder Global Equity Fund Annual Report and Accounts15 December 2021
Notes to the AccountsFor the year ended 15 December 2021 (continued)
7 Fair value hierarchyInstruments held at the year end are presented in line with amendments to FRS 102 the Financial Reporting Standard applicable in the UK and Republic of Ireland Fair value hierarchy disclosures.
2021 2020
Basis of valuationAssets £000’s
Liabilities £000’s
Assets £000’s
Liabilities £000’s
Level 1: Quoted prices 1,192,872 – 962,983 –Level 2: Observable market data – – – –Level 3: Unobservable data – – – –Total 1,192,872 – 962,983 –
Level 1: Unadjusted quoted price in an active market for an identical instrument.Level 2: Valuation techniques using observable inputs other than quoted prices within level 1.Level 3: Valuation techniques using unobservable inputs. Unobservable dataUnobservable data has been used only where relevant observable market data is not available. Where there was no reputable price source for an investment, the Manager has assessed information available from internal and external sources in order to arrive at an estimated fair value. The fair value is established by using measures of value such as the price of recent transactions, earnings multiple and net assets. The Manager of the Fund also makes judgements and estimates based on their knowledge of recent investment performance, historical experience and other assumptions that are considered reasonable under the circumstances. The estimates and the assumptions used are under continuous review by the Manager with particular attention paid to the carrying value of the investments.
8 Debtors2021 2020
£000's £000'sAmounts receivable for issue of units 860 719Sales awaiting settlement 9,958 974Accrued revenue 614 397Overseas withholding tax recoverable 392 150Income tax recoverable 9 –Total debtors 11,833 2,240
9 Other creditors2021 2020
£000's £000'sAmounts payable for cancellation of units 2,762 5,128Purchases awaiting settlement 6,673 –Accrued expenses 741 389Total other creditors 10,176 5,517
10 Contingent liabilitiesThere were no contingent liabilities at the balance sheet date (2020 – Nil).
11 Related party transactionsThe Manager exercises control over the Fund and is therefore a related party by virtue of its controlling influence. Amounts paid during the year or due to the Manager at the balance sheet date are disclosed under Expenses and Other creditors in the Notes to the Accounts. The Manager acts as principal on all transactions of units in the Fund. The aggregate monies paid through the issue and cancellation of units are disclosed in the Statement of Change in Net Assets Attributable to Unitholders and Distributions in the Notes to the Accounts. Amounts due from or to the Manager in respect of unit transactions at the balance sheet date are included under Debtors and Other creditors in the Notes to the Accounts. Units held or managed by the Manager or associates of the Manager as a percentage of the Fund's net asset value at the balance sheet date were 80.32% (2020 – 90.02%).

24 Schroder Global Equity Fund Annual Report and Accounts15 December 2021
Notes to the AccountsFor the year ended 15 December 2021 (continued)
12 Unit classesThe Fund currently has eleven unit classes. Following the introduction of the Schroders Annual Charge on 1 March 2021, as detailed on page 3, the Annual Management Charge from this date is included within the “all in one” fund management fee. Details of the Schroders Annual Charge and the amount for each unit class are disclosed in the Prospectus. Up to 1 March 2021, the Annual Management Charge was based on the average value of the Fund, calculated on a daily basis, and covered the remuneration of the Manager, the Investment Adviser and their overhead expenses and for each unit class was as follows:
I Accumulation units 0.50%I Income units 0.50%K1 Accumulation units 1.50%L Accumulation units 0.405%L Income units 0.405%X Accumulation units 0.00%Z Accumulation units 0.45%Z Income units 0.45%
The closing net asset value of each unit class, the closing net asset value per unit and the closing number of units in issue are given in the Comparative Table on pages 10 to 15. The distributions per unit class are given in the Distribution Table on pages 28 to 29. All classes have the same rights on winding up.
13 Derivative and other financial instrumentsThe main risks arising from the Fund’s financial instruments are market price, foreign currency, liquidity and interest rate risks. The Manager's policies for managing these risks are summarised below and have been applied throughout the year and the prior year.
Market price riskThe Fund’s investment portfolio is exposed to market price fluctuations which are monitored by the Manager in pursuance of the investment objective and policy. Adherence to investment guidelines and to investment and borrowing powers set out in the Trust Deed, the Prospectus and in the Collective Investment Schemes sourcebook mitigates the risk of excessive exposure to any particular type of security or issuer.
Foreign currency riskWhere a portion of the net assets of the Fund are denominated in currencies other than sterling the balance sheet and total return can be affected by currency movements. Therefore the Manager may decide that a proportion of the investments that are not priced in sterling, may be covered by forward currency contracts, so that the Fund’s exposure to currency risk is reduced. Revenue received in other currencies is translated to sterling on or near the date of receipt. The Fund does not hedge or otherwise seek to avoid currency movement risk on accrued revenue.

25Schroder Global Equity Fund Annual Report and Accounts15 December 2021
Notes to the AccountsFor the year ended 15 December 2021 (continued)
Currency risk profileThe currency risk profile of the Fund’s net assets and liabilities at the balance sheet date was as follows:
2021 2020Currency £000’s £000’sAustralian dollar 16,253 18,958Brazilian real 3,710 –Canadian dollar 7,838 –Danish krone 7,353 13,090Euro 177,188 132,679Hong Kong dollar 20,530 27,612Indonesian rupiah 9,901 8,069Japanese yen 39,712 35,061Norwegian krone 19,328 11,633Singapore dollar 1 1South Korean won 22,340 22,853Sterling 66,363 35,393Swedish krona 12,261 13,698Swiss franc 35,648 29,575Taiwan dollar 19,001 18,646US dollar 751,097 602,738
Liquidity riskThe primary source of this risk to the Fund is the liability to unitholders for any cancellation of units. This risk is minimised by holding cash, readily realisable securities and access to overdraft facilities up to the amount prescribed by the Collective Investment Schemes sourcebook.
Interest rate riskInterest rate risk is the risk that the value of the Fund’s investment holdings will fluctuate as a result of changes in interest rates. At the year end date 1.19% (2020 – 1.12%) of the net assets of the Fund were interest bearing and as such the interest rate risk is not considered significant.
Floating rate financial assets and financial liabilitiesSterling denominated bank balances bear interest at rates based on the Sterling Overnight Index Average rate. Foreign currency bank balances bear interest at rates based on the London Interbank Offer Rate or its international equivalent.
Fair value of financial assets and financial liabilitiesThere is no material difference between the value of the financial assets and liabilities, as shown in the balance sheet, and their fair value.
Global risk exposure Commitment approachWhen using derivatives, the Manager uses a risk management process that enables it to monitor the risk of a Fund’s derivative positions. The global risk exposure of a Fund is calculated daily either by means of the commitment approach or the Value-at-Risk (VaR) approach. Under the commitment approach, the global risk exposure is defined as the underlying market value of derivatives, after netting and hedging as permitted by the regulation, not exceeding the Net Asset Value of a Fund. This is typically used on Funds where derivative usage is low or Funds which limit their derivatives commitment to 100% or less of their Net Asset Value. The global risk exposure of the Fund is calculated using the commitment approach. During the year ended 15 December 2021 the global risk exposure of the Fund did not exceed 100% of its Net Asset Value. The lowest, highest, average and actual level of leverage for the Fund as at the balance sheet date was as follows:
Leverage
2021 2020
Lowest Highest AverageLeverage
15 December Lowest Highest AverageLeverage
15 December
0.00% 7.78% 0.11% 0.19% 0.00% 18.41% 0.61% 0.00%

26 Schroder Global Equity Fund Annual Report and Accounts15 December 2021
Notes to the AccountsFor the year ended 15 December 2021 (continued)
14 Direct transaction costs In the case of shares, broker commissions and transfer taxes/stamp duty are paid by the Fund on each transaction. In addition, there is a dealing spread between buying and selling prices of the underlying investments. Unlike shares, other types of investments (such as bonds, money market instruments, derivatives) have no separately identifiable transaction costs; these costs form part of the dealing spread. Dealing spreads vary considerably depending on the transaction value and market sentiment.
2021Principal
£000'sCommissions
£000'sTaxes
£000'sTotal cost
£000'sCommissions % of principal
Taxes % of principal
Purchases
Equities 458,985 92 273 459,350 0.02 0.06
Sales
Equities 440,889 (76) (50) 440,763 (0.02) (0.01)
Total cost of the Fund's average net asset value (%) 0.02 0.03
2020Principal
£000'sCommissions
£000'sTaxes
£000'sTotal cost
£000'sCommissions % of principal
Taxes % of principal
Purchases
Purchases1:Equities 762,770 128 299 763,197 0.02 0.04Corporate actions purchases: – – –Equities 431 – – 431 – –
763,201 128 299 763,628
Sales
Equities 344,854 (64) (26) 344,764 (0.02) (0.01)
Total cost of the Fund's average net asset value (%) 0.02 0.04
1 Excluding corporate actions.
Average portfolio dealing spreadAs at the balance sheet date the average portfolio dealing spread was 0.08% (2020 – 0.07%).This spread represents the difference between the values determined respectively by reference to the bid and offer prices of investments expressed as a percentage of the value determined by reference to the offer price.

27Schroder Global Equity Fund Annual Report and Accounts15 December 2021
Notes to the AccountsFor the year ended 15 December 2021 (continued)
15 Units in issue reconciliationNumber of units in issue 15.12.20
Number of units
issued
Number of units
cancelled
Number of units
converted
Number of units in issue 15.12.21
I Accumulation units 18,401,024 1,809,413 (3,038,374) – 17,172,063
I Income units 6,158,482 68,002 (2,554,668) (4) 3,671,812
K1 Accumulation units 137,323,202 163,291,547 (39,889,817) – 260,724,932
K2 Accumulation units – 3,000 – – 3,000
L Accumulation units 32,180 37 (76) – 32,141
L Income units 13,866 52,386 (13,709) – 52,543
S Accumulation units – 17,592,796 – – 17,592,796
S Income units – 47,979,551 (609,552) – 47,369,999
X Accumulation units 972,624,812 46,367,240 (289,198,221) – 729,793,831
Z Accumulation units 28,926,869 71,244,059 (2,060,632) (9,044) 98,101,252
Z Income units 3,067,264 8,043,641 (2,429,371) 9,438 8,690,972
16 Non-adjusting post balance sheet eventsAs a result of market movements and foreign exchange rates, since the balance sheet date on 15 December 2021, the price of each share class has changed as follows:
Dealing price 3.3.22
Dealing price 15.12.21 % change
I Accumulation units 1,625.00p 1,775.00p (8.45)
I Income units 1,153.00p 1,268.00p (9.07)
K1 Accumulation units 66.29p 72.55p (8.63)
K2 Accumulation units 51.87p 56.75p (8.60)
L Accumulation units 121.60p 132.90p (8.50)
L Income units 116.40p 127.90p (8.99)
S Accumulation units 52.29p 57.12p (8.46)
S Income units 52.17p 57.12p (8.67)
X Accumulation units 61.65p 67.26p (8.34)
Z Accumulation units 121.10p 132.30p (8.47)
Z Income units 115.90p 127.30p (8.96)

Distribution Table
28 Schroder Global Equity Fund Annual Report and Accounts15 December 2021
Final distribution for the year ended 15 December 2021Group 1 Units purchased prior to 16 December 2020Group 2 Units purchased on or after 16 December 2020
Net revenue
2021 per unit
Equalisation 2021
per unit
Distribution payable
15.2.22 per unit
Distribution paid
15.2.21 per unit
I Accumulation units
Group 1 11.7230p – 11.7230p 11.3937p
Group 2 1.5163p 10.2067p 11.7230p 11.3937p
I Income units
Group 1 8.3739p – 8.3739p 8.1929p
Group 2 5.1988p 3.1751p 8.3739p 8.1929p
L Accumulation units
Group 1 0.8247p – 0.8247p 0.6954p
Group 2 0.8233p 0.0014p 0.8247p 0.6954p
L Income units
Group 1 0.7963p – 0.7963p 0.6785p
Group 2 0.2921p 0.5042p 0.7963p 0.6785p
X Accumulation units
Group 1 0.7452p – 0.7452p 0.1622p
Group 2 0.2830p 0.4622p 0.7452p 0.1622p
Z Accumulation units
Group 1 0.7727p – 0.7727p 0.6372p
Group 2 0.3992p 0.3735p 0.7727p 0.6372p
Z Income units
Group 1 0.7450p – 0.7450p 0.6180p
Group 2 0.2701p 0.4749p 0.7450p 0.6180p
Final distribution for the period ended 15 December 2021Group 1 Units purchased on 28 May 2021Group 2 Units purchased after 28 May 2021
Net revenue
2021 per unit
Equalisation 2021
per unit
Distribution payable
15.2.22 per unit
S Accumulation units
Group 1 0.1303p – 0.1303p
Group 2 0.1303p – 0.1303p
S Income units
Group 1 0.1303p – 0.1303p
Group 2 0.1303p – 0.1303p
K1 Accumulation unitsThe K1 Accumulation units have made no distributions to date.K2 Accumulation unitsThe K2 Accumulation units have made no distributions to date

29Schroder Global Equity Fund Annual Report and Accounts15 December 2021
Distribution Table (continued)
Equalisation Equalisation applies to units purchased during the distribution period (Group 2 units). It is the average amount of revenue included in the purchase price of Group 2 units and is refunded to the holders of these units as a return of capital.Being capital it is not liable to income tax but must be deducted from the cost of units for capital gains tax purposes.

Remuneration
30 Schroder Global Equity Fund Annual Report and Accounts15 December 2021
UCITS remuneration disclosures for Schroder Unit Trusts Limited (‘SUTL’) for the year to 31 December 2020These disclosures form part of the non-audited section of this annual report and accounts and should be read in conjunction with the Schroders plc Remuneration Report on pages 75 to 102 of the 2020 Annual Report & Accounts (available on the Group’s website –https://www.schroders.com/en/investor-relations/results-and-reports/annual-report-and-accounts-2020/), which provides more information on the activities of our Remuneration Committee and our remuneration principles and policies.The UCITS Material Risk Takers (‘UCITS MRTs’) of SUTL are individuals whose roles within the Schroders Group can materially affect the risk of SUTL or any UCITS fund that it manages. These roles are identified in line with the requirements of the UCITS Directive and guidance issued by the European Securities and Markets Authority.The Remuneration Committee of Schroders plc has established a remuneration policy to ensure the requirements of the UCITS Directive are met for all UCITS MRTs. The Remuneration Committee and the Board of Schroders plc review remuneration strategy at least annually. The directors of SUTL are responsible for the adoption of the remuneration policy, for reviewing its general principles at least annually, for overseeing its implementation and for ensuring compliance with relevant local legislation and regulation. During 2020 the Remuneration Policy was reviewed to ensure compliance with the UCITS/AIFMD remuneration requirements and no significant changes were made.The implementation of the remuneration policy is, at least annually, subject to independent internal review for compliance with the policies and procedures for remuneration adopted by the Board of SUTL and the Remuneration Committee. The most recent review found no fundamental issues but resulted in a range of more minor recommendations, principally improvements to process and policy documentation.The total spend on remuneration is determined based on a profit share ratio, measuring variable remuneration charge against pre-bonus profit, and from a total compensation ratio, measuring total remuneration expense against net income. This ensures that the interests of employees are aligned with Schroders financial performance. In determining the remuneration spend each year, the underlying strength and sustainability of the business is taken into account, along with reports on risk, legal, compliance and internal audit matters from the heads of those areas.The remuneration data that follows reflects amounts paid in respect of performance during 2020. ¯ The total amount of remuneration paid by SUTL to its staff was nil as SUTL has no employees. SUTL has two independent Non Executive Directors who
receive fees in respect of their role on the Board of SUTL1. Employees of other Schroders Group entities who serve as Directors of SUTL receive no additional fees in respect of their role on the Board of SUTL.
¯ The following disclosures relate to UCITS MRTs of SUTL. Most of those UCITS MRTs were employed by and provided services to other Schroders group companies and clients. In the interests of transparency, the aggregate remuneration figures that follow reflect the full remuneration for each SUTL UCITS MRT. The aggregate total remuneration paid to the 151 UCITS MRTs of SUTL in respect of the financial year ended 31 December 2020 is £107.41 million, of which £40.88 million was paid to senior management, and £66.53 million was paid to MRTs deemed to be taking risk on behalf of SUTL or the UCITS funds that it manages and Control Function MRTs.
For additional qualitative information on remuneration policies and practices see www.schroders.com/rem-disclosures.
1 The fees are not disclosed due to confidentiality and data protection considerations. The amount is not material to SUTL.
General Information
31Schroder Global Equity Fund Annual Report and Accounts
15 December 2021
Manager Schroder Unit Trusts Limited 1 London Wall Place London EC2Y 5AU Authorised and regulated by the Financial Conduct Authority
Investment Adviser Schroder Investment Management Limited1 London Wall Place London EC2Y 5AU Authorised and regulated by the Financial Conduct Authority
Trustee J.P. Morgan Europe Limited Chaseside Bournemouth BH7 7DA Authorised by the Prudential Regulation Authority and regulated by the Financial Conduct Authority and Prudential Regulation Authority
Registrar Schroder Unit Trusts Limited 1 London Wall Place London EC2Y 5AU Authorised and regulated by the Financial Conduct Authority The Manager is responsible for maintaining the register for each Fund. It has delegated certain registrar functions to HSBC Bank Plc, 8 Canada Square, London, E14 8HQ.
Administration Details Schroders Investor ServicesPO Box 1402SunderlandSR43 4AF
Independent Auditors PricewaterhouseCoopers LLP Atria One 144 Morrison Street Edinburgh EH3 8EX
Authorisation The Fund is an authorised unit trust and is constituted pursuant to the Collective Investment Schemes sourcebook and is structured as a Trust. The Fund is a UCITS scheme for the purpose of the categorisation of the Collective Investment Schemes sourcebook.
Value Assessment A statement on the Assessment of Value is published on the Global Fund Centre in the Fund Literature section at www.Schroders.com within 4 months of the annual 'reference date' 31 December.
Other information The Prospectus, the Key Investor Information Document and details of investment charges and costs are available on request or can be downloaded from our website www.schroders.com.

For further literature please contact Schroder Investor Services on 0800 182 2399 or [email protected] for Retail Clients, or 0345 030 7277 or [email protected] for Institutional Clients, or visit our website at www.schroders.com.Issued in March 2022 by Schroder Unit Trusts Limited, 1 London Wall Place, London EC2Y 5AU. Registered Number 4191730 England. Schroder Unit Trusts Limited is an authorised corporate director, authorised unit trust manager and an ISA plan manager, and is authorised and regulated by the Financial Conduct Authority. For your security, communications may be taped and monitored.
Related Documents