1 School tracking and development of cognitive skills 1 Sari Pekkala Kerr (Wellesley College) 2 Tuomas Pekkarinen (Aalto University, IZA and IFAU) Roope Uusitalo (HECER, IZA and IFAU) [This version June 21, 2012] Abstract This paper evaluates the effects of selective vs. comprehensive school systems on military test scores in mathematical, verbal and logical reasoning skills tests. We use data from the Finnish comprehensive school reform which replaced the old two-track school system with a uniform nine-year comprehensive school. The paper uses a differences-in-differences approach and exploits the fact that the reform was implemented gradually across the country during a six- year period. We find that the reform had a small positive effect on the verbal test scores, but no effect on the mean performance in the arithmetic or logical reasoning tests. However, the reform significantly improved scores on all tests for the students whose parents had only basic education. JEL Codes: H52, I21 Key Words: Education, school system, tracking, comprehensive school, test scores 1 The authors would like to thank David Autor, Alexis Brownell, Lidia Farré, William Kerr, Sandra McNally, Eva Mörk, as well as seminar participants at London School of Economics, Universitat de Alicante, Wellesley College, ESPE Conference in London, and EALE Conference in Amsterdam for helpful comments. Pekkarinen and Pekkala Kerr are grateful for financial assistance from the Academy of Finland and Yrjö Jahnsson Foundation, respectively. 2 Corresponding author. Address: Wellesley College, WCW, 106 Central Street, Wellesley, MA 02481. Email: [email protected].

Welcome message from author
This document is posted to help you gain knowledge. Please leave a comment to let me know what you think about it! Share it to your friends and learn new things together.
Transcript

1
School tracking and development of cognitive skills1
Sari Pekkala Kerr (Wellesley College)2
Tuomas Pekkarinen (Aalto University, IZA and IFAU)
Roope Uusitalo (HECER, IZA and IFAU)
[This version June 21, 2012]
Abstract
This paper evaluates the effects of selective vs. comprehensive school systems on military test scores in mathematical, verbal and logical reasoning skills tests. We use data from the Finnish comprehensive school reform which replaced the old two-track school system with a uniform nine-year comprehensive school. The paper uses a differences-in-differences approach and exploits the fact that the reform was implemented gradually across the country during a six-year period. We find that the reform had a small positive effect on the verbal test scores, but no effect on the mean performance in the arithmetic or logical reasoning tests. However, the reform significantly improved scores on all tests for the students whose parents had only basic education.
JEL Codes: H52, I21
Key Words: Education, school system, tracking, comprehensive school, test scores
1The authors would like to thank David Autor, Alexis Brownell, Lidia Farré, William Kerr, Sandra McNally, Eva Mörk, as well as seminar participants at London School of Economics, Universitat de Alicante, Wellesley College, ESPE Conference in London, and EALE Conference in Amsterdam for helpful comments. Pekkarinen and Pekkala Kerr are grateful for financial assistance from the Academy of Finland and Yrjö Jahnsson Foundation, respectively. 2Corresponding author. Address: Wellesley College, WCW, 106 Central Street, Wellesley, MA 02481. Email: [email protected].

2
1. Introduction
International comparisons of student achievement, such as the OECD’s Programme for
International Student Assessment (PISA), have generated a growing interest in the effect of
school systems on student outcomes. According to these comparisons, the differences in
average test results across countries with roughly equal school resources are very large. Also,
the dispersion of test scores varies considerably across countries.
One potential explanation for cross-country differences in the level and, in particular, the
variance of achievement scores is the extent and timing of tracking, or ability grouping of
students. For example, the OECD has repeatedly argued that variation in student performance
tends to be higher in countries with early tracking policies (e.g. OECD, 2003). High variance
of student achievement and its correlation with family background have been seen as
problematic from the perspective of equality of opportunity. On the other hand, postponing
tracking could lower the quality of teaching at least for the high-ability students. Implicit in
this debate is an efficiency-equity trade-off: postponement of tracking could improve equality
but might decrease the average achievement.
The timing of tracking differs significantly between comprehensive and selective school
systems. In the selective system, tracking students into different types of schools occurs early,
and choices made as early as age ten largely determine later schooling options. In the
comprehensive system, students often stay in the same schools until the end of secondary
school.
In this study we evaluate the effect of the Finnish comprehensive school reform on cognitive
skills tests. Finland had a selective two-track school system until the 1970’s, when the school
reform replaced the old two-track system with a uniform comprehensive school system that is
similar to those in other European countries. As a result of the reform the tracking age was
postponed from age 10 to 15. The differences between the pre- and post-reform systems are
similar to the cross-country differences in school systems in the OECD countries today. The
effects of the Finnish reform are therefore informative for the current schooling policy debate.
Previous studies such as Meghir and Palme (2005) as well as Pekkarinen et al. (2009) have
shown that comprehensive school reforms did improve the equality of opportunity by
decreasing the intergenerational correlation of earnings. However, the earnings effects

3
reported in previous studies could be due to peer effects, social networks, opening of new
educational opportunities or direct impact on productive skills.
Using previously unavailable data from the Finnish Defense Forces we can partially open the
‘black box’ relating school systems to labor market outcomes. We use scores from cognitive
skills tests taken at the beginning of mandatory military service. These data allow us to
examine how the comprehensive school system affected arithmetic and verbal skills as well as
logical reasoning ability. This is particularly important as recent research emphasizes the role
of cognitive skills, rather than mere school attainment, as important determinants of
individual earnings, the distribution of income and economic growth. (Hanushek and
Wößmann, 2008). Yet existing evidence on the impact of major school reforms on cognitive
skills is still scarce.
We use a similar differences-in-differences approach as in Pekkarinen et al. (2009) and
exploit the fact that the school reform was implemented gradually across regions. However,
we evaluate the effects of the school reform directly on the distribution of skills that the
students are supposed to learn in school. Our results show that the reform had a small positive
effect on verbal test scores, but little effect on the mean performance in the arithmetic or
logical reasoning tests. However, the reform significantly improved the scores in all tests for
students whose parents had only basic education or low income. At the same time, the reform
had no negative effects on the test scores of students from more advantaged backgrounds.
These results are qualitatively in line with the results in Pekkarinen et al. (2009) where it was
shown that the comprehensive school reform had a substantial negative effect on the
intergenerational income elasticity. However, we find that the effects on cognitive skills are
far too small to fully explain the effects on income.
The rest of the paper proceeds as follows. In the next section, we review the literature on the
effects of school tracking and compare our approach to the previous studies. We then describe
the content and the implementation of the Finnish comprehensive reform. The fourth section
describes the data and the Finnish Army Basic Skills Test, the results of which we use as a
dependent variable. We then move on to present the differences-in-differences and maximum
likelihood estimation of the effect of the reform on test scores in section five and in the sixth
section we discuss the results. The seventh section concludes.

4
2. Previous literature
Economic theory provides somewhat ambiguous predictions on the effect of comprehensive
versus selective school systems on student achievement. A comprehensive system, where the
entire cohort is in the same class, increases heterogeneity in the classroom. This probably
makes classes more difficult to teach and thereby may lower student achievement (Lazear,
2001). However, any changes in the class composition may also affect student achievement
directly due to peer effects. The effect on the mean achievement depends on whether good
students are harmed by bad students more than bad students benefit from being around good
students.3
Even if the effect on the average student achievement is ambiguous, a comprehensive school
system should decrease the variance of test scores. This is due both to a more homogenous
curriculum and to less segregated peer groups. Furthermore, as early educational choices are
more likely to be determined by family background (Brunello and Checchi, 2007), later
tracking age in the comprehensive system may reduce the correlation between the test scores
and the family background.
The most convincing empirical evidence on the effects of ability tracking on test scores comes
from a field experiment in Kenya where randomly selected schools implemented tracking and
non-tracking policies. Duflo et al. (2008) show that tracking within schools seems to benefit
all students. However, it is not clear whether these results can be generalized to developed
countries where the student population is typically less heterogeneous. Furthermore, in
selective systems students are typically not tracked within schools but to different types of
schools, which necessarily implies that teacher quality and curriculum may vary considerably
across the tracks. In addition, the debate on the relative advantages of different school systems
is primarily concerned with tracking into different types of schools rather than tracking within
schools. Hence, even a well-designed randomized experiment of tracking within schools is
unlikely to settle the policy question of whether the entire school system should be selective
or comprehensive.
3In the Lazear (2001) model the peer effects cannot be distinguished from the curriculum effects. In his model ill-behaving students stop the teaching for the entire class. Hence, average student quality determines how much time the teacher can spend in teaching and how much material can be covered.

5
In developed countries, most of the existing evidence on the potential benefits of selective
versus comprehensive system originates from cross-country comparisons. For example,
Hanushek and Wößmann (2006) find that the variance in test scores in international student
assessments is higher in countries where tracking takes place at an early age. At the same
time, early tracking seems to have generally negative effects on mean performance. In
contrast, Brunello and Checchi (2007) and Waldinger (2006), who use a similar cross-country
approach, find no effects on the test score variance. These conflicting results from previous
studies reflect, in part, the difficulties in analyzing the effects of school system based on
cross-country data. While these studies try to control for variation due to other factors by
controlling for early test scores (Hanushek and Wößmann, 2006; and Waldinger, 2006) or by
using time variation in the tracking age (Brunello and Checchi, 2007), it is far from clear that
all relevant cross-country differences are reliably accounted for.
Analyzing changes in test scores when a country switches from a tracked to a comprehensive
system appears to be a more promising approach to identify the effects of the school system
on student achievement. Previous attempts to do this include Kerckhoff et al. (1996) and
Galindo-Rueda and Vignoles (2005), both of whom study the effect of a gradual movement
from a selective school system to a comprehensive system in England. However, as noted by
Manning and Pischke (2006), the areas that first switched to the comprehensive system in
England were on average poorer than the areas which retained the tracked system. It is
therefore difficult to disentangle the effect of school systems from the regional differences
using common data sources such as the National Child Development Survey, that only
contain a single cohort.
Relative to the earlier studies, the distinct advantage of the Finnish reform is the availability
of panel data from several cohorts, which avoids the need to rely exclusively on cross-
sectional variation. The Finnish comprehensive school reform was implemented gradually
region by region between 1972 and 1977. This gradual implementation allows us to control
for regional variation and any time trends in student achievement using a difference-in-
differences approach, which avoids biases such as those discussed by Manning and Pischke.
Furthermore, the data also include information on families, which makes it possible to
estimate the effect of the reform using data on brothers who were placed into different school
systems because they differed in age.

6
3. Comprehensive school reform4
3.1 Background
Finland introduced a wide-ranging comprehensive school reform in the 1970’s. Similar
reforms had already taken place in Sweden in the 1950s and in Norway in the 1960s (Meghir
and Palme, 2005; Aakvik et al. 2010). The Finnish comprehensive school reform abolished
the old two-track school system and created a uniform nine-year comprehensive school. The
main motivation of the reform was to provide equal educational opportunities to all students,
irrespective of place of residence or social background.
In the pre-reform system all students entered primary school (“kansakoulu”) at the age of
seven. After four years in the primary school, at age 11, the students were faced with the
choice of applying to general secondary school (“oppikoulu”) or continuing in the primary
school. Admissions to the general secondary school track were based on an entrance
examination, a teacher assessment and primary school grades. Those who were admitted to
the general secondary school (52% of the cohort in 1970) continued first in the junior
secondary schools for five years, and often went on to the upper secondary school for three
additional years. At the end of the upper secondary school the students took the matriculation
examination that provided eligibility for university-level studies.
Those who were not admitted or who did not apply to the general secondary school track
continued in the primary school. The primary school lasted altogether eight years. The last
two years of primary school concentrated on teaching vocational skills and were called
continuation classes or “civic school”. After an amendment in 1963 municipalities could
further extend these civic school courses by a year, thereby creating a nine-year primary
school. The minimum school leaving age, regardless of the track, was sixteen, unless the
student had already completed all required primary school courses. The pre-reform system is
described schematically in the left-hand panel of Figure 1.
[Figure 1: SCHOOL SYSTEMS]
4 This section draws on Pekkarinen et al. (2009).

7
3.2 Content of the comprehensive school reform
The reform introduced a new curriculum and changed the structure of primary and secondary
education. The new curriculum increased the academic content of education compared to the
old primary school curriculum by increasing the share of mathematics and sciences. In
addition, one foreign language became compulsory for all students. The new comprehensive
school curriculum resembled the old general secondary school curriculum and exposed the
pupils who in the absence of the reform would have stayed in the primary school, to a
significantly more academic education.
The structure of the post-reform school system is described in the right-hand panel of
Figure 1. The previous primary schools, civic schools and junior secondary schools were
replaced by nine-year comprehensive schools. At the same time, the upper secondary school
was separated from the junior secondary school into a distinct institution. After the reform, all
pupils followed the same curriculum in the same establishments (comprehensive schools) up
to age sixteen. After nine years in the new comprehensive school, all students could choose
between applying to upper secondary school or to vocational schools. Admission to both
tracks was based solely on comprehensive school grades.
Unlike comprehensive school reforms in many other European countries, the Finnish reform
did not change the minimum school leaving age, which had been sixteen ever since 1957,nor
did it in practice add any years of compulsory schooling. Although the pre-reform system
obliged the municipalities to provide only eight years of primary school, analysis of
quinquennial censuses reveals that by the time of the comprehensive school reform most
municipalities were already offering a full nine years of primary school for pupils who did not
go to junior secondary school. In 1975, when the reform had not yet reached the ninth grade,
92.6% of the fifteen-year-olds that would be in the ninth grade if they progressed at the
typical speed were still in school. This fraction remained at 92.6% in 1980 when the reform
had reached the ninth grade in all but the last reform region. In 1985, well after the reform
was completely implemented, the fraction of those turning fifteen while still in school was
only slightly higher, 93.9%. To us, these numbers suggest that the comprehensive school
reform did not increase the actual minimum school leaving age. The effect of the reform can
thus be interpreted as coming through changes in the curriculum and in the timing of tracking
choices, which naturally also implies changes in peer groups.

8
3.3 The implementation of the comprehensive school reform
The implementation of the reform was preceded by a process of planning that lasted for two
decades. The first experimental comprehensive schools started their operation in 1967. In
1968, the Parliament approved the School Systems Act (467/1968), according to which the
two track school system would be gradually replaced by a nine-year comprehensive school
system. The adoption of the new school system was to take place between 1972 and 1977. A
regional implementation plan divided the country into six implementation regions and
dictated when each region would implement the comprehensive school system. Regional
school boards were created to oversee the transition process. The municipalities that were
responsible for operating the school system could not select the reform date but were forced
to follow the plan designed by the National Board of Education.
In each region, pupils in the five lowest primary school grades started in the comprehensive
school during the fall term of the year stated in the implementation plan. Each following year,
the incoming cohort of first graders would start their schooling in the comprehensive school.
The pupils who were already above the fifth grade in the year that the region entered the
reform would complete their schooling according to the pre-reform system. Thus, in each
region it took approximately four years to fully complete the reform.
Figure 2 illustrates how the reform spread through the Finnish municipalities during 1972 to
1977. The municipalities in which the reform was implemented in 1972 were predominantly
situated in the northernmost province of Lapland. In 1973, the reform was implemented in the
north-eastern regions, in 1974 in the northwest, in 1975 in the south-east, in 1976 in the
south-west, and finally, in 1977 in the capital region of Helsinki.
[Figure 2: COMPREHENSIVE SCHOOL REFORM MAP]
The comprehensive school reform faced intense resistance. The most common argument
against the reform was that abolishing tracking would reduce the quality of education. As a
compromise, ability tracking was partially retained so that math and foreign languages were
taught at different levels within the comprehensive school. This ability grouping was
eventually abolished in 1985.
A reform of this scale naturally implied important changes in teacher education and the
internal organization of schools. In the old system primary school teachers were educated in

9
separate non-university institutions. Initially, these teachers continued to teach in the new
comprehensive schools. Eventually, teacher education was moved into newly founded schools
of education within universities. Over time the reform therefore led to an increase in the
average duration and an improvement in the quality of teacher training.
The implementation of the Finnish comprehensive school reform makes it in many ways a
promising natural experiment for evaluating the effects of tracking on student outcomes. A
particularly useful setup was created by the regional implementation plan that dictated when
each municipality moved into the comprehensive school system. This allows us to use a
fixed-effects approach to control for the changes over time and any regional differences
between the municipalities that were assigned to different implementation regions.
Given that we use data from the very first cohorts that were affected by the reform, the effects
are likely to be somewhat attenuated. For example, in the early years ability tracking was
retained in certain subjects, most teachers still only had the shorter primary school teacher
education, and the merging of separate schools into the same physical units probably caused
disruptions in the organizational structure.
4. Data
A fundamental problem in assessing the effects of school reform on student performance is
that students in separate school systems rarely participate in comparable tests. Sometimes it is
possible to use nation-wide or international comparisons of student achievement. However,
since most large-scale school reforms took place in 1960s and 1970s when testing was not as
widespread as today, it is difficult to find tests administered to representative and reasonably
large samples of students from both pre- and post-reform school systems.
This paper uses the results from the Basic Skills test of the Finnish Army. Since military
service is mandatory for men in Finland, almost the entire male cohort takes the test. The
average age at time of testing is 20, so obviously factors other than the school system may
also have had an effect on the test results. On the other hand, the longer-lasting outcomes of
school systems are probably more interesting than the immediate effects on test results. In
addition, the Basic Skills test is also a strong predictor of earnings and occupation later in life,

10
so any effect of school system on the test scores will have important consequences for
lifetime earnings.5
The Finnish Army Basic Skills test is designed to measure general abilities. The Army uses
these test results in selecting conscripts to officer training. Unlike the Swedish and Norwegian
military test score data, previously used by Black, Devereux, and Salvanes (2010) or by
Lindqvist and Vestman (2011), for example, the Finnish test score data are available in a
disaggregated form. The test consists of three subcategories: verbal, arithmetic, and logical
reasoning. Each subtest includes forty multiple choice questions. In the verbal reasoning
subtest, the subject has to choose synonyms or antonyms of given words, select words that
belong to the same category as a given word, exclude words from a group of words, and
identify similar relationships between word pairs. The arithmetic reasoning test asks the
subject to complete number series, solve verbally expressed mathematical problems, compute
simple arithmetic operations, and choose similar relationships between pairs of numbers. The
logical reasoning test is a standard “culture free” intelligence test based on Raven’s
progressive matrices and its results should therefore be less affected by pre-test schooling.6
On the other hand, both the verbal and arithmetic reasoning categories test skills that are
primarily taught in school.
The test was originally created in 1955 and re-designed in 1981. Exactly the same test was
used over the entire time span analyzed here. From 1982 onward, the test results are stored in
the Army database that also includes personal identification numbers, making it possible to
link the test results to information on test takers from other data registers. Our data include all
conscripts who were born between 1962 and 1966 and who were found in the Army database,
i.e., those who started their military service after January 1982. There is some selectivity in
the data due to the fact that it is possible to enter military service as a volunteer before age 20.
Thus some men in the oldest cohorts served before the Army register was created. We
experimented with several solutions to this problem. For example, we limited the analysis to
those who served in the army at age 20. We also restricted the data to men born between 1964
and 1966, i.e., those that we can observe even if they volunteered for early service at age 18
or 19. Since this made qualitatively little difference, we only report the results from using the
full sample and simply control for age at test.
5Uusitalo (1999) reports that recruits who scored one standard deviation higher in the Basic Skills tests earn on average 6% more than recruits with similar education and experience but lower test scores. 6The contents of the tests are described in detail in Tiihonen et al. (2005).

11
It is possible to be exempted from the military service due to religious or ethical conviction
though in 1980s this was rare. More common reasons for being exempt from military service
were severe health conditions, most often related to mental health problems. However, even
these criteria were substantially stricter in the 1980s than today. A comparison of the number
of observations by birth cohort in our data and the corresponding cohort size in the 1980
population census reveals that our test score data contain information on 85.3 percent of the
relevant male birth cohorts7. This corresponds closely to the reported fraction of the cohort
that served in the military in the 1980s (Finnish Defense Command, 2000).
Figure 3 plots the distribution of the raw scores, i.e. the number of correct answers in each
subtest. The distribution of the average score is plotted in the bottom right corner. These
histograms clearly show that there is plenty of variation in the test scores; the raw scores are
distributed over the whole range from zero to forty. Also, the distributions of the test scores,
in particular the distribution of the average score, are roughly symmetric.
[Figure 3: DISTRIBUTION OF THE TEST SCORES]
Per our request, Statistics Finland linked the test scores to Census data on the Finnish
population. The Statistics Finland longitudinal census file contains data on the entire
population living in Finland in 1970, -75, -80, -85 and -90. From 1990 onwards information is
available annually. Finnish Census data are based almost entirely on administrative registers.
For example, information on the place of residence in each census year is based on the
Population Register. In general, these register data are of very high quality. Only a few
persons have any missing data, and the main reasons for not being included in the census data
are residing abroad and death. Therefore practically all conscripts were found in the register
data and our data does not suffer from attrition problems that often plague similar studies.
Census data were used to gather information on the pupils’ date of birth and place of
residence in 1970, -75 and -80, which jointly determine whether the individual attended a
tracked or a comprehensive school. Statistics Finland does not release these data with a
municipality-identifier, but per our request created an indicator classifying municipalities into
six categories according to the year in which the comprehensive school reform was
7Our data are collected from the Finnish Army database and contain no information on those who did not serve in the military. It is also clear that those dismissed from the army due to health and mental reasons differ in many ways from the rest of the population. However, a simple comparison of the number of observations per cohort and region in our data to the overall cohort size in each region indicates that the comprehensive school reform had no effect on the likelihood of serving in the military.
12
implemented in each. Except for those who moved between census years between two
municipalities that implemented the reform at different years, it is possible to accurately
determine which school system was in place when the students were at the relevant age. The
movers were dropped from the data used below, resulting in a reduction of the sample by
10%.8
The census data also include family codes that can be used to identify brother pairs and to
gather information on parents’ education and earnings. To be more exact, these family codes
are based on persons living in the same household, not necessarily biological family
members. We use the family codes from the 1975 census, when the oldest men in the sample
were thirteen years old and most likely still living at home.
Table 1 reports the mean test scores by cohort and reform implementation region as
deviations from overall sample means in standard deviation units. Implementation regions are
defined by the year when the reform took place in the region. There are large differences
across regions and a general increase in the test scores over time. These regional differences
are correlated with the average parental education and income levels of the regions, reported
in the last two rows of the table. An increase in test scores over time, generally known as the
Flynn effect, has also been documented using the same data by Koivunen (2007) for a longer
time period. However, this effect also reflects differences between cohorts other than those
due to the school system.
The shaded area of the table indicates the students who attended comprehensive school. Since
these students are younger and are concentrated in the regions with below average test scores,
it is obvious that a cross-section comparison of regions or a time-series comparison of
subsequent cohorts would not produce reliable estimates for the effect of the comprehensive
school reform.
[Table 1: MEAN SCORE BY COHORT & REGION]
5. Estimation methods
8 As a robustness check we included the movers and determined the reform year based on the place of residence in the 1975 Census. This made practically no difference for the results.

13
Our goal is to estimate the causal effect of the school regime on the Army test scores. That is,
to determine how an average student, or a student with certain characteristics, would have
fared, had she or he been assigned to the reformed comprehensive system instead of the
previous selective early tracking system. A fixed effects approach is used to control for
regional differences as well as general trends over time. The effect of the comprehensive
school reform is identified because the timing of the reform differs across regions.
Most of the estimates are based on the following regression model:
iitijiitiji CADDy εβδα +++Ψ′+Ω′+= )()()()( (1)
where yi is the army test score of individual i, attending school in region j and belonging to
cohort t. Dj and Dt are region and cohort specific dummies and𝐴𝑖 is the age at test. Cj(i)t(i) is an
indicator, varying across cohorts and regions, that pupil i attended comprehensive school.
The parameter of interest in (1) is β. The identifying assumption is that the comprehensive
school indicator, Cj(i)t(i), is uncorrelated with the error term conditional on the other regressors.
This assumption, and the fact that Dj and Dt enter (1) additively, reflects the basic differences-
in-differences assumptions. Note, in particular, that we make no assumptions regarding the
similarity of the regions where the reform took place early to those where reform took place
later, nor do we claim that reform dates were randomly assigned. The parameter β is an
unbiased estimate of the average causal effect of comprehensive schooling, if the timing of
the reform is uncorrelated with other region-specific changes in student outcomes.
It is important to notice that regression (1) controls for the regional differences with six
implementation region dummies but not for the full set of more than five hundred municipal
fixed effects. The main reason is that we have no access to municipality codes due to data
protection regulations. However, the only reason to include municipality dummies in
regression (1) would be the concern that the reform took place earlier in non-randomly
selected municipalities. But this is only a problem if the reform dummy is correlated with the
municipality fixed effects. This correlation is fully absorbed by introducing the six
implementation region fixed effects, since within these regions the implementation year does
not vary across municipalities.
The fact that we only have 5 (cohorts) x 6 (regions) = 30 observations for identification
purposes obviously has implications for statistical inference. We deal with this by clustering

14
the standard errors at region level using the Moulton-procedure programmed for Stata by
Angrist and Pischke (2009). Following Cameron, Miller, and Gelbach (2007), we also make a
small sample correction for the standard errors by magnifying the residuals by )1/( −GG ,
where G is the number of regions, and use critical values from a t-distribution with G-2
degrees of freedom. 9 To facilitate the interpretation of the statistical significance of the
results, we report the 95% confidence intervals of our regression coefficients in the tables.
In addition to the mean effects of the reform, we also estimate (1) by interacting Cj(i)t(i) with
parental education and income. These results are informative in evaluating whether the reform
was particularly successful in improving the cognitive skills of students from disadvantaged
family backgrounds relative to other students.
Furthermore, we also evaluate the effect of the reform on the variance of the test scores. A
straightforward approach for examining this is to model simultaneously the effect of the
reform on both the mean and the variance of the test scores. Assuming that the error term
follows a normal distribution, the test scores will be distributed as
( )
++Ψ+Ω+−− 2
)()(
2j(i)t(i))()(
2)()(
)C(21exp
2
1~itij
iitiji
itiji
ADDyy
σ
βδα
πσ(2)
The subscripts in 2jtσ indicate that the variance in the test scores may vary across regions and
cohorts and may therefore be affected by the reform. The model is parameterized by assuming
that log-variance is an additive function of the region, cohort and reform dummies.
9We were also concerned that serial correlation within regions could lead to a bias in the standard errors. However, calculating mean residuals by region and cohort from equation 1 and regressing these mean residuals on the lagged residuals indicates that the first order autocorrelations of the residuals in different test items are between -.09 and .11. These estimates are consistent with the null of no autocorrelation according to an autocorrelation test suggested by Wooldridge (2002), who suggests regressing the first differenced residuals on their lagged values and testing whether the resulting coefficient is equal to -.5. As a final check we also estimated the standard errors using the block bootstrap and wild bootstrap procedures that, according to Cameron et al. (2007), perform well even with a small number of clusters. In both cases we bootstrap the t-statistic, imposing the null of zero effect. In general, the width of the confidence intervals does not vary much across the different cluster correction procedures, nor are the standard errors very different from the OLS standard errors once cohort and region fixed effects are included in the model. We report these estimates in the working paper version of our paper available at XXX. The main conclusion from these experiments is that, given the lack of significant autocorrelation in the data, even the OLS estimates of standard errors are reasonably accurate. . This is consistent with the Monte Carlo experiments in Bertrand et al. (2004).

15
)exp(2jttjjt CDD γασ +Φ+Γ+= (3)
The log-likelihood function of the normal – heteroskedastic model is
( )
( )( )∑
∑
=
=
++Φ+Γ+
−−Ψ−Ω−−−
++Φ+Γ+−−=
N
i itijiitij
itijiitiji
N
iitijiitij
CADDCADDy
CADDNL
1 )()()()(
2)()()()(
1)()()()(
exp21
21)2ln(
2ln
γφαβδα
γφαπ
(4)
where β measures the effect of the reform on the mean score and γ its effect on the variance.
6. Results
6.1 Average effects
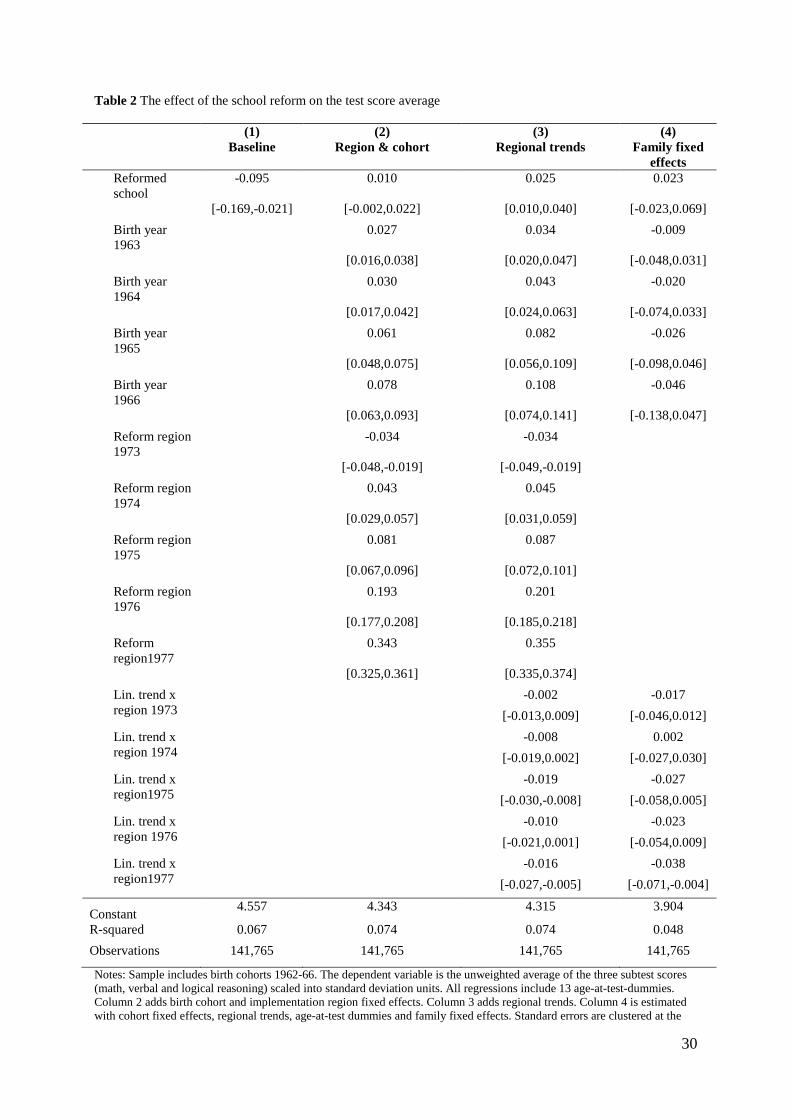
The baseline results are reported in Table 2. To facilitate the quantitative interpretation of the
results, the test scores are converted into standard deviation units. Column (1) simply
regresses the average test score on the comprehensive school dummy, and shows that those
who attended comprehensive school scored on average 0.09 standard deviations lower in the
Army test. However, the results in column (2) reveal that this negative correlation reflects the
fact that regions with on-average lower test scores implemented the reform first. When full
sets of birth cohort and region dummies are included in the regression, this negative
correlation is removed and we fail to find any effect of comprehensive school on average test
scores.
The causal interpretation of the result in column (2) of table 2 relies on the standard
difference-in-differences assumption that the changes in test scores in the reform regions
would have been similar to the changes in the control regions in the absence of the reform.
Given that the panel spans several periods, this assumption can be relaxed somewhat by
adding region-specific linear trends in test scores as we do in column (3). The effect of the
reform is now positive and marginally significant but very small at 0.02 standard deviation
units.

16
Column (4) adds family fixed effects to the equation, thus identifying the effect of the reform
from the differences between brothers that attended different school systems. The estimates
become imprecise but are still very close to those reported in column (3). Interestingly, adding
family fixed effects also reverses the positive trend in the test scores, indicating that the birth
order effect on the test scores is larger than the difference across the birth cohorts.10
[Table 2: BASIC RESULTS]
Table 3 examines the effect of the school reform on different tests in turn. Column (1)
regresses each test score separately on the region and cohort dummies and a dummy variable
indicating whether the person attended a comprehensive school. Column (2) again adds
separate region-specific linear trends and column (3) controls for the family fixed effects. For
brevity, only the coefficients of the comprehensive school dummy are reported in each
column. The comprehensive school reform had no significant effects on either math or logical
reasoning tests. The effect on the verbal ability test is positive. The size of the effect on verbal
test scores ranges between 0.02 and 0.04 standard deviation units. Family fixed effect
estimates tend to be much less precise than the estimates that exploit between-family
variation, and are therefore never significantly different from zero or significantly different
from the point estimates reported in columns (1) and (2).
The finding that the comprehensive school reform had its largest effects on the verbal test was
perhaps to be expected. After all, verbal skills are learned in schools, and hence the changes
in school system may have effects on these skills. If indeed the logical reasoning test truly
measures innate reasoning abilities, pre-test schooling should have little or no effect on the
test. Finally, the changes in the mathematics teaching resulting from the reform were perhaps
not as significant. As noted above, the ability grouping was retained in mathematics and, as a
result, math classes continued to be taught at three different ability levels after the reform.
[Table 3: EFFECTS ON DIFFERENT TEST ITEMS]
Table 4 reports the maximum-likelihood estimates measuring the effects of the reform on
both the mean and the log-variance of the test scores. These equations are estimated
separately for each test. All equations include cohort and region effects, regional trends and
age-at-test dummies on both the mean and the variance, but only the effects of the
10 The birth order effect was also found in a Norwegian study of the Army test scores (Kristenssen and Bjerkdal, 2007).

17
comprehensive school reform are reported. The maximum-likelihood method produces very
similar estimates for the effect of the reform on the mean scores as the linear regression model
used in tables 2 and 3. The effects on means are significant only for the verbal test and for the
average score. The effects on the variance of the test scores are small but generally negative.
In the math test the effect is close to zero. In the verbal and logical reasoning test the reform
reduced the variance about 2.5 percent. None of these effects, however, are statistically
significant.
[Table 4: EFFECTS ON MEAN AND VARIANCE]
As shown in tables 2 and 3, the estimated effect of the reform on test scores is somewhat
sensitive to the inclusion of region-specific linear trends. This raises a concern that the
standard differences-in-differences specification may fail to separate out pre-existing trends
from dynamic policy responses, as pointed out by Wolfers (2006) in a different context. To
explore this possibility, we re-estimated equation (1) by adding dummies for years two and
three prior to the reform and separate dummies for each of the five years after the reform, thus
omitting the dummy for one year prior to the reform. This flexible specification should trace
out any pre-reform trends and dynamic policy responses following the reform. The results are
reported in table 5 and a visual representation of the results for the average test scores is
plotted in figure 4. There is little indication of any pre-reform trends. However, especially the
verbal test scores, and to a lesser extent the average test scores, increase significantly in the
first year after the reform and stay at a higher level or even grow in the years following the
reform. These results suggest that the pattern found in tables 2 and 3 does not reflect pre-
existing trends but rather stems from the true reform effect.
[Table 5: The effect of the school reform allowing for leads and lags]
[Figure 4: LEADS AND LAGS]
6.2 Effects by parental background
Tables 6A and 6B examine the effect of the comprehensive school reform on average test
scores by family background. Column (1) in table 6A estimates regression models similar to
those reported in column (1) of table 3 but adds an indicator of parents’ education and its
interaction with the reform dummy. Parents are classified as being highly educated if at least

18
one parent has completed at least 12 years of education. In the pre-reform schooling system
this generally refers to a situation where the parent attended the more academic track. In
column (2), we add linear region-specific trends to the regression. Since the interest here is in
the effect of the reform on the test score difference between recruits from high- and low-
education families, we can control for regional trends in a more flexible way in these
regressions. In column (3), we add interactions of birth cohorts and regional dummies thus
controlling also for any non-linear regional trends. After adding these interactions the main
effect of the reform on test scores is no longer identified, but the effect on the test score
difference between recruits from high and low educated families still is. Finally, in column
(4), we further introduce the full interactions of parental education with cohort and
implementation region fixed effects as well as with the test age dummies.
According to table 6A, parental education has a clear effect on test scores. Men with highly
educated parents score 0.27 standard deviations higher, on average. However, the most
remarkable message in table 6A is how robust the effect of the reform is on the test score
difference by parental background. The comprehensive school reform has a negative effect on
the test score difference between recruits from high- and low-education families although the
effect is no longer significant once full interactions are introduced in column (4).
Furthermore, this result is robust to the inclusion of linear or non-linear regional trends. The
results in table 6A imply that the reform increased the test scores of men from low-education
families by 0.03 standard deviation units and had little effect on men from high-education
families. The results is qualitatively similar for individual tests and again the effect is
strongest in the case of verbal test scores where the reform increased the test scores of recruits
from low educated families by 0.06 standard deviation units. This effect is sizeable,
amounting to a quarter of the effect of parental education.
In table 6B we repeat the same analysis now using parents’ income as the family background
variable. The parents’ income is measured by summing the annual taxable income of both
parents, inflating the income to the 2002 price level and taking an average over the census
years 1970, -75 and -80. To facilitate the interpretation of the coefficients, parental earnings
were normalized by subtracting the sample mean. This demeaning has no impact on the
estimate of the interaction of the reform and parental earnings, but it makes it possible to
interpret the main effect of the reform in table 6B as the effect of the reform on sons from
families with sample mean income. The results are qualitatively similar to those using

19
parents’ education. Men with richer parents tend to have higher average scores and the
interaction between the parents’ income and the reform dummy is negative in all models but
column (4) where it is not statistically different from zero.
[Tables 6A and 6B: EFFECTS BY FAMILY BACKGROUND]
6.3 Magnitude of the effects
The results presented above suggest that the comprehensive school reform increased verbal
test scores by approximately 0.04 standard deviation units. This may seem like a small
increase and it is therefore instructive to put our results into perspective by comparing them to
the effect sizes found with other educational reforms. The closest comparisons are the various
studies on the effect of tracking. Duflo et al. (2008) report that tracking students within
schools in Kenya led to an average increase of test scores by 0.14 standard deviation units.
Comparing different countries, Hanushek and Wößmann (2006) find no effect of early school
tracking on mean test scores.
Jacob and Ludwig (2008) survey the effect sizes of various educational policies targeted at
children from low income families in the US. The effects of these policies on test scores vary
from a high of 0.22, related to a large reduction in class size, to effects as low as 0.03 of
policies such as Teach for America. In addition, the policies surveyed by Jacob and Ludwig
(2008) typically target children as young as kindergarten age, where we should expect to see
larger effects. Hence, in the light of these results, the effects of the Finnish comprehensive
school reform are small but not out of line with results from other education policies,
especially given that the effects here are measured on average four years after the completion
of comprehensive school while other studies tend to focus on more immediate outcomes.
Perhaps the most interesting result reported above is the consistent positive effect of the
reform on the test scores of recruits from low-education and low income families. As this
implies a reduction in test score differences along socioeconomic lines, it is informative to
compare the test score results to the earlier estimates of the effect of the comprehensive
school reform on the intergenerational income elasticity.
Pekkarinen et al (2009) found that the Finnish comprehensive school reform decreased the
elasticity of sons’ earnings with respect to their fathers’ earnings by as much as 0.066 log

20
points. In this paper we report that the interaction of the parents’ earnings and the school
reform is -0.036 in a comparable regression equation explaining the standardized test scores
(Table 6B, Column 2). This estimate can be scaled using earlier results on the effect of Army
test scores on earnings. For example, Uusitalo (1999) calculated that a one standard deviation
increase in these test scores implies about a six percent increase in earnings at age 33.
Hanushek and Wößmann (2008) found that a one standard deviation increase in the
International Adult Literacy test score increases earnings by about nine percent in Finland.
Multiplying -0.036 with either of these estimates indicates that the effect of school reform on
test scores only explains less than half a percent of the observed 6.6 percent decline in
intergenerational income elasticity. Even after allowing for generous corrections for
measurement errors in the test scores, it is obvious that the effect of the school reform on
measurable cognitive skills is not sufficient to explain its effect on the earnings distribution.
7. Conclusions
Persistent differences in average test scores across countries and over time have received
plenty of attention in recent years. One often suggested explanation for these differences is
the educational system. In particular, the tracking of pupils into different groups by ability and
aspirations has been considered a potentially important factor. However, both the economic
theory and the available empirical evidence remain inconclusive when it comes to the effects
of tracking regimes on test scores.
Here, we estimate the effect of the comprehensive school reform on the Finnish Army Basic
Skills Test scores. Unlike previous literature that had to rely on cross-country comparisons or
comparisons of regions within countries, here the effect of the comprehensive school reform
on test scores is estimated using a difference-in-differences approach with single-country
data. As such, the current study provides a more serious attempt at identifying the causal
effect of school systems on test outcomes.
On average, the reform had a small positive effect on the average verbal test scores and no
significant positive or negative effect on the average arithmetic or logical reasoning test
scores. Most interestingly, however, for all of these tests, the effect of the reform was positive
and significant in families where the parents had only basic education or low income,
indicating a reduction in cognitive skills differences along socioeconomic lines.

21
We argue that the changes in the distribution of skills are likely to be due to the more
academic curriculum content and the change in peer groups that especially affected the
students from less-advantaged families. As is typical with any evaluation of real-life policy
interventions of this scale, we cannot disentangle the relative importance of these factors.
However, most realistic changes in school tracking policies involve changes in both the
teaching content and peer groups almost by definition. Hence reliable estimates of the overall
causal effect of school tracking policies are highly relevant both in terms of the empirical
study of educational policies as well as the current policy debate on school tracking.
22
References
Aakvik, A., K. G. Salvanes, and K. Vaage, (2010), “Measuring heterogeneity in the returns to
education in Norway using an educational reform”, European Economic Review, 54(4), 483-500.
Angrist, J.D. and J. S. Pischke, (2009), Mostly Harmless Econometrics: An Empiricist's
Companion, Princeton University Press, Princeton and Oxford.
Bertrand, M., E. Duflo, and S. Mullainathan, “How Much Should We Trust Differences-in-
Differences Estimates?” Quarterly Journal of Economics 119 (2004), 249–275.
Black, S., P. Devereux, and K. G. Salvanes, (2010), “The more the smarter? Family size and
IQ”, Journal of Human Resources, 45(1), 33-58.
Brunello, G. and D. Checchi (2007), “Does school tracking affect equality of opportunity?
New international evidence”, Economic Policy, Oct 2007, pp. 781-861.
Cameron, A., D. Miller, and J. B. Gelbach, (2007), “Bootstrapped-based improvements for
inference with clustered errors”, Review of Economics and Statistics, 90 (3), 414-427.
Duflo, E., P. Dupas and M. Kremer (2011), “Peer effects, teacher incentives, and the impact
of tracking: Evidence from a randomized evaluation in Kenya”, The American Economic
Review, 101 (5), 1739-1774..
Finnish Defense Command (2000),“The Finnish Defense Forces, Annual Report 2000” (in
Finnish), Defense Command Public Information Division, Helsinki.
Galindo-Rueda, F. and A. Vignoles (2005), “The heterogeneous effect of selection in
secondary schools: Understanding the changing role of ability,” CEE Discussion Paper 52.
Hanushek, E. and L. Wößmann (2006), “Does educational tracking affect performance and
inequality? Differences-in-differences evidence across countries,” Economic Journal 116, pp.
C63-C76.
Hanushek, E. and L. Wößmann (2008), “The role of cognitive skills in economic
development”, Journal of Economic Literature, 46 (3), 607-668.

23
Jacob, B. and J. Ludwig, (2008), “Improving educational outcomes for poor children”, NBER
Working Paper, 14550.
Kerckhoff, A., K. Fogelman, D. Crook and D. Reeder (1996), “Going Comprehensive in
England and Wales. A Study of Uneven Change”, London: The Woburn Press.
Koivunen, S. (2007), “Suomalaismiesten kognitiivisen kykyprofiilin muutokset 1988-2001.
Flynnin efektiä suomalaisessa aineistossa?”[Changes in cognitive skill profile among Finnish
men. Flynn effect in Finnish data?], Master’s thesis (in Finnish), University of Jyväskylä.
Kristensen P. and T. Bjerkedal (2007), “Explaining the Relation Between Birth Order and
Intelligence”, Science, vol. 316 (5832), p. 1717.
Lazear, E. (2001), “Educational Production”, Quarterly Journal of Economics 116 (3), pp.
777-803.
Lindqvist, E. and R. Vestman(2011), “The labor market returns to cognitive and noncognitive
ability: Evidence from Swedish enlistment”, American Economic Journal: Applied
Economics, 3 (1), 101-128.
Manning, A. and J. Pischke (2006), “Comprehensive versus selective schooling in England in
Wales: What do we know?” NBER Working Paper No. 12176.
Meghir, C. and M. Palme (2005), “Educational reform, ability, and parental background”,
American Economic Review vol. 95 (1), pp. 414-424.
OECD (2003),“Learning for Tomorrow’s World: First Results from PISA 2003”, OECD
Publications, Paris.
Pekkarinen, T., R. Uusitalo and S. Pekkala (2009), “School tracking and intergenerational
income mobility: Evidence from the Finnish comprehensive school reform”, Journal of
Public Economics 93, 965 - 973.
Statistics Finland (1986), “Structure of population and vital statistics”, Official Statistics of
Finland VI A: 150, Central Statistical Office of Finland, Helsinki 1986.
Tiihonen, J., J. Haukka, M. Henriksson, M. Cannon, T. Kieseppä, I. Laaksonen, J. Sinivuo,
and J. Lönnqvist, (2005), “Premorbid intellectual functioning in bipolar disorder and

24
schizophrenia: Results from a cohort study of male conscripts”, American Journal of
Psychiatry vol. 162, pp. 1904-1910.
Uusitalo, R., (1999), “Return to education in Finland”, Labour Economics, 6, 569-580.
Waldinger, F. (2006), “Does tracking affect the importance of family background on students'
test scores?” mimeo, London School of Economics.
Wolfers, J., (2006), “Did unilateral divorce laws raise divorce rates? A reconciliation and new
results”, The American Economic Review,96 (5),1802—1820.
Wooldridge, J. M. 2002. Econometric Analysis of Cross Section and Panel Data. Cambridge,
MA: MIT Press.

25
Figure 1 Finnish school systems before and after the comprehensive school reform
University
University
↑ ↑
18 Upper secondary
school
Upper secondary
school
17 Vocational school Vocational school 16
↑ ↑ ↑ ↑
15 General
secondary school
Comprehensive school
14 Civic school 13
↑ 12 11
↑
10 Primary school
9 8 7
Age
Before reform
After reform

26
Figure 2 The implementation of the comprehensive school reform across regions 1972-1977

27
Figure 3 Distribution of the test scores
040
0080
0012
000
Freq
uenc
y
0 10 20 30 40Math test; mean = 18.8 sd = 8.04
040
0080
0012
000
Freq
uenc
y
0 10 20 30 40Verbal test; mean = 22.5 sd = 7.49
040
0080
0012
000
Freq
uenc
y
0 10 20 30 40Logical reasonig; mean = 23.8 sd = 5.86
040
0080
0012
000
Freq
uenc
y
0 10 20 30 40Average score; mean = 21.7 sd = 6.3

28
Figure 4 The effect of the school reform on the test score average, estimation around the reform date
Notes: The estimates in this graph represent a regression of the average test score on the cohort and implementation region dummies, age-at-test dummies, region-specific trends, as well as separate dummies for the leads (up to 4 years after reform) and lags (up to 3 years before reform) of the reform implementation. The omitted category is “Reform-1”. The plotted points are the estimates on the lead and lag dummies, and 95% confidence intervals are shown around the point estimates. Standard errors are clustered at the implementation region level and the critical values from a t-distribution with 4 degrees of freedom are used for inference.
-.1-.0
50
.05
.1.1
5.2
.25
Effe
ct o
n Te
st S
core
Ave
rage
Ref-3 Ref-2 Ref-1 Reform Ref+1 Ref+2 Ref+3 Ref+4Time Relative to Reform
+ 95% /- 95% Confidence Interval Point Estimate
Leads and LagsThe Effect of School Reform on Test Score Average

29
Table 1 Standardized average test score by comprehensive school reform implementation region and birth cohort Region (Year when reform was implemented) Birth cohort 1972 1973 1974 1975 1976 1977 Total
1962 -0.21 -0.22 -0.16 -0.10 -0.01 0.19 -0.09 [2,634] [3,895] [5,693] [5,468] [5,668] [3,019] [26,377]
1963 -0.10 -0.13 -0.07 -0.02 0.09 0.24 0.00 [2,896] [4,339] [6,346] [6,468] [6,496] [3,694] [30,239]
1964 -0.11 -0.16 -0.06 -0.01 0.06 0.23 -0.01 [2,865] [4,299] [6,238] [6,483] [6,723] [3,977] [30,585]
1965 -0.08 -0.11 -0.06 -0.00 0.11 0.22 0.02 [2,715] [4,036] [5,995] [6,304] [6,290] [3,889] [29,229]
1966 -0.01 -0.04 0.01 0.03 0.14 0.29 0.07 [2,185] [3,314] [5,117] [5,579] [5,550] [3,590] [25,335] Total -0.11 -0.14 -0.07 -0.02 0.08 0.24 0.00 [13,295] [19,883] [29,389] [30,302] [30,727] [18,169] [141,765] Parental education 0.48 0.46 0.50 0.51 0.59 0.69 0.53 Parental income 13,994 13,753 14,391 14,883 15,770 23,393 15,747 Notes: Sources include the Finnish Longitudinal Census data and the Army Basic Skills test data. Comprehensive school reform implementation regions are defined by the year when the reform took place in the region (see Figure 2). The unweighted average of the three subtest scores (math, verbal and logical reasoning) is standardized so that the sample mean is zero and the standard deviation is one. The number of observations in each cell is reported in square brackets, below the mean score. The shaded areas indicate cohorts that were affected by the post-reform educational system. The last two rows of the table report the average parental education and income by implementation region. Parental education is the share of observations where at least one parent has more than compulsory education (i.e. high-school diploma or greater). Parental income is the average annual taxable income of parents from the 1970, -75 and -80 census data inflated to 2002 price level using the consumer price index (CPI) in Euros.
30
Table 2 The effect of the school reform on the test score average
(1) (2) (3) (4) Baseline Region & cohort Regional trends Family fixed
effects Reformed school
-0.095 0.010 0.025 0.023
[-0.169,-0.021] [-0.002,0.022] [0.010,0.040] [-0.023,0.069] Birth year 1963
0.027 0.034 -0.009
[0.016,0.038] [0.020,0.047] [-0.048,0.031] Birth year 1964
0.030 0.043 -0.020
[0.017,0.042] [0.024,0.063] [-0.074,0.033] Birth year 1965
0.061 0.082 -0.026
[0.048,0.075] [0.056,0.109] [-0.098,0.046] Birth year 1966
0.078 0.108 -0.046
[0.063,0.093] [0.074,0.141] [-0.138,0.047] Reform region 1973
-0.034 -0.034
[-0.048,-0.019] [-0.049,-0.019] Reform region 1974
0.043 0.045
[0.029,0.057] [0.031,0.059] Reform region 1975
0.081 0.087
[0.067,0.096] [0.072,0.101] Reform region 1976
0.193 0.201
[0.177,0.208] [0.185,0.218] Reform region1977
0.343 0.355
[0.325,0.361] [0.335,0.374] Lin. trend x region 1973
-0.002 -0.017 [-0.013,0.009] [-0.046,0.012]
Lin. trend x region 1974
-0.008 0.002 [-0.019,0.002] [-0.027,0.030]
Lin. trend x region1975
-0.019 -0.027 [-0.030,-0.008] [-0.058,0.005]
Lin. trend x region 1976
-0.010 -0.023 [-0.021,0.001] [-0.054,0.009]
Lin. trend x region1977
-0.016 -0.038 [-0.027,-0.005] [-0.071,-0.004]
Constant 4.557 4.343 4.315 3.904
R-squared 0.067 0.074 0.074 0.048 Observations 141,765 141,765 141,765 141,765
Notes: Sample includes birth cohorts 1962-66. The dependent variable is the unweighted average of the three subtest scores (math, verbal and logical reasoning) scaled into standard deviation units. All regressions include 13 age-at-test-dummies. Column 2 adds birth cohort and implementation region fixed effects. Column 3 adds regional trends. Column 4 is estimated with cohort fixed effects, regional trends, age-at-test dummies and family fixed effects. Standard errors are clustered at the

31
implementation region level and the critical values from a t-distribution with 4 degrees of freedom are used for inference. As non-standard critical values are used, the 95% confidence intervals are reported in parentheses below the point estimates.

32
Table 3 The effect of the school reform in different tests (1) (2) (3) Region & cohort Regional trends Family fixed effects
Math test 0.002 0.015 0.011 [-0.010,0.014] [-0.000,0.030] [-0.037,0.058]
Verbal test 0.023 0.043 0.030 [0.011,0.036] [0.028,0.058] [-0.018,0.078]
Logical reasoning 0.006 0.011 0.027 [-0.007,0.018] [-0.004,0.026] [-0.025,0.078]
Notes: Sample includes birth cohorts 1962-66, n=141,765. Each cell of the table corresponds to a separate regression. The dependent variable is the unweighted average of the subtest score scaled into standard deviation units. The entries in the table represent the coefficients of a dummy variable indicating that the person attended the reformed comprehensive school. Column 1 includes cohort and implementation region fixed effects, and age-at-test dummies. Column 2 adds regional trends. Column 3 is estimated with cohort dummies, regional trends, age-at-test dummies and family fixed effects. Standard errors are clustered at the implementation region level and the critical values from a t-distribution with 4 degrees of freedom are used for inference. As non-standard critical values are used, the 95% confidence intervals are reported in parentheses below the point estimates.

33
Table 4 The effect of the school reform on the mean and the variance of the test scores (1) (2) (3) (4) Math
test Verbal
test Logical
reasoning test Average score in
all 3 tests
OLS estimates
Effect on the mean 0.015 0.043 0.011 0.025
[-0.000,0.030] [0.028,0.058] [-0.004,0.026] [0.010,0.040]
ML estimates
Effect on the mean 0.015 0.042 0.013 0.025
[-0.000,0.030] [0.027,0.057] [-0.002,0.028] [0.010,0.040]
Effect on the log -0.007 -0.025 -0.025 -0.024
Variance [-0.029,0.016] [-0.047,-0.003] [-0.047,-0.003] [-0.046,-0.002]
Notes: Sample includes birth cohorts 1962-66, n=141,765. The entries in the table represent the coefficients of a dummy variable indicating that the person attended the reformed comprehensive school. Each regression model includes cohort and implementation region fixed effects, regional trends, and age-at-test dummies. Standard errors are clustered at the implementation region level and the critical values from a t-distribution with 4 degrees of freedom are used for inference. As non-standard critical values are used, the 95% confidence intervals are reported in parentheses below the point estimates

34
Table 5 The effect of the school reform in different tests allowing for leads and lags
(1) Math test
(2) Verbal
test
(3) Logical reasoning
test
(4) Average score in
all 3 tests Reform - 3 years -0.003 -0.032 -0.034 -0.023
[-0.024,0.019] [-0.053,-0.010] [-0.056,-0.012] [-0.045,-0.002] Reform - 2 years 0.006 0.005 -0.001 0.005
[-0.008,0.021] [-0.010,0.020] [-0.016,0.014] [-0.010,0.020] Reform 0.016 0.055 0.020 0.032
[-0.001,0.032] [0.038,0.071] [0.004,0.037] [0.016,0.049] Reform + 1 year 0.012 0.054 0.044 0.038
[-0.012,0.035] [0.030,0.077] [0.020,0.068] [0.014,0.061] Reform + 2 years 0.003 0.070 0.045 0.040
[-0.029,0.035] [0.038,0.103] [0.012,0.077] [0.008,0.073] Reform + 3 years 0.024 0.098 0.083 0.071
[-0.018,0.065] [0.056,0.140] [0.040,0.125] [0.029,0.113] Reform + 4 years 0.050 0.143 0.082 0.099
[-0.005,0.104] [0.088,0.197] [0.027,0.137] [0.045,0.153] Constant 3.120 2.856 4.579 4.305
Observations 141,814 142,049 142,084 141,765 Notes: Sample includes birth cohorts 1962-66. Each column corresponds to a separate regression. Rows report the estimated coefficients of dummies for 3 and 2 years prior to the reform as well as for the immediate effect of the reform and 1, 2, 3, and 4 years after the reform. Each regression includes cohort and implementation region fixed effects, and age-at-test dummies. Standard errors are clustered at the implementation region level and the critical values from a t-distribution with 4 degrees of freedom are used for inference. As non-standard critical values are used, the 95% confidence intervals are reported in parentheses below the point estimates

35
Table 6A Effect of the school reform on average test score by parents’ education (1)
Cohort and region dummies
(2) Region specific linear trends
(3) Cohort x region
interactions
(4) Full interactions
with parental education
High educated parents
0.275 0.275 0.276 0.187
[0.263,0.288] [0.262,0.287] [0.263,0.289] [0.124,0.251]
Reform 0.031 0.047 [0.016,0.046] [0.029,0.064]
Reform × -0.035 -0.035 -0.036 -0.031 high educated parents
[-0.051,-0.020] [-0.050,-0.019] [-0.052,-0.021] [-0.057,-0.005]
Constant 2.270 2.237 2.920 2.962 Observations 126,977 126,977 126,977 126,977 R-squared 0.092 0.092 0.092 0.092 Table 6B Effect of the school reform on average test score by parents’ income (1)
Cohort and region dummies
(2) Region specific linear trends
(3) Cohort x region
interactions
(4) Full interactions
with parental income
Parents’ income 0.325 0.324 0.327 0.246 [0.313,0.337] [0.312,0.336] [0.315,0.339] [0.185,0.308]
Reform 0.014 0.029 [0.001,0.027] [0.014,0.045]
Reform × -0.034 -0.033 -0.036 0.002 parents’ income [-0.048,-0.019] [-0.047,-0.018] [-0.051,-0.021] [-0.023,0.027]
Constant 4.283 4.256 3.075 3.080 Observations 126,891 126,891
126,891 126,891 R-squared 0.101 0.101 0.102 0.102 Notes: Sample includes birth cohorts 1962-66. Each column corresponds to a separate regression. The dependent variable is the unweighted average of the three subtest scores (math, verbal and logical reasoning) scaled into standard deviation units. Parents’ education is a dummy variable indicating that at least one parent had a degree higher than compulsory education. Parents’ income is the log of average annual taxable income of parents from the 1970, -75 and -80 census data inflated to the 2002 price level using the consumer price index (CPI). Deviation from the mean log parents’ income is used so the reform effect can be interpreted at the mean income level. Column 1 includes cohort and implementation region fixed effects, and age-at-test dummies. Column 2 adds linear regional trends. Column 3 adds dummies for the interactions between birth cohort and implementation region. Column 4further adds the interactions of parental education (or income) with 1) birth cohort dummies, 2) implementation region dummies and 3) age-at-test dummies. Standard errors are clustered at the implementation region level and the critical values from a t-distribution with 4 degrees of freedom are used for inference. As non-standard critical values are used, the 95% confidence intervals are reported in parentheses below the point estimates.
Related Documents

