School Passports Making the Stimulus Pay Off for Students and State Budgets January 2011 Brian Gottlob NATIONAL RESEARCH The Foundation for Educational Choice WWW.EDCHOICE.ORG

School Passports: Making the Stimulus Pay Off for Students and State Budgets
Mar 28, 2016
A proposal to better use federal "stimulus" funds to create lasting budget relief and educational reform in the states.
Welcome message from author
This document is posted to help you gain knowledge. Please leave a comment to let me know what you think about it! Share it to your friends and learn new things together.
Transcript
School PassportsMaking the Stimulus Pay Off for Students and State Budgets
January 2011
Brian Gottlob
national research The Foundation for Educational Choice
www.edchoice.org
About the Foundation for Educational ChoiceThe Foundation for Educational Choice is a 501(c)(3) nonprofit and nonpartisan organization,
solely dedicated to advancing Milton and Rose Friedman’s vision of school choice for all children.
First established as the Milton and Rose D. Friedman Foundation in 1996, the foundation contin-
ues to promote school choice as the most effective and equitable way to improve the quality of K-12
education in America. The foundation is dedicated to research, education, and outreach on the vital
issues and implications related to choice and competition in K-12 education.
Commitment to Methods & Transparency The Foundation for Educational Choice is committed to research that adheres to high scientific
standards, and matters of methodology and transparency are taken seriously at all levels of our organi-
zation. We are dedicated to providing high-quality information in a transparent and efficient manner.
All individuals have opinions, and many organizations (like our own) have specific missions or
philosophical orientations. Scientific methods, if used correctly and followed closely in well-designed
studies, should neutralize these opinions and orientations. Research rules and methods minimize
bias. We believe rigorous procedural rules of science prevent a researcher’s motives, and an organiza-
tion’s particular orientation, from pre-determining results.
If research adheres to proper scientific and methodological standards, its findings can be relied
upon no matter who has conducted it. If rules and methods are neither specified nor followed, then
the biases of the researcher or an organization may become relevant, because a lack of rigor opens the
door for those biases to affect the results.
Our authors take full responsibility for research design, data collection, analysis, content and
charts, and any unintentional errors or misrepresentations. They welcome any and all questions
related to methods and findings.
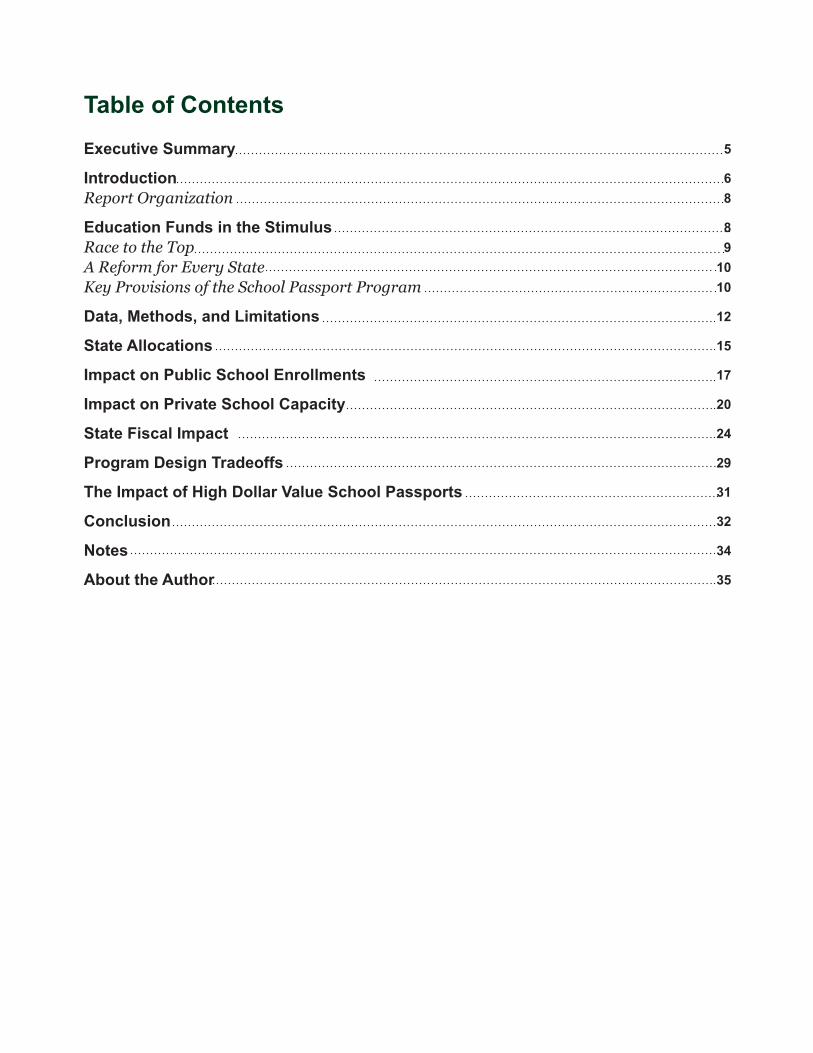
Table of ContentsExecutive Summary
IntroductionReport Organization
Education Funds in the StimulusRace to the TopA Reform for Every StateKey Provisions of the School Passport Program
Data, Methods, and Limitations
State Allocations
Impact on Public School Enrollments
Impact on Private School Capacity
State Fiscal Impact
Program Design Tradeoffs
The Impact of High Dollar Value School Passports
Conclusion
Notes
About the Author
5
68
89
1010
12
15
17
20
24
29
31
32
34
35
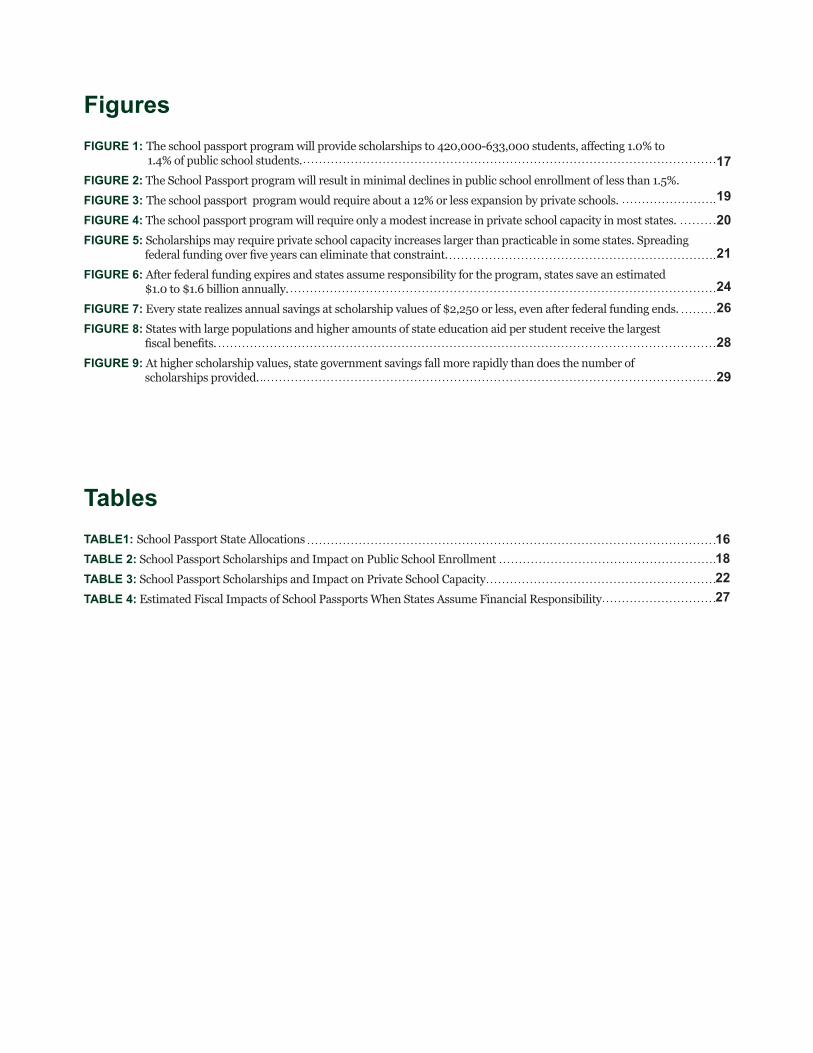
FiguresFIGurE 1: The school passport program will provide scholarships to 420,000-633,000 students, affecting 1.0% to 1.4% of public school students.
FIGurE 2: The School Passport program will result in minimal declines in public school enrollment of less than 1.5%.
FIGurE 3: The school passport program would require about a 12% or less expansion by private schools.
FIGurE 4: The school passport program will require only a modest increase in private school capacity in most states.
FIGurE 5: Scholarships may require private school capacity increases larger than practicable in some states. Spreading federal funding over five years can eliminate that constraint.
FIGurE 6: After federal funding expires and states assume responsibility for the program, states save an estimated $1.0 to $1.6 billion annually.
FIGurE 7: Every state realizes annual savings at scholarship values of $2,250 or less, even after federal funding ends.
FIGurE 8: States with large populations and higher amounts of state education aid per student receive the largest fiscal benefits.
FIGurE 9: At higher scholarship values, state government savings fall more rapidly than does the number of scholarships provided.
TablesTABLE1: School Passport State Allocations
TABLE 2: School Passport Scholarships and Impact on Public School Enrollment
TABLE 3: School Passport Scholarships and Impact on Private School Capacity
TABLE 4: Estimated Fiscal Impacts of School Passports When States Assume Financial Responsibility
17
19
20
21
2426
28
29
16182227
School Passports: Making the Stimulus Pay Off for Students and State Budgets 5
Executive Summary The Obama Administration is currently using more than $4 billion in federal stimulus funds in a con-
troversial program called Race to The Top in an attempt to improve student achievement in public schools
throughout the country. However, this study analyzes a different approach to spending stimulus funds from
the American Recovery and Reinvestment Act -- creation of a $4 billion tuition scholarship or education
voucher program to enable public school students in 50 states to attend private schools of their choice. The
purpose of this analysis is to generate, and then evaluate in comparison to other reforms, a competition-based
education reform, while providing states with lasting fiscal benefits that continue beyond the life of stimulus
funds. The study examines the impact the proposed tuition scholarship program would have on current pub-
lic and private school enrollments in each state, and calculates the annual fiscal impact on states after stimulus
funding is removed and states assume financial responsibility for the program. Finally, the discussion high-
lights some of the design features and key variables states could use to maximize fiscal benefits and achieve a
variety of different educational and equity objectives.
Key findings:
Unlike some reforms funded by the Race to the Top program, the financial rewards for states inherent in •
the School Passport program provide an incentive for states to continue the program long after federal
funds for the program cease.
A $4 billion School Passport tuition scholarship program, funded with remaining stimulus funds, would •
provide between 420,000 and 630,000 annual tuition scholarships and produce savings for states long
after stimulus funding ends.
In return for an initial, one-time federal investment of $4 billion, a School Passport program with scholar-•
ship values of between $2,000 and $2,250 would generate annual savings for states of $1 billion to $1.6
billion once states assume financial responsibility for the program.
The School Passport program will create a competition-based education reform program of a large •
enough scale to be evaluated against other reforms funded by the Race to the Top.
If School Passport scholarship values are set at $2,250 or below, every state in the nation will realize •
annual fiscal savings from the program once states assume financial responsibility for the program, but
some states can set scholarship values significantly higher and still realize savings.
A few key design features (e.g. the value of scholarships and the number of years over which federal •
funding for the program is spread) can be modified in each state to accommodate capacity constraints in
private schools and to generate different levels of desired savings.
School Passports: Making the Stimulus Pay Off for Students and State Budgets 6
IntroductionAfter more than a year of a dramatically weakening U.S. economy that threatened double-digit unem-
ployment rates and prompted unprecedented state budget gaps across the country, the American Recovery
and Reinvestment Act (ARRA), the federal government’s $797 billion stimulus legislation, was signed into
law February 2009. ARRA, most often identified with public infrastructure projects like roads and bridges,
also included nearly $80 billion to preserve public sector education jobs and programs and to boost re-
forms of primary and secondary education.
The ARRA’s education components were lauded by proponents of the stimulus for their potential to
spur education reform efforts throughout the country. However, the incorporation of substantive education
reform in the design of the stimulus education funding programs was limited.1 Only about $5 billion of the
funding for K-12 education is allocated for education reform efforts, and a majority of states appear un-
likely to receive any funding for reforms under the competition-based grants programs that allocate reform
funds. The desire to distribute and spend stimulus funds as rapidly as possible, along with states’ record
budget shortfalls, resulted in stimulus funding for K-12 education that had less to do with reform than it did
with maintaining K-12 education’s prominence as the first or second largest expenditure item in state bud-
gets. Although there is variation among states, total state spending on K-12 education and Medicaid each
represent more than 20 percent of state government expenditures.2 In all but a few rural states, Medicaid
and K-12 education received the largest share of stimulus funding provided to states.3
The similarities between the state of education finance and health care policy run deeper than their
importance to state budgets. Both health care and public education are increasingly seen as a category of
super services. Many argue they are fundamental rights, access to which should not vary with income. Calls
for equal educational access and quality have resulted in lawsuits challenging school funding systems in 45
states since the 1970s, prompting changes in education finance laws requiring large infusions of state aid to
local school districts in at least 27 states.4 In most states then, education reform has become synonymous
with changing state education finance systems and increasing funding to reduce spending disparities. But
when remedies for inequality of educational opportunity are not made directly available to affected parties
(parents and children), we should not be surprised that the results of these “reforms” have been so disap-
pointing. With the largest portion of stimulus education funding effectively functioning as a “bail out” of
School Passports: Making the Stimulus Pay Off for Students and State Budgets 7
state education finance systems and school districts, many who saw the stimulus as a historic opportunity
to generate educational reforms are now expressing disappointment.5 But even for those more interested
in the state budget relief provided by the stimulus than in spurring education reforms must admit that the
stimulus provides only temporary relief to states from the fiscal strains of education funding.
The $5 billion of stimulus funding in the form of competitive grants for education reform initiatives
(the Race to the Top and Investing in Innovation grant programs) may yet produce reforms in states that
have competed successfully for the funds. But with so much stimulus money distributed for education,
the vast majority of it directed at maintaining the status quo, and with ongoing efforts to extend additional
fiscal relief to state governments, it is appropriate to ask whether real education reform and enduring fiscal
relief for states could both be made a higher priority, more broadly available, and purchased at a much low-
er price than with the funding approach taken in the ARRA. As importantly, with more than $10 billion, or
about 30 percent, of ARRA’s basic education aid to states “obligated” to be spent but yet to be distributed,
there may yet be an opportunity to use existing ARRA funds to spur reform and create lasting fiscal benefits
for states.6
This paper proposes an alternative plan for use of remaining stimulus funds—school choice. This pro-
posal employs tuition scholarships, or vouchers, that can be used by parents to purchase educational servic-
es at private schools. The proposed School Passport program has similarities to existing tax-credit scholar-
ship and voucher programs in many states. The popularity and documented success of these programs
warrant an expansion of their size and scope as an educational reform strategy. The proposal outlined here
would ensure that reforms are funded in all states while creating an opportunity to evaluate market-based
educational reforms, in comparison to the more varied reform strategies currently proposed and funded by
the Race to the Top and Investing in Innovation grant programs.
Despite efforts to use ARRA as an inducement for education reform, stimulus funding that maintains
the status quo in education is by far the largest portion of funding allocated to states, and the only portion
guaranteed to every state. The School Passport program differs from that approach by directly integrating
the reform and fiscal relief objectives of the stimulus’education funds to all states.
School Passports: Making the Stimulus Pay Off for Students and State Budgets 8
Report Organization
This report first provides a brief overview of the stimulus funding currently provided to states and out-
lines the School Passport initiative as an alternative use of stimulus funds for promoting educational reform
in every state. In the next section, it describes the data and methods used to estimate the fiscal impacts of
the School Passport program, and some limitations of the estimates. It then presents calculations of the size
and impact of the School Passport program in each state and nationwide, and analyzes the program’s effect
on public and private school enrollments in each state. Finally, the report estimates the fiscal impact of the
program for each state and discusses some of the key program design features that can be modified to help
states achieve different educational objectives and ensure maximum fiscal benefits in every state.
Education Funds in the Stimulus
By far the largest portion of ARRA funding for K-12 education is distributed through three programs:
the newly created State Fiscal Stabilization Fund (SFSF), the existing Individuals with Disabilities Educa-
tion Act (IDEA), and Title I programs.
At approximately $48 billion, the SFSF represents the largest share of K-12 funding in the stimulus.
Although allocated through the Department of Education, 18.2 percent of SFSF funding for states is desig-
nated as General Government Services Grants, which can be used for non-education related purposes, leav-
ing only about $39 billion of SFSF allocated to states for use in maintaining or enhancing existing levels of
state education funding. Another $26 billion of stimulus funding was allocated for support of IDEA, Title I,
and a number of smaller initiatives.
Finally, ARRA provides $4.35 billion in non-formula-driven, competitive Race to the Top (RttT) funds,
$650 million in Investing in Innovation (I3) grants to increase the scale of existing successful programs in
individual states, and three smaller programs totaling $550 million.7
School Passports: Making the Stimulus Pay Off for Students and State Budgets 9
Race to the Top
The $4.35 billion in RttT funds are being awarded through a competitive process instead of for-
mula, and are not explicitly designed to fill budget holes or protect jobs. States that successfully apply for
the grants must demonstrate their commitment to advancing education reforms in the use of the State
Fiscal Stabilization Funds, and outline viable reform strategies in key areas such as teacher quality, data,
standards, and assessments. In addition, they must document significant support from school districts and
teachers unions in implementing the reforms outlined in their grant applications. Finally, the 12 states that
will receive grants are expected to use the funds to transform school performance, a significant criterion for
school reform initiatives that most often influence at the margins of school performance if at all.
Proponents argued that the stimulus primary purpose was to stabilize and stimulate the economy,
provide fiscal relief to state governments, and save or create jobs. Thus ARRA’s primary education fund-
ing objective of maintaining public education jobs appears to be largely inconsistent with the use of ARRA
funding for education reform. Saving education jobs required funds to be allocated quickly to counter
the impact of an economy in recession. This meant funneling the majority of the stimulus K–12 funding
through existing, formula-driven programs to avoid the lengthy process of drafting new programs, guide-
lines, and regulations. But because of the magnitude of K-12 education spending, the inability or unwilling-
ness of most state and local governments to slow escalating education expenditures, and the severity of the
recent recession, stimulus funds have not completely filled existing education budget gaps. The temporary
nature of ARRA’s fiscal assistance provided an opportunity to reconsider and alter long-standing policies
and practices that have contributed to stagnant performance, rising expenditures, and a growing national
awareness of the need for education reform.
Whatever reform intentions ARRA supporters may have had in mind, it is hard to see how holding
states and local districts harmless for past practices does not ultimately make future reforms more difficult.
As Chester E. Finn Jr. and Frederick M. Hess have noted, budget shortfalls should have forced difficult
decisions about programs, policies, and staffing patterns.8
School Passports: Making the Stimulus Pay Off for Students and State Budgets 10
A Reform for Every State
With RttT reform grants, a small number of states receive a small portion of stimulus money for a lim-
ited amount of time, making the prospects for widespread and lasting reforms with ARRA funds limited.
The outlook worsens because RttT reform initiatives require states to increase education appropriations
after RttT funds expire. A better approach is to fund a demonstrably valuable reform in every state that
provides a built-in fiscal incentive to continue operating the program after ARRA funds expire.
Proponents of school choice via universal vouchers and tax-credit scholarships argue that these policies
are an effective school reform strategy. High-quality empirical research on voucher programs has consis-
tently found positive results both for program participants and for school districts affected by competition.9
Increasingly, proponents also have made the case that school choice is a viable strategy for reducing the
fiscal strain that education places on state and local governments. For example, in 2008, an analysis by the
Office of Program Policy Analysis & Government Accountability of the Florida State Legislature document-
ed the fiscal benefits of that state’s tax-credit scholarship program.10
School choice programs are proving a popular policy for state governments to increase educational
choices and opportunities for a broader segment of students. ARRA’s provisions preclude the use of K-12
education funds for private education, but a new Congress can change that. As a policy that has demonstra-
bly positive impacts on the performance of public schools as well as on state government finances, school
choice programs can achieve the stimulus goal of education reform while providing lasting fiscal relief to
states more effectively than existing ARRA programs.
Key Provisions of the School Passport Program
The purpose of this report is to provide a basic structure for a School Passport policy and to demon-
strate its viability from a fiscal and operational perspective, not to issue detailed program guidelines. As
analyzed in this report, key features of the School Passport program include:
Allocation of $4 billion (approximately equal to RttT funds) from remaining stimulus state fiscal •
stabilization funds for implementation of voucher and tax-credit scholarship programs or expansion
of such existing programs in every state.
School Passports: Making the Stimulus Pay Off for Students and State Budgets 11
School Passport funds would be allocated to states in the same proportion as ARRA’s state fiscal •
stabilization fund.
Five percent of each state’s School Passport funds would be reserved for implementation and evalua-•
tion of its School Passport program.
The remaining 95 percent of School Passport funds would be used for scholarships, with funds •
spread over a period of three to five years at each state’s discretion. This allows the time period for
federal funding of the program in each state to exceed any lags in enrollment changes, ensuring
that states receive one or more years of fiscal savings from reductions in state education aid pay-
ments for each student receiving a School Passport scholarship before assuming financial respon-
sibility for the program.
As federal funding of each state’s School Passport program ends, each state will have one or more years •
of state education aid savings for every student receiving a School Passport scholarship. These savings,
accrued while federal funds paid for state School Passport scholarships, would be used to capitalize
each state’s School Passport fund, which would then fund scholarships during the first year after states
assume fiscal responsibility for the program. In subsequent years, states that wish to guarantee savings
can do so by setting scholarship values so that the cost of each scholarship is less than the amount of
state education aid saved when students use a scholarship to leave public schools.
Any funds not used to award School Passport scholarships would be returned and not available for •
spending on any other state government expenditure.
The School Passport program is consistent with the major goals of ARRA’s education funding pro-
grams. It directly funds a demonstrably viable reform strategy in all 50 states. But unlike temporary infu-
sions of ARRA funds, the School Passport program will produce enduring fiscal benefits for states that
extend beyond the time frame of stimulus funding.
Finally, although the School Passport program may ultimately lead to a decline in employment in the
public schools (although employment in public schools appears to be relatively inelastic with respect to
changes in enrollment), employment in the private sector will increase as the demand for private schooling
leads to increased hiring in that sector. To the extent that new private sector jobs represent a shift of jobs
School Passports: Making the Stimulus Pay Off for Students and State Budgets 12
away from the public sector, the result would confer additional long-term fiscal benefits to state and local
governments as they would lessen the exploding burden of public sector benefit and pension costs.
Regardless of whether the reform strategies funded by RttT or the competition-based strategy of the
School Passport program prove more effective in improving educational performance, only the School
Passport can guarantee lasting fiscal benefits while also increasing educational opportunities for hundreds
of thousands of students across the country. A legitimate concern of the reforms funded by RttT funds is
whether they will continue after temporary stimulus funding is removed. In contrast, by creating a source
of self-funding that can guarantee fiscal benefits to states, the School Passport program provides a strong
incentive for states to continue the program after federal funding is removed.
The School Passport scholarship program would affect only about 1 percent of public school students
in any state. However, in most states, the program would be large enough to allow for evaluation of com-
petition-based reforms on educational performance across a broad spectrum of geographies, with varied
socioeconomic and demographic characteristics. The restrictive size of existing school choice programs,
which limits differences in demographic and socioeconomic characteristics, can hinder the ability to gen-
eralize the positive research findings of competition-based school reforms. Creating a comparison between
competition-based reforms and the reforms advocated and advanced by public educators and schools will
motivate both camps to maximize the benefits of their reform strategies. Thus the School Passport program
may indirectly strengthen the reform efforts in RttT applications and awards.
Data, Methods, and Limitations
This analysis of the proposed School Passport program uses data on public school revenues, expendi-
tures, and enrollments for each state from the Common Core of Data of the U.S. Department of Education’s
National Center for Education Statistics, as well as stimulus funding data from the U.S. Department of
Education and estimates of private school enrollment for each state from the U.S. Census Bureau’s Ameri-
can Community Survey.
We determine the number of scholarships that can be awarded in each state based on the 95 percent of
School Passport funding allocations being used for scholarships. We estimate fiscal impacts of the program
School Passports: Making the Stimulus Pay Off for Students and State Budgets 13
in each state for a range of scholarship values ranging from $1,500 to $4,000. To account for the
fact that states often have a lag between changes in enrollment and resulting adjustments in state
education aid (the potential amount states would save in state education aid for each public school
student who receives a scholarship), or have hold harmless provisions that protect districts for one
or more years after enrollment declines, we allocate scholarship funds over both three-year and
four-year periods. This allocation accomplishes two important objectives:
It ensures that once states assume responsibility for the program, they will no longer be paying •
state education aid for students who receive scholarships.11
It allows for a modest expansion of private school enrollments that can be readily accommodat-•
ed in most states. States can opt for a longer or shorter period for distribution of School Passport
funds depending on the ability of private education providers to increase capacity. A shorter pe-
riod, such as three years, will increase the number of scholarships provided in each year, result-
ing in a larger increase in demand for private schooling than if funding (and scholarships) were
allocated over a four-year, or longer, period.
The number of annual scholarships awarded to public school students is divided by public
school enrollments in grades 1-12 to estimate the impact of the School Passport program on public
school enrollment in each state.
The number of annual scholarship awards is divided by estimates of the population of private
school students in grades 1-12 obtained from the American Community Survey to calculate the per-
centage expansion in private school enrollments necessary to accommodate School Passport schol-
arship students in each state.
Our estimate of the fiscal impact of the program on each state is the difference between 70
percent of the cost of state education aid per student and the per student cost of School Passport
scholarships times the number of students receiving scholarships. Explanation for the 70 percent
threshold is explained later in this report (see page 14).
Calculating the fiscal impacts of the School Passport program in all 50 states precludes accom-
modation of the unique aspects of every state’s school finance system. Accordingly, we adopt some
School Passports: Making the Stimulus Pay Off for Students and State Budgets 14
simplifying assumptions in our analysis that introduce a measure of error into the estimates of individual
state fiscal impacts. Allowing some discretion by states in the design of a few key program elements such as
scholarship value, time period for allocation of federal funding, and others that are generalized to all states
for purposes of this analysis, can ensure that potential program benefits are maximized in each state.
Readers should judge for themselves, but care was taken to avoid simplifying assumptions that
would overstate the benefits or minimize the costs related to the School Passport program. For ex-
ample, in estimating annual savings to each state associated with the School Passport program, it is
necessary to calculate how much state education expenditure will be avoided for every student who
receives a scholarship and leaves public schools. The most recent annual financial data available
from the National Center for Education Statistics is for the 2007-2008 school year. To obtain the
per student state aid values needed for the 2015 school year (the first year federal School Passport
funds would cease and most states would assume responsibly for the program), we inflated 2007-
2008 school year state aid values by 12 percent, or less than 2 percent annually.
In addition, using the total state aid per student for each state would overstate savings because
not all of state education aid is directly affected by changes in enrollment. Our analysis assumes
that 70 percent of state aid is determined by enrollment. Every state is different, but in our exami-
nation of 10 state finance systems, the lowest percentage of state aid determined by enrollment was
72.6 percent, and the highest was 90.3. In combination, these two assumptions (2 percent annual
increases in state education aid per student, and 70 percent of per student aid determined on the
basis of enrollment) produce conservative estimates of the state education savings that states would
realize for every student participating in the School Passport program.
One additional caveat. Because the latest Common Core of Data finance data available are from
the 2007-2008 school year, any major changes in state school finance policies that have occurred
since then will not be captured in our analysis. Every assumption used in this analysis introduces
some error into the calculations of individual state impacts, and unique aspects of each state’s edu-
cation finance laws may produce estimates different from the ones produced here. Our purpose is to
demonstrate the viability of the School Passport program and to provide reasonable projections of
state impacts, not to make a precise calculation for each state. Each state is encouraged to conduct
School Passports: Making the Stimulus Pay Off for Students and State Budgets 15
its own analysis to guide program implementation and maximize benefits.
State Allocations
We analyze a School Passport program that allocates $4 billion to states in the same proportions as the
awards for the State Fiscal Stabilization funds. A $4 billion amount was chosen because it approximates
the size of the current Race to the Top funding and because in most states this amount results in a program
scale that will produce enough competitive effects to allow for meaningful assessment and evaluation of
program impacts. In addition, $4 billion across all 50 states results in a manageable expansion of private
school capacity (if spread over a three- or four-year period); at the same time it produces modest overall
declines in public school enrollment in the range of 1 percent to 1.4 percent.
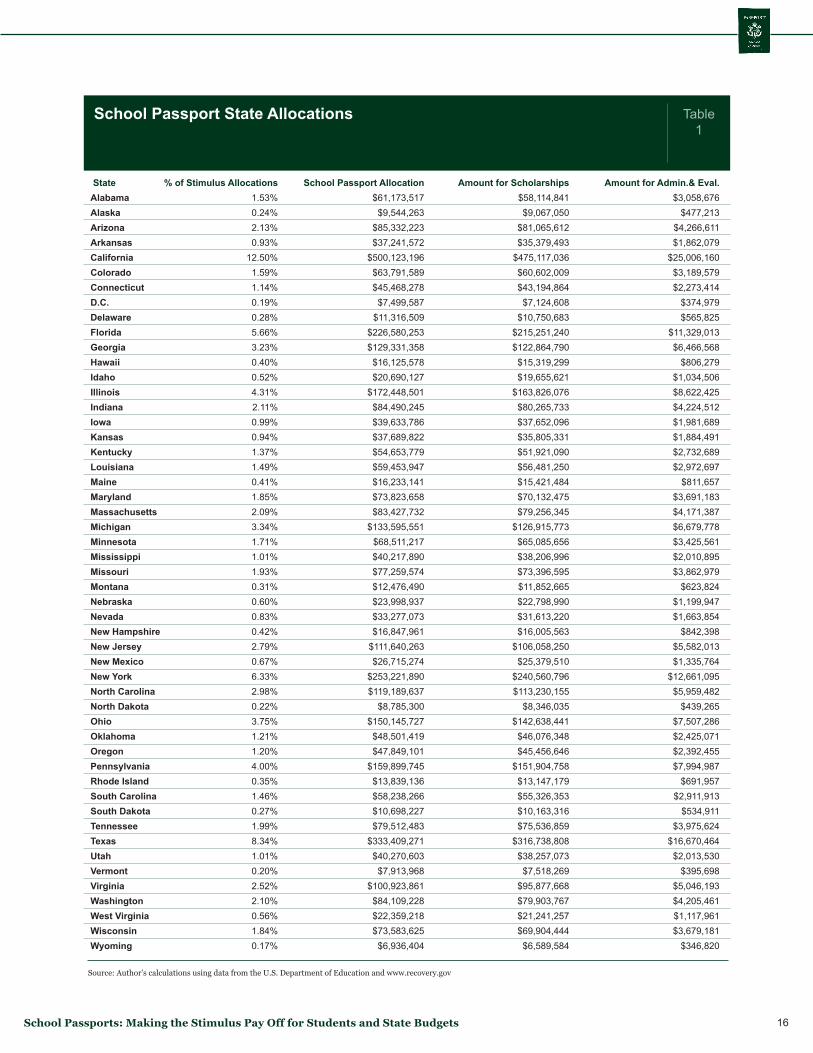
Table 1 presents individual state allocations for a $4 billion School Passport program that allocates 95
percent of funds for tuition scholarships and 5 percent for program administration and evaluation. Each
state would be allowed to choose the allocation period for federal funds, spreading scholarship funds over
a period of three to five years. Depending on how long it takes for changes in enrollment to be reflected in
state aid calculations, states would need to choose a period for allocating federal funds that guarantees sav-
ings to the state for each student receiving a School Passport scholarship. In addition, private schools would
have differing capacity for expansion in each state. A state choosing a shorter period for allocating federal
funds would increase the number of scholarships awarded in each year, requiring greater expansion of
private school capacity and potentially realizing greater state education aid savings. Spreading allocations
over more years reduces the number of annual scholarships but requires more modest expansion of private
school capacity.
In the sections that follow we document School Passport impacts on public and private school enroll-
ments and on state finances.
School Passports: Making the Stimulus Pay Off for Students and State Budgets 16
School Passport State Allocations
Source: Author’s calculations using data from the U.S. Department of Education and www.recovery.gov
Table 1
StateAlabamaAlaskaArizonaArkansasCaliforniaColoradoConnecticutD.C.DelawareFloridaGeorgiaHawaiiIdahoIllinoisIndianaIowaKansasKentuckyLouisianaMaineMarylandMassachusettsMichiganMinnesotaMississippiMissouriMontanaNebraskaNevadaNew HampshireNew JerseyNew MexicoNew YorkNorth CarolinaNorth DakotaOhioOklahomaOregonPennsylvaniarhode IslandSouth CarolinaSouth DakotaTennesseeTexasutahVermontVirginiaWashingtonWest VirginiaWisconsinWyoming
% of Stimulus Allocations1.53%0.24%2.13%0.93%
12.50%1.59%1.14%0.19%0.28%5.66%3.23%0.40%0.52%4.31%2.11%0.99%0.94%1.37%1.49%0.41%1.85%2.09%3.34%1.71%1.01%1.93%0.31%0.60%0.83%0.42%2.79%0.67%6.33%2.98%0.22%3.75%1.21%1.20%4.00%0.35%1.46%0.27%1.99%8.34%1.01%0.20%2.52%2.10%0.56%1.84%0.17%
School Passport Allocation$61,173,517
$9,544,263$85,332,223$37,241,572
$500,123,196$63,791,589$45,468,278
$7,499,587$11,316,509
$226,580,253$129,331,358
$16,125,578$20,690,127
$172,448,501$84,490,245$39,633,786$37,689,822$54,653,779$59,453,947$16,233,141$73,823,658$83,427,732
$133,595,551$68,511,217$40,217,890$77,259,574$12,476,490$23,998,937$33,277,073$16,847,961
$111,640,263$26,715,274
$253,221,890$119,189,637
$8,785,300$150,145,727
$48,501,419$47,849,101
$159,899,745$13,839,136$58,238,266$10,698,227$79,512,483
$333,409,271$40,270,603
$7,913,968$100,923,861
$84,109,228$22,359,218$73,583,625
$6,936,404
Amount for Scholarships$58,114,841$9,067,050
$81,065,612$35,379,493
$475,117,036$60,602,009$43,194,864
$7,124,608$10,750,683
$215,251,240$122,864,790
$15,319,299$19,655,621
$163,826,076$80,265,733$37,652,096$35,805,331$51,921,090$56,481,250$15,421,484$70,132,475$79,256,345
$126,915,773$65,085,656$38,206,996$73,396,595$11,852,665$22,798,990$31,613,220$16,005,563
$106,058,250$25,379,510
$240,560,796$113,230,155
$8,346,035$142,638,441
$46,076,348$45,456,646
$151,904,758$13,147,179$55,326,353$10,163,316$75,536,859
$316,738,808$38,257,073
$7,518,269$95,877,668$79,903,767$21,241,257$69,904,444
$6,589,584
Amount for Admin.& Eval.$3,058,676
$477,213$4,266,611$1,862,079
$25,006,160$3,189,579$2,273,414
$374,979$565,825
$11,329,013$6,466,568
$806,279$1,034,506$8,622,425$4,224,512$1,981,689$1,884,491$2,732,689$2,972,697
$811,657$3,691,183$4,171,387$6,679,778$3,425,561$2,010,895$3,862,979
$623,824$1,199,947$1,663,854
$842,398$5,582,013$1,335,764
$12,661,095$5,959,482
$439,265$7,507,286$2,425,071$2,392,455$7,994,987
$691,957$2,911,913
$534,911$3,975,624
$16,670,464$2,013,530
$395,698$5,046,193$4,205,461$1,117,961$3,679,181
$346,820
School Passports: Making the Stimulus Pay Off for Students and State Budgets 17
Impact on Public School Enrollments
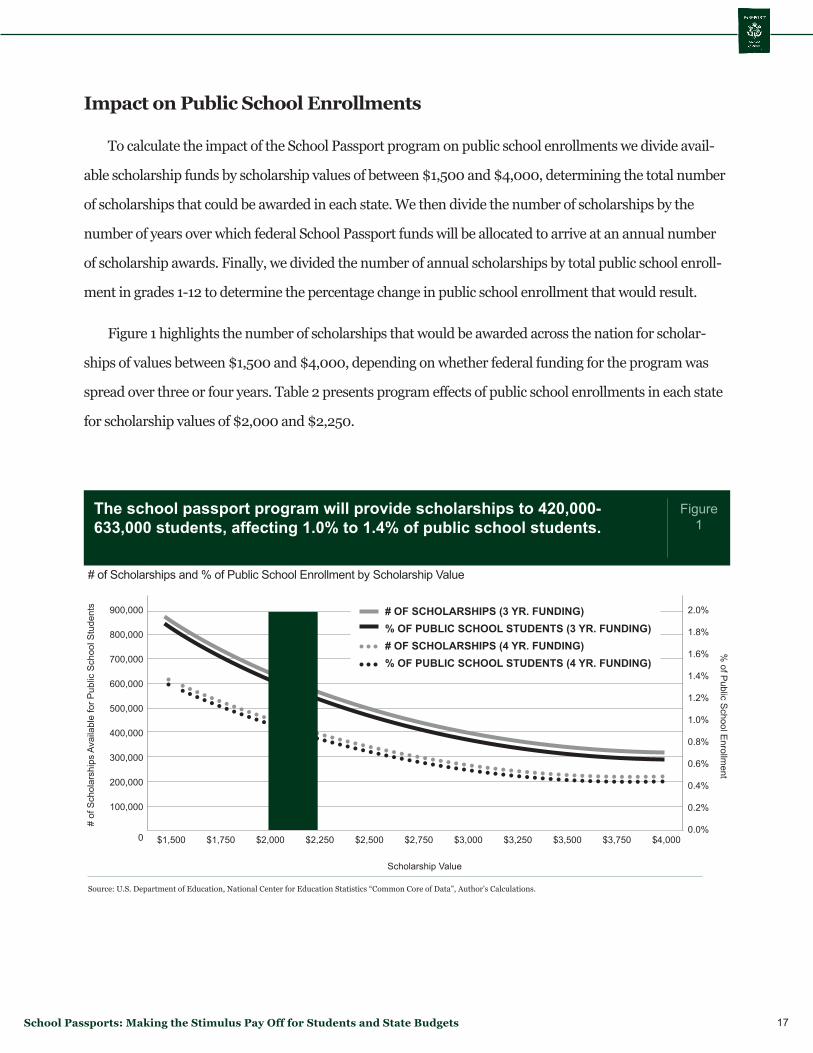
To calculate the impact of the School Passport program on public school enrollments we divide avail-
able scholarship funds by scholarship values of between $1,500 and $4,000, determining the total number
of scholarships that could be awarded in each state. We then divide the number of scholarships by the
number of years over which federal School Passport funds will be allocated to arrive at an annual number
of scholarship awards. Finally, we divided the number of annual scholarships by total public school enroll-
ment in grades 1-12 to determine the percentage change in public school enrollment that would result.
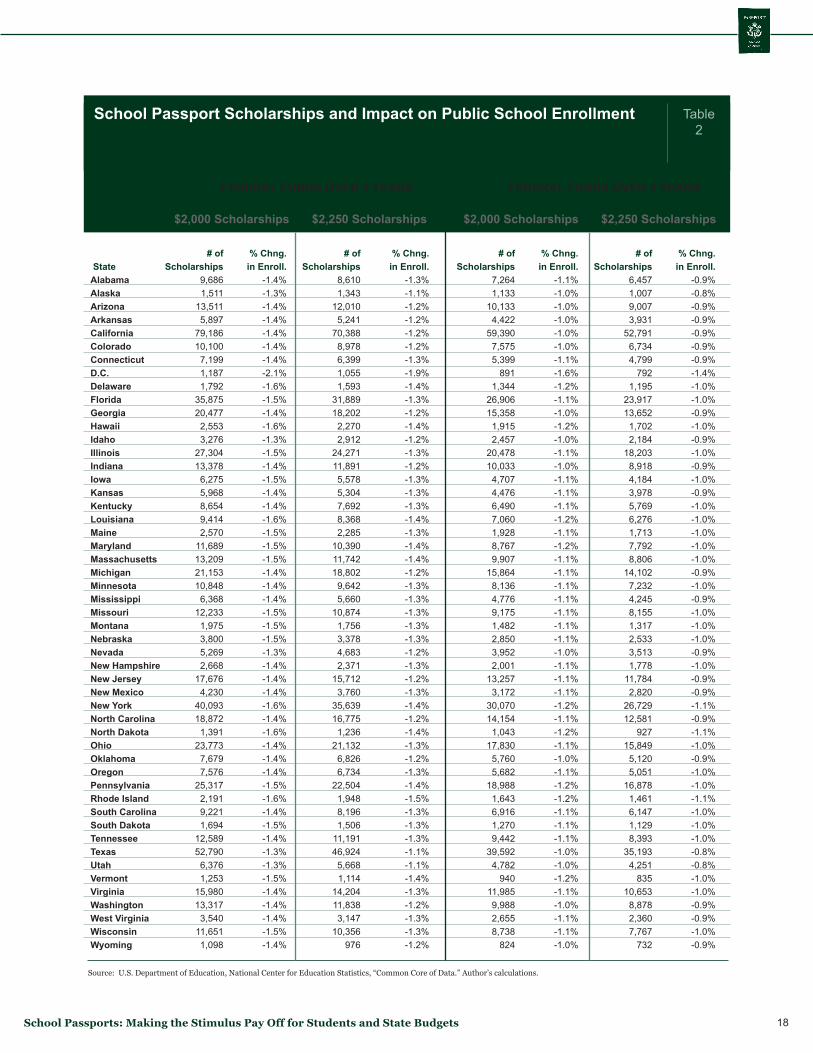
Figure 1 highlights the number of scholarships that would be awarded across the nation for scholar-
ships of values between $1,500 and $4,000, depending on whether federal funding for the program was
spread over three or four years. Table 2 presents program effects of public school enrollments in each state
for scholarship values of $2,000 and $2,250.
The school passport program will provide scholarships to 420,000-633,000 students, affecting 1.0% to 1.4% of public school students.
# of Scholarships and % of Public School Enrollment by Scholarship Value
Source: U.S. Department of Education, National Center for Education Statistics “Common Core of Data”, Author’s Calculations.
Figure 1
0
900,000
800,000
700,000
600,000
500,000
400,000
300,000
200,000
100,000
2.0%
1.8%
1.6%
1.4%
1.2%
1.0%
0.8%
0.6%
0.4%
0.2%
0.0%
Scholarship Value
# of
Sch
olar
ship
s Av
aila
ble
for P
ublic
Sch
ool S
tude
nts
% of P
ublic School E
nrollment
$1,500 $1,750 $2,000 $3,000 $4,000$2,250 $3,250$2,500 $3,500$2,750 $3,750
# OF SCHOLArSHIPS (3 Yr. FuNDING)% OF PuBLIC SCHOOL STuDENTS (3 Yr. FuNDING)# OF SCHOLArSHIPS (4 Yr. FuNDING)% OF PuBLIC SCHOOL STuDENTS (4 Yr. FuNDING)
School Passports: Making the Stimulus Pay Off for Students and State Budgets 18
School Passport Scholarships and Impact on Public School Enrollment
Source: U.S. Department of Education, National Center for Education Statistics, “Common Core of Data.” Author’s calculations.
Table 2
StateAlabamaAlaskaArizonaArkansasCaliforniaColoradoConnecticutD.C.DelawareFloridaGeorgiaHawaiiIdahoIllinoisIndianaIowaKansasKentuckyLouisianaMaineMarylandMassachusettsMichiganMinnesotaMississippiMissouriMontanaNebraskaNevadaNew HampshireNew JerseyNew MexicoNew YorkNorth CarolinaNorth DakotaOhioOklahomaOregonPennsylvaniarhode IslandSouth CarolinaSouth DakotaTennesseeTexasutahVermontVirginiaWashingtonWest VirginiaWisconsinWyoming
# of Scholarships
9,6861,511
13,5115,897
79,18610,100
7,1991,1871,792
35,87520,477
2,5533,276
27,30413,378
6,2755,9688,6549,4142,570
11,68913,20921,15310,848
6,36812,233
1,9753,8005,2692,668
17,6764,230
40,09318,872
1,39123,773
7,6797,576
25,3172,1919,2211,694
12,58952,790
6,3761,253
15,98013,317
3,54011,6511,098
% Chng.in Enroll.
-1.3%-1.1%-1.2%-1.2%-1.2%-1.2%-1.3%-1.9%-1.4%-1.3%-1.2%-1.4%-1.2%-1.3%-1.2%-1.3%-1.3%-1.3%-1.4%-1.3%-1.4%-1.4%-1.2%-1.3%-1.3%-1.3%-1.3%-1.3%-1.2%-1.3%-1.2%-1.3%-1.4%-1.2%-1.4%-1.3%-1.2%-1.3%-1.4%-1.5%-1.3%-1.3%-1.3%-1.1%-1.1%-1.4%-1.3%-1.2%-1.3%-1.3%-1.2%
% Chng.in Enroll.
-1.1%-1.0%-1.0%-1.0%-1.0%-1.0%-1.1%-1.6%-1.2%-1.1%-1.0%-1.2%-1.0%-1.1%-1.0%-1.1%-1.1%-1.1%-1.2%-1.1%-1.2%-1.1%-1.1%-1.1%-1.1%-1.1%-1.1%-1.1%-1.0%-1.1%-1.1%-1.1%-1.2%-1.1%-1.2%-1.1%-1.0%-1.1%-1.2%-1.2%-1.1%-1.1%-1.1%-1.0%-1.0%-1.2%-1.1%-1.0%-1.1%-1.1%-1.0%
# of Scholarships
8,6101,343
12,0105,241
70,3888,9786,3991,0551,593
31,88918,202
2,2702,912
24,27111,8915,5785,3047,6928,3682,285
10,39011,74218,802
9,6425,660
10,8741,7563,3784,6832,371
15,7123,760
35,63916,775
1,23621,132
6,8266,734
22,5041,9488,1961,506
11,19146,924
5,6681,114
14,20411,8383,147
10,356976
% Chng.in Enroll.
-1.4%-1.3%-1.4%-1.4%-1.4%-1.4%-1.4%-2.1%-1.6%-1.5%-1.4%-1.6%-1.3%-1.5%-1.4%-1.5%-1.4%-1.4%-1.6%-1.5%-1.5%-1.5%-1.4%-1.4%-1.4%-1.5%-1.5%-1.5%-1.3%-1.4%-1.4%-1.4%-1.6%-1.4%-1.6%-1.4%-1.4%-1.4%-1.5%-1.6%-1.4%-1.5%-1.4%-1.3%-1.3%-1.5%-1.4%-1.4%-1.4%-1.5%-1.4%
# of Scholarships
6,4571,0079,0073,931
52,7916,7344,799
7921,195
23,91713,652
1,7022,184
18,2038,9184,1843,9785,7696,2761,7137,7928,806
14,1027,2324,2458,1551,3172,5333,5131,778
11,7842,820
26,72912,581
92715,849
5,1205,051
16,8781,4616,1471,1298,393
35,1934,251
83510,653
8,8782,3607,767
732
% Chng.in Enroll.
-0.9%-0.8%-0.9%-0.9%-0.9%-0.9%-0.9%-1.4%-1.0%-1.0%-0.9%-1.0%-0.9%-1.0%-0.9%-1.0%-0.9%-1.0%-1.0%-1.0%-1.0%-1.0%-0.9%-1.0%-0.9%-1.0%-1.0%-1.0%-0.9%-1.0%-0.9%-0.9%-1.1%-0.9%-1.1%-1.0%-0.9%-1.0%-1.0%-1.1%-1.0%-1.0%-1.0%-0.8%-0.8%-1.0%-1.0%-0.9%-0.9%-1.0%-0.9%
# of Scholarships
7,2641,133
10,1334,422
59,3907,5755,399
8911,344
26,90615,358
1,9152,457
20,47810,033
4,7074,4766,4907,0601,9288,7679,907
15,8648,1364,7769,1751,4822,8503,9522,001
13,2573,172
30,07014,154
1,04317,830
5,7605,682
18,9881,6436,9161,2709,442
39,5924,782
94011,9859,9882,6558,738
824
FEDErAL FuNDS OVEr 3 YEArS FEDErAL FuNDS OVEr 4 YEArS
$2,000 Scholarships $2,000 Scholarships$2,250 Scholarships $2,250 Scholarships
School Passports: Making the Stimulus Pay Off for Students and State Budgets 19
As Figure 1 shows, depending on the value of scholarships offered and whether federal funding
is spread over three or four years, the School Passport program would provide between 238,000 and
844,000 scholarships and reduce public school enrollments by between 0.5 percent and 1.9 percent. At
scholarships values of $2,000 to $2,250, between 422,000 and 633,000 scholarships would be awarded
resulting in enrollment declines of between 0.95 percent and 1.4 percent.
The percentage decline in enrollment differs slightly in each state for any set of program variables
(scholarship values, etc). States would be allowed to set scholarship values to maximize benefits or ac-
commodate other objectives, so variations would occur, and it is unlikely all states would choose the same
scholarship values and time period for their allocation. Thus there likely would be greater variation in
enrollment changes in response to the School Passport program than is estimated here.
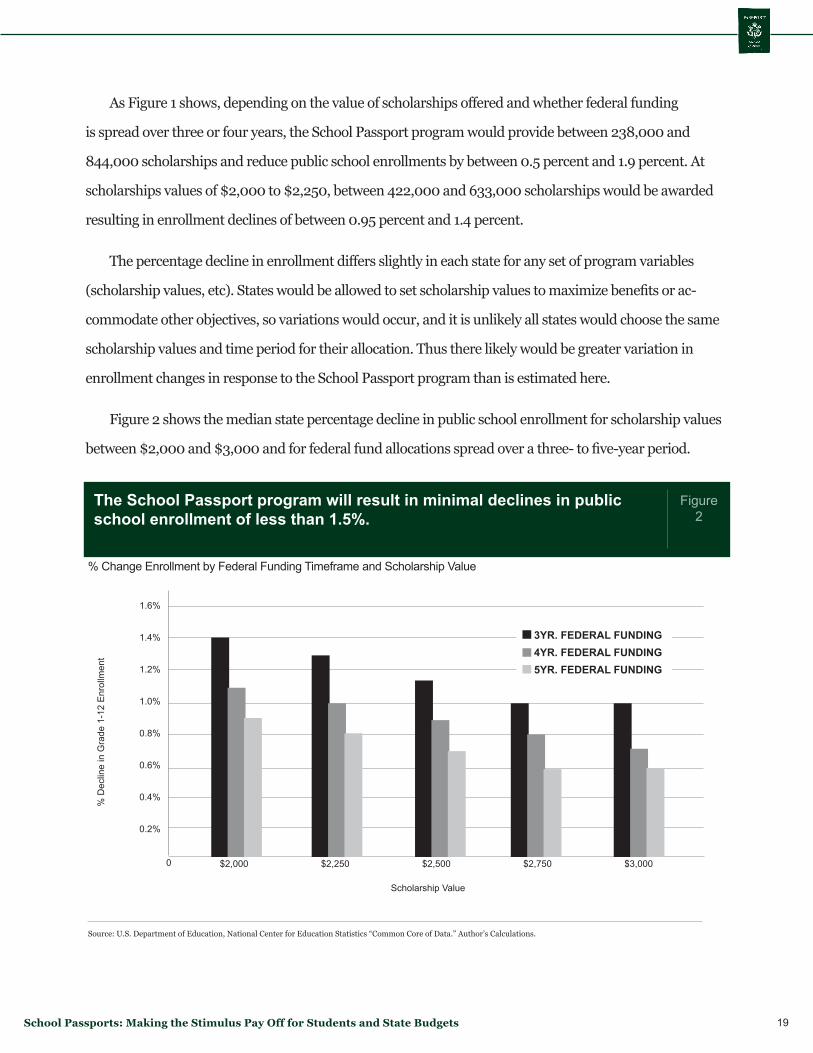
Figure 2 shows the median state percentage decline in public school enrollment for scholarship values
between $2,000 and $3,000 and for federal fund allocations spread over a three- to five-year period.
The School Passport program will result in minimal declines in public school enrollment of less than 1.5%.
% Change Enrollment by Federal Funding Timeframe and Scholarship Value
Source: U.S. Department of Education, National Center for Education Statistics “Common Core of Data.” Author’s Calculations.
0
1.6%
1.4%
1.2%
1.0%
0.8%
0.6%
0.4%
0.2%
Figure 2
$2,000 $2,250 $2,500 $2,750 $3,000
% D
eclin
e in
Gra
de 1
-12
Enr
ollm
ent
Scholarship Value
3Yr. FEDErAL FuNDING4Yr. FEDErAL FuNDING5Yr. FEDErAL FuNDING
School Passports: Making the Stimulus Pay Off for Students and State Budgets 20
Although the total impact on state enrollments is minimal, it must be noted that the impact on some
individual school districts could be substantially greater. This is both necessary and desirable to ensure the
program introduces true competitive forces in some districts.
Impact on Private School Capacity
The impact of the proposed School Passport program on public school enrollments would be minimal as
a percentage of the total public school population, but impacts on some individual districts would be more
substantial. One frequent criticism introduced in state debates over school choice proposals is that even if
such programs were desirable, private school capacity would be insufficient to accommodate participating
students. Like many arguments offered in opposition to school choice initiatives, this one lacks a fundamental
understanding of supply responses to increases in demand among organizations outside of government, and
the constraints and incentives facing schools in the private and not-for-profit sectors. Regardless of the legiti-
macy of the concerns over the ability of private schools to accommodate increases in demand and capacity,
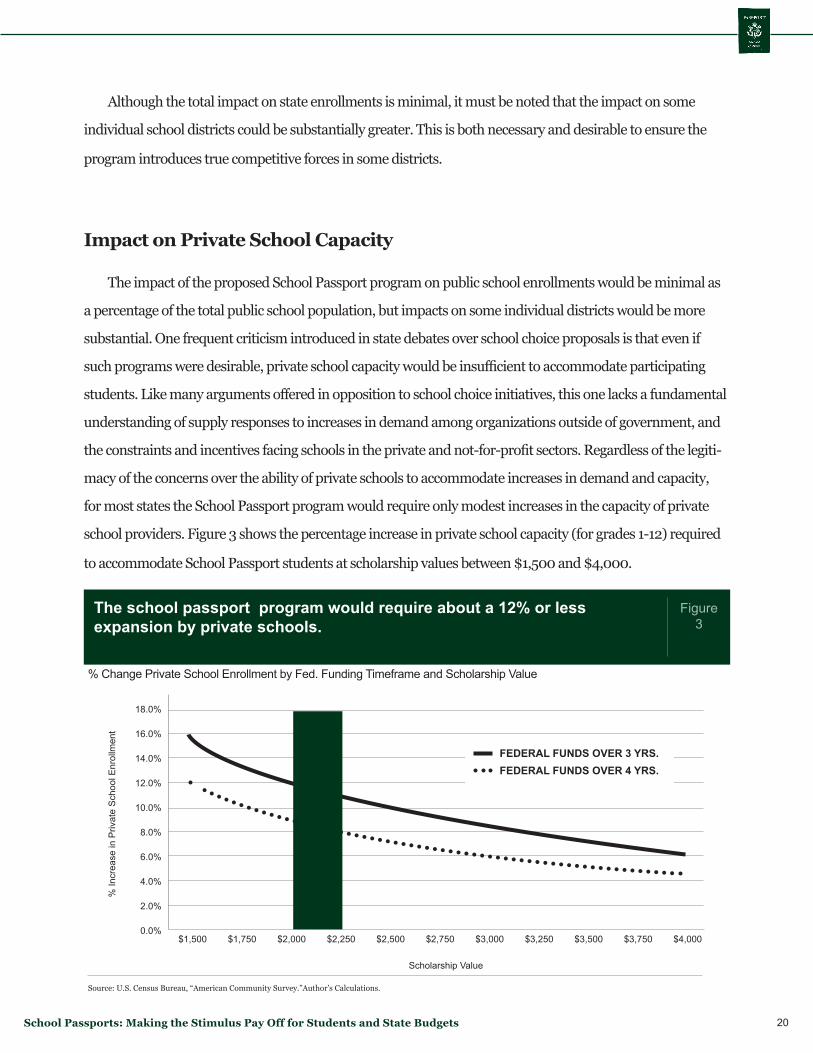
for most states the School Passport program would require only modest increases in the capacity of private
school providers. Figure 3 shows the percentage increase in private school capacity (for grades 1-12) required
to accommodate School Passport students at scholarship values between $1,500 and $4,000.
The school passport program would require about a 12% or less expansion by private schools.
% Change Private School Enrollment by Fed. Funding Timeframe and Scholarship Value
Source: U.S. Census Bureau, “American Community Survey.”Author’s Calculations.
Figure 3
18.0%
16.0%
14.0%
12.0%
10.0%
8.0%
6.0%
4.0%
2.0%
0.0%
Scholarship Value
% In
crea
se in
Priv
ate
Sch
ool E
nrol
lmen
t
$1,500 $1,750 $2,000 $3,000 $4,000$2,250 $3,250$2,500 $3,500$2,750 $3,750
FEDErAL FuNDS OVEr 3 YrS.FEDErAL FuNDS OVEr 4 YrS.
School Passports: Making the Stimulus Pay Off for Students and State Budgets 21
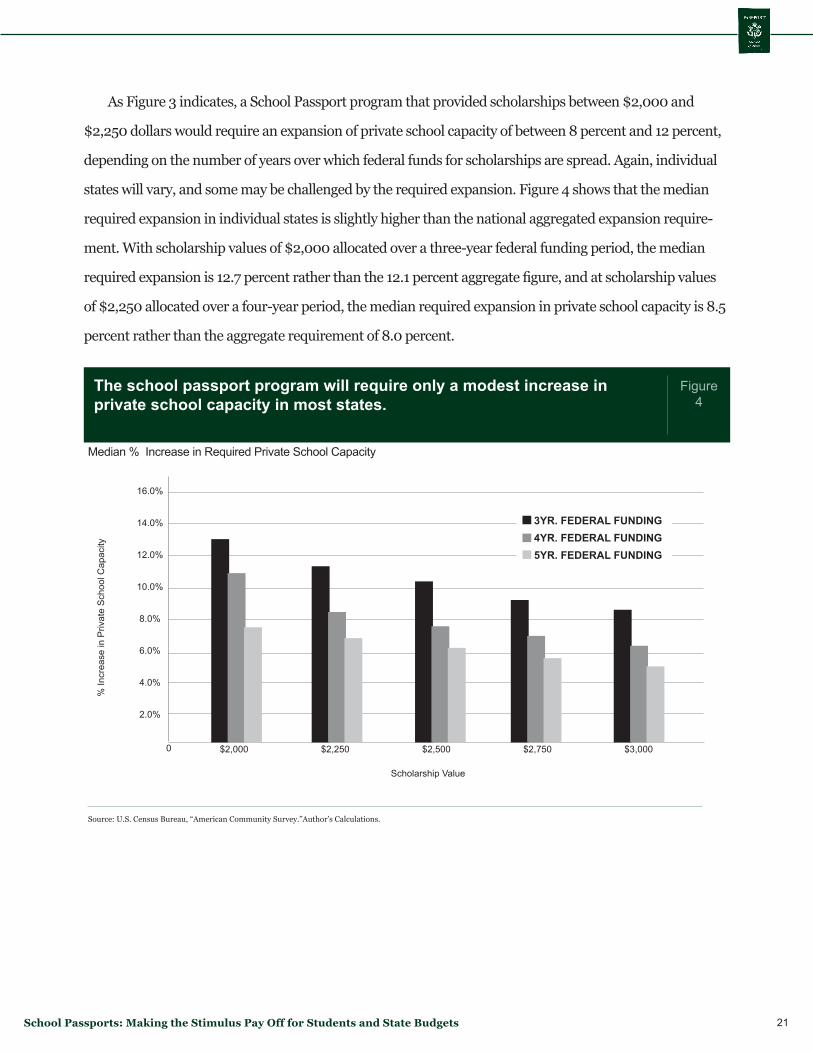
As Figure 3 indicates, a School Passport program that provided scholarships between $2,000 and
$2,250 dollars would require an expansion of private school capacity of between 8 percent and 12 percent,
depending on the number of years over which federal funds for scholarships are spread. Again, individual
states will vary, and some may be challenged by the required expansion. Figure 4 shows that the median
required expansion in individual states is slightly higher than the national aggregated expansion require-
ment. With scholarship values of $2,000 allocated over a three-year federal funding period, the median
required expansion is 12.7 percent rather than the 12.1 percent aggregate figure, and at scholarship values
of $2,250 allocated over a four-year period, the median required expansion in private school capacity is 8.5
percent rather than the aggregate requirement of 8.0 percent.
The school passport program will require only a modest increase in private school capacity in most states.
Median % Increase in Required Private School Capacity
Source: U.S. Census Bureau, “American Community Survey.”Author’s Calculations.
0
16.0%
14.0%
12.0%
10.0%
8.0%
6.0%
4.0%
2.0%
Figure 4
$2,000 $2,250 $2,500 $2,750 $3,000
% In
crea
se in
Priv
ate
Sch
ool C
apac
ity
Scholarship Value
3Yr. FEDErAL FuNDING4Yr. FEDErAL FuNDING5Yr. FEDErAL FuNDING
School Passports: Making the Stimulus Pay Off for Students and State Budgets 22
School Passport Scholarships and Impact on Private School Capacity
Source: U.S. Census Bureau, “American Community Survey” 3 year Average 2006-2008, Authors calculations
Table 3
StateAlabamaAlaskaArizonaArkansasCaliforniaColoradoConnecticutD.C.DelawareFloridaGeorgiaHawaiiIdahoIllinoisIndianaIowaKansasKentuckyLouisianaMaineMarylandMassachusettsMichiganMinnesotaMississippiMissouriMontanaNebraskaNevadaNew HampshireNew JerseyNew MexicoNew YorkNorth CarolinaNorth DakotaOhioOklahomaOregonPennsylvaniarhode IslandSouth CarolinaSouth DakotaTennesseeTexasutahVermontVirginiaWashingtonWest VirginiaWisconsinWyoming
Gr. 1-12Private Enroll.82,8489,11570,15834,955570,05265,62259,39015,07723,356319,896159,90235,37019,982251,421119,22042,77048,20977,337127,06817,167148,907117,400166,45493,72053,231129,67412,18538,40420,24420,250171,40727,925452,132129,3647,284241,71943,41752,963279,02120,48773,46111,203112,913286,06923,7029,015121,68493,16817,937117,3014,835
req. CapacityIncrease $2,250
Scholarships10.4%14.7%17.1%15.0%12.3%13.7%10.8%
7.0%6.8%
10.0%11.4%6.4%
14.6%9.7%
10.0%13.0%11.0%9.9%6.6%
13.3%7.0%
10.0%11.3%10.3%10.6%
8.4%14.4%
8.8%23.1%11.7%9.2%
13.5%7.9%
13.0%17.0%
8.7%15.7%12.7%
8.1%9.5%
11.2%13.4%
9.9%16.4%23.9%12.4%11.7%12.7%17.5%
8.8%20.2%
req. Capacity Increase $2,000
Scholarships11.7%16.6%19.3%16.9%13.9%15.4%12.1%
7.9%7.7%
11.2%12.8%
7.2%16.4%10.9%11.2%14.7%12.4%11.2%7.4%
15.0%7.8%
11.3%12.7%11.6%12.0%
9.4%16.2%
9.9%26.0%13.2%10.3%15.1%
8.9%14.6%19.1%
9.8%17.7%14.3%
9.1%10.7%12.6%15.1%11.1%18.5%26.9%13.9%13.1%14.3%19.7%
9.9%22.7%
req. CapacityIncrease $2,250
Scholarships7.8%
11.1%12.8%11.2%9.3%
10.3%8.1%5.3%5.1%7.5%8.5%4.8%
10.9%7.2%7.5%9.8%8.3%7.5%4.9%
10.0%5.2%7.5%8.5%7.7%8.0%6.3%
10.8%6.6%
17.4%8.8%6.9%
10.1%5.9%9.7%
12.7%6.6%
11.8%9.5%6.0%7.1%8.4%
10.1%7.4%
12.3%17.9%
9.3%8.8%9.5%
13.2%6.6%
15.1%
req. CapacityIncrease $2,000
Scholarships8.8%
12.4%14.4%12.7%10.4%11.5%9.1%5.9%5.8%8.4%9.6%5.4%
12.3%8.1%8.4%
11.0%9.3%8.4%5.6%
11.2%5.9%8.4%9.5%8.7%9.0%7.1%
12.2%7.4%
19.5%9.9%7.7%
11.4%6.7%
10.9%14.3%
7.4%13.3%10.7%
6.8%8.0%9.4%
11.3%8.4%
13.8%20.2%10.4%
9.8%10.7%14.8%
7.4%17.0%
FEDErAL FuNDS OVEr 3 YEArS FEDErAL FuNDS OVEr 4 YEArS
School Passports: Making the Stimulus Pay Off for Students and State Budgets 23
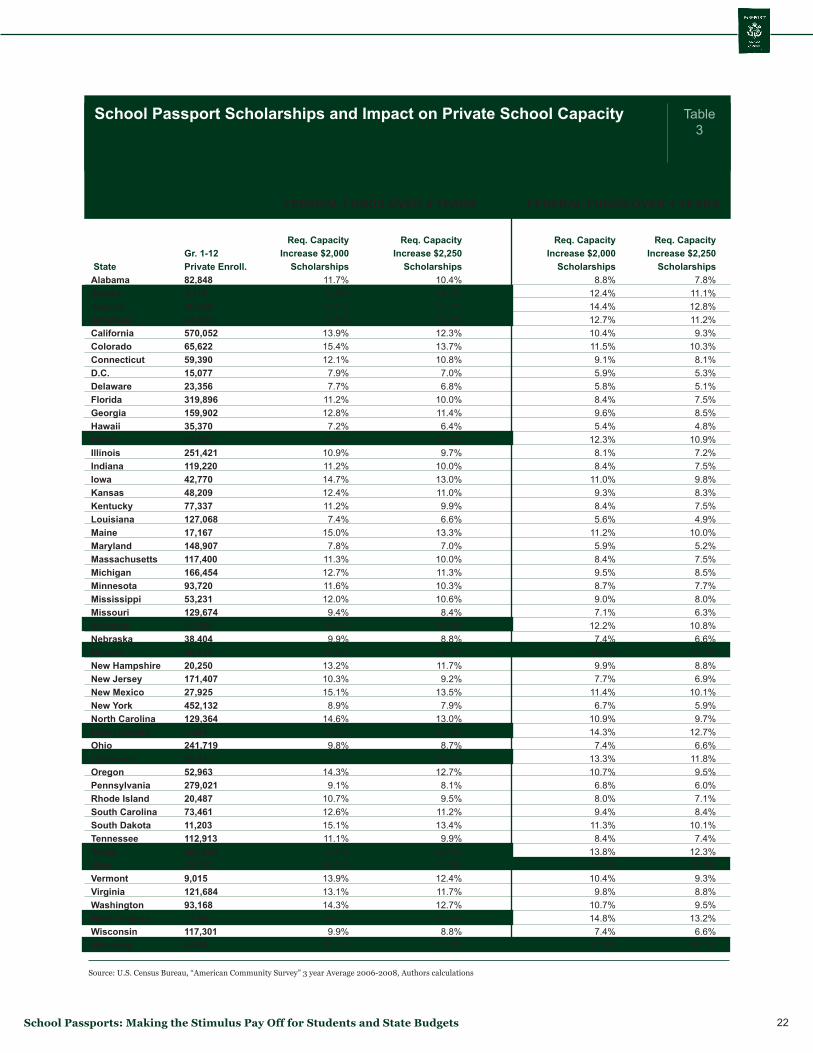
Still, some states and some districts will require larger and perhaps less realistic expansions of private
school capacity to accommodate School Passport scholarships. Table 3 presents state-by-state estimates of
private school enrollments in grades 1-12 and calculates the expansion in private school capacity that would
be required at scholarship values of $2,000 and $2,250 by the number of years over which scholarships
are allocated. The table highlights 12 states where School Passports valued at $2,000 and spread over three
years would require increases in private school capacity of at least 16 percent. It also shows how extending
the number of years to four and increasing the value of School Passports by just $250, to $2,250, signifi-
cantly reduces the required private school capacity increases in these states.
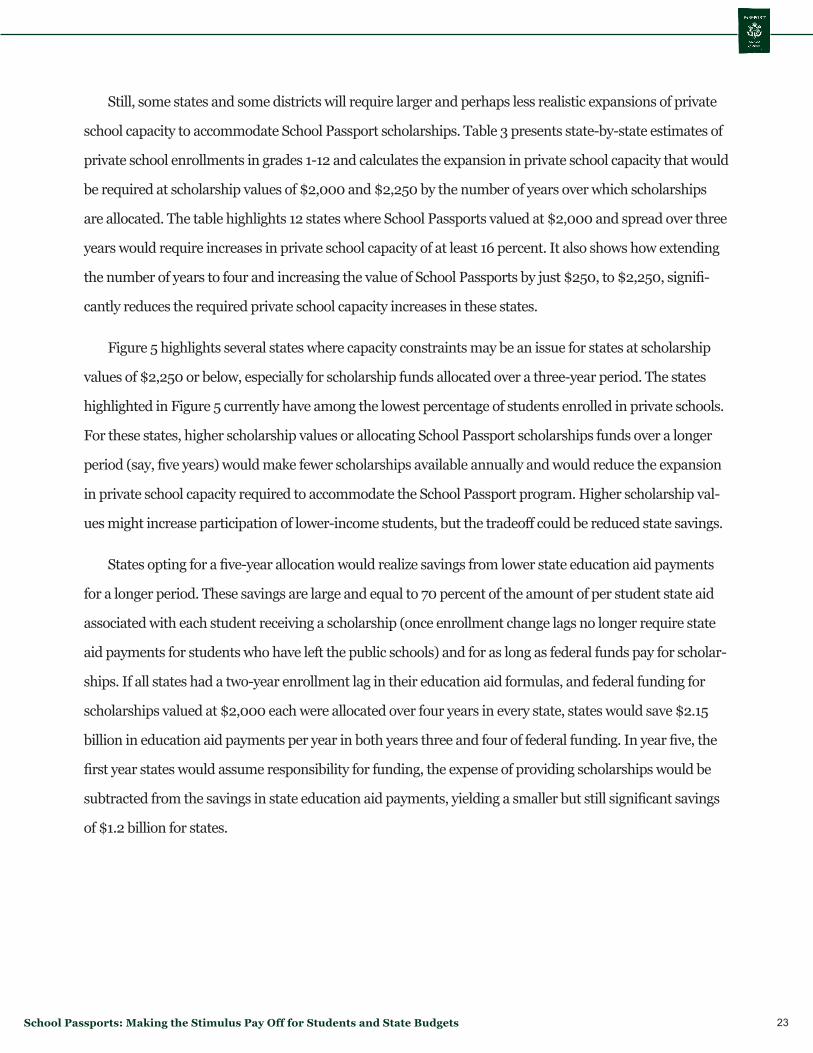
Figure 5 highlights several states where capacity constraints may be an issue for states at scholarship
values of $2,250 or below, especially for scholarship funds allocated over a three-year period. The states
highlighted in Figure 5 currently have among the lowest percentage of students enrolled in private schools.
For these states, higher scholarship values or allocating School Passport scholarships funds over a longer
period (say, five years) would make fewer scholarships available annually and would reduce the expansion
in private school capacity required to accommodate the School Passport program. Higher scholarship val-
ues might increase participation of lower-income students, but the tradeoff could be reduced state savings.
States opting for a five-year allocation would realize savings from lower state education aid payments
for a longer period. These savings are large and equal to 70 percent of the amount of per student state aid
associated with each student receiving a scholarship (once enrollment change lags no longer require state
aid payments for students who have left the public schools) and for as long as federal funds pay for scholar-
ships. If all states had a two-year enrollment lag in their education aid formulas, and federal funding for
scholarships valued at $2,000 each were allocated over four years in every state, states would save $2.15
billion in education aid payments per year in both years three and four of federal funding. In year five, the
first year states would assume responsibility for funding, the expense of providing scholarships would be
subtracted from the savings in state education aid payments, yielding a smaller but still significant savings
of $1.2 billion for states.
School Passports: Making the Stimulus Pay Off for Students and State Budgets 24
The salient point of our analysis of required increases in private school capacity, as with other variables
such as the number of years over which federal funds for School Passport scholarships are awarded, is that
with a modicum of flexibility, individual states can implement the program to achieve desired enrollment
and fiscal objectives.
State Fiscal Impact
Federal funds for School Passport scholarships would be allocated over a number of years, during
which states would incur no costs for the program. While delays in state education aid payments in re-
sponse to enrollment changes might initially result in no state savings from reduced state education aid
payments for students receiving scholarships, neither would they increase state education aid payments.
Scholarships may require private school capacity increases larger than practicable in some states. Spreading federal funding over five years can eliminate that constraint.
Required Increase in Private School Capacity ($2,250 Scholarships)
Source: U.S. Census Bureau, “American Community Survey.” Author’s Calculations.
0
Utah
Nevada
Wyoming
West Virginia
Arizona
North Dakota
Texas
Oklahoma
Arkansas
Figure 5
5% 10% 15% 20% 25% 30%
Required Increase in Private School Capacity
4 Yr. FEDErAL FuNDING3 Yr. FEDErAL FuNDING
School Passports: Making the Stimulus Pay Off for Students and State Budgets 25
States would continue to provide state education aid for students no longer in the public schools, but would
use federal funds to pay for School Passport scholarships.
Each state would assume fiscal responsibility for the School Passport program after a number of years.
If each state allocated the initial federal funds for School Passport scholarships over a period equal to one
year plus the number of years its per student state education aid payments lag changes in enrollment, then
the final year of federal funding would produce savings equal to 70 percent of the amount of state education
aid associated with each student receiving a School Passport times the number of scholarships awarded.
At scholarship values of $2,000, the savings realized from extending School Passport allocations one year
longer than the school funding lags would be approximately $2.15 billion, enough to pay the $950 million
cost for states to fund scholarships in the first year they assume financial responsibility for the program and
still deliver $1.2 billion in fiscal benefits to states (Table 4).
In each subsequent year, as long as the value of each Passport scholarship is less than 70 percent of per
student state education aid payments, then the savings from the difference between the cost of providing
School Passport scholarships and per student state aid payments would provide the funds needed to pay
for the program.
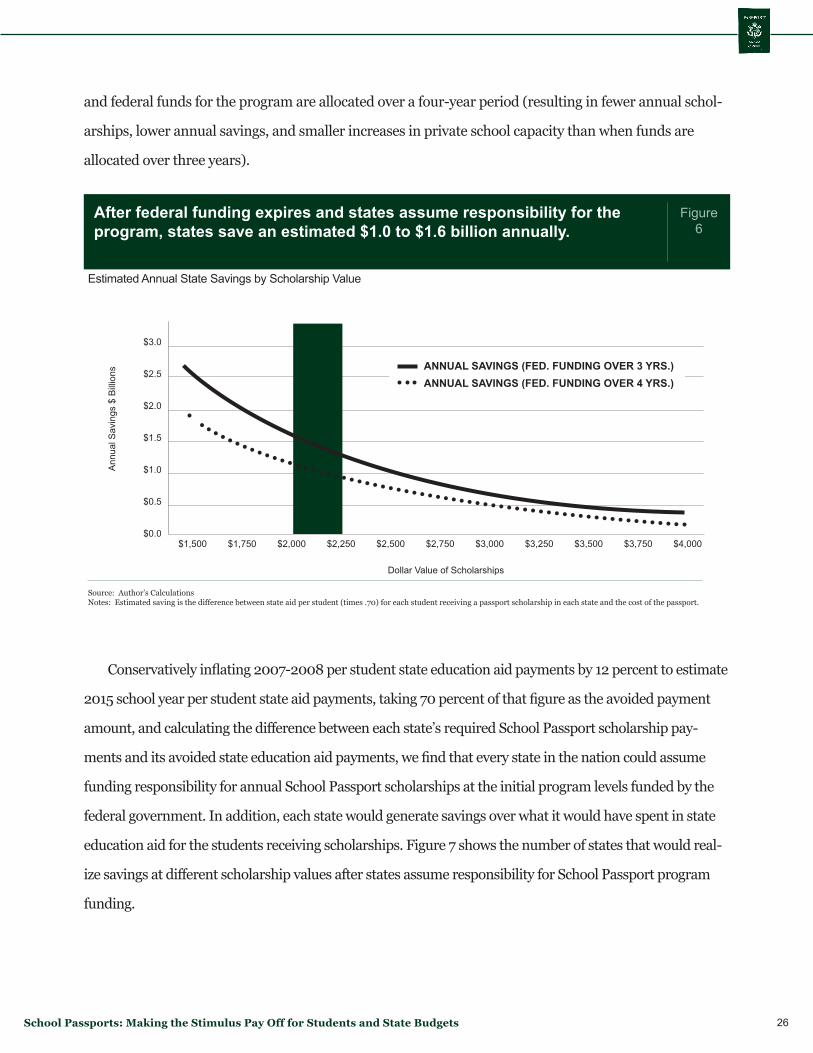
Each state could set scholarship values at levels required to generate enough savings in state education
aid to maintain the original size of the School Passport program and still produce savings for the state bud-
get. At scholarship values of between $2,000 and $2,250, states would realize savings of between $1 billion
and $1.6 billion every year as a result of the initial one-time $4 billion federal investment in the School
Passport program (Figure 6). Lower scholarship values not only would make more annual scholarships
available at any given level of funding, but also produce larger differences between per student state educa-
tion aid payments and scholarship costs, increasing state savings once states assume financial responsibil-
ity for the program.
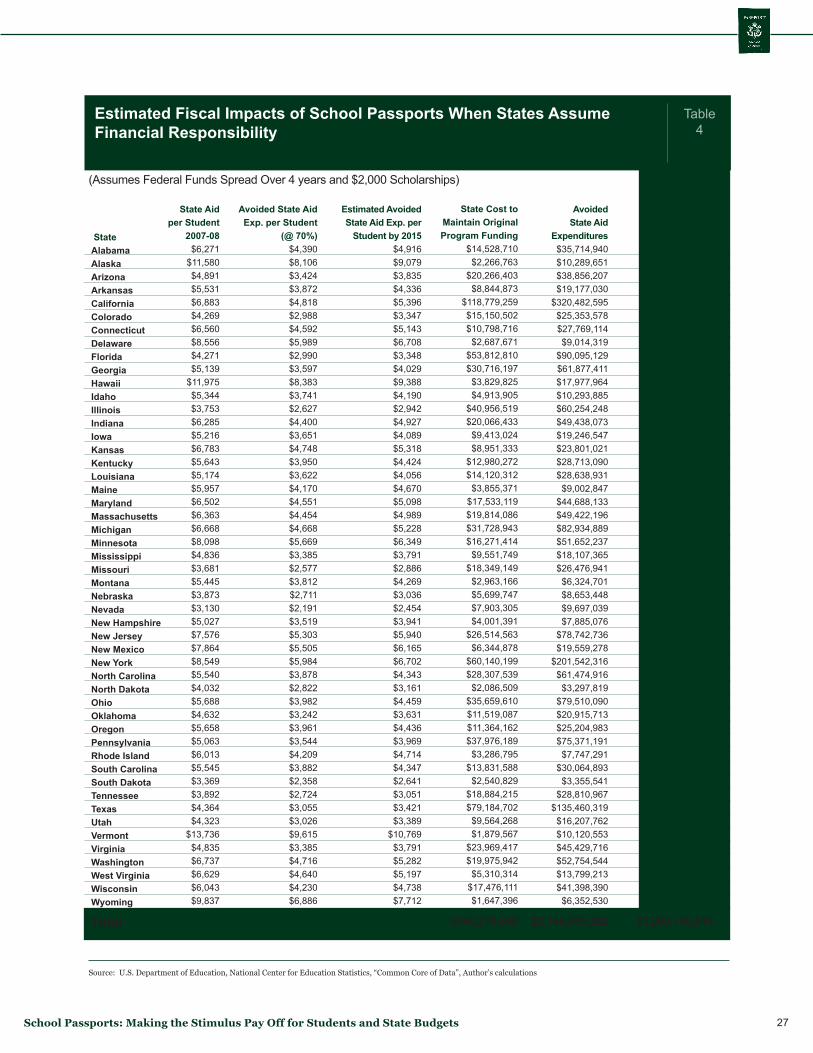
Once again, however, this aggregation masks differences across individual states. The scholarship
values required to generate enough savings to fund the School Passport program varies. States that pro-
vided higher amounts of per student aid would realize larger savings at the same scholarship values as
states that provided lower levels of per student state education aid. Table 4 presents estimates of the fis-
cal impact in each state of a School Passport program scenario where scholarships are valued at $2,000
School Passports: Making the Stimulus Pay Off for Students and State Budgets 26
and federal funds for the program are allocated over a four-year period (resulting in fewer annual schol-
arships, lower annual savings, and smaller increases in private school capacity than when funds are
allocated over three years).
Conservatively inflating 2007-2008 per student state education aid payments by 12 percent to estimate
2015 school year per student state aid payments, taking 70 percent of that figure as the avoided payment
amount, and calculating the difference between each state’s required School Passport scholarship pay-
ments and its avoided state education aid payments, we find that every state in the nation could assume
funding responsibility for annual School Passport scholarships at the initial program levels funded by the
federal government. In addition, each state would generate savings over what it would have spent in state
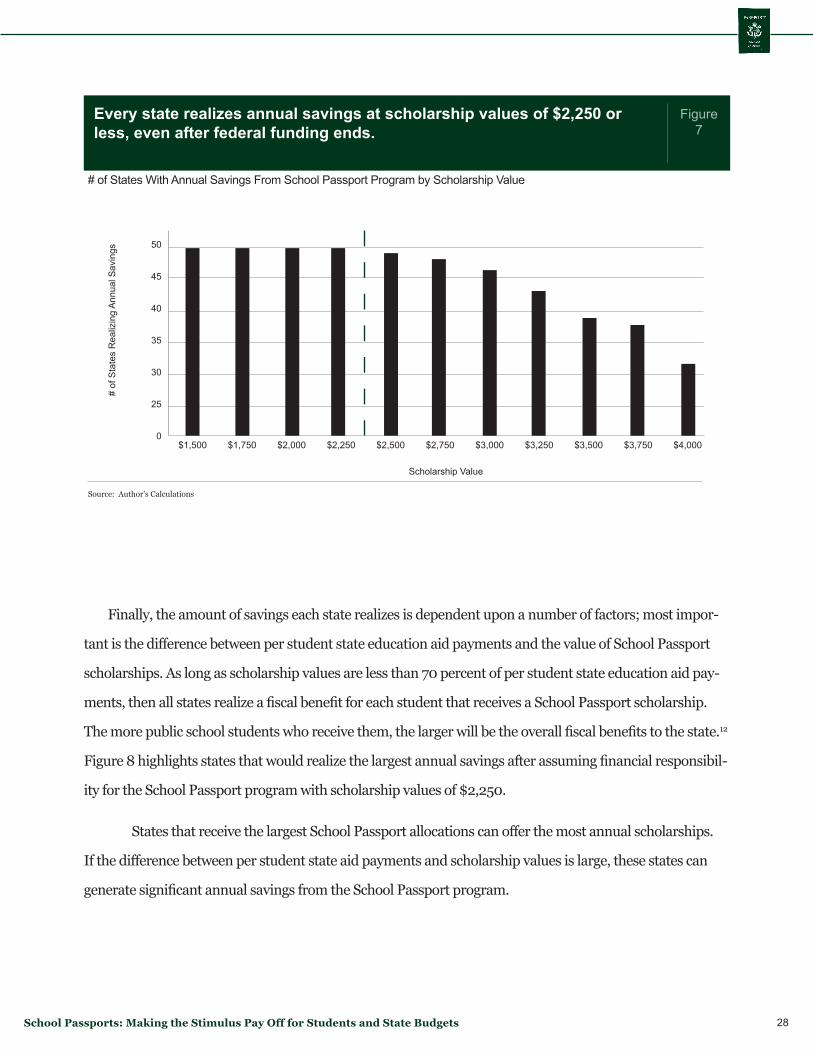
education aid for the students receiving scholarships. Figure 7 shows the number of states that would real-
ize savings at different scholarship values after states assume responsibility for School Passport program
funding.
After federal funding expires and states assume responsibility for the program, states save an estimated $1.0 to $1.6 billion annually.
Estimated Annual State Savings by Scholarship Value
Source: Author’s CalculationsNotes: Estimated saving is the difference between state aid per student (times .70) for each student receiving a passport scholarship in each state and the cost of the passport.
Figure 6
$3.0
$2.5
$2.0
$1.5
$1.0
$0.5
$0.0
Dollar Value of Scholarships
Ann
ual S
avin
gs $
Bill
ions
$1,500 $1,750 $2,000 $3,000 $4,000$2,250 $3,250$2,500 $3,500$2,750 $3,750
ANNuAL SAVINGS (FED. FuNDING OVEr 3 YrS.)ANNuAL SAVINGS (FED. FuNDING OVEr 4 YrS.)
School Passports: Making the Stimulus Pay Off for Students and State Budgets 27
Estimated Fiscal Impacts of School Passports When States Assume Financial responsibility
(Assumes Federal Funds Spread Over 4 years and $2,000 Scholarships)
Source: U.S. Department of Education, National Center for Education Statistics, “Common Core of Data”, Author’s calculations
Table 4
StateAlabamaAlaskaArizonaArkansasCaliforniaColoradoConnecticutDelawareFloridaGeorgiaHawaiiIdahoIllinoisIndianaIowaKansasKentuckyLouisianaMaineMarylandMassachusettsMichiganMinnesotaMississippiMissouriMontanaNebraskaNevadaNew HampshireNew JerseyNew MexicoNew YorkNorth CarolinaNorth DakotaOhioOklahomaOregonPennsylvaniarhode IslandSouth CarolinaSouth DakotaTennesseeTexasutahVermontVirginiaWashingtonWest VirginiaWisconsinWyoming
Total
Avoided State Aid Exp. per Student
(@ 70%)$4,390$8,106$3,424$3,872$4,818$2,988$4,592$5,989$2,990$3,597$8,383$3,741$2,627$4,400$3,651$4,748$3,950$3,622$4,170$4,551$4,454$4,668$5,669$3,385$2,577$3,812$2,711$2,191$3,519$5,303$5,505$5,984$3,878$2,822$3,982$3,242$3,961$3,544$4,209$3,882$2,358$2,724$3,055$3,026$9,615$3,385$4,716$4,640$4,230$6,886
State Aid per Student
2007-08$6,271
$11,580$4,891$5,531$6,883$4,269$6,560$8,556$4,271$5,139
$11,975$5,344$3,753$6,285$5,216$6,783$5,643$5,174$5,957$6,502$6,363$6,668$8,098$4,836$3,681$5,445$3,873$3,130$5,027$7,576$7,864$8,549$5,540$4,032$5,688$4,632$5,658$5,063$6,013$5,545$3,369$3,892$4,364$4,323
$13,736$4,835$6,737$6,629$6,043$9,837
State Cost to Maintain OriginalProgram Funding
$14,528,710$2,266,763
$20,266,403$8,844,873
$118,779,259$15,150,502$10,798,716
$2,687,671$53,812,810$30,716,197
$3,829,825$4,913,905
$40,956,519$20,066,433
$9,413,024$8,951,333
$12,980,272$14,120,312
$3,855,371$17,533,119$19,814,086$31,728,943$16,271,414
$9,551,749$18,349,149
$2,963,166$5,699,747$7,903,305$4,001,391
$26,514,563$6,344,878
$60,140,199$28,307,539
$2,086,509$35,659,610$11,519,087$11,364,162$37,976,189
$3,286,795$13,831,588
$2,540,829$18,884,215$79,184,702
$9,564,268$1,879,567
$23,969,417$19,975,942
$5,310,314$17,476,111$1,647,396
$948,218,848
Annual Savings
$21,186,230$8,022,889
$18,589,804$10,332,156
$201,703,336$10,203,075$16,970,398
$6,326,648$36,282,319$31,161,214$14,148,139
$5,379,979$19,297,729$29,371,640
$9,833,523$14,849,688$15,732,817$14,518,618
$5,147,476$27,155,014$29,608,110$51,205,946$35,380,823
$8,555,616$8,127,792$3,361,534$2,953,700$1,793,734$3,883,686
$52,228,173$13,214,400
$141,402,117$33,167,377
$1,211,310$43,850,480
$9,396,626$13,840,821$37,395,002
$4,460,496$16,233,305
$814,712$9,926,752
$56,275,617$6,643,494$8,240,986
$21,460,298$32,778,603
$8,488,898$23,922,279
$4,705,134
$1,200,740,514
Estimated Avoided State Aid Exp. per
Student by 2015$4,916$9,079$3,835$4,336$5,396$3,347$5,143$6,708$3,348$4,029$9,388$4,190$2,942$4,927$4,089$5,318$4,424$4,056$4,670$5,098$4,989$5,228$6,349$3,791$2,886$4,269$3,036$2,454$3,941$5,940$6,165$6,702$4,343$3,161$4,459$3,631$4,436$3,969$4,714$4,347$2,641$3,051$3,421$3,389
$10,769$3,791$5,282$5,197$4,738$7,712
Avoided State Aid
Expenditures$35,714,940$10,289,651$38,856,207$19,177,030
$320,482,595$25,353,578$27,769,114$9,014,319
$90,095,129$61,877,411$17,977,964$10,293,885$60,254,248$49,438,073$19,246,547$23,801,021$28,713,090$28,638,931
$9,002,847$44,688,133$49,422,196$82,934,889$51,652,237$18,107,365$26,476,941
$6,324,701$8,653,448$9,697,039$7,885,076
$78,742,736$19,559,278
$201,542,316$61,474,916
$3,297,819$79,510,090$20,915,713$25,204,983$75,371,191
$7,747,291$30,064,893
$3,355,541$28,810,967
$135,460,319$16,207,762$10,120,553$45,429,716$52,754,544$13,799,213$41,398,390
$6,352,530
$2,148,959,362
School Passports: Making the Stimulus Pay Off for Students and State Budgets 28
Finally, the amount of savings each state realizes is dependent upon a number of factors; most impor-
tant is the difference between per student state education aid payments and the value of School Passport
scholarships. As long as scholarship values are less than 70 percent of per student state education aid pay-
ments, then all states realize a fiscal benefit for each student that receives a School Passport scholarship.
The more public school students who receive them, the larger will be the overall fiscal benefits to the state.12
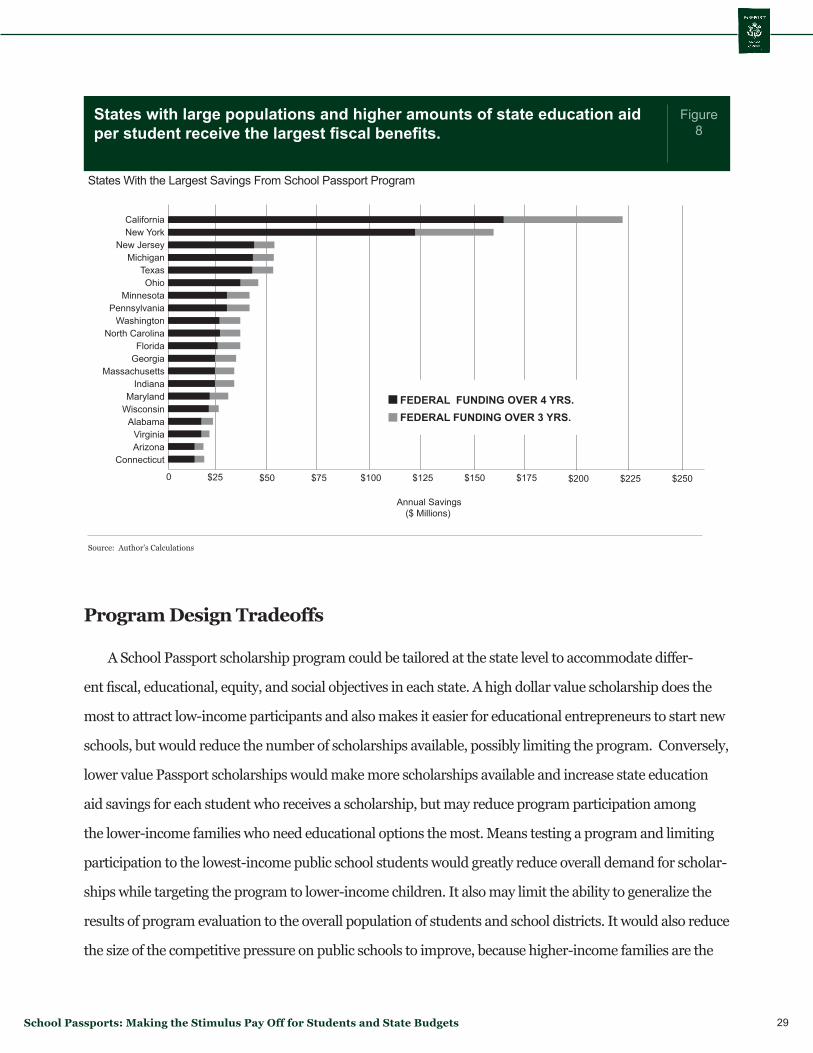
Figure 8 highlights states that would realize the largest annual savings after assuming financial responsibil-
ity for the School Passport program with scholarship values of $2,250.
States that receive the largest School Passport allocations can offer the most annual scholarships.
If the difference between per student state aid payments and scholarship values is large, these states can
generate significant annual savings from the School Passport program.
Every state realizes annual savings at scholarship values of $2,250 or less, even after federal funding ends.
# of States With Annual Savings From School Passport Program by Scholarship Value
Source: Author’s Calculations
Figure 7
50
45
40
35
30
25
0
Scholarship Value
# of
Sta
tes
Rea
lizin
g A
nnua
l Sav
ings
$1,500 $1,750 $2,000 $3,000 $4,000$2,250 $3,250$2,500 $3,500$2,750 $3,750
School Passports: Making the Stimulus Pay Off for Students and State Budgets 29
Program Design Tradeoffs
A School Passport scholarship program could be tailored at the state level to accommodate differ-
ent fiscal, educational, equity, and social objectives in each state. A high dollar value scholarship does the
most to attract low-income participants and also makes it easier for educational entrepreneurs to start new
schools, but would reduce the number of scholarships available, possibly limiting the program. Conversely,
lower value Passport scholarships would make more scholarships available and increase state education
aid savings for each student who receives a scholarship, but may reduce program participation among
the lower-income families who need educational options the most. Means testing a program and limiting
participation to the lowest-income public school students would greatly reduce overall demand for scholar-
ships while targeting the program to lower-income children. It also may limit the ability to generalize the
results of program evaluation to the overall population of students and school districts. It would also reduce
the size of the competitive pressure on public schools to improve, because higher-income families are the
States with large populations and higher amounts of state education aid per student receive the largest fiscal benefits.
States With the Largest Savings From School Passport Program
Source: Author’s Calculations
0
CaliforniaNew York
New JerseyMichigan
TexasOhio
MinnesotaPennsylvania
WashingtonNorth Carolina
FloridaGeorgia
MassachusettsIndiana
MarylandWisconsin
AlabamaVirginiaArizona
Connecticut
Figure 8
$25 $50 $75 $175$100 $200$125 $225$150 $250
Annual Savings ($ Millions)
FEDErAL FuNDING OVEr 4 YrS.FEDErAL FuNDING OVEr 3 YrS.
School Passports: Making the Stimulus Pay Off for Students and State Budgets 30
most likely to switch schools.
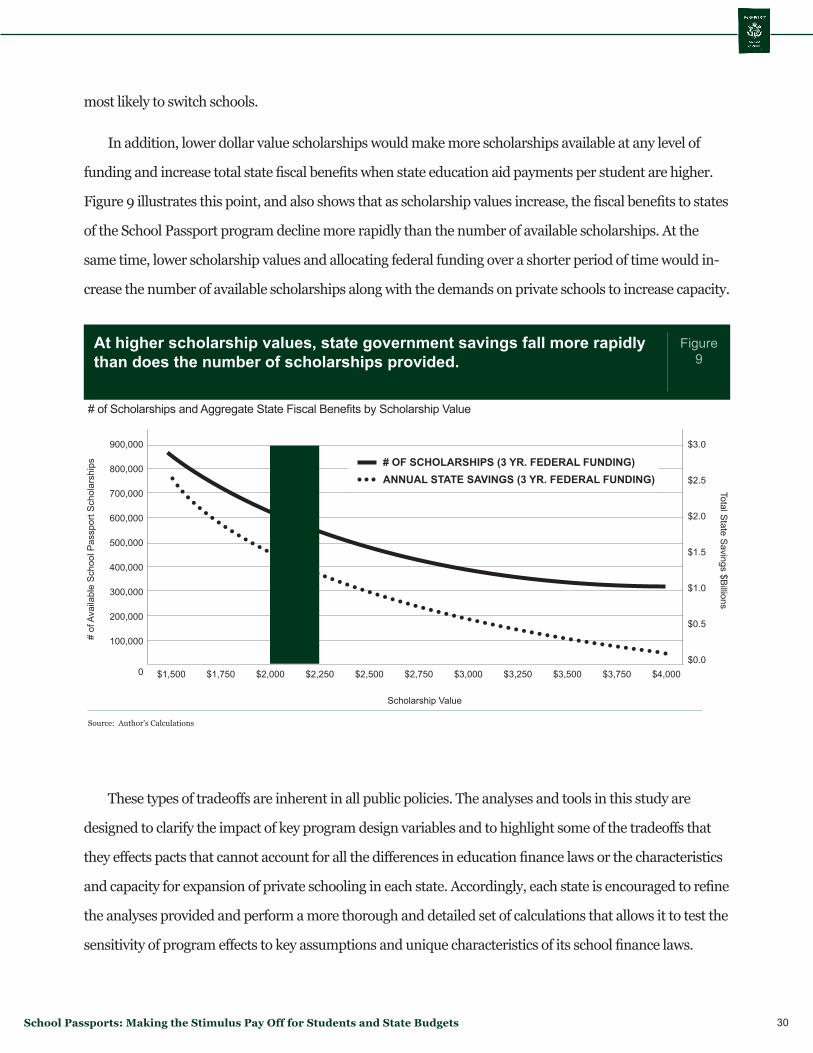
In addition, lower dollar value scholarships would make more scholarships available at any level of
funding and increase total state fiscal benefits when state education aid payments per student are higher.
Figure 9 illustrates this point, and also shows that as scholarship values increase, the fiscal benefits to states
of the School Passport program decline more rapidly than the number of available scholarships. At the
same time, lower scholarship values and allocating federal funding over a shorter period of time would in-
crease the number of available scholarships along with the demands on private schools to increase capacity.
These types of tradeoffs are inherent in all public policies. The analyses and tools in this study are
designed to clarify the impact of key program design variables and to highlight some of the tradeoffs that
they effects pacts that cannot account for all the differences in education finance laws or the characteristics
and capacity for expansion of private schooling in each state. Accordingly, each state is encouraged to refine
the analyses provided and perform a more thorough and detailed set of calculations that allows it to test the
sensitivity of program effects to key assumptions and unique characteristics of its school finance laws.
At higher scholarship values, state government savings fall more rapidly than does the number of scholarships provided.
# of Scholarships and Aggregate State Fiscal Benefits by Scholarship Value
Source: Author’s Calculations
Figure 9
0
900,000
800,000
700,000
600,000
500,000
400,000
300,000
200,000
100,000
$3.0
$2.5
$2.0
$1.5
$1.0
$0.5
$0.0
Scholarship Value
# of
Ava
ilabl
e S
choo
l Pas
spor
t Sch
olar
ship
sTotal S
tate Savings $B
illions
$1,500 $1,750 $2,000 $3,000 $4,000$2,250 $3,250$2,500 $3,500$2,750 $3,750
# OF SCHOLArSHIPS (3 Yr. FEDErAL FuNDING)ANNuAL STATE SAVINGS (3 Yr. FEDErAL FuNDING)
School Passports: Making the Stimulus Pay Off for Students and State Budgets 31
The Impact of High Dollar Value School Passports
A School Passport program with high dollar value scholarships (of at least $7,000) would offer a num-
ber of advantages. First, high value scholarships would create the most overall demand for the program
and the most demand among lower-income families. High-value school passports would confer the great-
est benefits on those students most constrained in their educational options and most in need of increased
school choice. However, as noted, high dollar value passports in a program with a fixed level of funding will
result in fewer students receiving passports. It is unclear whether strong demand alone, if it includes a high
level of unmet demand, introduces the same level of competitive forces to local education markets as would
a program with smaller overall demand but which provides passports to a great number of students. Thus
the benefit of expanded choice for lower-income students under high-value passports may come at the
expense of weaker forces for broad systemic educational reform.
High-value school passports will also increase the breadth of private school options for students
who receive them. By making a greater number and variety of schools affordable to families they will also
increase the demand for private non-sectarian schools relative to private sectarian schools, as generally
higher-priced non-sectarian schools become more affordable to a larger number of families.
High value school passports may also have a greater impact on the supply of private school options
than do lower value passports. New and existing private schools will have a greater incentive to enter or
expand in local education markets where there is a sufficient increase in demand from high-value school
passport students less in need of subsidies from the private schools.
Finally, from a fiscal perspective, high-value school passports decrease or eliminate the difference
in state government education expenses between the amount states pay in per student state aid and the
expense of school passports for each student. For some states, the benefits and educational objectives of
high value passports will outweigh the fiscal costs (or reduction in fiscal benefits) from the School Passport
program. Other states, constrained by fiscal concerns, or more interested in maximizing the number of
school passport students, will choose to offer only lower dollar value passports. States should be allowed to
determine the dollar value of their school passports, or set different passport values in different local educa-
tion markets. States may choose to offer higher value passports in markets most in need of educational
improvement while offering lower value passports in others.
School Passports: Making the Stimulus Pay Off for Students and State Budgets 32
The list below provides some perspective on how the impacts of high-value school passports may differ
from the analyses of school passports ranging from $1,500 to $4,000 presented earlier in this report. A
school passport program with funding for each state spread over four years that offers passports valued at
$7,000 would:
Provide school passports to about 136,000 students across the country.•
Reduce public school enrollment by 0.31 percent.•
Require a private school capacity increase of 2.6 percent nationwide.•
Increase state education expenditures by about $336 million once states assume financial responsi-•
bility for the program.
Produce net fiscal savings in four of the 50 states.•
ConclusionThe stimulus bill passed by Congress contained $80 billion in funding for states to help pay for public
education. Of that amount, all but $5 billion is awarded to maintain existing programs and practices in
public education. With so much of the stimulus funding supporting the status quo in education, the edu-
cation reform potential of the stimulus has been severely limited. This report analyzes a proposal to use
remaining stimulus funds to support a $4 billion program that provides tuition scholarships in each state
for public school students to attend private schools.
In this report we present one example of how such a program could generate significant and lasting fis-
cal benefits to each state. We show that the proposed program likely would affect no more than 1.5 percent
of public school students across the country and would require only a modest expansion (of between 8
percent and 12 percent) of private school capacity in a majority of states.
We show how states can implement the School Passport program to guarantee enough savings to allow
them to assume program funding responsibility once stimulus funding ends. The enduring fiscal benefits
provided to states can help ensure this reform would continue after stimulus funding ends, while produc-
School Passports: Making the Stimulus Pay Off for Students and State Budgets 33
ing annual savings for state treasuries of $1 billion to $1.6 billion in return for a one-time initial program
investment by the federal government of $4 billion.
School Passports: Making the Stimulus Pay Off for Students and State Budgets 34
Notes 1 Andrew Smarick, “Education Stimulus Watch, Special Report 1,” American Enterprise Institute, June 2010.2 National Association of State Budget Officers, “State Expenditure Report,” various years.3 NASBO, Transportation infrastructure funds exceed either or both funds for education and Medicaid in Montana, North Dakota, South Dakota and Wyoming. 4 National Access Network, Teachers College, Columbia University, “Litigation” accessed online at: http://www.schoolfunding.info/litiga-tion/litigation.php3. Christopher Berry, “School Finance Judgments and Spending on Education: A Review of the Evidence,” University of Chicago, 2004. 5 The disappointment is not limited to one end of the political or ideological spectrum; see for example “Obama’s Shallow Plan to Spend $23 Billion on Education,” Washington Post, May 28, 2010. For a more complete review of the reactions to ARRA’s education provisions see Andy Smarick’s quarterly “Education Stimulus Watch” reports for the American Enterprise Institute, available at http://www.aei.org/paperstudies .6 This is the amount that is obligated but remains undistributed in the State Fiscal Stabilization Fund (SFSF), and more specifically, the “educational services grant” , or the 81.8 percent portion of the SFSF that is directed to each state for distribution to local districts to main-tain existing funding levels. Author’s calculations of obligated and un-distributed funds are based on data contained in U.S. Department of Education ARRA September 17, 2010 state spending report, accessed here: http://www2.ed.gov/policy/gen/leg/recovery/reports.html
7 These include funds for Statewide Data Systems, the Teacher Incen-tive Fund, and Teacher Quality Enhancement.8 Chester E. Finn Jr., and Frederick M. Hess, “Silver Cloud, Dark Lin-ing,” National Review Online, January 8, 2009.9 Greg Forster, “A Win-Win Solution: The Empirical Evidence on How Vouchers Affect Public Schools.” Friedman Foundation for Educational Choice, February, 2009. David N. Figlio, and Cassandra M. D. Hart, “Competitive Effects of Means-Tested School Vouchers.” National Bureau of Economic Research, Working Paper # 16056, June 2010. 10 “The Corporate Income Tax Credit Scholarship Program Saves State Dollars,” Office of Program Policy Analysis & Government Account-ability, Florida State Legislature, December 2008.11 We did not do a comprehensive review of all state education finance laws for this report. In general, there is a lag between enrollment changes and state aid changes. In the 10 states we reviewed these lags were not longer than two years. 12 The 70% figure is a conservative estimate designed to set a higher criterion for generating savings than exists in most states. In most state education finance systems, a higher percentage of state educa-tion aid than 70% is awarded on the basis of enrollment numbers.
School Passports: Making the Stimulus Pay Off for Students and State Budgets 35
About the Author Brian J. Gottlob ([email protected]) is the Principal of PolEcon Research. For 17 years
Gottlob has analyzed economic, demographic, labor market industry and public policy trends for private
sector, government and nonprofit organizations. He has extensive experience in developing econometric
models and has completed studies on a range of economic, tax policy, energy, education, and health care
issues in the states of New Hampshire, Virginia, Ohio, New Mexico, New York, Texas, Oregon, Michigan,
Georgia, Mississippi, West Virginia and Illinois. Gottlob is a Senior Fellow at The Foundation for
Educational Choice. He has an undergraduate degree in economics from the State University of New York
and a graduate degree in public policy analysis from the University of New Hampshire.
We Welcome Your SupportOur goal is to promote Milton and Rose Friedman’s vision of a society where all parents have the
freedom to choose the school that works best for their children, regardless of whether that school is
publicly or privately run. One way we achieve this goal is by producing studies and reports on school
choice, that educate the public and policymakers on the need for and benefit of educational freedom. As
a nonprofit organization, our work relies solely on the generous support of our many friends and donors.
Please send your tax-deductible gift today, and help advance liberty and choice in our educational
system. With your help, America can achieve the Friedmans’ vision of universal school choice.
To order copies of this report, please call 317-681-0745, or visit us online at www.edchoice.org
ONE AMERICAN SQUARE, SUITE 2420 I INDIANAPOLIS, IN 46282317-681-0745 I WWW.EDChOICE.ORG
Dr. Patrick Byrne, ChairmanChairman of the Board and President, Overstock.com
Gordon St. Angelo, President EmeritusFormer Democratic State Chairman and Senior
Program Officer at Lilly Endowment
Janet F. Martel, Vice ChairpersonAttorney
Lawrence A. O’Connor, Jr., TreasurerExecutive Director, Butler Business Accelerator
Charles H. BrunieBrunie Associates
Robert C. EnlowPresident & CEO
Dr. David D. FriedmanProfessor, Santa Clara University
William J. HumeChairman of the Board, Basic American, Inc.
Sandra JordanOwner, Sandra Jordan Collection
Howard S. RichRich & Rich
Fred ReamsReams Asset Management
Dr. Michael WalkerPresident, The Fraser Institute Foundation
Dr. Milton Friedman, FounderNobel Laureate and Founder
Dr. Rose D. Friedman, FounderNoted Economist and Founder
BOARD OF DIRECTORS
Robert C. Enlow President & CEO
Leslie HinerVice President of Programs & State Relations
Paul DiPernaResearch Director
Greg ForsterSenior Fellow
Brian Gottlob
Senior Fellow
Matthew LadnerSenior Fellow
Benjamin Scafidi
Fellow
The Foundation for Educational Choice The Foundation for Educational Choice is a 501(c)(3) nonprofit and nonpartisan organization,
solely dedicated to advancing Milton and Rose Friedman’s vision of school choice for all children. First established as the Milton and Rose
D. Friedman Foundation in 1996, the foundation continues to promote school choice as the most effective and equitable way to improve the
quality of K-12 education in America. The foundation is dedicated to research, education, and outreach on the vital issues and implications
related to choice and competition in K-12 education.
www.edchoice.org
Related Documents


