2012 Pilot Plant Automation School of Engineering and Energy Joshua Dring

Welcome message from author
This document is posted to help you gain knowledge. Please leave a comment to let me know what you think about it! Share it to your friends and learn new things together.
Transcript

2012
Pilot Plant Automation School of Engineering and Energy
Joshua Dring

Pilot Plant Automation
Page 2
Abstract
The Murdoch university pilot plant is widely used throughout the instrumentation and control engineering major.
This plant allows students to implement the fundamental theoretical knowledge learnt in earlier years on a real industrial
plant. This miniaturized Bayer process plant, which runs cutting edge control hardware and software, is a core asset to
Murdoch University and it is essential that the system be maintained to the highest of standards. This project aims to
maintain the operation of the plant, while expanding the system by implementing an automation program.
The implementation of this project will be contributing to previous works by a number of previous students and
will finish this particular proposal. The design requirements of this project include a system that demonstrates the
functionality of the plant. This program must include transit of water through the system and adequately provide an
example of the functionality of the system. Secondary objectives include maintaining the plant between long periods of
dormancy and this will include instrument manipulation so all sections of the plant stay active during this period.
This proposal was solved by carefully designing the automation program, simulating different aspects of the
system and carrying out intense testing. The automation program was successfully implemented and provided adequate
operation to demonstrate the functionality of the pilot plant. This program also met the design requirements to cycle the
instruments to reduce maintenance issues over the long periods of dormancy. Other accomplishments that were
undertaken throughout the semester include the improvement and documentation of the system code, hardware
additions, component replacement and servicing.
The research undertaken over the semester has generated many other ideas that would improve the system
further. These have been assessed and work has commenced on the execution of these ideas, however future work is
needed to finish these goals. These include finishing the code restructuring of the entire plant, according to the generated
programming standards, implementation of new hardware and the completion of the instrument servicing.

Pilot Plant Automation
Page 3
Acknowledgments
Project Supervisor: Associate Professor Graeme R Cole,
Lecturer, Murdoch University
Assistant Project Supervisor: Dr. Linh Vu
Lecturer, Murdoch University
Mr Will Stirling
Technical Officer, Murdoch University
Mr John Boulton
Technical Officer, Murdoch University
Mr “Jeff” Iafeta Laava
Technician, Murdoch University

Pilot Plant Automation
Page 4
Table of Contents
Abstract ........................................................................................................................................................................ 2
Acknowledgments ........................................................................................................................................................ 3
List of Figures ................................................................................................................................................................ 5
List if Tables .................................................................................................................................................................. 7
Acronyms ...................................................................................................................................................................... 7
Chapter 1: Introduction ................................................................................................................................................ 8
Project Scope ............................................................................................................................................................ 8
Design Requirements................................................................................................................................................ 9
Chapter 2: Background Information ........................................................................................................................... 10
Hardware ............................................................................................................................................................... 10
Total I/O devices ................................................................................................................................................ 10
Equipment .......................................................................................................................................................... 10
Available Software ................................................................................................................................................. 11
Excel/MATLAB .................................................................................................................................................... 11
HoneyWell Software .......................................................................................................................................... 11
Chapter3: Initial Analysis and Research ...................................................................................................................... 14
Code Analysis.......................................................................................................................................................... 14
Control Modules and Sequential Control Modules ................................................................................................. 14
Control Modules ................................................................................................................................................. 14
Sequential Control Module ................................................................................................................................ 15
Backup and Restore Techniques ............................................................................................................................. 16
Indicators ................................................................................................................................................................ 17
Operator / Program................................................................................................................................................ 17
Control Execution Environment (CEE) states .......................................................................................................... 18
Simulated System ................................................................................................................................................... 18
Visual Basic Simulation ...................................................................................................................................... 18
Simulated controllers ............................................................................................................................................. 19
Chapter 4: Design Approach ....................................................................................................................................... 21
General Operation Approach ................................................................................................................................. 21
Program Design ...................................................................................................................................................... 21
SCM Design ........................................................................................................................................................ 23
SCM Operation ................................................................................................................................................... 24
Programming Standards ........................................................................................................................................ 24
Chapter 5: Initial Configuration .................................................................................................................................. 25
Initial Modifications ............................................................................................................................................... 25

Pilot Plant Automation
Page 5
Chapter 6: Implementation......................................................................................................................................... 27
Parallel Control Module Contents .......................................................................................................................... 28
Issues Encountered ................................................................................................................................................. 34
Access Lock ......................................................................................................................................................... 35
SCM Transitional Issue ........................................................................................................................................... 35
Chapter 7: HMI Design Requirements and Implementation ....................................................................................... 36
Implementation ...................................................................................................................................................... 36
Design ................................................................................................................................................................ 36
Chapter 8: Scenario Testing ........................................................................................................................................ 39
Changes Implemented ............................................................................................................................................ 39
Chapter 9: Additional Upgrading of the Pilot Plant .................................................................................................... 40
Obsolete code ......................................................................................................................................................... 40
Safety Override Interlock ........................................................................................................................................ 41
Trouble-Shoot Function .......................................................................................................................................... 43
Drain Detection ...................................................................................................................................................... 44
Bad PV Detection .................................................................................................................................................... 45
Flow Meter Issues ................................................................................................................................................... 45
Hardware Additions ............................................................................................................................................... 47
Chapter 10: Future Works ........................................................................................................................................... 49
Maintenance Issues ................................................................................................................................................ 49
Possible Plant Additions ......................................................................................................................................... 50
Code Restructuring ................................................................................................................................................. 51
Chapter 11: Concluding Remarks ................................................................................................................................ 53
Chapter 12: Available Resources ................................................................................................................................ 55
Chapter 13: Bibliography ............................................................................................................................................ 56
Chapter 14: Appendix ................................................................................................................................................. 57
List of Figures
Figure 1 – Programming Example .............................................................................................................................. 12
Figure 2 – HMI Programming Environment ................................................................................................................ 12
Figure 3 – Operator Screens ....................................................................................................................................... 13
Figure 4 – Control Module Function Execution ........................................................................................................... 14
Figure 5 – SCM Operation - (Mackay, 2012) ............................................................................................................... 15
Figure 6 – SCM Example ............................................................................................................................................. 15

Pilot Plant Automation
Page 6
Figure 7 – Step Block Example .................................................................................................................................... 16
Figure 8 –Transition Block Example ............................................................................................................................ 16
Figure 9 - Indicators .................................................................................................................................................... 17
Figure 10 – CEE States ................................................................................................................................................ 18
Figure 11 – VB Simulation Interface ........................................................................................................................... 19
Figure 12 – System Architecture ................................................................................................................................. 20
Figure 13 – HMI Architecture ...................................................................................................................................... 22
Figure 14 – Selector Block ........................................................................................................................................... 23
Figure 15 – HMI Page 303 .......................................................................................................................................... 27
Figure 16 – Monitoring Operation .............................................................................................................................. 28
Figure 17 – HMI Page 303 .......................................................................................................................................... 30
Figure 18 – HMI Page 304 .......................................................................................................................................... 31
Figure 19 – HMI Page 305 .......................................................................................................................................... 32
Figure 20 – HMI Page 306 .......................................................................................................................................... 33
Figure 21 – Scheduled Start ........................................................................................................................................ 34
Figure 22 – Access Lock............................................................................................................................................... 35
Figure 23 – Error Message .......................................................................................................................................... 35
Figure 24 – Control Interface ...................................................................................................................................... 36
Figure 25 – Operation Indication (On/Off).................................................................................................................. 37
Figure 26 – HMI Inconsistencies ................................................................................................................................. 37
Figure 27 – HMI Redundant Displays .......................................................................................................................... 38
Figure 28 – HMI Architecture ...................................................................................................................................... 38
Figure 29 – Redundant Code ....................................................................................................................................... 40
Figure 30 – Interlock Code .......................................................................................................................................... 41
Figure 31 – Interlock Logic .......................................................................................................................................... 41
Figure 32 – Lamella Tank ............................................................................................................................................ 42
Figure 33 – CSTR Tank ................................................................................................................................................ 43
Figure 34 – Drain Detection ........................................................................................................................................ 44
Figure 35 – Bad PV Detection ..................................................................................................................................... 45
Figure 36 – Flow Meter PV .......................................................................................................................................... 46
Figure 37 – Flow Meter Analysis ................................................................................................................................. 47
Figure 38 – Momentary Switch Control Module ......................................................................................................... 48
Figure 39 – Momentary Button and Digital Input Wiring ........................................................................................... 48
Figure 40 – Light and Buzzer ....................................................................................................................................... 49
Figure 41 – Maintenance Issues ................................................................................................................................. 50
Figure 42 – Manual Addition Valves ........................................................................................................................... 50
Pilot Plant Automation
Page 7
Figure 43 – Coding Example ....................................................................................................................................... 51
List if Tables
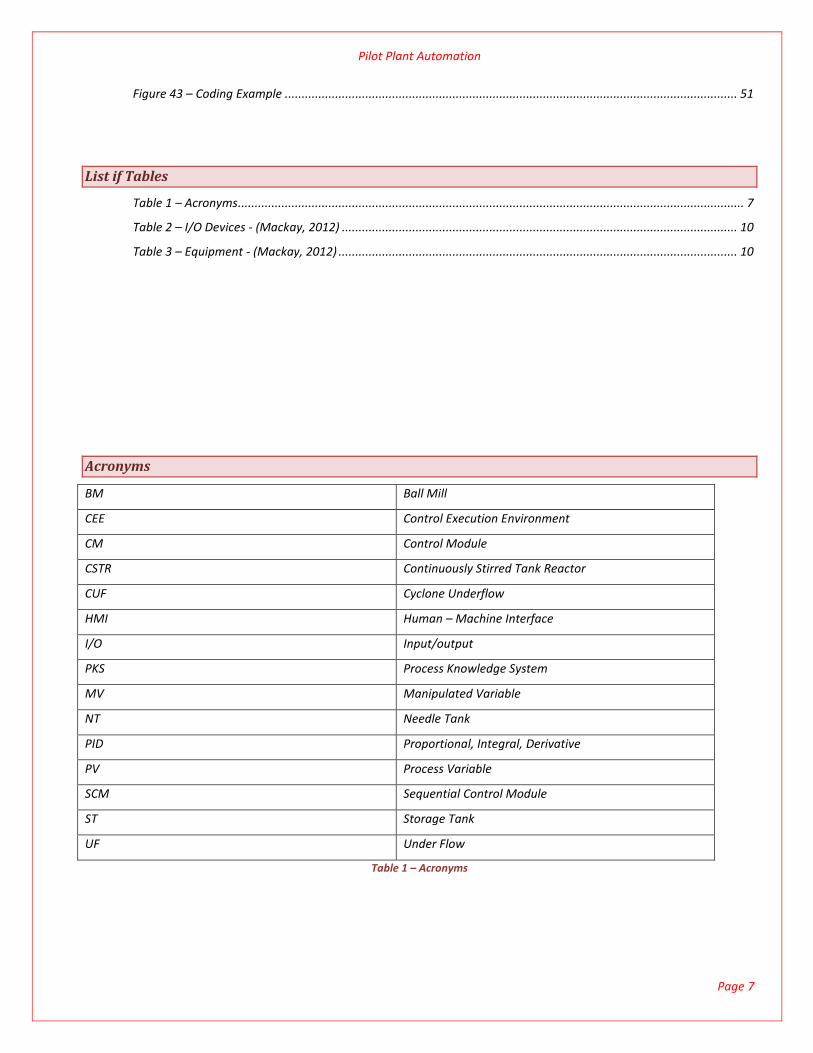
Table 1 – Acronyms ....................................................................................................................................................... 7
Table 2 – I/O Devices - (Mackay, 2012) ...................................................................................................................... 10
Table 3 – Equipment - (Mackay, 2012) ....................................................................................................................... 10
Acronyms
BM Ball Mill
CEE Control Execution Environment
CM Control Module
CSTR Continuously Stirred Tank Reactor
CUF Cyclone Underflow
HMI Human – Machine Interface
I/O Input/output
PKS Process Knowledge System
MV Manipulated Variable
NT Needle Tank
PID Proportional, Integral, Derivative
PV Process Variable
SCM Sequential Control Module
ST Storage Tank
UF Under Flow
Table 1 – Acronyms
Pilot Plant Automation
Page 8
Chapter 1: Introduction
Project Scope
The Murdoch university pilot plant is used throughout the instrumentation and control degree to allow students to
implement the theoretical knowledge gained from earlier studies on a real industrial plant. This project was proposed to
improve on previous developments associated with the pilot plant and to create an automation program that demonstrated
the plant’s operation capabilities. This automation program would also have a secondary function which ultimately would
reduce the maintenance work required.
This proposal will include many obstacles in the development of this automation program as the technology used
to implement the pilot plant is very advanced and information available on this system is minimal. The final product of this
paper will be to produce software capable of meeting the design requirements of the proposal. Secondary objectives include
documentation on the system, research notes, addition code manipulation and informative documents to assist future
works with any and all upgrades/modifications.
The automation program will need to be thoroughly tested and scrutinised to meet the operation criteria, as the
system will be ultimately in control of the plant with no supervision. As a result it is imperative that this system be
thoroughly planned before any implementation or modifications commence.
The obstacles that this project will experience are quite large compared to tasks previously accomplished. The plant
will be operated throughout the semester by other students and it is extremely important that no interference to the system
occurs, as the students depend on the system being operatable every day of the week. Therefore careful analysis, planning
and time management is needed to implement, test, and in some cases, restore vital systems in the event that anything
goes wrong. The environment used to control and program the plant is a massive obstacle in itself and will need research
and practice before attempting any modification on the running system.
Another obstacle includes the implemented software that runs the plant as it has been modified by a number of
individuals many times. This system was originally implemented on a programmable logic controller and has since been
converted, modified and manipulated without documentation being generated.
These obstacles will be addressed by researching and implementing a simulated system before making any
modifications to the pilot plant. Once adequate knowledge is achieved through this process the implementation of the
automation program will commence.

Pilot Plant Automation
Page 9
Design Requirements
The proposal for this thesis included creating an automation program that demonstrated the plant to visitors to the
school. This program will perform some functionality to show the capabilities of the plant to these visitors and students. The
secondary function will be to reduce the maintenance that needs to currently be implemented on the plant. By creating a
system that periodically cycles the instruments, including the pumps valves and other apparatus, this will reduce the
problems associated with the plant after long periods of dormancy.
The requirement for the automation program includes operation of the system which demonstrates the core
functionality of the plant. This will allow the demonstrator to initialize the program and explain what the plant is used for
and how, while the plant is actually performing these tasks. No specific implementation of the devices have been made
mandatory for this demonstration, however the program must demonstrate some form of valve manipulation and the
transition of water to different tanks of the plant.
The requirements for the maintenance side of the program includes cycling all the valves, pumps and basically any
instruments that can experience issues during long periods of dormancy.
As a result of the maintenance and demonstration requirements a single program will be created to meet all of
these conditions, while ensuring the correct functionality of the plant, safety of equipment and longevity of the instruments.

Pilot Plant Automation
Page 10
Chapter 2: Background Information
Hardware
The Pilot Plant uses a C300 Controller which is one of the more recent controllers provided by Honeywell. The C300
operates “Honeywell’s deterministic Control Execution Environment (CEE) software which executes control strategies on a
constant and predictable schedule” (honeywellprocess). The controller connects to “Series C input and output modules as
well as Series C FIMs”. (Mackay, 2012). The following tables indicate the hardware used in the Murdoch university pilot
plant.
Total I/O devices
Input Output Module Quantity
Digital Input 2
Digital Output 2
Hart Analogue Input 2
Hart Analogue Output 1
Table 2 – I/O Devices - (Mackay, 2012)
Equipment
Instrument Type Quantity
Flow Transmitter Magnetic 11
Level Transmitter Differential 7
Density Transmitter Differential 4
Temperature Transmitter Resistive Thermal Detective 4
Pump Positive Displacement 8
Ball Mill 3-phase Motor 1
Flow Control Valves Pneumatic 8
Solenoid Valves 24 Volt Direct Current 10
Pump/Motor Controller Variable Speed Drives 9
Table 3 – Equipment - (Mackay, 2012)

Pilot Plant Automation
Page 11
Available Software
When first considering this project there were several thoughts to what could be used to program the
maintenance/demonstration scheme. It is possible to perform this task using numerous programs that can directly write to
the server as well as the possibility of installing the program on the controller.
Excel/MATLAB
Using the knowledge gained from previous research, a scheduled program could be run from Excel or MATLAB
quite easily, successfully operating the pilot plant automation program. This would be done using Visual Basic which would
run an application periodically. However, it would require a client PC to be running at all times and the refresh rate of once
iteration a second would limit monitoring operations. MATLAB would also be capable of running this program but is
restricted to the same issues as the Excel application.
HoneyWell Software
It was decided that the HoneyWell software would be used to create the automation program. The reason is that
the program is directly downloaded to the C300 controller, removing the need for a client PC to be running. This would also
allow the maintenance program to run during long periods (between semesters) without the need for the server/client to be
operating.
Experion PKS
The C300 controller is programmed using the Honeywell Experion PKS software package. The main implementation
of the programming is done through a sub program called Configuration Studio. This program can link to any of the
Honeywell PKS servers in the university, including PPsever1 (the server responsible for the Pilot Plant) and Experion1 (the
server currently being used for teaching purposes).
From this program the controller is configured with respect to type, address, I/O, communication and operation
functionality. Once the controller is configured a controller execution environment is added which contains modules that
represent the operation of the plant. Figure 1 is an example of the function-block style of programming available within one
of these modules. Configuration studio is discussed in more depth in Appendix 1.1.

Pilot Plant Automation
Page 12
Figure 1 – Programming Example
HMI Display Builder
There are two main programs that can be used in the Honeywell software package to create a HMI display to
control the plant; however the current setup of the Pilot plant system is using the HMIWeb Display Builder and will be
researched in this thesis project.
“HMIWeb Display Builder is Honeywell’s proprietary program and is used in the construction of HMI screens”
(Mackay, 2012). These screens directly communicate to the server so that operators can control the plant. The program is
based on the programming language Hyper-Text Mark-up Language (HTML) and operates in a similar manner to other HMI
builders. From this screen shapes, pipes, values, buttons and numerical controls can be created to visually represent the
process or to create a customised control panels, as seen in Figure 2.
Figure 2 – HMI Programming Environment

Pilot Plant Automation
Page 13
Station
Station is the program that allows the created HMI screens to be displayed on the operators screen. Tasks that can
be performed included the manual setting of valves, pumps, agitators, as well as the new options to configure PID control
parameters.
Figure 3 – Operator Screens
Trending from the various inputs and outputs can be seen over a varying time within station, allowing for direct
data replication and extraction. This interface can be seen in Figure 3.
Pilot Plant Automation
Page 14
Chapter3: Initial Analysis and Research
Several factors had to be considered before attempting any code manipulation on the plant. This analysis included
assessing the current code, control module and sequential control module investigation, backup/restore techniques,
indicator significance, difference between Operator/Program, Control Execution Environment states, simulated controllers
and simulated system.
Code Analysis
Code analysis commenced in week three and was originally scheduled for completion within 6 days; however the
sheer amount of code and complexity was greatly underestimated. Two weeks later the entire code had been documented
in a 114 page reference document (See Appendix 2.4), containing descriptions of the more complex control modules as well
as a list of the function blocks used in each control module. This analysis revealed the code to be disorganized and
inconsistent in terms of layout, naming and overall code operation. The provided document highlights naming
inconsistencies and control modules that need reviewing.
Control Modules and Sequential Control Modules
Control Modules
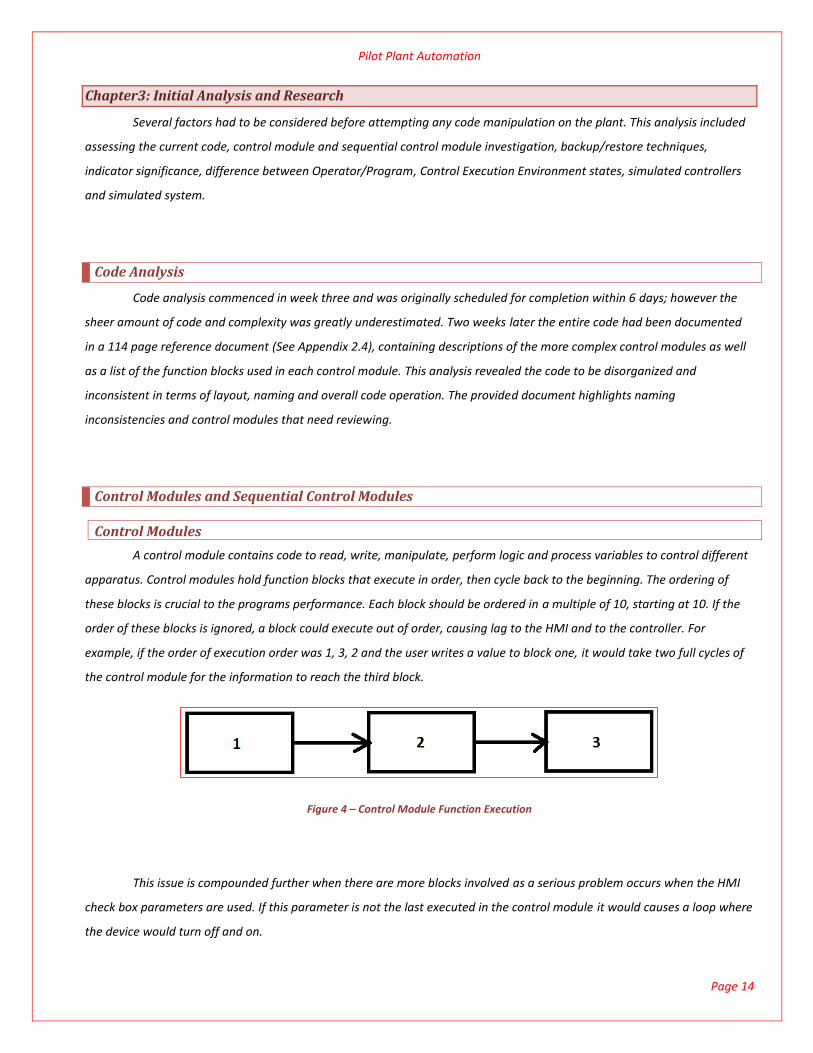
A control module contains code to read, write, manipulate, perform logic and process variables to control different
apparatus. Control modules hold function blocks that execute in order, then cycle back to the beginning. The ordering of
these blocks is crucial to the programs performance. Each block should be ordered in a multiple of 10, starting at 10. If the
order of these blocks is ignored, a block could execute out of order, causing lag to the HMI and to the controller. For
example, if the order of execution order was 1, 3, 2 and the user writes a value to block one, it would take two full cycles of
the control module for the information to reach the third block.
Figure 4 – Control Module Function Execution
This issue is compounded further when there are more blocks involved as a serious problem occurs when the HMI
check box parameters are used. If this parameter is not the last executed in the control module it would causes a loop where
the device would turn off and on.

Pilot Plant Automation
Page 15
Sequential Control Module
The sequential control module was investigated to be used in the implementation of the automation program. This
module allows for easy implementation of state machine design and is mainly used for sequential control logic. It will allow
events to trigger the transitional statement to the next state.
Figure 5 – SCM Operation - (Mackay, 2012)
Figure 5 is an example of the steps that are performed in each state. Once the initial transition is executed the
required actions in this state are performed, these actions will either activate another transition after a period of time, or
can be activated by an external action, such as an operator. Below is a simple example of a sequence of state machine
design executed on a tank
The state will be initialised and the tank will be filled up to a pre-determined level. During this operation the inlet
pump ramps up until the level is reached and then initiates the next state. The tank is then emptied to the next tank in the
system.
Initiate State
Turn Off Outlet Pump
Turn On Inlet Pump
Set operating point
Continue Until level Reaches 60 %
Reset Operators -> Next state
Initiate State
Turn Off Inlet Pump
Turn On Outlet Pump
Set operating point
Continue Until level Reaches 0 %
Reset Operators -> Next state
Figure 6 – SCM Example
Pilot Plant Automation
Page 16
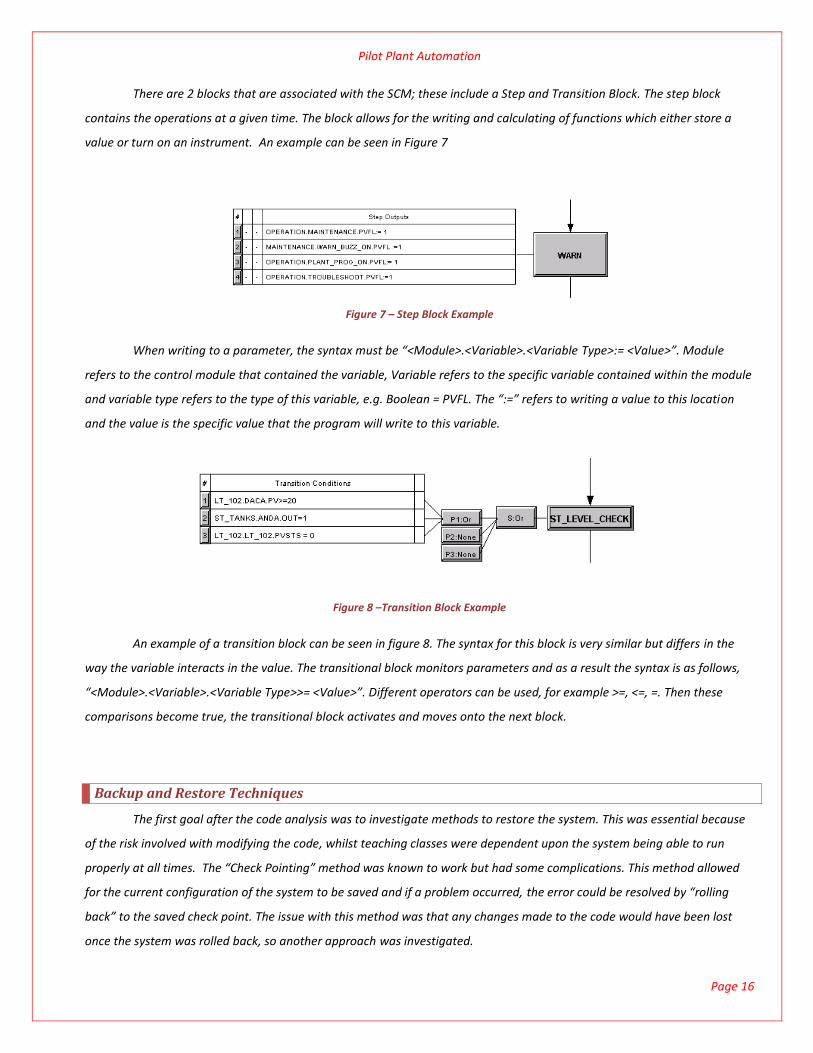
There are 2 blocks that are associated with the SCM; these include a Step and Transition Block. The step block
contains the operations at a given time. The block allows for the writing and calculating of functions which either store a
value or turn on an instrument. An example can be seen in Figure 7
Figure 7 – Step Block Example
When writing to a parameter, the syntax must be “<Module>.<Variable>.<Variable Type>:= <Value>”. Module
refers to the control module that contained the variable, Variable refers to the specific variable contained within the module
and variable type refers to the type of this variable, e.g. Boolean = PVFL. The “:=” refers to writing a value to this location
and the value is the specific value that the program will write to this variable.
Figure 8 –Transition Block Example
An example of a transition block can be seen in figure 8. The syntax for this block is very similar but differs in the
way the variable interacts in the value. The transitional block monitors parameters and as a result the syntax is as follows,
“<Module>.<Variable>.<Variable Type>>= <Value>”. Different operators can be used, for example >=, <=, =. Then these
comparisons become true, the transitional block activates and moves onto the next block.
Backup and Restore Techniques
The first goal after the code analysis was to investigate methods to restore the system. This was essential because
of the risk involved with modifying the code, whilst teaching classes were dependent upon the system being able to run
properly at all times. The “Check Pointing” method was known to work but had some complications. This method allowed
for the current configuration of the system to be saved and if a problem occurred, the error could be resolved by “rolling
back” to the saved check point. The issue with this method was that any changes made to the code would have been lost
once the system was rolled back, so another approach was investigated.

Pilot Plant Automation
Page 17
Exporting and importing was another method for restoring the system. The current directory of the code could be
exported to a storage device and imported back if an error occurred. If this should occur, the modified code could be
exported and saved for analysis whilst the original code would be restored to maintain operation of the plant.
A test was implemented on a simulated controller using the export/import method. The export worked without any
issues, successfully saving the control module to a file on the desktop. Changes were then made to the control module and
imported back to the system to confirm the process. An issue did arise when importing the control module, as an exported
control module stores the configuration that it belongs to and once imported back to the system it overwrites the
corresponding control module, EVEN if it has been renamed. This also caused another issue, as it was also desired to view
the old pilot plant code to help with analysis and if an import was applied it would write over the newly implemented setup.
A solution was found by using another Experion system to upload the code, “Experion 1”. The advantage of this
was that each control module could be assessed from its original configuration to the current configuration allowing for
easier analysis, without risking any unintentional modification of the code on the pilot plant.
Indicators
Several indicators that represented the state of the controller/control module needed investigation before the
commencement of code generation. After careful experimentation and the use of a simulated controller the different
indicator representations were resolved. These can be seen in the following image.
Idle
Active
Error/Offline
Changes detected between Project and Monitoring
Not loaded to the server/controller
Figure 9 - Indicators
Operator / Program
On the HMI it is possible to open the device interface by clicking on the object. On each window there is the ability
to change the device to Operator or Program. The selection of this is of great importance when operating the plant. If the
setting is on “Operator”, only the device interface window can change the value of the device. If this setting is “Program”
then the program behind the scenes can manipulate the device, including the Excel add-on. Recent upgrades to the HMI
allow students to change the device’s state (On/Off) with tick boxes, however if the device interface state is changed to
“Operator” these additions will fail to operate correctly.

Pilot Plant Automation
Page 18
The implications this has to the SCM’s will cause serious program malfunctions, as no device will operate at the
request of the software. A solution to this is to change the devices state every time a value is written from the SCM. If this
was to be implemented it would yield the addition of large amounts of code to the SCM, also making the program harder to
interpret. As a result of the implications of the previously mentioned method, another solution was found and will be
discussed in chapter 9.
Control Execution Environment (CEE) states
It was unknown what the different states represented in the control builder settings. In the standard Control
execution environment blocks there are four states, Idle, Cold start, Warm Start and None. Idle puts the control modules and
the corresponding blocks located within into a state where no calculations are being performed. Cold start will re initialise
the control module and its associated blocks to a state where the block parameters start off with the set values. Warm start
will re initialise the control modules with the values they had before they were idled down and finally the option “None” will
perform no action on the control modules and their corresponding blocks.
Figure 10 – CEE States
Simulated System
Visual Basic Simulation
It was discussed with the supervisors in the first week that the use of the pilot plant may not be available at all
times for testing, as ENG346 was currently utilizing the plant for learning purposes. As a result a simulated system was
considered for testing of code. The reason for this is because any changes made could possibly disrupt normal operations
and cause plant down time for the other students. One solution was found by creating a very basic simulated Pilot plant in
Excel. This would allow one of the simulated C300 controllers to be uploaded with the appropriate code, tested and analysed
for bugs before uploading it to the main Experion system. The image below is a screen shot of the created system.

Pilot Plant Automation
Page 19
Figure 11 – VB Simulation Interface
Each tank level can be simulated, with the VB code reading in values from point parameters. The actual flow-rates
between pumps are represented between 1 and 0, for example, if the pump was 100%, then the tank would pump water to
the next tank, removing 1 unit a second from the source and adding 1 unit to the destination. This system at its current
configuration is limited to the pumps; steam valves water addition valves and level sensors. After the analysis of the pilot
plant code it was determined that the simulated plant would not be used, as it would take a significant amount of time to
implement the necessary point parameters for the various pumps, valves and sensors.
Simulated controllers
A simulated controller was created on the pilot plant server which allowed for the SCM development and code
testing without affecting the C300 controller. Implementation of this simulated controller will not be discussed as it is
covered in Edwin Lum’s thesis (Lum, 2011). It was desired to create the new program on a simulated controller and use its
operation to write to the real controller’s flags allowing the operating system to be untouched. This was thought to be
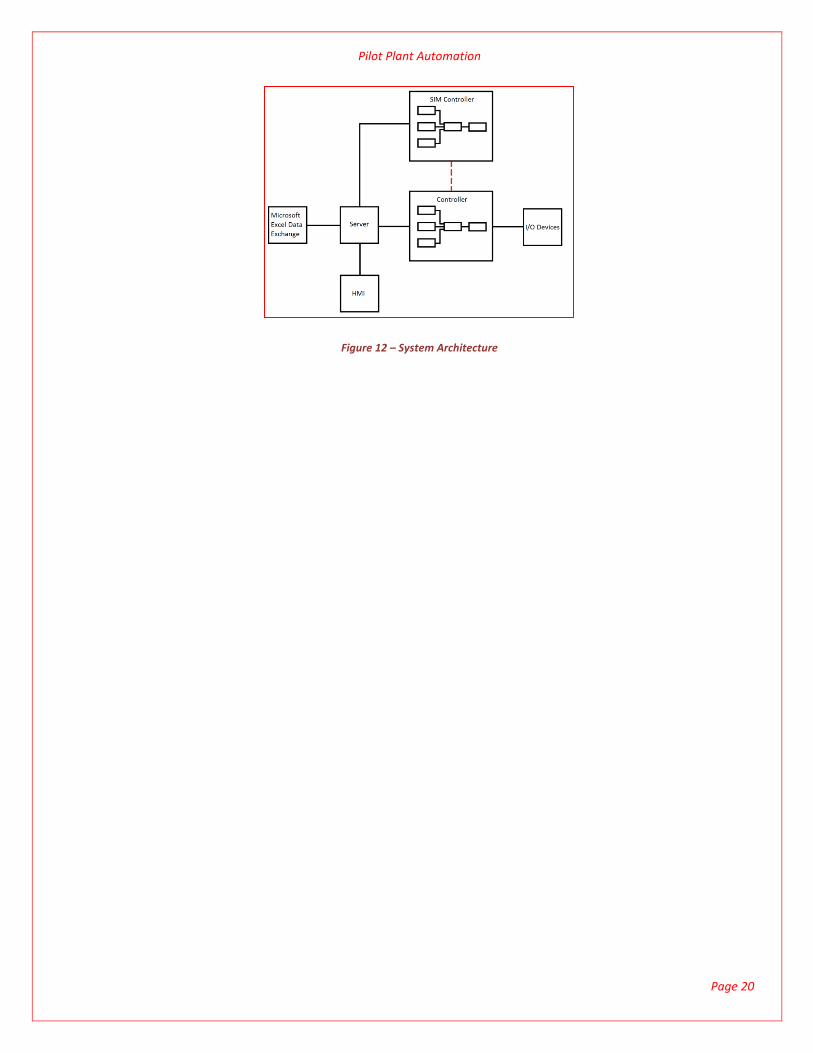
possible as Microsoft Excel Data Exchanger could write to points on the server, simulated or real. It was determined that the
server/MEDE works in the same way that the HMI Software writes to the parameters and that controller to simulated
controller communication was not possible (Figure 12). A solution to this issue could be implemented by using MEDE and
creating points that transferred to the corresponding point parameter to the real controller. However this would have been
a tedious task and as the code will eventually be uploaded to the real controller, a decision was made to implement the code
on the C300 controller without affecting the current operation.
Pilot Plant Automation
Page 20
Figure 12 – System Architecture
Pilot Plant Automation
Page 21
Chapter 4: Design Approach
General Operation Approach
To meet the design requirements it was determined that the program cycle all the valves and pump water through
the system. This would meet the requirements for maintenance of the plant and as well as demonstration purposes for
visitors to the university.
Two methods of operation were considered, the first being a continuous system, whereby the system would go
through and operate under control at steady state to achieve the design constraints. The second method considered was a
batch system, where the system would pump water into one tank to a required level, then pump the contents downstream
to the next tank etc.
The method chosen was to implement a batch system. Several reasons for choosing this method, firstly, the
internal control modules in the system needed for continuous implementation were not completely operational, which
would require dedicating time to testing and code manipulation before the actual program could be started. Secondly, if the
system was continuous, it would greatly increase the operating time of the program. Thirdly, the amount of water recycled
to the drain would be higher than a simpler batch program. The only advantage of implementing a continuous system is
that it would demonstrate to visitors some process control. However due to the nature of the plant, some process control
will be needed to perform the batch process method and as a result batch processing was implemented.
The final decision on the general operation approach was to investigate a method of implementing the code. The
two possible methods that were available were the control modules and the sequential control modules. The sequential
control module was the most logical choice for creating a program to meet the design requirements, as it followed a step by
step execution, the other method, a normal control module would create lengthy functions and make the program much
harder to interpret. It was appointed that the SCM method be used to implement the automation program.
Program Design
Initially several ideas were considered when planning the program. The program had to be designed in a way that
could be easily described and modified in case of future changes. The main design constraint that was considered was the
control module size. If the size of a control module or sequential control module was too large then it would cause lag in the
control builder software environment and be incredibly harder to interpret by personnel who did not write the code.
The first approach that was considered was to implement the plant on a single sequential control module. However
after viewing the current maintenance program, which only contained the manipulation of the valves, it was decided to
make several SCM’s.

Pilot Plant Automation
Page 22
The second approach was to create two sequential control modules, one for each half of the plant, where the split
would occur following the lamella tank. After analysis of the amount of variables that would be manipulated it was assessed
that this would create sequential control modules that are still too large and were outside the software capabilities.
The third approach included having a sequential control module for each HMI section of the plant. This included a
total of five SCM’s, the storage tanks, ball mill tank, cyclone underflow tank, nonlinear – needle tank, and the CSTR tanks.
This method greatly reduced the amount of code needed for each section of the plant and also simplified the arrangement
of the program. This method also had some draw backs as it required some carful design on how to implement each state
and also how each section would be initialized.
After the decision was made to implement several sequential control modules, each represented by the
corresponding HMI page, it was discovered that control modules were needed to support the timers, delays and transitional
statement of each SCM. As a result each corresponding SCM needed a parallel control module containing parameters that
monitored several variables. These modules contained the valve delays, running timers and feedback monitoring for the
transitional statements. The feedback monitoring statements were used when the actual batch processing occurred. If the
pump or the raw water valve was left off, the program needed to be able to detect that this was the case and move on to
the next state of the program. The final design architecture of the program is illustrated below in Figure 13.
NT_TANKS_OP CSTR_TANKS_OPST_TANKS_OP BM_TANK_OP CUF_TANKS_OP
ST_TANKS BM_TANK CUF_TANKS NT_TANKS CSTR_TANKS
MAINTENANCE
PLANT CONTROL MODULES
OPERATION
READ
WRITE
Figure 13 – HMI Architecture
Each SCM would read and write to its parallel control module, sending information to start timers and delays while
receiving information to indicate that a level has been achieved, a pump had been left off or a valve timer had expired.

Pilot Plant Automation
Page 23
These modules read directly from the plant control modules, retrieving values such as level and flow-rate. The SCM’s also
write to parameters that were contained in a control module called MAINTENANCE. This module contains parameters that
represent every instrument in the plant, containing a block for every valve, pump valve position and agitator. The advantage
of this is that there is only one control module that has a direct effect on the other plants module. Without this there could
be numerous control modules that call variables, making the interpretation of the code much harder to understand. This has
also been designed this way in the anticipation that other programs may be installed on the plant. The addition of this
allows other programmers to use the same module to operate the plant by calling these same variables, allowing the plant
control modules to remain untouched. Operation includes blocks that initialized the SCM sequence, start the plant and logic
that relinquish control to the user. Finally the Plant control modules are responsible for the operation of the whole plant,
containing device controls for the pumps, valves, operating points and agitators.
Within these plant control modules lies a selector block (Figure 14). This block chooses between two inputs
depending on the state of the first flag. This first flag is the maintenance flag and when it becomes true the plant is under
program control, removing the option for the operator to manipulate the valves, pumps and agitators.
Figure 14 – Selector Block
SCM Design
When considering the design of the SCM several tests were implemented on the simulated controller to determine
the operation of this control module. It was determined that each SCM would need two handlers. A handler contains a
sequence of events that initiate when the start conditions are met. For example, the main handler contains the sequence of
events for that particular function; other handlers that could be added to this SCM can include abort, interrupt, stop and a
number of other sequences.
Initially the SCM’s contained three handlers, MAIN, ABORT and STOP. The MAIN handler contained the sequence of
events for a particular part of the plant, the ABORT handler contained a sequence that reset all the relating apparatus and
finally the STOP handler contained information for resetting the SCM and initiating the next.
After careful thought the STOP handler was removed from the design and added to the end of the MAIN handler,
this reduced the overall size to two handlers and limited the needed parameters for each SCM, without causing any serious
disadvantages.

Pilot Plant Automation
Page 24
SCM Operation
The operation of the SCM was relatively straight forward. After determining that each HMI page has its own SCM,
the order of events needed to be determined. It was decided that firstly each SCM would cycle every instrument on the
corresponding HMI page including agitators, solenoid valves and 3 way valves. After this event the specific pumps on the
corresponding HMI operate and pump water along the plant to the next tank. These pumps operate until one of the
transition conditions become true, for example, the level that the water is being drawn from reaches 5%, or if the level of
the tank the water is being transported to reaches 90%. This method was introduced for every SCM in this program.
Programming Standards
It was discussed at the beginning of the semester that a standard be adopted for the implementation of new code
and to modify any existing code to this standard. The standard that has been adopted was originally put forward by Kyle
Edwards (Edwards, 2010); however some slight modifications have been made to account for the new elements of the
program. (For full programming standard see Appendix 2.7). Below is a list of some of the more important programming
standards.
Written code must be placed in the control environment left to right, top to bottom.
o This standard was not followed with the original creation of the code from the PLC5 to the Honeywell C300
system.
Each CM must contain a description of the code at the top of the page, describing its purpose and if needed a more in-
depth description of the different variables that are being called/written.
o The reason for this is because many of the control modules call other variables from other control modules
thereby making it very confusing when the user has multiple windows open and is jumping between them to
determine the origin of the value.
Blocks must be named in a way that is descriptive.
o A lot of the current code contains parameter names that have no meaning to the control module or its
purpose, for example, B14_0_0_1.
I/O channel referencing, each I/O has already got its value being written to a parameter.
o The parameter must be called using this tag, and not by dragging in the I/O block and referencing it to the
specific input/output number.
All function blocks be coloured Grey, with the exception of the I/O blocks that are Blue.
The Face plate (variables shown on the face of the block) of the function block should only contain the related
parameters.
o For example, not show extra variables that are not wired.
Within a control module, all blocks should be wired and not be calling the parameter from a block from within the
same control module.
Sequential Control Modules must contain adequate commenting down the right had side, describing the functionality
of each step and transition.
Pilot Plant Automation
Page 25
Chapter 5: Initial Configuration
The Pilot plant was originally controlled by an Allen Bradley PLC5 and was converted to the Honeywell system
several years ago. This ladder-logic to function block conversion caused many unnecessary blocks, loss of naming to
parameters and unnecessary control modules. On top of this the code comments were lost during the transition. The original
PLC5 code was available however the differences between ladder logic and the Honeywell PKS programming environment
was too different for the PLC code to be considered for analysis. The company that did the conversion did supply some
information in the header of each control module; however this information was very brief. Once the program returned to
the university the code was manipulated by another student to get the system up and running, as the converted system did
not work instantly. All of this was done without converting the old documentation/adding documentation to the new
system. Once the plant was up and running several students worked on the system, with Shane Mackay (Mackay, 2012)
being the last. The configuration of the system at the start of this thesis included a maintenance program that cycled only
the valves of the plant, a partially started demonstration program, additions to the instrument control, HMI additions and
some PID modifications.
Initial Modifications
The initial maintenance program that already resided on the system needed to be removed without causing any
interruptions to the current plant operation. The issue was that it was tied to all systems, including when the plant initiated.
There was no documentation on how this system was tied in with the plant and there was no simple way to remove the
program without affecting normal operations. After approximately three weeks of analysing the plant’s code, the
maintenance program could be successfully removed without causing any issues to the operation of the plant. The
incomplete demonstration program that existed on the system was relatively easy to remove after the code analysis and the
removal of the maintenance program.
The additions to the instruments from previous works included check boxes on the HMI which allowed the cycling of
the 3 way valves and the initialization of the agitators from the HMI. These additions were added to the HMI because
previously the operation of the instruments had to be controlled from the operator window. This issue was that students
would switch the state of the device control to either program or operator, as discussed previously, which would cause the
valve to change for that instance but it would remove program control, only allowing the device to be changed from this
window. The addition of these extra instrument controls were not changed in this thesis.
The HMI additions from the Shane Mackay’s thesis (Mackay, 2012) were modified slightly, keeping the new
instrument controls but modifying the program initialisation representation. There were two indicators that represented the
buzzer and light as well as a check box for the plant initialisation. The check box was not changed however the two Boolean
indicators for the light and buzzer were removed.

Pilot Plant Automation
Page 26
The final modification to the system before the implementation of the new design was to get the plant to operate
once the HMI Operation check box was ticked. This box in the original configuration initialised the SCM for the maintenance
program, which upon completion gave control to the user from the HMI. Careful analysis of the implemented maintenance
SCM determined how to modify the OPERATION control module to allow the user to have control of the plant. The final
system included the buzzer and light operating for five seconds before the user had control of the plant.
The analysis of the pilot plant code produced several documents that describe the operation and functionality of
the components of the system. The documents include a block library and program documentation. The block library
describes the operation of the unknown and more complex function blocks and the program documentation lists the control
modules, corresponding blocks and gives a brief description of the operation of each.

Pilot Plant Automation
Page 27
Chapter 6: Implementation
Implementation of the program commenced in week five with the use of the simulated controller. As discussed
previously the simulated controller was used to test the sequential control modules. After the experimentation was
complete, the code for the various apparatus on HMI page 302 was then created. The various instruments can be seen in
Figure 15.
Figure 15 – HMI Page 303
The program was initially controlled by using a single flag that was manipulated by the use of an Excel Sheet and
the Honeywell Experion Microsoft Data Exchange add-on. Once true the sequential control module was activated and
implemented the first step. In the case of the 303 HMI page, the 3 way valves were switched to one position, the control
valve was closed, the solenoid valves opened (except the water addition valves) and the agitators were activated. After a
delay of 5 seconds the devices returned to the opposite state. The next sets of events that follow operate the batch
sequence, whereby the storage tank is filled to a minimum of twenty precent of the designated volume. If the tank is already
above this level it continues onto the next state where the feed pump is operated. The reference speed is set by the SCM to
one-hundred percent and then activated, however the pump will not turn on unless the transitional conditions are met. For
instance if the next tank along the line is already above the predetermined level of forty percent, or the storage tank does
not contain sufficient water (in the event that the tank could not receive water in the previous step) or the signal received
from the ball mill tank is NaN (See Appendix 1.1), the SCM will continue onto the next state. If the level conditions are met

Pilot Plant Automation
Page 28
the pump is activated and starts to ramp up to one-hundred percent. The program then monitors all variables until the level
in the ball mill reaches the required limit. An issue did arise in the instance that a pump had been left off or a manual valve
in the line between the tanks was closed. This would cause the program to freeze and trip the internal interlock of the pump.
A feed-back monitoring system was then created within the parallel control module to determine if any of these scenarios
occurred.
Once the SCM finished the feed pump operation the SCM resets the various parameters that were still active from
the last step and as a final execution, resets its own operation to the idle state. The next obstacle was to create a way of
initiating the next SCM, as the same transitional conditions could not be used. The reason this could not be reused was that
the first and second SCM would initiate at the same time. The method to resolve this problem was to create a new variable
called “STATE”. This variable represented the position of the program assigning the HMI 302 page as 0, 303 as 1 and so on.
By doing this and including this parameter in the initial transitional state assured that only once SCM could run at one
instance.
Once the first handler had been created and was fully functional another was needed in the case of an abort. The
handler “ABORT” contains less code than the MAIN handler with its function only needing to reset the used parameters back
to the initial configuration. This included putting the 3 way valves, solenoid valves, pumps and agitators back to the off
position. The final operation of the handler was to reset the program operation, relinquishing control and to reset the SCM
back into the idle state.
Parallel Control Module Contents
The previously mentioned feedback system occurred within the parallel control module that is related to the
specific SCM and monitors the flow transmitter. The SCM would trigger the monitoring operation and after a predetermined
time the program would detect that no flow was occurring and move onto the next state. The advantage of this is that no
harm can come to the specific pump as the SCM only activates the pump, allowing for the internal interlocks to override
issues, such as no water, power or manual valve manipulation down on the plant floor. The following image is the design of
the time outs that allow the program to move on if one of the above scenarios does occur.
Figure 16 – Monitoring Operation

Pilot Plant Automation
Page 29
FP_TIME_OUT is the variable that is activated by the SCM which triggers the timer. If the flow value received from
the flow meter is not above 1 then the resulting comparison is true. This is then compared after three seconds of the pump
operating and if this is still the case the output is then used in the transitional statement to trigger the next state. If this
event does occur a message is also sent to the operator though the program station, indicating that there has been a fault
with the particular device.
A system was also created for the solenoid valve that adds water to the storage tank. A similar concept was
implemented but a method was needed to determine if the tank level was actually increasing. If the tank was below its
lower limit and the program activated the raw water valve it would wait forever if the raw water main valve or instrument
air was left off. A solution to this was to implement a way of storing the level at the time of operation, then comparing it
back to the current value after a time delay. This method worked well with one need for correction. An issue arose when by
chance the level sensor fluctuated at the time of initial operation. If this fluctuation was below the current level of the tank,
for example, 45.62% with the actual level being 45.67% then the comparison would be false. In the event of this rare
occurrence combined with the raw water being disabled would cause a never ending program. This was solved by adding in
a bias of 0.1% to the stored variable, which with the time delay, as water is entering the tank, is easily compensated when
comparing it with the real-time variable.
The final issue to consider with the batch implementation was the scenario if the tank level read “NaN” (not a
number). This case only occurred if the tank was full, allowing the code to be designed to not pump water into a tank with
the NaN reading, but allowing the program to draw water from a tank with this NaN reading. It was assumed that the
program would know that NaN was a high PV, but after testing the software ignored logic and acted as if the tank was
below the transitional level. The issue was eventually solved by searching through the parameters of the analogue input
block. The devices are configured in a way that once the level becomes over a certain limit they send a “BAD PV” signal to
the controller. The value “NaN” is defined within the settings; however an additional flag can be monitored if this value has
been received. The “BADPV” flag within each input block can be retrieved and therefore monitored within the transitional
statements that were affected by this problem.
At the completion of the first sequential control module and some quick testing to confirm operation the creation
of the second SCM started. The main obstacle of this was to implement the initialisation of the new module and have a
smooth transition from the previous SCM. The first code resulted in a completely empty SCM only containing one handler
that initialized when the previous code completed. Once this was fully operational and running correctly the various
instruments were cycled in the same manner as the previous SCM, before continuing onto pumping water to the cyclone

Pilot Plant Automation
Page 30
tank. This was done in the same manner as the previously implemented SCM by including the relevant parameters and
feedback timeouts in the corresponding parallel control module. The various instruments can be seen in Figure 17.
Figure 17 – HMI Page 303
Once the second SCM had been completed the implementation of the third commenced. In much the same way the
SCM code was generated by cycling the instruments first then processing on to the batch processing. The difference with this
implementation is that the tank contained two pumps for the cyclone underflow tank. Two methods were considered with
implementing this section of the program. Firstly to get the pumps to withdraw half of the remaining water each one at a
time, with the other method to operate the pumps in parallel, as seen below in figure 18.

Pilot Plant Automation
Page 31
Figure 18 – HMI Page 304
After some research though the Honeywell knowledge builder data base a block was found that could perform the
required tasks. The “SYNC” block could be used to branch a transitional statement into separate parallel operations. Up to
eight could be used; however the HMI 304 page only contains three pumps. Each pump was utilised in parallel, where the
initial “branch” divided into three separate steps which initiated the pumps by defining the reference speed and changing
the operating state to true. Once this was accomplished three transitional statements were created which monitored
variables in the same manner as previously outlined in the first SCM. The advantage of this is that one of the parallel
transitions could trip, turning the pump off, but allowing the others to continue with the operation. In the case of the recycle
pump (Cyclone recycle pump to the ball mill), would trip once the pre-determined value had been reached, leaving the rest
of the water in the cyclone underflow tank to return to the storage tank through the cyclone underflow pump. This
operation greatly reduced the time for the operation of this HMI page allowing for the SCM to initial the next much earlier.
The other tank contained on this page was the lamella underflow tank; this pump has no level sensor and as a result caused
several issues, one being the interlock which will be discussed later in this paper. The issue was that there is no way to
determine if the tank has received any water, however after testing of the systems and the operation of the ball mill pump it
was discovered that sufficient water will always remain in the lamella tank for a quick pulse, satisfying the design
requirement that all instruments be used in this automation program.

Pilot Plant Automation
Page 32
The second last SCM included operating the non-linear / needle tank sections as seen in the following image.
Figure 19 – HMI Page 305
The implementation of this SCM differed from the previous setups. The reason for this is because of two differences
apparent in this section of the plant. Firstly, one of the instruments is the water addition valve to the non-linear tank and
secondly the amount of water produced in the batch processing will not be adequate in compensating for scenarios that
could exists in the CSTR tank system. The SCM initialized in much the same way as the previous SCM’s by cycling the valves,
however once cycled on, they stayed on until the level reached approximately 30% of the tank. This removed a few steps in
the SCM and also decreases some of the operating time.
The most significant scenario as mentioned previously included the CSTR’s being empty and if a batch process was
to be implemented then the very small volume used to fill the needle tank would not even register in the CSTR 3 level sensor,
so a different approach was needed to implement this section of the plant.
After considering the two different possibilities, firstly to implement batch processing in a loop until the CSRT’s
registered a level change and secondly to implement a control solution, the decision was to implement a continuous process
using the inbuilt controllers. Not only did this solve the issue it decreased the overall operating time as well as provided
some process control that could be demonstrated to the visitors.

Pilot Plant Automation
Page 33
This involved implementing the inbuilt PID blocks to control the level of the non-linear tank and needle tanks. The
non-linear tank was controlled but the raw water addition valve and the needle tank was controlled by the needle tank
pump leaving the flow disturbance pump to be a constant.
The SCM program has to account for any changes that could occur during periods that the program isn’t running,
therefore the set point, Gain, Tau I and Tau D are all rewritten to the controller. Upon completion of the valve manipulations
the non-linear tank reaching the desired level, the flow disturbance pump fills the needle tank to the steady state value of
50%. Once this has been completed the raw water controller, flow disturbance pump and needle tank pump controller are
activated simultaneously. The program continues until the CSTR level reaches 10%. The safe guards include monitoring the
levels of all tanks and the flows from the various pumps
Finally the CSTR page (306) was created. Again the same method was used, by cycling the various instruments in
the figure below, before performing the batch application.
Figure 20 – HMI Page 306
Pilot Plant Automation
Page 34
The only variation that the last sequential control module had was that the solenoid valves located on the dye tank
page (307) were included in the CSTR valve cycle. The reason for this is because the dye page contains four instruments, the
three valves and pump. The Pump cannot be used as there is no way to add water to the tank (manual valve) nor is there a
way to monitor the level in that tank. As a result the three valves associated with that HMI page are included in the CSTR
SCM.
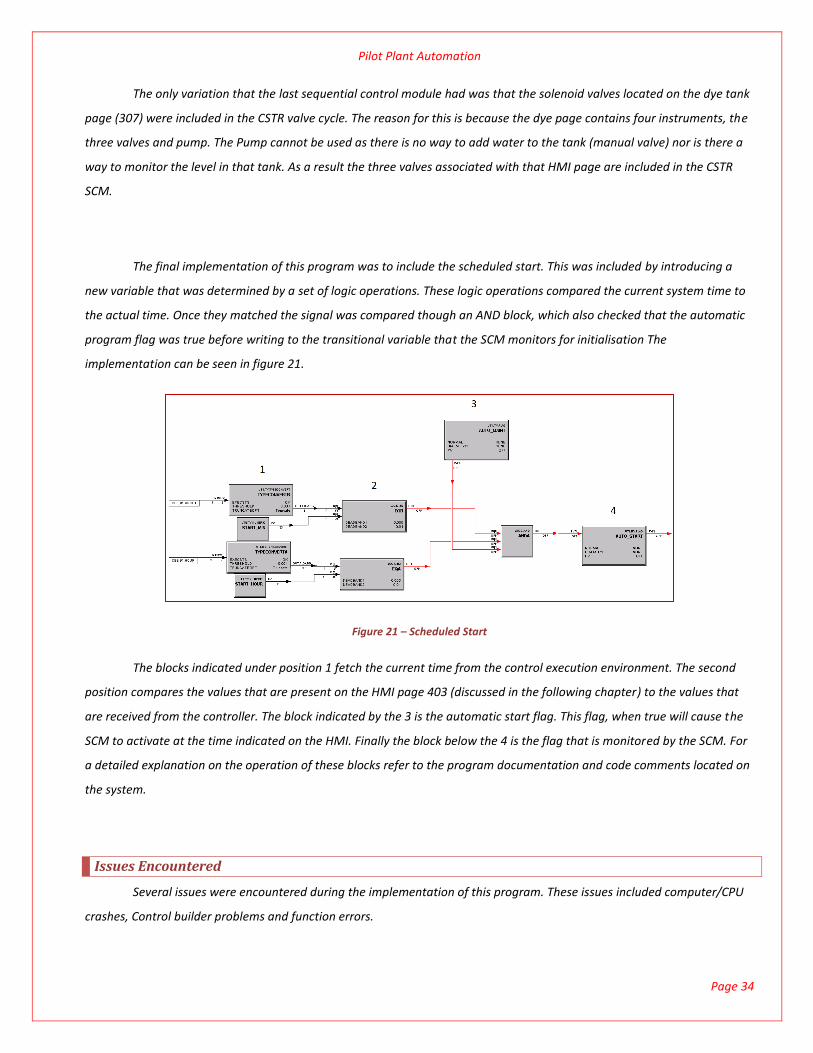
The final implementation of this program was to include the scheduled start. This was included by introducing a
new variable that was determined by a set of logic operations. These logic operations compared the current system time to
the actual time. Once they matched the signal was compared though an AND block, which also checked that the automatic
program flag was true before writing to the transitional variable that the SCM monitors for initialisation The
implementation can be seen in figure 21.
Figure 21 – Scheduled Start
The blocks indicated under position 1 fetch the current time from the control execution environment. The second
position compares the values that are present on the HMI page 403 (discussed in the following chapter) to the values that
are received from the controller. The block indicated by the 3 is the automatic start flag. This flag, when true will cause the
SCM to activate at the time indicated on the HMI. Finally the block below the 4 is the flag that is monitored by the SCM. For
a detailed explanation on the operation of these blocks refer to the program documentation and code comments located on
the system.
Issues Encountered
Several issues were encountered during the implementation of this program. These issues included computer/CPU
crashes, Control builder problems and function errors.

Pilot Plant Automation
Page 35
Access Lock
Access lock caused an hour downtime when the system crashed after tying to implement too much at once. It was
discovered through Honeywell knowledge builder, that if the system crashes, a module currently being edited by a user will
be locked. As a result of this, if the module is reopened even by the same user, an error message is received stating that the
module is already open by another user. The solution to this issue was to use the DB Admin tool and clearing all active locks,
allowing the module to be reopened. For a full example refer to the troubleshoot document.
Figure 22 – Access Lock
SCM Transitional Issue
During the creation of the CUF_TANKS SCM, an error occurred after downloading the latest code to the controller.
One of the handlers failed to configure, resulting in the SCM abort sequence to be inaccessible.
Figure 23 – Error Message
The error could not be fixed easily and after several hours of searching through the data base Honeywell was
contacted. After several days of no reply and experimentation, the solution was found before Honeywell had a chance to
respond. The issue was created by copying another transitional statement from another SCM and for whatever reason the
program environment associated the copied transitional statement to the original location causing this error. The solution
was to simply delete the statement and re-write it.

Pilot Plant Automation
Page 36
Chapter 7: HMI Design Requirements and Implementation
The required design specifications for the HMI included an interface that would control the newly implemented
program; indicators on the control pages and a program override,
Implementation
Implementation began by opening up the HMI web display builder program and navigating to the pilot plant
development folder. This folder contains the current HMI’s and is where any experimentation and additions are preformed
before the new screens are rolled out on the server and client PCs. Station is used to test the developed HMI’s and is done by
connecting to the files located on the server computer.
Design
The interface that operator used included several controls and can be seen in Figure 24.
Figure 24 – Control Interface
Firstly a tick box was used to initiate the program at the request of the operator. This Flag simply initiated the first
SCM transitional statement depending on several conditions (Refer to program documentation). The second flag was the
automatic maintenance flag; this initialised the program if the time located in the number boxes matched the system time.
These times are automatically written to the corresponding control modules upon a change. The last flag that was used in
the control interface was the trouble shoot flag. This flag initialised the trouble shoot SCM which will be discussed in chapter
10)
Pilot Plant Automation
Page 37
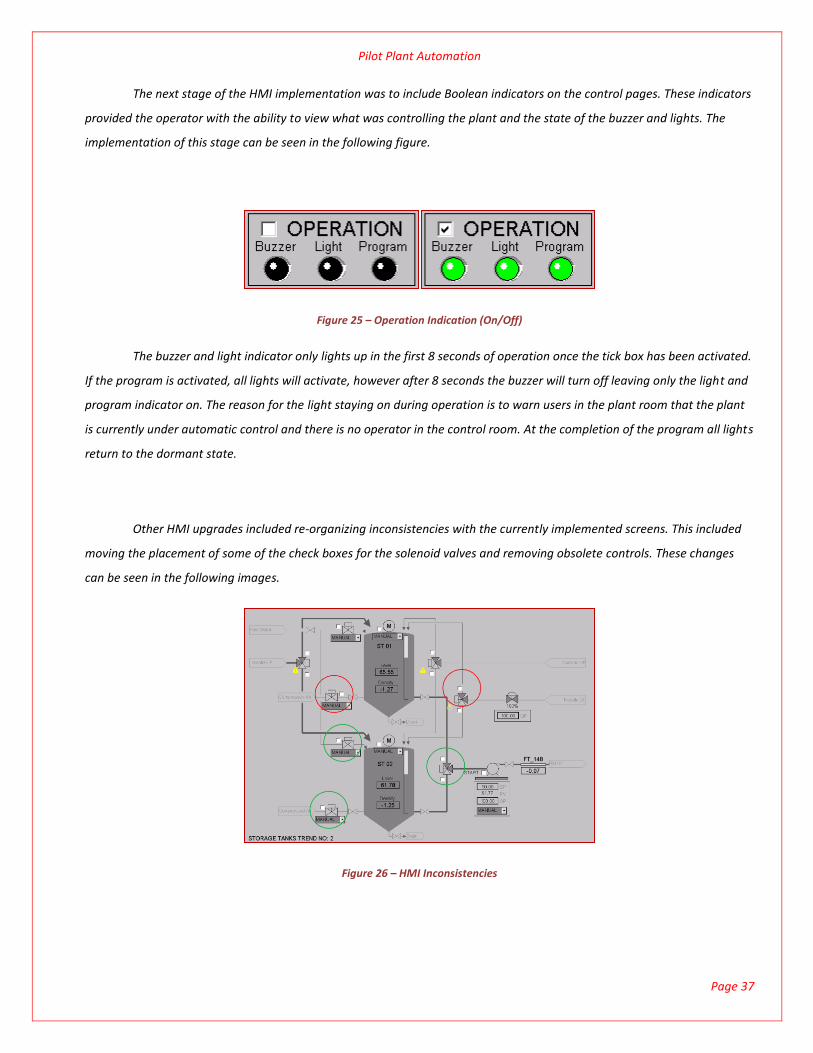
The next stage of the HMI implementation was to include Boolean indicators on the control pages. These indicators
provided the operator with the ability to view what was controlling the plant and the state of the buzzer and lights. The
implementation of this stage can be seen in the following figure.
Figure 25 – Operation Indication (On/Off)
The buzzer and light indicator only lights up in the first 8 seconds of operation once the tick box has been activated.
If the program is activated, all lights will activate, however after 8 seconds the buzzer will turn off leaving only the light and
program indicator on. The reason for the light staying on during operation is to warn users in the plant room that the plant
is currently under automatic control and there is no operator in the control room. At the completion of the program all lights
return to the dormant state.
Other HMI upgrades included re-organizing inconsistencies with the currently implemented screens. This included
moving the placement of some of the check boxes for the solenoid valves and removing obsolete controls. These changes
can be seen in the following images.
Figure 26 – HMI Inconsistencies

Pilot Plant Automation
Page 38
Figure 27 – HMI Redundant Displays
The Ordering of the actual HMI Screens was inconsistent, for example, to navigate to the control interface either
took the knowledge of the actual screen reference number or to sift through three different screens. Below is the newly
implemented HMI map in figure 28.
402
403
301 302 303 304 306 307
401
308
305
Figure 28 – HMI Architecture
This design simplifies the navigation from what was previously implemented. The triangles surrounding each oval
indicate the actual buttons on the HMI, seen above in the corner of figure 28. The yellow ovals represent the normal control
screens that have been discussed thus far. The red ovals indicate control points; where 403 is the control interface for the
newly implemented program and 402 is the control parameter window. The two green ovals are miscellaneous HMI
windows, 308 it the VSD monitoring speeds and 401 is the calibration for some of the automatic functions. For more
information on using the HMI software refer to 2012 ENG454 students – Experion for teaching purposes project. The Final
changes to the HMI include commenting on the control windows a brief explanation on how to control the system.
Pilot Plant Automation
Page 39
Chapter 8: Scenario Testing
After completion of the automation program many scenarios in relation to the valves and switches was considered.
These scenarios were created to test the performance of the program and to analyse possible issues that they may cause. As
a result of these tests the program underwent upgrades and modifications to act in the event that one of these scenarios
occurred.
Different isolation tests were implemented and these included manipulating the manual valves, pump power
switches, drain valves. Other tests included starting the program with all tanks at capacity, starting the system with all the
tanks empty and testing the program with the input PV’s as Nan.
For a full list of the scenarios tested and the outcomes produced refer to Appendix 2.6
Changes Implemented
As a result of the scenario testing numerous changes were made. Some of these changes were insignificant and
others included writing large amount of logic operations to increase efficiency. Some of the smaller changes included
changing the default comparison values, such as level limits and flow limits. The largest change implemented was an issue
with the storage tank. In the event that the storage tank is empty at the initialisation of this program, the timer for the raw
water valve expires before a change in level is detected. This was solved by introducing a longer time delay. However after
experimentation this timer needed to be approximately 1200 seconds (20 minutes) before a level change was detect. This
was acceptable, but an issue occurred when the level was just below the required limit and the raw water/instrument air
was switched off. The issue is that the program would take 20 minutes to determine that this was the case. The problem
was fixed by using logic to select between two timers, if the reading was below the empty level the 20 minute timer would
be used and if above the 30 second timer would be used. This resolved the issue with the programming waiting 20 minutes
to determine if the raw water was switched off.

Pilot Plant Automation
Page 40
Chapter 9: Additional Upgrading of the Pilot Plant
Apart from the implementation of the automation program, other upgrades were implemented to improve
performance and functionality. These upgrades included removing obsolete code, installing interlocks, reprogramming of
the light operation, introducing a trouble shoot function, a drain and flow meter failure detection system and finally the
addition of new hardware.
Obsolete code
Within the Experion programming environment there are many control modules, each contain code that represents
the functionality of a particular part of the plant. In some of these modules there is code that is completely irrelevant to the
operation of the system, whether this code was generated or implemented by the PLC to Honeywell conversion, this code is
not needed and needs to be removed. Initial analysis included removing code that clearly had no functionality whatsoever,
this included function blocks such as “AND” in series with the same parameters (Figure 29). The advantages of this is not
only to reduce the number of function blocks, as well as the size of each control module, but also increase the execution
speed of the control module. Although the removal of one or two blocks causes’ insignificant speed increases, this act ion
helps in the simplification of the overall understanding of the code.
Figure 29 – Redundant Code
The most significant obsolete code that was installed in the plant controller was the control module known as
“Warn Light”. This control module contained the digital output for the warn light, as well as an extra 30 blocks, which after

Pilot Plant Automation
Page 41
analysis, performed no apparent operation. The analysis of the original code suggested that when an alarm triggered, the
warn light turned on and after a delay, if the issue was not resolved, shut down the plant. This operation functionality is
handled differently in the Honeywell Experion program environment by the use of interlocks on each apparatus (Discussed
on page 43#). As a result, the removal of the “warn_light” code commenced immediately after the ENG346 class dependant
on the system finished. This could not be done sooner as the “warn_light” variables are thoroughly tied into the system and
a lot of downloading and testing of the modified code is needed before the code modifications can be approved. Currently
only some of this code has been removed as the time frame to execute this task was extremely small and quickly
approaching the submission of this report. Although this has not been completely finished, a document has been created to
ensure that correct procedure is carried out when performing the rest of this code removal.
Safety Override Interlock
The safety interlock is a Boolean parameter used in conjunction with the DEVCTRL block, highlighted in Figure 30
Figure 30 – Interlock Code
This Boolean parameter is programmed with respect to the apparatus that device control block is controlling. With
pumps, the main parameters that are monitored are the flow meters which are located immediately after the output of the
pump. The logic that accompanies these parameters compares the value of the flow meter to the state of the pump. For
example, if the pump has been activated and the flow is not greater than 1, the resulting logic turns the interlock parameter
to true after a time delay of 5 seconds. This logic can be seen in Figure 31
Figure 31 – Interlock Logic

Pilot Plant Automation
Page 42
The Flow limit is defined by the Flow_Limit Numeric Block, which is then compared to the fetched value of the flow
meter; if this comparison is true then the output value is compared to the current state of the pump using an AND block. If
the resulting comparison is true then the interlock on the device control will be activated.
During the operation of the plant several issues with the some of the instruments became apparent. The first was
the operation of the lamella underflow pump, shown in figure 32
Figure 32 – Lamella Tank
With most pumps, as previously mentioned, the flow meter is the main instrument that initialises the interlock and
in other cases the level of a tank is used to trip the interlock. For example, if the level is less than 1%, the interlock is
activated. However, the lamella underflow pump has no flow meter, nor does the lamella tank contain a level sensor. A
solution to this issue was to use the flow meter measuring the flow leaving the lamella tank, as seen highlighted in the green
circle above. The logic that followed stated that if the overflow was less than a predetermined amount, then the pump
would turn off. This logic was implemented because of several reasons; the first is that there is no way of determining the
amount of water in the tank. The second is that activation of the pump cannot safely occur without the flow meter giving a
positive value. This does restrict the use of the pump; however there is no reason to activate the pump if there is no overflow
from the tank. For whatever reason that this is the case and the over flow needs to be completely removed, then a controller
can open the drain to the tank, or change the cyclone valve to return all water to the underflow. This is the only logical way
to safely ensure that the pump is not running dry without installing new hardware, such as a flow meter or level sensor.
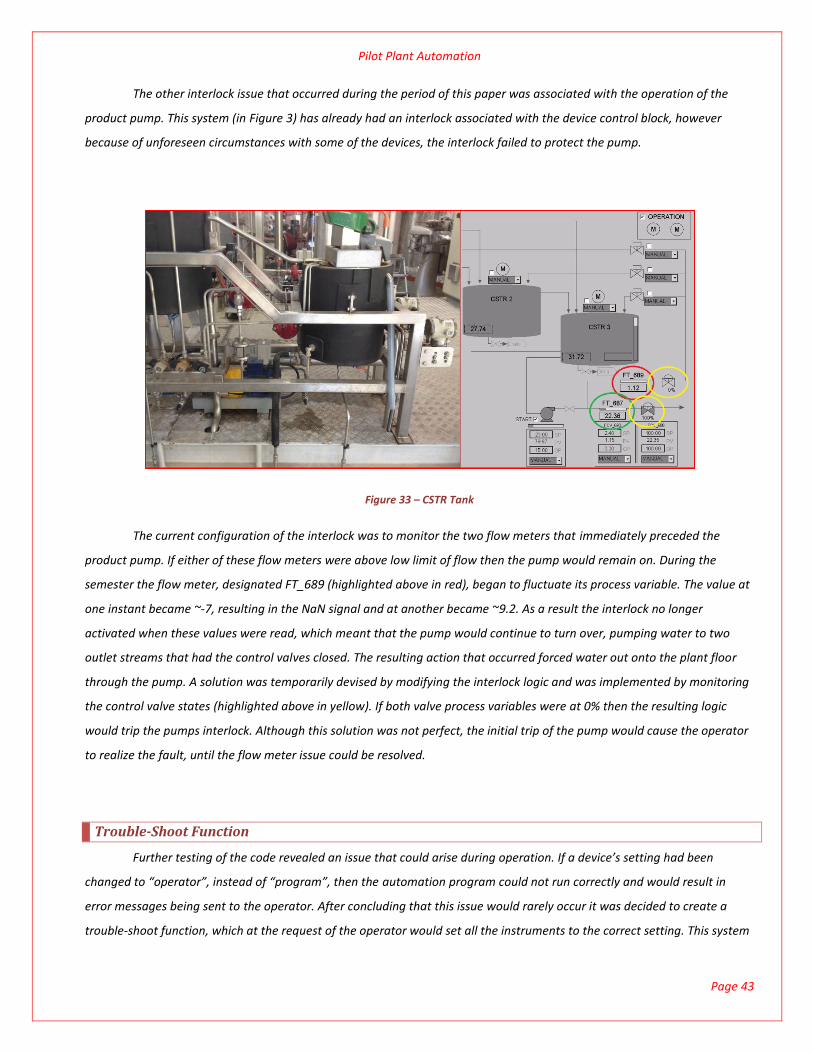
Pilot Plant Automation
Page 43
The other interlock issue that occurred during the period of this paper was associated with the operation of the
product pump. This system (in Figure 3) has already had an interlock associated with the device control block, however
because of unforeseen circumstances with some of the devices, the interlock failed to protect the pump.
Figure 33 – CSTR Tank
The current configuration of the interlock was to monitor the two flow meters that immediately preceded the
product pump. If either of these flow meters were above low limit of flow then the pump would remain on. During the
semester the flow meter, designated FT_689 (highlighted above in red), began to fluctuate its process variable. The value at
one instant became ~-7, resulting in the NaN signal and at another became ~9.2. As a result the interlock no longer
activated when these values were read, which meant that the pump would continue to turn over, pumping water to two
outlet streams that had the control valves closed. The resulting action that occurred forced water out onto the plant floor
through the pump. A solution was temporarily devised by modifying the interlock logic and was implemented by monitoring
the control valve states (highlighted above in yellow). If both valve process variables were at 0% then the resulting logic
would trip the pumps interlock. Although this solution was not perfect, the initial trip of the pump would cause the operator
to realize the fault, until the flow meter issue could be resolved.
Trouble-Shoot Function
Further testing of the code revealed an issue that could arise during operation. If a device’s setting had been
changed to “operator”, instead of “program”, then the automation program could not run correctly and would result in
error messages being sent to the operator. After concluding that this issue would rarely occur it was decided to create a
trouble-shoot function, which at the request of the operator would set all the instruments to the correct setting. This system

Pilot Plant Automation
Page 44
was developed by using the sequential control module to systematically write the correct valves to the corresponding device
control blocks. This system worked flawlessly, however an error had to occur before the operator was aware of the issue. So
a decision was made to also use this trouble-shoot function during the warning time at the start of the plants program. This
would allow the automation program to run on the plant with every instrument in the correct setting, removing the
possibility of the device setting causing an error. As a result the trouble-shoot function is automatically ran during the
warning stage of the program and included in the HMI design, as it can also be used by the operator if instrument issues are
being experienced.
Drain Detection
A further improvement to the system was creating logic that detected if a drain valve was open during the program
operation. This improvement allowed the implemented program to be completely reliable under normal circumstances. The
issue was first noticed during one of the testing phases. During the operation of filling the ball mill tank the only two
possibilities that could have tripped the transitional statement was the level reaching the required height, or if the flow
meter reading dipped below the limit. These conditions only occurred if the drain valve was closed and if left unmodified, the
feed pump would continue to pump into the ball mill tank until the source of the water (storage tank) reached its level limit.
If this scenario was to occur, then the entire storage tank would be emptied and would continue to happen on a daily basis,
until an operator noticed that the drain valve was open. A solution was devised by creating logic that if the level had not
changed within a given time frame then a error message would be received and the program would move on to the next
step. This logic can be seen highlighted in green in Figure 34.
Figure 34 – Drain Detection
Once the logic is activated by the BMP_TIM_OUT flag, the flow meter value is compared to the minimum required
value. If this comparison is false (the tank is receiving flow) and the height of the tank is below the lowest limit a 30 second

Pilot Plant Automation
Page 45
timer determines if the drain valve is open. It has been determined that if the tank is completely empty that the level will rise
above the minimum level before the 30 seconds expire, if this is not the case the program is tripped by the resulting AND
comparison and an error is sent to the control room. This method has been used for all the tanks where the level increase is
determined by an input from a pump.
Bad PV Detection
The final safe guard that was added to the implemented program was to include a bad process variable detection
system, if for whatever reason, the flow meters failed. The need for this safe guard is because the pump timeouts are
depended on the flow meter reading. If the reading is “NaN” then the pumps would continue to run regardless if there was
water in the tanks or not, possibly causing harm to the instruments. This was done simply by monitoring the status of the
process variable in the transitional statement for the given operation. If this value became true the program would simply
move onto the next step. This scenario is very unlikely and would only occur if the power had been cut to the instrument or if
the instrument had hardware issues. The addition of this detection can be seen in the following transitional state (figure
35).
Figure 35 – Bad PV Detection
Flow Meter Issues
During the operation of the pilot plant throughout the semester a number of issues arose, many of these were
quick fixes. However an issue with the product pump recycle flow meter could not be solved quickly. The reading from the
flow meter was reading either a high value or “NaN”, when there was no flow going through the transmitter. The
repercussions of this was not obvious at first, as these flow meters are very rarely used by the ENG346 students, however
after analysis it was found that this flow meter was also intertwined with the interlock for the product pump. The interlock
associated with this pump compares the value of the two flow meters and if both are below the value of 1, then the pump
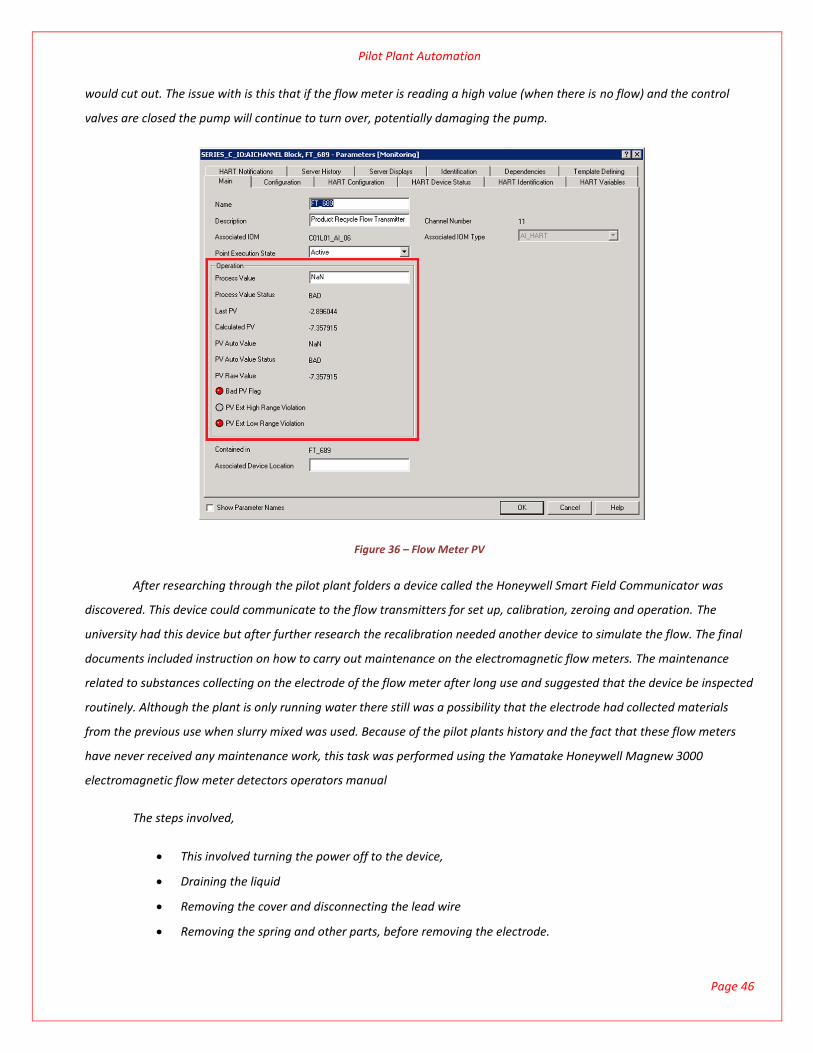
Pilot Plant Automation
Page 46
would cut out. The issue with is this that if the flow meter is reading a high value (when there is no flow) and the control
valves are closed the pump will continue to turn over, potentially damaging the pump.
Figure 36 – Flow Meter PV
After researching through the pilot plant folders a device called the Honeywell Smart Field Communicator was
discovered. This device could communicate to the flow transmitters for set up, calibration, zeroing and operation. The
university had this device but after further research the recalibration needed another device to simulate the flow. The final
documents included instruction on how to carry out maintenance on the electromagnetic flow meters. The maintenance
related to substances collecting on the electrode of the flow meter after long use and suggested that the device be inspected
routinely. Although the plant is only running water there still was a possibility that the electrode had collected materials
from the previous use when slurry mixed was used. Because of the pilot plants history and the fact that these flow meters
have never received any maintenance work, this task was performed using the Yamatake Honeywell Magnew 3000
electromagnetic flow meter detectors operators manual
The steps involved,
This involved turning the power off to the device,
Draining the liquid
Removing the cover and disconnecting the lead wire
Removing the spring and other parts, before removing the electrode.

Pilot Plant Automation
Page 47
The electrode was cleaned with mineral-turpentine., before reinstalling the components.
Once the device was powered up, stationary water pumped into the pipe and was left for 10 minutes.
Upon completion of this task the flow meter was reading a value of zero and was very stable. Once flow was present the
meter read the correct values, however, the following day the issue was checked and it was found that the meter was
reading a high value again. After some quick reading it was discovered that air bubbles cause erratic and high values to be
read in electromagnetic flow meters. To confirm that this is the case, the flow meter was filled with stationary water. The
resulting value read zero again. Inspection proceeded around the instrument to confirm where the water was leaking out to.
The Product pump seal was dripping water at an alarming rate, which would cause the water in the pipe to gravitate back
down the line, leaving the flow meter waterless. This scenario is illustrated in Figure 37.
Figure 37 – Flow Meter Analysis
This accounted for the issue and the pump was repaired by regreasing and tightening the seal. As a result the flow meter
correctly reads the value, assuring that the interlock placed on the pump is in correct working order.
Hardware Additions
The first hardware addition included installing a momentary push button. This was used to initiate the automation
program from the plant floor, allowing for the demonstrators to easily show the plant operating. This button was
programmed in by creating another control module named MS_100 (Momentary Switch). The blocks include the digital

Pilot Plant Automation
Page 48
input connecting to a pulse, followed by a flag block. This followed the standard that stated that all I/O have their own
control modules and the parameters are called by other control modules. This arrangement can be seen in the flowing
image.
Figure 38 – Momentary Switch Control Module
The Pulse block is needed because of the operation of the SCM. The push button behaves as a positive edge
momentary switch. If the button is pushed and held on, the resulting action caused the program to activate the flag for 1
second and then turn off regardless if the button is still being held down. The flag can only be reactivated if the button is
released and pushed again. This is needed because the SCM control modules use the both the button to start and stop the
program. If the button was active for more than once iteration after the program initialised, it would instantly cause an
abort. Placing this pulse in the control module removes the risk of this occurring, also allowing the operator/demonstrator
to hold the button down until the program initialises. The images below show the button and the digital input wiring to the
module. The wiring of this additional hardware was straight forward, by using the created turboCAD wiring diagrams, a
suitable input could be found.
Figure 39 – Momentary Button and Digital Input Wiring
The final hardware addition included the instalment of a new light and buzzer. The previously implemented
hardware was a temporally instalment sitting on top of the PLC cabinet. The actual light suffered damage as a result of the
power consumption and the time period at which the light ran due to the programming code. This code has now been
changed so that the buzzer and light stay of for 8 seconds once an operator is in control. When the automation program in
initialised both the buzzer and light stay on for 8 seconds, however the buzzer turns off and the light stays on during this

Pilot Plant Automation
Page 49
operation of this program. This is need because anyone entering the pilot plant room needs to be aware that there is no
operator controlling the plant during the automation program. The addition of these devices can be seen in the Figure 40.
Figure 40 – Light and Buzzer
Chapter 10: Future Works
During this thesis project several ideas were noted that could improve the system. These included general
maintenance issues, addition of a fresh water system, solenoid valves and a level sensor.
Maintenance Issues
Several instruments were not operational during the period of this semester. These included the 3-way-valves associated
with some of the recycle streams to the storage tank. Once of the valves had become inoperable and was leaking
compressed air, as a result the air line was closed, also affecting the other two working 3-way-valves. The following image
indicates these valves. Other instruments included the storage tank agitator and compressed air solenoid valve. A
document has been created to indicate the repairs that need to be completed at some stage.
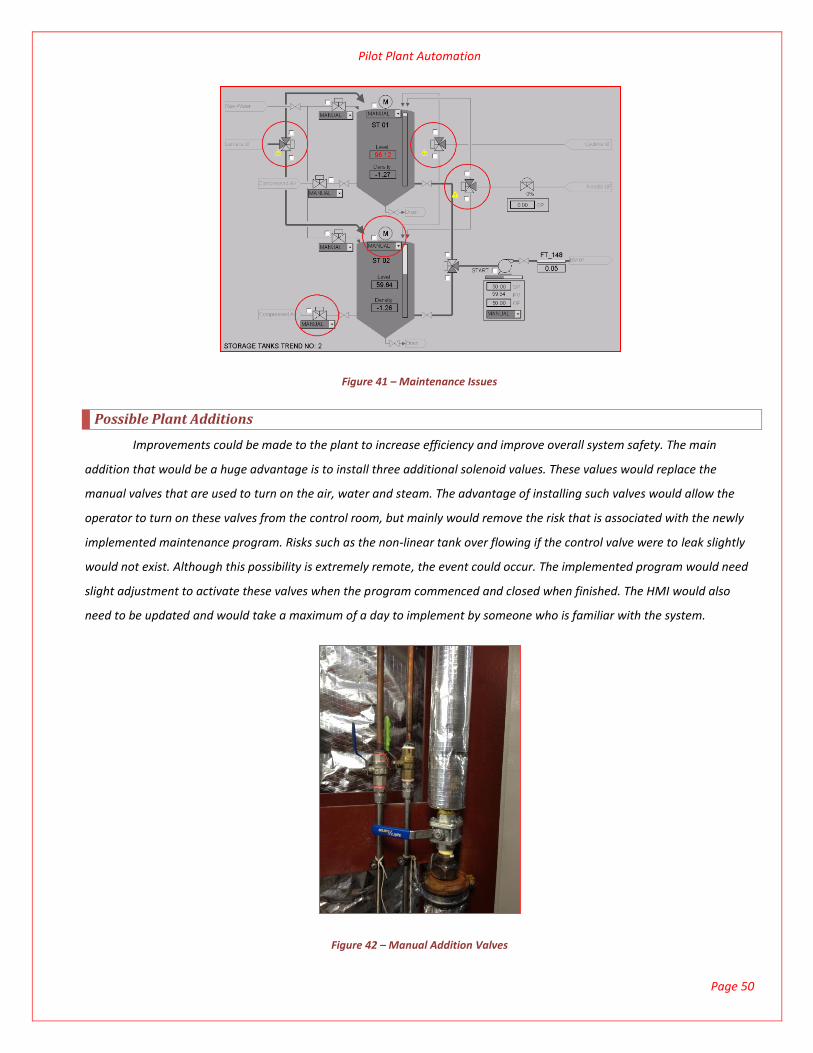
Pilot Plant Automation
Page 50
Figure 41 – Maintenance Issues
Possible Plant Additions
Improvements could be made to the plant to increase efficiency and improve overall system safety. The main
addition that would be a huge advantage is to install three additional solenoid values. These values would replace the
manual valves that are used to turn on the air, water and steam. The advantage of installing such valves would allow the
operator to turn on these valves from the control room, but mainly would remove the risk that is associated with the newly
implemented maintenance program. Risks such as the non-linear tank over flowing if the control valve were to leak slightly
would not exist. Although this possibility is extremely remote, the event could occur. The implemented program would need
slight adjustment to activate these valves when the program commenced and closed when finished. The HMI would also
need to be updated and would take a maximum of a day to implement by someone who is familiar with the system.
Figure 42 – Manual Addition Valves
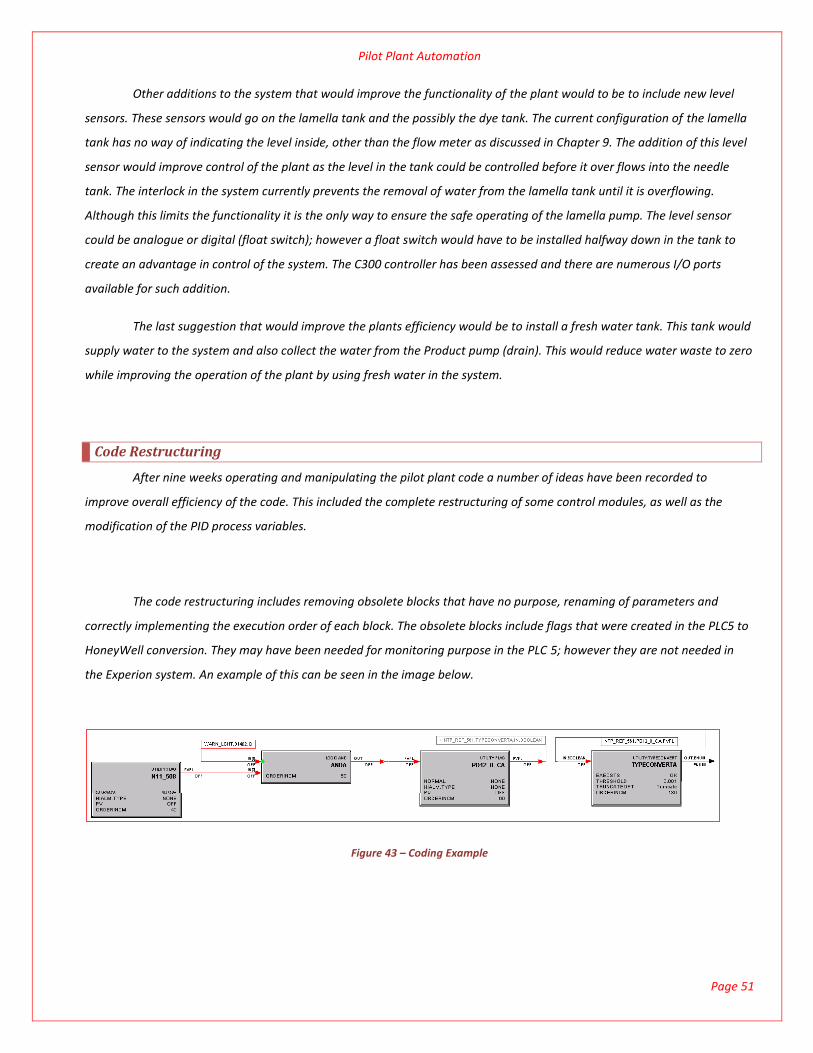
Pilot Plant Automation
Page 51
Other additions to the system that would improve the functionality of the plant would to be to include new level
sensors. These sensors would go on the lamella tank and the possibly the dye tank. The current configuration of the lamella
tank has no way of indicating the level inside, other than the flow meter as discussed in Chapter 9. The addition of this level
sensor would improve control of the plant as the level in the tank could be controlled before it over flows into the needle
tank. The interlock in the system currently prevents the removal of water from the lamella tank until it is overflowing.
Although this limits the functionality it is the only way to ensure the safe operating of the lamella pump. The level sensor
could be analogue or digital (float switch); however a float switch would have to be installed halfway down in the tank to
create an advantage in control of the system. The C300 controller has been assessed and there are numerous I/O ports
available for such addition.
The last suggestion that would improve the plants efficiency would be to install a fresh water tank. This tank would
supply water to the system and also collect the water from the Product pump (drain). This would reduce water waste to zero
while improving the operation of the plant by using fresh water in the system.
Code Restructuring
After nine weeks operating and manipulating the pilot plant code a number of ideas have been recorded to
improve overall efficiency of the code. This included the complete restructuring of some control modules, as well as the
modification of the PID process variables.
The code restructuring includes removing obsolete blocks that have no purpose, renaming of parameters and
correctly implementing the execution order of each block. The obsolete blocks include flags that were created in the PLC5 to
HoneyWell conversion. They may have been needed for monitoring purpose in the PLC 5; however they are not needed in
the Experion system. An example of this can be seen in the image below.
Figure 43 – Coding Example

Pilot Plant Automation
Page 52
This example provides a number of issues with the current code. Firstly, the parameter from the “warn_light”
module can be seen entering the ANDA block and as previously discussed, the “warn_light” code is completely redundant.
Secondly, the Flag variable PD12_8_CA has absolutely no purpose. It is suspected that these were needed in the PLC5
implementation for monitoring, however this variable is not being monitored. Thirdly the output from the PD12_8_CA flag is
being passed through the reference node to a block that is in the same control module. This method is only needed if the
fetched variable is from another module. The PD12_8_CA and the TYPECONVERTA could be physically wired, thus causing
absolutely no change to the program, but making it extremely easier to understand. These issues are scattered throughout
all the modules in the pilot plant system, and would take a considerable amount of time to successfully remove, reprogram
and test the operation of each module.
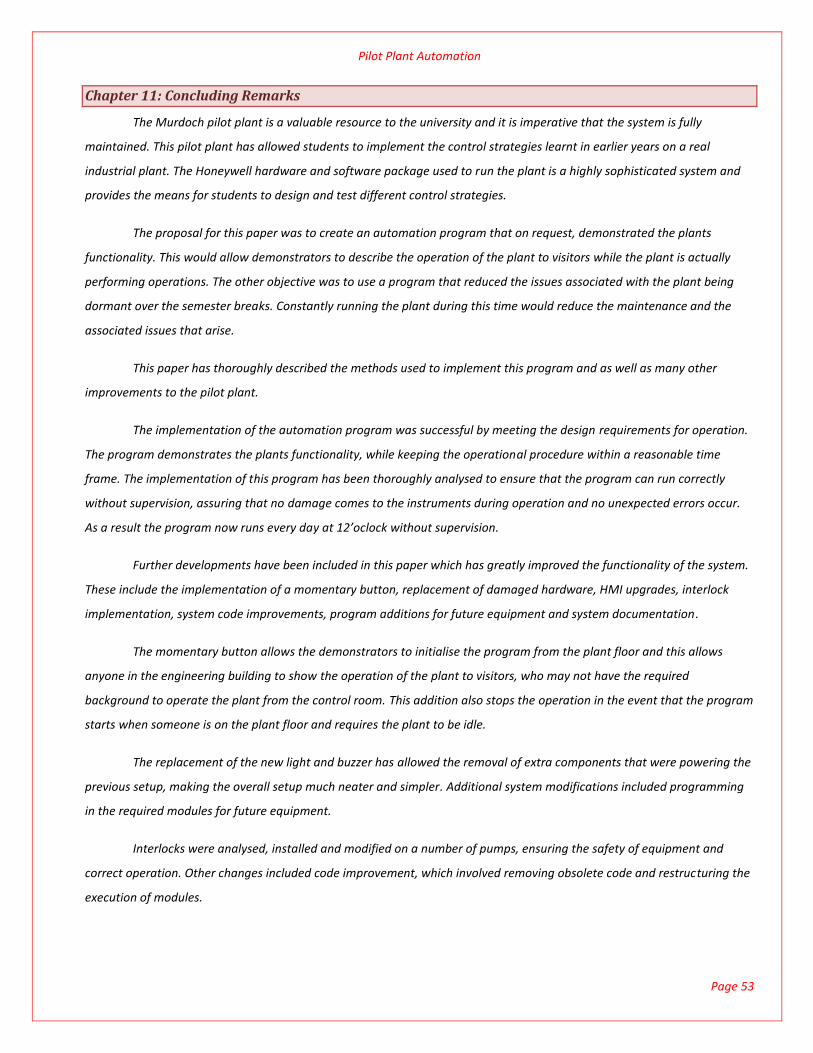
Pilot Plant Automation
Page 53
Chapter 11: Concluding Remarks
The Murdoch pilot plant is a valuable resource to the university and it is imperative that the system is fully
maintained. This pilot plant has allowed students to implement the control strategies learnt in earlier years on a real
industrial plant. The Honeywell hardware and software package used to run the plant is a highly sophisticated system and
provides the means for students to design and test different control strategies.
The proposal for this paper was to create an automation program that on request, demonstrated the plants
functionality. This would allow demonstrators to describe the operation of the plant to visitors while the plant is actually
performing operations. The other objective was to use a program that reduced the issues associated with the plant being
dormant over the semester breaks. Constantly running the plant during this time would reduce the maintenance and the
associated issues that arise.
This paper has thoroughly described the methods used to implement this program and as well as many other
improvements to the pilot plant.
The implementation of the automation program was successful by meeting the design requirements for operation.
The program demonstrates the plants functionality, while keeping the operational procedure within a reasonable time
frame. The implementation of this program has been thoroughly analysed to ensure that the program can run correctly
without supervision, assuring that no damage comes to the instruments during operation and no unexpected errors occur.
As a result the program now runs every day at 12’oclock without supervision.
Further developments have been included in this paper which has greatly improved the functionality of the system.
These include the implementation of a momentary button, replacement of damaged hardware, HMI upgrades, interlock
implementation, system code improvements, program additions for future equipment and system documentation.
The momentary button allows the demonstrators to initialise the program from the plant floor and this allows
anyone in the engineering building to show the operation of the plant to visitors, who may not have the required
background to operate the plant from the control room. This addition also stops the operation in the event that the program
starts when someone is on the plant floor and requires the plant to be idle.
The replacement of the new light and buzzer has allowed the removal of extra components that were powering the
previous setup, making the overall setup much neater and simpler. Additional system modifications included programming
in the required modules for future equipment.
Interlocks were analysed, installed and modified on a number of pumps, ensuring the safety of equipment and
correct operation. Other changes included code improvement, which involved removing obsolete code and restructuring the
execution of modules.

Pilot Plant Automation
Page 54
The HMI upgrades have greatly improved the plants operative abilities, allowing students or the operator to gain
control at the click of a button. This also ensures the plant is correctly shut down at the completion of a student session, as
the operation button is un-ticked to indicate that the user control is finished. This action turns off all pumps and closes the
relevant control valves to ensure the plants shut down correctly. The final achievement of this paper included all the
documentation that resulted from the research that was performed on this system.

Pilot Plant Automation
Page 55
Chapter 12: Available Resources
Various resources are available for this project, these include;
Previous Theses
o Shane Mackay
o Edwin Lum
APACS+™ Advanced Control Module (ACM) Standard Function Blocks Version 4.40 and Higher
Honeywell International Incorporated. (2008c) Knowledge Builder.
o Contains a huge amount of information about the system and programming environment
Honeywell Pacific Automation College. (2010) Experion PKS Control Execution, Environment
Book1 Student Guide.
Honeywell Pacific Automation College. (2010) Experion PKS Control Execution, Environment
Student Guide.
Honeywell Pacific Automation College. (2009) Experion PKS Server Configuration &Engineering.
Manuals located in the Pilot Plant Control Room
ENG454 Honeywell Experion Simulated C300 Controller Project
Shane Mackay
Pilot Plant Documentation
o Murdoch University Pilot Plant Manuals 26/3/98, Control and Thermal Engineering CTE 702359 Book 2 of 3
Siemens Sikufest
The fuel less motor starter combination
Alan Bradley
Prog Logic Controller
Rittal Switchboard
Dyna Pumps
Lightin Agintators
SEETRU Pressure Relief Valves
o Murdoch University Pilot Plant Manuals 26/3/98, Control and Thermal Engineering CTE 702359 Book 2 of 3
Honeywell Smart Field Communicator
Pipe Flow Sheet
Honeywell ST3000 Transmitters
Honeywell Flow Transmitters
Honeywell Installation Drawing

Pilot Plant Automation
Page 56
The Experion PKS software is Honeywell’s proprietary software and resources on its operation is extremely limited.
Most knowledge gained on how to operate the software packages was used through careful analysis and experimentation.
Documentation on various aspects regarding hardware and software has been used for trouble shooting purposes and is
located on the Mylab network folder.
Chapter 13: Bibliography
APACS+™ Advanced Control Module (ACM) Standard Function Blocks Version 4.40 and Higher. (August 2002).
Siemens Energy & Automation, Inc.
Automation, H. (2012). Knowledge Builder.
Edwards, K. (2010). Murdoch University.
Files, P. P. (2012). Perth: Murdoch University.
honeywellprocess. (n.d.). Retrieved 8th Wednesday, 2012, from honeywellprocess:
https://www.honeywellprocess.com/en-US/explore/products/control-monitoring-and-safety-systems/integrated-control-
and-safety-systems/experion-pks/controllers/Pages/c300.aspx
Jemmac. (n.d.). Retrieved 8th Wednesday, 2012, from Jemmac: http://www.jemmac.com/images/news/c300.jpg
Lum, E. (2011). Honeywell Experion System for Teaching Purposes. Perth: Murdoch University.
Mackay, S. (2012). Development and Implementation of Maintenance and Demonstration Programs. Perth:
Murdoch University.

Pilot Plant Automation
Page 57
Chapter 14: Appendix
List of Appendices
1.0 Additional Information..................................................................................................................................................... 54 1.1 NaN Signal.................................................................................................................................................................. 54 1.2 Configuration Studio.................................................................................................................................................. 54
2.0 Supporting Documents..................................................................................................................................................... 56 2.1 Block Library............................................................................................................................................................... 57 2.2 Hardware Additions.................................................................................................................................................... 57 2.3 Program Documentation (Automation Program)...................................................................................................... 57 2.4 Program Documentation (Plant)................................................................................................................................ 57 2.5 Program Operation Checklist..................................................................................................................................... 57 2.6 Scenario Testing......................................................................................................................................................... 57 2.7 Programming Standards............................................................................................................................................ 57
1.0 Additional Information
1.1 NaN Signal
NaN Signal refers to not a number, and occurs in the event when something is wrong with the signal being sent by
the transmitter. This occurs on several tanks in the pilot plant when a tank level goes beyond the highest limits. These tanks
have been calibrated incorrectly, as the tank should start to over flow once the level reaches 105%. When calibrating the
lower limit should be set (0% = Tank Empty), and the upper limit should be set (100 = Tank Full). When some of these tanks
were calibrated they were not filled all the way to the top, and when the level rises above this level the level sensors get a
reading that is outside the calibration range, resulting in the NAN signal. The main significance of this signal is that it will
cause issues with how the software processes the particular value. The program doesn’t know whether to interpret the
signal as high or as low, so in the event of a transitional statement in a SCM or an interlock in a control module, they will
both fail. The other instance this can occur is if the flow meter has lost power, or some other hardware fault. This must be
taken into account in the event that any programming relevant to an interlock or transition be manipulated or created, as
the program must account for these rare occurrences.
1.2 Configuration studio
Once logged on Configuration studio is used to change the settings, after connection, navigating to PPserver1,
control strategy and finally configure process control strategies, the user can open control builder.

Pilot Plant Automation
Page 58
Control builder holds all the control modules that control the plant. There are two tabs that are used to modify the
configuration of the controller, Project and Monitoring.
Project contains all the simulated controllers (Starting with Sim) and the real controller (CPM_01). Modifications
are made the individual control modals within each controller and downloaded to the controller or server, depending if it’s a
simulation or not.
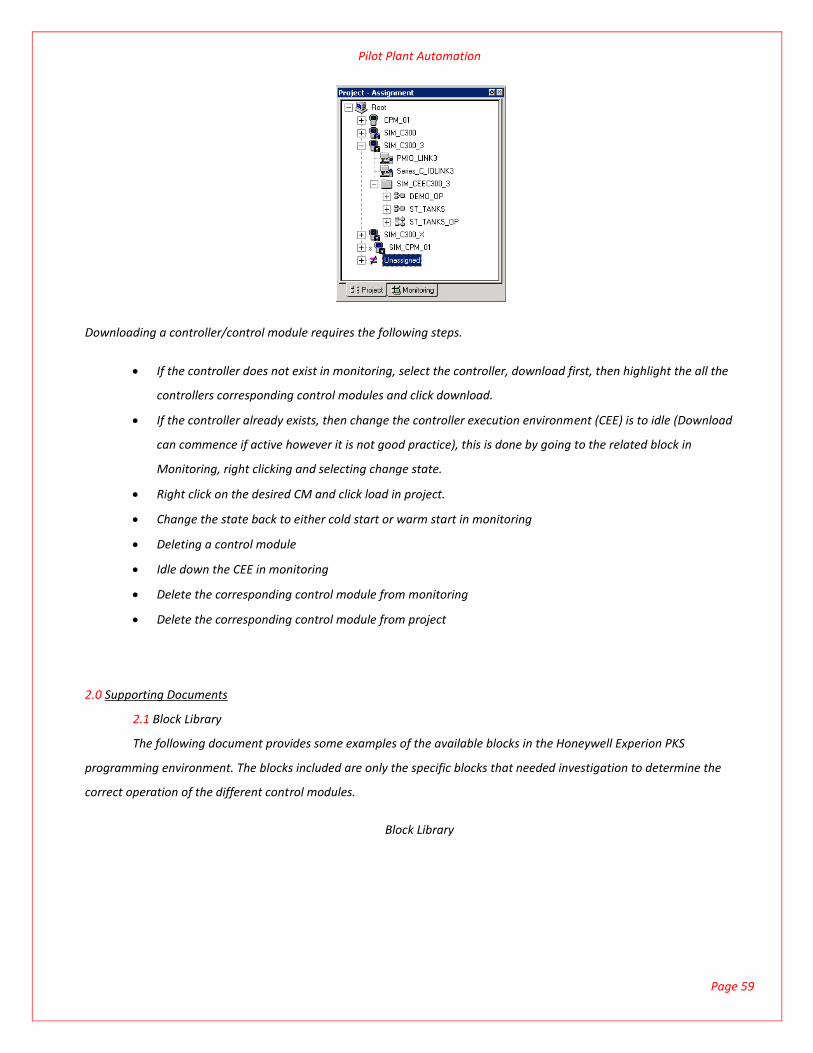
Pilot Plant Automation
Page 59
Downloading a controller/control module requires the following steps.
If the controller does not exist in monitoring, select the controller, download first, then highlight the all the
controllers corresponding control modules and click download.
If the controller already exists, then change the controller execution environment (CEE) is to idle (Download
can commence if active however it is not good practice), this is done by going to the related block in
Monitoring, right clicking and selecting change state.
Right click on the desired CM and click load in project.
Change the state back to either cold start or warm start in monitoring
Deleting a control module
Idle down the CEE in monitoring
Delete the corresponding control module from monitoring
Delete the corresponding control module from project
2.0 Supporting Documents
2.1 Block Library
The following document provides some examples of the available blocks in the Honeywell Experion PKS
programming environment. The blocks included are only the specific blocks that needed investigation to determine the
correct operation of the different control modules.
Block Library

Pilot Plant Automation
Page 60
2.2 Hardware Additions
The hyperlinked document describes possible hardware additions that can be implemented to improve the pilot
plant. Listed with these recommendations is a brief outline of the tasks that will need to be completed to achieve correct
operation.
Hardware Additions
2.3 Program Documentation (Automation Program)
This document describes the operation of the newly implemented program and will go through the different SCM’s,
important flags, general operation, SCM information, the associated control modules that perform monitoring tasks and
how to remove the program.
Program Documentation (Automation Program)
2.4 Program Documentation (Plant)
The following document is an analysis of the Pilot Plant Program code; this document will describe the different
programming modules. The purpose if this document is to provide personnel attempting to modify the program, with a
quick lookup reference which will allow for faster debugging and program expansion.
Program Documentation (Plant)
2.5 Program Operation Checklist
The document indicates the states of the valves and power outlets needed for the program to run successfully.
Refer to this document if there is any doubt of the state of a valve or power supply when setting the plant up for the
maintenance program between semesters.
Program Operation Checklist
2.6 Scenario Testing
The Following document describes the scenario testing carried on the Pilot Plant that adequately prove that the
Automation Program can run without supervision
Scenario Testing
2.7 Programming Standards
The implementation of Honeywell’s Experion Process Knowledge System (EPKS) has led to the requirement for particular
standards and conventions to be developed in order to maintain the systems integrity. This document was originally created
by Kyle Edwards and has been updated with some Sequential control module standards.
Programming Standards
Related Documents