School of Computing Computing and Information Systems Volume 16, No 3, 2012 Edited by Abel Usoro www.uws.ac.uk

Welcome message from author
This document is posted to help you gain knowledge. Please leave a comment to let me know what you think about it! Share it to your friends and learn new things together.
Transcript

School of ComputingComputing and Information Systems Volume 16, No 3, 2012Edited by Abel Usoro
www.uws.ac.uk
Table of Contents Vol 16, No 3, 2012
Overcoming the problem of di�erent density-regions using the Inter-Connectivity and the Closeness
Ahmed M. Serdah and Wesam M Ashour ......................................................................................................................1
Home-grown Model for Managing Knowledge in Organizations
Patrick S Okonji, Olufemi O Olayemi, Abel Usoro and Ezendu Ariwa..................................................7
Modi�ed DBSCAN Clustering Algorithm for Data with Di�erent Densities
Hassan M Dawoud and Wesam M Ashour ................................................ ..............................................15
Exploration of Cloud Computing Adoption for E-learning in Higher Education
Isaiah Ewuzie and Abel Usoro .......................................................................................................................21 New Methods for DNA Sequence Similarity Analysis
Maryam Nuser, Izzat Alsmadi and Heba Al-Shaek Salem......................................................................25
Knowledge Management and SMEs’ Competitiveness in Nigeria: A Conceptual Analysis
Olufemi Olabode Olayemi; Sunday Patrick Okonji, Abel Usoro and Ezendu Ariwa ..................33
ISSN 1352-9404
Table of Contents Overcoming the problem of different density-regions using the Inter-Connectivity and the Closeness Ahmed M. Serdah and Wesam M Ashour Home-grown Model for Managing Knowledge in Organizations Patrick S Okonji, Olufemi O Olayemi, Abel Usoro and Ezendu Ariwa Modified DBSCAN Clustering Algorithm for Data with Different Densities Hassan M Dawoud and Wesam M Ashour Exploration of Cloud Computing Adoption for E-learning in Higher Education Isaiah Ewuzie and Abel Usoro New Methods for DNA Sequence Similarity Analysis Maryam Nuser, Izzat Alsmadi and Heba Al-Shaek Salem Knowledge Management and SMEs’ Competitiveness in Nigeria: A Conceptual Analysis Olufemi Olabode Olayemi; Sunday Patrick Okonji, Abel Usoro and Ezendu Ariwa
1
Overcoming the problem of different density-regions using the Inter-Connectivity and the Closeness
Ahmed M. Serdah and Wesam M Ashour
Department of Computer Engineering The Islamic University of Gaza
[email protected] and [email protected] Abstract The density based algorithms considered as one of the most common and powerful algorithms in data clustering, this paper presents new way to solve the problem of detecting the clusters of varying density which most of the density based algorithms can't deal with it correctly. Our approach depending on the merging of the Inter-Connectivity and the Closeness techniques, which applied on the resulting of the sub-clusters by using the density based clustering technique to conflation it in a new clusters, the proposed algorithm help to decide if the different density regions belonged to the same cluster or not. The experimental results show that the proposed clustering algorithm gives satisfied results. Keywords: density-region, inter-connectivity, closeness, cluster
1. Introduction
Clustering is one of the most basic tasks in the ex-exploratory data analysis that groups similar points in an un-supervision fashion. We have studied this problem in the compilation in many disciplines such as statistics, pattern recognition, signal processing (eg, vector quantization), biology, and so on. As a consequence numerous clustering algorithms had been proposed in these different communities, spanning different clustering paradigms such as density-based (Ester et al., 1996), partitional (Forgy, 1965), mixture-modeling ( Jain and Dubes, 1988), hierarchical (Jardine et al., 1967), spectral (Shi and Malik, 2000), and so on. DBSCAN algorithm is one of the most famousdensity-based cluster (Ester et al., 1996). For each point ofacluster its eps-neighborhood for some given eps>0 has contained at least the minimumpoints. the “density” in the eps-neighborhood of points has to exceed some threshold. The main advantages of the DBSCAN are, the first, DBSCAN does not require a determination of the number of cluster of data, the second, DBSCAN can find arbitrarily shaped clusters. It can even find a cluster completely surrounded by a different cluster. Due to the MinPts parameter, the so-called single-link effect is reduced, and the third, DBSCAN is not sensitive for outliers.
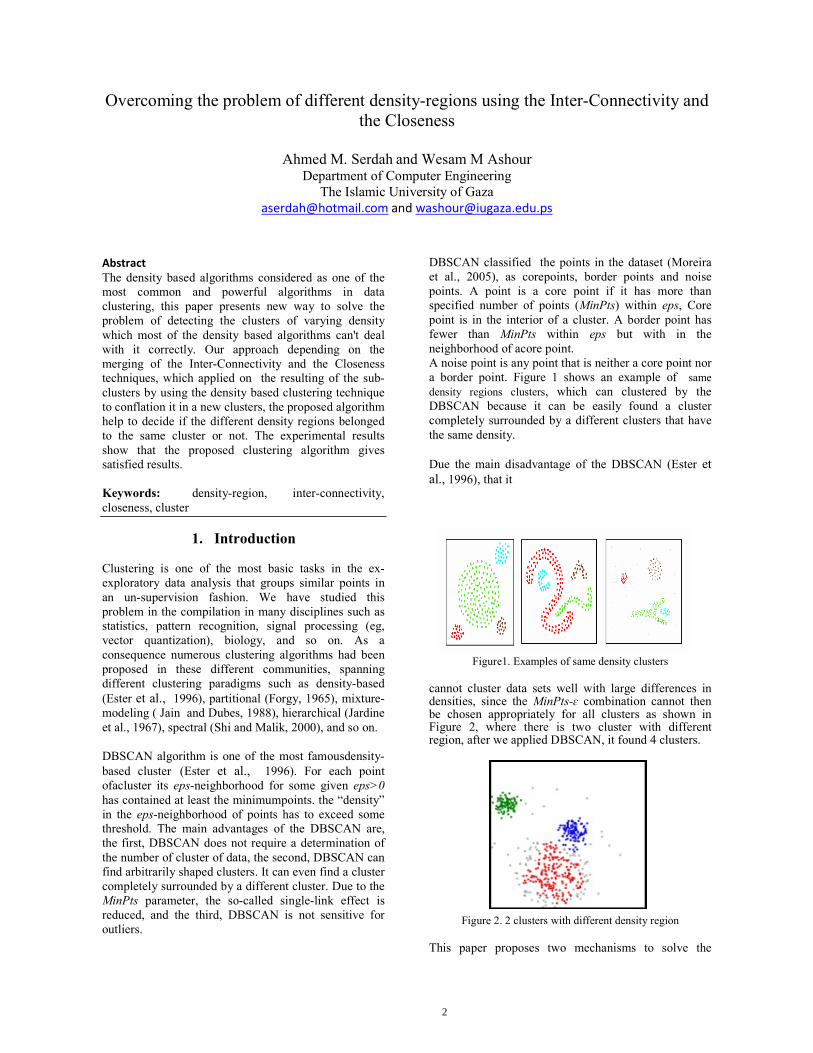
DBSCAN classified the points in the dataset (Moreira et al., 2005), as corepoints, border points and noise points. A point is a core point if it has more than specified number of points (MinPts) within eps, Core point is in the interior of a cluster. A border point has fewer than MinPts within eps but with in the neighborhood of acore point. A noise point is any point that is neither a core point nor a border point. Figure 1 shows an example of same density regions clusters, which can clustered by the DBSCAN because it can be easily found a cluster completely surrounded by a different clusters that have the same density. Due the main disadvantage of the DBSCAN (Ester et al., 1996), that it
Figure1. Examples of same density clusters cannot cluster data sets well with large differences in densities, since the MinPts-ɛ combination cannot then be chosen appropriately for all clusters as shown in Figure 2, where there is two cluster with different region, after we applied DBSCAN, it found 4 clusters.
Figure 2. 2 clusters with different density region
This paper proposes two mechanisms to solve the
2
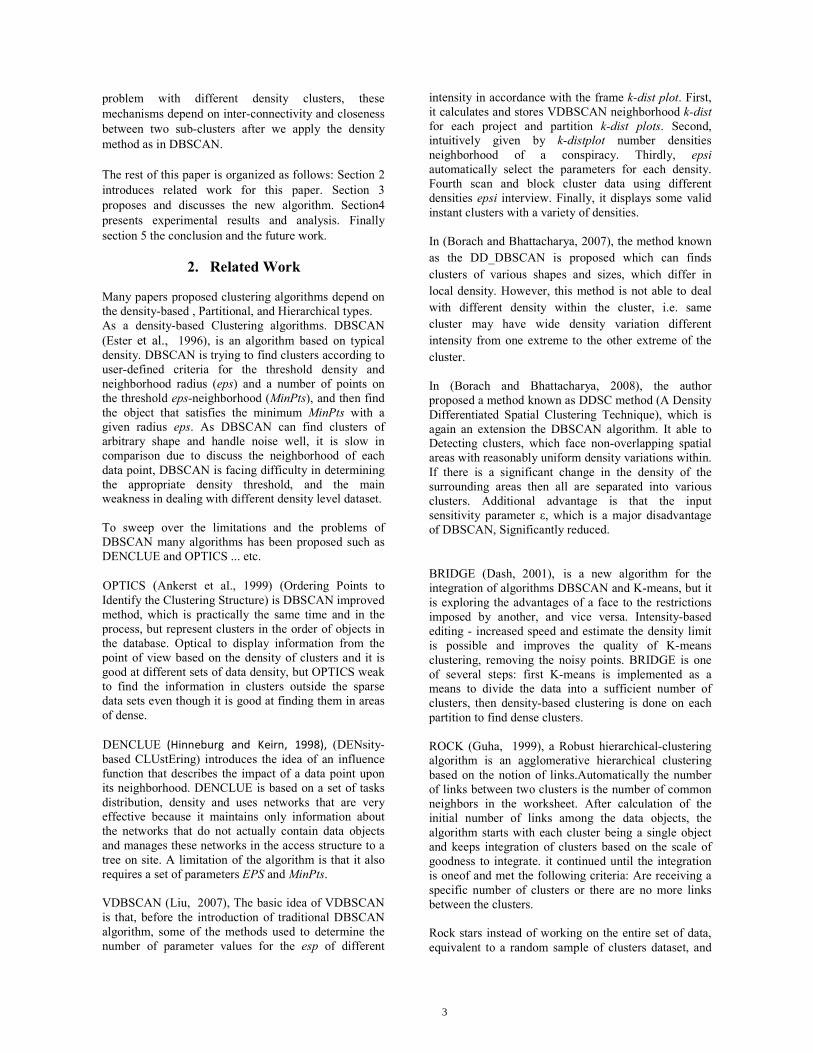
problem with different density clusters, these mechanisms depend on inter-connectivity and closeness between two sub-clusters after we apply the density method as in DBSCAN. The rest of this paper is organized as follows: Section 2 introduces related work for this paper. Section 3 proposes and discusses the new algorithm. Section4 presents experimental results and analysis. Finally section 5 the conclusion and the future work.
2. Related Work
Many papers proposed clustering algorithms depend on the density-based , Partitional, and Hierarchical types. As a density-based Clustering algorithms. DBSCAN (Ester et al., 1996), is an algorithm based on typical density. DBSCAN is trying to find clusters according to user-defined criteria for the threshold density and neighborhood radius (eps) and a number of points on the threshold eps-neighborhood (MinPts), and then find the object that satisfies the minimum MinPts with a given radius eps. As DBSCAN can find clusters of arbitrary shape and handle noise well, it is slow in comparison due to discuss the neighborhood of each data point, DBSCAN is facing difficulty in determining the appropriate density threshold, and the main weakness in dealing with different density level dataset. To sweep over the limitations and the problems of DBSCAN many algorithms has been proposed such as DENCLUE and OPTICS ... etc. OPTICS (Ankerst et al., 1999) (Ordering Points to Identify the Clustering Structure) is DBSCAN improved method, which is practically the same time and in the process, but represent clusters in the order of objects in the database. Optical to display information from the point of view based on the density of clusters and it is good at different sets of data density, but OPTICS weak to find the information in clusters outside the sparse data sets even though it is good at finding them in areas of dense. DENCLUE (Hinneburg and Keirn, 1998), (DENsity-based CLUstEring) introduces the idea of an influence function that describes the impact of a data point upon its neighborhood. DENCLUE is based on a set of tasks distribution, density and uses networks that are very effective because it maintains only information about the networks that do not actually contain data objects and manages these networks in the access structure to a tree on site. A limitation of the algorithm is that it also requires a set of parameters EPS and MinPts. VDBSCAN (Liu, 2007), The basic idea of VDBSCAN is that, before the introduction of traditional DBSCAN algorithm, some of the methods used to determine the number of parameter values for the esp of different
intensity in accordance with the frame k-dist plot. First, it calculates and stores VDBSCAN neighborhood k-dist for each project and partition k-dist plots. Second, intuitively given by k-distplot number densities neighborhood of a conspiracy. Thirdly, epsi automatically select the parameters for each density. Fourth scan and block cluster data using different densities epsi interview. Finally, it displays some valid instant clusters with a variety of densities. In (Borach and Bhattacharya, 2007), the method known as the DD_DBSCAN is proposed which can finds clusters of various shapes and sizes, which differ in local density. However, this method is not able to deal with different density within the cluster, i.e. same cluster may have wide density variation different intensity from one extreme to the other extreme of the cluster.
In (Borach and Bhattacharya, 2008), the author proposed a method known as DDSC method (A Density Differentiated Spatial Clustering Technique), which is again an extension the DBSCAN algorithm. It able to Detecting clusters, which face non-overlapping spatial areas with reasonably uniform density variations within. If there is a significant change in the density of the surrounding areas then all are separated into various clusters. Additional advantage is that the input sensitivity parameter ε, which is a major disadvantage of DBSCAN, Significantly reduced. BRIDGE (Dash, 2001), is a new algorithm for the integration of algorithms DBSCAN and K-means, but it is exploring the advantages of a face to the restrictions imposed by another, and vice versa. Intensity-based editing - increased speed and estimate the density limit is possible and improves the quality of K-means clustering, removing the noisy points. BRIDGE is one of several steps: first K-means is implemented as a means to divide the data into a sufficient number of clusters, then density-based clustering is done on each partition to find dense clusters. ROCK (Guha, 1999), a Robust hierarchical-clustering algorithm is an agglomerative hierarchical clustering based on the notion of links.Automatically the number of links between two clusters is the number of common neighbors in the worksheet. After calculation of the initial number of links among the data objects, the algorithm starts with each cluster being a single object and keeps integration of clusters based on the scale of goodness to integrate. it continued until the integration is oneof and met the following criteria: Are receiving a specific number of clusters or there are no more links between the clusters. Rock stars instead of working on the entire set of data, equivalent to a random sample of clusters dataset, and
3
then split the entire dataset on the basis of sample clusters.
3. Proposed Algorithm
3.1 Inter-Connectivity and Closeness
In this section we are going to talk about our proposed algorithm, in these techniques we will try to solve the problem of dealing with different density level dataset in DBSCAN, after we applied DBSCAN on the dataset we will passed the clusters to two phases to determine the final clusters, the similarity between each pair of clusters Ci and Cj by looking both at their inter-connectivity RI (Ci , Cj) and their closeness RC(Ci , Cj) (Karypis, 1999a). Inter-Connectivity the links between a pair of clusters Ci and Cj is defined as the absolute inter-connectivity between Ci and Cj normalized with respect to the internal inter-connectivity of the two clusters Ci and Cj and is defined as the total weight of links connection Ci and Cj, (Karypis, 1998), (Karypis, 1999b), thus the relative inter-connectivity
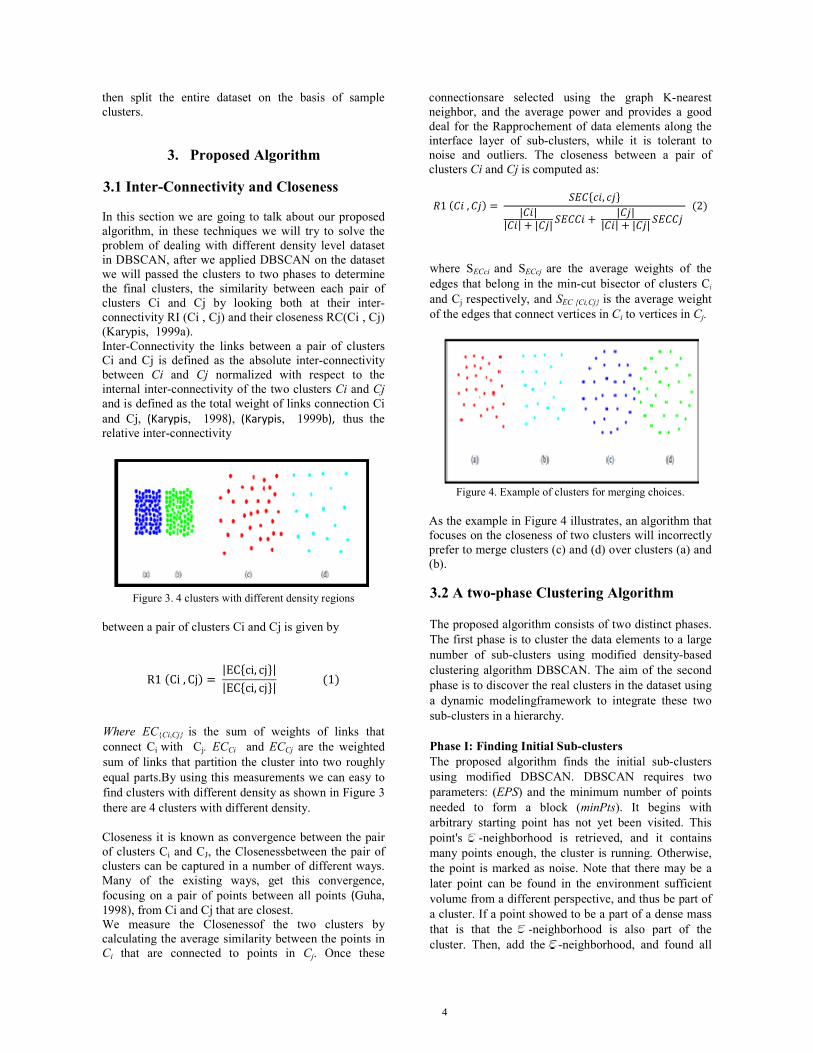
Figure 3. 4 clusters with different density regions between a pair of clusters Ci and Cj is given by R1(Ci, Cj) = |EC ci, cj ||EC ci, cj | (1) Where EC{Ci,Cj} is the sum of weights of links that connect Ci with Cj. ECCi and ECCj are the weighted sum of links that partition the cluster into two roughly equal parts.By using this measurements we can easy to find clusters with different density as shown in Figure 3 there are 4 clusters with different density. Closeness it is known as convergence between the pair of clusters Ci and CJ, the Closenessbetween the pair of clusters can be captured in a number of different ways. Many of the existing ways, get this convergence, focusing on a pair of points between all points (Guha, 1998), from Ci and Cj that are closest. We measure the Closenessof the two clusters by calculating the average similarity between the points in Ci that are connected to points in Cj. Once these
connectionsare selected using the graph K-nearest neighbor, and the average power and provides a good deal for the Rapprochement of data elements along the interface layer of sub-clusters, while it is tolerant to noise and outliers. The closeness between a pair of clusters Ci and Cj is computed as: 1( , ) = ,| || | | | | || | | | (2)
where SECci and SECcj are the average weights of the edges that belong in the min-cut bisector of clusters Ci and Cj respectively, and SEC {Ci,Cj} is the average weight of the edges that connect vertices in Ci to vertices in Cj.
Figure 4. Example of clusters for merging choices.
As the example in Figure 4 illustrates, an algorithm that focuses on the closeness of two clusters will incorrectly prefer to merge clusters (c) and (d) over clusters (a) and (b). 3.2 A two-phase Clustering Algorithm
The proposed algorithm consists of two distinct phases. The first phase is to cluster the data elements to a large number of sub-clusters using modified density-based clustering algorithm DBSCAN. The aim of the second phase is to discover the real clusters in the dataset using a dynamic modelingframework to integrate these two sub-clusters in a hierarchy. Phase I: Finding Initial Sub-clusters The proposed algorithm finds the initial sub-clusters using modified DBSCAN. DBSCAN requires two parameters: (EPS) and the minimum number of points needed to form a block (minPts). It begins with arbitrary starting point has not yet been visited. This point's -neighborhood is retrieved, and it contains many points enough, the cluster is running. Otherwise, the point is marked as noise. Note that there may be a later point can be found in the environment sufficient volume from a different perspective, and thus be part of a cluster. If a point showed to be a part of a dense mass that is that the -neighborhood is also part of the cluster. Then, add the -neighborhood, and found all
4
the points that fall within their own region, when it is also dense. This process continues until you find the mass density of the entire network (Ester et al., 1996), we ran the DBSCAN with 10 different values to (EPS) and (minPts) to obtain as many as possible sub-clusters which the input of phase II. Phase II: Merging Sub-Clusters Once the clusters of fine grain produced by DBSCAN the first phase finish, the proposed algorithm switch to the agglomerative hierarchical clustering, combining the most similar sub-clusters together by looking at their inter-connectivity and their closeness. The first schema contains only those pairs of clusters that their inter-connectivity and their closeness above a user set threshold TRI and TRC, respectively. In this approach, the proposed algorithm visits each cluster Ci, and check whether any of the neighbors Cj satisfy the following two conditions:
RI (Ci, Cj) ≥ TRI&RC(Ci, Cj) ≥TRC. (3)
If one of the neighbors clusters Cj satisfies the above conditions, then Ci and Cj will merge. We note that the choose a pair of clusters Ci and CJ merged maximize RI (Ci , Cj )*RC(Ci , Cj ) This formula attaches equal importance to both of these criteria. If we want to give a higher preference to one of these measures, we can used this formula:
RI (Ci , Cj )*RC(Ci , Cj )α (4)
If α > 1 we give the closeness a higher importance and if α< 1 we give the inter-connectivity a higher importance.In our work we use the Euclidian distance for closeness: | − | = ( − )(5) And we used the ROCK links concept to measuring the inter-connectivity. In ROCK, links between two cluster, are the number of shared neighbors between them, so if cluster A has the set of neighbors { d, e, f, g}while cluster B has the neighbors { f, g, h, i, j} then link{A, B} =|{f, g}| = 2 (Alnabriss and Ashour 2011), we calculated the shared neighbors between two cluster by using Jaccard coefficient: ( , ) = | ∩ || ∪ (6) We must build two matrices with size n* n, the first for the inter-connectivity between each pair of sub-clusters
result from the first phase using equation (6) to find the links in each sub-clusters and the links between a pair of sub-clusters to measuring the inter-connectivity between a pair of clusters using equation (1), the second matrix for the closeness between each pair of sub-clusters results from first phase using equation (5) to find the Euclidian distance between each point and the centroid in each sub-cluster and the Euclidian distance between a pair of sub-clusters to measures the closeness between a pair of clusters using equation (2), we can multiply the second matrix by α as in equation (4) to give a higher preference to one of these measures.after preparing the two matrices it can be sum and divide It is about 2, it will be our new similarity value depends on the closeness and the inter-connectivity[20].
4. Simulation and Results
We have implemented Java code to test our algorithm, the code receives data files in CSV format, each row is an object and each column an attribute, despite our system received multi-dimensional data, we used two dimensional artificial data files, which shown in the form of 2D. We also used two real datasets for testing, the first one is the Iris and the second is the glass identification dataset.
4.1 Artificial Datasets
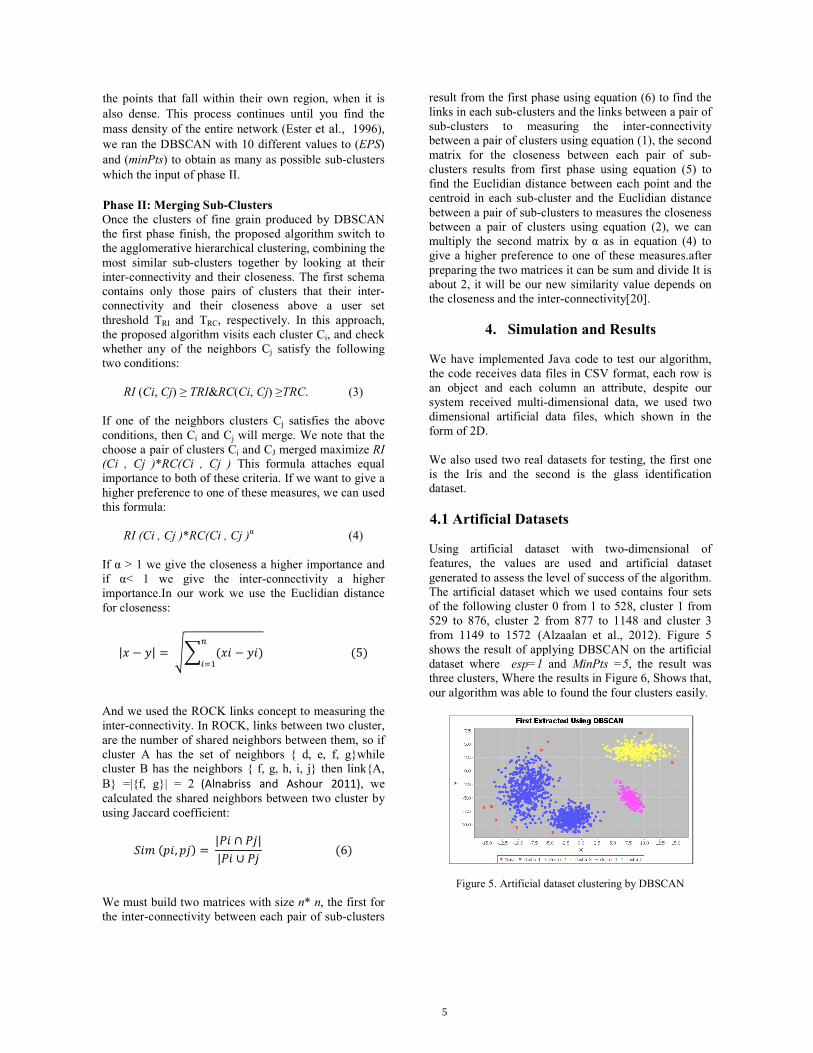
Using artificial dataset with two-dimensional of features, the values are used and artificial dataset generated to assess the level of success of the algorithm. The artificial dataset which we used contains four sets of the following cluster 0 from 1 to 528, cluster 1 from 529 to 876, cluster 2 from 877 to 1148 and cluster 3 from 1149 to 1572 (Alzaalan et al., 2012). Figure 5 shows the result of applying DBSCAN on the artificial dataset where esp=1 and MinPts =5, the result was three clusters, Where the results in Figure 6, Shows that, our algorithm was able to found the four clusters easily.
Figure 5. Artificial dataset clustering by DBSCAN
5
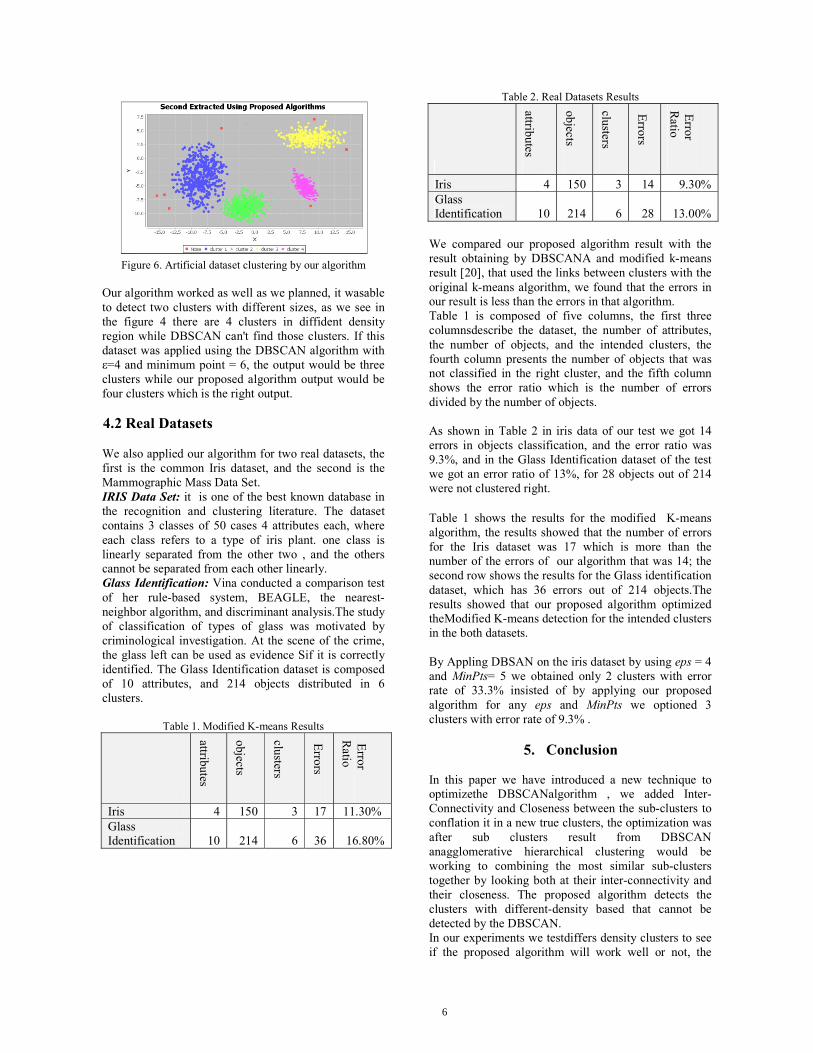
Figure 6. Artificial dataset clustering by our algorithm Our algorithm worked as well as we planned, it wasable to detect two clusters with different sizes, as we see in the figure 4 there are 4 clusters in diffident density region while DBSCAN can't find those clusters. If this dataset was applied using the DBSCAN algorithm with ε=4 and minimum point = 6, the output would be three clusters while our proposed algorithm output would be four clusters which is the right output. 4.2 Real Datasets
We also applied our algorithm for two real datasets, the first is the common Iris dataset, and the second is the Mammographic Mass Data Set. IRIS Data Set: it is one of the best known database in the recognition and clustering literature. The dataset contains 3 classes of 50 cases 4 attributes each, where each class refers to a type of iris plant. one class is linearly separated from the other two , and the others cannot be separated from each other linearly. Glass Identification: Vina conducted a comparison test of her rule-based system, BEAGLE, the nearest-neighbor algorithm, and discriminant analysis.The study of classification of types of glass was motivated by criminological investigation. At the scene of the crime, the glass left can be used as evidence Sif it is correctly identified. The Glass Identification dataset is composed of 10 attributes, and 214 objects distributed in 6 clusters.
Table 1. Modified K-means Results
attributes
objects
clusters
Errors
Error
Ratio
Iris 4 150 3 17 11.30% Glass Identification 10 214 6 36 16.80%
Table 2. Real Datasets Results
attributes
objects
clusters
Errors
Error
Ratio
Iris 4 150 3 14 9.30% Glass Identification 10 214 6 28 13.00%
We compared our proposed algorithm result with the result obtaining by DBSCANA and modified k-means result [20], that used the links between clusters with the original k-means algorithm, we found that the errors in our result is less than the errors in that algorithm. Table 1 is composed of five columns, the first three columnsdescribe the dataset, the number of attributes, the number of objects, and the intended clusters, the fourth column presents the number of objects that was not classified in the right cluster, and the fifth column shows the error ratio which is the number of errors divided by the number of objects. As shown in Table 2 in iris data of our test we got 14 errors in objects classification, and the error ratio was 9.3%, and in the Glass Identification dataset of the test we got an error ratio of 13%, for 28 objects out of 214 were not clustered right. Table 1 shows the results for the modified K-means algorithm, the results showed that the number of errors for the Iris dataset was 17 which is more than the number of the errors of our algorithm that was 14; the second row shows the results for the Glass identification dataset, which has 36 errors out of 214 objects.The results showed that our proposed algorithm optimized theModified K-means detection for the intended clusters in the both datasets. By Appling DBSAN on the iris dataset by using eps = 4 and MinPts= 5 we obtained only 2 clusters with error rate of 33.3% insisted of by applying our proposed algorithm for any eps and MinPts we optioned 3 clusters with error rate of 9.3% .
5. Conclusion
In this paper we have introduced a new technique to optimizethe DBSCANalgorithm , we added Inter-Connectivity and Closeness between the sub-clusters to conflation it in a new true clusters, the optimization was after sub clusters result from DBSCAN anagglomerative hierarchical clustering would be working to combining the most similar sub-clusters together by looking both at their inter-connectivity and their closeness. The proposed algorithm detects the clusters with different-density based that cannot be detected by the DBSCAN. In our experiments we testdiffers density clusters to see if the proposed algorithm will work well or not, the
6

final results showedthat our proposed algorithm is more robust for density comparedwith the modified K-means traditional algorithm and the DBSCAN. The results showed that our proposed algorithm detected theintended clusters in the Iris and the glass identification datasets,and the error ratio was less than the modified traditional K-means ratio and the DBSCAN.
REFERENCES
Alnabriss, H. and Ashour, W. (2011), "Avoiding objects with few neighbors in the K-Means process and adding ROCK Links to its distance", International Journal of Computer Applications, 28 (10): 12-17.
Alzaalan, M.E., Aldahdooh, R.T. and Ashour, W. (2012), "EOPTICS “Enhancement Ordering Points to Identify the Clustering Structure”", International Journal of Computer Applications, 40 (17): 1-6.
Ankerst, M., Brnenig, M., Kreigel, H.P. and Sander, J. (1999), "OPTICS:ordering points to identify the clustering structure", In Proceedings of ACM SIGMOD International Conference on Management of Data.
Ashour, W., Murtaja, M. (2012), "Finding Within Cluster Dense Regions Using Distance Based Technique", I.J. Intelligent Systems and Applications, 14 (2): 42-48.
Borach, B. and Bhattacharya, D.K. (2007), "A Clustering Technique using Density Difference", In proceedings of International Conference on Signal Processing, Communications and Networking, 585–588.
Borah, B. and Bhattacharyya, D.K. (2008), "DDSC: A Density Differentiated Spatial Clustering Technique", ACADEMY PUBLISHER Journal of Computers, 3 (2): 72-79.
Dash, M., Liu, H. and Xu, X. (2001), "1+1>2'~ Merging Distance and Density Based Clustering" , IEEE Computer Society Publisher, HongKong: 32-39.
Ester, M., Kriegel, H., Sander, J. and Xu, X. (1996), "A density-based algorithm for discovering clusters in large spatial databases with noise", Proc. Second International Conference on Knowledge Discovery and Data Mining, Portland, Oregon. AAAI Press.
Forgy, E. (1965), "Cluster analysis of multivariate data:Efficiency vs. interpretability of classifications", Biometrics 21: 768.
Guha, S., Rastogi, R. and Shim, K. (1998), "CURE: An efficient clusteringalgorithm for large databases", ACM-SIGMOD Int. Conf. on Management of Data.
Guha, S., Rastogi, R. and Shim, K. (1999), "ROCK: A robust clustering algorithm for categorical attributes", Proceedings of the IEEE International Conference on Data Engineering, Sydney.
Hinneburg, A. and Keirn, D.A. (1998), "An efficient approach to clustering in large multimedia databases with noise", Proc. Fourth International Conference on Knowledge Discovery and Data Mining.
Jain, A and Dubes, R. (1988), "Algorithms for Clusterind data", Pentice-Hill.
Jardine, C., Jardine, N. and Sibson, C. (1967), "Thestructure and construction of Taxonomic Hierarchies", Math. Bioscience, 1 (2): 173-179.
Karypis, G. and Kumar, V. (1998), "METIS 4.0: Unstructured graph partitioning and sparse matrix ordering system. Technical report", Department of Computer Science, University of Minnesota.
Karypis, G., Han, E.S. and Kumar, V. (1999a), "Chameleon: Hierarchical clustering using dynamic modeling", IEEE Computer, 32(8): 68–75.
Karypis, G. and Kumar, V. (1999b), "A fast and highly quality multilevel scheme for partitioning irregulargraphs", SIAM Journal on Scientific Computing, 20(1).
Liu, P., Zhou, D. and Wu, N. (2007), "Varied Density Based Spatial Clustering of Applications with Noise", Proceedings of IEEE international conference on service systems and service management, Chengdu, China: 1-4.
Moreira, A., Santos, M. and Carneiro, S. (2005), "Density-based clustering algorithms – DBSCAN and SNN", University of Minho – Portugal.
Shi, J. and Malik, J. (2000), "Normalized Cuts and Image Segmentation", IEEE Transactions on Pattern Analysis and Machine Intelligence, 22 (8).
7
Homegrown Model for Managing Knowledge in Organizations
*Patrick S Okonji, *Olufemi O Olayemi, **Abel Usoro and ***Ezendu Ariwa *Department of Business Administration, University of Lagos
**School of Computing, University of West of Scotland, Paisley, Scotland, UK ***School of Business, London Metropolitan University, London
[email protected], [email protected], [email protected], and [email protected]
ABSTRACT Knowledge management has been identified as a source of competitive advantage since the last two decades. However, its potentials have not been fully utilized in most organizations. This is borne out of the confusion of what it is and the doubt on its real contribution to organizational success. Most organizations employees regard it as one of the management fads which as its kind will pass away while others see it as a technology thing. The conceptual model is intended to provide guidelines for a stress-free introduction and acceptance of knowledge management by organizational stakeholders, especially the employees. The utility of the model lies in its simplicity and the use of common and understandable language. Managers are advised to intelligently apply this model in building and sustaining competitive advantage for their respective organizations. Keywords: Knowledge, management, strategy, competitive advantage, organizational prosperity. INTRODUCTION The management literature acknowledges that organizational success is largely a function of conscious decisions and actions taken by its management. Organizations faced with increased environmental uncertainties and complexities, have relentlessly searched for effective means of successfully competing in their relevant industries. The current focus on knowledge management as a basis for developing sustainable competitive advantage is an extension of the resource based view of the firm. The resource based view of the firm postulates that the ability of an organization to develop and sustain a competitive advantage is dependent on its resource (Grant 2000). The
thrust of knowledge management is that a firm’s economic prosperity will be enhanced if it can expand, disseminate and exploit organizational knowledge internally (Berly and Chakrabarti, 1996). Thus a firm can gain competitive superiority if it can expand, disseminate and exploit organizational knowledge internally, protect its knowledge from expropriation and imitation by competitors, effectively share with, transfer to and receive knowledge from distant locations (Schulz and Jobe, 1998; Szulanski, 1996; Bierly and Chakralri, 1996; Mowery, Omwley and Silverman, 1996; Appleyeond, 1996 and Almaida, 1996). Hansen, Nohria and Tierney (1999) observe that knowledge management is not new as owners of family businesses have for ages passed their commercial wisdom on to their children, master craftsmen have painstakingly taught their trades to apprentices, and workers have exchanged ideas and know how on the job. However, the focus on knowledge management can be traced to the last two decades when environmental volatility and rapid technological improvements led to recognition that knowledge accumulation is the best way to make a breakthrough and obtain an enduring competitive advantage (Su-Chao and Ming-Shing 2008). In this light, Drucker (1999) stressed that the most valuable asset of the 21st century institution would be its knowledge workers and their productivity. These observations are supported by Quinn (1992) who argues that a corporation’s success today lies more in its intellectual and systematic capabilities than in its physical assets. Managing human-capital and converting it into useful products and services is fast becoming the critical executive skill of the age.
8
Though the concept of knowledge has been in existence for over two decades, there has been suspicion among managers and academics that it may turn out to be one of those management fads that results in no real benefit to the organization (Naslund 2008). This view is further strengthened by the mixed findings on the relationships between knowledge management and organizational performance. For instance, Lee and Chio (2003) and Hunter, Beaumont, and Lee (2002) reported a no relationship between knowledge management and organizational performance. On the other hand, Nonaka and Takenchi (1995) reported that knowledge management results in business process efficiency improvements, better organized communities and higher staff motivation. McEvily and Chakravarthy (2002) pointed out that there are very few works which have found a clear relation between knowledge and superior performance. Konig, Meyer and Heisig (2004) postulate that the most theoretical research issue facing knowledge management as a discipline is the integration of knowledge
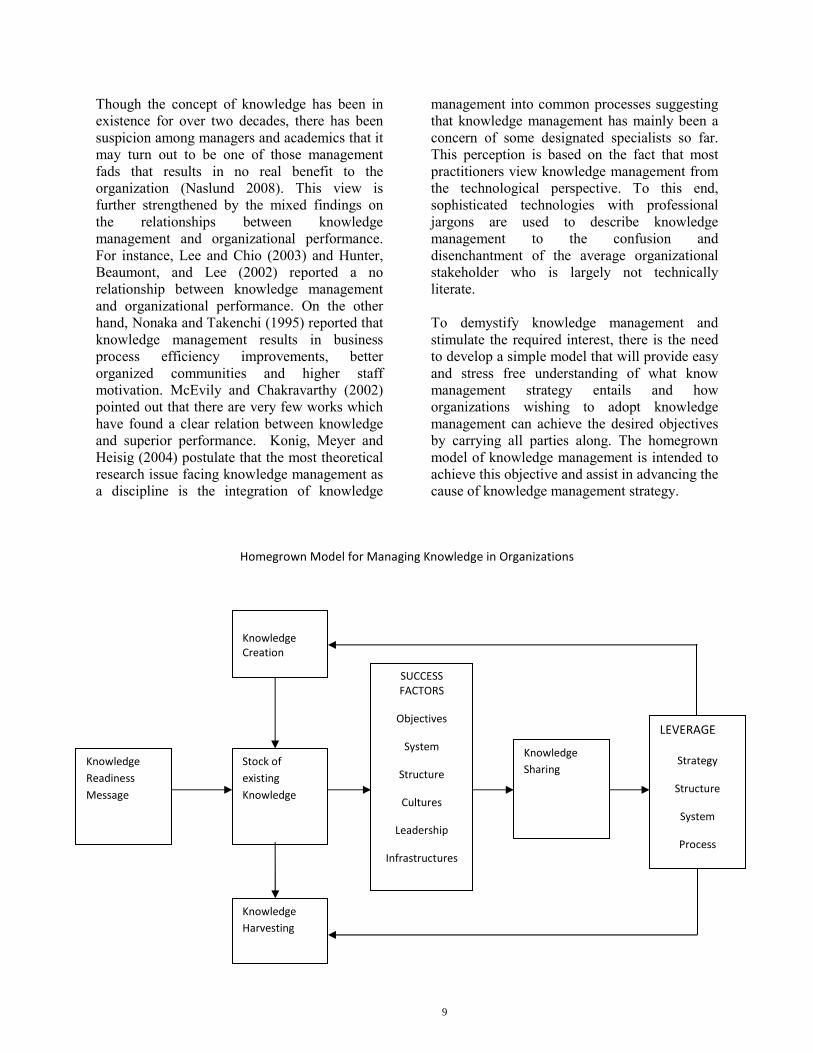
management into common processes suggesting that knowledge management has mainly been a concern of some designated specialists so far. This perception is based on the fact that most practitioners view knowledge management from the technological perspective. To this end, sophisticated technologies with professional jargons are used to describe knowledge management to the confusion and disenchantment of the average organizational stakeholder who is largely not technically literate. To demystify knowledge management and stimulate the required interest, there is the need to develop a simple model that will provide easy and stress free understanding of what know management strategy entails and how organizations wishing to adopt knowledge management can achieve the desired objectives by carrying all parties along. The homegrown model of knowledge management is intended to achieve this objective and assist in advancing the cause of knowledge management strategy.
Homegrown Model for Managing Knowledge in Organizations
Knowledge Creation
Knowledge Sharing
Knowledge Readiness Message
Knowledge Harvesting
LEVERAGE
Strategy
Structure
System
Process
Stock of existing Knowledge
SUCCESS FACTORS
Objectives
System
Structure
Cultures
Leadership
Infrastructures
9
Knowledge management has been variously defined. According to Hailey and Dawson (2000) knowledge management is a collecting procedure for effectively conducting the creation, expansion and the effect of knowledge for the purpose of realizing the goals of an organization. Brown and Duguid (2000) define knowledge management as the use of technology to make information relevant and accessible wherever the information may reside. To do this effectively requires the appropriate application of the appropriate technology for the appropriate situation. In simple terms, knowledge management is the framework for managing the acquisition, creation, utilization and sharing of organizational knowledge. Sun (2010) posits that knowledge acquisition refers to the processes by which new knowledge is acquired from outside sources, knowledge creation is the process of transforming the newly acquired to the context of the organization and knowledge utilization and sharing is the process of continuously applying or exploiting the newly created knowledge and sharing it from individual or group. Nonaka and Konno (1998) identify two main kinds of knowledge: explicit and tacit knowledge. Explicit knowledge is knowledge that can be expressed in words and numbers and shared in the form of data, scientific formulae, specifications, manuals and the like. This kind of knowledge can be readily transmitted between individuals formally and systematically. On the other hand, Roberts (2000) describes tacit knowledge as an implicit and noncodifiable knowledge that is difficult to share or is learnt by experience, “learning by doing” and apprenticeship. To succeed in sharing tacit knowledge, it is necessary to share through know-how, the process of demonstration and through show-how, face to face contact between transmitter and receiver. In other words, the transfer of know-how requires a process of “show-how” Information technology is bridging the face-to-face gap by the provision of collaborative, social networking and other virtual tools. The model is made up of distinct
but interrelated phases which managers should follow in managing and institutionalizing knowledge in their respective organizations. These stages are discussed below. KNOWLEDGE MANAGEMENT READINESS MESSAGE The starting point for the knowledge management process is the top management’s decision to adopt the knowledge management strategy as a means of gaining competitive superiority. This should be followed with a readiness message for stake holders’ buy-in. In line with Armenakis and Harris’s (2002) change readiness communication model, the key five message components are: discrepancy, efficacy, appropriateness, principal support and personal valence. Discrepancy addresses the sentiments regarding whether knowledge management is needed. Discrepancy is typically demonstrated by clarifying how an organization’s current performance differs from the desired state. Discrepancy can be stated in terms of a question, namely ‘is knowledge management really necessary? Since denial is a natural reaction of employees to any given change, there is the need for a compelling message to be sent to them that a change to knowledge management is s required. It is helpful to explain what has happened in the external environment (e.g changing economic conditions, industry deregulation) and /or the internal environment (e.g unacceptable levels of product quality, lack of collaboration among departments) that motivated the decision (Armenakis and Harris 2002). Efficacy is the sentiments regarding confidence in one’s ability to succeed. The question that captures the efficacy component is ‘can/we successfully implement the knowledge management strategy? If individuals do not have the confidence to embrace a new way of operating then the proposed change to knowledge management will be difficult, or will fail.
10
Appropriateness is concerned with the perception of the employees as to whether the introduction of knowledge management is an appropriate reaction to the need or discrepancy. The appropriateness of change is important because individuals may feel that some form of change is needed but may disagree that knowledge management is the appropriate response to the situation. Morris, Cascio and Young (1999) posit that the question of appropriateness seems to be particularly relevant when many organizations are implementing changes over the past few years that appear to be based on fad or fashion rather than careful diagnosis and planning. Armenakis and Harris (2002) stressed the need for the change message to communicate the fact that the decision to introduce knowledge management is determined through careful diagnosis and planning. The principal support is concerned with the willingness and ability of management to provide resources and commitment to the specific knowledge management initiative. In today’s environment of quick fix, faddish, program-of the month changes, employees may be rightfully skeptical of the level of commitment that leaders/principals in their organizations would have for any new change. If the organization has initiated change efforts in the past that have been abandon and/or been considered failures then cynicism may exist throughout the organization. The principal support message is meant to convey that the leaders of the organization are committed to investing the time, energy and resources necessary to push the knowledge management initiative through the process of institutionalization. Personal valence is concerned with organizational members’ assessment of the distribution of positive and negative outcomes, the fairness of the change and the manner in which individuals are treated (Cobb, Woten and Folger 1995). The question associated with personal valence is ‘what is in it for me?’ If an individual self-interest is threatened a proposed change will likely be resisted (Clarke, Ellett, Bateman and Rugutt 1996).
STOCK OF EXISTING KNOWLEDGE Having bought the employees over, attempts should be made to identify the stock of knowledge in existence in the organization. Normally, knowledge will be informally stored in standard operating procedures (SOPs), policy manuals, internal training modules, organizational culture, among others. It is also pertinent for top management to compare the stock of existing knowledge with the actual stock of knowledge required by the organization. OBJECTIVES, STRUCTURES, CULTURES, SYSTEMS, LEADERSHIP AND INFRASTRUCTURES Objectives The ultimate objective of any knowledge management in any firm is the increase in profitability. However, Anderson Consulting (1999) posits that the goals of knowledge management should include: improving the economic methods and methodologies for meeting demands for innovation as well as enhanced efficiency in the operations, the creation of products featuring innovative qualities by using creativity which also improve market adaptability, becoming aware of the knowledge that can reduce risks, enhancing the sharing of the organization knowledge in order to improve the problem solving capability within the company and increasing the efficiency by improving the competitiveness. Culture Organizational culture is a mind set – “the realm of feelings and sentiments” (Allaire and Firsirotu,1985). It consists of the basic values, assumptions or expectations that have emerged from the organization’s particular history, leadership, and contingency factors and that are supported by present-day management policies and practices; it is also a worldview and belief, meanings and symbols historical vestiges, traditions and customs. Schein (1992) defines organizational culture as a system of shared meaning held by members that distinguishes the organization from other organizations. O’ Reilly III, Chatman and Caldwell (1991) reports that empirical evidences reveal that there are seven primary characteristics that capture the essence
11
of organization’s culture. These characteristics are: innovation, attention to details, outcome orientation, and people orientation. Others are: team orientation, aggressiveness and stability. Knowledge management will likely thrive in a culture that encourages risk taking, organizational learning, team orientation, trust and openness and divergent thinking (Nonaka, 1994; Jansen, Van den Bosch and Volberdah, 2005; Zheng, Yang and Mclean, 2009). Mcdermott and O Dell (2001) suggest that aligning knowledge sharing to the culture can be more effective than altering and changing the culture itself. Furthermore, Knapp (1998) opines that organizational culture is an imperative element of knowledge management and a culture that creates mutual credit and cooperation will trigger the implementation of knowledge management. According to O’Neil, Beauvais and Scholl (2001) organization structure has long been described as a mechanism through which effort is integrated through the coordination and control of activities. In the same vein, Annad and Daft (2007) argue that traditionally, organizational structure defines the reporting relationships among the internal functional departments of an organization. It involves the grouping of people into functions as departments, the reporting relationships among people and the systems to ensure coordination and integration of activities both horizontally and vertically. The distribution of decision making powers in the organization is a central feature that affects the adoption and practice of knowledge management. Centralization and decentralization refer to the locus of decision making in organizations. Centralization is the state in which little or no authority is delegated to lower managerial levels as authority is concentrated at the top management level. To this end, virtually all important decisions are made by top management alone. On the other hand, decentralization is a situation in which a great deal of authority is delegated to lower management with little concentrated at the top management level. Decentralized structure with low formalization will be ideal for effective knowledge management.
Systems The adoption of knowledge management strategy calls for a reward system that is directly tied to knowledge outcomes. Thus organizational reward system in terms of pay, promotion, and evaluations should be based on ability and cooperation in knowledge management application and sharing. Lin (2007), Waston and Howett (2006) report that knowledge sharing will be enhanced when there is greater organizational commitment. The commitment is strengthened when the processes involved in determining reward and recognition are seen to be just and fair. Leadership Successful knowledge management requires strategic leadership. Top management must be able to set the right vision and align stakeholders, especially employees, towards it. Sun and Anderson (2008) and Sun (2010) opine that when leadership in the organization recognizes the need to manage knowledge and then sanction the routines that directly influence it, they collectively create the appropriate context for knowledge management. Knowledge management will be facilitated when leaders adopt the participatory decision making process. In addition, roles and responsibilities need to be clarified so as to avoid confusion. Infrastructure The choice of the appropriate technology is a sine qua non for effective knowledge management. Plessis (2007) reports that in most organizations the enterprise portal has been identified as the key vehicle for access to knowledge. It is therefore vital for knowledge management teams to align with the organization’s information technology (IT) department to ensure that the business requirements relating to enterprise portals is understood and translated correctly into a technology environment that can support the knowledge management and enterprise portal objectives. KNOWLEDGE SHARING According to Russ, Fineman and Jones (2010) one of the choices an organization has to make in managing knowledge is whether it should
12

focus on codifying the knowledge or leaving the knowledge tacit. Schaltz and Jibe (1998) argue that an important means to effective management of knowledge flows is the codification of organizational knowledge. When organizations codify their knowledge, they package it into formats which facilitate knowledge transfer. Morten et al (1998) claim that knowledge is codified using a “people to documents approach as it involves the extraction of knowledge from the person who developed it, made independent of that person, and reused for various purposes. The benefits of codification include: fast and reliable access to organizational knowledge across geographical, social, and organizational boundaries, facilitation of organizational learning on the level of organizational routines, and the retention of organizational knowledge in the event of personnel turnover (Levitt and March, 1988; Simon, 1991 and Schulz and Jobe, 1998). On the other hand, tacitness or personalization strategy involves the keeping of knowledge in a state of fluid gestation that could only be shared through dialogue between individuals. The advantages of tacitness include: the stimulation of creativity, the nourishment of competitive advantage by making it hard for competitors to copy. Russ et al (2011) recommend that a choice between the two should be based on industry characteristics, organizational culture, and risk management philosophy regarding knowledge, patent protection, and industrial espionage, among others. The medium for leveraging knowledge in organizations include intranets, e-mails, expert systems, data bases, flow charts, operational reports, stimulation of itra unit communication, cross functional teams, development of specialized languages and technical logo and training programs/modules. Others include the expansion of official documentation, budget information, memos, policies, and if everything else fails, organizations hire consulting firms to extract and elucidate hidden capabilities and obstacles (Schulz and Jobe, 1998). KNOWLEDGE CREATION AND HARVESTING
Nonaka (1994), Nonaka, Byosiere and Konno (1994) and Nonala and Takenchi(1995) developed the socialization, externalization, combination and internalisation (SECI) model to explain four knowledge conversion patterns that results in knowledge creation by spiraling process of interactions between explicit and tacit knowledge. The knowledge conversion modes are: socialization, externalization, combination and internalization. Socialization involves the sharing of tacit knowledge between individuals through joint activities, such as being together, spending time, and living in the same environment- rather than through written or verbal instructions. In practical terms, this may involve the acquiring of knowledge through direct interaction with suppliers, management by walking around and the dissemination of tacit knowledge. Externalization is the conversion of knowledge into comprehensive forms that can be understood by others. It entails the translation of highly personal or highly professional knowledge of customers or specialists into explicit forms that are easily understandable. On the other hand, combination involves the conversion of explicit knowledge into more complex sets of explicit knowledge. Nonaka and Konno (1999) stress that in practice the combination phase relies on three processes of capturing and integrating new explicit knowledge, disseminating the explicit knowledge throughout the organization and editing to make the explicit knowledge in forms readily usable. Internalization is the conversion of the new created explicit knowledge into tacit knowledge. In practice, internalization relies on explicit knowledge being embodied in action and practice and by using simulations or experiments to trigger learning by doing processes. Since change is part of organizational life, there is the need for update of knowledge stock. To this end, knowledge that is no longer useful should be deleted. CONCLUSION Sustainable competitive advantage is the bed rock of organizational success. Knowledge management is one of the present day sources of competitive advantage. To fully exploit this
13

advantage there is need for managers and IT practitioners to cooperate to the advantage of the organization. The intelligent application of this model will help create the needed understanding and cooperation. Since the model is devoid of technical jargons, non technical managers and their technical counterparts will engage in a meaningful dialogue in instituting and implementing knowledge management strategies to improve organizational performance. References Allaire, Y. and Firsirotu, M. (1985) “How to
Implement Radical Strategies in Large Organizations” Sloan Management Review, 26,3: 19-34.
Almedia, P (1996) “Knowledge Sourcing by Foreign Nationals: Patent citation analysis in the US semiconductor industry” Strategic Management Journal, 17:153-165.
Annad, N and Daft, R (2007) “What is the Right Organizational Design?” Organizational Dynamics, 36, 4:329-344.
Armenakis A. A and Harris, S. G. (2002) “Crafting a Change Message to Create Transformational Readiness” Journal of Organizational Change Management, 15, 2: 169 -183.
Auther Anderson Business Consulting (1999) Zukui Knowledge Management. Tokyo: Koyi Keizai Inc.
Bierly, P and Chakrabarti, L (1996) “Generic Knowledge in US Pharmaceutical Industry” Strategic Management Journal,17:123-135.
Brown, J.S and Duguid, P (1997) “Organizing Knowledge” California Management Review, 40, 3:231-240.
Clarke, J, Bateman, J and Rugutt, J (1996) “ Faculty receptivity and effectiveness in research in universities” Paper Presented at the Twenty-first Annual Meeting of the Association for the Study of Higher Education, Memphis, TW, Octi, 31-Nov.
Cobb, A,Wooten, K. and Foger, R (1995) “Justice in the making: Toward understanding the theory and practice of justice in organizational change and development” In Pasmore,W and Woodman, R (eds) Research in
Organization Change and Development. Vol xiii, Greenwich, CT: JAI Press.
Grant, R.M (2000) Contemporary Strategy Analysis: Concepts Techniques, Application (4th ed). Massachusetts: Blackwell Publishers.
Hanley, S and Dawson, C (2000) “A Framework for Delivering Value with Knowledge Management” The American Marketing Society knowledge Center’s Information Strategy, 16,4:27-35.
Hansen, M, Nohria, N and Tierney,T (1999) “ What is Your Strategy for Managing Knowledge?” Harvard Business Review, 77, 2: 106-116.
Hunter, L Beaumont, P and Lee, M (2002) “Knowledge Management Practice in Scottish Law Firms” Human Resource Management Journal, 12, 2:4-21.
Jensen, J.J.D, Van den Bosch, F.A and Volbera, H.W (2005) “Managing Potential and Realized Absorptive Capacity: How do organizational antecedents matter?” Academy of Management Journal, 40: 999-1015.
Lee, H and Choi, B (2003) “Knowledge Management Enablers, Processes and Organizational Performance: An Integrative View of empirical explanation” Journal of Management Information System, 2, 1: 79-94.
Levitt, B and March, J (1998) “Organizational Learning” Annual Review of Sociology, 14: 319 340.
Lin, C (2007) “To Share or Not to Share: Modeling tacit knowledge, its mediators and antecedents” Journal of Business Ethics, 70:411-428.
McCvily, S.K and Chakravarthy, B (2002) “The Persistence of Knowledge Advantage: An empirical test for product performance and technological knowledge” Strategic Management Journal, 23, 4: 285-305.
Mcdermott, R and O’Dell, C (2001) “Overcoming Cultural Barriers to Sharing Knowledge” Journal of Knowledge Management, 5,1:76-85.
Morris, J, Cascio, W and Young, C (1999) “Downsizing after all those years” Organizational Dynamics, winter: 25-38.
14

Naslund, D (2008) “Lean, Six Sigma, and Lean Sigma: Fads or real process improvement methods?” Business ProcessMmanagement Journal, Vol 14, No3:269-287.
Nonaka, I (1995) “A Dynamic Theory of Organizational Knowledge Creation” Organizational Science, 5,1: 14-37.
Nonaka, I and Takenchi, H (1995) The Knowledge Creating Company. New York: Oxford University Press.
O’Reilly III C. A, Chatman J. and Caldwell (1991) “A Profile Comparison Approach to Assessing Person- Organization Fit” Academy of Management Journal, Sept: 487-516.
O’Neil,J.W, Beauvais,L.V and Scholl.R.W (2001) “ The Use of Organizational Culture and Structure to Guide Strategic Behaviour: An information processing perspective” Journal of Applied Behavoiural and Aplied Mnagement,2, 2: 131-150.
Plessis, M (2007) “Knowledge Management: What makes complex implementation successful” Journal of Knowledge Management, 11,2:91-101.
Quinn, J.B (1999) “Strategic Outsourcing: Leveraging Knowledge Management Capabilities” Sloan Management Review,40,4:9-21.
Roberts, J (2000) “From Know-How to Show-How? Questioning the role of information and communication technologies in knowledge transfer” Technology Analysis and Strategic Management, 12,4: 429-43.
Russ, M ,Fineman,R and Jones, J.K (2010) “CEEP Typology and Taxonomies: Knowledge based (KB) strategies” In Russ, M (ed) Knowledge Management
Strategies for Business Development. New York: IGI Gloss.
Schein E. H. (1992) Organizational Culture and Leadership (2nd ed). San Francisco: Jossey-Bass
Scholl, W, Konig, C, Meyer, B and Heisig, P(2004) “The Future of Knowledge Management: An international Delphi study” Journal of Knowledge Mnagement,8,2:19-35.
Schulz, M and Jobe, L.A (1998) “Codification and Tactiness as Knowledge Management Strategy: An empirical exploration” Martinus@wintington,edu.
Simon, H.E (1995) “Bounded Rationality and Organizational Learning” Organizational Science, 2, 1:125-134.
Su-Chao, C and Ming-Shing, L (2008) “The Linkage between Knowledge Accumulation Capability and Organizational Innovation” Journal of Knowledge Management, 12, 1:3-20.
Sun, P (2010) “Five Critical Knowledge Management Organizational Themes” Journal of Knowledge Management, 14, 4:507-523.
Sun, P.T.Y and Anderson, M.H (2008)”An Examination of the Relationship Between ACAP and OL, and a Proposed Integration” International Journal of Management Reviews, 12, 2:130-150.
Sunlanski, G (1996) “Exploring Internal Stickiness Impediments to the Transfer of Best Practices Within the firm” Strategic Management Journal, 17:27-43.
Zheng,W, Yang,B and Mclean,G.N (2009) “Linking Organizational Culture, Structure and Strategy and Organizational Effectiveness: Mediating role of knowledge management” Journal of Business Research:23-35.
15
Modified DBSCAN Clustering Algorithm for Data with Different Densities
Hassan M Dawoud and Wesam M Ashour Department of Computer Engineering
The Islamic University of Gaza [email protected] and [email protected]
Abstract The problem of detecting clusters of points in data is challenging when the clusters are of different size, density and shape. The density based clustering algorithm DBSCAN is one of the most popular density based algorithms. The DBSCAN algorithm has a limitation when dealing with data of different densities. In this paper we propose an algorithm based on the DBSCAN. The proposed algorithm is capable of clustering data with arbitrary shapes and dealing with different densities of data. The Idea of the proposed algorithm is to update the eps and MinPts (where eps and MinPts are input parameters of DBSCAN algorithm) values according to the densities of regions of data points. These values are scaled depending on eps-neighborhood points. In the experiments we apply the proposed algorithm to artificial dataset and real dataset as we will show in the last section of the paper. Keywords: Clustering, DBSCAN, variable densities.
1. Introduction Clustering can be considered the most important unsupervised learning problem; it deals with finding a structure in a collection of unlabeled data. A cluster is therefore a collection of objects which are “similar” between them and are “dissimilar” to the objects belonging to other clusters (Ester, 1996).
There are many different ways to express and formulate the clustering problem; as a consequence, the obtained results and its interpretations depend strongly on the way the clustering problem was originally formulated. For example, the clusters or the groups that are identified may be exclusive, so that every instance belongs to only one group. Or, they may be overlapping; meaning that one instance may fall into several clusters. Or they may be probabilistic, whereby an instance belongs to each group depending on a certain assigned probability. Or they may be hierarchical, such that there is a crude division of the instances into groups at a high level that is further refined into a finer levels. Furthermore, different formulations lead to different algorithms to solve. If we also consider all the variations of each different algorithm proposed
to solve each different formulation, we end up with a very large family of clustering algorithms (Jain, 1998).
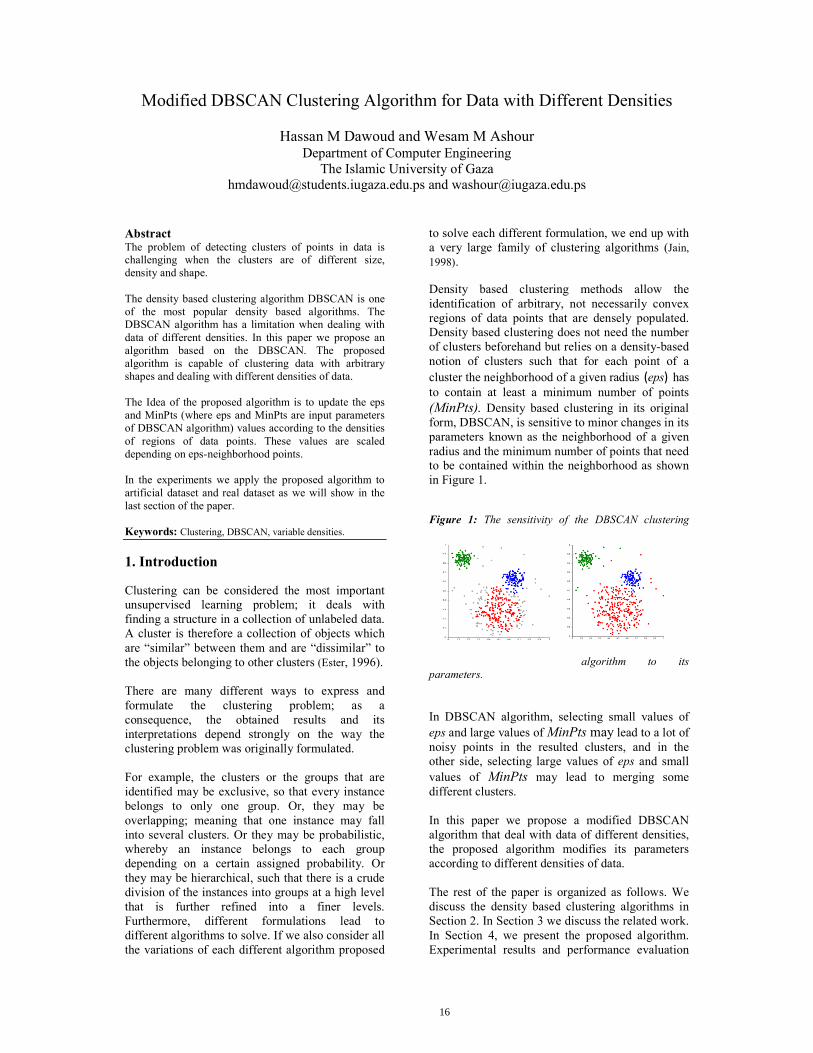
Density based clustering methods allow the identification of arbitrary, not necessarily convex regions of data points that are densely populated. Density based clustering does not need the number of clusters beforehand but relies on a density-based notion of clusters such that for each point of a cluster the neighborhood of a given radius (eps) has to contain at least a minimum number of points (MinPts). Density based clustering in its original form, DBSCAN, is sensitive to minor changes in its parameters known as the neighborhood of a given radius and the minimum number of points that need to be contained within the neighborhood as shown in Figure 1. Figure 1: The sensitivity of the DBSCAN clustering
algorithm to its parameters.
In DBSCAN algorithm, selecting small values of eps and large values of MinPts may lead to a lot of noisy points in the resulted clusters, and in the other side, selecting large values of eps and small values of MinPts may lead to merging some different clusters. In this paper we propose a modified DBSCAN algorithm that deal with data of different densities, the proposed algorithm modifies its parameters according to different densities of data. The rest of the paper is organized as follows. We discuss the density based clustering algorithms in Section 2. In Section 3 we discuss the related work. In Section 4, we present the proposed algorithm. Experimental results and performance evaluation
16
are given in Section 5,and in the conclusion in Section 6. 2. Density Based Clustering Algorithms The density-based clustering approach is a methodology that is capable of finding arbitrary shaped clusters, where clusters are defined as dense regions separated by low-density regions. A density-based algorithm needs only one scan of the original data set and can handle noise. The number of clusters is not required, since density-based clustering algorithms can automatically detect the clusters, along with the natural number of clusters (Ankerst ,1999).
We start with some definitions (Peng, 2007) and notation. An important concept in density-based algorithms is the eps-neighborhood of a point. Let x be a point. Then the eps-neighborhood of x is denoted by Neps(x) and is defined as follows. Definition 1 : eps-neighborhood of a point The eps-neighborhood of a point x is defined as Neps(x) = { y ∈ D : d(x, y) ≤ eps}, where D is the data set and d(.,.) is a certain distance function. Definition 2 (Directly density-reachable). A point x is said to be directly density reachable from a point y (with respect to eps and Nmin) if
1. )(yNx eps∈
2. ||,)(| minmin NwhereNyNeps ≥
denotes the number of points in Neps(y). Directly density-reachable is symmetric for
pairs of core points (points inside a cluster), but it is in general not symmetric in case one core point and one border point (a point on the border of a cluster) are involved. As an extension of directly density-reachable, density-reachable, defined below, is also not symmetric in general. But density-connected is a symmetric relation. Definition 3 (Density-reachable). A point x is said to be density-reachable from a point y if there is a sequence of points x = x1, x2, . . . , xi = y such that xl is directly density-reachable from xl+1 for l = 1, 2, . . . , i − 1. Definition 4 (Density-connected). Two points x and y are said to density-connected with respect to eps and Nmin if there exists a point z such that both x and y are density-reachable from z with respect to eps and Nmin. A cluster is then very intuitively defined as a set of density-connected points that is maximal with respect to density-reachability. Mathematically, we have the following definition.
Definition 5 (Cluster). Let D be a data set. A cluster C with respect to eps and Nmin is a nonempty subset of D satisfying the following conditions: 1. ∀x, y ∈ D, if x ∈ C and y is density-reachable from x with respect to eps and Nmin, then y ∈ C (maximality). 2. ∀x, y ∈ C, x and y are density-connected with respect to eps and Nmin (connectivity).
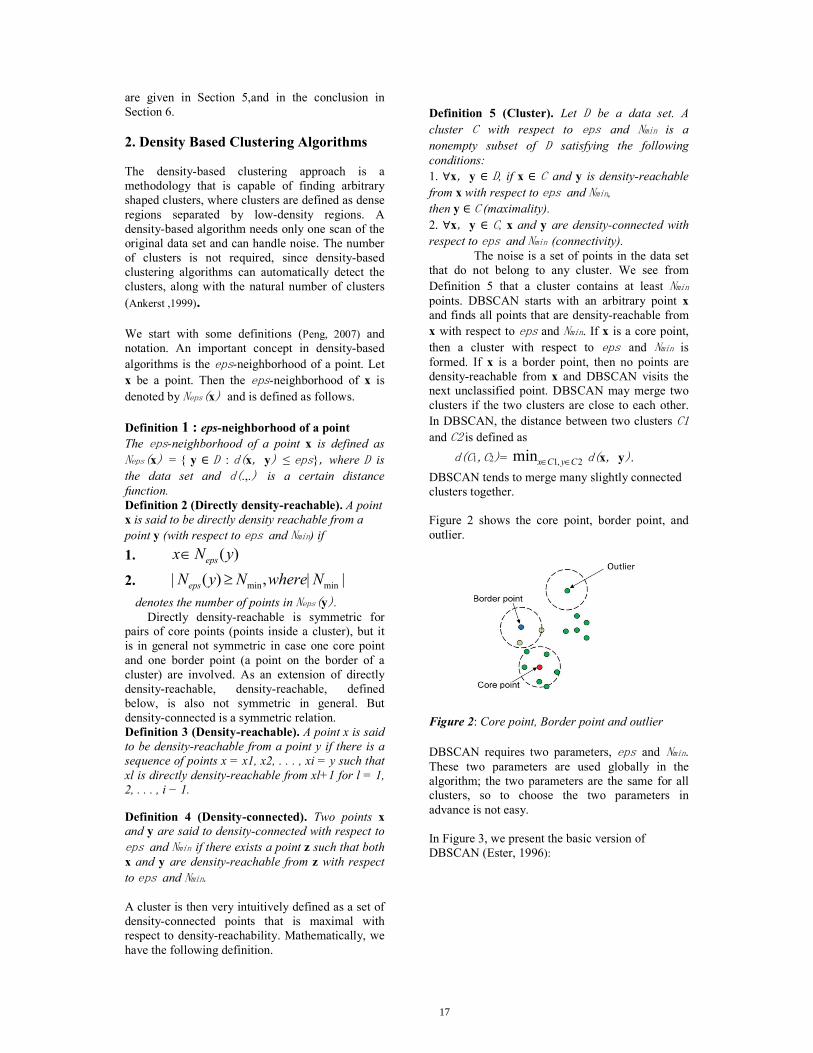
The noise is a set of points in the data set that do not belong to any cluster. We see from Definition 5 that a cluster contains at least Nmin points. DBSCAN starts with an arbitrary point x and finds all points that are density-reachable from x with respect to eps and Nmin. If x is a core point, then a cluster with respect to eps and Nmin is formed. If x is a border point, then no points are density-reachable from x and DBSCAN visits the next unclassified point. DBSCAN may merge two clusters if the two clusters are close to each other. In DBSCAN, the distance between two clusters C1
and C2 is defined as
d(C1,C2)= 2,1min CyCx ∈∈ d(x, y).
DBSCAN tends to merge many slightly connected clusters together. Figure 2 shows the core point, border point, and outlier.
Figure 2: Core point, Border point and outlier
DBSCAN requires two parameters, eps and Nmin. These two parameters are used globally in the algorithm; the two parameters are the same for all clusters, so to choose the two parameters in advance is not easy. In Figure 3, we present the basic version of DBSCAN (Ester, 1996):
17
DBSCAN(D, eps, MinPts) C = 0 for each unvisited point P in dataset D mark P as visited NeighborPts = regionQuery(P, eps) if sizeof(NeighborPts) < MinPts mark P as NOISE else C = next cluster expandCluster(P, NeighborPts, C, eps, MinPts) expandCluster(P, NeighborPts, C, eps, MinPts) add P to cluster C for each point P' in NeighborPts if P' is not visited mark P' as visited NeighborPts' = regionQuery(P', eps) if sizeof(NeighborPts') >= MinPts NeighborPts = NeighborPts joined with NeighborPts' if P' is not yet member of any cluster add P' to cluster C regionQuery(P, eps) return all points within P's eps-neighborhood
Figure 3: the Basic version of DBSCAN Algorithm As shown in figure 3 The DBSCAN starts with an arbitrary starting point that has not been visited. This point's eps-neighborhood is retrieved, and if it contains sufficiently many points, a cluster is started. Otherwise, the point is labeled as noise. If a point is found to be a dense part of a cluster, its eps-neighborhood is also part of that cluster. Hence, all points that are found within the eps-neighborhood are added, as is their own eps-neighborhood when they are also dense. This process continues until the density-connected cluster is completely found. Then, a new unvisited point is retrieved and processed, leading to the discovery of a further cluster or noise. 2.1 Advantages of DBSCAN (Jian, 2009) 1. DBSCAN does not require you to know the number of clusters in the data in advance, as opposed to k-means. 2. DBSCAN can find arbitrary shaped clusters. It can even find clusters completely surrounded by (but not connected to) a different cluster. 3. DBSCAN has a notion of noise. 4. DBSCAN requires just two parameters and is mostly insensitive to the ordering of the points in the database. 2.2 Disadvantages of DBSCAN (Jian,2009)
1. DBSCAN can only result in a good clustering
as good as its distance measure. The most common distance metric used is the Euclidean distance measure. Especially for high-dimensional data, this distance metric can be rendered almost useless.
2. DBSCAN does not respond well to data sets with varying densities .
3. Related Work
The DBSCAN (Density Based Spatial Clustering of Application with Noise) (Ester, 1996) is the basic clustering algorithm to mine the clusters based on objects density. In this algorithm, first the number of objects present within the neighbour region (Eps) is computed. If the neighbor objects count is below the given threshold value, the object will be marked as NOISE. Otherwise the new cluster will be formed from the core object by finding the group of density connected objects that are maximal w.r.t density reachability. The cluster formed by the DBSCAN algorithm will have wide variation inside each cluster in terms of density. The OPTICS (Ankerst, 1999) algorithm adopts the original DBSCAN algorithm to deal with variance density clusters. This algorithm computes an ordering of the objects based on the reachability distance for representing the intrinsic hierarchical clustering structure. The Valleys in the plot indicate the clusters. But the input parameters ξ is critical for identifying the valleys as ξ clusters. The DENCLUE (Hinneburg, 1998) algorithm uses kernel density estimation. The result of density function gives the local density maxima value and this local density value is used to form the clusters. If the local density value is very small, the objects of clusters will be discarded as NOISE. The CHAMELEON (Karypis, 1999) is a two phase algorithm. It generates a k-nearest graph in the first phase and hierarchical cluster algorithm has been used in the second phase to find the cluster by combining the sub clusters. The DDSC (A Density Differentiated Spatial Clustering Technique) (Borah, 2008) and EDBSCAN (An Enhanced Density Based Spatial Clustering of Application with Noise) (Ram, 2009) are the extension of DBSCAN algorithm, gives solution to handling different densities. The DDSC algorithm takes very sensitive parameter for variance density clusters and even a very minimum change in the parameter will give wrong result. The other algorithm EDBSCAN expands the cluster based on the Relative Core Object condition. Homogeneity Index (HI) and Density Variance are the two important parameters which determine the density variance.
18

The most of the Density Based algorithms accept very sensitive parameters for working on different density clusters. Even if we give the right density parameter values, it will not be able to deal with different range of densities and this may vary based on the nature of data base. So this paper introduces a method to handle the density variance. 4. The proposed algorithm
Our proposed algorithm relies on the basic DBSCAN algorithm , it starts with initial values of eps and MinPts , but these values are changed according to the density of the points in the regions. The pseudo code for the proposed algorithm is shown in Figure 4.
DBSCAN(D, eps, MinPts) C = 0 for each unvisited point P in dataset D mark P as visited NeighborPts = regionQuery(P, eps) if sizeof(NeighborPts) >= MinPts { Mark P as core Point expandCluster(P, NeighborPts, C, eps, MinPts) } else if ( 0 < sizeof(NeighborPts) < MinPts ) if (NeighborPts contains core points ) then { New_eps=eps*(MinPts/ sizeof(NeighborPts)) New_MinPts= sizeof(NeighborPts) } else Mark P as noise expandCluster(P, NeighborPts, C, eps, MinPts) add P to cluster C for each point P' in NeighborPts if P' is not visited mark P' as visited NeighborPts' = regionQuery(P', eps) if sizeof(NeighborPts') >= MinPts NeighborPts = NeighborPts joined with NeighborPts' if P' is not yet member of any cluster add P' to cluster C regionQuery(P, eps) return all points within P's eps-neighborhood
Figure 4: the Modified version of DBSCAN Algorithm. In Figure 4, we show the pseudo code of the proposed algorithm which works as the following:
1- It runs with the given parameters eps and MinPts.
2- It starts with an arbitrary starting point that has not been visited.
3- eps-neighborhood is retrieved. 4- If eps-neighborhood contains a number of
points that greater than or equal to MinPts then a cluster is started.
5- If eps-neighborhood contains a number of points less than or equal to MinPts and
eps-neighborhood > 0 then the eps value is modified as the following : if eps-neighborhood contain visited points then:
New_eps=eps*(MinPts/ sizeof(NeighborPts)) New_MinPts= sizeof(NeighborPts)
else a new cluster is started
6- Otherwise, the point is labeled as noise. 7- The algorithm is repeated until all points are
visited.
5. Experimental Results In fact there are many tools and frameworks that help to experiment different clustering algorithms, and one of the most popular tools is Matlab which was used to implement the our algorithm and generate some artificial dataset, a number of datasets will be tested to evaluate the algorithm, two types of dataset: artificial dataset and real dataset will be used.
A. Artificial Dataset
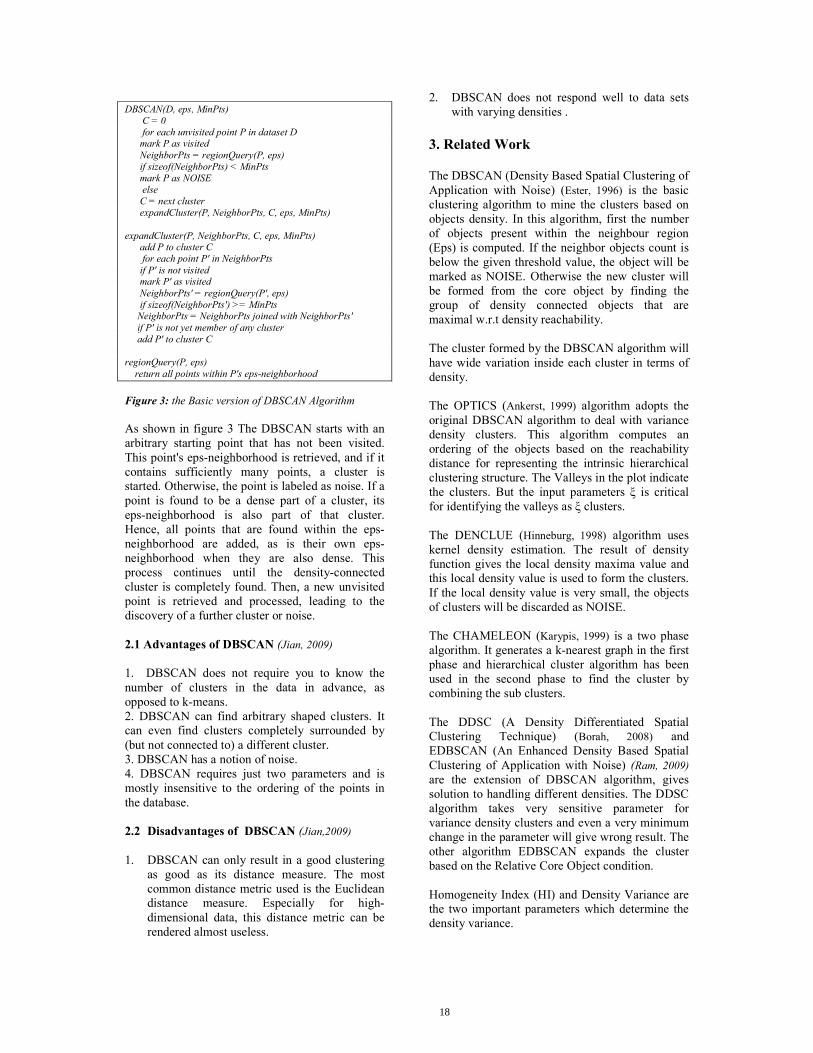
Very different Artificial datasets can be generated using random functions generators with different parameters, the artificial dataset dataset1 are consisted of three clusters each cluster contains 2473 samples with two features. Figure 5 show the output of the (a) DBSCAN and (b) proposed algorithm with the artificial dataset1. The dataset1 is clustered using eps=2, MinPts=5 in the two cases of Figure 5, as we see in Figure 6, in the case of using DBSCAN algorithm, there are several points that are labeled as noise, where it is clustered correctly in the proposed algorithm. The second artificial dataset dataset2 consist of 2104 points with two features, the results are shown in figure 6 by using (a) DBSCAN and (b) proposed algorithm.
Figure 5 (a): Dataset1 clustered by DBSCAN
19
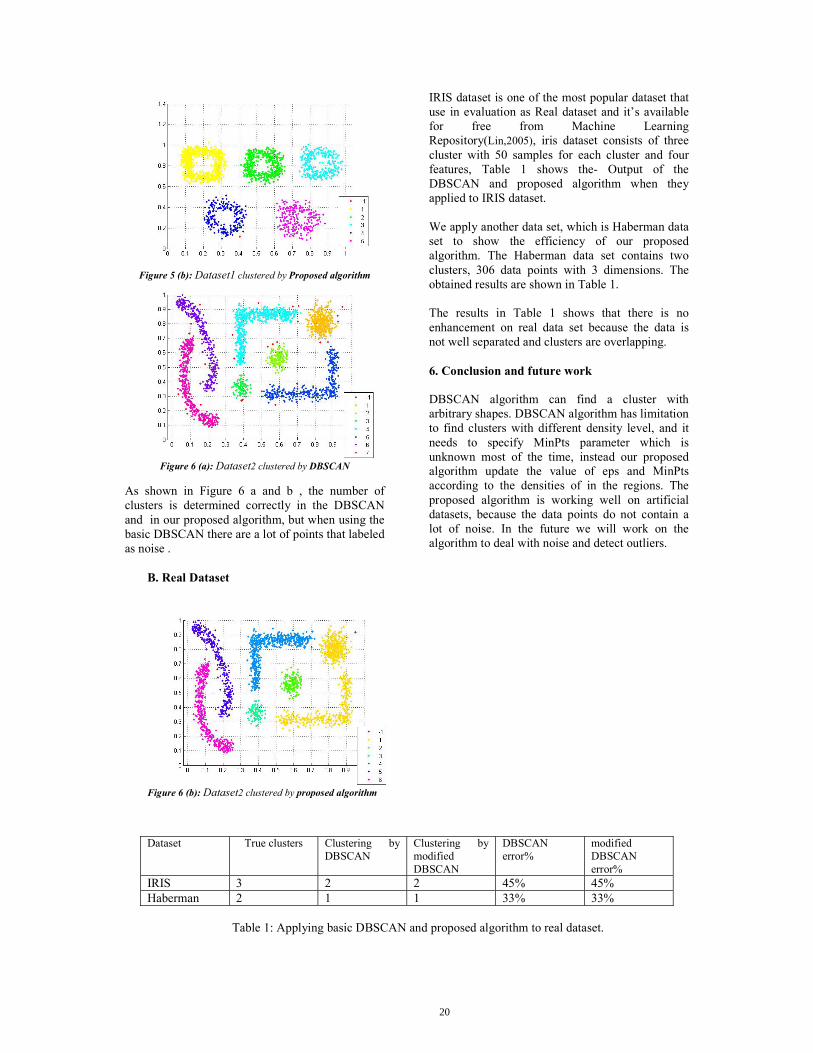
Figure 5 (b): Dataset1 clustered by Proposed algorithm
Figure 6 (a): Dataset2 clustered by DBSCAN
As shown in Figure 6 a and b , the number of clusters is determined correctly in the DBSCAN and in our proposed algorithm, but when using the basic DBSCAN there are a lot of points that labeled as noise .
B. Real Dataset
IRIS dataset is one of the most popular dataset that use in evaluation as Real dataset and it’s available for free from Machine Learning Repository(Lin,2005), iris dataset consists of three cluster with 50 samples for each cluster and four features, Table 1 shows the- Output of the DBSCAN and proposed algorithm when they applied to IRIS dataset. We apply another data set, which is Haberman data set to show the efficiency of our proposed algorithm. The Haberman data set contains two clusters, 306 data points with 3 dimensions. The obtained results are shown in Table 1. The results in Table 1 shows that there is no enhancement on real data set because the data is not well separated and clusters are overlapping. 6. Conclusion and future work
DBSCAN algorithm can find a cluster with arbitrary shapes. DBSCAN algorithm has limitation to find clusters with different density level, and it needs to specify MinPts parameter which is unknown most of the time, instead our proposed algorithm update the value of eps and MinPts according to the densities of in the regions. The proposed algorithm is working well on artificial datasets, because the data points do not contain a lot of noise. In the future we will work on the algorithm to deal with noise and detect outliers.
Figure 6 (b): Dataset2 clustered by proposed algorithm
Dataset True clusters Clustering by
DBSCAN Clustering by modified DBSCAN
DBSCAN error%
modified DBSCAN error%
IRIS 3 2 2 45% 45% Haberman 2 1 1 33% 33%
Table 1: Applying basic DBSCAN and proposed algorithm to real dataset.
20

REFERENCES Ankerst M., Breunig M., Kriegel H., and Sander J.
(1999) “OPTICS: Ordering Objects to Identify the Clustering Structure, Proc. ACM SIGMOD,” in International Conference on Management of Data, pp. 49–60.
Bahmani Firouzi B., Niknam T, and Nayeripour M., (2008) “A new evolutionary algorithm for cluster analysis,” in Proceedings of the World Academy of Science, Engineering and Technology, vol. 36, December.
Borah B., Bhattacharyya D. (2008) "DDSC, "A Density Differentiated Spatial Clustering Technique", Journal of Computers, vol. 3, no. 2, February.
Ester M., Kriegel H., Sander J., and Xu X. (1996) “A Density-Based Algorithm for Discovering Clusters in Large Spatial Databases with Noise” In Proceedings of the 2nd International Conference on Knowledge Discovery and Data Mining (KDD’96), Portland: Oregon, pp. 226-231.
Fillippone, M., Camastra, F., Masulli, F., Rovetta, S. (2008). "A survey of kernel and spectral methods for clustering" In Pattern Recognition 41, 176–190.
Han J. and Kamber M. (2006) Data Mining Concepts and Techniques. Morgan Kaufman.
Hinneburg A. and Keim D. (1998) “An efficient approach to clustering in large multimedia data sets with noise,” in 4th International Conference on Knowledge Discovery and Data Mining, pp. 58–65.
Hsu D. and Johnson S. (2008) “A vibrating method based cluster reducing strategy,” in Proceedings of the 5th International Conference on Fuzzy Systems and Knowledge Discovery (FSKD ’08), pp. 376–379, Shandong, China, October.
Jain A. and Dubes R. (1998) Algorithm for Clustering Data, Prentice Hall, Englewood Cliffs, NJ, USA.
Jian L., Wei Y. and Bao-Ping Y. (2009) "Memory effect in DBSCAN algorithm" In Computer Science & Education, 2009. ICCSE '09. 4th International Conference on, vol., no., pp.31-36, 25-28 July.
Kailing K, Kriegel H. and Kroger P (2004). "Density-connected subspace clustering for high-dimensional data" In Proceedings of the 4th SIAM International Conference on Data Mining (SDM), Lake Buena Vista, FL.
Karypis G., Han E., and Kumar V. (1999) “CHAMELEON: A hierarchical clustering algorithm using dynamic modeling” In Computer, vol. 32, no. 8, pp. 68–75.
Lin C. and Chang C. (2005) “A new density-based scheme for clustering based on genetic algorithm” In Fundamental Informatics, vol. 68, no. 4, pp. 315–331.
Pascual D., Pla F., and Sanchez J. (2006) “Non parametric local density-based clustering for multimodal overlapping distributions,” In Proceedings of the Intelligent Data Engineering and Automated Learning (IDEAL ’06), pp. 671–678, Burgos, Spain.
Pei T, Jasra A, Hand D, Zhu A and Zhou C. (2009) "DECODE: a new method for discovering clusters of different densities in spatial data" In Data Mining Knowledge Discovery, 18:337–369.
Peng L., Dong Z., and Naijun W. (2007) “VDBSCAN: varied density based spatial clustering of applications with noise,” In Proceedings of the International Conference on Service Systems and Service Management (ICSSSM ’07), pp. 528–531, Chengdu, China, June.
Peter J. and Antonysamy A. (2010) “Heterogeneous density based spatial clustering of application with noise,” In International Journal of Computer Science and Network Security, vol. 10, no. 8, pp. 210–214.
Ram, A., Sharma, A., Jalal A., Agrawal, A. and Singh R. (2009) "An Enhanced Density Based Spatial Clustering of Applications with Noise," In Advance Computing Conference, 2009. IACC 2009. IEEE International, vol., no., pp.1475-1478, 6-7 March.
Vijayalakshmi S. and Punithavalli M. (2007) "Improved Varied Density Based Spatial Clustering Algorithm with Noise" In Services Systems and Services Management International Conference, June.
21
Exploration of Cloud Computing Adoption for E-learning in Higher Education
Isaiah Ewuzie and Abel Usoro School of Computing University of the West of Scotland, UK
[email protected] and [email protected] ABSTRACT E-learning is a comparatively new concept, even newer is cloud computing. Thus, there is need to increase research on how the two innovations can best work together. This paper explains the challenge within the context of higher education. This paper begins with background literature research on these key concepts before identifying where gaps exist. It then proposes a research by presenting objectives and indicating proposed methods for the investigation. Keywords: cloud computing, cloud adoption, e-learning. INTRODUCTION In recent years e-learning tools appear to be growing and are becoming widely accepted as a learning method. This growth and acceptability may not be unconnected to, among others, its flexible access, just in time delivery (JIT) and perceived cost effectiveness (Wang, 2011), and potential for education and learning (Cobcroft et al 2006), as well as the opportunity for creation, implementation and delivering of user specific applications anytime and anywhere. The growth and acceptability of e-learning and advances in information technology (IT) have resulted in a shift from the traditional learning methods to a more advanced form of learning through the use of the Internet, thereby resulting in changes in the learning content, delivery and modes (McGuire and Gubbins, 2010). There also seems to be rapid and drastic changes in the way and manner learning institutions and organisations conduct their businesses, brought about by advances in information technology (IT). These advances have given rise to developments and research in cloud computing. As the demand for education and the need to develop and improve e-learning solution increases, cloud computing is seen as a new direction for e-learning systems in order to keep pace with developments in technology (Pocatilu et al,
2010). Considering the growth and acceptability of e-learning tools and current advances in cloud computing, the need for adequate research in cloud computing for higher education would not be greater and timelier. Furthermore, cloud computing appears to be generating a lot of interest both within the academia and the industry as the number of workshops, symposia and conferences on cloud are on the increase. It is expected that institutions of higher learning will take advantage of this and tap into e-learning and knowledge market that cloud computing may provide. This paper is not presenting a result of an empirical work but is an early exploration of the topic. Therefore it performs preliminary literature review and proposes a research by presenting objectives and indicating proposed methods for the investigation. The rest of this paper will present cloud computing, gap in knowledge, objectives and summary. CLOUD COMPUTING Various researchers have defined cloud computing differently. Some schools of thought are of the opinion that cloud is an evolution of various computing resources and technologies at different times, combined to deliver new possibilities through high speed internetworks. Another school of thought believes that cloud computing is a new paradigm with new technologies such as virtualisation. Definitions have also been proposed based on scalability and elasticity, ability to be delivered and accessed in real time and cost considerations. The term cloud computing describes a type of parallel and distributed system consisting of a collection of inter-connected and virtualized computers that are dynamically provisioned and presented as one or more unified computing resource(s) based on service-level agreements established through negotiations
22

between the service provider and consumers (Buyya et al, 2009). These concepts shift the location of this infrastructure to the network to reduce the cost associated with management of hardware and software because the computation takes place on remote servers (Vaquero et al, 2009). The definition in 2011 by the National Institute of Standards and Technology (NIST) appears to be widely accepted in the cloud computing industry as it includes the key elements and characteristics of cloud computing. The NIST defined cloud computing as “A model for enabling convenient, on-demand network access to shared pool of configurable computing resources (e.g. networks, servers, storage, applications and services) that can be rapidly provisioned and released with minimal management effort or service provider interaction”. The key elements and characteristics of cloud computing as contained in the NIST definition 2011 include:
• On-demand self-service: Ability of consumers to access computing resources (e.g. server time and network storage) instantaneously and unilaterally without need for human interaction.
• Broad network access: Computing resources and capabilities are available over the network (e.g. Internet) and accessed using various heterogeneous platforms (e.g., mobile phones, tablets, laptops and workstations).
• Resource pooling: The ability to pool provider’s computing resources to serve multiple consumers using a multi-tenant virtualisation model while dynamically meeting the needs of the consumer. With a pool based model the consumer has no control or knowledge of the exact location as the computing resources (storage, processing, etc) are virtualised.
• Rapid elasticity: Ability to provision instantaneously and dynamically based on particular needs and demands at any time.
• Measured service: Being able to measure usage of computing resources with the use of metering mechanism such that resources are better controlled and monitored.
E-LEARNING Although e-learning is somewhat new, the advent of the Internet with features such as its broadband has expanded its meaning and dimension such that it has become a widely accepted way of learning. The factors that have made e-learning so acceptable include innovations in digital videos and personal computers (Catherall, 2005). The Internet and the World Wide Web are seen as the focal point of e-learning technologies since it is web based and delivered via web browsers, such as the Internet Explorer. E-learning, as the word suggests, means electronic learning which includes traditional electronic media such as video and more recent media as the Internet. It is an innovative approach for delivering well-designed, learner-centred, interactive and facilitated learning environments to anyone, anyplace and anytime (Dong et al, 2009). Therefore the use of any technology (computer based) that allows for delivery of learning resources or communication between tutor and students is defined as e-learning (Catherall, 2005). GAPS IN KNOWLEDGE As information technology (IT) continues to play a hugely important role in various walks of life, its impact on e-learning is visibly evident in the ability of learners and users to access, evaluate and use information to build knowledge and solve problems through the use of digital library (Neuman, 1997). However, the current e-learning offerings appear to be limited and unsuitable hence unable to meet the demands of the learners and their resource needs. This limitation massively impedes development (Ma et al, 2010, Liasheng & Zhengxia, 2011). Cloud computing on the other hand is rapidly changing the computing and business landscape, including the learning organisations as it empowers them in creating, implementing and delivering user specific applications anytime and anywhere.
23
Though there are a number of works on e-learning and cloud computing, they appear to be more of comparative studies (Rimal et al, 2010). Many researchers are focusing on benefits with emphasis on economics and cost reduction through a variety of measures (Armbrust et al, 2010; Pocatilu et al, 2010; Ercan, 2010; Sultan 2010), issues, challenges and scepticisms (Casola et al, 2011; Dillon et al, 2010; Heiser & Nicolett, 2008; Hosseini et al, 2010; Liasheng & Zhengxia, 2011; Lin et al, 2009; Pearson, 2009; Subashini and Kavitha, 2011; Rimal et al, 2010), ranking factors when deciding services and vendors etc. (Garg et al, 2012). Some research work carried out on the actual adoption and usages of cloud computing for education were limited. For example, Webber (2011) carried out a research on the adoption of cloud computing in higher education, highlighting the benefits and concerns of such an adoption taking into consideration the socio-cultural issues of the Middle East and North Africa (MENA) region. However, his research was limited to that region. Behrend et al (2010) also limited their research on the adoption of cloud computing and usage to community colleges. Based on the aforementioned paragraph, research that explores the possibilities of cloud computing in higher education should address the following questions:
• How can we use cloud computing to efficiently support e-learning for higher education?
• What are the key factors, if any, that may affect adoption of cloud computing for higher education?
• What is the role of IT in the current cloud computing infrastructure and environment?
OBJECTIVES To answer these questions, the following objectives should be used:
• Conducting a critical review of literatures on e-learning and cloud computing.
• Conducting a critical review of the relationships between e-learning, IT infrastructures and cloud computing.
• Identifying factors that are likely to influence adoption of cloud computing for e-learning in higher education.
• Evaluating the current e-learning technologies and how they can be improved with the adoption of cloud computing.
• Establishing the relationships between the identified factors.
• Developing a theoretical model that may be used in adopting e-learning systems with cloud computing.
• Performing primary study to validate the research model.
• Presenting implications (recommendations) and framework that may act as a platform for practice and future research.
SUMMARY This paper introduced cloud computing and e-learning concepts. It also presented problems relating to cloud computing in higher education. Since cloud computing promises great potentials, it is hoped that developing and validating a research model for cloud computing adoption in higher education will help in harnessing the e-learning potentials also. This development and validation will form the basis for future research. References Armbrust, M., Fox, A., Griffith, R,. Joseph, A.D.,
Katz, R,. Konwinski, A., Lee, G., Patterson, D., Rabkin, A., Stoica, I. and Zaharia, M. (2010) Clearing the clouds away from the true potential and obstacles posed by this computing capability: A view of cloud computing. ACM 53 (4)
Behrend, T.S., Weibe, E.N., London, J.E. and Johnson, E.C (2010) Cloud computing adoption and usage in community colleges. Behaviour and Information Technology, 30 (2), pp231-240. Taylor and Francis Group.
Buyya, R., Yeo, C.S. Venugopal, S., Broberg, J. and Brandic, I. (2009) Cloud computing and emerging IT platforms: Vision, hype, and reality for delivering computing as the 5th utility. Future Generation Computer Systems (25) 599_616 [Online] Available
24
from: http://www.sciencedirect.com/science/article/pii/S0167739X08001957 [Accessed 10 April 2012]
Casola, V.; Cuomo, A; Rak, M and Villano, U (2011) The CloudGrid approach: Security analysis and performance evaluation. Future Generation Computing Systems, Elsevier.
Catherall, P. (2005) Delivering E-learning for Information Services in Higher Education. Oxford England, New Hampshire USA: Chandos Publishing.
Cobcroft, Rachel, S., Towers, Stephen, Smith, Judith, Bruns, Axel (2006) Mobile learning in review: Opportunities and challenges for learners, teachers, and institutions. In: Proceedings Online Learning and Teaching (OLT) Conference 2006. Brisbane: Queensland University of Technology, pages pp. 21-30 [Online] Available from: http://eprints.qut.edu.au [Accessed 17 October 2012]
Dong, B., Zheng, Q., Qiao, M., Shu, J. and Yang, J. (2009b) BlueSky Framework: An E-learning Framework Embracing Cloud Computing. [Online] Available from: http://www.springerlink.com/content/yp527x3wm7854360/fulltext.pdf [Accessed 24 July 2012]
Dong, B., Zheng, Q., Yang, J., Li, H. and Qiao, M. (2009a) An e-learning ecosystem based on cloud computing infrastructure. Ninth IEEE International Conference on Advanced Learning Technologies. IEEE Computer Society
Ercan, T. (2010) Effective use of cloud in educational institutions. Science Direct. Procedia Social and Behavioural Science. pp 938-942. Elsevier
Garg, S.K., Versteeg, S. and Buyya, R. (2012) A framework for ranking cloud computing services. Future Generation Computer Systems. DOI:10.1016/j.future.2012.06.006
Heiser, J. and Nicolett, M. (2008) Assessing the Security Risk of Cloud Computing. [Online] Available from: http://www.gartner.com/id=68536 [Accessed 23 September 2012]
Hosseini, A.K., Sommerville, I., Sriram, I. (2010) Research Challenges for Enterprise Cloud Computing [Online] Available from:
http://arxiv.org/ftp/arxiv/papers/1001/1001.3257.pdf [Accessed 23 July 2012]
Liasheng, X. and Zhengxia, W (2011) Cloud Computing: a New Business Paradigm for E-learning. Third International Conference on Measuring Technology and Mechatronics Automation. IEEE Computer Society
Lin, G., Fu, D., Zhu, J,. Dasmalchi, G. (2009) Cloud computing: IT as a Service. IT Professional. 11 (2), pp. 10-13 IEEE Computer Society [online] Available from: http://www.computer.org/csdl/mags/it/2009/02/mit2009020010.html [Accessed 23 July 2012]
McGuire, D and Gubbins, C (2010) The Slow Death of Formal Learning: A Polemic. Human Resource Development Review, 9 (3), pp 249–265.
Mell, P., and Grance, T. (2011) The NIST Definition of Cloud Computing (Draft) Recommendations of the National Institute of Standards and Technology
Neuman, D. (1997) Learning and the digital library Library Trend, 45 (4), pp.687-709.
Pocatilu, P., Alecu, F., and Vetrici, M. (2010) Measuring the Efficiency of Cloud Computing for E-learning Systems. [Online] Available from: http://www.wseas.us/e-library/transactions/computers/2010/89-159.pdf. [Accessed 8 October 2011]
Rimal, B.P., Choi, E. and Lumb, I. (2010) A Taxonomy, Survey and Issues of Cloud Computing Ecosystem. In: Gilliam, L and Antonopoulos, N (eds), Cloud Computing: Principles, Systems and Applications. London: Computer Commutations and Networks, chapter 2 pp21-46
Subashini, S. and Kavitha, V, (2011) A survey on security issues in service delivery models of cloud computing. Journal of Network and computer applications 34 pp. 1-11
Vaquero, L.M., Rodero-Merino, M., Caceres, J., Lindner, M. (2009) Break in the Clouds: Towards a Cloud definition. ACM SIGCOMM Computer Review, 39 (1), pp 50-55
Wang, M. (2011) Integrating Organisational, Social and Individual Perspectives in Web 2.0-Based Workplace E-Learning. Information Systems Frontiers, 13 (2), pp 91-205.
25

New Methods for DNA Sequence Similarity Analysis
Maryam Nuser, Izzat Alsmadi and Heba Al-Shaek Salem Computer Information Systems department
Yarmouk University, Irbid, Jordan [email protected],[email protected] and [email protected]
Abstract Similarity for DNA sequences is an important issue in computational biology where sequences are analyzed to find the most similar/dissimilar pairs. This helps scientists in predicting the functionality of unknown regions based on the similarity, making medical experiments on species that are similar to human, for example, before testing it on humans, and helps in drawing phylogenetic trees for several species. Several techniques exist that are either based on alignment between sequences or are alignment-free. This paper introduces four alignment-free approaches for finding similarity between DNA sequences. These techniques are simple, fast, and efficient. The first one is based on a graphical representation of the difference between DNA sequences. The second one is based on the statistical correlation coefficient between the DNA sequences. The third approach is based on the Gibbs free energy between the sequences, and the fourth one is based on the difference in the count of individual nucleotides between sequences. All techniques were tested on the beta-Globin genes of seven species. Results of the four techniques were compatible; in addition, they confirmed results in other relevant research papers.
Keywords: DNA sequences; DNA similarity; correlation Coefficient; graphical-based DNA comparison; Gibbs-free energy; and beta-Globin genes.
1. INTRODUCTION DNA is the nucleic acid that contains the genetic information for all biological systems. It consists of a long sequence of nucleotide blocks particularly: Adenine (A), Thymine (T), Cytosine (C) and Guanine (G). The arrangement of these four bases determines the exact function and coding capacity of the DNA sequence and helps in distinguishing between individuals.
With the rapid increase in the number of DNA sequences and the need to analyze these sequences and to find the similarity between
these sequences, several techniques have been suggested. These techniques either allow insertions and deletions of elements in the DNA sequence [e.g. BLAST, DIALIGN, etc.] or treat the DNA sequences as complete (i.e. with no insertions or deletions) [e.g. Guo et al. 2008, Guohua 2011, etc.].
The first description of a sequence similarity search method that allows insertions, deletions, and gaps was published in [Needleman, 1970] where a computer program for finding similarities in the amino acid sequences of two proteins was developed.
Basic Local Alignment Search Tool (BLAST) is one of the most commonly used web tools for comparing primary biological sequence information whether proteins or DNA sequences. One problem that may occur with web tools is the semantic type mismatch in scientific workflows. This problem was tackled in [Kheiredine and Denis, 2007] and a similarity search on DNA sequences was applied that guarantees semantic type correctness in scientific workflows.
Another computer program that is used for multiple sequence alignment is DIALIGN. This program combines both local and global alignment features and uses dynamic programming in its algorithm [DIALIGN]. In order to improve the performance of this program, a hardware accelerator was built and combined with the program. Experiments showed a clear progress in the retrieval of alignments for large biological sequences. [Azzedine et al., 2010].
Several other tools were built whether for DNA sequences or proteins [Dominic et al., 2008; Elizabeth, 2008; and Boris, 2009]. A study that compares several tools was conducted experimentally in [Petri, 2008] shows that new variations of old algorithms were efficient in practice. In addition, the authors mentioned that the algorithms’ efficiency comparison depends on the performance of the computer or the
26
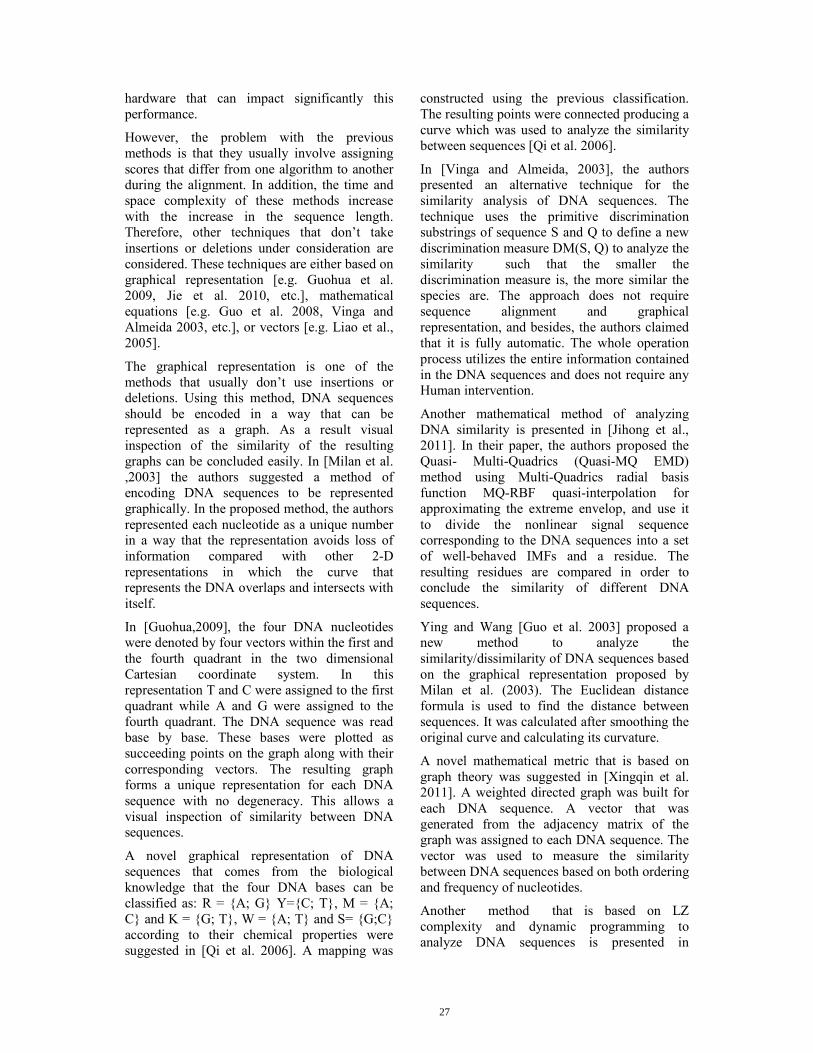
hardware that can impact significantly this performance.
However, the problem with the previous methods is that they usually involve assigning scores that differ from one algorithm to another during the alignment. In addition, the time and space complexity of these methods increase with the increase in the sequence length. Therefore, other techniques that don’t take insertions or deletions under consideration are considered. These techniques are either based on graphical representation [e.g. Guohua et al. 2009, Jie et al. 2010, etc.], mathematical equations [e.g. Guo et al. 2008, Vinga and Almeida 2003, etc.], or vectors [e.g. Liao et al., 2005].
The graphical representation is one of the methods that usually don’t use insertions or deletions. Using this method, DNA sequences should be encoded in a way that can be represented as a graph. As a result visual inspection of the similarity of the resulting graphs can be concluded easily. In [Milan et al. ,2003] the authors suggested a method of encoding DNA sequences to be represented graphically. In the proposed method, the authors represented each nucleotide as a unique number in a way that the representation avoids loss of information compared with other 2-D representations in which the curve that represents the DNA overlaps and intersects with itself.
In [Guohua,2009], the four DNA nucleotides were denoted by four vectors within the first and the fourth quadrant in the two dimensional Cartesian coordinate system. In this representation T and C were assigned to the first quadrant while A and G were assigned to the fourth quadrant. The DNA sequence was read base by base. These bases were plotted as succeeding points on the graph along with their corresponding vectors. The resulting graph forms a unique representation for each DNA sequence with no degeneracy. This allows a visual inspection of similarity between DNA sequences.
A novel graphical representation of DNA sequences that comes from the biological knowledge that the four DNA bases can be classified as: R = {A; G} Y={C; T}, M = {A; C} and K = {G; T}, W = {A; T} and S= {G;C} according to their chemical properties were suggested in [Qi et al. 2006]. A mapping was
constructed using the previous classification. The resulting points were connected producing a curve which was used to analyze the similarity between sequences [Qi et al. 2006].
In [Vinga and Almeida, 2003], the authors presented an alternative technique for the similarity analysis of DNA sequences. The technique uses the primitive discrimination substrings of sequence S and Q to define a new discrimination measure DM(S, Q) to analyze the similarity such that the smaller the discrimination measure is, the more similar the species are. The approach does not require sequence alignment and graphical representation, and besides, the authors claimed that it is fully automatic. The whole operation process utilizes the entire information contained in the DNA sequences and does not require any Human intervention.
Another mathematical method of analyzing DNA similarity is presented in [Jihong et al., 2011]. In their paper, the authors proposed the Quasi- Multi-Quadrics (Quasi-MQ EMD) method using Multi-Quadrics radial basis function MQ-RBF quasi-interpolation for approximating the extreme envelop, and use it to divide the nonlinear signal sequence corresponding to the DNA sequences into a set of well-behaved IMFs and a residue. The resulting residues are compared in order to conclude the similarity of different DNA sequences.
Ying and Wang [Guo et al. 2003] proposed a new method to analyze the similarity/dissimilarity of DNA sequences based on the graphical representation proposed by Milan et al. (2003). The Euclidean distance formula is used to find the distance between sequences. It was calculated after smoothing the original curve and calculating its curvature.
A novel mathematical metric that is based on graph theory was suggested in [Xingqin et al. 2011]. A weighted directed graph was built for each DNA sequence. A vector that was generated from the adjacency matrix of the graph was assigned to each DNA sequence. The vector was used to measure the similarity between DNA sequences based on both ordering and frequency of nucleotides.
Another method that is based on LZ complexity and dynamic programming to analyze DNA sequences is presented in
27
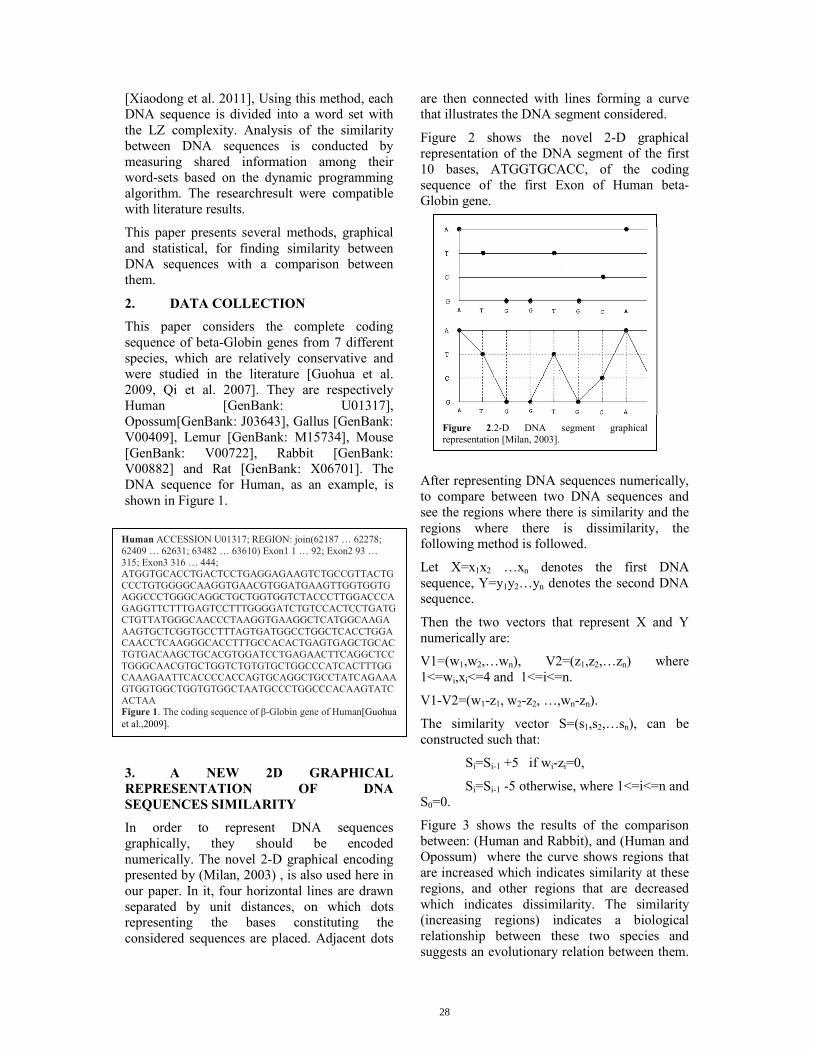
[Xiaodong et al. 2011], Using this method, each DNA sequence is divided into a word set with the LZ complexity. Analysis of the similarity between DNA sequences is conducted by measuring shared information among their word-sets based on the dynamic programming algorithm. The researchresult were compatible with literature results.
This paper presents several methods, graphical and statistical, for finding similarity between DNA sequences with a comparison between them.
2. DATA COLLECTION This paper considers the complete coding sequence of beta-Globin genes from 7 different species, which are relatively conservative and were studied in the literature [Guohua et al. 2009, Qi et al. 2007]. They are respectively Human [GenBank: U01317], Opossum[GenBank: J03643], Gallus [GenBank: V00409], Lemur [GenBank: M15734], Mouse [GenBank: V00722], Rabbit [GenBank: V00882] and Rat [GenBank: X06701]. The DNA sequence for Human, as an example, is shown in Figure 1.
3. A NEW 2D GRAPHICAL REPRESENTATION OF DNA SEQUENCES SIMILARITY In order to represent DNA sequences graphically, they should be encoded numerically. The novel 2-D graphical encoding presented by (Milan, 2003) , is also used here in our paper. In it, four horizontal lines are drawn separated by unit distances, on which dots representing the bases constituting the considered sequences are placed. Adjacent dots
are then connected with lines forming a curve that illustrates the DNA segment considered.
Figure 2 shows the novel 2-D graphical representation of the DNA segment of the first 10 bases, ATGGTGCACC, of the coding sequence of the first Exon of Human beta-Globin gene.
After representing DNA sequences numerically, to compare between two DNA sequences and see the regions where there is similarity and the regions where there is dissimilarity, the following method is followed.
Let X=x1x2 …xn denotes the first DNA sequence, Y=y1y2…yn denotes the second DNA sequence.
Then the two vectors that represent X and Y numerically are:
V1=(w1,w2,…wn), V2=(z1,z2,…zn) where 1<=wi,xi<=4 and 1<=i<=n.
V1-V2=(w1-z1, w2-z2, …,wn-zn).
The similarity vector S=(s1,s2,…sn), can be constructed such that:
Si=Si-1 +5 if wi-zi=0,
Si=Si-1 -5 otherwise, where 1<=i<=n and S0=0.
Figure 3 shows the results of the comparison between: (Human and Rabbit), and (Human and Opossum) where the curve shows regions that are increased which indicates similarity at these regions, and other regions that are decreased which indicates dissimilarity. The similarity (increasing regions) indicates a biological relationship between these two species and suggests an evolutionary relation between them.
Human ACCESSION U01317; REGION: join(62187 … 62278; 62409 … 62631; 63482 … 63610) Exon1 1 … 92; Exon2 93 … 315; Exon3 316 … 444; ATGGTGCACCTGACTCCTGAGGAGAAGTCTGCCGTTACTGCCCTGTGGGGCAAGGTGAACGTGGATGAAGTTGGTGGTGAGGCCCTGGGCAGGCTGCTGGTGGTCTACCCTTGGACCCAGAGGTTCTTTGAGTCCTTTGGGGATCTGTCCACTCCTGATGCTGTTATGGGCAACCCTAAGGTGAAGGCTCATGGCAAGAAAGTGCTCGGTGCCTTTAGTGATGGCCTGGCTCACCTGGACAACCTCAAGGGCACCTTTGCCACACTGAGTGAGCTGCACTGTGACAAGCTGCACGTGGATCCTGAGAACTTCAGGCTCCTGGGCAACGTGCTGGTCTGTGTGCTGGCCCATCACTTTGGCAAAGAATTCACCCCACCAGTGCAGGCTGCCTATCAGAAAGTGGTGGCTGGTGTGGCTAATGCCCTGGCCCACAAGTATCACTAA Figure 1. The coding sequence of β-Globin gene of Human[Guohua et al.,2009].
Figure 2.2-D DNA segment graphical representation [Milan, 2003].
28

While the dissimilarity that appears in some positions on the curve indicates numerous mutations. The curve atpart a of figure 3 has more increasing regions than decreasing regions which indicates a high similarity between Human and Rabbit. While part b of Figure 3 demonstrates a similarity between Human and Opossum until around point 80 where a diversion occurs indicating a high dissimilarity between these two species.
The same can be done to all species. Figure 4 shows the similarity between Human and other species. The resulting figures agree with previous researches results [Guohua et al.,2009].
Our method has several advantages over other methods such as:
The similarity/dissimilarity regions can be easily inspected visually. The complexity of the
method is linear which is much better than other algorithms that require higher complexity. The resulting similarity figure (such as Figure 4) doesn’t overlap or intersect itself. In addition, the method doesn’t involve any alignment process.
4. SIMILARITY BASED ON CORRELATION COEFFICIENT
Another method that can be used to check the similarity/dissimilarity between DNA sequences which is not based on graphical representation is shown here. This method depends on the correlation coefficient measure to decide the percent of similarity between sequences. Pearson’s correlation coefficient is used here. The Pearson product-moment correlation coefficient(r) for two sets of values, x and y, is given by the formula:
( )( )( ) ( )∑ −∑ −
−−= ∑
yyxx
yyxxr
22
where x and y are the sample means of the two arrays of values.
If the value of r is close to +1, this indicates a strong positive correlation, and if r is close to -1, this indicates a strong negative correlation.
The correlation coefficient gives a number that is between 1 and -1. Taking the absolute value of the correlation, the resulting number is between 0 and 1 with 1 indicating the most similarity and 0 indicating the least similarity.
Table 1 shows the results of calculating the correlation coefficient between the 7 species after representing them numerically using the same representation used above for the graphical method. Note that Human and Rabbit have a similarity of 0.85 while Human and Opossum has a similarity indicator of 0.18 which agrees with the previous graphical results shown above (i.e. Figures: 3 and 4). Table 1 indicates that six species (all except Opossum) are more similar to each other than the Opossum which is the most dissimilar to others. In addition, the most similar pairs of species are Human-Rabbit, Human-Lemur, and Rat-Mouse. These results agree with previous research results [Guohua et al.,2009].
Table 1 the correlation coefficient between the seven DNA sequences.
a) Human-Rabbit DNA sequence comparison
b)Human-Opossum DNA sequence comparison Figure 3. Human-Rabbit, Human-Opossum DNA sequence
comparison.
Figure 4 similarity graph between Human and the other species.
-1000
-500
0
500
1000
1500
2000
1 29 57 85 113
141
169
197
225
253
281
309
337
365
393
421
Human-Gallus
Human-Lemur
Human-mouse
Human-Opossum
Human-Rabbit
Human-Rat
29
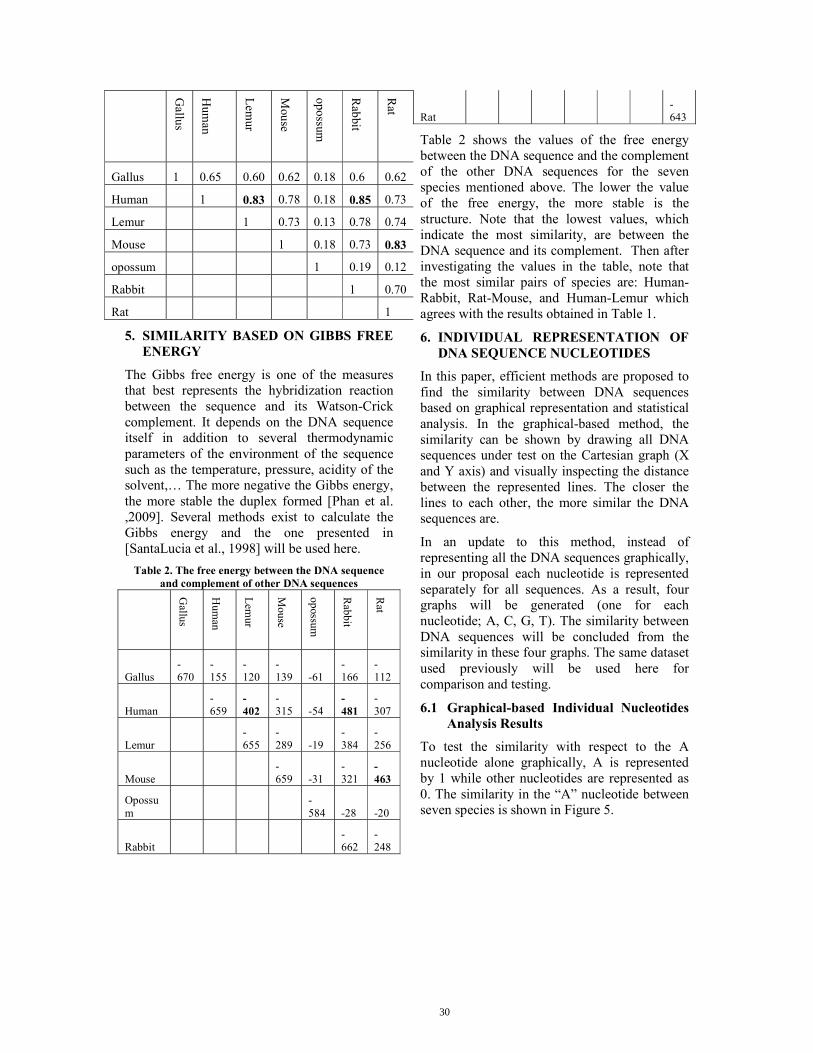
Gallus
Hum
an
Lem
ur
Mouse
opossum
Rabbit
Rat
Gallus 1 0.65 0.60 0.62 0.18 0.6 0.62
Human 1 0.83 0.78 0.18 0.85 0.73
Lemur 1 0.73 0.13 0.78 0.74
Mouse 1 0.18 0.73 0.83
opossum 1 0.19 0.12
Rabbit 1 0.70
Rat 1
5. SIMILARITY BASED ON GIBBS FREE ENERGY
The Gibbs free energy is one of the measures that best represents the hybridization reaction between the sequence and its Watson-Crick complement. It depends on the DNA sequence itself in addition to several thermodynamic parameters of the environment of the sequence such as the temperature, pressure, acidity of the solvent,… The more negative the Gibbs energy, the more stable the duplex formed [Phan et al. ,2009]. Several methods exist to calculate the Gibbs energy and the one presented in [SantaLucia et al., 1998] will be used here.
Table 2. The free energy between the DNA sequence and complement of other DNA sequences
Gallus
Hum
an
Lem
ur
Mouse
opossum
Rabbit
Rat
Gallus -670
-155
-120
-139 -61
-166
-112
Human -659
-402
-315 -54
-481
-307
Lemur -655
-289 -19
-384
-256
Mouse -659 -31
-321
-463
Opossum
-584 -28 -20
Rabbit -662
-248
Rat -643
Table 2 shows the values of the free energy between the DNA sequence and the complement of the other DNA sequences for the seven species mentioned above. The lower the value of the free energy, the more stable is the structure. Note that the lowest values, which indicate the most similarity, are between the DNA sequence and its complement. Then after investigating the values in the table, note that the most similar pairs of species are: Human-Rabbit, Rat-Mouse, and Human-Lemur which agrees with the results obtained in Table 1.
6. INDIVIDUAL REPRESENTATION OF DNA SEQUENCE NUCLEOTIDES
In this paper, efficient methods are proposed to find the similarity between DNA sequences based on graphical representation and statistical analysis. In the graphical-based method, the similarity can be shown by drawing all DNA sequences under test on the Cartesian graph (X and Y axis) and visually inspecting the distance between the represented lines. The closer the lines to each other, the more similar the DNA sequences are.
In an update to this method, instead of representing all the DNA sequences graphically, in our proposal each nucleotide is represented separately for all sequences. As a result, four graphs will be generated (one for each nucleotide; A, C, G, T). The similarity between DNA sequences will be concluded from the similarity in these four graphs. The same dataset used previously will be used here for comparison and testing.
6.1 Graphical-based Individual Nucleotides Analysis Results
To test the similarity with respect to the A nucleotide alone graphically, A is represented by 1 while other nucleotides are represented as 0. The similarity in the “A” nucleotide between seven species is shown in Figure 5.
30
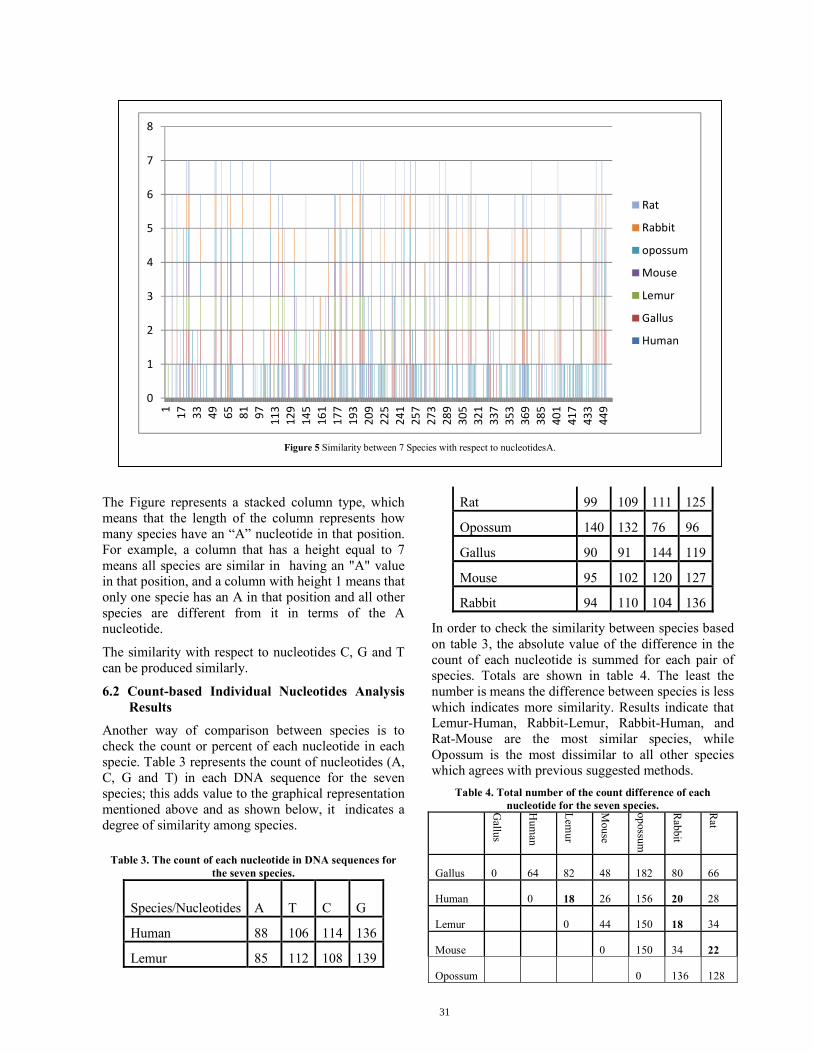
The Figure represents a stacked column type, which means that the length of the column represents how many species have an “A” nucleotide in that position. For example, a column that has a height equal to 7 means all species are similar in having an "A" value in that position, and a column with height 1 means that only one specie has an A in that position and all other species are different from it in terms of the A nucleotide.
The similarity with respect to nucleotides C, G and T can be produced similarly.
6.2 Count-based Individual Nucleotides Analysis Results
Another way of comparison between species is to check the count or percent of each nucleotide in each specie. Table 3 represents the count of nucleotides (A, C, G and T) in each DNA sequence for the seven species; this adds value to the graphical representation mentioned above and as shown below, it indicates a degree of similarity among species.
Table 3. The count of each nucleotide in DNA sequences for the seven species.
Species/Nucleotides A T C G
Human 88 106 114 136
Lemur 85 112 108 139
Rat 99 109 111 125
Opossum 140 132 76 96
Gallus 90 91 144 119
Mouse 95 102 120 127
Rabbit 94 110 104 136
In order to check the similarity between species based on table 3, the absolute value of the difference in the count of each nucleotide is summed for each pair of species. Totals are shown in table 4. The least the number is means the difference between species is less which indicates more similarity. Results indicate that Lemur-Human, Rabbit-Lemur, Rabbit-Human, and Rat-Mouse are the most similar species, while Opossum is the most dissimilar to all other species which agrees with previous suggested methods.
Table 4. Total number of the count difference of each nucleotide for the seven species. G
allus
Hum
an
Lem
ur
Mouse
opossum
Rabbit
Rat
Gallus 0 64 82 48 182 80 66
Human 0 18 26 156 20 28
Lemur 0 44 150 18 34
Mouse 0 150 34 22
Opossum 0 136 128
Figure 5 Similarity between 7 Species with respect to nucleotidesA.
0
1
2
3
4
5
6
7
8
1 17 33 49 65 81 97 113
129
145
161
177
193
209
225
241
257
273
289
305
321
337
353
369
385
401
417
433
449
Rat
Rabbit
opossum
Mouse
Lemur
Gallus
Human
31
Rabbit 0 24
Rat 0
7. A COMPARISON BETWEEN THE USED METHODS
Previous methods, graphical and statistical, used above agree with their results according to the similarity of 6 species and the dissimilarity of the Opossum with other species. In addition, there is a strong agreement in the results of the correlation coefficient based method with the free energy based method and the count-based method regarding the degree of similarity of the seven species
Graphical methods show visually the regions that are similar and the regions that are not similar, while statistical methods indicate the similarity/dissimilarity of the sequences as a whole and both gave compatible results.
8. CONCLUSION DNA sequence similarity helps researchers in several areas of the field of bioinformatics. Four techniques for testing the similarity between DNA sequences are demonstrated. The similarity is checked based on a graphical representation, correlation coefficient, Gibbs free energy, and the count of individual nucleotides in each sequence.
The techniques were tested on the beta-Globin gene for seven species. Similarity/dissimilarity results agree between the four techniques. Furthermore, current results show a match with previous research results. Advantages of these techniques over other techniques in the literature are simplicity and efficiency.
REFERENCES Boukerche, Azzedine; Correa, Jan M.; Melo, Alba
Cristina; Jacobi, Ricardo P. (2010) “A Hardware Accelerator for the Fast Retrieval of DIALIGN Biological Sequence Alignments in Linear Space”, IEEE Transactions on Computers, 59(6): 808—821.
BLAST, http://blast.ncbi.nlm.nih.gov/Blast.cgi, Accessed Jan. 2012.
Vishnepolsky, Boris; Pirtskhalava, Malak (2009) “ALIGN MTX—An optimal pairwise textual sequence alignment program, adapted for using in sequence-structure alignment”; Computational Biology and Chemistry, 33(3):235-238.
DIALIGN, http://dialign.gobics.de/, Accessed Jan. 2012.
Rose, Dominic; Hertel, Jana; Reiche, Kristin; Stadler, Peter F.; Hackermüller, Jörg (2008) “NcDNAlign: Plausible multiple alignments of non-protein-coding genomic Sequences”; Genomics, 92: 65-74.
Dong, Elizabeth; Smith, Jarrod; Heinze, Sten; Alexander, Nathan; Meiler, Jens (2008) “BCL::Align—Sequence alignment and fold recognition with a custom scoring function online”; Gene; 422(1-2): 41–46.
Ying, Guo; Wang, Tian-ming (2008) “A new method to analyze the similarity of the DNA sequences”; Journal of Molecular Structure: THEOCHEM 853: 62–67;
Huang, Guohua; Liao, Bo; Li, Yongfan; Yu, Yougui (2009) “Similarity studies of DNA sequences based on a new 2D graphical representation”, Biophysical Chemistry 143: 55–59.
Huang, Guohua; Zhou, Houqing; Li, Yongfan; Xu, Lixin (2011) ”Alignment-free comparison of genome sequences by a new numerical characterization; Journal of Theoretical Biology”281(1):107-112.
Feng, Jie; Hu, Yong; Wan, Ping; Zhang, Aibing; Zhao,Weizhong (2010) “New method for comparing DNA primary sequences based on adiscrimination measure”, Journal of Theoretical Biology 266:703–707
Zhang, Jihong; Wang, Renhong; Bai, Fenglan; Zheng, Junsheng (2011) “A Quasi-MQ EMD method for similarity analysis of DNA sequences”, Applied Mathematics Letters 24(12): 2052-2058
Derouiche, Kheiredine; Nicole, Denis A. (2007) “Semantically Resolving Type Mismatches in Scientific Workflows”, OTM 2007 Workshops, Springer-Verlag Berlin Heidelberg, Part I, LNCS 4805:125–135.
Liao, Bo; Tan, Mingshu; Ding, Kequan (2005) “A 4D representation of DNA sequences and its application”. Chem.Phys. Lett., 402: 380–383.
Randic, Milan; Vracko, Marjan; Lers, Nella; Plavsic, Dejan (2003) “Novel 2-D graphical representation of DNA sequences and their numerical characterization”, Chemical Physics Letters 368:1–6.
Needleman, Saul B.; Wunsch, Christian D. (1970) "A general method applicable to the search for similarities in the amino acid sequence of two proteins". Journal of Molecular Biology 48 (3): 443–53.
Kalsi, Petri; Peltola, Hannu; Tarhio, Jorma (2008) “Comparison of Exact String Matching Algorithms for Biological Sequences”. In: Proc. BIRD ’08, 2nd International Conference on Bioinformatics Research and Development (ed.
32
M. Elloumi et al.). Communications in Computer and Information Science 13, Springer, 417-426.
Phan, Vinhthuy; Garzon, Max(2009) “On codeword design in metric DNA spaces”, Natural Computing: an international journal 8(3):571–588.
Qi, Dai; Liu, Xiaoqing; Wang, Tianming (2006) “A novel 2D graphical representation of DNA sequences and its application”, Journal of Molecular Graphics and Modelling 25:340–344
Qi, Xiao-Qin; Wen, Jie; Qi, Zhao-Hui (2007) “New3D graphical representation of DNA sequence based on dual nucleotides”, Journal of Theoretical Biology 249(4): 681-690.
SantaLucia, Jr. John(1998) “A unified view of polymer, dumbbell, and oligonucleotide DNA nearest-neighbor thermodynamics”, Proceedings of the National Academy of Sciences, 95:1460-1465.
Vinga, Susana; Almeida, Jonas (2003) “Alignment-free sequence comparison - a review”.Bioinformatics, 19(4):513-523.
Guo, Xiaodong; Dai, Qi; Han, Bin; Zhu, Lei; Li, Lihua (2011)“Similarity Analysis of DNA Sequences Based on LZ Complexity and Dynamic Programming Algorithm” : Bioinformatics and Biomedical Engineering, (iCBBE) 2011 5th International Conference, 1 – 4.
Qi, Xingqin; Wu, Qin; Zhang, Yusen; Fuller, Eddie; Zhang, Cun-Quan (2011) “A Novel Model for DNA Sequence Similarity Analysis Based on Graph Theory”, Evolutionary Bioinformatics:(7): 149–158.
33
Knowledge Management and SMEs’ Competitiveness in Nigeria: A Conceptual Analysis
*Olufemi Olabode Olayemi; *Sunday Patrick Okonji, **Abel Usoro and ***Ezendu Ariwa
*Department of Business Administration, University of Lagos, Akoka - Yaba, Nigeria **School of Computing, University of West of Scotland in Paisley, UK
***London Metropolitan University, London UK [email protected], [email protected], [email protected], and
ABSTRACT The purpose of this paper is to provide a conceptual overview of the knowledge management (KM) relationship with SMEs competitiveness in Nigeria. It also focuses on knowledge management processes amongst Nigerian SMEs by identifying those factors responsible for the application and adaptability of KM. It explores the relevance of KM in most SMEs and the extent to which organizational structural design influences KM in relation to SMEs competitiveness in the ever dynamic Nigerian business environment. Keywords: Knowledge management, SMEs, competitiveness, organizational structure, business environment. INTRODUCTION The business environment is increasingly becoming unpredictable and unsure. Businesses are being pressurized as a result of global competition, increased complexity, economic uncertainty (Watson et al. 1997; Ness, 2005) a more dynamic market place and a changing business environment (Brown, 2004). The difference between businesses that may likely succeed and those that may not depends on the extent of the knowledge they possess and how it is being apply to overcome challenges and be competitively relevant. This has necessitated most organizations in the developing economies to embrace KM in order to strengthen their capability for wealth creation. As current markets are characterized by high complexity caused by decreasing market entry barriers, increasing competition, shorter (product) life cycles, and increasing risk, the
roots of corporate competitiveness and success have changed. In particular, the significance of knowledge management has increased. Many KM experts believe that knowledge is a modern organization’s most important resource, the only resource not readily replicated by rivals, and therefore the source of its uniqueness. Senge (1990) argues that some organizations are unable to function as knowledge-based organizations because of the lack of their learning abilities. Nonaka (1991) believes that the twenty-first century successful organizations are those that consistently create new knowledge, disseminate it widely throughout the organization, and quickly embody it in new technologies and products. In highly competitive industries, firms need to focus on enhancing their knowledge management capability to ensure survival. These firms are more likely to integrate complementary resources and achieve superior performance (Ireland et al., 2002). Firms can meet this challenge by actively managing their knowledge repertoires and to do so effectively require that they focus on building and diffusing knowledge. Thus, the development of knowledge management expertise involves multiple steps related to the acquisition and utilization of knowledge within the firm. Organizations that actively utilize knowledge management tools can enhance their ability to create new knowledge within the firm (Wiltbank et al., 2006). The rate at which knowledge is effectively transferred and shared within a firm can significantly affect its competitive ability and firm performance.
34

Knowledge management (KM) should be at the forefront of any strategic management effort to be made by an organisation. Since knowledge is viewed as a key resource and strategic asset that contributes to improved firm performance, it is appropriate for firms to base their entire business on knowledge in order to survive in the market. Academics and practitioners have recognised that KM processes are becoming prerequisites for success in organisations (Cole, 1998; Davenport and Klahr, 1998; Powell, 1998). Some literature also suggests that KM processes contribute to organizational performance by improving job performance, leveraging core business competencies, accelerating time to market, reducing cycle times, enhancing product quality, etc. (Argote and Ingram, 2000; Davenport and Prusak, 1998). The objective of this paper is to gain a conceptual understanding of knowledge management as it relates to SMEs competitiveness and application of the concept in a developing economy. It is also to examine the extent to which the transference of knowledge and its impacts could serve as a strategic approach leading to better organizational survival and growth. It is realized that in the current knowledge economy, it is essential to keep up with the global challenges to strengthen the competitiveness of national economy players, such as Small and Medium Sized Enterprises (SMEs), in order to enhance wealth creation in most developing countries. Knowledge management do not focus on academics only, but a realization that knowing about knowledge is critical to business growth and survival and that if properly utilized and leveraged, can drive organisations to become more competitive, innovative and sustainable. A framework for identification of the state of Nigerian SME with respect to its competitiveness was developed in order for SMEs to become competitive in the global market. In an economy where the only certainty is uncertainty, the one sure source of lasting competitive advantage is knowledge. Successful organizations are those that consistently create new knowledge, disseminate it widely
throughout the organization, and quickly embody it in new technologies and products. The ability of firms to effectively adjust to changing conditions will be greater when it has a well-developed knowledge management capability (Collins and Hitt, 2006).Although, there are studies focusing on knowledge management in SMEs (Beijerse, 2000; Frey, 2001;Wickert and Herschel, 2001), as well as on growth of SMEs (Choueke and Armstrong, 2000; Morrison and Bergin-Seers, 2002), but hardly any of these studies focusing on KM and SMEs competitiveness in developing economies like Nigeria. The global challenges have made SMEs particularly vulnerable as they are entrepreneur driven. Being smaller organizations, most have very weak knowledge management practices. However, some have developed unique cultures and practices that help them benefit from the interplay between innovation, tacit knowledge and explicit knowledge. These SMEs have become more competitive in the market, while others, who have failed to realize the importance of these factors, are caught in the competition conundrum. DEFINITION OF KNOWLEDGE MANAGEMENT “Knowledge Management” is a contested concept. During the 1990’s the concept has often used to describe computer applications for information storage and retrieval, Wilson (2002). The information-perspective on KM has been heavily criticised by authors who claim that KM must be seen as a perspective on strategy, management and innovation (von Krogh et al., 2001). It is evident that KM is not a new phenomenon as organizations’ knowledge has been stored in several ways in the past which includes human minds, documents policies and procedures shared among individuals through the means of conversation, training and reports. Advances in knowledge defined the achievements of the ancient Greek, Roman, Egyptian and Chinese civilizations. There seems to be a consensus that knowledge management is a process of capturing and sharing knowledge among people to create additional value (Dunning, 1993). Ahmed et al.
35
(2002) proposed that KM is all about the collection of knowledge and connection of people and that the foundation of KM is based on three processes: knowledge acquisition, knowledge conversion and knowledge application by the firm. While, Davenport and Hansen (1999) opine that knowledge management is concerned with the exploitation and development of the knowledge assets of an organization with a view to furthering the organization’s objectives, Gurteen (1999: 3) defines knowledge management as a “business philosophy, a set of principles, processes, organizational structures, and technology applications that help people share and leverage their knowledge to meet their business objectives.” Evanschitzky et al. (2007: 273) conclude that: “to be of value to the organization, the transfer of knowledge should lead to changes in behavior and to changes in practices and policies, and to the development of new ideas, processes, practices, and policies’’. Knowledge within an organization is information pooled with the experience of employees in terms of their implicit and explicit knowledge (Von Krogh et al., 2000). This implies that organizational knowledge do not only refers to the knowledge of the organization, but to the knowledge of the individuals. If both explicit and implicit knowledge types of the individual and the organization merge, the knowledge of the organization starts becoming a strategic asset of the firm (Bolinger and Smith, 2001). It has been identified by some researchers that KM is among the key factors ensuring firm success, and provides benefits such as improved efficiency, improved competency, better decision-making, etc. to local firms (Badruddin, 2004; Gan et al., 2006; Mazlan and Ahmad, 2006). Among the key reasons identified for the importance of KM to firms is the need for firms to develop new areas of growth in the knowledge-intensive era.The knowledge-based view of the firm considers knowledge as the most strategically significant resource of the firm (Grant, 1996a) and identifies the primary role for the firm in the creation and application of knowledge (Nonaka, 1994). This view
considers the firm’s role as a distributed knowledge systems’ composed of knowledge-holding employees, and believes that the firm’s role is to co-ordinate these employees so that they can create knowledge and value for the firm (Spender, 1996). The rationale is that knowledge endows a firm with various competencies and capabilities that account for its performance and competitiveness in the market. Kogut and Zander (1992) suggested that for a firm to remain competitive, it must effectively and efficiently apply knowledge to solve problems and exploit opportunities. KNOWLEDGE MANAGEMENT PROCESSES Gold et al. (2001) considered KM processes as a firm’s capabilities, believing these to be a pre-condition for effective KM implementation. Most researchers and practitioners have realised that KM is not a product that can be bought, but rather a capability that must be built over time. Through KM processes, a firm can acquire, generate and apply new knowledge to its products or services in order to sustain its position in a competitive market. Employees are encouraged to work as knowledge workers, in teams, on projects, or other such communities of interest in order to create, capture, share and leverage their collective knowledge to improve performance. There are various studies that have considered KM processes by dividing them into several dimensions which include acquisition, creation, identification, capturing, collection, organisation, application, sharing, transferring and distributing. KM processes were discussed in terms of knowledge acquisition, conversion and application as suggested by Salina and Wan (2008). Knowledge management involves a number of processes that govern the creation, dissemination and utilization of knowledge to fulfill organizational objectives. It also refers to a range of practices used by organizations to identify, create, represent, and distribute knowledge for reuse, awareness, and learning across the organizations. All activities of KM are typically tied to organizational objectives and are intended to lead to the achievement of specific outcomes, such as shared intelligence,
36
improved performance and higher levels of innovation. Knowledge processing and management framework can provide an integrated approach for understanding the interrelationship among structural organization, longer-term focus, learning orientation and capabilities (Bowonder and Miyake, 1999). THE KM PROCESS AND FLOW KM includes several strategies for knowledge that are acquisition, sharing and use. Some of these processes are briefly explained below (Gupta et al., 2000; Clarke and Rollow, 2001): (1) Knowledge acquisition: It is a process by which all organizations devise a strategy to guide the acquisition of new knowledge. In order to have a viable future, an organization must have processes, which obtain new knowledge for the organization to apply and this knowledge can be acquired normally:
i. By obtaining from outside organization, purchasing it, hiring experts, or licensing patents; and
ii. By creating inside the organization doing formal research activities and
iii. By acquiring experienced experts.
(2) Knowledge sharing: This refers to the process of sharing of experiences through observation, imitation and practices. It is a socialization processthrough which knowledge could be shared among organizational members. Examples of different methods involved in socialization process are workshops, seminars, apprenticeships and conferences. (3) Knowledge retention and dissemination: the aim of knowledge retention strategy is to maintain the knowledge base of the organization. This knowledge is vital to the present performance of the organization and so it must be maintained at the point of exploitation. This also involves the process of conversion of tacit knowledge (e.g. what one learned at a workshop) into explicit form (written report). Dissemination of knowledge also constitutes a retention activity, because the knowledge still must be available at the point of exploitation, and should be shared to protect it from loss.
(4) Knowledge exploitation: knowledge exploitation is the most vital KM category in terms of sustainable competitive advantage, because the exploitation of the knowledge gained is an economic justification for the existence of any type of organization. However, some organizations are often not sufficiently creative enough when formulating methods to deploy the knowledge they possess. This is often the case in some manufacturing organizations that typically embody their knowledge in a product, whereas, a better source of competitive advantage may actually be in providing designated consultancy services to their customers. TYPES OF KNOWLEDGE It is an undisputable fact that our society is increasingly knowledge-based and knowledge is regarded as the key strategic resource of the future. Hence, the need to develop comprehensive understanding of this unique asset’s processes for creation, transfer and deployment are becoming critical. In most management literature, managing knowledge has become increasingly important. There are two types of knowledge according to Polanyi (1966) and Saint-Onge (1996), they are as follows: (1) Explicit knowledge: This type of knowledge is also known as “hard” knowledge, explicit knowledge can be expressed in numbers and words and shared formally and systematically in the form of data, specifications, manuals, and so on. It is part of everyday professional life, exemplified by manuals, books and articles and thus this type of knowledge can easily be captured, and then shared with others either through courses or books for self-reading. (2) Tacit knowledge: This is the opposite of explicit knowledge known as “soft” knowledge that includes insights, intuitions, and hunches. Tacit knowledge is difficult to express and formalize, and is, therefore, difficult to share. It includes skills and “know how” that we have inside each of us and cannot be shared easily. It is embedded in practices of thepeople of an organization. This kind of knowledge is acquired over several years. Tacit knowledge also has a
37

taken-for-granted dimension. This dimension consists of schemata, mental models, beliefs and perceptions deeply ingrained in our psyche and it is not only shared but also is taken as given
(Nonaka et al., 1995). Both types of knowledge are important and necessary for organization to grow.
Figure 1: An array of knowledge management interrelationship
Source: Olayemi et al. 2012
KNOWLEDGE MANAGEMENT AND SMES COMPETITIVENESS KM may be particularly relevant for SMEs. Typically, SMEs have between 20-50 employees. As such, these firms tend to be relatively more dynamic and agile than larger organizations, and more ready to learn. However, they are often more vulnerable than
larger organizations to the loss of key personnel. Therefore, the main issue of concern is how to effectively establish and sustain good knowledge management practices in SMEs in order to en-sure their competitiveness in the new business environment.
Knowledge Management
Descriptive Framework
Sequential
Partial
Integrated
Intellectual Capital
Economic School
Prescriptive Framework
Iterative
Content
Context
Organizational
Factors
Process oriented
Explicit Knowledge
Tacit Knowledge
Organizational
environment
Technological Infrastructure
38
KM is a perspective on firm’s management as a whole, encompassing activities in all relevant managerial areas. KM-activities take place also in small companies, but few SME managers call them “knowledge management”. For instance, Beijerse (2000) in his study of 12 innovative small companies in Netherlands found 79 different knowledge management activities or processes. The most important of those were related to strategic management and supporting open and positive culture. Lim and Klobas (2000), in turn, found in their study of small businesses in Australia and Singapore that the knowledge management needs and challenges are surprisingly similar to those of bigger companies. They also noted that many knowledge management processes are easier to apply in smaller companies because it is easier to capture tacit knowledge in less formalised environments. The studies both by Gustavsson and Harung (1994) and by Choueke and Armstrong (1998) have shown that collective consciousness, and shared experience and meaning have an impact on organisational learning and ability to change, and thus, also on the competitive advantage of SMEs. SMEs should thus be able to enhance their performance and competitive advantage by a more conscious and systematic approach to knowledge management. Their most important conclusion is that strategic learning and knowledge orientation lead to survival and growth in the long run, even though there might be other quicker ways to gain short-term success. Despite the fact that learning occurred in the majority of small businesses, only a minority of these companies were able to manage new knowledge strategically to sustain and advance their competitive advantage (Matlay, 2000). The results of these studies indicate that a strategic perspective on acquiring knowledge can be even more important for the business survival and success in the long run than the environmental factors. Knowledge is arguably the asset most directly linked to overall firm’s performance (Assudani, 2005). A growing body of literature also suggests that in highly dynamic environments, increased organizational knowledge can reduce
risks and uncertainties (Liebeskind, 1996). Thus, firms capable of acquiring, assimilating, and integrating newly discovered knowledge add to their existing knowledge stock (Zollo and Winter, 2002). Combining the firm’s current knowledge resource-stock with newly acquired knowledge-stock can lead to the creation of new knowledge within the firm (Ketchen et al., 2004; Schoemaker, 1993) and the discovery or the creation of entrepreneurial opportunities (Zahra, 2008).While knowledge is a vital resource for any firm, knowledge management is the lever required to transform resource into capability. CONCEPTUAL MODELS There are various models and concepts to explain knowledge management, which all identify different knowledge processes (Spender, 2005;McElroy, 2003; Nonaka and Takeuchi, 1995). One model which describes the way in which tacit knowledge is translated into explicit knowledge is Nonaka and Takeuchi’s (1995) spiral of knowledge creation. According to them, the process of knowing is a social process where knowledge is socialized through direct experience. McElroy (2003), however, argues that knowledge processing is not only a social process but a self-organizing one as well; this ultimately means that no management is required, but nonetheless, policy and programs need to support and set the conditions for emergent knowledge. Grant (2005) does not focus on the processes (social or self-organized), but depicts the process of knowledge management in a model that specifically follows six steps. These steps are:
i. Knowledge integration: This is the assessment of the competencies and knowledge assets of employees with in an organization.
ii. The next step is knowledge measurement, which, according to Grant (2005), means applying metrics to knowledge assets.
iii. Knowledge storage and organization: This is regarded as the most critical step. This step is closely related to technology and it is largely agreed that technology plays a significant part in knowledge management.
39
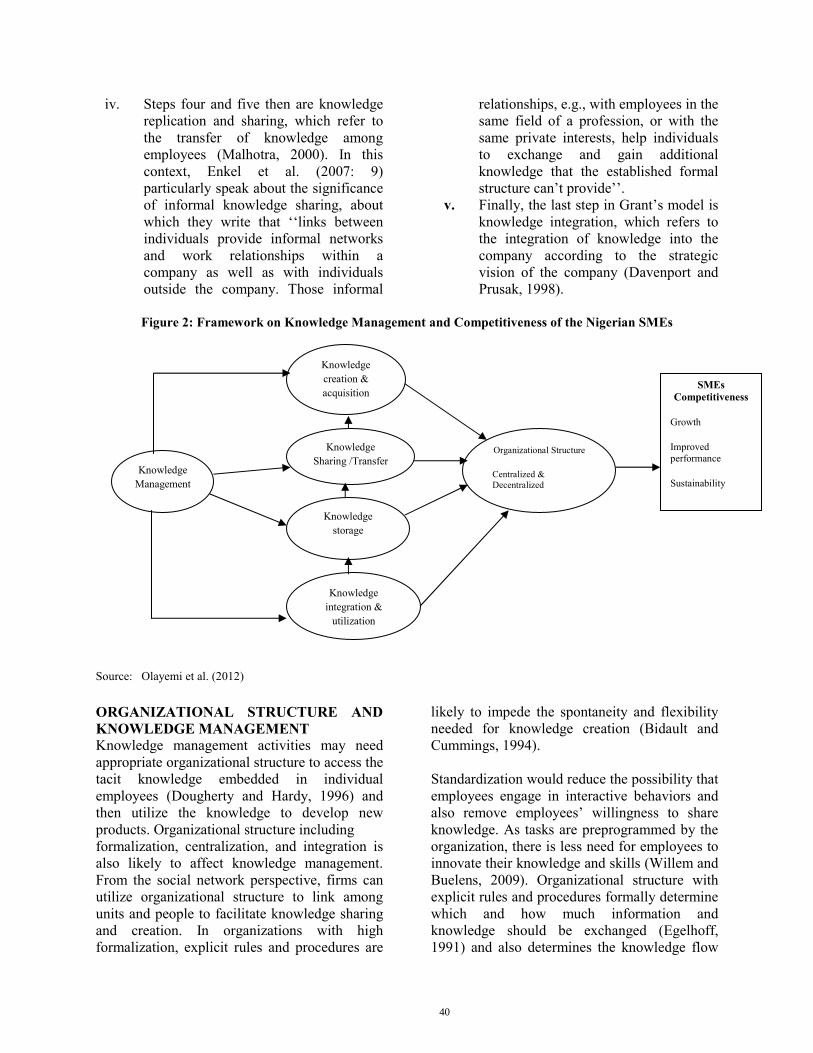
iv. Steps four and five then are knowledge replication and sharing, which refer to the transfer of knowledge among employees (Malhotra, 2000). In this context, Enkel et al. (2007: 9) particularly speak about the significance of informal knowledge sharing, about which they write that ‘‘links between individuals provide informal networks and work relationships within a company as well as with individuals outside the company. Those informal
relationships, e.g., with employees in the same field of a profession, or with the same private interests, help individuals to exchange and gain additional knowledge that the established formal structure can’t provide’’.
v. Finally, the last step in Grant’s model is knowledge integration, which refers to the integration of knowledge into the company according to the strategic vision of the company (Davenport and Prusak, 1998).
Figure 2: Framework on Knowledge Management and Competitiveness of the Nigerian SMEs
Source: Olayemi et al. (2012)
ORGANIZATIONAL STRUCTURE AND KNOWLEDGE MANAGEMENT Knowledge management activities may need appropriate organizational structure to access the tacit knowledge embedded in individual employees (Dougherty and Hardy, 1996) and then utilize the knowledge to develop new products. Organizational structure including formalization, centralization, and integration is also likely to affect knowledge management. From the social network perspective, firms can utilize organizational structure to link among units and people to facilitate knowledge sharing and creation. In organizations with high formalization, explicit rules and procedures are
likely to impede the spontaneity and flexibility needed for knowledge creation (Bidault and Cummings, 1994). Standardization would reduce the possibility that employees engage in interactive behaviors and also remove employees’ willingness to share knowledge. As tasks are preprogrammed by the organization, there is less need for employees to innovate their knowledge and skills (Willem and Buelens, 2009). Organizational structure with explicit rules and procedures formally determine which and how much information and knowledge should be exchanged (Egelhoff, 1991) and also determines the knowledge flow
Organizational Structure
Centralized & Decentralized
Knowledge integration &
utilization
Knowledge Sharing /Transfer
Knowledge Management
Knowledge storage
Knowledge creation & acquisition
SMEs Competitiveness
Growth
Improved performance
Sustainability
40

in the different steps of a sequentially organized production process.Such organizational structure is considered to have limited possibilities for enhancing knowledge creation and sharing (Grant, 1996). Conversely, in organizations with low formalization, job behaviors are relatively unstructured and members would have greater willingness in knowledge creation and sharing (Chen and Huang, 2007).Therefore, the less formalized work process would stimulate knowledge management within the firm. Centralization may have disadvantages on knowledge management in organizations because of the control embedded in centralized systems (Tsai, 2002). Top-down directives would reinforce an environment of fear, distrust, and internal competition while decreasing collaborations and integrative actions (Senge, 1997).Centralization creates a non-participatory environment which employees do not have freedom, independence, and discretion to determine what actions are required and how best to execute activities (Damanpour, 1991). However, if individuals are allowed to determine what actions are required and how best to execute activities, they would accept the resulting decisions because they have the opportunity to provide inputs and further share their ideas during the decision-making process (Yap et al., 1998). The more autonomy organizational members possess, the more responsibility they will feel for the work and context (Janz et al., 1997). Furthermore, employees would be more capable of developing and exchanging new knowledge and skills to solve new or existing problems if they are allowed to do so (Willem and Scarbrough, 2006).Therefore, the centralized structure would hinder knowledge management within the firm. Employees in the organizations with a high degree of integration are more likely to have access to a variety of knowledge for their work. An integrated structure provides opportunities for employees to learn from their colleagues. It could also help employees build communication and coordination channels to share relevant expertise and knowledge (Janz and Prasarnphanich, 2003). In addition, an integrated structure blurs the boundaries among
organizational units and takes advantage of multiple viewpoints that support knowledge creation within the organization (Janz et al., 1997). Thus, a higher level of integration would have a positive effect on knowledge management.Therefore, when the organizational structure is less formalized, less centralized and more integrated, knowledge management within the organization would be more strengthened. This invariably will lead to growth, improved performance and sustainability. CONCLUSION This paper addresses the issues of why and how managers of small to medium sized enterprises (SMEs) need to conduct knowledge management (KM) in their organizations. Knowledge management is too important to be ignored by managers in order to preserve or create value for their organizations. KM also needs to be integrated into the strategic management of the organizationby building KM awareness, determining its intended outcomes and valuing knowledge assets and resources, and finally by developing and implementing those KM solutions that have the best potential to enhance knowledge and add value to the organization. This paper attempts to put into the hands of SME managers practical ways that can help them unleash the power of knowledge in their organizations through the structural design in place. It has clearly demonstrated that SMEs need to focus more on KM in order to improve their performance since SMEs might be able to enhance their performance and competitive advantage by a more conscious and systematic approach to knowledge management.
References
Ahmed, P.K., Lim, K.K., and Loh, A.Y.E. (2002), Learning through knowledge management. Oxford, Boston: Butterworth-Heinemann.
Argote, L. and Ingram, P. (2000), “Knowledge transfer: a basis for competitive advantage in firms”.Organ.Behav. Hum. Dev. Pro., 82(1), 150-169.
Assudani, R.H. (2005), ‘‘Catching the chameleon: understanding the elusive term knowledge’’ Journal of Knowledge Management, 9, 31-44.
41
Badruddin, A.R. (2004), “Knowledge management initiatives: exploratory study in Malaysia”Journal of America Academic Business Camb., 4 (1/2), 330-335.
Beijerse, R.P. (2000), “Knowledge management in small and medium-sized companies: knowledge management for entrepreneurs”, Journal of Knowledge Management, 4 (2), 162-179.
Bidault, F. and Cummings, T. (1994), “Innovating through alliances: expectations and limitations”,Research & Development Management, 24 (1), 33- 45.
Birkinshaw, J. (2001), “Why knowledge management so difficult?” Business Strategy Review, 12 (1), 11-18.
Bolinger, A.S. and Smith, R.D. (2001), ‘‘Managing organizational knowledge as a strategic asset’’, Journal of Knowledge Management, 5 (1), 8-18.
Bowonder, B. and Miyake, T. (1999), “Japanese LCD industry through knowledge management”, Competing through Knowledge Management, 8 (2), 77-99.
Brown, D.H. (2004). “Websphere business integration server foundation building and deploying service-oriented applications that extend and integrate existing IT assets”.ADH.5.1.
Chen, C. and Huang, J. (2007), “How organizational climate and structure affect knowledge management: the social interaction perspective”, International Journal of Information Management, 27 (2), 104-18.
Choueke, R. and Armstrong, R. (1998), “The learning organization in small and medium-sized enterprises: A destination or a journey?” International Journal of Entrepreneurial Behaviourand Research, 4 (2), 129-140.
Clarke, T. and Rollow, C. (2001), “Corporate initiatives in knowledge management”, Education Training, 43 (4/5), 206-14.
Collins, J.D. and Hitt, M.A. (2006), ‘‘Leveraging tacit knowledge in alliances: the importance of using relational capabilities to build and leverage relational capital’’, Journal of
Engineering and Technology Management, 23 (3), 147-67.
Davenport T.H. and Prusak L. (1998), Working Knowledge, Harvard Business School Press,
Boston. Damanpour, F. (1991), “Organizational
innovation: a meta-analysis of effects of determinants and moderators”, Academy of Management Journal, Vol. 34 (3), 555- 590.
Davenport, T. and Klahr P. (1998). “Managing customer support knowledge”. California Management Review, 40(3), 195-208.
Davenport, T.and Prusak, L (1998). Working knowledge: How organizations manage what they know. Boston, MA: Harvard Business School Press.
Davenport, T. and Hansen, M. (1999), “Knowledge management at Andersen Consulting”, Harvard Business School Case Study, 9-499-032, Harvard Business Press, Boston, MA.
Dougherty, D. and Hardy, C. (1996), “Sustained product innovation in large, mature organizations: overcoming innovation-to-organization problems”, Academy of Management Journal, 39 (5) 1120- 1153.
Dunning, J.H. (1993), Multinational Enterprises and the Global Economy, Addison Wesley, Wokingham.
Egelhoff, W.G. (1991), “Information-processing theory and the multinational enterprise”, Journal of International Business Studies, 22 (1), 341- 367.
Enkel, E., Back, A. and Von Krogh, G. (2007), ‘‘The concept of knowledge networks for growth’’,in Back, B., Enkel, E. and von Krogh, GT. (Eds), Knowledge Networks for Business Growth, Springer, Berlin, 1-32.
Evanschitzky, H., Ahlert, D., Blaich, G., and Kenning, P. (2007), ‘‘Knowledge management inknowledge-intensive service networks’’, Management Decision, 45 (2), 265- 283.
Frey, R.S. (2001), “Knowledge management, proposal development, and small businesses”, Journal of Management Development, 20 (1), 38-54.
42
Gan G.G.G., Ryan C.and Gururajan R (2006), Knowledge management and the organizational performance of Multimedia Super Corridor status companies in Malaysia. Paper presented at the International Borneo Business Conference Hilton Hotel, Kuching, Sarawak, Malaysia.
Gold A.H, Malhotra A, Segars AH (2001), Knowledge management: An organizational capabilities perspective. Journal of Management Information System 18(1), 185 - 214.
Grant, R.M. (1996a), ‘‘Prospering in dynamically-competitive environments: organizational capability as knowledge integration’’, Organization Science, 7 (4), 375 – 387.
Grant R.M (1996b). “Towards a knowledge-based theory of the firm”.Strategic ManagementJournal 17, (4), 109-122.
Grant, R.M. (2005), Contemporary Strategy Analysis, Blackwell, Oxford.
Gupta, A.K. and Govindarajan, V. (2000), ‘‘Knowledge flows within multinational corporations’’, Strategic Management Journal, 21 (4) 473-96.
Gupta, B., Iyer, L.S. and Aroson, J.E. (2000), “Knowledge management: practices and challenges”, Industrial Management & Data Systems, 100 (1) 17-21.
Gurteen, D. (1999), ‘‘Creating a knowledge sharing culture’’, available at www.gurteen.com (Accessed September 6, 2012)
Gustavson, B. and Harung, H.S. (1994): “Organizational Learning based on transforming collectiveconsciousness”, The Learning Organization, 1 (1), 33-40.
Hair, J. F., Black, W.C., Babin, B. J., Anderson, E.Tatham, R. L., (2006), Multivariate data analysis (Sixth ed.) Upper Saddle River, New Jersey: Pearson Education International.
Hishamuddin, M. S., Norliza, M. S., Azlah, M. A., SitiZaleha, O, Thuaibah andSuaibah, A. B., (2004). Knowledge management practices amongst top 1000 Malaysian organizations: An insight. Paper presented at the Universiti Tenaga Nasional International Management
Conference, Hyatt Hotel, Kuantan, Malaysia.
Hitt,M. A., Baibaia W. K., and Samuel, M. D., (1998), “Navigating in the new competitive landscape: Building strategic flexibility and competitive advantage in the 21stcentury”. Academy of Management Executive, 12 (4)
Ireland, R.D., Hitt, M.A. and Vaidyanath, D. (2002), ‘‘Alliance management as a source of competitive advantage’’, Journal of Management, 28 (3), 413-46.
Janz, B.D. and Prasarnphanich, P. (2003), “Understanding the antecedents of effective knowledge management: the importance of a knowledge-centered culture”, Decision Sciences, 34 (2), 351-84.
Janz, B.D., Wehterbe, J.C., Colquitt, J.A. and Noe, R.A. (1997), “Knowledge worker team effectiveness: the role of autonomy interdependence, team development, and contextual support variables”, Personnel Psychology, 50 (4), 877-904.
Kanungo, S., Duda, S. and Srinivas, Y. (1999).“A structured model for evaluating information systems effectiveness”. Systems Research and Behavioral Science, 16 (6), 495-518.
Ketchen, D.J., Snow, C.C. and Street, V.L. (2004), ‘‘Improving firm performance by matching strategic decision-making processes to competitive dynamics’’, Academy of Management Executive, 18 (4) 29.
Kogut, B. and Zander, U. (1992),“Knowledge of the firm, combinative capabilities and the replication of technology”. Organization Science, 3 (3), 383- 397.
Kogut, B. and Zander, U. (1993), “Knowledge of the firm and the evolutionary theory of the multinational’’, Journal of International Business Studies, 24, 625-45.
Liebeskind, J.P. (1996), ‘‘Knowledge, strategy, and the theory of the firm’’, StrategicManagement Journal, (17), 93 -107.
Lim, D. and Klobas, J. (2000), “Knowledge management in small enterprises” The
43

Electronic Library, Vol. 18 No. 6, pp. 420-432.
McElroy, W.M. (2003), The New Knowledge Management Complexity: Learning and sustainable Innovation, Oxford: Butterworth-Heinemann
Matlay, H. (2000), “Organisational learning in small learning organizations: an empirical overview”, Education and Training, Vol. 4 No. 5, pp. 202-210.
Malhotra, Y. (2000), Knowledge Management and Virtual Organizations, Idea GroupPublishing,London.
Mazlan, I.and Ahmad, R. S. (2006), The influence of knowledge management and leveraging of intellectual capital on the organization performance: A case study of Telekom Malaysia. Paper presented at the Knowledge Management International Conference and Exhibition, Legend Hotel, Kuala Lumpur, Malaysia.
Morrison, A. and Bergin-Seers, S. (2002), “Pro-growth small businesses: learning architecture”, Journal of Management Development, Vol. 21 No. 5, pp. 388-400.
Ness L.R. (2005), “Assessing the relationships among IT flexibility, strategic alignment and IT effectiveness: study overview and findings”, Journal of Information Technology Management,16 (2),
Nonaka, I. (1994), “A dynamic theory of organizational knowledge creation'', Organization Science, 5, 14-37.
Nonaka, I. and Takeuchi, H. (1995), The knowledge creating company, Oxford University Press,New York.
Powell, W. (1998),“Learning from collaboration: Knowledge and networks in the biotechnology and pharmaceutical industries”. California Management Review, 40(3), 228-240.
Polanyi, M. (1966), The Tacit Dimension, Routledge, London.
Senge, P.M. (1997), “Looking ahead”, Harvard Business Review, September-October, 30-32.
Salina, D.and Wan Fadzilah, W. Y. (2008),“An empirical study of knowledge management processes in Small and Medium Enterprises”. Comm. of the IBIMA, 4 (22), 169 - 177.
Saint-Onge, H. (1996), “Tacit knowledge: the key to the strategic alignment of intellectual capital”, Strategy & Leadership, 24 (2), 10-16.
Senge, P. (1990), The Fifth Discipline: The Art and Practice of the Learning Organisation, Doubleday, New York, NY.
Smallborne, D. Leigh, R. and North, D. (1995), “The characteristics and strategies of high growth SMEs”, International Journal of Entrepreneurial Behaviour and Research, 1 (3), 44-62.
Smith, W.J. (1998), “Turning toward growth”, Empowerment in Organisations, 6 (4), 110-114.
Schoemaker, P.J.H. (1993), ‘‘Multiple scenario development: its conceptual and behavioral foundation’’, Strategic Management Journal, 14 (3), 193-213.
Smith, A.D. (2005), ‘‘Exploring radio frequency identification technology and its impact on business systems’’ Information Management and Computer Society, 13, 16-28.
Spender, J.C. (2005), ‘‘An overview of what is new and important about knowledge management: building new bridges between managers and academics’’, in Little, S. and Ray, T. (Eds), Managing Knowledge: An Essential Reader, Sage Publications, London, pp. 127-54.
Spender, J.C. and Grant, R.M. (1996), ‘‘Knowledge and the firm: an overview’’, Strategic Management Journal, 17, 5-9.
Tranfield, D., Denyer, D. and Marcos, J. (2004), “Co-producing management knowledge”, Management Decision, 42 (3/4), 375- 386.
Tsai, W. (2002), “Social structure of ‘coopetition’ within a multiunit organization: coordination,competition, and intra-organizational knowledge sharing”, Organization Science, 13 (2) 179-90.
Von Krogh, G., Ichijo, K. and Nonaka, I. (2000), Enabling Knowledge Creation, Oxford University Press Inc., New York.
Von Krogh, G., Nonaka, I. and Aben, M. (2001), “Making the most of your company’s knowledge: A strategic framework”, Long Range Planning, 34 (4), 421-439.
44
Watson, K., Hogarth-Scott, S. and Wilson, N. (1998), “Small business start-ups: success factors and support implications”, International Journal of Entrepreneurial Behaviour and Research, 4 (3), 217 -238.
Watson, R.T., Kelly, G.G., Galliers, R.D., &Brancheau, J.C. (1997, Spring). “Key issues in information systems management: An international perspective”. Journal of Management Information Systems, 13(4), 91-115.
Wickert, A. and Herschel, R. (2001), “Knowledge management issues for smaller business” Journal of Knowledge Management, 5 (4), 329-337.
Willem, A. and Scarbrough, H. (2006), “Social capital and political bias in knowledge sharing: an exploratory study”, Human Relations, 59 (11), 1343-1370.
Wilson T.D (2002), “The nonsense of 'knowledge management”, Information Research, Vol. 1, paper no.144.
Wiltbank, R., Dew, N., Read, S. and Sarasvathy, S.D. (2006), ‘‘What to do next? The case for non-predictive strategy’’ Strategic Management Journal, 27 (10), 981- 998.
Yap, C.M., Foo, S.W., Wong, P.K. and Singh, M. (1998), “The impact of organizational characteristics on the outcome of new product development projects in Singapore-based firms”, Singapore Management Review, 21 (1), 25-42.
Zahra, S.A. (2008), ‘‘The virtuous cycle of discovery and creation of entrepreneurial opportunities’’, Strategic Entrepreneurship Journal, 2 (3), 243 -57.
Zollo, M. andWinter, S.G. (2002), ‘‘Deliberate learning and the evolution of dynamic capabilities’’ Organization Science, 13 (3), 339-51.
45
Related Documents