School of Civil, Environmental and Mining Engineering Life Impact | The University of Adelaide Wednesday, 4 th April 2012 Changes to sub-daily rainfall in Australia Dr Seth Westra

Welcome message from author
This document is posted to help you gain knowledge. Please leave a comment to let me know what you think about it! Share it to your friends and learn new things together.
Transcript

School of Civil, Environmental and Mining Engineering
Life Impact | The University of Adelaide
Wednesday, 4th April 2012
Changes to sub-daily
rainfall in Australia
Dr Seth Westra

Slide 2

Slide 3

Slide 4

Slide 5

Presentation overview
• Part 1: The sub-daily rainfall dataset in Australia
• Part 2: The observed relationship between temperature, humidity and rainfall intensity
• Part 3: Detection of trends in sub-daily rainfall
• Part 4: Towards a downscaling algorithm for sub-daily rainfall
• Part 5: Evaluating regional climate model (WRF) performance using the diurnal cycle of sub-daily precipitation
Slide 6

Part 1: Australian rainfall record• More than 19000 daily precipitation stations (read at
9am daily) • More than 1500 pluviograph stations (6-minute
resolution)

Slide 8Pluviograph (sub-daily)

Slide 9Daily (only locations > 100 years)

Australian rainfall record – record
length
Slide 10
Pluviograph Daily
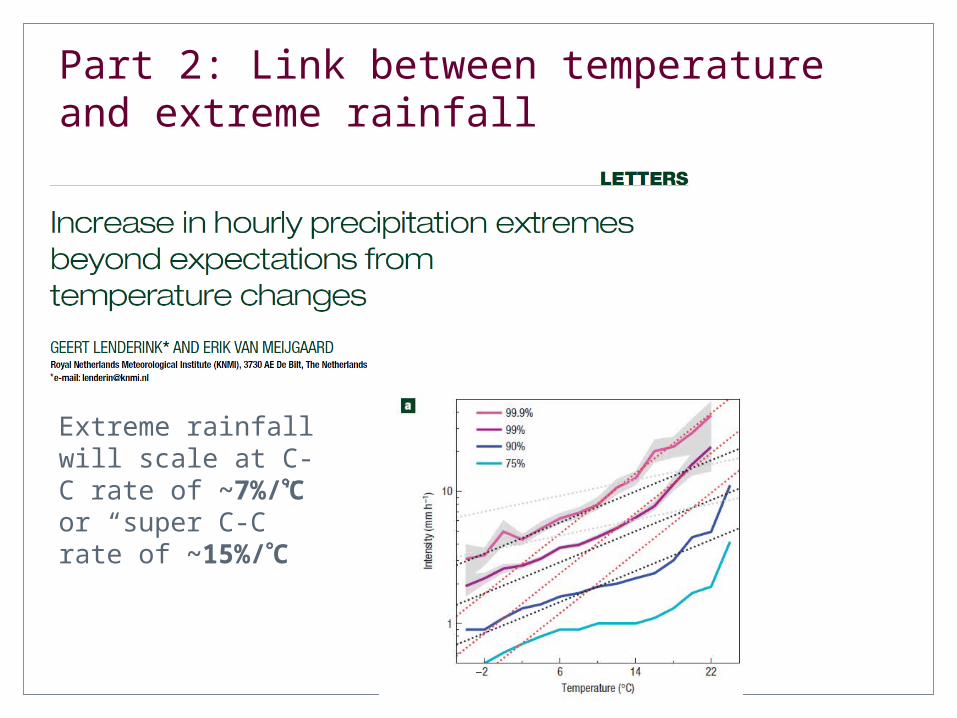
Part 2: Link between temperature and extreme rainfall
Slide 11
Extreme rainfall will scale at C-C rate of ~7%/C or “super C-C” rate of ~15%/C

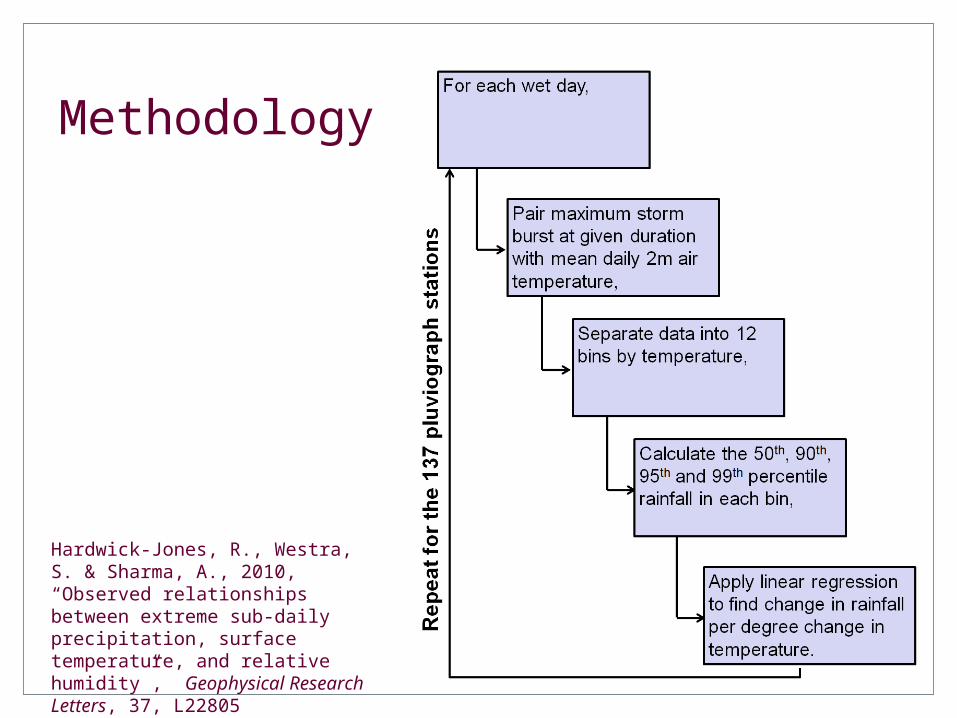
Methodology
• Reproduce this work using Australia-wide data:
– 137 long pluviograph records (average length 32 years, with average of 6% missing)
– Mean and maximum daily 2m air temperature extracted for each wet day
– Data grouped into 15 bins by temperature – and different percentile (e.g. 50, 99%ile) rainfall extracted in each bin
– Where available, relative humidity also extracted
Methodology
Slide 13
Hardwick-Jones, R., Westra, S. & Sharma, A., 2010, “Observed relationships between extreme sub-daily precipitation, surface temperature, and relative humidity”, Geophysical Research Letters, 37, L22805

60-minute rainfall intensity against average daily temperature
Blue = 99 percentile rainfall (representing behaviour of ‘extremes’)Red = 50 percentile rainfall (representing behaviour of ‘average’ events)

24 25 26 27 28 29 30 3110
0
101
102
Mean Daily Temperature ( C)
Max
imum
da
ily 6
0-m
inut
e p
reci
pita
tion
(m
m)
DARWIN AIRPORT 014015
10 15 20 25 3010
0
101
102
Mean Daily Temperature ( C)
Max
imum
dai
ly 6
0-m
inut
e pr
ecip
itatio
n (m
m)
ALICE SPRINGS AIRPORT 015590
60-minute rainfall intensity against average daily temperature
Blue = 99 percentile rainfall (representing behaviour of ‘extremes’)Red = 50 percentile rainfall (representing behaviour of ‘average’ events)

School of Civil, Environmental and Mining Engineering
Life Impact | The University of Adelaide
Wednesday, 4th April 2012
Scaling of 99th percentile maximum daily 60-minute burstwith mean daily surface temperature
EA
ST
NORTH
SOUTH
CENTRAL-WEST
120 E 135
E 150
E 165
E
45 S
30 S
15 S
13% to 20%.C-1
7% to 13%.C-1
2% to 7%.C-1
-2% to 2%.C-1
-7% to -2%.C-1
-13% to -7%.C-1
-17% to -13%.C-1

School of Civil, Environmental and Mining Engineering
Life Impact | The University of Adelaide
Wednesday, 4th April 2012
0 5 10 15 20 25 30 35 4010
0
101
102
103
Temperature ( C)
Pre
cipi
tati
on D
ep
th (
mm
)
Regional scaling of 99th percentile 60-minute burst precipitation with surface temperature
East RegionNorth RegionSouth RegionCentral RegionClausius-Clapeyron Relationship

School of Civil, Environmental and Mining Engineering
Life Impact | The University of Adelaide
Wednesday, 4th April 2012
0 5 10 15 20 25 30 35 4010
0
101
102
103
104
Temperature ( C)
Pre
cipi
tati
on D
ep
th (
mm
)
Regional scaling of 99th percentile daily precipitationwith surface temperature
East RegionNorth RegionSouth RegionCentral RegionClausius-Clapeyron Relationship

Slide 19

Slide 20

Does relative humidity stay constant with
temp?
5 10 15 20 25 30 3520
30
40
50
60
70
80
90
100
Mean daily surface temperature ( C )
Mea
n d
aily
re
lati
ve h
um
idity
(%
)
PERTH AIRPORT 009021
Jun to NovDec to May
5 10 15 20 25 30 35 4010
20
30
40
50
60
70
80
90
100
Mean daily surface temperature ( C )
Mea
n d
aily
re
lati
ve h
um
idity
(%
)
ALICE SPRINGS AIRPORT 015590
Jun to NovDec to May
5 10 15 20 25 3030
40
50
60
70
80
90
100
Mean daily surface temperature ( C )
Mea
n d
aily
re
lati
ve h
um
idity
(%
)
SYDNEY (OBSERVATORY HILL) 066062
Jun to NovDec to May
22 24 26 28 30 3250
55
60
65
70
75
80
85
90
95
100
Mean daily surface temperature ( C )
Mea
n d
aily
re
lati
ve h
um
idity
(%
)
DARWIN AIRPORT 014015
Jun to NovDec to May

Summary of temperature scaling
work• Clear scaling of rainfall with temperature across
Australia
• Scaling depends on duration of storm burst, and exceedance probability
• Scaling also depends on atmospheric temperature – negative scaling with high temperatures!
– Likely to be due to access to atmospheric moisture
• BUT: Does a historical scaling relationship imply similar future changes?
Slide 22

Part 2: Detection of trends in Australian
rainfall• We wish to detect whether there are trends or
other types of climatic non-stationarity in extreme precipitation data
• Consider the following hypothetical example:
– ‘Extreme’ precipitation will scale at a rate of 7%/C in proportion to the water holding capacity of the atmosphere
– Global warming trend has been ~0.74C over the 20th century
– Therefore would need to be able to detect a ~5% change

Motivation• Assuming 50 years of data, such a trend would be
detected at the 5% significance level in only 8% of samples (and a negative trend detected in 2% of samples!)

What is a max-stable process?• Formal definition: suppose for , i = 1,..., n, are
independent realisations of a continuous process. If the limit:
exists for all s with normalising constants an(s) and bn(s), then is a max-stable process.
• Spatial analogue of multivariate extreme value models, which accounts for both data-level dependence and parameter-level dependence.
– Distinct from ‘Spatial GEV’ models which only account for parameter-level dependence.

Illustration of max-stable process• The ‘storm profile’ model:

Benefits for trend
detection• Can improve the strength of the trend that can be
detected (given by value of parameter ‘β1’), depending on the amount of spatial correlation.

Application to Australian rainfall
data• Of Australia’s ~1400 sub-daily records,
we selected the 35 most complete stations with records from 1965-2005.
– Extracted annual maximum data for 6-minute through to 72 hour storm bursts
• Also considered high quality daily data from 1910 to 2005

Application to Australian rainfall
• Trends in annual maximum 6-minuterainfall
– Blue/red indicates increasing/decreasing trend
– Filled circles indicatestatistically significantat the 5% level

Is there an increasing trend in east-Australian precipitation?

Sensitivity to gauge
changes• Many sub-daily stations had at least one gauge
change over the record, usually from Dines pluviograph to TBRG
• Tested sensitivity by extracting any ‘step change’ in the year the gauge change occurred, and then re-fitting the trend.
• Did not make any significant difference to the strength of the trends in the previous slide
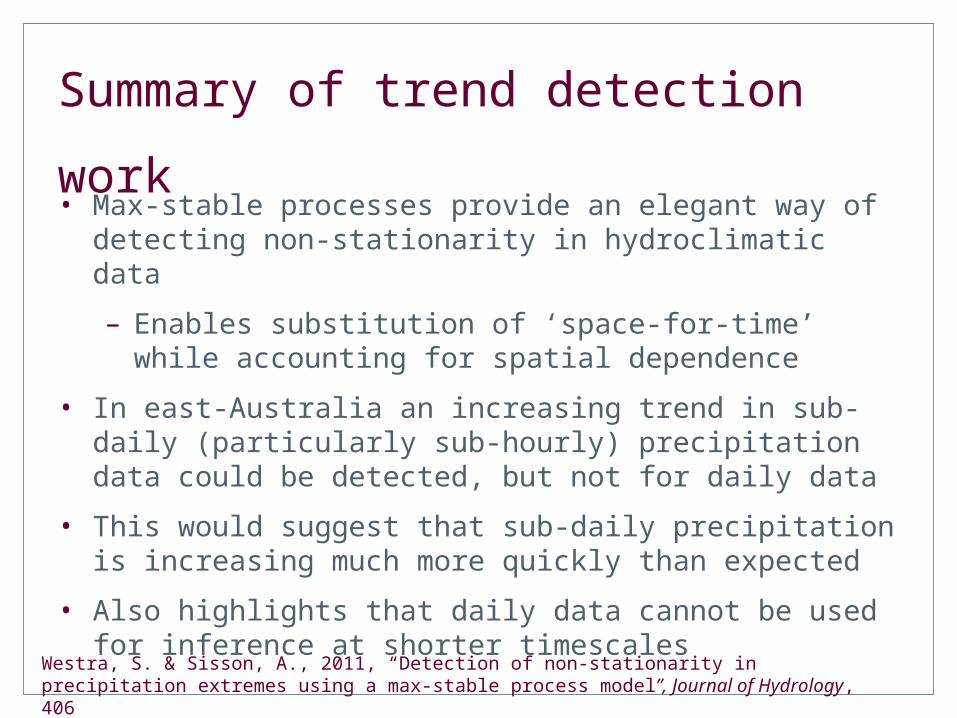
Summary of trend detection work• Max-stable processes provide an elegant way of
detecting non-stationarity in hydroclimatic data
– Enables substitution of ‘space-for-time’ while accounting for spatial dependence
• In east-Australia an increasing trend in sub-daily (particularly sub-hourly) precipitation data could be detected, but not for daily data
• This would suggest that sub-daily precipitation is increasing much more quickly than expected
• Also highlights that daily data cannot be usedfor inference at shorter timescales
Westra, S. & Sisson, A., 2011, “Detection of non-stationarity in precipitation extremes using a max-stable process model”, Journal of Hydrology, 406

Part 4: Disaggregating from daily to sub-daily rainfall under a future climate
• We have shown that the scaling of rainfall with atmospheric temperature depends on storm burst duration, exceedance probability, and moisture availability
– How can this be used for estimating change in sub-daily rainfall under a future climate?
• Various techniques are available for downscaling daily rainfall under a future climate
– We have developed an algorithm to disaggregate from daily to sub-daily rainfall under a future climate.
Slide 33

Importance of seasonality on daily to sub-daily scaling
Slide 34
• Scaling from daily to sub-daily rainfall strongly depends on atmospheric temperature

Plotting against both temperature and day of
year
Slide 35
• BUT – most of the annual variation can actually be attributed to atmospheric temperature!

Influence of location – before and after regressing against atmospheric temperature
Slide 36

Considering a broader range of atmospheric variables...
Variable Abbreviated name Daily mean, maxima, minima and/or diurnal range
Units
2m surface temperature tmp2m mean, maxima, minima, range
Degrees Celsius
500, 700 and 850hPa temperature
t500, t700, t850 mean Degrees Celsius
Dew point temperature Td maxima Degrees CelsiusRelative humidity RH mean and maxima Percentage (%)Pressure reduced to mean sea level
prmsl mean and minima Pa
850hPa wind strength and direction
wnd850_str, wnd850_theta
mean (derived from u and v components of wind; units of m/s)
10m wind strength and direction
wnd10m_str, wnd10m_theta
mean (derived from u and v components of wind; units of m/s)
500 and 850hPa geopotential height
z500, z850 mean Geopotential meter (gpm)
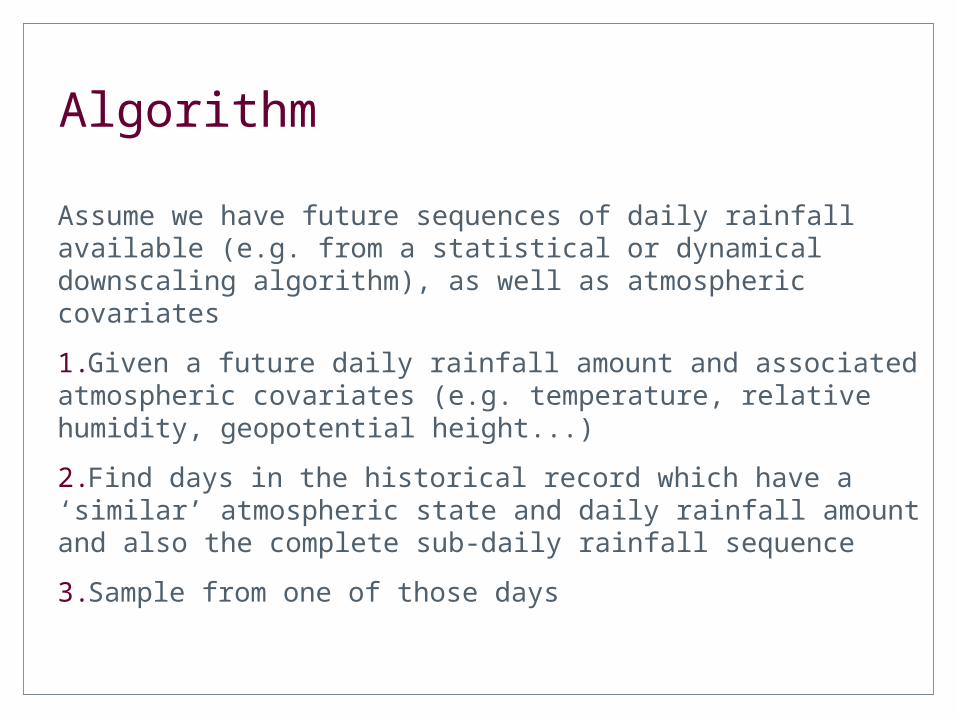
Algorithm
Assume we have future sequences of daily rainfall available (e.g. from a statistical or dynamical downscaling algorithm), as well as atmospheric covariates
1.Given a future daily rainfall amount and associated atmospheric covariates (e.g. temperature, relative humidity, geopotential height...)
2.Find days in the historical record which have a ‘similar’ atmospheric state and daily rainfall amount and also the complete sub-daily rainfall sequence
3.Sample from one of those days
Slide 38

A disaggregation algorithm for downscaling sub-daily
rainfall
Slide 39Westra, S., Evans, J., Mehrotra, R. & Sharma, A., “Disaggregating from daily to sub-daily rainfall under a future climate”, submitted to Journal of Climate

Summary of sub-daily
disaggregation • Disaggregation algorithm is a simple ‘analogues’
based approach for understanding sub-daily rainfall behaviour under a future climate
• Requires daily downscaling information, but such information is often readily available
• Shows substantial changes can be expected at hourly or sub-hourly timescales.
Slide 40

Part 5: Diurnal cycle of modelled and observed rainfall
Slide 41Evans, J. & Westra, S., “Investigating the mechanisms of diurnal rainfall variability using a Regional Climate Model”, submitted to Journal of Climate
• Good performance of a dynamical model in capturing the diurnal cycle provides a positive indication that the processes of sub-daily precipitation are correctly represented.

Diurnal cycle of different precipitation generating
mechanisms
Slide 42

Conclusions and ongoing
work• Evaluated scaling relationships of sub-daily rainfall and found strong dependence on temperature and atmospheric moisture
• Trend detection work also shows increasing trends in fine time-scale (particularly sub-hourly) rainfall
– Significant implications for urban flood risk and risk of flash flooding
• Developed statistical disaggregation algorithm to generate sub-daily rainfall sequences conditional to daily rainfall, under a future climate.
• Also collaborating with dynamical climate modellers to evaluate capacity of regional climate models to simulate sub-daily precipitation
Slide 43

Slide 44

References
Slide 45
• Hardwick-Jones, R., Westra, S. & Sharma, A., 2010, “Observed relationships between extreme sub-daily precipitation, surface temperature, and relative humidity”, Geophysical Research Letters, 37, L22805
• Westra, S. & Sisson, A., 2011, “Detection of non-stationarity in precipitation extremes using a max-stable process model”, Journal of Hydrology, 406
• Westra, S., Mehrotra, R., Sharma, A. & Srikanthan, S., 2012, Continuous rainfall simulation: 1. A regionalised sub-daily disaggregation approach, Water Resources Research, 48 (W01535).
• Westra, S., Evans, J., Mehrotra, R. & Sharma, A., “Disaggregating from daily to sub-daily rainfall under a future climate”, submitted to Journal of Climate
• Evans, J. & Westra, S., “Investigating the mechanisms of diurnal rainfall variability using a Regional Climate Model”, submitted to Journal of Climate
Related Documents