SIP Template 1 | Page 11/19/2013 Implementation September 2016-June 2019 Washington Elementary School Improvement Plan Schoolwide Title I

Welcome message from author
This document is posted to help you gain knowledge. Please leave a comment to let me know what you think about it! Share it to your friends and learn new things together.
Transcript

SIP Template
1 | P a g e 1 1 / 1 9 / 2 0 1 3
Implementation September 2016-June 2019
Washington Elementary
School Improvement Plan
Schoolwide Title I
SIP Template
2 | P a g e 1 1 / 1 9 / 2 0 1 3
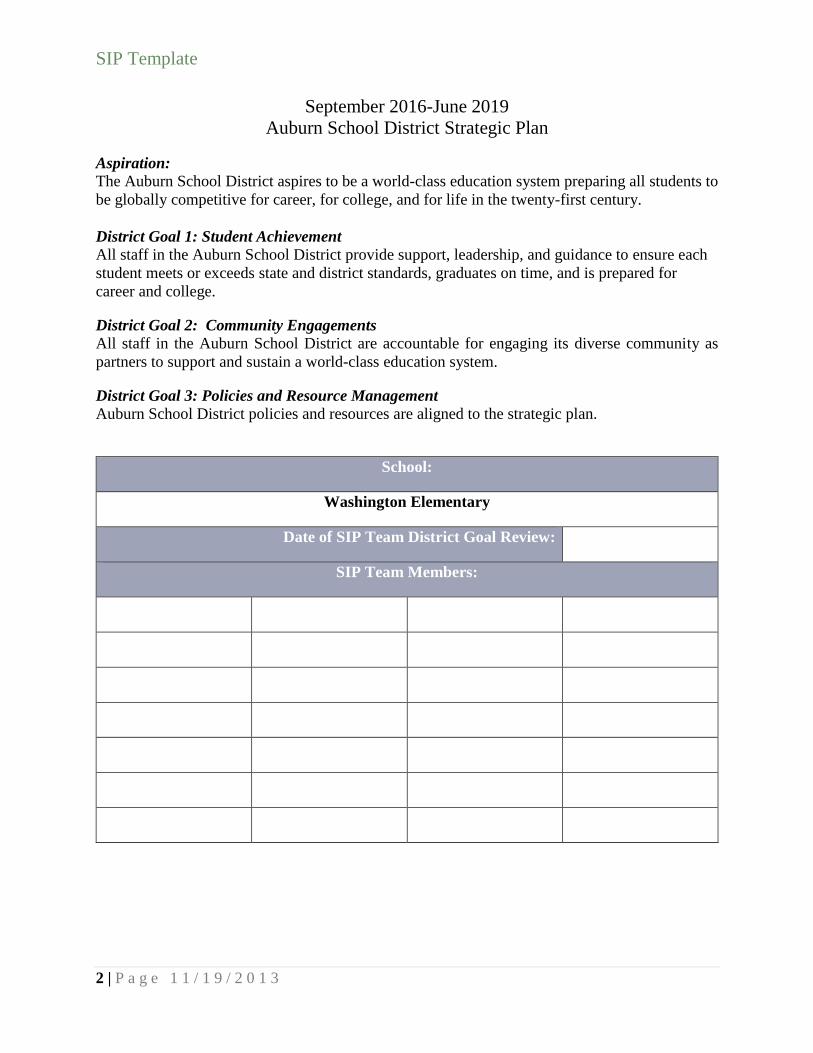
September 2016-June 2019
Auburn School District Strategic Plan
Aspiration:
The Auburn School District aspires to be a world-class education system preparing all students to
be globally competitive for career, for college, and for life in the twenty-first century.
District Goal 1: Student Achievement
All staff in the Auburn School District provide support, leadership, and guidance to ensure each
student meets or exceeds state and district standards, graduates on time, and is prepared for
career and college.
District Goal 2: Community Engagements
All staff in the Auburn School District are accountable for engaging its diverse community as
partners to support and sustain a world-class education system.
District Goal 3: Policies and Resource Management
Auburn School District policies and resources are aligned to the strategic plan.
School:
Washington Elementary
Date of SIP Team District Goal Review:
SIP Team Members:

SIP Template
3 | P a g e 1 1 / 1 9 / 2 0 1 3
School Improvement Team Signatures 2013-2014
Date Submitted: Date of School Board
Approval:
Name Title/Position Signature
Pauline Thomas Principal
Lynnette Stewart Parent
Emanuel Chavez-
Ocegueda
Student
Community
Member
Bonnie Harvey Staff
Jessica Lewis Staff
Jolie Stevens Staff
Danielle Boyles Staff
Kim Seng Staff
Kelli Monagin Staff
Katie Anderson Staff
Donna Mayer Staff
Tori Smith Staff
Tracy Brown Staff
Each team must include staff, students, families, parents, and community
members.

SIP Template
4 | P a g e 1 1 / 1 9 / 2 0 1 3
Signatures for Approval
Department of Student Learning
Heidi Harris Assistant Superintendent
Student Learning
Julie DeBolt Executive Director High
School/Post Secondary
Programs
Vicki Bates Assistant Superintendent
Technology
Department of School Programs
Ryan Foster Associate Superintendent
Principal Leadership and
School Programs
Rhonda Larson Assistant Superintendent
Family Engagement and
Student Services
Superintendent
Alan Spicciati
Superintendent
School Board
Anne Baunach School Board
Carol Seng School Board
Laurie Bishop School Board
Ray Vefik School Board
Ryan Van Quill School Board

SIP Template
5 | P a g e 1 1 / 1 9 / 2 0 1 3
Executive Summary – SWT 1
COMPREHENSIVE NEEDS ASSESSMENT
Auburn School District Mission
In a safe environment, all students will achieve high standards of learning in order to become
ethically responsible decision makers and lifelong learners.
Auburn School District Vision
The vision of Auburn School District is to develop in students the skills and attitudes that will
maximize their potential for lifelong learning and ethically responsible decision making.
School Mission
The Mission of Washington is to provide a safe environment where all students achieve high
standards of learning and develop responsible behavior.
School Vision
The vision of Washington Elementary is to provide a supportive and challenging environment
where all students have the opportunity to reach their full potential through high academic
standards, independent thinking and responsible behavior.
Background Information
WAC 180-16-220
Requirements for School Improvement Plan Each school shall be approved annually by the school board of directors under an approval process determined
by the district board of directors and “At a minimum the annual approval shall require each school to have a
school improvement plan that is data driven, promotes a positive impact on student learning, and includes a
continuous improvement process that shall mean the ongoing process used by a school to monitor, adjust, and
update its school improvement plan.” School Improvement plans must include a brief summary of use of data to
establish improvement; acknowledging the use of data which may include DIBELS, MAP, WELPA, Credit
Attainment, Enrollment in Honors/AP Courses, CEE Perceptual Data, SAT/ACT, Discipline, and MSP or HSPE.
Stakeholder Input
In the fall of 2015 the SIP team met to review the following data: DIBELS, MAP, WLPTII and
MSP. Over a three week period data was reviewed by all staff at weekly meetings. In addition,
staff, parents and students completed the CEE Perceptual survey and Positive Behavior Support
survey and reviewed data on school climate in January of 2015. Trends were noted and areas of

SIP Template
6 | P a g e 1 1 / 1 9 / 2 0 1 3
growth were celebrated and areas of concern were discussed. Comments and areas of concern
were collated and reviewed by the teams and ranked by greatest concern. Next, a review of
current research and best instructional practices in the areas of reading and math were reviewed
by sub committees of classroom teachers and specialist. In addition, a school summary Report
of the CEE and PBIS surveys was by the climate team. Lastly, Smart Goals, which align with
research findings in reading, math and school climate, were set and shared with staff. As plans
are made for instruction and curriculum needs, Grade Level Professional Learning Communities,
along with Specialist and support staff will meet to review academic data and plan for
differentiated instruction and curriculum. Throughout the process the Department of Student
Learning provided support through half day staff development workshops, work release time,
and consultant visitation.
Highly Qualified Staff – SWT 3
All Washington staff members have met the requirement for highly qualified.
High Quality, Highly Qualified Teachers – SWT 5 All Washington staff members have met the requirement for highly qualified.
Demographic data
Washington Elementary School is located in downtown Auburn, Washington and reflects this
diverse community. During our fall data review workshop the full staff looked at the most recent
demographic data as reported in the 2014-2015 OSPI Report Card and made the following
observations;
Washington’s student body is made up of males and females with 79.4% of Washington’s
nearly four hundred and forty students qualify for free or reduced lunch. This is an increase from
61.3% in 2009.
The ethnicity at Washington reflects the downtown community of Auburn: 34% white, 28%
Hispanic, 2% Asian, 9% Pacific Islander, 9% Black, 18% Multi Racial. 25.4% of the students are
served by the Transitional Bilingual program with our largest groups speaking Spanish and
Marshallese. Special Education and 504 students make up 12.6%which includes two Structured
Learning Center Classrooms and one Resource Room.

SIP Template
7 | P a g e 1 1 / 1 9 / 2 0 1 3
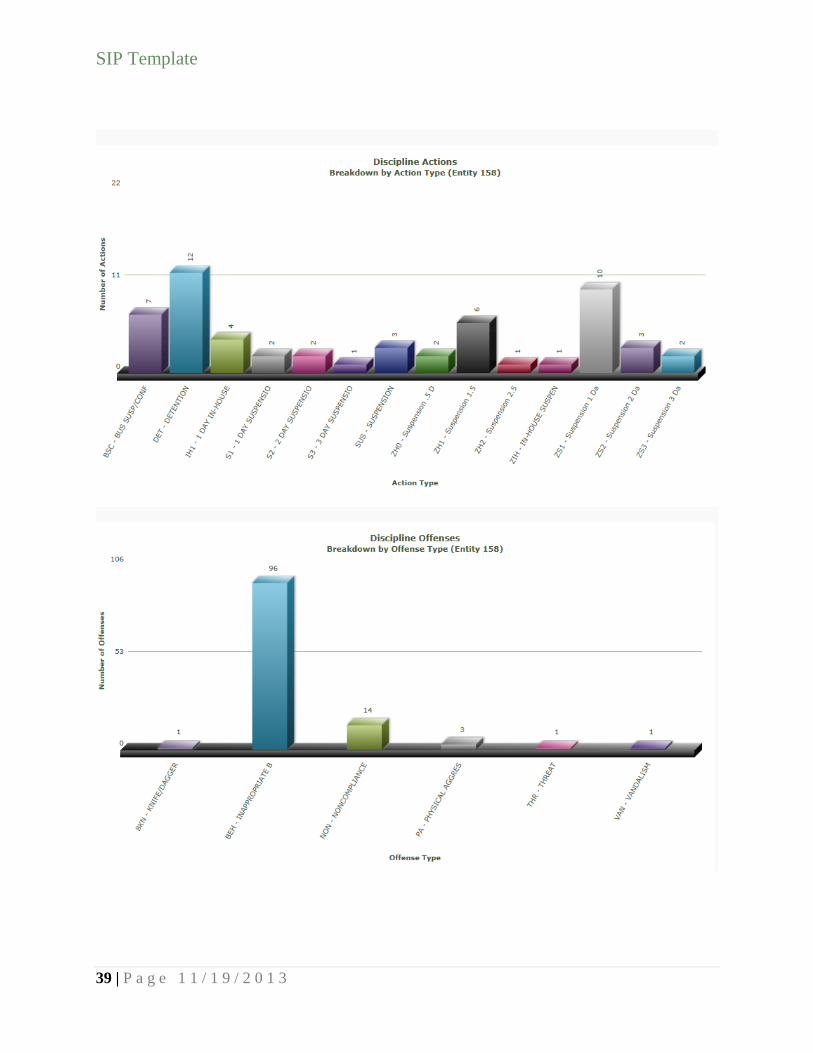
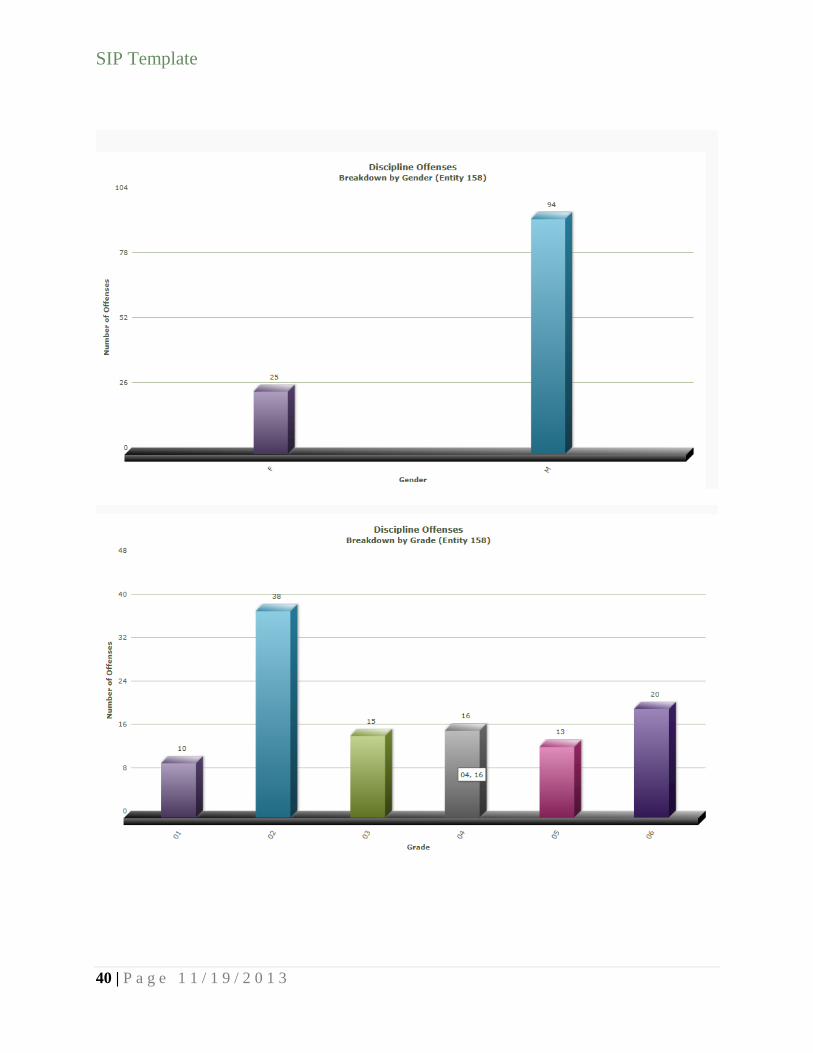
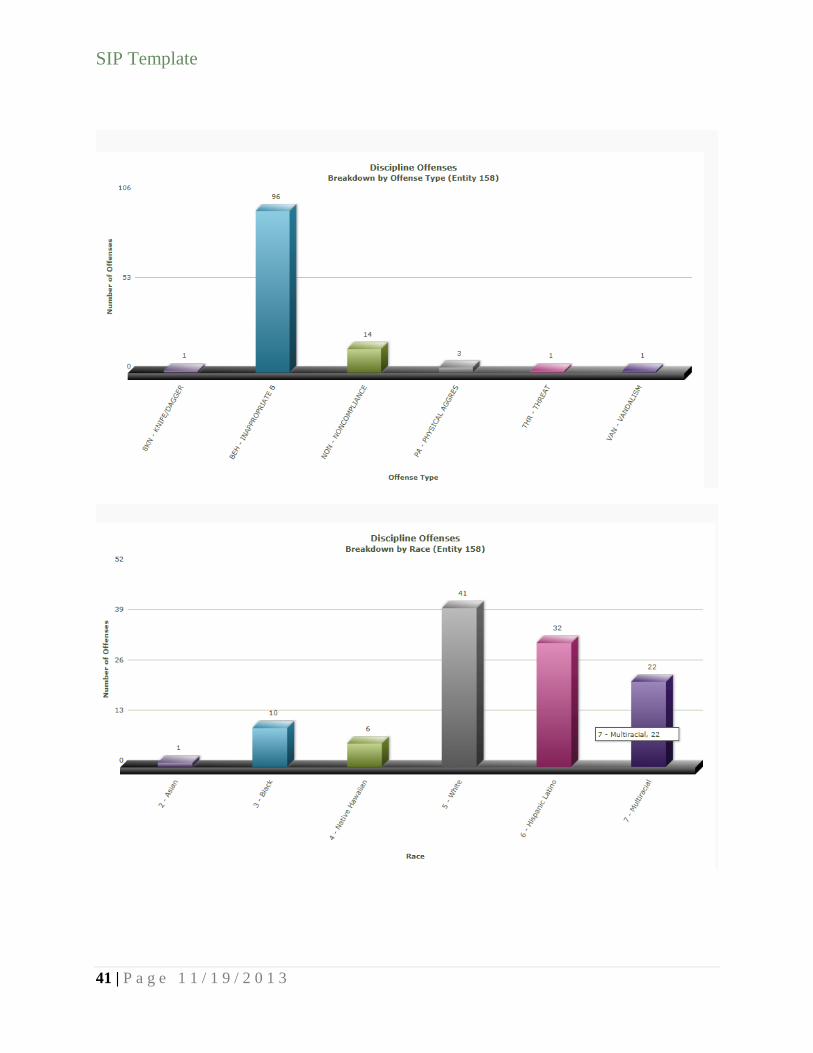
Discipline The number of discipline reports increased which was a reflection of the implementation of systematic
reporting and documentation systems.
Based on the end of the year Olweus Bully/Victim Questionnaire most students reported liking school and
having 2-3 friends. There appears to be a decrease in the percentage of students reporting being bullied
this year but the number of students reporting being bullied for one year or more remained consistent.
The most frequently reported bullying types were verbal taunting and rumors. These bullying incidents
most frequently took place on the playground and in the gym. A smaller numbers of incidents were
reported in the bathroom and at the bus stop. Students reporting feeling afraid of being bullied by other
students often or fairly often decreased by 5%.
Attendance Analysis
Attendance continues to be an area of focus with the percentage of student absences on the
increase. Attendance letters go home monthly to families who have reached the 10% threshold.
Students receive recognition at Student of the Month assemblies for monthly and year to date
perfect attendance.
Three Year Attendance Trend (Absences)
2013 2014 2015
All School 15.7% 14.5% 16.8%
Data Analysis- DIBELS
Formally, three times each year the staff comes together to review the DIBELS benchmark assessment results. The results are shared with the entire instructional team and decisions are made to support the students that are not at benchmark. Results are shared in multiple formats; whole grade level, by class, by rank and by performance level. Staff work collectively to determine interventions. Walk to Read groups, small group instruction via special programs and tutoring is applied to support the reader. Volunteers are utilized to assist with progress monitoring.
Fall 2015
Number of students performing at each level in each grade level
Grade Level Intensive Strategic Benchmark Advanced
Kindergarten 35 11 51 11
1st grade 31 11 41 10
SIP Template
8 | P a g e 1 1 / 1 9 / 2 0 1 3
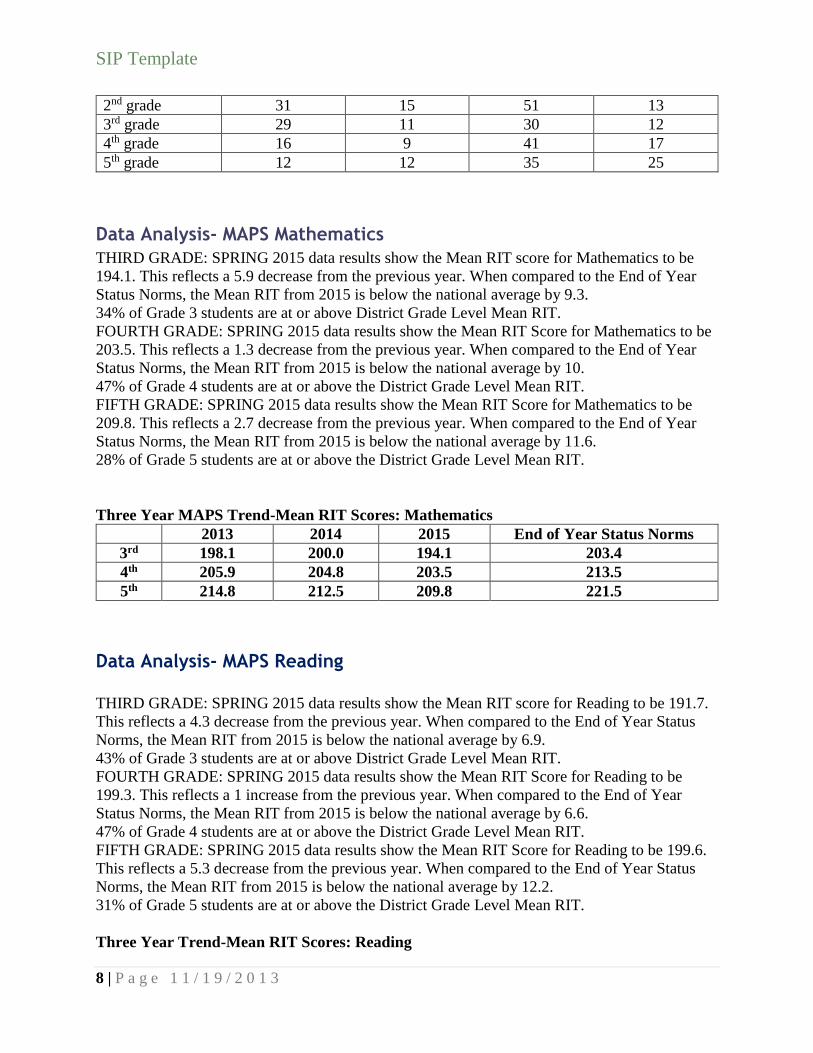
2nd grade 31 15 51 13
3rd grade 29 11 30 12
4th grade 16 9 41 17
5th grade 12 12 35 25
Data Analysis- MAPS Mathematics
THIRD GRADE: SPRING 2015 data results show the Mean RIT score for Mathematics to be
194.1. This reflects a 5.9 decrease from the previous year. When compared to the End of Year
Status Norms, the Mean RIT from 2015 is below the national average by 9.3.
34% of Grade 3 students are at or above District Grade Level Mean RIT.
FOURTH GRADE: SPRING 2015 data results show the Mean RIT Score for Mathematics to be
203.5. This reflects a 1.3 decrease from the previous year. When compared to the End of Year
Status Norms, the Mean RIT from 2015 is below the national average by 10.
47% of Grade 4 students are at or above the District Grade Level Mean RIT.
FIFTH GRADE: SPRING 2015 data results show the Mean RIT Score for Mathematics to be
209.8. This reflects a 2.7 decrease from the previous year. When compared to the End of Year
Status Norms, the Mean RIT from 2015 is below the national average by 11.6.
28% of Grade 5 students are at or above the District Grade Level Mean RIT.
Three Year MAPS Trend-Mean RIT Scores: Mathematics
2013 2014 2015 End of Year Status Norms
3rd 198.1 200.0 194.1 203.4
4th 205.9 204.8 203.5 213.5
5th 214.8 212.5 209.8 221.5
Data Analysis- MAPS Reading
THIRD GRADE: SPRING 2015 data results show the Mean RIT score for Reading to be 191.7.
This reflects a 4.3 decrease from the previous year. When compared to the End of Year Status
Norms, the Mean RIT from 2015 is below the national average by 6.9.
43% of Grade 3 students are at or above District Grade Level Mean RIT.
FOURTH GRADE: SPRING 2015 data results show the Mean RIT Score for Reading to be
199.3. This reflects a 1 increase from the previous year. When compared to the End of Year
Status Norms, the Mean RIT from 2015 is below the national average by 6.6.
47% of Grade 4 students are at or above the District Grade Level Mean RIT.
FIFTH GRADE: SPRING 2015 data results show the Mean RIT Score for Reading to be 199.6.
This reflects a 5.3 decrease from the previous year. When compared to the End of Year Status
Norms, the Mean RIT from 2015 is below the national average by 12.2.
31% of Grade 5 students are at or above the District Grade Level Mean RIT.
Three Year Trend-Mean RIT Scores: Reading
SIP Template
9 | P a g e 1 1 / 1 9 / 2 0 1 3
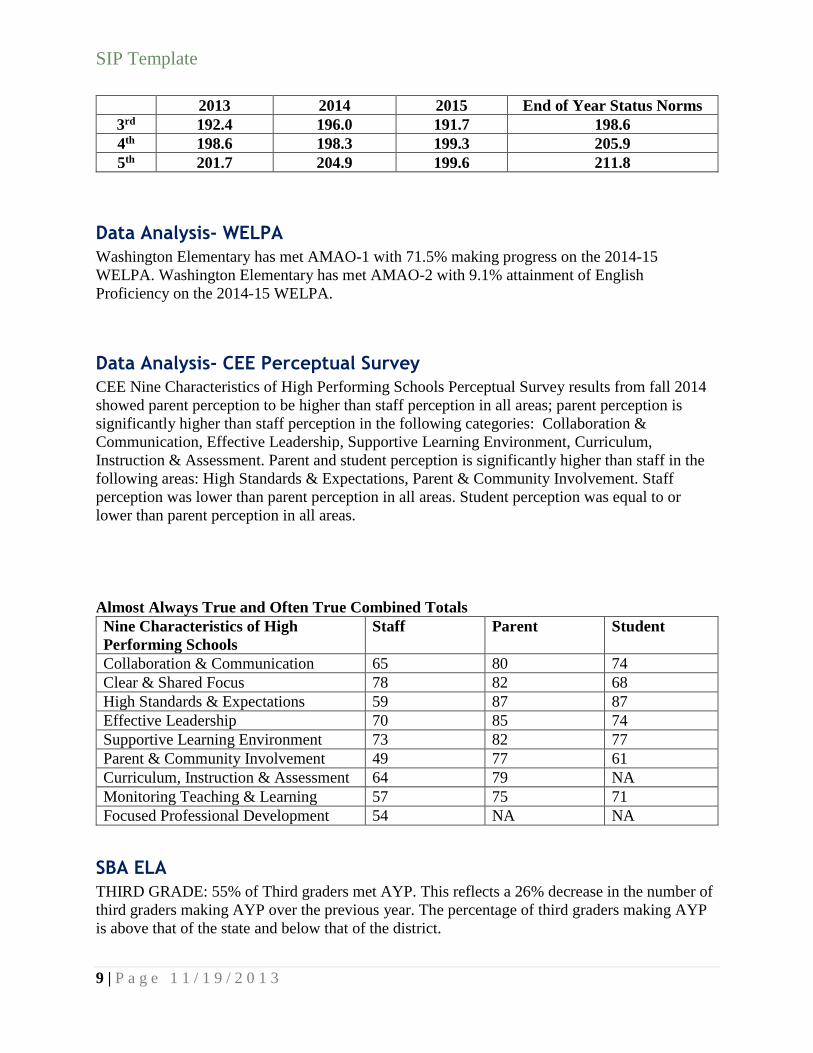
2013 2014 2015 End of Year Status Norms
3rd 192.4 196.0 191.7 198.6
4th 198.6 198.3 199.3 205.9
5th 201.7 204.9 199.6 211.8
Data Analysis- WELPA
Washington Elementary has met AMAO-1 with 71.5% making progress on the 2014-15
WELPA. Washington Elementary has met AMAO-2 with 9.1% attainment of English
Proficiency on the 2014-15 WELPA.
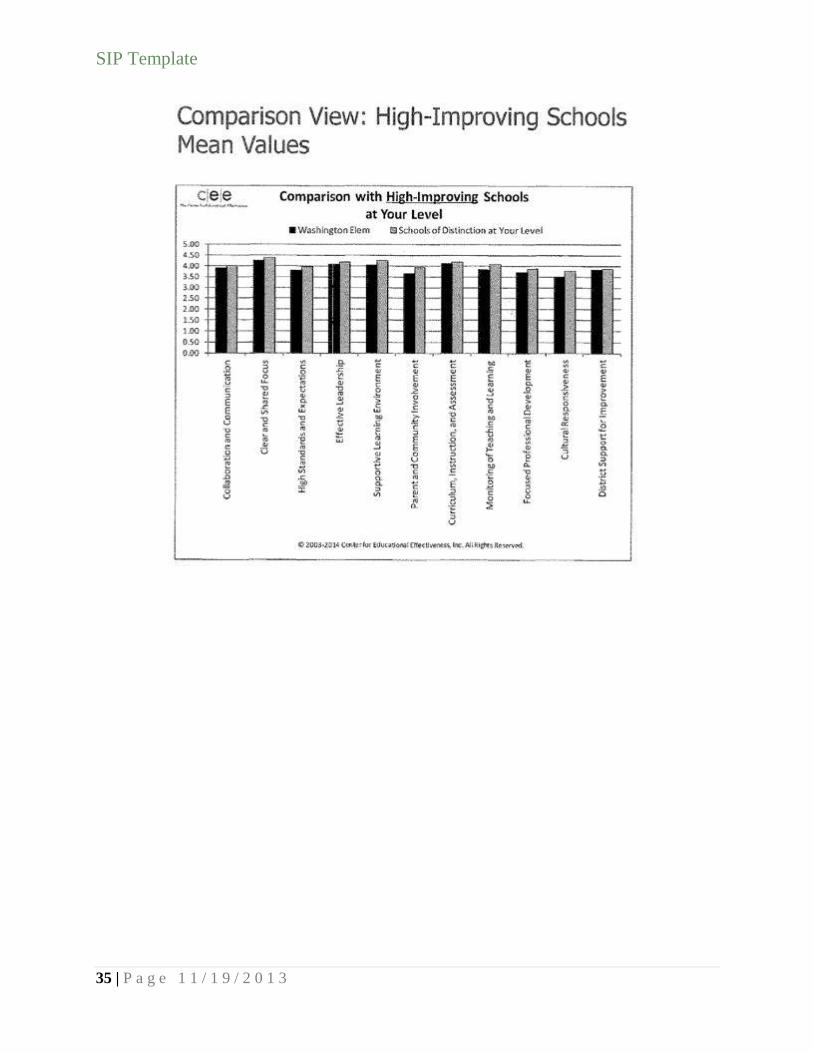
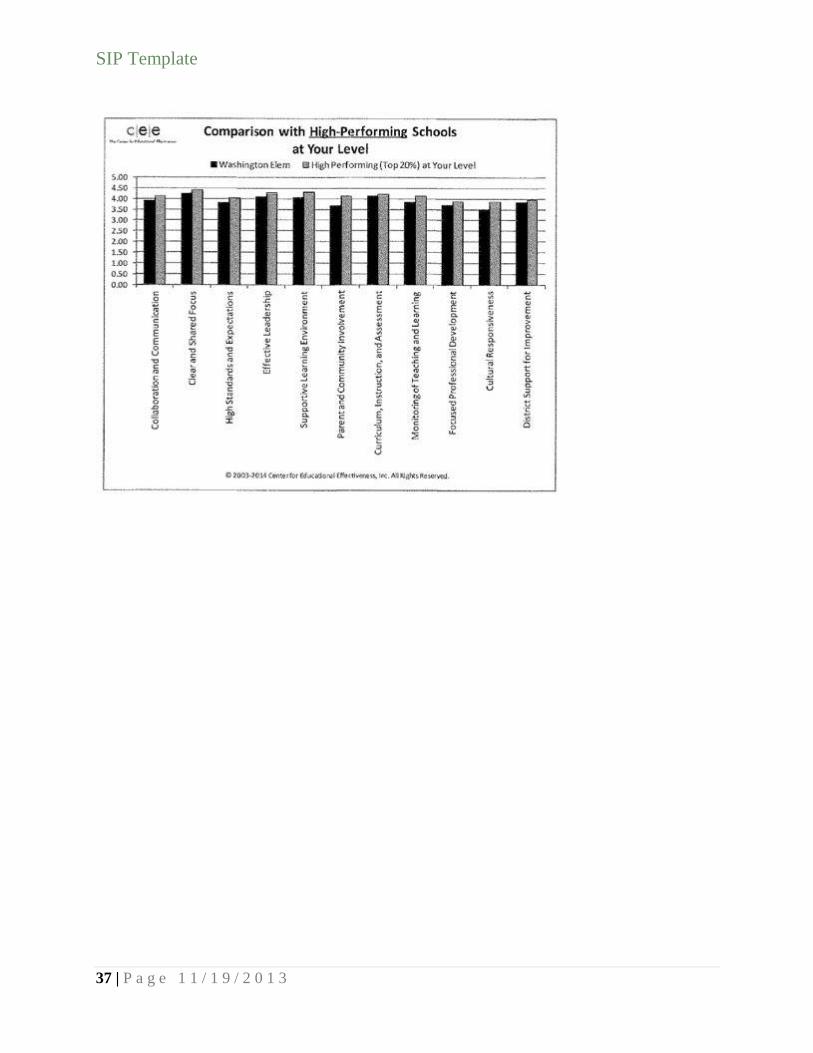
Data Analysis- CEE Perceptual Survey
CEE Nine Characteristics of High Performing Schools Perceptual Survey results from fall 2014
showed parent perception to be higher than staff perception in all areas; parent perception is
significantly higher than staff perception in the following categories: Collaboration &
Communication, Effective Leadership, Supportive Learning Environment, Curriculum,
Instruction & Assessment. Parent and student perception is significantly higher than staff in the
following areas: High Standards & Expectations, Parent & Community Involvement. Staff
perception was lower than parent perception in all areas. Student perception was equal to or
lower than parent perception in all areas.
Almost Always True and Often True Combined Totals
Nine Characteristics of High
Performing Schools
Staff Parent Student
Collaboration & Communication 65 80 74
Clear & Shared Focus 78 82 68
High Standards & Expectations 59 87 87
Effective Leadership 70 85 74
Supportive Learning Environment 73 82 77
Parent & Community Involvement 49 77 61
Curriculum, Instruction & Assessment 64 79 NA
Monitoring Teaching & Learning 57 75 71
Focused Professional Development 54 NA NA
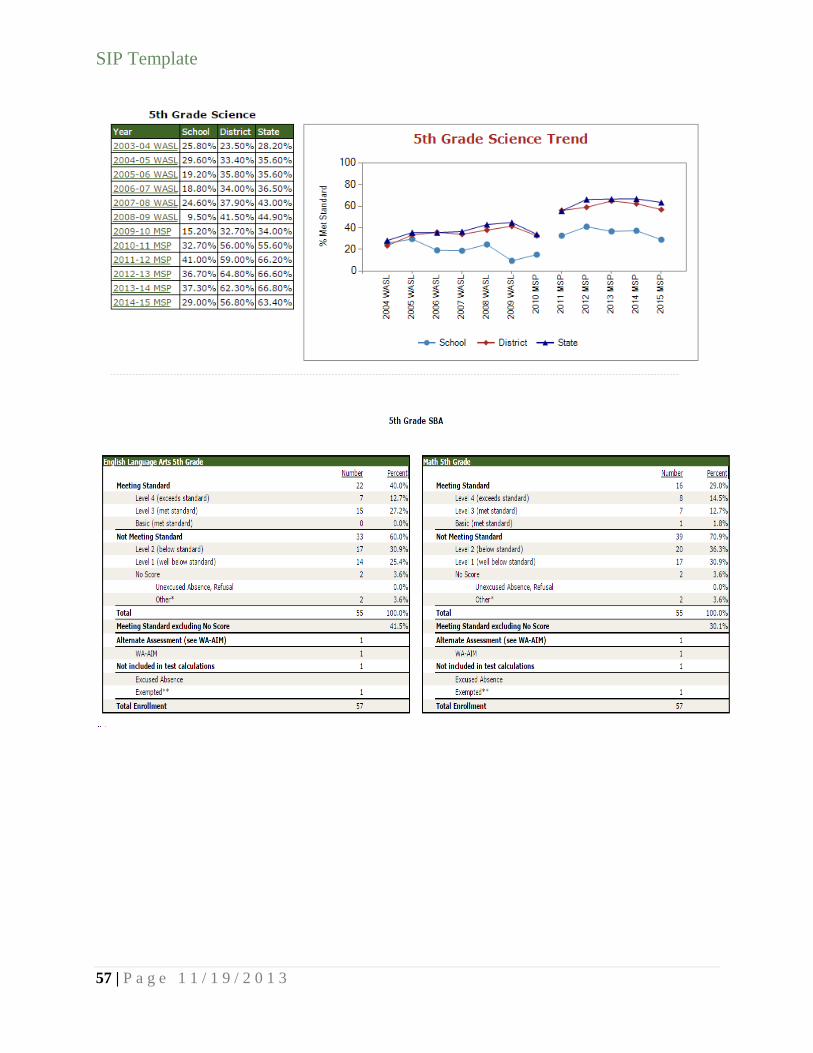
SBA ELA
THIRD GRADE: 55% of Third graders met AYP. This reflects a 26% decrease in the number of
third graders making AYP over the previous year. The percentage of third graders making AYP
is above that of the state and below that of the district.

SIP Template
10 | P a g e 1 1 / 1 9 / 2 0 1 3
FOURTH GRADE: 54.1% of Fourth graders met AYP. This reflects a 12.5% decrease in the
number of third graders making AYP over the previous year. The percentage of fourth graders
making AYP is below that of the state and district.
FIFTH GRADE: 40% of Fourth graders met AYP. This reflects a 25.6% decrease in the number
of fifth graders making AYP over the previous year. The percentage of fifth graders making
AYP is below that of the state and district.
Three Year MSP/SBA Trend: Reading
2013-MSP 2014-MSP 2015-SBA
3rd 71.1% 81% 55%
4th 66.6% 66.6% 54.1%
5th 64.7% 65.6% 40%
SBA/EOC Math
THIRD GRADE: 55.7% of Third graders met AYP in math. This reflects a 14.3% decrease in
the number of third graders making AYP over the previous year. The percentage of third graders
making AYP is above that of the state, but below that of the district.
FOURTH GRADE: 65.2% of Fourth graders met AYP in math. This reflects a 4% increase in
the number of fourth graders making AYP over the previous year. The percentage of fourth
graders making AYP is above both the state and the district.
FIFTH GRADE: 29% of Fifth graders met AYP in math. This reflects a 34.2% decrease in the
number of fifth graders making AYP over the previous year. The percentage of fifth graders
making AYP is below that of the state and district.
Three Year MSP/SBA Trend: Math
2013-MSP 2014-MSP 2015-SBA
3rd 65.2% 70% 55.7%
4th 65.1% 61.2% 65.2%
5th 60.8% 63.2% 29%
MSP Science/EOC Biology
FIFTH GRADE: 29% of fifth graders met AYP in Science. This reflects an 8.3% decrease in the
number of students making AYP over the previous year. The percentage of fifth graders making
AYP is below that of the state and district.
Three Year MSP Trend: Science

SIP Template
11 | P a g e 1 1 / 1 9 / 2 0 1 3
2013 2014 2015
5th 36.7% 37.3% 29%
Data Analysis- Credit Attainment, Honors/AP Enrollment
Students designated as Highly Capable are placed in general education courses at Hazelwood in
all grades in a PACE format. Students are provided opportunities to accelerate their learning via
Walk to Read and Walk to Math programs within the school. Additionally, the individual
classroom teacher provides support along with the school counselor meeting with the designated
highly capable students on a regular basis. Highly Capable students in grades 4 and 5 have the
opportunity to attend Terminal Park Elementary School.
Parent Involvement – SWT 6
All students enrolled at Washington are notified in writing regarding the School-Wide Walk-to-
Read Program. All parents receive grade level specific instructional plans for reading. In addition,
parents will receive an explanation of specific Title I programs, its selection process, and basic
procedures. All parents will receive Washington elementary Title I Parent Policy, the Parent Right to
Know and information on Title I funding is made available in both Spanish and English. This
information is posted on the school web site and available in the office Parent Information kiosk.
The goals of parent involvement will be to share materials and suggestions that will help
their children improve and succeed in the basic education classroom. The following ongoing
activities (but not limited to) may take place: open house, conferences, home reading program,
newsletters, good work awards, curriculum exploration nights, telephone contacts, additional
materials as requested by concerned parents, take-home books with parent information, parent
observation of groups in session, workshops, and other activities that encourage parental
involvement in the educational experience of their child.
A fall and spring survey will give parents input as to what type of communication and
involvement they would value in the Title I program. The results of this survey will be complied by
the Title I coordinator and taken into consideration during program planning. The Title I program’s
open door policy welcomes parent input and program suggestions at any time. Translators are
contracted for school wide events to support the predominate languages. Notices will be sent in
home languages as available. A Compact, on which parents, students, and teachers indicate
activities they will engage in is used in an effort to work together to foster reading growth. A signed
copy of these compacts will be kept on file for selected students.

SIP Template
12 | P a g e 1 1 / 1 9 / 2 0 1 3
Student Transitions – SWT 7
The Auburn School district has recognized the Head Start program as a community outreach
program. Former Head Start students are identified in consideration for Kindergarten Title I
support. ECE teachers work with Kindergarten teachers to develop ways to support ECE students
that are entering Kindergarten. Local preschools and daycares, which feed into Washington
Elementary, will be notified of parent education opportunities. In the spring, Kindergarten Round-
up is held to give upcoming Kindergarten parents important school information. Upcoming
Kindergarten students are invited to attend also to become familiar with the school setting and
riding the bus. If funds permit, parents are invited to have their child participate in a screening for
possible participation in a Summer School Jump Start program for qualifying students. Summer
school is available for selected students, K-3, for three weeks in August.
Students moving on to Cascade middle school are invited to a parent night in the spring.
They will tour the building and discuss procedures for the upcoming year. Counselors come to
Washington Elementary in the spring to meet 5th graders, get acquainted with them, and discuss
what they can look forward to at their new school.
Assessment Decisions – SWT 8
Washington Elementary is a Schoolwide Title Building. Students identified for extra help in reading score below standard at his/her grade level using the DIBELS fluency assessment and the Diagnostic Decoding Survey (DDS) for grades 1-5. Student state assessments like the Maps and SBA tests, along with Teacher Rating Scales are also used to identify and place students into small reading groups. Kindergarten students are placed according to their DIBELS and Trimester Skills assessment (readiness skills assessment), in addition to the Teacher Rating Scale.
Data meetings are conducted with each grade level, three times a year after each benchmark assessment. Assessment data and student placement are discussed and goals are confirmed. Professional Learning Communities (PLC’s) are ongoing to revisit student progress and/ or concerns throughout the year. All students are progress monitored every month and changes in grouping may be made. Reading groups are fluid and instruction is determined by assessment data. Gaps confirmed by using the DDS assessment are targeted with timely, effective instruction.
Effective, Timely Assistance – SWT 9
Students at Washington Elementary are tested within the first week of school using the DIBELS assessment for fluency and the Diagnostic Decoding Survey for phonics knowledge. This data, along with student state assessments like the Maps and SBA tests, and the Teacher Rating Scales are also used to identify and place students into small reading groups. Kindergarten students are placed according to their DIBELS and Trimester Skills assessment (readiness skills assessment), in
SIP Template
13 | P a g e 1 1 / 1 9 / 2 0 1 3
addition to the Teacher Rating Scale. Student data is sorted and walk-to-read groups are established according to need. Data is shared with the staff, reviewed, and discussed promptly. Walk to read groups begin as soon as possible for effective and timely assistance. These groups are fluid and on-going progress monitoring occurs. As students grow and progress they may change groups so we may continue to challenge them. If a student is struggling, we place them in a group to strategically target the skills that they need.

SIP Template
14 | P a g e 1 1 / 1 9 / 2 0 1 3
Prioritized Challenges
1. The percentage of Washington 3rd, 4th, and 5th graders passing the reading MSP
between 2013 and 2014 was on an upward trend while the 2015 ELA SBA
percentages dropped.
2. The percentage of Washington 3rd and 5th graders passing the Math MSP between
2013 and 2014 was on an upward trend while the 2015 Math SBA percentages
dropped.
3. Based on the data between 2012 and 2015 Bully survey, the number of students who
reported being bullied at least 2 times per month did not decrease. In 2012 30%, 2015
29%.
4. Our free and reduced population increased from 75.5% in 2012 to 81% in 2015.
5. Our Absentees have increased from 15.7% to 16.8% in 2015.
SIP Template
15 | P a g e 1 1 / 1 9 / 2 0 1 3
SMART Goal 1:
The percent of students at each grade level meeting standard will increase by at least 6% each year from spring 2015 to spring 2019 as measured by the State assessment in ELA for Grades 3, 4, and 5. Scores will increase from 55% to 73% in 3rd grade, 54.1% to 72.1% in 4th grade, and 40% to 58% in 5th grade.
SMART Goal 2:
The percent of students at each grade level meeting standard will increase by at least 6% each year from spring 2015 to spring 2019 as measured by the State assessment in MATH for Grades 3, 4, and 5. Scores will increase from 55.7% to 73.7% in 3rd grade, 65.2% to 83.2% in 4th grade, and 29% to 47% in 5th grade.
SMART Goal 3:
Reduce percentages of Absences by at least 2% each year from spring 2015 to spring 2019 as measured by Skyward attendance records decreasing absences from 16.8% in 2015 to 10.8% in 2019.
SIP Template
16 | P a g e 1 1 / 1 9 / 2 0 1 3
Needs Assessment Data Documents
o DIBELS
o MAP
o WELPA
o CEE
o Discipline
o Demographics
o AYP
o SBA/MSP/EOC

SIP Template
17 | P a g e 1 1 / 1 9 / 2 0 1 3
DIBELS DASHBOARD
SIP Template
18 | P a g e 1 1 / 1 9 / 2 0 1 3
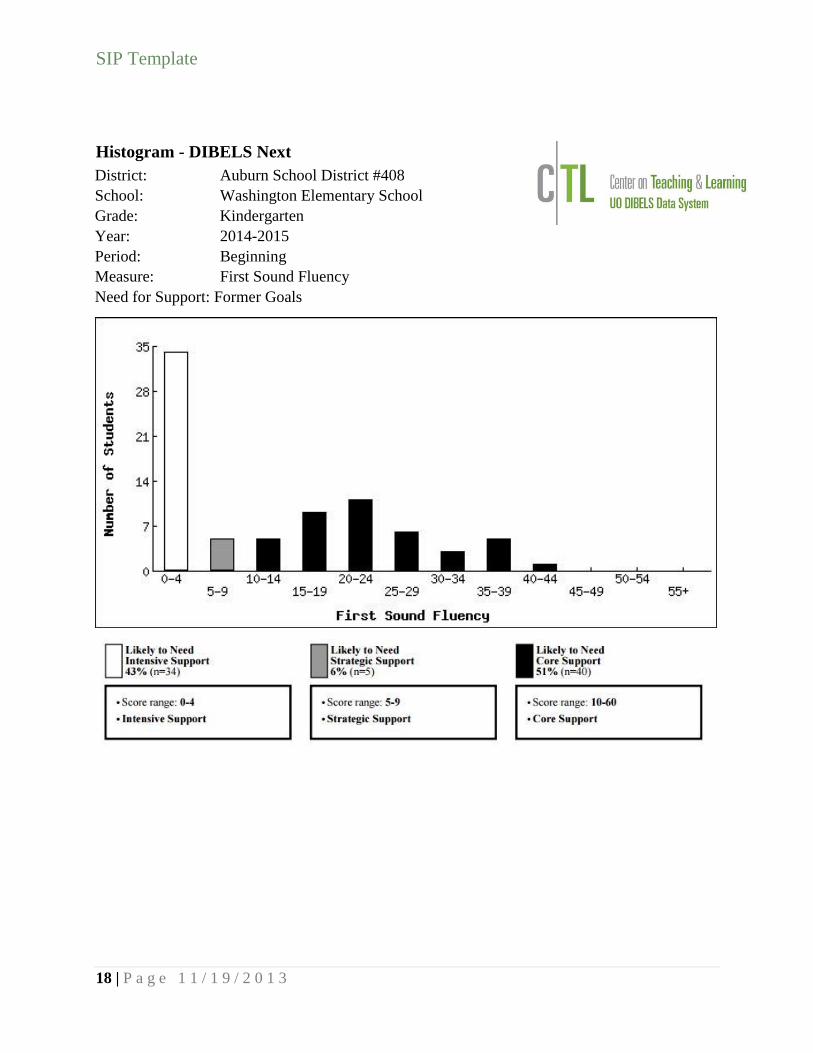
Histogram - DIBELS Next
District: Auburn School District #408
School: Washington Elementary School
Grade: Kindergarten
Year: 2014-2015
Period: Beginning
Measure: First Sound Fluency
Need for Support: Former Goals

SIP Template
19 | P a g e 1 1 / 1 9 / 2 0 1 3
Histogram - DIBELS Next
District: Auburn School District #408
School: Washington Elementary School
Grade: First Grade
Year: 2014-2015
Period: End
Measure: Nonsense Word Fluency - Correct Letter Sounds
Need for Support: Former Goals

SIP Template
20 | P a g e 1 1 / 1 9 / 2 0 1 3
Histogram - DIBELS Next
District: Auburn School District #408
School: Washington Elementary School
Grade: Second Grade
Year: 2014-2015
Period: End
Measure: DIBELS Oral Reading Fluency - Words Correct
Need for Support: Former Goals
SIP Template
21 | P a g e 1 1 / 1 9 / 2 0 1 3
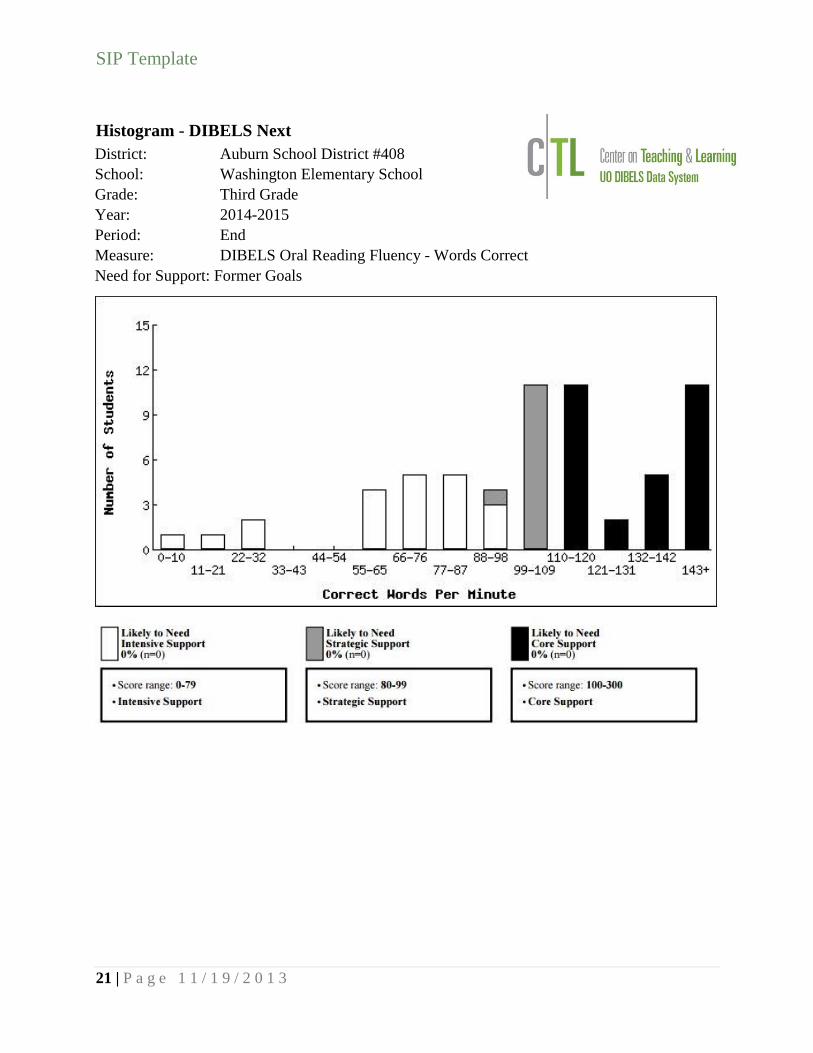
Histogram - DIBELS Next
District: Auburn School District #408
School: Washington Elementary School
Grade: Third Grade
Year: 2014-2015
Period: End
Measure: DIBELS Oral Reading Fluency - Words Correct
Need for Support: Former Goals

SIP Template
22 | P a g e 1 1 / 1 9 / 2 0 1 3
Histogram - DIBELS 6th Edition
District: Auburn School District #408
School: Washington Elementary School
Grade: Fourth Grade
Year: 2014-2015
Period: End
Measure: Oral Reading Fluency - Words Correct
SIP Template
23 | P a g e 1 1 / 1 9 / 2 0 1 3
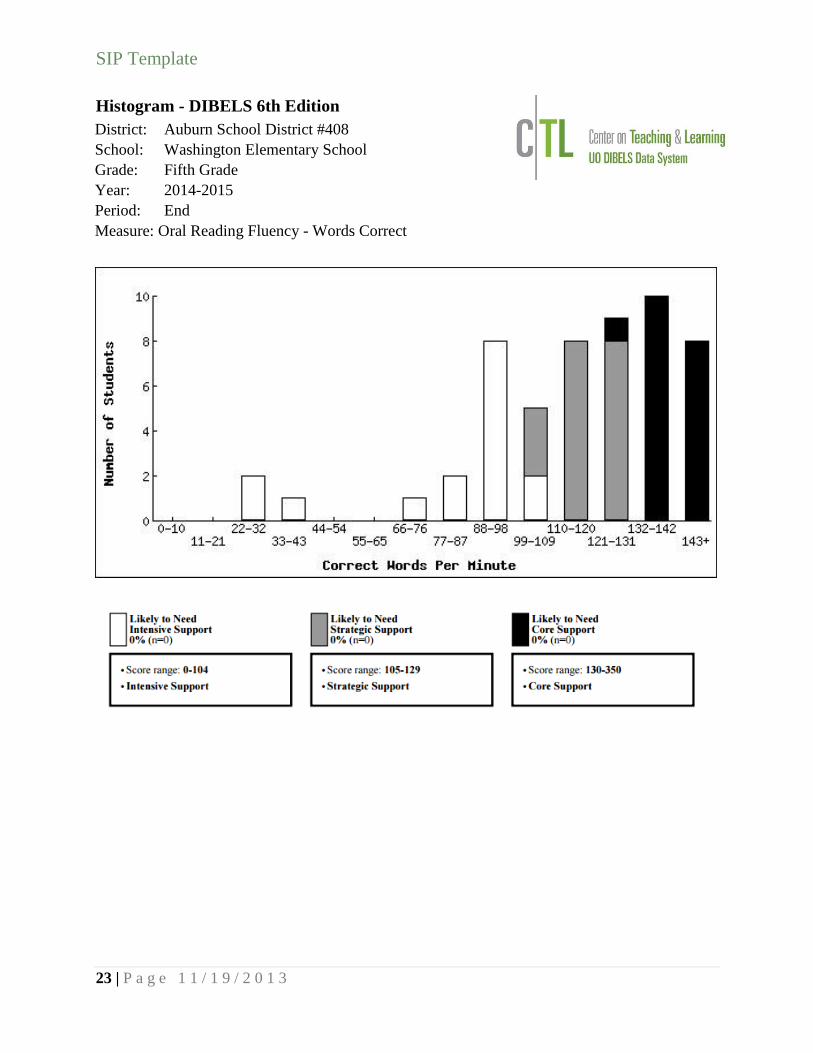
Histogram - DIBELS 6th Edition
District: Auburn School District #408
School: Washington Elementary School
Grade: Fifth Grade
Year: 2014-2015
Period: End
Measure: Oral Reading Fluency - Words Correct

SIP Template
24 | P a g e 1 1 / 1 9 / 2 0 1 3
MAP DATA
DASHBOARD

SIP Template
25 | P a g e 1 1 / 1 9 / 2 0 1 3

SIP Template
26 | P a g e 1 1 / 1 9 / 2 0 1 3
WELPA
DASHBOARD
SIP Template
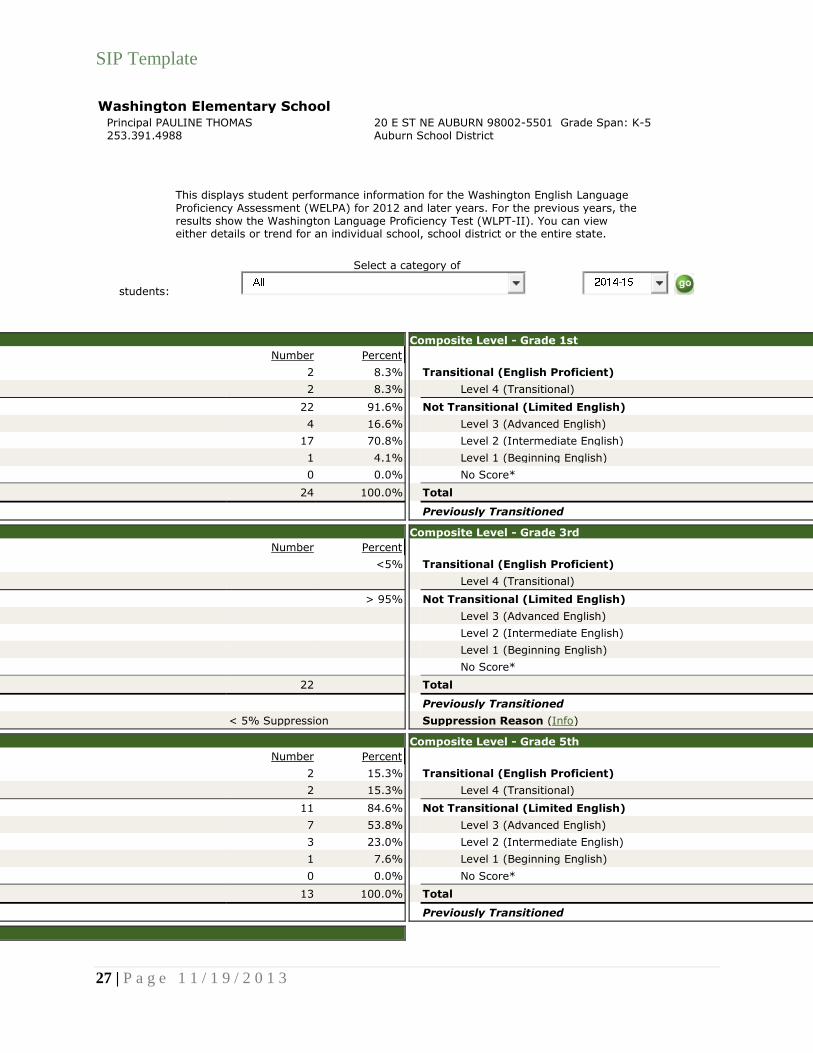
27 | P a g e 1 1 / 1 9 / 2 0 1 3
Washington Elementary School
Principal PAULINE THOMAS 253.391.4988
20 E ST NE AUBURN 98002-5501 Auburn School District
Grade Span: K-5
This displays student performance information for the Washington English Language
Proficiency Assessment (WELPA) for 2012 and later years. For the previous years, the results show the Washington Language Proficiency Test (WLPT-II). You can view either details or trend for an individual school, school district or the entire state.
Select a category of
students:
Composite Level - Grade K
Number Percent
Transitional (English Proficient) 2 8.3%
Level 4 (Transitional) 2 8.3%
Not Transitional (Limited English) 22 91.6%
Level 3 (Advanced English) 4 16.6%
Level 2 (Intermediate English) 17 70.8%
Level 1 (Beginning English) 1 4.1%
No Score* 0 0.0%
Total 24 100.0%
Previously Transitioned
Composite Level - Grade 1st
Transitional (English Proficient)
Level 4 (Transitional)
Not Transitional (Limited English)
Level 3 (Advanced English)
Level 2 (Intermediate English)
Level 1 (Beginning English)
No Score*
Total
Previously Transitioned
Composite Level - Grade 2nd
Number Percent
Transitional (English Proficient) <5%
Level 4 (Transitional)
Not Transitional (Limited English) > 95%
Level 3 (Advanced English)
Level 2 (Intermediate English)
Level 1 (Beginning English)
No Score*
Total 22
Previously Transitioned
Suppression Reason (Info) < 5% Suppression
Composite Level - Grade 3rd
Transitional (English Proficient)
Level 4 (Transitional)
Not Transitional (Limited English)
Level 3 (Advanced English)
Level 2 (Intermediate English)
Level 1 (Beginning English)
No Score*
Total
Previously Transitioned
Suppression Reason (Info)
Composite Level - Grade 4th
Number Percent
Transitional (English Proficient) 2 15.3%
Level 4 (Transitional) 2 15.3%
Not Transitional (Limited English) 11 84.6%
Level 3 (Advanced English) 7 53.8%
Level 2 (Intermediate English) 3 23.0%
Level 1 (Beginning English) 1 7.6%
No Score* 0 0.0%
Total 13 100.0%
Previously Transitioned
Composite Level - Grade 5th
Transitional (English Proficient)
Level 4 (Transitional)
Not Transitional (Limited English)
Level 3 (Advanced English)
Level 2 (Intermediate English)
Level 1 (Beginning English)
No Score*
Total
Previously Transitioned
Composite Level - Grade All

SIP Template
28 | P a g e 1 1 / 1 9 / 2 0 1 3
Number Percent
Transitional (English Proficient) 11 9.1%
Level 4 (Transitional) 11 9.1%
Not Transitional (Limited English) 109 90.8%
Level 3 (Advanced English) 49 40.8%
Level 2 (Intermediate English) 55 45.8%
Level 1 (Beginning English) 4 3.3%
No Score* 1 0.8%
Total 120 100.0%
Previously Transitioned
Washington Language Proficiency Test
This displays student performance information for the Washington English Language Proficiency Assessment (WELPA) for 2012 and later years. For the previous years, the results show the Washington Language Proficiency Test (WLPT-II). You can view either details or trend for an individual school, school district or the entire state.
Select a category of
students:
Kindergarten
Transitioning
Year School District State
2008-09 6.1%
2009-10 8.3%
2010-11 5.2% 6.3%
2011-12 6.3%
2012-13 5.9% 7.3%
2013-14 6.2%
2014-15 8.3% 8.3%

SIP Template
29 | P a g e 1 1 / 1 9 / 2 0 1 3
1st Grade
Transitioning
Year School
District
State
2008-09
17.6%
18.3% 16.7
%
2009-10
5.8% 22.1% 18.5
%
2010-11
18.5% 18.0
%
2011-12
6.6% 16.4% 12.4
%
2012-13
26.6%
14.4% 11.8
%
2013-14
13.7% 10.9
%
2014-15
11.4%
16.7% 13.1
%
2nd Grade Transitioning
Year School District State
2008-09
12.5% 35.7% 30.2%
2009-10
16.6% 36.5% 21.1%
2010-11
33.3% 37.6% 29.9%
2011-12
11.7% 19.6% 13.0%
2012-13
33.3% 18.6% 13.7%
2013-14
18.7% 14.5% 13.1%
2014-15
19.2% 15.2%

SIP Template
30 | P a g e 1 1 / 1 9 / 2 0 1 3
3rd Grade
Transitioning
Year School District State
2008-09
23.2% 19.5%
2009-10
11.6% 10.2%
2010-11
27.2% 20.2% 24.7%
2011-12
13.2% 10.4%
2012-13
7.1% 11.7% 10.6%
2013-14
14.2% 15.5% 13.8%
2014-15
11.0% 13.5%
4th Grade
Transitioning
Year School District State
2008-09
30.5% 23.2%
2009-10
6.2% 6.9%
2010-11
18.1% 23.1% 22.1%
2011-12
10.0% 11.5% 10.2%
2012-13
8.9% 9.6%
2013-14
18.7% 11.8% 11.7%
2014-15
15.3% 13.5% 16.5%
SIP Template
31 | P a g e 1 1 / 1 9 / 2 0 1 3
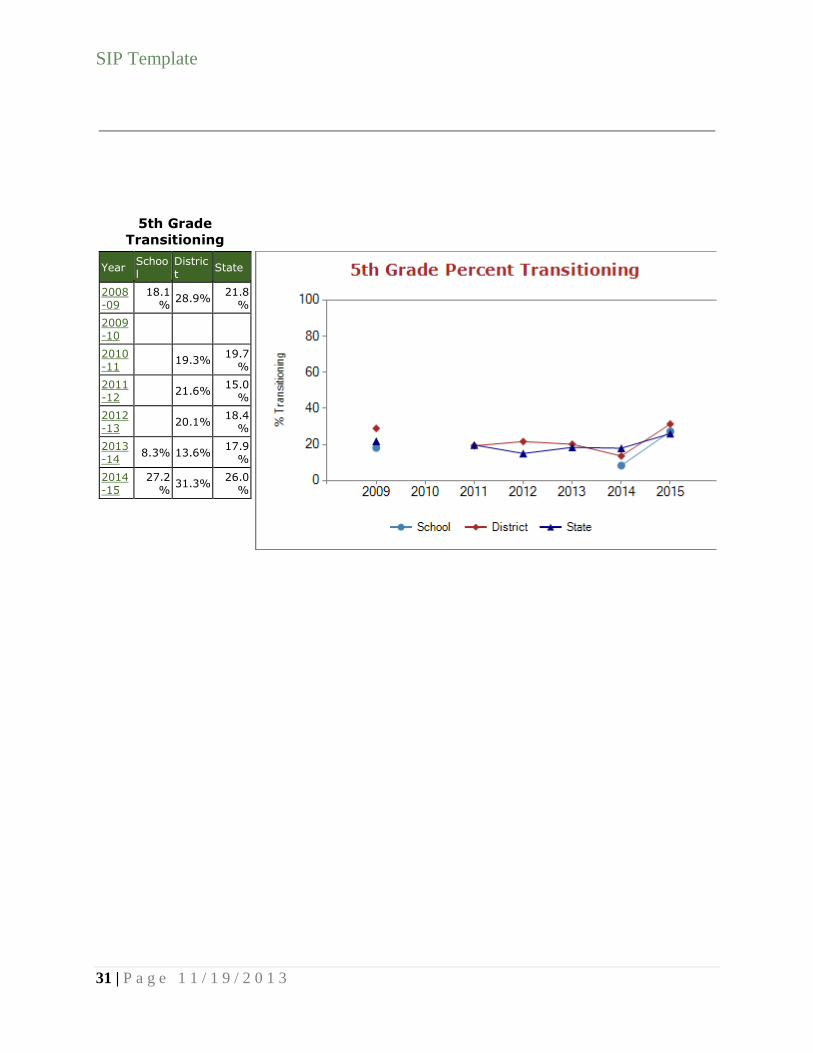
5th Grade
Transitioning
Year School
District
State
2008-09
18.1%
28.9% 21.8
%
2009-10
2010-11
19.3% 19.7
%
2011-12
21.6% 15.0
%
2012-13
20.1% 18.4
%
2013-14
8.3% 13.6% 17.9
%
2014-15
27.2%
31.3% 26.0
%
SIP Template
32 | P a g e 1 1 / 1 9 / 2 0 1 3
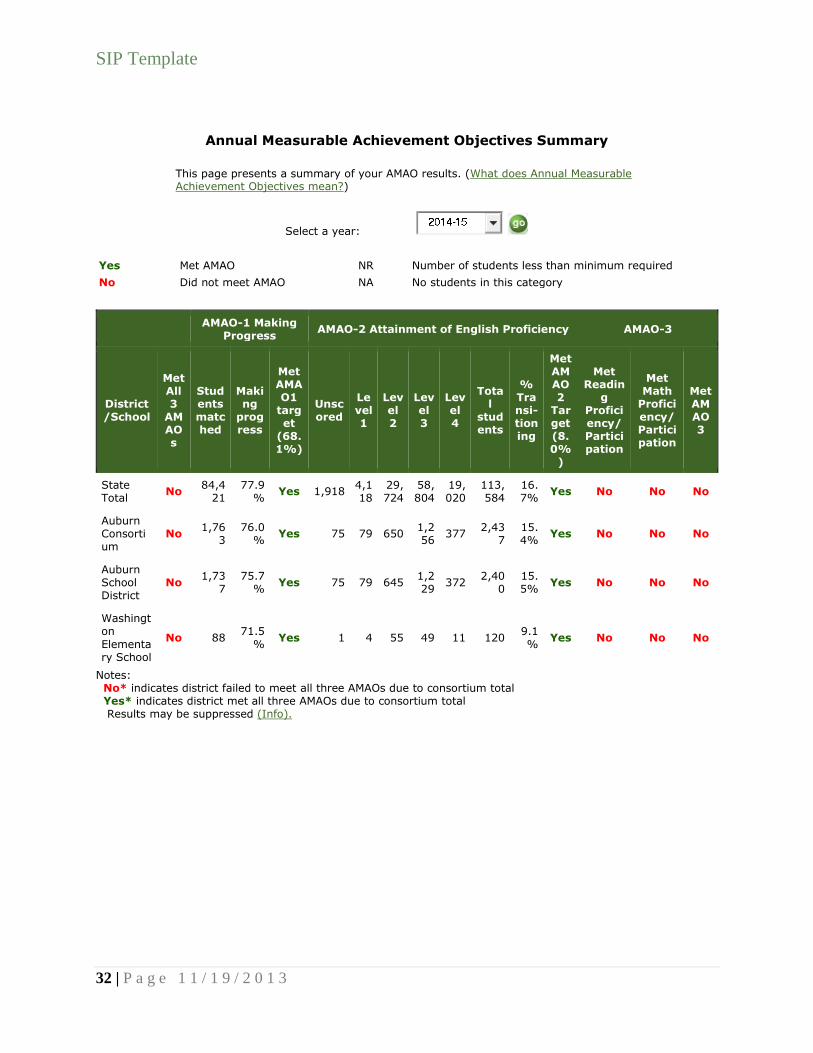
Annual Measurable Achievement Objectives Summary
This page presents a summary of your AMAO results. (What does Annual Measurable Achievement Objectives mean?)
Select a year:
Yes Met AMAO NR Number of students less than minimum required
No Did not meet AMAO NA No students in this category
AMAO-1 Making Progress
AMAO-2 Attainment of English Proficiency AMAO-3
District/School
Met All 3
AMAOs
Students matched
Making
progress
Met AMAO1
target
(68.1%)
Unscored
Level 1
Level 2
Level 3
Level 4
Total
students
% Transi- tioning
Met AMAO2
Target (8.0%
)
Met Readin
g Proficiency/ Participation
Met Math
Proficiency/ Participation
Met AMAO3
State Total
No 84,4
21 77.9
% Yes 1,918
4,118
29,724
58,804
19,020
113,584
16.7%
Yes No No No
Auburn Consortium
No 1,76
3 76.0
% Yes 75 79 650
1,256
377 2,43
7 15.4%
Yes No No No
Auburn School District
No 1,73
7 75.7
% Yes 75 79 645
1,229
372 2,40
0 15.5%
Yes No No No
Washington
Elementary School
No 88 71.5
% Yes 1 4 55 49 11 120
9.1
% Yes No No No
Notes: No* indicates district failed to meet all three AMAOs due to consortium total Yes* indicates district met all three AMAOs due to consortium total Results may be suppressed (Info).
SIP Template
33 | P a g e 1 1 / 1 9 / 2 0 1 3
CEE
SPIDER CHART

SIP Template
34 | P a g e 1 1 / 1 9 / 2 0 1 3
SIP Template
35 | P a g e 1 1 / 1 9 / 2 0 1 3

SIP Template
36 | P a g e 1 1 / 1 9 / 2 0 1 3
SIP Template
37 | P a g e 1 1 / 1 9 / 2 0 1 3

SIP Template
38 | P a g e 1 1 / 1 9 / 2 0 1 3
DISCIPLINE
DASHBOARD
SIP Template
39 | P a g e 1 1 / 1 9 / 2 0 1 3
SIP Template
40 | P a g e 1 1 / 1 9 / 2 0 1 3
SIP Template
41 | P a g e 1 1 / 1 9 / 2 0 1 3

SIP Template
42 | P a g e 1 1 / 1 9 / 2 0 1 3
DEMOGRAPHICS

SIP Template
43 | P a g e 1 1 / 1 9 / 2 0 1 3
Washington Elementary School
Principal PAULINE THOMAS 253.391.4988
20 E ST NE AUBURN 98002-5501 Auburn School District
Grade Span: K-5
2014-15 Results (Administration Info)
Grade Level SBA ELA SBA Math
3rd Grade 55.0% 55.7%
4th Grade 54.1% 65.2%
5th Grade 40.0% 29.0%
Grade Level MSP Science
5th Grade 29.0%
Student Demographics
Enrollment
October 2014 Student Count 461
May 2015 Student Count 452
Gender (October 2014)
Male 214 46.4%
Female 247 53.6%
Race/Ethnicity (October 2014)
Hispanic / Latino of any race(s) 128 27.8%
Asian 11 2.4%
Black / African American 41 8.9%
Native Hawaiian / Other Pacific Islander 40 8.7%
White 159 34.5%
Two or More Races 82 17.8%
Special Programs
Free or Reduced-Price Meals (May 2015) 359 79.4%
Special Education (May 2015) 57 12.6%
Transitional Bilingual (May 2015) 115 25.4%
Migrant (May 2015) 0 0.0%
Section 504 (May 2015) 2 0.4%
Foster Care (May 2015) N<10
SIP Template
44 | P a g e 1 1 / 1 9 / 2 0 1 3
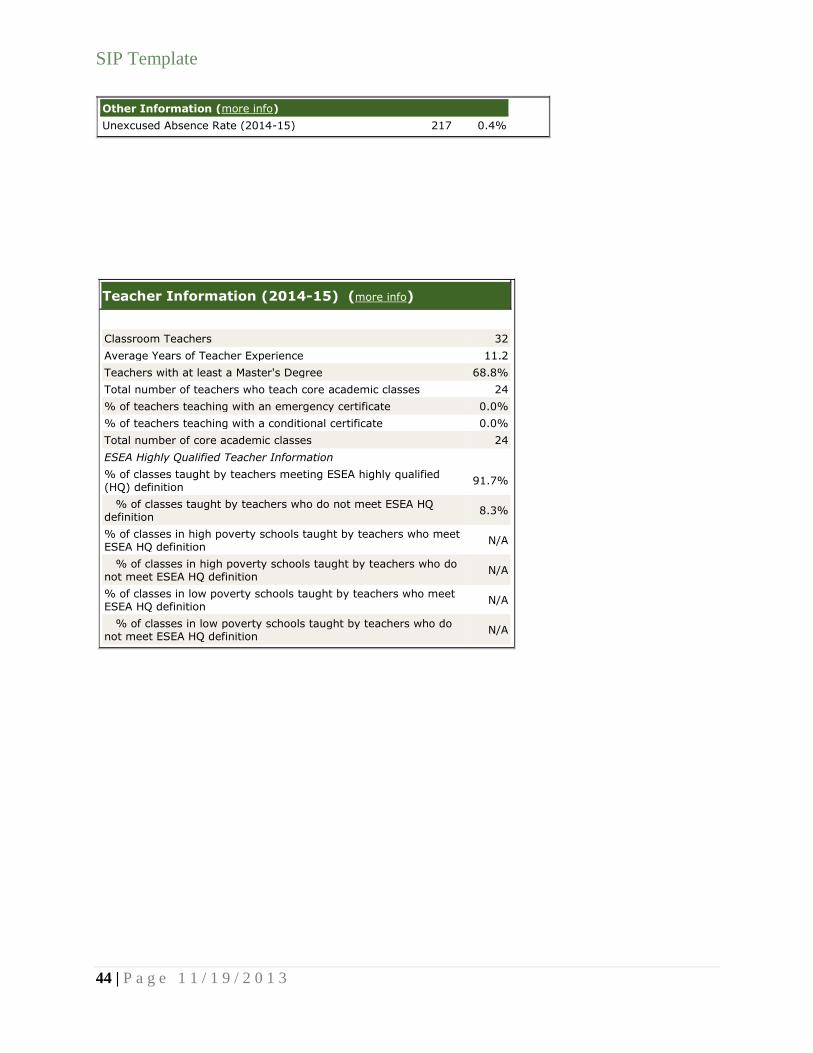
Other Information (more info)
Unexcused Absence Rate (2014-15) 217 0.4%
Teacher Information (2014-15) (more info)
Classroom Teachers 32
Average Years of Teacher Experience 11.2
Teachers with at least a Master's Degree 68.8%
Total number of teachers who teach core academic classes 24
% of teachers teaching with an emergency certificate 0.0%
% of teachers teaching with a conditional certificate 0.0%
Total number of core academic classes 24
ESEA Highly Qualified Teacher Information
% of classes taught by teachers meeting ESEA highly qualified (HQ) definition
91.7%
% of classes taught by teachers who do not meet ESEA HQ definition
8.3%
% of classes in high poverty schools taught by teachers who meet ESEA HQ definition
N/A
% of classes in high poverty schools taught by teachers who do not meet ESEA HQ definition
N/A
% of classes in low poverty schools taught by teachers who meet ESEA HQ definition
N/A
% of classes in low poverty schools taught by teachers who do not meet ESEA HQ definition
N/A

SIP Template
45 | P a g e 1 1 / 1 9 / 2 0 1 3
AYP
SIP Template
46 | P a g e 1 1 / 1 9 / 2 0 1 3
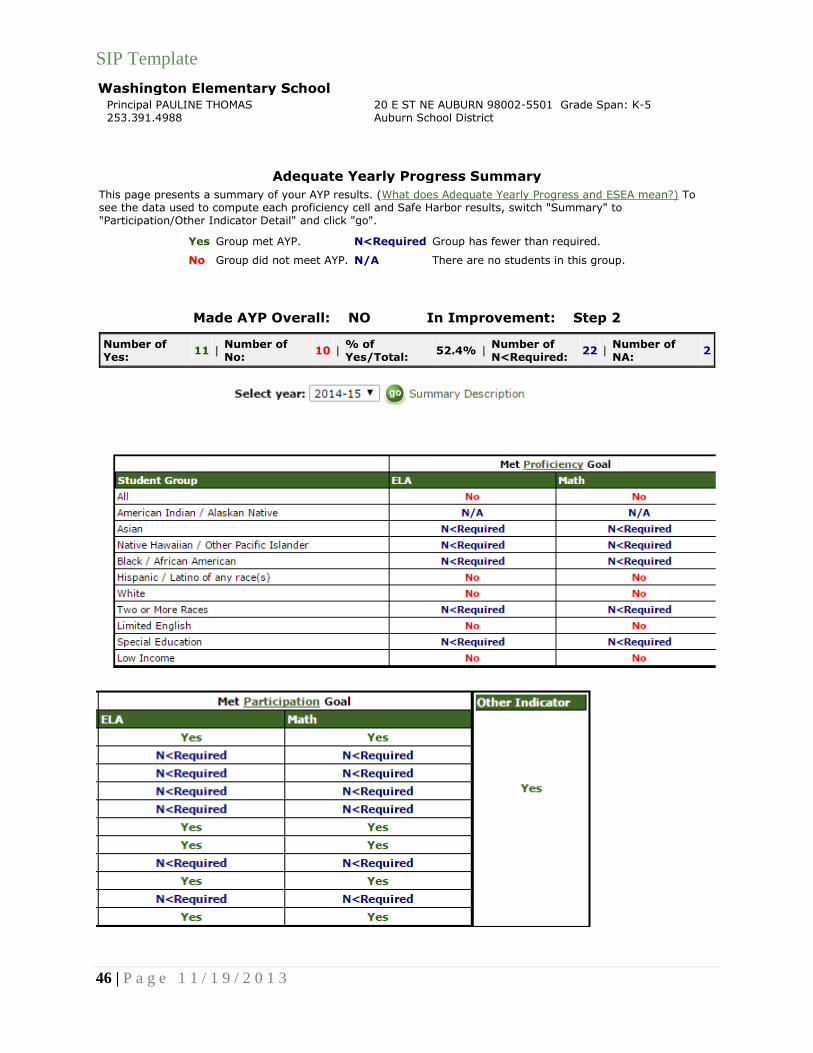
Adequate Yearly Progress Summary
This page presents a summary of your AYP results. (What does Adequate Yearly Progress and ESEA mean?) To see the data used to compute each proficiency cell and Safe Harbor results, switch "Summary" to "Participation/Other Indicator Detail" and click "go".
Yes Group met AYP. N<Required Group has fewer than required.
No Group did not meet AYP. N/A There are no students in this group.
Made AYP Overall: NO In Improvement: Step 2
Number of Yes:
11 | Number of No:
10 | % of Yes/Total:
52.4% | Number of N<Required:
22 | Number of NA:
2
Washington Elementary School
Principal PAULINE THOMAS 253.391.4988
20 E ST NE AUBURN 98002-5501 Auburn School District
Grade Span: K-5
SIP Template
47 | P a g e 1 1 / 1 9 / 2 0 1 3
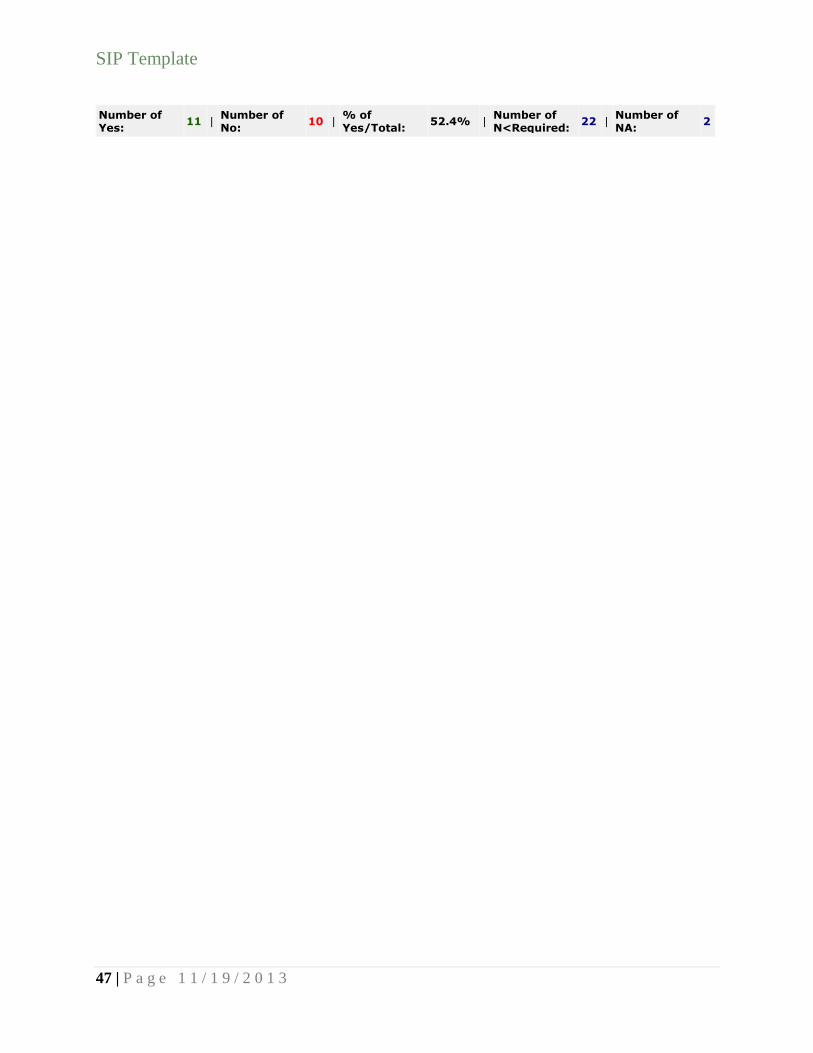
Number of Yes:
11 | Number of No:
10 | % of Yes/Total:
52.4% | Number of N<Required:
22 | Number of NA:
2

SIP Template
48 | P a g e 1 1 / 1 9 / 2 0 1 3
SBA/MSP
SIP Template
49 | P a g e 1 1 / 1 9 / 2 0 1 3
Washington Elementary School
Principal PAULINE THOMAS 253.391.4988
20 E ST NE AUBURN 98002-5501 Auburn School District
Grade Span: K-5
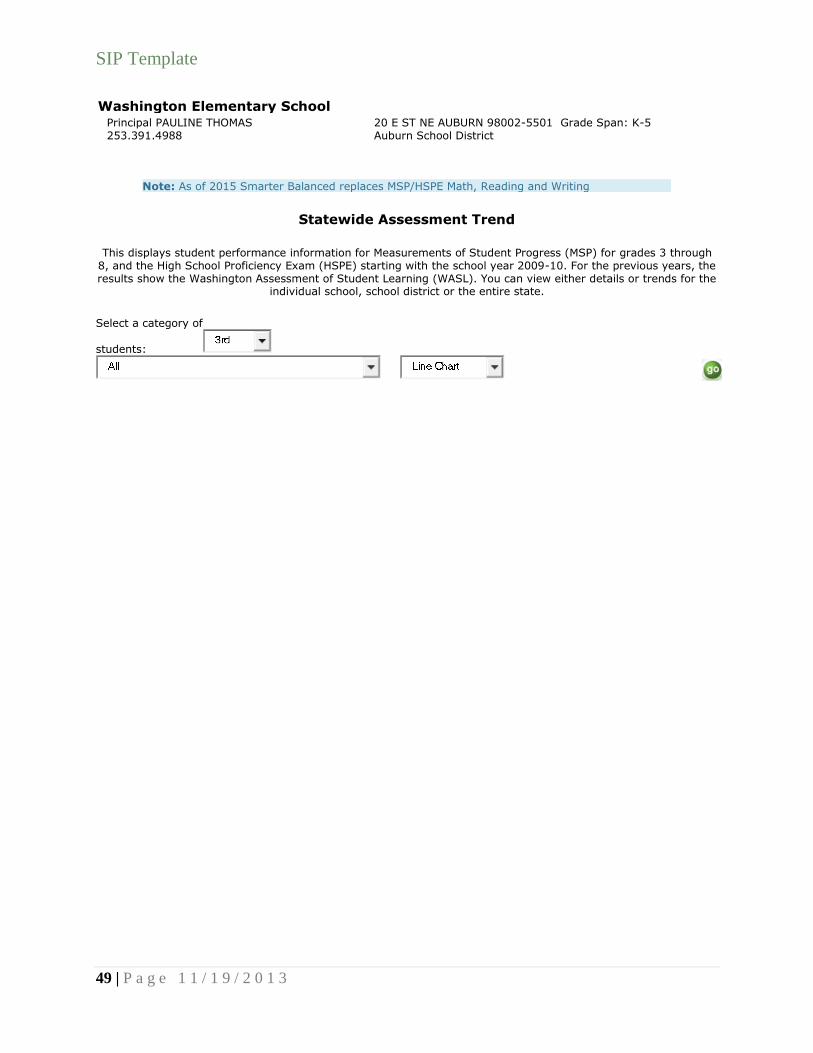
Note: As of 2015 Smarter Balanced replaces MSP/HSPE Math, Reading and Writing
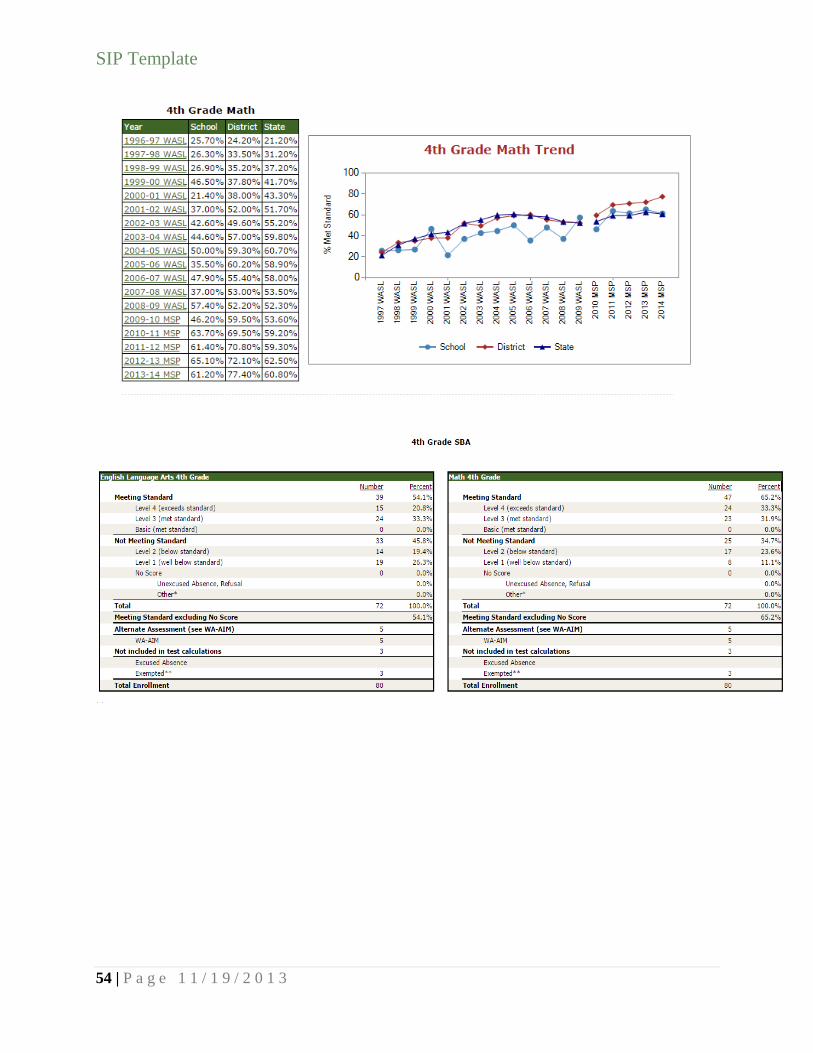
Statewide Assessment Trend
This displays student performance information for Measurements of Student Progress (MSP) for grades 3 through 8, and the High School Proficiency Exam (HSPE) starting with the school year 2009-10. For the previous years, the results show the Washington Assessment of Student Learning (WASL). You can view either details or trends for the
individual school, school district or the entire state.
Select a category of
students:

SIP Template
50 | P a g e 1 1 / 1 9 / 2 0 1 3

SIP Template
51 | P a g e 1 1 / 1 9 / 2 0 1 3

SIP Template
52 | P a g e 1 1 / 1 9 / 2 0 1 3
Washington Elementary School
Principal PAULINE THOMAS 253.391.4988
20 E ST NE AUBURN 98002-5501 Auburn School District
Grade Span: K-5
Note: As of 2015 Smarter Balanced replaces MSP/HSPE Math, Reading and Writing
Statewide Assessment Trend
This displays student performance information for Measurements of Student Progress (MSP) for grades 3 through 8, and the High School Proficiency Exam (HSPE) starting with the school year 2009-10. For the previous years, the results show the Washington Assessment of Student Learning (WASL). You can view either details or trends for the
individual school, school district or the entire state.
Select a category of
students:

SIP Template
53 | P a g e 1 1 / 1 9 / 2 0 1 3
SIP Template
54 | P a g e 1 1 / 1 9 / 2 0 1 3

SIP Template
55 | P a g e 1 1 / 1 9 / 2 0 1 3
Washington Elementary School
Principal PAULINE THOMAS 253.391.4988
20 E ST NE AUBURN 98002-5501 Auburn School District
Grade Span: K-5
Note: As of 2015 Smarter Balanced replaces MSP/HSPE Math, Reading and Writing
Statewide Assessment Trend
This displays student performance information for Measurements of Student Progress (MSP) for grades 3 through 8, and the High School Proficiency Exam (HSPE) starting with the school year 2009-10. For the previous years, the results show the Washington Assessment of Student Learning (WASL). You can view either details or trends for the
individual school, school district or the entire state.
Select a category of
students:

SIP Template
56 | P a g e 1 1 / 1 9 / 2 0 1 3
SIP Template
57 | P a g e 1 1 / 1 9 / 2 0 1 3
SIP Template
58 | P a g e 1 1 / 1 9 / 2 0 1 3
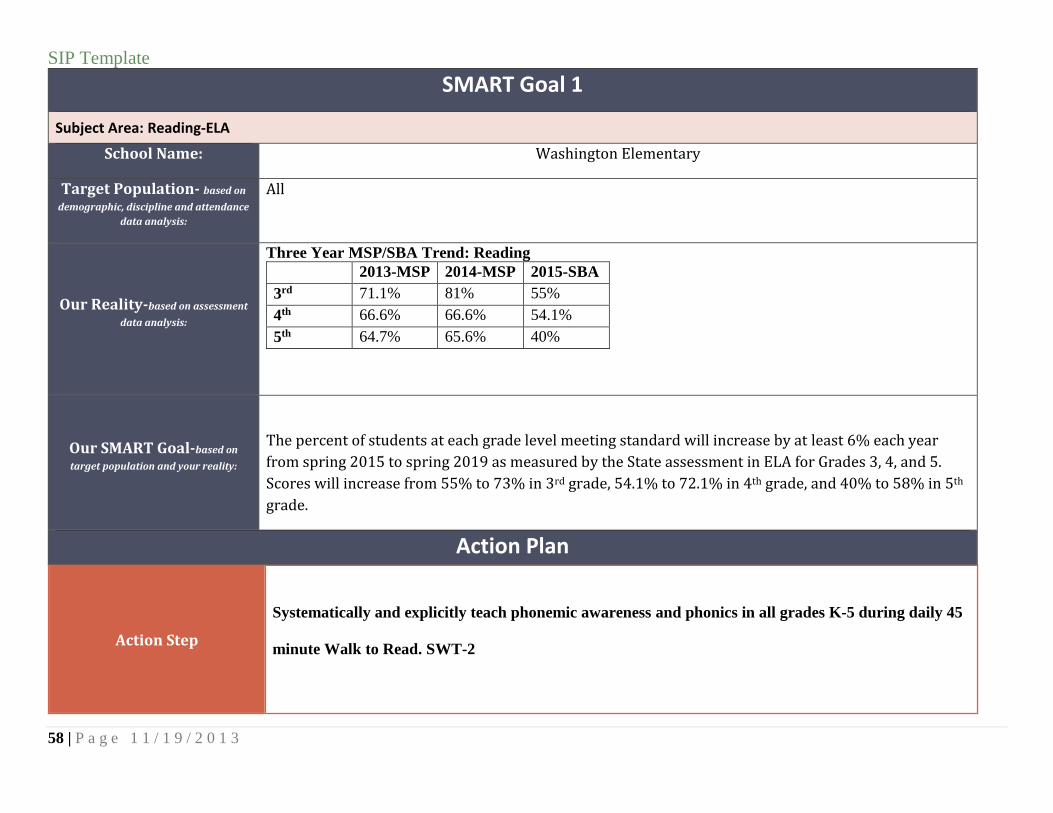
SMART Goal 1
Subject Area: Reading-ELA
School Name: Washington Elementary
Target Population- based on
demographic, discipline and attendance
data analysis:
All
Our Reality-based on assessment
data analysis:
Three Year MSP/SBA Trend: Reading
2013-MSP 2014-MSP 2015-SBA
3rd 71.1% 81% 55%
4th 66.6% 66.6% 54.1%
5th 64.7% 65.6% 40%
Our SMART Goal-based on
target population and your reality:
The percent of students at each grade level meeting standard will increase by at least 6% each year
from spring 2015 to spring 2019 as measured by the State assessment in ELA for Grades 3, 4, and 5.
Scores will increase from 55% to 73% in 3rd grade, 54.1% to 72.1% in 4th grade, and 40% to 58% in 5th
grade.
Action Plan
Action Step
Systematically and explicitly teach phonemic awareness and phonics in all grades K-5 during daily 45
minute Walk to Read. SWT-2
SIP Template
59 | P a g e 1 1 / 1 9 / 2 0 1 3
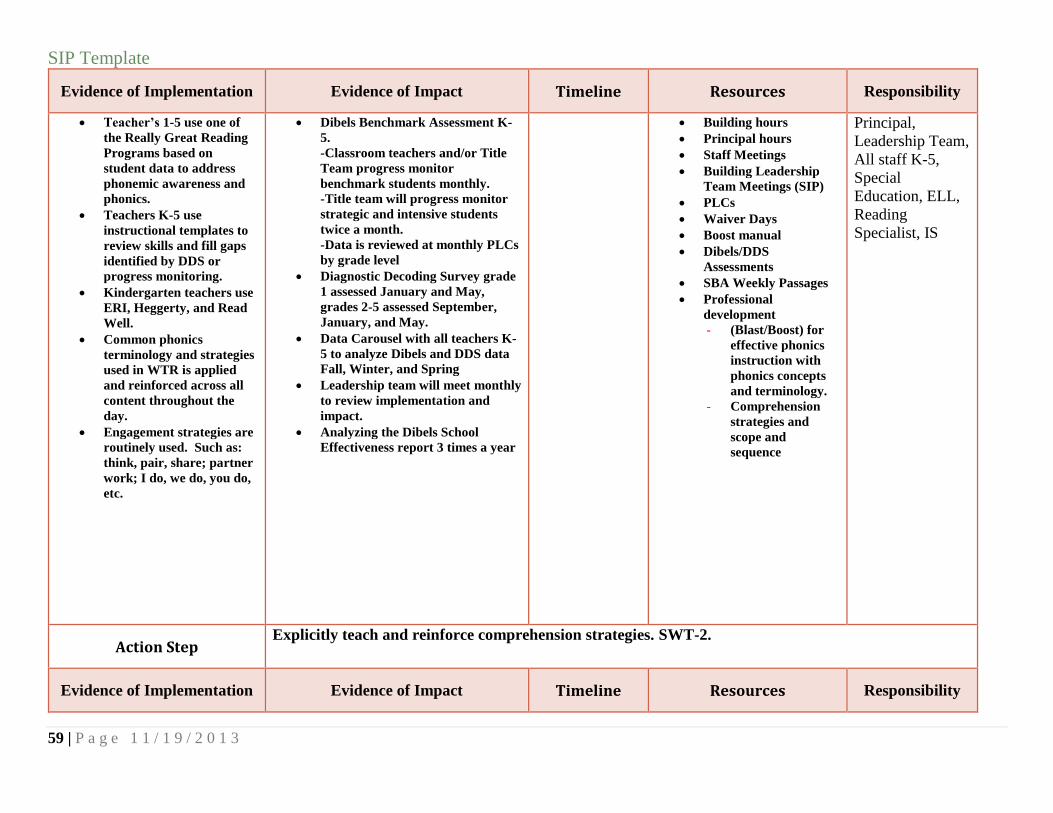
Evidence of Implementation Evidence of Impact Timeline Resources Responsibility
Teacher’s 1-5 use one of
the Really Great Reading
Programs based on
student data to address
phonemic awareness and
phonics.
Teachers K-5 use
instructional templates to
review skills and fill gaps
identified by DDS or
progress monitoring.
Kindergarten teachers use
ERI, Heggerty, and Read
Well.
Common phonics
terminology and strategies
used in WTR is applied
and reinforced across all
content throughout the
day.
Engagement strategies are
routinely used. Such as:
think, pair, share; partner
work; I do, we do, you do,
etc.
Dibels Benchmark Assessment K-
5.
-Classroom teachers and/or Title
Team progress monitor
benchmark students monthly.
-Title team will progress monitor
strategic and intensive students
twice a month.
-Data is reviewed at monthly PLCs
by grade level
Diagnostic Decoding Survey grade
1 assessed January and May,
grades 2-5 assessed September,
January, and May.
Data Carousel with all teachers K-
5 to analyze Dibels and DDS data
Fall, Winter, and Spring
Leadership team will meet monthly
to review implementation and
impact.
Analyzing the Dibels School
Effectiveness report 3 times a year
Building hours
Principal hours
Staff Meetings
Building Leadership
Team Meetings (SIP)
PLCs
Waiver Days
Boost manual
Dibels/DDS
Assessments
SBA Weekly Passages
Professional
development
- (Blast/Boost) for
effective phonics
instruction with
phonics concepts
and terminology.
- Comprehension
strategies and
scope and
sequence
Principal,
Leadership Team,
All staff K-5,
Special
Education, ELL,
Reading
Specialist, IS
Action Step Explicitly teach and reinforce comprehension strategies. SWT-2.
Evidence of Implementation Evidence of Impact Timeline Resources Responsibility

SIP Template
60 | P a g e 1 1 / 1 9 / 2 0 1 3
Grade level teams will
intentionally and
systematically use the
scaffolding tools and
teaching strategies to
enhance comprehension
instruction, ie anchor
charts, close reading,
visuals, graphic
organizers, etc.
Student performance on SBA
Weekly passages grades 2-5
ELA embedded assessments
MAP Data analyzed fall, winter,
spring at grades 3-5
K performance on oral
comprehension; ie: sequencing,
predict, retell
Leadership team will meet to
review schoolwide data
Building hours
Principal hours
Staff Meetings
PLCs
Building Leadership
Team Meetings
Waiver Days
Professional
development
- Comprehension
strategies and
scope and
sequence
- Close reading
Chart Sense
Principal,
Leadership Team,
All staff K-5,
Special
Education, ELL,
Reading
Specialist, IS

SIP Template
61 | P a g e 1 1 / 1 9 / 2 0 1 3
SMART Goal 2
Subject Area: Math
School Name: Washington Elementary
Target Population- based on
demographic, discipline and attendance
data analysis:
ALL
Our Reality-based on assessment
data analysis:
Three Year MSP/SBA Trend: Math
2013-MSP 2014-MSP 2015-SBA
3rd 65.2% 70% 55.7%
4th 65.1% 61.2% 65.2%
5th 60.8% 63.2% 29%
Our SMART Goal-based on
target population and your reality:
The percent of students at each grade level meeting standard will increase by at least 6% each year
from spring 2015 to spring 2019 as measured by the State assessment in MATH for Grades 3, 4, and 5.
Scores will increase from 55.7% to 73.7% in 3rd grade, 65.2% to 83.2% in 4th grade, and 29% to 47% in
5th grade.
Action Plan
Action Step Increase student math fact fluency in all grades. SWT-2
Evidence of Implementation Evidence of Impact Timeline Resources Responsibility
Math facts will be explicitly
taught by classroom teachers 1-5.
Daily math fact fluency practice.
Students will set personal fluency
goals.
Monthly fact fluency
assessments
Building hours
Principal hours
Staff Meetings
PLCs
Waiver Days
Kim Sutton
Engage NY
Principal,
Leadership Team,
All staff K-5,
Special Education,
ELL, Reading
Specialist, IS
SIP Template
62 | P a g e 1 1 / 1 9 / 2 0 1 3
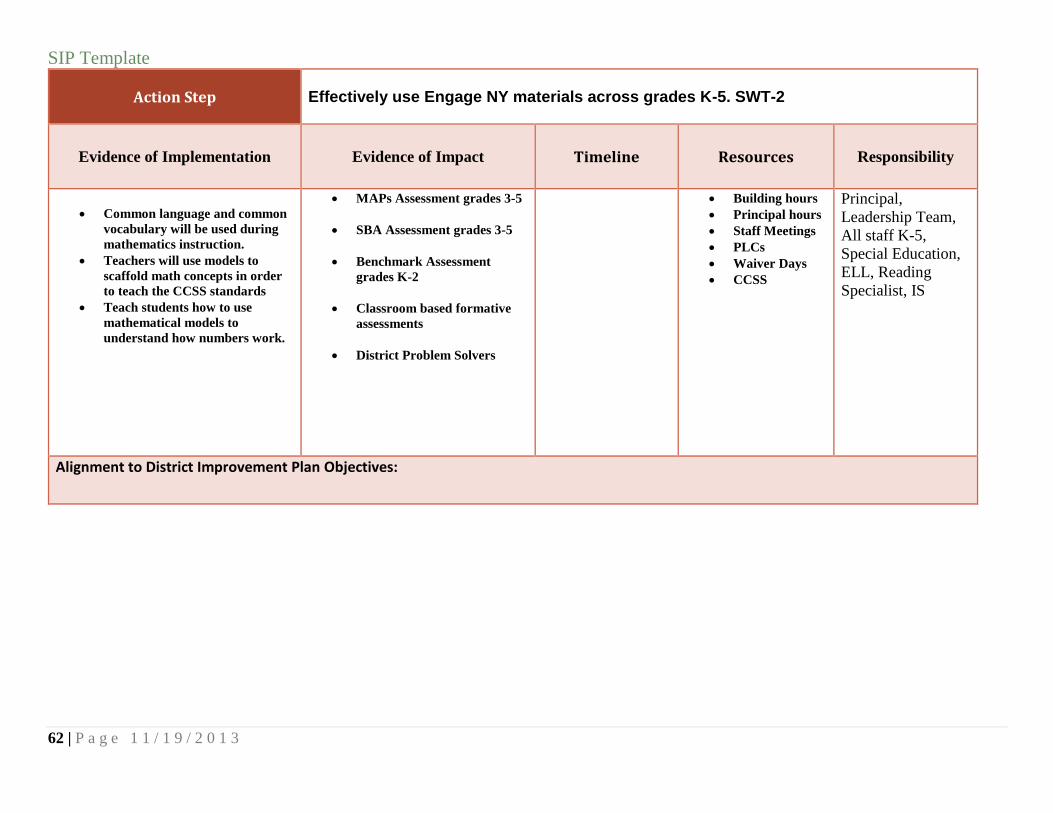
Action Step Effectively use Engage NY materials across grades K-5. SWT-2
Evidence of Implementation Evidence of Impact Timeline Resources Responsibility
Common language and common
vocabulary will be used during
mathematics instruction.
Teachers will use models to
scaffold math concepts in order
to teach the CCSS standards
Teach students how to use
mathematical models to
understand how numbers work.
MAPs Assessment grades 3-5
SBA Assessment grades 3-5
Benchmark Assessment
grades K-2
Classroom based formative
assessments
District Problem Solvers
Building hours
Principal hours
Staff Meetings
PLCs
Waiver Days
CCSS
Principal,
Leadership Team,
All staff K-5,
Special Education,
ELL, Reading
Specialist, IS
Alignment to District Improvement Plan Objectives:
SIP Template
63 | P a g e 1 1 / 1 9 / 2 0 1 3
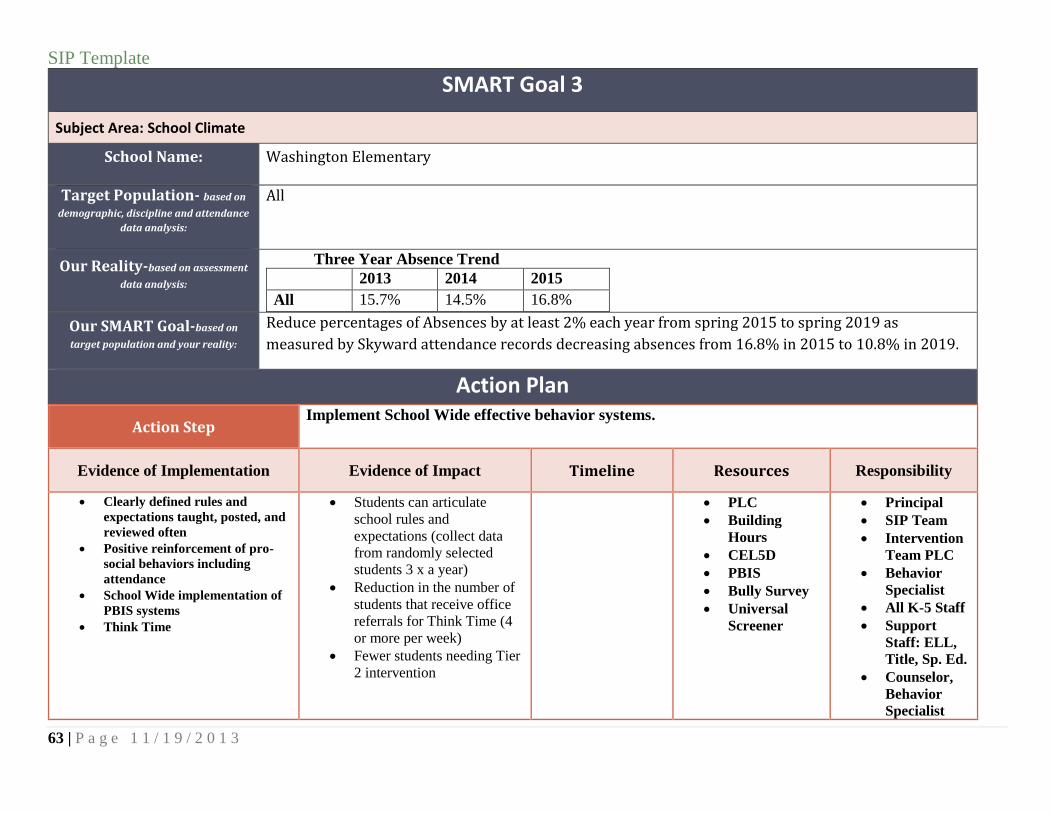
SMART Goal 3
Subject Area: School Climate
School Name: Washington Elementary
Target Population- based on
demographic, discipline and attendance
data analysis:
All
Our Reality-based on assessment
data analysis:
Three Year Absence Trend
2013 2014 2015
All 15.7% 14.5% 16.8%
Our SMART Goal-based on
target population and your reality:
Reduce percentages of Absences by at least 2% each year from spring 2015 to spring 2019 as
measured by Skyward attendance records decreasing absences from 16.8% in 2015 to 10.8% in 2019.
Action Plan
Action Step Implement School Wide effective behavior systems.
Evidence of Implementation Evidence of Impact Timeline Resources Responsibility
Clearly defined rules and
expectations taught, posted, and
reviewed often
Positive reinforcement of pro-
social behaviors including
attendance
School Wide implementation of
PBIS systems
Think Time
Students can articulate
school rules and
expectations (collect data
from randomly selected
students 3 x a year)
Reduction in the number of
students that receive office
referrals for Think Time (4
or more per week)
Fewer students needing Tier
2 intervention
PLC
Building
Hours
CEL5D
PBIS
Bully Survey
Universal
Screener
Principal
SIP Team
Intervention
Team PLC
Behavior
Specialist
All K-5 Staff
Support
Staff: ELL,
Title, Sp. Ed.
Counselor,
Behavior
Specialist

SIP Template
64 | P a g e 1 1 / 1 9 / 2 0 1 3
Reduction in the number of
students being bullied
(yearly bullying survey)
Fewer Absences
Fewer Tardies
-Reviewed 3 times a year by
SIP Team
-Reviewed 2 times a year by
whole staff
Action Step Implement school wide Social Emotional Learning curriculum.
Evidence of Implementation Evidence of Impact Timeline Resources Responsibility
Staff will reinforce Social
Emotional Learning skills:
Vocabulary and visuals
Targeted small group SEL
instruction
Weekly SEL lessons K-5
- Reduction in the number of
students that receive office
referrals for Think Time (4
or more per week)
- Fewer students needing Tier
2 intervention (Universal
Screener)
Fall 2016 PLC
Building
Hours
CEL5D
Universal
Screener
Professional
Development:
-Zones of Regulation
-Steps to Respect
-Social Thinking
-Kelso’s Choices
Principal
SIP Team
Intervention
Team PLC
Behavior
Specialist
All K-5
Staff
including
Specialists
SIP Template
65 | P a g e 1 1 / 1 9 / 2 0 1 3
Alignment to District Improvement Plan Objectives:
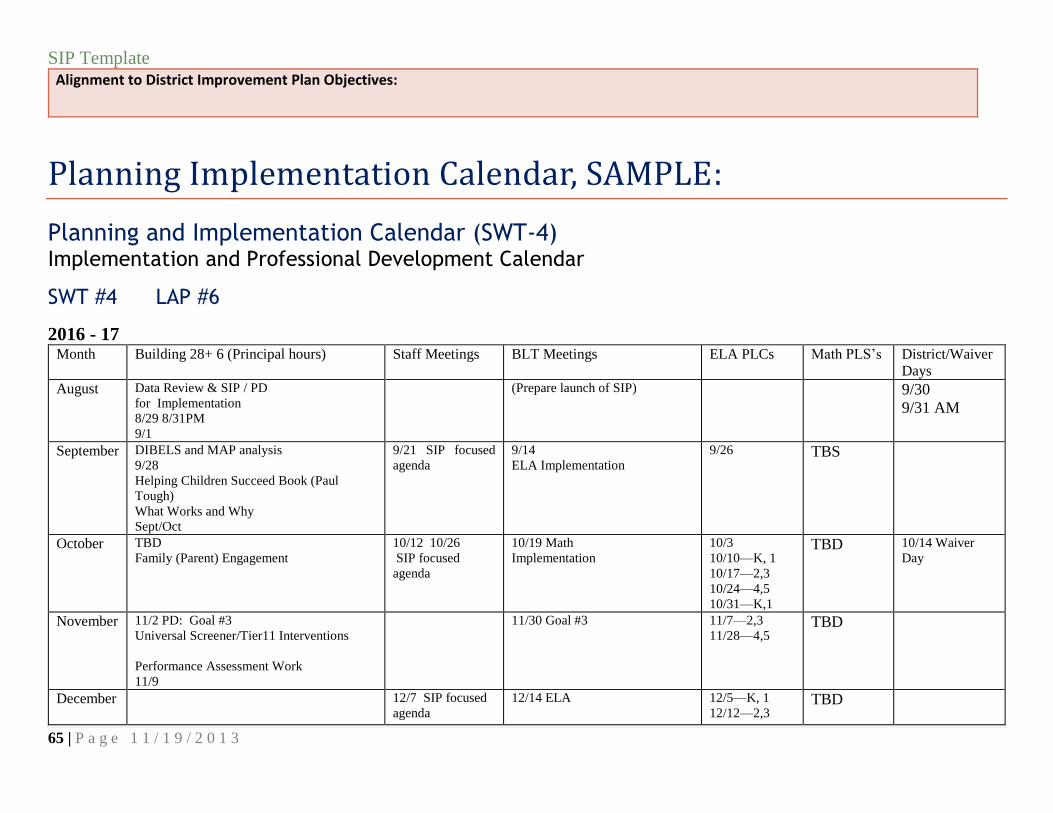
Planning Implementation Calendar, SAMPLE:
Planning and Implementation Calendar (SWT-4) Implementation and Professional Development Calendar
SWT #4 LAP #6
2016 - 17
Month Building 28+ 6 (Principal hours) Staff Meetings BLT Meetings ELA PLCs Math PLS’s District/Waiver Days
August Data Review & SIP / PD
for Implementation
8/29 8/31PM
9/1
(Prepare launch of SIP)
9/30
9/31 AM
September DIBELS and MAP analysis
9/28
Helping Children Succeed Book (Paul
Tough)
What Works and Why
Sept/Oct
9/21 SIP focused
agenda 9/14 ELA Implementation
9/26 TBS
October TBD
Family (Parent) Engagement 10/12 10/26
SIP focused
agenda
10/19 Math Implementation
10/3 10/10—K, 1 10/17—2,3 10/24—4,5 10/31—K,1
TBD 10/14 Waiver
Day
November 11/2 PD: Goal #3
Universal Screener/Tier11 Interventions
Performance Assessment Work
11/9
11/30 Goal #3 11/7—2,3 11/28—4,5
TBD
December 12/7 SIP focused
agenda 12/14 ELA 12/5—K, 1
12/12—2,3 TBD

SIP Template
66 | P a g e 1 1 / 1 9 / 2 0 1 3
January 1/18 SIP focused
agenda 1/11 Goal 3 1/25 Math
1/9—reading
team 1/23—4,5 1/30—K, 1
TBD
February DIBELS AND MAP analysis
2/8
Universal Screener Data Review
2/14
2/8 SIP focused
agenda 2/15 ELA
2/6—2,3 2/13—4,5 2/27—8:40 K,1
TBD
March Performance Assessment Work
3/1
TBD Family (Parent Engagement)
3/8 SIP focused
agenda 3/15 Goal 3 3/29 ELA
3/13—2,3 3/20—4,5 3/17—K,1
TBD 3-6 Waiver Day
April
4/19 SIP focused agenda
4/5 Math 4/26 ELA
4/3—2,3
4/1—reading
team 4/24—4,5
TBD
May (DIBELS and MAP analysis) 5/17
5/10 SIP focused
agenda 5/3 Goal 3 5/17 Math
5/1—K, 1 5/15—2,3 5/22—4,5
TBD 5/8 Waiver Day
June 6/15 Staff reflection on Y1 of
Implementation and plan for Y2 6/7 Prepare to Facilitate
Reflection on Y1 of
Implementation and plan for Y2
SIP Template
67 | P a g e 1 1 / 1 9 / 2 0 1 3
Budget - SWT# 10 Insert budget page here
Related Documents