PhD in Educational Effectiveness School Effectiveness and Educational Evaluation in Greece ATHANASIOS VERDIS Thesis submitted for the Degree of Doctor of Philosophy at the University of London, Institute of Education 2002

Welcome message from author
This document is posted to help you gain knowledge. Please leave a comment to let me know what you think about it! Share it to your friends and learn new things together.
Transcript

PhD in Educational Effectiveness
School Effectiveness and Educational Evaluation
in Greece
ATHANASIOS VERDIS
Thesis submitted for the Degree of Doctor of Philosophy
at the University of London, Institute of Education 2002
Abstract
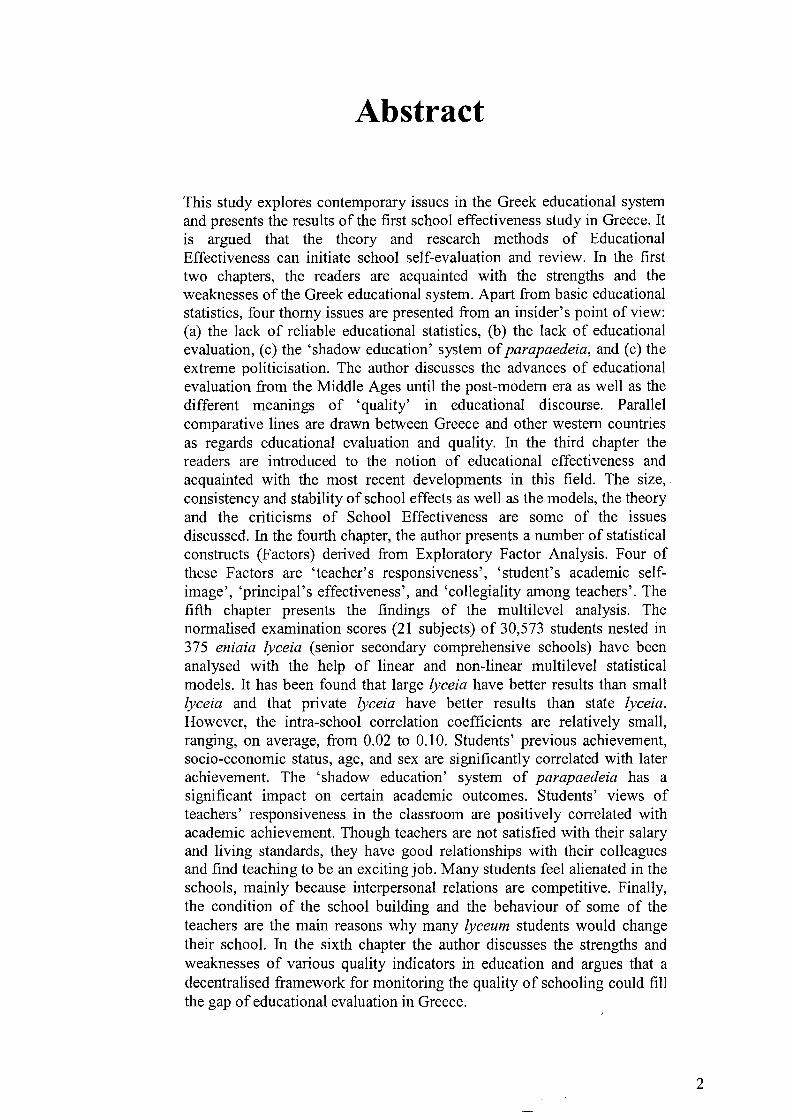
This study explores contemporary issues in the Greek educational system and presents the results of the first school effectiveness study in Greece. It is argued that the theory and research methods of Educational Effectiveness can initiate school self-evaluation and review. In the first two chapters, the readers are acquainted with the strengths and the weaknesses of the Greek educational system. Apart from basic educational statistics, four thorny issues are presented from an insider's point of view: (a) the lack of reliable educational statistics, (b) the lack of educational evaluation, (c) the 'shadow education' system of parapaedeia, and (c) the extreme politicisation. The author discusses the advances of educational evaluation from the Middle Ages until the post-modem era as well as the different meanings of 'quality' in educational discourse. Parallel comparative lines are drawn between Greece and other western countries as regards educational evaluation and quality. In the third chapter the readers are introduced to the notion of educational effectiveness and acquainted with the most recent developments in this field. The size, consistency and stability of school effects as well as the models, the theory and the criticisms of School Effectiveness are some of the issues discussed. In the fourth chapter, the author presents a number of statistical constructs (Factors) derived from Exploratory Factor Analysis. Four of these Factors are 'teacher's responsiveness', 'student's academic selfimage', 'principal's effectiveness', and 'collegiality among teachers'. The fifth chapter presents the findings of the multilevel analysis. The normalised examination scores (21 subjects) of 30,573 students nested in 375 eniaia lyceia (senior secondary comprehensive schools) have been analysed with the help of linear and non-linear multilevel statistical models. It has been found that large lyceia have better results than small lyceia and that private lyceia have better results than state lyceia. However, the intra-school correlation coefficients are relatively small, ranging, on average, from 0.02 to 0.10. Students' previous achievement, socio-economic status, age, and sex are significantly correlated with later achievement. The 'shadow education' system of parapaedeia has a significant impact on certain academic outcomes. Students' views of teachers' responsiveness in the classroom are positively correlated with academic achievement. Though teachers are not satisfied with their salary and living standards, they have good relationships with their colleagues and find teaching to be an exciting job. Many students feel alienated in the schools, mainly because interpersonal relations are competitive. Finally, the condition of the school building and the behaviour of some of the teachers are the main reasons why many lyceum students would change their school. In the sixth chapter the author discusses the strengths and weaknesses of various quality indicators in education and argues that a decentralised framework for monitoring the quality of schooling could fill the gap of educational evaluation in Greece.
2
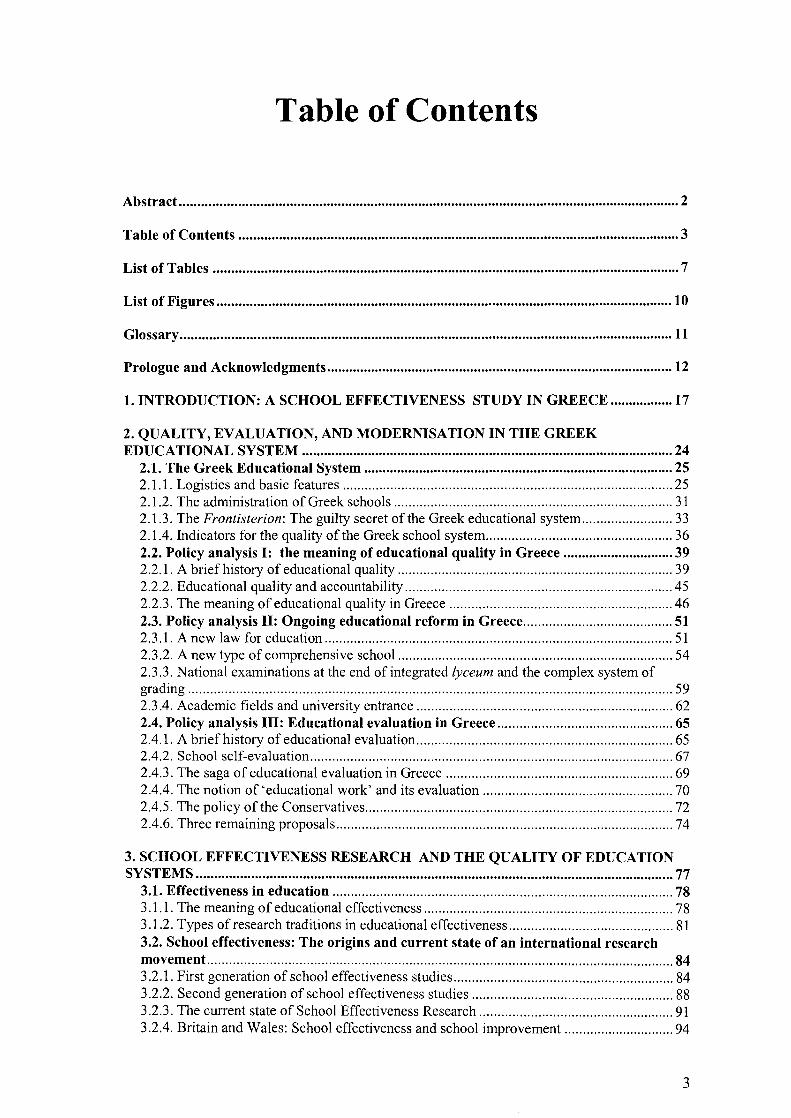
Table of Contents
Abstract ........................................................................................................................................ 2
Table of Contents ........................................................................................................................ 3
List of Tables ............................................................................................................................... 7
List of Figures ............................................................................................................................ 10
Glossary ...................................................................................................................................... 11
Prologue and Acknowledgments .............................................................................................. 12
1. INTRODUCTION: A SCHOOL EFFECTIVENESS STUDY IN GREECE ................. 17
2. QUALITY, EVALUATION, AND MODERNISATION IN THE GREEK EDUCATIONAL SYSTEM ..................................................................................................... 24
2.1. The Greek Educational System .................................................................................... 25 2.1.1. Logistics and basic features .......................................................................................... 25 2.1.2. The administration of Greek schools ............................................................................ 31 2.1.3. The Frontisterion: The guilty secret of the Greek educational system ......................... 33 2.1.4. Indicators for the quality of the Greek school system ................................................... 36 2.2. Policy analysis I: the meaning of educational quality in Greece .............................. 39 2.2.1. A brief history of educational quality ........................................................................... 39 2.2.2. Educational quality and accountability ......................................................................... 45 2.2.3. The meaning of educational quality in Greece ............................................................. 46 2.3. Policy analysis II: Ongoing educational reform in Greece ......................................... 51 2.3.1. A new law for education ............................................................................................... 51 2.3.2. A new type of comprehensive school ........................................................................... 54 2.3.3. National examinations at the end of integrated lyceum and the complex system of grading .................................................................................................................................... 59 2.3.4. Academic fields and university entrance ...................................................................... 62 2.4. Policy analysis III: Educational evaluation in Greece .. , ............................................. 65 2.4.1. A brief history of educational evaluation ...................................................................... 65 2.4.2. School self-evaluation ................................................................................................... 67 2.4.3. The saga of educational evaluation in Greece .............................................................. 69 2.4.4. The notion of 'educational work' and its evaluation .................................................... 70 2.4.5. The policy of the Conservatives .................................................................................... 72 2.4.6. Three remaining proposals ............................................................................................ 74
3. SCHOOL EFFECTIVENESS RESEARCH AND THE QUALITY OF EDUCATION SySTEMS .................................................................................................................................. 77
3.1. Effectiveness in education ...................................................... ....................................... 78 3.1.1. The meaning of educational effectiveness .................................................................... 78 3.1.2. Types of research traditions in educational effectiveness ............................................. 81 3.2. School effectiveness: The origins and current state of an international research movement .................................................................................................... ........................... 84 3.2.1. First generation of school effectiveness studies ............................................................ 84 3.2.2. Second generation of school effectiveness studies ....................................................... 88 3.2.3. The current state of School Effectiveness Research ..................................................... 91 3.2.4. Britain and Wales: School effectiveness and school improvement .............................. 94
3
3.2.5. Reviews of five illustrative school effectiveness studies .............................................. 98 3.2.6. Some findings from PISA 2000 .................................................................................. 104 3.3. Criticism of School Effectiveness ................................................................................ 109 3.3.1. Political criticism ........................................................................................................ 109 3.3.2. Epistemological and methodological criticism ........................................................... 113 3.3.3. Internal criticism ......................................................................................................... 117 3.4. Effective school conditions .......................................................................................... 120 3.4.1. Lists of effective school conditions ............................................................................ 120 3.4.2. Summary of review studies ......................................................................................... 124 3.5. Modelling School Effectiveness ................................................................................... 128 3.5.1. Alternative school effectiveness models ..................................................................... 135 3.6. Size, consistency, and stability of school effects ........................................................ 142 3.6.1. The size and structure of the school effect .................................................................. 142 3.6.2. Consistency and stability of the school effecL. .......................................................... 148 3.6.3. Stability of school effects over time .......................................................................... 151 3.7. Conditions of school effectiveness ............................................................................... 154 3.7.1. Effectiveness enhancing conditions at organisational level.. ...................................... 155 3.7.2. School size as a factor in effectiveness ....................................................................... 164 3.7.3. Private schools versus state schools ............................................................................ 167 3.7.4. Conclusions ................................................................................................................. 168
4. DESIGNING THE FIRST SCHOOL EFFECTIVENESS STUDY IN GREECE ........ 169 4.1. Some notes on philosophy: Reclaiming reality in educational research ................. 170 4.2. Measuring School Effectiveness .................................................................................. 176 4.2.1. Research models of school effectiveness .................................................................... 176 4.2.2. Characteristics of a good school effectiveness study .................................................. 178 4.3. The design of the current study .................................................................................. 181 4.3.1. Variables, phases, and research questions .................................................................. 181 4.3.2. Findings of the pilot study .......................................................................................... 183 4.3.3. Students' previous achievement and social background ............................................. 186 4.3.4. One population - four samples ................................................................................... 189 4.3.5. The interpretation of academic outcomes ................................................................... 196 4.3.6. Transformation of the original examination scores .................................................... 197 4.3.7. The meaning of affective outcomes and school processes .......................................... 201 4.4. Multilevel Statistical Models ....................................................................................... 216 4.4.1. The Generalised Linear Model and its notation .......................................................... 216 4.4.2. The logic of hierarchical linear models ....................................................................... 217 4.4.3. More complex hierarchical models ............................................................................. 219 4.4.4. Multivariate hierarchical models ................................................................................ 221 4.4.5. Non-linear hierarchical models ................................................................................... 223 4.4.6. Conclusions ................................................................................................................. 226
5. FINDINGS: EXPLORING VARIABLES IN SCHOOL EFFECTS IN RELATION TO STUDENTS' ACADEMIC AND AFFECTIVE OUTCOMES ........................................... 228
5.1. Descriptive statistics ..................................................................................................... 229 5.1.1. Introduction ................................................................................................................. 229 5.1.2. Student age .................................................................................................................. 229 5.1.3. Directions of studies ................................................................................................... 231 5.1.4. Student gender ............................................................................................................ 231 5.1.5. Student mobility .......................................................................................................... 233 5.1.6. Student socio-economic status .................................................................................... 234 5.1.7. Frontisteria and private tuition ................................................................................... 236 5.1.8. Accommodation .......................................................................................................... 237 5.1.9. Computer at home ....................................................................................................... 238 5.1.10. Socio-economic status,parapaedeia and access to computer .................................. 239 5.1.11. Commuting to school ................................................................................................ 242 5.1.12. Academic outcomes: Overproduction of 'excellent' students .................................. 243
4
5.1.13. Affective outcomes ................................................................................................... 245 5.1.14. School organisational climate and processes ............................................................ 247 5.1.15. School size ................................................................................................................ 250 5.2. Answering the first research question: The size and structure of the school effect in the Greek lyceia ................................................................................................................... 251 5.2.1. Introduction ................................................................................................................. 251 5.2.2. Variance components models for the population ........................................................ 252 5.2.3. Explaining educational achievement in the population .............................................. 254 5.204. Graphic representation of school means ..................................................................... 258 5.2.5. Controlling for previous achievement.. ....................................................................... 259 5.2.6. Exploring the 'school year effect' ............................................................................... 262 5.2.7. Modelling success with non-linear multilevel models ................................................ 266 5.2.8. More measures of social background .......................................................................... 268 5.2.9. Conclusions ................................................................................................................. 276 5.3. Answering the second research question: Modelling school effects in the social domain .................................................................................................................................. 279 5.3.1. New codes for student responses ................................................................................ 279 5.3.2. Hierarchical logistic models ....................................................................................... 280 5.3.3. Conclusions ................................................................................................................. 282 5.4. Answering the third research question: Consistency of school effects .................... 283 504.1. School effects across different academic outcomes .................................................... 283 504.2. Value-added multivariate multilevel model for the population .................................. 284 504.3. Multivariate multilevel models for Sample B ............................................................. 288 5.5. Answering the fourth research question: Academic achievement and teachers' responsiveness ..................................................................................................................... 292 5.5.1. Academic achievement and school processes ............................................................. 292 5.5.2. Academic achievement and teacher responsiveness ................................................... 292 5.6. Conclusions ................................................................................................................... 297
6. DISCUSSION: EVALUATING EDUCATIONAL WORK IN GREEK LYCEIA USING SETS OF INDICATORS ........................................................................................................ 301
6.1. Four questions about the future of educational evaluation in Greece .................... 302 6.1.1. Will the myth of 'educational work' ever be dispelled? ............................................. 302 6.1.2. Will a 'curriculum for self-evaluation' ever be written? ............................................ 304 6.1.3. Will there be a new law for educational evaluation in Greece? .................................. 306 6.1.4. What will be the role of the Greek quality newspapers? ............................................ 307 6.2. A model for the effectiveness of the Greek integrated lyceum ................................. 310 6.3. Quality indicators in education ................................................................................... 315 6.3.1. The complexity of educational systems ...................................................................... 315 6.3.2. The meaning of indicators in education ...................................................................... 316 6.3.3. Examination results as indicators ................................................................................ 319 6.304. Current researcher's proposals .................................................................................... 323 6.4. Epilogue ........................................................................................................................ 327
References ................................................................................................................................ 330
7. Appendixes ........................................................................................................................... 351 7.1. Chapters 2 and 3 .......................................................................................................... 352 7.1.1. Educational levels ....................................................................................................... 352 7.1.2. Points for university entrance (June 2001) ................................................................. 352 7.2. Chapters 4 and 5 .......................................................................................................... 353 7.2.1. Factors identified in the pilot study ............................................................................. 353 7.2.2. The formula for Cronbach's alpha coefficient ........................................................... 355 7.2.3. The formula for direct oblimin .................................................................................... 356 7.204. The formula for the I statistic .................................................................................... 356 7.2.5. The Measure of Sampling Adequacy (MSA) in Factor Analysis ............................... 356 7.2.6. The regression method for scales construction in Factor Analysis ............................. 357
5
7.2.7. Adjusted residuals in chi square test.. ......................................................................... 357 7.2.8. Bayesian estimates in multilevel modelling ................................................................ 357 7.3. The questionnaires ....................................................................................................... 359 7.3.1. Student questionnaire 2000 ......................................................................................... 359 7.3.2. Teacher questionnaire 2000 ........................................................................................ 371 7.3.3. Student questionnaire 1999 (pilot work) ..................................................................... 376 7.3.4. Teacher questionnaire 1999 (pilot work) .................................................................... 388
6

List of Tables Table 2-1. The structure of the Greek school system after the 1998 educational reform ......... 26 Table 2-2. Percentages for the educational attainment of the Greek population ...................... 28 Table 2-3. Educational attainment of the Greek population by gender and age group ............. 28 Table 2---4.Total public expenditure on education as a percentage of total public expenditure. 29 Table 2-5. Expenditure per student (1998) in US dollars ......................................................... 29 Table 2-6. The Greek system ofparapaedeia (shadow education) .......................................... 34 Table 2-7. Some results from PISA 2000 for the Greek students ............................................. 38 Table 2-8. The OECD schooling scenarios .............................................................................. 44 Table 2-9 Subjects in the first year of integrated lyceum . ........................................................ 56 Table 2-10. The syllabus of the second year of integrated lyceum ........................................... 57 Table 2-11. The syllabus of the third year of integrated lyceum . ............................................. 58 Table 2-12. Subjects examined nationally in the second year of lyceum . ................................ 59 Table 2-13. Subjects examined nationally in the third year of lyceum ..................................... 59 Table 2-14. Points for university entrance (June 2000) ............................................................ 63 Table 2-15. The different origins of school self-evaluation
(from Bosker & Scheerens, 1995: 155) .............................................................................. 68
Table 3-1. Some research projects in the United Kingdom (based on Stoll & Riley, 1999: 23-24) ................................................................................ 96
Table 3-2. Percentage of variance in student progress accounted for by among-classes and between schools differences in the Victorian Quality of School Project ................... 100
Table 3-3. Between school and within school variation in student performance on reading literacy scale (from OECD, 2001: 257) ............................................................................ 106
Table 3---4. Effects of student-level and school-level factors on reading literacy (from OECD, 2001: 312) .................................................................................................. 107
Table 3-5. Effects of student-level and school-level factors on mathematics literacy (fromOECD, 2001: 312) .................................................................................................. 108
Table 3-6. Lists with educational and school effectiveness characteristics part I (from Scheerens, 1990, from OECD, 1991) ............................................................................... 122
Table 3-7. Lists with Educational and School Effectiveness characteristics part II (from Scheerens, 1990, from OECD, 1991) ............................................................................... 122
Table 3-8. Effectiveness-enhancing conditions of schooling in three review studies (from Scheerens & Bosker, 1997: 156) ...................................................................................... 123
Table 3-9. The degree to which the most important school and instruction characteristics relevant to effectiveness have been confirmed by empirical research (from Scheerens & Bosker, 1997: 212) ............................................................................ 125
Table 3-10. Review of the evidence from qualitative reviews, international studies and research syntheses that are supported to enhance school effectiveness (from Scheerens & Bosker, 1997: 305) ............................................................................ 126
Table 3-11. The characteristics of the 168 studies analysed by Scheerens & Bosker (1997).144 Table 3-12. Results from the meta-analysis on gross and net school effects (from Scheerens
and Bosker, 1997) ............................................................................................................. 145 Table 3-13. Class and school level effects in nine countries,
adjusted for father's occupation ....................................................................................... 147 Table 3-14. Sources of variance in English and Mathematics
in the Victorian Quality School Project ............................................... ............................. 147 Table 3-15. Consistency across subjects in secondary education
(cited in Scheerens & Bosker, 1997: 90) .......................................................................... 150 Table 3-16. Effects in achievement in percentages for black and white students in the Coleman
Report (from Scheerens & Bosker 1997) ......................................................................... 153 Table 3-17. Effectiveness-enhancing conditions .................................................................... 155
7

Table 3-18. Summary of variables identified as significant problems in various studies of teacher working conditions (from Corcoran 1990: 156) .................................................. 164
Table 3-19. School size and educational outcomes (review of selected studies from Fowler Jr, 1995) ........................................................... 166
Table 4-1. Basic beliefs of alternative inquiry paradigms (from Guba & Lincoln, 1998: 203) .................................................................................. 173
Table 4-2. Percentage of total and school level variance explained by three different value added models (from Sammons et al. 1997: 35) ................................................................ 178
Table 4-3. The pilot and the main phase of the current study ................................................ 182 Table 4-4. Constructing the Factor 'school status' from the answers ofthe
students in the pilot questionnaire .................................................................................... 183 Table 4-5. Regression coefficients and variance components for the perceived status of the
schoo1. ............................................................................................................................... 185 Table 4-6. The population of integrated Iyceia in Attiki and the population
of the students who participated in the leaving examinations of the year 2000 ............... 190 Table 4-7. The population and the four samples of the study ................................................. 193 Table 4-8. Boys and girls in the population and the three samples ........................................ 194 Table 4-9. The percentages of students in the three programmes of studies .......................... 194 Table 4-10. Students' year of birth in the three samples and the population .......................... 195 Table 4-11. The means and the standard deviations of seven subjects for the population and
the three samples .............................................................................................................. 195 Table 4-12. Descriptive statistics of the distribution of students' scores in Chemistry .......... 199 Table 4-13. The structure of the students' questionnaire (1999 - 2000) ................................ 202 Table 4-14. The structure of the teachers' questionnaire (1999-2000) ................................... 202 Table 4-15. Some issues (Factors) derived from participants' responses ............................... 204 Table 4-16. Pattern matrix of Factors derived from student questionnaire ............................ 208 Table 4-17. Correlation matrix of students' Factors ............................................................... 208 Table 4-18. Pattern matrix of Factors derived from teacher questionnaire ............................ 209 Table 4-19. Correlation matrix of teachers' Factors ............................................................... 209
Table 5-1. Students' year of birth (percentages) .................................................................... 230 Table 5-2. Percentages of the students in the three Directions of studies ............................... 231 Table 5-3. Participation of boys and girls in the three Directions (375 schools) .................... 232 Table 5-4. Father's and mother's occupation (Sample B) ...................................................... 234 Table 5-5. Father's and mother's educational level (Sample B) ............................................ 236 Table 5-6. Frontisterion and private tuition ........................................................................... 237 Table 5-7. Students' accommodation (Sample B) .................................................................. 238 Table 5-8.Father's occupation by parapaedeia and access to computer. ............................... 240 Table 5-9. Mother's educational level by parapaedeia and computer. .................................. 241 Table 5-10. Descriptive statistics for 27 examined subjects (375 schools) ............................ 243 Table 5-11. Descriptive statistics of students' answers (Sample C) ....................................... 246 Table 5-12. Reasons for changing school ifit was allowed (Sample C) ................................ 247 Table 5-13. Descriptive statistics of teachers' answers (Sample D) ....................................... 248 Table 5-14. The number of students of each school who participated in the examinations of
2000 .................................................................................................................................. 250 Table 5-15. Variance components Model pO (N=375 schools) .............................................. 253 Table 5-16. Fixed coefficients and random parts of the 'personal characteristics
and contextual Model' pAB (N=375 schools) .................................................................... 255
Table 5-17. Model P~ear (375 schools) ................................................................................... 261
Table 5-18. Contextual and previous achievement Model P~r for the population ............... 263
Table 5-19. Hierarchical logistic regression coefficients for success in obtaining certificate of
integrated lyceum (Model Pb~:)' ...................................................................................... 267
Table 5-20. Model BO : Variance components model for Sample B. ..................................... 269
8
Table 5-21. Fixed and random parts for linear models with more personal student characteristics (Model BA) ................................................................................................ 271
Table 5-22. The 39 schools of Sample B ranked according to Bayesian estimates of their average students' achievement. ........................................................................................ 275
Table 5-23. Students' responses in four selected areas (Sample C) ....................................... 280
Table 5-24. Coefficients and error terms for Model C~in' ..................................................... 280
Table 5-25. Comparing observed probability with probability estimated from Model C~in' 281
Table 5-26. Social outcomes (Model C~n)' ........................................................................... 282
Table 5-27. Value added multivariate multilevel Model p~:ar ............................................... 285
Table 5-28. Residual between school covariance (375 schools) ............................................ 287 Table 5-29. Residual within school covariance (375 schools) ............................................... 287
Table 5-30. Coefficients for the multivariate multilevel Model B~v .................................... 289
Table 5-31. Residual between school covariance (39 schools) .............................................. 290 Table 5-32. Residual within school covariance (39 schools) ................................................. 291
Table 5-33. Fixed coefficients and random part of value added Model C~ear (33 schools) ... 294
Table 6-1. GCSE examination indicators used by four quality daily newspapers in the United Kingdom in 1998 (from West & Pennell, 2000) ........................................ 308
Table 6-2. The four OECD networks for educational indicators (from Fitz-Gibbon & Kochan, 2000: 270) ........................................................................ 317
Table 6-3. The two roles of public examinations ................................................................... 321 Table 6--4. Public examinations and national assessments ..................................................... 322
9

List of Figures
Figure 2-1. The organisational structure ofthe Greek educational system ................................. 33
Figure 3-1. Contextual effects and school organisational effects on student achievement. ...... 119 Figure 3-2. Essential ingredients of effective schooling ........................................................... 127 Figure 3-3. Sammons' et al. (1997) secondary school academic effectiveness model ............. 131 Figure 3-4. Scheerens' integrated model of school effectiveness ............................................. 132 Figure 3-5. Creemers' model of schoolleaming ....................................................................... 133 Figure 3-6. Basic model of educational effectiveness: Consistency of effective characteristics
and components ................................................................................................................ 134 Figure 3-7. The additive model (from Scheerens & Bosker, 1997, p. 61) ................................ 135 Figure 3-8. The interaction model (from Scheerens & Bosker, 1997, p. 62) ............................ 136 Figure 3-9. Contextual and genuine school effects (from Scheerens & Bosker, 1997, p. 63) .. 137 Figure 3-10. The indirect model (from Scheerens & Bosker, 1997, p. 64) ............................... 138 Figure 3-11. The synergetic model (from Scheerens & Bosker, 1997, p. 65) ........................... 139 Figure 3-12. The recursive model (from Scheerens & Bosker, 1997, p. 66) ............................ 140 Figure 3-13. Change in school effects over time ...................................................................... 151 Figure 3-14. Dimensions ofthe school effect. .......................................................................... 152 Figure 3-15. A path analytic model of organisational culture and school outcomes
(from Heck & Marcoulides, 1996: 88) ............................................................................. 160
Figure 4-1. Sets of explanatory and response variables in the current thesis ............................ 186 Figure 4-2. Map of Greece with the prefecture of Attiki in grey .............................................. 192 Figure 4-3. Histogram showing the distribution of students' grades in Chemistry ................. 199 Figure 4-4. Students' Factors 1,2 and 3 as axes in rotated space ............................................. 212
Figure 5-1. Bayesian estimates for the mean student achievement in lyceum certificate with comparative confidence intervals at the 5% significance level (Model pAB) ................... 258
Figure 5-2. 'Mean grade in year 3' against 'mean grade in year 2' ......................................... 262 Figure 5-3. Total variable at school level as a function of mean grade in year 2 ...................... 265
Figure 6-1. A systemic approach to the effectiveness of Greek higher secondary schools ...... 311 Figure 6-2. A model for the effectiveness of the Greek lyceum, based on Scheerens' (1990)
'integrated model of school effectiveness' ....................................................................... 314
10
•
•
•
•
CER (Centre for Educational Research)
DOE (Didaskaliki Omospondia Ellados)
Direction of studIes
EPEAEK (Epiheirisiako Programma Ekpedefsis kai Arhikis Epagelmatikis Katartisis)
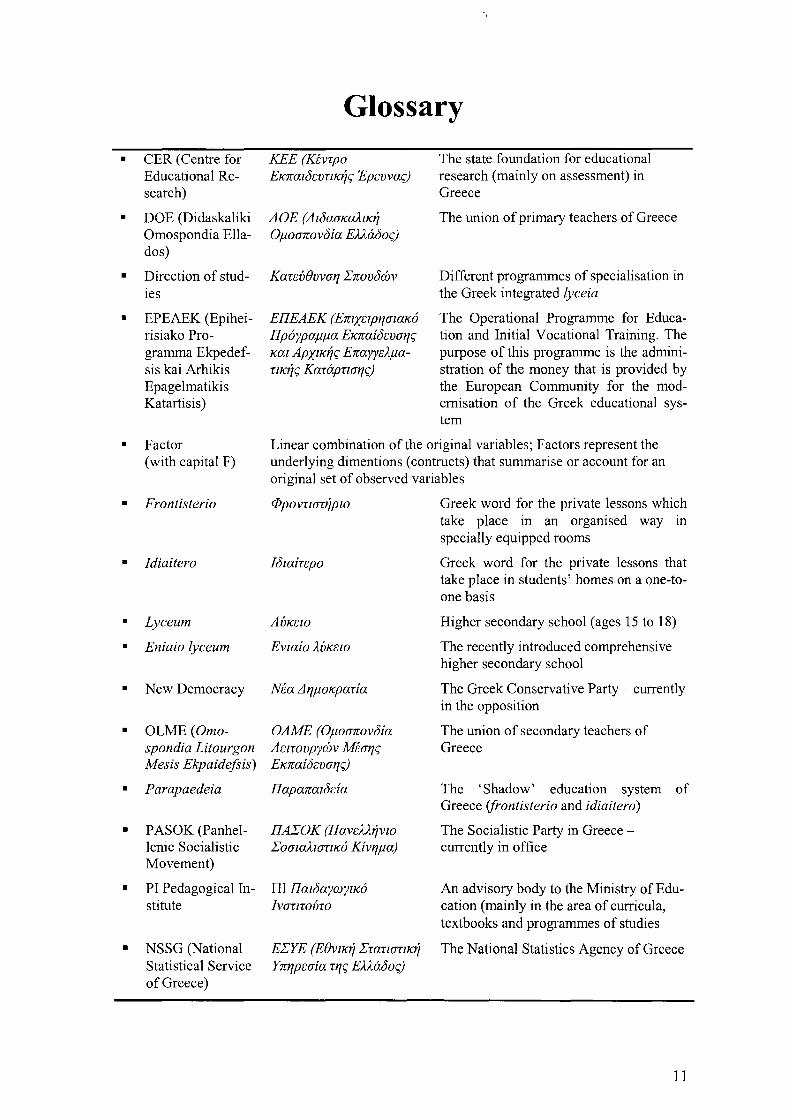
Glossary
KEE (Ktvrpo EKna[(5E:VnK~C; 'Epcvvac;)
LlOE (iJ1Ja(J1W.A1K~ OJ.1orJnovJia E).AaJoc;)
Karcv8vvrJ'I InovMJV
EilEAEK (E7rlXc1P'lrJzaKO Ilpoypaj.1j.1a EKnaiJeVfJ'IC; Kaz APX1K~C; EnayycApanK~C; KarapnrJ'IC;)
The state foundation for educational research (mainly on assessment) in Greece
The union of primary teachers of Greece
Different programmes of specialisation in the Greek integrated lyceia
The Operational Programme for Education and Initial Vocational Training. The purpose of this programme is the administration of the money that is provided by the European Community for the modernisation of the Greek educational system
• Factor Linear combination of the original variables; Factors represent the underlying dimentions (contructs) that summarise or account for an original set of observed variables
•
•
• •
•
(with capital F)
Frontisterio
Idiaitero
Lyceum
Eniaio lyceum
New Democracy
IJzaircpo
AVKclO
Evzaio J.,VKclO
Nta iJ'Ij.1oKparia
• OLME (Omo- OAME (OJ.1O(JnovJia
•
•
•
•
spondia Litourgon AclTOVPYWV MtrJ'IC; Mesis Ekpaidejsis) EKnaiJevrJ'IC;)
Parapaedeia
PASOK (Panhellenic Socialistic Movement)
PI Pedagogical Institute
NSSG (National Statistical Service of Greece)
IlapanazJeia
IlAIOK (Ilavc).A~vlO IOfJlaAUIT1KO Kiv'lj.1a)
ITI IlazJaywY1Ko IvmlTOVTO
EIYE (E8vlK~ ImnmlK~ Y7r1JpcrJia r'le; E).AaJoe;)
Greek word for the private lessons which take place III an organised way III
specially equipped rooms
Greek word for the private lessons that take place in students' homes on a one-toone basis
Higher secondary school (ages 15 to 18)
The recently introduced comprehensive higher secondary school
The Greek Conservative Party - currently in the opposition
The union of secondary teachers of Greece
The 'Shadow' education system of Greece (jrontisterio and idiaitero)
The Socialistic Party in Greece -currently in office
An advisory body to the Ministry of Education (mainly in the area of curricula, textbooks and programmes of studies
The National Statistics Agency of Greece
11
Prologue and Acknowledgments
When I open a book, whether it is a narrative or not, I do so to have the author speak to me. And since I am not yet either deaf or dumb, sometimes I even happen to answer him (Gerard Genette, 1990: 102).
(9 N MY 16TH BIRTHDAY I was a student at the 1 st General
Lyceum of Elefsina and I remember that I had visited my friend Michael Fotiadis at his house. Michael was a very
handsome boy and a natural-born basketball player. He also attended frontisterion after school and therefore he knew some topics in mathematics better than I did. Our mathematics teacher, Mr. Stavrides (not his real surname), was a brilliant mathematician but I always left his classes with many unanswered questions and many issues still unclear. It was not his fault though. How could he be expected to be effective with 33 students in a small class where the radiators were not working and the ceiling was trickling every time it rained? And how could students be expected to be motivated when the whole school building was shared between two schools? I remember that every second week I went to school in the evening instead of the morning because the students of the 2nd General Lyceum of Elefsina were having the 'morning shift'.
On the 1 st of February it was my birthday and with a little help from my friend, I managed to understand the topics that I had not understood in Mr. Stavrides' class. Then Michael and I talked about Larry Bird - the 'greatest American basketball player ever' - and listened to some ballads of Kostas Hatzis - a Greek singer and guitar player. I thanked Michael's mother for the home-made sour-cherry juice, said hello to my friend and rode my father's bicycle. On my way home I stopped for a while to watch the sea because the sun was setting through the white clouds and the colours of the evening were beautiful. Four columns of white thick smoke were coming from the chimneys of my hometown's cement company, the 'Titan'. The smoke was rising peacefully straight up in the air like the fingers of a prayer, only to be scattered violently the moment it touched the clouds. The weather was getting stormy and the sea was getting rough. If my parents could afford sending me to frontisterion, as Michael's parents did, I would have some chances of becoming an electrical engineer and leave my hometown.
It is very difficult to explain what a frontisterion is. Actually, one will have to read this thesis in order to find out. Put briefly, however, frontisterion is the Greek 'umbrella' word for the extra
12

lessons offered outside the nonnal school hours. It was a commonly known 'secret', for example, that our mathematics teacher offered private jrontisterion to groups of 3 to 5 students of his class just after his nonnal teaching hours in the school. My family could never have afforded these lessons. Some students were saying that Mr. Stavrides could be persuaded to offer a little extra 'push' to the grades of the students of his groups. These grades were of great importance for university entrance. Every body in the school knew Mr. Stavrides' private students. They knew that we knew. The nonnal hours in the school and the private hours in Mr Stavrides' after school 'lessons' were interlinked. However, nobody could do anything about it.
A few days after my 16th birthday, an earthquake of 6.6 points on the Richter scale hit the greater area of Athens. My school building was badly damaged. The officers of the local military airport were kind enough to put up large camouflaged tents for us in an open space near the school. These tents were now our new 'classrooms'. The students moved their chairs and desks under the tents while teachers moved the blackboards. Each blackboard was supported on two chairs. Under the tents, the teachers pretended to teach and we pretended to listen. In 1982, we were back at our school again and I did my best to revise for the final examinations. During the examination days I remember that there were police around the school. This was because national examinations needed to look reliable and fair. In the previous year the examination questions leaked to a number ofjrontisterion teachers. In 1982, I was wondering how in the world the police could possibly prevent a new leakage from within the system.
The final examinations in 1982 were not corrupted and one hot August morning I was listening to the radio in order to find out whether I would become an electrical engineer or not. The results of the national examinations were broadcast from the two existing national stations (in 1982 there were neither private stations nor laws for the protection of personal data). The fact that I am now writing this thesis indicates that I, like many others in my school, did not become an electrical engineer. The numerus clausus of the Greek universities, my cold class with the trickling ceiling, my teachers who secretly and unashamedly taught for money, and the fact that my school worked in two shifts are some of the excuses that I still make today in order to protect my hurt' ego'. Yes, I never became an electrical engineer but it was not my fault. Yes, I could have become an electrical engineer if I could afford to be better prepared for the examinations. At that time, I didn't know the exact meaning of the phrase 'equality of educational opportunity'. I knew, however, the meaning of the word 'unfair'.
In the first days of the year 2002 the world is very different from the date of my 16th birthday. The development of computers and the Internet, the breakthroughs in biology, the disintegration of the 'eastern world', the AIDS epidemic, and the terrorist attacks in the United States are some of the epoch-making facts that my friend Michael and I wouldn't even have imagined back in 1981. However -and this is quite disheartening - Greek school system has not overcome the problems that my friend and I experienced many years ago. Last week I read to the Ethnos newspaper about a number of 16-
l3
year-olds who took over their school because, as they said, 'heating is not adequate, the ceilings are trickling when it rains and the toilets are not being cleaned' (Triga & Nivolianitis, 2001). This situation is not unfamiliar. I looked at the faces of these students in the black and white photograph in the newspaper and I tried to understand their feelings. How do they feel when they go to school in the evening and not in the morning? How do they feel when they try to write on the blackboard wearing their gloves? Can their parents afford to pay for the frontisterion classes of today' s equivalent of Mr Stavrides? I could not answer all these questions but at least I was satisfied that I had done a lot in order to write about these problems in the pages of my thesis.
If one had the time to read the present thesis, he or she would learn many interest things about the problems of the Greek secondary schools. The reader would then share the idea of the current author: the theory and research methods of School Effectiveness Research can help in the case of educational evaluation. As it will argued later, there is no one with the task of monitoring the quality of the educational system in Greece. In the 'secret gardens' of the Greek educational system, there are neither 'standards' to be achieved nor inspections to be carried out. In addition, the collection of educational data is rather uninsightful and slow. The publication of educational statistics is something that takes place occasionally. Like a steamboat without a compass, the Greek school system tries to find its route in the middle of a large archipelago. In fact that is how Odysseas Elytis, a Greek Nobel Prize winner for literature, described modem Greece in one of his poems: the 'loony steamboat'.
* * * * *
Gerard Genette (1990), this prominent French theoretician in the area of narrative discourse, wants the author of a book to speak to him, regardless of this book being a narrative or not. Thus, the purpose of this prologue is to 'speak' to the readers in a more personal tone. From what has been already written, it is evident that the current thesis is based on a personal story. In fact, I believe that every thesis in the area of education is written by people who have something personal to say. In most cases, these people are teachers. I have read a number of doctorate dissertations and I bet that behind the standard academic expressions found in these theses (for example, 'more research is needed') lies the true heart of every author. Of course, there are successful PhD dissertations without this internal narration, as there are personal stories which will never find an open door to academia. Therefore, I think that I was lucky enough to be allowed to say what I wanted to say. Researchers are supposed not to know their findings in advance but when I started my research, I knew exactly what I wanted to find and where to find it. My supervisors and the other friends at the London Institute of Education helped me to tell my story in an academically acceptable way. In other words, they have transformed me from a storyteller to an academic writer. Very honestly, I would like to declare that I only tried to put my personal views on paper using mathematical models and plain English language. For the latter,
14
I must apologies to native speakers for my relatively poor command of this beautiful language. Thus, among the mathematical models that are presented in this work, the reader will probably find a personal plea among the lines. Let me give an example of this personal plea by quoting a paragraph from the sixth chapter of the current thesis.
The situation that was described in the previous paragraph has to change if Greece is ever to improve the quality of its educational system. If a 'second chance' is to be given to those secondary school students whose level of achievement in June is low, policy makers have to make sure that this 'chance' is being offered by the schools themselves and not by frontisteria. A 'second chance' that depends on the family's income is not a chance at all. In current author's opinion, such a policy deeply insults the image of the Greek educational system in the eyes of teachers, students and parents. After all, Greek people pay their taxes in order to enjoy an effective and just educational system. In the current study, some elementary statistical models showed that attendance at frontisteria raises the chances of success, especially in subjects where procedural and not declarative knowledge is being pursued (such as Mathematics and Science). Future research has to open the 'black box' of parapaedeia in Greece whereas future educational policy has to eliminate the parasite of parapaedeia forever.
* * * * *
There are many people to whom I am indebted for the writing of this thesis. Firstly, I owe a lot to Professor Pamela Sammons, my supervisor at the London Institute of Education for her guidance. A supervisor's work is not only to offer his or her experience and knowledge. The difficult part of his or her work is to harmonise a candidate's own abilities with the academic standards. Supervision is an art. It takes heart to do it and I am sure that Professor Pam Sammons has put some of her heart into my work. She believed in my thesis and, as I have told her in person, she gave me more than a student could expect from his supervisor. I should also not forget the contribution of Dr. Sally Thomas, now at Bristol University, who jointly supervised me at the London Institute of Education with Professor Pam Sammons in the first stages of this work. Ms Karen Elliot has also been a good friend. The door of her office was always open and it was a great experience to see a trained statistician like her produce the type of work which is still being regarded as avant garde in my country. Thanks are also due to the people at the London Institute of Education who offered courses in statistics and multilevel modelling.
I am also grateful to two Greek academics who though not involved in this study were for me a source of help. Associated Professor Nikos Andreadakis from the University of Crete was my teacher at Marasleion College in the field of Educational Research Methodology. Though our teacher-learner relationship has officially
15
ended I am lucky because he has remained my critical advisor and friend ever since. The most important thing that I have learned from him is that reading about educational research in the books is one thing; doing educational research in the real world is another thing. I am also grateful to Professor Elias Matsagouras from the University of Athens for taking me into his office at a time that I could not afford to continue my studies in London as a full time student. I learned a lot working with Professor Matsagouras because in my opinion he is one of the most prolific Greek authors in the field of didactics and - I must say - a fair person.
I must also thank the Greek State Scholarships Foundation (SSF) for providing the necessary funds for my studies in the United Kingdom. The people who work at the SSF do their best to give to those who cannot afford to study for a higher degree the chance to do so. I think that the next step for the people in the SSF is to change their regulation to allow students from poor families to study at Oxford and Cambridge. Professor Michael Vamvoukas, who was appointed by the SSF to act as my supervisor, is regarded as the Greek expert in the field of educational research methodology. His reports to the SSF regarding my progress were excellent. I am proud for having satisfied this 'difficult' but fair researcher. Thanks are also due to Dr Anastasia Kostaki from the Greek Pedagogical Institute and Mrs Anastasia Pashalidou from the Ministry of Education (Department of Secondary Schools Studies) for providing the necessary permission for school-based research. At the administrative level, thanks are also due to the head of my local educational authority Mr. Vasilios Koutas for allowing me to leave my teaching post during my studies.
I would like to thank one person as a representative of all the teachers who helped this study either by participating, or by voluntary help in the collection of the data. Mr. Paul Haramis, the secretary of the Centre of Studies and Documentation (KEMETE) within the Greek Secondary Teachers Union (OLME), presented my thesis to the heads of this powerful organisation. At a time when all teachers were very suspicious of the word 'evaluation', I was able to go to the schools and claim that my study had been approved by the Union. Special thanks are also due to Dr John Karanikas (a physicist and school consultant) and Mr. Kostas Arvanitakis (a physicist and PhD candidate) for their advice on secondary education.
I would like to close this prologue by thanking the people I value most. 'There are no victories in all our histories without love' are the lyrics of a song that I used to play in my study room and there are many people who provide love in my life. My wife Georgia, my daughter Katerina, my mother Katerina, my parents in law Argyro and George Markeas, and my brother Anastasios have always been near me both physically and mentally. My wife helped me a lot by listening to my ideas with a clear mind and giving her opinion. George Markeas, my father in law, helped me in the preparation of the questionnaires (printing, binding, and storing). Finally, I cannot find words enough to say how much I miss now my father, Nikos Verdis, who passed away one year ago. He never lost his sense of humour. This work is dedicated to him.
16

1 • INTRODUCTION: A SCHOOL EFFECTIVENcESS STUDY IN GREECE
"It is an exciting time to be involved in educational research" .
Tony Townsend (2001) Satan or saviour? An analysis of two decades of School Effectiveness Research. School Effectiveness and School Improvement (vol. 12, part 1, p. 115-129).
17
~ A T HILST IT WOULD BE UNREALISTIC TO CLAIM THAT THERE ARE NO OTHER
J' V works dealing with effective pedagogues in Greece, it would not be
umealistic to argue that the present work is essentially the first Greek
school effectiveness study. In other words, it is the first time that a Greek study
addresses to the international community of school effectiveness and improvement. As
it will be argued later in this work, there is nowadays an international community of
researchers who study effectiveness in education. These researchers see education
through certain epistemological lenses and recognise a number of factors which
influence the quality of educational systems. Most of these researchers use certain
methodological tools, meet at annual congresses for 'school effectiveness and school
improvement' and, although they may have different interests, are aware of their
common historical and theoretical roots. Within this lively international community,
there are many influential books, journals, and reports. From time to time, researchers
who belong to the school effectiveness and improvement community answer their
critics as there are books and articles which resist both the idea of educational
effectiveness and the methods by which this idea is developed. All these issues will be
discussed later in this volume. What is important to state here is that the present thesis
would be better understood from the perspective of those who are aware of the school
effectiveness and improvement knowledge base.
What is also important to stress in this introductory chapter is the reason for which the
current work has focused on the organisational effectiveness of the Greek higher
secondary school, the lyceum. The answer is that the present work hopes to contribute to
the evaluation of 'educational work' and the improvement of the Greek educational
18
system. In other words, this thesis will attempt to bring together 'effectiveness' and
'evaluation'. This combination is not uncommon. 'Effectiveness' is a broad term in
education. There are studies on 'effectiveness' which focus on equality of opportunities
and the significance of the school in this; the evaluation of compensatory programmes;
the effectiveness of teachers, classes and instruction procedures; the economic aspect of
education, and the educational production functions. All these aspects of effectiveness
will be discussed in the thesis.
The association between school effectiveness and educational evaluation is not difficult
to establish. Hill (1995) has argued that school effectiveness is concerned with
measuring the quality of schools and of understanding the characteristics of those
schools in which students make greater progress than would be expected from a
consideration of their intakes. If, however, we could measure the quality of the schools
or assess the extent to which they achieve their goals, as Hill (1995) suggests, we could
use this information in order to evaluate the different aspects and processes of
schooling. Moreover, if we could understand more about the characteristics of those
schools in which students make greater progress than would be expected from a
consideration of their intakes, we could design and evaluate our own policies and
interventions. If schools in Greece can be shown to 'make a difference', as in other
educational contexts, it would be important to understand these differences, measure
them and comment on them. The application of the methods and the knowledge base of
school effectiveness could provide Greek teachers with a powerful stimulus for
developing school self-evaluation, review and improvement. Of course, in every
evaluation there are dangers. Brown (1994) warns that there is always the danger that
the findings on the school effect to be used by politicians for 'summative' evaluations
and accountability. However, policy makers and journalist in Greece will use the
summative function of school results in any way. It is essential therefore for the teachers
to have their own proposals.
Educational evaluation disappeared from the Greek educational agenda in the early
1980s. Until then, the evaluation of teachers had been the job of school inspectors
whose reports - as most people in Greece agree today - constituted the tools with which
political control was exerted over education. Inspection reached its heyday during the
military regime in Greece between 1967 and 1974. In the early 1980s, teachers'
reactions and the socialist government's efforts towards democratisation resulted in the
abolishment of any inspection and the introduction of the body of school consultants.
19
School consultants only provided pedagogical guidance and support to teachers. It is
important therefore to note that for twenty years now there has been nobody in Greece
with the task of evaluating the quality of education from kindergarten to university.
Until now, nobody has been able to write about the relative effectiveness of Greek
schools. Kallen (1996) in a report about the condition of secondary education in Greece
gave the following two explanations for why this is the case: (a) there is no adequate
mechanism for data collection and analysis in Greece and (b) there is no culture for
educational evaluation in Greek schools. Today, eight years after Kallen's (1996)
remarks, little has been changed regarding the collection of educational statistics and the
evaluation of the Greek school system. A study conducted by the Greek Pedagogical
Institute regarding the evaluation of so-called 'educational work' was terminated in
1999 due to changes in the government's educational policy. Another study undertaken
by the Centre for Educational Research concerning the 'investigation of the
characteristics of the Greek schools' is still in its pilot phase. It is important to stress
that 75% of the funds for these studies come from the Second Support Framework of
the European Community. The aim of the current researcher is thus to investigate
whether a self-financed work could be a model for other educational researchers in the
Greek Pedagogical Institute or the Centre for Educational Research. The basic purposes
of the current study is (a) to investigate the size, the structure and the correlates of
school effect in Greece and (b) to use the knowledge base that will be created from this
investigation as a theoretical and methodological framework for developing approaches
to educational evaluation.
The purposes of the current researcher may sound unremarkable in the ears of those
who work within the school effectiveness and improvement community. This is because
in most European countries there are systems for educational evaluation. Reliable
educational statistics are published on a regular basis. Also in most European countries
there are people - usually called 'school inspectors' - who visit the schools in order to
evaluate the work of the teachers, the use ofthe resources, and the processes of teaching
and learning. The situation in Greece is dramatically different from that of the other
European countries. No mechanisms for monitoring the quality of education exist, no
educational statistics are published, and no inspectors visit the Greek schools. Greece
participated in the Third Mathematics and Science Study (TIMSS) as well as the
Programme for International Student Assessment (pISA 2000). Results regarding the
place of Greek students in these two studies can be found in the official OECD
20
publications. However, no further analyses have been made or published focusing on
the Greek educational system.
Plans for educational evaluation were recently introduced by the previous Minister of
Education, Dr. Gerasimos Arsenis, in the eighth article of educational Law 2525 of
1997. However, this article was never enforced in response to teachers' adverse
reactions, lack of the necessary infrastructure and expertise, and lack of the supporting
presidential decrees. The current Minister for Education who succeeded Dr. Arsenis, Mr
Petros Efthimiou, has essentially abolished the eighth article of the Law 2525 and is
preparing his own proposals for educational evaluation. Some basic ideas from Mr.
Efthimiou's plans are presented in the sixth chapter of the current thesis but up to the
day when the present work was submitted, the details of the new procedures for
educational evaluation were unknown. Therefore, there are now three different
published proposals for educational evaluation in Greece: (a) a proposal made by
teachers in the 1980s, (b) the proposal made by the Greek Pedagogical Institute in 1999,
and (c) the eighth article of Law 2525 of 1997 that was passed by the previous Minister.
Fitz-Gibbon (1996b) has written that monitoring the outcomes of any educational
system is a procedure heavily dependent on the availability of the necessary data. When
the present study began in 1998, the most important problem was the scarcity of
educational statistics. Even in the cases where tables with summative statistics did exist,
the access to them was extremely difficult. The people at the Centre for Educational
Research, the Ministry of Education and the Educational Department of the National
Statistical Service of Greece prompted the current researcher to seek tables with
educational statistics in the annual OECD publications. Actually, there are no standard
ways in which a researcher can ask state organisations in Greece to supply him or her
with educational statistics. This is quite disheartening. Dissemination of information can
be seen as a basic ingredient of democracy, whereas unavailability of information
should be considered as undemocratic as censorship. From that perspective, a lot needs
to be done in Greece. Let us see how a team of OECD inspectors has described the
collection of educational statistics in Greece:
The collection and processing of statistical data in Greece are mainly the responsibility of the National Statistical Service of Greece. However, according to the Background Report, the Agency, due to lack of resources, is about ten years behind in its collection of data on education. The Statistical Unit in the Ministry of Education seems to suffer from a similar shortage of resources. A chaotic
21
and wasteful network of data collection within and outside the Ministry (the Pedagogical Institute also collects its own data) has resulted ( ... ). A strong relevant recommendation from the UNESCO International Institute for Education Planning (lIEP) was not followed up and it seems that the situation has since (i.e. the mid-1980s) further deteriorated. We were able to see for ourselves on the spot that essential data were not available and that on many matters widely diverging data were being used. This state of affairs represents a serious handicap to educational policy making and management (OECD, 1997: 164, italics added by the current author).
Greek policy makers are well aware of the situation described in OECD's quotation.
Therefore, Greeks are discussing the need for the establishment of a 'committee for the
co-ordination of statistical information and questionnaires'. The OECD inspectors wrote
in their report in 1997 that 'we strongly recommend that the discussions [for the above
mentioned committee] be carried out as rapidly as possible and that pertinent decisions
be taken and implemented without delay' (p. 165). However, so far, the committee for
the co-ordination of statistical information and questionnaires has not been established.
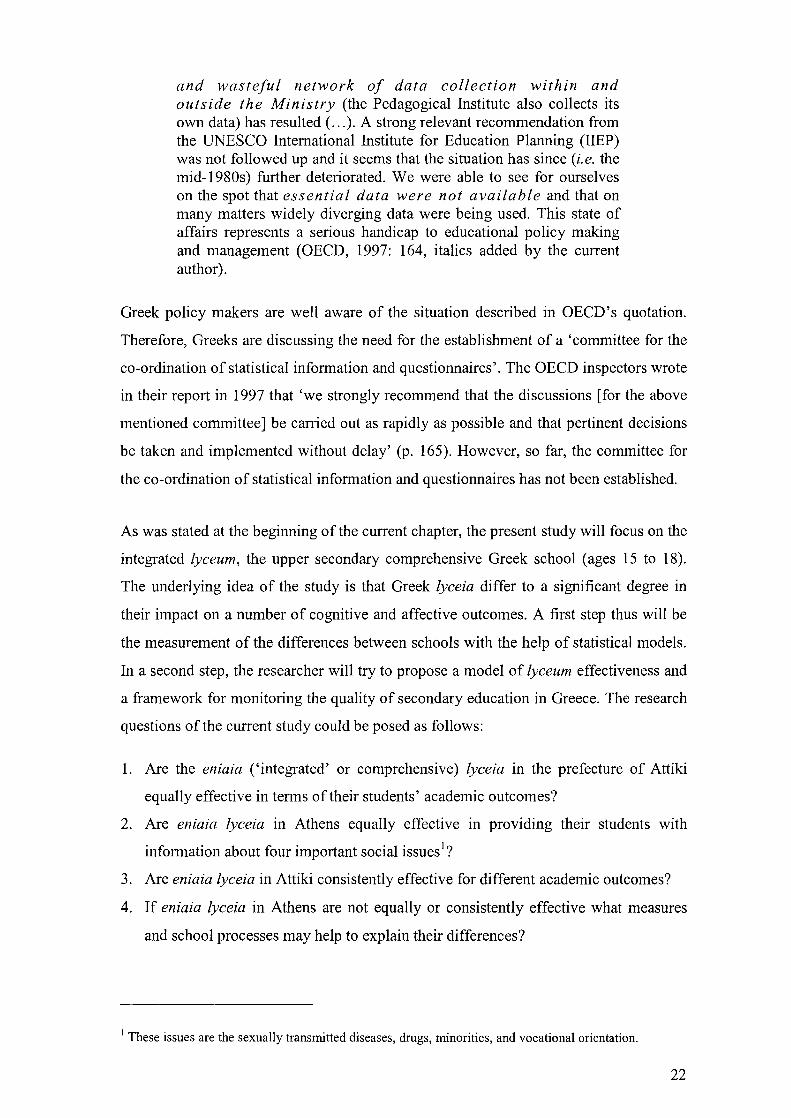
As was stated at the beginning of the current chapter, the present study will focus on the
integrated lyceum, the upper secondary comprehensive Greek school (ages 15 to 18).
The underlying idea of the study is that Greek lyceia differ to a significant degree in
their impact on a number of cognitive and affective outcomes. A first step thus will be
the measurement of the differences between schools with the help of statistical models.
In a second step, the researcher will try to propose a model of lyceum effectiveness and
a framework for monitoring the quality of secondary education in Greece. The research
questions of the current study could be posed as follows:
1. Are the eniaia ('integrated' or comprehensive) lyceia in the prefecture of Attiki
equally effective in terms of their students' academic outcomes?
2. Are eniaia lyceia in Athens equally effective in providing their students with
information about four important social issues I?
3. Are eniaia lyceia in Attiki consistently effective for different academic outcomes?
4. If eniaia lyceia in Athens are not equally or consistently effective what measures
and school processes may help to explain their differences?
I These issues are the sexually transmitted diseases, drugs, minorities, and vocational orientation.
22

Strongly associated with these four research question are the two following issues:
1. How could the answers to the four research questions of the current study contribute
to the development of a model of lyceum effectiveness in Greece?
2. How could a theoretical model of lyceum effectiveness contribute to the case of
educational evaluation and school based review in Greece?
Having presented the rationale and the research questions of the thesis it is now time to
introduce the readers of this work to the Greek educational system. For the needs of this
brief presentation, a collection of laws and presidential degrees will be outlined.
Teachers' perspectives will also be approached through their unions' publications.
Before closing this first introductory chapter it is important to stress that like many other
areas in education, this thesis is a mosaic of pieces from different disciplines: pedagogy,
philosophy, psychology, statistics, educational evaluation and assessment, educational
policy, and organisational theory. Elements of educational policy and evaluation can be
found in the second chapter of this work; educational effectiveness and organisational
theory are discussed in the third chapter; finally, philosophical and statistical issues are
presented in the fourth chapter.
23

2. QUALITY, EVALUATION, AND MODERNISATION IN THE GREEK EDUCATIONAL SYSTEM
"The problem of the Greek educational system becomes more intense as 1992 approaches. In competitions among the educational systems, Greece lags behind. Tomorrow, in the united Europe, all the opportunities, all the possibilities and all the benefits will belong to the others, because they will be better qualified and better prepared to cope with the emerging problems. If we do not stop going backwards, we will be providing the European market with low-level personnel in jobs requiring merely mechanical skills and not creative work".
Current Prime Minister of Greece Konstandinos Simitis in the newspaper To B~f.1a [To Vima] on 10 December 1989. Title: 'Ta <JxoAcia )lW; napciyouv )ltKpoKamTaAt<J)lO Kat Kpan<J)lO' [Our schools produce micro-capitalism and statism].
24

2.1 . THE GREEK EDUCATIONAL SYSTEM
2.1.1. LOGISTICS AND BASIC FEATURES
Greece is a county in the south east of Europe and member of the European
Community. Due to the lack of detailed published national educational statistics in
Greece, most of the figures that will be presented in this chapter have been derived from
international publications, especially the publications of the Organisation for Economic
Co-operation and Development (OECD). OECD has commissioned and published four
reports on the Greek educational system: the first in 1961, the second in 1965, the third
in 1979 and the fourth in 1997. The latest report (OECD, 1997) identifies four basic
features of the Greek educational system. Firstly, Greek education serves a traditionally
highly homogeneous society, sustained by its deep-rooted Hellenic and Byzantine
traditions, by a cohesive, state-supported religion, and by a strong family solidarity.
Secondly, education in Greece operates within a context of great geographic contrasts
and variety, with corresponding differences in the distribution of popUlation between
urban and rural areas, as well as great socio-economic differences between these two
areas. School buildings space in towns is hard to find while schools in rural areas are
regarded as functioning at high cost. Thirdly, education in Greece has never connected
with the world of work. This is because by serving a traditionally agricultural country,
Greek economy shifted rapidly from the primary production sector to a secondary and
tertiary level. Fourthly, as it will be explained in the following sections, education in
Greece is extremely politicised. Politicisation is logically a characteristic of centralised
educational systems because in these systems the teachers and administrators are
directly accountable to the governments. Few other countries, however, have
experienced the extent of educational discontinuities that Greece has suffered as a result
of political turmoil in the post War period.
The Greek school system has a rather simple and clearly delineated structure. Its
compUlsory part consists of six years of primary school (demotiko scholeio), followed
by a three-year comprehensive lower secondary school (gymnasio) After gymnasio,
most students continue their studies to the higher secondary school, the lyceum. Until
25
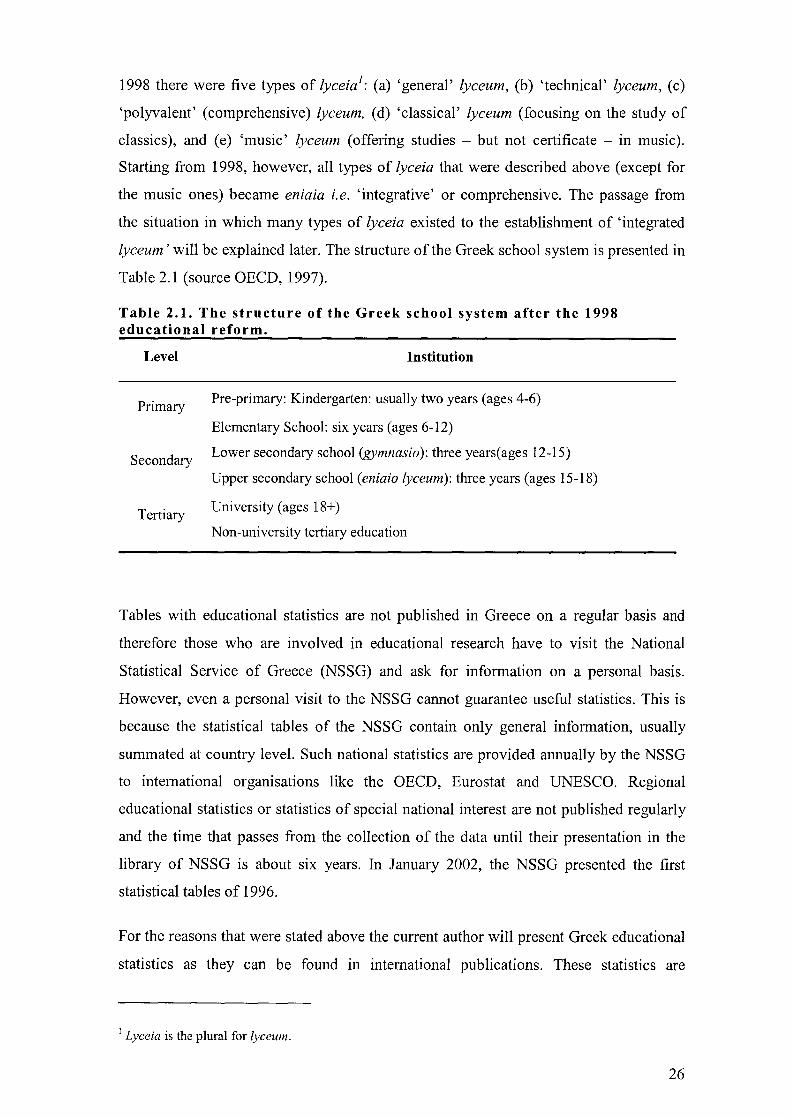
1998 there were five types of lyceia l: (a) 'general' lyceum, (b) 'technical' lyceum, (c)
'polyvalent' (comprehensive) lyceum, (d) 'classical' lyceum (focusing on the study of
classics), and (e) 'music' lyceum (offering studies - but not certificate - in music).
Starting from 1998, however, all types of lyceia that were described above (except for
the music ones) became eniaia i.e. 'integrative' or comprehensive. The passage from
the situation in which many types of lyceia existed to the establishment of 'integrated
lyceum' will be explained later. The structure of the Greek school system is presented in
Table 2.1 (source OECD, 1997).
Table 2.1. The structure of the Greek school system after the 1998 educational reform.
Level
Primary
Secondary
Tertiary
Institution
Pre-primary: Kindergarten: usually two years (ages 4-6)
Elementary School: six years (ages 6-12)
Lower secondary school (gymnasio): three years(ages 12-15)
Upper secondary school (eniaio lyceum): three years (ages 15-18)
University (ages 18+)
Non-university tertiary education
Tables with educational statistics are not published in Greece on a regular basis and
therefore those who are involved in educational research have to visit the National
Statistical Service of Greece (NSSG) and ask for information on a personal basis.
However, even a personal visit to the NSSG cannot guarantee useful statistics. This is
because the statistical tables of the NSSG contain only general information, usually
summated at country level. Such national statistics are provided annually by the NSSG
to international organisations like the OECD, Eurostat and UNESCO. Regional
educational statistics or statistics of special national interest are not published regularly
and the time that passes from the collection of the data until their presentation in the
library of NSSG is about six years. In January 2002, the NSSG presented the first
statistical tables of 1996.
For the reasons that were stated above the current author will present Greek educational
statistics as they can be found in international publications. These statistics are
I Lyceia is the plural for lyceum.
26

published and therefore their accuracy can be verified. The statistics that will be
presented in the current section have been taken from the latest publication of Education
at a Glance (OECD, 2001). In the current chapter two kinds of statistics will be used:
(a) those dealing with the attainments of the Greek population - a piece of infonnation
that will be used later in Chapter 5 - and (b) those dealing with the extent of the public
and private investments on education.
Table 2.2 presents the educational attainments of the Greek popUlation (21-64 years of
age) by the highest level of attainment achieved (source OECD, 2001). The numbers in
the cells are percentages. The abbreviation ISCED stands for the International Standard
Classification of Education in its latest revision in 1997. Explanations for the various
levels of ISCED can be found in the Appendix (p. 352). It can be seen that the
percentage of Greeks who only hold a certificate from primary school is very high
compared to the OECD mean. In addition, the difference between Greece and OECD
country mean in the ISCED-3B column indicates that not many Greek students hold a
degree from a technical secondary school.
27
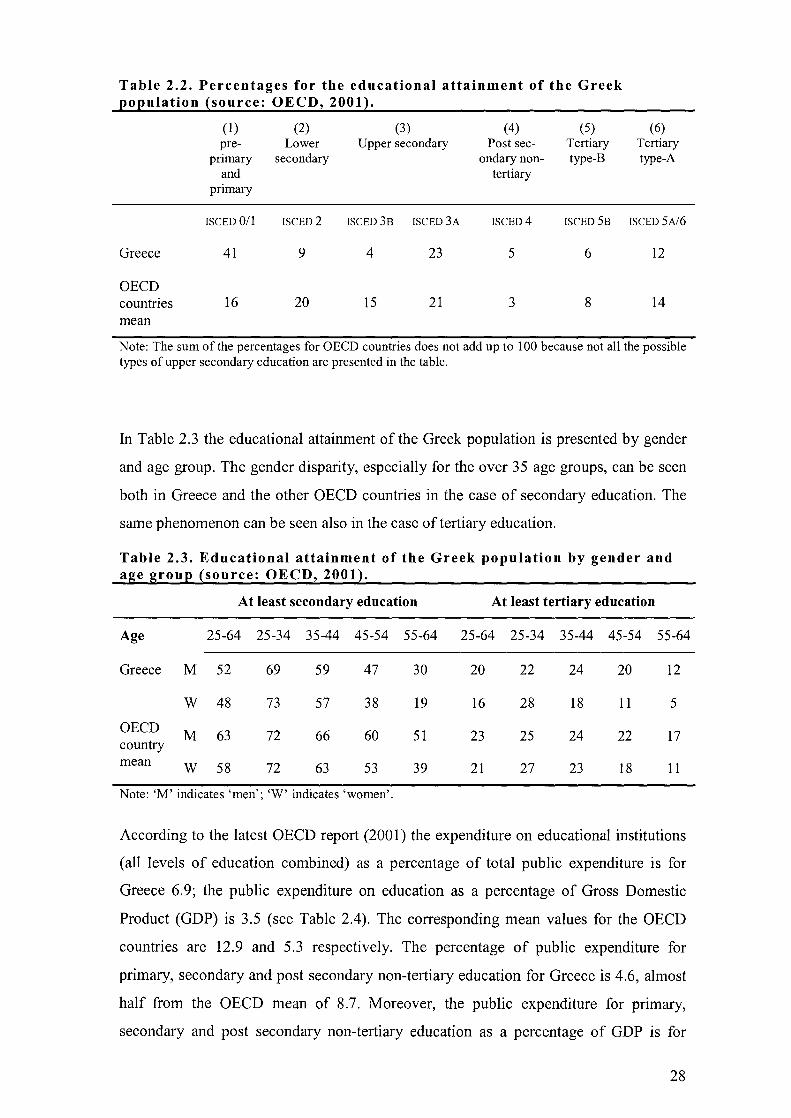
Table 2.2. Percentages for the educational attainment of the Greek ~o~ulation !source: OECD, 2001~.
(1) (2) (3) (4) (5) (6) pre- Lower Upper secondary Post sec- Tertiary Tertiary
primary secondary ondarynon- type-B type-A and tertiary
primary
ISCED 0/1 ISCED 2 ISCED 38 ISCED 3A ISCED4 ISCED 58 ISCED 5A!6
Greece 41 9 4 23 5 6 12
OECD countries 16 20 15 21 3 8 14 mean
Note: The sum of the percentages for OEeD countries does not add up to 100 because not all the possible types of upper secondary education are presented in the table.
In Table 2.3 the educational attainment of the Greek population is presented by gender
and age group. The gender disparity, especially for the over 35 age groups, can be seen
both in Greece and the other OEeD countries in the case of secondary education. The
same phenomenon can be seen also in the case of tertiary education.
Table 2.3. Educational attainment of the Greek population by gender and age grou~ !source: OECD, 200q.
At least secondary education At least tertiary education
Age 25-64 25-34 35-44 45-54 55-64 25-64 25-34 35-44 45-54 55-64
Greece M 52 69 59 47 30 20 22 24 20 12
W 48 73 57 38 19 16 28 18 11 5
OECD country
M 63 72 66 60 51 23 25 24 22 17
mean W 58 72 63 53 39 21 27 23 18 11
Note: 'M' indicates 'men'; oW' indicates 'women'.
According to the latest OEeD report (2001) the expenditure on educational institutions
(all levels of education combined) as a percentage of total public expenditure is for
Greece 6.9; the public expenditure on education as a percentage of Gross Domestic
Product (GDP) is 3.5 (see Table 2.4). The corresponding mean values for the OEeD
countries are 12.9 and 5.3 respectively. The percentage of public expenditure for
primary, secondary and post secondary non-tertiary education for Greece is 4.6, almost
half from the OEeD mean of 8.7. Moreover, the public expenditure for primary,
secondary and post secondary non-tertiary education as a percentage of GDP is for
28
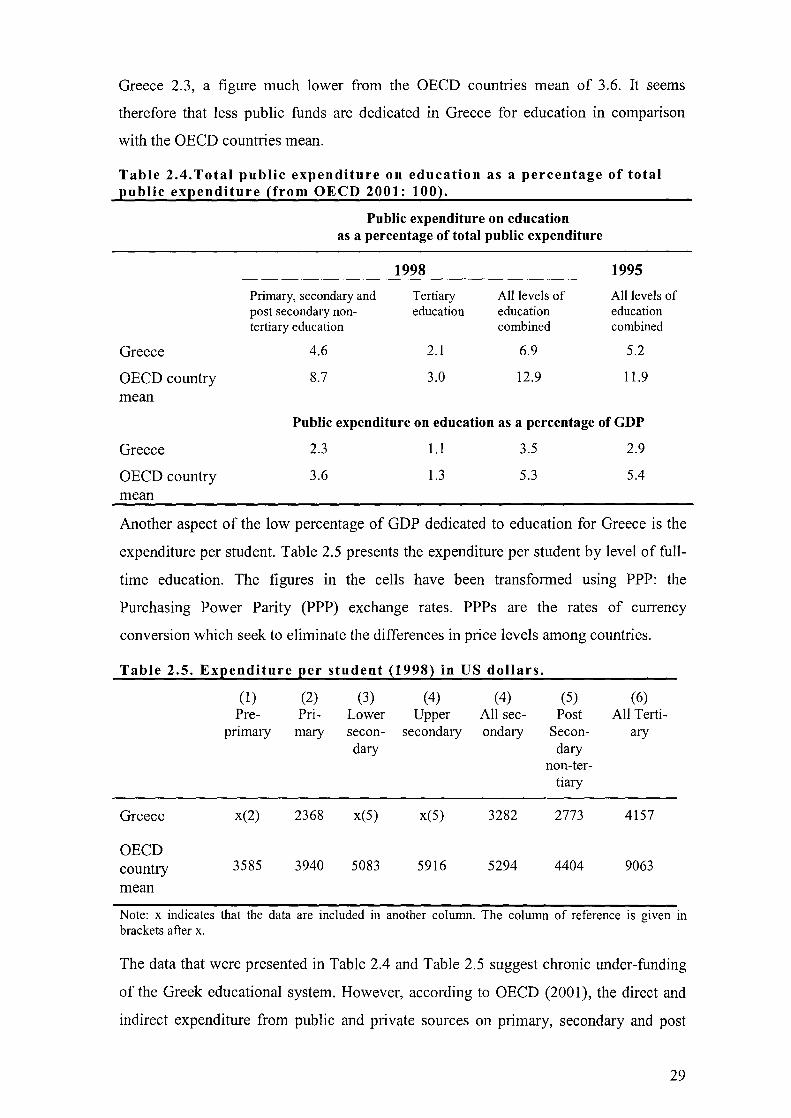
Greece 2.3, a figure much lower from the OEeD countries mean of 3.6. It seems
therefore that less public funds are dedicated in Greece for education in comparison
with the OEeD countries mean.
Table 2.4. Total public expenditure on education as a percentage of total public expenditure (from OECD 2001: 100).
Greece
OEeD country mean
Public expenditure on education as a percentage of total public expenditure
1998
Primary, secondary and Tertiary All levels of post secondary non- education education tertiary education combined
4.6 2.1 6.9
8.7 3.0 12.9
1995
All levels of education combined
5.2
11.9
Public expenditure on education as a percentage of GDP
Greece
OEeD country mean
2.3
3.6
1.1
1.3
3.5
5.3
2.9
5.4
Another aspect of the low percentage of GDP dedicated to education for Greece is the
expenditure per student. Table 2.5 presents the expenditure per student by level of full
time education. The figures in the cells have been transformed using PPP: the
Purchasing Power Parity (PPP) exchange rates. PPPs are the rates of currency
conversion which seek to eliminate the differences in price levels among countries.
Table 2.5. Expenditure per student ~1998~ in US dollars.
(1) (2) (3) (4) (4) (5) (6) Pre- Pri- Lower Upper All sec- Post All Terti-
pnmary mary secon- secondary ondary Sec on- ary dary dary
non-ter-tiary
Greece x(2) 2368 x(5) x(5) 3282 2773 4157
OEeD country 3585 3940 5083 5916 5294 4404 9063
mean
Note: x indicates that the data are included in another column. The column of reference is given in brackets after x.
The data that were presented in Table 2.4 and Table 2.5 suggest chronic under-funding
of the Greek educational system. However, according to OEeD (2001), the direct and
indirect expenditure from public and private sources on primary, secondary and post
29
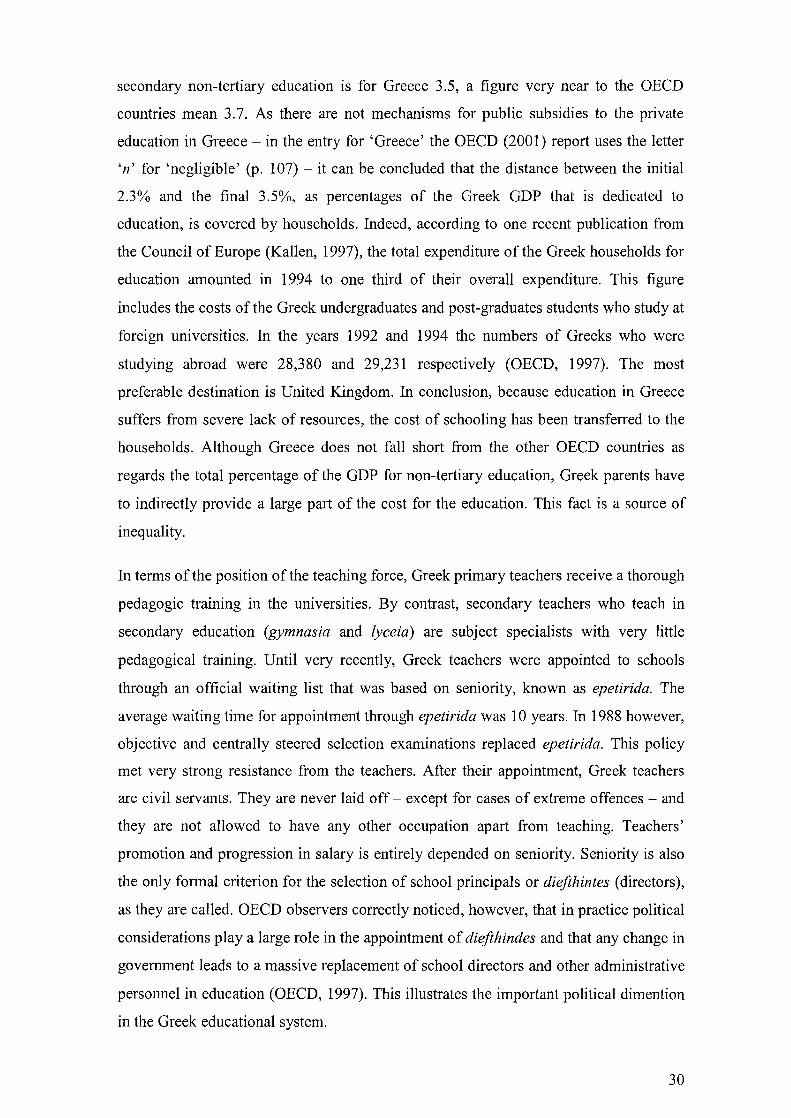
secondary non-tertiary education is for Greece 3.5, a figure very near to the OECD
countries mean 3.7. As there are not mechanisms for public subsidies to the private
education in Greece - in the entry for 'Greece' the OECD (2001) report uses the letter
On' for 'negligible' (p. 107) - it can be concluded that the distance between the initial
2.3% and the final 3.5%, as percentages of the Greek GDP that is dedicated to
education, is covered by households. Indeed, according to one recent pUblication from
the Council of Europe (Kallen, 1997), the total expenditure of the Greek households for
education amounted in 1994 to one third of their overall expenditure. This figure
includes the costs of the Greek undergraduates and post-graduates students who study at
foreign universities. In the years 1992 and 1994 the numbers of Greeks who were
studying abroad were 28,380 and 29,231 respectively (OECD, 1997). The most
preferable destination is United Kingdom. In conclusion, because education in Greece
suffers from severe lack of resources, the cost of schooling has been transferred to the
households. Although Greece does not fall short from the other OECD countries as
regards the total percentage of the GDP for non-tertiary education, Greek parents have
to indirectly provide a large part of the cost for the education. This fact is a source of
inequality.
In terms ofthe position of the teaching force, Greek primary teachers receive a thorough
pedagogic training in the universities. By contrast, secondary teachers who teach in
secondary education (gymnasia and lyceia) are subject specialists with very little
pedagogical training. Until very recently, Greek teachers were appointed to schools
through an official waiting list that was based on seniority, known as epetirida. The
average waiting time for appointment through epetirida was 10 years. In 1988 however,
objective and centrally steered selection examinations replaced epetirida. This policy
met very strong resistance from the teachers. After their appointment, Greek teachers
are civil servants. They are never laid off - except for cases of extreme offences - and
they are not allowed to have any other occupation apart from teaching. Teachers'
promotion and progression in salary is entirely depended on seniority. Seniority is also
the only formal criterion for the selection of school principals or diefthintes (directors),
as they are called. OECD observers correctly noticed, however, that in practice political
considerations playa large role in the appointment of diefthindes and that any change in
government leads to a massive replacement of school directors and other administrative
personnel in education (OECD, 1997). This illustrates the important political dimention
in the Greek educational system.
30
2.1.2. THE ADMINISTRATION OF GREEK SCHOOLS
The Greek educational system has always been centralised and bureaucratically
organised. All decisions pertaining to curricula, textbooks, school timetables, the
appointment, salaries and promotion of teachers, the establishment, equipment and
operation of the schools, are made by the Ministry of Education and are uniformly
introduced into all the schools. Figure 2.1 presents the administrational pyramid of the
Greek educational system. The Greek Ministry of Education is at the top. The
Pedagogical Institute and the National Council for Education act as advisory bodies to
the Minister. The National Council for Education has a small secretariat but it has
hardly ever held any meetings. Another advisory body to the Minister is the Centre for
Educational Research (it does not appear in Figure 2.1), which should be regarded as
being on the same level as the Pedagogical Institute and the National Council for
Education.
Kassotakis (2000) describes the small steps that were introduced towards
decentralisation of the Greek educational system with Law 1566 of 1985. Through this
law, a proportion of public subsidies is now allocated and administered at local level. In
addition the same law provides for the participation of local authorities and
representatives of social bodies in educational committees functioning at school level as
well as regional and national levels (op. cit.). The steps towards decentralisation,
however, have been very small. The Greek educational system retains its centralised
character. The schools in every Greek prefecture are administered by educational
directorates which are different for the primary and secondary level. There are 108
educational directorates in the 54 prefectures of the country. In some densely populated
prefectures, there are also education offices, which come under the education
directorates. The role of the heads of the directorates and the offices is the supervision
of the functioning of the schools. However, the heads of these two local education
authorities have very limited authority over the teaching staff, the school buildings, and
the curriculum.
The lowest level in the Greek educational pyramid is the school. Greek schools are
governed by the school director! who is assisted by a deputy director. However, both the
I In some English texts, the Greek school director is translated either as 'headteacher' or as 'principal'. In the current thesis, 'director' is thought to be a better translation for the Greek word 'diefthintis'.
31
director and the deputy director do not have any authority over the teaching staff, the
students and the curriculum. Until now their only work has been to keep teachers
informed about the circulars issued by the Ministry of Education. In fact, all the minor
decisions in Greek schools are taken 'democratically' by the teaching staff. The teachers
hold special sessions every few days in order to decide the policy of the school. The
policy issues that have been left by the Ministry to be decided at school level mainly
regard issues like the action that is to be taken to deal with students' disciplinary
problems, the visits to museums, and the organisation of athletic and musical events.
Thus the autonomy of Greek schools is limited. Teachers who have been selected by the
Ministry of Education to act as school consultants visit the schools and offer advice and
help concerning educational problems but they do not evaluate either the school or the
teachers. School consultants are appointed for four years and their appointment is
subject to renewal. Ever since their introduction in the early 1980s their role in the
Greek education system has remained unclear.
Another aspect of special importance in the Greek secondary schools is the participation
of students in the administration of the school. Educational Law 1566 of 1985
introduced student participation in decision making through the 'school communities'
which now exist in every lyceum (higher secondary school). School communities have
been introduced mainly for educational purposes. It is thought that increased
participation in decision making at school will make today's democratic students
tomorrow's democratic citizens. School communities seek to promote collaboration
among students, emphasise freedom of expression, and encourage the flow of ideas. In
fact, however, this role of the school communities has been marginal. There are two
other administrative groups at school level: the school council and the school
committee. The role of the former is to build up good relationships and foster links
between teachers and parents. The school committee is responsible for fund-raising
activities and the operational expenditure of the school (apart from teachers' salaries).
Both the school council and the school committee are presented in Figure 2.1.
32
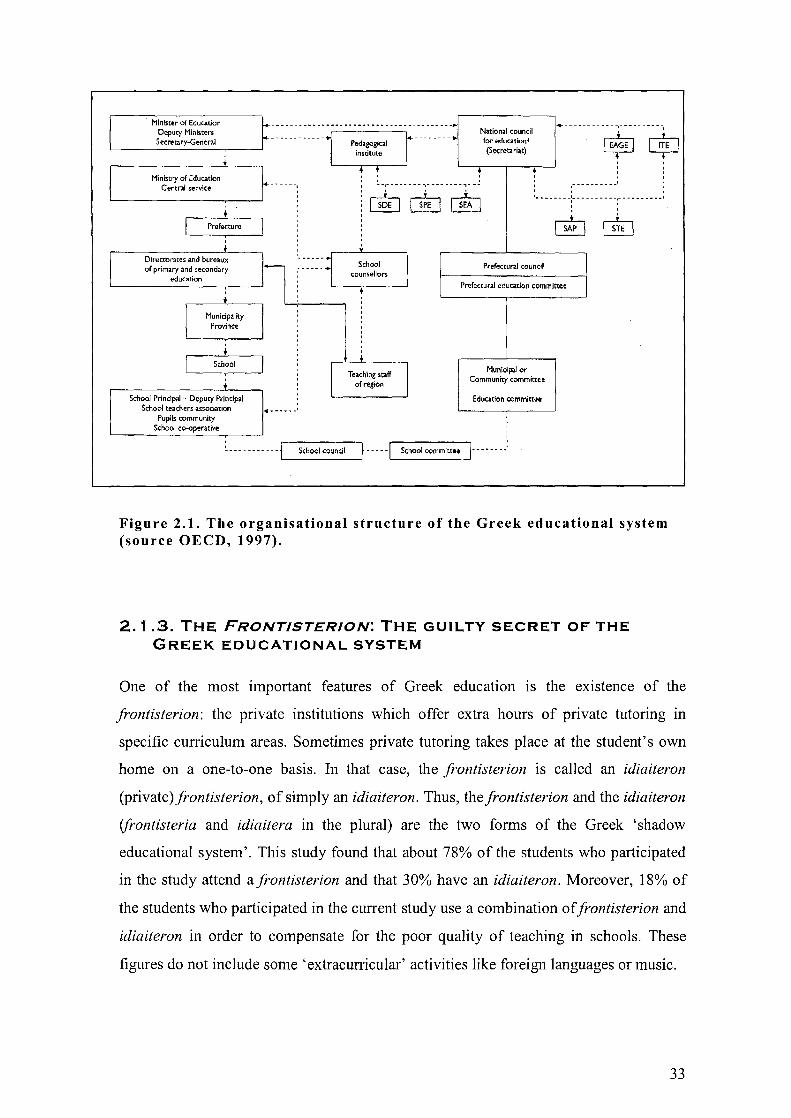
__ - - __ - _~ .. - y __ a ..... _a ..... __ ~ _______________ ~
.... -- - - -- -- -- - -,----- --- --I MinIster of Education Deputy Ministers Secretary-General - --- - - --+
National council for ~ducationl (Secreta riat) I EA~E I ok]
Ministry of Education Central service
Prefecture
School
School Principoi - Deputy Principal School teachers assoCiation ..... _ .... ~ .'
Pupils community School co-operative
• +
, , --.----- --- ..... ---- - ---,--- , __________ I
, , '- ------ -:--- -- .-- --,- --.. -_ ... -- .. '
School counsellors
Teaching staff of region
Prefectural councIl
Prefectural education committee
Municipal or Community cOl'llmitte.e
Education committee
,
~ ----- ----- -j School coundl f -- ---I School com mitt.. 1- ----- --:
Figure 2.1. The organisational structure of the Greek educational system (source OECD, 1997).
2.1.3. THE FRONTISTERION: THE GUILTY SECRET OF THE GREEK EDUCATIONAL SYSTEM
One of the most important features of Greek education is the existence of the
frontisterion: the private institutions which offer extra hours of private tutoring in
specific curriculum areas. Sometimes private tutoring takes place at the student's own
home on a one-to-one basis. In that case, the frontisterion is called an idiaiteron
(private)frontisterion, of simply an idiaiteron. Thus, thefrontisterion and the idiaiteron
(jrontisteria and idiaitera in the plural) are the two forms of the Greek 'shadow
educational system'. This study found that about 78% of the students who participated
in the study attend a frontisterion and that 30% have an idiaiteron. Moreover, 18% of
the students who participated in the current study use a combination offrontisterion and
idiaiteron in order to compensate for the poor quality of teaching in schools. These
figures do not include some 'extracurricular' activities like foreign languages or music.
33
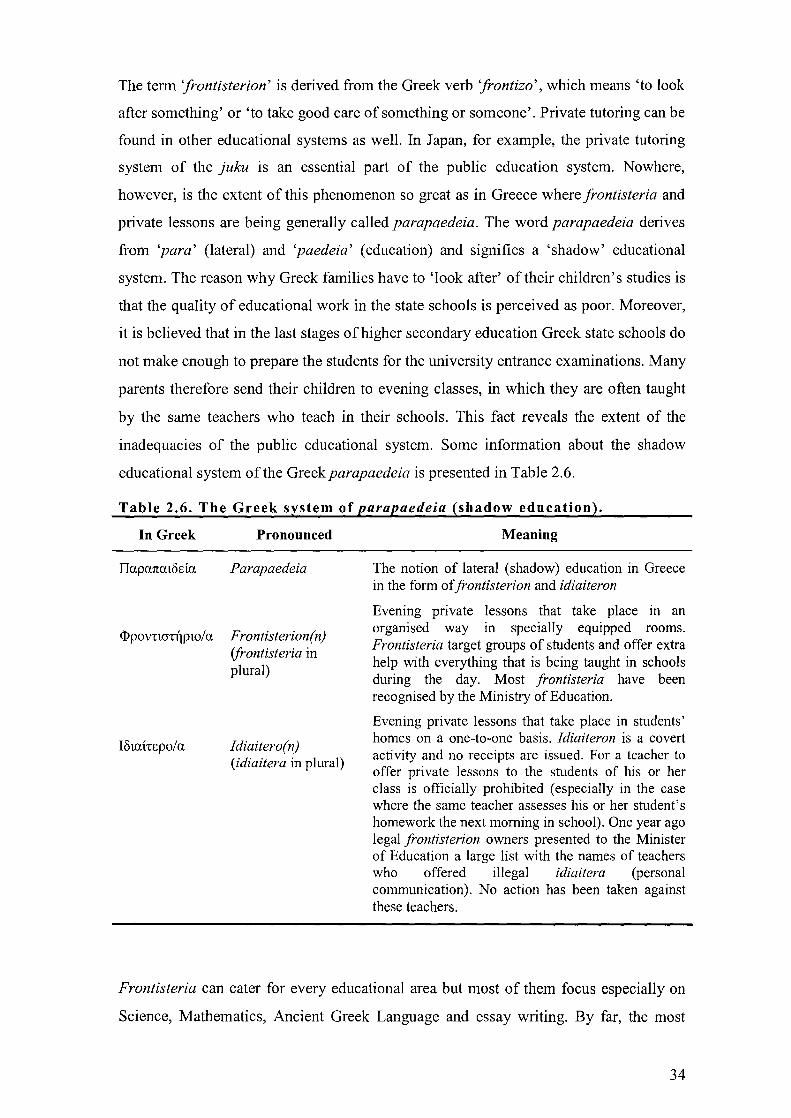
The term 'jrontisterion' is derived from the Greek verb 'jrontizo', which means 'to look
after something' or 'to take good care of something or someone'. Private tutoring can be
found in other educational systems as well. In Japan, for example, the private tutoring
system of the juku is an essential part of the public education system. Nowhere,
however, is the extent of this phenomenon so great as in Greece where jrontisteria and
private lessons are being generally called parapaedeia. The word parapaedeia derives
from 'para' (lateral) and 'paedeia' (education) and signifies a 'shadow' educational
system. The reason why Greek families have to 'look after' of their children's studies is
that the quality of educational work in the state schools is perceived as poor. Moreover,
it is believed that in the last stages of higher secondary education Greek state schools do
not make enough to prepare the students for the university entrance examinations. Many
parents therefore send their children to evening classes, in which they are often taught
by the same teachers who teach in their schools. This fact reveals the extent of the
inadequacies of the public educational system. Some information about the shadow
educational system ofthe Greek parapaedeia is presented in Table 2.6.
Table 2.6. The Greek system of parapaedeia (shadow education).
In Greek Pronounced
I1apa1tatoEia Parapaedeia
<I>povnaTIjptO/a Frontisterion(n) (jrontisteria in plural)
IOtai'rEpo/a Idiaitero(n) (idiaitera in plural)
Meaning
The notion of lateral (shadow) education in Greece in the form ofjrontisterion and idiaiteron
Evening private lessons that take place in an organised way in specially equipped rooms. Frontisteria target groups of students and offer extra help with everything that is being taught in schools during the day. Most jrontisteria have been recognised by the Ministry of Education.
Evening private lessons that take place in students' homes on a one-to-one basis. Idiaiteron is a covert activity and no receipts are issued. For a teacher to offer private lessons to the students of his or her class is officially prohibited (especially in the case where the same teacher assesses his or her student's homework the next morning in school). One year ago legal jrontisterion owners presented to the Minister of Education a large list with the names of teachers who offered illegal idiaitera (personal communication). No action has been taken against these teachers.
Frontisteria can cater for every educational area but most of them focus especially on
Science, Mathematics, Ancient Greek Language and essay writing. By far, the most
34
profitable jrontisteria are those offering classes in foreign languages. Greek students are
taught at least one foreign language (usually English) in their schools but the quality of
teaching is regarded as so low that languages other than Greek are exclusively taught in
jrontisteria. As for the subjects that are completely missing from the Greek National
Curriculum, other private institutions have taken every opportunity to benefit from the
inefficiency of the state system. For example, students who are talented in music, have
an artistic inclination, or wish to take on athletics, have to turn to the private sector after
the normal school hours because, essentially, courses in music, fine arts and physical
education are not offered in Greek schools. After the normal school hours, which are
usually from 8: 15 a.m. to 1 :30 p.m., Greek students start their shadow education
marathon. The 'race' is not over until late at night. According to PISA 2000 Greek
students have the largest amount of homework among all the other OECD countries (see
OECD, 2001: Figure 7.6)1. The funds for all this highly profitable activity come directly
from Greek households. Thus the inequalities between Greek households are directly
transformed into educational inequalities. That is how Manolis Dretakis (2001), an
academic in the field of Economics and former socialist Minister describes the role of
jrontisteria. He calls their existence 'the biggest problem for education in our country'
and writes:
Parapedeia in the primary and, most importantly, in secondary education is an activity that causes economic bleeding to the families which can afford to pay for jrontisteria and/or idiaitera and, in addition, it engages a large number of teachers of every level and area of specialisation. ( ... ) Apart from the strengthening of educational inequalities, however, parapedeia causes serious problems to the children of the families which can afford the expenses ofjrontisteria and idiaitera. Even in the case where these children are attending morning schools, they have to stay away from home for at least 12 hours a day and 5 days a week. Some of these children are attending jrontisteria even at the weekends. This is an exhausting time schedule for them, which leaves no time for study and recreation. These two elements are necessary for students of this age (Dretakis, 2001: 4).
The 'economic bleeding' caused by jrontisteria is not easy to estimate because
parapaedeia is a covert activity in Greece. In most of the cases, no receipts are issued
and no open discussions are held. In the Greek and international literature there are no
I If one would like to be concise, 'frontisterio-work' and not 'homework' should be used in the case of Greek students.
35
published studies investigating the effect of private tutoring on students' attainment.
The educational department of the NSSG does not hold any data about frontisteria
because these are not official institutions. However, the number of legally run
jrontisteria in the country has been estimated to be 2,713 (Flessa, 1999). In the greater
area of Athens - the 'Attiki basin' as it is called - there are as many as 832 legal
frontisteria (op. cit.). The annual cost forjrontisterion attendance for a gymnasio (lower
secondary school) student is estimated to be 880 Euro on average (Papamathaiou, 1999:
6). The equivalent for those who study at the last two grades of lyceum is estimated to
be 2,494 Euro (op. cit.). Both figures show the prices for the 1999 - 2000 academic
year. According to the OEeD inspectors report for Greece (1997) any attempt to raise
funding for the public educational system is doomed to fail as long as better performing
private systems compete for these resources. This discussion reveals why the Greek
shadow education system of frontisterion has been called by the current author 'the
guilty secret' of the Greek education system. Frontisteria are responsible (thus, 'guilty')
for many educational inequalities in Greece. However, their role is hardly ever
discussed by educators and policy makers and not information can be found in Greek
educational journals and international pUblications.
2.1.4. INDICATORS FOR THE QUALITY OF THE GREEK SCHOOL SYSTEM
Without basic educational statistics, discussions about the quality of the Greek
educational system are severely hampered. So far, Greek policy makers and educators
have used everything that according to their opinion could serve as a quality indicator.
The most widely used indicators for the quality of the school system in Greece are the
raw student examination grades in national examinations. Until 2001 all national Greek
newspapers published what is known in Greece as 'the bases': the lowest grades that
students need to have achieved in June in order to continue their studies at universities.
From 2001 however students' raw grades in lyceum leaving examinations are used as
quality indicators. For example, the main article in the first page of the Greek quality
newspaper I Kathimerini on 21 August 2001 was that 'the quality of educational work is
being put to test' because the 'base' for entrance in some university department was
only 6.37 out of 20.00 (Lakasas, 2001 b). Other newspapers have also publish similar
articles since August 2001.
36

The examinations at the end of lyceum are designed by a steering committee that is
different from year to year. In Greece, there are no item banks for the members of each
examination committee to draw on in preparing the examination papers. Therefore, the
psychometric characteristics of the examination papers (the distribution of the raw
grades, the discrimination power etc) are only a result of the arbitrary selection of the
questions to be answered from year to year. The meaning of 'educational standards' and
'educational indicators', as well as the use of examination results for drawing
conclusions about the quality of a given educational system are three topics that will be
discussed in more detail in the sixth chapter of the current work.
Another statistic that has been used by Greek policy makers as a quality indicator is the
student participation rates at secondary level, i.e. the number of gymnasia (lower
secondary school) students who continue their studies at lyceum (higher secondary
school). According to the latest OEeD country report (1997), the participation rates of
students leaving gymnasia and continue at lyceum are 95 per cent for boys and 91 per
cent for girls. According to the same source, no less than 923 of 1,000 entrants to
primary education reach the third and last stage of upper secondary education (ap. cit.).
Of 1,000 entrants to the primary school in 1985-1986, 862 students completed the
lyceum in 1997 (op cit.). However, these figures do not tell us as much about the real
performance of the system as about the absence of student assessment during the
primary and secondary school.
Two important sources of information about the quality of the Greek educational system
are the Greek results in the international comparisons of students' achievement, like the
Third International Mathematics and Science Study (TIMSS), and the recent
Programme for International Student Assessment (PISA). Very strangely, however,
information derived from these two sources has never found its way to the Greek
newspapers or the Greek educational journals. It must be reminded that TIMSS was
conducted in 1995 by the International Association for the Evaluation of Educational
Achievement (IEA). A second phase of this study (TIMSS-R) was conducted in 1999
but Greece did not participate. The mean achievement of Greek students in the fourth
and eighth grade of TIMMS was 356 (standard error 8.9) and 484 (standard error 3.1)
respectively. These figures were significantly lower than those of the other OEeD
countries' at both age levels (OEeD, 1999). PIS A was conducted by OEeD in 2000 on
reading literacy, mathematical literacy and scientific literacy. In all these areas, Greek
37
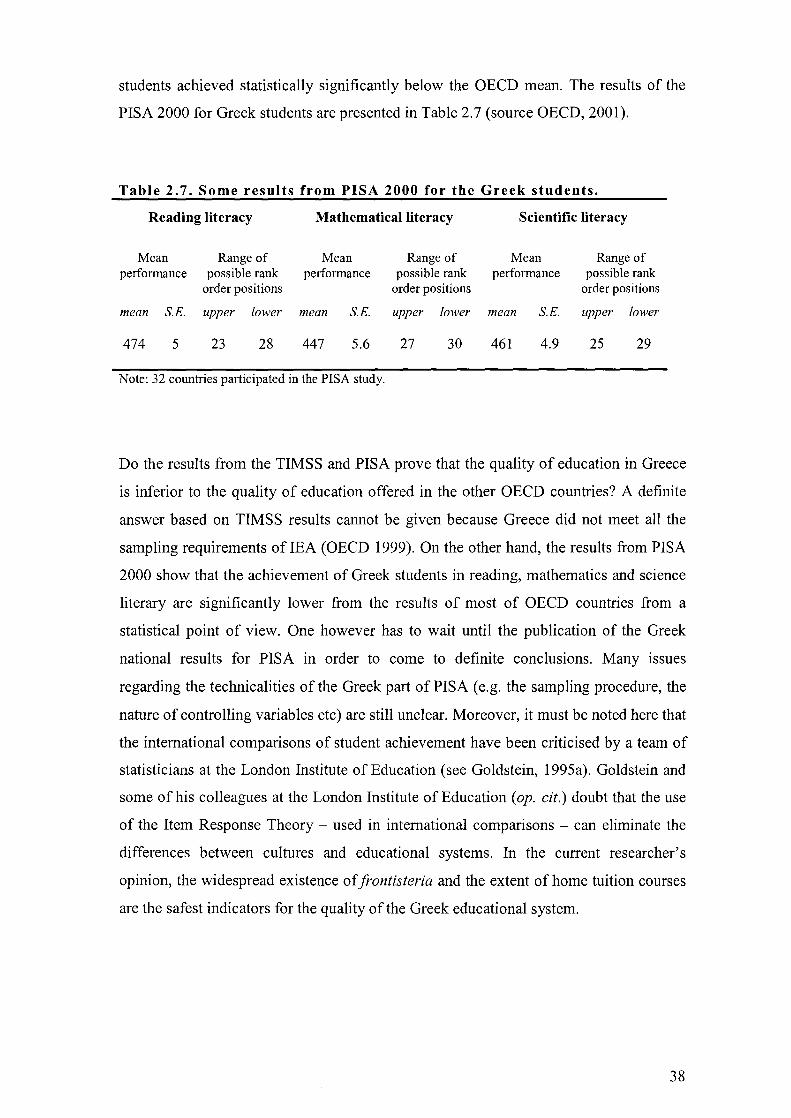
students achieved statistically significantly below the OEeD mean. The results of the
PISA 2000 for Greek students are presented in Table 2.7 (source OEeD, 2001).
Table 2.7. Some results from PISA 2000 for the Greek students.
Reading literacy Mathematical literacy Scientific literacy
Mean Range of Mean Range of Mean Range of perfonnance possible rank perfonnance possible rank perfonnance possible rank
order positions order positions order positions
mean SE. upper lower mean SE. upper lower mean SE. upper lower
474 5 23 28 447 5.6 27 30 461 4.9 25 29
Note: 32 countries participated in the PISA study.
Do the results from the TIMSS and PIS A prove that the quality of education in Greece
is inferior to the quality of education offered in the other OEeD countries? A definite
answer based on TIMSS results cannot be given because Greece did not meet all the
sampling requirements of IEA (OEeD 1999). On the other hand, the results from PISA
2000 show that the achievement of Greek students in reading, mathematics and science
literary are significantly lower from the results of most of OEeD countries from a
statistical point of view. One however has to wait until the publication of the Greek
national results for PISA in order to come to definite conclusions. Many issues
regarding the technicalities of the Greek part of PISA (e.g. the sampling procedure, the
nature of controlling variables etc) are still unclear. Moreover, it must be noted here that
the international comparisons of student achievement have been criticised by a team of
statisticians at the London Institute of Education (see Goldstein, 1995a). Goldstein and
some of his colleagues at the London Institute of Education (op. cit.) doubt that the use
of the Item Response Theory - used in international comparisons - can eliminate the
differences between cultures and educational systems. In the current researcher's
opinion, the widespread existence of jrontisteria and the extent of home tuition courses
are the safest indicators for the quality of the Greek educational system.
38
2.2. POLICY ANALYSIS I: THE MEANING OF EDUCATIONAL QUALITY IN GREECE
2.2.1. A BRIEF HISTORY OF EDUCATIONAL QUALITY
Policy makers in Greece find it difficult to agree on the final form of an ideal, high
quality school. The Communists have in the past held demonstrations advocating the
lengthening of compulsory education by three years and the Conservatives have
promised that if they take office, they will abolish many of the changes of the current
socialist government. The disagreements within the Omospondia Leitourgon Mesis
Ekpaidefsis - the National Union of Secondary Teachers - (OLME) and the Didaskaliki
Omospondia Ellados - National Union of Primary Teachers - (DOE) are highly
politicised. The arguments within these two bodies are reflections of the arguments that
take place in the political field between the four main Greek political parties: the ruling
'Panhellenic Socialistic Movement' (the socialists), the opposition 'New Democracy'
(the conservatives), the Communist Party, and the 'Coalition of the Left and
Progressive'. An agreed National Council for Education that could act as a starting point
for planning and discussion on educational issues has not been introduced yet because
of the difficulty of such a step. In these circumstances, searching for an ideal form of
high-quality schooling in Greece is like undertaking a search for the Greek mythical
beast, the Chimera. A definition for 'educational quality' must however be given before
any discussion about the effectiveness of the Greek lyceia takes place. Thus, in the
following paragraphs there will be a brief presentation of the dominant ideas and the
historical development of views about educational quality. Some exemplary texts will
also be highlighted. Like any other brief history, however, the following paragraphs can
only attempt to telescope complex realities into neat categories. The degree of contrast
between the ideas that will be presented has been emphasised in order to illuminate the
main arguments. The point of departure for the exploration of educational quality is the
first decade after the Second World War.
In the 1950s, the role of education in the damaged post-war economies of the western
industrialised countries was perceived to be the production of economic growth. In this
39
era, educational quality was mainly understood in terms of returns of investment. It was
the epoch in which the educational researchers, using international governmental census
data, tried to demonstrate a positive relationship between investment in education and
economic indicators, such as the Gross Domestic Product. An exemplary text of this era
is the book Education Economy and Society, in which Vaizey & Debeauvais (1961)
wrote a chapter about 'the economic aspects of educational development'. The authors
wrote that 'hitherto education has been mainly regarded as consumption; henceforth, it
is primarily to be regarded as investment' (p. 40). Thus, it could be argued, with some
risk of oversimplification, that in the 1950s public schooling was directly connected in
the minds of educators with economic growth.
In the next two decades, the ideas about what might constitute a 'good' educational
system changed. As direct relationships between educational provisions and economic
growth were not easily discernible, educators and policy makers in the western
industrialised nations turned their focus on more substantive evidence of educational
quality. This however does not mean that studies about educational provisions and
recourses did not disappear from the political agenda. At that time, using resources
effectively was becoming a very important issue. Examples of the new interest in the
effective use of resources are the works of Brookover et al. (1979) and Jencks et al.
(1972) in the United States, two studies that became known for their strong sociological
perspective. Thus, in the 1960s and the early 1970s the schools were conceptualised as
places where social progress should be seen to be occurring, rather than places where
investment would be translated into economic indicators. Political conjunctions also
helped to this ideology shift. The United States of the 1960s were marked by the
presidency of John F. Kennedy and an explosion of equal rights and equality in
educational opportunity.
Some roots of the progressive ideas of the 1960s and the early 1970s can also be found
in the 1950s. Two of the editors of the book Education, Economy and Society published
the book Social Class and Educational Opportunity (Floyd et al., 1956). In this book,
Floud and his colleagues investigated the relation between social class and access to
education and they showed that children from families with low socio-economic status
have little chance of success within the state public schools. The authors (op. cit.)
proposed the reconstruction of the secondary education towards more progressive forms
of schooling. A school system that according to the authors would help compensate for
the social inequalities was based on the comprehensive ideal. In the United States, a
40

country with state educational systems, the action that was taken against social
inequalities was not the development of a new kind of school but the introduction of
extra educational provisions within the existing school system. Examples of such
reforms in the United Stated are the efforts for the early identification and help of the 'at
risk' students, the development of the 'educational priority areas', the changes in the
curriculum and the teaching strategies, and the provision of special compensatory
programmes. Educational priority areas were also adopted in the European contexts
such as the United Kingdom and the Netherlands.
From the second half of the 1970s, the ideas about the ideal high-quality school system
changed again as positive links between educational change and improved social
mobility for the disadvantaged proved illusive. Public expenditures in education ceased
to increase, as a result of scarce resources. In the second half of the 1970s and the 1980s
there were high unemployment rates - especially among the young. In these decades,
the perceived role of the state in the distribution of goods and services was diminished
and more conservative - 'market-economy' principles found their way in education. In
this context, the theme of 'accountability' (see Section 2.2.2) came very high in the
political agenda. In 1990 Chapman & Carrier wrote in their book Improving
Educational Quality that one of the most serious challenges facing the education system
of many countries is how to meet the demands for higher quality public education
within increasingly harsh economic and fiscal constrains. Thus, during the 1980s the
notion of quality became closely associated with the notion of accountability.
In the 1990s the word 'quality' received increasing attention. The titles of some
pUblications are characteristic: Schools and Quality (OECD, 1989), Improving
Educational Quality (Chapman & Carrier, 1990), Measuring the Quality of Education
(Vedder, 1992), High-Quality Education and Training for All (OECD, 1992), Quality
Schooling (Aspin, Chapman, & Wilkinson, 1994), Quality Education and Self
Managing Schools (Townsend, 1994), Restructuring and Quality (Townsent, 1997) and
so on. Chapman & Aspin (1994) searched the use of the term quality in the discourse
and found a wide measure of agreement between educators on some core values that,
according to the reviewers, might said to be typical of quality schooling. The 'core'
values of quality, according to Chapman & Aspin (1994) are:
41

a) Schools should give their students access to, and the opportunity to acquire, practice
and apply those bodies and kinds of knowledge, competencies, skills and attitudes
that will prepare them for life in today's complex society;
b) schools should have a concern for and promote the value of excellence and high
standards of individual and institutional aspiration, achievement and conduct in all
aspects of its activities;
c) schools should be democratic, equitable and just;
d) schools should humanise students and give them an introduction into and offer them
opportunities for acquiring the values that will be crucial in their personal and social
development;
e) schools should develop in students a sense of independence and of their own worth
as human beings, having some confidence in their ability to contribute to the society
of which they are a part, in appropriate social, political and moral ways;
f) schools should prepare future citizens to conduct their interpersonal relationships
with each other in ways that shall not be inimical to the health and stability of
society or the individuals that comprise it;
g) schools should prepare students to have a concern for the cultural as well as the
economic enrichment of the community in which they will ultimately playa part,
promoting the enjoyment of artistic and expressive experience in addition of
knowledge and its employment;
h) schools should conjoin education for personal autonomy and education for
community enhancement and social contribution, enabling each student to enrich the
society of which he or she is to become a part as a giver, an enlarger and an
enhancer, as well as being an inheritor and recipient (Chapman & Aspin, 1994: 64-
65).
In the tum of the millennium, a new situation has been emerged and the meaning of
educational quality is changing again. The new situation has been called' globalisation'.
With reference to education, Power & Whitty (1999) have described globalisation as
follows:
As capital becomes more mobile, nations lose control over economic activity. New international regulative bodies limit national sovereignty. Technological innovations render geographic boundaries less significant, and the penetrations of commercialisation into all spheres of public life is deemed to reduce cultural differences between nations. Within advanced capitalist countries, the demise of industry has led to a fragmentation of past
42
collectivities and communities. As the old power blocks break down, archetypical modernist projects of social engineering are abandoned and national systems of welfare provision dismantled. With reference to schooling, education ceases to be a publicly prescribed and distributed entitlement and becomes a commodity available for private consumption (Power & Whitty, 1999: 16).
It is very difficult to predict what the future implications of globalisation will be for
Education. In fact, it is only recently that educators and teachers have started to analyse
the new situation. In April of2001, for example, a number of economists, educators and
policy makers from many parts of the world met in Karlstad (Sweden) in a congress that
focused on the meaning of quality in education. In this congress, Chinapah (2001)
presented the current strategy of UNESCO as follows:
In its proposal for the medium term-strategy (2002 - 2007) UNESCO emphasises the human right to quality education. ( ... ) Quality education cannot be limited to increasing the material inputs for school systems or enhancing school effectiveness, important though they are. Quality education must be geared to enhancing each individual's potential and the full development of a leamer's personality, including flexible adaptation of educational provision. It should also be intertwined with values forming the basis of social cohesion and respect for human dignity. An education of quality must necessarily contribute to peace and solidarity. Quality education should also encompass and reflect the diversity of education needs, expectations, interests, and cultural contexts. Likewise, educational policies and strategies should be promoted to foster cultural and linguistic diversity in a curriculum. Methodological guidelines and indicators for the assessment of learning achievements and for quality assurance are to be developed for such untapped domain (Chinapah, 2001: 4-5).
Another interesting analysis of the new situation can be found in a book that was
published by the Centre for Educational Research and Innovation of OECD with the
title Educational Policy Analysis 2001 (OECD-CERI, 2001). In this book, the authors
present four possible scenarios for the future of schooling in the long term. These
scenarios are presented in Table 2.8.
43

Table 2.8. The OECD schooling scenarios (source OECD-CERI, 2001: 121).
The 'status quo' extrapolated scenarios
Scenario 1
Robust and Bureaucratic school systems
Scenario 2
Extending the market model
The 're-schooling' scenarios The 'de-schooling' scenarios
Scenario 3 Scenario 5
Schools as core social centres Learner networks and the learning society
Scenario 4 Scenario 6
Schools as focused learning Teacher exodus - the organisations 'meltdown' scenario
The first scenano IS characterised by strong bureaucracies and robust institutions.
According to it, personal stakes resist fundamental change in education. Thus, the
existing problems of school image and resources continue. According to the second
scenario, widespread dissatisfaction with schooling leads to re-shaping of public
funding and transformation of the school system. There is rapid growth of demand
driven 'market currencies', which may enlarge the existing inequalities in achievement
and opportunity. In the third scenario, there is an increment in the levels of public trust
and funding to education. Schools are seen as centres of community and formation of
the social capital. There is extended use of Information and Communication Technology
(lCT). In this scenario there is also both organisational and professional diversity and
greater social equity. The forth scenario is similar to the previous one. There are also
high levels of public trust and funding but here schools are understood as learning
organisations. The use of ICT is maximised. There are strong quality and equity
features. The fifth scenario describes the process to a society without schools. It is
suggested that widespread dissatisfaction with the organised school system may tum
communities to access non-formal learning using ICT. These changes will essentially
reflect the 'network society' of the future. In the fifth scenario there are serious equity
problems due to the different access to new technologies. Finally, the sixth scenario
describes another possible 'de-schooling' process. The severe teacher shortages do not
respond to policy action. The retrenchment, conflict and falling standards lead to areas
of 'melt down' or crisis which may in tum provide spur to widespread innovation.
To summarise, in western industrialised societies, ideas about the role of education
changed direction at least three times in the last 50 years. Starting from the
44
economically orientated 1950s and the 'progressive' 1960s and 1970s, the ideas tuned
more towards conservative rather driven policies in the 1980s and 1990s. In the turn of
the millennium, the globalisation of information is expected to bring a lot of change in
the schools. In the following paragraphs, the same sequence is explored in relation to
the Greek educational system. First, however, the notion of 'accountability' needs to be
discussed.
2.2.2. EDUCATIONAL QUALITY AND ACCOUNTABILITY
As it was presented in Section 2.2.1, the issue of quality is one ofthe most central issues
in the educational discourse from the late 1950s to today's era of 'globalisation'. In
Section 2.2.1 'educational quality' was discussed at the macro-level, as most of the
relevant work has been published from international or national organisations that are
interested in the economic or the organisational aspects of schooling. Such an
international organisation is OECD and more specifically, the Centre for Educational
Research and Innovation (CERI) that was introduced in November 1987. The basic
reason behind the introduction of CERI was the perceived need for information and
benchmarks that might allow comparisons across countries and indicators of how well
education is functioning in each country. For CERI, the issue of educational quality can
be associated with five fields: (a) the flow of students through the education system (b)
students' outcomes, (c) the schools and their environment, (d) the costs of education,
and (e) students' attitudes and expectations. Many schemes for school based review
have been disseminated as a result of the work of the OECD International School
Improvement Project (Van Velzen, 1987). Other international organisations, like the
World Bank, are also interested in monitoring the quality of educational systems at the
macro-level (see Greaney & Kellaghan, 1996).
Another characteristic of the current international educational context is the idea that the
schools and the teachers should be accountable to the wider society for the quality of
education they provide. In countries with centralised educational system like, for
example, Germany, teachers and not schools are mostly accountable to their educational
clientele. In other countries, however, the schools and not the teachers are directly
accountable to the community. The issue of accountability is the theme of the book
School Under Scrutiny, edited by OECD in 1995. This book gives examples of how
schools in different countries are held accountable for the quality of education they
provide to their students. In New Zealand, for example, the board of trustees of each
45
school is directly accountable to the Crown, under the Public Finance Act. The
Education Review Office also holds them accountable to their charters, and reports to
the Minister the Ministry and the community. The way in which each school develops
its own charter suggests a less formal but, nevertheless, real accountability to the local
community and the parent body. In the United States schools are generally legally
accountable to their local school board of district and, in terms of political rhetoric, are
seen as being accountable to parents and the community for the achievement of their
students. In England, the governing body of each school is ostensibly accountable to its
'consumers' - the parents of the children in the school - in relation to both financial
management and students' achievement but also, through inspection (Office for
Standards in Education), to the Secretary of State. Parents are elected as representatives
onto school governing bodies and they are supposed to have a choice of school.
2.2.3. THE MEANING OF EDUCATIONAL QUALITY IN GREECE
The educational reforms that were based on the vision of education as the vehicle for
economic growth and pursuit of social justice have left the Greek educational system
intact. Ambitious plans and high-flying objectives have abounded in Greek educational
discourse, but from the 1950s until today efforts towards modernisation of the system
have failed (examples of the above statement will be given in the following paragraphs).
From an economic point of view, although Greeks believe that education is connected
with economic prosperity, the aims of the Greek educational system have never been
associated with the world of work. From a sociological point of view, although many
Greek educators have highlighted the connection between Greek students' socio
economic status and their access to higher education, nothing concrete has been done to
help fill the gaps of unequal opportunities. In fact, Greek sociologists had never
attempted sophisticated studies about the inequalities in the Greek school system. As
stated in Section 2.1.3, the quality of the Greek educational system is so low that Greek
families dedicate on average one third of their annual income in order to compensate for
the perceived ineffectiveness of the state school system and to promote their children's
educational attainment (see also Kallen, 1997). In the fifth chapter of the current work,
(page 236), it will be noted that 8 out of 10 students attend jrontisterion. Some
explanations for the situation that has just been described may be as follows.
From a political point of view it is believed that Greece is a country on the 'periphery'
of the capitalistic centre (Kazamias, 1995). The country's economic formation after the
46
Second World War was characterised by hypertrophy in the public sector and an
emphasis on certain activities like tourism and agriculture (op. cit.). In the 1960s and the
1970s 30% of the Greek working force emigrated to the industrialised countries of the
west, the most preferred destinations being the United States, Germany, and Australia.
So far, people connected by family ties have run the majority of Greek Industries. Some
other features of the Greek economy were noted earlier in this chapter. The Greek
educational system is very centralised and bureaucratic. Repeated efforts towards its
modernisation have failed due to political circumstances and lack of consensus about
the appropriate directions for educational change.
Because of these repeated failures, a very successful metaphor for the Greek educational
system has been suggested in the literature. More specifically, it is said that the Greek
educational system is under the ancient curse of SisyphUS. The metaphor was used by
Andreas Kazamias, a leading scholar in the field of Comparative Education at an
internationa11evel. In Greek mythology Sisyphus was an extremely handsome man who
passed his days admiring his own reflection in the clear waters of a lake. This, however,
was a blasphemy against ancient ethics and, as a punishment, Sisyphus was obliged by
the gods to push a huge stone up to the peak of a mountain. The gods knew that
Sisyphus would never finish his task. Every time Sisyphus approached the peak, he
failed take the final decisive step to get the stone onto the top. Thus the rock rolled
down the mountainside and Sisyphus' task remained uncompleted. The Greek
educational system, like the mythical Sisyphus, has never changed in spite of repeated
attempts at its modernisation. It has remained worlds away from other European
educational systems: firmly bound to Greek national history, Greek tradition, and the
Greek Orthodox religion. When the socialist government tried to reduce the hours for
Greek Orthodox Catechism in the lyceum, the State Council (Highest Court) decided
that every reduction in the teaching hours of that particular subject was against the
Constitution (Decision 2176 of 1998).
The first post-war effort towards modernisation of the Greek educational system took
place in the early 1960s under the National Radical Party (the Right Wing). During the
1950s, Greece was trying to heal the wounds of the civil war between the forces of the
Right and the forces of the Left that followed the Second World War. In the early
1960s, Greece was a Kingdom and Constandinos Karamanlis was the Prime Minister
for the National Radical Party (the forces of the Right). In Greece, as in the other
countries of the western world, it was believed that education would bring economic
47
prosperity. The members of the Greek Education Committee (a body of experts on
education) wrote in 1958 that 'education is our most positive and productive
investment' (Education Committee, 1958: 43). The president of the Educational
Committee in 1958 was a person who was bound to playa major role in the formation
of ideas about educational quality in Greece. This person was Evangelos Papanoutsos, a
national expert on educational issues.
The second - and very important - attempt towards modernisation of the system took
place in 1964, during the short-lived progressive government of Enosis Kentrou, the
Centre Party. At that time George Papandreou was the Prime Minister with Enosis
Kentrou and Evangelos Papanoutsos, the former president of the Educational
Committee, was now the Minister for Education. Ideas about an intended connection
between education and economic growth were dominant in this second modernisation
effort. In the introductory chapter of Law 4379 of 1964 Papanoutsos wrote that 'the
upgrading of a nation's educational level is the main prerequisite for its economic
prosperity and cultural development' (Papanoutsos, 1965: 331). However, Papanoutsos'
plans for a modem educational system did not flourish. The Colonels' military coup on
April the 21 of 1967 - a few days before the national elections - brought the Greek
educational system back to its pre-1960s position. Katharevousa, a language with many
grammatical and syntactical similarities to Ancient Greek, regained its place in the
classrooms. Interestingly, the Colonels tried also to connect education with economic
growth. They introduced KATEEs, the lower technology schools that were a form of
non-university tertiary education. The main aim of KATEE was the training of the
Greek workforce for the needs of industry. KATEE's descendants are today's
Technology Institutes (TEl), a form of tertiary education equivalent to the former
British Polytechnics (there are currently many efforts to upgrade the status ofTEls).
The third attempt towards modernisation of the system took place in 1977, three years
after the fall ofthe military regime. This time 'New Democracy', the conservative party,
was in power and Greece was no longer a Kingdom. Constandinos Karamanlis - the
former Prime Minister with the Radical Party- was the Prime Minister with New
Democracy. George Papandreou, the former Prime Minister with Enosis Kentrou had
died during the military regime. Evangelos Papanoutsos, the progressive educator of the
Centre Party, also played a major part in the educational policy of 1977. In this third
modernisation effort, it was decided that the language taught in Greek schools would be
the modem Greek Language, known as dimotiki. As described in the prevIOUS
48

paragraph, katharevousa, a difficult type of Greek, was used for teaching and learning
before 1977.
In 1981, the socialists came to power and Andreas Papandreou, the son of George
Papandreou of the Centre Party, became Prime Minister. Papanoutsos died in 1982 but
until the end of his life he tried to link education with economic growth and prosperity.
As Papanoutsos wrote in 1982, 'without a sophisticated education there is no
sophisticated economy and without sophisticated economy there is no sophisticated
education' (Papanoutsos, 1982: 183). The socialists, like the conservatives in 1977,
adopted Papanoutsos' ideological framework and in 1986 there was a new effort for the
modernisation of the system. However, the educational policy of the socialists in 1986
did not only focus on economic growth. The socialists reorganised the educational
system and sought to emphasise equality and the internal reform of the system. A
National Curriculum was introduced and new teaching methods found their way into the
classroom. School inspection was abolished and school consultants took the place of
school inspectors. A comprehensive secondary school, the integrated polyvalent lyceum,
was introduced. For the first time in Greek educational history, state schools offered
some compensatory classes for the students who needed them. The characteristic of the
1980s however was the abolition of inspection. In the minds of teachers, 'evaluation'
had negative connotations. Thus educational evaluation was left to be discussed in the
1990s.
The Conservatives came to power again in 1990. In 1992 the Minister for Education,
George Kontogianopoulos attempted to introduce some form of educational evaluation
into the system. However, the reactions of the teachers were very strong. The Minister
resigned when a teacher was killed in the riots against his refonns. The Socialists came
again to power in 1993 and Andreas Papandreou became Prime Minister for a second
time. His son, George Papandreou, became the minister for Education and Michael
Kassotakis, an academic with a strong background in educational statistics was one of
his main counsellors. In 1996, Prime Minister Papandreou died and Constantinos
Simitis, a politician with social-democratic roots, became Prime Minister in his place.
Simitis also succeeded Andreas Papandreou in the presidency of the Panhellenic
Socialist Movement (the socialist party). Professor Michael Kassotakis became the
president of the newly introduced Centre for Educational Research and with the new
Minister of Education Gerasimos Arsenis (an academic with a brilliant international
career in economics) designed the latest educational reform in Greece. There are two
49
texts from which information for the latest educational reform in Greece can be taken:
the Education 2000 programme and Law 2525 of 1997.
With Law 2525 of 1997 a form of educational evaluation has been reintroduced into the
Greek educational system. Epetirida, the national waiting list for teachers' appointment,
was replaced by a new system based on national examinations. In the national elections
of the year 2000, the socialists won again (by a narrow margin) and Konstantinos
Simitis remained in office. However, the previous minister of education Gerasimos
Arsenis was replaced by Petros Efthimiou, a former journalist for the Greek quality
daily newspaper To Vima. The new minister selected his own team of advisors and
asked the presidents of the Pedagogical Institute (Panagiotis Ex arhakos ) and the Centre
for Educational Research (Michael Kasotakis) to submit their resignations, which they
did. The current Minister is now reviewing Law 2525 of 1997 for educational reform.
Thus the attempts towards modernisation of the Greek educational system are still under
way. In the next section, some points of the ongoing educational reform will be
presented in greater detail.
50

2.3. POLICY ANALYSIS II: ONGOING EDUCATIONAL REFORM IN GREECE
2.3.1. A NEW LAW FOR EDUCATION
As reported in the previous section, in September of 1997 the socialist Minister for
Education, Gerasimos Arsenis, presented the basic features of his programme Education
2000. This programme was designed to deal with the major problems of the Greek
educational system, some of which were presented in Section 2.1. The whole effort
towards modernisation of the system (i.e. the programme Education 2000, a special
education law and a number of presidential decrees) has been referred to as 'the
educational reform'. The funding of this unprecedented educational reform in Greece
comes both from national resources (25%) and from the Second European Community
Support Framework (75%). The funds from both national and European sources are
administered through a programme that is called EI1EAEK (Epiheirisiako Programma
Ekpedefsis kai Arhikis Epagelmatikis Katartisis - Operational Programme for Education
and Initial Vocational Training).
In the policy domain, educational reform was materialised with Law 2525 of 1997
which was voted in by the Greek parliament and took effect as from the academic year
1998-1999. More specifically, Law 2525 of 1997 introduced:
• a new type of comprehensive higher secondary school (the integrated lyceum),
• new curricula and textbooks for primary and secondary school students,
• new procedures for teacher recruitment,
• educational evaluation at primary and secondary level,
• new procedures for university entrance,
• combined courses and student mobility at the tertiary level,
• An Open University,
• Information and Communication Technology in schools,
• extracurricular provisions for students 'at risk',
• special programmes for students with mother tongue other than Greek, and many
more.
51

The innovations brought by Law 2525 of 1997 were many and cannot be discussed
thoroughly in this work. Thus the discussion will be restricted to the changes that took
place in upper secondary education and the university entrance examinations and other
issues related to the topic of this thesis.
With Law 2525, the previous form of the university entrance examinations was replaced
by a system of continuous assessment during the last two years of integrated lyceum.
The purpose of the new examination system was also different from the old one. The
old examination system of 'desmes', which aimed exclusively at selection, was replaced
by a new system that focused on a combination of selection and certification.
Specifically, the Minister of Education introduced the A7[OAVT~PlO Evw.iov AV1(f;iov
(Apolytirio Eniaiou Lykeiou), the certificate of the integrated lyceum. The first students
to receive their certificate were those of the academic year 1999-2000.
In the previous system, the final year of the general lyceum was dominated by the
system of 'desmes'. Desmes were four academic streams i.e. groups of subjects which
students had to choose from for entry into higher education. The final examination in
the third year of lyceum under the desmes system determined teachers and learners'
approaches to learning. The system of desmes reinforced the role of rote learning and
reduced the range of subjects that were taken seriously by students and their parents to
those that appeared in the university entrance examination. The role of frontisteria was
very significant under the desmes system because teachers, students, and parents
focused only on four specific subjects. Under the new system, the students are examined
in many subjects during the last two years of the integrated lyceum. The examination
papers also have a new format. The essay-style, memory-based examination papers
under the system of desmes have been replaced by standardised, curriculum-specific
tests and portfolio assessment. With the above-mentioned changes in the examination
system and also with the extra resources that were targeted on the upper secondary
school, the socialists intended to reduce the role offrontisteria. They also attempted to
reduce the outflow of Greek students to foreign universities by targeting extra resources
on the tertiary level and by creating new places in Greek universities. Until 2000,
numerus clausus was a dominant characteristic of the Greek tertiary level.
The programme Education 2000 as well as Law 2525 of 1997 were fiercely resisted by
certain social forces who had vested interests in the old state of affairs. These social
forces include (a) those involved infrontisteria and private tutoring, (b) the secondary
52
school teachers who faced the prospect of being selected and appraised with objective
criteria, (c) those in the network of studies at foreign universities (preparation,
foundation courses, diplomas etc.), and (d) university teachers and lecturers in existing
departments which were competitive with newly introduced departments. In the field of
educational policy, these forces soon joined their voices and the opposition parties
found a fertile ground for challenging the government on the issue of education. The
Greek Communist Party sought to take advantage of secondary students' uncertainties
about the newly established examination system. The strategy of the Communists was
to gain control of the school committees, which were supposed to represent students'
voice in the administration of the schools. Soon a so-called 'national co-ordination
committee for taking over schools' was created by secondary students affiliated with the
Communist Party. The members of this committee were not elected by students but
appointed by adults in the headquarters of the Communist Party (personal
communication). A number of non-elected 'co-ordinators' - also appointed by the
Communist Party - addressed secondary school students through the media (television
and radio) urging them to close their schools and resist the educational reform. The
representatives of more moderate school committees were excluded from membership
of the national co-ordination committee (personal communication). At the same time,
secondary school teachers joined their voices to the voices of their students and asked
for the abolition of the new education Law (2525 of 1997). A few months earlier
teachers had lost their battle against the governmental plans for the abolition of
epetirida (the official waiting list for appointment to a teaching job) and the
introduction of educational evaluation. Now that the government wanted to implement a
new educational policy, teachers had a chance to regain what they had lost.
At this crucial point Greek schools descended into chaos and destruction. Most of the
lyceia were taken over by some of their students. The doors were locked for those
teachers and students who wanted to continue their classes. People from outside the
schools intruded and joined the students who were inside. Noone could actually control
who slept in the schools at night or who the people from outside were. The schools
remained closed from October 1998 to February 1999. When they opened again, the
extent of the damage was great. This however happened only in the state sector. In the
private lyceia the new system worked excellently, an indicator that the new law, even
with its weak points, could function. The extent of the catastrophe in the state sector,
however, was disheartening. The situation was described in The Guardian of26 January
53
1999. The headline for the report III the newspaper was very poignant: 'A Greek
Tragedy'.
Attempts to reform higher education in Greece have thrown the government and much of the country into c h a 0 S . (oo .) in an extraordinary bid to quash efforts to rep I ace un i v e r sit y entrance exams with continual assessment (oo.) petrol bombs and stones were hurled at riot police. (oo.) Yesterday, as students rallied nation-wide, the powerful secondary school teachers union staged the second of a series of one-day strikes against the ruling socialists' tough new [teachers'] recruitment pol ice s. (oo.) For the past two months most [schools] have been occupied by youngsters, protesting against a law many had hoped would make tertiary education more accessible. ( ... ) The scale of unrest has shocked the nation. ( ... ) Students - some as young as 10 - have moved onto the streets, erecting makeshift roadblocks with desks, chairs and rubbish bins. (oo.) Greece is home to one of the most antiquated education systems in the west. Historically low educational budgets have ensured teaching methods and facilities - not least libraries - lag far behind those of other ED states. ( ... ) But the government has made it clear: education has now become a cornerstone of its determination to modernise the country. (Smith, 1999, page i, emphasis added).
The fact that some of the students who took over their schools were 10-year-olds, is an
indication that teachers might be behind the take-overs. In the current researcher's
opinion, teachers should themselves have the courage to challenge the policies that they
dislike. In no case, however, should they use children's voices as their shield. The take
overs did not stop the educational reform but invalidated some parts of it. Many schools
remained closed for as long as three months. In the eyes of an educational researcher
few things are worse than the sight of a closed or damaged school. The next sections
describe the new type of higher secondary school which was designed by the policy
makers and resisted by the teachers.
2.3.2. A NEW TYPE OF COMPREHENSIVE SCHOOL
Regarding upper secondary education, the first aim of Law 2525 was the expansion of
comprehensive schooling in Greece. Three of the four forms of Greek higher secondary
school - the general lyceum, the technical/vocational lyceum, and polyvalent lyceum -
were merged into one flexible type of comprehensive school: named' eniaio (integrated)
lyceum'. The eniaio lyceum was based on the polyvalent lyceum of the past. The
polyvalent lyceum was an experimental form of comprehensive higher secondary school
54
with 17 different Directions (programmes or 'branches') of studies. The integrated
lyceum had only three such Directions. The polyvalent lyceum could not function in the
sparsely populated areas of Greece. By cutting down the size of the polyvalent lyceum,
the government tried to make the eniaio lyceum the only form of comprehensive higher
secondary school in the country. The new form of lyceum consists of three Directions of
studies: (a) the Humanities Direction (arts), (b) the Sciences Direction (sciences), and
(c) the Technology Direction (technical or technological). From now on the eniaio
lyceum will also be referred to as the 'integrated lyceum'.
Until the introduction of the eniaio lyceum with Law 2525 of 1997 Greek higher
secondary schools had not been comprehensive, except for the 25 polyvalent lyceia
mentioned in the previous section. Polyvalent lyceia were scattered throughout the
country and had functioned on an experimental basis since their introduction in 1984.
The two main disadvantages were their enormous size and the high cost per pupil.
Moreover, polyvalent lyceia needed a very big area in order function properly and as a
consequence they did not succeed in the sparsely populated areas of the Greek
periphery, like the small islands and the small mountain towns. After the recent
educational reform, the existing polyvalent lyceia reduced the number of Directions that
they offered in order to function as integrated lyceia. On the other hand, the former
generallyceia, which up to then had formed the majority of upper secondary schools in
Greece, as well as the technical/vocational lyceia, increased the number of their
Directions from one to three. Thus all Greek lyceia today offer three Directions of
studies in their final two years. The programme of studies in the three years of
integrated lyceum is dictated by the Ministry of Education. All students are issued with
one textbook per subject. The textbooks are the same for all students in every lyceum.
They are published and disseminated by the National Organisation for the Editing of
Textbooks (OEL'lB) and they are free.
2.3.2.1. The first year of integrated lyceum
The first year in the integrated (eniaio) lyceum is a year of orientation. In September of
each school year, students are examined in four papers for diagnostic purposes. These
papers are Greek Language, Physics and Chemistry, Mathematics, and a foreign
language. During the year, students are taught 10 common subjects or subjects of
'General Education' for 29 hours per week. They also have to choose one subject of
'specialisation' (two hours per week) from a list of such subjects. Students can select
55

another (second) subject of specialisation (two hours per week), thus being taught for 33
hours weekly in total. The subjects for General Education and specialisation are
presented in Table 2.9.
Table 2.9 Subjects in the first year of integrated lyceum.
Subjects for General Education
Greek Orthodox Religion (Catechism) Greek Language (Ancient and Modem) History Mathematics Physics and Chemistry Foreign Language Introduction to Economics Technology Physical Education Vocational Orientation
Subjects for specialisation
Second Foreign Language Origins of European Culture Applied Computing Skills Music, Drama, Fine Arts Psychology
Note: Students must select one or two subject(s) for specialisation.
2.3.2.2. The second year of integrated lyceum
In the second year of integrated lyceum, the syllabus is divided into three kateflhinseis,
which are programmes or 'Directions' of studies. There is a common core of eight
subjects for General Education, but in the second year of lyceum students must also
attend three 'Direction' subjects. As was mentioned in Section 2.3.2 the Directions, are:
(a) the 'Humanities', (b) the 'Sciences', and (c) the 'Technology'. The subjects that are
offered in the second year of integrated lyceum are presented in Table 2.10.
56
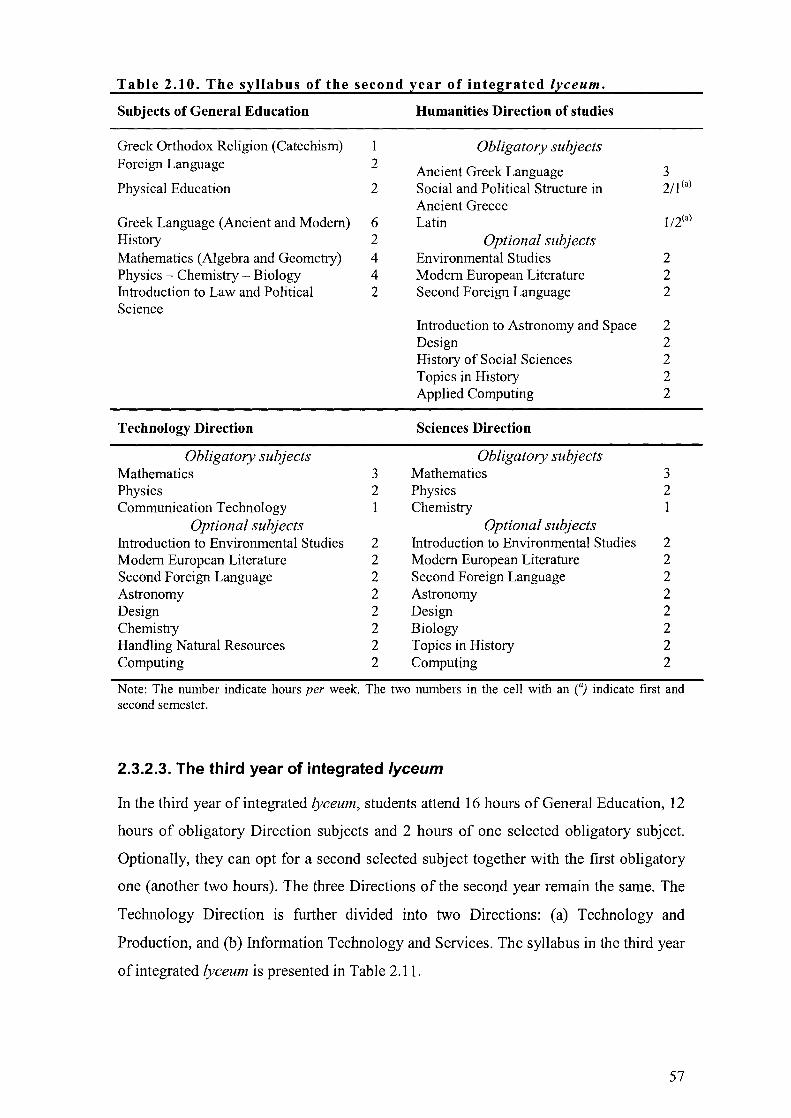
Table 2.10. The sl:llabus of the second l:ear of integrated lJ:.ceum.
Subjects of General Education Humanities Direction of studies
Greek Orthodox Religion (Catechism) Obligatory subjects Foreign Language 2
Ancient Greek Language 3 Physical Education 2 Social and Political Structure in 211 Cal
Ancient Greece Greek Language (Ancient and Modem) 6 Latin I/2Cal
History 2 Optional subjects Mathematics (Algebra and Geometry) 4 Environmental Studies 2 Physics - Chemistry - Biology 4 Modem European Literature 2 Introduction to Law and Political 2 Second Foreign Language 2 Science
Introduction to Astronomy and Space 2 Design 2 History of Social Sciences 2 Topics in History 2 Applied Computing 2
Technology Direction Sciences Direction
Obligatory subjects Obligatory subjects Mathematics 3 Mathematics 3 Physics 2 Physics 2 Communication Technology 1 Chemistry I
Optional subjects Optional subjects Introduction to Environmental Studies 2 Introduction to Environmental Studies 2 Modem European Literature 2 Modem European Literature 2 Second Foreign Language 2 Second Foreign Language 2 Astronomy 2 Astronomy 2 Design 2 Design 2 Chemistry 2 Biology 2 Handling Natural Resources 2 Topics in History 2 Computing 2 Computing 2
Note: The number indicate hours per week. The two numbers in the cell with an C) indicate first and second semester.
2.3.2.3. The third year of integrated lyceum
In the third year of integrated lyceum, students attend 16 hours of General Education, 12
hours of obligatory Direction subjects and 2 hours of one selected obligatory subject.
Optionally, they can opt for a second selected subject together with the first obligatory
one (another two hours). The three Directions of the second year remain the same. The
Technology Direction is further divided into two Directions: (a) Technology and
Production, and (b) Information Technology and Services. The syllabus in the third year
of integrated lyceum is presented in Table 2.11.
57
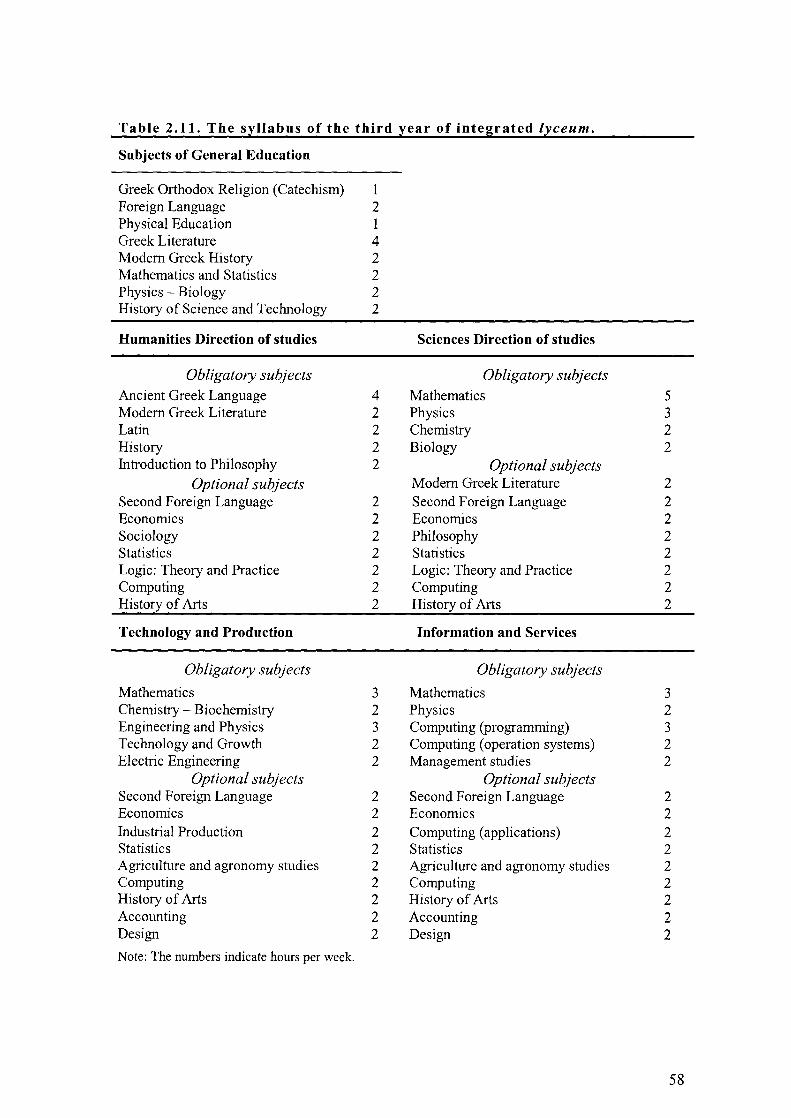
Table 2.11. The syllabus of the third year of integrated lyceum.
Subjects of General Education
Greek Orthodox Religion (Catechism) 1 Foreign Language 2 Physical Education 1 Greek Literature 4 Modem Greek History 2 Mathematics and Statistics 2 Physics - Biology 2 History of Science and Technology 2
Humanities Direction of studies Sciences Direction of studies
Obligatory subjects Obligatory subjects Ancient Greek Language 4 Mathematics 5 Modem Greek Literature 2 Physics 3 Latin 2 Chemistry 2 History 2 Biology 2 Introduction to Philosophy 2 Optional subjects
Optional subjects Modem Greek Literature 2 Second Foreign Language 2 Second Foreign Language 2 Economics 2 Economics 2 Sociology 2 Philosophy 2 Statistics 2 Statistics 2 Logic: Theory and Practice 2 Logic: Theory and Practice 2 Computing 2 Computing 2 History of Arts 2 History of Arts 2
Technology and Production Information and Services
Obligatory subjects Obligatory subjects
Mathematics 3 Mathematics 3 Chemistry - Biochemistry 2 Physics 2 Engineering and Physics 3 Computing (programming) 3 Technology and Growth 2 Computing (operation systems) 2 Electric Engineering 2 Management studies 2
Optional subjects Optional subjects Second Foreign Language 2 Second Foreign Language 2 Economics 2 Economics 2 Industrial Production 2 Computing (applications) 2 Statistics 2 Statistics 2 Agriculture and agronomy studies 2 Agriculture and agronomy studies 2 Computing 2 Computing 2 History of Arts 2 History of Arts 2 Accounting 2 Accounting 2 Design 2 Design 2
Note: The numbers indicate hours per week.
58

2.3.3. NATIONAL EXAMINATIONS AT THE END OF INTEGRATED LYCEUM AND THE COMPLEX SYSTEM OF GRADING
The law of educational reform introduced a new type of national examination. The
students in the end of the second and third year of integrated lyceum sit for
examinations that take place in their own schools buildings. In the second year of
integrated lyceum, students are examined in 11 common subjects and 3 or 4 direction
subjects (see Table 2.10). In the end of the third year, the students are examined in 8
common subjects and 5 or 6 Direction subjects (see Table 2.11). The students who
finish the second year are also examined in a general ability test, the grade of which is
exclusively used for entrance in the tertiary level. The subjects that are examined in the
second and third year of the integrated lyceum are presented in the two following tables.
Table 2.12. Subjects examined nationally in the second year of lyceum.
Subjects of general education
Ancient Greek Language Modem Greek Language Algebra Geometry Physics Chemistry Biology History Religion (Greek Orthodox Catechism) Foreign Language Introduction to Law and Political Science
grade
B1 B2
B3(a) B3(a)
B4 BS B6 B7 B8 B9
B10
Direction subjects grade
Obligatory 151 Direction obligatory subject B 11 2nd Direction obligatory subject B 12 3rd Direction obligatory subject B 13
Optional 151 Direction optional subject B 14
Note: Algebra and Geometry are examined separately but only one grade - the mean - is extracted.
Table 2.13. Subjects examined nationally in the third year of lyceum.
Subjects of general education grade Direction subjects grade
Obligatory Greek Literature G1 151 Direction obligatory subject G9 Mathematics and Statistics G2 2nd Direction obligatory subject G10 Physics G3 3rd Direction obligatory subject GIl Biology G4 41h Direction obligatory subject G12 Modem Greek History GS Slh Direction obligatory subject G13(a) History of Science and Technology G6 Optional Religion (Greek Orthodox Catechism) G7 151 Direction optional subject G14 Foreign Language G8
Note: Sciences Direction has only four obligatory Direction subjects.
59
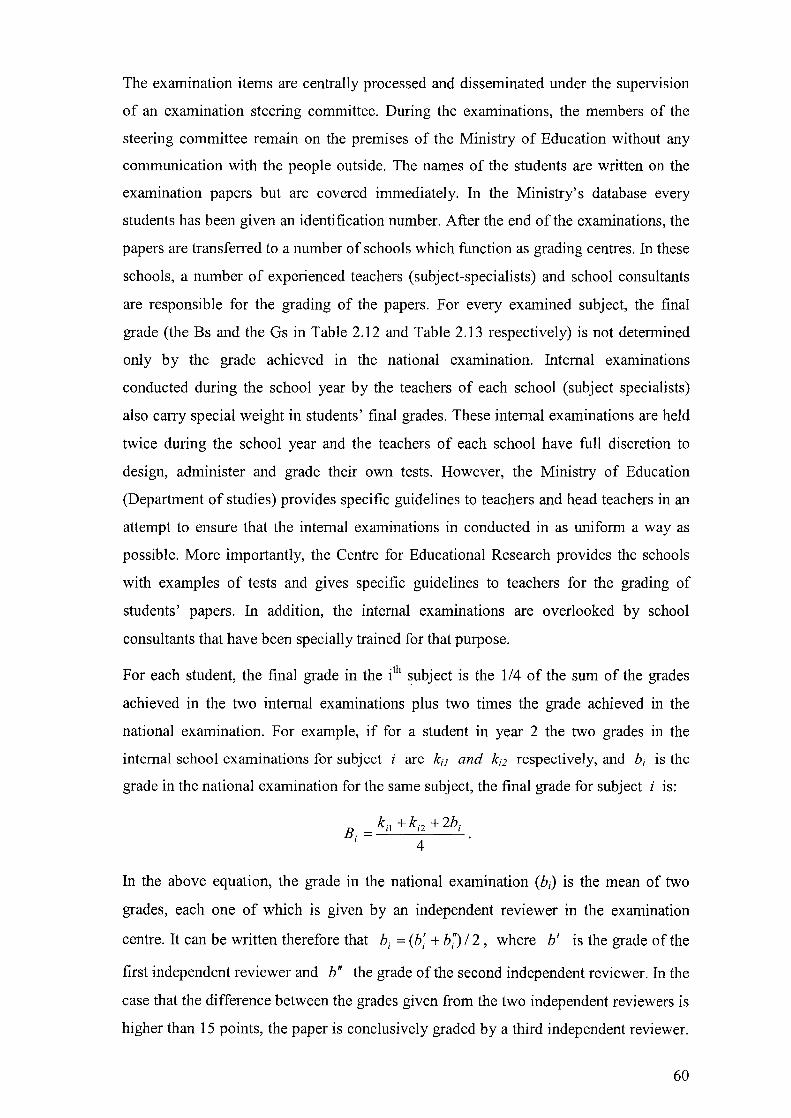
The examination items are centrally processed and disseminated under the supervision
of an examination steering committee. During the examinations, the members of the
steering committee remain on the premises of the Ministry of Education without any
communication with the people outside. The names of the students are written on the
examination papers but are covered immediately. In the Ministry's database every
students has been given an identification number. After the end of the examinations, the
papers are transferred to a number of schools which function as grading centres. In these
schools, a number of experienced teachers (subject-specialists) and school consultants
are responsible for the grading of the papers. For every examined subject, the final
grade (the Bs and the Gs in Table 2.12 and Table 2.13 respectively) is not determined
only by the grade achieved in the national examination. Internal examinations
conducted during the school year by the teachers of each school (subject specialists)
also carry special weight in students' final grades. These internal examinations are held
twice during the school year and the teachers of each school have full discretion to
design, administer and grade their own tests. However, the Ministry of Education
(Department of studies) provides specific guidelines to teachers and head teachers in an
attempt to ensure that the internal examinations in conducted in as uniform a way as
possible. More importantly, the Centre for Educational Research provides the schools
with examples of tests and gives specific guidelines to teachers for the grading of
students' papers. In addition, the internal examinations are overlooked by school
consultants that have been specially trained for that purpose.
For each student, the final grade in the ith subject is the 1/4 of the sum of the grades
achieved in the two internal examinations plus two times the grade achieved in the
national examination. For example, if for a student in year 2 the two grades in the
internal school examinations for subject i are kif and ki2 respectively, and bi is the
grade in the national examination for the same subject, the final grade for subject i is:
B. = kil +ki2 +2bi I 4
In the above equation, the grade in the national examination (bD is the mean of two
grades, each one of which is given by an independent reviewer in the examination
centre. It can be written therefore that bi = (b; + b;') 1 2, where b' is the grade of the
first independent reviewer and b" the grade of the second independent reviewer. In the
case that the difference between the grades given from the two independent reviewers is
higher than 15 points, the paper is conclusively graded by a third independent reviewer.
60
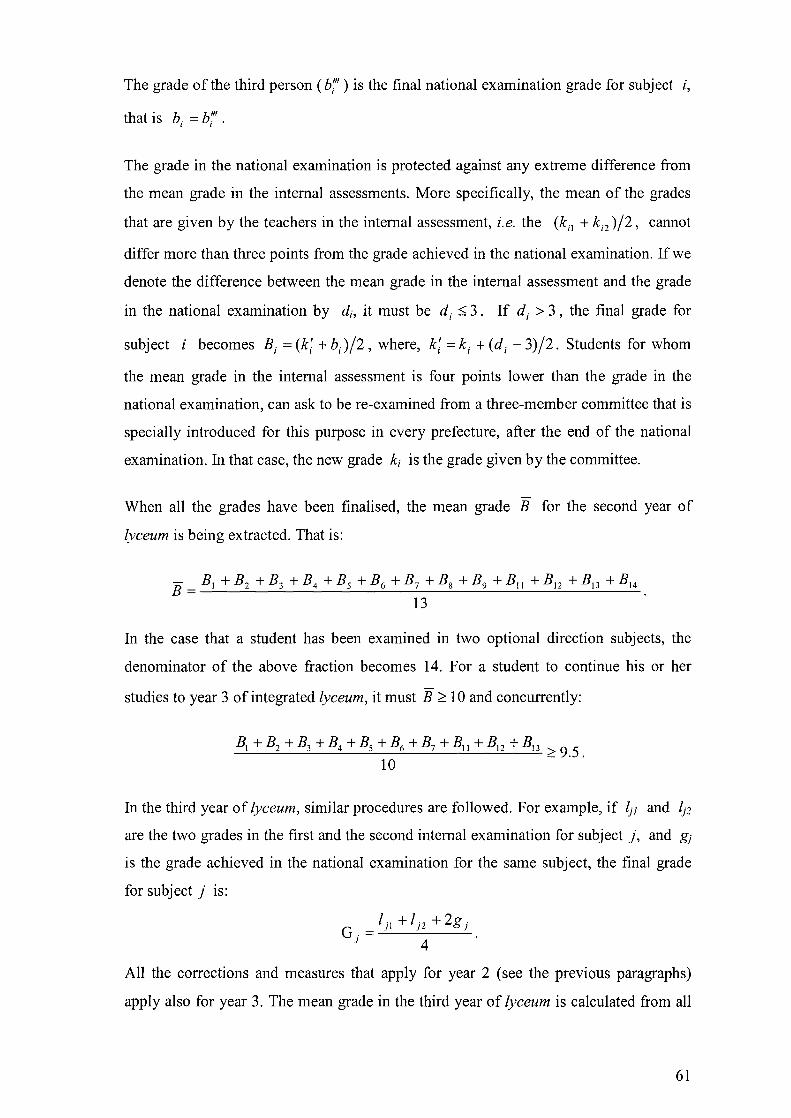
The grade of the third person (b;" ) is the final national examination grade for subject i,
h . b b'" t at IS ; = ; .
The grade in the national examination is protected against any extreme difference from
the mean grade in the internal assessments. More specifically, the mean of the grades
that are given by the teachers in the internal assessment, i.e. the (ki] + k;2 )/2, cannot
differ more than three points from the grade achieved in the national examination. If we
denote the difference between the mean grade in the internal assessment and the grade
in the national examination by di , it must be d;:::; 3. If d; > 3, the final grade for
subject i becomes B; = (k; + b; )/2, where, k; = k; + (d; - 3)/2. Students for whom
the mean grade in the internal assessment is four points lower than the grade in the
national examination, can ask to be re-examined from a three-member committee that is
specially introduced for this purpose in every prefecture, after the end of the national
examination. In that case, the new grade ki is the grade given by the committee.
When all the grades have been finalised, the mean grade B for the second year of
lyceum is being extracted. That is:
- B1 + B2 + B3 + B4 + Bs + B6 + B7 + Bg + B9 + Bll + B12 + B13 + B14 B=~--~--~--~--~--~--~--~--~--~---=--~-----
13
In the case that a student has been examined in two optional direction subjects, the
denominator of the above fraction becomes 14. For a student to continue his or her
studies to year 3 of integrated lyceum, it must B ~ 10 and concurrently:
B1 + B2 + B3 + B4 + Bs + B6 + B7 + B11 + B12 + B13 ~ 9.5. 10
In the third year of lyceum, similar procedures are followed. For example, if ljl and Ij2
are the two grades in the first and the second internal examination for subject j, and gj
is the grade achieved in the national examination for the same subject, the final grade
for subject j is:
/'1 + 1'2 + 2g . G. = J J J
J 4
All the corrections and measures that apply for year 2 (see the previous paragraphs)
apply also for year 3. The mean grade in the third year of lyceum is calculated from all
61
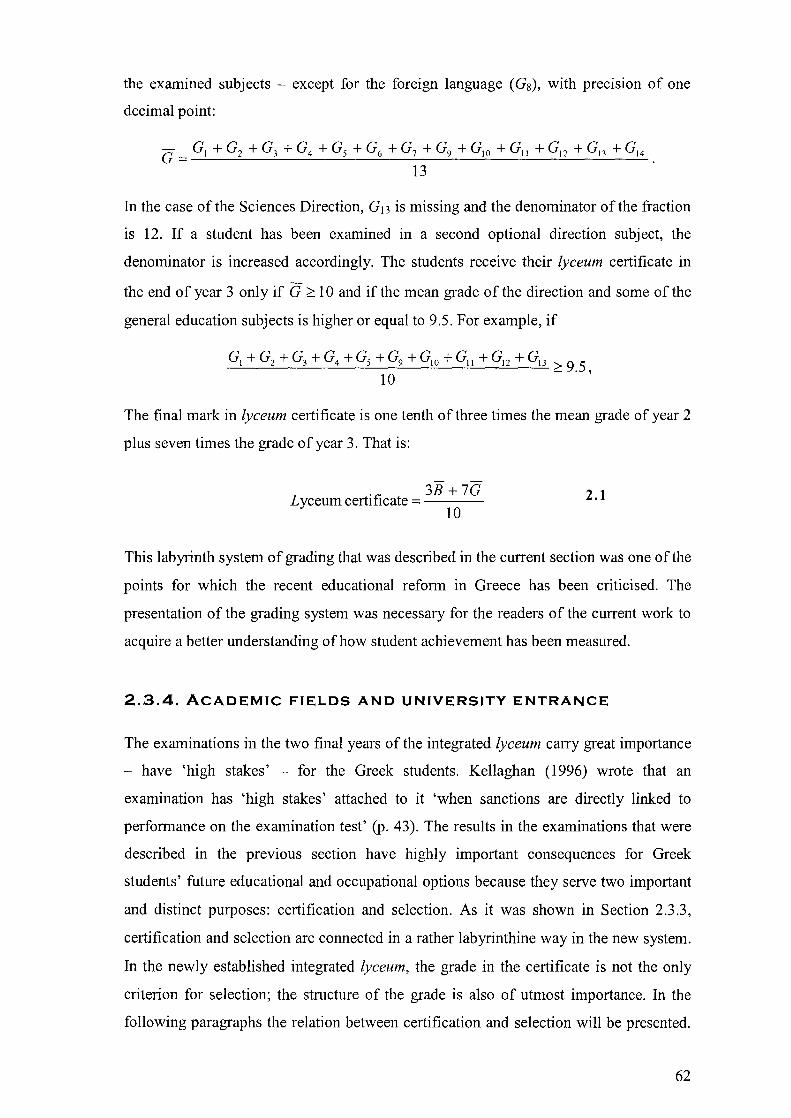
the examined subjects - except for the foreign language (Gs), with precision of one
decimal point:
G = GI +G2 +G3 +G4 +Gs +G6 +G7 +G9 +GJO +GII +G12 +G13 +G14 13
In the case of the Sciences Direction, G13 is missing and the denominator of the fraction
is 12. If a student has been examined in a second optional direction subject, the
denominator is increased accordingly. The students receive their lyceum certificate in
the end of year 3 only if G ~ 10 and if the mean grade of the direction and some of the
general education subjects is higher or equal to 9.5. For example, if
GI + G2 + G3 + G4 + Gs + G9 + GJO + GIl + GI2 + GI3 ~ 9.5, 10
The final mark in lyceum certificate is one tenth of three times the mean grade of year 2
plus seven times the grade of year 3. That is:
. 3B + 7G Lyceum certIficate = ---
10 2.1
This labyrinth system of grading that was described in the current section was one of the
points for which the recent educational reform in Greece has been criticised. The
presentation of the grading system was necessary for the readers of the current work to
acquire a better understanding of how student achievement has been measured.
2.3.4. ACADEMIC FIELDS AND UNIVERSITY ENTRANCE
The examinations in the two final years of the integrated lyceum carry great importance
- have 'high stakes' - for the Greek students. Kellaghan (1996) wrote that an
examination has 'high stakes' attached to it 'when sanctions are directly linked to
performance on the examination test' (p. 43). The results in the examinations that were
described in the previous section have highly important consequences for Greek
students' future educational and occupational options because they serve two important
and distinct purposes: certification and selection. As it was shown in Section 2.3.3,
certification and selection are connected in a rather labyrinthine way in the new system.
In the newly established integrated lyceum, the grade in the certificate is not the only
criterion for selection; the structure of the grade is also of utmost importance. In the
following paragraphs the relation between certification and selection will be presented.
62

The readers not only will understand the structure and the 'philosophy' behind the new
school but also they will probably get a clearer picture of the data that will be analysed
later in this work.
According to the new law for education, every targeted tertiary institution (university
level or not) is associated with one 'academic field', that is an area of specialisation in
the secondary level (the integrated lyceum). In practice, the academic fields are groups
of interconnected subjects, the grade of which carry special weight for the final
outcome. For example, the grade of 'Mathematics & Statistics' - a subject of General
Education - plays a very important role in the case that a students plans to study
economics but not so much an important role in the case that a student plans to study
Medicine. There are five academic fields: (a) Humanities, Social Sciences and Law, (b)
Exact Sciences, (c) Health Sciences, (d) Technology, and (e) Economics and
Management.
After the examinations, students who plan to continue their studies in the tertiary level
fill in a special form in which they list the institutions that they are targeting. Each
institution offers a limited number of places (numerus clausus) and in the case that there
are more prospective students than places, the ones who enter are those who have
gathered more points and have the targeted institution higher on their list. The greater
possible number of points is 200. The points are calculated as follows:
Table 2.14. Points for university entrance (June 2000).
Grades
Certificate of integrated lyceum General Ability Test First subject of the academic field Second subject of the academic field
Total
Weight
7.5 1 (3)
1 0.5
Points
20x 7.5=150 20x 1=20 20x 1=20
20xO.5=1Q
200 3 During 2000-2001, the General Ability Test was not applied. The weight attached to it was thus distributed to the first and second subject of the academic field (see also Appendix, p. 352).
The first and the second subjects of academic field in Table 2.14 are Direction subjects.
In the case that a student changes Direction, the first and the second subjects of the
academic field are replaced by two subjects of General Education. In this case, the
weight for the first subject is reduced to 0.7 and the weight for the second subject is
reduced to 0.3. Thus, in the case that a student changes Direction, the higher possible
63
score for university entrance is not 200 but190 points. As it can be seen, the grading
system is very complex.
To add to the complexity that was described above, the grading system changed when
the new Minister of education, Mr. Efthimiou, took office. Specifically, the nationally
examined subjects at the final year of lyceum have been dramatically reduced and the
weights are now different (see Appendix in pabe 352). In addition, the examinations at
the second year of lyceum have been essentially invalidated, as the students who fail in
them now have a 'second' chance in September (the nature of September's
examinations is discussed in Section 6.1). However, the changes that were introduced
by the new Minister Mr. Efthimiou in 2001 are not applicable to the analysis of the
current study, which is based on students' results for the year 2000.
64

2.4. POLICY ANALYSIS III: EDUCATIONAL EVALUATION IN GREECE
2.4.1. A BRIEF HISTORY OF EDUCATIONAL EVALUATION
Because educational evaluation is a significant component in the current thesis, a
special section of policy analysis is dedicated to it. Thus in the current section,
educational evaluation will be approached from a historical and comparative point of
view. Three texts have set the basis for the literature review in the current section:
Fourth Generation Evaluation by Guba & Lincoln (1989), Assessment: Problems,
Developments and Statistical Issues by Goldstein & Lewis (1996), and Assessment in
Historical Perspective by Wilbrink (1997).
It seems that educational evaluation was born in Europe. For researchers like Eckstein
& Noah (1993) and Webber (1989) the roots of educational evaluation can be seen in
Imperial China since in this country we have the first written examinations in history.
Wilbrink (1997), however, states that examinations in China were for selection for
higher administrational positions and were not concerned with teaching and learning.
Possible influences of educational evaluation from the Muslim world should also be
noted. According to Makdisi (1981), wise Muslim teachers - the equivalent of Christian
Masters - themselves certified the ability of their students. In contrast, in Europe after
1200 AD the certification of learning took place in universities. In the universities of
Paris, Oxford and Cambridge the evaluation took the form of public confrontation: One
Master would support a position while the students of another Master undertook to
demolish this position.
During the Middle Ages, students the European universities were classified in a list
according to their academic and extracurricular achievements. Only in the 18th and 19th
centuries with the creation of the nation-state and an increase in the number of people
who took university courses ranking lists gave their place to grades of academic
performance. With the new system of grades the students could get the same marks and
found themselves in the same position in the evaluation list. Two countries that are late
in replacing lists with grades are the United States and the UK. The former was late in
achieving nation identity, whereas in the later, the University of Oxbridge confers a
65

umque status. As is well known, public confrontation takes place even in modern
universities in the framework of examinations for the award of a doctorate degree (the
viva voce).
At the beginnings of the 20th century, the term 'educational evaluation' was identified
with the term 'measurement'. It was the post Darwin era and theories of 'scientific
management' in education gained currency. From a methodological point of view,
researchers were trying to use 'scientific' methods in the study of social phenomena. In
this context, the developments in Statistics in the early 20th century and the construction
of the first Intelligence Test by Binet, provided the fertile ground for the educational
evaluation of the 'first generation'. The main characteristic of the first generation of
educational evaluation is that evaluations were tended to be based on 'objective' tests
and were exclusively focused on students' achievement (Guba & Lincoln, 1989; Russell
& Willinsky, 1997).
After the First World War, a reorientation of educational thought took place. Educators
in the USA turned their attention from teaching academic knowledge towards teaching
things that would be useful for life outside the school. This reorientation turned the
interest of evaluators from the persons (the students) to the content (the curriculum). In
this context, the work of Smith & Tyler (1942) on educational objectives became the
line that separated 'assessment' from 'evaluation' in education. Evaluation ought to be
'formative', in other words to help to the formation of educational objectives and
methods. From the decade of 1950 and after, evaluation acquired an another
characteristics: the characteristic of 'decision'. In the the Cold War, educational
objectives were thought not only as something that needed to be clearly stated but also
as something that should be 'on the right side' and be evaluated as being on the 'right
side'. Guba & Lincoln (1989) expressed the view that after the 1970s educational
evaluation has once more reoriented itself. According to the authors (op. cit.), three
elements prevail in the newest evaluation paradigm: (a) equal participation of all
'stakeholders' in education as regards the objects of evaluation, (b) the ideas of
postmodernism as counterbalance to the modernism of the older generations, and (c) a
constructivistic epistemology as counterbalance to positive and 'scientific' methods of
the previous generations. A critique of these ideas can be found in Section 4.1 of the
current work.
66
Some more information on the epistemological assumptions of educational evaluation
can be derived from Scriven. In his paper 'evaluation as a discipline' (1994) Scriven
provides an epistemological framework for seeing for all types of evaluation (not only
educational evaluation). Scriven's possible epistemological positions for evaluation are:
(a) the 'strong decision view' in which evaluators conduct investigations aiming to
arrive at evaluative conclusions;
(b) the 'weak decision support' view, in which the evaluators collect decision-relevant
data but do not go as far as evaluate conclusions;
(c) the 'relativistic' view, in which the evaluators uses their clients' value framework;
(d) the 'rich description' approach which is more a kind of ethnographic or journalistic
enterprise and in which the evaluators also do not make evaluative statements;
(e) the 'social progress' evaluation, established by a group of Stanford academics who
denied the importance of summative evaluation; and
(f) the 'constructivist' or 'fourth generation' evaluation, supporters of which argue that
evaluation, as well as the reality, is nothing but a social construct.
2.4.2. SCHOOL SELF-EVALUATION
Closely related to the content of the previous section and to the research questions of the
current study is the idea for the self-evaluation of the school. The idea for school self
evaluation was mainly explored in the 1980s. At that decade self-evaluation was seen as
a strategy that could both strengthen the capacity of the school to develop and at the
same time to provide evidence for accountability purposes. Hopkins & Lagerweij
(1996) described school self-evaluation as one of the three most common 'internal'
school improvement programmes of the 1980s. The other two programmes were
'development planning' and 'staff development'. Hopkins & Lageweij (1996) presented
three examples of 'state of art' school self-evaluation programmes:
(a) the Schools Council Guidelines for Internal Review and Development (GRIDS)
project, which was designed to help teachers review and develop the curriculum and
organisation of their schools;
(b) the Institutional Development Programme (IDP), which was based on standardised
questionnaires, consultant support and systematic feedback; and
(c) the Systematic Analysis for School Improvement (SAS) project, which focused on
school organisation and staff development.
67
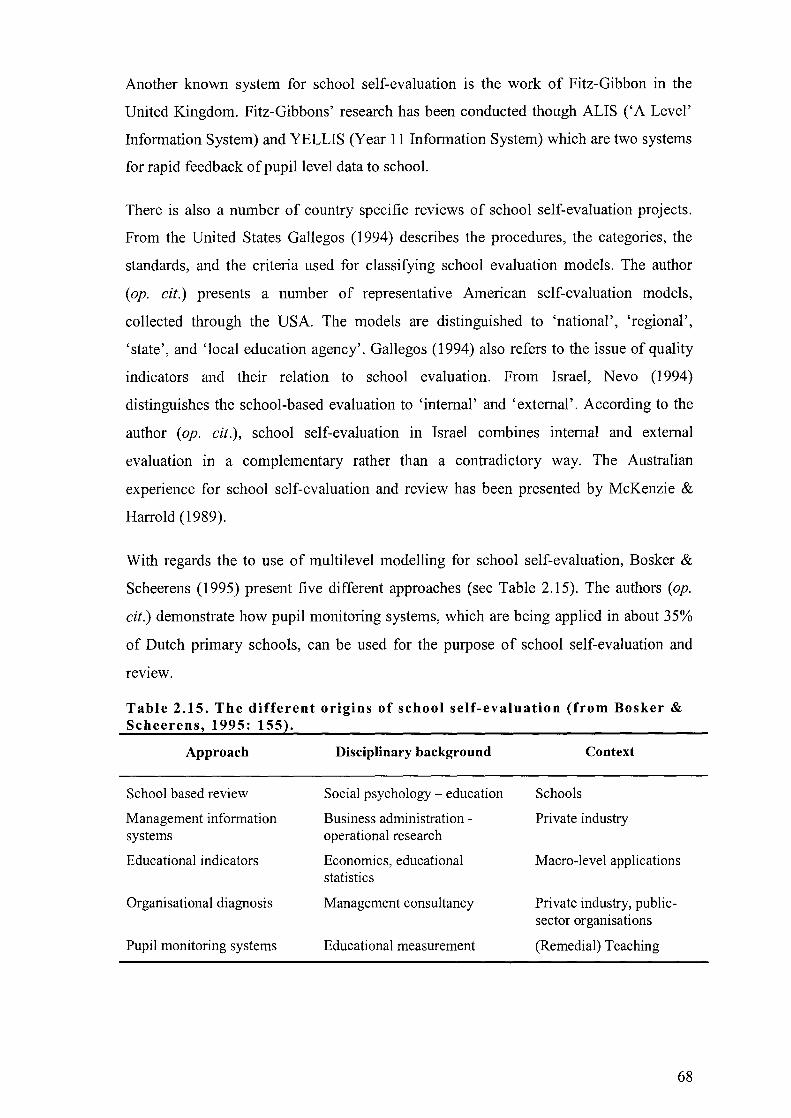
Another known system for school self-evaluation is the work of Fitz-Gibbon in the
United Kingdom. Fitz-Gibbons' research has been conducted though ALIS ('A Level'
Information System) and YELLIS (Year 11 Information System) which are two systems
for rapid feedback of pupil level data to school.
There is also a number of country specific reviews of school self-evaluation projects.
From the United States Gallegos (1994) describes the procedures, the categories, the
standards, and the criteria used for classifying school evaluation models. The author
(op. cit.) presents a number of representative American self-evaluation models,
collected through the USA. The models are distinguished to 'national', 'regional',
'state', and 'local education agency'. Gallegos (1994) also refers to the issue of quality
indicators and their relation to school evaluation. From Israel, Nevo (1994)
distinguishes the school-based evaluation to 'internal' and 'externa1'. According to the
author (op. cit.), school self-evaluation in Israel combines internal and external
evaluation in a complementary rather than a contradictory way. The Australian
experience for school self-evaluation and review has been presented by McKenzie &
Harrold (1989).
With regards the to use of multilevel modelling for school self-evaluation, Bosker &
Scheerens (1995) present five different approaches (see Table 2.15). The authors (op.
cit.) demonstrate how pupil monitoring systems, which are being applied in about 35%
of Dutch primary schools, can be used for the purpose of school self-evaluation and
reVIew.
Table 2.15. The different origins of school self-evaluation (from Bosker & Scheerens, 1995: 155).
Approach Disciplinary background Context
School based review Social psychology - education Schools
Management information Business administration - Private industry systems operational research
Educational indicators Economics, educational Macro-level applications statistics
Organisational diagnosis Management consultancy Private industry, public-sector organisations
Pupil monitoring systems Educational measurement (Remedial) Teaching
68
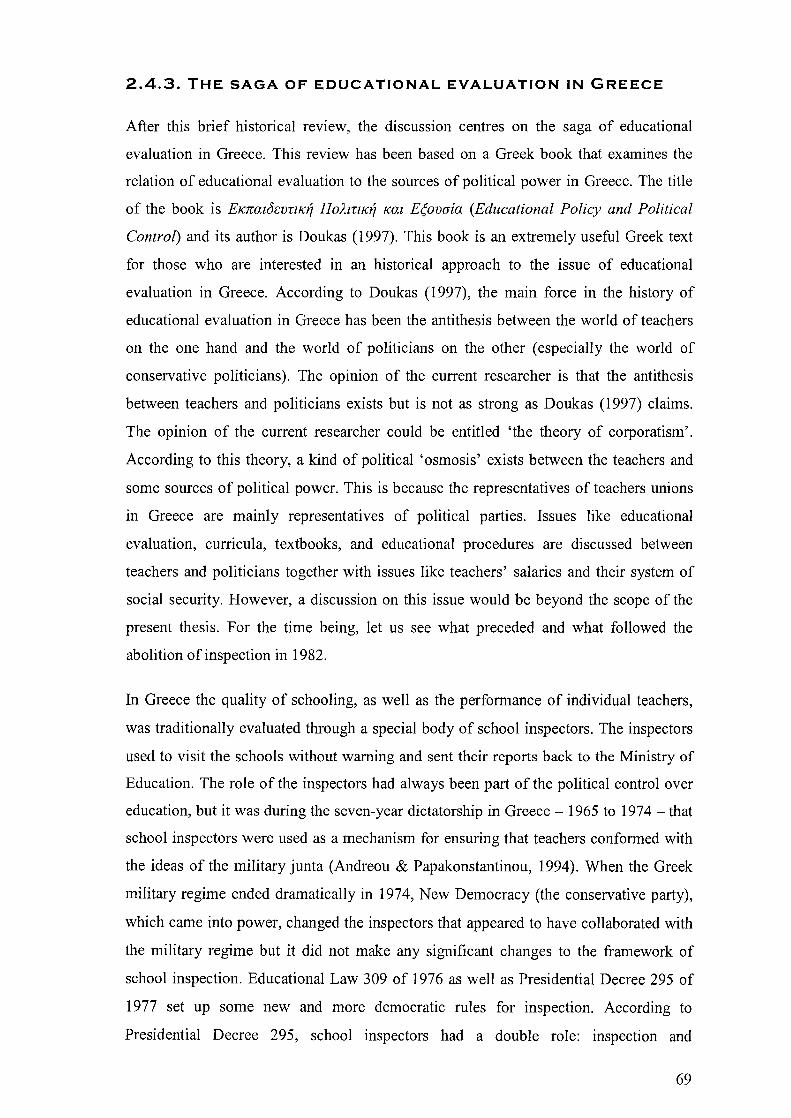
2.4.3. THE SAGA OF EDUCATIONAL EVALUATION IN GREECE
After this brief historical review, the discussion centres on the saga of educational
evaluation in Greece. This review has been based on a Greek book that examines the
relation of educational evaluation to the sources of political power in Greece. The title
of the book is EK7ral&vrrK~ IIoAlTlK~ Kal E(ovaia (Educational Policy and Political
Control) and its author is Doukas (1997). This book is an extremely useful Greek text
for those who are interested in an historical approach to the issue of educational
evaluation in Greece. According to Doukas (1997), the main force in the history of
educational evaluation in Greece has been the antithesis between the world of teachers
on the one hand and the world of politicians on the other (especially the world of
conservative politicians). The opinion of the current researcher is that the antithesis
between teachers and politicians exists but is not as strong as Doukas (1997) claims.
The opinion of the current researcher could be entitled 'the theory of corporatism'.
According to this theory, a kind of political 'osmosis' exists between the teachers and
some sources of political power. This is because the representatives of teachers unions
in Greece are mainly representatives of political parties. Issues like educational
evaluation, curricula, textbooks, and educational procedures are discussed between
teachers and politicians together with issues like teachers' salaries and their system of
social security. However, a discussion on this issue would be beyond the scope of the
present thesis. For the time being, let us see what preceded and what followed the
abolition of inspection in 1982.
In Greece the quality of schooling, as well as the performance of individual teachers,
was traditionally evaluated through a special body of school inspectors. The inspectors
used to visit the schools without warning and sent their reports back to the Ministry of
Education. The role of the inspectors had always been part of the political control over
education, but it was during the seven-year dictatorship in Greece - 1965 to 1974 - that
school inspectors were used as a mechanism for ensuring that teachers conformed with
the ideas of the military junta (Andreou & Papakonstantinou, 1994). When the Greek
military regime ended dramatically in 1974, New Democracy (the conservative party),
which came into power, changed the inspectors that appeared to have collaborated with
the military regime but it did not make any significant changes to the framework of
school inspection. Educational Law 309 of 1976 as well as Presidential Decree 295 of
1977 set up some new and more democratic rules for inspection. According to
Presidential Decree 295, school inspectors had a double role: inspection and
69

consultancy. Inspection continued to be conducted with surprise visits to the schools
and school inspectors' reports remained indirectly connected to teachers' promotion and
pay. However, the inspectors had now to offer model teaching sessions to the teachers.
This was the 'consultancy' part of their work.
Teacher unions initially welcomed the new inspectors and applauded their democratic
role (Vasilou-Papageorgiou, 1990). However, by 1980 teachers' unions had already
started to challenge both the credibility of school inspectors and the validity of their
reports. In 1981, during the first congress of the powerful secondary teachers' union
(OLME), teachers proposed the introduction of a new body of higher educational
officials that would exclusively offer support and advice rather than inspection. The
persons who would form this new body were to be called 'education consultants'
(OLME, 1981). In the general assembly of OLME in 1982, the teachers openly asked
for the abolition of the school inspectorate (OLME, 1982a). The year 1981 was also the
year in which the conservatives lost the elections and the socialists came to power. In
February of 1982, the socialist Minister for Education restricted the duties of school
inspectors and later, with the Law 1304 of 1982, the body of school inspectors was
abolished (Doukas, 1997). The same year a body of school consultants was introduced,
in line with the teachers' proposals. In the educational Law 1304 of 1982, it was written
that school consultants were going to undertake the evaluation of the educational system
and, in order for this to be implemented, a number of presidential decrees needed to be
published (Doukas, 1997).
2.4.4. THE NOTION OF 'EDUCATIONAL WORK' AND ITS EVALUATION
The teachers initially welcomed the prospect of educational evaluation being conducted
by school consultants. However, a few months later they took a U-turn, by arguing that
school consultants should not be allowed to evaluate the teaching personnel. According
to OLME, school consultants should only evaluate teachers' 'educational work'
conducted in schools (OLME, 1982b). It is important to note that the term 'educational
work' was never defined by those who proposed it. Nevertheless, the teachers
anticipated the publication of the necessary presidential decrees for the evaluation and
in 1984 the primary teachers' union (DOE) proposed a framework for the evaluation of
'educational work', an as yet undefined theoretical construct. According to this
framework, the teachers of each school would democratically plan their 'educational
70
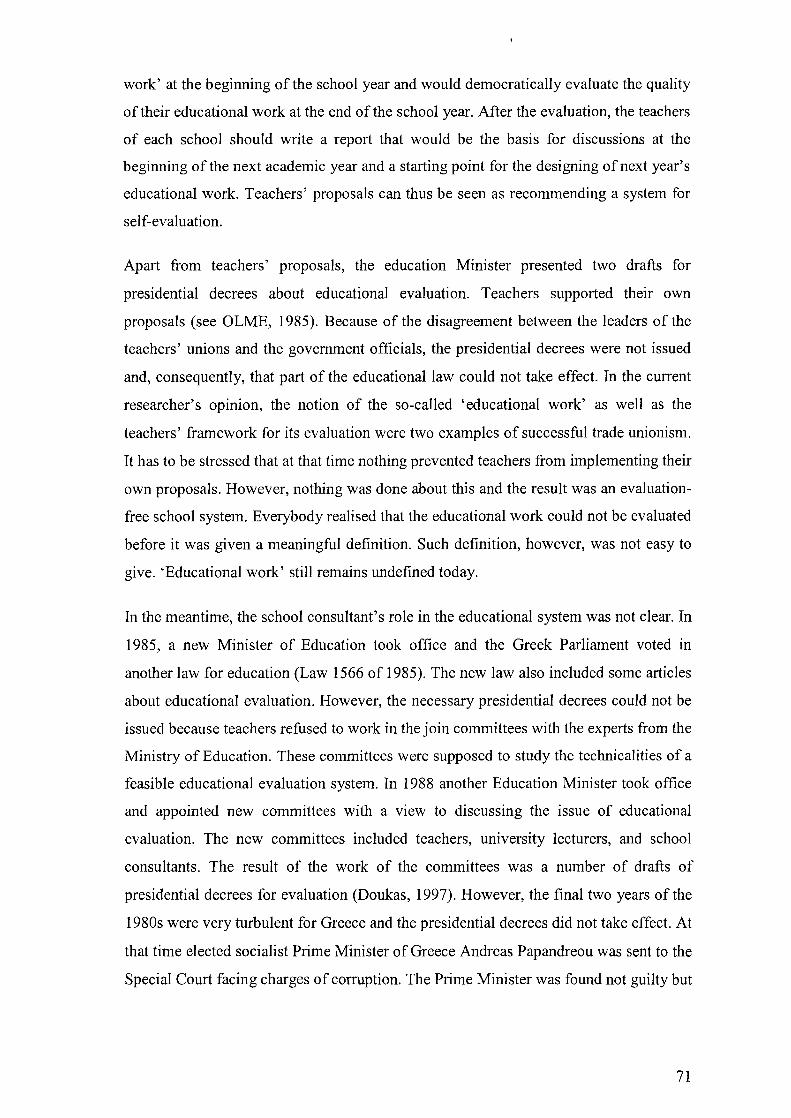
work' at the beginning of the school year and would democratically evaluate the quality
of their educational work at the end of the school year. After the evaluation, the teachers
of each school should write a report that would be the basis for discussions at the
beginning of the next academic year and a starting point for the designing of next year's
educational work. Teachers' proposals can thus be seen as recommending a system for
self-evaluation.
Apart from teachers' proposals, the education Minister presented two drafts for
presidential decrees about educational evaluation. Teachers supported their own
proposals (see OLME, 1985). Because of the disagreement between the leaders of the
teachers' unions and the government officials, the presidential decrees were not issued
and, consequently, that part of the educational law could not take effect. In the current
researcher's opinion, the notion of the so-called 'educational work' as well as the
teachers' framework for its evaluation were two examples of successful trade unionism.
It has to be stressed that at that time nothing prevented teachers from implementing their
own proposals. However, nothing was done about this and the result was an evaluation
free school system. Everybody realised that the educational work could not be evaluated
before it was given a meaningful definition. Such definition, however, was not easy to
give. 'Educational work' still remains undefined today.
In the meantime, the school consultant's role in the educational system was not clear. In
1985, a new Minister of Education took office and the Greek Parliament voted in
another law for education (Law 1566 of 1985). The new law also included some articles
about educational evaluation. However, the necessary presidential decrees could not be
issued because teachers refused to work in the join committees with the experts from the
Ministry of Education. These committees were supposed to study the technicalities of a
feasible educational evaluation system. In 1988 another Education Minister took office
and appointed new committees with a view to discussing the issue of educational
evaluation. The new committees included teachers, university lecturers, and school
consultants. The result of the work of the committees was a number of drafts of
presidential decrees for evaluation (Doukas, 1997). However, the final two years of the
1980s were very turbulent for Greece and the presidential decrees did not take effect. At
that time elected socialist Prime Minister of Greece Andreas Papandreou was sent to the
Special Court facing charges of corruption. The Prime Minister was found not guilty but
71

his party lost the elections. After the elections, the Conservatives took office together
with the Communist Partyl. Thus, the 1980s ended with the problem of educational
evaluation left to be solved in the next decade. It was evident that someone had to cut
this Gordian Knot, to use an expression from Greek mythology. The solution would not
have teachers' acquiescence. None, however, could predict have predicted the tragic
events that followed.
2.4.5. THE POLICY OF THE CONSERVATIVES
The conservative New Democracy party came again to power in 1990, but this time
without the communists. The Minister of Education, George Kontogianopoulos,
published two presidential decrees about educational evaluation. With these presidential
decrees, a behavioural 'point system' was introduced for the students and objective
criteria were introduced for teachers' appraisal at local level. Teachers' unions fought
fiercely against the presidential decrees. Secondary students and their teachers did not
acknowledge the credibility of the law and soon serious riots broke out in the schools.
Students, with their parents' support, and almost all of their teachers on their side,
locked themselves into the schools and refused to open before the presidential decrees
were withdrawn. In a crescendo of events, teams of parents who supported the new
policies tried to reopen the schools. In the serious clashes that took place all over the
country, Nikos Temponeras, a teacher of Mathematics, was killed in his classroom by
an 'angry parent'. The incident took place in the city of Patra, and the 'angry parent'
was the local representative of the conservative party. In the aftermath of this event, the
conservative Minster of Education resigned. He later wrote in a book with reference to
these events:
The clash between the forces of modernisation and the forces of anachronism was unavoidable. The same clash shall be repeated sometimes as a tragedy, sometimes as a farce. Because the hypocrisy has eroded our society and because nobody has the necessary political courage, we all have become the followers of the same dead-end course. ( ... ) These dramatic events were part of a general plan that aimed at bringing turmoil and political anomaly [to the country]. ( ... ) Very irresponsibly and cowardly, the children were brought onto the streets, as if they were living shields, in order that teachers might fulfil their perfidious aims and satisfy their selfish
I In fact the Communist Party was then part of the' Alliance of the Left'.
72
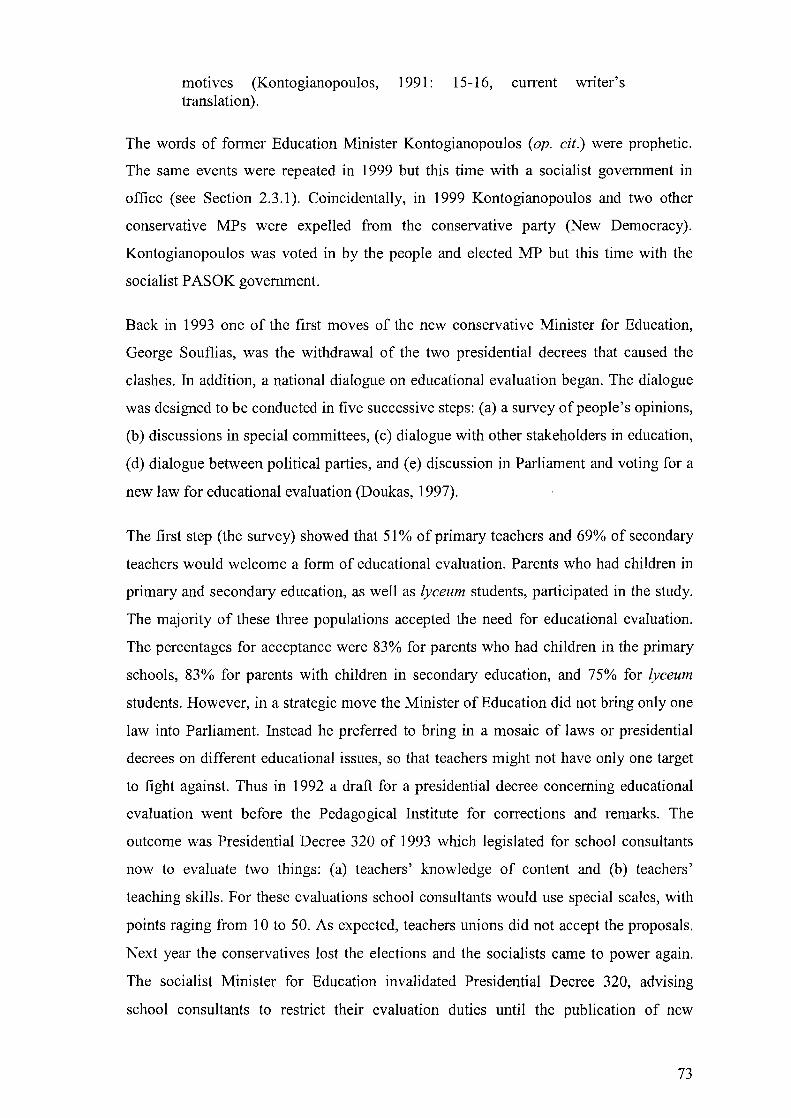
motives (Kontogianopoulos, 1991: 15-16, current writer's translation).
The words of former Education Minister Kontogianopoulos (op. cit.) were prophetic.
The same events were repeated in 1999 but this time with a socialist government in
office (see Section 2.3.1). Coincidentally, in 1999 Kontogianopoulos and two other
conservative MPs were expelled from the conservative party (New Democracy).
Kontogianopoulos was voted in by the people and elected MP but this time with the
socialist P ASOK government.
Back in 1993 one of the first moves of the new conservative Minister for Education,
George Souilias, was the withdrawal of the two presidential decrees that caused the
clashes. In addition, a national dialogue on educational evaluation began. The dialogue
was designed to be conducted in five successive steps: (a) a survey of people's opinions,
(b) discussions in special committees, (c) dialogue with other stakeholders in education,
(d) dialogue between political parties, and (e) discussion in Parliament and voting for a
new law for educational evaluation (Doukas, 1997).
The first step (the survey) showed that 51% of primary teachers and 69% of secondary
teachers would welcome a form of educational evaluation. Parents who had children in
primary and secondary education, as well as lyceum students, participated in the study.
The majority of these three populations accepted the need for educational evaluation.
The percentages for acceptance were 83% for parents who had children in the primary
schools, 83% for parents with children in secondary education, and 75% for lyceum
students. However, in a strategic move the Minister of Education did not bring only one
law into Parliament. Instead he preferred to bring in a mosaic of laws or presidential
decrees on different educational issues, so that teachers might not have only one target
to fight against. Thus in 1992 a draft for a presidential decree concerning educational
evaluation went before the Pedagogical Institute for corrections and remarks. The
outcome was Presidential Decree 320 of 1993 which legislated for school consultants
now to evaluate two things: (a) teachers' knowledge of content and (b) teachers'
teaching skills. For these evaluations school consultants would use special scales, with
points raging from 10 to 50. As expected, teachers unions did not accept the proposals.
Next year the conservatives lost the elections and the socialists came to power again.
The socialist Minister for Education invalidated Presidential Decree 320, advising
school consultants to restrict their evaluation duties until the publication of new
73

presidential decrees (Doukas, 1997). The new presidential decrees, however, were never
issued.
There is an interesting question here: If the lack of educational evaluation is a result of
opposition between the teachers and the politicians, how can we explain the reluctance
of the new socialist government to introduce evaluation? In 1994 the socialist
government was in a very advantageous position as regards the issue of educational
evaluation because the presidential decrees for evaluation had been passed by the
previous conservative government. The only thing that the new socialist Minister of
Education had to do was to implement those presidential decrees. It needs to be
remembered that at that time most parents and teachers were in favour of educational
evaluation (see previous paragraphs). Why did the socialists not implement the
presidential decrees that had already been voted in by the conservative government? If
the 'saga' of educational evaluation in Greece is the result of a continuous controversy
between the world of teachers and the world of politicians, as Doukas (1997) implies,
what made the politicians to loose the battle?
According to the current author, the policy of the socialists in 1994 shows that there is
no real antithesis between teachers and policy makers with regards to the need for
educational evaluation. Educational evaluation in Greece is a negotiable issue, like, for
example, teachers' salaries and social security system. Political parties and teachers'
unions are interlinked. The hypothetical 'controversy' between them is only the surface
of the everyday politics or the theme of academic discussions in educational congresses.
The important things for educational evaluation happen under the surface and inside the
headquarters of the political parties. There is therefore no antithesis between teachers
and policy makers in Greece. Politicised teachers are the real policy makers.
2.4.6. THREE REMAINING PROPOSALS
The next socialist Minister did not initially touch the issue of educational evaluation.
Instead, following the advice of the new president of the Pedagogical Institute, he
introduced a new system for students' assessment. The new examination system
included examinations at the end of each school year, examination at the end of each
term, and portfolio assessment. The plans for educational evaluation however were also
high on the agenda. Michael Kassotakis, the president of the Pedagogical Institute and
the main designer of the new system for students' assessment, wrote in a Greek daily
74

newspaper that 'the new examinations would allow the monitoring of the Greek
educational system and the measurement of the effectiveness of Greek schools'
(Kassotakis, 1994). Secondary teachers did not accept the government's new
examination policy and claimed that the new examination system for students would put
teachers under intolerable pressure (OLME, 1995).
In 1996 another Minister for education took office and Michael Kassotakis, the
president of the Pedagogical Institute became the president of the Centre for
Educational Research (CEE). The task of CEE is mainly to develop appropriate
methods of student assessment. In 1997 the new Minister passed Law 2525 for
education, the 8th article of which set a new framework for educational evaluation. More
specifically, Law 2525 established the foundations for the introduction of Soma
Monimon Axi%giton - the Body of Permanent Evaluators - whose work would be the
evaluation of the school unit and the educational system in general. The elaboration of
the technicalities of the 8th article of Law 2525 and the preparation of the necessary
presidential decrees was assigned to the Pedagogical Institute. However, the people in
the Department of Evaluation of the Pedagogical Institute were working on their own
project for educational evaluation. The project of the Greek Pedagogical Institute was a
combination of two ideas. The first was that the teachers of each school should work
together as researchers in small-scale action-research studies and gather information
through questionnaires, interviews and observations. The second was that each school
would send the gathered information to a special centre, which would provide feedback
to the teachers. According to the proponents of this idea, the Pedagogical Institute's
project should be seen by the schoolteachers as a 'curriculum for educational
evaluation' (Pedagogical Institute, 1999: 29).
In 1998, the project of the Pedagogical Institute was in its third pilot year with five
participating schools. That year the Ministry of Education sent Circular f2/4791 to all
the local education authorities in the country, describing a number of compulsory
procedures for the evaluation of educational work. Later, on 9 of November 1998, the
Pedagogical Institute sent a fax to all the schools (fax no 586) accusing the Ministry of
Education of copying the Institute's ideas and trying to implement a new policy for
evaluation without having the necessary knowledge. According to Ministry Circular
f2/4791, evaluation was to be conducted in schools by the director, the deputy director,
and some of the teachers. The Ministry guidelines were never implemented in the
schools as teachers tacitly ignored them. That academic year the president of the
75

Department of Evaluation of the Pedagogical Institute, Dr. Josef Solomon, resigned. In
1999 the Pedagogical Institute published the book Internal Evaluation and Planning of
the Educational Work in the School, in which the Institute's proposals were explained
and analysed. It was, however, too late for these proposals to find a place in Greek
schools.
Since October of 2001 the procedures for educational evaluation have been changing
again. The advisors to the current Minister for Education must have designed a number
of procedures for the evaluation of educational work, but the new procedures have
neither been finalised nor made known to the public. More information about these new
procedures will be presented in the sixth chapter of the current work, when the issue of
educational evaluation will be reconsidered. At present, there are three proposals for
educational evaluation in Greece: (a) the well-known proposal of the Ministry of
Education (as found in the Law 2525 of 1997), (b) the proposal of the Greek
Pedagogical Institute (as found in the book Internal Evaluation and Planning of the
Educational Work in the School), and (c) teachers' proposals (as found in their union's
publications). The teachers' proposals were restated in the 12th national congress of
primary teachers' unions that took place on the island of Chios in 1998 (DOE-POED,
1998). Another landmark congress as regards the future of educational evaluation in
Greece took place at the University of Patra in May of 2000. The title of the congress
was: 'educational evaluation: how?' Most of the papers at that congress focused on the
ontological question of the evaluation (what is to be evaluated and who defines what is
to be evaluated). A significant number of papers also focused on the epistemological
question of evaluation (what are the limits of our evaluation and how valid is evaluative
research). Only a small number papers focused on the methodological question of
evaluation (how we should evaluate the quality of education in Greece). The papers
presented in the congress - essentially, the first congress on educational evaluation in
Greece - were published in a book with the title Curricula and School Evaluation,
edited by Bagakis (2001). The papers of the current researcher focused on the
methodological and practical perspectives of educational evaluation in Greece (see
Verdis, 2001a). The discussion about educational evaluation in Greece will be
relinquished at this point; it will be resumed in the sixth chapter of the present work. In
the next chapter, the discussion will centre on the notion of educational effectiveness.
76

3. SCHOOL EFFECTIVENESS RE.SEARCH AND THE QUALITY OF EDUCATION SYSTEMS
"Inquiry into school effectiveness is concerned with measuring the quality of schools; of assessing the extent to which schools achieve their goals; and of understanding the characteristics of those schools in which students make greater progress than would be expected from a consideration of their intakes".
Hill, P. (1995) School effectiveness and improvement: present realities and future possibilities. Inaugural Professorial lecture. (University of Melbroune, Faculty of Education).
77

3.1. EFFECTIVENESS IN EDUCATION
3.1.1. THE MEANING OF EDUCATIONAL EFFECTIVENESS
In the previous chapter, the different meanings of educational quality and educational
evaluation were discussed. The formulation of ideas about educational quality and
evaluation in the Greece educational policy context were also described. The current
chapter is more 'technical' and less theoretical than the previous one. Specifically,
Chapter 3 examines different aspects of effectiveness in education. The policy
dimension of the previous chapter has provided a context for the discussion of research
relevant to the theme of the thesis. The current chapter begins with a number of
necessary definitions.
The term 'effectiveness' can be seen In the educational discourse as 'educational
effectiveness', 'school effectiveness', 'instructional effectiveness' and 'resources
effectiveness'. Scheerens & Bosker (1997: 36), following Creemers & Scheerens (1994)
use the terms 'educational effectiveness' to refer to the 'effectiveness of the educational
system in general' (comprising all models of schooling) and 'instructional effectiveness'
to refer to the 'effectiveness of education at the classroom level'. School effectiveness
will be defined later because it lies on the heart of the current thesis. 'Resources
effectiveness' is economically orientated research in the case that the research is
focused on the effective use of educational resource. Cheng (1996: 3) has used the term
'educational efficiency' in order to refer to resources effectiveness studies. There are
also studies which are called 'cost effectiveness' analyses in education. The purpose of
using such analyses has been described by Karadjia-Stavlioti as follows:
The case for using cost effectiveness analysis [in education] is that it integrates the results of activities with their costs in such a way that one can select those activities that provide the best educational results for any given cost or that provide any given level of educational results for the least cost. It is closely related to the efficiency of the educational production (Karadjia-Stavlioti, 1997: p. 123).
Apart from cost effectiveness analyses, researchers in the realms of economy have used
other methods for studying the effective use of resources in education. In the third
78

volume of the series Advances in Educational Productivity, both Walberg (1993) and
Bessent & Bessent (1993) describe a procedure that is known to many economists as
Data Envelopment Analysis (DEA). The idea behind DEA in education is simple. In
two vertical axes y and x, a number of 'cost effective' schools are connected with a
curved line. This line is called 'the front'. Each one of the other schools, which
apparently are not so cost effective, have to use a strategy for improvement that will
bring them near to the school of the front that has similar characteristics.
Except for the studies that focus exclusively on the effective use of resources, the realm
of economics has played an important role in the development of the notion of
educational effectiveness. According to Creemers & Scheerens (1994), the very
meaning of educational effectiveness has its roots in economically oriented studies that
have focused on educational inputs and outputs and are expressed in monetary terms
with the help of educational production functions. These functions are relations between
the supply of selected schooling inputs and educational outcomes, controlling for the
influence of various background features like pupil to teacher ratio, teachers' salary and
per pupil expenditure (Scheerens & Bosker, 1997; see also Hanushek, 1979; Monk
1989, 1992; and Bessent & Bessent, 1993 for a further discussion on such studies). The
research framework of much of the research on educational production functions has
been called by Fuller & Clarke (1994) 'policy mechanics'. According to these authors,
studies related to the educational production functions remain influential and useful
particularly in the context the developing countries. In the developed countries,
however, research has moved beyond this naIve 'input-output' conceptualisations of
educational effectiveness or, to quote Monk (1992), away from the 'fundamentally
primitive black-box formulations' (p. 309).
In addition to the educational production functions, Scheerens & Bosker (1997)
distinguish two other disciplinary backgrounds to educational effectiveness: (a) the
educational psychological approach to effective instruction and learning conditions, and
(b) the generalist-educationalist approach to integrated, multilevel school effectiveness
modelling. These two approaches use models and relations similar to the educational
production functions with the difference that they also include variables in the micro
level like the quality of instruction, the amount of the content that has been covered, the
instruction strategy that has been followed, the motivation of the students, and other
similar conditions of the teaching and learning transaction (Scheerens & Bosker, 1997).
79
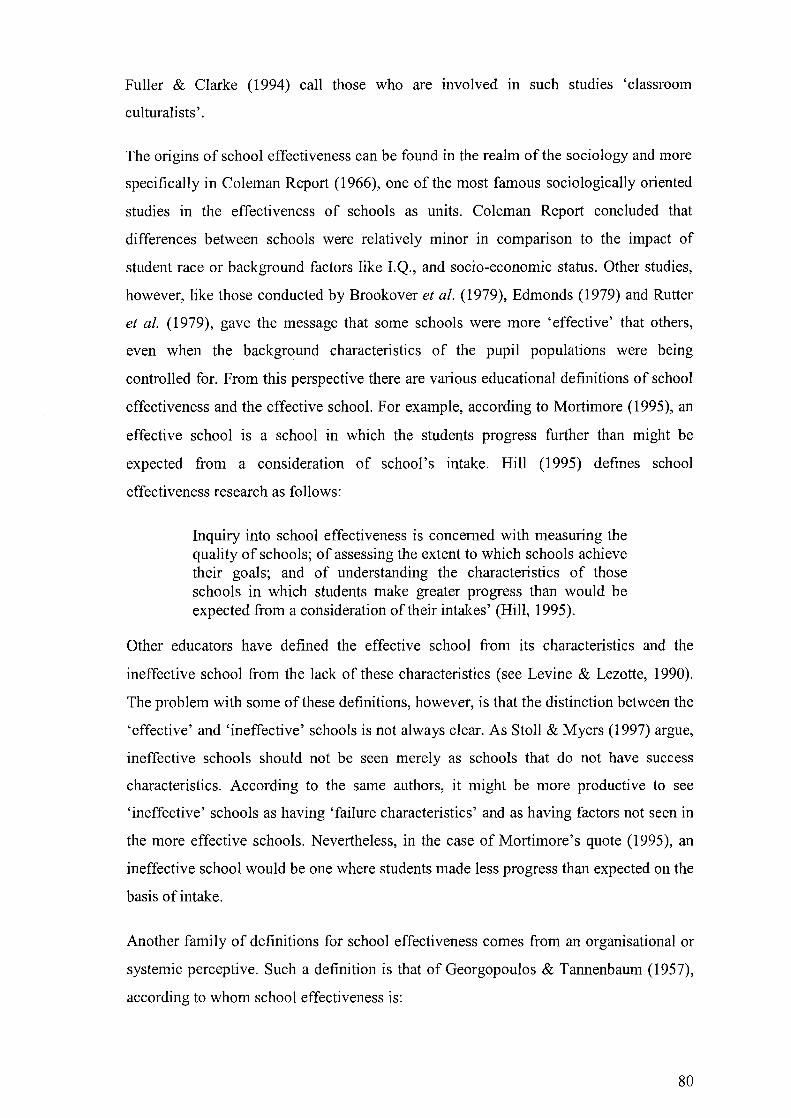
Fuller & Clarke (1994) call those who are involved III such studies 'classroom
culturalists' .
The origins of school effectiveness can be found in the realm of the sociology and more
specifically in Coleman Report (1966), one of the most famous sociologically oriented
studies in the effectiveness of schools as units. Coleman Report concluded that
differences between schools were relatively minor in comparison to the impact of
student race or background factors like LQ., and socio-economic status. Other studies,
however, like those conducted by Brookover et ai. (1979), Edmonds (1979) and Rutter
et al. (1979), gave the message that some schools were more 'effective' that others,
even when the background characteristics of the pupil populations were being
controlled for. From this perspective there are various educational definitions of school
effectiveness and the effective school. For example, according to Mortimore (1995), an
effective school is a school in which the students progress further than might be
expected from a consideration of school's intake. Hill (1995) defines school
effectiveness research as follows:
Inquiry into school effectiveness is concerned with measuring the quality of schools; of assessing the extent to which schools achieve their goals; and of understanding the characteristics of those schools in which students make greater progress than would be expected from a consideration of their intakes' (Hill, 1995).
Other educators have defined the effective school from its characteristics and the
ineffective school from the lack of these characteristics (see Levine & Lezotte, 1990).
The problem with some of these definitions, however, is that the distinction between the
'effective' and 'ineffective' schools is not always clear. As Stoll & Myers (1997) argue,
ineffective schools should not be seen merely as schools that do not have success
characteristics. According to the same authors, it might be more productive to see
'ineffective' schools as having 'failure characteristics' and as having factors not seen in
the more effective schools. Nevertheless, in the case of Mortimore's quote (1995), an
ineffective school would be one where students made less progress than expected on the
basis of intake.
Another family of definitions for school effectiveness comes from an organisational or
systemic perceptive. Such a definition is that of Georgopoulos & Tannenbaum (1957),
according to whom school effectiveness is:
80
The extent to which any (educational) organisation as a social system, given certain resources and means, fulfils its objectives without incapacitating its means and recourses and without placing undue strain upon its members (Georgopoulos & Tannenbaum, 1957, cited in Reynolds et ai., 1996a: 2).
Reynolds et al. (1996) comment on Georgopoulos & Tannenbaum's (1957) definition,
is that with this definition a school can have a low degree of effectiveness but not zero
effectiveness. Another definition of School Effectiveness from an organisational point
of view is that ofMadaus et ai. (1980), who define school effectiveness as:
The extent that there is congruence between its objectives and achievements. In other words it [the school] is effective to the extent that it accomplishes what it sets out to do (Madaus, et al., 1980, cited in OEeD, 1991).
The definition of school effectiveness or what constitutes an effective school is very
important because, according to Stoll & Fink (1996), a definition of effectiveness
influences researchers' orientations and perspectives. According to Robertson &
Sammons (1997) these perspectives, in tum, define the outcomes by which school
effectiveness is to be judged. Because in the current thesis the educational component is
stronger than the economical or the organisational one, Mortimore's (1995) definition of
effectiveness would be more appropriate. Thus, in the current thesis, a school would be
regarded as 'effective' if its students will be found to have progressed further than they
might be expected from a consideration of school's intake. This definition will be better
understood when 'type A' and 'type B' school effects will be discussed in page 151.
3.1.2. TYPES OF RESEARCH TRADITIONS IN EDUCATIONAL EFFECTIVENESS
In the most recent review, Scheerens & Bosker (1997) have divided the literature of
educational effectiveness into five types of research traditions, each concentrating on a
different aspect of effectiveness. These areas are:
1. Research on equality of opportunities in education and the significance of the school
in this.
2. Economic studies on education production functions.
3. The evaluation of compensatory programs.
4. Studies of effective schools and the evaluation of school improvement programs.
5. Studies on the effectiveness of teachers, classes and instruction procedures.
81

The studies on education production functions deal with the task of manipulating the
inputs that increase the outputs of education. These studies therefore are studies in the
field of educational economics. Scheerens & Bosker (1997), reviewing early work on
educational production functions, conclude that relevant studies have produced
inconsistent findings.
Compensatory programs are programs that intend to improve the levels of performance
of the educationally disadvantaged. Such programs have been carried out mainly in the
USA. The most widely known such program in America is the Head Start and its sequel
Follow Through. The results of these programs have been difficult to assess because
their long-term effects are believed to be more important and because it has been
demonstrated that it is the moderately disadvantaged pupils that have mostly benefited
from them.
The research on effective schools and the evaluation of school improvement programs
touches the core of School Effectiveness studies. Effective school research, in contrast
with the research on educational production functions, has attempted to open the 'black
box' of the school by studying process characteristics related to organisation and
curriculum. Scheerens & Bosker (1997) distinguish three types of effective school
studies:
1. Studies of schools that are identified, after controlling for the prior achievement of
students, as displaying an exceptionally favourable output. These positive 'outlier'
schools are then analysed to determine what distinguishes them from schools with
an unfavourable output (negative outliers).
2. Studies in which the knowledge base of research of studies of 'exceptionally
effective schools' are adopted for school improvement programs. A more recent
category in which larger scale studies are made of the school characteristics that are
related to the achievement level.
3. Studies of the effectiveness of teachers and teaching methods. These studies do not
fall exactly in the area of School Effectiveness but Scheerens & Bosker (1997) state
that the impact of effectiveness-promoting school characteristics on pupils'
performance largely happens via class teaching techniques. According to the same
authors (op. cit.) research results in the field of instructional effectiveness are
82

centred around three major factors: (a) effective learning time, (b) structured
teaching and (c) opportunity to learn.
83
3.2. SCHOOL EFFECTIVENESS: THE ORIGINS AND CURRENT STATE OF AN INTERNATIONAL RESEARCH MOVEMENT
3.2.1. FIRST GENERATION OF SCHOOL EFFECTIVENESS STUDIES
In the previous section a number of definitions for educational and school effectiveness
were presented. In this section, the movement of School Effectiveness will be presented
in its historical development, so that the reader of the current work can acquire a better
picture of the forces that have shaped contemporary character of the school
effectiveness research tradition. Section 3.2 has been based on one of the most
important books on School Effectiveness that have being published until today: The
International Handbook of School Effectiveness Research. The Handbook has been
edited by Charles Teddlie and David Reynolds (2000) and includes contributions from
some of the most influential scholars in the field.
The school effectiveness research tradition has a history of expansion for more than 20
years. In these two decades, the educational community has witnessed the development
of a very influential research movement that brought together researchers and
practitioners from a wide spectrum of areas like statistics, educational evaluation,
subject didactics, and educational policy. The main tenet of this movement, according to
the titles of some of the most prominent pieces of work, is that 'schools matter', or that
they 'can make a difference'. In the last two decades, School Effectiveness has been a
very active area of inquiry. International conferences for school effectiveness and
improvement are held regularly from 1988 onwards in different countries and special
country reports are published every two years. Collections of the most important papers
of some of the congresses have been published by Reynolds, Creemers, & Peters
(1989), Creemers, Peters, & Reynolds (1989), Bashi & Zehava (1992), Creemers &
Osinga (1995), and Townsend et al. (1999). A journal, School Effectiveness and School
Improvement, is edited quarterly by Bert Creemers and David Reynolds and many
issues of the International Journal of Educational Research are edited by Jaap
Scheerens, Herbert Walberg and other scholars who work in the area of educational
effectiveness and productivity. In the following section, the main points of the school
84
effectiveness movement will be highlighted. The presentation starts with the first
qualitative studies of the 1970s and will finish to the state-of-art studies of the 1990s
and the early 2000s. In this twenty years long advancement of School Effectiveness,
Creemers (1996) distinguishes two 'generations' of research. This distinction will be
used by the current author as a framework for presenting key studies and their main
findings.
Studies of the 'first generation' of School Effectiveness were carried out in the 1970s,
mainly in the USA but also in the UK. The studies of the first generation were
conducted as a reaction to the pessimistic findings of a congressionally mandated study
Equality of Educational Opportunity, carried out in the USA by James Coleman and his
colleagues and known as the Coleman Report (Coleman et al., 1966). Coleman was
interested in the educational opportunities that were available to different racial and
ethnic groups in the American schools. He collected data from over 4,000 schools and
analysed the results of standardised tests of ability and achievement for 645,000 pupils.
The outcomes were used to relate school resources to pupil achievement. The main
conclusion was that school differences accounted only for 5 to 9 per cent of differences
in pupils' attainment. Daly (1995) later characterised this 9 per cent 'a benchmark' for
the modem school effectiveness studies.
Five years after Coleman, Christopher Jencks and his colleages (1972) reached similar
conclusions. In the book Inequality, Jencks and his colleagues argued that the most
important determinant of educational attainment is family background and that the main
purpose of schools is to get children to behave as administrators want them to behave.
Schooling, Jencks (op. cit.) claimed, cannot affect the distribution of incomes. In the
United Kingdom much sociological but also educational research yielded similar
findings. Plowden (1967), in her report Children and Their Primary Schools argued that
family is the strongest determinant of a student's success and suggested that teachers
should work in order to involve parents in schools. The studies noted above were
disheartening for educators and educational researchers because it seemed that schools
could not win in the battle against educational and social inequities. If the impact of
students' societal background is so strong, what remains to be done in the school and
what can teachers hope for in their combat against social injustice?
The findings of studies by Coleman and Jencks were seen by some educators as
stimulus for further research to better explore the influence of school. New studies were
85

published that suggested that some schools did in fact do much better than could be
expected of them in terms of students' outcomes. Most of these early studies used fairly
simple qualitative designs of comparing the 'good' and the 'bad' schools or positive and
negative 'outliers' for schools that served broadly similar intakes. In such an 'outilier'
study, Weber published the report Inner-City Children Can Be Taught to Read (1971).
Weber (op. cit.) argued that some schools can offer much more to their pupils and that
the characteristics of the 'successful' schools can be identified. Thus Weber listed a
number characteristics like strong leadership, high expectations, and good atmosphere.
The atmosphere of the school was the topic of another 'outlier' study that was
conducted later by Sarason (1981). In his study The Culture of the School and the
Problem of Change Sarason (1981) provided impetus for educators to consider the
intemallife of schools and its influence on students' experience and attainment. Finally,
another outlier study was conducted by Phi Delta Kappa in (1980) to investigate the
reasons that certain schools 'succeed' whereas some others 'fail'.
Brookover and his colleagues (1979) in the United States, tried to identify school effects
by using surveys to measure student and teacher perceptions of school climate. Their
book School Social Systems and Student Achievement became known with its subtitle:
Schools Can Make a Difference. Brookover and his colleagues (op. cit.) gathered
quantitative data from 159 schools that were broken down to particular sub groups. A
random sample of 68 elementary schools in Michigan U.S.A. was among these sub
groups. For these schools, Brookover and his colleagues developed 14 social
psychological climate scales and related school climate variables, school level measures
of students' socio-economic status and school racial composition with mean school
achievement. Later, for reasons of adding depth to the correlation study, detailed
observational studies in four outlier schools were conducted. The differences in
students' attainment between the schools were significant and the researchers looked
systematically for specific features of schools' social structure in order to explain them.
Jencks and his colleagues (1972) considered various school characteristics that could
explain the variation between schools like school size, attendance rates, teachers to
student ratio, teachers' qualifications and so on. In Brookover's study however, the
focus was on school's operational aspects as teachers and students perceived them to be.
Brookover (op. cit.) not only showed that students' social and racial background did not
completely explain the variation in schools' outcomes, but also concluded that the
combination of school's social structure variables (i.e. the combination of social
86
composition and personnel inputs from one hand and the social climate from the other)
accounted for more than 85 per cent of the between school variance in mean Reading
and Mathematics achievement. The work of Brookover had very strong policy
implications. As Silver (1994) notes, the book Schools Can Make a Difference turned
the pieces of effective school research into a research movement.
Another important study in the United States was that of Edmonds (1979) with the title
Effective Schools for the Urban Poor. Before 1979, Ronald Edmonds, an African
American educator, had written a number of papers relating to effective schools. He was
also one of those who criticised the research methodology of Coleman's Report. His
paper Effective Schools for the Urban Poor had a far-reaching influence with both
researchers and policy makers. In his book, Edmonds (1979) highlighted three points:
(a) that schools should give an emphasis to promoting social equity, (b) that schools
should set a minimum of attainment standards for all the children, and (c) that schools
and teachers should not be absolved from their responsibilities to promote basic skills,
regardless of the social or racial background of their students. The most important
feature of Edmonds' (1979) paper, however, was a list with five characteristics of
effective school. Other researchers expanded and revised Edmonds' list since its first
publication in 1979 but the central elements of the original have been maintained until
today the same. The original characteristics highlighted by Edmonds were: (a) strong
educational leadership, (b) high expectations of student achievement, (c) an emphasis
on basic skills, (d) a safe and orderly climate, and (e) frequent evaluation of pupil
progress. Samouilidi (1995) in her PhD thesis sought Edmonds' five characteristics in
seven Greek integrated polyvalent lyceia. She interviewed a number of students from
each school and claimed that all integrated polyvalent lyceia in Greece, posses
Edmonds' five original characteristics. Nowadays, Edmonds' list is not the only list
with effective school characteristics. Other such lists are presented in Section 3.4.1.
On the other side of the Atlantic, the United Kingdom, the School Effectiveness
research had had 'a somewhat difficult infancy', to use Reynolds, Sammons, Stoll,
Barber, & Hillman (1996b) expression. The British researchers traditionally put
emphasis on the psychological perspectives of school success and the school and family
relationships. This approach was supported by a very strong sociological tradition in the
United Kingdom that understood schools as the determinants of students' social
mobility or lack of it but did not perceive them as organisations which could have an
influence outside of the constrains of social structure. In addition, in contrast with what
87

happened in the United States, there was also in the u.K. a lack of instruments for
measuring school climate. Nevertheless, some influential studies on school
effectiveness and some studies on school and classroom effects were conducted. Some
of these studies will be presented in the following paragraph.
In an early British study, Michael Power (1967) investigated variations in effectiveness
in terms of social behavioural outcomes of students in a study of 'delinquent' schools.
In another British study, Brimer et al. (1978) published for the National Foundation of
Educational Research the book Sources of Difference in School Achievement. The most
discussed early school effectiveness study in the UK however, was Fifteen Thousand
Hours, by Rutter et al. (1979). Rutter and his colleagues found a number of factors that
were connected with high levels of school effectiveness. Rutter et al. (1979) original
factors were (a) the reward system of the school, (b) the school physical environment,
and (c) the use of the homework in the school. Other factors like the school size and the
physical characteristics of the school were not strongly associated with school outcomes
in that study. Moreover, Rutter et al. (1979) suggested that effective schools were
consistently effective across a range of student outcomes.
Fifteen Thousand Hours was sharply criticised for its methodology and statistical
analysis (see, for example, Goldstein, 1980 and Tizard et al., 1980). These criticisms are
examples of the 'difficult infancy' of school effectiveness research in the United
Kingdom. In two other countries, in which much of today's state-of-art school
effectiveness research is being produced School Effectiveness had also had a difficult
start. In Australia, there was scepticism about the use of standardised achievement tests
as measures of the effective schools. Instead, Australians paid more attention to the
social outcomes of the schools. Finally, in the Netherlands, school effectiveness
research did not begin until the mid-1980s. More information about the development of
school effectiveness research in Australia and the Netherlands will be presented in the
following sections.
3.2.2. SECOND GENERATION OF SCHOOL EFFECTIVENESS STUDIES
From the early 1980s, the studies of first generation were criticised on the grounds that
they were biased and lacking verifiable evidence for their empirical claims. Purkey &
Smith (1983), in one of the first review studies in the area of school effectiveness,
88

distinguished the five following weaknesses of the studies of the first generation: (a)
small and unrepresentative samples, (b) possible errors in identifying effective schools,
(c) achievement data aggregated at the school level, (d) inappropriate comparisons, and
(e) the use of sUbjective criteria in determining school success. School Effectiveness
studies of the second generation did not begin until the mid-1980s. This was the era
when the researchers attempted to address the criticisms of the previous generation and,
most importantly, they utilised the new statistical techniques that took into account the
hierarchical structure of the educational systems. In the early 1980s, new statistical
algorithms and packages were developed simultaneously in the United States and the
United Kingdom. The new statistical models were called 'hierarchical linear models',
'parameter-varying models', 'variance component models', or 'random coefficient
models'.
The statistical foundation of the statistical models that were presented in the previous
paragraph can be found in a paper by Lindley & Smith (1972) 'Bayes estimates for the
linear model'. In the realm of education, the new models were used as a tool to question
the claims of Bennett's (1976) that 'progressive' teaching methods were unsuccessful.
Thus in a paper published in the Journal of the Royal Statistical Society five years after
Bennett's (op. cit.) claims, Aitkin et at. (1981) showed that Bennett had actually
overstated the extent of the observed differences between teaching styles. That was
because the variability between teachers in pupils' progress (i.e. the hierarchical
structure) in Bennett's (1976) study had been ignored. In 1986 Aitkin & Longford
published another paper in the Journal of the Royal Statistical Society with the title
'statistical modelling in School Effectiveness Research studies' . The same year
Goldstein (1986) published a paper titled 'multilevel models in educational and social
research' and in the next year published the book Multilevel Models in Educational and
Social Research (Goldstein, 1987). In the United States Raudenbush & Bryk (1986)
published in the Sociology of Education an article titled 'a hierarchical model for
studying school effect'. In 1989, Bock published a collection of 12 papers written from
statisticians and methodologists about the use of new statistical models in the area of
education. The title of Bock's book was Multilevel Analysis of Educational Data.
Similarly, Raudenbush & Willms (1991) published another collection of 14 articles
based on an international conference held during the summer of 1989 in Edinburgh. The
book comprised 14 articles and its title was Schools, Classrooms and Pupils. Its subtitle,
however, was much more illuminating: International Studies of Schooling from a
89
Multilevel Perspective. Thus, the advances in the front of applied statistics enhanced the
methods and the design of school effectiveness studies. Studies with an outlier design
did not disappear completely but the notion of 'value added' found its way from the
realm of the economy to the realm of education. The meaning of 'value added' will be
analysed later. Its history in education has recently been reviewed by Saunders (1999).
Apart from the issue of statistical analysis, more adequate techniques were also used for
data collection in these second-generation school effectiveness studies. Instead of using
questionnaires, researchers in the 1980s used direct observation and behaviour
checklists. Researchers began now to consider the context and the social organisation of
of the schools in more depth, to construct scales for measuring administrational issues
and develop more sensitive output measures. In the same period, the school
effectiveness research tradition began to expand to other countries, such as the
Netherlands, the former Hong Kong, Norway, Israel, Taiwan, Mainland China, Canada,
Australia, and also in some Eastern countries (for the latest country reports see
Townsend et al., 1999). Two of the most important school effectiveness studies in the
1980s were (a) one that conducted by Peter Mortimore and his colleagues in the United
Kingdom in 1988 and (b) another that was conducted by Teddlie & Stringfield (1993) in
the United States. These two studies will be presented below.
Mortimore et al. (1988) and his colleagues selected a sample of 50 primary schools in
the Inner London Local Educational Authority and attempted for the ages of 7 -11 what
Rutter (1979) and his colleagues (including Mortimore) had done previously for
secondary schools in the Fifteen Thousand Hours. The tittle of Mortimore's work was
School Matters. The study was completed by the end of the 1980s and was one of the
first studies to take advantage of the powerful new statistical techniques that described
in the previous paragraph. Mortimore et al. (1988) investigated a number of
fundamental school effectiveness issues like the size of school effect, the notion of the
differential school effectiveness, and the factors that contribute to the enhancement of
the school effectiveness. His central questions were: (a) whether some schools or
classes were more effective than others when controlled for variance in pupil intake, (b)
whether some schools or classes were more effective for certain groups of pupils (the
notion of differential school effectiveness) and finally, in the case that some schools or
classes were found to be more effective that others, (c) what factors could explain the
difference in effectiveness. The main answer to Mortimore's questions was also the title
of his book: School Matters. In addition, a set of 12 characteristics of the effective
90

school and classroom practices were identified: (1) a purposeful leadership, (2)
involvement of the deputy head and (3) involvement from the part of the teachers, (4)
consistency among teachers, (5) structured sessions, (6) intellectually challenging
teaching, (7) a work-centred environment, (8) sharp focus within sessions, (9) maximum
communication between teachers and pupils, (10) record keeping, (11) parental
involvement, and (12) a positive climate.
Teddlie & Stringfield (1993) carried out their major research, the Louisiana School
Effectiveness Study, in the United States. The study was in fact an ambitious programme
of four studies and had a longitudinal design, starting in 1980 and ending in 1992. The
researchers used both qualitative and quantitative techniques and collected data from the
school and the classroom level. Differences between 'effective' and 'ineffective'
schools were found. Some of the correlates of the effective schools were 'time on task',
'high expectations from the part of the teachers', the type of discipline, the presentation
of new material and the physical condition of the school. Qualitative case studies of
'outlier' schools were also used in the Louisiana School Effectiveness Study to give
insight into the characteristics of particular schools. The study drew particular attention
to the impact of socio-economic status and school context.
3.2.3. THE CURRENT STATE OF SCHOOL EFFECTIVENESS RESEARCH
In the 1990s, the school effectiveness research flourished in a number of countries apart
from the USA and the United Kingdom. Two of these countries are the Netherlands and
Australia. The development of school effectiveness research tradition in these countries
will be the theme of the following paragraphs. According to the International Handbook
of School Effectiveness Research, in the Netherlands quantitatively sophisticated
research seems to be relatively unused within practice (Reynolds, Teddlie, Creemers,
Scheerens, & Townsend, 2000). Dutch researchers in the area of School Effectiveness
have investigated the contribution of various factors to students' achievement and
explored the issue of the differential school effect. Bosker (1990) and Luyten (1994),
for example, found inconsistency in effectiveness across students with different
characteristics and different school sub-units respectively.
Other Dutch researchers have investigated special factors that are related with the
effectiveness of the schools. For example, Reezigt (1993) studied the grouping
91

procedures in the schools whereas Ros (1994) studied the effect of the co-operation
between students. An interesting finding in the Netherlands has been the contribution of
educational leadership on students' outcomes. Early research showed that good
educational leadership was not correlated with students' achievement (see van de Grift,
1990). Later studies, however, like the one conducted by Lam & van der Grift (1995)
developed more sensitive instruments for leadership and found positive correlation
between good leadership and student outcomes. Other Dutch researchers in the
University of Groningen have turned their attention to instructional effectiveness instead
of the effectiveness of the school as an organisational unit. Creemers (1994), for
example, has investigated the role of alternative epistemological and educational
frameworks of instruction and has focused on the constructivist approach of learning
(rather, on the constructivist approach of 'constructing knowledge'). Another notable
study in the Netherlands is that of Brandsma et al. (1995), who conducted an
experimental study in order to compare school-level and classroom-level determinants
of Mathematics achievement in secondary education. Brandsma et al. found that the
most important factor of students' success was teachers' behaviour and the quality of
instruction. Finally, in University of Twente a number of simulation-based analyses of
educational effectiveness have been produced (see De Vos, 1998).
In Australia, School Effectiveness has been used as a tool for the improvement of the
schools and for designing educational policy. For example, the Good School Strategy
was an activity initiated by the Australian Education Council. In the context of the Good
School Strategy, more than 2,300 schools responded to an open-ended questionnaire
which investigated peoples' views of school effectiveness (McGaw, Piper, Banks, &
Evans, 1992). The implications for policy makers were that: (a) accountability must be
sought in a local level, (b) discipline problems does not affect effectiveness and
improvement, (c) achievement is not the only thing that is worth fighting for in schools,
and (d) the role of central administrators in school improvement is important (McGaw
et aI., 1992, cited in Reynolds et aI., 2000: 22). In recent years a number of studies in
Australia have considered a variety of issues. The most promising of these issues is
classroom effectiveness (see Rowe, 1991), the relation between classroom effectiveness
and school effectiveness (see Hill et al., 1993; Rowe et aI., 1994), and the relationship
between school effectiveness and school self-management (see Townsend, 1997).
In the United Kingdom, a lot of research has been conducted in the area of school
effectiveness during the last decade. Moreover, in England and Wales, School
92

Effectiveness has connected with educational evaluation both summative fonn
(educational accountability) and its fonnative fonn (educational improvement).
Important aspects of the connection between School Effectiveness Research and
educational evaluation in England and Wales are presented in Section 3.2.4 of the
current study.
School Effectiveness Research in the United Kingdom has been focused lately on the
dimensions of school effectiveness and equity issues. Smith & Tomlinson (1989)
studied the school effects in Mathematics and English Language and were of the first to
show that schools can be differentially effective between subjects. According to the
International Handbook of School Effectiveness Research (Teddlie & Reynolds, 2000:
15-16), ongoing cutting-edge work in the United Kingdom focuses on:
1. Stability over time of school effects (see Goldstein et al., 1993; Gray & Wilcox,
1995; Thomas et a!., 1997a).
2. Consistency of school effects on different outcomes (see Goldstein et a!., 1993;
Sammons et a!., 1996; Thomas et a!., 1994).
3. Differential effects of schools for different groups of students (see Goldstein et al.,
1993; Jesson & Gray, 1991; Sammons, Nuttall, & Cuttance, 1993a).
4. The relative continuity of the effect of school over time (see Goldstein, 1995b;
Sammons, 1996; Sammons et aI., 1995b).
5. The existence or size of school effect (see Daly, 1991; Gray et a!., 1990; Thomas et
al., 1997a). A number of authors (Sammons et a!., 1993ab ) suggest that the size of
primary school effects may be greater that those of secondary schools.
6. Departmental differences in educational effectiveness (see Fitz-Gibbon, 1991,
1992). Fitz-Gibbons' research has been conducted though ALIS ('A Level'
Infonnation System) and YELLIS (Year 11 Infonnation System) which are two
systems for rapid feedback of pupil level data to school.
7. The international dimension and the context specificity of school effectiveness,
through the International School Effectiveness Research Project (lSERP) (see
Creemers & Reezigt, 1996; Reynolds et a!., 1994).
8. The different characteristics of the ineffective schools (see Reynolds, 1996; Stoll &
Myers, 1997).
9. The assessment of 'value added' using already available data (see Fitz-Gibbon,
1996a, 1997).
93
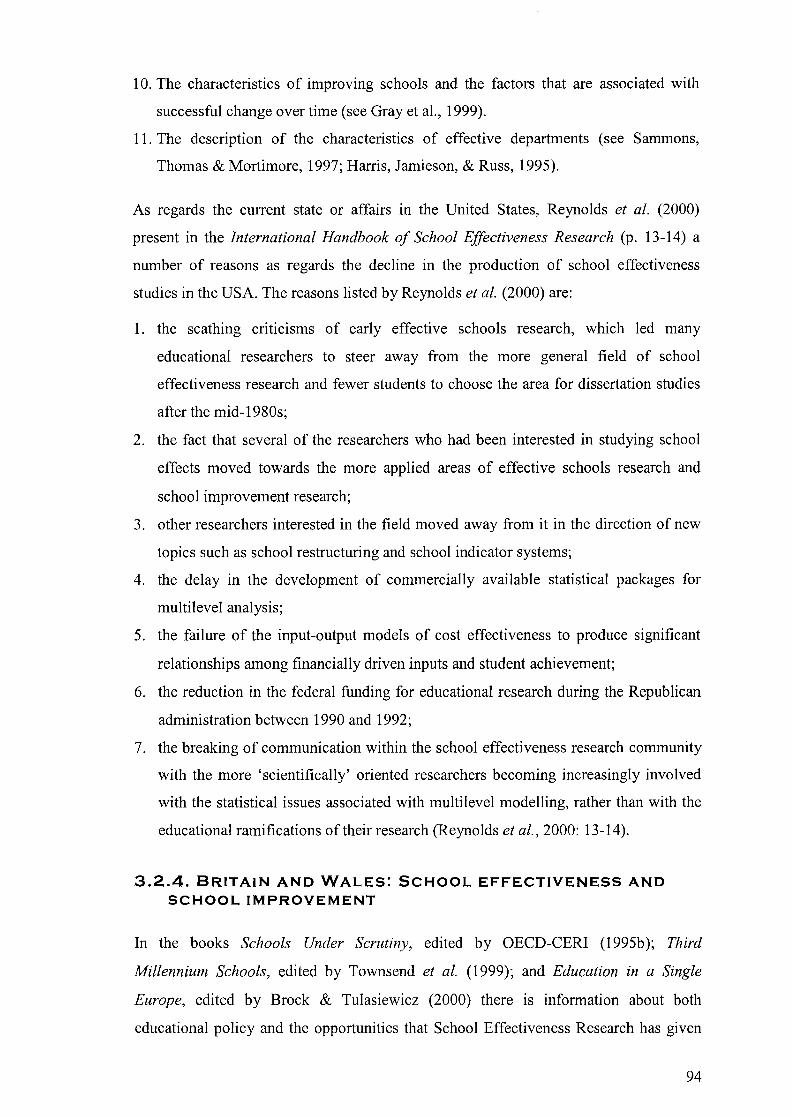
10. The characteristics of improving schools and the factors that are associated with
successful change over time (see Gray et aI., 1999).
11. The description of the characteristics of effective departments (see Sammons,
Thomas & Mortimore, 1997; Harris, Jamieson, & Russ, 1995).
As regards the current state or affairs in the United States, Reynolds et al. (2000)
present in the International Handbook of School Effectiveness Research (p. 13-14) a
number of reasons as regards the decline in the production of school effectiveness
studies in the USA. The reasons listed by Reynolds et al. (2000) are:
1. the scathing criticisms of early effective schools research, which led many
educational researchers to steer away from the more general field of school
effectiveness research and fewer students to choose the area for dissertation studies
after the mid-1980s;
2. the fact that several of the researchers who had been interested in studying school
effects moved towards the more applied areas of effective schools research and
school improvement research;
3. other researchers interested in the field moved away from it in the direction of new
topics such as school restructuring and school indicator systems;
4. the delay in the development of commercially available statistical packages for
multilevel analysis;
5. the failure of the input-output models of cost effectiveness to produce significant
relationships among financially driven inputs and student achievement;
6. the reduction in the federal funding for educational research during the Republican
administration between 1990 and 1992;
7. the breaking of communication within the school effectiveness research community
with the more 'scientifically' oriented researchers becoming increasingly involved
with the statistical issues associated with multilevel modelling, rather than with the
educational ramifications of their research (Reynolds et al., 2000: 13-14).
3.2.4. BRITAIN AND WALES: SCHOOL EFFECTIVENESS AND SCHOOL IMPROVEMENT
In the books Schools Under Scrutiny, edited by OECD-CERI (1995b); Third
Millennium Schools, edited by Townsend et al. (1999); and Education in a Single
Europe, edited by Brock & Tulasiewicz (2000) there is information about both
educational policy and the opportunities that School Effectiveness Research has given
94

to educational policy. England is an interesting case for exploring the impact of School
Effectiveness Research on educational policy and evaluation. With the Education
Reform Act of 1988 the conservative government in England and Wales centralised
decisions about curriculum and standards by:
• introducing the National Curriculum;
• requiring pupils to sit tests measuring their attainment in relation to the curriculum
at four 'key stages' (specifically, at the ages of7, 11, 14, and 16);
• requiring local education authorities to delegate managerial and financial
responsibilities to individual schools;
• allowing pupils to apply for any school, with the right of admittance as long as there
are free places (open enrolment);
• ensuring that each school's budget is calculated according to the number of pupils
who enrol; and
• giving schools the option of full autonomy by opting out of local authority control
(OECD-CERI, 1995b).
A 'Parents Charter' published in 1991 set out the entitlement of parents to know the
characteristics of the schools which their children are attending. The information to the
parents took the following three forms: (a) quantitative indicators of school
'performance' in relation to national trends, (b) regular reports produced by schools on
the progress of individual children and (c) regular inspections of the schools by teams of
independent inspectors. These inspection teams comprise former school inspectors as
well as people who do not have any relation with education. Inspectors under the new
system bid for contracts commissioned by the Office for Standards in Education
(OFSTED). In this framework every school was supposed to be inspected every four
years; the schools are required to draw up action plans in response to the inspection
reports. A summary of each report and the action plan are sent to all parents of the
school. By September 1997, 340 schools had been designated as having failed the
OFSTED process and requiring 'special measures'.
The Labour Government which came into power in 1997 not only continued most of the
previous Conservative policies but also increased the central government's powers. In
the paper Excellence in Schools, the Labour Party emphasised literacy and numeracy in
primary education, advocated setting in secondary education, envisaged home-school
contracts, and promised additional school performance information to parents and
95
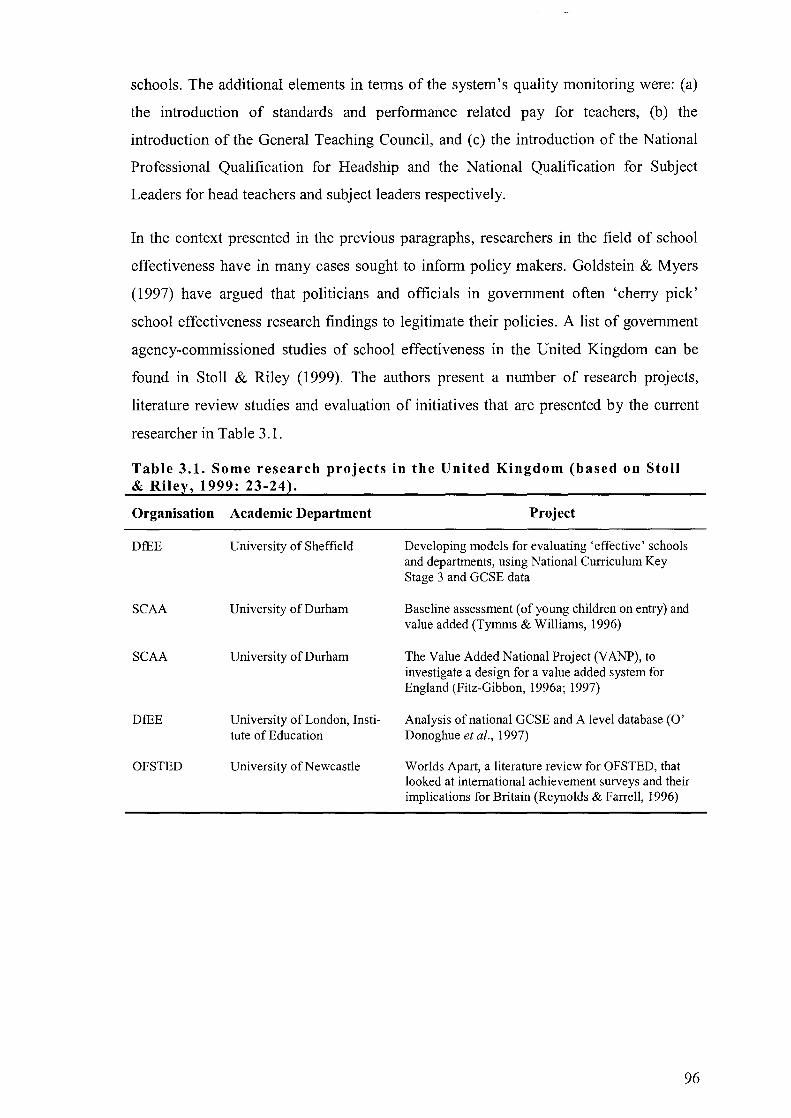
schools. The additional elements in tenns of the system's quality monitoring were: (a)
the introduction of standards and perfonnance related pay for teachers, (b) the
introduction of the General Teaching Council, and (c) the introduction of the National
Professional Qualification for Headship and the National Qualification for Subject
Leaders for head teachers and subject leaders respectively.
In the context presented in the previous paragraphs, researchers in the field of school
effectiveness have in many cases sought to infonn policy makers. Goldstein & Myers
(1997) have argued that politicians and officials in government often 'cherry pick'
school effectiveness research findings to legitimate their policies. A list of government
agency-commissioned studies of school effectiveness in the United Kingdom can be
found in Stoll & Riley (1999). The authors present a number of research projects,
literature review studies and evaluation of initiatives that are presented by the current
researcher in Table 3.1.
Table 3.1. Some research projects in the United Kingdom (based on Stoll & Riley, 1999: 23-24).
Organisation Academic Department
DfEE University of Sheffield
SCAA University of Durham
SCAA University of Durham
DfEE University of London, Institute of Education
OFSTED University of Newcastle
Project
Developing models for evaluating 'effective' schools and departments, using National Curriculum Key Stage 3 and GCSE data
Baseline assessment (of young children on entry) and value added (Tymms & Williams, 1996)
The Value Added National Project (VANP), to investigate a design for a value added system for England (Fitz-Gibbon, 1996a; 1997)
Analysis of national GCSE and A level database (0' Donoghue et at., 1997)
Worlds Apart, a literature review for OFSTED, that looked at international achievement surveys and their implications for Britain (Reynolds & Farrell, 1996)
96
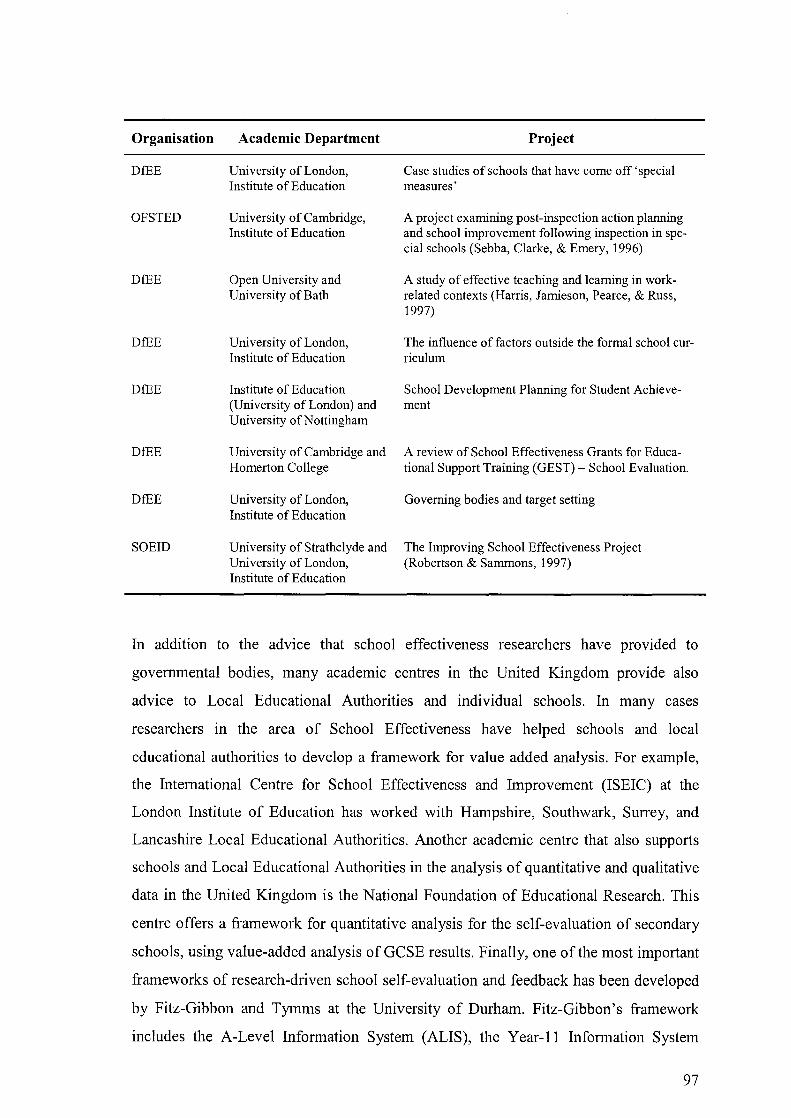
Organisation Academic Department
DfEE University of London, Institute of Education
OFSTED University of Cambridge, Institute of Education
DfEE Open University and University of Bath
DfEE University of London, Institute of Education
DfEE Institute of Education (University of London) and University of Nottingham
DfEE University of Cambridge and Homerton College
DillE University of London, Institute of Education
SOEID University of Strathclyde and University of London, Institute of Education
Project
Case studies of schools that have come off 'special measures'
A project examining post-inspection action planning and school improvement following inspection in special schools (Sebba, Clarke, & Emery, 1996)
A study of effective teaching and learning in workrelated contexts (Harris, Jamieson, Pearce, & Russ, 1997)
The influence of factors outside the formal school curriculum
School Development Planning for Student Achievement
A review of School Effectiveness Grants for Educational Support Training (GEST) - School Evaluation.
Governing bodies and target setting
The Improving School Effectiveness Project (Robertson & Sammons, 1997)
In addition to the advice that school effectiveness researchers have provided to
governmental bodies, many academic centres in the United Kingdom provide also
advice to Local Educational Authorities and individual schools. In many cases
researchers in the area of School Effectiveness have helped schools and local
educational authorities to develop a framework for value added analysis. For example,
the International Centre for School Effectiveness and Improvement (ISEIC) at the
London Institute of Education has worked with Hampshire, S outhw ark , Surrey, and
Lancashire Local Educational Authorities. Another academic centre that also supports
schools and Local Educational Authorities in the analysis of quantitative and qualitative
data in the United Kingdom is the National Foundation of Educational Research. This
centre offers a framework for quantitative analysis for the self-evaluation of secondary
schools, using value-added analysis of GCSE results. Finally, one of the most important
frameworks of research-driven school self-evaluation and feedback has been developed
by Fitz-Gibbon and Tymms at the University of Durham. Fitz-Gibbon's framework
includes the A-Level Information System (ALIS), the Year-ll Information System
97
(YELLIS), the Middle Years Information System (MidYIS) and the Performance
Indicators in Primary Schools (PIPS) (see Fitz-Gibbon, 1991, 1992). These systems are
important because they involve the largest databases in school effectiveness research in
the UK, with a third of UK A-level results, one in four secondary schools in YELLIS
and over four thousand primary schools receiving feedback each year (Reynolds et al.,
2000).
3.2.5. REVIEWS OF FIVE ILLUSTRATIVE SCHOOL EFFECTIVENESS STUDIES
The previous sections have attempted to explore the history of school effectiveness
research and show how researchers in this area tried to provide an antidote to the
pessimism and fatalism of the educational research of the early 1970s. After a brief
presentation of first- and second-generation school effectiveness studies the expanding
of school effectiveness research in a number of countries during the 1980s and the
1990s was outlined. In the current section, a number of illustrative school effectiveness
studies of particular importance will be presented. These studies have been reviewed by
Scheerens & Bosker (1997) in The Foundations of Educational Effectiveness. The
review of Scheerens & Bosker (1997) is balanced and informative and manages to
identify common threads among the reviewed studies with regards to their contribution
to School Effectiveness. The five studies overviewed by Scheerens & Bosker are (a) the
work of Brandsma (1993) in the Netherlands with the title 'characteristics of primary
schools and the quality of education', (b) the Victorian Quality of Schools Project in
Australia by Hill et al. (1995), (c) the Success for All programme of Slavin, (1996) in
the United States, (d) the Differential Secondary School Effectiveness Project by
Sammons et al. (1995c) in the United Kingdom, and (e) the important work of Grisay
(1997) in France about the evolution of cognitive and affective development in lower
secondary education.
Brandsma's (1993) study focused on the existence of differences in effectiveness
between schools in the Netherlands and sought to identify the organisational
characteristics that 'explain' the differences between them. Brandsma approached 252
primary schools and gathered information on Mathematics and Language achievement
by means of standardised pre-and post-test at the end of grade-7 and grade-8
respectively. He also administered questionnaires to the head teacher and the teachers of
the schools in order to measure variables in the domain of school context and
98

organisation, as well as teaching practice. It was found that the between school variance
for Language and Arithmetic, adjusted for previous achievement and other student
background characteristics, was 8 and 11.6 per cent respectively.
The Victorian Quality of Schools Project (Hill, 1995) is one of the first school
effectiveness studies to use multivariate multilevel models. The main research questions
in the Victorian Quality of Schools Project were: (a) 'what are the characteristics of
schools in which students make rapid and sustained progress in English and
Mathematics, after adjusting for their initia11eve1s of achievement?' and (b) 'what are
the characteristics of schools in which there are positive student attitudes and
behaviours, positive perceptions by teachers of their work environment, and high levels
of parent participation in and satisfaction with their child's schooling?' (Hill et al.,
1995: 5). In the Victorian Quality of Schools Project, five entire year-level cohorts of
13,909 students including their parents and teachers were selected. The sample
consisted of 59 primary and 31 secondary schools and included 365 and 538 teachers
respectively. The outcome measures both cognitive and non-cognitive. As regards the
former, they were results of teachers' authentic assessments because there were serious
reservations about the validity of the standardised achievement tests that were available
with reference to the curriculum in the Victorian schools. The explanatory variables of
the study included measures of students' background, like ability and socio-educationa1
level, as well as instructional characteristics, like students' reports on the type of
homework in English and Mathematics. Teachers' perceptions of their work
environment were also investigated by means of a specially designed questionnaire. The
statistical analysis consisted of multilevel regression models with three levels (student,
classroom, and school), as well as of multilevel path analysis models (both of these
statistical procedures will be explained in Chapter 4). The results of the multilevel
regression analysis showed that the variance between classes, with adjustments for year
level and prior achievement, were much larger than the variance between schools. This
finding is summarised by Scheerens & Bosker (1997: 189) as in Table 3.2.
99
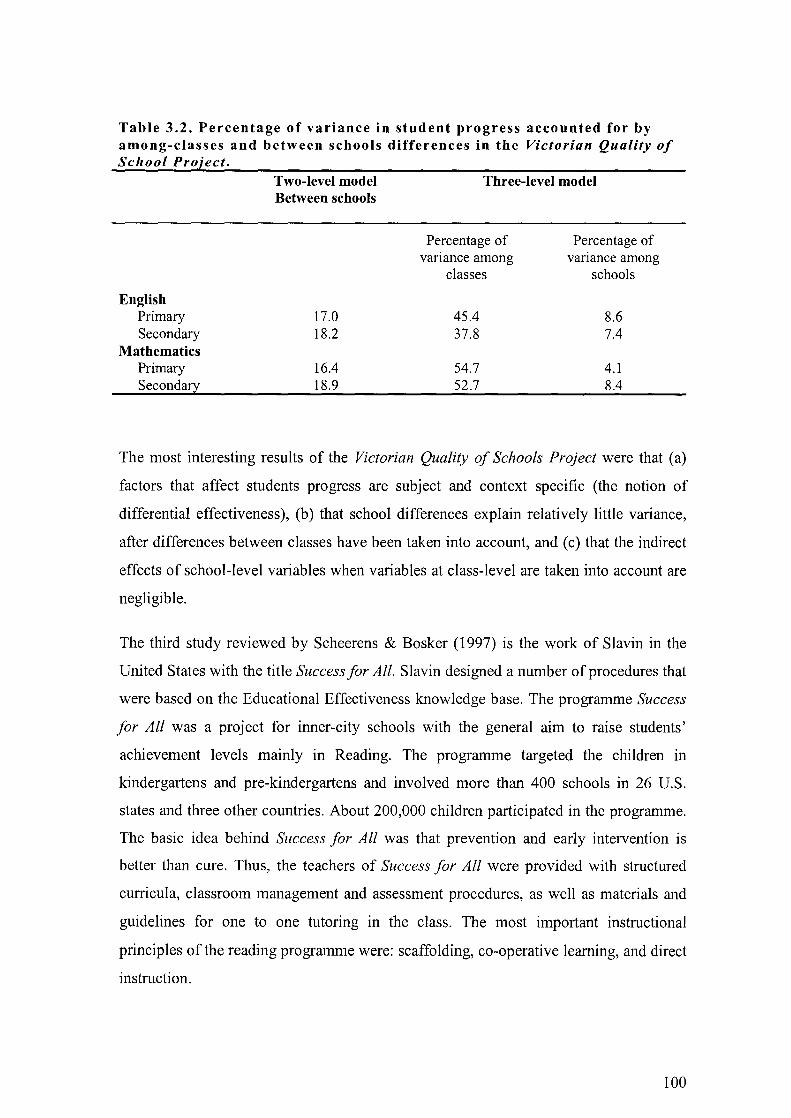
Table 3.2. Percentage of variance in student progress accounted for by among-classes and between schools differences in the Victorian Quality of School Project.
English Primary Secondary
Mathematics Primary Secondary
Two-level model Between schools
17.0 18.2
16.4 18.9
Three-level model
Percentage of Percentage of variance among vanance among
classes schools
45.4 8.6 37.8 7.4
54.7 4.1 52.7 8.4
The most interesting results of the Victorian Quality of Schools Project were that (a)
factors that affect students progress are subject and context specific (the notion of
differential effectiveness), (b) that school differences explain relatively little variance,
after differences between classes have been taken into account, and (c) that the indirect
effects of school-level variables when variables at class-level are taken into account are
negligible.
The third study reviewed by Scheerens & Bosker (1997) is the work of Slavin in the
United States with the title Success for All. Slavin designed a number of procedures that
were based on the Educational Effectiveness knowledge base. The programme Success
for All was a project for inner-city schools with the general aim to raise students'
achievement levels mainly in Reading. The programme targeted the children in
kindergartens and pre-kindergartens and involved more than 400 schools in 26 U.S.
states and three other countries. About 200,000 children participated in the programme.
The basic idea behind Success for All was that prevention and early intervention is
better than cure. Thus, the teachers of Success for All were provided with structured
curricula, classroom management and assessment procedures, as well as materials and
guidelines for one to one tutoring in the class. The most important instructional
principles of the reading programme were: scaffolding, co-operative learning, and direct
instruction.
100
In an evaluation report of the Success for All programme, which used a quasl
experimental design, Slavin (1996) compared the results of 19 Success for All school
with the results of other 19 control schools (matching pairs). The units of analysis were
grade-level cohorts i.e. the students in all classes in that grade in a given year. It was
found that the adjusted means for the programme cohorts in four reading tests were
higher than the corresponding means for the control schools. However, the impact of
Success for All programme in the knowledge base of School Effectiveness is much more
far reaching than the finding that was just presented. Firstly, Success for All indicated
that the structure of teaching and learning transaction in the classroom is much more
important than the organisational structure of the school. This finding is important for
policy makers and those who are concerned with educational change. As Scheerens &
Bosker (1997) comment, the message of Success for All seems to be that systematic
innovation and restructuring of school administration and organisation should be seen as
facilitative to educational reform rather than the target of educational reform. A second
message of Success for All is that externally developed materials and manuals have
positive impact on education. This finding seems to contradict the opinion that
successful school reforms come only on-site from schoolteachers themselves.
The fourth study reviewed by Scheerens & Bosker (1997) is the work of Sammons et at.
(1995c) with the title Differential Secondary School Effectiveness. The study was
conducted in the United Kingdom and addressed three major themes in School
Effectiveness Research: (a) the size of school effect, (b) the consistency of school
effects across time and school organisational sub-units, and (c) the research for
explanatory process conditions of effective schooling. The study of Sammons et al.
(1995c) was of a longitudinal character and focused on assessment results over a five
year period. It involved 94 secondary schools in 8 inner London Local Educational
Authorities and 7,000 students in anyone year. The project had three phases. In the first
phase, school- and department-level value added outcomes were analysed. Apart from
prior achievement, students' academic outcomes were adjusted for a number of
background factors such as ethnicity and eligibility for free school meals. The outcome
measures were total GCSE results and GCSE scores in six sUbjects: English, English
Literature, Mathematics, French, History, and Science. In the first stage of the study it
was found that only a small number of schools were consistently effective or
consistently ineffective across subjects and over several years. Most schools had fairly
mixed effects. In many cases, highly effective and highly ineffective departments
101

coexisted in the same school. The message of this finding is that confident
discrimination of the schools can only be made for a small number of broadly effective
and broadly ineffective institutions. Given the observed inconsistency of effectiveness
between departments and subject areas, the publication of value added league tables
alone does not solve the problem of identifying 'effective' and 'ineffective' schools. In
other words, Sammons et al. (1995c) showed how complex phenomenon school
effectiveness can be with regards the comparisons between schools. One year after the
publication of the findings, Sammons (1996) discussed complexities in the judgement
of school effectiveness in an article that appeared in the journal Educational Research
and Evaluation. The book Forging Links: Effective Schools and Effective Departments
by Sammons, Thomas, & Mortimore (1997) was based on the findings of the
Differential Secondary School Effectiveness project.
The school- and department-level residuals from the statistical analysis of the
Differential Secondary School Effectiveness were later used by the same researchers as
the basis for selecting schools for detailed case studies. Three types of schools were
distinguished in the statistical analysis of the residuals: (a) broadly effective schools, i.e.
positive residuals in most of the outcomes, (b) broadly ineffective schools, i.e. negative
residuals in most of the subjects, and (c) schools with mixed effects, i.e. schools with
positive residuals in some of the outcomes and negative residuals in the rest of the
outcomes. In the second phase of the project, in-depth qualitative case studies were
carried out to the three types of schools that were presented above with the purpose of
understanding their characteristics. The factors that contributed most to the
effectiveness of the schools were: (a) the history of the school or the department, (b)
high expectation for students' achievement, (c) entry policy and constant monitoring of
student's progress, (d) shared visions and goals, (e) an effective School Management
Team, (f) the quality of teaching, and (g) the involvement of the parents. Another
purpose of the case studies was the development of instruments (questionnaires) for the
collection of information about sch?ol and departmental processes that affect students'
achievement. The questionnaires were administered to head teachers and head of
departments in another quantitative phase of the project.
The multilevel analysis of this new quantitative phase identified a number of important
relations between explanatory and response variables. A relation discussed in Scheerens
& Bosker (1997) review is the relation between the total GCSE score and the head
teacher variables. In the study of Sammons et al. (1995c) it was found that the total
102
school level variance was 7.21 % of the total variance in GCSE score. This figure was
reduced to 1.82% after controlling for pupil background factors and prior achievement.
When process variables were added in the model, the between school variance was
reduced to 0.58%. This implies that the process variables count for 68 per cent of the
residual between school variance. Given the small size of between school variance, the
effect of school process characteristics must be very small indeed. In conclusion, the
Differential Secondary School Effectiveness project made an important contribution to
School Effectiveness Research by revealing the size and the complexities in the
effectiveness of the schools (i.e. differential effects for different student groups and
internal variations in the departmental level).
The fifth study reviewed by Sheerens & Bosker (1997) is the work of Grisay (1997) in
France. Grisay was asked by the Direction de I' Evaluation et de la Prospective to
conduct a longitudinal study on school effectiveness in French middle schools. The
researcher focused on both the cognitive and affective domain. She collected a sample
of 100 schools, and in each school, a random sample of 80 pupils entering grade-6. The
students, the teachers and the head-teachers of these schools were monitored for four
years. Information on school processes was collected with the help of specially designed
questionnaires. There was also a notable effort towards selecting comments from
teachers and the other participants as well as an effort towards providing feedback. For
this reason special information-exchange meetings were held on a regular basis with the
teachers and the researchers together.
The findings of Grisay's (1997) study were important because they informed the French
policy makers about correlates of school and classroom effectiveness, like for example,
the grouping procedures and the type of instruction. Issues like the school climate and
the school-parent relationship were also tapped. Grisay's data-set has later undergone
many secondary analyses from other French researchers. In one such analysis Meuret
(1995) used path-analytic techniques (USREL) to investigate a number of school
outcomes in the affective domain, like motivation and sociability. In another study,
Meuret & Marivain (1997) used the same data-set in order to model the factors that
constitute students' feeling of 'well being' in schools. Another researcher who also used
Grisay's data-set was Sacre (1997), who focused on the role of the school director. Thus
Grisay work in France was one of these few educational studies that initiated other
studies and in the end changed people's about what is going on in schools. In the past
many French researchers used to see the school exclusively from a sociological
103
perspective concluding either that each school's unique identity makes it incomparable
with other schools (see Paty, 1980), or that schools are 'non-organisations' (see Ballion,
1991). Some other French researchers took a constructivistic perspective, claiming that
the effectiveness of each school can be seen only through a school's individual
objectives and that therefore no generally agreed criteria of effectiveness exist (see
Derouet, 1987). Grisay's (1997) study, however, helped to see the work in schools
under a different perspective.
3.2.6. SOME FINDINGS FROM PISA 2000
The Programme for International Student Assessment (PISA 2000) is an international
study that assessed literacy in Reading, Mathematics and Science. It is of course one of
the landmark studies of our times in the area of educational evaluation and
effectiveness. The study was co-ordinated by the governments of 32 participating
countries through the Organisation for Economic Co-operation and Development
(OECD). Because the results from PISA 2000 are only recently appearing, its impact
has not yet been fully felt by educational researchers and policy makers around the
world. The difference of the PISA 2000 from the other international comparisons of
students' achievement is that PISA 2000 has investigated the reasons why some
educational policies and practices at the micro level are more effective than the others.
Some of these findings will be presented in the current section. More information can be
found in a long book (322 pages) which contains the first results from PISA 2000
(OECD, 2001). The title of this recently published book is Knowledge and Skills for
Life.
Table 3.3 (adapted from OECD, 2001: 257) presents the between-school and within
school variation in student performance on the reading literacy scale of PIS A 2000. The
variation is expressed as a percentage of the average variation in student performance
across OECD countries. The last column of Table 3.3 contains the total variation
between schools expressed as a percentage of the total variation within each country.
For example, 50.4 per cent of the total variance in reading literacy in Greece is between
schools. However, this is 'unexplained' variance. In order to find the 'net' school effect,
one has to subtract the between school vanance explained by
geographical/systemic/institutional factors and the international socio-economic index
of occupational status of students and schools (see in third from the right column). The
variance accounted for by the aforementioned factors is for Greece 40.1 %. Thus, the
104
'net' school effect for Greece is 10.3% (SO.04% - 40.1 %). This figure is very large for
such a centralised educational system as the Greek one, which serves a mono-cultural
society. The corresponding figure for the United Kingdom - a country with
decentralised educational system - is only 4.3%. The OEeD average is S.6%.
Table 3.4 and Table 3.S (both adapted from OEeD, 2001: 312) present the effects of
student-level and school-level factors on performance the reading and mathematics
literacy scales, for all OEeD countries combined. Modell presents the impact of school
factors, Model 2 the impact of family background, and Model 3 the joint impact of
school factors and family background. It can be seen that the most important correlate
of student achievement both in reading literacy and mathematics literacy scale is
schools' intake (the 'school mean index of economic, social and cultural status'). The
first findings from PISA 2000 have just been published and it is relatively early for the
policy makers and those who work in the fields of educational effectiveness and
evaluation to respond. However, in current researcher's opinion, the results of PIS A
2000 - and more importantly the results of the forthcoming PISA 2003 - will have a
tremendous impact not only on educational policies but also on what is being taught in
educational department all over the world.
lOS
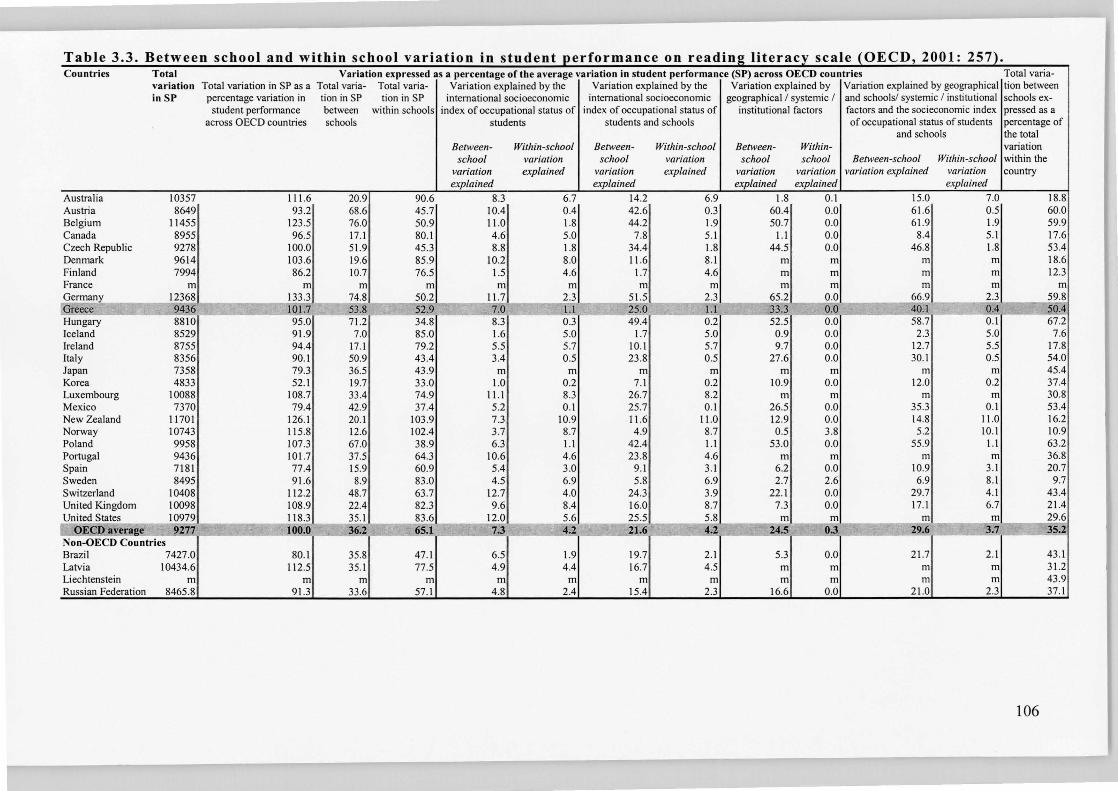
- ~ - - - - - - - - - - - - -- - - - - --- - - - --- -- - - --- --- -- ---- - -- c- -- - -- -- - - - - - - - ----- -- ----- --- - - -- - - - - - -
Countries Total Variation expressed as a percentage of the average variation in student performance (SP) across OECD countries Total varia-variation Total variation in SP as a Total varia- Total varia- Variation explained by the Variation explained by the Variation explained by Variation explained by geographical tion between in SP percentage variation in tion in SP tion in SP international socioeconomic international socioeconomic geographical / systemic / and schools/ systemic / institutional schools ex-
student performance between within schools index of occupational status of index of occupational status of institutional factors factors and the socieconomic index pressed as a across OECD countries schools students students and schools of occupational status of students percentage of
and schools the total Between- Within-school Between- Within-school Between- Within- variation
school variation school variation school school Between-school Within-school within the variation explained variation explained variation variation variation explained variation country explained explained explained explained explained
Australia 10357 111.6 20.9 90.6 8.3 6.7 14.2 6.9 1.8 0.1 15.0 7.0 18.8 Austria 8649 93 .2 68.6 45.7 10.4 0.4 42.6 0.3 60.4 0.0 61.6 0.5 60.0 Belgium 11455 123.5 76.0 50.9 11.0 1.8 44.2 1.9 50.7 0.0 61.9 1.9 59.9 Canada 8955 96.5 17.1 80.1 4.6 5.0 7.8 5.1 1.1 0.0 8.4 5 .1 17.6 Czech Republic 9278 100.0 51.9 45.3 8.8 1.8 34.4 1.8 44.5 0 .0 46.8 1.8 53.4 Denmark 9614 103.6 19.6 85.9 10.2 8.0 11.6 8.1 m m m m 18.6 Finland 7994 86.2 10.7 76.5 1.5 4.6 1.7 4.6 m m m m 12.3 France m m m m m m m m rn m m m m
~! 12368 133.3 74.8 50.2 11.7 2 .3 51.5 2.3 65 .2 0.0 66.9 2.3 59.8
Greece 9436 1QI.:Z 23.8 52.2 7.0 1.1 - 25.0 _ 1.1 33.3 0 .0 40.1 0 .4 50.4 Hungary 8810 95.0 71.2 34.8 8.3 0.3 49.4 0.2 52.5 0 .0 58.7 0 .1 67.2 Iceland 8529 91.9 7.0 85.0 1.6 5.0 1.7 5 .0 0.9 0.0 2.3 5.0 7.6 Ireland 8755 94.4 17.1 79.2 5 .5 5 .7 10.1 5.7 9 .7 0 .0 12.7 5.5 17.8 Italy 8356 90. 1 50.9 43.4 3.4 0 .5 23 .8 0 .5 27.6 0.0 30.1 0 .5 54.0 Japan 7358 79.3 36.5 43.9 m m m m m m m m 45.4 Korea 4833 52.1 19.7 33.0 1.0 0 .2 7.1 0 .2 10.9 0 .0 12.0 0 .2 37.4 Luxembourg 10088 108.7 33.4 74.9 11.1 8.3 26.7 8.2 m m m m 30.8 Mexico 7370 79.4 42.9 37.4 5 .2 0 .1 25.7 0.1 26.5 0 .0 35.3 0.1 53.4 New Zealand 11701 126.1 20.1 103.9 7.3 10.9 11.6 11.0 12.9 0 .0 14.8 11.0 16.2 Norway 10743 115.8 12.6 102.4 3.7 8.7 4.9 8.7 0 .5 3.8 5.2 10.1 10.9 Poland 9958 107.3 67.0 38.9 6.3 1.1 42.4 1.1 53.0 0 .0 55.9 1.1 63.2 Portugal 9436 101.7 37.5 64.3 10.6 4.6 23 .8 4.6 m m m m 36.8 Spain 7181 77.4 15.9 60.9 5.4 3 .0 9.1 3.1 6.2 0.0 10.9 3.1 20.7 Sweden 8495 91.6 8.9 83.0 4.5 6 .9 5.8 6.9 2.7 2 .6 6.9 8.1 9 .7 Switzerland 10408 112.2 48.7 63.7 12.7 4 .0 24.3 3.9 22.1 0 .0 29.7 4.1 43.4 United Kingdom 10098 108.9 22.4 82.3 9.6 8.4 16.0 8.7 7.3 0 .0 17.1 6.7 21.4 United States 10979 ~ 35.1 83 .6 12.0 5.6 25.5 5.8 m m m m 29.6
C OECD aveOtge 9277 l00 .. !) '3.6.1 65.1 7.3 --;u - 21.6 4.2 24.5 . 0.3 29.6 3.7 35.2 Non-OECD C ountries Brazil 7427 .0 80.1 35.8 47.1 6 .5 1.9 19.7 2.1 5.3 0 .0 21.7 2.1 43 .1 Latvia 10434.6 112.5 35.1 77.5 4.9 4.4 16.7 4.5 m m m m 31.2 Liechtenstein m m m m m m m m m m m m 43.9 Russian Federation 8465 .8 91.3 33.6 57.1 4.8 2.4 15.4 2.3 16.6 0 .0 21.0 2.3 37.1
106
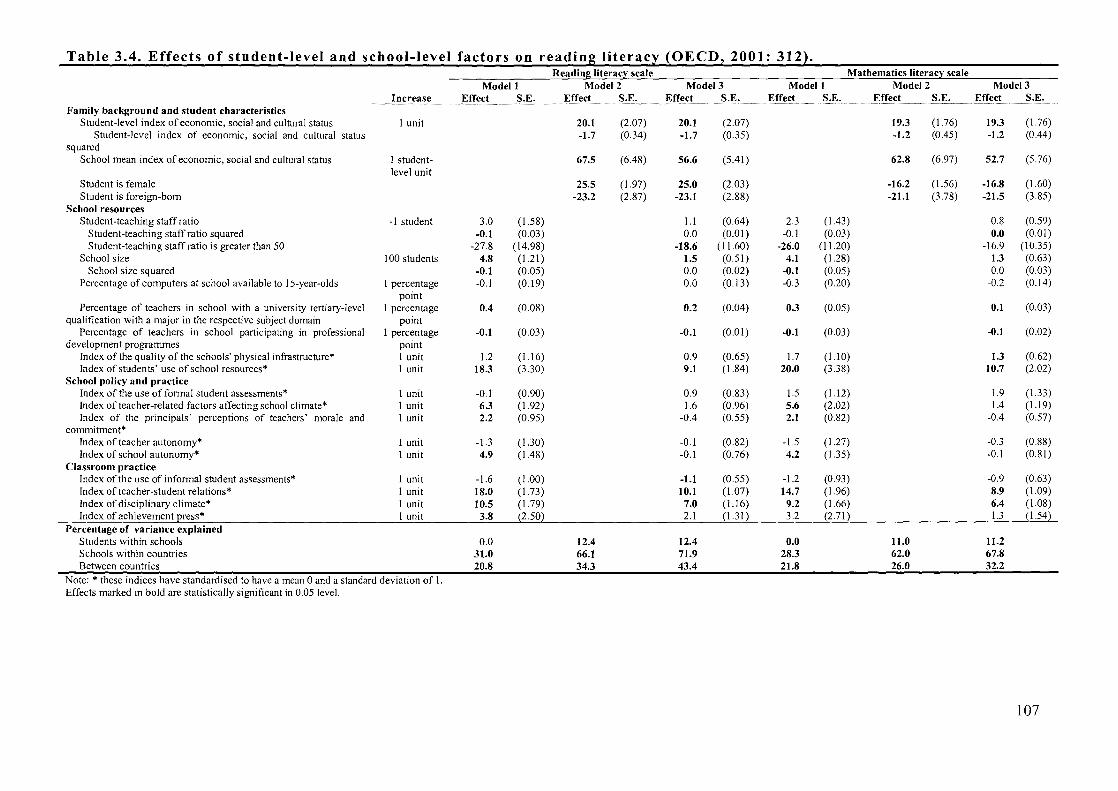
Table 3.4. Effects of student-level and school-level factors on reading literacy (OECD, 2001: 312).
Family background and student characteristics Student-level index of economic, social and cultural status
Student-level index of economic, social and cultural status squared
School mean index of economic, social and cultural status
Student is female Student is foreign-born
School resources Student-teaching staff ratio
Student-teaching staff ratio squared Student-teaching staff ratio is greater than 50
School size School size squared
Percentage of computers at school available to 15-year-olds
Percentage of teachers in school with a university tertiary-level qualification with a major in the respective subject domain
Percentage of teachers in school participating in professional development programmes
Index of the quality of the schools' physical infrastructure* Index of students' use of school resources*
School policy and practice Index of the use of formal student assessments* Index of teacher-related factors affecting school climate* Index of the principals' perceptions of teachers' morale and
commitment* Index of teacher autonomy* Index of school autonomy*
Classroom practice Index of the use of informal student assessments* Index of teacher-student relations* Index of disciplinary climate* Index of achievement press*
Percentage of variance explained Students within schools Schools within countries Between countries
Increase -_ .... _._--_._,,--
I unit
I student-level unit
-I student
100 students
I percentage point
I percentage point
I perc en tage point I unit I unit
I unit I unit I unit
I unit I unit
I unit I unit I unit I unit
Note: * these indices have standardised to have a mean 0 and a standard deviation of I. Effects marked in bold are statistically significant in 0.05 level.
Modell Effect S.E. -- ~~-~--.. _---._._._.-
3.0 -0.1
-27.8 4.8
-0.1 -0.1
0.4
-0.1
1.2 18.3
-0.1 6.3 2.2
-1.3 4.9
-1.6 18.0 10.5 3.8
0.0 31.0 20.8
(1.58) (0.03)
(14.98) (1.21) (0.05) (0.19)
(0.08)
(0.03)
(1.16) (3.30)
(0.90) (1.92) (0.95)
(1.30) (lA8)
(1.00) (I. 73) (1.79) (2.50)
Reading literacy scale Mathematics liter~cy scale Model 2 Model 3
Effect S.E. Effect S.E.
20.1 -1.7
67.5
25.s -23.2
12.4 66.1 34.3
-" .... _,,_ ..... _---
(2.07) (0.34)
(6A8)
(1.97) (2.87)
20.1 -1.7
56.6
25.0 -23.1
1.1 0.0
-18.6 1.5 0.0 0.0
0.2
-0.1
0.9 9.1
0.9 1.6
-OA
-0.1 -0.1
-1.1 10.1
7.0 2.1
12.4 71.9 43.4
(2.07) (0.35)
(SAl)
(2.03) (2.88)
(0.64) (0.01)
(11.60) (0.51) (0.02) (0.13)
(0.04)
(0.01)
(0.65) (1.84)
(0.83) (0.96) (0.55)
(0.82) (0.76)
(0.55) (1.07) (1.16) {l.312
Modell Effect
2.3 -0.1
-26.0 4.1
-0.1 -0.3
0.3
-0.1
1.7 20.0
1.5 5.6 2.1
-1.5 4.2
-1.2 14.7
9.2 3.2
0.0 28.3 21.8
S.E.
(1.43) (0.03)
(11.20) (1.28) (0.05) (0.20)
(0.05)
(0.03)
(1.10) (3.38)
(1.12) (2.02) (0.82)
(1.27) (1.35)
(0.93) (1.96) (1.66)
_(2.71)
Model 2 Effect
19.3 -1.2
62.8
-16.2 -21.1
-
11.0 62.0 26.0
S.E.
(1.76) (OA5)
(6.97)
(1.56) (3.78)
_ .. -- -
Model 3 Effect S.E.
19.3 (1.76) -1.2 (0.44)
52.7 (5.76)
-16.8 (1.60) -21.5 (3.85)
0.8 (0.59) 0.0 (0.01)
-16.9 (10.35) 1.3 (0.63) 0.0 (0.03)
-0.2 (0.14)
0.1 (0.03)
-0.1 (0.02)
1.3 (0.62) 10.7 (2.02)
1.9 (1.33) 1.4 (1.19)
-OA (0.57)
-OJ (0.88) -0.1 (0.81)
-0.9 (0.63) 8.9 (1.09) 6.4 (1.08)
_1~_(1.541
1l.2 67.8 32.2
107
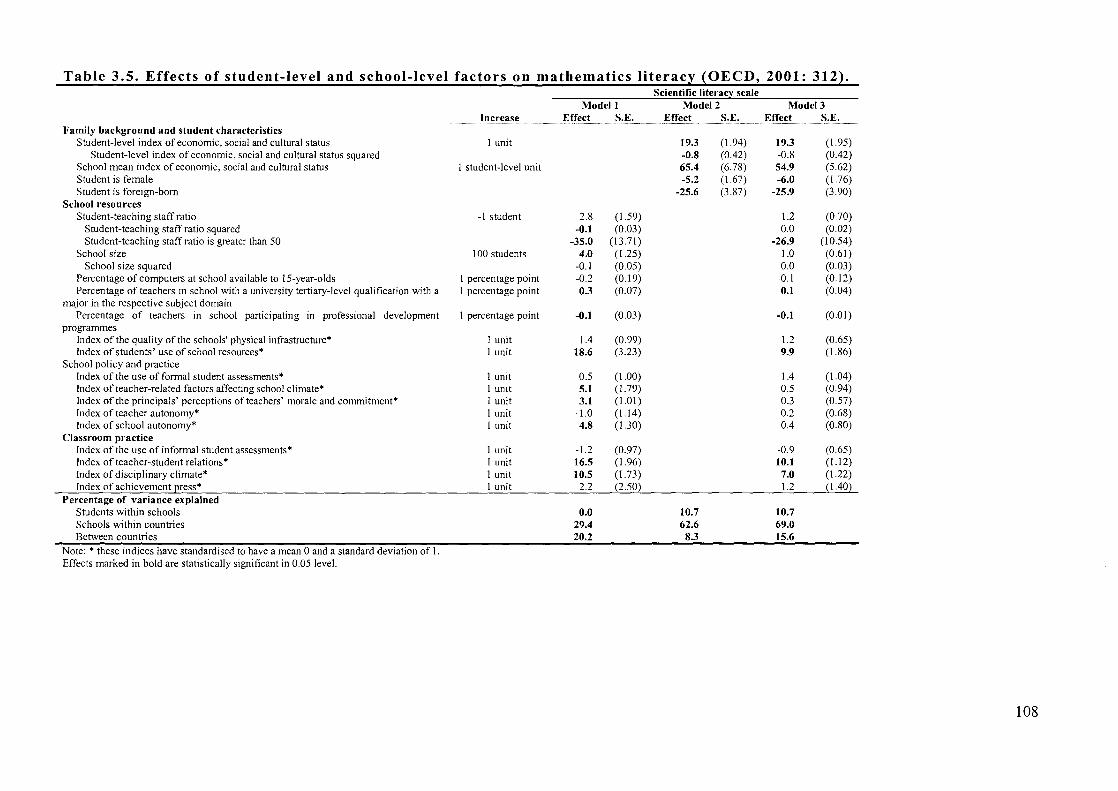
Table 3.5. Effects of student-level and school-level factors on mathematics literacy (OECD, 2001: 312).
Family background and student characteristics Student-level index of economic, social and cultural status
Student-level index of economic, social and cultural status squared School mean index of economic, social and cultural status Student is female Student is foreign-born
School resources Student-teaching staff ratio
Student-teaching staff ratio squared Student-teaching staff ratio is greater than 50
School size School size squared
Percentage of computers at school available to 15-year-olds Percentage of teachers in school with a university tertiary-level qualification with a
major in the respective subject domain Percentage of teachers in school participating in professional development
programmes Index of the quality of the schools' physical infrastructure* Index of students' use of school resources*
School policy and practice Index of the use of formal student assessments* Index of teacher-related factors affecting school climate* Index of the principals' perceptions of teachers' morale and commitment* Index of teacher autonomy* Index of school autonomy*
Classroom practice
Increase
1 unit
1 student-level unit
-1 student
100 students
1 percentage point 1 percentage point
1 percentage point
1 unit 1 unit
1 unit 1 unit 1 unit 1 unit 1 unit
Scientific literacy scale Modell Model 2 Model 3
Effect S.E. Effect S.E. Effect S.E.
19.3 (1.94) 19.3 (1.95) -0.8 (0.42) -0.8 (0.42) 65.4 (6.78) 54.9 (5.62) -5.2 (1.67) -6.0 (1.76)
-25.6 (3.87) -25.9 (3.90)
2.8 (1.59) 1.2 (0.70) -0.1 (0.03) 0.0 (0.02)
-35.0 (13.71 ) -26.9 (10.54) 4.0 (1.25) 1.0 (0.61)
-0.1 (0.05) 0.0 (0.03) -0.2 (0.19) -0.1 (0.12) 0.3 (0.07) 0.1 (0.04)
-0.1 (0.03) -0.1 (0.01)
1.4 (0.99) 1.2 (0.65) 18.6 (3.23) 9.9 (1.86)
0.5 (1.00) 1.4 (1.04) 5.1 (1.79) 0.5 (0.94) 3.1 (1.01) 0.3 (0.57)
-1.0 (1.14) 0.2 (0.68) 4.8 (1.30) 0.4 (0.80)
Index of the use of informal student assessments* 1 unit -1.2 (0.97) -0.9 (0.65) Index of teacher-student relations* I unit 16.5 (1.96) 10.1 (1.12) Index of disciplinary climate* 1 unit 10.5 (1.73) 7.0 (1.22) Index of achievement press* 1 unit 2.2 _ (2.50) 1.2 _(1 ~
Percentage of variance explained Students within schools Schools within countries Between countries
Note: * these indices have standardised to have a mean 0 and a standard deviation of I. Effects marked in bold are statistically significant in 0.05 level.
0.0 29.4 20.2
10.7 62.6
8.3
10.7 69.0 15.6
108

3.3. CRITICISM OF SCHOOL EFFECTIVENESS
From what has been discussed so far in this chapter, it is obvious that School
Effectiveness has been a catalytic research movement for more than 20 years. Barber &
White (1997) are right to argue that 'it is hard to think of another example of a body of
research having such a powerful impact on the education service since the War' (p. 1).
However, where there is research there is critique. Some of the critics of school
effectiveness research are supportive. Others, however, are very antagonistic and reject
school effectiveness completely. As school effectiveness lies at the heart of the current
work, basic criticism of it has to be presented and dealt with.
One of the charges made against School Effectiveness is that the researchers who work
inside this paradigm do not respond to criticism. Allegedly, this is done either by
ignoring criticism, or downplaying it, or not being consistent in confronting it, or by
accepting it with the promise of future improvements (Thrupp, 2001). In this chapter the
basic points against school effectiveness research are presented together with a number
of counterpoints. The issue of criticism, however, is large and in a way context-specific.
Indeed, if one browsed the special issue of the journal School Effectiveness and School
Improvement (volume 12, part 1), which is dedicated to the issue of criticism of school
effectiveness, he or she would get the impression that criticism is an exclusively British
issue. Teddlie & Reynolds (2001) recognise three strands of criticism against school
effectiveness: political, methodological, and theoretical. The current author will keep
Teddlie & Reynolds' (2000) classification.
3.3.1. POLITICAL CRITICISM
Political criticism of School Effectiveness Research (SER) is the most serious. In the
domain of policy, there are some authors who claim that School SER has failed to
control the political use of its findings (Thrupp, 2001). Indeed, it is true that in many
cases politicians have used SER findings in a way which has hurt teachers' morale. The
most serious accusation from a political point of view, however, is that SER has been
supporting Right-wing policies - especially in the United Kingdom - and has been
promoting social engineering through education. Mortimore & Sammons (1997) have
strongly denied such 'unfair accusations', as they characterise them, and challenged
109
those who support them either to provide evidence for these criticisms or withdraw
them. Regarding the argument that SER is supportive of Right-wing policies, the issue
has been put onto a theoretical basis by Whitty et ai. (1998) as follows:
Both the New Right and the school effectiveness body take the discursive repositioning of schools as autonomous self-improving agencies at face value, rather than recognising that, in practice, the atomisation of schooling too often merely allows advantaged schools to maximise their advantages (Whitty et ai., 1998: 13)
Willmott (1999) goes further and claims that SER is ideologically committed to
conservative social philosophy. As he writes:
The defense of the accusation of 'ideological commitment' consist in an elucidation of the relationship between the social ontology that positivist methodology presupposes and its implications for social policy. It has been argued that positivist ontology is congruent with specific constituent elements of Conservative social philosophy. ( ... ) Indeed, what is distinctively ideological about the research is the ways in which it lends credence to, and informs, policies which place the burden of 'improving' schools squarely on teachers' shoulders, thus concealing the reality of structured inequalities that necessarily delimit the extent to which 'improvement' can take place (Willmott, 1999: 266)
Agnus (1993) similarly writes that School Effectiveness advocates an 'isolationist's
apolitical approach' to education in which it is assumed that educational problems can
be fixed by technical means. 'The School Effectiveness Research tradition - Angus
(1993) argues - advocates that inequality can be managed within the walls of schools
and classrooms, provided that teachers and pupils follow correct effective school
procedures' (p. 343). Similarly, for Morley & Rassool (1999), School Effectiveness is
not a neutral scientific device but is saturated in power relations. Finally, for Fielding
(1997) both School Effectiveness and School Improvement paradigms are 'importantly
flawed' because, as he argues, they do not deal with the dilemmas and possibilities
facing education in and for democracy at the end of the 20th century.
As regards the accusation that School Effectiveness is a kind of social engineering,
much criticism can be found in the book School Effectiveness for Whom which has been
edited by Slee et al. (1998). In this book, Hamilton et al. (1998) claim that School
Effectiveness Research lends support to a functionalistic view of social engineering and
is nothing more than the implementation of the ideas of Taylor and Adams about
Scientific Management in schooling. Hamilton (1998) accuses School Effectiveness of
110
being 'an ethnocentric pseudo-science that serves merely to mystify anxIOUS
administrators and marginalise uncertain practitioners' and goes on to accuse School
Effectiveness of being 'social Darwinist and eugenic ... standing at the intersection of
educational research and social engineering' (p. 13). Lingard, Ladwig, & Luke (1998)
also support the idea that School Effectiveness Research is a form of social engineering.
The authors claim that 'better outcomes (effectiveness) and better proof of outcomes are
expected of a less-funded schooling system' (p. 78). According to the same authors (op.
cit.), the School Effectiveness literature 'is founded on a narrative about the success of
the technological quantification'. The managerial model which is claimed to be
advocated by School Effectiveness theorists and researchers is, according to Lingard et
al. (1998) that of 'steering from a distance', that is a managerial model which advocates
self-monitoring, local self-regulation, local reporting and discursive self-reconstruction.
These qualities, according to the authors (op. cit.), are the characteristics of a
managerial model that is mostly found in the modem Japanese car industry. Lingard et
al. (1998) thus argue that School Effectiveness brings 'toyotism' into education. Morley
& Rassool (1999) support similar ideas about the 'japanisation' (sic) of education in the
British Islands. They argue that School Effectiveness Research has gradually distanced
itself from its initial focus which has been the pursuit of equity and social justice. The
same authors also point to the 'irrationality' of exporting the school effectiveness
research paradigm to developing countries (op. cit.).
It is very difficult indeed for any researcher in the area of School Effectiveness to
answer all of the criticisms made in the political and philosophical domain. What
however makes the response to the criticism more difficult is that the criticism seems to
be specific to the British educational context and couched in highly emotive language.
In Greece, for example, there is no precedent of work in school effectiveness and
therefore there is no precedent of criticism. A powerful defence against criticism is the
contribution of Teddlie & Reynolds (2001) in the journal School Effectiveness and
School Improvement (vol. 12, part 1). Teddlie & Reynolds (2001) answer criticisms
presented in the previous paragraph by pointing out that there is a wide diversity of
school effectiveness research internationally. The authors (op. cit.) name three major
strands of this research after Reynolds & Teddlie (2000b): (a) school effects research,
(b) effective school research, and (c) school improvement research. According to
Teddlie & Reynolds (2001), in school effects research studies, the researchers
investigate the scientific properties of school effects as they evolve from simple input-
111

output studies to studies that use complex multilevel models. Effective schools research
is concerned with the processes of effective schooling evolving from case studies of
'outlier' schools through to more complex contemporary studies merging qualitative
and quantitative methods in the simultaneous study of classrooms and schools. Finally,
school improvement research examines the processes whereby schools can be changed
using increasingly sophisticated models that have gone beyond simple applications of
school effectiveness knowledge to sophisticated 'multiple level' models (op. cit.: 48).
The same authors also list a number of sub-branches of these three areas of school
effectiveness. For example, it is argued that as many as seven different scientific areas
exist within school effect research paradigm and nine areas exist within the effective
schools research paradigm (op. cit.). Thus, the first counterpoint to the criticisms which
were presented in the previous paragraph is that School Effectiveness Research must not
be treated as a monolithic area of enquiry; many strands exist under its umbrella and
therefore SER cannot be validly accused of 'social engineering' and 'japanisation'.
With regard to the accusations that School Effectiveness Research has had a pervasive
impact on educational policy making, and that researchers in the school effectiveness
paradigm have been unable to control negative uses of their findings by policy makers,
Teddlie & Reynolds (2001) argue that 'the symbiotic relationship between educational
policy making and school effectiveness has been overstated by the critics' (p. 50). The
authors present the example of the Netherlands and the United States, where a
flourishing school effectiveness research knowledge base has been ignored for years by
politicians. However, the most savage political criticism against School Effectiveness
Research has been the view that it gives support to Right-wing policies. In the current
researcher's opinion such criticism is unfair. Upon this Townsend (2001) responds to a
similar criticism by Thrupp (2001) and gives a more personal tone to his answer:
As a researcher who has felt the wrath of a right-wing government (Victoria's Kennett government of 1992-1999) and was banned from doing research in public schools for 4 years, I feel somewhat unhappy about the tone that this argument takes. It suggests that research that has been undertaken in many parts of the world is somehow tainted because it was funded by governments not of the political persuasion of Dr. Thrupp. Yet it is obvious that there have been many advances in our knowledge about children and their learning that has come as a product or research that has spanned governments of different persuasions and levels of support (Townsend, 2001: 124).
112
3.3.2. EPISTEMOLOGICAL AND METHODOLOGICAL CRITICISM
Epistemology is a branch of philosophy concerned with the nature of knowledge, its
possibility, scope, and general basis (Hamlyn, 1995). Methodology, on the other hand,
is the study of the methods. In an attempt to summarise criticisms of school
effectiveness research methodology, Jensen (1995) listed the following 11 points: (1)
sample bias, (2) definition problems, (3) narrow outcome measures, (4) inadequate
control of background characteristics, (5) inappropriate comparisons between schools
and students, (6) various methodological limitations, (7) the aggregation of achievement
data, (8) not enough levels of analysis, (9) observer bias, (10) theoretical weaknesses,
and (11) problems in causal ordering (Jensen 1995: 187). Another example of
theoretical criticism has been provided by Chitty (1997) who has argued that School
Effectiveness Research may have provided an antidote to the pessimism and fatalism of
the 1970s but today it is deficient in four important respects. Firstly, it places too much
emphasis on the notion of progressive school management as the dynamic of change;
secondly, it fails to take full account of the characteristics of the education system as a
whole; thirdly, it shows little regard for the issues of social class; fourthly, it has little to
say about issues of curriculum content and pedagogy.
From an epistemological perspective, some critics doubt whether the mathematical
models of school effectiveness can 'explain' reality. Slee & Weiner (1998) wrote that
the School Effectiveness Research movement is undermined by epistemic and
methodological reductionism because, as they argued, 'it bleaches the context from its
analytic frame' (p. 8). Agnus (1993) argues that the methodology of SER is 'a technicist
common sense approach that fails to understand or explain the complex notion of what
counts as educational practice' (p. 335). The same author goes on to accuse School
Effectiveness Research of being 'naively positivistic'. 'There is - Agnus (1993) argues
- an attempt to establish a mathematical connection between statistically equalised
pupils and their performance'. He also argues that:
There is no sense of how the relationship (between statistically equalised pupils and their performance) works. The correlations can be said to build into a systematic theory only because, as Seddon (in press) explains, such standard view positivist propositions are regarded as true if they correspond with the facts (Angus, 1993: 341).
113
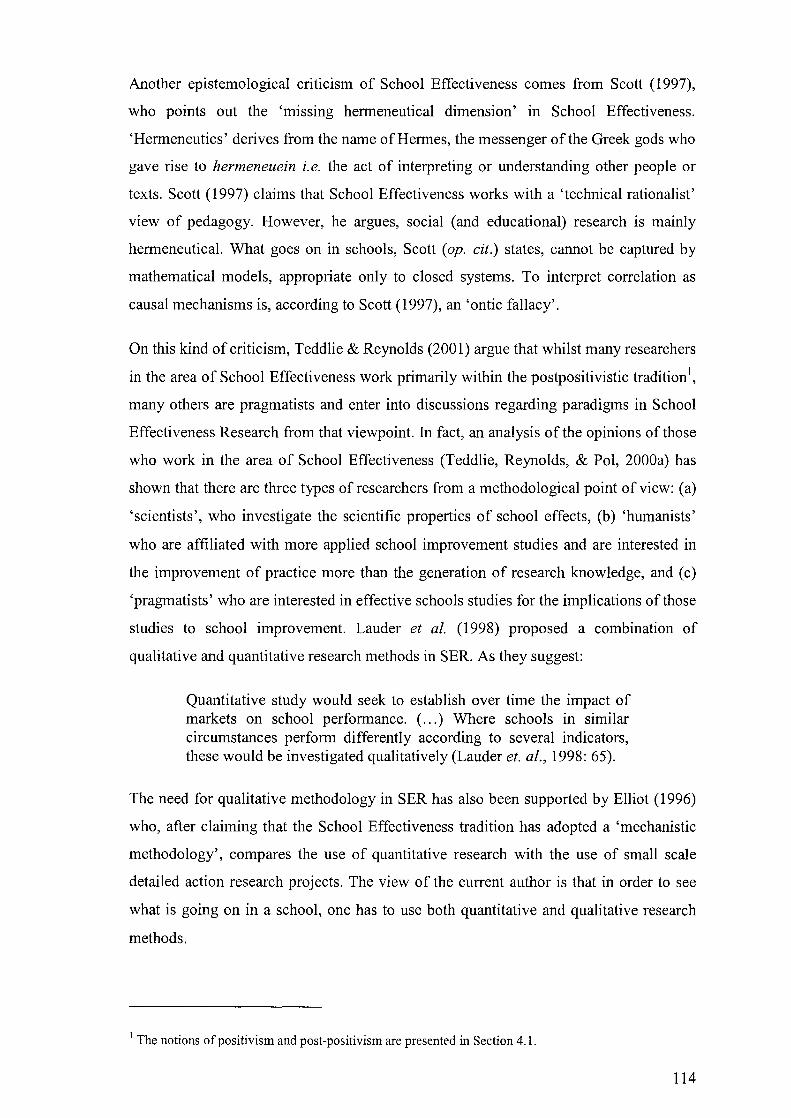
Another epistemological criticism of School Effectiveness comes from Scott (1997),
who points out the 'missing hermeneutical dimension' in School Effectiveness.
'Hermeneutics' derives from the name of Hermes, the messenger of the Greek gods who
gave rise to hermeneuein i. e. the act of interpreting or understanding other people or
texts. Scott (1997) claims that School Effectiveness works with a 'technical rationalist'
view of pedagogy. However, he argues, social (and educational) research is mainly
hermeneutical. What goes on in schools, Scott (op. cit.) states, cannot be captured by
mathematical models, appropriate only to closed systems. To interpret correlation as
causal mechanisms is, according to Scott (1997), an 'ontic fallacy'.
On this kind of criticism, Teddlie & Reynolds (2001) argue that whilst many researchers
in the area of School Effectiveness work primarily within the postpositivistic tradition 1,
many others are pragmatists and enter into discussions regarding paradigms in School
Effectiveness Research from that viewpoint. In fact, an analysis of the opinions of those
who work in the area of School Effectiveness (Teddlie, Reynolds, & Pol, 2000a) has
shown that there are three types of researchers from a methodological point of view: (a)
'scientists', who investigate the scientific properties of school effects, (b) 'humanists'
who are affiliated with more applied school improvement studies and are interested in
the improvement of practice more than the generation of research knowledge, and (c)
'pragmatists' who are interested in effective schools studies for the implications of those
studies to school improvement. Lauder et al. (1998) proposed a combination of
qualitative and quantitative research methods in SER. As they suggest:
Quantitative study would seek to establish over time the impact of markets on school performance. ( ... ) Where schools in similar circumstances perform differently according to several indicators, these would be investigated qualitatively (Lauder et. al., 1998: 65).
The need for qualitative methodology in SER has also been supported by Elliot (1996)
who, after claiming that the School Effectiveness tradition has adopted a 'mechanistic
methodology', compares the use of quantitative research with the use of small scale
detailed action research projects. The view of the current author is that in order to see
what is going on in a school, one has to use both quantitative and qualitative research
methods.
I The notions of positivism and post-positivism are presented in Section 4.1.
114
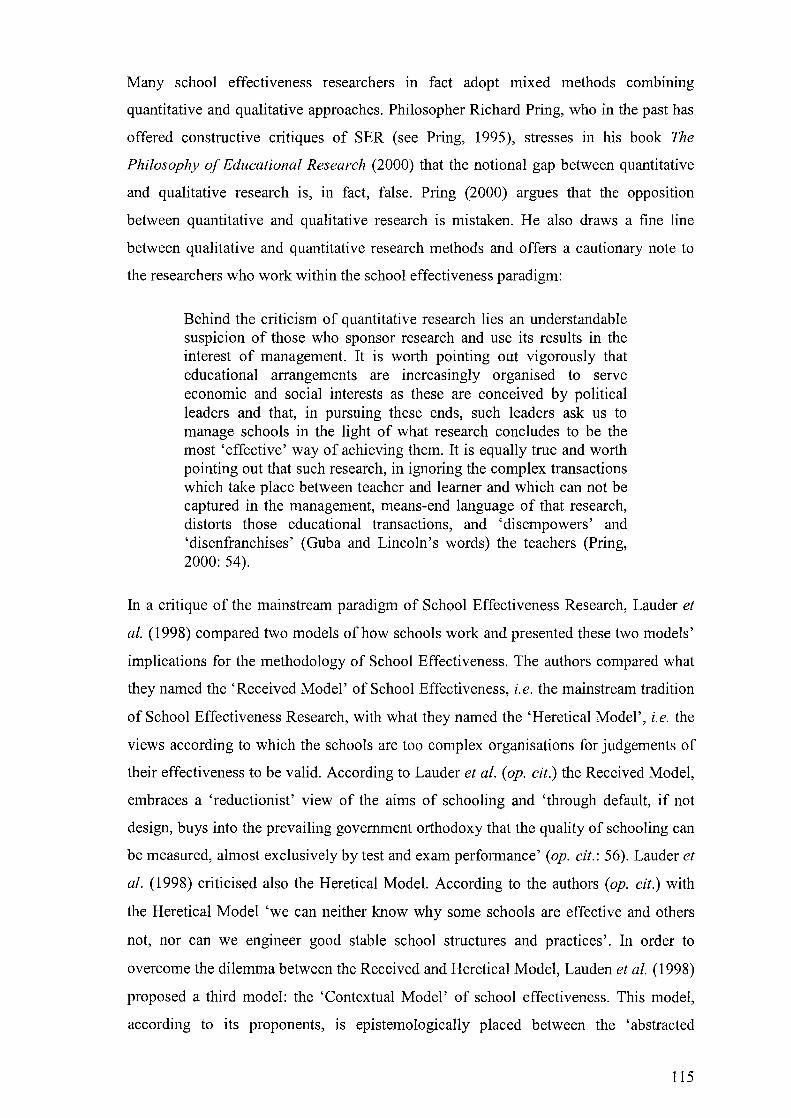
Many school effectiveness researchers in fact adopt mixed methods combining
quantitative and qualitative approaches. Philosopher Richard Pring, who in the past has
offered constructive critiques of SER (see Pring, 1995), stresses in his book The
Philosophy of Educational Research (2000) that the notional gap between quantitative
and qualitative research is, in fact, false. Pring (2000) argues that the opposition
between quantitative and qualitative research is mistaken. He also draws a fine line
between qualitative and quantitative research methods and offers a cautionary note to
the researchers who work within the school effectiveness paradigm:
Behind the criticism of quantitative research lies an understandable suspicion of those who sponsor research and use its results in the interest of management. It is worth pointing out vigorously that educational arrangements are increasingly organised to serve economic and social interests as these are conceived by political leaders and that, in pursuing these ends, such leaders ask us to manage schools in the light of what research concludes to be the most 'effective' way of achieving them. It is equally true and worth pointing out that such research, in ignoring the complex transactions which take place between teacher and learner and which can not be captured in the management, means-end language of that research, distorts those educational transactions, and 'disempowers' and 'disenfranchises' (Guba and Lincoln's words) the teachers (Pring, 2000: 54).
In a critique of the mainstream paradigm of School Effectiveness Research, Lauder et
al. (1998) compared two models of how schools work and presented these two models'
implications for the methodology of School Effectiveness. The authors compared what
they named the 'Received Model' of School Effectiveness, i.e. the mainstream tradition
of School Effectiveness Research, with what they named the 'Heretical Model', i.e. the
views according to which the schools are too complex organisations for judgements of
their effectiveness to be valid. According to Lauder et al. (op. cit.) the Received Model,
embraces a 'reductionist' view of the aims of schooling and 'through default, if not
design, buys into the prevailing government orthodoxy that the quality of schooling can
be measured, almost exclusively by test and exam performance' (op. cit.: 56). Lauder et
al. (1998) criticised also the Heretical Model. According to the authors (op. cit.) with
the Heretical Model 'we can neither know why some schools are effective and others
not, nor can we engineer good stable school structures and practices'. In order to
overcome the dilemma between the Received and Heretical Model, Lauden et al. (1998)
proposed a third model: the 'Contextual Model' of school effectiveness. This model,
according to its proponents, is epistemologically placed between the 'abstracted
115
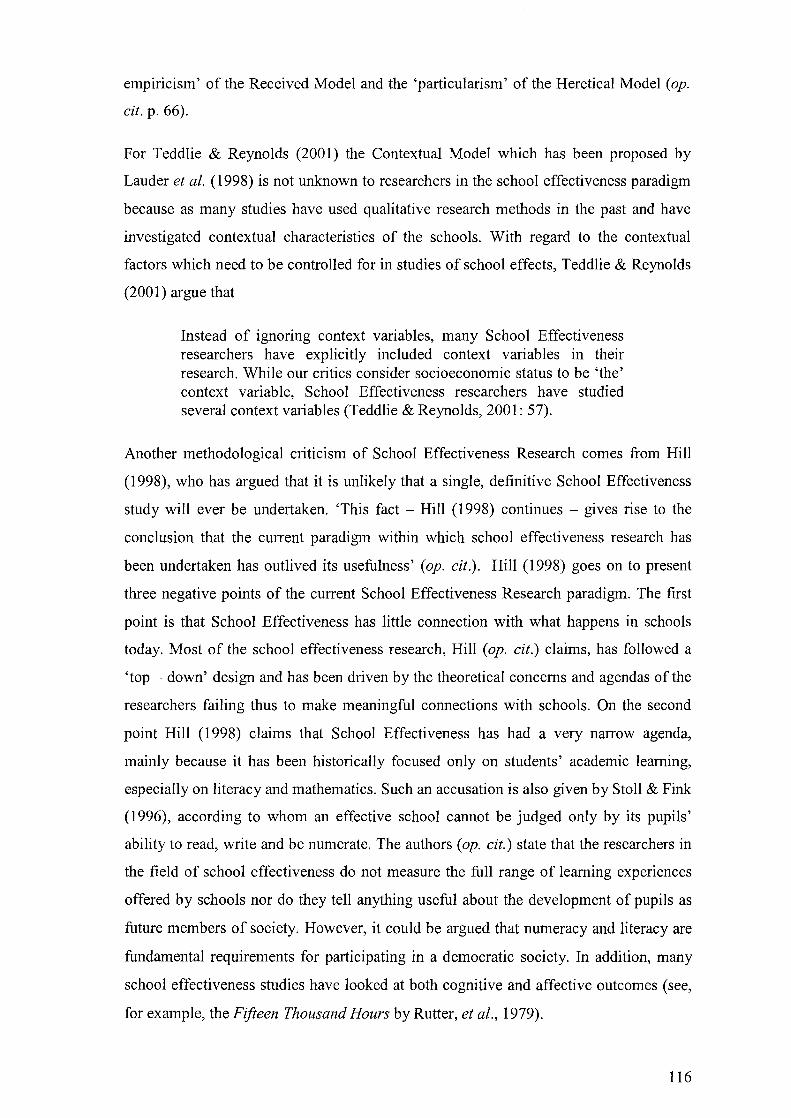
empiricism' of the Received Model and the 'particularism' of the Heretical Model (op.
cit. p. 66).
For Teddlie & Reynolds (2001) the Contextual Model which has been proposed by
Lauder et al. (1998) is not unknown to researchers in the school effectiveness paradigm
because as many studies have used qualitative research methods in the past and have
investigated contextual characteristics of the schools. With regard to the contextual
factors which need to be controlled for in studies of school effects, Teddlie & Reynolds
(2001) argue that
Instead of ignoring context variables, many School Effectiveness researchers have explicitly included context variables in their research. While our critics consider socioeconomic status to be 'the' context variable, School Effectiveness researchers have studied several context variables (Teddlie & Reynolds, 2001: 57).
Another methodological criticism of School Effectiveness Research comes from Hill
(1998), who has argued that it is unlikely that a single, definitive School Effectiveness
study will ever be undertaken. 'This fact - Hill (1998) continues - gives rise to the
conclusion that the current paradigm within which school effectiveness research has
been undertaken has outlived its usefulness' (op. cit.). Hill (1998) goes on to present
three negative points of the current School Effectiveness Research paradigm. The first
point is that School Effectiveness has little connection with what happens in schools
today. Most of the school effectiveness research, Hill (op. cit.) claims, has followed a
'top - down' design and has been driven by the theoretical concerns and agendas of the
researchers failing thus to make meaningful connections with schools. On the second
point Hill (1998) claims that School Effectiveness has had a very narrow agenda,
mainly because it has been historically focused only on students' academic learning,
especially on literacy and mathematics. Such an accusation is also given by Stoll & Fink
(1996), according to whom an effective school cannot be judged only by its pupils'
ability to read, write and be numerate. The authors (op. cit.) state that the researchers in
the field of school effectiveness do not measure the full range of learning experiences
offered by schools nor do they tell anything useful about the development of pupils as
future members of society. However, it could be argued that numeracy and literacy are
fundamental requirements for participating in a democratic society. In addition, many
school effectiveness studies have looked at both cognitive and affective outcomes (see,
for example, the Fifteen Thousand Hours by Rutter, et at., 1979).
116
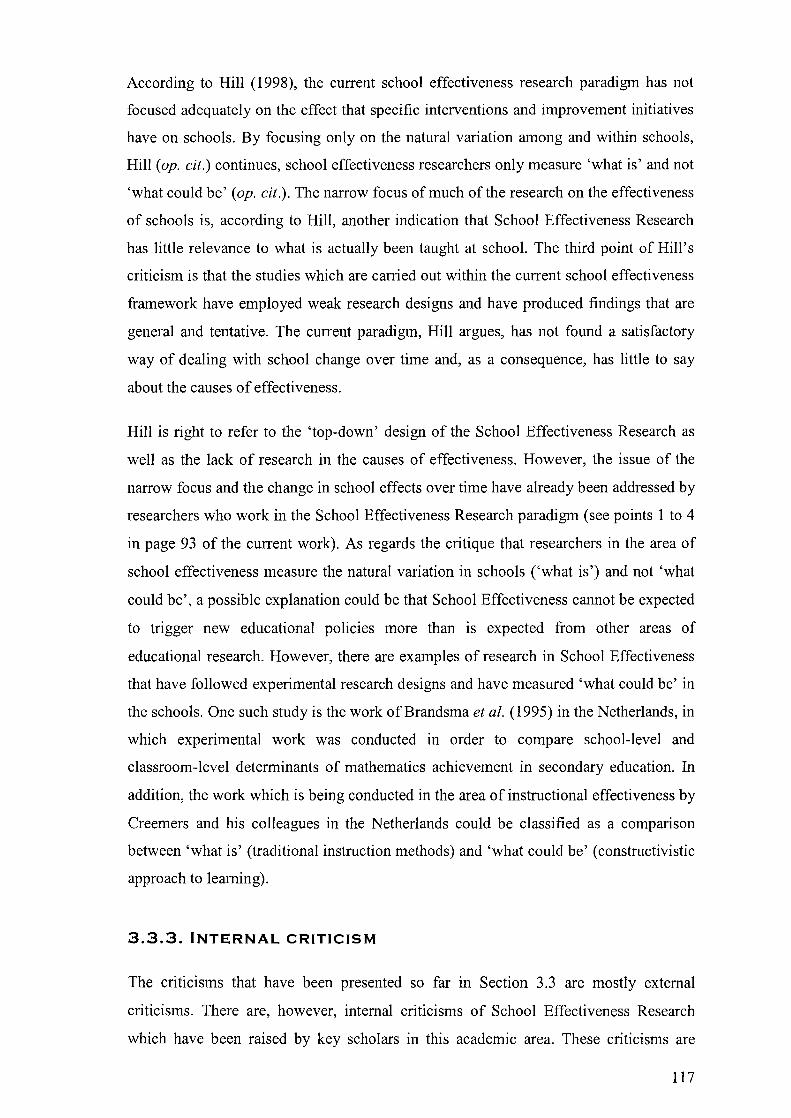
According to Hill (1998), the current school effectiveness research paradigm has not
focused adequately on the effect that specific interventions and improvement initiatives
have on schools. By focusing only on the natural variation among and within schools,
Hill (op. cit.) continues, school effectiveness researchers only measure 'what is' and not
'what could be' (op. cit.). The narrow focus of much of the research on the effectiveness
of schools is, according to Hill, another indication that School Effectiveness Research
has little relevance to what is actually been taught at school. The third point of Hill's
criticism is that the studies which are carried out within the current school effectiveness
framework have employed weak research designs and have produced findings that are
general and tentative. The current paradigm, Hill argues, has not found a satisfactory
way of dealing with school change over time and, as a consequence, has little to say
about the causes of effectiveness.
Hill is right to refer to the 'top-down' design of the School Effectiveness Research as
well as the lack of research in the causes of effectiveness. However, the issue of the
narrow focus and the change in school effects over time have already been addressed by
researchers who work in the School Effectiveness Research paradigm (see points 1 to 4
in page 93 of the current work). As regards the critique that researchers in the area of
school effectiveness measure the natural variation in schools (,what is') and not 'what
could be', a possible explanation could be that School Effectiveness cannot be expected
to trigger new educational policies more than is expected from other areas of
educational research. However, there are examples of research in School Effectiveness
that have followed experimental research designs and have measured 'what could be' in
the schools. One such study is the work of Brandsma et al. (1995) in the Netherlands, in
which experimental work was conducted in order to compare school-level and
classroom-level determinants of mathematics achievement in secondary education. In
addition, the work which is being conducted in the area of instructional effectiveness by
Creemers and his colleagues in the Netherlands could be classified as a comparison
between 'what is' (traditional instruction methods) and 'what could be' (constructivistic
approach to learning).
3.3.3. INTERNAL CRITICISM
The criticisms that have been presented so far in Section 3.3 are mostly external
criticisms. There are, however, internal criticisms of School Effectiveness Research
which have been raised by key scholars in this academic area. These criticisms are
117
important because they are in fact insiders' view of the case of school effectiveness. In
one such internal critique, Scheerens et al. (200 1) deal with a number of important
issues within SER like the issues of context, alternative perspectives on learning, and
the use of Information and Communication Technology (lCT) in schools. This critique
has been published in the special issue of School Effectiveness and School Improvement
(vol. 12, part 1).
Scheerens et al. (2001) attempt to restore the true picture of School Effectiveness
Research by explaining what SER is about and what it is not. They later go on to defend
School Effectiveness Research against the criticism which was presented in Section
3.3.1. According to the authors, School Effectiveness is about 'instrumental rationality
(how to do things right)' and not so much about 'substantive rationality (how to do the
right things)' (p. 132). Scheerens et al. (2001) admit that researchers in the area of
School Effectiveness are making political choices but, as they argue, this is not
necessarily a defect or as important as presented by external critics. The researchers in
the realm of School Effectiveness, Scheerens et al. (2001) state, focus on the study of
basic skills or examination results for which there is a fair degree of agreement about
their practical importance.
Another point of criticism which Scheerens et al. (2001) react to is the accusation that
SER has ignored the social context. Upon that, the authors present two lines of defence.
Firstly, they stress the importance of the school effect on students' achievement by
comparing it with the contribution of other societal factors. The general finding that
schools account for, say, only 15 per cent of the variation in students' achievement,
does not mean that societal factors account for the remaining 85 per cent. In fact, the
contribution of a school can be much higher from a statistical point of view and much
more important from a substantial point of view, mainly because:
(a) this 15% does not include either the variation which can be found at lower levels,
like departments and individual teachers or the interaction between the levels;
(b) the aforementioned percentage is based on the relative distance between 'good' and
'bad' and says nothing about the true contribution of the educational system which
for some subjects can be very high indeed;
(c) in fact, the best predictor of student performance is not their socio-economic status
but past performance or aptitude.
118

Scheerens et al. (200 I), however, rise above the criticisms which target the allegedly
ignorance of social context from the researchers within SER. Scheerens et al. (op. cit.)
not only discuss contextual effects in the form of an exemplary mathematical formula
but also consider the effects of school composition on student achievement (see Figure
3.1, below).
school organisation
school level socioeconomic status (2)
student level socioeconomic status
(1)
student achievement
Figure 3.1. Contextual effects and school organisational effects on student achievement (from Scheerens et al. 2001: 136).
According to Scheerens et al. (2001), if schools have their own policies for student
enrolment, the effect of the socioeconomic status of student achievement is not direct.
In fact, the effect of socioeconomic status is represented by arrows 1 and 2, the latter
being associated with variables that have to do with the organisation of the school. The
decomposition of the total effect of school organisation on student achievement would
thus require the estimation of the structural coefficients indicated by arrows 2,3, and 4.
Scheerens et al. (2001) in their 'self-criticism' deal with other issues including (a) the
need for 'state of the art' studies on foundational SER issues, (b) the need for more
studies that focus on the teaching and learning transaction, (c) the use of Information
and Communication Technology in the schools, and (d) the relation of SER to
educational policy in the area of decentralisation and accountability. Scheerens et al.
(2001) refer to the relation between School Effectiveness and school self-evaluation. In
the same article they inform their readers that they have been active in developing
instruments for school self-evaluation inspired by the factors that constitute part of the
knowledge base on school effectiveness. This is also the purpose of the current thesis. It
is hoped that the present study, which explores SER in the Greek context, will
contribute to the further development of approaches to the study of variation between
secondary schools and their impact on students.
119

3.4. EFFECTIVE SCHOOL CONDITIONS
As it has been already stated, school effectiveness research findings and methods lie on
the heart of the current thesis. The aim of this section is to present SER findings on the
topics that will be investigated in the Greek context. The literature on School
Effectiveness Research findings is rich and, therefore, it is important to divide the
literature into lines of inquiry. For this purpose a number of efforts have be done in the
past. Clark et al. (1984) for example, categorised the body of the School Effectiveness
literature into two parts: the literature on 'instructionally effective schools' and the
literature of 'school improvement'. Purkey & Smith (1983) in their review distinguished
four groups of school effectiveness research: (a) 'outlier studies', (b) 'case studies', (c)
'programme evaluations', and (d) 'other studies'. A third categorisation is provided by
Ralf & Fennessey (1983), who distinguished two categories of School Effectiveness
studies: (a) the study of effective schools and (b) the study of school effects. The scope
of the current thesis falls into Ralf and Fennessey's (1983) second category: the study of
school effects. The presentation will start with lists of effective schools' conditions.
3.4.1. LISTS OF EFFECTIVE SCHOOL CONDITIONS
Lists of effective schools' conditions are sets of factors that, as research has indicated,
are associated with the effectiveness of the school. The older list of effective school
condition can be found in the work of Edmond (1979) which was presented earlier in
Section 3.2.1. The five effectiveness conditions of Edmonds (1979) were: (a) strong
educational leadership, (b) high expectations of student achievement, (c) an emphasis
on basic skills, (d) a safe and orderly climate, and (e) frequent evaluation of pupil
progress. Lists, which in a way summarised some important educational and school
effectiveness characteristics, were very popular among researchers in the past because
they epitomised the school effectiveness knowledge base and could easily be
disseminated to policy makers, schoolteachers and inspectors. Soon, however, the lists
of effective schools conditions received a lot of criticism. For example, OECD experts
warned that 'compilations of such lists unfortunately still fail to provide us with the
means fully to understand the complex interplay of factors and the means whereby
effectiveness may be enhanced (OECD, 1994: 14).
120
Nowadays, the lists of effective school conditions have been used by the same critics to
undennine all research that is being conducted inside the SER paradigm. Hoy et al.,
(2000), for example, argue that 'it is now widely acknowledged that most "effective"
schools display five or six characteristics which most of us could write down without
much thought on the back of an envelope' (p. 5). On the other hand, lists with effective
schools characteristics can be useful in some cases. As Sammons & Reynolds (1997)
answered to Elliot's (1996) criticism, many so called 'obvious' characteristics of school
effectiveness are not supported by research. The SER community has recently distance
itself from lists of effective school characteristics because it is today acknowledged that
the characteristics of educational effectiveness have a strong local character (Teddlie et
at., 2000a).
Lists of effective school conditions will be presented in the current study because this
will help the readers of the current thesis to acquire a clearer picture of findings and
theory development in the area of School Effectiveness. The lists that will be presented
here are either the result of a single school effectiveness study or the result of review of
many school effectiveness studies. In one such review, Purkey & Smith (1983) re
examined a number of early qualitative studies of school effectiveness. These were six
evaluation studies, wherein most of the programs to be assessed were compensatory
programmes, nine 'outlier' studies, all related to primary schools, and seven case
studies. The most important effectiveness conditions in these studies were: (1) strong
leadership, (2) an orderly climate, (3) high expectations, (4) achievement oriented
policy, and (5) time on task. Other early list of effective school conditions are presented
in Table 3.6 and Table 3.7 that follow.
121
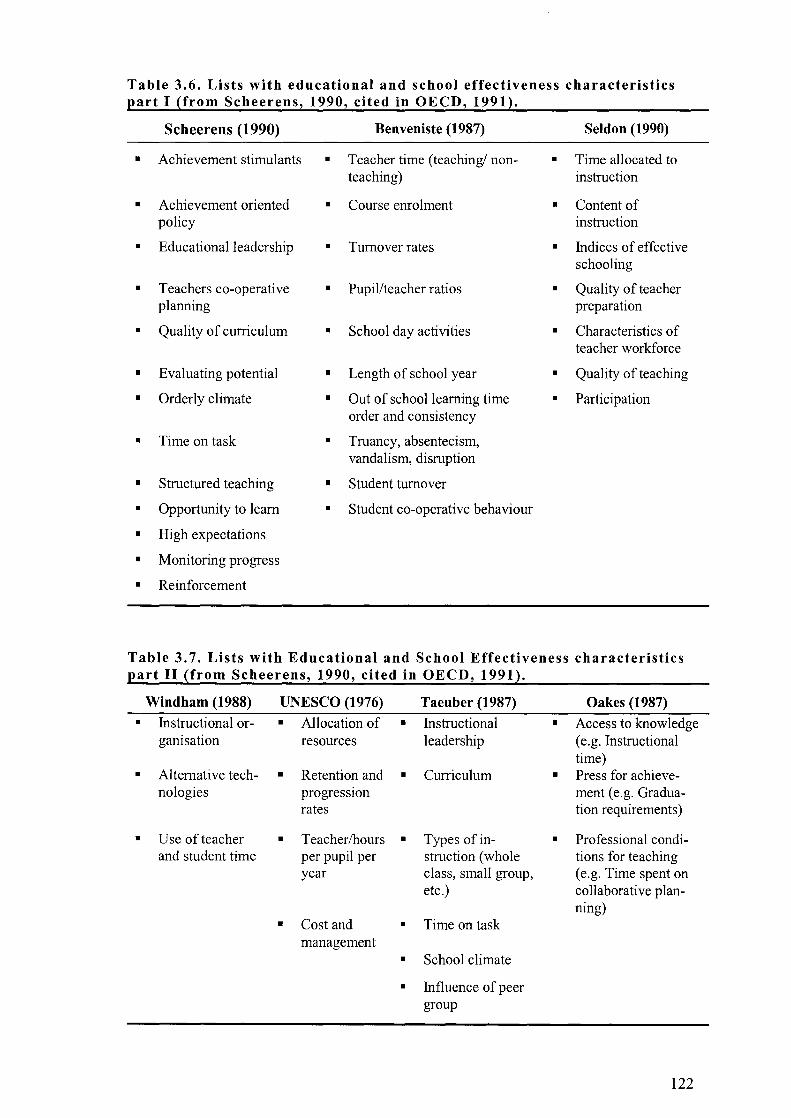
Table 3.6. Lists with educational and school effectiveness characteristics part I (from Scheerens, 1990, cited in OECD, 1991).
Scheerens (1990) Benveniste (1987) Seldon (1990)
• Achievement stimulants • Teacher time (teaching! non- • Time allocated to teaching) instruction
• Achievement oriented • Course enrolment • Content of policy instruction
• Educational leadership • Turnover rates • Indices of effective schooling
• Teachers co-operative • Pupil/teacher ratios • Quality of teacher planning preparation
• Quality of curriculum • School day activities • Characteristics of teacher workforce
• Evaluating potential • Length of school year • Quality of teaching
• Orderly climate • Out of school learning time • Participation order and consistency
• Time on task • Truancy, absenteeism, vandalism, disruption
• Structured teaching • Student turnover
• Opportunity to learn • Student co-operative behaviour
• High expectations
• Monitoring progress
• Reinforcement
Table 3.7. Lists with Educational and School Effectiveness characteristics ~art II {from Scheerens, 1990, cited in OECD, 199q.
Windham (1988) UNESCO (1976) Taeuber (1987) Oakes (1987) • Instructional or- • Allocation of • Instructional • Access to knowledge
ganisation resources leadership (e.g. Instructional time)
• Alternative tech- • Retention and • Curriculum • Press for achieve-nologies progression ment (e.g. Gradua-
rates tion requirements)
• Use of teacher • Teacherlhours • Types of in- • Professional condi-and student time per pupil per struction (whole tions for teaching
year class, small group, (e.g. Time spent on etc.) collaborative plan-
ning) • Cost and • Time on task
management • School climate
• Influence of peer group
122
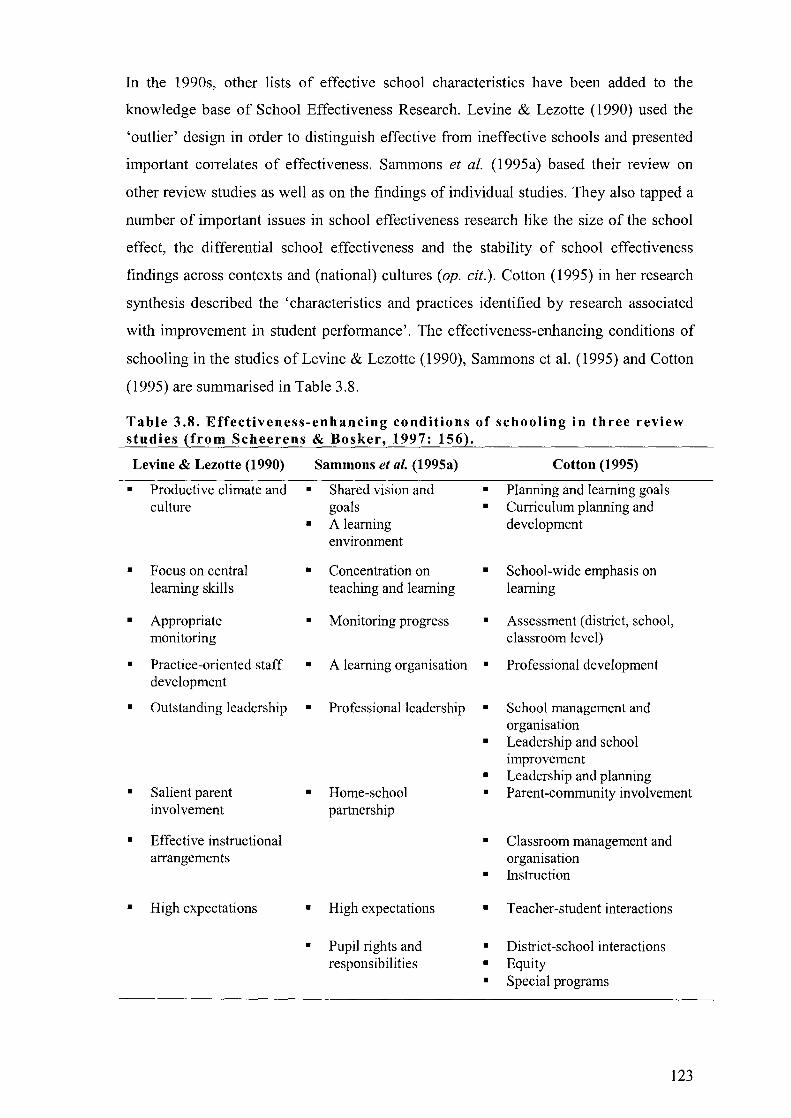
In the 1990s, other lists of effective school characteristics have been added to the
knowledge base of School Effectiveness Research. Levine & Lezotte (1990) used the
'outlier' design in order to distinguish effective from ineffective schools and presented
important correlates of effectiveness. Sammons et al. (1995a) based their review on
other review studies as well as on the findings of individual studies. They also tapped a
number of important issues in school effectiveness research like the size of the school
effect, the differential school effectiveness and the stability of school effectiveness
findings across contexts and (national) cultures (op. cit.). Cotton (1995) in her research
synthesis described the 'characteristics and practices identified by research associated
with improvement in student performance'. The effectiveness-enhancing conditions of
schooling in the studies of Levine & Lezotte (1990), Sammons et al. (1995) and Cotton
(1995) are summarised in Table 3.8.
Table 3.8. Effectiveness-enhancing conditions of schooling in three review studies (from Scheerens & Bosker, 1997: 156).
Levine & Lezotte (1990) Sammons et al. (1995a) Cotton (1995)
• Productive climate and • Shared vision and
•
•
•
•
•
•
•
culture goals
Focus on central learning skills
Appropriate monitoring
Practice-oriented staff development
Outstanding leadership
Salient parent involvement
Effective instructional arrangements
High expectations
• A learning environment
•
•
•
•
•
•
•
Concentration on teaching and learning
Monitoring progress
A learning organisation
Professional leadership
Home-school partnership
High expectations
Pupil rights and responsibilities
• Planning and learning goals • Curriculum planning and
development
• School-wide emphasis on learning
• Assessment (district, school, classroom level)
• Professional development
• School management and organisation
• Leadership and school improvement
• Leadership and planning • Parent-community involvement
• Classroom management and organisation
• Instruction
• Teacher-student interactions
• District-school interactions • Equity • Special programs
123
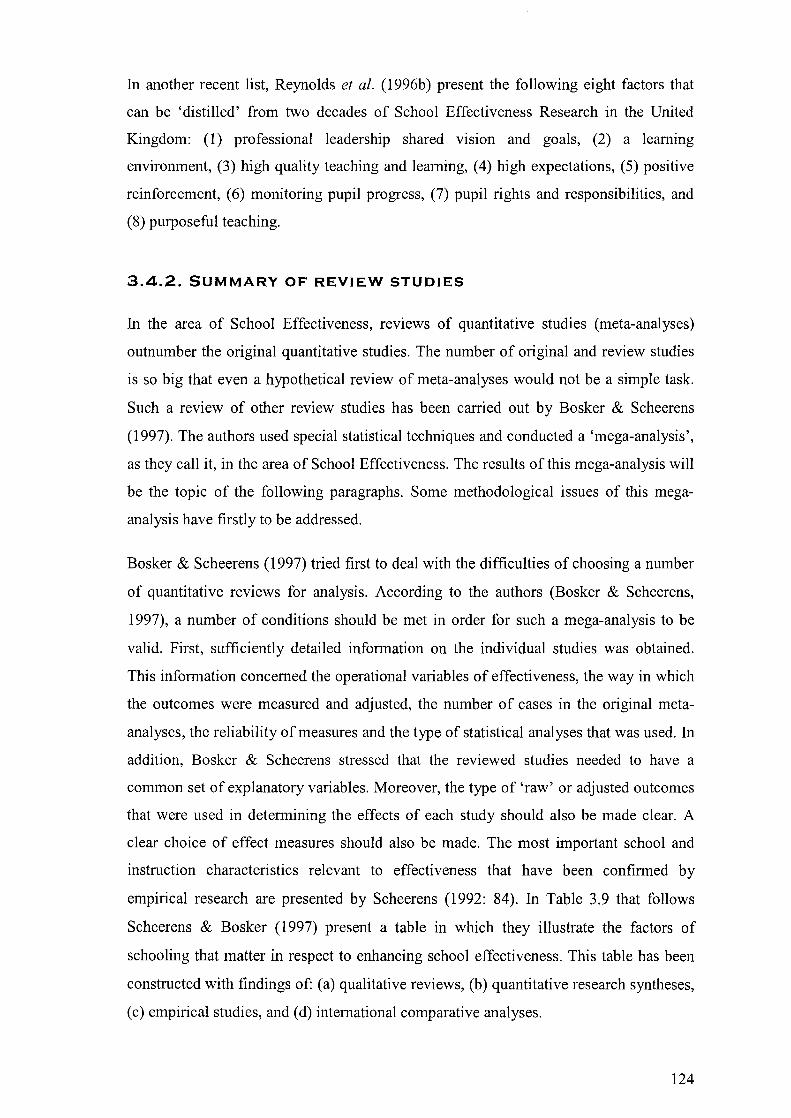
In another recent list, Reynolds et al. (1996b) present the following eight factors that
can be 'distilled' from two decades of School Effectiveness Research in the United
Kingdom: (1) professional leadership shared vision and goals, (2) a learning
environment, (3) high quality teaching and learning, (4) high expectations, (5) positive
reinforcement, (6) monitoring pupil progress, (7) pupil rights and responsibilities, and
(8) purposeful teaching.
3.4.2. SUMMARY OF REVIEW STUDIES
In the area of School Effectiveness, reviews of quantitative studies (meta-analyses)
outnumber the original quantitative studies. The number of original and review studies
is so big that even a hypothetical review of meta-analyses would not be a simple task.
Such a review of other review studies has been carried out by Bosker & Scheerens
(1997). The authors used special statistical techniques and conducted a 'mega-analysis',
as they call it, in the area of School Effectiveness. The results of this mega-analysis will
be the topic of the following paragraphs. Some methodological issues of this mega
analysis have firstly to be addressed.
Bosker & Scheerens (1997) tried first to deal with the difficulties of choosing a number
of quantitative reviews for analysis. According to the authors (Bosker & Scheerens,
1997), a number of conditions should be met in order for such a mega-analysis to be
valid. First, sufficiently detailed information on the individual studies was obtained.
This information concerned the operational variables of effectiveness, the way in which
the outcomes were measured and adjusted, the number of cases in the original meta
analyses, the reliability of measures and the type of statistical analyses that was used. In
addition, Bosker & Scheerens stressed that the reviewed studies needed to have a
common set of explanatory variables. Moreover, the type of 'raw' or adjusted outcomes
that were used in determining the effects of each study should also be made clear. A
clear choice of effect measures should also be made. The most important school and
instruction characteristics relevant to effectiveness that have been confirmed by
empirical research are presented by Scheerens (1992: 84). In Table 3.9 that follows
Scheerens & Bosker (1997) present a table in which they illustrate the factors of
schooling that matter in respect to enhancing school effectiveness. This table has been
constructed with findings of: (a) qualitative reviews, (b) quantitative research syntheses,
(c) empirical studies, and (d) international comparative analyses.
124
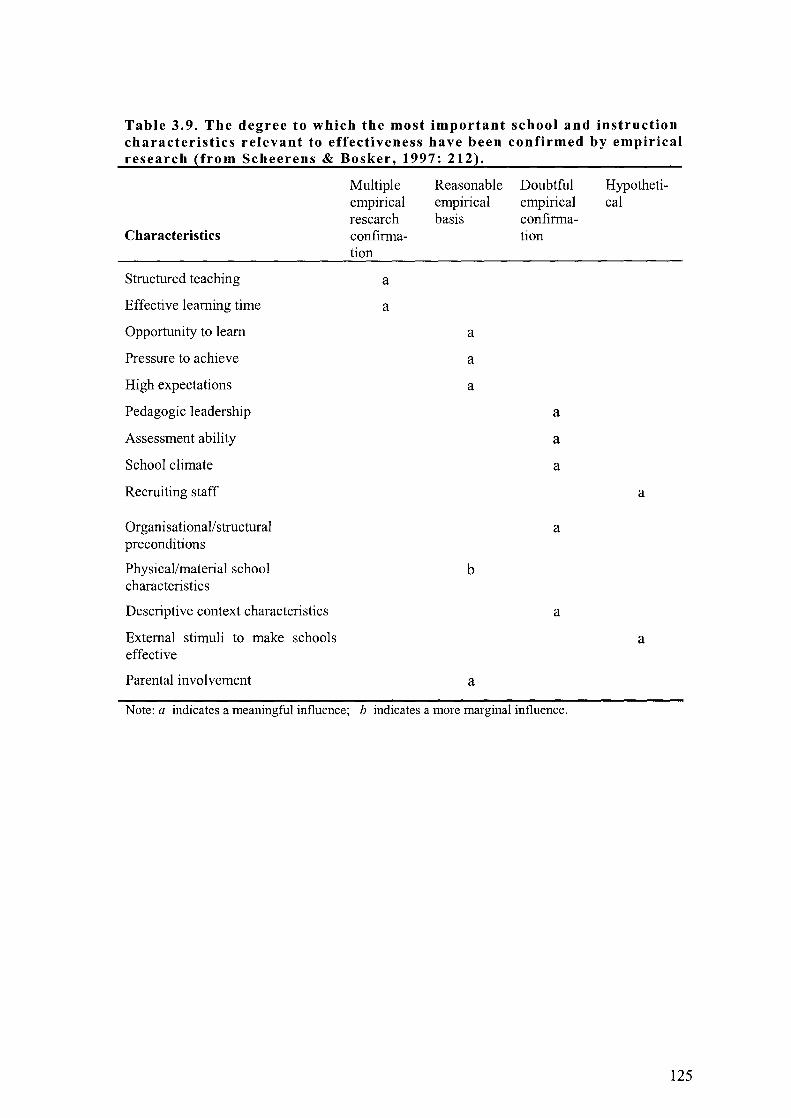
Table 3.9. The degree to which the most important school and instruction characteristics relevant to effectiveness have been confirmed by empirical research (from Scheerens & Bosker, 1997: 212).
Multiple Reasonable Doubtful Hypotheti-empirical empirical empirical cal research basis confirma-
Characteristics confirma- tion tion
Structured teaching a
Effective learning time a
Opportunity to learn a
Pressure to achieve a
High expectations a
Pedagogic leadership a
Assessment ability a
School climate a
Recruiting staff a
Organi sa ti onal/ structural a preconditions
Physical/material school b characteristics
Descriptive context characteristics a
External stimuli to make schools a effective
Parental involvement a
Note: a indicates a meaningful influence; b indicates a more marginal influence.
125

Table 3.10. Review of the evidence from qualitative reviews, international studies and research syntheses that are supported to enhance school effectiveness (from Scheerens & Bosker, 1997: 305).
Resourse input variables Pupil-teacher ratio Teacher training Teacher experience Teachers' salaries Expenditure per pupil
School organisation factors Productive climate culture Achievement pressure for basic subjects Educational leadership Monitoring/evaluation Co-operation/consensus Parental involvement Staff development High expectations Orderly climate
Instructional conditions: Opportunity to learn Time on task/homework Structured teaching Aspects of structured teaching: co-operative learning feedback reinforcement Differentiation/adaptive instruction
Qualitative reviews
+ + + + + + + + +
+ + +
International analyses
-0.03 0.00
0.02 0.04 0.00
-0.02 0.08
0.20 0.04
0.15 0.00/-0.01 (n.s.)
-0.01 (n.s.)
Research syntheses
0.02 -0.03 0.04
-0.07" -0.20b
0.14 0.05 0.l5 0.03 0.l3
0.11
0.09 0.19/0.06 0.11 (n.s.)
0.27 0.48 0.58 0.22
Note: -Numbers refer to correlations the size of which might be interpreted as: 0.10: small; 0.30: medium; 0.50: large. n.s.: statistically not significant. + a positive influence; a having assumed a standard deviation of $5000 for teacher salary. b assuming a standard deviation of $1 00 for PPE.
Heck & Marcoulides (1996) have stated that although the literature on school
effectiveness has identified some essential variables, few attempts have been made to
unify the conceptual components of school factors into a theory that explain outcomes.
However, Scheerens & Bosker (1997), after considering the review studies and the
research syntheses that were presented in Section 3.4.2, pointed to the existence of a
substantial degree of international agreement of 'what works in education'. This is how
the authors describe the bases of effective schooling:
126
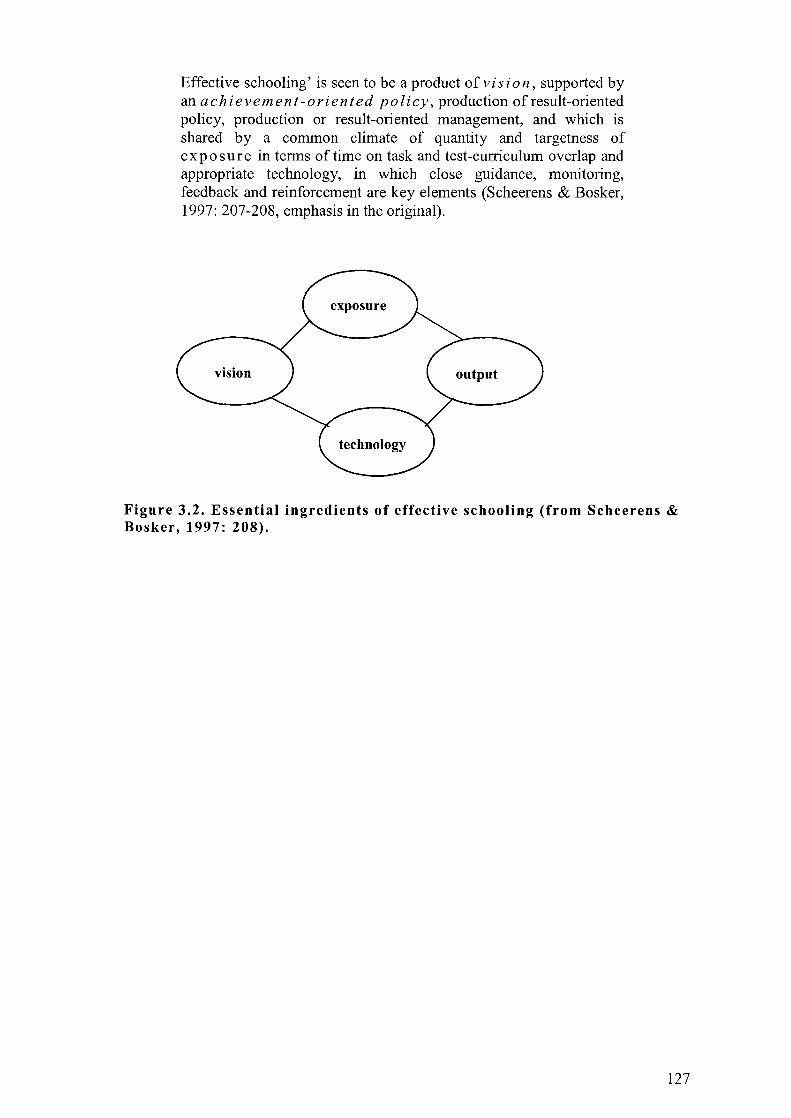
Effective schooling' is seen to be a product of vis ion, supported by an achievement-oriented policy, production of result-oriented policy, production or result-oriented management, and which is shared by a common climate of quantity and targetness of exposure in terms of time on task and test-curriculum overlap and appropriate technology, in which close guidance, monitoring, feedback and reinforcement are key elements (Scheerens & Bosker, 1997: 207-208, emphasis in the original).
Figure 3.2. Essential ingredients of effective schooling (from Scheerens & Bosker, 1997: 208).
127

3.5. MODELLING SCHOOL EFFECTIVENESS
School effectiveness models are attempts to create simple conceptual maps in which the
most promising variables that have come out of educational effectiveness research are
more or less ordered according to an input-process-output framework (Bosker &
Scheerens, 1994). When the interrelationships between various categories of variables
are specified in more detail, these ordered summaries of variables could be referred to
as school effectiveness models. Thus, in the literature of School Effectiveness, two
categories of models could be distinguished: (a) conceptual (substantive) models of
school effectiveness and (b) statistical models of school effectiveness.
The substantial school effectiveness models represent in most of the times the
theoretical background of the researcher(s). According to Barr & Dreeben (1983), the
common ingredient in these models is an image of the production of educational
outcomes, where the school is seen as a system of nested layers. The emphasis on
particular categories of variables among the models varies. Educational economists, for
example, are interested in educational production functions, educational psychologists
are interested mainly in instructional learning conditions, educational sociologists have
a particular interest in contextual variables, the researchers that operate in the field of
educational administration are mostly interested in organisation and management
conditions and the school environment. In the literature of SER, the most prominent
models of school effectiveness have the form of integrated multilevel educational
effectiveness models, which contain a collection of important contextual, school- and
class-level variables. Five such models can be found in literature of school effectiveness
research:
I. The integrated model of school effectiveness of Scheerens (1990) which is
based on a review of the instructional and school effectiveness research
literature. Its main assumption is that higher level conditions facilitate lower
level conditions (see Figure 3.4).
II. Stringfield & Slavin's (1992) QAIT/MACRO Model (QAIT standing for quality,
appropriateness, incentive, and time and MACRO for meaningful goals,
attention to academic focus, co-ordination, recruitment and training and
organisation).
128
III. Creemers' (1994) Model of educational effectiveness, which stresses the
consistency between the curriculum, the grouping procedures, the teacher's
behaviour and the quality of instruction (see Figure 3.6). In a relatively recent
paper, Reezigt et al. (1999) tested the main assumptions of Creemers' model of
educational effectiveness by reanalysing a large-scale longitudinal data set in the
Netherlands. The authors (op. cit.) did not suggest any changes to Creemer's
(1994) model of educational effectiveness.
IV. Creemers' (1994) model of school learning, which is closely related to the very
well known Carroll model (Carroll, 1989) with relatively more emphasis given
on the classroom level, the nature of instruction and the idea that higher levels of
organisational and contextual conditions facilitate lower level condition (see
Figure 3.5).
v. Sammons et al. (1997) integrated model of secondary school academic
effectiveness, which draws on the work of Creemers (1994) and Scheerens
(1990) and the special characteristic of which is the existence of variables in
departmental level (see Figure 3.3).
According to Stringfield (1994), models of school effectiveness are very useful because
they can help to explain previous research parsimoniously and they can be used as 'road
maps' for further theory development and practice redirection. Bosker & Scheerens
(1994: 160) present the general characteristics of the most well known school
effectiveness models found in the literature:
•
•
•
•
the variables are categorised according to an input-pro cess-outcome and context
structure;
the models incorporate a multi-level structure, usually at pupil, classroom and
school-level, sometimes even extending to school-environment level;
the models also recognise causal chains, i.e. intermediate causal variables that
reflect the influence of certain other variables;
in some cases the models also include non-recursive relationships (feedback loops)
implying self-regulating causal mechanisms.
However, despite the above-mentioned common characteristics, Bosker & Scheerens
(1994) found a great deal of uncertainty surrounding models of school effectiveness.
According to the same authors (op. cit.), two main sources of uncertainty in the models
are: (a) the lack of consistency in the research findings that corroborate the models, and
129
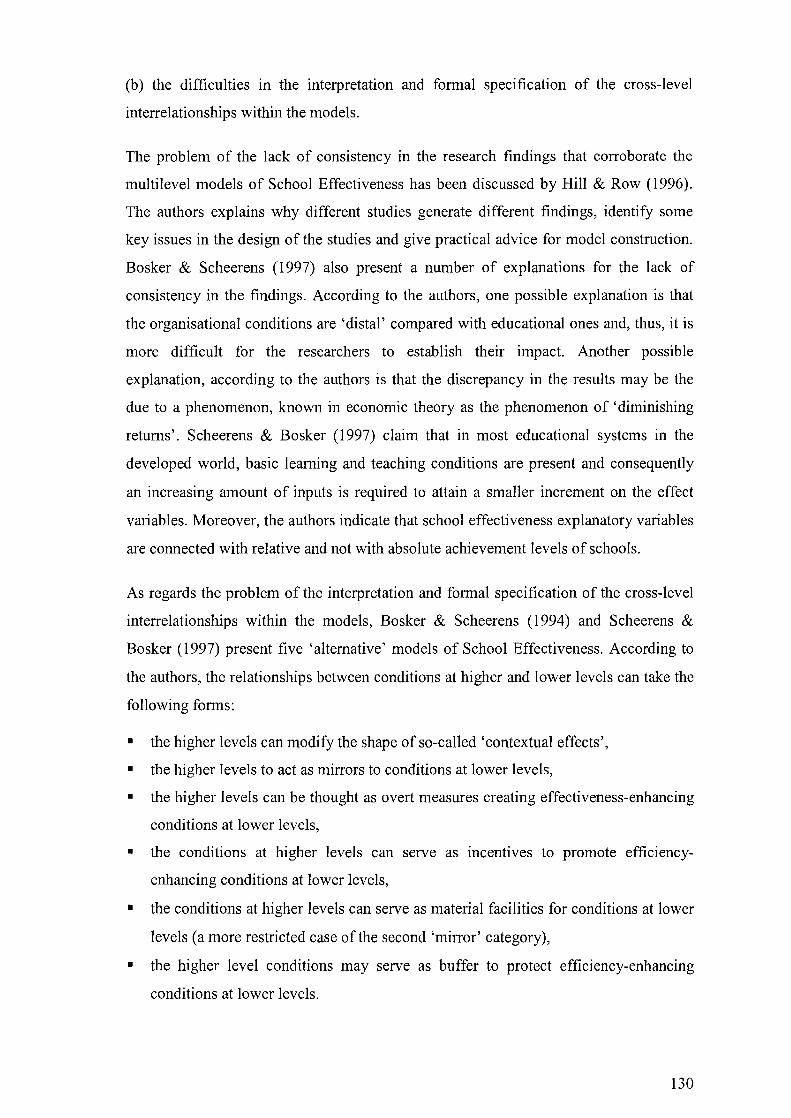
(b) the difficulties in the interpretation and fonnal specification of the cross-level
interrelationships within the models.
The problem of the lack of consistency in the research findings that corroborate the
multilevel models of School Effectiveness has been discussed by Hill & Row (1996).
The authors explains why different studies generate different findings, identify some
key issues in the design of the studies and give practical advice for model construction.
Bosker & Scheerens (1997) also present a number of explanations for the lack of
consistency in the findings. According to the authors, one possible explanation is that
the organisational conditions are 'distal' compared with educational ones and, thus, it is
more difficult for the researchers to establish their impact. Another possible
explanation, according to the authors is that the discrepancy in the results may be the
due to a phenomenon, known in economic theory as the phenomenon of 'diminishing
returns'. Scheerens & Bosker (1997) claim that in most educational systems in the
developed world, basic learning and teaching conditions are present and consequently
an increasing amount of inputs is required to attain a smaller increment on the effect
variables. Moreover, the authors indicate that school effectiveness explanatory variables
are connected with relative and not with absolute achievement levels of schools.
As regards the problem of the interpretation and fonnal specification of the cross-level
interrelationships within the models, Bosker & Scheerens (1994) and Scheerens &
Bosker (1997) present five 'alternative' models of School Effectiveness. According to
the authors, the relationships between conditions at higher and lower levels can take the
following fonns:
• the higher levels can modify the shape of so-called 'contextual effects',
• the higher levels to act as mirrors to conditions at lower levels,
• the higher levels can be thought as overt measures creating effectiveness-enhancing
conditions at lower levels,
• the conditions at higher levels can serve as incentives to promote efficiency
enhancing conditions at lower levels,
• the conditions at higher levels can serve as material facilities for conditions at lower
levels (a more restricted case of the second 'mirror' category),
• the higher level conditions may serve as buffer to protect efficiency-enhancing
conditions at lower levels.
130
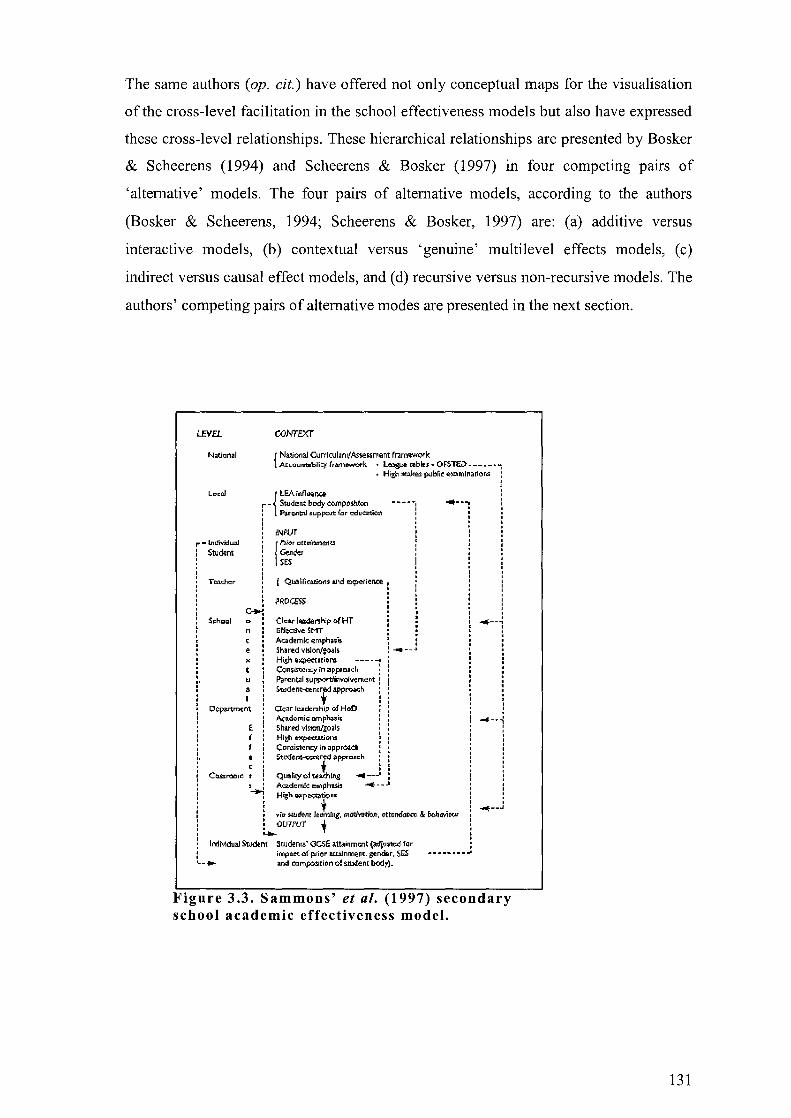
The same authors (op. cit.) have offered not only conceptual maps for the visualisation
of the cross-level facilitation in the school effectiveness models but also have expressed
these cross-level relationships. These hierarchical relationships are presented by Bosker
& Scheerens (1994) and Scheerens & Bosker (1997) in four competing pairs of
'alternative' models. The four pairs of alternative models, according to the authors
(Bosker & Scheerens, 1994; Scheerens & Bosker, 1997) are: (a) additive versus
interactive models, (b) contextual versus 'genuine' multilevel effects models, (c)
indirect versus causal effect models, and (d) recursive versus non-recursive models. The
authors' competing pairs of alternative modes are presented in the next section.
l£VEL CONrEXr
Noilianal {
N.,;onaJ Currlculun\'Assess",ont frun.....",k A<tau_bili~ I"""...."..k • ~ ",bios - OFSTID _____ •
• tiizl! "'-'ll<eo publi. ~""n><'o'"
{
tEA illnuer.a r - Stude'" body oompo<1tloo
"",,,,,t;;IJ support lor cdu~
INPUT -lndivXlual { P'rf,(,r crrllinmerlu
StlJdonl Gen~ SES
T<=hcr { Q~lific";o", and e><t><'(iena I
S,hool
c e
8
I
E {
CI.ar le.we",hip 0( HT GffocWelMT Acad.mk: ."'Fh ..... Shared ,l5Iorv'g<>aI. Hi8.he~"io", Co:n~i.rtcrx:y in O!IIpprD31!h
P;o"'ntill.~~VQI""""'nt ~denc<emr approo<;~
00"' h,.dc:,.,hip oi HoD /\.cadc",i. <lIT'pb,.,i. Shared v1>!oolgo'" tii~ ""p<aao"". Con::si:ibcnq jr. ilPP~1 St<"<fei>l-«<ltr<><l ~pP'"o.'h
,
~ t : elmroolo t Quoli!), oh.a.i:hI/1S ""'II! -_.... I
, Aadc:nio! .'~PITa<i. ... ---'
.... --
~ H1g'''''p~", : t . : .i~ """"", J.otmlJli. m~ . • tt~nOal>OO & OOIIatlO(Jl I OLJ7I'Ur J. :... "f
IndMdoJaJ Swdem Swden,,· GCSE .ttoi"mont (>rlI"i\«J lor iMf3&et of p,tior a..u.aInmenl. gender I SES ...... _ .... ~ ODd ""mJ>O>i'ion oi .. 1><10,,, bod)').
.....-.-: I I
I I I
I I , I
: I
~ __ .J
Figure 3.3. Sammons' et al. (1997) secondary school academic effectiveness model.
131

Context Achievement stimulants from higher administrationallevels Development of educational consumerism 'covariables', such as school size, student-body composition, school category, urban/rural
Inputs
-Teacher experIence
·Per pupil expenditure
• Parent support
.. ..
PROCESS
School level • Degree of achievement oriented policy • Educational leadership • Consensus, cooperative
planning of teachers • Quality of school curricula in
terms of content covered, and formal atmosphere
- Evaluative potential
r~~~~~~~~~~~~~~~~~~~~~~~~~~~~~ Classroom level • Time on task (including
homework) • Structured teaching • Opportunity to learn • High expectations of pupils'
progress • Degree of evaluation and
monitoring of pupils' progress • Reinforcement
Outputs
Student achievement adjusted for: • Previous
achievement • Intelligence • SES
Figure 3.4. Scheerens' integrated model of school effectiveness.
132
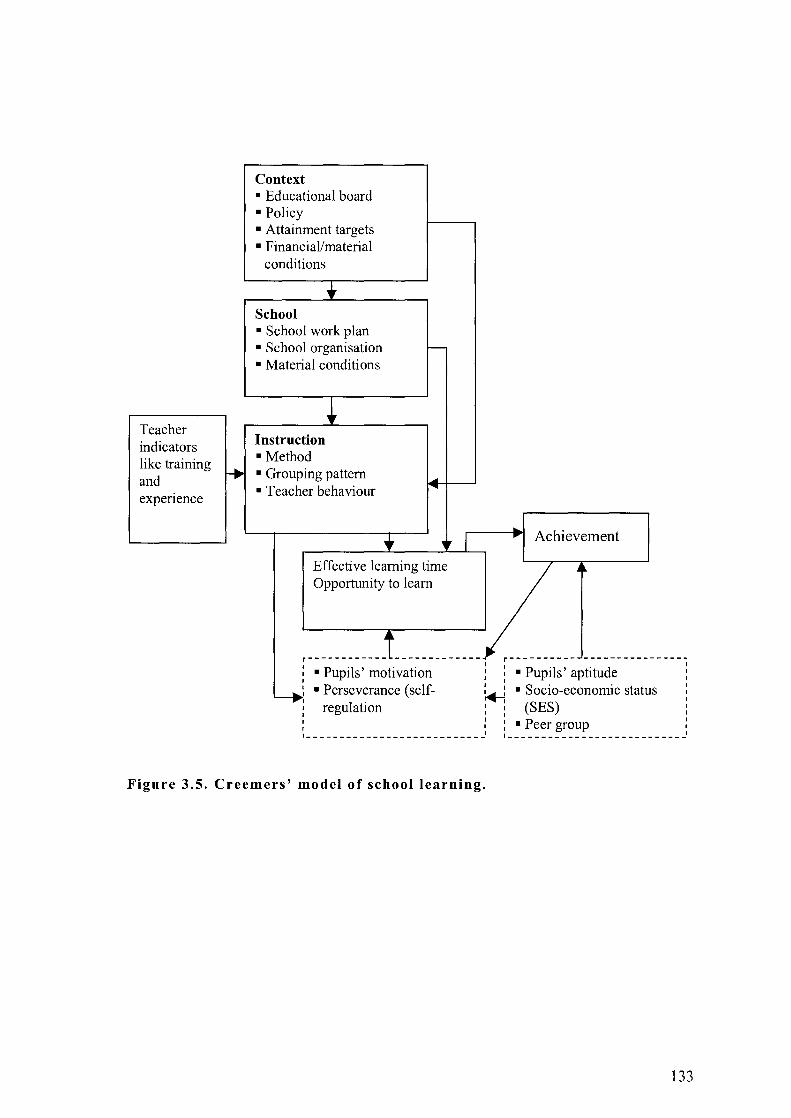
Teacher indicators like training and expenence
Context • Educational board • Policy • Attainment targets • Financial/material
conditions
School • School work plan • School organisation -• Material conditions
Instruction • Method
.... • Grouping pattern • Teacher behaviour
...
.. .. " Ir---I .. ~ Achievement ~ ________ -L ______ J--L-,
Effective learning time Opportunity to learn
r------------1l------------- r---------- ---------------. I I
: • Pupils' motivation :: • Pupils' aptitude I ---.i • Perseverance (self- ~ • Socio-economic status regulatlOn (SES)
I
: __________________________ J I • Peer group I __________________________ J
Figure 3.5. Creemers' model of school learning.
133
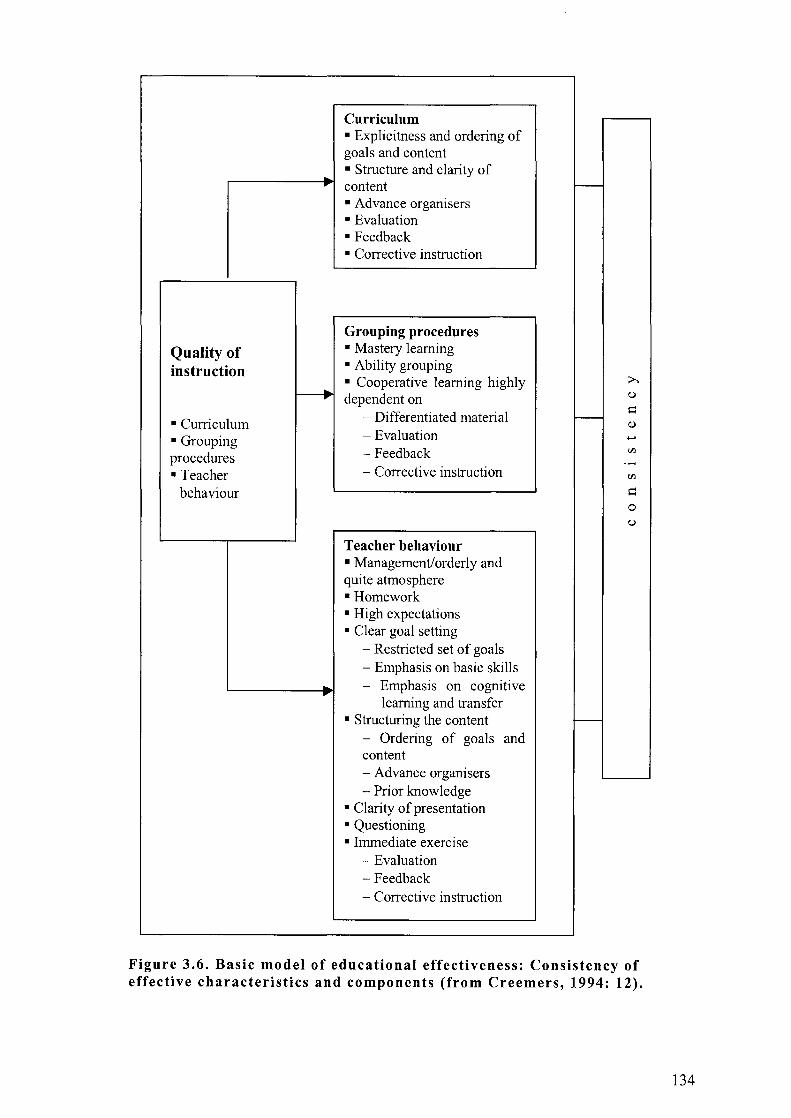
Curriculum • Explicitness and ordering of goals and content
.. • Structure and clarity of .. content r--• Advance organisers • Evaluation • Feedback • Corrective instruction
Grouping procedures
Quality of • Mastery learning
instruction • Ability grouping • Cooperative learning highly >.
~ dependent on u
- Differentiated material :::
• Curriculum r---
(])
• Grouping - Evaluation ......
procedures - Feedback Vl
....... • Teacher - Corrective instruction Vl
behaviour ::: 0
u
Teacher behaviour • Management/orderly and quite atmosphere • Homework • High expectations • Clear goal setting
- Restricted set of goals - Emphasis on basic skills
.. - Emphasis on cognitive learning and transfer
• Structuring the content r---
- Ordering of goals and content - Advance organisers - Prior knowledge
• Clarity of presentation • Questioning • Immediate exercise
- Evaluation - Feedback - Corrective instruction
Figure 3.6. Basic model of educational effectiveness: Consistency of effective characteristics and components (from Creemers, 1994: 12).
134
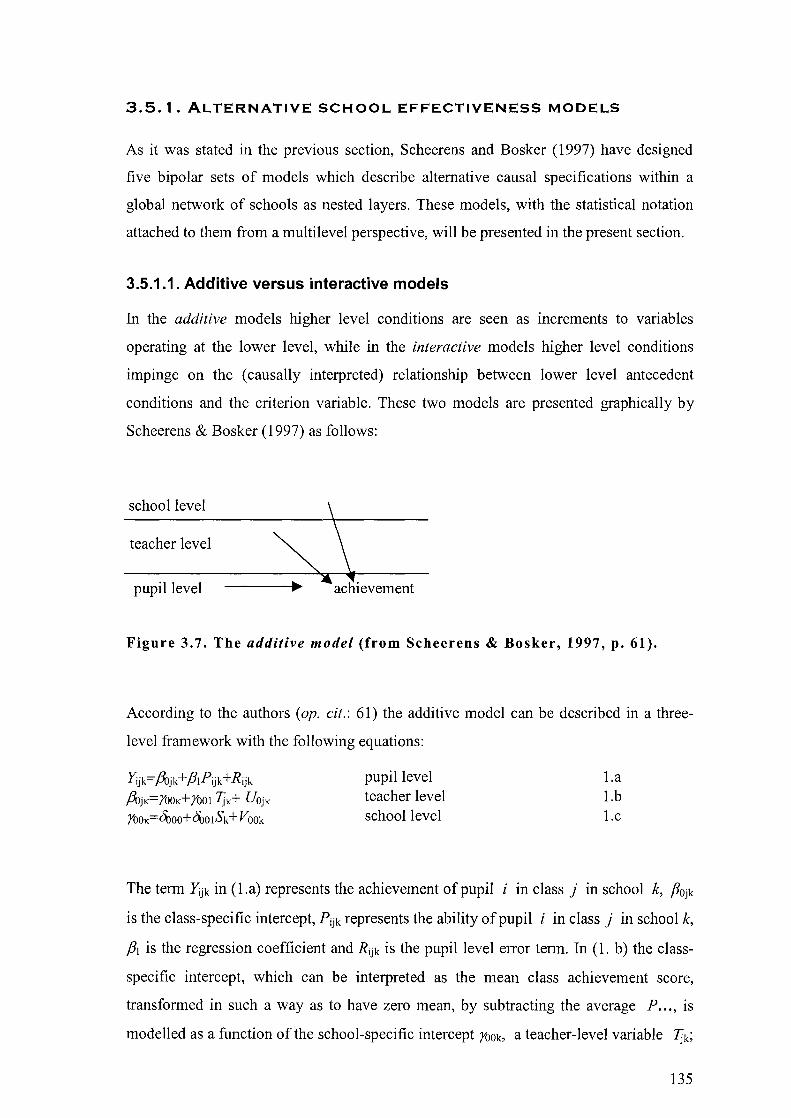
3.5.1. ALTERNATIVE SCHOOL EFFECTIVENESS MODELS
As it was stated in the previous section, Scheerens and Bosker (1997) have designed
five bipolar sets of models which describe alternative causal specifications within a
global network of schools as nested layers. These models, with the statistical notation
attached to them from a multilevel perspective, will be presented in the present section.
3.5.1.1. Additive versus interactive models
In the additive models higher level conditions are seen as increments to variables
operating at the lower level, while in the interactive models higher level conditions
impinge on the (causally interpreted) relationship between lower level antecedent
conditions and the criterion variable. These two models are presented graphically by
Scheerens & Bosker (1997) as follows:
school level
teacher level
pupil level achievement
Figure 3.7. The additive model (from Scheerens & Bosker, 1997, p. 61).
According to the authors (op. cit.: 61) the additive model can be described in a three
level framework with the following equations:
Yijk=Aljk + /JIPijk + Rijk
AljK=rooK+rool1jK+ UOjK
rooK=~OO+~OISk+ VOOk
pupil level teacher level school level
La I.b I.c
The term lijk in (La) represents the achievement of pupil i in class j in school k, /JOjk
is the class-specific intercept, Pijk represents the ability of pupil i in class j in school k,
PI is the regression coefficient and Rijk is the pupil level error term. In (1. b) the class
specific intercept, which can be interpreted as the mean class achievement score,
transformed in such a way as to have zero mean, by subtracting the average P ... , is
modelled as a function of the school-specific intercept rOOk, a teacher-level variable 1jk;
135

YOOI is the regression coefficient and UOjk is the class-level error term. Finally, in (1. c)
the school-specific intercept is modelled as a function of the grand mean ~OO, a school
level variable Sk with accompanying regression coefficient ~Ol; VOOk is the school-level
residual.
The interactive model is a little more complicated than the additive one. For three levels
it can be presented graphically as follows:
school level
teacher level
pupil level
\
~achievement ----' •.
Figure 3.8. The interaction model (from Scheerens & Bosker, 1997, p. 62).
The equations in the interaction model are somewhat different from those in the additive
one. They incorporate school-specific regression coefficients YOlk. for the regression of
class-mean achievement /Jojk on the teacher variable 1jk (2. b). These coefficients are
then modelled in (2. d) as a function of an overall regression coefficient ~IO, school
variable Sk with regression coefficient ~II and a school level error term VOlk, which
expresses the school-specific deviation from the overall regression of achievement on
the teacher variable (Scheerens & Bosker, 1997: 61). The four equations are presented
below:
Jijk=/Jojk + !3IPijk+Rijk
/Jojk= YOOk+ yo I k 1jk+ UOjk
YOOk=~OO+~OISk+ V OOk
YOlk=~lO+~IISk+VOlk
pupil level teacher level school level school level
(2. a) (2. b) (2. c) (2. d)
Scheerens & Bosker (op. cit.) conclude that by a mere substitution the term ~11(SkX 1jk)
can be shown to be included in the model. This term is the cross-level interaction.
It can also be easily shown that the additive model is a special case of the interactive
model (where the term &11 = 0) and therefore more parsimonious. In model building all
researchers begin with the general model and proceed to the more elaborate one. Aitkin
& Zuzovsky (1994) argue that in educational effectiveness, all models should be
regarded as interactive until proven not to be empirically valid. Rosenholds (1989) has
136
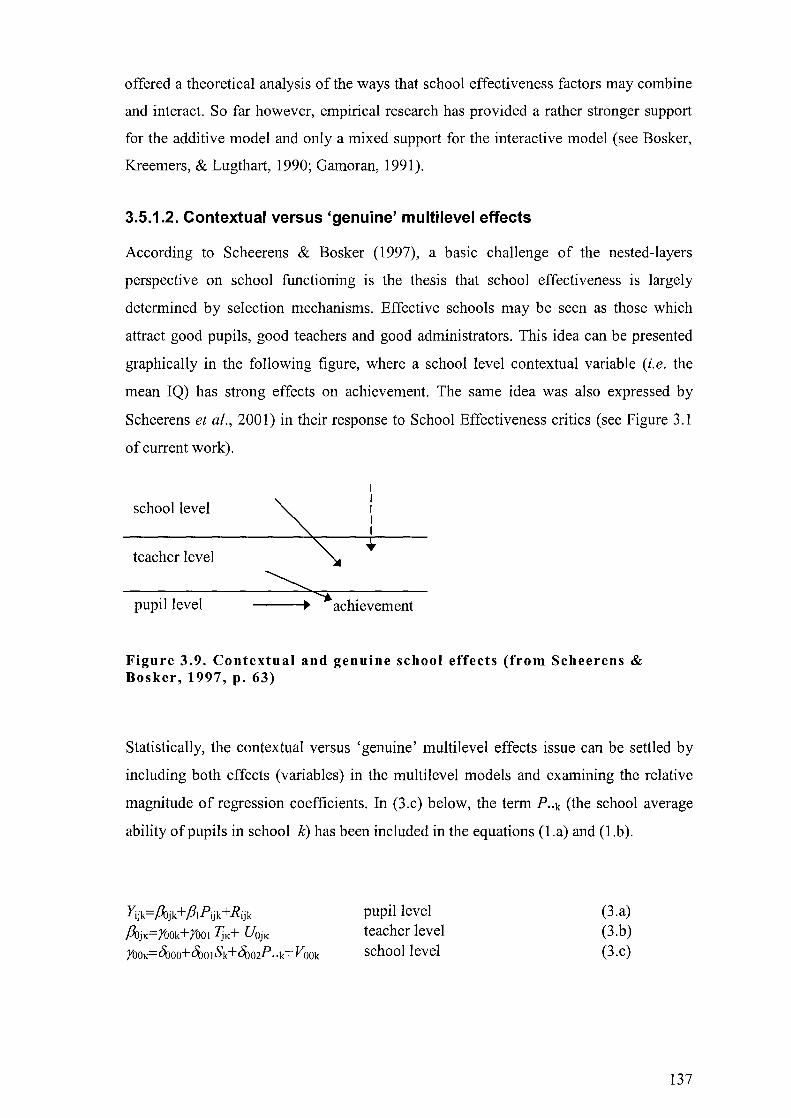
offered a theoretical analysis of the ways that school effectiveness factors may combine
and interact. So far however, empirical research has provided a rather stronger support
for the additive model and only a mixed support for the interactive model (see Bosker,
Kreemers, & Lugthart, 1990; Gamoran, 1991).
3.5.1.2. Contextual versus 'genuine' multilevel effects
According to Scheerens & Bosker (1997), a basic challenge of the nested-layers
perspective on school functioning is the thesis that school effectiveness is largely
determined by selection mechanisms. Effective schools may be seen as those which
attract good pupils, good teachers and good administrators. This idea can be presented
graphically in the following figure, where a school level contextual variable (i.e. the
mean IQ) has strong effects on achievement. The same idea was also expressed by
Scheerens et at., 2001) in their response to School Effectiveness critics (see Figure 3.1
of current work).
school level
teacher level
pupil level ---+ ....... achievement
Figure 3.9. Contextual and genuine school effects (from Scheerens & Bosker, 1997, p. 63)
Statistically, the contextual versus 'genuine' multilevel effects issue can be settled by
including both effects (variables) in the multilevel models and examining the relative
magnitude of regression coefficients. In (3.c) below, the term P"k (the school average
ability of pupils in school k) has been included in the equations (1.a) and (1.b).
Yijk=~jk + PI Pijk + Rijk
~jK=rOOk+rOOI 7jK+ UOjK
rOOK=~OO+~o I Sk +~02P .• k + VOOk
pupil level teacher level school level
(3.a) (3.b) (3.c)
137

According to Scheerens & Bosker (1997) the test of genuine school effects is concerned
with the test that ~Ol =t= 0, not withstanding the inclusion of the effect of P .. k. The
authors also stress that contextual effects are only present when ~02 =t= PI.
3.5.1.3. Indirect versus direct causal effects
According to Scheerens & Bosker (1997), conditions that are 'more than one level up'
with respect to educational achievement can be seen either as direct causes of
achievement or as indirectly influencing achievement via intermediate levels.
school level
teacher level
pupil level achievement
Figure 3.10. The indirect model (from Scheerens & Bosker, 1997, p. 64).
For the authors this sort of competing causal models however cannot simply be settled
by comparing different specifications of the usual LISREL-type or path-analytic
models. Instead, multilevel path-analytic techniques are required.
The use of multilevel structural equation models is a new and promising family of
statistical procedures in the field of educational effectiveness. Relatively few studies
have been conducted utilising such complex statistical procedures. In one of them Rowe
& Hill (1997) used multilevel structural equations to track school and teachers
effectiveness. In terms of statistical packages the 'Mplus' statistical package, recently
developed from Bengt Muthen at UCLA, deals with multilevel structural equation
analyses. However, in the absence of these models, Scheerens & Bosker (1997: 64)
propose the assessing of direct and indirect effects with the use of the following
equations.
Yijk=ftJjk+{JIPijk+Rijk
ftJjK=YOOK+YoOI1jk+ UOjK
YOOK=~OO+~o 1 Sk + VOOk
1jk=&OOO+&OOISk+WOOk
pupil level teacher level school level school level
(4.a) (4.b) (4.c) (4.d)
138
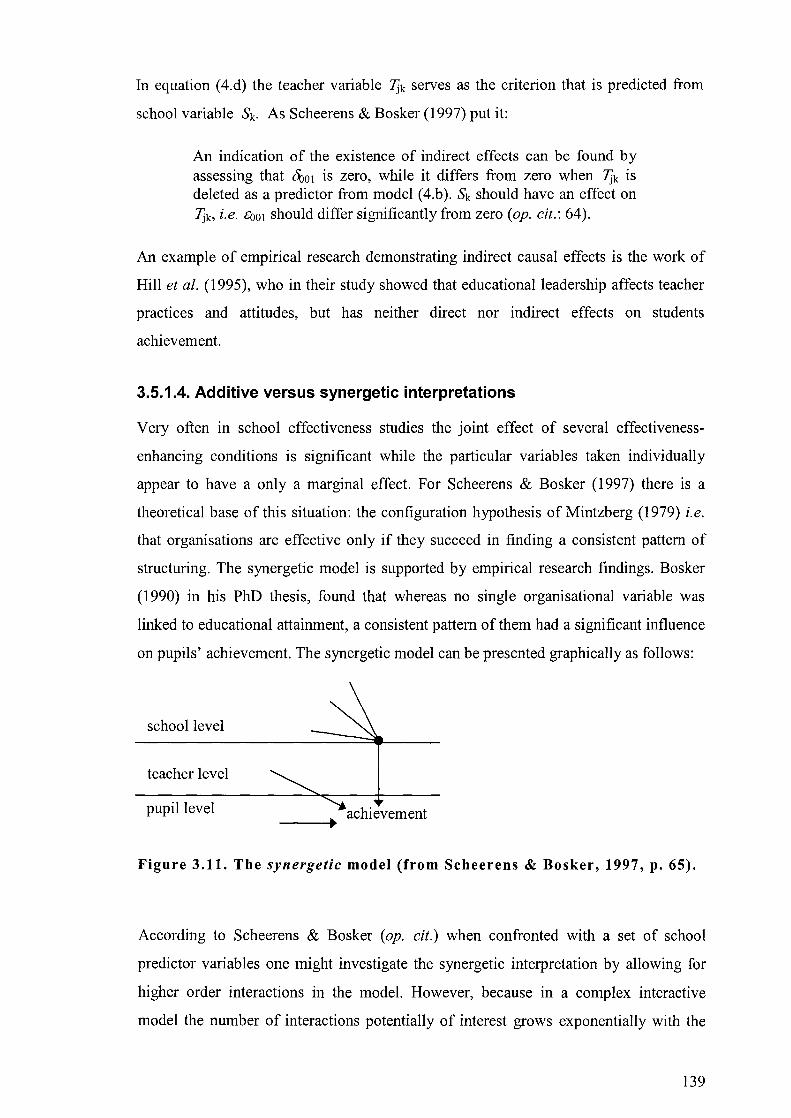
In equation (4.d) the teacher variable 1Jk serves as the criterion that is predicted from
school variable Sk. As Scheerens & Bosker (1997) put it:
An indication of the existence of indirect effects can be found by assessing that ~Ol is zero, while it differs from zero when 1Jk is deleted as a predictor from model (4.b). Sk should have an effect on 1Jk' i.e. COOl should differ significantly from zero (op. cit.: 64).
An example of empirical research demonstrating indirect causal effects is the work of
Hill et al. (1995), who in their study showed that educational leadership affects teacher
practices and attitudes, but has neither direct nor indirect effects on students
achievement.
3.5.1.4. Additive versus synergetic interpretations
Very often in school effectiveness studies the joint effect of several effectiveness
enhancing conditions is significant while the particular variables taken individually
appear to have a only a marginal effect. For Scheerens & Bosker (1997) there is a
theoretical base of this situation: the configuration hypothesis of Mintzberg (1979) i.e.
that organisations are effective only if they succeed in finding a consistent pattern of
structuring. The synergetic model is supported by empirical research findings. Bosker
(1990) in his PhD thesis, found that whereas no single organisational variable was
linked to educational attainment, a consistent pattern of them had a significant influence
on pupils' achievement. The synergetic model can be presented graphically as follows:
school level
teacher level
pupil level __ --+~ achievement
Figure 3.11. The synergetic model (from Scheerens & Bosker, 1997, p. 65).
According to Scheerens & Bosker (op. cit.) when confronted with a set of school
predictor variables one might investigate the synergetic interpretation by allowing for
higher order interactions in the model. However, because in a complex interactive
model the number of interactions potentially of interest grows exponentially with the
139
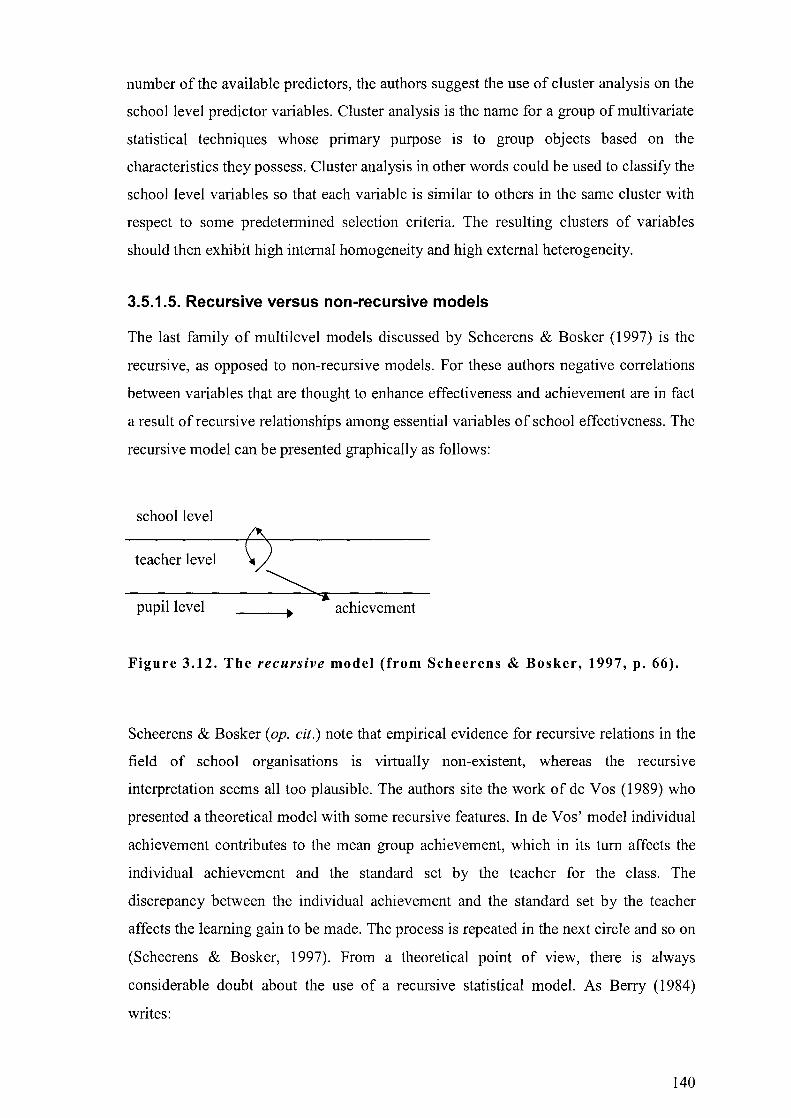
number of the available predictors, the authors suggest the use of cluster analysis on the
school level predictor variables. Cluster analysis is the name for a group of multivariate
statistical techniques whose primary purpose is to group objects based on the
characteristics they possess. Cluster analysis in other words could be used to classify the
school level variables so that each variable is similar to others in the same cluster with
respect to some predetermined selection criteria. The resulting clusters of variables
should then exhibit high internal homogeneity and high external heterogeneity.
3.5.1.5. Recursive versus non-recursive models
The last family of multilevel models discussed by Scheerens & Bosker (1997) is the
recursive, as opposed to non-recursive models. For these authors negative correlations
between variables that are thought to enhance effectiveness and achievement are in fact
a result of recursive relationships among essential variables of school effectiveness. The
recursive model can be presented graphically as follows:
school level
teacher level
pupil level ... .
achIevement
Figure 3.12. The recursive model (from Scheerens & Bosker, 1997, p. 66).
Scheerens & Bosker (op. cit.) note that empirical evidence for recursive relations in the
field of school organisations is virtually non-existent, whereas the recursive
interpretation seems all too plausible. The authors site the work of de Vos (1989) who
presented a theoretical model with some recursive features. In de Vos' model individual
achievement contributes to the mean group achievement, which in its tum affects the
individual achievement and the standard set by the teacher for the class. The
discrepancy between the individual achievement and the standard set by the teacher
affects the learning gain to be made. The process is repeated in the next circle and so on
(Scheerens & Bosker, 1997). From a theoretical point of view, there is always
considerable doubt about the use of a recursive statistical model. As Berry (1984)
writes:
140
The decision to use a recursive model should not be taken lightly or simply for the purpose of convenience. Unless one is convicted that (1) causation among the variables is strictly unidirectional and (2) the factors constituting the error terms in the model are fundamentally different for each equation, recursive models should not be used (Berry, 1984: 15).
Scheerens & Bosker (1997) state that the question about the recursiveness or non
recursiveness of certain inter-relationships within school effectiveness models can be
tackled with either experimental research, by the use of alternative path-analytic models
or by the use of system-dynamic models. According to the authors, longitudinal
research at school level would shed some light on the issue of whether repetitive cycles
of feedback loops are important in educational effectiveness studies.
141
3.6. SIZE, CONSISTENCY, AND STABILITY OF SCHOOL EFFECTS
3.6.1. THE SIZE AND STRUCTURE OF THE SCHOOL EFFECT
So far in this chapter, the 'school effect' has been regarded as an unidimensional
concept, large enough to be significant. In this section, however, 'school effect' will be
decomposed; questions about its size, consistency and stability will be explored. The
importance of the decomposition of school effect is apparent. If, for example, the size of
the school effect was showed to be small, the whole theoretical basis of School
Effectiveness could be proved to be 'a myth', to use a word also used by Scheerens &
Bosker (1997) in The Foundations of Educational Effectiveness. In the Foundations,
Scheerens & Bosker (1997) wonder if school effectiveness is an unambiguous concept
and if school effects are large enough to answer questions about school effectiveness.
Indeed, some critics claim nowadays that schools do not make an educationally
significant difference in student outcomes and that, in reality, nothing new has been
proved in terms of the first 'pessimistic' findings of Coleman and Jencks that were
described in Section 3.2. Examples of this type of criticism have been made by Elliot
(1996) and Thrupp (2001) and presented in Section 3.3 of the present study.
As has already been discussed in Section 3.2, early school effectiveness studies like
Coleman's Equality of Educational Opportunity (1966), Plowden's Children and their
Primary Schools (1967), and Jencks et al. Inequality (1972) showed that schools do not
seem to alter overall social inequalities. More specifically, in Coleman's Report (1966),
the differences between schools in mathematics achievement - adjusted for socio
economic status and schools' intake characteristics - were only 4.95% and 8.73% of the
total variation for white and black students respectively. In Plowden's Report (1967) it
was suggested that as much as 58% of the variance in student achievement was
attributable to parental attitudinal factors. In Inequality, Jencks et al. (1972) used the
difference between the experimental condition and the control group relative to the
standard deviation of the criterion variable in the control group condition. The school
effect was the square root of the variance accounted for by schools. After controlling for
prior achievement and school intake characteristics, Jencks et al. (1972) concluded that
142

the school effect was 0.23 and 0.28 for white and black students respectively. In Fifteen
Thousand Hours, Rutter et al. (1979) found that less than 2% of the variance in
students' examination results could be attributed to a composite school process score.
However, Rutter et al. (1979) also used the rank correlation coefficient between the
composite process score and examination results and found a high value (0.76).
Studies of the second generation of school effectiveness research have been more useful
for estimating the true value of the school effect as they took advantage of the
algorithms and the statistical packages for multilevel analysis. One of the first studies to
take advantage of these algorithms was Aitkin & Longford's (1986) reanalysis of the
data from a study of secondary school public examination results. In their report, Aitkin
& Longford (1986) concluded that schools account for 10% of the variation in students'
achievement. This percentage however was reduced to less than 2% when adjustments
for schools' intake characteristics were made. In the Junior School Project, Mortimore
et al. (1988) found that the adjusted variance in student level for achievement in reading
that was accountable for by the school effect was 9%. The corresponding percentages
for mathematics and writing were 9% and 11 % respectively. A later reanalysis of the
same database, conducted by Sammons et al. (1993a), showed that 14% of the variance
in achievement in reading and mathematics for year 5 could be attributed to school
level. In one of the first school effectiveness studies in the Netherlands, Brandsma &
Knuver (1989) concluded that school level differences accounted for 12% of the
variance in arithmetic achievement and 8% of the variance in Dutch Language
achievement. In the School Effect, which was published in 1979 by Smith & Tomlinson,
it was found that about 10% of the variance in students' achievement across different
test items, ability groups and ethnic groups was accounted for by the school. In that
study it was also found that the school effect was not unidimensional but differed with
regards to ability group, ethnicity, and ability (the notion of differential effectiveness).
Fitz-Gibbon (1991) in a report of her A-level Information System (ALIS) found a
school effect of around 15%. The author (op. cit.) attributed this large percentage to the
use of content-specific tests.
143

3.6.1.1. Meta-analysis of a number of school effectiveness studies
In order to estimate the size of school effect, Scheerens & Bosker (1997) made a meta
analysis of a number of school effectiveness studies. More specifically, the authors
scanned the international literature (ERIC, School Organisation and Management
Abstracts, Educational Administration Abstracts, and the Sociology of Education
Abstracts) and selected a number of studies to be used as a representative sample of all
published school effectiveness studies. The authors dealt with problems of pUblication
bias and the quality of the selected studies. Only second-generation studies using
multilevel analysis were selected by Scheerens & Bosker. The characteristics of the
selected studies are given by the same authors in Table 3.11 that follows.
Table 3.11. The characteristics of the 168 studies analysed by Scheerens & Bosker (1997).
Measure Cross 79 47% Net 15 9% Both 74 44%
Level Primary 84 53% Secondary 74 47%
Subject Language 81 48% Mathematics 72 43% Composite 11 7% Science 4 2%
Country The Netherlands 55 33% United Kingdom 35 21% Europe-other countries 20 13% North America 25 15% Other industrialised 19 11% Third World countries 6 3,6%
Note: Percentages refer to the 168 studies.
The authors (op. cit.) used random coefficient models in a design for meta-analyses that
was first proposed by Raudenbush & Bryk in 1985. Specifically, each one of the 168
studies of Table 3.11 contained a number of replications for more subject areas or for
different cohorts of students. Thus the results of the replications were considered as
information at level-l and the studies were considered as level-2. The results of this
two-level analysis are presented in Table 3.12.
144
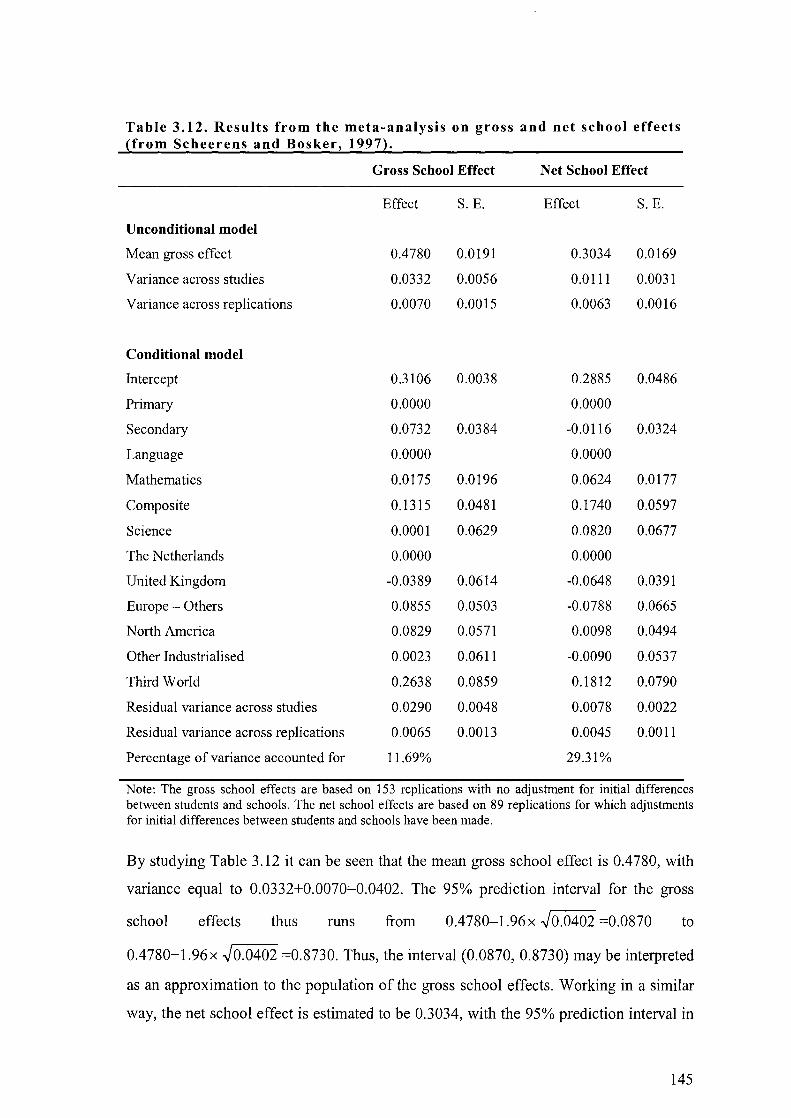
Table 3.12. Results from the meta-analysis on gross and net school effects {from Scheerens and Bosker, 1997~.
Gross School Effect Net School Effect
Effect S. E. Effect S. E.
Unconditional model
Mean gross effect 0.4780 0.0191 0.3034 0.0169
Variance across studies 0.0332 0.0056 0.0111 0.0031
Variance across replications 0.0070 0.0015 0.0063 0.0016
Conditional model
Intercept 0.3106 0.0038 0.2885 0.0486
Primary 0.0000 0.0000
Secondary 0.0732 0.0384 -0.0116 0.0324
Language 0.0000 0.0000
Mathematics 0.0175 0.0196 0.0624 0.0177
Composite 0.1315 0.0481 0.1740 0.0597
Science 0.0001 0.0629 0.0820 0.0677
The Netherlands 0.0000 0.0000
United Kingdom -0.0389 0.0614 -0.0648 0.0391
Europe - Others 0.0855 0.0503 -0.0788 0.0665
North America 0.0829 0.0571 0.0098 0.0494
Other Industrialised 0.0023 0.0611 -0.0090 0.0537
Third World 0.2638 0.0859 0.1812 0.0790
Residual variance across studies 0.0290 0.0048 0.0078 0.0022
Residual variance across replications 0.0065 0.0013 0.0045 0.0011
Percentage of variance accounted for 11.69% 29.31 %
Note: The gross school effects are based on 153 replications with no adjustment for initial differences between students and schools. The net school effects are based on 89 replications for which adjustments for initial differences between students and schools have been made.
By studying Table 3.12 it can be seen that the mean gross school effect is 0.4780, with
variance equal to 0.0332+0.0070=0.0402. The 95% prediction interval for the gross
school effects thus runs from 0.4780-1.96 x ";0.0402 =0.0870 to
0.4780+ 1.96 x ";0.0402 =0.8730. Thus, the interval (0.0870, 0.8730) may be interpreted
as an approximation to the population of the gross school effects. Working in a similar
way, the net school effect is estimated to be 0.3034, with the 95% prediction interval in
145

the space (0.0449, 0.5619). In the second part of Table 3.12 the effect sizes have been
regressed against some characteristics of the replications and the studies. The intercept
school effect is the estimated effect size for language achievement of students in Dutch
primary schools. The gross school effect sizes for the Third W orId countries are
significantly higher than those found for the other counties. In total, 11.69% and
29.31 % of the variation in gross and net effect size estimates respectively, can be
accounted for by the variables in the second part of the table. Scheerens & Bosker
(1997) state that the school effects in Table 3.12 may well be underestimated because
measurement error in the achievement tests shows up in the models as within-school
variance. Thus the authors increase the effect size for the gross and net school effect to
0.33 and 0.56 respectively. The proportion of variance in student achievement
accounted for by the school attended is thus 9% for the gross school effect and 4% for
the net school effect.
What are the conclusions of the meta-analysis made by Scheerens & Bosker in The
Foundations of Educational Effectiveness? According to the authors, 'when considering
the best of currently available recent empirical school effectiveness studies no
conclusion can be reached other than admitting that Coleman was right with respect to
the size of school effect in terms of the between school variance on value-added
outcomes in basic school subjects' (op. cit.: 299-300). Does this mean that the school
effect is to small to be discussed about? The obvious answer to this question is 'yes' but
the things might be more complicated if one considered the classroom effect together
with the school effect. This theme will be examined in the next section.
3.6.1.2. School effect as compared to classroom effect
More recent studies on the school effects have used three-level analyses, considering the
classroom or departmental effects jointly with school-level effects. Tymms (1993), for
example, reanalysed the A-Level Information System (ALIS) database and found that
7% of the variance in examination results could be attributed to school-level. However,
when the variable 'school' was dropped from the analysis and students were nested
within classes and departments, it was found that the proportion of variance in
classroom level was from 9% to 25%. In another study, Scheerens et al. (1989:794)
analysed students' achievement in the Second International Mathematics Study (SIMS)
and found that for four out of nine countries for which between-class information was
146
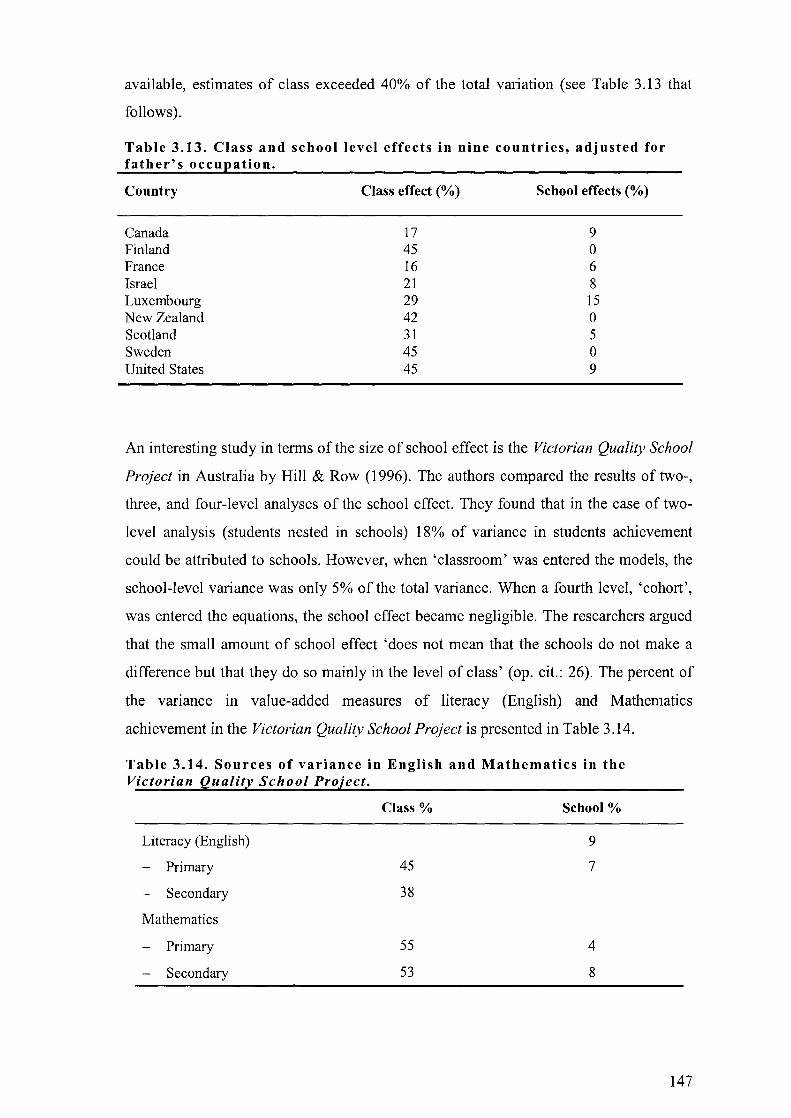
available, estimates of class exceeded 40% of the total variation (see Table 3.13 that
follows).
Table 3.13. Class and school level effects in nine countries, adjusted for father's occupation.
Country Class effect (%) School effects (%)
Canada 17 9 Finland 45 0 France 16 6 Israel 21 8 Luxembourg 29 15 New Zealand 42 0 Scotland 31 5 Sweden 45 0 United States 45 9
An interesting study in terms of the size of school effect is the Victorian Quality School
Project in Australia by Hill & Row (1996). The authors compared the results of two-,
three, and four-level analyses of the school effect. They found that in the case of two
level analysis (students nested in schools) 18% of variance in students achievement
could be attributed to schools. However, when 'classroom' was entered the models, the
school-level variance was only 5% of the total variance. When a fourth level, 'cohort',
was entered the equations, the school effect became negligible. The researchers argued
that the small amount of school effect 'does not mean that the schools do not make a
difference but that they do so mainly in the level of class' (op. cit.: 26). The percent of
the variance in value-added measures of literacy (English) and Mathematics
achievement in the Victorian Quality School Project is presented in Table 3.14.
Table 3.14. Sources of variance in English and Mathematics in the Victorian Quality School Project.
Literacy (English)
- Primary
- Secondary
Mathematics
- Primary
Secondary
Class %
45
38
55
53
School %
9
7
4
8
147
The columns of see Table 3.13 and Table 3.14 show that the effect of the class is much
stronger than the effect of the school. This is in fact logical because in every human
activity, the largest variation is among people and not among groups of people. As we
descend from the upper levels to the lower ones, the variation increases. Does this,
however, mean that school effectiveness is a 'myth' and that the real difference lies with
the teachers who teach in individual classes within the schools? The answer is 'not
necessarily'. In Section 3.5.1 of the current thesis a number of 'alternative' school
effectiveness models demonstrated how the conditions at school level can affect the
work that is being conducted from individual teachers within classes and departments.
In other words, the idea here is that good schools are not simply the sum of a number of
good teachers. Good teachers tend to teach in good schools.
3.6.2. CONSISTENCY AND STABILITY OF THE SCHOOL EFFECT
Consistency and stability are two very important issues in the study of the school effect
because they can shape a researcher's ideas and formulate his or her theory. Consistency
is operationally defined by Scheerens & Bosker (1997) as the correlation between
different rank orderings of schools in terms of the criterion used. Stability is similarly
defined as the correlation between different rank ordering of schools in terms of
different points in time (op. cit.).
Sammons (1996) points out that relatively few studies in the area of school
effectiveness have investigated school differences for different outcomes. In the original
Junior School Project in the u.K. (Mortimore et al., 1988), 19 schools were reported to
have positive effects on three of the four cognitive outcomes that were examined.
Another 12 schools were found to have positive effects on none or only one cognitive
outcome out of the sample of 47 schools for which the data on all outcomes were
available (op. cit.). A few years later, Sammons et al. (1993a, b) reanalysed the data of
the Junior School Project and found that only 4 out of 49 schools in the sample had a
significantly positive effects on students' progress in both mathematics and reading (p <
0.05). Six of the schools had a negative effect in both cognitive areas, whereas majority
of schools was found to vary in effectiveness. In two other studies that were also
focused on the primary level, Hill & Rowe (1996) and Luyten (1996) used multivariate
multilevel techniques in order to model the covariation of mathematics and reading
scores at student and school level. 'Value added' multivariate multilevel models
revealed a consistency of 0.51 in the study of Hill & Rowe and 0.59 in the study of
148
Luyten. The current study has also used multivariate multilevel techniques in order to
model covariance at school and student level in four subjects: Mathematics, Greek
Language, Science and Religion (see Section 5.4).
The meaning of the consistency of effectiveness in the secondary school is different
from the meaning of consistency in the primary school. That is because in virtually all
countries, different subjects are taught in secondary school by subject-specialists. In the
primary school a teacher usually teaches all the sUbjects. Scheerens & Bosker (1997)
present the results of five studies that dealt with the issue of consistency across different
school outcomes. These studies are presented in Table 3.15.
149
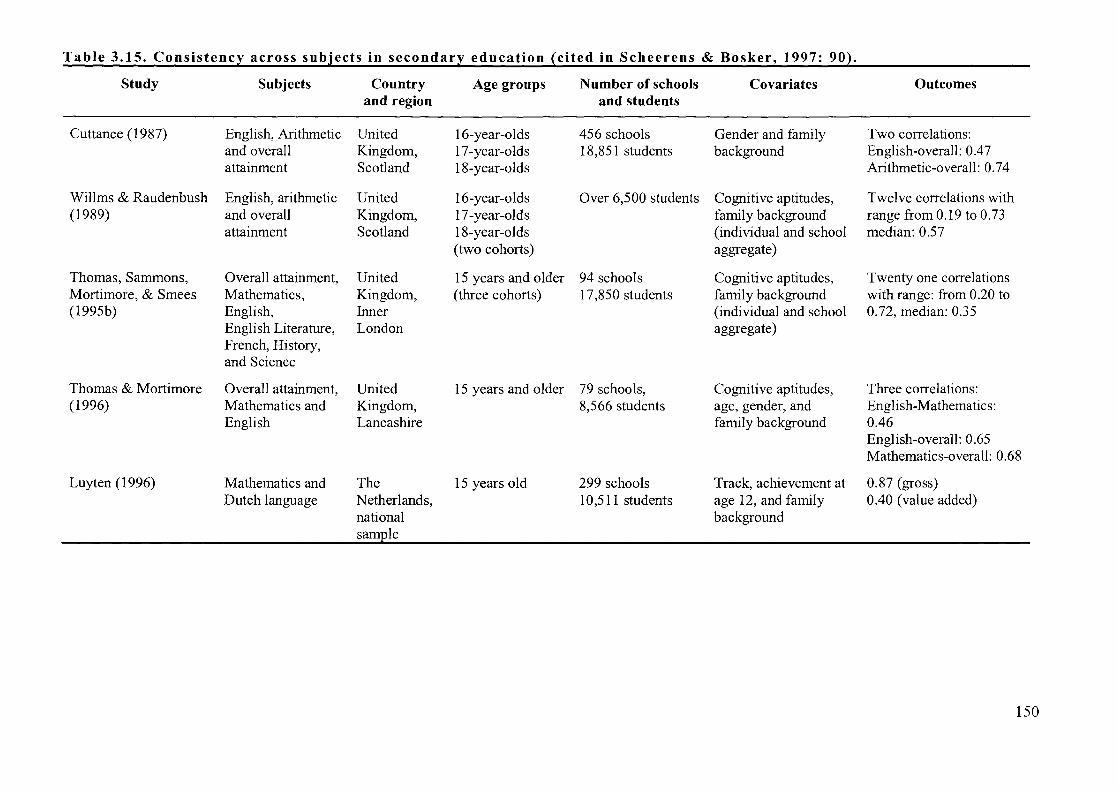
Table 3.15. Consistencl: across subjects in secondarl: education {cited in Scheerens & Bosker, 1997: 90~.
Study Subjects Country Age groups Number of schools Covariates Outcomes and region and students
Cuttance (1987) English, Arithmetic United 16-year-olds 456 schools Gender and family Two correlations: and overall Kingdom, 17-year-olds 18,851 students background English-overall: 0.47 attainment Scotland 18-year-olds Arithmetic-overall: 0.74
Willms & Raudenbush English, arithmetic United 16-year-olds Over 6,500 students Cognitive aptitudes, Twelve correlations with (1989) and overall Kingdom, 17-year-olds family background range from 0.19 to 0.73
attainment Scotland 18-year-olds (individual and school median: 0.57 (two cohorts) aggregate)
Thomas, Sammons, Overall attainment, United 15 years and older 94 schools Cognitive aptitudes, Twenty one correlations Mortimore, & Smees Mathematics, Kingdom, (three cohorts) 17,850 students family background with range: from 0.20 to (1995b) English, Inner (individual and school 0.72, median: 0.35
English Literature, London aggregate) French, History, and Science
Thomas & Mortimore Overall attainment, United 15 years and older 79 schools, Cognitive aptitudes, Three correlations: (1996) Mathematics and Kingdom, 8,566 students age, gender, and English-Mathematics:
English Lancashire family background 0.46 English-overall: 0.65 Mathematics-overall: 0.68
Luyten (1996) Mathematics and The 15 years old 299 schools Track, achievement at 0.87 (gross) Dutch language Netherlands, 10,511 students age 12, and family 0.40 (value added)
national background sample
150

After what has been presented so far, one could conclude that schools show a fair
degree of consistency in different academic outcomes. The degree of this consistency as
found in the literature is high enough so as to justifying the concept of school
effectiveness.
3.6.3. STABILITY OF SCHOOL EFFECTS OVER TIME
A number of researchers have dealt with the question of how stable is the school effect
over a period of time. Willms & Raudenbush (1989) in their study of 20 secondary
schools in Scotland reported the stability of 'type A' and 'type B' school effects over a
period of four years (from 1980 to 1984). According to the authors (ap. cit.), type A
school effect for school j is the expected performance of student i with average
background characteristics in school j. Type B school effect is similar to type A with
the difference that in type B corrections have also been made for the composition of the
student popUlation within a school (ap. cit.). The left and the right side of Figure 3.13
presents the type A and type B effects respectively. In each case, there are 20 separate
regression lines. The correlation between 1980 and 1984 for type A and type B school
effect is 0.87 and 0.70 respectively. This can easily be seen in Figure 3.13, where the
regression lines of the type B effect are more intertwined than the regression lines of the
type A effect.
----
1980 1984 1980 1984 Type A effect Type B effect
Figure 3.13. Change in school effects over time.
In another study in the United Kingdom, Gray, Jesson, Goldstein, Hedger, & Rasbash,
(1995) investigated the changes in schools' performance over time in terms of total
GCSE results. The researchers controlled for students' prior achievement (thus using
151

type A value-added school effects) and found high correlation coefficients between
three consecutive years: 0.94 between 1990 and 1991, 0.96 between 1991 and 1992,
and 0.81 between 1990 and 1992. Thus from what can be seen in the literature so far,
school effects are relatively stable from year to year. In order to investigate the
dimensions of the school effect, Scheerens & Bosker (1997: 92) present, in graphical
form, the findings ofa study conducted by Luyten (1994) (see Figure 3.14). Luyten (op.
cit.) studied the examination results of five cohorts of secondary school students in the
Netherlands and concluded that the total school-level variance is 15% of the total
variance. The main school effect was found to amount only for 25% of the school-level
variance. The most predominant factor was found to be the subject (40% of the school
level variance).
School 15%
Main school effect 25%
Interaction subject/year 27%
~~ Year effect 8%
Subject effect 40%
Figure 3.14. Dimensions of the school effect.
Many recent studies have also investigated whether schools are differentially effective
for students with different characteristics e.g. below and above average students,
different ethnic backgrounds etc. The study of the differences in school outcomes as
regards students with different characteristics has been called in the literature as
'differential school effectiveness'. Today, it is generally accepted that schools matter
mostly for the underprivileged and initially low-achieving students. In the Equality of
Educational Opportunity, Coleman (1996) reported that the school effects for the black
students are much higher from the corresponding effects for the white students (see
Table 3.16).
152
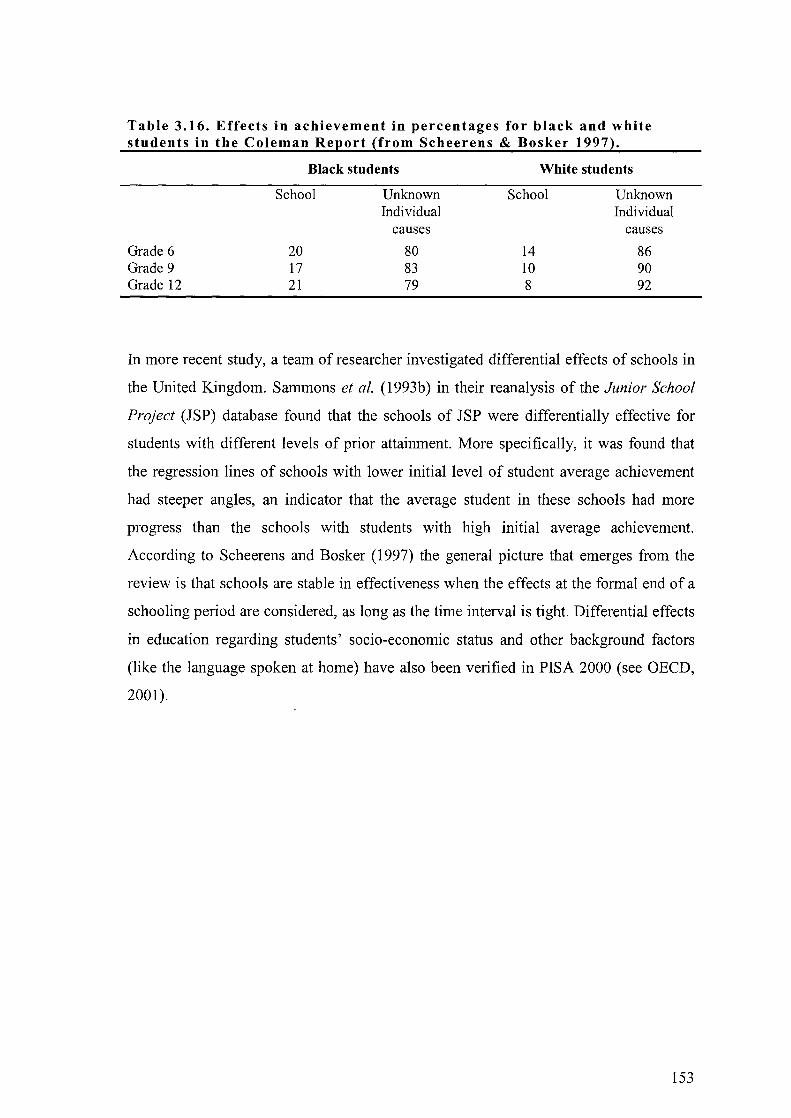
Table 3.16. Effects in achievement in percentages for black and white students in the Coleman Report (from Scheerens & Bosker 1997).
Grade 6 Grade 9 Grade 12
Black students
School
20 17 21
Unknown Individual
causes
80 83 79
White students
School
14 10 8
Unknown Individual
causes
86 90 92
In more recent study, a team of researcher investigated differential effects of schools in
the United Kingdom. Sammons et al. (1993b) in their reanalysis of the Junior School
Project (JSP) database found that the schools of JSP were differentially effective for
students with different levels of prior attainment. More specifically, it was found that
the regression lines of schools with lower initial level of student average achievement
had steeper angles, an indicator that the average student in these schools had more
progress than the schools with students with high initial average achievement.
According to Scheerens and Bosker (1997) the general picture that emerges from the
review is that schools are stable in effectiveness when the effects at the formal end of a
schooling period are considered, as long as the time interval is tight. Differential effects
in education regarding students' socio-economic status and other background factors
(like the language spoken at home) have also been verified in PISA 2000 (see OEeD,
2001).
153
3.7. CONDITIONS OF SCHOOL EFFECTIVENESS
The present section explores a number of conditions that have been associated with
school effectiveness. Lists with effective school conditions have been presented earlier
in this thesis (see Section 3.4.1). The current section however will not present findings
of individual studies but instead analyses of findings of many school effectiveness
studies. This is important because the effectiveness-enhancing conditions are many and
in the international literature, the studies exploring these conditions may reach the
thousands. The differences in the selection, definition and measurement of the
effectiveness-enhancing conditions are significant among the original studies, mainly
because different researchers have different theoretical orientations, different resources
and level of access to the necessary data. Efforts towards the codification of the
conditions which are associated with the quality of schooling have been made by
scholars in the area of educational effectiveness at both organisational and instructional
level. The lists which were presented in Section 3.4 have been based on other review
studies and are examples of sets of factors which are considered to 'work' in education.
In the fourth chapter of the Foundations of Educational Effectiveness, Scheerens and
Bosker (1997) present the meaning of 13 factors that are considered to work in
education. These factors have been reproduced here in Table 3.17. In the International
Handbook of School Effectiveness Research (Teddlie & Reynolds, 2000), the
effectiveness-enhancing conditions are presented in Chapter 4 and Chapter 5. The fourth
chapter of the Handbook has been written by Reynolds & Teddlie (2000a) and focuses
on the processes of school effectiveness. The fifth chapter of the same book has been
written by Teddlie et al. (2000c) and focuses on context issues within school
effectiveness research. Some of the effectiveness enhancing conditions are presented in
Table 3.17. The meaning of some of the factors in Table 3.17 will be discussed in the
following sections.
154

Table 3.17. Effectiveness-enhancing conditions.
Achievement orientation/high expectations/teacher expectation
Educational leadership
Consensus and cohesion among staff
Curriculum quality/opportunity to learn
School climate
Evaluative potential
Parental involvement
Classroom climate
Effective learning time (classroom management)
Structured instruction
Independent learning
Differentiation, adaptive instruction
Feedback and reinforcement
3.7.1. EFFECTIVENESS ENHANCING CONDITIONS AT ORGANISATIONAL LEVEL
The role of the current section is to present the findings of a literature review on a
number of effectiveness enhancing conditions at organisational level. The conditions
which are discussed in the third chapter of this thesis are those which will be explored
later in the fifth chapter of the current work. The process variables which will be
investigated in the fifth chapter include a collection of school organisational
characteristics. Information about these characteristics will be partly selected through
students' and teachers' answers to questionnaires. These organisational characteristics
include teachers' work life, school environment, school climate, and school leadership.
Another process variable that will be explored in the fifth chapter of the current work is
students' views of the responsiveness of the teacher, a factor which cannot be measured
directly. In the current study teacher responsivenes is a statistical construct, the
components of which have mainly to do with teachers' communication skills and not
with the organisation of the classroom and the instruction method followed. The current
study does not enter the area of instructional effectiveness (important though this area
may be) and therefore findings associated with quality of teaching will not be presented
155

here. The rationale behind this decision reflects the insufficiency of resources for an
independent PhD student to allow observation of classroom practice.
3.7.1.1. Solidarity and collegiality among teachers
An important factor in school effectiveness identified in the literature is teachers'
collegiality and solidarity. Little (1982), following an 'outlier' design, conducted semi
structured interviews with 105 teachers and 14 administrators in four 'successful' and
four 'unsuccessful' schools and found that in the successful schools more than in
unsuccessful ones teachers valued and participated in norms of collegiality and
continuous improvement. Five years later Dworkin (1987) showed that the students of
teachers who show lower solidarity and work satisfaction exhibit lower achievement
gains and have higher rates of absenteeism. In a more recent study Seashore & Smith
(1991) also found that working conditions and career opportunities affect the degree to
which teachers are actively engaged in teaching and strive to create exciting learning
environments in their classrooms. The authors also list seven criteria which affect
teachers' work as found in the literature. The criteria listed by Seashore & Smith (1991)
are:
• respect from relevant adults, such as the administrators in the school and district,
parents, and the community at large;
• participation in decision making which augments the teachers' sense of influence or
control over their work setting;
• frequent and stimulating professional interaction among peers (e.g. collaborative
work and collegial relationships) within the school;
• structures and procedures which contribute to a high sense of efficacy (e.g .
mechanisms permitting teachers to obtain frequent and accurate feedback about their
performance and the specific effects of their performance on student learning);
• opportunity to make full use of existing skills and knowledge, and to acquire new
skills and knowledge (self-development); the opportunity to experiment; adequate
resources to carry out the job; a pleasant, orderly working environment;
• a sense of congruence between personal goals and the school's goals (low level of
alienation) (op. cit.: 37).
In another study, Rosenholtz & Simpson (1990) found that SIX organisational
conditions, identified from a review of the socio-psychological literature on job design,
affected the job commitment of 1,213 teachers from 78 elementary schools in
156
Tennessee. These conditions were (a) performance efficacy, (b) task autonomy and
discretion, (c) learning opportunities, (d) school management of students' behaviour, (e)
buffering by principals, and (f) socio-economic status of student body.
3.7.1.2. School climate and ethos
Teachers' solidarity and the collegiality is associated with what is being referred to as
'school climate', 'school ethos', 'school culture' or 'school atmosphere'. The notion of
school climate has been defined differentially by various researchers and has been
approached either as an outcome or as an explanatory variable. In terms of definitions,
Robertson & Sammons (1997) choose to use the term 'school culture'. The authors (op.
cit.), argue that organisational culture is concerned with deeply held beliefs and values,
demonstrated in outward behaviour. For Robertson & Sammons (1997) school culture is
difficult to define. According to the authors (op. cit.) a school may incorporate different
cultures: student culture, teacher culture and non-teaching staff and parent cultures.
Furthermore, there may be sub-cultures among main cultures, where, for example, the
staff is split.
Robertson & Sammons (1997) have distinguished 'school culture' from 'school ethos'
writing that the latter is a more outward expression of those norms, beliefs and values as
rules, standards or modes of operation. The term 'school ethos' is used by British
researchers more often that the term 'school culture'. Ethos has been connected in the
British studies with the composite learning climate that is provided for the students of
each school. In the book Managing the Effective School edited by Preede (1993),
Torrington & Weightman have also discussed the difference between 'school ethos' and
'school culture'. For the authors the former is a 'self-conscious expression in relation to
the behaviours and values in each school'. School culture on the other hand was
described by the authors as a more 'managerial' issue. Anderson (1982) uses neither of
these terms. Instead she uses the term 'school climate' and distinguishes four aspects of
it:
• ecology (the physical and material environment of the school);
• milieu (the composition of the population of a school);
• social system (relationships between persons); and
• culture (beliefs and values of the persons in a school).
157

3.7.1.3. Measuring school climate
Teachers' opinions about their working conditions have in many cases been seen as a
measure of the climate or ethos of a school. According to Raudenbush et al. (1991) a
standard practice in many of the studies who look into school organisational climate is
to use teachers as informants about the schools in which they participate. Thus
researchers ask teachers a series of questions, and teachers' responses to interrelated
items are combined to yield a scale for each teacher on one or more dimensions of
organisational climate. Witcher (1993) presented a number of such research instruments
for assessing school climate. Firstly, she highlighted the importance of positive school
climate and the use of school climate measures as predictors of school effectiveness.
The research instruments discussed by Witcher (1993) included the Organisational
Climate Index (OCI), the Organisational Climate Description Questionnaire (OCDQ),
the Effective School Battery (ESB), the Charles F. Kettering Ltd. School Climate
Profile, and the Comprehensive Assessment of School Environment (CASE). Freiberg
(1999) in a recently edited book with the title School Climate lists 11 climate
instruments that have been used in the past for measuring school climate environment.
Discrepancies in research findings on school climate and ethos are rather the rule than
the exception in the literature. Hallinger & Heck (1998) believe that this discrepancy
may be explained by the fact that different researchers employ different conceptual and
methodological tools. A thorough presentation of the research instruments and the
literature on school climate and ethos is beyond the scope of the current study.
However, some important pieces of relevant work will be discussed here.
In terms of review studies Anderson (1982) based her article 'the search of school
climate' on more than 200 references. In this early review the author (op. cit.) used
organisational theory taxonomy to organise the diverse body of research and to draw
conclusions about common findings. Another review study on school climate can be
found in the Handbook of Research on Educational Administration (edited by Boyan in
1988). In the 14th chapter of this book, Miskel & Ogawa (1988) reviewed and evaluated
the literature on teacher motivation, job satisfaction and school climate. The findings
were summarised with the help of a number of models of 'school atmosphere'.
Kallestad et al. (1998) explored a number of methodological and substantive issues
relating to school climate. The authors used Factor Analysis (in fact, Principal
Components Analysis) in order to explore the nature of school climate. Taylor &
Tashakkori (1995) used a national data set in order to explore the dimensionality of
158
decision participation, school climate, teachers' sense of efficacy and job satisfaction.
They found that the lack of obstacles to teaching and the type of leadership were the
stronger school climate dimensions which could predict teachers' sense of efficacy and
job satisfaction.
Heck & Marcoulides (1996) examined in the area of education the relevance of an
organisational culture model that had been developed and validated by the same authors
three years before (Marcoulides & Heck, 1993). Heck & Marcoulides (1996) collected
data from 156 teachers which had been previously selected at random from 26
secondary schools in Singapore. The authors designed a questionnaire though which
they measured 42 strategic interactions between principals and teachers, focusing on
how the school is structured and governed, how it is organised instructionally, and how
teachers perceive elements of its culture and climate'. The Confirmatory Factor
Analysis (LISREL) resulted in a model which had a good fit with the data. Other
personal and school level variables, like gender, teaching experience, academic
background, and school size and type were not included in the model of Heck &
Marcoulides (1996) because other variables were unrelated to organisational processes.
The model and the standardised path coefficients of Heck & Marcoulides (1996) are
presented in Figure 3.15 which follows. The authors (op. cit.), state that 'how school
staff and parents are able to organise and co-ordinate the work life of the school ...
shapes not only the learning experiences and achievement of the students, but also the
environment in which this work is carried out' (p. 77). The school outcomes which were
used as a measure of school performance in the path diagram of Figure 3.15 were the
national standardised tests of Reading and Mathematics. The other factors in the model
were arranged by the authors in three groups: (a) the socia-cultural subsystem, which
includes the organisational structure and the managerial processes; (b) the
organisational value subsystem, which included the organisational values and the
organisational climate; and (c) the individual belief system, i. e. the teacher attitudes.
Heck & Marcoulides (1996) interpreted their findings as supporting the notion that
positive social and professional relations in the schools are related to learning.
159
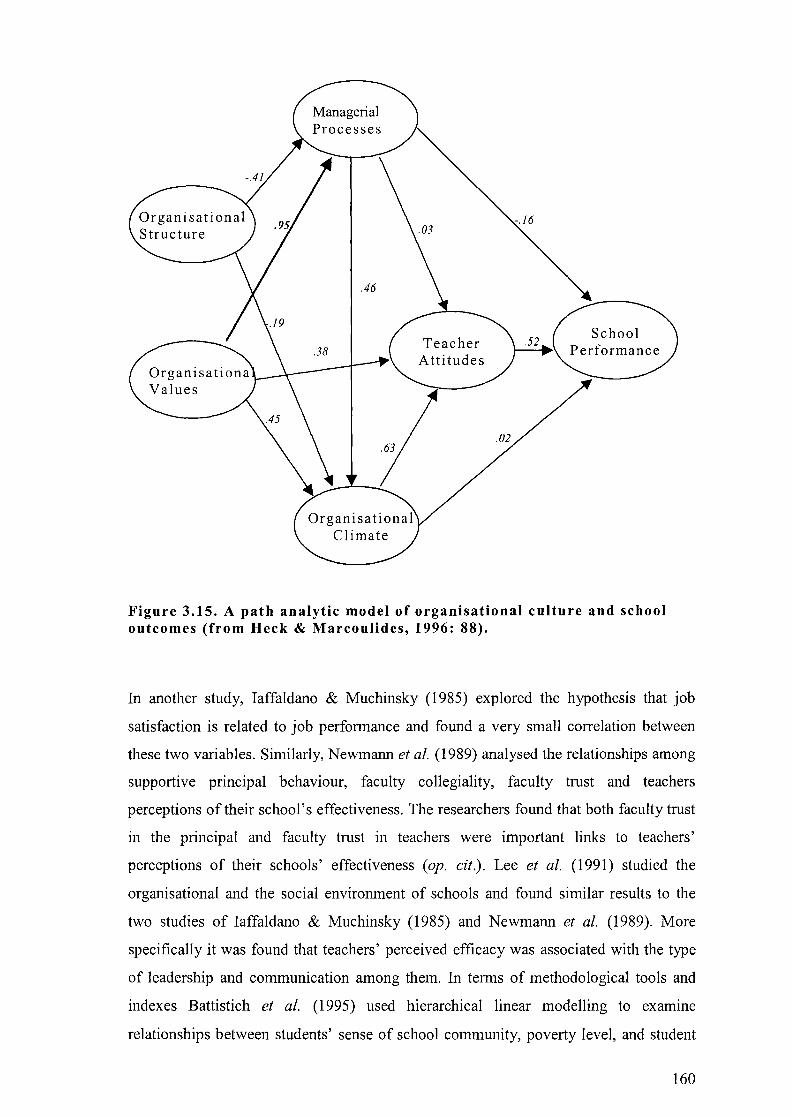
-.16
Figure 3.15. A path analytic model of organisational culture and school outcomes (from Heck & Marcoulides, 1996: 88).
In another study, Iaffaldano & Muchinsky (1985) explored the hypothesis that job
satisfaction is related to job perfonnance and found a very small correlation between
these two variables. Similarly, Newmann et al. (1989) analysed the relationships among
supportive principal behaviour, faculty collegiality, facuIty trust and teachers
perceptions of their school's effectiveness. The researchers found that both facuIty trust
in the principal and facuIty trust in teachers were important links to teachers'
perceptions of their schools' effectiveness (op. cit.). Lee et al. (1991) studied the
organisational and the social environment of schools and found similar results to the
two studies of Iaffaldano & Muchinsky (1985) and Newmann et al. (1989). More
specifically it was found that teachers' perceived efficacy was associated with the type
of leadership and communication among them. In tenns of methodological tools and
indexes Battistich et al. (1995) used hierarchical linear modelling to examine
relationships between students' sense of school community, poverty level, and student
160
attitudes, motives, beliefs and behaviour. The authors used a diverse sample of 24
elementary schools. Within schools, individual students' sense of school community
was significantly associated with almost all of the student outcome measures. Between
schools, school-level community and poverty were both significantly related to many of
the student outcomes (the former positively, the latter negatively).
More recent articles in the area of school climate or ethos include Hargreaves' (1995)
'school culture, school effectiveness and school improvement' and Keefe's (1994)
'school evaluation using the case-ims model and improvement process'. Keefe (op. cit.)
presents an interactive model of the school environment in which school climate and
teacher satisfaction are the mediating variables. The same author (op. cit.) presents the
Comprehensive Assessment of School Environment model (CASE). In another recent
study Tarter et al. (1995) used path-analytic models and concluded that it is rather the
supportive behaviour of the principal and not the behaviour of the teachers which
promotes trust in the principal. On the other hand, it is the collegiality between teachers
and not the behaviour of the principal which fosters trust among colleagues (op. cit.).
Other recent articles in the area of school climate include van der Sijde's (1999) article
about the Dutch classroom climate. The author (op. cit.), in order to measure school
climate, used a number of different instruments like opinion questionnaires, attitude
tests and achievement tests. Finally, Seashore (1998), in a recent article explores the
way in which teachers' quality of working life contributes to their commitment to work
and their sense of efficacy.
3.7.1.4. School leadership
Grift & loutveen (1999} define educational leadership as the ability of the principal to
initiate school improvement, to create a learning-oriented climate, and to stimulate and
supervise teachers in such a way that the latter may execute their tasks as effectively as
possible. Beare et al. (1993) also clarify the concepts of 'leadership' and 'leader'. They
present a set of definitions, according to which principals, head-teachers and other
senior staff who have formal authority by virtue of their appointments are leaders and
may exercise leadership. The important theme of a principal's contribution to the
organisational climate of the school has been reviewed by Hallinger & Heck (1998) in
the School Effectiveness and School Improvement journal. The authors scrutinised the
literature in order to investigate the relation between principal leadership and student
achievement through 1980-1995. Their main conclusion was that principals make a
161
significant and measurable contribution to the effectiveness of staff and learning of
students but this contribution is not linear. School principals influence four components
of the organisational system of the school: School aims and goals, its structure and
social networks, its people, and its organisational culture.
3.7.1.5. Teachers' participation in decision making
A special dimension of working conditions in school is the extent of the teachers'
influence, through participation, in school decision-making. Corcoran (1990) reviewed
the literature and argued that there is some evidence of a positive relationship between
teachers' degree of participation in decision making and effectiveness in schools.
Corcoran stated that 'teacher participation in decisions has been shown to be related to
lower levels of staff conflict, higher morale and more positive feelings about school
leaders, greater commitment to new policies and programmes, more effective
enforcement of discipline, and less absenteeism' (op. cit.: 58). Lack of opportunity for
participation may increase teacher stress and burnout (ibid.). In terms of the association
between teacher participation and school effectiveness, Brookover et al. (1979) found
no clear, definitive relation between higher levels of teacher influence and educational
outcomes. The authors stated however that 'while evidence of the benefits of increased
teacher influence is fragmentary, reforms are assuming that there is a causal relationship
between staff influence and school effectiveness' (op. cit.: 158).
Sederberg & Clark (1990) conducted a number of interviews with 'high vitality'
teachers in order to find how these teachers explained their motivation. It was found that
what motivated the teachers was not simply a collection of school organisational
conditions. Instead, teachers attributed their motivation to replication of role models,
missionary zeal and the satisfaction of reaching all students. In the same study teachers
also referred to a number of organisational incentives like adequate salary, involvement
in decision-making, and released time for collegial relationships. Corcoran (1990)
reviewed the effective-schools literature and listed the following 10 characteristics of
the work environment in which teachers are likely to be most effective:
•
•
•
•
shared goals and high expectation of success;
respectful and dignified treatment as professionals, by supenors, parents, and
students;
an orderly school climate in which discipline is a by-product of school organisation;
strong and supportive instructional leadership and supervision;
162
•
•
•
•
•
•
adequate and protected instructional time;
participation by teachers in the decisions affecting their work;
regular opportunities for collegial interaction and sharing which promote skill
development and professional support;
recognition and rewards for efforts and achievement;
opportunities for professional growth;
decent and safe physical working conditions (Corcoran, 1990: 150).
The same author presented the findings drawn from a qualitative study of working
conditions in urban public schools, conducted by the Institute of Educational Leadership
(IEL) and reported by Corcoran et al. (1988). The IEL data drew upon 400 in-depth
interviews with teachers and administrators from 31 schools in five urban districts in the
United States, providing detailed descriptions of working conditions across schools and
districts. The IEL study provided insights into the effects of working conditions on the
attitudes and job performance of urban teachers and the factors which account for
variations in these effects across school sites. The findings of the IEL study are
presented in Table 3.18.
163
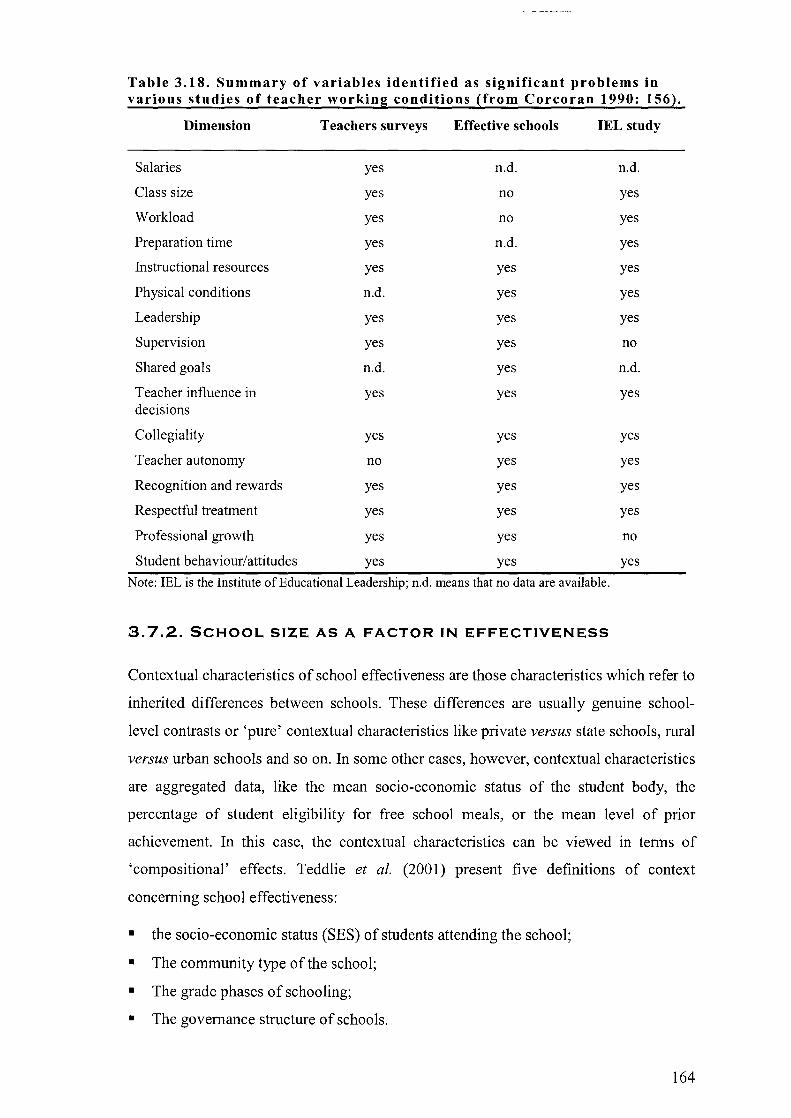
Table 3.18. Summary of variables identified as significant problems in various studies of teacher working conditions (from Corcoran 1990: 156).
Dimension Teachers surveys Effective schools IEL study
Salaries yes n.d. n.d.
Class size yes no yes
Workload yes no yes
Preparation time yes n.d. yes
Instructional resources yes yes yes
Physical conditions n.d. yes yes
Leadership yes yes yes
Supervision yes yes no
Shared goals n.d. yes n.d.
Teacher influence in yes yes yes decisions
Collegiality yes yes yes
Teacher autonomy no yes yes
Recognition and rewards yes yes yes
Respectful treatment yes yes yes
Professional growth yes yes no
Student behaviour/attitudes yes yes yes
Note: IEL is the Institute of Educational Leadership; n.d. means that no data are available.
3.7.2. SCHOOL SIZE AS A FACTOR IN EFFECTIVENESS
Contextual characteristics of school effectiveness are those characteristics which refer to
inherited differences between schools. These differences are usually genuine school
level contrasts or 'pure' contextual characteristics like private versus state schools, rural
versus urban schools and so on. In some other cases, however, contextual characteristics
are aggregated data, like the mean socio-economic status of the student body, the
percentage of student eligibility for free school meals, or the mean level of prior
achievement. In this case, the contextual characteristics can be viewed in terms of
'compositional' effects. Teddlie et al. (2001) present five definitions of context
concerning school effectiveness:
• the socio-economic status (SES) of students attending the school;
• The community type of the school;
• The grade phases of schooling;
• The governance structure of schools.
164

From a methodological point of View, both pure contextual and compositional
explanatory variables can be treated as the same in the statistical analysis of educational
data. Such compositional effects have been presented by the current author in Figure 3.1
(page 119). Two contextual variables will be used in the current study: school size and
school type (private or state). The impact of these two variables on school effectiveness
will be the theme of this section.
The findings on the relation between school Size and educational outcomes are
ambivalent. In two of the first studies which dealt with the association between size and
outcomes is that of Barker & Gump (1964) and Conant (1967). These two studies came
to opposing conclusions. In the former it is argued that small schools are superior to
large ones in every aspect. In the latter it was found that size affects a school's ability to
offer a wide programme of classes and in that sense larger schools were preferable. This
difference is an inherited characteristic of research in school size and an indication of
the complexity of such an issue. In another study Monk (1987) theorised that the
curricular variation in the larger schools involves at least three dimensions in the mix of
courses, and wide variation in the method of offering the courses. Haller et al. (1990)
have stated that as schools get larger 'the comprehensiveness increases differentially
both across and within subjects' (p. 116) and that the larger schools can 'add advanced
and alternative courses to their curricula' (p. 117).
Fowler Jr (1995) reviewed a number of studies on the relation between school size and
student outcomes. Some of the studies in Fowler's review are presented in Table 3.19.
In Greece the relation between school size and students' achievement has never been
investigated. School building space in Greek cities is hard to find whereas schools in
rural areas are regarded as functioning at a high cost. The only reference to the size of
the Greek school has been made by Kassotakis (1998) who argues that the multifarious
lyceum (a form of lyceum that was abolished in 1998) had problems due to its large size.
In terms of student outcomes Kassotakis referred to discipline problems in integrated
multifarious lyceia because, as he argued, 'the high number of students that are
necessary for the functioning of this specific school is not only an obstacle for the
development of multifarious lyceia in areas with a small number of students but also is
regarded by many as causing problems' in student behaviour (op. cit.: 116). Table 3.19
contains the findings of Fowler Jr (1995).
165

Table 3.19. School size and educational outcomes (review of selected studies from Fowler Jr, 1995).
Study Outcomes Main finding
Willems (1967) Students to When the ratio is high, marginal students do activities ratio not receive much attention
Lindsay (1982) School satisfaction Satisfaction is higher in small schools and sense of belonging
Pittman & Dropout rate School size mediates the level of student participation and the severity of school problems, with larger schools producing a poorer social climate, which in turn causes a higher dropout rate
Haughwout (1987)
Page (1990)
Haller (1992)
Fowler & Walberg (1991)
Marion et al. (1991)
Baird (1969)
Morgan & Alwin (1980)
Adolescent loneliness
Student , indiscipline'
Retention and achievement test scores
Academic achievement
Non academic accomplishments (leadership, music, drama, writing, art and science)
Student participation
'Students in small schools were least likely to experience loneliness' (152)
'Size is significantly and substantially correlated with all measures of 'indiscipline' except for self-reported disorder' (151)
Higher in smaller schools
School size negatively correlated with school level achievement and educational attainment, controlling for the socio-economic status of students
High school size positively related to the first four academic accomplishments
'Increases in school size lead to decreased student participation' (249)
Note: The parentheses in the right hand column indicate page numbers from the book Organisational Influences on Educational Productivity, edited by Levin et al. (1995).
166
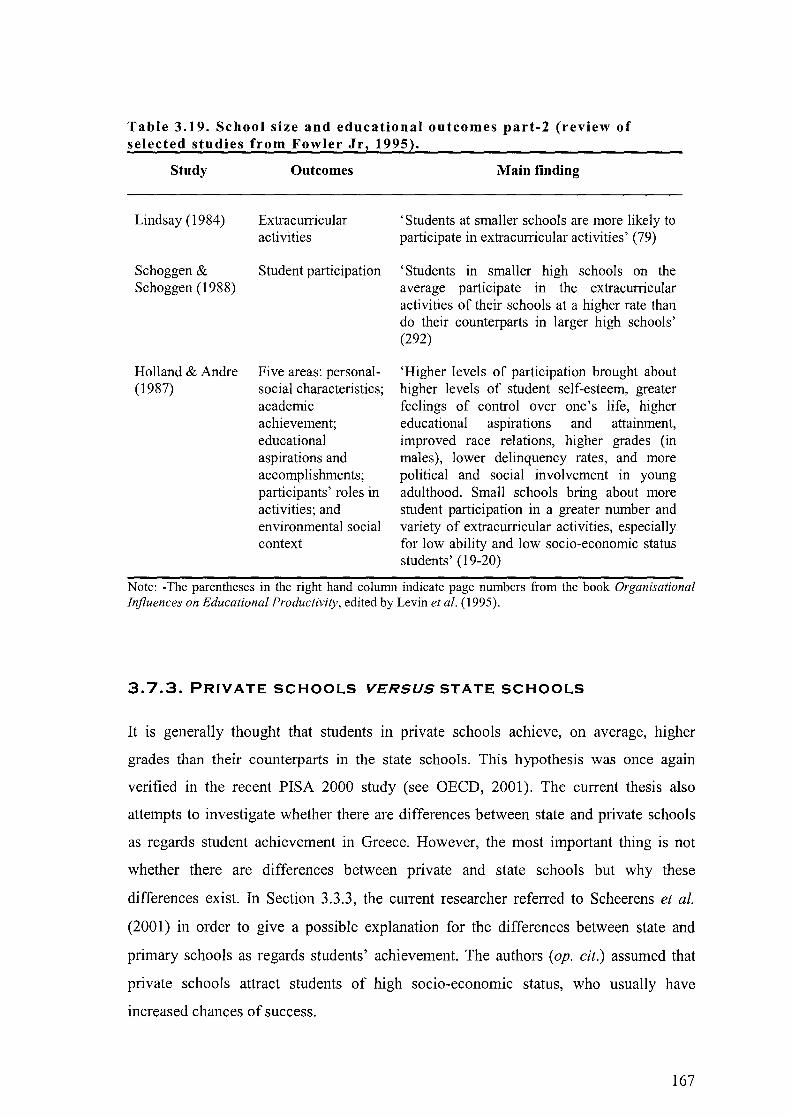
Table 3.19. School size and educational outcomes part-2 (review of selected studies from Fowler Jr, 1995).
Study
Lindsay (1984)
Schoggen & Schoggen (1988)
Holland & Andre (1987)
Outcomes
Extracurricular activities
Student participation
Five areas: personalsocial characteristics; academic achievement; educational aspirations and accomplishments; participants' roles in activities; and environmental social context
Main finding
'Students at smaller schools are more likely to participate in extracurricular activities' (79)
'Students in smaller high schools on the average participate in the extracurricular activities of their schools at a higher rate than do their counterparts in larger high schools' (292)
'Higher levels of participation brought about higher levels of student self-esteem, greater feelings of control over one's life, higher educational aspirations and attainment, improved race relations, higher grades (in males), lower delinquency rates, and more political and social involvement in young adulthood. Small schools bring about more student participation in a greater number and variety of extracurricular activities, especially for low ability and low socio-economic status students' (19-20)
Note: -The parentheses in the right hand column indicate page numbers from the book Organisational Influences on Educational Productivity, edited by Levin et al. (1995).
3.7.3. PRIVATE SCHOOLS VERSUS STATE SCHOOLS
It is generally thought that students in private schools achieve, on average, higher
grades than their counterparts in the state schools. This hypothesis was once again
verified in the recent PISA 2000 study (see OEeD, 2001). The current thesis also
attempts to investigate whether there are differences between state and private schools
as regards student achievement in Greece. However, the most important thing is not
whether there are differences between private and state schools but why these
differences exist. In Section 3.3.3, the current researcher referred to Scheerens et al.
(2001) in order to give a possible explanation for the differences between state and
primary schools as regards students' achievement. The authors (op. cit.) assumed that
private schools attract students of high socio-economic status, who usually have
increased chances of success.
167
An investigation of the differences between private and state schools in Greece is
particularly important now that a number of Greek politicians argue that all Greek
schools should function as 'private' institutions in a 'market-like environment'. For
example, George Psaharopoulos, a parliamentarian and professor of education
economics at the University of Economics in Athens claims that the 16th article of the
Greek Constitution should be changed in order that all Greek state schools may
privatise (see Papagianidis & Mpaskozos, 2001). Issues like whether Greek schools
should function as private institutions or whether Greek parents should be given
educational vouchers are beyond the scope of the current study. For those who are
interested in these issues there are a number of introductory texts like the book School
Choice and the Quasi-Market, edited by Walford (1996), and the book Market
Approaches to Education, edited by Cohn (1997). A number of relevant articles can
also be found in the journal Education Economics (vol. 5, no. 3, 1997). The recent
PISA study showed that expenditure per student explains 17 per cent of the variation
between countries in student's mean performance (OECD, 2001: 93). However, for
manageability the current study focuses on the two topics of educational effectiveness
and evaluation and not on education economics. Further studies will be needed to
explore the question of resources and their links with educational effectiveness in the
Greek context.
3.7.4. CONCLUSIONS
In the current section, a number of school process and contextual characteristics were
discussed. These process characteristics had to do with the organisational atmosphere of
the school and included topics like the contribution of the head-teacher, the degree of
collegiality among the staff, teachers' satisfaction and participation in decision making
and other similar school climate factors. The contextual variables which were examined
were school size and type. The research results regarding school size are conflicting.
With regard to private or state status of the school, the literature is broad and the issue
has significant political ramifications which cannot be fully discussed in the context of
the present thesis.
168

4. DESIGNING THE FIRST SCHOOL EF!FECTIVENESS STUDY IN GREECE
"I will argue that in order to describe the complex reality that constitutes educational systems we require modeling tools that involve a comparable level of complexity. I also wish to argue that, while we need continually to elaborate our models, we will almost certainly remain a long way from perfect descriptions; the journey is important, even though we may never arrive at our destination. ( ... ) In other words we require a measure of our knowledge as well as a measure of our ignorance".
Harvey Goldstein (1998) Models for Reality: New Approaches to the Understanding of Educational Processes. Professorial Lecture: London Institute of Education Papers, p. 2.
169

4.1. SOME NOTES ON PHILOSOPHY: RECLAIM~ ING REALITY IN EDUCATIONAL RESEARCH
The reason why the present thesis enters the realms of philosophy is that school
effectiveness and educational evaluation are considered interesting fields in the
philosophical domain. Specifically, School Effectiveness has been accused of
subscribing to a naive realism (see Section 3.3). Moreover, many exponents of the
'fourth generation educational evaluation' argue that all 21 st century evaluators should
endorse a 'constructivist' epistemology (see Section 2.4.1 and page 67). This is, for
example, how Guba & Lincoln (1989) describe 'fourth generation educational
evaluation' :
Evaluation outcomes are not descriptions of the 'way things really are' or 'really work', or of some 'true' state of affairs, but instead represent meaningful constructions that individual actors or groups of actors form to 'make sense' of the situations in which they find themselves. The findings are not 'facts' in some ultimate sense but are, instead, literally created through an interactive process that includes the evaluator (so much for objectivity!) as well as the many stakeholders. ( ... ) What emerges from this process is one or more constructions that are the realities of the case (Guba & Lincoln, 1989: 8, italics in the original).
Goldstein (1998), in his professorial lecture at the London Institute of Education, spoke
about 'models for reality'. In fact, the present study will attempt to build such models.
On the other hand, however, the argument of Guba & Lincoln (1989) - i. e. that there is
no such thing as 'reality' - is too serious to be ignored. Philosophy is not the field of the
current study. However, this section will attempt to set this study's approach to research
context.
In the book Philosophy of Educational Research Pring (2000) touches on philosophical
issues like 'reality', 'objectivity', 'causal explanation', 'truth', 'facts', 'theories', and
'knowledge'. He also describes two 'paradigms' for educational research: the
'scientific' paradigm (Paradigm A) and the 'constructivist' paradigm (Paradigm B). It
needs to be reminded here that according to Kuhn (1970), a 'paradigm' is a basic system
of ideas and beliefs that are based on ontological, epistemological and methodological
assumptions. Two definitions need also to be given. According to the Oxford
170
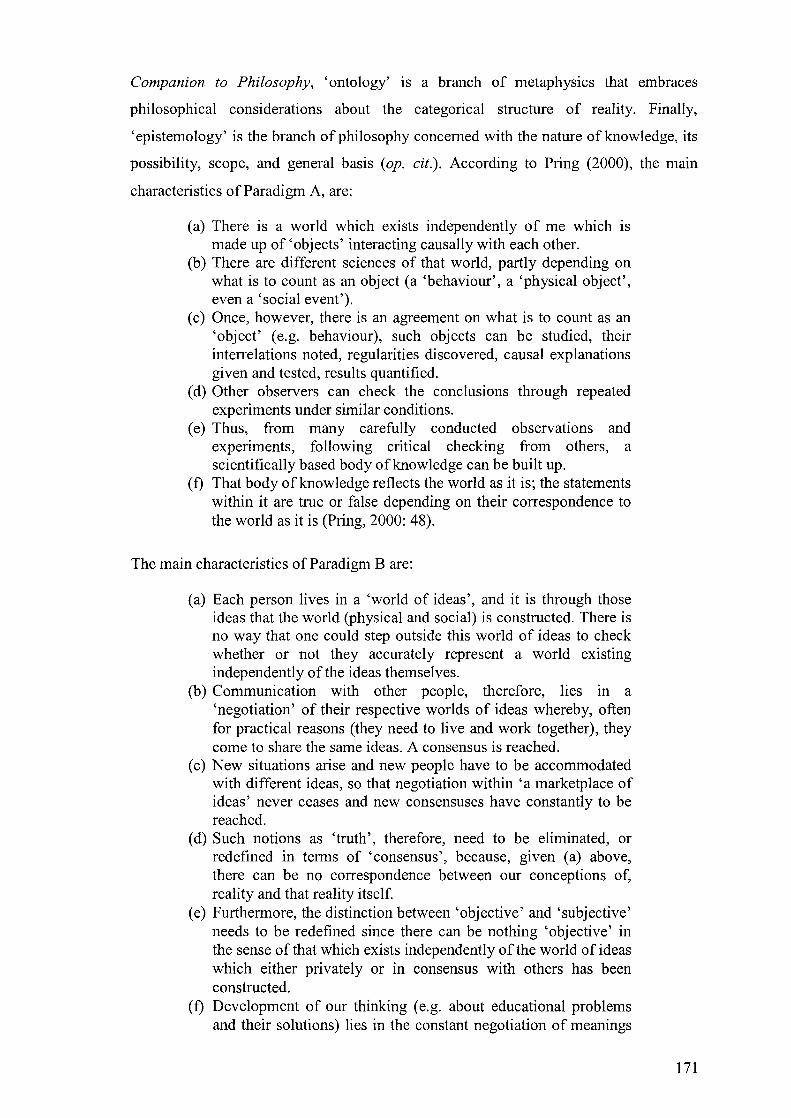
Companion to Philosophy, 'ontology' is a branch of metaphysics that embraces
philosophical considerations about the categorical structure of reality. Finally,
'epistemology' is the branch of philosophy concerned with the nature of knowledge, its
possibility, scope, and general basis (op. cit.). According to Pring (2000), the main
characteristics of Paradigm A, are:
(a) There is a world which exists independently of me which is made up of 'objects' interacting causally with each other.
(b) There are different sciences of that world, partly depending on what is to count as an object (a 'behaviour', a 'physical object', even a 'social event').
(c) Once, however, there is an agreement on what is to count as an 'object' (e.g. behaviour), such objects can be studied, their interrelations noted, regularities discovered, causal explanations given and tested, results quantified.
(d) Other observers can check the conclusions through repeated experiments under similar conditions.
(e) Thus, from many carefully conducted observations and experiments, following critical checking from others, a scientifically based body of knowledge can be built up.
(f) That body of knowledge reflects the world as it is; the statements within it are true or false depending on their correspondence to the world as it is (Pring, 2000: 48).
The main characteristics of Paradigm Bare:
(a) Each person lives in a 'world of ideas', and it is through those ideas that the world (physical and social) is constructed. There is no way that one could step outside this world of ideas to check whether or not they accurately represent a world existing independently of the ideas themselves.
(b) Communication with other people, therefore, lies in a 'negotiation' of their respective worlds of ideas whereby, often for practical reasons (they need to live and work together), they come to share the same ideas. A consensus is reached.
(c) New situations arise and new people have to be accommodated with different ideas, so that negotiation within 'a marketplace of ideas' never ceases and new consensuses have constantly to be reached.
(d) Such notions as 'truth', therefore, need to be eliminated, or redefined in terms of 'consensus', because, given (a) above, there can be no correspondence between our conceptions of, reality and that reality itself.
(e) Furthermore, the distinction between 'objective' and 'subjective' needs to be redefined since there can be nothing 'objective' in the sense of that which exists independently of the world of ideas which either privately or in consensus with others has been constructed.
(f) Development of our thinking (e.g. about educational problems and their solutions) lies in the constant negotiation of meanings
171

between people who only partly share each other's ideas but who, either in order to get on practically or in order to I accommodate new ideas, create new agreements - new ways of conceiving reality. Since there is no sense in talking of reality independently of our conceiving it, therefore there are as many realities as there are conceptions of it - multiple realities (Pring, 2000: 50).
The dualism between Pring's Paradigm A and Paradigm B has been described more
systematically by other authors. Guba & Lincoln (1998), for example, compared four
research paradigms in terms of ontology, epistemology and methodology. The
paradigms discussed by Guba & Lincoln are presented in Table 4.1. As we move from
the left-hand columns of Table 4.1 to the right-hand ones, the meanings of concepts like
'reality', 'objectivity', 'fact', and 'knowledge' change. Positivism and post-positivism
(columns 1 and 2) believe in an objective reality, whereas the other two paradigms do
not. In addition, in columns 1 and 2 the researcher keeps a distance from the object of
his or her research. Paradigms 3 and 4, on the other hand, blur the distinction between
the researcher and researched object. For these two paradigms, the research findings are
being created from the interaction between researchers and what is researched.
172
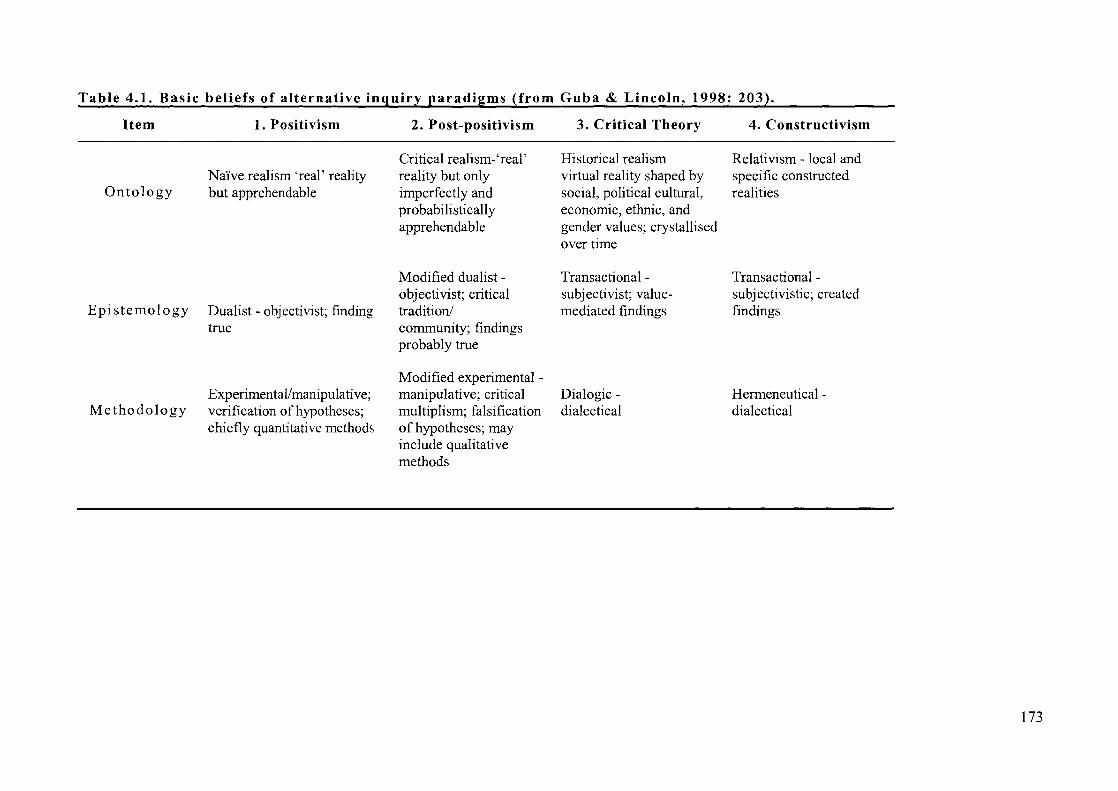
Table 4.1. Basic beliefs of alternative inquiry paradigms (from Gub~& Linc~ln, 1998: 203).
Item
Ontology
Epistemology
Methodology
1. Positivism
NaIve realism 'real' reality but apprehendable
Dualist - objectivist; finding true
Experimental/manipulative; verification of hypotheses; chiefly quantitative methods
2. Post-positivism
Critical realism-'real' reality but only imperfectly and probabilistically apprehendable
Modified dualist -objectivist; critical tradition! community; findings probably true
Modified experimental -manipulative; critical multiplism; falsification of hypotheses; may include qualitative methods
3. Critical Theory
Historical realism virtual reality shaped by social, political cultural, economic, ethnic, and gender values; crystallised over time
Transactional -subjectivist; valuemediated findings
Dialogic -dialectical
4. Constructivism
Relativism - local and specific constructed realities
Transactional -subjectivistic; created findings
Hermeneutical -dialectical
173

The term 'realism' that can be found III the first row of Table 4.1, (the row of
'ontology'), is the view that there is a 'reality' that exists independently of the
researcher. Realism can be seen in the first three columns of Table 4.1 to be described
as 'naIve', 'critical', or 'historical'. In the last column of Table 4.1, however, there is no
one reality but many. In the constructivist paradigm, 'multiple realities' exist, based on
peoples' perceptions of them. Thus, for constructivists, reality is something created by
people and, theoretically speaking, there could be as many realities as individuals.
Pring does not subscribe to Guba & Lincoln's (1998) categorisation. In the Philosophy
of Educational Research (2000) Pring considers the very existence of human beings
(persons) and makes the distinction between reality per se and peoples' views of reality.
He argues that 'the very possibility of the social interactions, through which social
reality is construed, depends upon a shared understanding (howsoever vague and
general) of what it is to be a person - a centre of consciousness capable of intentional
action, rational behaviour, emotional response and potential for assuming some level of
responsibility' (p. 52). In other words, the very possibility of the negotiation of
meanings presupposes, for Pring (2000), the existence of persons. Realism, therefore,
should not be confused with naIve realism i.e. the view that there is a one-to-one
relation between our descriptions of reality and reality itself.
In conclusion, educational researchers should reclaim reality. We must make a
distinction between reality per se and people's views of it. It is nowadays held among
social (and educational) researchers that our theories shape, determine and in some
cases create what they see as proofs of theories. The Structure of Scientific Revolutions
(Kuhn, 1970) has been very influential in the birth of this philosophical position.
Because of this philosophical position, there is nowadays a widely held view among
educational researchers that much quantitative educational research is ontologically
'naIve'. However, in should be noted that researchers and scholars in the area of School
Effectiveness have never adopted naIve positivistic claims such as that research finding
mirror reality. On the contrary, it is constantly stressed by researchers that the statistical
models of reality can never be perfect, as far as educational processes are concerned. As
Goldstein (1998) said in his professorial lecture at the London Institute of Education,
researchers in the area of school effectiveness try to construct models which provide 'a
measure of our knowledge and a measure of our ignorance'. In this study the researcher
seeks to explore students' and teachers' perceptions in order to gain an understanding of
174

school processes in Greek secondary schools and to investigate a range of models
linking such processes to measures of student outcomes.
Before ending the discussion about the philosophical ramifications of this thesis, a brief
reference should be made to another line of philosophical thought which also rejects the
notion of a single reality: post-modernism. The notion of post-modernism was proposed
by Jean-Francois Lyotard in his book The Postmodern Condition (1984). Post
modernism has had great impact on educational research. Today, authors like Stronach
& Mac Lure (1997) argue that a large part of educational research is faulty because it
remains resistant to the 'post-modem embrace'. The basic idea of post-modernism is
that not only reality but also Reason is a social construct. A discussion on this
philosophical proposition is beyond the scope of the current study. However, a short
quotation reflecting current author's opinion about post-modernism could be presented
here.
Postmodernism's emphasis on the inscribed subject, the decentred subject constructed by language, discourses, desire and the unconscious, seems to contradict the very purpose of education which was founded on modernity's self-motivated, self-directing, rational subject, capable of exercising individual agency (Jennings & Graham, 1996: 270).
The brief quotation presented above could be seen as a starting point to further
philosophical investigations.
175

4.2. MEASURING SCHOOL EFFECTIVENESS
4.2.1. RESEARCH MODELS OF SCHOOL EFFECTIVENESS
Before presenting the research design of the current study it is necessary to present a
number of models for research on school effectiveness. This will help in the
categorisation and the better understanding of the variables. Shipman (1990, cited in
Rae, 1997: 132) described five design models for school effectiveness research.
D ---30 The output model. > This first model is an ex post facto (after-the
event) design. In using this model, there is no way of knowing what influences the outputs in a particular school.
The process-output model. d---'" In the second model, the outputs are related to
different school processes. Differences among intakes and their environment could still be major influences.
'" I > The input-output model. +----::;. The third model is a before-after design. This
L.. ___ ---' model gives no information on what other factors may have influenced any differences in the result.
>
, ........ --- .............
The input-process-output model. In the fourth model the progress (output after adapting for input) of pupils can be related to aspects of school and classroom policy and practice.
,. .... / ,. .... , The context-input-process-output model.
I " In the fifth model environmental factors (state, ~ , local, neighbourhood) can also be taken into \ / I account at input and output, and progress , .... ,. ,. attributed to the school.
.... "" .............. _-_ .... ..-
176

Another set of models with increasing degree of complexity for measuring the school
effect, has been advocated by Scheerens & Bosker (1997). These models are:
1. the gross school effects model, which uses as the measure of school effect the
mean (uncorrected) achievement score of pupils in a certain school;
11. the unpredicted student achievement model, in which a prediction equation is
estimated from student and school level data;
111. the learning gain model, in which achievement IS predicted from pnor
achievement;
IV. the unpredicted learning gain model, in which a post-test score is corrected for a
reassessment score and then it is corrected for aptitude, socio-economic status, age,
gender, ethnicity and other student and school variables.
As the research design lists develops from the output model to the context-input-output
model (in the case of Shipman, 1990) or from the gross school effects model to the
model of unpredicted learning gain (in the case of Scheerens & Bosker, 1997), the level
of complexity and the requirement in tenns of data increase. What is achieved by the
use of more complex models however is a much clearer picture of the effectiveness of
the schools.
The above idea has been demonstrated empirically by Sammons et al. (1997), in an
analysis of the size of school and departmental effects in students' GCSE examination
results. The authors (op. cit.) employed four models of varying complexity for
measuring value added in schools: Model I, which did not include any explanatory
variable; Model II, which included only background variables but not prior attainment;
Model III; which included prior attainment measures only; and Model IV, the complete
model. The percentage of total and school level variance explained by three of the
above-mentioned models is presented in Table 4.2.
177
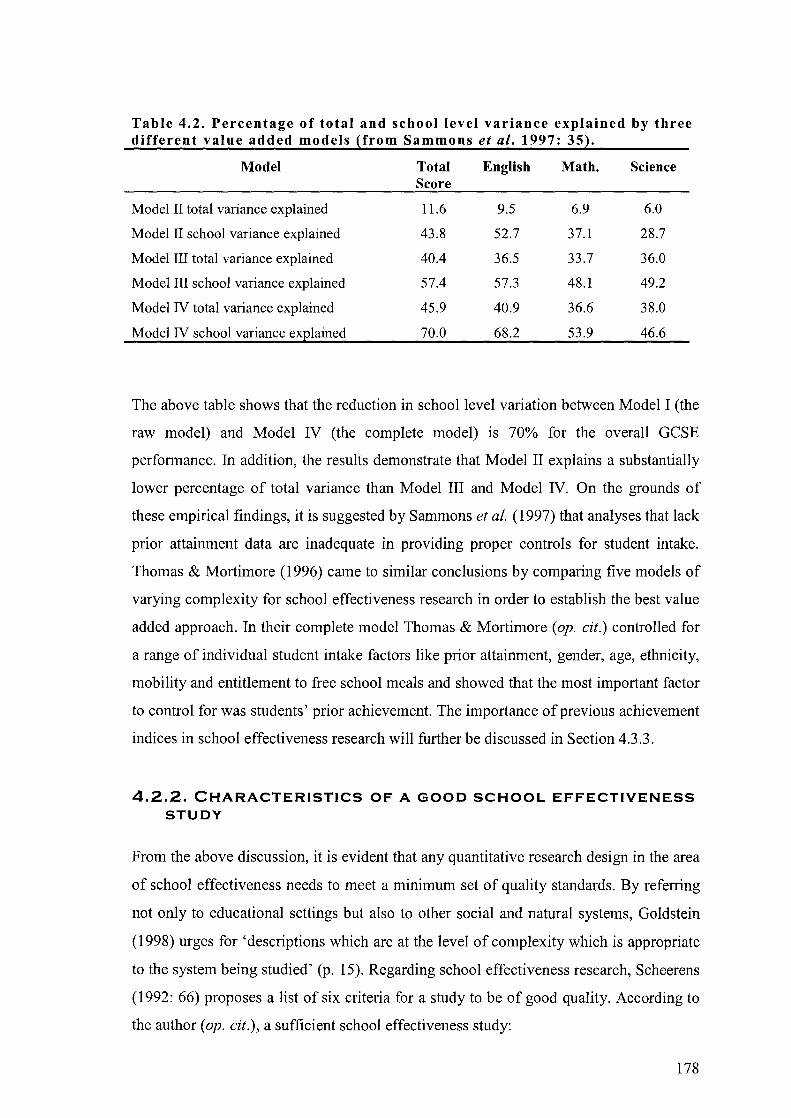
Table 4.2. Percentage of total and school level variance explained by three different value added models ~from Sammons et al. 1997: 35~.
Model Total English Math. Science Score
Model II total variance explained 11.6 9.5 6.9 6.0
Model II school variance explained 43.8 52.7 37.1 28.7
Model III total variance explained 40.4 36.5 33.7 36.0
Model III school variance explained 57.4 57.3 48.1 49.2
Model N total variance explained 45.9 40.9 36.6 38.0
Model N school variance eXElained 70.0 68.2 53.9 46.6
The above table shows that the reduction in school level variation between Model I (the
raw model) and Model IV (the complete model) is 70% for the overall GCSE
performance. In addition, the results demonstrate that Model II explains a substantially
lower percentage of total variance than Model III and Model IV. On the grounds of
these empirical findings, it is suggested by Sammons et al. (1997) that analyses that lack
prior attainment data are inadequate in providing proper controls for student intake.
Thomas & Mortimore (1996) came to similar conclusions by comparing five models of
varying complexity for school effectiveness research in order to establish the best value
added approach. In their complete model Thomas & Mortimore (op. cit.) controlled for
a range of individual student intake factors like prior attainment, gender, age, ethnicity,
mobility and entitlement to free school meals and showed that the most important factor
to control for was students' prior achievement. The importance of previous achievement
indices in school effectiveness research will further be discussed in Section 4.3.3.
4.2.2. CHARACTERISTICS OF A GOOD SCHOOL EFFECTIVENESS STUDY
From the above discussion, it is evident that any quantitative research design in the area
of school effectiveness needs to meet a minimum set of quality standards. By referring
not only to educational settings but also to other social and natural systems, Goldstein
(1998) urges for 'descriptions which are at the level of complexity which is appropriate
to the system being studied' (p. 15). Regarding school effectiveness research, Scheerens
(1992: 66) proposes a list of six criteria for a study to be of good quality. According to
the author (op. cit.), a sufficient school effectiveness study:
178

1. Taps sufficient 'natural' variance in school and instructional characteristics, so that
there is a fair chance that they might be shown to explain differences in achievement
between schools.
2. Uses adequate operationalisations and measures of the process and effect variables,
preferably including direct observations of process variables and a mixture of
quantitative and qualitative measures.
3. Adequately adjusts effect measures for intake differences between schools (e.g., In
previous achievement and socio-economic status of student).
4. Has units of analysis that allow for data analyses with sufficient discriminative
power.
5. Uses adequate techniques for data analysis - in many cases multilevel models will
be appropriate to do justice to the fact that we usually look at classes within schools,
students within classes and perhaps even schools within specific types of
environments.
6. Uses longitudinal data (the more demanding condition; few studies within the
school effectiveness framework are longitudinal).
In another text, Hill et al. (1995) described the main characteristics of 'state-of-art'
studies of school effectiveness. According to the authors, good school effectiveness
studies are (a) 'multi-method', in that they make use of both qualitative and quantitative
techniques); (b) 'multi-level', in that they make use of sampling designs and analytic
techniques that take into account the organisation of students within classes within
schools; (c) 'longitudinal', in that they follow students' progress over two or more
years; and (d) 'multivariate', in that they include measures or a range of student
achievements, behaviours and attitudes. Hill (1998) accepts that meeting all the ideal
conditions of a school effectiveness study is both time-consuming and logistically
demanding. Goldstein & Spiegelhalter (1996), considering the large amount of
information needed for a 'state of art' school effectiveness expressed similar ideas to
those of Hill (1998) by claiming that finely graded comparisons between schools are
impossible, even when considerable effort for adjustment have taken place. According
to Goldstein & SpiegelhaIter (op. cit.), the current School Effectiveness Research
tradition suffers from many limitations that have to do with the size of the samples, the
'opportunistic' nature of many input and output measures, and errors in the
measurement. It is on these grounds that Hill (op. cit.) argues that the current school
effectiveness paradigm rests on a relatively 'flimsy' base.
179

In conclusion, it could be argued that different researchers have set similar quality
standards for a school effectiveness study to be 'state of art'. These criteria can be very
easy or very difficult to achieve, depending on the context in which the study is being
made. The logistics of the research and the practical difficulties of conducting a school
effectiveness study differ dramatically with respect to the educational system, the
availability of information and the social and political context. In other words, it is
practically another thing to conduct a school effectiveness study in the UK or the
Netherlands and another thing to make school effectiveness study in Greece. Section
6.1.2 of the current work describes the unforeseen and insuperable difficulties of the
people who worked in the Greek Pedagogical Institute, under the aegis of the Ministry
of Education, in a study similar to the current one. The difficulties for an academic
group or a state-supported team to conduct a school effectiveness study are
considerable. Often, teams of researchers found themselves in a position between what
is desirable and what is feasible. The difficulties for a single researcher to make a school
effectiveness study in the context of his or her own doctorate thesis are in many cases
formidable.
180
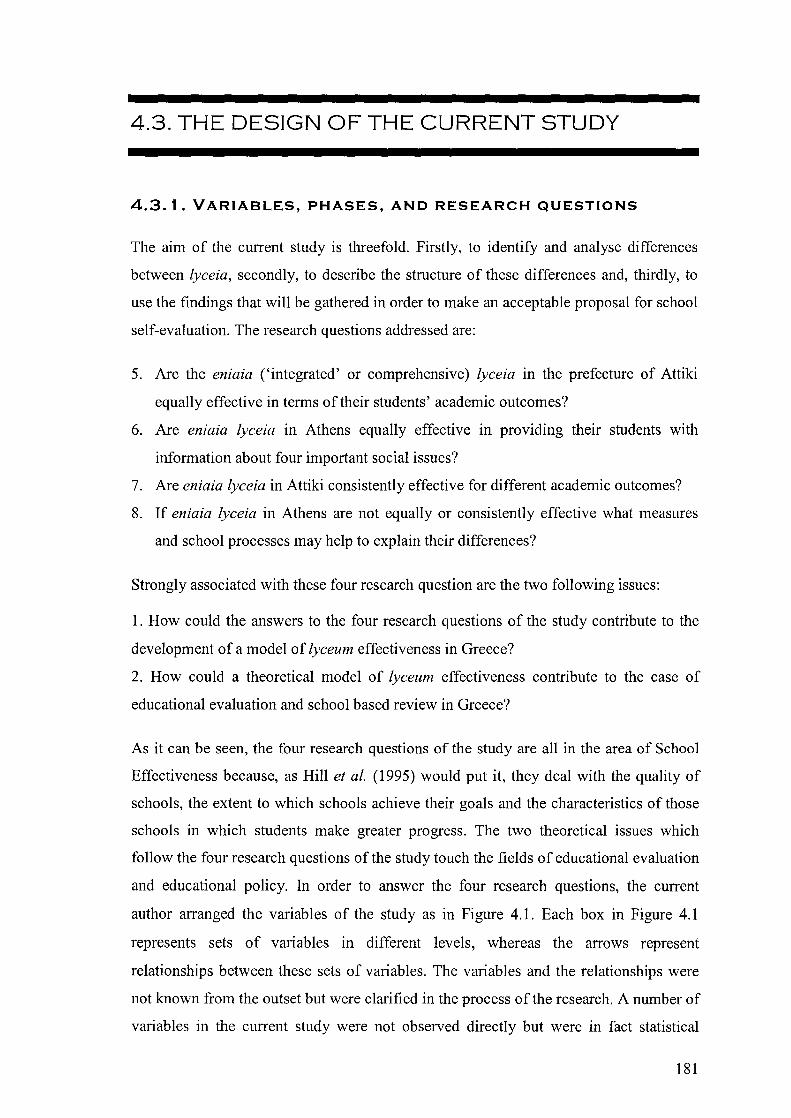
4.3. THE DESIGN OF THE CURRENT STUDY
4.3.1. VARIABLES, PHASES, AND RESEARCH QUESTIONS
The aim of the current study is threefold. Firstly, to identify and analyse differences
between lyceia, secondly, to describe the structure of these differences and, thirdly, to
use the findings that will be gathered in order to make an acceptable proposal for school
self-evaluation. The research questions addressed are:
5. Are the eniaia ('integrated' or comprehensive) lyceia in the prefecture of Attiki
equally effective in terms of their students' academic outcomes?
6. Are eniaia lyceia in Athens equally effective in providing their students with
information about four important social issues?
7. Are eniaia lyceia in Attiki consistently effective for different academic outcomes?
8. If eniaia lyceia in Athens are not equally or consistently effective what measures
and school processes may help to explain their differences?
Strongly associated with these four research question are the two following issues:
1. How could the answers to the four research questions of the study contribute to the
development of a model of lyceum effectiveness in Greece?
2. How could a theoretical model of lyceum effectiveness contribute to the case of
educational evaluation and school based review in Greece?
As it can be seen, the four research questions of the study are all in the area of School
Effectiveness because, as Hill et al. (1995) would put it, they deal with the quality of
schools, the extent to which schools achieve their goals and the characteristics of those
schools in which students make greater progress. The two theoretical issues which
follow the four research questions of the study touch the fields of educational evaluation
and educational policy. In order to answer the four research questions, the current
author arranged the variables of the study as in Figure 4.1. Each box in Figure 4.1
represents sets of variables in different levels, whereas the arrows represent
relationships between these sets of variables. The variables and the relationships were
not known from the outset but were clarified in the process of the research. A number of
variables in the current study were not observed directly but were in fact statistical
181
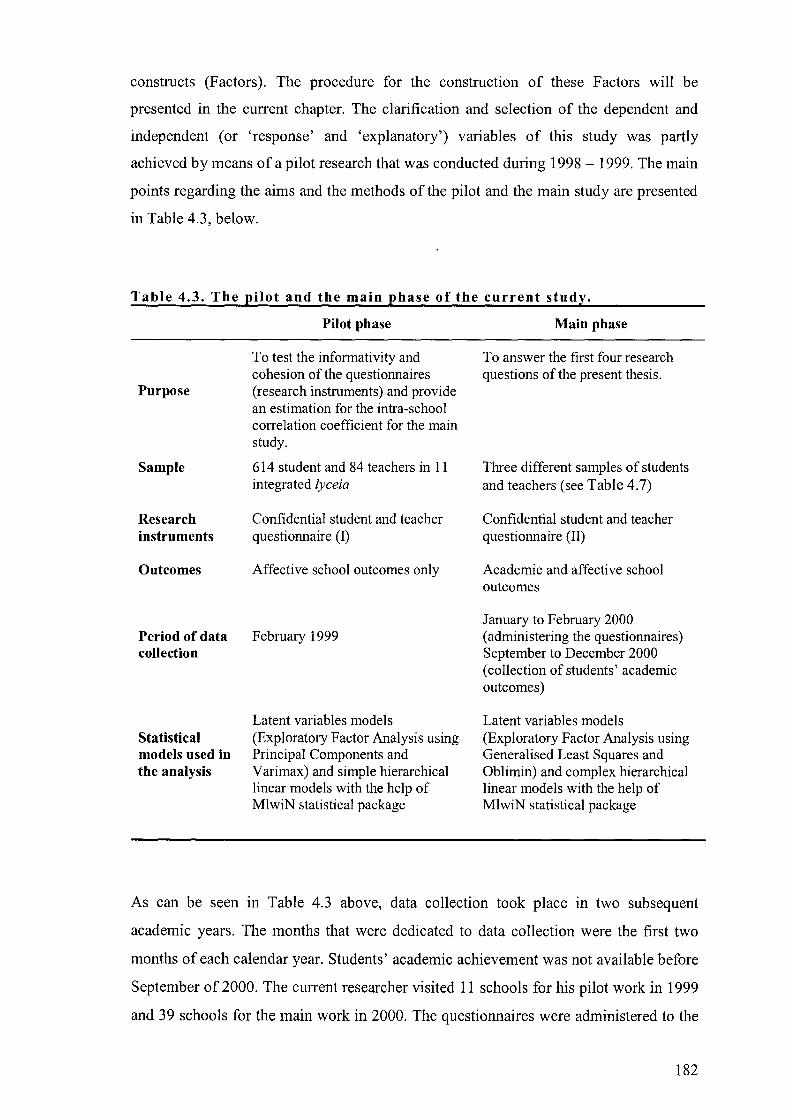
constructs (Factors). The procedure for the construction of these Factors will be
presented in the current chapter. The clarification and selection of the dependent and
independent (or 'response' and 'explanatory') variables of this study was partly
achieved by means of a pilot research that was conducted during 1998 - 1999. The main
points regarding the aims and the methods of the pilot and the main study are presented
in Table 4.3, below.
Table 4.3. The pilot and the main phase of the current study.
Purpose
Sample
Research instruments
Outcomes
Period of data collection
Statistical models used in the analysis
Pilot phase
To test the informativity and cohesion of the questionnaires (research instruments) and provide an estimation for the intra-school correlation coefficient for the main study.
614 student and 84 teachers in 11 integrated lyceia
Confidential student and teacher questionnaire (I)
Affective school outcomes only
February 1999
Latent variables models (Exploratory Factor Analysis using Principal Components and Varimax) and simple hierarchical linear models with the help of MlwiN statistical package
Main phase
To answer the first four research questions of the present thesis.
Three different samples of students and teachers (see Table 4.7)
Confidential student and teacher questionnaire (II)
Academic and affective school outcomes
January to February 2000 (administering the questionnaires) September to December 2000 (collection of students' academic outcomes)
Latent variables models (Exploratory Factor Analysis using Generalised Least Squares and Oblimin) and complex hierarchical linear models with the help of MlwiN statistical package
As can be seen in Table 4.3 above, data collection took place in two subsequent
academic years. The months that were dedicated to data collection were the first two
months of each calendar year. Students' academic achievement was not available before
September of 2000. The current researcher visited 11 schools for his pilot work in 1999
and 39 schools for the main work in 2000. The questionnaires were administered to the
182

students either by the researcher himself or by the teachers of the selected schools. In
every case the researcher visited the schools himself and had had personal
communication and co-operation with the teachers. In both the pilot and the main study,
the questionnaires were printed - not photocopied - in pages of size A3 (twice the size
of the normal ~ page). Each A3 page was latter folded in the middle, thus creating a
questionnaire that looked like an elegant leaflet, easy for the participants (students and
teachers) to read and complete (see Appendix, p. 359). The questionnaires for the pilot
work were printed in an Athenian printing office during Christmas vacations of 1998.
The questionnaires or the main study were printed in the same printing office during
Christmas vacations of 1999. The current researcher's personal savings covered the cost
for the paper and the printers.
4.3.2. FINDINGS OF THE PILOT STUDY
The purpose of the pilot study was mainly to test the informativity and coherence of the
questionnaires that were going to be used later in the main study. The 11 /yceia of the
pilot work were found not to differ significantly in terms of a number of affective
outcomes (students' perceptions). The highest intra-school correlation coefficient was
for the Factor 'perceived school status' (p = 0.080). Table 4.4 presents the components
of this Factor. The technique by which the components presented in the second column
of Table 4.4 constructed the Factor 'school status' will be explained later in this chapter.
More information about the other Factors of the pilot study can be found in the
Appendix.
Table 4.4. Constructing the Factor 'school status' from the answers of the students in the pilot questionnaire.
Number of the variable in Description of the Loading Factor the pilot questionnaire variable
1 Liking of school 0.502 3 Going well with teachers 0.605 F3: SCHST 5 Teacher are fair 0.427 (school status) 6 The playground 0.359 18 Interesting work at school 0.421 33 Truancy -0.433 37 Behaving well to teachers 0.453
183

Another purpose of the pilot work was to give an idea about the school-level variance
and the coefficients of the statistical models. An estimation of the differences between
schools, even in the affective domain, would be helpful in the prospect of the main
study in 2000. With the pilot study, the current researcher gained a clearer view of the
optimal number of schools and the optimal number of students per school to be selected
in the main study. It was decided that the number of schools should be around 40;
around 30 students should be selected from each school. The findings of the pilot study
were presented in a congress at the University of Patra (Verdis, 200 1 b). Regarding the
statistical models that were tested in the pilot work, the analysis resulted in some not
statistically significant regression coefficients for all the affective outcomes. Table 4.5
presents the regression coefficients and the variance components from the Factor
'perceived school status'.
184

Table 4.5. Regression coefficients and variance components for the perceived status of the school.
The 'empty' model The 'background' model
Coefficient S.E. Coefficient S.E. Regression coefficients Intercept -0.001 0.081 0.373 0.254 Farther large proprietor -0.252 0.125 Mother with university degree -0.151 0.082 Having both parents 0.058 0.117 Being a boy -0.460 0.072 Commuting to school -0.004 0.003 Live in a owned house 0.030 0.096
Variance components Variation between schools
0.054 0.030 0.040 0.023 Variation within schools
0.634 0.042 0.573 0.038 Variation between schools as a
0.080 0.065 percentage of the total variation
Goodness of fit criterion 1138,331 1089,068
(-2 log likelihood)
In both the pilot and the main study, special measures were taken in order to protect the
identity of the respondents. More specifically, each questionnaire was coded with an
eight-digit identification number that was made from students' own initials: the name,
the surname, the father's name, and the mother's name. For example, if a student's
initials were the Greek letters 'A', 'B', 'K', and 'n', his or her identification number
would be '01021024' ('01' for 'alpha', '02' for 'beta', '10' for kappa, and '24' for
omega). Thus, the current author was able to combine the data files that were created at
different periods and at the same time to protect students' personal data.
In both the pilot and the main study the data, once selected, were transferred from the
questionnaires to electronic databases by the author himself. A simple DOS-based
program! named 'Dbase III plus' was used for that purpose. The data were later
transferred to the other databases (Microsoft's Excell). The final database contained
data derived both from the questionnaires and the Ministry of Education. Large amounts
I DOS stands for 'Disc Operating System', an outdated computer operating system that was developed by Microsoft in the 1980s.
185

of descriptive statistics were produced with the help of the Statistical Package for Social
Sciences (SPSS). The same package was later used for the construction of the factor
analytic models. Finally, the multilevel analyses of the data were conducted in the
computers of the London Institute of Education with the help of the MlwiN statistical
package. Figure 4.1, below, presents the variables that were used in the main study. The
variables have been arranged in six different sets. The meaning of each set will be
presented in the following paragraphs.
Input Processes Outputs
1. 4. 5. Previous .. .. SOCIAL
~ II'"
Achievement OUTCOMES
• Climate ... I • Processes
• Context 6. 2.
ACADEMIC Social .. ...
~ .... OUTCOMES Background School
~ .. I
~ I I I 3. I
~---. Learning opportunities outside school (jrontisterion)
Figure 4.1. Sets of explanatory and response variables in the current thesis.
4.3.3. STUDENTS' PREVIOUS ACHIEVEMENT AND SOCIAL BACKGROUND
Boxes 1 and 2 in Figure 4.1 represent sets of independent or explanatory variables in the
study. These variables were chosen to function as adjustments for differences in the
intake between schools. The importance of adjustments for school intake is stated by
Scheerens' (1992) in his list for an 'adequate' school effectiveness study (see page 179
of the current work). Of all the adjustments for intake, the most important is students'
previous achievement. Willms (1992: 58) warns that 'if the analysis in a school
186

effectiveness study does not include measures of prior performance, the estimate of
school effects will probably be biased'. Teddlie et al. (2000b) give guidelines for the
most appropriate time point for prior attainment to be measured: 'ideally - they argue -
such measures should be collected at the point of entry to school at the beginning of a
relevant phase' (p. 95).
In the current work, one set of models which explained students' academic outcomes
controlled for prior achievement. However, it must be noted that the measures of prior
achievement which were used suffered from severe limitations. This is because tests and
valid examinations which could possibly provide previous achievement indices are non
existent in the Greek educational system until the final two years of the integrated
lyceum. Using the examination results at the end of the second year of lyceum as
previous achievement indices was something which had to be decided after balancing
the advantages and disadvantages of such a methodological step. Indeed it was shown
that students' mean grade at the end of the second year was a very good predictor for
students' achievement at the end of year 3 in every academic outcome. In simple
Ordinary Least Squares regression models the variable 'mean grade in year 2' explained
around 70 per cent of the variance in achievement in year 3. However, when mean
achievement in year 2 was regressed against students' background and process
variables, it was found that the variables which 'explained' achievement in year 3 also
explained achievement in year 2. In other words, academic achievement in the final two
years of lyceum cannot be completely separated because achievement in these two years
is likely to be understood as the result of the same school effect. When the aim of a
study is the measurement of the school effect, two measurement over one year period
may partial out the effect of schooling, as Preece (1989) has argued. Achievement in the
second year of lyceum would be best used by the current researcher as a controlling
variable in the case where the focus was on teacher effectiveness or the 'year effect'.
This however was not the focus of this thesis and would have been unacceptable to
many teachers in the Greek context.
Apart from this serious disadvantage, however, there were other - non statistical -
reasons for not including achievement in year 2 in the analysis. National examinations
in year 2 were conducted for the first time at the end of academic year 1998-1999 (June
1999). However, during academic year 1998 - 1999 a number of factors severely
distorted the normal flow of teaching and learning in Greek schools. Examinations in
1999 may have been procedurally valid but the distortion in teaching and learning
187

during 1998 -1999 was such that the Minister of Education gave 'optional' status to the
grades which were achieved in that examination. Specifically, the mean achievement in
year 2 was left out from the Equation 2.1, unless the mean achievement in year 2 was
higher than the mean achievement in year 3 (see Equation 2.1 in page 62 for the formula
of the calculation of the final grade in the certificate of integrated lyceum). In this way,
the Minister of Education tried to protect the students who did not do well in year 2, due
to factors beyond their control.
The lack of previous achievement indices in the current study was partially
compensated by the use of information on student social background. In the
questionnaires, students were asked a number of questions that investigated their socio
economic status. Such questions dealt with the size and the structure of the family, the
size and type of the house, parents occupation and educational level, whether there was
access to a computer at home, etc. One problem that emerged in measuring student
social background was that the National Statistical Service of Greece (NSSG) could not
provide information on social stratification in Greece. This was mainly for three
reasons. Firstly, the NSSG does not publish such statistics either in Greek or in any
other language; it only sends information on social stratification to other international
and European statistical agencies. Secondly, the categories on social stratification used
by the NSSG have not been reviewed since the late 1950s. However, from that decade
onwards a sea change has taken place in social stratification and people's professions.
Thirdly, a large but still unknown amount of economic activity in Greece takes place
'under the surface' and therefore a large percentage of the Greek workforce is still
unregistered in the social security system.
Because of the situation that was described III the previous paragraph, students'
outcomes could not be controlled for family earnings. In order to address the problem of
social stratification, the current researcher designed a number of cards with sets of
professions and another set of cards with educational degrees. The cards were printed in
the student questionnaire in white and dark grey. The students were initially asked to
chose which card best represented the occupation and educational level of their parents
and then to describe their parents' occupation and educational level in their own words.
The basis for the construction of the cards was sought in the literature of a country with
economic indices similar to Greek ones. That country was Ireland. Breen & Whelan
(1996) occupational stratification table in the book Social Mobility and Social Class in
188

Ireland (p. 21) was used as a basis for the construction of the occupational cards in the
student questionnaire. All the cards were tested in the pilot study.
4.3.4. ONE POPULATION - FOUR SAMPLES
The population of schools in the current study are lyceia in the prefecture of Attiki. The
prefecture of Attiki is the geographic area of the Greek capital city and includes two
major cities: Athens and Piraeus. The former is the capital of Greece and the latter is the
capital's port for the Saronic Gulf (Aegean Sea). These two cities with their suburbs
constitute what is known in Greece as 'periohi protevousis' (the 'area of the Greek
capital city') or most commonly 'lekanopedio Attikis' (the 'basin of Attiki'). Outside the
boundaries of the basin of Attiki - but in the boundaries of Attiki prefecture - the
popUlation density is significantly lower and a number of smaller satellite cities exist.
Small towns and picturesque villages also exist in the four islands of the Saronic Gulf:
Aegina, Poros, Hydra, and Spetses. From an administrational point of view, these four
islands are part of the prefecture of Attiki. According to the Data Processing
Department of the Greek Ministry of Education, there are 375 integrated lyceia in the
prefecture of Attiki. In the rows of Table 4.6 these 375 schools have been categorised
according to their relation with the state.
Information on other important school characteristics, apart from school type is not
available. This is because the database of the Data Processing Department of the
Ministry of Education only contains information at student level (i. e. examination
results for entering the tertiary level). Other databases, like for example, the database of
the Greek Pedagogical Institute, the database of the Centre for Educational Research,
and the database of the National Statistical Service of Greece were not commensurable
with the database of the Ministry of Education. Therefore, no further information was
available from official sources regarding the target population of schools. This
unfortunate situation is part of the problem that the current study tries to solve. As noted
in Chapter 2, OECD inspectors have highlighted the problem of lack of educational
statistics in Greece. As they have stressed, 'this state of affairs [the lack of reliable
statistics] represents a serious handicap to educational policy making' (OECD, 1997:
164). A number of contextual variables were later constructed by the current researcher
from information at student level.
189
Table 4.6. The population of integrated lyceia in Attiki and the population of the students who participated in the leaving examinations of the year 2000.
Type of school
State (public) integrated lyceia
Private integrated lyceia
Foreign private integrated lyceia
Religious private integrated lyceia
Total
Schools
count per cent
307 81.7
42 11.2
24 6.4
2 0.5
375 100
Students
count per cent
26,434 86.5
2,493 8.2
1,616 5.3
30 0.0
30,573 100 Note: The Ministry of Education makes sure that teachers in the private integrated lyceia use exactly the same textbooks with those in the state integrated lyceia. The Ministry has also set rules for the hiring and the working conditions of the teachers in the private sector.
As was presented in the two prevIOus paragraphs, basic information regarding the
population of the schools in Attiki prefecture was collected from the Data Processing
Department of the Greek Ministry of Education. However, because the information that
is compiled in the Ministry is exclusively used for students' certification and selection,
the current author designed his own data collection strategy in order to answer the
questions of the study. According to the research design, 39 schools were selected from
the basin of Attiki with stratified random sampling. The number of students of these 39
schools who participated in the examinations of the year 2000 was 3,380. This was
'Sample A' - the main sample of the study. In order to examine whether Sample A is
adequate, a review of the literature on sampling theory in settings with a multilevel
structure has been carried out.
The theory of sampling and sampling techniques is an important element in the
statistical theory and it can be found in many statistical texts, simple or advanced (for
example see Kental & Stuart, 1977). However, the sampling techniques have to be
reconsidered in the case where the data have a multilevel structure. When, for example,
the research requirements and logistics call for a sample of students in a sample of
schools, the prime question is about the optimal number of students and the optimal
number of schools in the sample.
The issues of sample size and statistical power in two-level analysis have been
discussed by Snijders & Bosker (1993). The authors (op. cit.) have argued that the
researcher should make a reasonable guess of the estimators of the fixed regression
190

coefficients (the variables at the lower and the higher level) and thus make a choice of
sample sizes at either level. Another author (Mok, 1995) considered a wider range of
estimators like coefficients, variances and covariances. According to her, for a given
sample size, research designs that use more schools and fewer students per school are
generally less biased and more efficient than other studies with fewer schools and more
students per school. Practical guidelines are also very useful for the researchers who
design their own multilevel study. Such guidelines are given by Afshartous (1995), who
claimed that for the estimation of the regression coefficients, the number of schools
should be at least 40. The same author has also argued (op. cit.) that in the case where
the focus of the study is not on the regression coefficients but on the estimation of the
variance components, the minimum number of schools in the sample should be 320.
From that point of view, the samples that were used in the current study are adequate.
Finally, for Cohen (1998), traditional sample designs are sufficient for estimating
regression coefficients in hierarchical linear models. The author has also stated (op. cit.)
that in the cases where it is important to estimate also the variance components, more
students per school and fewer schools are needed.
In the current study, financial and practical constraints made it impossible for the
researcher to collect background information from all the 3,380 students of Sample A.
Therefore, with the help of random numbers the researcher chose about 30 student from
each of the 39 schools of Sample A. The 1,224 selected students constituted Sample B.
The students of Sample B provided information about their background and answered to
questions asking for their opinion. However, the imperfect conditions for data collection
in some of the schools (e.g. teachers' interference) made the researcher to exclude the
opinions of the students in six of the 39 schools of Sample A. Thus the remaining 997
students who studied in 33 schools constituted Sample C. Finally, 223 teachers who
taught in the 38 schools of Sample A were asked about the organisational climate of
their school via a teacher questionnaire (due to circumstantial reasons, the teachers in
the 39th school did not complete the questionnaires). These teachers constituted Sample
D. Teachers of Sample D were purposely selected by the current researcher with the
help of a number of quality criteria. According to these criteria, teachers had (a) to teach
in the third grade, (b) not to regard themselves part of the unofficial administration team
of the schools, and (c) be neither new to the profession, nor near their retirement. A
more accurate sampling framework for the selection of teachers could not be
constructed. The schools in Greece are small and teachers know each other very well.
191

This feature affected both the procedures for the selection of the teachers and the
content of the questions in the teacher questionnaire. The samples of the current study
are presented in Table 4.7. Figure 4.2 is a simple map of Greece with the prefecture of
Attiki in grey. According to information that was provided by the Ministry of Education
(personal communication), 42% of the students who participated in the examinations of
June 2000 studied in the prefecture of Attiki.
Figure 4.2. Map of Greece with the prefecture of Attiki in grey.
192

Table 4.7. The ~o~ulation and the four sam~les of the studl:.
Name Level-one Level-two Collected information
375 inte- All the 30,573 Academic outcomes, a measure of prior
Population grated lyceia students of the achievement, basic contextual characteristics in the pre- 375 lyceia in the at school level, and basic student background fecture of prefecture of information (gender, year of birth, and Attiki Attiki programme of studies)
Sample A 39 state inte- All the 3,382 All the above plus information on school grated lyceia students of the processes derived from Sample D in Athens 39 schools
A random sam- All the above plus more detailed information
Sample B The same as pIe of 1,225 stu- on students' backgrounds (like socio-Sample A dents (subset of economic status)
Sample A)
Sample C 33 lyceia (a A random sam- All the above plus social outcomes, affective subset of pIe of 997 stu- outcomes and more school processes derived Sample A) dents (subset of from student questionnaires (five Factors)
Sample A)
Sample D 38lyceia A purposive School organisational climate and school from the 39 sample of 223 processes that derived from a teacher ques-of Sample A teachers tionnaire (four Factors)
Before proceeding to the analysis, the current researcher had to make sure that the
students in Sample A and the subsequent Samples B, C, and D are representative of the
population of students. This will be discussed in the remaining part of Section 4.3.4.
However, with regards to the organisational characteristics of the schools, Samples A,
B, C, and D do not represent the integrated lyceia in the prefecture of Attiki. This is
because only state schools were included in Sample A. Some organisational
characteristics of the schools in Attiki (e.g. their size and type) became known after the
study. An the beginning of the study, the Greek Ministry of Education could only
provide a simple catalogue for state schools in the prefecture of Attiki. In this catalogue
no information was available for private schools. Thus, all the schools of Sample A are
state integrated lyceia in the 'so-called basin of Attiki' (the greater area of Athens,
Piraeus, and their suburbs). Consequently, it is right to state that inferences based on
Sample A cannot be made for private schools and schools outside the basin of Attiki.
However, student-level information is available for all schools in the population and
193
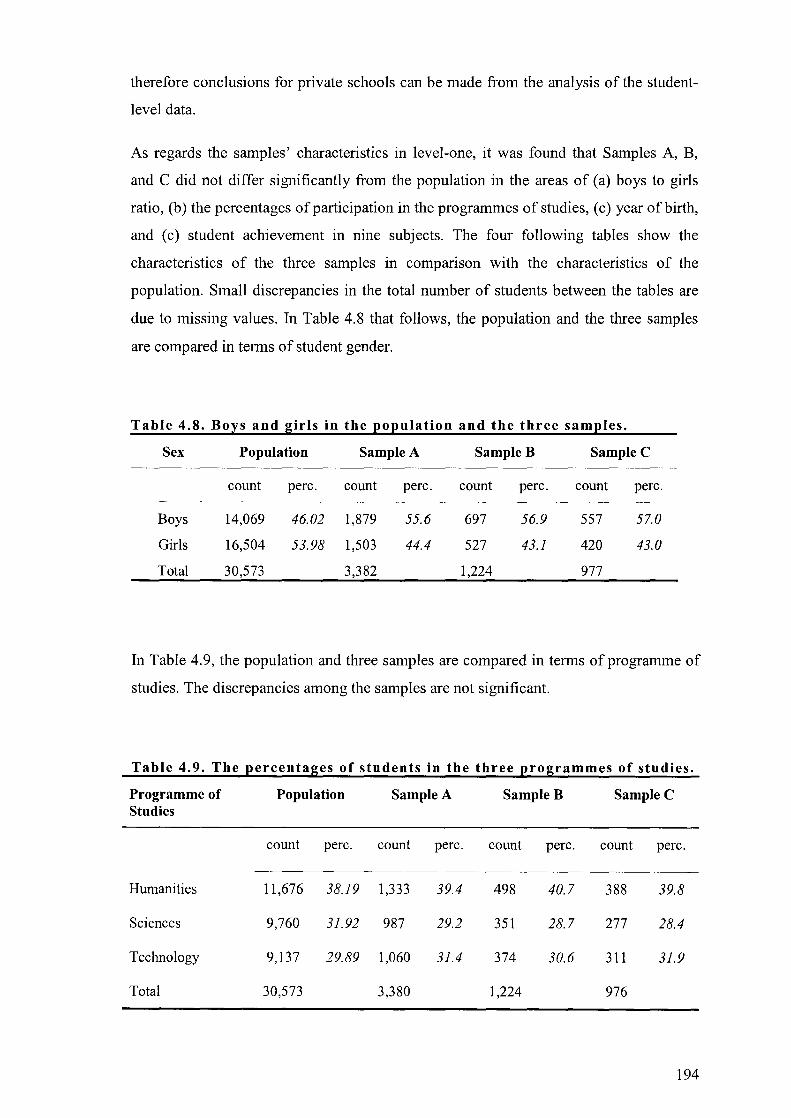
therefore conclusions for private schools can be made from the analysis of the student
level data.
As regards the samples' characteristics in level-one, it was found that Samples A, B,
and C did not differ significantly from the population in the areas of (a) boys to girls
ratio, (b) the percentages of participation in the programmes of studies, (c) year of birth,
and (c) student achievement in nine subjects. The four following tables show the
characteristics of the three samples in comparison with the characteristics of the
population. Small discrepancies in the total number of students between the tables are
due to missing values. In Table 4.8 that follows, the population and the three samples
are compared in terms of student gender.
Table 4.8. Boys and girls in the population and the three samples.
Sex Population Sample A Sample B Sample C
count perc. count perc. count perc. count perc.
Boys 14,069 46.02 1,879 55.6 697 56.9 557 57.0
Girls 16,504 53.98 1,503 44.4 527 43.1 420 43.0
Total 30,573 3,382 1,224 977
In Table 4.9, the population and three samples are compared in terms of programme of
studies. The discrepancies among the samples are not significant.
Table 4.9. The percentages of students in the three programmes of studies.
Programme of Population Sample A SampleB Sample C Studies
count perc. count perc. count perc. count perc.
Humanities 11,676 38.19 1,333 39.4 498 40.7 388 39.8
Sciences 9,760 31.92 987 29.2 351 28.7 277 28.4
Technology 9,137 29.89 1,060 31.4 374 30.6 311 31.9
Total 30,573 3,380 1,224 976
194
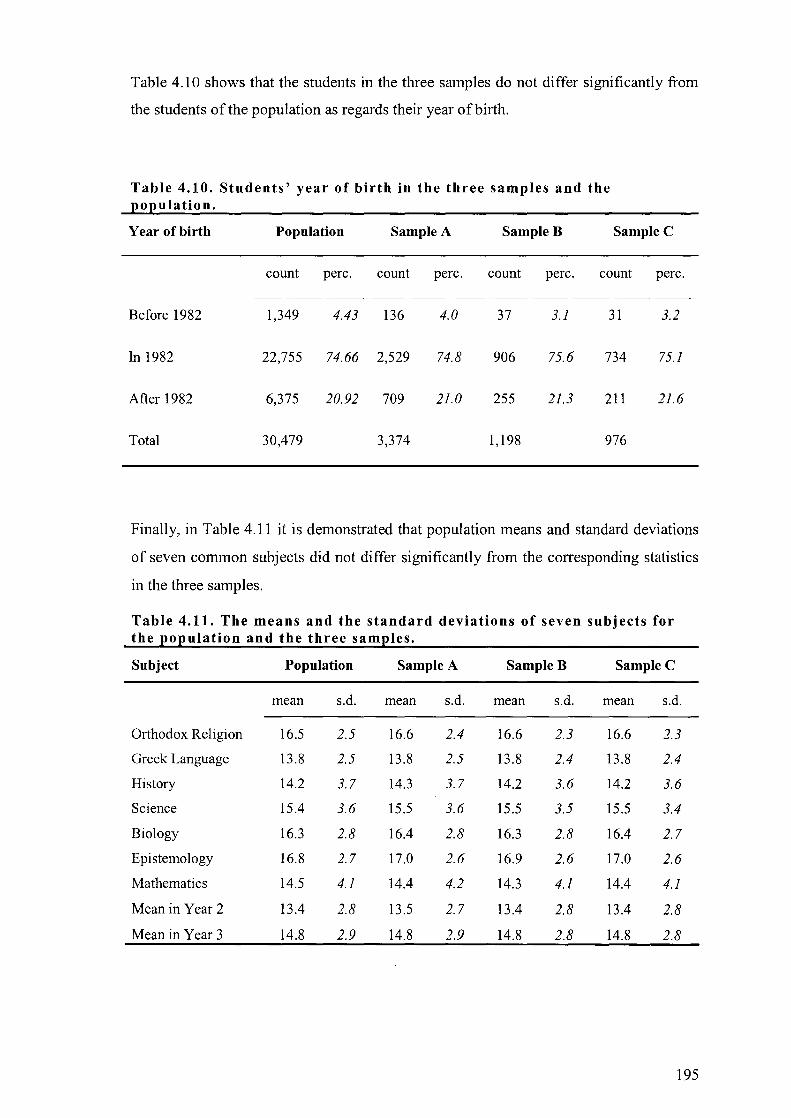
Table 4.10 shows that the students in the three samples do not differ significantly from
the students of the population as regards their year of birth.
Table 4.10. Students' year of birth in the three samples and the ~o~ulation.
Year of birth Population Sample A Sample B Sample C
count perc. count perc. count perc. count perc.
Before 1982 1,349 4.43 136 4.0 37 3.1 31 3.2
In 1982 22,755 74.66 2,529 74.8 906 75.6 734 75.1
After 1982 6,375 20.92 709 21.0 255 21.3 211 21.6
Total 30,479 3,374 1,198 976
Finally, in Table 4.11 it is demonstrated that population means and standard deviations
of seven common subjects did not differ significantly from the corresponding statistics
in the three samples.
Table 4.11. The means and the standard deviations of seven subjects for the ~o~ulation and the three sam~les.
Subject Population Sample A Sample B Sample C
mean s.d. mean s.d. mean s.d. mean s.d.
Orthodox Religion 16.5 2.5 16.6 2.4 16.6 2.3 16.6 2.3
Greek Language 13.8 2.5 13.8 2.5 13.8 2.4 13.8 2.4
History 14.2 3.7 14.3 3.7 14.2 3.6 14.2 3.6
Science 15.4 3.6 15.5 3.6 15.5 3.5 15.5 3.4
Biology 16.3 2.8 16.4 2.8 16.3 2.8 16.4 2.7
Epistemology 16.8 2.7 17.0 2.6 16.9 2.6 17.0 2.6
Mathematics 14.5 4.1 14.4 4.2 14.3 4.1 14.4 4.1
Mean in Year 2 13.4 2.8 13.5 2.7 13.4 2.8 13.4 2.8
Mean in Year 3 14.8 2.9 14.8 2.9 14.8 2.8 14.8 2.8
195
4.3.5. THE INTERPRETATION OF ACADEMIC OUTCOMES
The decision on the most appropriate academic outcomes is a crucially important
element of every school effectiveness study. As Hill (1996) has argued, the choice of
outcome measures has major implications for the conclusions that one might draw
regarding the impact of student-, class- and school-level effects. A basic distinction
between two possible types of academic school outcomes in school effectiveness studies
has been made by Scheerens & Bosker (1997). The authors (op. cit.) distinquish
between measures of academic achievement and measures of academic attainment. As
they write:
Attainment measures are close to the economic notion of effectiveness as maximisation of outputs, where output is measured as the amount of product resulting from a particular production process. ( ... ) Achievement, in contrast, fits more neatly into an interpretation of effectiveness in terms of 'quality'. Achievement tests as effectiveness criteria capitalise on more fine-grained quality differences of the units of outputs (Scheerens & Bosker, 1997: 51).
The current study uses both measures: achievement and attainment. The former is
students' normalised grades in the nationally examined subjects presented in Table 2.13
(p. 26). The latter is students' success in the certificate of integrated lyceum. Two issues
must be discussed here in relation to students' academic achievement: (a) the degree to
which the measures of academic achievement are close to what is being taught in the
classrooms and (b) the degree to which academic achievement plays an important role
to the life of the students (is of 'high stakes' for them). Both issues that were described
above, affect the nature of a school effectiveness study.
The degree to which the measures of academic achievement are close to what is being
taught in the classrooms has been discussed by Scheerens & Bosker (1997). The authors
present a list with possible measures of academic achievement for investigating
educational effectiveness. Scheerens & Bosker (1997) discern the following outcome
measures:
• • •
•
•
authentic assessment by trained teachers,
trained test items,
content specific measures,
Rasch scales of narrow content areas,
subject-specific tests,
196
• general scholastic aptitude tests,
• intelligence tests.
The authors (op. cit.) do not show any preference to any of the measures that are
presented above but state that the list should be seen as a 'continuum with many discrete
scale points rather than a dichotomous choice between two extremes' (p. 53). In the
current study, student results in curriculum specific tests at the end of integrated lyceum
were used as measures of academic achievement. This was the only possible solution as
no other reliable measures of academic achievement (with the exception of the results of
the PISA 2000 study) have ever existed in Greece. In the literature of school
effectiveness research, most researchers have used general tests of academic
achievement. However, in a number of British and Scottish studies subject-specific
examination results (GCSEs and standard grade scores) have been used as measures of
academic achievement (Sammons et al., 1996; Thomas et al., 1995a; Thomas et aI.,
1995b; Thomas et al., 1997a; Tymms, 1993). From a theoretical point of view, Madaus
et al. (1979) maintain that curriculum-specific tests are most appropriate when the aim
of the study is the maximisation of the school- or classroom-effect.
As regards the issue of using students' examination results for measuring the quality of
the educational system, Kellaghan (1996) asks whether public examinations can be used
to provide information for national assessment. According to the same author (op. cit.),
the answer is negative. As he writes (op. cit.: 46), 'I think that the clear answer to that
question must be no. I do not know of any existing public examination system that
meets all the objectives of national assessment systems'. The issue of using examination
results for testing the quality of the system will be discussed in detail in the sixth
chapter of the current thesis. In conclusion, the academic outcomes in the current study
are of two types: continuous and categorical. For the analysis of the continuous
outcomes students' grades in the examinations of June 2000 were normalised (see next
section). For the analysis of the categorical outcomes, a dichotomous variable (success -
failure) was created.
4.3.6. TRANSFORMATION OF THE ORIGINAL EXAMINATION SCORES
The statistical procedures for the analysis of a continuous variable - in our case the
examination results - are based on certain statistical assumptions. One of them is that
the distributions of students' grades do not deviate significantly from the normal
197

distribution. However, this does not seem to be the case for the public examinations in
the year 2000 in Greece because most distributions of students' grades had negative
skewness and kurtosis. Skewness is a measure of the symmetry of distribution. When a
distribution is negatively skewed, the higher scores are more frequent than they should
be. The normal distribution has skewness equal to zero. The concept of kurtosis is
linked to the relative 'thickness' of the tails of distributions. The normal distribution has
zero kurtosis. Negative values of kurtosis indicate that the distribution is platykurtic i.e.
that its tails are thicker that they should be. In the current study, 94% of students
succeeded in taking lyceum certificate. The minimum achieved grade was 7.00 and the
maximum 19.90. The mean of the distribution was 14.78 with a standard deviation of
28.72. The values of skewness and kurtosis were -0.188 and -0.772 respectively.
The asymmetry of the distributions of students' grades can be explained with statistical
and non-statistical terms. Statistically, a distribution is often clustered when there is an
upper and a lower limit in the scale. In the Greek lyceum certificate, the scale has a
theoretical range of 200 points (0 to 20 with one decimal point). The baseline for
success is 9.50. As it was stated in the previous paragraph, the smaller score in the raw
data was 7.00. Another explanation for the shape of the distributions can be found in the
psychometric characteristics of the test items that were selected. Tests composed from
easy items or relatively few items, produce negatively skewed distributions (Hambleton
& Swaminathan, 1985). It seems that the people responsible for the implementation of
the new examination system in Greece, constructed short tests that comprised relatively
easy items. Most probably, the members of the examinations committee did not want
the new examination system to be seen by students and parents as the juggernaut of
educational failure. In the case that many students failed, it would not only be the
examination system that would meet strong public opposition; the entire educational
policy of the socialist government would be in jeopardy. In the current researcher's
opinion, the psychometric characteristics of the test items were the main reason for the
'overproduction' of high achievers in lyceum certificate. The large number of students
who achieved very good grades in the tests, reduced the discriminative power of the
examinations. In some cases, the grades of the students that targeted university
departments of high status were so close to each other that one tenth of a grade
practically decided who would succeed and who would be left out. An extreme example
for the 'overproduction' of high achievers in the examinations of the year 2000 is the
198
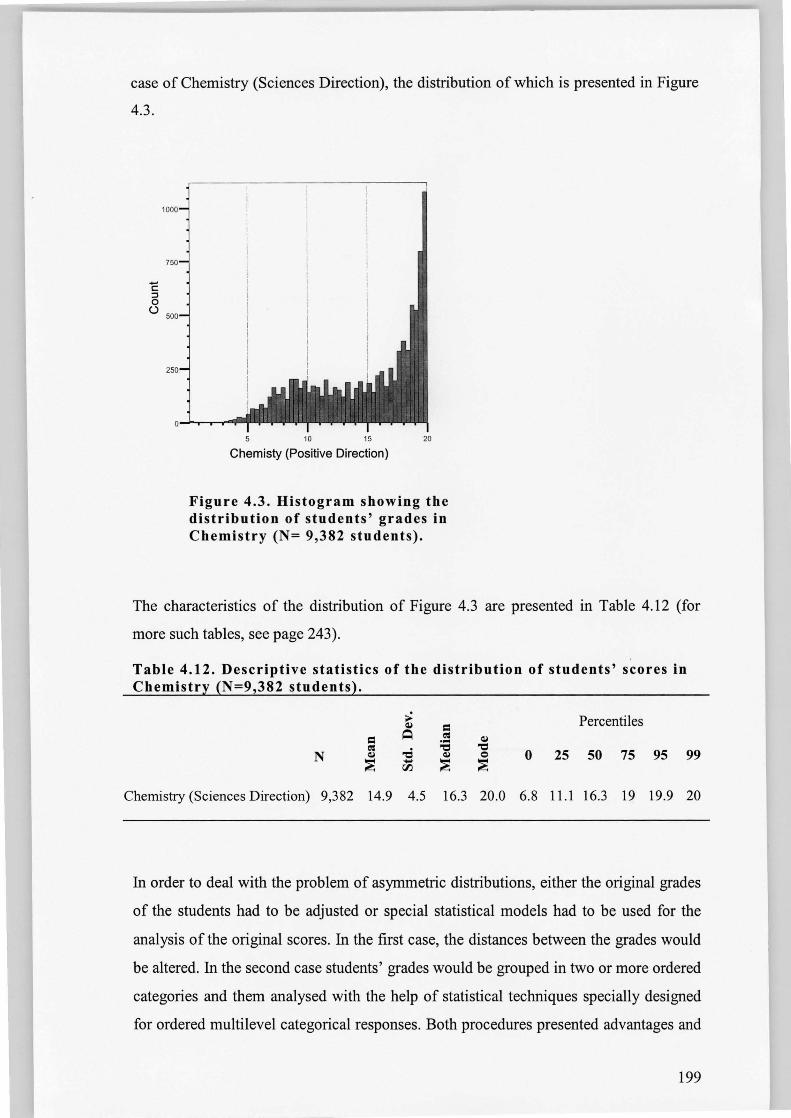
case of Chemistry (Sciences Direction), the distribution of which is presented in Figure
4.3 .
-C ::I o o
250
10 15 20
Chemisty (Positive Direction)
Figure 4.3. Histogram showing the distribntion of students' grades in Chemistry (N= 9,382 stndents).
The characteristics of the distribution of Figure 4.3 are presented in Table 4.12 (for
more such tables, see page 243).
Table 4.12. Descriptive statistics of the distribution of students' scores in Chemistry (N=9,382 students).
,; Percentiles ~ ==
== ~ to: ~ .-to: -d 'e 'e
0 25 50 95 N ~ ~ 0 75 ~ - ~ ~ 00
Chemistry (Sciences Direction) 9,382 14.9 4.5 16.3 20.0 6.8 11.1 16.3 19 19.9
99
20
In order to deal with the problem of asymmetric distributions, either the original grades
of the students had to be adjusted or special statistical models had to be used for the
analysis of the original scores. In the first case, the distances between the grades would
be altered. In the second case students' grades would be grouped in two or more ordered
categories and them analysed with the help of statistical techniques specially designed
for ordered multilevel categorical responses. Both procedures presented advantages and
199
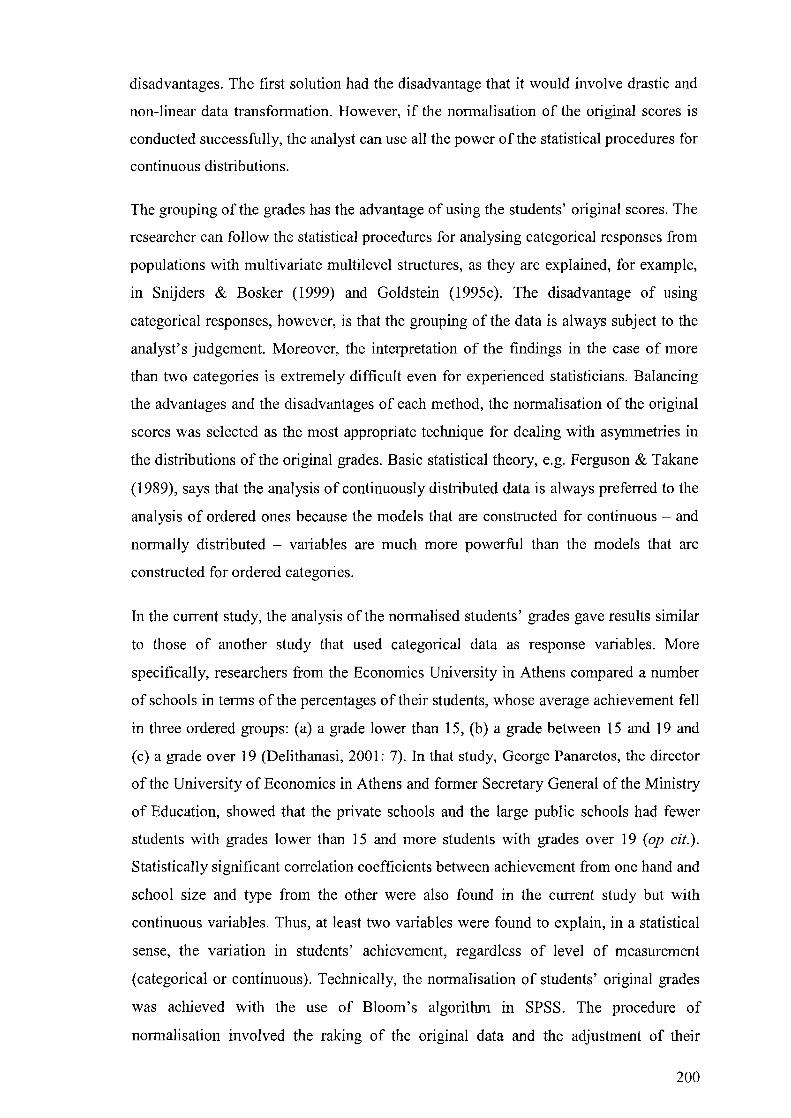
disadvantages. The first solution had the disadvantage that it would involve drastic and
non-linear data transformation. However, if the normalisation of the original scores is
conducted successfully, the analyst can use all the power of the statistical procedures for
continuous distributions.
The grouping of the grades has the advantage of using the students' original scores. The
researcher can follow the statistical procedures for analysing categorical responses from
populations with multivariate multilevel structures, as they are explained, for example,
in Snijders & Bosker (1999) and Goldstein (1995c). The disadvantage of using
categorical responses, however, is that the grouping of the data is always subject to the
analyst's judgement. Moreover, the interpretation of the findings in the case of more
than two categories is extremely difficult even for experienced statisticians. Balancing
the advantages and the disadvantages of each method, the normalisation of the original
scores was selected as the most appropriate technique for dealing with asymmetries in
the distributions of the original grades. Basic statistical theory, e.g. Ferguson & Takane
(1989), says that the analysis of continuously distributed data is always preferred to the
analysis of ordered ones because the models that are constructed for continuous - and
normally distributed - variables are much more powerful than the models that are
constructed for ordered categories.
In the current study, the analysis of the normalised students' grades gave results similar
to those of another study that used categorical data as response variables. More
specifically, researchers from the Economics University in Athens compared a number
of schools in terms of the percentages of their students, whose average achievement fell
in three ordered groups: (a) a grade lower than 15, (b) a grade between 15 and 19 and
(c) a grade over 19 (Delithanasi, 200 1: 7). In that study, George Panaretos, the director
of the University of Economics in Athens and former Secretary General of the Ministry
of Education, showed that the private schools and the large public schools had fewer
students with grades lower than 15 and more students with grades over 19 (op cit.).
Statistically significant correlation coefficients between achievement from one hand and
school size and type from the other were also found in the current study but with
continuous variables. Thus, at least two variables were found to explain, in a statistical
sense, the variation in students' achievement, regardless of level of measurement
(categorical or continuous). Technically, the normalisation of students' original grades
was achieved with the use of Bloom's algorithm in SPSS. The procedure of
normalisation involved the raking of the original data and the adjustment of their
200

relative distance so as the raw scores to correspond with the points of the standard
normal distribution. Students whose scores were regarded as zeros or missing values
were not included in the procedure of normalisation.
Analyses of the type of those that were presented in the two previous paragraphs have
been published in Greek newspapers. So interested are the Greek people about the
quality of education that articles about 'good' and 'bad' schools are always given high
priority in the press. On 11 of July 2001, a Greek quality newspaper To Virna published
a report based on current researcher's multilevel analysis, which focused on the
variables that affected students' grades in the examinations of the year 2000. On 25 of
July 2001 most Greek newspapers published reports based on the work of George
Panaretos at the University of Economics. The tittles of the newspapers were about 'the
best 40 lyceia in the country'. A newspaper, Apogevmatini, chose 'the best 40 lyceia' as
its main story on the front page.
4.3.7. THE MEANING OF AFFECTIVE OUTCOMES AND SCHOOL PROCESSES
4.3.7.1. Methodology and research instruments
In order to investigate the impact of school processes on the academic and social
outcomes of the schools, a number of statistical entities (Factors) were constructed with
the help of a procedure known as Exploratory Factor Analysis (EF A). In the current
study, the Factors were linear combinations of students' and teachers' responses to a
number of directly posed questions. Two questionnaires were used for collecting
people's responses: one for the teachers and one for the students. The bases for the
construction of the questionnaires were (a) the literature on the school climate and the
social environment of the school and (b) the findings of the pilot work that was
conducted by the current author during 1998 - 1999. The literature on school climate
has already been reviewed in the previous chapter (Section 3.7.1). As regards the pilot
work during 1998 - 1999, Factor Analysis identified Factors similar to the Factors of
the main study (see Table 4.15 and also Appendix in page 353). The left column of
Table 4.13 contains a number of areas associated with students' views in the main
study. The right column presents the corresponding questions with their numbering.
201
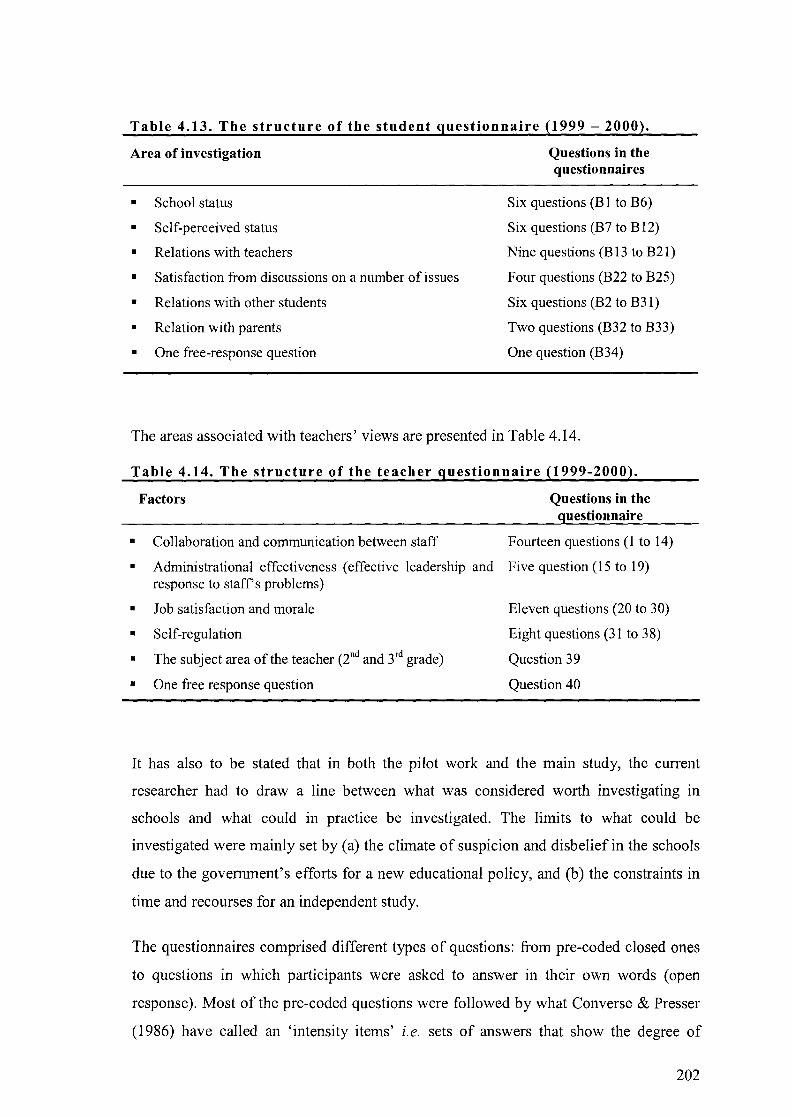
Table 4.13. The structure of the student questionnaire (1999 - 2000).
Area of investigation
• School status
• Self-perceived status
• Relations with teachers
• Satisfaction from discussions on a number of issues
• Relations with other students
• Relation with parents
• One free-response question
Questions in the questionnaires
Six questions (B 1 to B6)
Six questions (B7 to B 12)
Nine questions (B 13 to B21)
Four questions (B22 to B25)
Six questions (B2 to B31)
Two questions (B32 to B33)
One question (B34)
The areas associated with teachers' views are presented in Table 4.14.
Table 4.14. The structure of the teacher questionnaire (1999-2000).
Factors Questions in the questionnaire
• Collaboration and communication between staff Fourteen questions (1 to 14)
• Administrational effectiveness (effective leadership and Five question (15 to 19) response to staffs problems)
• Job satisfaction and morale
• Self-regulation
• The subject area of the teacher (2nd and 3rd grade)
• One free response question
Eleven questions (20 to 30)
Eight questions (31 to 38)
Question 39
Question 40
It has also to be stated that in both the pilot work and the main study, the current
researcher had to draw a line between what was considered worth investigating in
schools and what could in practice be investigated. The limits to what could be
investigated were mainly set by (a) the climate of suspicion and disbelief in the schools
due to the government's efforts for a new educational policy, and (b) the constraints in
time and recourses for an independent study.
The questionnaires comprised different types of questions: from pre-coded closed ones
to questions in which participants were asked to answer in their own words (open
response). Most of the pre-coded questions were followed by what Converse & Presser
(1986) have called an 'intensity items' i.e. sets of answers that show the degree of
202
agreement or disagreement with a statement. In the current study, the items were fixed
answers (categories) that followed two directions. The categories were constructed so
that the respondents who occupied a position (i.e. followed one direction) could be
separated from those who only leaned towards it. In students' and teachers'
questionnaires the intensity items were composed of four and in some case six ordered
and mutually exclusive categories. There was no middle or 'neutral' category and
because of that, there was a notional gap between the two directions of each item. In the
student questionnaire, the gap was materialised with the wording of the categories (for
example, a direction of 'agree' and a direction for 'disagree'). In the teacher
questionnaire there was also a thin wavy line printed between the two directions. The
lack of middle category is being discussed in the following paragraph. The
questionnaires and their translation in English are presented in the Appendix (page 359).
The lack of the middle category in questionnaire items has been an issue of concern
among many researchers. On the one hand are those who oppose the use of middle
category. Converse & Presser (1986), for example, advise the social researchers not to
provide a middle category, if they do not want to lose information. On the other hand,
there are those who support the use of a middle or 'neutral' category. Foddy (1993), for
example, warns that when no middle category is present, the answers can be biased, as
in that case the neutral or ambivalent respondents are equated with those who hold a
substantive answer but indicate that they do not hold it very strongly. The most
important reason for not offering a middle category to the respondents of the current
study was that the questionnaires were asking information that was relatively simple.
Therefore, problems associated with the evaluation of hypothetical situations or the
recalling of information in long-term memory were expected to be minimal. Moreover,
the questions in the questionnaires were clearly defined and relevant to respondents.
The use of words that were likely to invoke stereotypical reactions or misunderstandings
was avoided. The teachers and the students were able to provide basic information about
their everyday life in schools and, as demonstrated in the pilot work, not many
ambivalent responders were found. In terms of statistical analysis, items with even
numbers of ordered categories can easily split into two directions and analysed with
statistical techniques appropriate for dichotomous distributions.
203
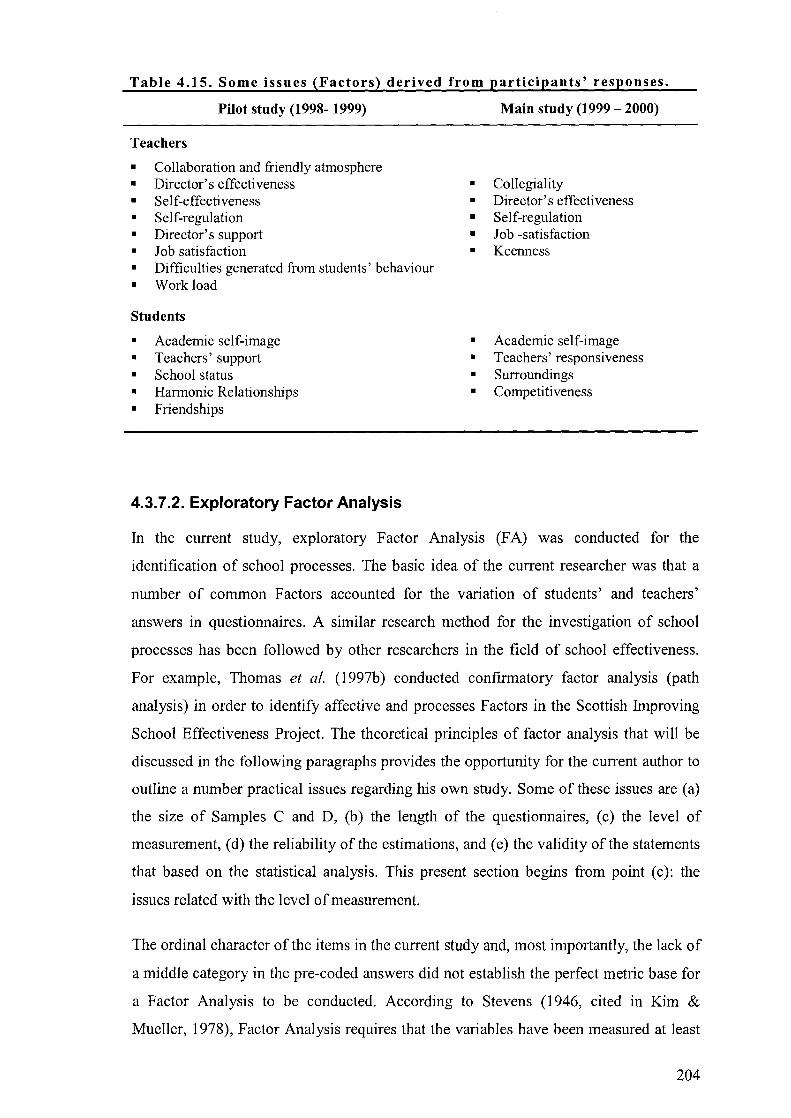
Table 4.15. Some issues (Factors) derived from participants' responses.
Pilot study (1998- 1999) Main study (1999 - 2000)
Teachers
• Collaboration and friendly atmosphere • Director's effectiveness • Collegiality • Self-effectiveness • Director's effectiveness • Self-regulation • Self-regulation • Director's support • Job -satisfaction • Job satisfaction • Keenness • Difficulties generated from students' behaviour • Work load
Students
• Academic self-image • Academic self-image • Teachers' support • Teachers' responsiveness • School status • Surroundings • Harmonic Relationships • Competitiveness • Friendships
4.3.7.2. Exploratory Factor Analysis
In the current study, exploratory Factor Analysis (FA) was conducted for the
identification of school processes. The basic idea of the current researcher was that a
number of common Factors accounted for the variation of students' and teachers'
answers in questionnaires. A similar research method for the investigation of school
processes has been followed by other researchers in the field of school effectiveness.
For example, Thomas et al. (1997b) conducted confirmatory factor analysis (path
analysis) in order to identify affective and processes Factors in the Scottish Improving
School Effectiveness Project. The theoretical principles of factor analysis that will be
discussed in the following paragraphs provides the opportunity for the current author to
outline a number practical issues regarding his own study. Some of these issues are (a)
the size of Samples C and D, (b) the length of the questionnaires, (c) the level of
measurement, (d) the reliability of the estimations, and ( e) the validity of the statements
that based on the statistical analysis. This present section begins from point (c): the
issues related with the level of measurement.
The ordinal character of the items in the current study and, most importantly, the lack of
a middle category in the pre-coded answers did not establish the perfect metric base for
a Factor Analysis to be conducted. According to Stevens (1946, cited in Kim &
Mueller, 1978), Factor Analysis requires that the variables have been measured at least
204

at the interval level. However, Kim & Mueller (1978) have shown that many ordinal
variables may be given numeric values without distorting the underlying properties of
Factor Analysis. The same author also states, that 'there are some encouraging
comments about the use of Factor Analysis as a heuristic device even under severe
measurement distortions' (op. cit.: 75). In theory, the degree of distortion in the metric
base of Factor Analysis that is caused either by ordinal responses or of hidden
dichotomies in the items decreases, as the number of categories in the items increases. A
decrement of the degree of distortion is also expected in the case that the underlying
correlations among the variables are of a moderate level (op. cit.). For the needs of the
current study, it has to be shown that the directional character of the items does not
distort the properties of Factor Analysis. It is encouraging therefore, that the school
process Factors that emerged from the analysis were plausible and consistent both with
the theory and with the findings of the pilot work. In all probability, the directional
character of the items may have distorted but not destroyed the metric base of factor
analysis in the current study. The Factors that were extracted in the pilot and the main
study will be presented in the following paragraphs.
4.3.7.3. The rotated factor analytic solution
In the pilot study, the Factors were extracted with the method of Principal Components
and rotated with the method of Varimax. The meaning of Factors' extraction and
rotation will be explained in the next section. The names of the Factors of the pilot work
can be seen in the Appendix (page 353). The 11 student Factors are: (a) academic self
image, (b) teachers support, (c) school status, (d) home behaviour, (e) parents caring, (f)
harmonic relationships with others, (g) easiness of work at school and home, (h) self
efficacy (perceived), (i) friendships. There were also two unidentified Factors i.e.
Factors not easy to name. The analysis of the teacher questionnaire resulted in the
following 10 Factors: (a) friendly atmosphere and collaboration (b) perceived directors'
effectiveness, (c) perceived self-effectiveness, (d) self-regulation, (e) director's support,
(f) job satisfaction, (g) behavioural difficulties, (h) easiness of work. Another two
Factors that were extracted remained unidentified. The findings of the pilot study were
presented in a conference held at the University of Patra (Greece) and published in a
book about educational evaluation (Bagakis, 2001).
In the main study, nine Factors were identified: four from students' questionnaires and
five from teachers' questionnaires. The method that was followed for the extraction of
205
the Factors was the generalised least squares. The method for the rotation ofthe Factors
was the direct oblimin. Both of these methods will be explained in the next section. The
names of the four student factors are (a) 'teacher responsiveness', (b) 'surroundings', (c)
'academic self-image', and (d) 'rivalry'. The names of the five teacher Factors are (a)
'directors' effectiveness', (b) 'self-regulation', (c) 'collegiality', (d) 'job satisfaction',
and (e) 'keenness'. The description of the Factors and their loadings are presented in
Table 4.16 and Table 4.18.
The Factors that were extracted in the main study may be considered to tap very
important issues in every education system. However, one must not forget that Factors
are purely statistical entities and therefore their construct validity can only
probabilistically be verified. The research instruments (questionnaires) that were used in
the current study should be considered only as case of a larger and undocumented
universe of similar research instruments. According to Kim & Mueller (1978), the
observable variables in a factor analytic design are in fact a subset of a potentially larger
domain of relevant variables. It must be noted that the current study did not aim at the
construction of a generic research tool for investigating school processes in different
educational contexts. The readers of the current work can find many such research
instruments in the book School Climate that has been edited by Freiberg (1999). The
interpretation of the Factors that are presented in the current study must be made in the
light of the literature that has been reviewed and the items that have statistically been
associated with each Factor. The meaning of the Factors may be different in the context
of different educational systems.
The left column of Table 4.16 and Table 4.18 presents descriptions of the questions in
student and teacher questionnaire respectively. The capital letters before the
descriptions indicate the specific part of the questionnaire from which the questions
have been taken. The numbers in the rows indicate the position of the question in the
questionnaires. Thus, 'B_8' indicates the eighth question in part B of a questionnaire.
The capital 'R' beside the number of some of the questions indicate that the direction of
the intensity item for these specific questions had originally had the positive category
coded '1' and the negative category coded '4'. Normally, the categories that described
the best educational practice were coded '4' and were printed on the right side of the
questionnaire. By haphazardly changing this pattern, the current researcher tried to
reduce the possibility of some students answering carelessly without, paying much
206
attention to the content of the questions. Later, all the items were re-coded in the same
direction i. e. '1' for the negative practice and' 4' for the positive practice.
The Greek symbol alpha Ca') in the right column of Table 4.16 and Table 4.18
represents the reliability coefficient of the corresponding scales for each Factor.
Nunnally (1978, in Kline, 1994b) describes the reliability coefficient as 'the average
correlation of one test, or one item, with all the tests or items in the universe' (p. 34). In
the current study, Cronbach's alpha reliability coefficient was used for evaluating the
internal reliability of the items. As a measure of internal reliability, Cronbach's alpha
assumes that there is a true score causing the variance in a set of items. It also assumes
that the items are caused by one, and only one, underlying construct and that each item
measures the underlying construct equally. Thus, the degree to which the items are
correlated is the variance of the true score. The formula for Cronbach's alpha is
presented in the Appendix (p. 355). With the exemption of the Factor 'rivalry between
students', all the other scales have medium to high values for the alpha coefficient.
207
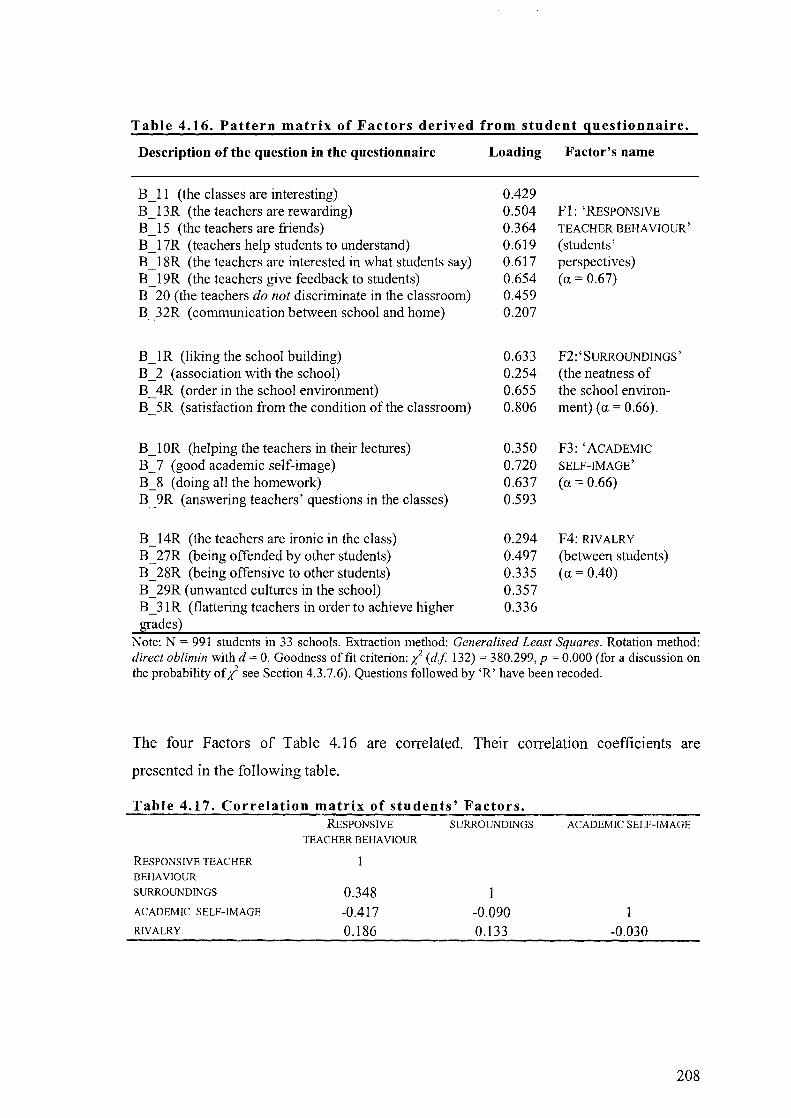
Table 4.16. Pattern matrix of Factors derived from student questionnaire.
Description of the question in the questionnaire
B _11 (the classes are interesting) B_13R (the teachers are rewarding) B_15 (the teachers are friends) B _17R (teachers help students to understand) B _18R (the teachers are interested in what students say) B_19R (the teachers give feedback to students) B _20 (the teachers do not discriminate in the classroom) B 32R (communication between school and home)
B_1 R (liking the school building) B_2 (association with the school) B 4R (order in the school environment) B 5R (satisfaction from the condition of the classroom)
B _lOR (helping the teachers in their lectures) B _7 (good academic self-image) B _ 8 (doing all the homework) B _9R (answering teachers' questions in the classes)
B_14R (the teachers are ironic in the class) B_27R (being offended by other students) B_28R (being offensive to other students) B _ 29R (unwanted cultures in the school) B_3 1 R (flattering teachers in order to achieve higher grades)
Loading
0.429 0.504 0.364 0.619 0.617 0.654 0.459 0.207
0.633 0.254 0.655 0.806
0.350 0.720 0.637 0.593
0.294 0.497 0.335 0.357 0.336
Factor's name
Fl: 'RESPONSIVE TEACHER BEHAVIOUR' (students' perspecti ves ) (a = 0.67)
F2:'SURROUNDINGS' (the neatness of the school environ-ment) (a = 0.66).
F3: 'ACADEMIC SELF-IMAGE' (a = 0.66)
F4: RIVALRY (between students) (a=0.40)
Note: N = 991 students in 33 schools. Extraction method: Generalised Least Squares. Rotation method: direct oblimin with d = O. Goodness of fit criterion: l (df 132) = 380.299, p = 0.000 (for a discussion on the probability of l see Section 4.3.7.6). Questions followed by 'R' have been recoded.
The four Factors of Table 4.16 are correlated. Their correlation coefficients are
presented in the following table.
Table 4.17. Correlation matrix of students' Factors. RESPONSIVE SURROUNDINGS ACADEMIC SELF-IMAGE
TEACHER BEHAVIOUR
RESPONSIVE TEACHER
BEHAVIOUR
SURROUNDINGS 0.348 ACADEMIC SELF-IMAGE -0.417 -0.090 1 RIVALRY 0.186 0.133 -0.030
208
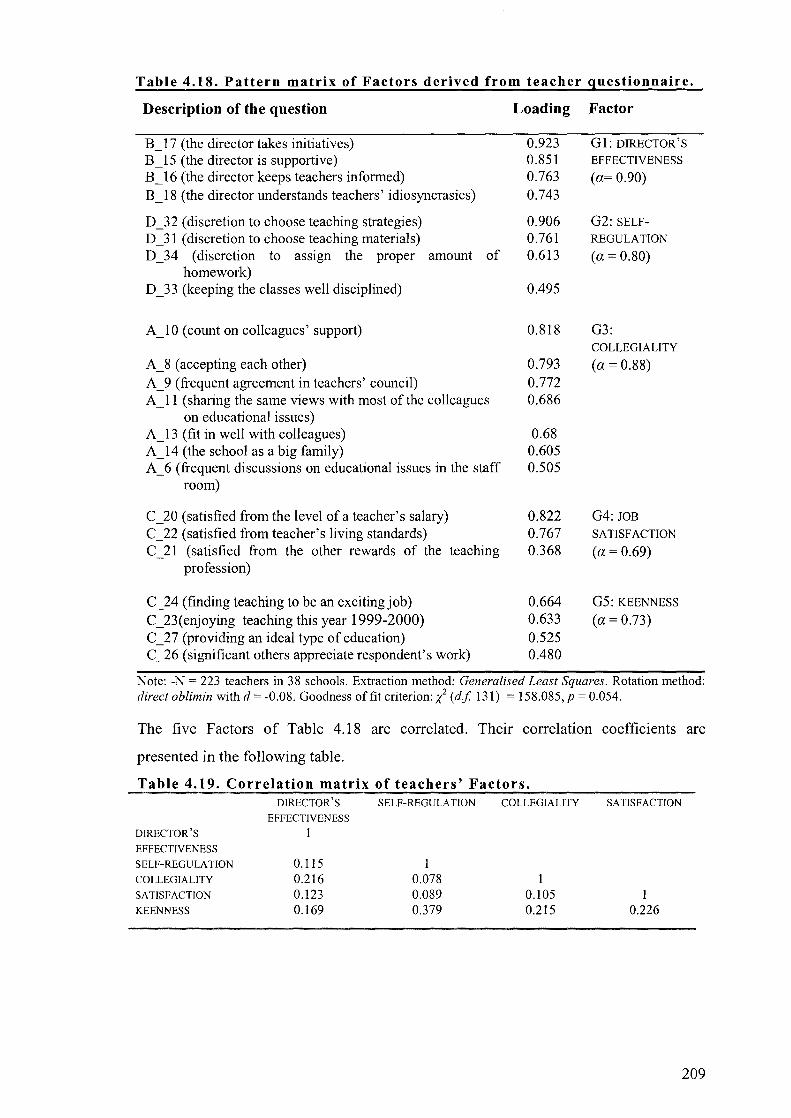
Table 4.18. Pattern matrix of Factors derived from teacher questionnaire.
Description of the question
B_17 (the director takes initiatives) B _15 (the director is supportive) B_16 (the director keeps teachers infonned) B_18 (the director understands teachers' idiosyncrasies)
D _32 (discretion to choose teaching strategies) D _31 (discretion to choose teaching materials) D_34 (discretion to assign the proper amount of
homework) D _33 (keeping the classes well disciplined)
A_I0 (count on colleagues' support)
A_8 (accepting each other) A_9 (frequent agreement in teachers' council) A_II (sharing the same views with most of the colleagues
on educational issues) A_13 (fit in well with colleagues) A_14 (the school as a big family) A_6 (frequent discussions on educational issues in the staff
room)
C_20 (satisfied from the level of a teacher's salary) C_22 (satisfied from teacher's living standards) C _ 21 (satisfied from the other rewards of the teaching
profession)
C_24 (finding teaching to be an exciting job) C_23(enjoying teaching this year 1999-2000) C_27 (providing an ideal type of education) C _26 (significant others appreciate respondent's work)
Loading
0.923 0.851 0.763 0.743
0.906 0.761 0.613
0.495
0.818
0.793 0.772 0.686
0.68 0.605 0.505
0.822 0.767 0.368
0.664 0.633 0.525 0.480
Factor
G 1: DIRECTOR'S
EFFECTIVENESS
(a= 0.90)
G2: SELF
REGULATION
(a = 0.80)
G3: COLLEGIALITY
(a = 0.88)
G4: JOB SATISFACTION
(a = 0.69)
G5: KEENNESS
(a = 0.73)
Note: -N = 223 teachers in 38 schools. Extraction method: Generalised Least Squares. Rotation method: direct oblimin with d = -0.08. Goodness of fit criterion: l (df 131) = 158.085, P = 0.054.
The five Factors of Table 4.18 are correlated. Their correlation coefficients are
presented in the following table.
Table 4.19. Correlation matrix of teachers' Factors. DIRECTOR'S SELF-REGULA nON COLLEGIALITY SA nSFACTION
EFFECTIVENESS
DIRECTOR'S 1 EFFECTIVENESS
SELF-REGULA nON 0.115 1 COLLEGIALITY 0.216 0.078 SA TISFAcnON 0.123 0.089 0.105 1 KEENNESS 0.169 0.379 0.215 0.226
209
The numbers in the middle column of Table 4.16 and Table 4.18 are the correlation
coefficients between the variables in the left column and the corresponding Factors in
the right column. Very small loadings - i.e. those with an absolute value less than 0.2 -
have been omitted from the two tables for reasons of simplicity of presentation. Thus, in
both tables the complexity of the factor analytic solution seems to be equal to 1 (i.e.
each variable seems to correlate with only one Factor). Strictly speaking, however, this
is not quite true because both Table 4.16 and Table 4.18 are the 'pattern' matrixes and
not the 'structure' matrixes. As pattern matrixes, they present the unique contribution of
each variable to the rotated factor analytic solution, without taking into account any
correlation between the Factors. The role of Table 4.17 and Table 4.19 is therefore to
present this correlation between the Factors of Table 4.16 and Table 4.18 respectively.
4.3.7.4. The rotation of the Factors
The rotation of the Factors is a necessary procedure in order their relation with the
directly observed variables to be simplified. By adjusting the relations between the
Factors and the corresponding variables, the Factors are given meaning. In Exploratory
Factor Analysis, the rotation of the Factors is achieved with special mathematical
algorithms that help the analyst to choose the most appropriate Factor structure from a
universe of equivalent Factor structures. The rotation algorithm that was used in the
current study was direct oblimin, a method that will be explained in the following
paragraph. What must be stressed here, is that the Factor loadings in Table 4.16 and
Table 4.18 are not the standardised regression coefficients because, as it has been
already stated, these tables represent pattern matrixes. Nevertheless, the correlations in
the middle column of the tables are sufficient in giving meaningful names to the
Factors.
As it was stated in the previous paragraph, oblimin algorithm was used for the rotation
of the Factors. If it had not been for oblimin, the researcher could have used another
approach for Factors' rotation, for example to focus on a prearranged pattern matrix.
This approach was not followed because it would need (a) accurate prior knowledge
about the nature of the Factors and (b) special statistical packages to deal with the
necessities of Confirmatory Factor Analysis. These two elements were not available in
the current study. As regards precise prior knowledge about school processes in the
Greek context, the lack of relevant studies in the literature is notable. As the
investigation of school processes in the current study had an exploratory character,
210
oblimin was preferred on because it provided a standard method of rotation, free of the
researcher's sUbjective judgements. In order to understand the advantages of oblimin
over other methods of rotation (e.g. the Varimax method), we may consider the four
student Factors and the five teacher Factors as geometrical axes in four- and five
dimensional spaces respectively. If variables were dots in these multidimensional
spaces, oblimin would rotate the axes in such an oblique manner so as that each dot to
be strongly associated with only one dimension. For example, Figure 4.4 presents the
directly observed variables of Table 4.16 as dots in a space with three dimensions.
Factors F1, F2 and F3 are the reference axis in this three-dimensional space. We can
clearly see that four dots (grouped in the central circle) have high values in the vertical
axis (F2) but almost zero values in the other two axes. These four dots are the four
variables which construct the Factor 'surroundings'.
The formula of oblimin that was used in the current study was that of 'direct oblimin',
which was developed by Jennrich & Sampson (1966). In the current study, the basic
idea behind direct oblimin is that if there are definable clusters of variables representing
separate school processes, each cluster will have near-zero loadings on all the primary
Factors except one. In the formula of direct oblimin, a special computational algorithm
is used to reduce a criterion that it has been named 'D'. Both the formula of direct
oblimin and the 'D' criterion are presented in the Appendix (p. 356). In the algorithm
for direct oblimin, the analyst can control the magnitude of factors' obliqueness by
adjusting the sign and the magnitude of a coefficient named 'd'. Negative values of d
make the axes more orthogonal and decrease the correlation between the Factors,
whereas positive values of d make the axes more oblique and increase the correlation
between the Factors. As Kim & Mueller (1978) stated for the relation between a
Factor's pattern and the value of d, 'if the factor pattern is unifactorial (the simplest
possible), the specification of d = 0 identifies the correct pattern' (p. 39). In the current
study, the value of d for students and teachers was 0 and -0.08 respectively.
211

.5
----------~ ---- ..... -~ ".-, ,.,; I I ,
\-rar'lI~r::e:-:-'1J /~ ,-,,'" '--'" ~
I \ I \ I \ I \ I \ I \ I \
Factor 2 0.0
-.5
-.5 -.5
Factor 1 Factor 3
Figure 4.4. Students' Factors 1, 2 and 3 as axes in rotated space.
4.3.7.5. The extraction of the Factors
Another issue of great importance as regards the statistical construction of school
processes, is the initial extraction of the Factors. Although Factors' extraction precedes
their rotation, the order has changed in this chapter for making the presentation clearer.
From a procedural point of view, the current researcher had to decide on two things: (a)
if Factors or Components would be extracted, and (b) what the number of these Factors
or Components would be. The first of these two points will be discussed later. As
regards point (b), the least squares method for extraction was used. The idea behind this
method, as Kim & Mueller (1978) explain, is to minimise the residual correlation in
participants' responses, after extracting a given number of Factors, and to assess the
degree of fit between the reproduced correlations under the model and the observed
correlations_ For the objectives of the current study, the method of least squares had
certain advantages over other methods of extraction. Firstly, - and this is related to the
point (a), above - it represented the structure of people's answers in terms of a number
of causal Factors i.e. statistical constructs that 'cause' the variance in the directly
observed variables. On the contrary, in deriving the components in the Principal
Components analysis one need not to consider causation. Secondly, least squares
212

provided a 'built in' test of how well the Factors represented the correlation in people's
answers. The analysis showed that the Least Squares solution had a good fit to the
observed data as regards the five teachers' Factors. For the four student's Factors,
however, least squares gave a poor fit. The problem of lack of fit must therefore be
discussed before proceeding with the statistical analysis of the data. This discussion will
also provide an opportunity to present other characteristics ofthe current study.
4.3.7.6. The fit of the factor analytic model
The degree to which the extracted Factors reproduce the correlation matrix of the
initially observed variables in a factor analytic design is called 'goodness of fit'.
Statistical theory provides a number of tests and criteria for evaluating goodness of fit in
Factor Analysis. The most commonly used goodness of fit criterion is 'Uk', which
follows the i distribution. The SUbscript 'k' in the criterion refers to the number
extracted factors. The formula of Uk is presented in the Appendix, in order to show that
Uk is a function of the sample size, whereas its degrees of freedom are independent of
the sample size. In the current study, the value of U5 for the five Factors that derived
from teachers' responses had 131 degrees of freedom and its value was not significant
(x2 = 158.08,p = 0.054). This means that the factor analytic model for the teachers has a
good fit. However, the value of U4 for the four Factors that derived from students'
responses was highly significant, meaning that the factor analytic model for the student
did not have a good fit. This may indicate either that more than four factors should be
extracted or that the number of Factors was correct but i was significant due to the
relatively large sample size that was used (Sample C). Kim & Mueller (1978) state that
although Uk is appropriate when the sample size is large, minor deviations may be
statistically significant when the sample is 'very' large (p. 22). What is, however, a
'very large' size in Factor Analysis? This question will be answered in the following
paragraphs.
Although the literature on sample size in Factor Analysis is very rich, there is not a
generally accepted rule on how many observations are sufficient for factor analytic
designs. Guildford (1956), one of the firsts to write about sample size in Factor
Analysis, argued that 200 observations is the minimum. Kelloway (1998) shares the
same opinion with Guildford (op. cit.), especially for models of moderate complexity.
Kline (1994a), however, founds 200 observations to be a very 'pessimistic' number.
According to him (op. cit.), in data with a clear factor structure samples even as small as
213
100 are sufficient. Hair, et al. (1995) argue that a researcher should not factor analyse a
sample of fewer than 50 observations, and preferably the sample size should be 100 or
larger. Sample size, however, is not the only important issue in a factor analytic design:
the subject to variable ratio is equally important. In the statistical literature, there are
various claims about the subjects to variables ratio in factor analytic designs running
from 2:1 to 10:1. Generally, Hair et al. (1995) claim that a researcher has to have at
least five times as many observations as there are variables to be analysed. In the current
study, the observation to variables ratio (Sample C) was 47: 1. The possibility, therefore,
to find statistically significant Uk due to sample size was large!.
In order to investigate the hypothesis that the value of U4 was a result of the sample
size and not a result of poor model fit, the current researcher used the statistical program
to randomly select 208 cases (20%) from the initial sample. The analysis was repeated
and this time the value of U4 was not statistically significant (x2 = 154.25, df = 132,p =
0.090). In the 208 observations, the model had a good fit and, in addition, the Factor
pattern matrix was similar to the pattern matrix for the 991 valid observations of Sample
C. It can therefore be inferred that the factor analytic model in the case of students'
responses gave a good picture of the underlying structure and that the poor fit that was
found for the 991 observation was simply a result of large sample size. It now remains
to be shown that the small samples of the current study, i. e. the 208 randomly selected
students and the 223 teachers of Sample C, were adequate to be factor analysed.
According to Kaiser (1970), the quality of the sample in Factor Analysis depends on
four conditions: (a) the number of variables, (b) the number of common factors, (c) the
number of observations, and (d) the strength of the relationship among the variables.
The first three of Kaiser's (1970) conditions have already been discussed in this section.
As regards the fourth condition, the strength of the relationships among the variables, an
indicator of the strength of these relationship, the Bartlett's Test of Sphericity, was used.
Bartlett's Test of Sphericity (BTS) checks the hypothesis that all the diagonal terms of
the initial correlation matrix are 1 and all the off diagonal terms are O. The values of the
BTS for the initial sample of the 991 students, the random sample of 208 students, and
the sample of 223 teachers were all statistically significant. Another important index is
the Kaiser-Meyer-Olkin Measure of Sampling Adequacy (MSA), which was developed
IOn the other hand, the possibility of the students' responses to construct sample specific school processes was very small.
214
by Kaiser in the 1970's (1970, 1974). The fonnula of the MSA is presented in the
Appendix (p. 356). Kaiser (1974) characterises measures of MSA higher than 0.90 as
'marvelous', between 0.80 and 0.90 as 'meritorious' and between 0.70 and 0.80 as
'middling'. The base line of the Measure of Sampling Adequacy, under which the
sample is unacceptable, is 0.50. In the current study, the MSA for the 991 students was
0.787. For the 223 teachers (Sample D) the MSA was 0.844. For the random sample of
208 students the MSA was 0.746. Since all the MSA measures in this study were over
0.70, the data were considered adequate for Factor Analysis.
Reflecting on the material presented so far in this section, it can be argued that the
current researcher took all the available steps in order to construct factor analytic
models that would represent the underlying Factor structures. The final step in Factor
Analysis was to constructions of Factors' scales. Factors' scales were constructed in
order the derived process Factors to be used as independent (predictor) variables in
hierarchical linear models. In the current study, Factor scales were constructed with the
method of Regression. The criterion of this method is to find a Factor scale in such a
way that the correlation between the underlying common Factor and the scale to be
maximum. Regression is not the only method for constructing Factor scales but it is the
most commonly used by statisticians. However, the choice of the appropriate method
for constructing Factor scores is not held to have a major impact on the findings. Kim &
Mueller (1978) state that there is usually a very high correlation among the scales
produced by different scaling methods and that 'for many research problems the choice
of the method may be academic' (p. 69). The fonnula of the regression method is given
in the Appendix (p. 357). With the construction of the Factor scores, the first phase of
the statistical analysis was over. In the second phase, hierarchical statistical models
were conducted. A brief description of these models will take place in the following
section.
215

4.4. MULTILEVEL STATISTICAL MODELS
4.4.1. THE GENERALISED LINEAR MODEL AND ITS NOTATION
In the previous chapter, it was stated that statistical procedures which deal with
hierarchical data structures are an active area of educational research from the 1980s
onwards. Education is a field in which hierarchies in the data are the rule rather than the
exception. Apart for education, however, the conceptualisation of data structures as
hierarchical has also been proved to be of value in other contexts as growth models (see
Bryk & Raudenbush, 1987) and research meta-analyses (see Raudenbush & Bryk,
1985). The purpose of Section 4.4 is to present the logic and the main features of the
hierarchical (or multilevel) statistical models. By presenting the logic of these statistical
models, the current researcher will have the opportunity to explain his findings more
clearly in the next chapter.
Statisticians call the hierarchical linear models 'linear' because the sum of their
parameters is specified to be a straight line and 'hierarchical', because these models are
commensurate with the hierarchical nature of some kinds of data. Non-linear multilevel
models as well as hierarchical models for cross-classified random data structures have
been recently developed by Harvey Goldstein (1991) at the London Institute of
Education. In the literature focusing on hierarchical models, most books contain
complex statistical formulas written for students and researchers with a strong
mathematical background. Such a book is Multilevel Statistical Models by Goldstein
(1995c) which makes extensive use of Matrix Algebra. However, there are also books
written for students and researchers with a more applied approach to multilevel
statistical analysis. Such a book is Multilevel Analysis by Snijders & Bosker (1999)
which explains the hierarchical statistical models to researchers in the fields of social
sciences and includes many example from education. In the remaining part of Section
4.4 the current researcher will present a selection of topics taken directly from the book
Multilevel Analysis. The current author has also followed the notation found in the book
by Scnijder & Bosker (1999). More specifically, abstract and random variables are
denoted here by italicised capital letters, like X or Y. Outcomes of random variables and
other fixed values are denoted with italicised lowercase letters. Finally, matrixes and
216
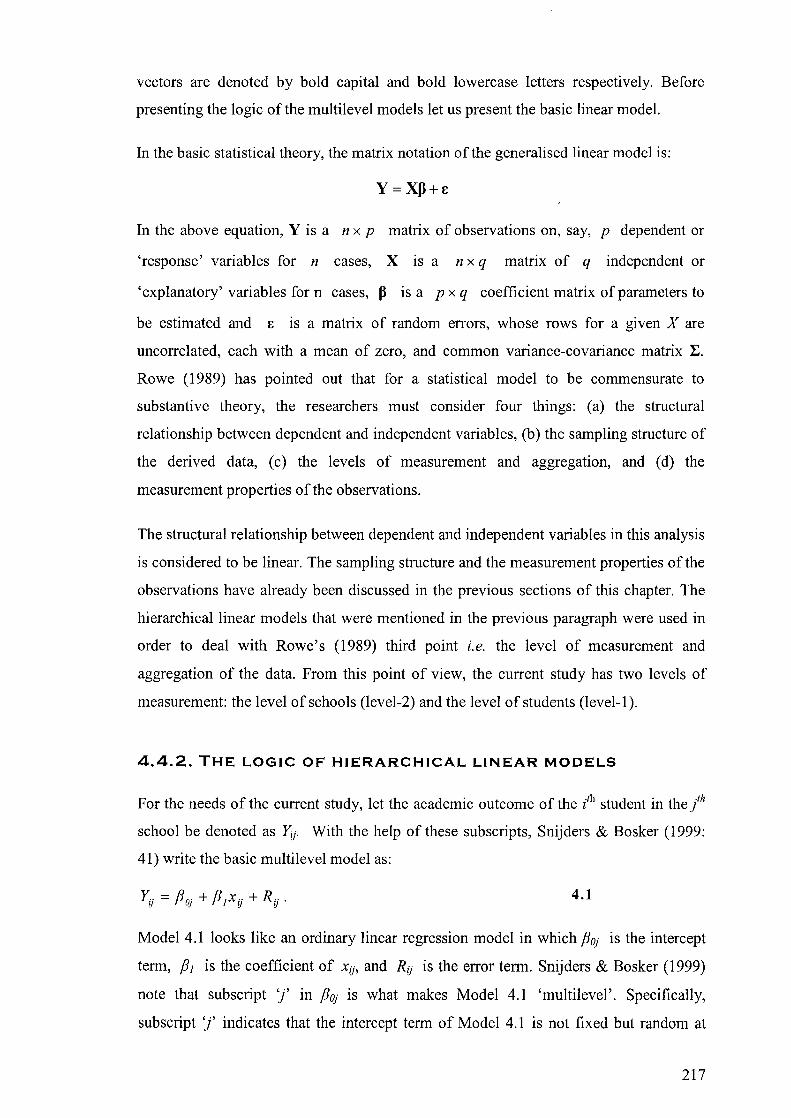
vectors are denoted by bold capital and bold lowercase letters respectively. Before
presenting the logic of the multilevel models let us present the basic linear model.
In the basic statistical theory, the matrix notation of the generalised linear model is:
In the above equation, Y is a n x p matrix of observations on, say, p dependent or
'response' variables for n cases, X is a n x q matrix of q independent or
'explanatory' variables for n cases, P is a p x q coefficient matrix of parameters to
be estimated and E is a matrix of random errors, whose rows for a given X are
uncorrelated, each with a mean of zero, and common variance-covariance matrix 1:.
Rowe (1989) has pointed out that for a statistical model to be commensurate to
substantive theory, the researchers must consider four things: (a) the structural
relationship between dependent and independent variables, (b) the sampling structure of
the derived data, (c) the levels of measurement and aggregation, and (d) the
measurement properties of the observations.
The structural relationship between dependent and independent variables in this analysis
is considered to be linear. The sampling structure and the measurement properties of the
observations have already been discussed in the previous sections of this chapter. The
hierarchical linear models that were mentioned in the previous paragraph were used in
order to deal with Rowe's (1989) third point i.e. the level of measurement and
aggregation of the data. From this point of view, the current study has two levels of
measurement: the level of schools (level-2) and the level of students (level-1).
4.4.2. THE LOGIC OF HIERARCHICAL LINEAR MODELS
For the needs of the current study, let the academic outcome of the lh student in the /h school be denoted as Yij. With the help of these subscripts, Snijders & Bosker (1999:
41) write the basic multilevel model as:
4.1
Model 4.1 looks like an ordinary linear regression model in which POj is the intercept
term, Pi is the coefficient of xij, and Rij is the error term. Snijders & Bosker (1999)
note that subscript 'j' in POj is what makes Model 4.1 'multilevel'. Specifically,
subscript 'j' indicates that the intercept term of Model 4.1 is not fixed but random at
217
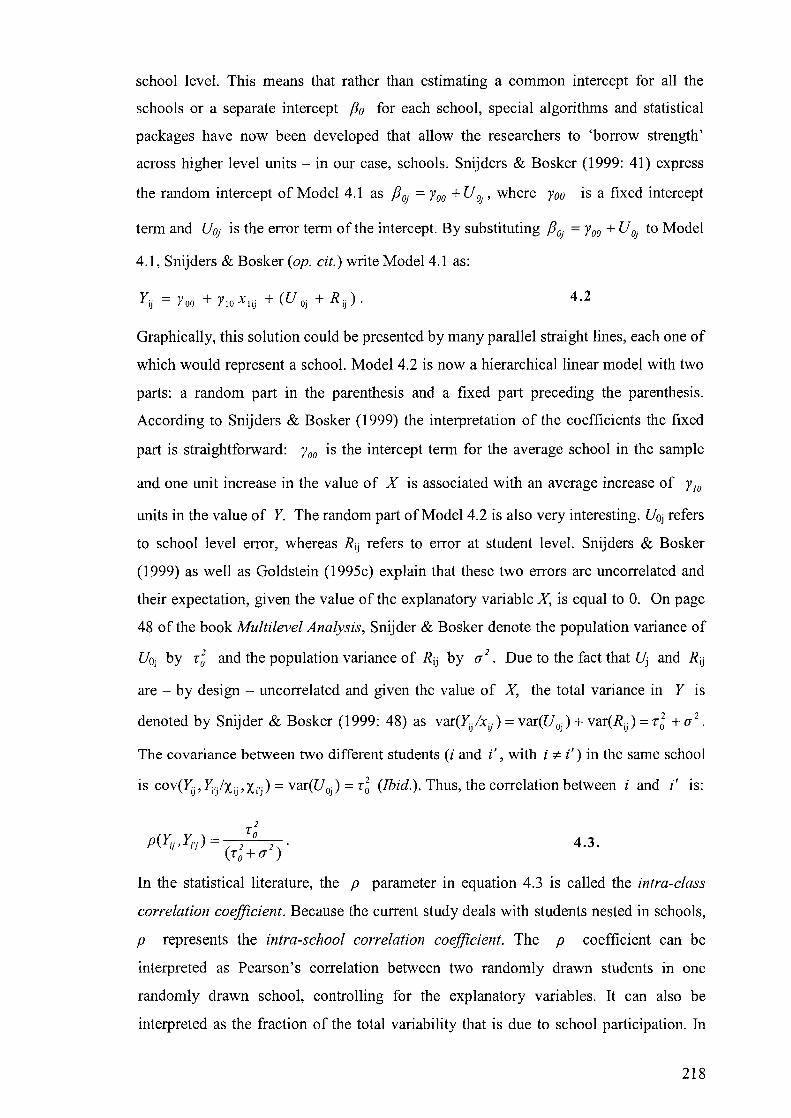
school level. This means that rather than estimating a common intercept for all the
schools or a separate intercept flo for each school, special algorithms and statistical
packages have now been developed that allow the researchers to 'borrow strength'
across higher level units - in our case, schools. Snijders & Bosker (1999: 41) express
the random intercept of Model 4.1 as fl OJ = Yoo + U OJ' where Yoo is a fixed intercept
term and UOj is the error term of the intercept. By substituting floj = Yoo + U Oj to Model
4.1, Snijders & Bosker (op. cit.) write Model 4.1 as:
Y ij = Y 00 + Y 10 Xl ij + (U OJ + R ij ) . 4.2
Graphically, this solution could be presented by many parallel straight lines, each one of
which would represent a school. Model 4.2 is now a hierarchical linear model with two
parts: a random part in the parenthesis and a fixed part preceding the parenthesis.
According to Snijders & Bosker (1999) the interpretation of the coefficients the fixed
part is straightforward: Yoo is the intercept term for the average school in the sample
and one unit increase in the value of X is associated with an average increase of YIO
units in the value of Y. The random part of Model 4.2 is also very interesting. UOj refers
to school level error, whereas Rij refers to error at student level. Snijders & Bosker
(1999) as well as Goldstein (1995c) explain that these two errors are uncorrelated and
their expectation, given the value of the explanatory variable X, is equal to O. On page
48 of the book Multilevel Analysis, Snijder & Bosker denote the population variance of
UOj by T~ and the population variance of Rij by (J2. Due to the fact that Uj and Rij
are - by design - uncorrelated and given the value of X, the total variance in Y is
denoted by Snijder & Bosker (1999: 48) as var(~/xjj)=var(UOj)+var(Rij)=r~ +(J2.
The covariance between two different students (i and i' , with i =;:. i') in the same school
is cov(Yij' ~/Xij' Xi') = var(Uo) = T~ (Ibid.). Thus, the correlation between i and i' is:
4.3.
In the statistical literature, the p parameter in equation 4.3 is called the intra-class
correlation coefficient. Because the current study deals with students nested in schools,
p represents the intra-school correlation coefficient. The p coefficient can be
interpreted as Pearson's correlation between two randomly drawn students in one
randomly drawn school, controlling for the explanatory variables. It can also be
interpreted as the fraction of the total variability that is due to school participation. In
218

other words, p represents an estimate of the 'school effect' on a given school outcome
(Snijders & Bosker, 1999).
What would be the consequences of ignoring the existence of the 'school effect'? If the
data of the hypothetical example that was presented above were analysed with the
method of Ordinary Least Squares, the correlation between the student level error terms
would be ignored and thus the estimates of the parameters would be biased. In the
alternative case that the data were aggregated to school level, it would be possible to use
Ordinary Least Squares in order to estimate the parameters for the aggregated data. In
that case, however, the relationship between the aggregated variables might be different
from the relationships at student-level, a phenomenon known in the statistical literature
as 'ecological fallacy' (see Langbein & Lichtman, 1978). Of course, the intercepts can
always be seen as separate fixed parameters to be estimated (i.e. a different coefficient
for each school). This solution however would contradict the principle of model
simplicity because a researcher would then have to estimate a large number of
parameters. In the case of the current work, for example, 375 intercepts would have to
be estimated. In the alternative case that a model with the specifications of Model 4.2
was fitted to the data of the current study, only four terms would have to be estimated:
the fixed coefficients Yoo and YiO, and the variances r; and (J2. In this alternative
case, the schools of the current study could also be seen as a sample of a wider
population of schools.
Model 4.2 could be expanded to include more than one explanatory variable. If, for
example, there were p explanatory variables at individual level and q explanatory
variables at school level (to use Snijders' & Bosker's 1999 notation), Model 4.2 could
be written as:
Yij =yoo +YIOX1ij +···+Ypoxpij +YOIZlj +···+YOqZqj +UOj +Rij 4.4
The regression parameters in Model 4.4 have the same interpretation as non
standardised regression coefficients in Ordinary Least Squares mUltiple regression
models.
4.4.3. MORE COMPLEX HIERARCHICAL MODELS
Snijders & Bosker (1999) explain that if Model 4.1 was expanded so as to include a
random coefficient not only for the intercept but also for variable X, PI would be
219

written Pli and the hierarchical model would then have random slopes as well as
random intercepts. In that case, the two school dependent coefficients would be
separated into an average coefficient and a school-dependent variation. This is written
by Snijders & Bosker (1999: 67) as follows:
P OJ = Y 00 + U OJ
Plj = YIO + U lj •
4.5 (a & b)
Using again Snijders' & Bosker's (1999:68) notation, substitution of the above
equations to 4.1 would lead to the model:
4.6
In Model 4.6, the term UliXij can be regarded as the random interaction between
schools and the explanatory variable X. In this case, X allowed to have a 'random
effect' on outcome Y. Snijders & Bosker (1999: 68) write that in this case 'the variance
of Y, given the value x of X, depends on x'. The authors present an example of this
situation in the book Multilevel Analysis: the case in which socio-economic status (SES)
has an effect on academic achievement (Y) but only for students with low SES.
According to Snijders & Bosker (1999) in that case, there is no significant school effect
for students from a high socio-economic background but there is significant school
effect for students from low socio-economic background. The authors inform their
readers that in the statistical literature this phenomenon is called heteroscedasticity.
For Snijders & Bosker (op. cit.) the most common situation in multilevel models is for
the two school level error terms to be correlated. Thus the authors on page 68 of the
book Multilevel Analysis write the variances and covariance of the level-two residuals
of Model 4.6 as follows:
var(Uo) = Too = Tg
var(Ulj) = TlJ = T:
cov(UOi ' U I) = Tal
Snijders & Bosker (1999) highlight two interesting points about random slopes models.
Firstly, in these models the slopes are normally distributed round their mean YIO ' with
standard deviation TI :::: R . This means that approximately 95 percent of the groups
(schools) have slopes within the YIO ± 2TI range (op. cit.). Secondly, in random slope
220
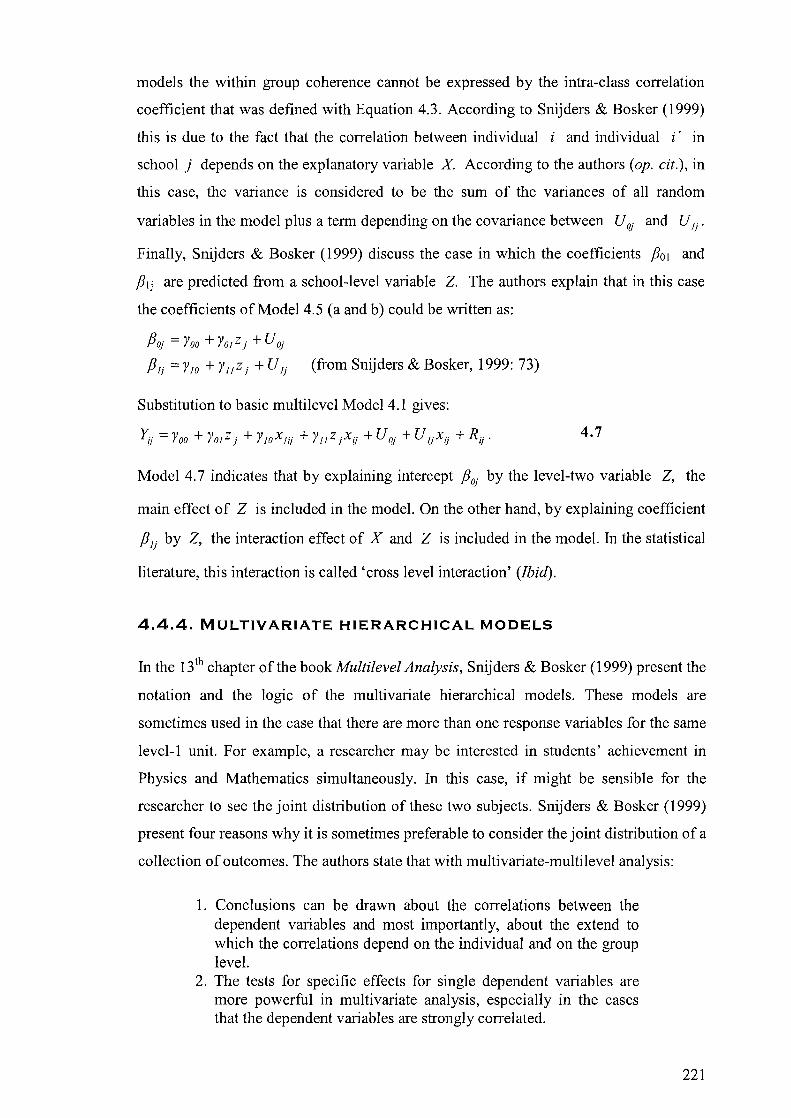
models the within group coherence cannot be expressed by the intra-class correlation
coefficient that was defined with Equation 4.3. According to Snijders & Bosker (1999)
this is due to the fact that the correlation between individual i and individual i' in
school j depends on the explanatory variable X According to the authors (op. cit.), in
this case, the variance is considered to be the sum of the variances of all random
variables in the model plus a term depending on the covariance between U Oj and U Ij .
Finally, Snijders & Bosker (1999) discuss the case in which the coefficients f301 and
f3lj are predicted from a school-level variable Z. The authors explain that in this case
the coefficients of Model 4.5 (a and b) could be written as:
f30j =Yoo +YoIZj +UOj
f3lj = YIO + Yllz j + U Ij (from Snijders & Bosker, 1999: 73)
Substitution to basic multilevel Model 4.1 gives:
4.7
Model 4.7 indicates that by explaining intercept f3o' by the level-two variable Z, the .I
main effect of Z is included in the model. On the other hand, by explaining coefficient
f31) by Z, the interaction effect of X and Z is included in the model. In the statistical
literature, this interaction is called 'cross level interaction' (Ibid).
4.4.4. MULTIVARIATE HIERARCHICAL MODELS
In the 13th chapter of the book Multilevel Analysis, Snij ders & Bosker (1999) present the
notation and the logic of the multivariate hierarchical models. These models are
sometimes used in the case that there are more than one response variables for the same
level-1 unit. For example, a researcher may be interested in students' achievement in
Physics and Mathematics simultaneously. In this case, if might be sensible for the
researcher to see the joint distribution of these two SUbjects. Snijders & Bosker (1999)
present four reasons why it is sometimes preferable to consider the joint distribution of a
collection of outcomes. The authors state that with multivariate-multilevel analysis:
1. Conclusions can be drawn about the correlations between the dependent variables and most importantly, about the extend to which the correlations depend on the individual and on the group level.
2. The tests for specific effects for single dependent variables are more powerful in multivariate analysis, especially in the cases that the dependent variables are strongly correlated.
221
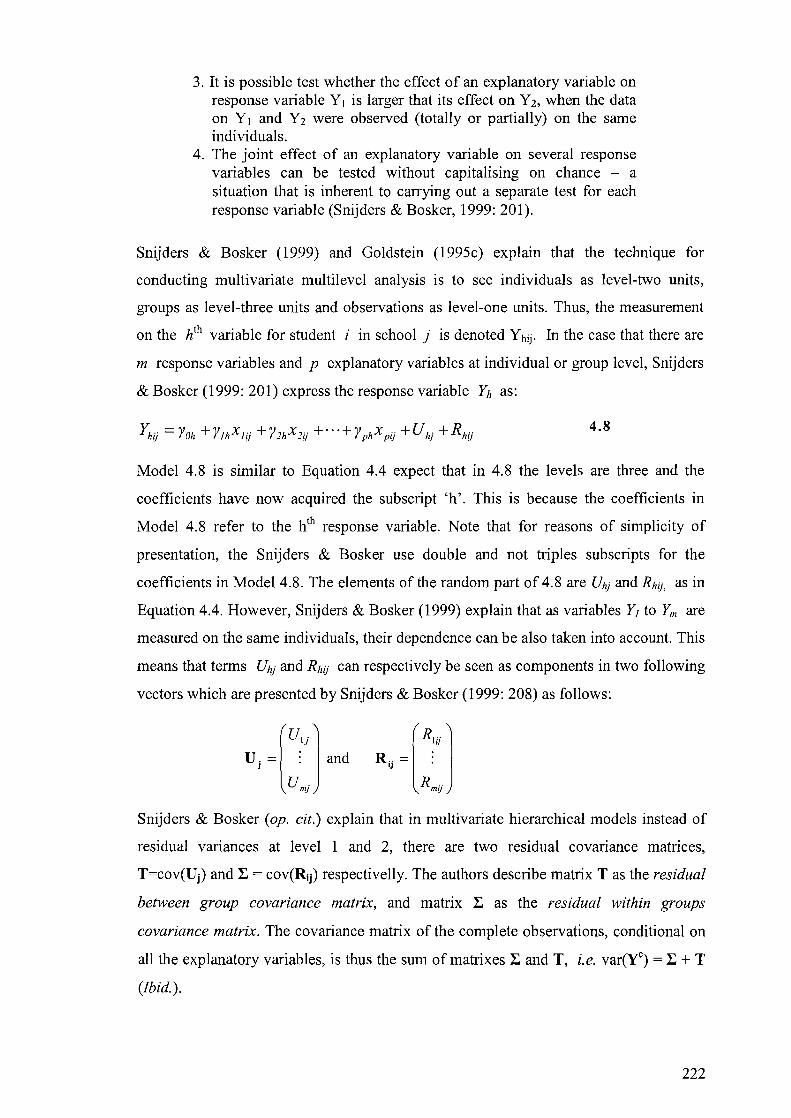
3. It is possible test whether the effect of an explanatory variable on response variable Y\ is larger that its effect on Y2, when the data on Y\ and Y2 were observed (totally or partially) on the same individuals.
4. The joint effect of an explanatory variable on several response variables can be tested without capitalising on chance - a situation that is inherent to carrying out a separate test for each response variable (Snijders & Bosker, 1999: 201).
Snijders & Bosker (1999) and Goldstein (1995c) explain that the technique for
conducting multivariate multilevel analysis is to see individuals as level-two units,
groups as level-three units and observations as level-one units. Thus, the measurement
on the hth variable for student i in school j is denoted Yhij. In the case that there are
m response variables and p explanatory variables at individual or group level, Snijders
& Bosker (1999: 201) express the response variable Yh as:
4.8
Model 4.8 is similar to Equation 4.4 expect that in 4.8 the levels are three and the
coefficients have now acquired the subscript 'h'. This is because the coefficients in
Model 4.8 refer to the hth response variable. Note that for reasons of simplicity of
presentation, the Snijders & Bosker use double and not triples subscripts for the
coefficients in Model 4.8. The elements of the random part of 4.8 are Uhj and Rhij, as in
Equation 4.4. However, Snijders & Bosker (1999) explain that as variables Y j to Ym are
measured on the same individuals, their dependence can be also taken into account. This
means that terms Uhj and R hij can respectively be seen as components in two following
vectors which are presented by Snijders & Bosker (1999: 208) as follows:
Snijders & Bosker (op. cit.) explain that in multivariate hierarchical models instead of
residual variances at levelland 2, there are two residual covariance matrices,
T=cov(Uj) and r. = COV(Rij) respectivelly. The authors describe matrix T as the residual
between group covariance matrix, and matrix r. as the residual within groups
covariance matrix. The covariance matrix of the complete observations, conditional on
all the explanatory variables, is thus the sum of matrixes r. and T, i. e. var(YC) = r. + T
(Ibid. ).
222
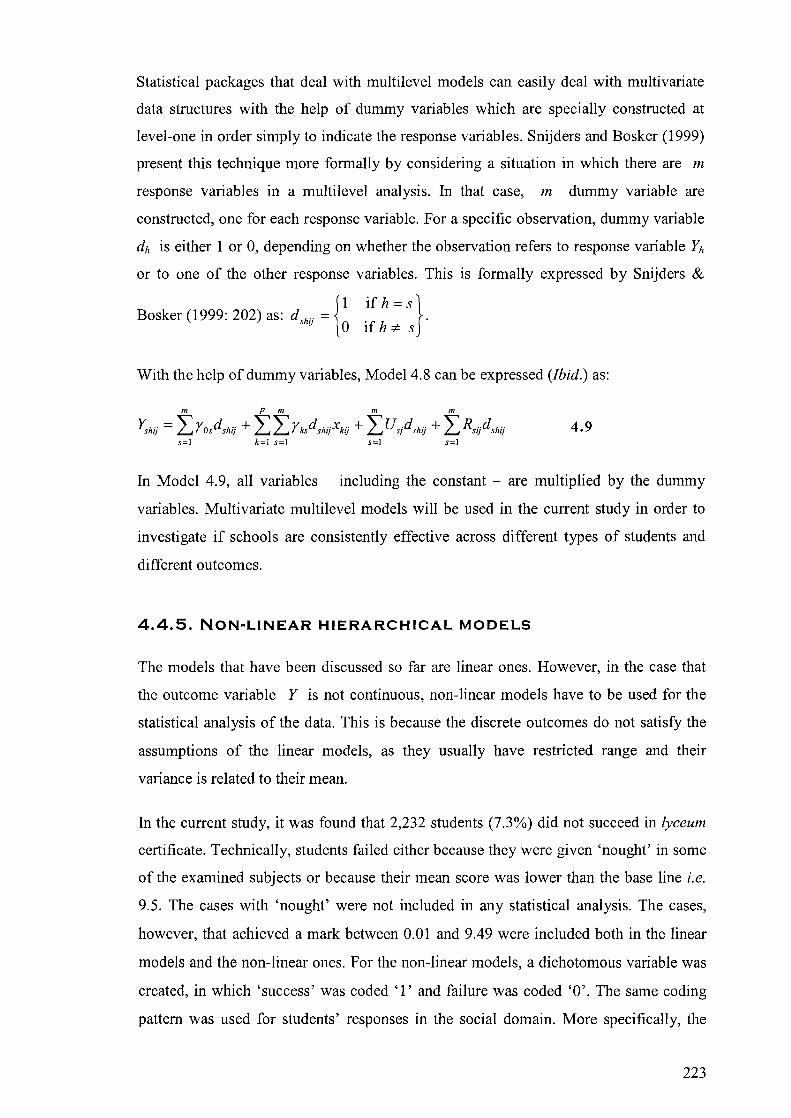
Statistical packages that deal with multilevel models can easily deal with multivariate
data structures with the help of dummy variables which are specially constructed at
level-one in order simply to indicate the response variables. Snijders and Bosker (1999)
present this technique more formally by considering a situation in which there are m
response variables in a multilevel analysis. In that case, m dummy variable are
constructed, one for each response variable. For a specific observation, dummy variable
dh is either 1 or 0, depending on whether the observation refers to response variable Yh
or to one of the other response variables. This is formally expressed by Snijders &
{I if h = s} Bosker (1999: 202) as: d Shij =. . o If h =F S
With the help of dummy variables, Model 4.8 can be expressed (Ibid.) as:
m p m m m
Y,hij = IrosdShij + IIrksdshijXkij + IUsjdShij + I Rsijdshij 4.9 s=1 k=1 s=1 s=1 s=1
In Model 4.9, all variables - including the constant - are multiplied by the dummy
variables. Multivariate multilevel models will be used in the current study in order to
investigate if schools are consistently effective across different types of students and
different outcomes.
4.4.5. NON-LINEAR HIERARCHICAL MODELS
The models that have been discussed so far are linear ones. However, in the case that
the outcome variable Y is not continuous, non-linear models have to be used for the
statistical analysis of the data. This is because the discrete outcomes do not satisfy the
assumptions of the linear models, as they usually have restricted range and their
variance is related to their mean.
In the current study, it was found that 2,232 students (7.3%) did not succeed in lyceum
certificate. Technically, students failed either because they were given 'nought' in some
of the examined subjects or because their mean score was lower than the base line i.e.
9.5. The cases with 'nought' were not included in any statistical analysis. The cases,
however, that achieved a mark between 0.01 and 9.49 were included both in the linear
models and the non-linear ones. For the non-linear models, a dichotomous variable was
created, in which 'success' was coded '1' and failure was coded '0'. The same coding
pattern was used for students' responses in the social domain. More specifically, the
223
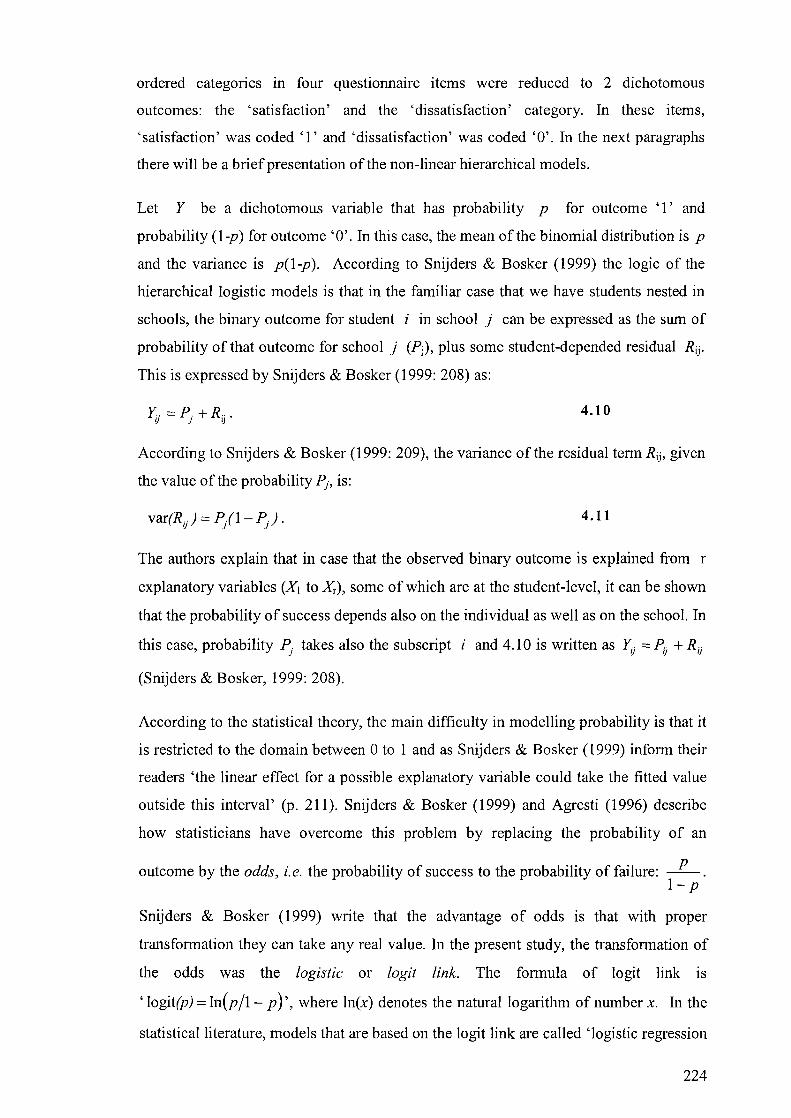
ordered categories III four questionnaire items were reduced to 2 dichotomous
outcomes: the 'satisfaction' and the 'dissatisfaction' category. In these items,
'satisfaction' was coded' l' and 'dissatisfaction' was coded '0'. In the next paragraphs
there will be a brief presentation of the non-linear hierarchical models.
Let Y be a dichotomous variable that has probability p for outcome 'I' and
probability (1-p) for outcome' 0'. In this case, the mean of the binomial distribution is p
and the variance is p(1-p). According to Snijders & Bosker (1999) the logic of the
hierarchical logistic models is that in the familiar case that we have students nested in
schools, the binary outcome for student i in school j can be expressed as the sum of
probability of that outcome for school j (Pj ), plus some student-depended residual Rij.
This is expressed by Snijders & Bosker (1999: 208) as:
4.10
According to Snijders & Bosker (1999: 209), the variance of the residual term R ij , given
the value of the probability Pj, is:
4.11
The authors explain that in case that the observed binary outcome is explained from r
explanatory variables (X\ to Xr), some of which are at the student-level, it can be shown
that the probability of success depends also on the individual as well as on the school. In
this case, probability Pj takes also the sUbscript i and 4.10 is written as Yij = Pij + Rij
(Snijders & Bosker, 1999: 208).
According to the statistical theory, the main difficulty in modelling probability is that it
is restricted to the domain between 0 to 1 and as Snijders & Bosker (1999) inform their
readers 'the linear effect for a possible explanatory variable could take the fitted value
outside this interval' (p. 211). Snijders & Bosker (1999) and Agresti (1996) describe
how statisticians have overcome this problem by replacing the probability of an
outcome by the odds, i.e. the probability of success to the probability of failure: ~. 1- p
Snijders & Bosker (1999) write that the advantage of odds is that with proper
transformation they can take any real value. In the present study, the transformation of
the odds was the logistic or logit link. The formula of logit link is
'logit(jJ) = In(p/l- p)', where In(x) denotes the natural logarithm of number x. In the
statistical literature, models that are based on the logit link are called 'logistic regression
224

models'. In logistic regression analysis, linear models are constructed for the log-odds
of the probability.
In the present study the log-odds of probability of success in lyceum certificate could be
considered to be normally distributed in the population of schools. According to
Snijders & Bosker (1999: 213), this could be written as:
10git(P)) = Yo + Va) . 4.12
The authors (op. cit.) explain that in Model 4.12, VOj are independent deviations at
school level, distributed normally with mean 0 and variance r~. Student-level variance
is not included in Model 4.12 as this variance can be derived from 4.10 (op. cit.).
Snijders & Bosker (1999: 213) explain that if the probability of success corresponding
to the average value Yo, is denoted 7[0, it can be written that:
. • eYo
7r 0 = 10glstlC(r 0) = , 1 + eYo
4.13
where e is the base of the natural logarithm. The 7[0 approximates the average value of
the probability of success in the popUlation of schools (see Goldstein, 1995c for a
discussion). Snijders & Bosker (1999: 214) present a formula for the calculation of the
variation in Pj , when r~ is small:
4.14
Snijders & Bosker (1999: 216) also explain that in the case that a number of explanatory
variables Xl to x;. are considered to explain the probability of success, it can be written
that l:
r
10git(Pij) = Yo + LYhXhij + Va) . h=1
4.15
In that case, a unit difference in Xh between two students in the same school is
associated with a difference of r h in the log-odds of their possibility for success (op.
cit.). Finally, Snijders & Bosker (1999) explain given the values of all the explanatory
variables, deviations VOj are assumed to have zero mean and a variance r~. Level-one
residual is not included in Equation 4.15 because, as the authors explain (op.cit.) this
equation refers to the probability Pij and not to the outcome Yij. In the current study
225
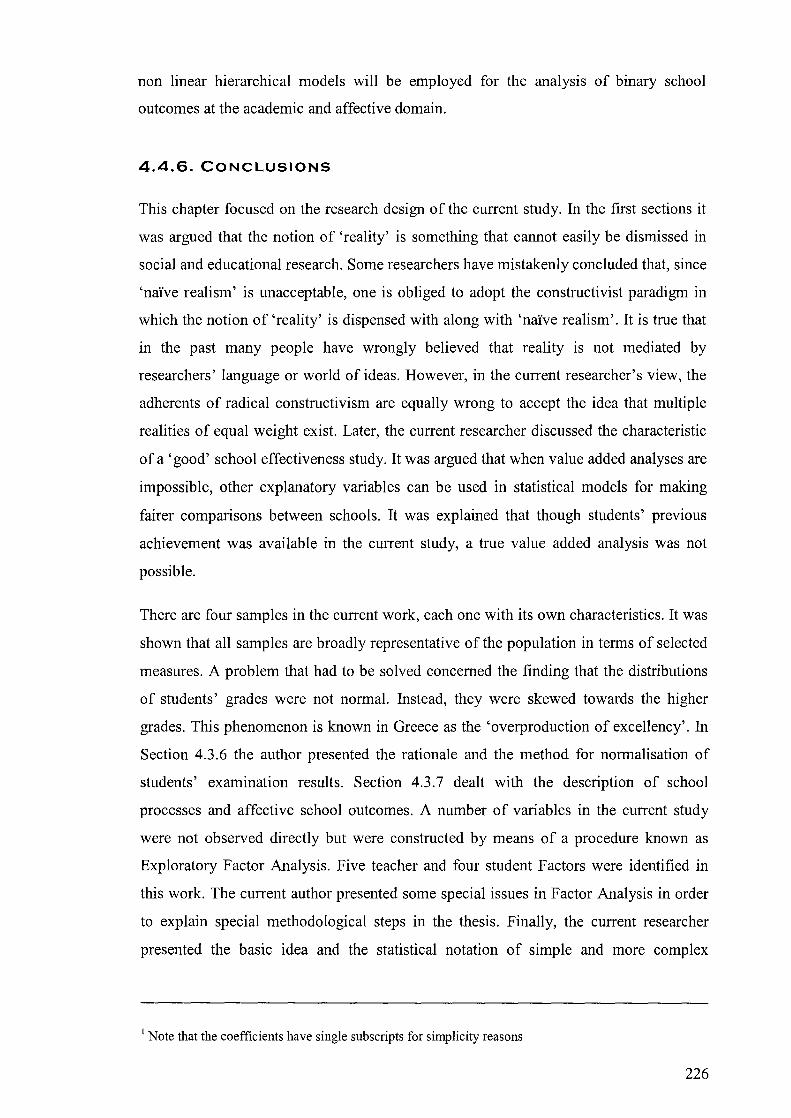
non linear hierarchical models will be employed for the analysis of binary school
outcomes at the academic and affective domain.
4.4.6. CONCLUSIONS
This chapter focused on the research design of the current study. In the first sections it
was argued that the notion of 'reality' is something that cannot easily be dismissed in
social and educational research. Some researchers have mistakenly concluded that, since
'naIve realism' is unacceptable, one is obliged to adopt the constructivist paradigm in
which the notion of 'reality' is dispensed with along with 'naIve realism'. It is true that
in the past many people have wrongly believed that reality is not mediated by
researchers' language or world of ideas. However, in the current researcher's view, the
adherents of radical constructivism are equally wrong to accept the idea that multiple
realities of equal weight exist. Later, the current researcher discussed the characteristic
of a 'good' school effectiveness study. It was argued that when value added analyses are
impossible, other explanatory variables can be used in statistical models for making
fairer comparisons between schools. It was explained that though students' previous
achievement was available in the current study, a true value added analysis was not
possible.
There are four samples in the current work, each one with its own characteristics. It was
shown that all samples are broadly representative of the population in terms of selected
measures. A problem that had to be solved concerned the finding that the distributions
of students' grades were not normal. Instead, they were skewed towards the higher
grades. This phenomenon is known in Greece as the 'overproduction of excellency'. In
Section 4.3.6 the author presented the rationale and the method for normalisation of
students' examination results. Section 4.3.7 dealt with the description of school
processes and affective school outcomes. A number of variables in the current study
were not observed directly but were constructed by means of a procedure known as
Exploratory Factor Analysis. Five teacher and four student Factors were identified in
this work. The current author presented some special issues in Factor Analysis in order
to explain special methodological steps in the thesis. Finally, the current researcher
presented the basic idea and the statistical notation of simple and more complex
I Note that the coefficients have single subscripts for simplicity reasons
226

hierarchical linear models. In the next chapter such models will be fitted into real data
for the /yceia in Attiki and their students.
227
5. FINDINGS: EXPLORING VARIABLES IN SCHOOL EFFECTS IN RELATION TO STUDENTS' ACADEMIC AND AFFECTIVE OUTCOMES
"What can schools do to achieve the desired effect? Studies such as PISA can answer this question only up to a point, because many important contextual factors cannot be captured by international comparative surveys of student performance and because such surveys do not look closely enough at processes over time to allow cause and effect to be firmly established".
OEeD (2001) Knowledge and Skills for Life (First Results from the OEeD Programme for International Student Assessment (PISA) 2000. Paris: OEeD.
228

5.1. DESCRIPTIVE STATISTICS: THE INTERPRE~ TATION OF SCHOOL OUTCOMES AND PROC~ ESSES
5.1.1. INTRODUCTION
This chapter contains the main findings of the current study. Section 5.1 examines the
meaning of school outcomes, processes factors and presents descriptive statistics for a
selection of variables. Most of these variables have been measured at nominal level, like
students' gender. There are, however, variables that have been measured at ordinal
level, like students' and teachers' opinions. Finally, there are variables that have been
measured with interval or ratio scales, like students' normalised scores in the national
examinations. Most of the variables relating to social and affective outcomes as well as
school processes are based on students' and teachers' views. Students' views are used to
provide measures of social and affective outcomes, whereas teachers' responses are
used to provide measures of school processes. The following 13 sections contain the
most interesting descriptive statistics of the current study.
5.1.2. STUDENT AGE
Age is a factor strongly associated with achievement, especially in the early years of
schooling. In an article which appeared in the journal Educational Research, West &
Varlaam (1990) asked if the age at which children start school had any impact on their
achievement. The researchers reviewed the literature and concluded that it was rather
the quality of pre-school provision and not so much the age of entrance which was
important for later achievement. It is interesting for the Greek context to investigate
whether age of entrance continues to affect achievement after 12 years of schooling. In
the current study, students' ages were measured with the help of a categorical variable
with three ordered categories: 'born before 1982', 'born in 1982', and 'born after 1982'.
This was decided because only year of birth and not month was available in the
Ministry of Education database for the students of the 357 integrated lyceia in Attiki
prefecture. The base category in the multilevel models was 'born in 1982'. The
percentages of the three categories are presented in Table 5.1.
229
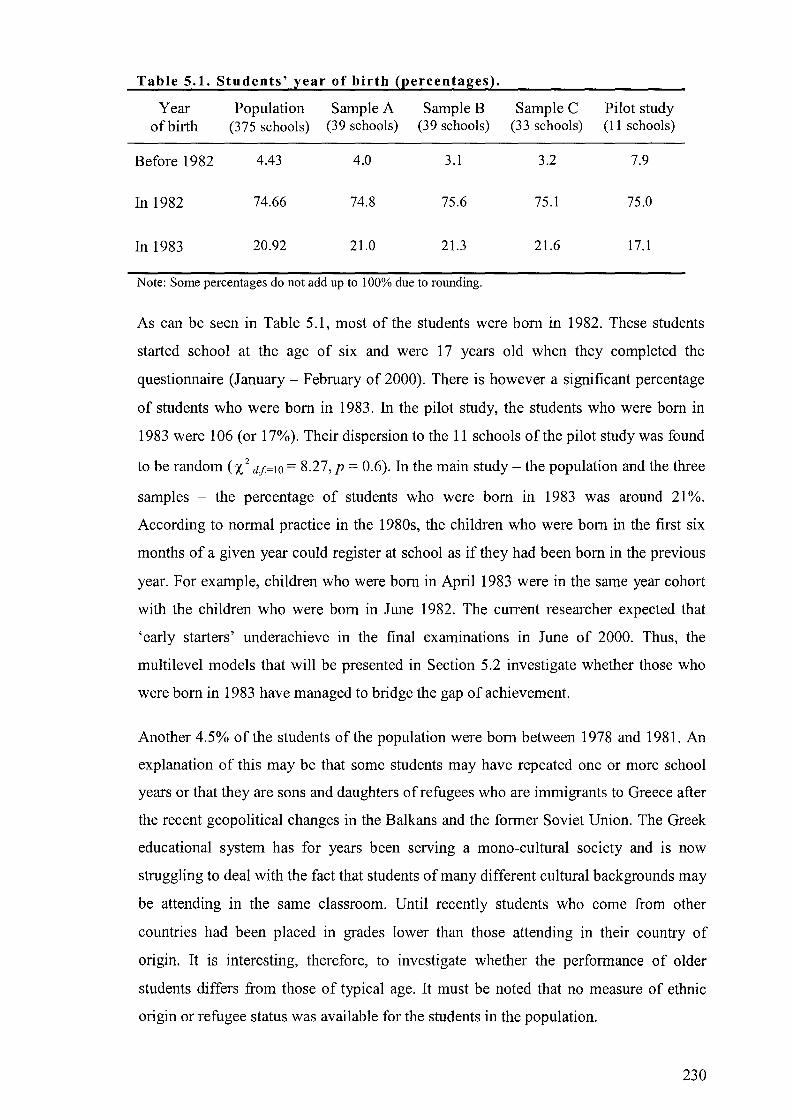
Table 5.1. Students' ~ear of birth !~ercentages~.
Year Population Sample A Sample B Sample C Pilot study of birth (375 schools) (39 schools) (39 schools) (33 schools) (11 schools)
Before 1982 4.43 4.0 3.1 3.2 7.9
In 1982 74.66 74.8 75.6 75.1 75.0
In 1983 20.92 21.0 21.3 21.6 17.1
Note: Some percentages do not add up to 100% due to rounding.
As can be seen in Table 5.1, most of the students were born in 1982. These students
started school at the age of six and were 17 years old when they completed the
questionnaire (January - February of 2000). There is however a significant percentage
of students who were born in 1983. In the pilot study, the students who were born in
1983 were 106 (or 17%). Their dispersion to the 11 schools of the pilot study was found
to be random (X 2 dj=lO = 8.27, p = 0.6). In the main study - the population and the three
samples - the percentage of students who were born in 1983 was around 21 %.
According to normal practice in the 1980s, the children who were born in the first six
months of a given year could register at school as if they had been born in the previous
year. For example, children who were born in April 1983 were in the same year cohort
with the children who were born in June 1982. The current researcher expected that
'early starters' underachieve in the final examinations in June of 2000. Thus, the
multilevel models that will be presented in Section 5.2 investigate whether those who
were born in 1983 have managed to bridge the gap of achievement.
Another 4.5% of the students of the population were born between 1978 and 1981. An
explanation of this may be that some students may have repeated one or more school
years or that they are sons and daughters of refugees who are immigrants to Greece after
the recent geopolitical changes in the Balkans and the former Soviet Union. The Greek
educational system has for years been serving a mono-cultural society and is now
struggling to deal with the fact that students of many different cultural backgrounds may
be attending in the same classroom. Until recently students who come from other
countries had been placed in grades lower than those attending in their country of
origin. It is interesting, therefore, to investigate whether the performance of older
students differs from those of typical age. It must be noted that no measure of ethnic
origin or refugee status was available for the students in the population.
230
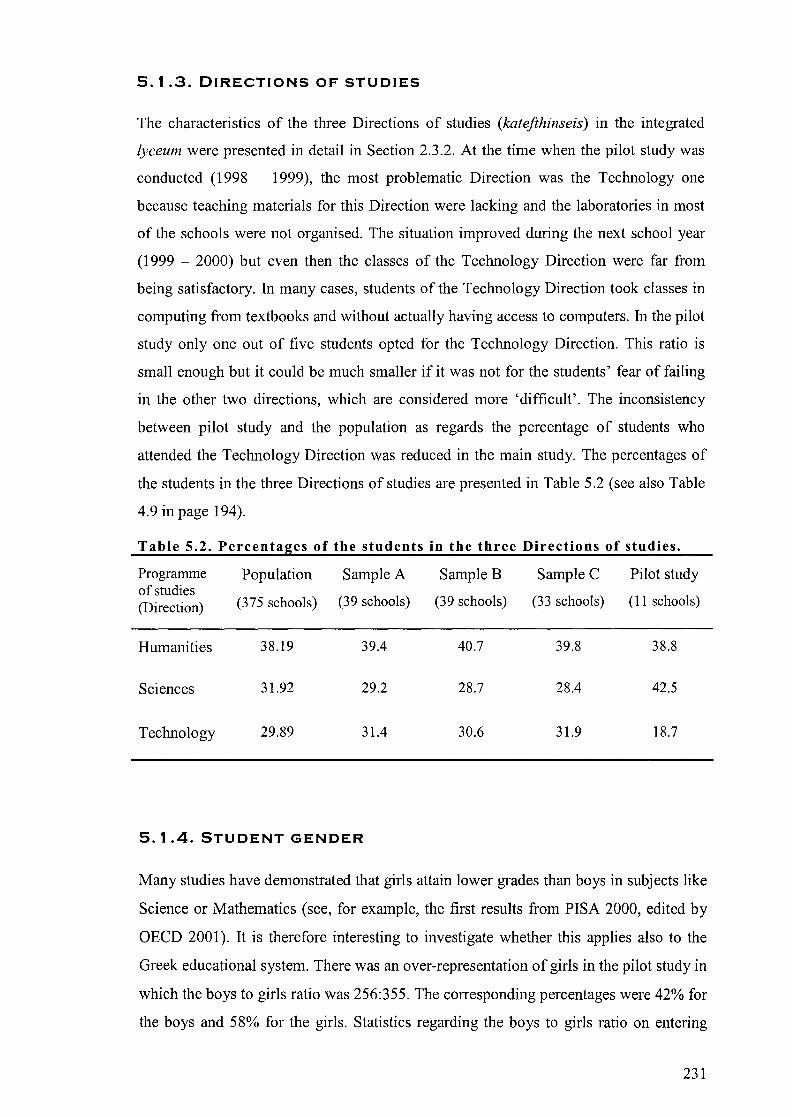
5.1.3. DIRECTIONS OF STUDIES
The characteristics of the three Directions of studies (katefthinseis) in the integrated
lyceum were presented in detail in Section 2.3.2. At the time when the pilot study was
conducted (1998 - 1999), the most problematic Direction was the Technology one
because teaching materials for this Direction were lacking and the laboratories in most
of the schools were not organised. The situation improved during the next school year
(1999 - 2000) but even then the classes of the Technology Direction were far from
being satisfactory. In many cases, students of the Technology Direction took classes in
computing from textbooks and without actually having access to computers. In the pilot
study only one out of five students opted for the Technology Direction. This ratio is
small enough but it could be much smaller if it was not for the students' fear of failing
in the other two directions, which are considered more 'difficult'. The inconsistency
between pilot study and the population as regards the percentage of students who
attended the Technology Direction was reduced in the main study. The percentages of
the students in the three Directions of studies are presented in Table 5.2 (see also Table
4.9 in page 194).
Table 5.2. Percentages of the students in the three Directions of studies.
Programme Population Sample A Sample B Sample C Pilot study of studies (Direction) (375 schools) (39 schools) (39 schools) (33 schools) (11 schools)
Humanities 38.19 39.4 40.7 39.8 38.8
Sciences 31.92 29.2 28.7 28.4 42.5
Technology 29.89 31.4 30.6 31.9 18.7
5.1.4. STUDENT GENDER
Many studies have demonstrated that girls attain lower grades than boys in subjects like
Science or Mathematics (see, for example, the first results from PISA 2000, edited by
OECD 2001). It is therefore interesting to investigate whether this applies also to the
Greek educational system. There was an over-representation of girls in the pilot study in
which the boys to girls ratio was 256:355. The corresponding percentages were 42% for
the boys and 58% for the girls. Statistics regarding the boys to girls ratio on entering
231
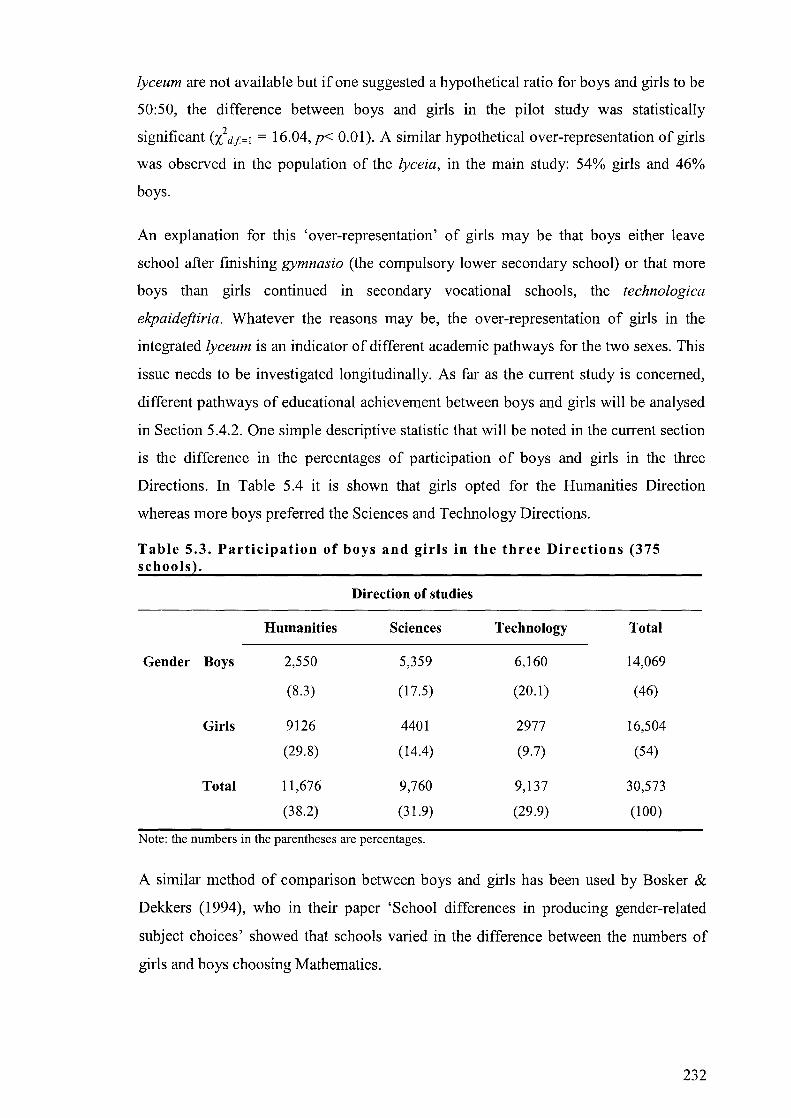
lyceum are not available but if one suggested a hypothetical ratio for boys and girls to be
50:50, the difference between boys and girls in the pilot study was statistically
significant (l df=! = 16.04, p< 0.01). A similar hypothetical over-representation of girls
was observed in the population of the lyceia, in the main study: 54% girls and 46%
boys.
An explanation for this 'over-representation' of girls may be that boys either leave
school after finishing gymnasia (the compulsory lower secondary school) or that more
boys than girls continued in secondary vocational schools, the technalagica
ekpaidefliria. Whatever the reasons may be, the over-representation of girls in the
integrated lyceum is an indicator of different academic pathways for the two sexes. This
issue needs to be investigated longitudinally. As far as the current study is concerned,
different pathways of educational achievement between boys and girls will be analysed
in Section 5.4.2. One simple descriptive statistic that will be noted in the current section
is the difference in the percentages of participation of boys and girls in the three
Directions. In Table 5.4 it is shown that girls opted for the Humanities Direction
whereas more boys preferred the Sciences and Technology Directions.
Table 5.3. Participation of boys and girls in the three Directions (375 schools).
Direction of studies
Humanities Sciences Technology Total
Gender Boys 2,550 5,359 6,160 14,069
(8.3) (17.5) (20.1) (46)
Girls 9126 4401 2977 16,504
(29.8) (14.4) (9.7) (54)
Total 11,676 9,760 9,137 30,573
(38.2) (31.9) (29.9) (100)
Note: the numbers in the parentheses are percentages.
A similar method of comparison between boys and girls has been used by Bosker &
Dekkers (1994), who in their paper 'School differences in producing gender-related
subject choices' showed that schools varied in the difference between the numbers of
girls and boys choosing Mathematics.
232
5.1 .5. STUDENT MOBILITY
A number of studies in England have shown that students' mobility affects their
achievement in a negative manner (Sammons, 1996). The effect of mobility on
achievement is such that in England the Office for Standards in Education has published
special guidelines for measuring students' mobility OFSTED (1994). In addition,
statisticians in the London Institute of Education have developed special algorithms for
allowing multiple previous school membership to be modelled (Rasbash & Goldstein,
1994). In the pilot study, three measures of students' mobility were used: (a) whether
students attended the same lyceum in 1998 - 1999 school year, (b) the name of the
lower secondary school (gymnasia) that they attended, and (c) the name of the primary
school that they attended. In the pilot study it was also found that only 9% of the
students had attended a different lyceum in previous years and that these students were
randomly scattered in the 11 schools of the sample (i df=lO =6.94, p=0.7). In the main
study (Sample B), 305 students (25.4%) attended different lyceum in year 2. The name
of the primary school was not asked. Both in the pilot and the main study, it was found
that having attended a different lyceum in the previous year did not show any
statistically significant difference either in academic achievement or in other school
outcomes.
As regards previous multiple school membership, it was found in the pilot study that
students attended 57 different gymnasia (lower secondary schools) before enrolling in
the 11 lyceia of the sample. Most of the students (86.4%) attended 14 gymnasia,
roughly the number of lyceia in the pilot study. This was not unexpected because in
Greece gymnasia share the same buildings with lyceia. Normally, therefore, students do
not physically change their school building when they continue in lyceum after
gymnasia. As regards the primary schools, it was found that in the pilot study 68 per
cent of the students attended 30 different primary schools. The total number of primary
schools attended by students in the sample of the pilot work was 163. In conclusion, it
was found that students' mobility was not a significant factor in accounting for variation
in the attainment of other educational outcomes. This finding might be expected
because in Greece, there is no open enrolment policy and all students attend the school
that happens to be nearest to their house.
233

5.1.6. STUDENT SOCIO-ECONOMIC STATUS
The role of parents' socio-economic status was explored III Section 4.3.3. In the
questionnaire of the main study, 11 numbered 'cards' were printed, each one with
different categories of trades and professions. Each card included a general description
of similar occupations and some examples. The basis for the construction of the 11
occupation cards was a recent pUblication about social class and social mobility in
Ireland (Breen & Whelan, 1996: 21). The reason for using this publication was
explained in Section 4.3.3. The numbers in the cards were not arranged according to the
status of the professions in them. For example, teachers were included in the card
numbered '1', whereas the 'unemployed' (including 'inactive') were put in the card
number' 3'. Students were initially asked to write in special places in the questionnaires
the number of the card that represented the occupation of their parents. The students
were then asked to describe their parents' occupation in their own words. This
procedure proved to be very useful in the preparation of the database because the
numbers were compared with the written descriptions. From these comparisons it was
found that the use of the numbered cards provided a reliable method for identifying
parents' occupations. As regards parents' educational level, exactly the same procedure
was followed but this time with eight numbered cards. Each card described an
educational level. The occupation and the educational level of the parents are presented
in Table 5.4 and Table 5.5 respectively. The numbers in the parentheses are
percentages.
Table 5.4. Father's and mother's occneation !Samele B~.
I. 2. 3. 4. 5. 6.
Lower-grade Managers in Unem- Agricultural Semiskilled Skilled man-professionals, small industrial ployed or and other manual ual workers administrators establishments inactive workers in workers (not and officials, (state or pri- primary pro- in primary in education, vate), supervisor duction production police, etc of non-manual
employers
Father's 302 106 79 7 58 152 occupation (25.2) (8.8) (6.6) (0.6) (4.8) (12.7)
Mother's 320 51 592 2 58 53 occupation (26.4) (4.2) (48.9) (0.2) (4.8) (4.4 Note: the numbers in the parentheses are percentages.
234
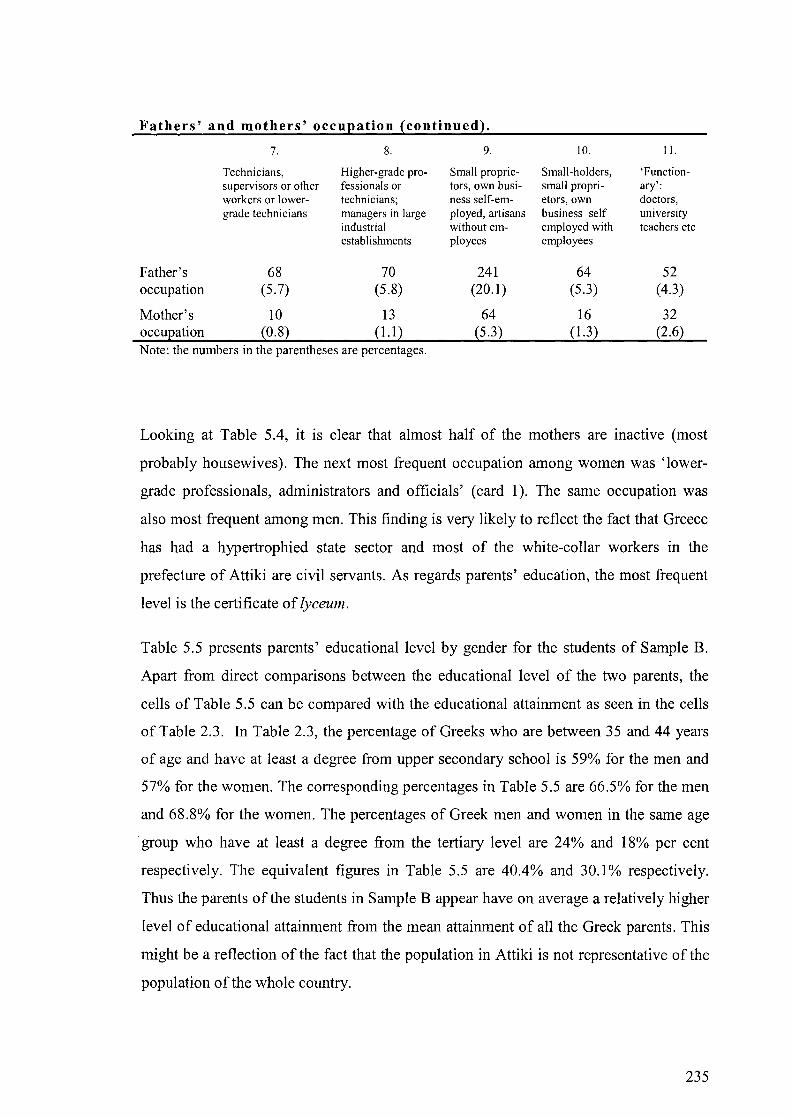
Fathers' and mothers' occul!ation ~continued~.
7. 8. 9. 10. II.
Technicians, Higher-grade pro- Small proprie- Small-holders, 'Function-supervisors or other fessionals or tors, own busi- small propri- ary': workers or lower- technicians; ness self-em- etors, own doctors, grade technicians managers in large ployed, artisans business self university
industrial without em- employed with teachers etc establishments ployees employees
Father's 68 70 241 64 52 occupation (5.7) (5.8) (20.1) (5.3) (4.3)
Mother's 10 13 64 16 32 occuEation (0.82 (1.12 (5.3) (1.32 (2.62 Note: the numbers in the parentheses are percentages.
Looking at Table 5.4, it is clear that almost half of the mothers are inactive (most
probably housewives). The next most frequent occupation among women was 'lower
grade professionals, administrators and officials' (card 1). The same occupation was
also most frequent among men. This finding is very likely to reflect the fact that Greece
has had a hypertrophied state sector and most of the white-collar workers in the
prefecture of Attiki are civil servants. As regards parents' education, the most frequent
level is the certificate of lyceum.
Table 5.5 presents parents' educational level by gender for the students of Sample B.
Apart from direct comparisons between the educational level of the two parents, the
cells of Table 5.5 can be compared with the educational attainment as seen in the cells
of Table 2.3. In Table 2.3, the percentage of Greeks who are between 35 and 44 years
of age and have at least a degree from upper secondary school is 59% for the men and
57% for the women. The corresponding percentages in Table 5.5 are 66.5% for the men
and 68.8% for the women. The percentages of Greek men and women in the same age
group who have at least a degree from the tertiary level are 24% and 18% per cent
respectively. The equivalent figures in Table 5.5 are 40.4% and 30.1 % respectively.
Thus the parents of the students in Sample B appear have on average a relatively higher
level of educational attainment from the mean attainment of all the Greek parents. This
might be a reflection of the fact that the population in Attiki is not representative of the
population of the whole country.
235
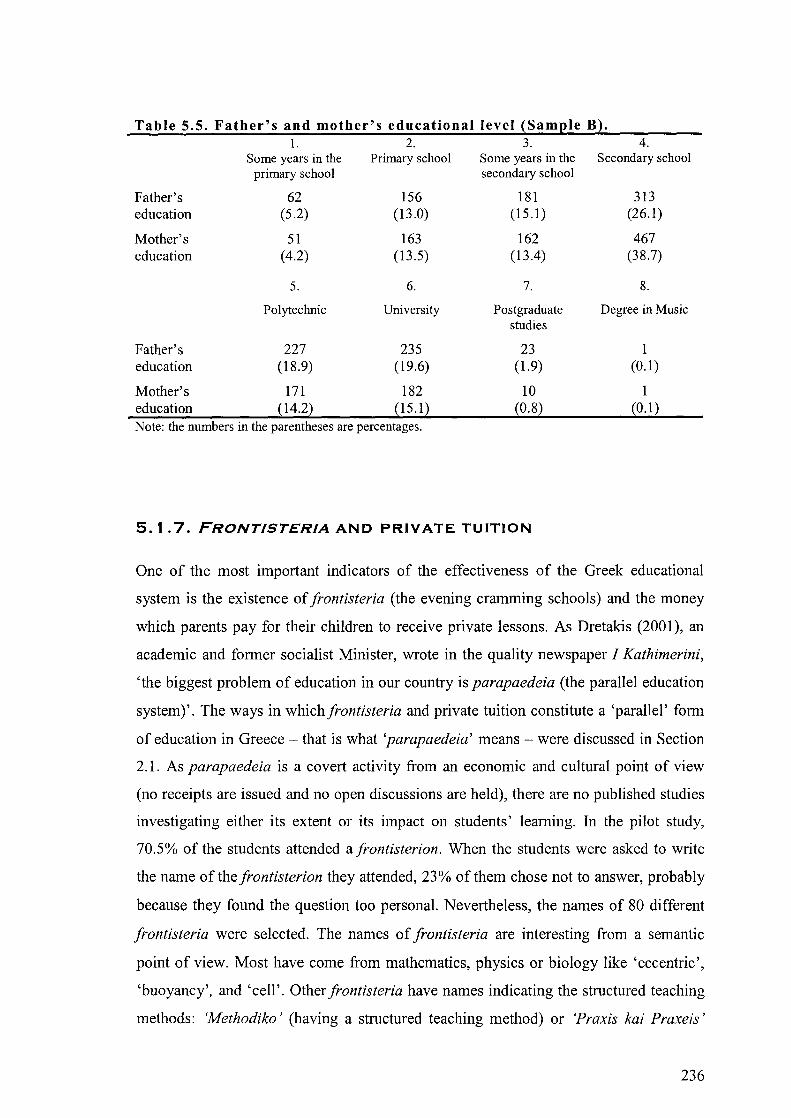
Table 5.5. Father's and mother's educational level {Samele B~. 1. 2. 3. 4.
Some years in the Primary school Some years in the Secondary school primary school secondary school
Father's 62 156 181 313 education (5.2) (13.0) (15.1) (26.1)
Mother's 51 163 162 467 education (4.2) (13.5) (13.4) (38.7)
5. 6. 7. 8.
Polytechnic University Postgraduate Degree in Music studies
Father's 227 235 23 1 education (18.9) (19.6) (1.9) (0.1)
Mother's 171 182 10 1 education (14.2) (15.1) (0.8) (0.1) Note: the numbers in the parentheses are percentages.
5.1.7. FRONTISTERIA AND PRIVATE TUITION
One of the most important indicators of the effectiveness of the Greek educational
system is the existence of frontisteria (the evening cramming schools) and the money
which parents pay for their children to receive private lessons. As Dretakis (2001), an
academic and former socialist Minister, wrote in the quality newspaper I Kathimerini,
'the biggest problem of education in our country is parapaedeia (the parallel education
system)'. The ways in whichfrontisteria and private tuition constitute a 'paralle1' form
of education in Greece - that is what 'parapaedeia' means - were discussed in Section
2.1. As parapaedeia is a covert activity from an economic and cultural point of view
(no receipts are issued and no open discussions are held), there are no published studies
investigating either its extent or its impact on students' learning. In the pilot study,
70.5% of the students attended a frontisterion. When the students were asked to write
the name of the frontisterion they attended, 23% of them chose not to answer, probably
because they found the question too personal. Nevertheless, the names of 80 different
frontisteria were selected. The names of frontisteria are interesting from a semantic
point of view. Most have come from mathematics, physics or biology like 'eccentric',
'buoyancy', and 'cell'. Other frontisteria have names indicating the structured teaching
methods: 'Methodiko' (having a structured teaching method) or 'Praxis kai Praxeis'
236
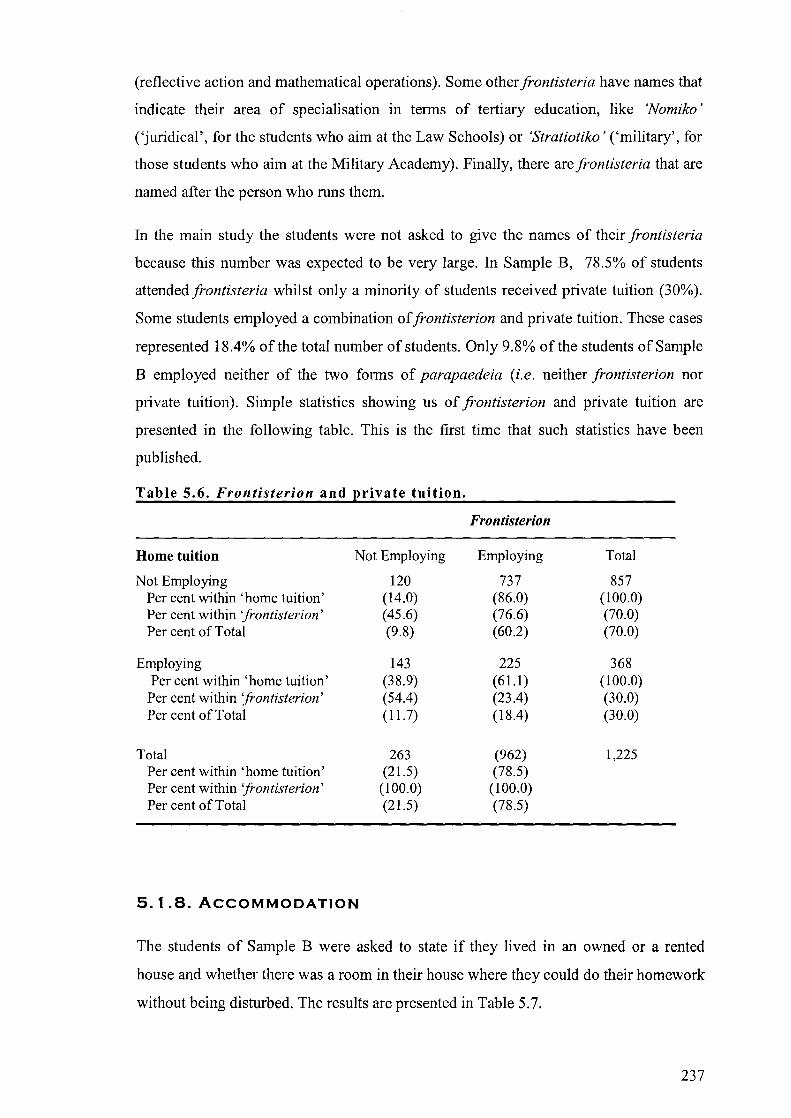
(reflective action and mathematical operations). Some otherfrontisteria have names that
indicate their area of specialisation in terms of tertiary education, like 'Nomiko'
('juridical', for the students who aim at the Law Schools) or 'Stratiotiko' ('military', for
those students who aim at the Military Academy). Finally, there are frontisteria that are
named after the person who runs them.
In the main study the students were not asked to give the names of their jrontisteria
because this number was expected to be very large. In Sample B, 78.5% of students
attendedfrontisteria whilst only a minority of students received private tuition (30%).
Some students employed a combination offrontisterion and private tuition. These cases
represented 18.4% of the total number of students. Only 9.8% of the students of Sample
B employed neither of the two forms of parapaedeia (i.e. neither frontisterion nor
private tuition). Simple statistics showing us of frontisterion and private tuition are
presented in the following table. This is the first time that such statistics have been
published.
Table 5.6. Frontisterion and private tuition.
Frontisterion
Home tuition Not Employing Employing Total
Not Employing 120 737 857 Per cent within 'home tuition' (14.0) (86.0) (100.0) Per cent within 'jrontisterion' (45.6) (76.6) (70.0) Per cent of Total (9.8) (60.2) (70.0)
Employing 143 225 368 Per cent within 'home tuition' (38.9) (61.1) (100.0)
Per cent within 'jrontisterion' (54.4) (23.4) (30.0) Per cent of Total (11.7) (18.4) (30.0)
Total 263 (962) 1,225 Per cent within 'home tuition' (21.5) (78.5) Per cent within 'jrontisterion' (100.0) (100.0) Per cent of Total (21.5) (78.5)
5.1.8. ACCOMMODATION
The students of Sample B were asked to state if they lived in an owned or a rented
house and whether there was a room in their house where they could do their homework
without being disturbed. The results are presented in Table 5.7.
237
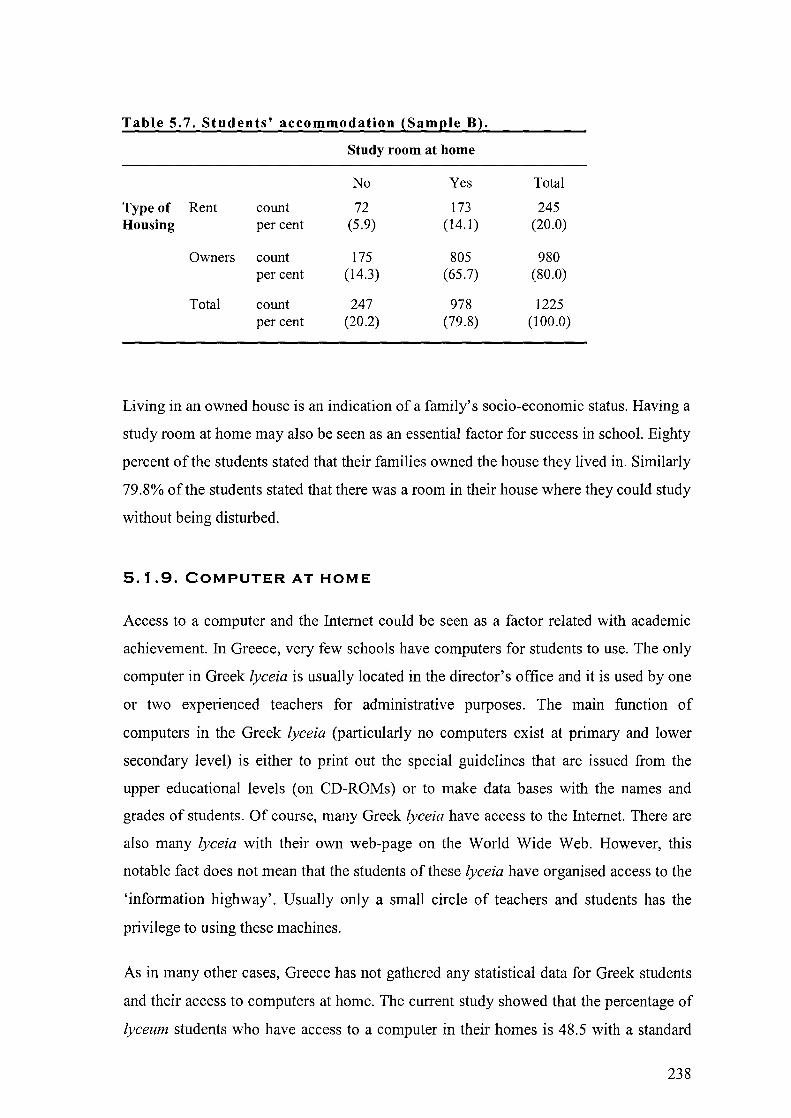
Table 5.7. Students' accommodation ~Sam~le B~.
Study room at home
No Yes Total
Type of Rent count 72 173 245 Housing per cent (5.9) (14.1) (20.0)
Owners count 175 805 980 per cent (14.3) (65.7) (80.0)
Total count 247 978 1225 per cent (20.2) (79.8) (100.0)
Living in an owned house is an indication of a family's socio-economic status. Having a
study room at home may also be seen as an essential factor for success in school. Eighty
percent of the students stated that their families owned the house they lived in. Similarly
79.8% of the students stated that there was a room in their house where they could study
without being disturbed.
5.1.9. COMPUTER AT HOME
Access to a computer and the Internet could be seen as a factor related with academic
achievement. In Greece, very few schools have computers for students to use. The only
computer in Greek lyceia is usually located in the director's office and it is used by one
or two experienced teachers for administrative purposes. The main function of
computers in the Greek lyceia (particularly no computers exist at primary and lower
secondary level) is either to print out the special guidelines that are issued from the
upper educational levels (on CD-ROMs) or to make data bases with the names and
grades of students. Of course, many Greek lyceia have access to the Internet. There are
also many lyceia with their own web-page on the World Wide Web. However, this
notable fact does not mean that the students of these lyceia have organised access to the
'information highway'. Usually only a small circle of teachers and students has the
privilege to using these machines.
As in many other cases, Greece has not gathered any statistical data for Greek students
and their access to computers at home. The current study showed that the percentage of
lyceum students who have access to a computer in their homes is 48.5 with a standard
238

error of 1.43 (Sample B). This figure is very near to the unweighted average of the
OECD countries that for the year 1998 was 40 per cent (see OECD-CERI, 2001: 149).
The OECD unweighted average for students per computer in upper secondary education
is 13 per cent. In the current study, none of the schools of Sample B had had any
organised access to computers for their students.
5.1.10. SOCIO-ECONOMIC STATUS, PARAPAEDEIA AND ACCESS TO COMPUTER
As claimed by the current author in Section 2.1.3, the Greek shadow education system
of parapaedeia is associated with family's socio-economic status. However, no studies
have been carried out to investigate this hypothetical association. The present study
offers some evidence for the statistical significance and the strength of the association
between father's occupation and mother educational level from the one hand and
frontisterio attendance, idiaitero, and access to computer from the other.
In order to test the hypothesis that father's occupation is independent from attending
frontisterio, taking idiaitero or having access to a computer at home, the current
researcher constructed two-way contingency tables and used the chi square test of
independence (Likelihood Ratio) with 9 degrees of freedom. In addition, Cramer's V
coefficient was used for measuring the strength of the association. Table 5.8 represents
three two-way contingency tables. The fourth occupational category ('agricultural and
other workers in primary production') is missing from Table 5.8 because the expected
values for independence for this category were too small for the chi square distribution
to be continuous. With the remaining 11 categories it was found that frontisterion
attendance is not associated with father's occupation. The chi square test for
jrontisterion was I = 8.535 (p = 0.481) and the associated Cramer's V coefficient was
0.092 (p = 0.507). However taking idiaiteron and having a computer in home are two
variables that if taken separately are highly associated with father's occupation. For
idiaiteron the value of chi square was I = 46.811 (p = 0.000) and for 'computer' the
chi square was I = 38.577 (p=O.OOO). The strength of the statistically significant
associations which were described above was relatively small. Cramer's V coefficient
between father's occupation and idiaiteron was 0.224 (p = 0.000). The corresponding
coefficient between father's occupation and 'computer' was only 0.196 (p = 0.000).
239
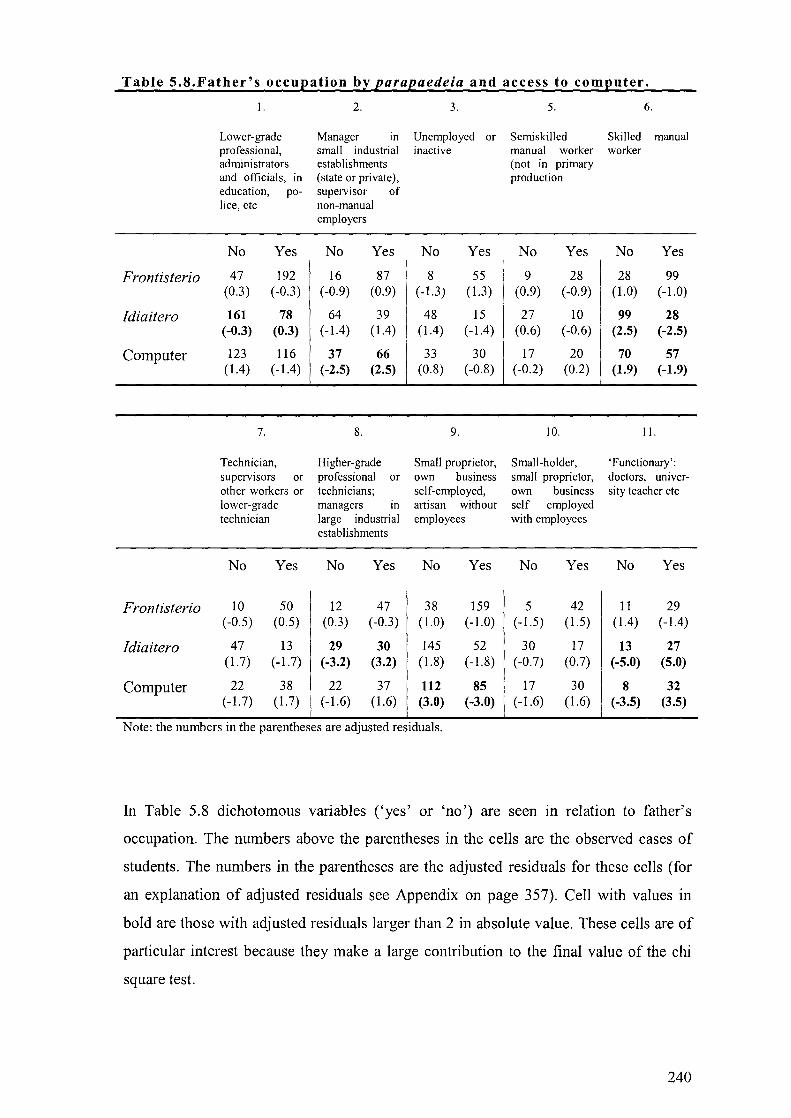
Table 5.8.Father's occupation by parapaedeia and access to computer.
Frontisterio
!diaitero
Computer
Frontisterio
Idiaitero
Computer
I.
Lower-grade professional, administrators and officials, in education, po-lice, etc
No Yes
47 192 (0.3) ( -0.3)
161 78 (-0.3) (0.3)
123 116 (1.4) (-1.4)
7.
Technician, supervisors or other workers or lower-grade technician
No Yes
10 50 (-0.5) (0.5)
47 13 (1.7) (-1. 7)
22 38 (-1.7) (1.7)
2.
Manager m small industrial establishments (state or private), supervisor of non-manual employers
No Yes
16 87 (-0.9) (0.9)
64 39 (-1.4) (1.4)
37 66 (-2.5) (2.5)
8.
Higher-grade professional or technicians; managers in large industrial establishments
No Yes
12 47 (0.3) ( -0.3)
29 30 (-3.2) (3.2)
22 37 ( -1.6) (1.6)
3.
Unemployed or inactive
No Yes
8 55 (-1.3) (1.3)
48 15 (1.4) (-1.4)
33 30 (0.8) ( -0.8)
9.
Small proprietor, own business self-employed, artisan without employees
No Yes
38 159 (1.0) (-1.0)
145 52 (1.8) (-1.8)
112 85 (3.0) (-3.0)
Note: the numbers III the parentheses are adjusted resIduals.
5.
Semiskilled manual worker (not m primary production
No Yes
9 28 (0.9) ( -0.9)
27 10 (0.6) ( -0.6)
17 20 (-0.2) (0.2)
10.
Small-holder, small proprietor, own business self employed with employees
No Yes
5 42 (-1.5) (1.5)
30 17 ( -0.7) (0.7)
17 30 ( -1.6) (1.6)
6.
Skilled manual worker
No Yes
28 99 (1.0) (-1.0)
99 28 (2.5) (-2.5)
70 57 (1.9) (-1.9)
11.
'Functionary': doctors, university teacher etc
No Yes
11 29 (1.4) (-1.4)
13 27 (-5.0) (5.0)
8 32 (-3.5) (3.5)
In Table 5.8 dichotomous variables ('yes' or 'no') are seen in relation to father's
occupation. The numbers above the parentheses in the cells are the observed cases of
students. The numbers in the parentheses are the adjusted residuals for these cells (for
an explanation of adjusted residuals see Appendix on page 357). Cell with values in
bold are those with adjusted residuals larger than 2 in absolute value. These cells are of
particular interest because they make a large contribution to the final value of the chi
square test.
240
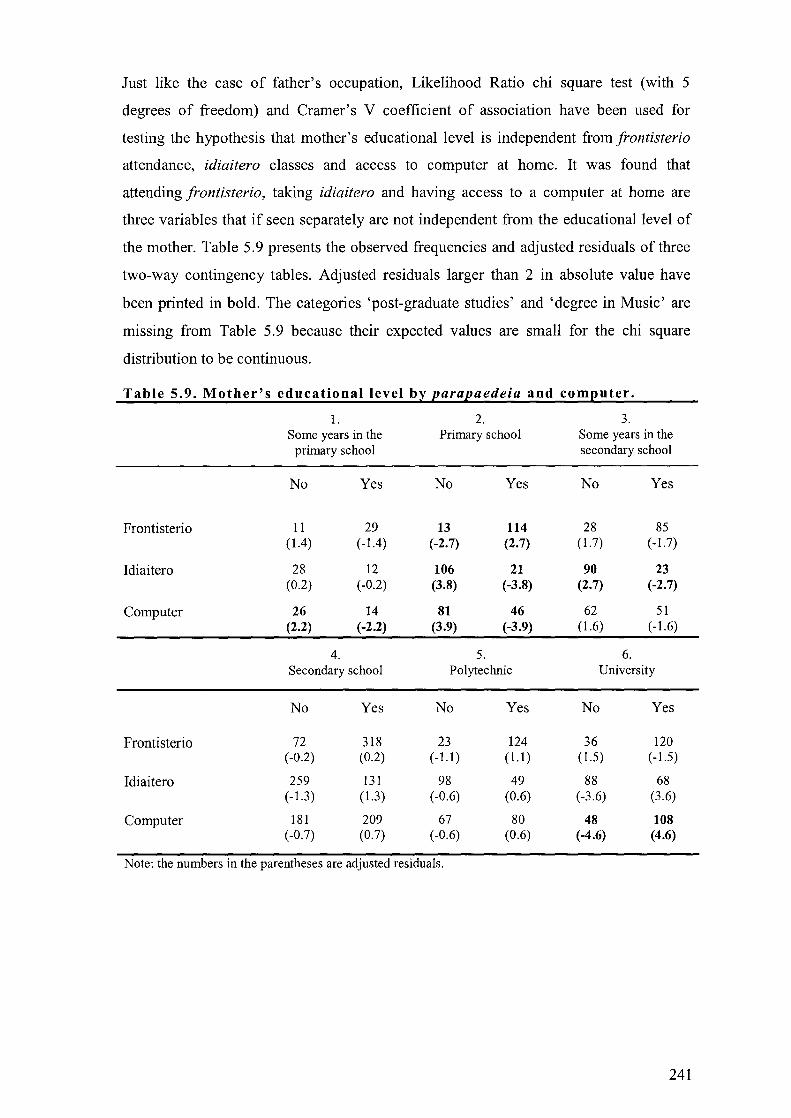
Just like the case of father's occupation, Likelihood Ratio chi square test (with 5
degrees of freedom) and Cramer's V coefficient of association have been used for
testing the hypothesis that mother's educational level is independent from jrontisterio
attendance, idiaitero classes and access to computer at home. It was found that
attending jrontisterio, taking idiaitero and having access to a computer at home are
three variables that if seen separately are not independent from the educational level of
the mother. Table 5.9 presents the observed frequencies and adjusted residuals of three
two-way contingency tables. Adjusted residuals larger than 2 in absolute value have
been printed in bold. The categories 'post-graduate studies' and 'degree in Music' are
missing from Table 5.9 because their expected values are small for the chi square
distribution to be continuous.
Table 5.9. Mother's educational level by parapaedeia and computer.
1. 2. 3. Some years in the Primary school Some years in the
primary school secondary school
No Yes No Yes No Yes
Frontisterio 11 29 13 114 28 85 (1.4) (-1.4) (-2.7) (2.7) (1.7) ( -1.7)
Idiaitero 28 12 106 21 90 23 (0.2) ( -0.2) (3.8) (-3.8) (2.7) (-2.7)
Computer 26 14 81 46 62 51 (2.2) (-2.2) (3.9) (-3.9) (1.6) ( -1.6)
4. 5. 6. Secondary school Polytechnic University
No Yes No Yes No Yes
Frontisterio 72 318 23 124 36 120 ( -0.2) (0.2) (-1.1) (1.1) (1.5) ( -1.5)
Idiaitero 259 131 98 49 88 68 (-1.3) (1.3) ( -0.6) (0.6) ( -3.6) (3.6)
Computer 181 209 67 80 48 108 ( -0.7) (0.7) ( -0.6) (0.6) (-4.6) (4.6)
Note: the numbers in the parentheses are adjusted residuals.
241
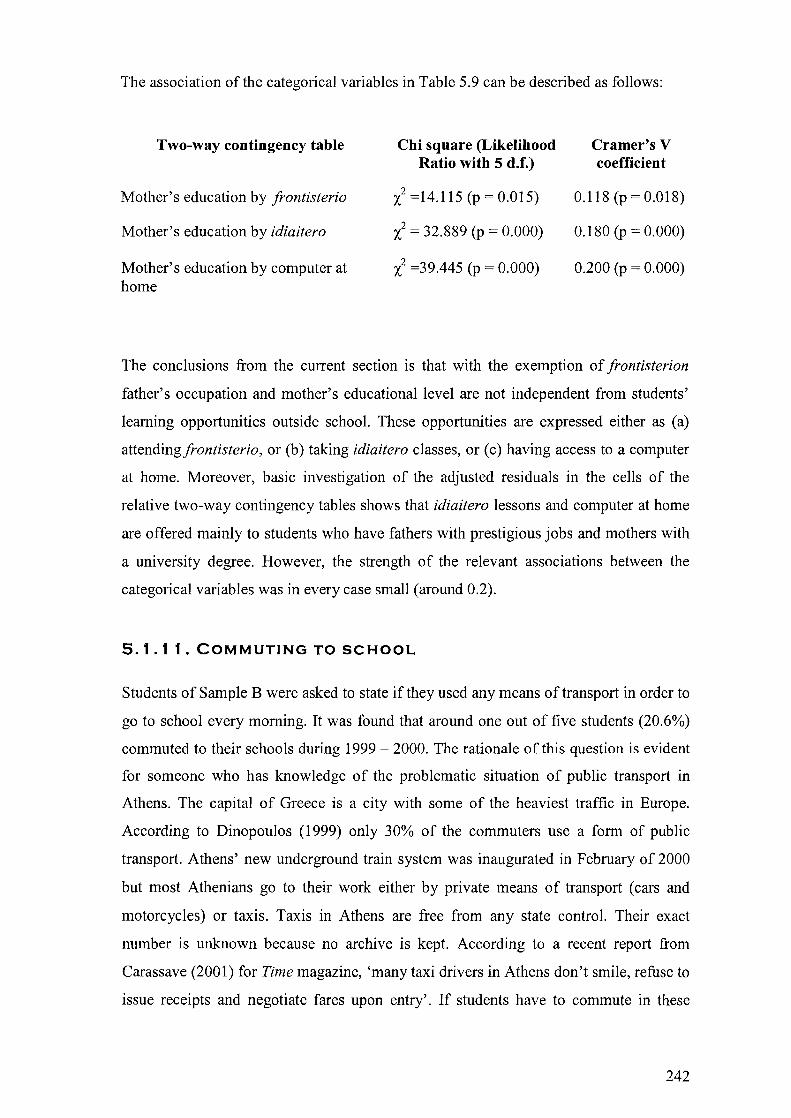
The association of the categorical variables in Table 5.9 can be described as follows:
Two-way contingency table
Mother's education by jrontisterio
Mother's education by idiaitero
Mother's education by computer at home
Chi square (Likelihood Ratio with 5 d.f.)
X2 =14.115 (p = 0.015)
l = 32.889 (p = 0.000)
X2 =39.445 (p = 0.000)
Cramer's V coefficient
0.118 (p = 0.018)
0.180 (p = 0.000)
0.200 (p = 0.000)
The conclusions from the current section is that with the exemption of jrontisterion
father's occupation and mother's educational level are not independent from students'
learning opportunities outside school. These opportunities are expressed either as (a)
attendingjrontisterio, or (b) taking idiaitero classes, or (c) having access to a computer
at home. Moreover, basic investigation of the adjusted residuals in the cells of the
relative two-way contingency tables shows that idiaitero lessons and computer at home
are offered mainly to students who have fathers with prestigious jobs and mothers with
a university degree. However, the strength of the relevant associations between the
categorical variables was in every case small (around 0.2).
5.1.11. COMMUTING TO SCHOOL
Students of Sample B were asked to state if they used any means of transport in order to
go to school every morning. It was found that around one out of five students (20.6%)
commuted to their schools during 1999 - 2000. The rationale of this question is evident
for someone who has knowledge of the problematic situation of public transport in
Athens. The capital of Greece is a city with some of the heaviest traffic in Europe.
According to Dinopoulos (1999) only 30% of the commuters use a form of public
transport. Athens' new underground train system was inaugurated in February of 2000
but most Athenians go to their work either by private means of transport (cars and
motorcycles) or taxis. Taxis in Athens are free from any state control. Their exact
number is unknown because no archive is kept. According to a recent report from
Carassave (2001) for Time magazine, 'many taxi drivers in Athens don't smile, refuse to
issue receipts and negotiate fares upon entry'. If students have to commute in these
242
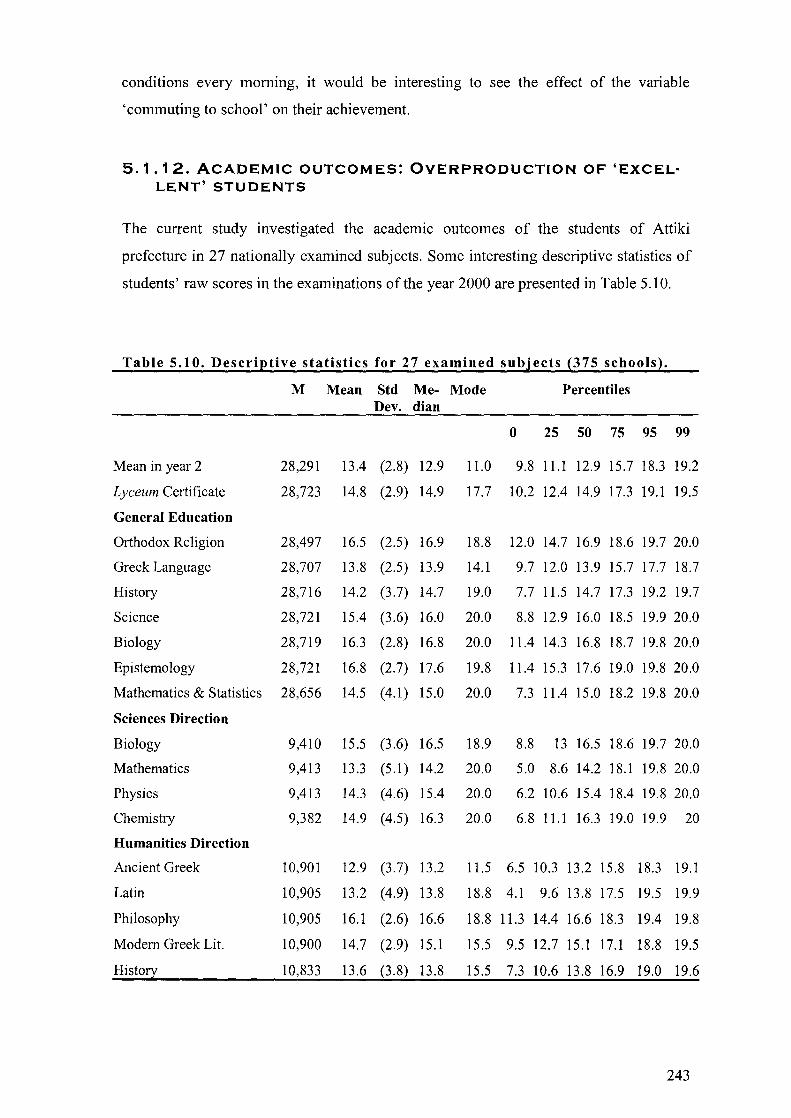
conditions every morning, it would be interesting to see the effect of the variable
'commuting to school' on their achievement.
5.1.12. ACADEMIC OUTCOMES: OVERPRODUCTION OF 'EXCELLENT'STUDENTS
The current study investigated the academic outcomes of the students of Attiki
prefecture in 27 nationally examined subjects. Some interesting descriptive statistics of
students' raw scores in the examinations of the year 2000 are presented in Table 5.10.
Table 5.10. Descri~tive statistics for 27 examined subjects p75 schooisl'
M Mean Std Me- Mode Percentiles Dev. dian
0 25 50 75 95 99
Mean in year 2 28,291 13.4 (2.8) 12.9 11.0 9.8 11.1 12.9 15.7 18.3 19.2
Lyceum Certificate 28,723 14.8 (2.9) 14.9 17.7 10.2 12.4 14.9 17.3 19.1 19.5
General Education
Orthodox Religion 28,497 16.5 (2.5) 16.9 18.8 12.0 14.7 16.9 18.6 19.7 20.0
Greek Language 28,707 13.8 (2.5) 13.9 14.1 9.7 12.0 13.9 15.7 17.7 18.7
History 28,716 14.2 (3.7) 14.7 19.0 7.7 11.5 14.7 17.3 19.2 19.7
Science 28,721 15.4 (3.6) 16.0 20.0 8.8 12.9 16.0 18.5 19.9 20.0
Biology 28,719 16.3 (2.8) 16.8 20.0 11.4 14.3 16.8 18.7 19.8 20.0
Epistemology 28,721 16.8 (2.7) 17.6 19.8 11.4 15.3 17.6 19.0 19.8 20.0
Mathematics & Statistics 28,656 14.5 (4.1) 15.0 20.0 7.3 11.4 15.0 18.2 19.8 20.0
Sciences Direction
Biology 9,410 15.5 (3.6) 16.5 18.9 8.8 13 16.5 18.6 19.7 20.0
Mathematics 9,413 13.3 (5.1) 14.2 20.0 5.0 8.6 14.2 18.1 19.8 20.0
Physics 9,413 14.3 (4.6) 15.4 20.0 6.2 10.6 15.4 18.4 19.8 20.0
Chemistry 9,382 14.9 (4.5) 16.3 20.0 6.8 11.1 16.3 19.0 19.9 20
Humanities Direction
Ancient Greek 10,901 12.9 (3.7) 13.2 11.5 6.5 10.3 13.2 15.8 18.3 19.1
Latin 10,905 13.2 (4.9) 13.8 18.8 4.1 9.6 13.8 17.5 19.5 19.9
Philosophy 10,905 16.1 (2.6) 16.6 18.8 11.3 14.4 16.6 18.3 19.4 19.8
Modem Greek Lit. 10,900 14.7 (2.9) 15.1 15.5 9.5 12.7 15.1 17.1 18.8 19.5
Histo!! 10,833 13.6 (3.8) 13.8 15.5 7.3 10.6 13.8 16.9 19.0 19.6
243

Descri~tive statistics for 27 examined subjects {J75 schooisl.
N Mean Std Me- Mode Percentiles Dev. dian
0 25 50 75 95 99
Technology Direction I
Mathematics 8,135 9.6 (5.0) 8.7 6.5 2.9 5.3 8.7 13.6 18.5 19.6
Physics 8,138 9.7 (4.4) 8.5 6.5 4.2 6.2 8.5 12.8 18.3 19.6
Management Studies 8,148 14.2 (2.9) 14.1 14.3 9.8 12.1 14.1 16.3 18.8 19.7
Information Systems 7,947 14.8 (3.2) 15.0 20.0 9.3 12.5 15.0 17.3 19.4 20.0
Software Development 7,706 14.7 (3.0) 14.8 14.3 9.9 12.7 14.8 17.0 19.1 19.8
Economics 9,753 15.5 (3.5) 16.3 19.5 8.9 13.2 16.3 18.4 19.7 20.0
Technology Direct. II
Electrical Engineering 269 16.3 (3.0) 16.8 19.7 10.9 14.4 16.8 18.6 19.9 20.0
Mathematics 269 12.5 (5.5) 13.6 18.9 3.3 7.7 13.6 17.8 19.5 19.9
Physics 268 12.8 (5.2) 13.5 18.6 4.7 8.5 13.5 18.0 19.7 20.0
Chemistry & Biology 267 14.7 (4.0) 15.3 18.8 7.1 11.7 15.3 18.2 19.7 20.0
Technology & Develp. 327 15.6 (3.5) 16.6 18.9 8.7 13.5 16.6 18.3 19.5 19.8
By examining Table S.l 0, it can be concluded that the kurtosis in the distributions of
students' raw scores is negative. The distributions are also negatively skewed. As can be
seen on the right hand part of Table S.10, the raw scores of the students are accumulated
at the higher points of the grading scales which extend from 1 to 20. The reasons which
affected the shape of the distributions as well as the technique that was followed for the
transformation of the original scores have been presented in Section 4.3.6. In that
section the current researcher had argued that 'one tenth of a grade practically decided
who would succeed and who would be left out from a good university department'. This
argument can now be seen more clearly. For example, the difference between the 7Sth
and the 9Sth percentile for Chemistry (Sciences Direction) is only 0.9 points. This means
that in the examinations for Chemistry of June 2000 1,976 students (21.1%) were
accumulated between grade 19 and 19.9 in Chemistry. In the case of Science of the
General Direction, 1,462 students (S.l%) achieved either a grade of 19.9 or 20. This
phenomenon, i.e. the overproduction of excellence, does not reflect the real abilities of
Greek students. The overproduction of excellence is most likely to be an indicator of the
relatively poor discriminating power of the national examinations. Proposals on how
this situation could be amended will be presented in the sixth chapter of the thesis.
244
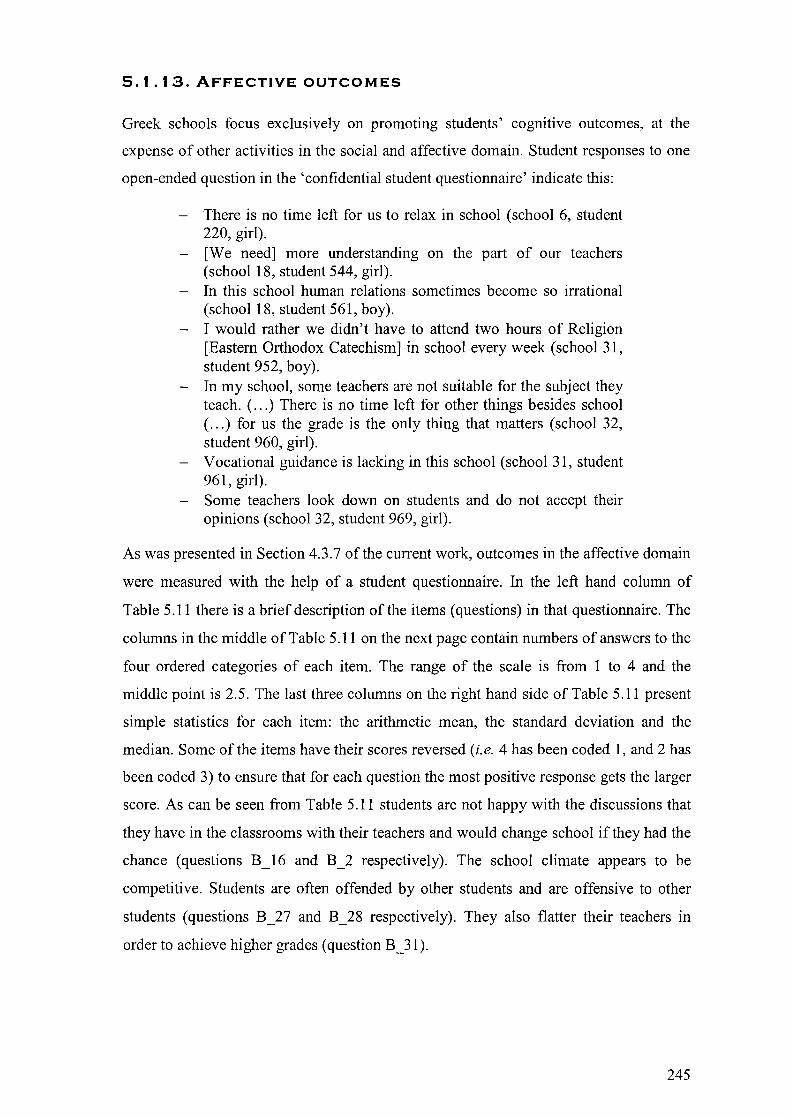
5.1.13. AFFECTIVE OUTCOMES
Greek schools focus exclusively on promoting students' cognitive outcomes, at the
expense of other activities in the social and affective domain. Student responses to one
open-ended question in the 'confidential student questionnaire' indicate this:
- There is no time left for us to relax in school (school 6, student 220, girl).
- [We need] more understanding on the part of our teachers (school 18, student 544, girl).
- In this school human relations sometimes become so irrational (school 18, student 561, boy).
- I would rather we didn't have to attend two hours of Religion [Eastern Orthodox Catechism] in school every week (school 31, student 952, boy).
- In my school, some teachers are not suitable for the subject they teach. ( ... ) There is no time left for other things besides school ( ... ) for us the grade is the only thing that matters (school 32, student 960, girl).
- Vocational guidance is lacking in this school (school 31, student 961, girl).
- Some teachers look down on students and do not accept their opinions (school 32, student 969, girl).
As was presented in Section 4.3.7 of the current work, outcomes in the affective domain
were measured with the help of a student questionnaire. In the left hand column of
Table 5.11 there is a brief description of the items (questions) in that questionnaire. The
columns in the middle of Table 5.11 on the next page contain numbers of answers to the
four ordered categories of each item. The range of the scale is from 1 to 4 and the
middle point is 2.5. The last three columns on the right hand side of Table 5.11 present
simple statistics for each item: the arithmetic mean, the standard deviation and the
median. Some of the items have their scores reversed (i.e. 4 has been coded 1, and 2 has
been coded 3) to ensure that for each question the most positive response gets the larger
score. As can be seen from Table 5.11 students are not happy with the discussions that
they have in the classrooms with their teachers and would change school if they had the
chance (questions B _16 and B_2 respectively). The school climate appears to be
competitive. Students are often offended by other students and are offensive to other
students (questions B _ 27 and B _ 28 respectively). They also flatter their teachers in
order to achieve higher grades (question B _31).
245
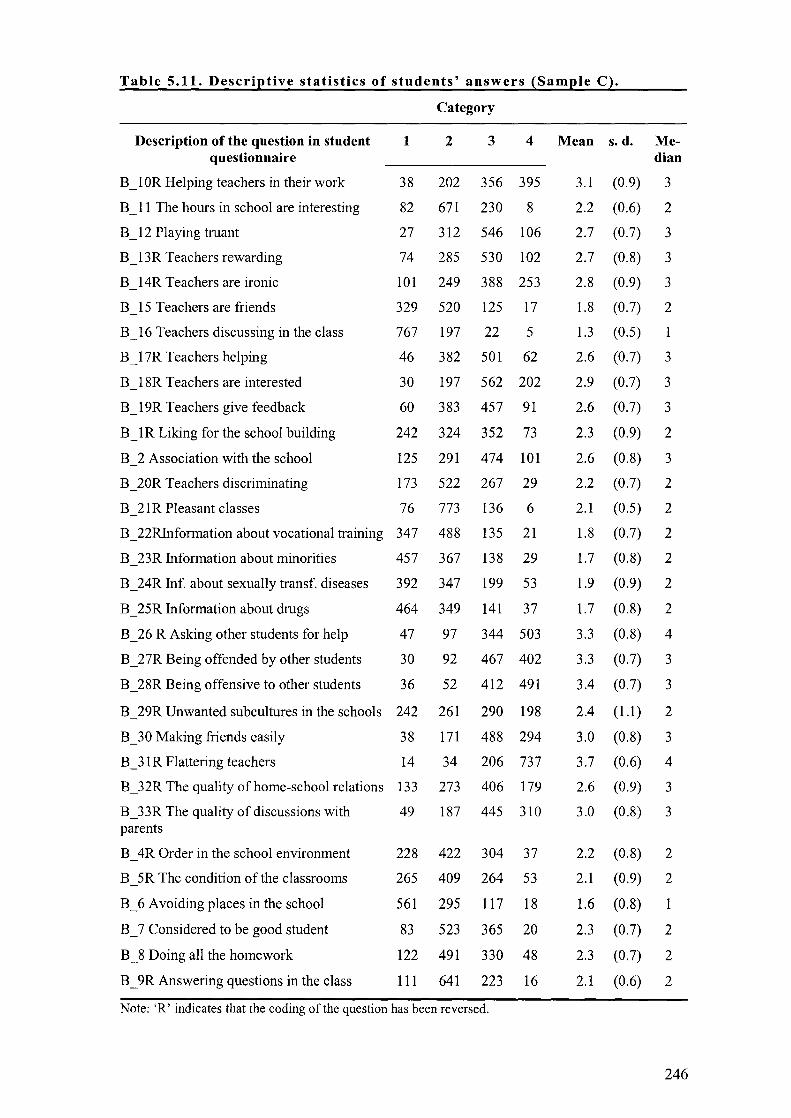
Table 5.11. Descril!tive statistics of students' answers {Saml!le C~.
Category
Description of the question in student 1 2 3 4 Mean s. d. Me-questionnaire dian
B_I0R Helping teachers in their work 38 202 356 395 3.1 (0.9) 3
B _11 The hours in school are interesting 82 671 230 8 2.2 (0.6) 2
B _12 Playing truant 27 312 546 106 2.7 (0.7) 3
B _13R Teachers rewarding 74 285 530 102 2.7 (0.8) 3
B 14R Teachers are ironic 101 249 388 253 2.8 (0.9) 3
B 15 Teachers are friends 329 520 125 17 1.8 (0.7) 2
B_16 Teachers discussing in the class 767 197 22 5 1.3 (0.5)
B _17R Teachers helping 46 382 501 62 2.6 (0.7) 3
B 18R Teachers are interested 30 197 562 202 2.9 (0.7) 3
B _19R Teachers give feedback 60 383 457 91 2.6 (0.7) 3
B_IR Liking for the school building 242 324 352 73 2.3 (0.9) 2
B 2 Association with the school 125 291 474 101 2.6 (0.8) 3
B _ 20R Teachers discriminating 173 522 267 29 2.2 (0.7) 2
B 21R Pleasant classes 76 773 136 6 2.1 (0.5) 2
B _ 22RInformation about vocational training 347 488 135 21 1.8 (0.7) 2
B 23R Information about minorities 457 367 138 29 1.7 (0.8) 2
B_24R Inf. about sexually transf. diseases 392 347 199 53 1.9 (0.9) 2
B _ 25R Information about drugs 464 349 141 37 1.7 (0.8) 2
B _ 26 R Asking other students for help 47 97 344 503 3.3 (0.8) 4
B _ 27R Being offended by other students 30 92 467 402 3.3 (0.7) 3
B _ 28R Being offensive to other students 36 52 412 491 3.4 (0.7) 3
B 29R Unwanted subcultures in the schools 242 261 290 198 2.4 (1.1) 2
B_30 Making friends easily 38 171 488 294 3.0 (0.8) 3
B _ 31 R Flattering teachers 14 34 206 737 3.7 (0.6) 4
B_32R The quality of home-school relations 133 273 406 179 2.6 (0.9) 3
B _33R The quality of discussions with 49 187 445 310 3.0 (0.8) 3 parents
B 4R Order in the school environment 228 422 304 37 2.2 (0.8) 2
B 5R The condition of the classrooms 265 409 264 53 2.1 (0.9) 2
B _ 6 A voiding places in the school 561 295 117 18 1.6 (0.8)
B_7 Considered to be good student 83 523 365 20 2.3 (0.7) 2
B _ 8 Doing all the homework 122 491 330 48 2.3 (0.7) 2
B _9R Answering questions in the class 111 641 223 16 2.1 (0.6) 2
Note: 'R' indicates that the coding of the question has been reversed.
246
From the 991 students of Sample C who answered question number 12 in Table 5.11,
which asks whether they would change their school or not, 125 answered 'yes
definitely' and 291 'yes probably' (total 416 students). From those 416 students, 352
stated also the reasons why they would change schools if they were allowed to. A open
response question was used for this purpose. Students' responses are presented in Table
5.12. The condition of the school building and the behaviour of the teachers were by far
the most important reasons why students would change their schools.
Table 5.12. Reasons for changing school if it was allowed (Sample C).
Reasons Number of answers
The condition of the school building 110
Lack of resources 47
The behaviour of the teachers 90
The behaviour of other students 23
Having to go to school in the evening hours 2
The condition of the school building and the behaviour of the teachers 54
The behaviour of students and teachers 19
The organisation of the school 7
5.1.14. SCHOOL ORGANISATIONAL CLIMATE AND PROCESSES
As has already been stated in Chapter 4, teachers' views on the organisational climate of
their school as well as on a number of school processes and policies were investigated
by means of a questionnaire that was administered to 223 teachers from 38 schools
(Sample D). In the following table, teachers' answers to the 38 questions of the
questionnaire are presented analytically, together with a number of simple statistics viz.
the arithmetic mean, the standard deviation and the median. By examining Table 5.13,
we can see that teachers 'fit in well' with their colleagues and that the amount of
unanimity in the teachers' council is high. However, teachers are very dissatisfied with
the rewards of the teaching profession - economical and others - and believe that their
voice is not being heard in the places where important decisions about education are
being taken.
247

Table 5.13. Descri)!tive statistics of teachers' answers {Sam)!le D~.
Category
Description of the items -3 -2 -1 1 2 3 Mean s.d. Me-in teacher questionnaire dian
1. Care for the smooth operation of the 10 13 47 65 61 27 0.7 (1.7) school as a whole
2. Agreement among teachers 8 19 50 74 56 16 0.5 (1.6)
3. New teachers in the school are acquainted 27 51 53 48 36 8 -0.4 (1.8) -1 with their duties in an organised way
4. The sessions of the schoolteachers' 26 43 44 68 29 13 -0.2 (1.8) -1 council have produced significant results
5. Colleagues provide you with advice you 18 31 57 50 53 14 0.1 (1.8) about dealing successfully with the difficulties of the educational work
6. Frequent discussions on educational 6 19 37 57 65 39 0.9 (1.7) issues in the staff room
7. The effective operation of the schools is 14 41 39 79 27 23 0.2 (1.8) regarded as more important than teachers' personal pursuits
8. Accepting each other 6 22 32 75 60 28 0.8 (1.6)
9. Frequent agreement in teachers' council 4 16 30 73 80 20 1.0 (1.5) 1
10. Count on colleagues' support 14 24 39 67 60 19 0.5 (1.7)
11. Sharing the same views with colleagues 6 26 40 70 59 22 0.6 (1.7) on educational issues
13. Fit in well with colleagues 3 9 20 56 89 46 1.5 (1.4) 2
14. See the school as a big family 19 15 37 75 56 21 0.6 (1.8)
15. The director is supportive* 48 26 37 46 46 20 -0.2 (2.1)
16. The director keeps teachers informed* 26 27 26 46 55 43 0.6 (2.1)
17. The director takes initiatives* 38 23 35 44 47 36 0.2 (2.1)
18. The director understands teachers' 30 34 30 39 52 38 0.3 (2.1) idiosyncrasies*
19. The director emphasises the rules set by 14 17 34 33 56 69 1.1 (1.9) 2 the Ministry*
20. Satisfied with the level of a teacher's 110 49 43 19 2 -2.0 (1.3) -2 salary
21. Satisfied with the other rewards of the 66 57 36 30 22 12 -1.1 (1.9) -2 teaching profession
22. Satisfied with teacher's livin~ standards 67 53 54 39 9 -1.3 (1.6) -2 Note: Question 12 does not exist. * for these questions the scale is from 15 to 20 and not from-3 to +3.
248
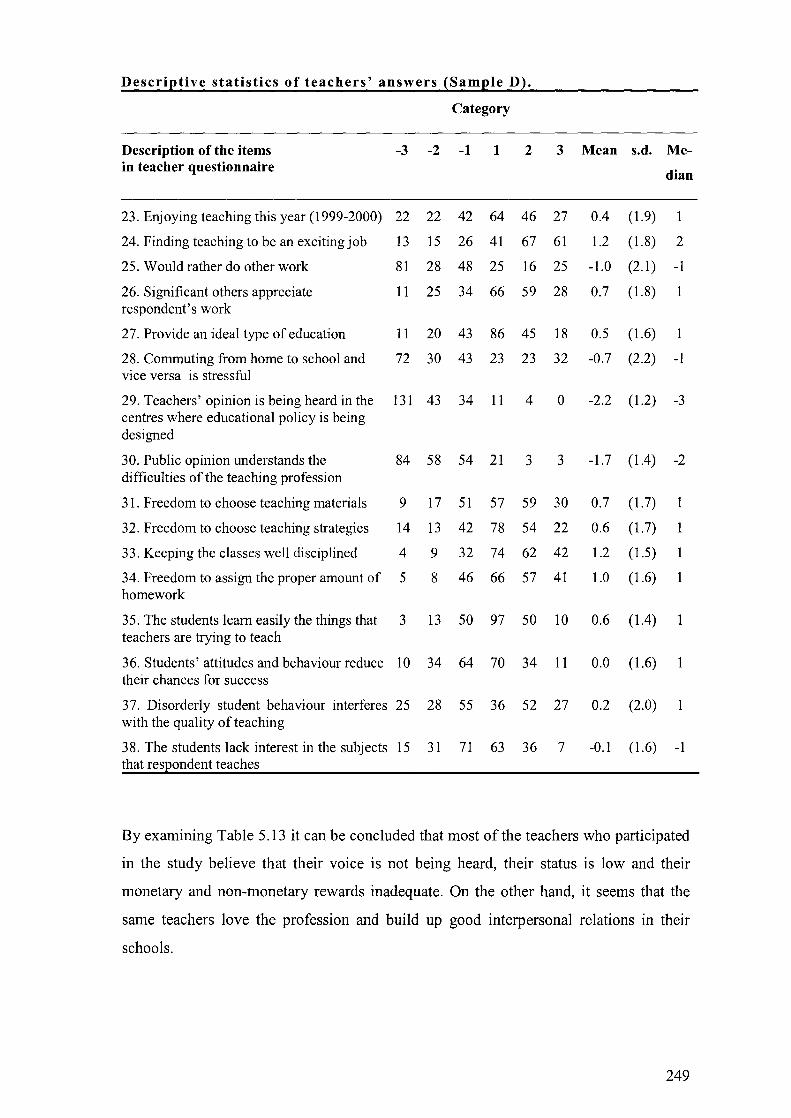
Descrietive statistics of teachers' answers !Samele D}.
Category
Description of the items -3 -2 -1 1 2 3 Mean s.d. Me-in teacher questionnaire dian
23. Enjoying teaching this year (1999-2000) 22 22 42 64 46 27 0.4 (1.9) 1
24. Finding teaching to be an exciting job l3 15 26 41 67 61 1.2 (1.8) 2
25. Would rather do other work 81 28 48 25 16 25 -1.0 (2.1) -1
26. Significant others appreciate 11 25 34 66 59 28 0.7 (1.8) respondent's work
27. Provide an ideal type of education 11 20 43 86 45 18 0.5 (1.6)
28. Commuting from home to school and 72 30 43 23 23 32 -0.7 (2.2) -1 vice versa is stressful
29. Teachers' opinion is being heard in the l31 43 34 11 4 0 -2.2 (1.2) -3 centres where educational policy is being designed
30. Public opinion understands the 84 58 54 21 3 3 -1.7 (1.4) -2 difficulties of the teaching profession
31. Freedom to choose teaching materials 9 17 51 57 59 30 0.7 (1.7)
32. Freedom to choose teaching strategies 14 13 42 78 54 22 0.6 (1.7)
33. Keeping the classes well disciplined 4 9 32 74 62 42 1.2 (1.5)
34. Freedom to assign the proper amount of 5 8 46 66 57 41 1.0 (1.6) homework
35. The students learn easily the things that 3 13 50 97 50 10 0.6 (1.4) teachers are trying to teach
36. Students' attitudes and behaviour reduce 10 34 64 70 34 11 0.0 (1.6) their chances for success
37. Disorderly student behaviour interferes 25 28 55 36 52 27 0.2 (2.0) with the quality of teaching
38. The students lack interest in the subjects 15 31 71 63 36 7 -0.1 (1.6) -1 that resEondent teaches
By examining Table 5.13 it can be concluded that most of the teachers who participated
in the study believe that their voice is not being heard, their status is low and their
monetary and non-monetary rewards inadequate. On the other hand, it seems that the
same teachers love the profession and build up good interpersonal relations in their
schools.
249
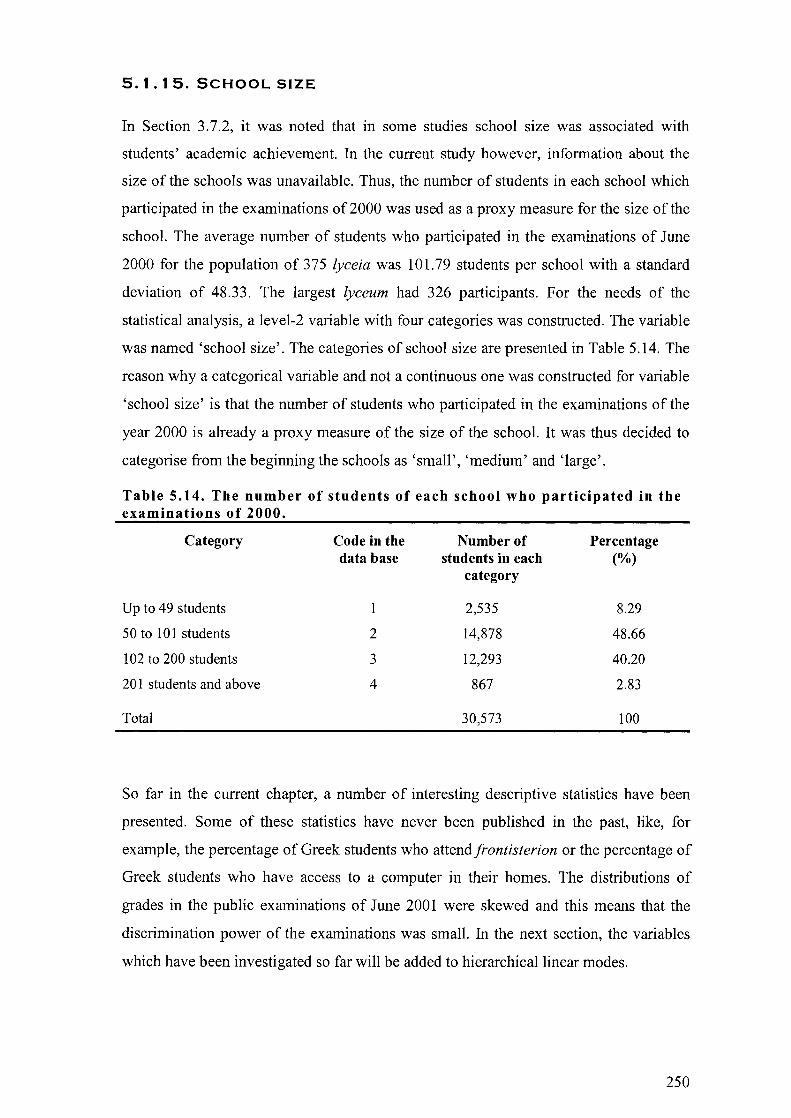
5.1.15. SCHOOL SIZE
In Section 3.7.2, it was noted that in some studies school size was associated with
students' academic achievement. In the current study however, information about the
size of the schools was unavailable. Thus, the number of students in each school which
participated in the examinations of 2000 was used as a proxy measure for the size of the
school. The average number of students who participated in the examinations of June
2000 for the popUlation of 375 lyceia was 101.79 students per school with a standard
deviation of 48.33. The largest lyceum had 326 participants. For the needs of the
statistical analysis, a level-2 variable with four categories was constructed. The variable
was named 'school size'. The categories of school size are presented in Table 5.14. The
reason why a categorical variable and not a continuous one was constructed for variable
'school size' is that the number of students who participated in the examinations of the
year 2000 is already a proxy measure of the size of the school. It was thus decided to
categorise from the beginning the schools as 'small', 'medium' and 'large'.
Table 5.14. The number of students of each school who participated in the examinations of 2000.
Category Code in the Number of Percentage data base students in each (%)
category
Up to 49 students 2,535 8.29
50 to 101 students 2 14,878 48.66
102 to 200 students 3 12,293 40.20
201 students and above 4 867 2.83
Total 30,573 100
So far in the current chapter, a number of interesting descriptive statistics have been
presented. Some of these statistics have never been published in the past, like, for
example, the percentage of Greek students who attend frontisterion or the percentage of
Greek students who have access to a computer in their homes. The distributions of
grades in the public examinations of June 2001 were skewed and this means that the
discrimination power of the examinations was small. In the next section, the variables
which have been investigated so far will be added to hierarchical linear modes.
250

5.2. ANSWERING THE FIRST RESEARCH QUES~ TION: THE SIZE AND STRUCTURE OF THE SCHOOL EFFECT IN THE GREEK L YCEIA
5.2.1. INTRODUCTION
The first research question asks whether lyceia in the prefecture of Attiki are equally
effective in terms of their students' academic achievement. As has been described in
Chapter 4, academic achievement in the present study refers to two outcomes: (a)
students' normalised grades in 22 nationally examined subjects and (b) students'
success in obtaining their certificate for the integrated lyceum. To answer this question,
a number of linear and non-linear multilevel models were built. The former were fitted
to students' normalised grades, whereas the latter investigated the probability of success
in obtaining the certificate of the integrated lyceum. The explanatory variables in the
models were dummy variables with two or more categories at the school or student
level. Information on students' previous achievement was available and has been used
in the multilevel models which were mentioned above but value added results in this
study must be interpreted with caution for reasons that were explained in Section 4.3.3.
The coefficients and the error terms of the models that were built will be presented
under different headings because two different data sets were used in the current
analysis. The first data set refers to the popUlation of schools in the prefecture of Attiki,
the prefecture of the Greek capital. The second data set refers to a stratified random
sample of the popUlation of the lyceia in Attiki, namely Sample B. As we proceed from
the models for the Population to the models for Sample B, the level of available
information increases but the number of observations (students and schools) decreases.
The models which will be presented in the following sections have been named in such
as to enable the reader to understand the sample that they have been based on. For
example, the model named 'P' refers to the population, whereas the model named 'B'
refers to Sample B. Superscripts and subscripts in the Ps and Bs indicate the complexity
and the statistical attributes of the models. For example, Model P: refers to the
'population' (the 'P'), it models a binary response variable (the 'bin'), and includes the
explanatory variables of the set 'AB'.
251

5.2.2. VARIANCE COMPONENTS MODELS FOR THE POPULATION
The first set of model for the population of schools are the models in the 'po, series,
hence referred to as 'Model pO'. In fact, Model 'po, is not one model but a collection of
22 hierarchica11inear models, each one for a different academic outcome (Mathematics,
Science etc). The purpose of this set of models is to separate the total variance to
variance between schools Uij and j variance between students R i • Thus, the models
under the umbrella term 'po, are of the form: Yij = fJoj + Rij , where Yij represents an
academic outcome. It is also suggested that fJ OJ = Yoo + U OJ" In the statistical literature,
models of this kind are called 'variance components' models or 'empty' models or
'null' models (Hox, 1995; Snijders & Bosker, 1999). With the help of Model pO it was
found that the average size of the 'unexplained' intra-school correlation was about 0.10.
The variances and the intra-school correlation coefficient for Model pO are presented in
Table 5.15. In this table, the variances between schools and students are denoted T~
and (J'2 respectively. The number of schools is 375. The number of students differs
across the rows of Table 5.15 because the subjects in the left hand column have
different numbers of cases with missing values. The right hand column of Table 5.15
contains the intra-school correlation coefficients (p).
252
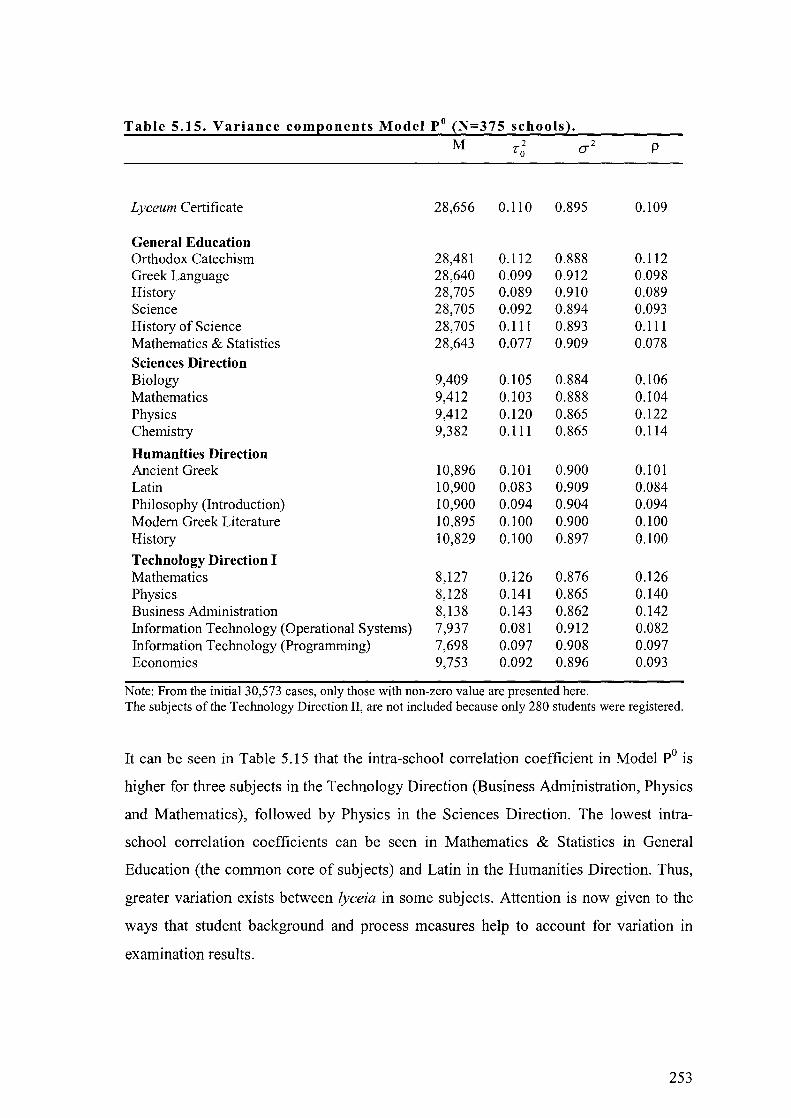
Table 5.15. Variance components Model pO (N=375 schools).
Lyceum Certificate 28,656 0.110 0.895 0.109
General Education Orthodox Catechism 28,481 0.112 0.888 0.112 Greek Language 28,640 0.099 0.912 0.098 History 28,705 0.089 0.910 0.089 Science 28,705 0.092 0.894 0.093 History of Science 28,705 0.111 0.893 0.111 Mathematics & Statistics 28,643 0.077 0.909 0.078 Sciences Direction Biology 9,409 0.105 0.884 0.106 Mathematics 9,412 0.103 0.888 0.104 Physics 9,412 0.120 0.865 0.122 Chemistry 9,382 0.111 0.865 0.114
Humanities Direction Ancient Greek 10,896 0.101 0.900 0.101 Latin 10,900 0.083 0.909 0.084 Philosophy (Introduction) 10,900 0.094 0.904 0.094 Modem Greek Literature 10,895 0.100 0.900 0.100 History 10,829 0.100 0.897 0.100
Technology Direction I Mathematics 8,127 0.126 0.876 0.126 Physics 8,128 0.141 0.865 0.140 Business Administration 8,138 0.143 0.862 0.142 Information Technology (Operational Systems) 7,937 0.081 0.912 0.082 Information Technology (Programming) 7,698 0.097 0.908 0.097 Economics 9,753 0.092 0.896 0.093
Note: From the initial 30,573 cases, only those with non-zero value are presented here. The subjects of the Technology Direction II, are not included because only 280 students were registered.
It can be seen in Table 5.15 that the intra-school correlation coefficient in Model pO is
higher for three subjects in the Technology Direction (Business Administration, Physics
and Mathematics), followed by Physics in the Sciences Direction. The lowest intra
school correlation coefficients can be seen in Mathematics & Statistics in General
Education (the common core of subjects) and Latin in the Humanities Direction. Thus,
greater variation exists between /yceia in some subjects. Attention is now given to the
ways that student background and process measures help to account for variation in
examination results.
253
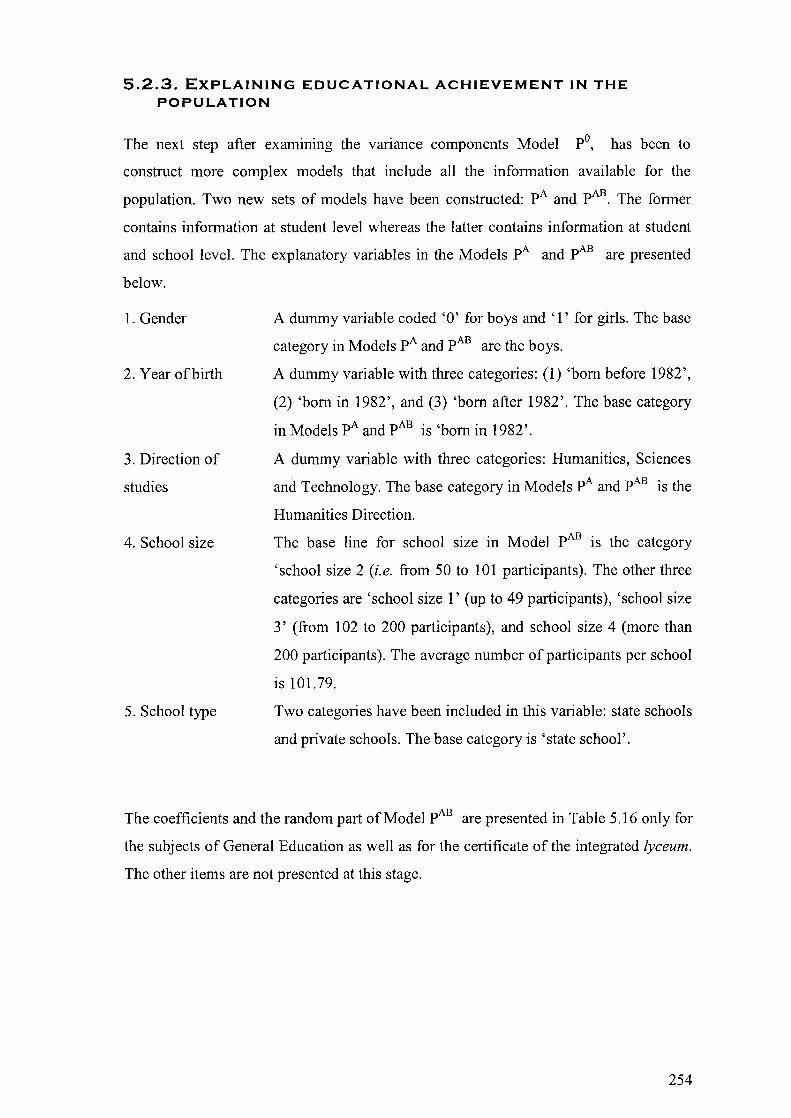
5.2.3. EXPLAINING EDUCATIONAL ACHIEVEMENT IN THE POPULATION
The next step after examining the vanance components Model pO, has been to
construct more complex models that include all the information available for the
population. Two new sets of models have been constructed: pA and pAB. The former
contains information at student level whereas the latter contains information at student
and school level. The explanatory variables in the Models pA and pAB are presented
below.
1. Gender
2. Year of birth
3. Direction of
studies
4. School size
5. School type
A dummy variable coded '0' for boys and '1' for girls. The base
category in Models pA and pAB are the boys.
A dummy variable with three categories: (1) 'born before 1982',
(2) 'born in 1982', and (3) 'born after 1982'. The base category
in Models pA and pAS is 'born in 1982'.
A dummy variable with three categories: Humanities, Sciences
and Technology. The base category in Models pA and pAB is the
Humanities Direction.
The base line for school SIze III Model pAB is the category
'school size 2 (i.e. from 50 to 101 participants). The other three
categories are 'school size l' (up to 49 participants), 'school size
3' (from 102 to 200 participants), and school size 4 (more than
200 participants). The average number of participants per school
is 101.79.
Two categories have been included in this variable: state schools
and private schools. The base category is 'state school'.
The coefficients and the random part of Model pAB are presented in Table 5.16 only for
the subjects of General Education as well as for the certificate of the integrated lyceum.
The other items are not presented at this stage.
254

Table 5.16. Fixed coefficients and random ~arts of the '~ersonal characteristics and contextual Model' pAB {N=375 schools~.
Lyceum Certificate Religion Greek Language History Science Biology
Coeff. S.E. Coeff. S.E. Coeff. S.E. Coeff. S.E. Coeff. S.E. Coeff. S.E. Fixed part Y 00 (intercept) -0.127 0.024 -0.028 0.025 0.011 0.023 0.111 0.023 -0.403 0.022 -0.194 0.021
YIO (girl) 0.078 0.012 0.246 0.012 0.326 0.011 -0.037 0.012 -0.012 0.011 0.032 0.011
Y20 (born in 1981) -0.686 0.030 -0.401 0.030 -0.559 0.030 -0.503 0.031 -0.582 0.028 -0.535 0.030
Y30 (born in 1983) -0.015 0.013 -0.037 0.013 -0.048 0.013 -0.020 0.013 -0.013 0.012 -0.014 0.013
Y 40 (Technol. Direction) -0.280 0.015 -0.535 0.015 -0.695 0.014 -0.502 0.015 0.199 0.014 -0.216 0.014
Y 50 (Sciences Direction) 0.491 0.013 0.141 0.013 0.051 0.013 0.162 0.014 1.043 0.012 0.695 0.013
Y 01 (private school) 0.208 0.052 0.129 0.055 0.146 0.048 0.188 0.050 0.235 0.047 0.164 0.045
Y 02 (school size-1) -0.246 0.043 -0.203 0.045 -0.213 0.040 -0.165 0.041 -0.203 0.038 -0.171 0.037
Y 03 (school size-3) 0.073 0.035 0.073 0.037 0.046 0.032 0.044 0.033 0.056 0.031 0.059 0.030
Random part 2
To 0.071 0.006 0.081 0.007 0.061 0.005 0.063 0.006 0.056 0.005 0.049 0.004
(72 0.785 0.007 0.782 0.007 0.762 0.006 0.834 0.007 0.677 0.006 0.766 0.006
P 0.083 0.101 0.074 0.070 0.076 0.060
-2 loglikelihood 74911.59 74256.0 6
73974.12 76583.5 70671.6 74108.5
Number of cases 28,578 28,352 28,562 28,576 28,576 28,576
Effects marked in bold are statistically significant at 0.05 level.
255

Table 5.16. Fixed coefficients and random parts of the 'personal characteristics and contextual Model' pAB (part II).
History of Science Mathematics & Statistics
Coeff. S.E. Coeff. S.E. Fixed part
roo (intercept) -0.109 0.023 -0.427 0.021
rIO (girl) 0.101 0.012 -0.046 0.011
r20 (born in 1981) -0.526 0.030 -0.568 0.028
r 30 (born in 1983) -0.017 0.013 0.005 0.012
r 40 (Techno I. Direction) -0.304 0.015 0.310 0.014
r 50 (Sciences Direction) 0.438 0.013 1.065 0.012
r 01 (private school) 0.208 0.048 0.223 0.044
r 02 (school size-1) -0.292 0.040 -0.184 0.037
r 03 (school size-3) 0.048 0.032 0.056 0.029
Random part 2 To 0.059 0.005 0.049 0.004
2 0.799 0.007 0.690 0.006 0"
P 0.069 0.066
-2 loglikelihood 75359.45 70984.92 Number of cases 28,576 28,518
Effects marked in bold are statistically significant at 0.05 level.
256
By studying Table 5.16, it can be concluded that the intra-school correlation coefficients
are around 0.075 on average. This means that according to Model pAS, about 7.5% of
the total variation on normalised academic outcomes can be attributed to the school
(although in the absence of more detailed intake controls these results must be treated
with considerable caution). The smaller value of p in Table 5.16 is in the case of
Biology of General Education (p = 0.060); the highest value is in the case of Greek
Orthodox Catechism (p = 0.101). For reasons that were explained in Section 4.4.4,
direct comparison between coefficients in the pAS family of models is not a safe method
for making conclusions about patterns of student achievement. However, the negative
coefficients for the dummy variable 'girl' in History, Mathematics, and Science (in the
latter the coefficient is not statistically significant) need more investigation.
A very interesting finding of Model pAS is that the differences in achievement between
the students who went to school before the age of six and those who went to school at
the normal age (six) are small. The coefficients for the dummy variable 'born in 1983'
are negative but not statistically significant in the pAS models (0.05 level of
significance). The results however are dramatically different for the students who were
born before 1982, as their coefficient in Model pAS is negative and statistically
significant. It seems that the older students, who either repeated a class or immigrated to
Greece due to the geopolitical changes in the former eastern world, are underachieving
in lyceum.
Differences were also found in the patterns of achievement in relation to the Direction.
In the seven examined subjects and the lyceum certificate, students who followed the
Sciences Direction had had significantly better achievement than the students who
followed the other two Directions. The Direction of studies may therefore also be seen
as a crude indicator of prior attainment. Finally, the students of the private schools
achieved better grades than students of state schools and the students of large schools
achieved better grades than students of the small schools. This finding, however, has
probably to do with the context of the school. Private schools are selective; small state
schools are located in remote areas in the prefecture of Attiki. Thus, the mechanisms for
selection in the case of private schools and the average socio-economic status of the
neighbourhood in the case of small state schools are two factors that may well explain
some of differences in students' achievement.
257
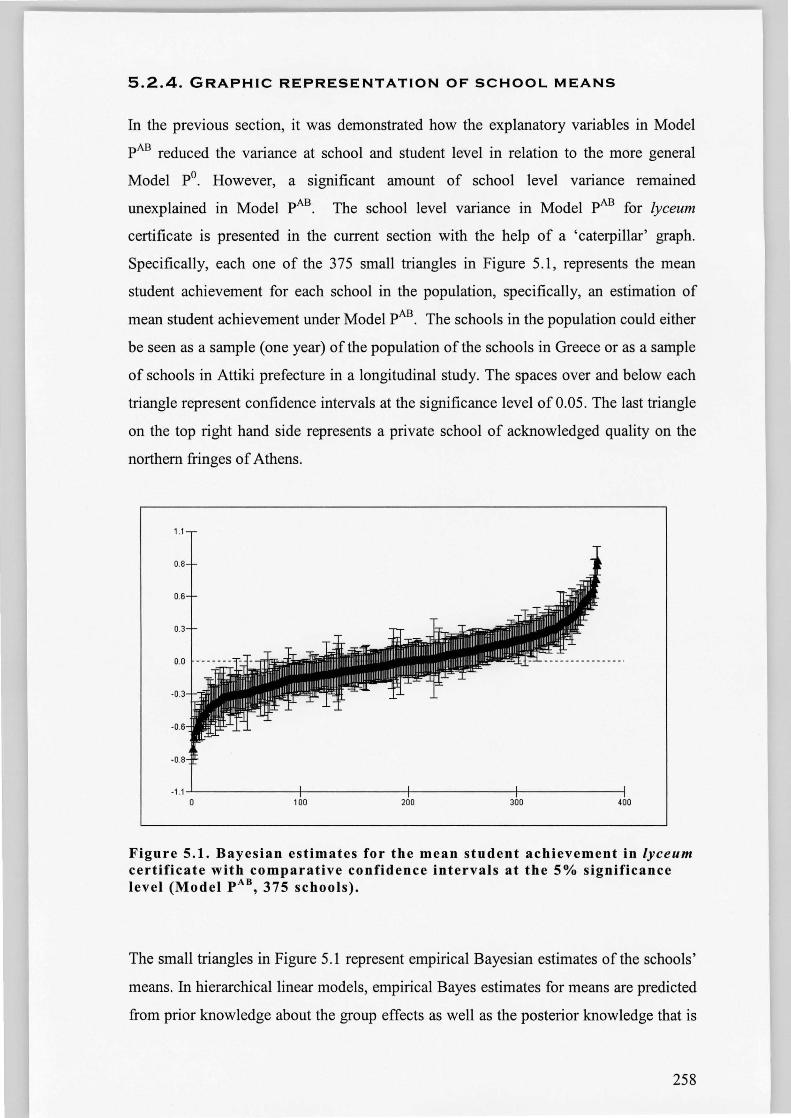
5.2.4. GRAPHIC REPRESENTATION OF SCHOOL MEANS
In the previous section, it was demonstrated how the explanatory variables in Model
pAS reduced the variance at school and student level in relation to the more general
Model po. However, a significant amount of school level variance remained
unexplained in Model pAS. The school level variance in Model pAS for lyceum
certificate is presented in the current section with the help of a 'caterpillar' graph.
Specifically, each one of the 375 small triangles in Figure 5.1, represents the mean
student achievement for each school in the population, specifically, an estimation of
mean student achievement under Model pAS. The schools in the population could either
be seen as a sample (one year) of the population of the schools in Greece or as a sample
of schools in Attiki prefecture in a longitudinal study. The spaces over and below each
triangle represent confidence intervals at the significance level of 0.05. The last triangle
on the top right hand side represents a private school of acknowledged quality on the
northern fringes of Athens.
1.1
-1 .1-'---------+-------4------+-------1 o 100 200 300 400
Figure 5.1. Bayesian estimates for the mean student achievement in lyceum certificate with comparative confidence intervals at the 5% significance level (Model pAB, 375 schools).
The small triangles in Figure 5.1 represent empirical Bayesian estimates of the schools'
means. In hierarchical linear models, empirical Bayes estimates for means are predicted
from prior knowledge about the group effects as well as the posterior knowledge that is
258
based on the observations made about the groups (see page 357 in the Appendix for
more information on the logic of Bayesian estimates in hierarchical linear models).
What must be stressed here is that the Bayesian estimate for the mean of school j is
'shrunk' to the general mean of a collection of schools. More specifically, if we denote
the Bayesian estimate of school j as P-;; and the Ordinary Least Squares estimation of
A
the mean of the same school with flo) , then it can be shown that
A EB A A A
flOj = AjflOj + (1- A))r 00' where roo IS the general mean predicted from the total
number of students in the data base and ~ is the reliability of the mean of school j
(Snijders & Bosker, 1999: 58). Due to shrinkage effect, the residual estimates of the
means in Figure 5.1 can be regarded as 'conservative'. This means that in Figure 5.1 the
schools in the upper right hand side and lower left hand side of the graph are presented
closer to the doted horizontal line in the centre that splits the graph into two.
Another important point in Figure 5.1 regards the calculation of the standard error. If we
denote the standard error for the mean of school j with SEj , the ninety five percent
confidence interval is given by the formula POE; ± 1.96 x SE). However, the confidence
intervals in the current study have been designed narrower than that. This is because, as
Goldstein & Healy (1995) have shown, if the aim of the research is the simultaneous
comparison of a collection means, the width of the confidence interval should be
adjusted in such a way that their significance level averaged over all possible pairs is
equal to the required value. In the present study, the required value of statistical
significance is 5 percent and according to the formula of Goldstein & Healy, (1995) the
confidence interval for the mean of school j should be the interval between
A EB A EB flo} -1.39 x SE} and flo} + 1.39 x SE j"
5.2.5. CONTROLLING FOR PREVIOUS ACHIEVEMENT
The only measure of prior academic achievement before the final examinations in third
year of lyceum is students' academic achievement in the final examinations of year 2.
From a statistical point of view examination results of year 2 would be a perfect base for
measuring 'value added' results. However, it is from an educational point of view that
serious doubts can been raised with regard to the use of examination results in year 2 for
predicting achievement in year 3. Firstly, the span between the examination in year 2
and the examination in year 3 is only one school year. Thus, the 'value added' that
259
would be estimated after controlling for the mean grade in year 2 (the B ) would rather
be a 'year effect' and not a 'school effect'. In addition, B is itself 'explained' by the
variables that statistically 'explain' mean grade in year 3 (the G). Thus, practically, B
may be seen as a school product rather than a base line for measuring other school
products.
A second source of scepticism concernmg the use of achievement in year 2 for
predicting achievement in year 3 is the situation which was caused by students' take
over of their schools during 1998 - 1999. As has been discussed in Chapter 2, many
schools were taken over by their students in 1998 - 1999 for nearly two months. These
schools were state lyceia. The students in private lyceia did not manage to get round
their administrators and the profit-making mechanisms that they represented. The
different forms of unrest in Greek schools not only affected the quality of teaching and
learning in state lyceia but also had serious implications for the validity of the
examinations in year 2 as a mechanism for selection. Because the decision for taking
over a state school was taken 'democratically' by its students (each one had a vote),
many children lost their classes against their will. Thus, in the final examinations in year
2 (June 2000), many students would be less prepared not because they had not tried
enough but because the government did not offer them the same opportunities as other
students. In order to diminish the effects of the unrest on the examination results, the
Minister of Education issued a circular to the schools by which he changed the formula
for the calculation of the final grade in the lyceum certificate. As has been presented in
Section 2.3.3, the lyceum certificate is given by the formula: (3B + 7G)110, where B
is the mean grade for year 2 and G is the mean grade for year 3. According to the new
regulation, which was announced by the Media, B would now enter the formula of
lyceum certificate only if B > G . In every other case, the grade in the lyceum certificate
would be equal to G . This was an 'after the event' policy for 'protecting' the students
who had not done so well in the final examinations of 1998 - 1999 (only year 2
examinations were conducted in June of 1999).
Notwithstanding the serious caveats which were presented in the two prevIOUS
paragraphs, achievement in year 2 was finally used in the current study as a predictor of
achievement in year 3. This was decided because one of the purposes of the current
study was to demonstrate how 'value-added' models could be used by other Greek
researchers in the field of educational effectiveness. Greek students who finished
260

integrated lyceum in 2000 were the first to have been examined one year before (June o - -
1999). Thus Model P year regressed G against B. The fixed and the random parts of
the Model P~ear for the mean grade in year 3 are presented in Table 5.17.
Tab Ie 5. 1 7. Mod e I P ;ear (375 s c h 0 0 Is).
Fixed part
roo (intercept)
rIO (mean grade in year 2)
Random part
T~ (level-2 variation - intercept)
T12 (level-2 variation - slopes)
T~1 (level-2 intercept/slope covariance)
a 2 (level-1 variation)
Mean grade in year 3
Coeff. S.E.
-0.003
0.835
0.015
0.005
-0.001
0.233
(0.007)
(0.005)
(0.001)
(0.001)
(0.001)
(0.002)
2 loglikelihood (Iterative Generalised Least Squares - IGLS) = 40090.240 (28,224 of 30,573 cases) Note: Values in bold are statistically significant at 0.005 level.
By examining Table 5.17 we can obtain an idea of the relation between Band G . The
coefficient for B in Model P~ear is 0.835, a very high value if we consider that it refers
to 28,573 students. Model P~ear is a 'random slopes' model. This means that the school
in the population could be represented by separate regression lines, the slopes of which
have a variance equal to T12. The term T~ represents the variance in the intercepts,
whereas the term T~1 is the intercept/slopes covariance. A negative value of T~1 would
make the regression lines 'fan in' i.e. incline as mean grade in year 2 increases.
However, in Table 5.18, T~1 is not statistically significant. The relation between Band
G has been visualised in Figure 5.2. In this figure, the abscissa (horizontal axis)
represents the values of B whereas the ordinate (the vertical axis) the values of G .
Each one of the 375 regression lines in Figure 5.2 predicts G for the students of each
school in the population. The regression lines differ significantly both in their intercepts
and slopes. However, the intercept/slope covariance is not significant and this means
that the progress during the final school year is independent of the value of Ii .
261
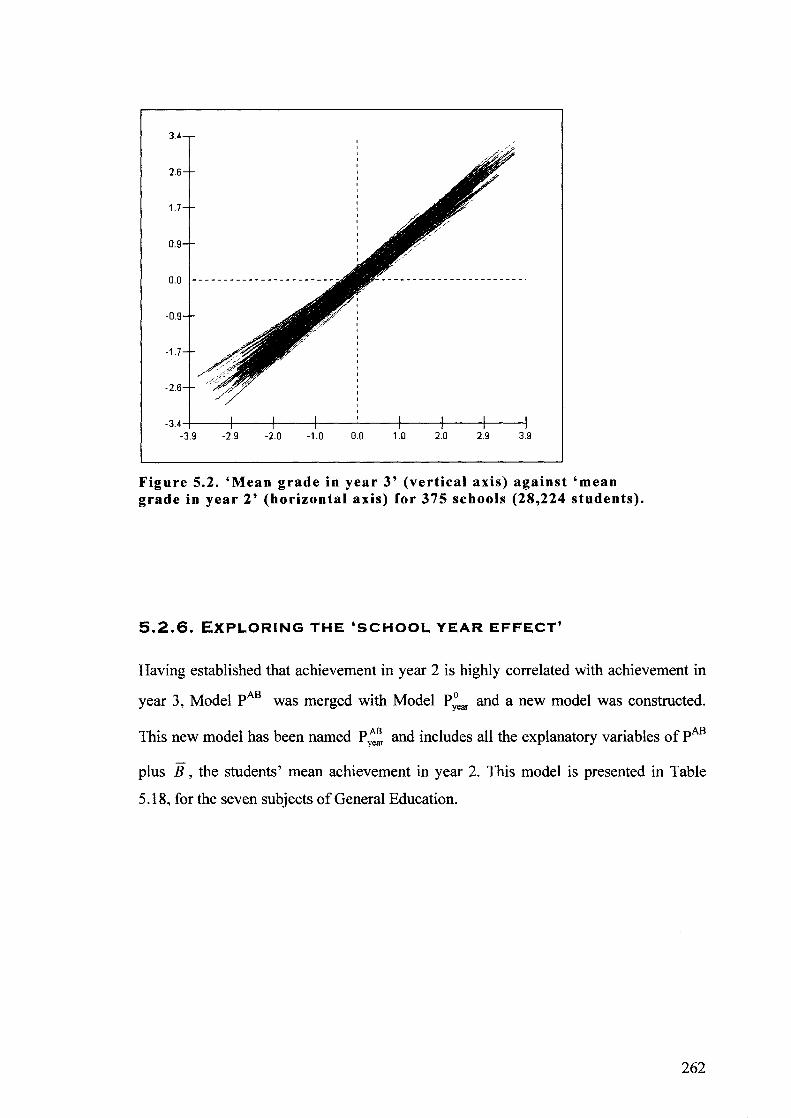
3.4
2.6
1.7
0.9
0.0
-0.9
-1.7
-2.6
-3.4-+----+--+---+-----I---+----t----; -3.9 -2.9 -2.0 -1.0 0.0 1.0 2.0 2.9 3.9
Figure 5.2. 'Mean grade in year 3' (vertical axis) against 'mean grade in year 2' (horizontal axis) for 375 schools (28,224 students).
5.2.6. EXPLORING THE 'SCHOOL YEAR EFFECT'
Having established that achievement in year 2 is highly correlated with achievement in
year 3, Model pAB was merged with Model P~ear and a new model was constructed.
This new model has been named p;: and includes all the explanatory variables of pAB
plus B, the students' mean achievement in year 2. This model is presented in Table
5.18, for the seven subjects of General Education.
262
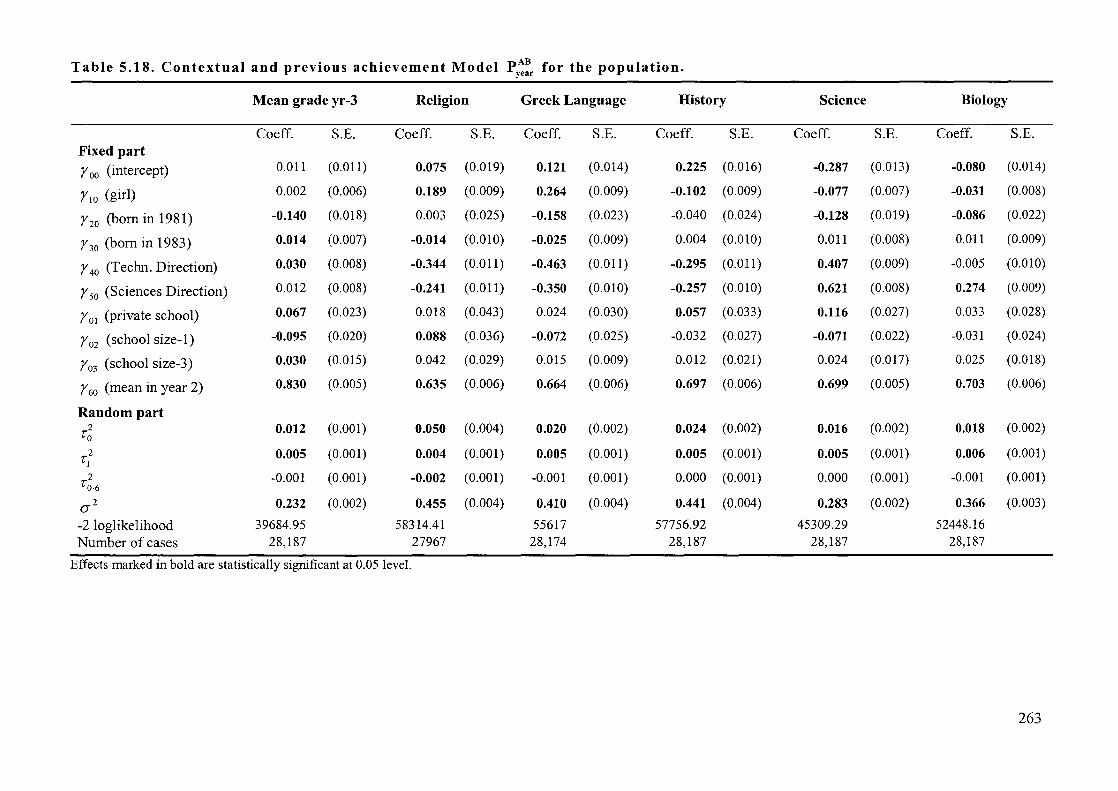
Table 5.18. Contextual and previous achievement Model Py~:r for the population.
Mean grade yr-3 Religion Greek Language History Science Biology
Coeff. S.E. Coeff. S.E. Coeff. S.E. Coeff. S.E. Coeff. S.E. Coeff. S.E. Fixed part Y 00 (intercept) 0.011 (0.011) 0.075 (0.019) 0.121 (0.014) 0.225 (0.016) -0.287 (0.013) -0.080 (0.014)
YIO (girl) 0.002 (0.006) 0.189 (0.009) 0.264 (0.009) -0.102 (0.009) -0.077 (0.007) -0.031 (0.008)
Yzo (born in 1981) -0.140 (0.018) 0.003 (0.025) -0.158 (0.023) -0.040 (0.024) -0.128 (0.019) -0.086 (0.022)
Y30 (born in 1983) 0.014 (0.007) -0.014 (0.010) -0.025 (0.009) 0.004 (0.010) 0.011 (0.008) 0.011 (0.009)
Y 40 (Techn. Direction) 0.030 (0.008) -0.344 (0.011) -0.463 (0.011) -0.295 (0.011) 0.407 (0.009) -0.005 (0.010)
Y 50 (Sciences Direction) 0.012 (0.008) -0.241 (0.011) -0.350 (0.010) -0.257 (0.010) 0.621 (0.008) 0.274 (0.009)
Y 01 (private school) 0.067 (0.023) 0.018 (0.043) 0.024 (0.030) 0.057 (0.033) 0.116 (0.027) 0.033 (0.028)
Y 02 (school size-I) -0.095 (0.020) 0.088 (0.036) -0.072 (0.025) -0.032 (0.027) -0.071 (0.022) -0.031 (0.024)
Y03 (school size-3) 0.030 (0.015) 0.042 (0.029) 0.015 (0.009) 0.012 (0.021) 0.024 (0.017) 0.025 (0.018)
Y60 (mean in year 2) 0.830 (0.005) 0.635 (0.006) 0.664 (0.006) 0.697 (0.006) 0.699 (0.005) 0.703 (0.006)
Random part 2
To 0.012 (0.001) 0.050 (0.004) 0.020 (0.002) 0.024 (0.002) 0.016 (0.002) 0.018 (0.002)
2 T) 0.005 (0.001) 0.004 (0.001) 0.005 (0.001) 0.005 (0.001) 0.005 (0.001) 0.006 (0.001)
2 TO.6 -0.001 (0.001) -0.002 (0.001) -0.001 (0.001) 0.000 (0.001) 0.000 (0.001) -0.001 (0.001)
(J2 0.232 (0.002) 0.455 (0.004) 0.410 (0.004) 0.441 (0.004) 0.283 (0.002) 0.366 (0.003)
-2 loglikelihood 39684.95 58314.41 55617 57756.92 45309.29 52448.16
Number of cases 28,187 27967 28,174 28,187 28,187 28,187
Effects marked in bold are statistically significant at 0.05 level.
263
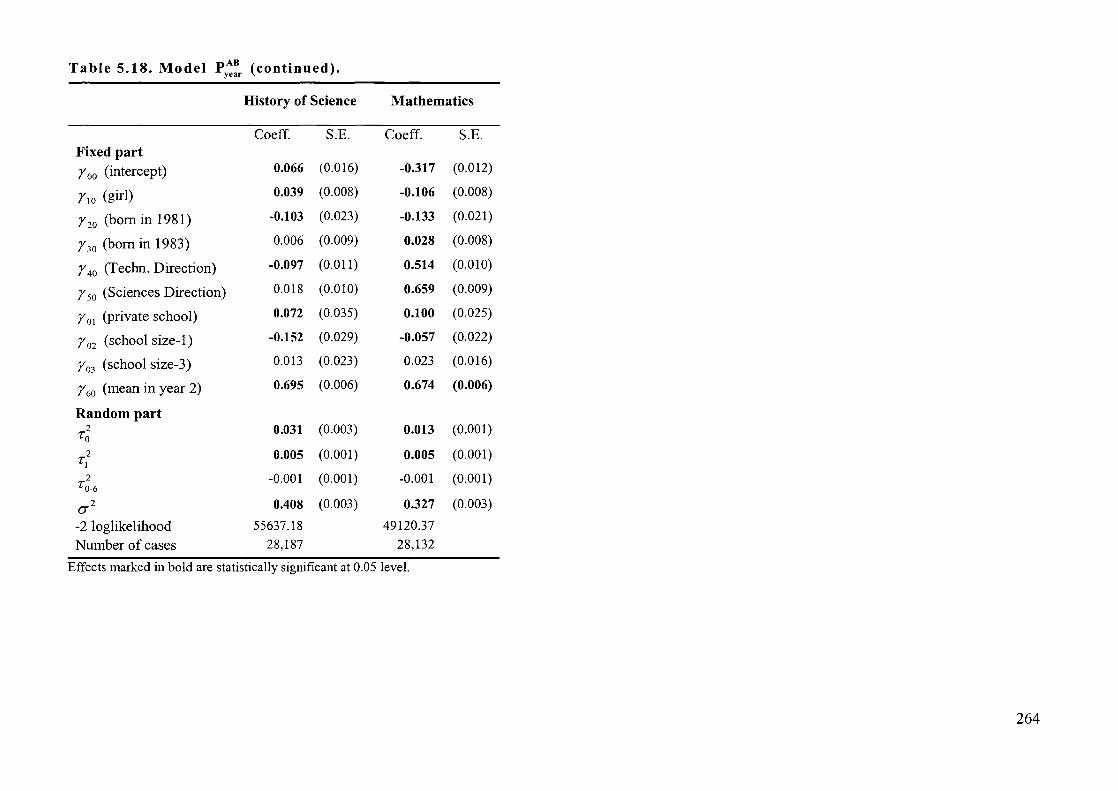
Table 5.18. Model pAB (continued). year
History of Science Mathematics
Coeff. S.E. Coeff. S.E. Fixed part roo (intercept) 0.066 (0.016) -0.317 (0.012)
rlO (girl) 0.039 (0.008) -0.106 (0.008)
r 20 (born in 1981) -0.103 (0.023) -0.133 (0.021)
r30 (born in 1983) 0.006 (0.009) 0.028 (0.008)
r 40 (Techn. Direction) -0.097 (0.011) 0.514 (0.010)
r 50 (Sciences Direction) 0.018 (0.010) 0.659 (0.009)
r 01 (private school) 0.072 (0.035) 0.100 (0.025)
r 02 (school size-1) -0.152 (0.029) -0.057 (0.022)
r03 (school size-3) 0.013 (0.023) 0.023 (0.016)
r60 (mean in year 2) 0.695 (0.006) 0.674 (0.006)
Random part 2 To 0.031 (0.003) 0.013 (0.001)
2 T1 0.005 (0.001) 0.005 (0.001)
2 -0.001 (0.001) -0.001 (0.001) TO.6 0'2 0.408 (0.003) 0.327 (0.003)
-2 loglikelihood 55637.18 49120.37
Number of cases 28,187 28,132
Effects marked in bold are statistically significant at 0.05 level.
264

Because the regressIOn lines in Figure 5.2 have random slopes except for random
intercepts, the within school coherence in Model P~:r cannot be expressed by the intra-
class correlation coefficient that was defined in Section 4.4.2. This is because the
correlation between the mean grades in year 3 for two random individuals in the same
school depends on their initial mean grades in year 2. In other words, the variance in
Model P:'r is considered the sum of the variances of all random variables in the model
plus a term depending on the covariance of the random variables. In Model P:'r the
school-level variance is the sum of two variances: the variance of the intercept UOj and
the variance of the slopes U jj • Model P:ar has been constructed in such a way that U jj •
is multiplied by B . Thus, the school level variance in Model P:ar is given by the
quadratic function: var(U 0 j + U 1 j. B) = T~ + 2 T~l . B + T; . B 2. The visual representation
of this function is presented in Figure 5.3.
0.10
0.08
0.05
0.03
0.00 I---+--f---f---'----if----+-_+_--I -3.9 -2.9 -2.0 -1.0 0.0 1.0 2.0 2.9 3.9
Figure 5.3. Total variable at school level (vertical axis) as a function of mean grade in year 2 (horizontal axis).
By examining Figure 5.3, we can see how B affects the total amount of variance at
school level. Very large and very small values of mean grade in year 2 are related to
larger variance in mean grade in year 3 at school level. The use of B as an explanatory
variable for students' achievement in year 3 may be tempting from a statistical point of
265
view but at the same time is problematic from an educational point of view. Therefore,
mean achievement in year 2 has not been included in multilevel models that will follow.
5.2.7. MODELLING SUCCESS WITH NON-LINEAR MULTILEVEL
MODELS
Success or failure in obtaining a lyceum certificate is another very important aspect of
the students' academic achievement. The models which have been presented so far have
analysed students' normalised grades but have not touched on the issues of failure. In
order to investigate the structure of success or failure, non-linear hierarchical models
were built.
The students who succeeded in a obtaining lyceum certificate had achieved a score
equal to or higher than 9.5 (the upper level was 20.0). As discussed in the previous
chapter, a dichotomous variable (Yij ) was constructed which was coded '0' if student i
in school j achieved a grade between 0 to 9.49 and '1' if student achieved a grade
equal to or higher than 9.50. From the 30,573 students who participated in the
examinations of 2000, 28,643 obtained their lyceum certificate and only 1,838 did not
(92 cases were missing). The ratio of success in the population was thus 28,643/30,573
= 0.936.
At the first stage, an 'empty' non-linear hierarchical model was constructed in order to
investigate the ratio of success which was presented in the previous paragraph. This
model was named P~n and was ofthe form of ~j = ~ + R ij , where Pj is the probability
of obtaining lyceum certificate in school j and Rij is the error term. It has been found
that logit(lj) = 2.621(0.051) + UOj • The variance of U Oj is r;=0.742, with a standard
error of 0.071. Thus, the probability of success corresponding to the average value r 0 is
p=[I+exp(-x,lnt = [1+exp(-2.621)t= 0.932. This estimated value is very close
though not perfectly equal to the calculated ratio of success in the popUlation which was
presented in the previous paragraph (0.936). Snijders & Bosker (1999: 214) also offer a
proximate formula for the estimation of the variance of P when r; is not very small.
The formula IS var(lj):::;[7l"o(I-7l"o)]2r; and with substitution it yields
var(P):::; 0.047. Thus the standard deviation of Pj is .J0.047 = 0.217.
266
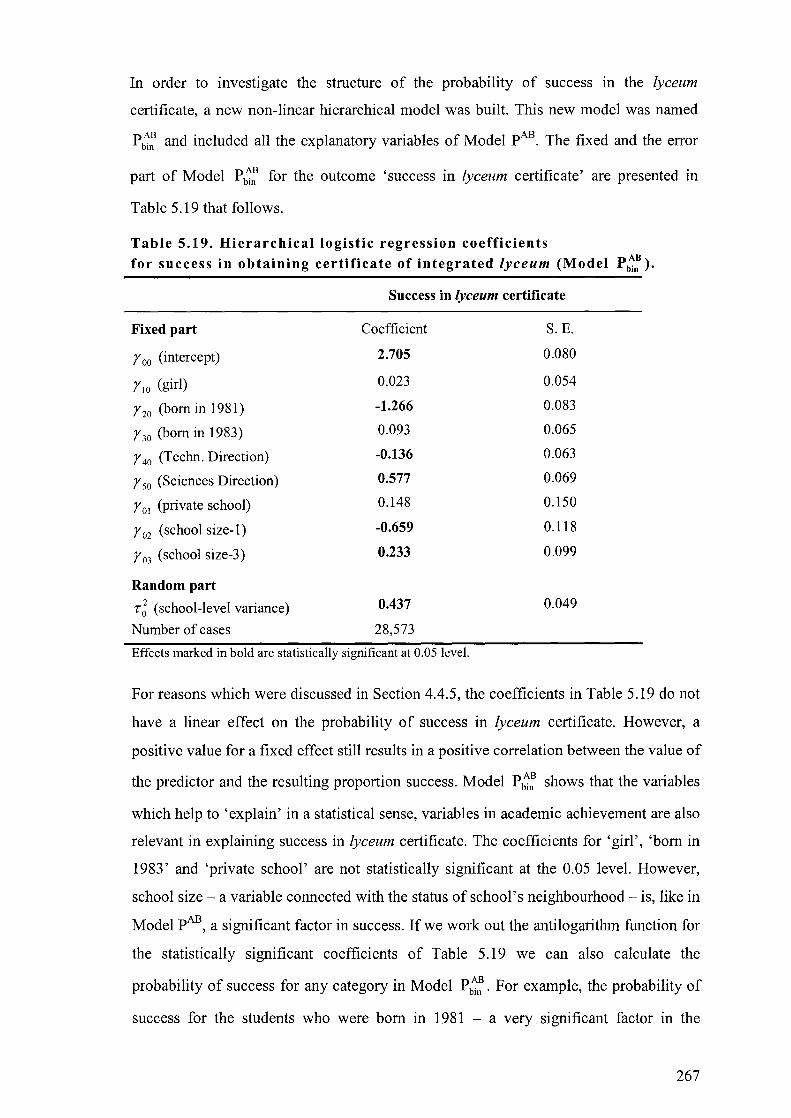
In order to investigate the structure of the probability of success in the lyceum
certificate, a new non-linear hierarchical model was built. This new model was named
Pb~ and included all the explanatory variables of Model pAB. The fixed and the error
part of Model Pb~: for the outcome 'success in lyceum certificate' are presented in
Table 5.19 that follows.
Table 5.19. Hierarchical logistic regression coefficients
for success in obtaining certificate of integrated lyceum (Model Pb~:)'
Success in lyceum certificate
Fixed part Coefficient S. E.
roo (intercept) 2.705 0.080
rIO (girl) 0.023 0.054
r 20 (born in 1981) -1.266 0.083
r30 (born in 1983) 0.093 0.065
r 40 (Techn. Direction) -0.136 0.063
r 50 (Sciences Direction) 0.577 0.069
r 01 (private school) 0.148 0.150
r 02 (school size-I) -0.659 0.118
r 03 (school size-3) 0.233 0.099
Random part
r; (school-level variance) 0.437 0.049
Number of cases 28,573
Effects marked in bold are statistically significant at 0.05 level.
For reasons which were discussed in Section 4.4.5, the coefficients in Table 5.19 do not
have a linear effect on the probability of success in lyceum certificate. However, a
positive value for a fixed effect still results in a positive correlation between the value of
the predictor and the resulting proportion success. Model P b~: shows that the variables
which help to 'explain' in a statistical sense, variables in academic achievement are also
relevant in explaining success in lyceum certificate. The coefficients for 'girl', 'born in
1983' and 'private school' are not statistically significant at the 0.05 level. However,
school size - a variable connected with the status of school's neighbourhood - is, like in
Model pAB, a significant factor in success. Ifwe work out the antilogarithm function for
the statistically significant coefficients of Table 5.19 we can also calculate the
probability of success for any category in Model Pb~. For example, the probability of
success for the students who were born in 1981 - a very significant factor in the
267
explanation of failure - is given by the fonnula: p = [1 + exp( -xp)r1• Substitution
yields [1 + exp(1.266 - 2.705)t = 4.2165. Thus, students who were born before 1982
have less than 50% a probability (specifically, 42%) than the average student in Model
Pb~ of succeeding in the lyceum certificate.
5.2.8. MORE MEASURES OF SOCIAL BACKGROUND
In Section 5.2.5 two arguments were presented against using academic achievement in
year 2 for predicting academic achievement in year 3. It was stated then that B (the
mean achievement in year 2) can be seen as a school 'product' rather than a pure base
line for measuring school effects on student progress. In fact, B can be partially
'explained' by the same set of background factors which 'explain' achievement in year
3. Therefore, interesting variables on students' background (like socio-economic status,
Frontisterion-attending etc) would lose their explanatory power if B was also included
in the models. In order to study the impact of other explanatory variables on student
level (excluding the impact of previous achievement) a number of multilevel models
were constructed which were given the generic name 'Model B'. Table 5.20 presents
the variance components Model BO for Sample B.
268

Table 5.20. Model BO: Variance com~onents model for Sam~le B.
Lyceum Religion Greek Language Certificate
Coeff. S.E. Coeff. S.E. Coeff. S.E. Fixed part roo (intercept) -0.024 0.049 -0.018 0.05 -0.021 0.053
Random part r2 0.058 0.021 0.064 0.022 0.076 0.025
0
(J'2 0.966 0.041 0.908 0.039 0.914 0.039
p 0.057 0.066 0.077 -2 log likelihood 3270.721 3196.112 3215.442 Number of cases 1153 1150 1153
History Science Biology
Coeff. S.E. Coeff. S.E. Coeff. S.E. Fixed part
roo (intercept) -0.037 0.048 -0.018 0.049 -0.041 0.048
Random part 2
ro 0.057 0.020 0.061 0.021 0.057 0.021
(J'2 0.928 0.039 0.893 0.038 0.957 0.041
p 0.058 0.064 0.056 -2 log likelihood 3225.496 3183.37 3260.139 Number of cases 1153 1153 1153
History of Science Mathematics
Coeff. S.E. Coeff. S.E.
Fixed part roo (intercept) -0.033 0.041 -0.035 0.046
Random part r2 0.045 0.017 0.052 0.019
0
(J'2 0.885 0.038 0.907 0.038
P 0.048 0.054 -2 log likelihood 3166.965 3196.926 Number of cases 1153 1153
Effects marked in bold are statistically significant at 0.05 level.
An elaborated form of Model BO is Model BA, which contains 10 explanatory variables,
all of them at student level. The construction of Model BA was based on Model pAB.
However, two school level variables which were used in Model pAB, namely school size
and type, were not included in Model BA. As was explained on page 193 the schools in
Sample B, on which Model BA is based, are state schools with sizes near the overall
school average (the 101,79 participants). Therefore there was no reasons for the
269
variables 'school type' and 'school size' to be included in the model. New variables in
Model BA are related to socio-economic status and are (a) 'father being a professional',
(b) 'mother with university degree' (c) 'attendingfrontisterion', and (d) 'taking private
lessons at home'. Student's previous achievement was not used in the Model BA
because the purpose of this model is to measure the impact of student background
characteristics on attainment - as opposed to progress - more clearly. Had previous
achievement been included in Model BA, the intra-school correlation coefficient would
probably have been lower. This however was not the reason for not using previous
achievement in Model BA. The researcher has explained the problems that are
connected with previous achievement in the context of the current study (see Section
4.3.3). The fixed and error parts of Model BA are presented in Table 5.21.
The collection of information on students' socio-economic backgrounds has made it
possible to test the 'iron rule of educational research' according to which mother's
educational level and father's occupation play an important role in their sons' and
daughters' academic achievement. In Model BA the coefficient for the category 'mother
with university degree' (a combination of categories 6, 7, and 8 in Table 5.5) is positive
and statistically significant in every subject of General Education and the lyceum
certificate. In addition, it can be seen that students whose father is a leitourgo/ - i.e.
doctor, lawyer, or judge - achieve better grades than other students in lyceum certificate
and in a number of subjects of General Education.
I The word leitourgos (functionary) does not have derogatory connotations in Greek in contrast to English. In Greek, functionaries are not only the higher public officers (civil servants) but also professionals of high status in the private sector.
270
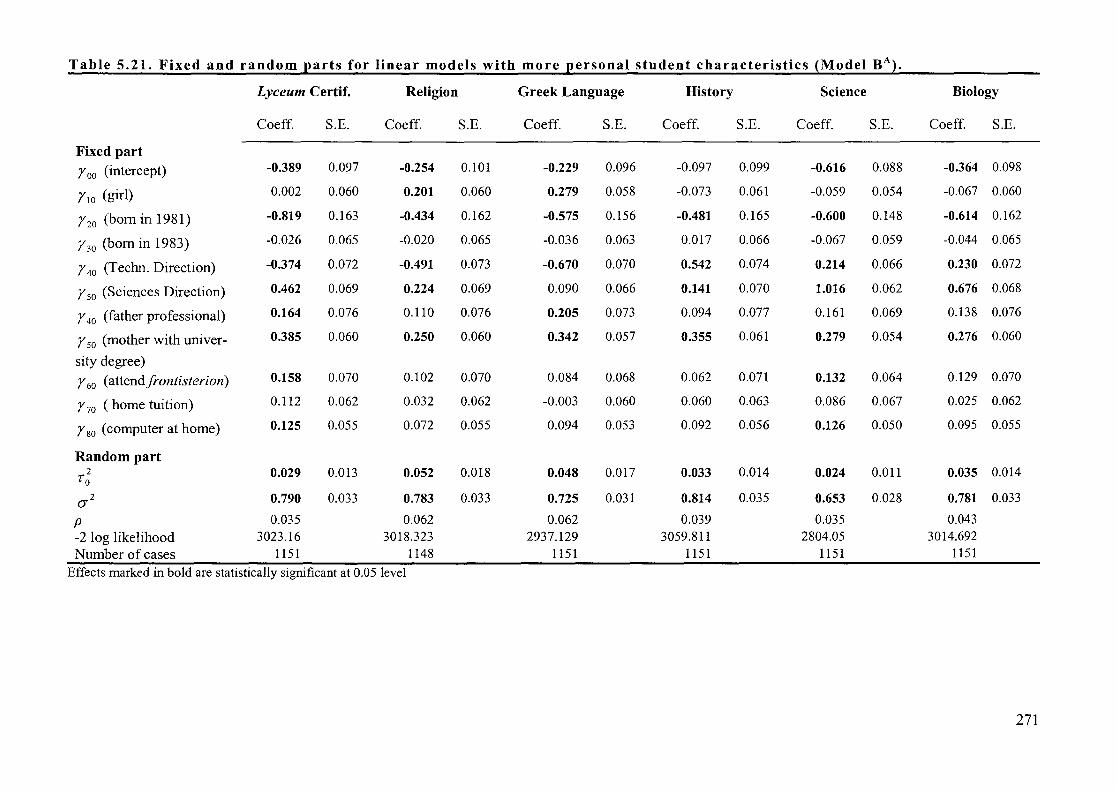
Table 5.21. Fixed and random ~arts for linear models with more ~ersonal student characteristics {Model BAl.
Lyceum Certif. Religion Greek Language History Science Biology
Coeff. S.E. Coeff. S.E. Coeff. S.E. Coeff. S.E. Coeff. S.E. Coeff. S.E.
Fixed part roo (intercept) -0.389 0.097 -0.254 0.101 -0.229 0.096 -0.097 0.099 -0.616 0.088 -0.364 0.098
rIO (girl) 0.002 0.060 0.201 0.060 0.279 0.058 -0.073 0.061 -0.059 0.054 -0.067 0.060
r 20 (born in 1981) -0.819 0.163 -0.434 0.162 -0.575 0.156 -0.481 0.165 -0.600 0.148 -0.614 0.162
r30 (born in 1983) -0.026 0.065 -0.020 0.065 -0.036 0.063 0.017 0.066 -0.067 0.059 -0.044 0.065
r 40 (Techn. Direction) -0.374 0.072 -0.491 0.073 -0.670 0.070 0.542 0.074 0.214 0.066 0.230 0.072
r 50 (Sciences Direction) 0.462 0.069 0.224 0.069 0.090 0.066 0.141 0.070 1.016 0.062 0.676 0.068
r 40 (father professional) 0.164 0.076 0.110 0.076 0.205 0.073 0.094 0.077 0.161 0.069 0.138 0.076
r 50 (mother with univer- 0.385 0.060 0.250 0.060 0.342 0.057 0.355 0.061 0.279 0.054 0.276 0.060
sity degree)
r 60 (attendfrontisterion) 0.158 0.070 0.102 0.070 0.084 0.068 0.062 0.071 0.132 0.064 0.129 0.070
r 70 (home tuition) 0.112 0.062 0.032 0.062 -0.003 0.060 0.060 0.063 0.086 0.067 0.025 0.062
r 80 (computer at home) 0.125 0.055 0.072 0.055 0.094 0.053 0.092 0.056 0.126 0.050 0.095 0.055
Random part 2
To 0.029 0.013 0.052 0.018 0.048 0.017 0.033 0.014 0.024 0.011 0.035 0.014
(J"2 0.790 0.033 0.783 0.033 0.725 0.031 0.814 0.035 0.653 0.028 0.781 0.033
P 0.035 0.062 0.062 0.039 0.035 0.043 -2 log likelihood 3023.16 3018.323 2937.129 3059.811 2804.05 3014.692
Number of cases 1151 1148 1151 1151 1151 1151
Effects marked in bold are statistically significant at 0.05 level
271
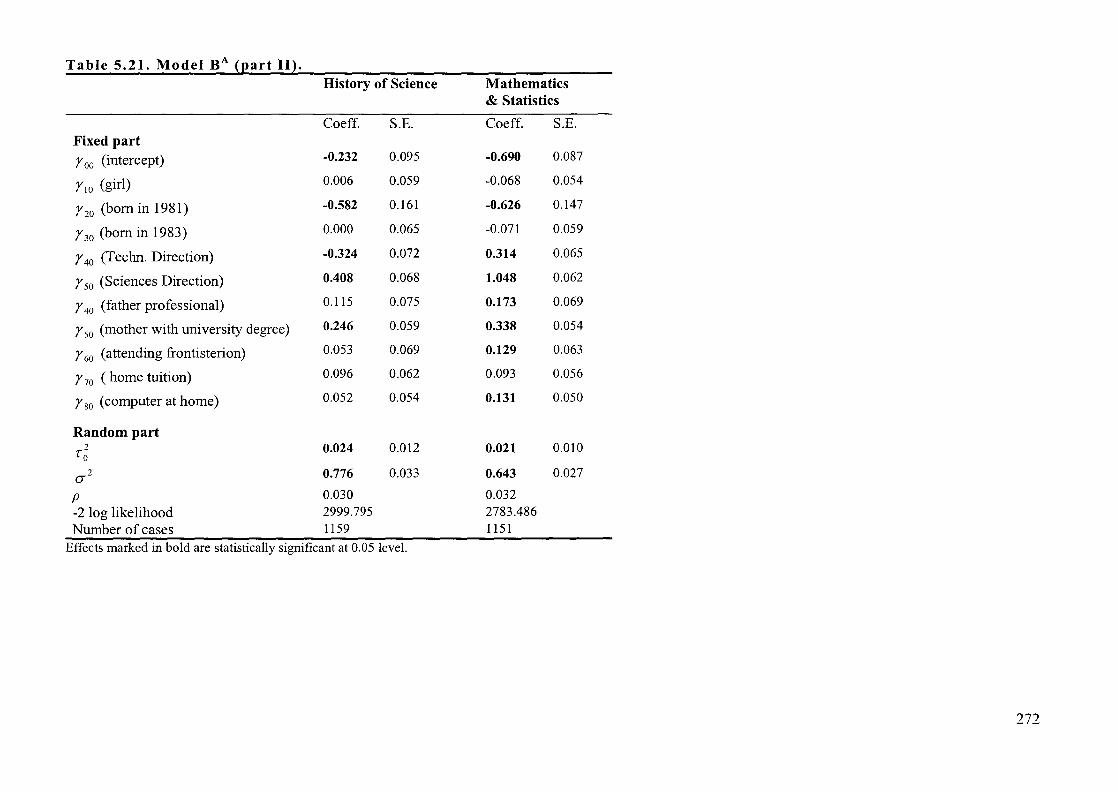
Table 5.21. Model BA (part II). History of Science Mathematics
& Statistics
Coeff. S.E. Coeff. S.E. Fixed part roo (intercept) -0.232 0.095 -0.690 0.087
rIO (girl) 0.006 0.059 -0.068 0.054
r20 (born in 1981) -0.582 0.161 -0.626 0.147
r30 (born in 1983) 0.000 0.065 -0.071 0.059
r 40 (Techn. Direction) -0.324 0.072 0.314 0.065
r 50 (Sciences Direction) 0.408 0.068 1.048 0.062
r 40 (father professional) 0.115 0.075 0.173 0.069
r 50 (mother with university degree) 0.246 0.059 0.338 0.054
r 60 (attending frontisterion) 0.053 0.069 0.129 0.063
r 70 (home tuition) 0.096 0.062 0.093 0.056
r 80 (computer at home) 0.052 0.054 0.131 0.050
Random part 2
To 0.024 0.012 0.021 0.010
(5'2 0.776 0.033 0.643 0.027
P 0.030 0.032
-2 log likelihood 2999.795 2783.486
Number of cases 1159 1151
Effects marked in bold are statistically significant at 0.05 level.
272
The relation between parents' socio-economic status (SES) and students' academic
achievement is something that educational research has illustrated from the 1960s
onwards (e.g. the works of Coleman et aI., 1966, Plowden, 1967, and Jencks et at.,
1972). In the Greek literature, Professor Andreas Kazamias, has called the relation
between SES and academic achievement 'the iron rule of educational research'
(Kazamias, 1995). However, this 'iron rule' has never been verified in the Greek
context. Firstly, as we saw in Section 2.2.3, Greek thinkers in the sphere of education
have focused on the role of schooling as a mechanism for economic growth rather than
the possible role of schooling in terms of promoting equality and social justice.
Secondly, large-scale sociological studies are usually based on educational statistics and
such statistics are not normally available in Greece.
However, the relation between achievement and socio-economic status is well known
among Greek academics but only indications of it exist in the literature. For example
Antoninis & Tsakloglou (2001) analysed the data of the 1993 - 1994 Household Budget
Survey in Greece and wrote recently that 'children of better-off families are over
represented in tertiary education' (p. 218). It is not unusual for many Greek researchers
to approach the issue of educational inequalities from an organisational rather than a
sociological point of view. Such an approach has been made in Greece by Kassotakis &
Papageli (1996) who have based their study concerning Greek students' access to
tertiary education on percentages and other simple statistical measures of central
location.
Another important and new finding in Model BA is the effect of frontisterion and
idiaiteron on students' achievement. As discussed in Section 2.1.3, the jrontisterion can
be seen as both a reflection and a probable cause of the low quality of the Greek school
system. The contribution of the frontisterion to educational inequalities is large. The
exact effects of jrontisterion attendance on academic achievement is difficult to
measure in detail because the word of the evening cramming schools - the jrontisteria -
is inaccessible and secretive. However, it is clear in Model BA that frontisterion
attendance (as reported by students themselves) has had a significant positive impact on
academic achievement, especially in the subjects which are associated with the exact
sciences: Mathematics, Biology, and Science. It seems, therefore, that 'under the table'
education is more useful for the subjects which require procedural rather than
declarative kinds of knowledge.
273
Interestingly, private tuition at home, in contrast to jrontisterion attendance, appears to
have no statistically significant impact on students' achievement; the coefficients for
'home tuition' are positive but not statistically significant in Model BA. This piece of
information may be useful for Greek parents who often invest a larger amount of money
in private tutoring instead of a frontisterion. However, the lack of significant impact
from private tuition on academic achievement may as well be attributed to the reasons
why the parents of a specific student choose this form of additional education. For
example, it may be that private tuition is being used by students who have already been
low-achievers or those who have difficulties with a specific subject. As Model P:ear has
shown, low achievement is something that remains partly steady from one school year
to the next. Finally, Table 5.22 presents the 39 schools of Sample B, ranked according
to Bayesian estimates of their average students' achievement. The grey areas indicate
the schools which are either below or above average with a 95% level of statistical
significance. It seems that schools are consistently effective for a range of subjects.
274
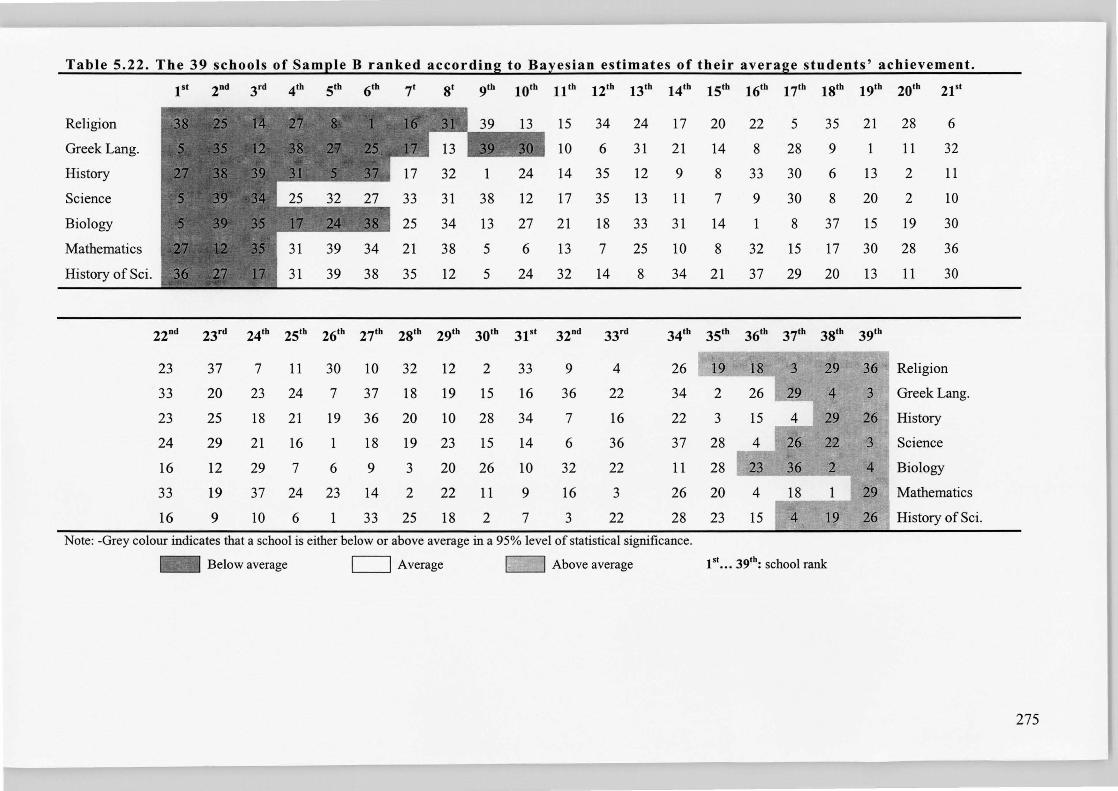
Table 5.22. The 39 schools of Sample B ranked according to Bayesian estimates of their average students' achievement.
Religion
Greek Lang.
History
Science
Biology
Mathematics
History of Sci.
1 st 20d 3rd 4 th 5th 6th 7t 8t 9th 10th 11th 12tb 13tb 14th 15th 16tb 17th 18th 19tb 20tb 21 st
31
31
39 34
39 38
17
33
25
21
35
32
31
34
38
12
1
38
13
5
5
15
10
24 14
12 17
27 21
6 13
24 32
34 24
6 31
35 12
35 13
18 33
7 25
14 8
220d 23 rd 24th 25tb 26tb 27th 28th 29th 30tb 31't 320d 33 rd
23
33
23
24
16
33
16
37
20
25
29
12
19
9
7 11 30 10 32 12 2 33
23 24 7 37 18 19 15 16
18 21 19 36 20 10 28 34
21 16 1 18 19 23 15 14
29 7 6 9 3 20 26 10
37 24 23 14 2 22 11 9
10 6 1 33 25 18 2 7
9
36
7
6
32
16
3
4
22
16
36
22
3
22
17
21
9
11
31
10
34
20
14
8
7
14
8
21
22 5 35
8 28 9
33 30 6
9 30 8
1 8 37
32 15 17
37 29 20
21
1
13
20
15
30
13
28
11
2
2
19
28
11
6
32
11
10
30
36
30
34th 35th 36tb 37th 38th 39tb
26 I 19
34 2
22 3
37 28
29 36 Religion
4 3 Greek Lang.
29 26 History
22 3 Science
11 28 .:::;.:;;.,_..::;.;;;._....:2~ 4 Biology
26 20 4 18 1 29 Mathematics
28 23 15 4 19 26 History of Sci.
Note: -Grey colour indicates that a school is either below or above average in a 95% level of statistical significance.
Below average C:=J Average r==I Above average 1st .•• 39th: school rank
275

5.2.9. CONCLUSIONS
In the previous sections, the phrase 'effective school' has meant the schools the students
of which achieved higher grades than expected, given their year of birth, gender,
Direction of studies, school size and type, and an arguable measure of previous
achievement. The multilevel linear models which have been built so far have been
associated with two distinct data sets: the population of the schools in Attiki and a
stratified random sample of this popUlation. These models can be seen as contextual
ones. The outcomes were at first adjusted for intake characteristics but not for prior
achievement. No private schools were included in Sample B. The first research question
of the current study asks if schools are equally effective in terms of their students'
academic achievement. The answer to this question seems to be negative. As in other
educational contexts, schools seem to make a difference also in Greece. From the
analysis of the normalised examination results of June 2000 (population) it has been
found that private lyceia have higher results than state lyceia and that large lyceia have
higher results than small lyceia. The analysis, however, has not made it possible to
explain the reasons for the difference in the results because vital contextual information
is lacking.
In the 'empty' Model pO, it has been found that the average 'unexplained' intra-school
correlation for the seven subjects of General Education in the population is about 0.10.
This coefficient was reduced to around 0.07 - on average - in Model pAS, the more
elaborated model for the population. When previous achievement (one year before) was
added, Model P:ar yielded a school-level variance of around 0.03 (see Table 5.18).
However, it must be noted that the 'value-added' models in the current study suffer
from significant limitations in that they only cover progress over a one-year period and
the Greek context of student arrest means that the prior attainment measure is of
doubtful quality. In the 'variance component' model for Sample B, the average intra
school correlation coefficient is around 0.06. This coefficient has dropped to an average
value of 0.04 in the elaborated Model BA. The amount of variance that is statistically
'explained' by the school-factor in models pAS, P:'~r' and BA is very close to the
findings of Scheerens & Bosker (1997), as presented in Section 3.6 ofthe current work.
Except for differences in academic achievement, schools have been found to differ in
terms of their students' likelihood of success in the lyceum certificate. With the help of
276

the hierarchical non-linear Model P:, it has been found that variance of the logistic
intercept tenn T~ is about 0.432 with a standard error of 0.049. The estimated ratio of
success in the population is 0.932 or 93%, a very high percentage of successful students.
The high rate of success in the lyceum certificate can best be interpreted as a result of
the system's 'overproduction' of high achievers rather than an indicator of good
educational practices in schools. The standard deviation of the probability of success in
the lyceum certificate was calculated to be 0.217. Thus, in some lyceia the students have
a better chance of obtaining their certificate than the others.
In the popUlation of schools, the student-level factors which help to explain success in
obtaining the lyceum certificate (a binary outcome) are the same as the factors which
help to explain academic achievement. These factors are students' year of birth, sex, and
Direction of studies. Specifically, it has been found that, with the exception of
Mathematics and History, girls achieve higher grades than boys. For Science, the
coefficient for 'girls' is negative but not significantly different from zero. 'Direction of
studies' is also a significant factor in explaining achievement in the seven subjects of
General Education. Specifically, students who attended the Technology Direction
achieved on average lower grades than the grades of the other two Directions. In tum,
the students who attended the Sciences Direction achieved on average higher grades
than students of the other two Directions. It should be noted that the choice of Direction
can be seen as a crude indicator of prior attainment in that more able students tend to
opt for the Sciences Direction, which is perceived as more challenging.
When social background factors were entered into the models, it was found that students
with an advantaged family background achieved better grades than the other students. In
the current study, the advantaged family background includes a mother with a university
degree, a father who is a functionary and the access to a computer at the student's home.
Students' social background includes an indicator of learning opportunities outside
school: Fronisteria and private lessons at home. It has been found that private lessons
do not affect achievement in a statistically significant way for the students in the
sample. By contrast, the jrontisterion is an important factor for achievement, especially
for subjects associated with a procedural rather than a declarative type knowledge.
Further research on these aspects of lateral education is required in order to understand
their impact on students' achievement.
277

The 375 schools of the study have been ranked according to Bayesian estimates of their
students' mean achievement. In Figure 5.1 school differences are clearly pictured on the
left and the right hand side of the 'caterpillar' graph. The schools in which student
achievement is significantly higher of lower than the average are those for which the
confidence intervals do not overlap. The identity of the first school in the far right of the
graph will not made known but it is one of the 'good' private schools in the northern
suburbs of Athens. Whether this school is really the most effective school in the
prefecture of Attiki is a matter for further discussion which would need additional
information about students' previous attainment. Unfortunately, with the data available,
the current study can only initiate a number of discussions on the features ofthe more or
less effective schools but definite answers are very difficult to give. Statements about
the quality of individual schools need to be reinforced by other researchers who will
have access to crucial information on educational inputs, outputs and processes. Given
the fact that there is no official mechanism in Greece for monitoring the quality of the
educational system, no predictions about when or how this information will come can
be made.
278
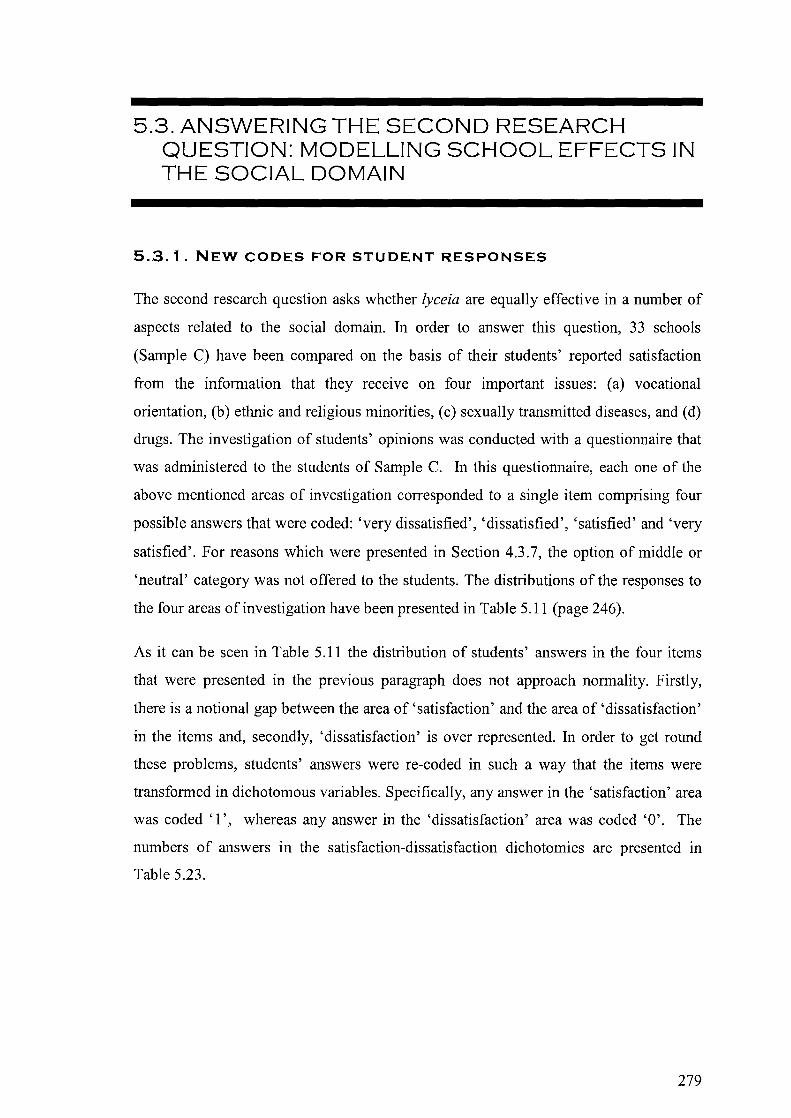
5.3. ANSWERING THE SECOND RESEARCH QUESTION: MODELLING SCHOOL EFFECTS IN THE SOCIAL DOMAIN
5.3.1. NEW CODES FOR STUDENT RESPONSES
The second research question asks whether lyceia are equally effective in a number of
aspects related to the social domain. In order to answer this question, 33 schools
(Sample C) have been compared on the basis of their students' reported satisfaction
from the information that they receive on four important issues: (a) vocational
orientation, (b) ethnic and religious minorities, (c) sexually transmitted diseases, and (d)
drugs. The investigation of students' opinions was conducted with a questionnaire that
was administered to the students of Sample C. In this questionnaire, each one of the
above mentioned areas of investigation corresponded to a single item comprising four
possible answers that were coded: 'very dissatisfied', 'dissatisfied', 'satisfied' and 'very
satisfied'. For reasons which were presented in Section 4.3.7, the option of middle or
'neutral' category was not offered to the students. The distributions of the responses to
the four areas of investigation have been presented in Table 5.11 (page 246).
As it can be seen in Table 5.11 the distribution of students' answers in the four items
that were presented in the previous paragraph does not approach normality. Firstly,
there is a notional gap between the area of 'satisfaction' and the area of 'dissatisfaction'
in the items and, secondly, 'dissatisfaction' is over represented. In order to get round
these problems, students' answers were re-coded in such a way that the items were
transformed in dichotomous variables. Specifically, any answer in the 'satisfaction' area
was coded '1', whereas any answer in the 'dissatisfaction' area was coded '0'. The
numbers of answers in the satisfaction-dissatisfaction dichotomies are presented in
Table 5.23.
279
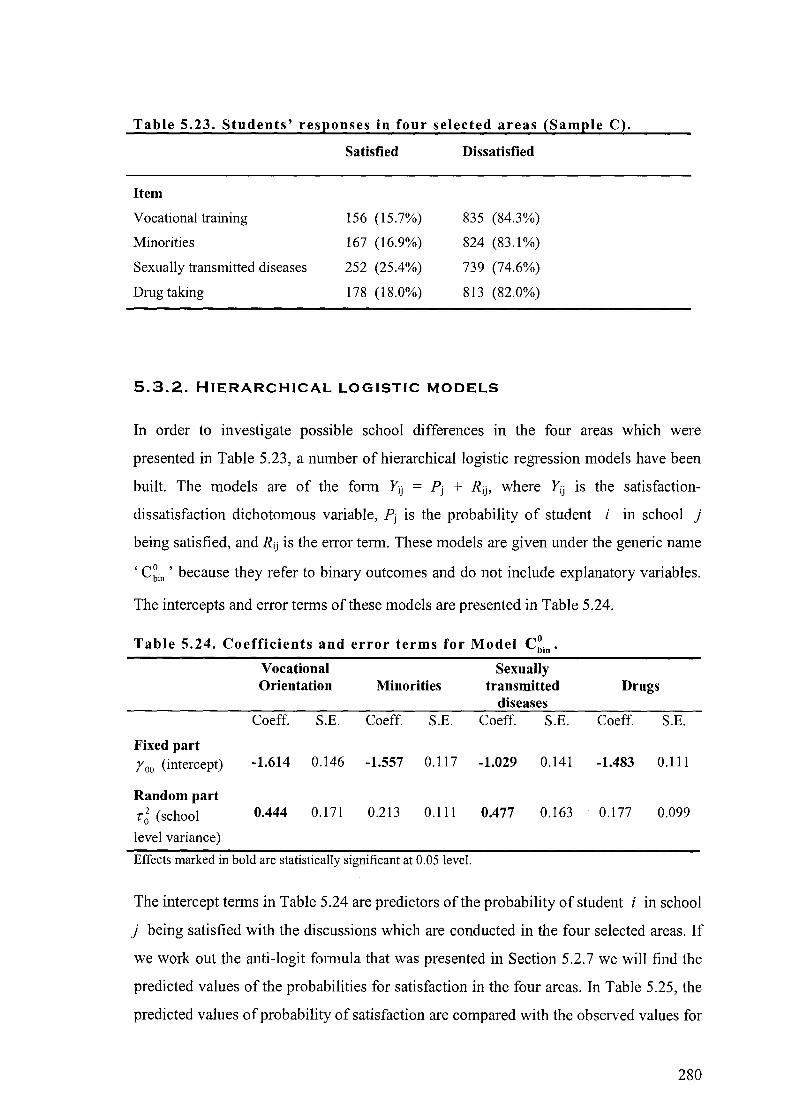
Table 5.23. Students' responses in four selected areas (Sample C).
Item
Vocational training
Minorities
Sexually transmitted diseases
Drug taking
Satisfied
156 (15.7%)
167 (16.9%)
252 (25.4%)
178 (18.0%)
Dissatisfied
835 (84.3%)
824 (83.1%)
739 (74.6%)
813 (82.0%)
5.3.2. HIERARCHICAL LOGISTIC MODELS
In order to investigate possible school differences in the four areas which were
presented in Table 5.23, a number of hierarchical logistic regression models have been
built. The models are of the fonn Y ij = Pj + Rij, where Y ij is the satisfaction
dissatisfaction dichotomous variable, Pj is the probability of student i in school j
being satisfied, and Rij is the error tenn. These models are given under the generic name
'C~in ' because they refer to binary outcomes and do not include explanatory variables.
The intercepts and error tenns of these models are presented in Table 5.24.
Table 5.24. Coefficients and error terms for Model C~in'
Vocational Sexually Orientation Minorities transmitted Drugs
diseases Coeff. S.E. Coeff. S.E. Coeff. S.E. Coeff. S.E.
Fixed part roo (intercept) -1.614 0.146 -1.557 0.117 -1.029 0.141 -1.483 0.111
Random part
T~ (school 0.444 0.171 0.213 0.111 0.477 0.163 0.177 0.099
level variance)
Effects marked in bold are statistically significant at 0.05 level.
The intercept tenns in Table 5.24 are predictors of the probability of student i in school
j being satisfied with the discussions which are conducted in the four selected areas. If
we work out the anti-logit fonnula that was presented in Section 5.2.7 we will find the
predicted values of the probabilities for satisfaction in the four areas. In Table 5.25, the
predicted values of probability of satisfaction are compared with the observed values for
280
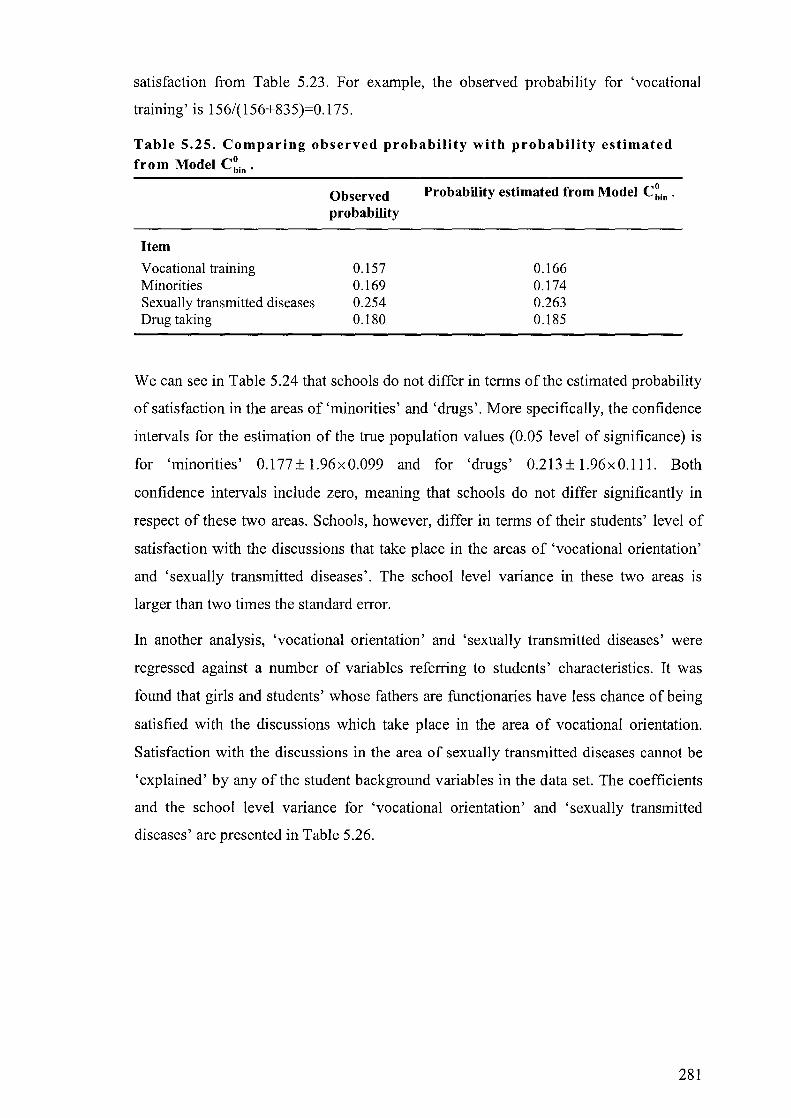
satisfaction from Table 5.23. For example, the observed probability for 'vocational
training' is 156/(156+835)=0.175.
Table 5.25. Comparing observed probability with probability estimated
from Model C~in .
Item
Vocational training Minorities Sexually transmitted diseases Drug taking
Observed Probability estimated from Model C~in . probability
0.157 0.169 0.254 0.180
0.166 0.174 0.263 0.185
We can see in Table 5.24 that schools do not differ in terms of the estimated probability
of satisfaction in the areas of 'minorities' and 'drugs'. More specifically, the confidence
intervals for the estimation of the true population values (0.05 level of significance) is
for 'minorities' 0.177± 1.96 x 0.099 and for 'drugs' 0.213± 1.96xO.lll. Both
confidence intervals include zero, meaning that schools do not differ significantly in
respect of these two areas. Schools, however, differ in terms of their students' level of
satisfaction with the discussions that take place in the areas of 'vocational orientation'
and 'sexually transmitted diseases'. The school level variance in these two areas IS
larger than two times the standard error.
In another analysis, 'vocational orientation' and 'sexually transmitted diseases' were
regressed against a number of variables referring to students' characteristics. It was
found that girls and students' whose fathers are functionaries have less chance of being
satisfied with the discussions which take place in the area of vocational orientation.
Satisfaction with the discussions in the area of sexually transmitted diseases cannot be
'explained' by any of the student background variables in the data set. The coefficients
and the school level variance for 'vocational orientation' and 'sexually transmitted
diseases' are presented in Table 5.26.
281
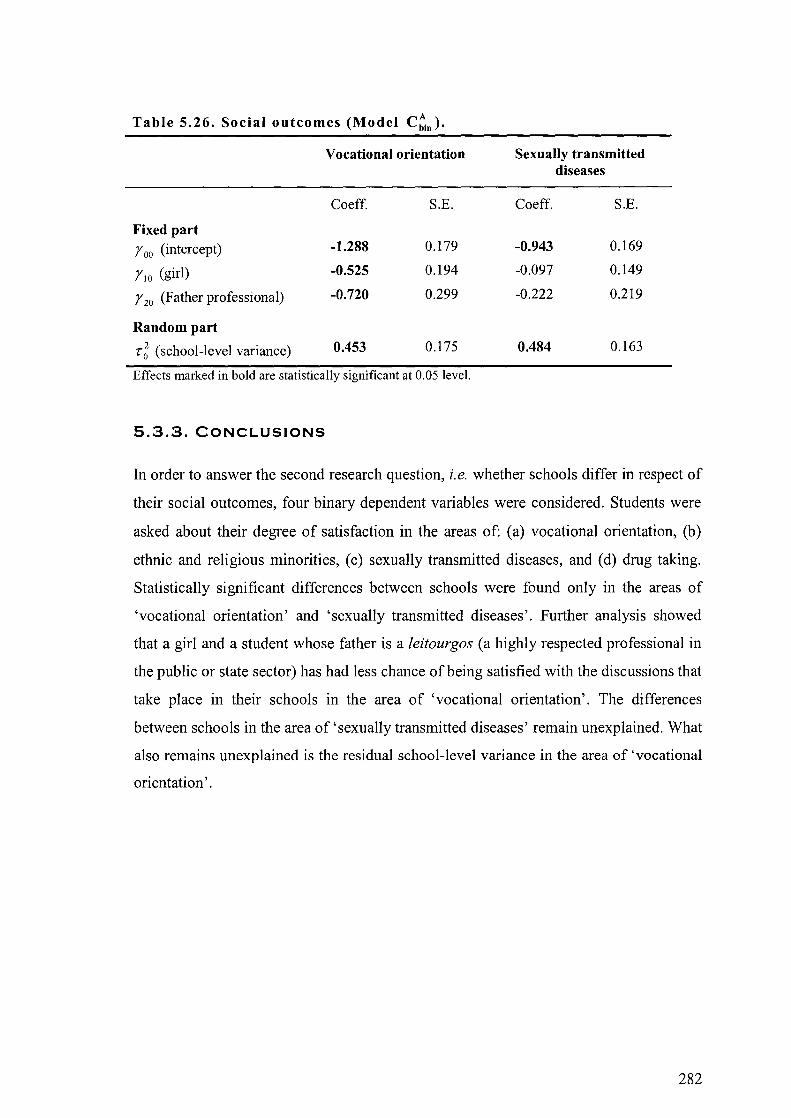
Table 5.26. Social outcomes (Model C~n)'
Vocational orientation
Coeff. S.E.
Fixed part
roo (intercept) -1.288 0.179
rIO (girl) -0.525 0.194
r 20 (Father professional) -0.720 0.299
Random part
T~ (school-level variance) 0.453 0.175
Effects marked in bold are statistically significant at 0.05 level.
5.3.3. CONCLUSIONS
Sexually transmitted diseases
Coeff. S.E.
-0.943 0.169
-0.097 0.149
-0.222 0.219
0.484 0.163
In order to answer the second research question, i. e. whether schools differ in respect of
their social outcomes, four binary dependent variables were considered. Students were
asked about their degree of satisfaction in the areas of: (a) vocational orientation, (b)
ethnic and religious minorities, (c) sexually transmitted diseases, and (d) drug taking.
Statistically significant differences between schools were found only in the areas of
'vocational orientation' and 'sexually transmitted diseases'. Further analysis showed
that a girl and a student whose father is a leitourgos (a highly respected professional in
the public or state sector) has had less chance of being satisfied with the discussions that
take place in their schools in the area of 'vocational orientation'. The differences
between schools in the area of 'sexually transmitted diseases' remain unexplained. What
also remains unexplained is the residual school-level variance in the area of 'vocational
orientation' .
282
5.4. ANSWERING THE THIRD RESEARCH QUES~ TION: CONSISTENCY OF SCHOOL EFFECTS
5.4.1. SCHOOL EFFECTS ACROSS DIFFERENT ACADEMIC OUTCOMES
The third research question asks if schools have been equally effective in the final year
for different academic outcomes and students with different characteristics. In order to
investigate if schools are equally effective, four different academic outcomes have been
selected for study: (a) Religion (Greek Orthodox Catechism), (b) Greek Language, (c)
Mathematics, and (d) Science. The selection of these General Education subjects was
deliberate. Mathematics and Science are two subjects frequently researched in the
context of international evaluation studies. Religion and Greek Language are considered
strong components in the syllabus of the Greek integrated lyceum. According to
Kassotakis (2000) 'Greek history, tradition, culture, Orthodox Religion and modem
Greek Language .,. are considered essential components of the Greek national identity
and will also have to be accomplished through education' (p. 185).
In order to answer the third research question new models have been used, more
complex than the ones which were described in Section 5.2. The new models are
necessary because the ones which have been used up to now are not appropriate for
making multiple comparisons between different school outcomes or students with
different characteristics. What constrains the comparing power of the models in Section
5.2 is the problem of 'capitalisation on chance', i.e. the probability of - incorrectly -
finding differences due only to the large number comparisons. For example if we
compare the coefficient for the dummy variable 'girl' across the columns of Table 5.21,
we might find some differences between the columns but we are not sure that these
differences are 'real'.
The solution to the problem of capitalising on chance is the construction of multivariate
multilevel models which are appropriate for multiple comparisons. Two such models
have been constructed for the needs of the third research question of the current study.
The first model refers to the popUlation of schools and has been named 'Model p~:an.
The basis of construction of Model P ~:ar was Model pAS. The second multivariate model
283
refers to Sample B and the basis of its construction was Model BA. It has therefore been
called 'Model B~v'. The fixed parts of Models p;:ar and B~v are presented in Table
5.27 and Table 5.30 respectively.
A number of points need to be clarified as regards Model p;:ar and Model B~v'
Contrary to what is the case in the models of Section 5.2, Models P ;:ar and B ~v do not
refer to many school outcomes but to one. Thus, it is suggested that an imaginary
outcome exist, which combines achievement in Religion, Greek Language, Mathematics
and Science. This imaginary outcome follows the multivariate normal distribution.
Therefore, whilst Model pAB is repeated on page 255 as many times as the subjects in
the columns of Table 5.16, only a single Model p;:ar exist. The notation of the
coefficients in Models p;:ar and B~v is a little more complicated because it comprises
three subscripts instead of two. The role of the first two subscripts is to indicate the
position of the coefficient in the models. The role of the third subscript, the 'h', is to
indicate the name of the dependent variable: h = for Religion, h = 2 for Greek
Language, h = 3 for Mathematics, and h = 4 for Science.
5.4.2. VALUE-ADDED MULTIVARIATE MULTILEVEL MODEL FOR THE POPULATION
The fixed part of the multivariate Model for the population P ;:ar is presented in Table
5.27. Model p~:ar includes students' mean achievement in year 2 (the B). Previous
achievement has been included in the multilevel multivariate models because the focus
of the current section is on the final year of lyceum. If we compare the fixed parts of
Model pyear and Model P ;:ar, we will see that there are no significant differences in
Religion, Greek Language, Science and Mathematics. In both models, the coefficient
for 'girl' is negative for Science and Mathematics. This means that after controlling for
the mean academic achievement in year 2, as well as for a number of other independent
variables, the girls appear to have significantly lower grades than the boys in these two
subjects. Significant differences between the two sexes are for the first time being
measured in the Greek educational system. In Model P ~~ar , these differences are more
clearly apparent because the coefficients are now directly comparable among the four
284
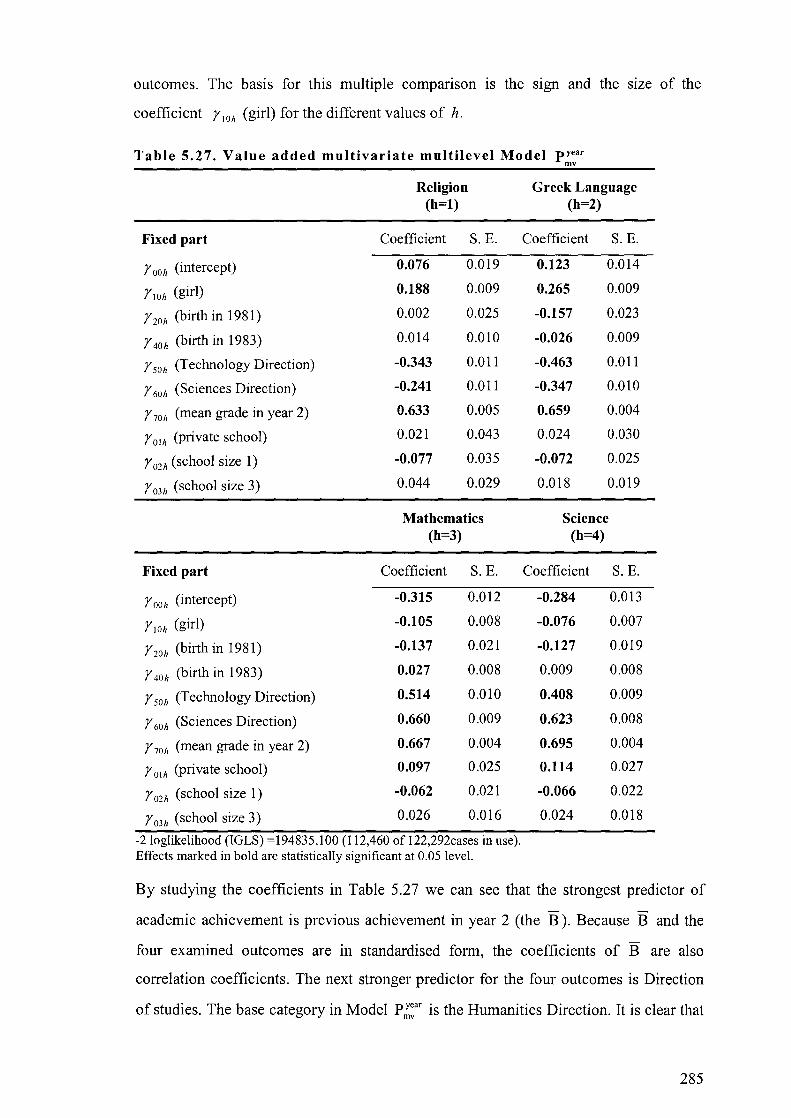
outcomes. The basis for this multiple companson IS the SIgn and the SIze of the
coefficient r IOh (girl) for the different values of h.
Table 5.27. Value added multivariate multilevel Model pyear mv
Religion Greek Language (h=l) (h=2)
Fixed part Coefficient S.E. Coefficient S. E.
r OOh (intercept) 0.076 0.019 0.123 0.014
rlOh (girl) 0.188 0.009 0.265 0.009
r 20h (birth in 1981) 0.002 0.025 -0.157 0.023
r 40h (birth in 1983) 0.014 0.010 -0.026 0.009
r 50h (Technology Direction) -0.343 0.011 -0.463 0.011
r 60h (Sciences Direction) -0.241 0.011 -0.347 0.010
r 70h (mean grade in year 2) 0.633 0.005 0.659 0.004
r Olh (private school) 0.021 0.043 0.024 0.030
r 02h (school size 1) -0.077 0.035 -0.072 0.025
r 03h (school size 3) 0.044 0.029 0.018 0.019
Mathematics Science (h=3) (h=4)
Fixed part Coefficient S. E. Coefficient S. E.
r OOh (intercept) -0.315 0.012 -0.284 0.013
rlOh (girl) -0.105 0.008 -0.076 0.007
r 20h (birth in 1981) -0.137 0.021 -0.127 0.019
r 40h (birth in 1983) 0.027 0.008 0.009 0.008
r 50h (Technology Direction) 0.514 0.010 0.408 0.009
r 60h (Sciences Direction) 0.660 0.009 0.623 0.008
r 70h (mean grade in year 2) 0.667 0.004 0.695 0.004
r Olh (private school) 0.097 0.025 0.114 0.027
r 02h (school size 1) -0.062 0.021 -0.066 0.022
r 03h (school size 3) 0.026 0.016 0.024 0.018
-2 loglikelihood (IGLS) =194835.100 (112,460 of l22,292cases in use). Effects marked in bold are statistically significant at 0.05 level.
By studying the coefficients in Table 5.27 we can see that the strongest predictor of
academic achievement is previous achievement in year 2 (the B). Because B and the
four examined outcomes are in standardised fonn, the coefficients of B are also
correlation coefficients. The next stronger predictor for the four outcomes is Direction
of studies. The base category in Model P ~:ar is the Humanities Direction. It is clear that
285
boys and students from the Technology and Sciences Direction have better grades for
Science and Mathematics and lower grades for Religion and Greek Language. Another
finding is that on average the students of the private schools achieve higher grades than
the students of state schools. The benefit of being student in a private school is larger in
Science (coefficient =0.117) and smaller in Religion where the coefficient is effectively
equal to zero. Being a student in a small school (less than 50 participants in the
examinations) is a disadvantage for all the four outcomes of Model P ~~ar. On the other
hand, the coefficients for the large schools (over 101 participants) are not different from
zero.
Differences between the sexes and Direction of studies acquire a special meaning in the
case of Orthodox Religion (h=I). Religion in Greek schools is taught by clergymen. The
educational objective of the subject is to catechise the students in the values of the
Greek Orthodox Church. Other groups' values are not presented in the classrooms and
different theologies are regarded as inferior to that of the Greek Orthodox. Religion is
the only outcome in Model P ~~ar for which the coefficient for the variable 'born before
1982' is not statistically significant. However, differences have been found for Religion
between the two sexes, the Directions of Studies and the size of the schools. There are
two possible explanations for these differences: either girls who follow the Humanities
Direction in large schools are more knowledgeable than the boys who follow the other
two Directions in small schools or Religion has much in common with subjects in
which similar patterns of achievement appear. The second explanation is much more
plausible. The importance of this conclusion in educational policy will be a matter of
discussion in the sixth chapter of the current work. The relation between the subjects is
more clearly presented in the two following tables. Table 5.28 presents the residual
covariance matrix of the four subjects at school level. The numbers in the diagonal are
the variances whereas the numbers off the diagonal represent the covariance between
the items. The numbers in the parentheses are standard errors and the numbers in bold
are correlation coefficients. The same notation has been used in Table 5.29, which
presents the residual covariance and correlation coefficients at student level.
286

Table 5.28. Residual between school covariance !J75 schools~. Religion Greek Mathematics Science
Language 0.049 (0.004)
Religion 1 0.010 (0.002) 0.020 (0.002)
Greek Lang. 0.317 1 0.004 (0.002) 0.005 (0.001) 0.013 (0.001)
Mathematics 0.168 0.338 1 0.004 (0.002) 0.004 (0.001) 0.008 (0.001) 0.017 (0.002)
Science 0.138 0.214 0.537 1
Note: All values are statistically significant at 0.05 level. Values in bold are Pearson's correlation coefficients.
Table 5.29. Residual within school covariance (375 schools). Religion Greek
Language 0.459 (0.004)
Religion 1 0.152 (0.003) 0.415 (0.004)
Greek Lang. 0.348 1 0.065 (0.002) 0.065 (0.002)
Mathematics 0.167 0.175 0.081 (0.002) 0.070 (0.002)
Science 0.224 0.204
All values are statistically significant at 0.05 level. Values in bold are Pearson's correlation coefficients.
Mathematics
0.332 (0.003) 1 0.155 (0.002) 0.503
Science
0.288 (0.002) 1
By observing the structure of covariance at school and student level, it can be concluded
that at both levels there is strong correlation between Science and Mathematics. The
smallest correlation coefficient at school-level is between Religion and Science whereas
the smallest correlation coefficient at student-level is between Religion and
Mathematics. Within schools, Greek Language correlates in only a small degree with
Mathematics. Between schools, however, Mathematics and Greek Language are
medially correlated. The general picture is that within schools there is a fair correlation
between Mathematics and Science on the one hand, and Religion and Greek Language
on the other. At the school level, however, Greek Language correlates fairly both with
Religion and with the pair of Mathematics and Science. Students' prior achievement in
Model P ~:ar is not random at school level as in Model pAB and therefore the intra-school
correlation coefficient (P) can be computed. The p coefficient is 0.096 for Religion,
0.046 for Greek Language, 0.038 for Mathematics and 0.046 for Science. In a recent
287
study, Huber (1999) has argued that achievement in Mathematics is rather unaffected by
school level processes. The current study has partially confirmed this finding.
5.4.3. MULTIVARIATE MULTILEVEL MODELS FOR SAMPLE B
Apart from Model p~:ar, Model B~v was constructed in order to investigate the joint
effects of other explanatory variables available only for Sample B. Model B~v was
constructed on the basis of Model BA The fixed coefficients of Model B ~v are
presented in Table 5.30 that follows.
288

Table 5.30. Coefficients for the multivariate multilevel Model B~v'
Religion Greek Language ~h=ll ~h=2l
Fixed part Coefficient S. E. Coefficient S. E.
r OOh (intercept) -0.274 0.100 -0.227 0.096
rlOh (girl) 0.199 0.060 0.278 0.058
r 20h (birth in 1981) -0.439 0.162 -0.575 0.156
r 40h (birth in 1983) -0.016 0.065 -0.037 0.063
r SOh (Technology Direction) -0.491 0.072 -0.668 0.070
r 60h (Sciences Direction) 0.218 0.069 0.090 0.066
r 70h (father professional) 0.116 0.076 0.206 0.073
r SOh (mother with university degree 0.257 0.060 0.343 0.057
r 90h (Frontisterion attendance) 0.117 0.070 0.084 0.068
rlOOh (home tuition) 0.039 0.062 -0.003 0.060
rllOh (computer at home) 0.079 0.055 0.094 0.053
Mathematics Science ~h=3l ~h=4l
Fixed part Coefficient S. E. Coefficient S. E.
r OOh (intercept) -0.696 0.086 -0.615 0.087
rlOh (girl) -0.073 0.054 -0.065 0.054
r 20h (birth in 1981) -0.626 0.146 -0.601 0.147
r 40h (birth in 1983) -0.065 0.059 -0.059 0.059
r SOh (Technology Direction) 0.313 0.064 0.206 0.065
r 60h (Sciences Direction) 1.041 0.061 1.006 0.062
r 70h (father professional) 0.176 0.068 0.162 0.069
r SOh (mother with university degree 0.338 0.054 0.277 0.054
r 90h (Frontisterion attendance) 0.138 0.063 0.138 0.063
rlOOh (home tuition) 0.093 0.056 0.086 0.056
rllOh (computer at home) 0.132 0.049 0.128 0.050
-2loglikelihood (IGLS) = 9191.049 (4601 of 13,528 cases in use) Effects in bold are statistically significant at 0.05 level.
If we compare the fixed coefficients of Model B~v with the coefficients of Model BA
(see Table 5.21), we find no large differences. A comparison between Model p~:ar and
Model B~v however, yields some differences. More specifically, the students that were
born before 1982 have lower grades in all the four outcomes of Model B:'v but not in
289
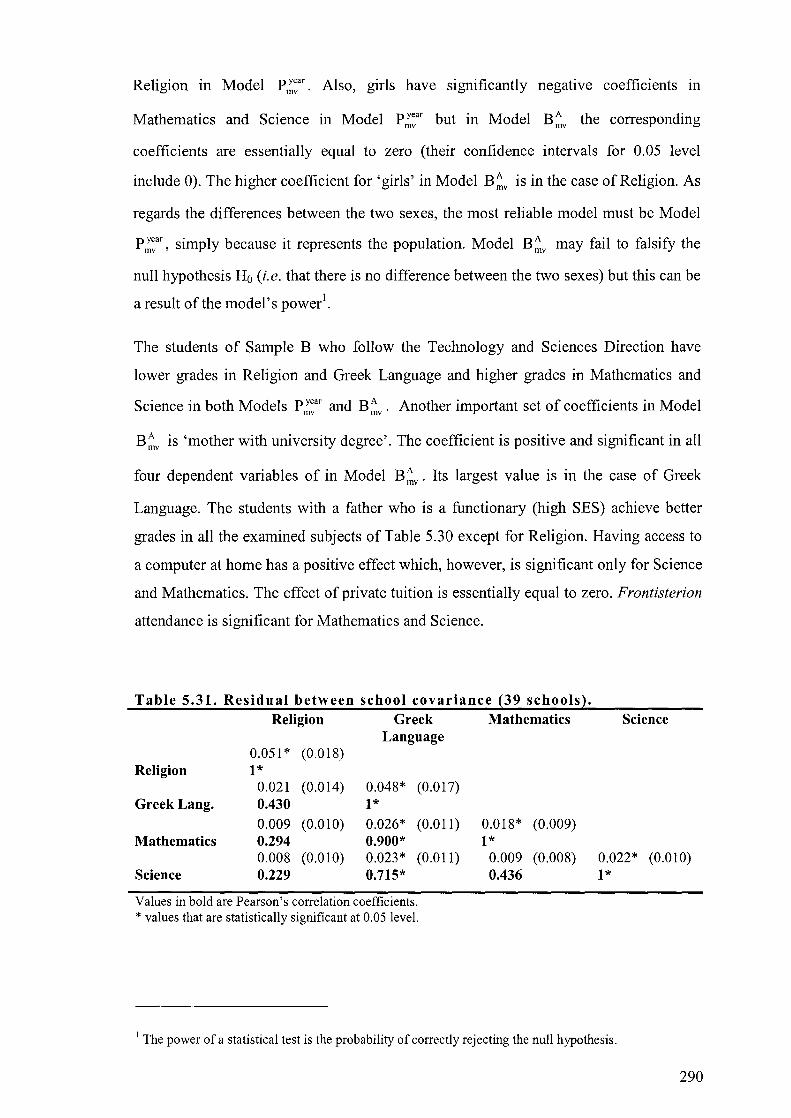
Religion in Model P ~~ar. Also, girls have significantly negative coefficients in
Mathematics and Science in Model p~~ar but in Model B~v the corresponding
coefficients are essentially equal to zero (their confidence intervals for 0.05 level
include 0). The higher coefficient for 'girls' in Model B~v is in the case of Religion. As
regards the differences between the two sexes, the most reliable model must be Model
p~~ar, simply because it represents the population. Model B~v may fail to falsify the
null hypothesis Ho (i.e. that there is no difference between the two sexes) but this can be
a result of the model's powerl.
The students of Sample B who follow the Technology and Sciences Direction have
lower grades in Religion and Greek Language and higher grades in Mathematics and
Science in both Models p~~ar and B~v' Another important set of coefficients in Model
B~v is 'mother with university degree'. The coefficient is positive and significant in all
four dependent variables of in Model B~v' Its largest value is in the case of Greek
Language. The students with a father who is a functionary (high SES) achieve better
grades in all the examined subjects of Table 5.30 except for Religion. Having access to
a computer at home has a positive effect which, however, is significant only for Science
and Mathematics. The effect of private tuition is essentially equal to zero. Frontisterion
attendance is significant for Mathematics and Science.
Table 5.31. Residual between school covariance (39 schools). Religion Greek Mathematics
Language 0.051 * (0.018)
Religion 1* 0.021 (0.014) 0.048* (0.017)
Greek Lang. 0.430 1* 0.009 (0.010) 0.026* (0.011)
Mathematics 0.294 0.900* 0.008 (0.010) 0.023* (0.011)
Science 0.229 0.715*
Values in bold are Pearson's correlation coefficients. * values that are statistically significant at 0.05 level.
0.018* (0.009) 1*
0.009 (0.008) 0.436
Science
0.022* (0.010) 1*
I The power of a statistical test is the probability of correctly rejecting the null hypothesis.
290
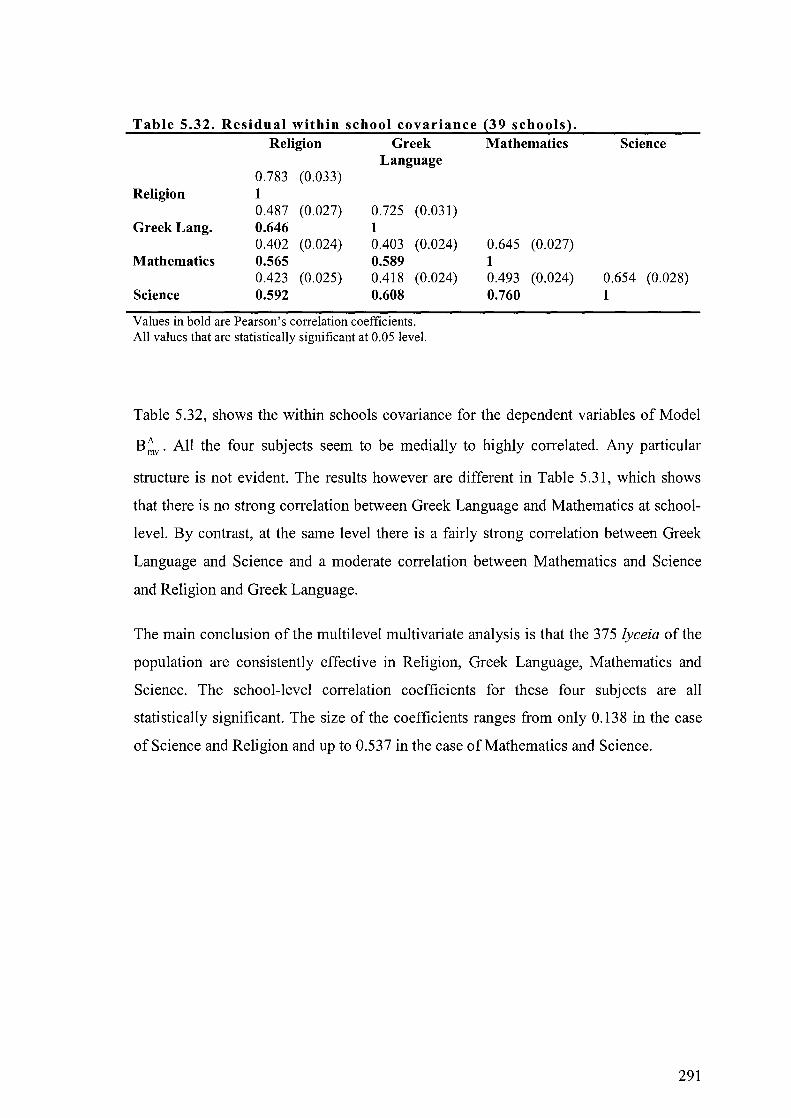
Table 5.32. Residual within school covariance (39 schools). Religion Greek
Language 0.783 (0.033)
Religion 1 0.487 (0.027) 0.725 (0.031)
Greek Lang. 0.646 1 0.402 (0.024) 0.403 (0.024)
Mathematics 0.565 0.589 0.423 (0.025) 0.418 (0.024)
Science 0.592 0.608
Values in bold are Pearson's correlation coefficients. All values that are statistically significant at 0.05 level.
Mathematics
0.645 (0.027) 1 0.493 (0.024) 0.760
Science
0.654 (0.028) 1
Table 5.32, shows the within schools covariance for the dependent variables of Model
B~v' All the four subjects seem to be medially to highly correlated. Any particular
structure is not evident. The results however are different in Table 5.31, which shows
that there is no strong correlation between Greek Language and Mathematics at school
level. By contrast, at the same level there is a fairly strong correlation between Greek
Language and Science and a moderate correlation between Mathematics and Science
and Religion and Greek Language.
The main conclusion of the multilevel multivariate analysis is that the 375 /yceia of the
population are consistently effective in Religion, Greek Language, Mathematics and
Science. The school-level correlation coefficients for these four subjects are all
statistically significant. The size of the coefficients ranges from only 0.138 in the case
of Science and Religion and up to 0.537 in the case of Mathematics and Science.
291
5.5. ANSWERING THE FOURTH RESEARCH QUESTION: ACADEMIC ACHIEVEMENT AND TEACHERS' RESPONSIVENESS
5.5.1. ACADEMIC ACHIEVEMENT AND SCHOOL PROCESSES
The fourth research question asks what are the most important school processes and
policies which are associated with effectiveness in the final year of the Greek lyceum.
Attempting to answer this research question is very complex. The literature of school
effectiveness research has shown that no study has ever exhaustively investigated all the
effective school processes and policies. In the current researcher's opinion, the main
reasons why no perfect study of such a kind will ever be conducted are both theoretical
and methodological. From a theoretical point of view it is well known among teachers
and educators that no single theory of instruction or school organisation has ever been
suggested. From a methodological point of view, the factors which may affect teaching
and learning are myriad and, in addition, even a small change in one of them may affect
the others in an unpredictable way. However, relationships which link processes with
outcomes have been recognised in a large number of studies within the tradition of
school effectiveness research. In the current study only students' views on 'teacher
responsiveness' was selected as an explanatory variable in multilevel analysis.
5.5.2. ACADEMIC ACHIEVEMENT AND TEACHER RESPONSIVENESS
The relationship between school processes and students' academic achievement was
studied with the help of the Factors which were presented in Section 4.3.7.2. More
specifically, all Factors from Table 4.18 and a Factor from Table 4.16 were used as
explanatory variables in multilevel models. These new multilevel models were given the
generic name 'Model C' because they were exclusively constructed for Sample C. The
five teacher Factors which were tested in the new multilevel models were: (a)
'effectiveness of the school's director', (b) 'teachers' self-regulation', (c) 'teachers'
collegiality', (d) 'teachers' satisfaction with their profession', and (e) 'teachers'
keenness'. The four student Factors were: (a) 'teacher responsiveness', (b) 'neatness of
the school environment', (c) 'academic self-image', and (d) 'rivalry among students'.
292

The impact of the fixed coefficient for each one of the five teacher-generated Factors
with students' achievement was essentially equal to zero. This means that 'teachers'
self-regulation', 'collegiality', 'satisfaction', and 'keenness' appear to have no
significant effects on students' achievement for this sample. This is an unexpected
finding. There are two possible explanations for it. The first explanation is that the
finding is correct and there is essentially no relationship between teachers' Factors and
students' academic outcomes. The second explanation is that relationships between the
explanatory Factors and the outcomes do exist but the constraints of the sample size and
the weaknesses of this phase of the research made it impossible to identify any real
effects. This is a problem of statistical power. However, apart from the power of the
models, there are a number of weaknesses as regards the current phase of the research
that must be recognised. Firstly, the teachers who participated in this phase of the study
were not all the teachers of the 33 schools of Sample C (see Section 4.3.4). The
selection of the participants was something which had to be done by the researcher.
Greek lyceia are governed 'democratically' by their teachers. The role of the director is
simply to keep his or her fellow teachers informed about the decisions of the Ministry.
However, inside this apparently power-free environment, strong interpersonal
relationships are built up that are based on psychological, social and political ties. The
small number of staff in Greek schools - about 20 teachers - makes it very difficult for
any researcher to conduct any other type of research apart from an ethnographic one.
Any quantitative study which uses questionnaires as research tools cannot enter
teachers' interpersonal relationships without a significant danger of 'non-response' or
even worse - false response. This issue will be discussed in greater detail in the next
chapter. The only Factor that has been found to correlate significantly and positively
with students' progress is the 'teacher responsiveness', as reported from the students'
perspective. The components of this Factor have been presented in Table 4.16. The
fixed coefficients of 'teacher responsiveness' are presented in bold in Table 5.33 that
follows.
293
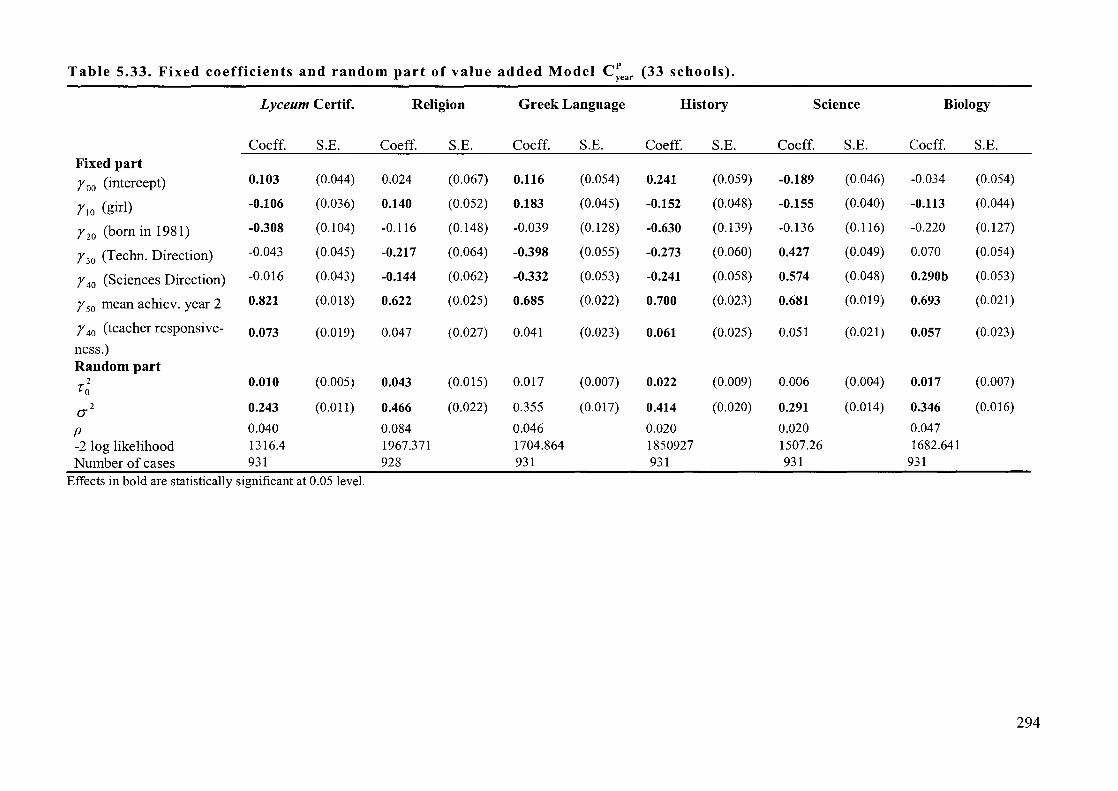
Table 5.33. Fixed coefficients and random part of value added Model C:ear (33 schools).
Lyceum Certif. Religion Greek Language History Science Biology
Coeff. S.E. Coeff. S.E. Coeff. S.E. Coeff. S.E. Coeff. S.E. Coeff. S.E. Fixed part roo (intercept) 0.103 (0.044) 0.024 (0.067) 0.116 (0.054) 0.241 (0.059) -0.189 (0.046) -0.034 (0.054)
rIO (girl) -0.106 (0.036) 0.140 (0.052) 0.183 (0.045) -0.152 (0.048) -0.155 (0.040) -0.113 (0.044)
rzo (born in 1981) -0.308 (0.104) -0.116 (0.148) -0.039 (0.128) -0.630 (0.139) -0.136 (0.116) -0.220 (0.127)
r 30 (Techn. Direction) -0.043 (0.045) -0.217 (0.064) -0.398 (0.055) -0.273 (0.060) 0.427 (0.049) 0.070 (0.054)
r 40 (Sciences Direction) -0.016 (0.043) -0.144 (0.062) -0.332 (0.053) -0.241 (0.058) 0.574 (0.048) 0.290b (0.053)
r 50 mean achiev. year 2 0.821 (0.018) 0.622 (0.025) 0.685 (0.022) 0.700 (0.023) 0.681 (0.019) 0.693 (0.021)
r 40 (teacher responsive- 0.073 (0.019) 0.047 (0.027) 0.041 (0.023) 0.061 (0.025) 0.051 (0.021) 0.057 (0.023) ness.) Random part
z To 0.010 (0.005) 0.043 (0.Q15) 0.Q17 (0.007) 0.022 (0.009) 0.006 (0.004) 0.017 (0.007)
(J"z 0.243 (0.011) 0.466 (0.022) 0.355 (0.017) 0.414 (0.020) 0.291 (0.014) 0.346 (0.016)
P 0.040 0.084 0.046 0.020 0.020 0.047
-2 log likelihood 1316.4 1967.371 1704.864 1850927 1507.26 1682.641
Number of cases 931 928 931 931 931 931
Effects in bold are statistically significant at 0.05 level.
294
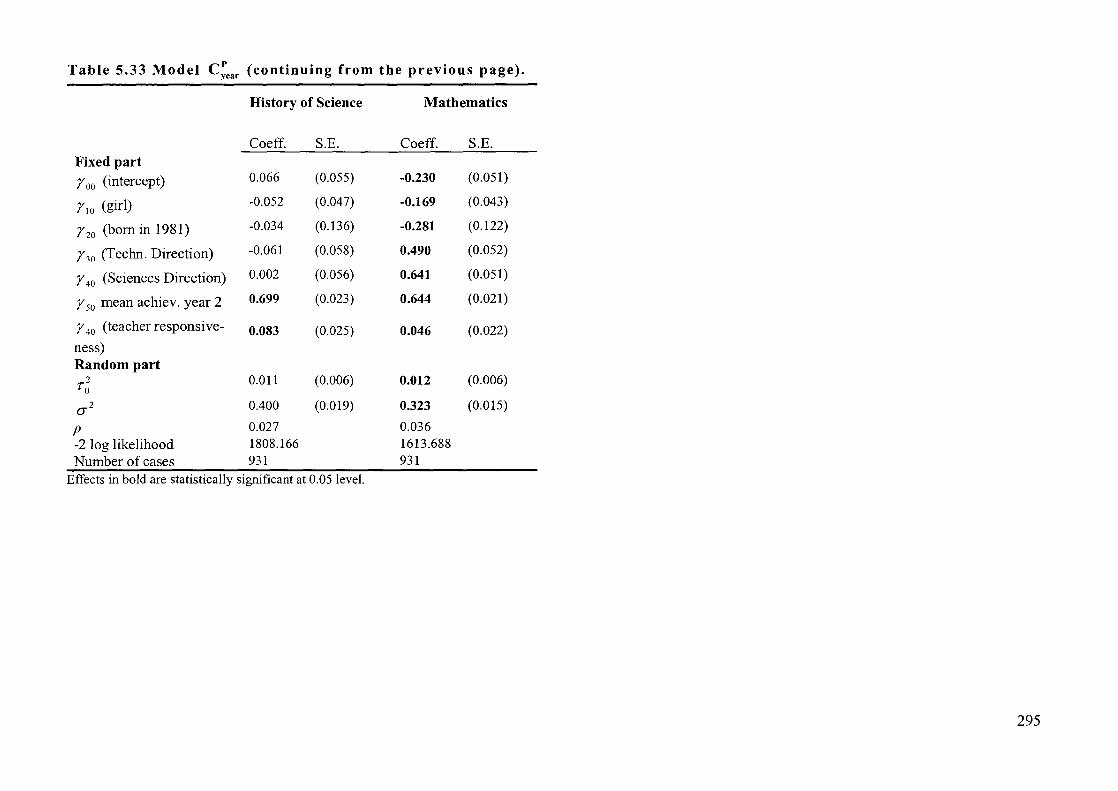
Table 5.33 Model C:ear (continuing from the previous page).
History of Science Mathematics
Coeff. S.B. Coeff. S.E. Fixed part roo (intercept) 0.066 (0.055) -0.230 (0.051)
rIO (girl) -0.052 (0.047) -0.169 (0.043)
r20 (born in 1981) -0.034 (0.136) -0.281 (0.122)
r 30 (Techn. Direction) -0.061 (0.058) 0.490 (0.052)
r 40 (Sciences Direction) 0.002 (0.056) 0.641 (0.051)
r 50 mean achiev. year 2 0.699 (0.023) 0.644 (0.021)
r 40 (teacher responsive- 0.083 (0.025) 0.046 (0.022) ness) Random part r2 0.011 (0.006) 0.012 (0.006)
0
(]"2 0.400 (0.019) 0.323 (0.015)
P 0.027 0.036 -2 log likelihood 1808.166 1613.688
Number of cases 931 931
Effects in bold are statistically significant at 0.05 level.
295
Model C~ear shows the fixed coefficient of the Factor 'teacher responsiveness' as r 40 .
This Factor has been constructed from students' perceptions and is associated with: (a)
the degree to which they found the classes to be interesting, (b) the degree to which
students find teachers to be rewarding, ( c) the friendliness of the teachers, (d) the
frequency with which teachers help students to 'understand', (e) the degree to which
teachers are interested in what their students say in the classroom, (f) the frequency of
the feedback which is being given to students by teachers, (g) lack of teachers
discriminations between students, and (h) the quality of communication between school
and home. In conclusion, this aspect of the study draws attention to the importance of
the classroom, particularly teacher behaviour as influences on students' academic
outcomes. It also suggests that measures of school process derived from students'
reports may be more useful than those derived from teacher-completed instruments.
296
5.6. CONCLUSIONS
The purpose of this chapter was (a) to present a collection of interesting statistics about
the Greek educational system and (b) to investigate if schools make a difference in
Greece, as has been found in a range of research studies in different studies and
contexts. Twelve multilevel models of different degrees of complexity, 34 tables and 3
figures were used for the presentation of the results. The main finding is that schools
make a difference also in Greece and that the school effect is fairly consistent across
different subjects and students with different levels of initial achievement. This finding
is something that Greek researchers and politicians would not found surprising. On the
contrary, it is a rather common belief among Greek parents and students that in some
state lyceia better 'educational work' is being conducted. A list with the 12 multilevel
models that were used in the current study are presented below.
pO: Variance component model for the population
P AB : Personal characteristics and contextual model for the population
pO. Prior achievement model for the popUlation year'
PAB . year'
Personal characteristics, contextual, and pnor achievement model (population)
P AB • Personal characteristics, contextual, and prior achievement model bin'
P year. mv •
B year • nlV •
CO • bin'
C A • bin'
Cp • year'
(population) for success in the certificate of integrated lyceum
Multivariate, personal characteristics, contextual, and prior achievement model (population)
Variance components model for Sample B
Personal characteristics model for Sample B
Multivariate personal characteristics and prior achievement model for Sample B
Variance components model for binary outcomes (satisfaction - dissatisfaction) for Sample C
Personal characteristics model for binary outcomes (satisfaction - dissatisfaction) for Sample C
Processes, personal characteristics and prior achievement model for Sample C
The 26 most important findings of the current study are:
297

1. The typical father for the sample of 39 schools in Attiki (Sample B) is a lower-grade
professional in the services sector. The typical mother stays at home taking care of
the children. Typically, both parents have finished a form of secondary education.
2. Parents in the prefecture of Attiki are on average better educated than those in the
rest of the country.
3. About half the students (48%) of Sample B have access to a computer in their homes
(S.E. 2,8%). This figure is higher than the OECD unweighted percentage of 40%.
4. Essentially, there are no computers in the Greek lyceia, except for administrational
purposes. Thus it is meaningless to refer to the 'computer per student' ratio in Greek
schools.
5. The teachers of Sample D are not satisfied with their salary and their living
standards. However, they find teaching an exciting job and have good relationships
with their colleagues and their school directors.
6. Students feel alienated in the schools. Almost half of the students in Sample C would
change school if they had the chance. The main reasons for changing school are the
condition of the building and the behaviour of some of the teachers. The climate in
most of the schools is competitive: Many students are often rude to each other and
many admit that sometimes they flatter their teachers in order to get higher grades.
7. Students are not satisfied with the information they receive in their schools about
drugs, vocational orientation, life after school and ethic minorities.
8. The distributions of the examination results in the final year of lyceum are highly
skewed. This fact reduces the discriminating power of the tests and damages the
selection function of the national examinations.
9. More girls than boys take the national examinations. This difference is statistically
significant at the 0.05 level. This finding needs to be explored in another study.
10. Differences between boys and girls were found in the three Directions of studies.
Girls prefer the Humanities Direction whereas boys prefer the other two Directions
Sciences and Technology.
11. Girls underachieve in Science and Mathematics but outperform boys in Greek
Language and Greek Orthodox Religion. This finding is consistent with the
outcomes of PISA 2000 study for Greece (see OECD, 2001). Again, more research
is needed regarding this issue.
298
12. The size of the school effect in the present study varies according to the model
which was used. The intra-school correlation coefficient in the 'empty' model pO for
the population of 375 schools in Attiki is around 0.10. This figure is much smaller
than the intra-school correlation coefficient which was found in the 'empty' model
of the PISA 2000 study (0.504). In Models pAB and BA the average intra-school
correlation coefficients are 0.075 and 0.038 respectively. In Model P:'r , the intra
school correlation coefficient varies with students' initial achievement in the second
year of lyceum and is between 0.02 and 0.09. The small school effect can be
explained from the fact that in the current study normalised and not raw scores of
students examination results were used. The discrepancy between the findings of
PISA 2000 and the findings of the current study can also be attributed to: (a) the
different educational level on which these two studies have focused; (b) to the fact
that the tests which were used in the current study were content-specific, whereas
the test of PISA 2000 were not; and (c) the fact that the population of schools in the
current work was more homogeneous than the population ofthe PISA 2000 study.
13. Schools are not differentially effective for students with different initial achievement
levels (with the reservation that the measures or prior achievement used were only
over a one-year period).
14. Schools are generally consistently effective across different academic outcomes.
15. Students who either have repeated one year underachieve in the national
examinations. This finding is consistent with the findings of the PISA 2000 study
(see OECD, 2001).
16. Students who have followed the Sciences Direction have on average significantly
higher achievement in their lyceum certificate. The choice of Direction also provides
a crude indicator of prior achievement also because more able students tend to opt
for the Sciences Direction.
17. Students who studied in large schools have on average significantly higher grades in
their lyceum certificate. Again, this finding is consistent with the findings of the
PISA 2000 study (see OECD, 2001).
18. Students who studied in private schools have on average significantly higher grades
in their lyceum certificate (consistent with the results of the PISA 2000).
299
19. Students with a highly educated mother and a 'functionary' father have on average
better achievement.
20. Almost 80% of the students attend a frontisterion and 30% receive private tutoring
at home. Eighteen percent of the students attend both forms of parallel education.
Only 9.8% of the students have no experience of the Greek 'shadow education'
system of parapaedeia.
21. Participation in the 'shadow education' system (jrontisterio and idiaitero) is
associated with mother holding a university degree and father being a professional
(leitourgos) .
22. The jrontisterion is an important factor in educational achievement in Greece,
especially in Science and Mathematics. If we combine this fact with the skewed
distributions of the raw examination results, we can conclude that access to
frontisterion can essentially determine to a large degree a student's educational and
occupational future. This is a very important finding because it demonstrates a kind
of educational inequality which is little evident in other developed countries.
23. Having access to a computer at home is something that correlates positively and
significantly with (a) father being a professional, (b) mother holding a university
degree and (c) educational achievement.
24. The study shows that teacher responsiveness - as measured by student perceptions -
has a positive impact on school achievement in all subjects. This is an important
finding which suggests that aspects of teacher quality may be generic rather than
subject-specific in the context of the Greek lyceum.
25. Roughly, the same variables which 'explain' students' achievement 'explain' also
success and failure in obtaining a lyceum certificate (a categorical variable).
26. Bayesian estimates for the mean student achievement in the lyceum certificate with
comparative confidence intervals at a given level of statistical significance can be
used for visually examining the differences in school outcomes.
300
DISCUSSION: EVALUATING ED,UCATIONAL WORK IN GREEK LYCEIA USING SETS: OF INDICATORS
"The requirement to publish examination results inevitably involves the risk of institutional damage. However, if such data are not made available it is possible that schools will not be aware of their current performance in relation to other schools, and therefore there will be less pressure for improvement of current practices. ( ... ) We conclude that the determining factor should be the right or parents to have the most useful information".
Goldstein & Myers (1996) Freedom of information: towards a code of ethics in performance indicators. Research Intelligence, 57, p. 3.
301

6.1. FOUR QUESTIONS ABOUT THE FUTURE OF EDUCATIONAL EVALUATION IN GREECE
In the preVIOUS chapter, the current researcher attempted to answer four research
questions which dealt with the particularities of school effectiveness research in Greece,
as well as the size and structure of the' lyceum effect'. In the first chapter of the current
study, these four research questions were associated with two theoretical issues: (a) the
construction of a model of lyceum effectiveness model and (b) the case of educational
evaluation and school based review in Greece. This thesis is not about educational
policy but about educational effectiveness and evaluation. However, the lack of a given
political and administrative framework for educational evaluation in Greece would
made any relevant educational discussion unstable. Thus, before attempting to discuss
the two theoretical issues that were mentioned above, it would be worth putting forward
a number of questions about the future of educational evaluation in Greece. Thus, the
different answers to the four questions that are presented below could represent an equal
number of possible policy scenarios. The four questions are:
1. Will the myth of' educational work' ever be dispelled?
2. Will a 'curriculum for self-evaluation ever been written?
3. Will there be a new law for educational evaluation?
4. What will be the role of the media, and especially the quality newspapers III
educational evaluation?
The answers to these questions will be given below.
6.1.1. WILL THE MYTH OF 'EDUCATIONAL WORK' EVER BE DISPELLED?
The first question deals with the future of 'educational work', a term which according to
the current author is a well-preserved myth among teachers. As it was described in
Section 2.4.4, Greek teachers have proposed a model for school self-evaluation based
on staff meetings. In the early 1980s teachers reacted against their evaluation and
proposed instead the evaluation of their 'educational work'. Since then, teachers'
proposals have roughly remained the same and can be found in their own official
302
publications (see, for example, OLME's bulletins in 1995, 1997, and 1998). In brief,
teachers propose two evaluation meetings, the first at the beginning of the school year
and the second at the end of the school year. In the first meeting teachers are supposed
to design their 'educational work'. In the second meeting teachers will evaluate the
degree to which their targets - set in the first meeting - have been achieved. School
consultants and a number of educational administrators are supposed to be kept
informed about the minutes of the meetings but without having any right to interfere in
the actual procedure of evaluation. In teachers' proposals, the targets, the methods and
the context of evaluation are not prescribed by educational administrators in the upper
levels but are left to be 'democratically' decided by the teachers of each school
separately.
The current researcher has strong reservations about teachers' proposal because, in his
opinion, such an evaluation could never be implemented in Greek schools. If this kind
of evaluation were feasible, the teachers themselves would have piloted it in the last
twenty years. This however has never been the case. In the current researcher's opinion,
evaluation is not so simple a task that it could be discussed in just two staff meetings.
Evaluation presupposes training, experience and a minimum degree of knowledge of
literature and other people's work. Moreover, educational evaluation presupposes clear
- though not necessarily incontestable - ideas of what is worth fighting for in our
schools. As was mentioned in Section 2.1, the Greek educational system is extremely
politicised and usually every governmental shift means a change in the educational
administrators at prefectural municipal, and school (neighbourhood) level. Thus, most
probably, the evaluating discussions of the teachers will in fact become political debates
over the scope and the role of education in modem societies.
A second serious disadvantage in teachers' proposals is the lack of the' accountability'
aspect. One of the purposes of educational evaluation is to inform the people outside the
teaching and learning transaction about the quality of the system in which this
transaction takes place. Of course, evaluation can be 'formative', aiming at the
improvement of educational processes, and of course in many cases the results of
evaluations are for internal information and action and not for dissemination. However,
every evaluation has a summative part, however small this part may be. In current
researcher's opinion, the 'self-evaluation of educational work' proposed by Greek
teachers has never been anything more than a successful myth of Greek trade unionism.
Like Homer's Odyssey, the myth about the 'self-evaluation of educational work' is
303
being related again and again in teachers' unions and its variants are also published
from time to time in educational journals and newspapers. However, there are signs that
teachers do not believe in this myth anymore. The conclusion of current researcher's
personal communication with teachers who are very high up in the hierarchy of the two
teachers unions (OLME and DOE) is that in all probability the myth of educational
work will finally be dispelled.
6.1.2. WILL A 'CURRICULUM FOR SELF-EVALUATION' EVER BE WRITTEN?
A very interesting case of failure as regards the issue of educational evaluation in
Greece is the proposal of the Greek Pedagogical Institute (PI). The model of the Greek
PI was based on the tradition of educational action-research of the 1980s. According to
this tradition, teachers can act as researchers in their own schools (for a review of these
views, see Bollen & Hopkins, 1987; Hopkins, 1987 and 1988). The basic idea behind
the model of PI was that the teachers of each school would be provided with written
guidelines and special supportive material in order to be able to evaluate their schools.
For this purpose, the Pedagogical Institute published in 1999 the book Internal
Evaluation and Planning of Educational Work (in Greek), prompting teachers to see it
as a 'curriculum for self-evaluation' (p. 90). What was included in this volume was a
rough description of qualitative and quantitative research techniques for data collection
and analysis that were supposed to be taken up by the teachers in each school
separately. The information that would be gathered by means of questionnaires,
interviews, observation, and even photographs, would help teachers to improve their
schools, reorganise their pedagogy and even enhance their interpersonal relations. The
proposal of the Greek Pedagogical Institute failed and was finally abandoned by its own
designers. The failure was important because the people who worked on this proposal
were teachers on secondment at the Greek Pedagogical Institute who tried to distance
themselves from the myth that was presented in the previous section.
There are various reasons behind the failure of the Greek Pedagogical Institute's
proposal. An internal account of these reasons was given by Bofilatos (2000), who had
participated in the PI's project. The author concluded that the reasons for the failure
were of two kinds: political and circumstantial. From a political point of view, Bofilatos
argued that the Greek Ministry of Education turned down the work that was
painstakingly conducted in the Pedagogical Institute by issuing a number of circulars
304

which prescribed educational evaluation. From a 'circumstantia1' point of VIew,
Bofilatos claimed that the take-overs of the schools by their students between November
1998 and January 1999 made the teachers of four of the five participating pilot schools
to withdrawn from the project.
Bofi1atos' (2000) views can be understood and they are justifiable to a degree.
However, the current researcher believes that there were more serious reasons for the
failure of Institute's programme. First, there seems to have been no adequate
communication between the Department of Evaluation of the Pedagogical Institute and
the Ministry of Education although the former is an advisory body to the latter.
Secondly, five participating schools is a very small number for an externally funded
study. This unfortunate fact must be seen in relation to the lack of an alternative plan in
case that something went wrong. What 'went wrong' was the students' take over of
their schools. With four out of the five participating schools withdrawn from the
Institute's programme, the programme was bound to fail. A third reason for the failure
of the programme was that the guidelines that were given to teachers were ambiguous.
In the phase of data collection the Internal Evaluation and Planning of Educational
Work (Pedagogical Institute, 1999) adopted a constructivistic view either by allowing
teachers to decide what information they should collect or by presenting large lists of
effectiveness-enhancing variables but without presenting a theory that would join the
pieces of the puzzle. Current researcher believes that there should be a clearer theory
and a much more thorough review of other research findings in the PI's guidelines
(1999).
Another reason for failure was the motivation of the teachers who worked on the
programme. Unlike other evaluation programmes that kept on running, despite severe
shortages of funds - like the A-Level Information System in the United Kingdom - the
funds that were coming from the European Union seemed to be a crucial factor for
teachers' participation in the programme of the Greek Pedagogical Institute.
Characteristically, when technical papers for funding were not approved by the auditors
of the Operational Educational and Initial Vocational Training Programme (see Section
2.3), the participants and some of the persons in the support team of the Pedagogical
Institute withdrew. As Bofilatos (2000) admits:
The delay in the approval of the technical papers for the second year of the programme's implementation as well as the delay in the approval of the technical papers for the third year gave to the
305

steering committee, the support team and the teachers in the schools a feeling of insecurity and, in some cases, a feeling of defeat (Bofilatos, 2000: 173, current author's translation).
In conclusion, the proposal of the Greek Pedagogical Institute was an ambitious plan for
school self-evaluation and review by means of action research. The plan was designed
to help schools to evaluate themselves by providing self-evaluation survival kits.
However, according to Hopkins & Lagerweij (1996), the empirical support for the
utility of the school based review with the form of 'action research' was criticised even
in the 1980s of being 'ambivalent'. The people that worked in the Evaluation
Department of the Greek Pedagogical Institute could have succeeded in their work if (a)
they had not been so attached to a relativistic 'bottom-up' approach, (b) had prepared a
consistency plan in order to deal with students' reactions that traditionally become
evident every November, (c) had been less dependent on teachers' circumstantial
attitudes, (d) had had a theory, or at least a more concrete idea about the factors that
have an impact on the quality of education, and (e) had a grasp of the multilevel
character of educational data. Thus, concerning the question of the current section i.e.
whether a curriculum for school self-evaluation will ever be written in Greece, the
answer must be negative. The proposal of the Greek Pedagogical Institute failed and
there is no reason to believe that a second chance will be given by the government.
6.1.3. WILL THERE BE A NEW LAW FOR EDUCATIONAL EVALUATION IN GREECE?
Over the last three years, the Greek Ministry of Education has repeatedly attempted to
introduce educational evaluation. For example, the 8th article of Education Law 2525
introduced the Soma Monimon Axi%giton, (Body of Permanent Evaluators) for
education. These evaluators would be responsible for evaluating schools using
questionnaires, interviews and regular visits. This Body, however, was never
established. Another attempt at evaluation was the Ministry's Circular f2/479l of 1998,
according to which Greek teachers should be appraised by their school director, the
deputy director and a special evaluation committee in their school. According to
Circular f2/4791, teachers were to be assessed in two fields: (a) the degree of their
pedagogical competence and (b) the quality of their personal contribution to the work
that is being conducted at school. So far, no such reports have been written.
306
The new education Minister, Mr. Petros (Peter) Efthimiou, has been designing new
procedures for educational evaluation. In a draft of bill named 'organisation of primary
and secondary local educational authorities, in-service training and appraisal of
teachers, evaluation of educational work, and other provisions' the Minister describes
the new procedures for educational evaluation. According to the fourth article of the
draft bill, the evaluation of schools is jointly assigned to the Pedagogical Institute and
the Centre for Educational Research. The fifth article of the draft outlines new
procedures for teachers' appraisal. According to these procedures, it is planned that
teachers should be appraised on a voluntarily basis by means of self-written reports.
Non-voluntary evaluations will be carried out in cases where teachers are applying for
administrative posts within the system. Obligatory evaluation applies also in cases
where teachers already hold such administrative posts (for example, school consultants
or school directors). In these cases, personnel evaluation will take a pyramid-like form
in which the upper administrative levels evaluate the lower administrative levels by
means of reports.
One characteristic that differentiates the policy of the Greek Ministry of Education from
the proposals of teachers and the proposals of the Pedagogical Institute is the Ministry's
interest in the appraisal of education personnel rather than the evaluation of' educational
work'. The interest of the Ministry is not unjustifiable. According to Webster (1995),
school evaluation programmes must be co-ordinated with teacher appraisal. From this
point of view, the model of the Greek Pedagogical Institute and the model of the Greek
Ministry of Education are different as regards teacher appraisal. The Greek Ministry of
Education sees teacher appraisal in a way similar to Scriven's (1995) 'inspector model'.
What, however, will be the future of these new procedures for evaluation if the draft
finally becomes law? The answer to this question is not easy. The new bill will be
discussed in February of 2001. Many things will depend on the final form of the law,
the quality of work in the Greek Pedagogical Institute and the Centre for Educational
Research, as well as teachers' reactions.
6.1.4. WHAT WILL BE THE ROLE OF THE GREEK QUALITY NEWSPAPERS?
In some countries, and especially in the United Kingdom and France, quality
newspapers systematically publish the results of public examinations in order to inform
parents about differences between schools. The information that is published in four
307
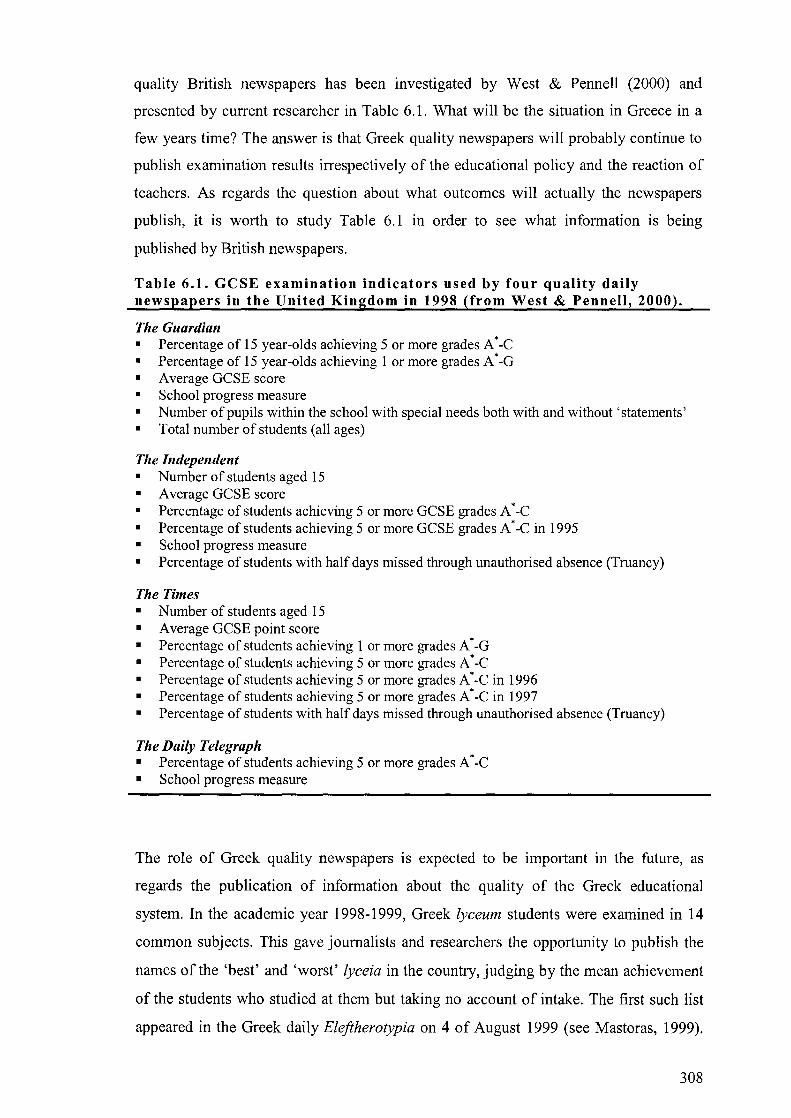
quality British newspapers has been investigated by West & Pennell (2000) and
presented by current researcher in Table 6.1. What will be the situation in Greece in a
few years time? The answer is that Greek quality newspapers will probably continue to
publish examination results irrespectively of the educational policy and the reaction of
teachers. As regards the question about what outcomes will actually the newspapers
publish, it is worth to study Table 6.1 in order to see what information is being
published by British newspapers.
Table 6.1. GCSE examination indicators used by four quality daily newspapers in the United Kingdom in 1998 (from West & Pennell, 2000).
The Guardian • Percentage of 15 year-olds achieving 5 or more grades A *-C • Percentage of 15 year-aIds achieving 1 or more grades A*-G • Average GCSE score • School progress measure • Number of pupils within the school with special needs both with and without 'statements' • Total number of students (all ages)
The Independent • Number of students aged 15 • Average GCSE score • Percentage of students achieving 5 or more GCSE grades A *-C • Percentage of students achieving 5 or more GCSE grades A * -C in 1995 • School progress measure • Percentage of students with half days missed through unauthorised absence (Truancy)
The Times • Number of students aged 15 • Average GCSE point score • Percentage of students achieving 1 or more grades A *-G • Percentage of students achieving 5 or more grades A *-C • Percentage of students achieving 5 or more grades A * -C in 1996 • Percentage of students achieving 5 or more grades A * -C in 1997 • Percentage of students with half days missed through unauthorised absence (Truancy)
The Daily Telegraph • Percentage of students achieving 5 or more grades A *-C • School progress measure
The role of Greek quality newspapers is expected to be important in the future, as
regards the publication of information about the quality of the Greek educational
system. In the academic year 1998-1999, Greek lyceum students were examined in 14
common SUbjects. This gave journalists and researchers the opportunity to publish the
names of the 'best' and 'worst' lyceia in the country, jUdging by the mean achievement
of the students who studied at them but taking no account of intake. The first such list
appeared in the Greek daily Eleftherotypia on 4 of August 1999 (see Mastoras, 1999).
308

Currently, George Panaretos, a professor at the University of Economics in Athens,
gave the newspapers details about the 40 most 'effective' and the 40 most 'ineffective'
integrated lyceia in Greece. Panaretos' analysis was in every national newspaper on 25
of July 2001. One conservative newspaper, Apogevmatini, made Panaretos' findings its
main headline on the front page. The reporter's comment on the difference between
private and public schools was that this difference 'proves the failure of the new system'
- meaning 'the failure of the socialist government in the field of education'.
The criteria of effectiveness in Panaretos' study were the percentages of students'
achievement within four different intervals: (a) a grade lower than 15, (b) a grade from
15 to 19, (d) a grade higher than 19, and (c) failure in obtaining a certificate of the
integrated lyceum. The characteristics that were studied by Panaretos and his colleagues
at the University of Economics were exclusively at school level. Neither student
background variables nor school compositional characteristics were taken into account.
It was found that the 'best' schools were the large and private ones. It is worth noting
however, that just a few days before the day on which Panaretos' analysis was
published in all the national newspapers, the current author published a small part of his
multivariate multilevel results. Thus on 11 of July 2001 the Greek quality newspaper To
Virna, published the first 'value added' examination results in Greece (see Triga, 2001).
In addition to the publication of examination results, Greek newspapers are expected to
playa significant role in formulating people's opinions about the quality of education
offered in Greece. For example, good private Greek lyceia, like 'Ekpaideftiria Douka'
and 'Scholes MoraYti' have published advertisements which inform their prospective
'clients' that a high percentage of their students have been accepted in prestigious
universities. The closer this percentage is to 100%, the better a school is esteemed. This
however was not the normal practice two years ago. Other educational characteristics of
good private lyceia, things, for example, that have to do with students' values and
attitudes are ignored. The possibility that strong sociological or compositional factors
have affected the percentage of students' success is never considered. In conclusion,
Greek quality newspapers have already begun to playa very significant role in shaping
people's opinion about schools and education in general. This phenomenon will most
probably intensify in the future.
309
6.2. A MODEL FOR THE EFFECTIVENESS OF THE GREEK INTEGRATED LYCEUM
At first sight, the construction of a model of lyceum effectiveness seems simple. As has
become evident from Chapter 5, Greek lyceia seem to make a difference regarding their
effectiveness. Thus, a list with the most promising effectiveness-enhancing conditions
identified in the previous chapter could be constructed. The contents of this list could
then be easily transformed into an integrated model of lyceum effectiveness, in which
the correlates of students' outcomes would be connected with arrows and lines in an
impressive conceptual map. However, how useful the construction of yet another school
effectiveness model in the literature would be? The answer is 'not very useful', unless
this model contained a number of characteristics not found in other studies. Figure 6.1
attempts a systemic approach to the Greek educational system. What makes this
approach different is the existence of the 'shadow education' (parapaedeia) box below
the formal educational system.
As argued in subsection 2.1.3, parapaedeia can be viewed as the 'guilty secret' of the
Greek educational system. In the current researcher's opinion, Greek parapaedeia
represents a network of vested interests that is supposed to compensate for the
inefficiencies of the normal schools but, in practice, it only increases the likelihood that
students with disadvantaged backgrounds will 'fail' in terms of their chances of
continuing in higher education. Over the years, the parasite of parapaedeia has created
its own mechanisms and strategies for survival. The statistical analysis of the current
work (see Section 5.1.7) revealed that 78.5% of the students attend frontisterion
whereas 21.5% of students are taking idiaitera (private lessons at home). Official data
for the cost of frontisteria and idiaitera do not exist, both because there are no
mechanisms for the collection of such data and also because frontisteria and private
lessons are not always legal. However, some unofficial courses, like those for
journalists and certain political parties, estimate the fees for frontisteria to total around
34,0425,532 Euro per annum. To this amount one must add another 500,366,838 Euro
for frontisteria in foreign languages. Finally, according to the same unofficial sources,
the annual cost ofidiaitera totals 731,914,838 Euro (Lakasas, 2001a).
310
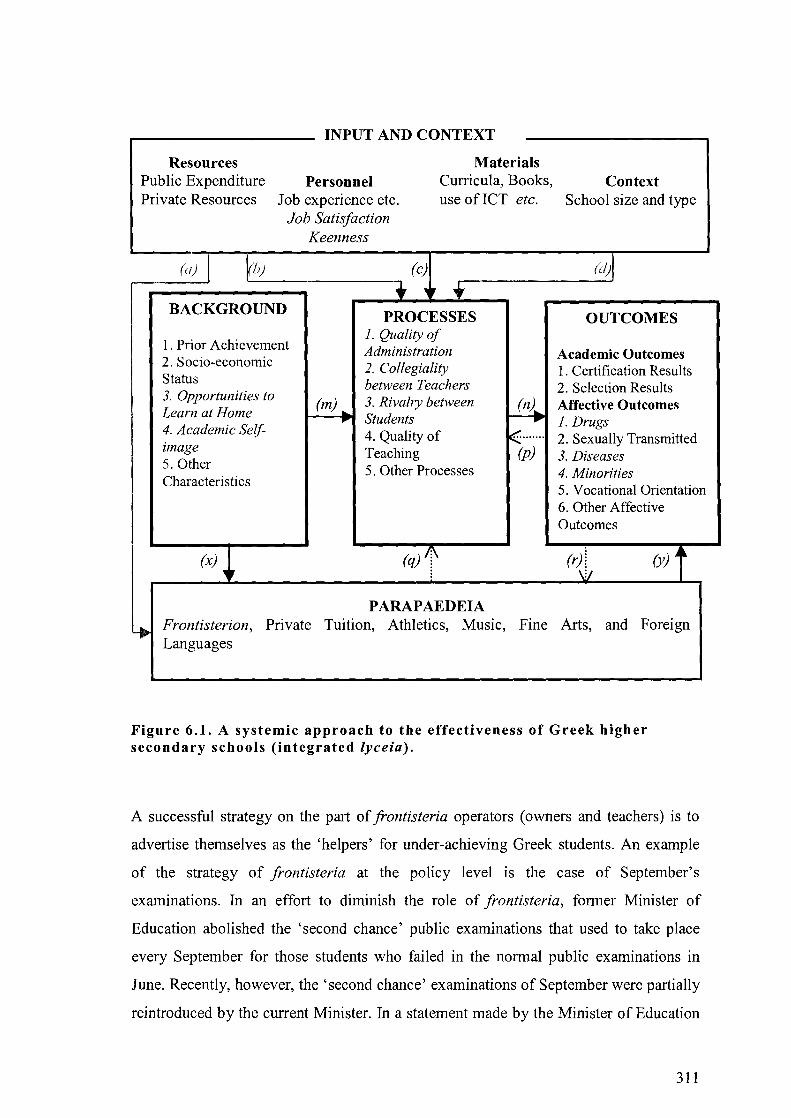
INPUT AND CONTEXT
Personnel Resources
Public Expenditure Private Resources Job experience etc.
Materials Curricula, Books, use of ICT etc.
(a) I BACKGROUND
Job Satisfaction Keenness
1. Prior Achievement
PROCESSES 1. Quality of Administration
2. Socio-economic Status 3. Opportunities to Learn at Home 4. Academic Selfimage 5. Other Characteristics
(x) ."
(m) ... ...
2. Collegiality between Teachers 3. Rivalry between Students 4. Quality of Teaching 5. Other Processes
(q)~
PARAPAEDEIA
Context School size and type
OUTCOMES
Academic Outcomes 1. Certification Results 2. Selection Results Affective Outcomes 1. Drugs 2. Sexually Transmitted 3. Diseases 4. Minorities 5. Vocational Orientation 6. Other Affective Outcomes
(r/ V
(y) J~
LJt. Frontisterion, Private Tuition, Athletics, Music, Fine Arts, and Foreign Languages
Figure 6.1. A systemic approach to the effectiveness of Greek higher secondary schools (integrated /yceia).
A successful strategy on the part of frontisteria operators (owners and teachers) is to
advertise themselves as the 'helpers' for under-achieving Greek students. An example
of the strategy of frontisteria at the policy level is the case of September's
examinations. In an effort to diminish the role of frontisteria, former Minister of
Education abolished the 'second chance' public examinations that used to take place
every September for those students who failed in the normal public examinations in
June. Recently, however, the 'second chance' examinations of September were partially
reintroduced by the current Minister. In a statement made by the Minister of Education
311

on 31 st of July 2001, September examinations came back because, as the Minister
explained: 'for both educational and social reasons, an educational system should avoid
at all costs the exclusion of students and support their attainment'. However, given the
fact that Greek schools close from June to September,frontisteria are the only source of
teaching during the summer. Thus, some Greek students are expected to learn in
frontisteria what they should have learned in their school during the whole school year.
Butfrontisteria are profit-making organisations. The knowledge that they offer to Greek
students is linearly dependent on families' income. In that sense, Greek frontisteria
produce the worst type of educational inequality ever: a 'hidden' but nevertheless
'necessary' inequality that is officially fuelled. Upon this, Professor Michael
Kassotakis, one of the main designers of the latest educational reform in Greece, wrote
in Sunday's Kathimerini (1 i h of July 2001) that:
The appeal to educational and social reasons occurred in order to cover up the practical reasons which they imposed, the deference to pressures from different groups and the satisfaction of sectional claims (Kassotakis, 2001: 17).
The situation that was described in the previous paragraph has to change if Greece is
ever to improve the quality of its educational system. If a 'second chance' is to be given
to those secondary school students whose level of achievement in June is low, policy
makers have to make sure that this 'chance' is being offered by the schools themselves
and not by frontisteria. A 'second chance' that depends on the family's income is not a
chance at all. In current author's opinion, such a policy deeply insults the image of the
Greek educational system in the eyes of teachers, students and parents. After all, Greek
people pay their taxes in order to enjoy an effective and just educational system. In the
current study, some elementary statistical models showed that attendance at jrontisteria
raises the chances of success, especially in subjects where procedural and not
declarative knowledge is being pursued (such as Mathematics and Science). Future
research has to open the 'black box' of parapaedeia in Greece whereas future
educational policy has to eliminate the parasite of parapaedeia forever.
The left-hand box in the model of Figure 6.1 contains a list with students' background
characteristics. These characteristics can be found in the international literature to have
a very important effect on the school outcomes irrespective of the processes in the
school or the classroom. In the current study, the strong effect of a family's socio
economic status and previous achievement over a one year period was confirmed. The
312

outcomes in the right-hand box of Figure 6.1 are of two kinds: academic and social. The
formers include two types of examination results: results for certification and results for
selection. Only the certification results were available in the current study (whether a
student succeeded in obtaining his or her certificate of integrated lyceum). The selection
function of the examinations was not accessible because the special weights by which
students' scores are multiplied were unknown (see page 63 of the current thesis). As
regards affective outcomes, they were students' self-reported level of satisfaction on
four distinct areas: drugs, sexually transmitted diseases, vocational orientation and
minorities.
The processes that were studied in the present work (see middle box of Figure 6.1) were
only at school-organisational level as the concern of the thesis was not the investigation
ofthe teaching and learning transaction. In the history of School Effectiveness the study
of variables at school level has preceded the study of variables at lower levels (e.g. at
instruction- or teacher-level). Thus the current work can be seen as the basis on which
other school effectiveness studies will emerge in Greece and which will take into
consideration variables at classroom or teacher level. The possible associations between
classroom-level effectiveness-enhancing conditions and school-level effectiveness
enhancing conditions have been presented in Section 3.5.1. The fact that 'quality of
instruction' was found to correlate significantly with academic outcomes is an important
indicator that more work needs to be done in this field. It is interesting that students'
perceptions of quality of instruction show a strong relationship across all different
subjects even after other factors are controlled in the models. This suggests that factors
taps significant aspects of teaching which may be seen as generic rather than subject
specific.
In order to construct a model of effectiveness for the Greek integrated lyceum, the
author used the systemic approach as presented in Figure 6.1. A model that is
commensurate with a systemic approach of school effectiveness is the Integrated Model
of School Effectiveness, proposed by Scheerens in 1990 (see Figure 3.4). The model of
Scheerens (1990) could be reconfigured to include a number of Greek specific factors of
educational effectiveness. Thus, a model for the effectiveness of the Greek integrated
lyceum could appear as in the model in Figure 6.2.
313
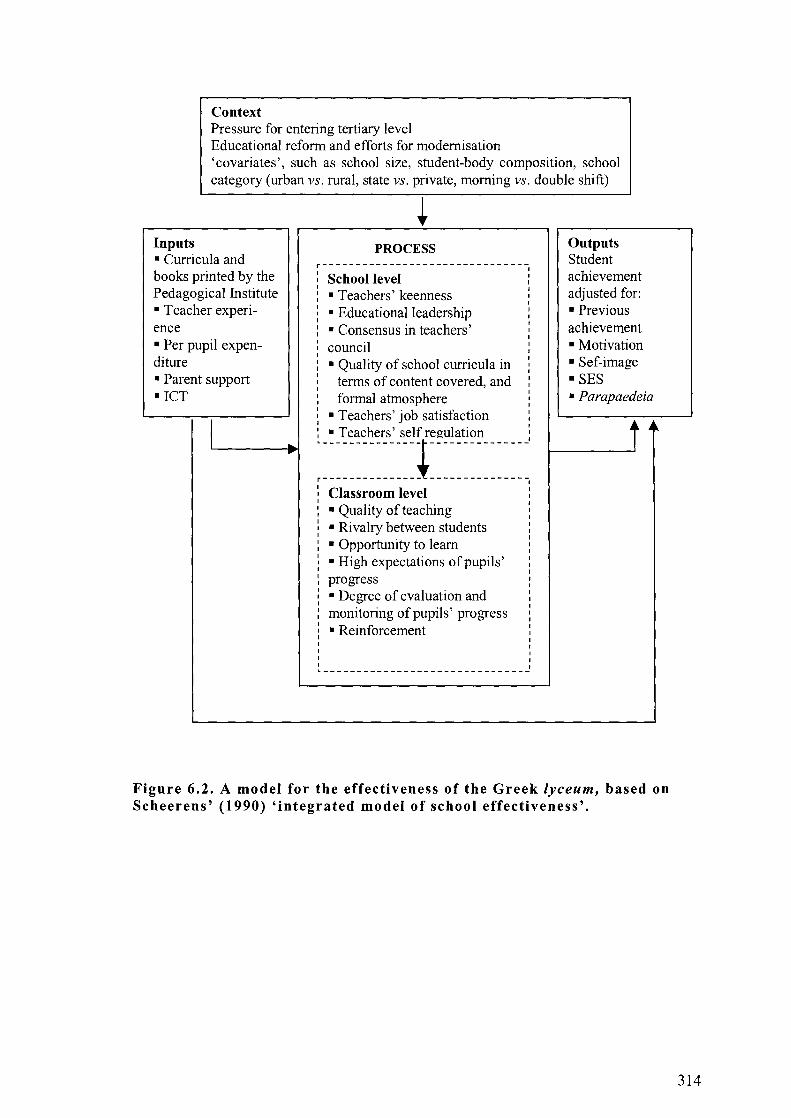
Context Pressure for entering tertiary level Educational reform and efforts for modernisation 'covariates', such as school size, student-body composition, school category (urban vs. rural, state vs. private, morning vs. double shift)
Inputs PROCESS Outputs • Curricula and r------------------------------ Student books printed by the School level achievement Pedagogical Institute • Teachers' keenness adjusted for: • Teacher experi- • Educational leadership • Previous ence • Consensus in teachers' achievement • Per pupil expen- council • Motivation diture • Quality of school curricula in • Sef-image • Parent support I terms of content covered, and • SES
I
·rCT I formal atmosphere • Parapaedeia I I
• Teachers' job satisfaction I
I I t ~~ I • Teachers' self regulation I .. :::::::::::::::~::::::::::::::-
Classroom level • Quality of teaching • Rivalry between students • Opportunity to learn • High expectations of pupils' progress • Degree of evaluation and monitoring of pupils' progress • Reinforcement
------------------------------
Figure 6.2. A model for the effectiveness of the Greek lyceum, based on Scheerens' (1990) 'integrated model of school effectiveness'.
314
6.3. QUALITY INDICATORS IN EDUCATION
6.3.1. THE COMPLEXITY OF EDUCATIONAL SYSTEMS
Figure 6.1 presented a simple model of the Greek educational system. However,
educational systems are extremely complex or, from a mathematical point of view,
'chaotic'. Chaotic systems, like the weather or the earthquakes, are not linear or
predictable. This not only because the number of the governing variables in such
systems is enormous but also because the behaviour of these systems is sensitive even
to the smaller change in the initial conditions. As Davies (1987) writes in his famous
book The Cosmic Blueprint, 'a minor disturbance [in chaotic systems] such as the
flapping of a butterfly's wings could cause a major disturbance in the weather such as a
hurricane' (p. 52). Perhaps, complexity explains why meteorologist have difficulties in
making long-term weather forecasts and why policy makers find it hard to make long
term plans for educational change.
The complexity of a school system as regards its effectiveness has been partially
presented in the current work in Sections 3.5.1, 3.6.2, and 3.6.3. In Section 3.5.1 a
number of 'alternative' models demonstrated how complex the relations between
school-, classroom- and student-level effectiveness correlates could be. Sections 3.6.2
and 3.6.3 dealt with the complexities in the consistency and stability of the school
effect. In order to discuss the implications that chaos theory has for education, Fitz
Gibbon refers to the book Complexity: the Emerging Science on the Edge of Order and
Chaos (Waldrop, 1992) and makes analogies between chaotic systems and the
educational system. Fitz-Gibbon (1996) lists the following four characteristics of
complex organisations:
• unpredictability - the impossibility of prediction under some circumstances;
• feedback - the flow of information and consequences from the environment in
which a complex organism is surviving;
•
•
local organisation as opposed to central control;
emergence - the spontaneous development of diverse and effective organisations in
conditions which border on chaos. (Waldrop, 1992; cited in Fitz-Gibbon, 1996: 38).
315
The first of the above-presented points implies that educational systems are
unpredictable. In the New Meaning of Educational Change, Fullan (1991) presents five
reasons for this unpredictability: (a) the existence ofmuItiple and sometimes competing
goals, (b) the distribution or power, (c) the process for arriving at solutions that satisfy a
number of constituencies, (d) the influence of the society and (e) the variety of
situationally appropriate ways of teaching. According to Fullan (op. cit.), wishing for,
waiting for, and urging the educational system to become more rational is in itself
irrational.
In conclusion, linear planning cycles in education like 'set priorities, set targets, plan,
implement, and evaluate' do not always work. Fullan's (1991) arguments have been
illustrated in the Greek context. In the second chapter of the current work the reasons
why the Greek educational system is said to be under the ancient curse of Sisyphus were
described. At that point, it was argued that the history of the modernisation of the
system has been a history of consecutive small-scale catastrophes. As regards
'feedback', the second of the points that were presented in the previous paragraph, Fitz
Gibbon notes that if feedback strongly affects the development of complex
organisations, then the nature of that feedback must be of utmost concern.
6.3.2. THE MEANING OF INDICATORS IN EDUCATION
The model for the effectiveness of the Greek integrated lyceum in Figure 6.2 is based on
a systemic approach to the Greek school system that was presented in Figure 6.1. The
contents of the boxes both in Figure 6.1 and Figure 6.2 are entities that from a statistical
point of view are called 'variables', 'correlates', or 'factors'. These variables can be
found in the statistical literature together with defining epithets like 'dependent',
'independent', 'explanatory', 'latent' and so on. From a theoretical point of view,
however, the variables in the boxes of Figure 6.1 and Figure 6.2 may also be called
'indicators'. Thus, educational indicators are 'individual or composite statistics that
relate to basic constructs in education and are useful in a policy context', (Shavelson et
al., 1989: 5). From the definition of Shavelson et al. (1989), it is evident that not every
educational statistic can be classified as indicator. Indeed, as Nuttal (1992) points out:
To be an indicator, an education statistic must also have a reference point against which it can be judged. Usually the reference point is some socially agreed-upon standard (e.g., a minimum reading age to indicate basic literacy), a past value (e.g., the 1970 level of
316
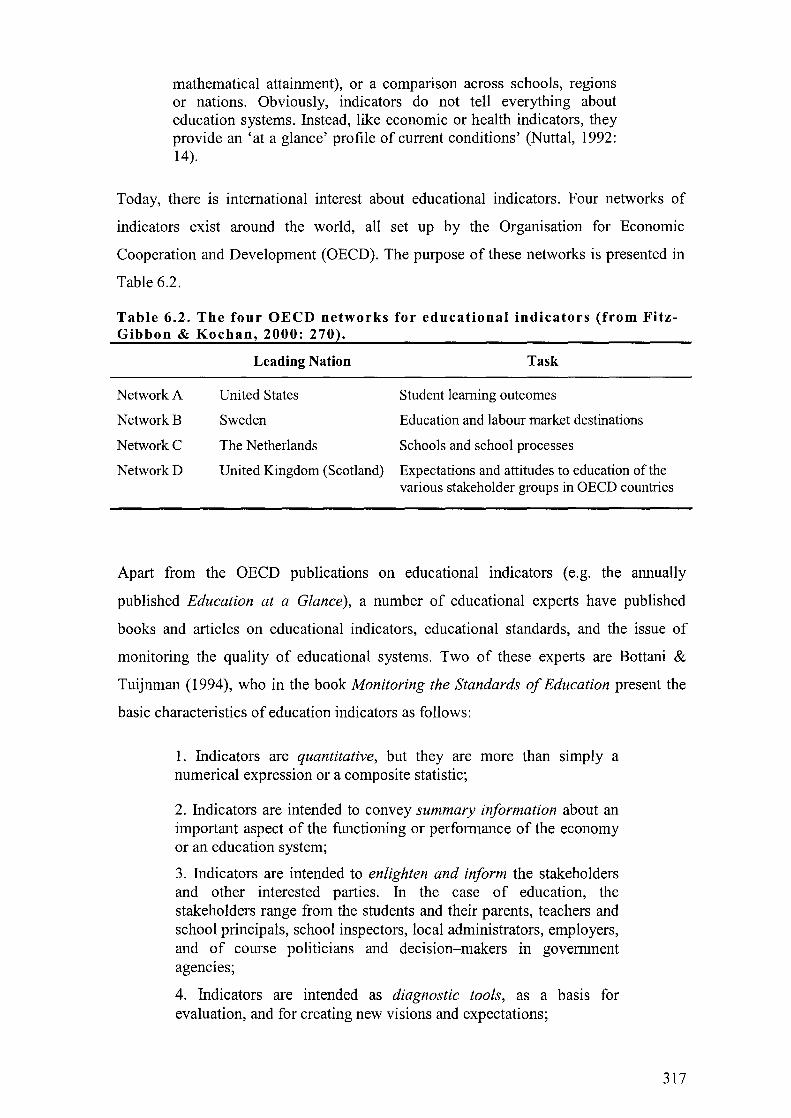
mathematical attainment), or a comparison across schools, regions or nations. Obviously, indicators do not tell everything about education systems. Instead, like economic or health indicators, they provide an 'at a glance' profile of current conditions' (Nuttal, 1992: 14).
Today, there is international interest about educational indicators. Four networks of
indicators exist around the world, all set up by the Organisation for Economic
Cooperation and Development (OECD). The purpose of these networks is presented in
Table 6.2.
Table 6.2. The four OECD networks for educational indicators (from FitzGibbon & Kochan, 2000: 270).
Leading Nation Task
United States Student learning outcomes
Sweden Education and labour market destinations
The Netherlands Schools and school processes
Network A
Network B
NetworkC
NetworkD United Kingdom (Scotland) Expectations and attitudes to education of the various stakeholder groups in OECD countries
Apart from the OECD publications on educational indicators (e.g. the annually
published Education at a Glance), a number of educational experts have published
books and articles on educational indicators, educational standards, and the issue of
monitoring the quality of educational systems. Two of these experts are Bottani &
Tuijnman (1994), who in the book Monitoring the Standards of Education present the
basic characteristics of education indicators as follows:
1. Indicators are quantitative, but they are more than simply a numerical expression or a composite statistic;
2. Indicators are intended to convey summary information about an important aspect of the functioning or performance of the economy or an education system;
3. Indicators are intended to enlighten and inform the stakeholders and other interested parties. In the case of education, the stakeholders range from the students and their parents, teachers and school principals, school inspectors, local administrators, employers, and of course politicians and decision-makers III government agencIes;
4. Indicators are intended as diagnostic tools, as a basis for evaluation, and for creating new visions and expectations;
317
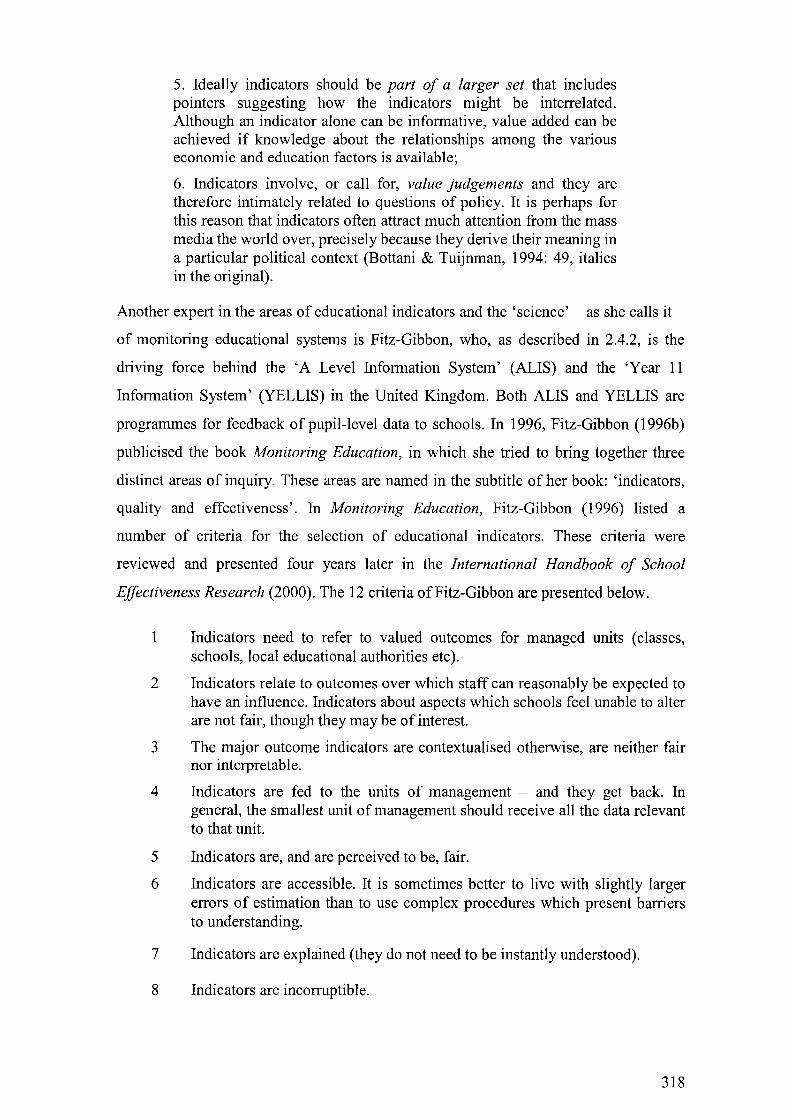
5. Ideally indicators should be part of a larger set that includes pointers suggesting how the indicators might be interrelated. Although an indicator alone can be informative, value added can be achieved if knowledge about the relationships among the various economic and education factors is available;
6. Indicators involve, or call for, value judgements and they are therefore intimately related to questions of policy. It is perhaps for this reason that indicators often attract much attention from the mass media the world over, precisely because they derive their meaning in a particular political context (Bottani & Tuijnman, 1994: 49, italics in the original).
Another expert in the areas of educational indicators and the 'science' - as she calls it
of monitoring educational systems is Fitz-Gibbon, who, as described in 2.4.2, is the
driving force behind the 'A Level Information System' (ALIS) and the 'Year 11
Information System' (YELLIS) in the United Kingdom. Both ALIS and YELLIS are
programmes for feedback of pupil-level data to schools. In 1996, Fitz-Gibbon (1996b)
publicised the book Monitoring Education, in which she tried to bring together three
distinct areas of inquiry. These areas are named in the subtitle of her book: 'indicators,
quality and effectiveness'. In Monitoring Education, Fitz-Gibbon (1996) listed a
number of criteria for the selection of educational indicators. These criteria were
reviewed and presented four years later in the International Handbook of School
Effectiveness Research (2000). The 12 criteria of Fitz-Gibbon are presented below.
1 Indicators need to refer to valued outcomes for managed units (classes, schools, local educational authorities etc).
2 Indicators relate to outcomes over which staff can reasonably be expected to have an influence. Indicators about aspects which schools feel unable to alter are not fair, though they may be of interest.
3 The major outcome indicators are contextualised otherwise, are neither fair nor interpretable.
4 Indicators are fed to the units of management - and they get back. In general, the smallest unit of management should receive all the data relevant to that unit.
5 Indicators are, and are perceived to be, fair.
6 Indicators are accessible. It is sometimes better to live with slightly larger errors of estimation than to use complex procedures which present barriers to understanding.
7 Indicators are explained (they do not need to be instantly understood).
8 Indicators are incorruptible.
318
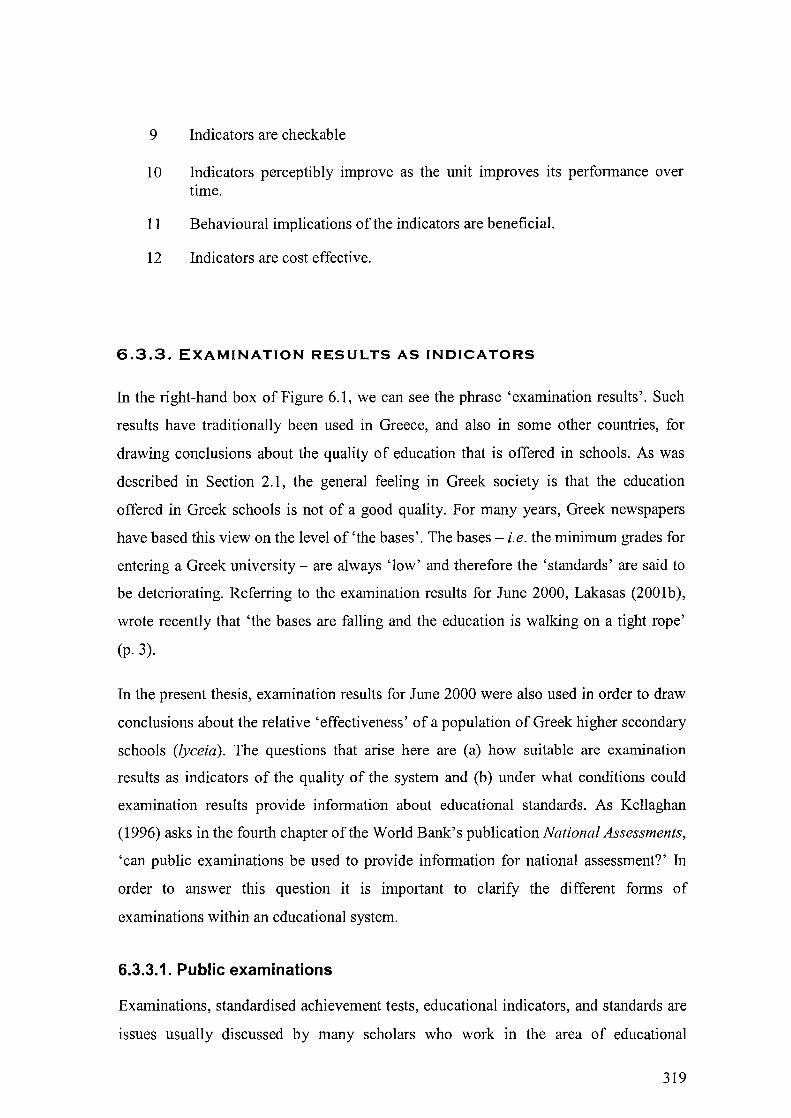
9 Indicators are checkable
10 Indicators perceptibly improve as the unit improves its performance over time.
11 Behavioural implications of the indicators are beneficial.
12 Indicators are cost effective.
6.3.3. EXAMINATION RESULTS AS INDICATORS
In the right-hand box of Figure 6.1, we can see the phrase 'examination results'. Such
results have traditionally been used in Greece, and also in some other countries, for
drawing conclusions about the quality of education that is offered in schools. As was
described in Section 2.1, the general feeling in Greek society is that the education
offered in Greek schools is not of a good quality. For many years, Greek newspapers
have based this view on the level of 'the bases'. The bases - i.e. the minimum grades for
entering a Greek university - are always 'low' and therefore the 'standards' are said to
be deteriorating. Referring to the examination results for June 2000, Lakasas (2001 b),
wrote recently that 'the bases are falling and the education is walking on a tight rope'
(p.3).
In the present thesis, examination results for June 2000 were also used in order to draw
conclusions about the relative 'effectiveness' of a popUlation of Greek higher secondary
schools (lyceia). The questions that arise here are (a) how suitable are examination
results as indicators of the quality of the system and (b) under what conditions could
examination results provide information about educational standards. As Kellaghan
(1996) asks in the fourth chapter of the World Bank's publication National Assessments,
'can public examinations be used to provide information for national assessment?' In
order to answer this question it is important to clarify the different forms of
examinations within an educational system.
6.3.3.1. Public examinations
Examinations, standardised achievement tests, educational indicators, and standards are
issues usually discussed by many scholars who work in the area of educational
319

assessment. Most of the literature on these issues is anglophone, probably because in
most non-English speaking countries, like France or Germany, the results of tests and
public examinations are not used in debates about national educational 'standards'. A
significant centre for the study of the above mentioned areas is the International Centre
for Research on Assessment (ICRA) at the London Institute of Education. The director
of this centre, Professor Alison Wolf, together with Professor Angela Little, are the
editors of the book Assessment in Transition: Learning, Monitoring and Selection in
International Perspective (1996), which approaches educational assessment from a
comparative point of view. Thus, if we looked at the educational examination systems
around the world with the help of Assessment in Transition, we would find that
examinations can play three roles: either selection, or certification, or a combination of
both.
Of the first two roles, selection is the most common function of educational assessment.
In many countries, there is a form of public examination at the end of an official school
stage, specially designed to select students for the higher educational stage (usually
from the higher secondary school to the tertiary level). Such an examination is, for
example, the Entrance Examination to Higher Education (EEHE) in The People's
Republic of China. The aim of EEHE is to rank the candidates so that they can later be
placed into prestigious or less prestigious universities. The certification function of
public examinations can also be seen in a number of countries. For example, the French
baccalaureat and the German abitur are issued to those students who posses a minimum
set of criteria, usually linked to declarative and procedural knowledge that has been
acquired in schools. Somerset (1996) compares selection examinations and certification
examinations against six criteria. The results of this comparison are presented in Table
6.3.
320
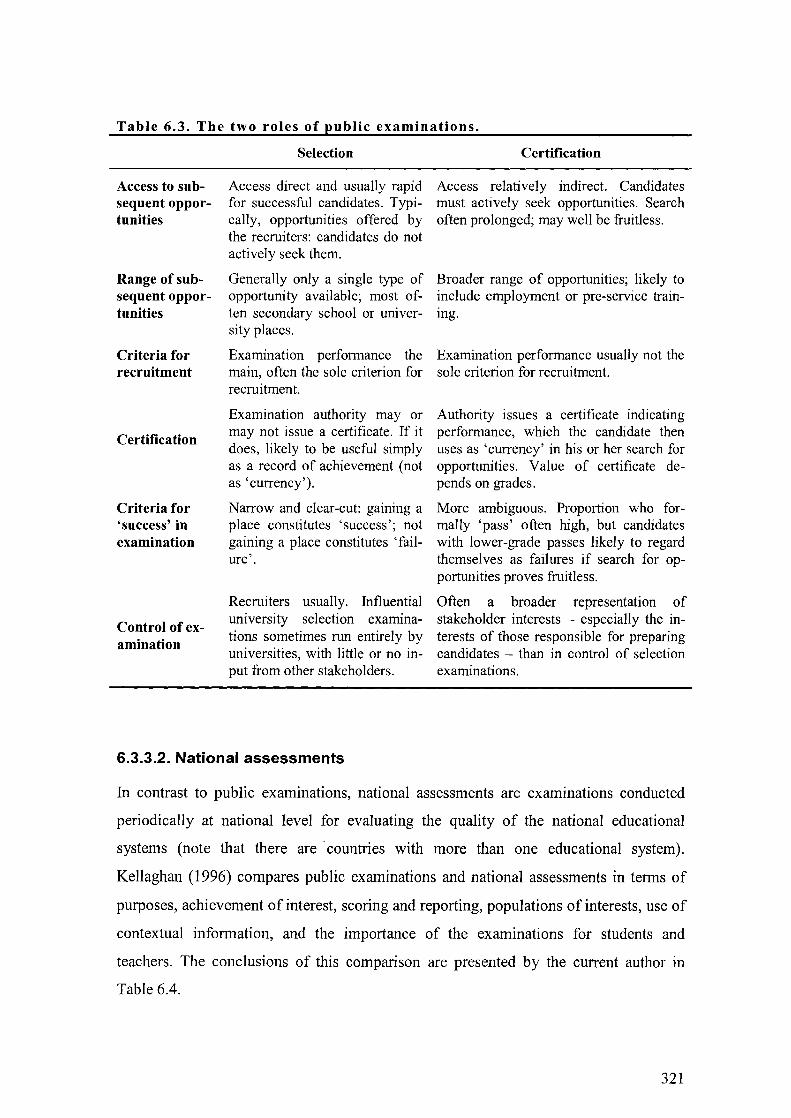
Table 6.3. The two roles of public examinations.
Access to subsequent opportunities
Range of subsequent opportunities
Criteria for recruitment
Certification
Criteria for 'success' in examination
Control of examination
Selection Certification
Access direct and usually rapid Access relatively indirect. Candidates for successful candidates. Typi- must actively seek opportunities. Search cally, opportunities offered by often prolonged; may well be fruitless. the recruiters: candidates do not actively seek them.
Generally only a single type of Broader range of opportunities; likely to opportunity available; most of- include employment or pre-service trainten secondary school or univer- mg. sity places.
Examination performance the Examination performance usually not the main, often the sole criterion for sole criterion for recruitment. recruitment.
Examination authority mayor may not issue a certificate. If it does, likely to be useful simply as a record of achievement (not as 'currency').
Narrow and clear-cut: gaining a place constitutes 'success'; not gaining a place constitutes 'failure'.
Recruiters usually. Influential university selection examinations sometimes run entirely by universities, with little or no input from other stakeholders.
Authority issues a certificate indicating performance, which the candidate then uses as 'currency' in his or her search for opportunities. Value of certificate depends on grades.
More ambiguous. Proportion who formally 'pass' often high, but candidates with lower-grade passes likely to regard themselves as failures if search for opportunities proves fruitless.
Often a broader representation of stakeholder interests - especially the interests of those responsible for preparing candidates - than in control of selection examinations.
6.3.3.2. National assessments
In contrast to public examinations, national assessments are examinations conducted
periodically at national level for evaluating the quality of the national educational
systems (note that there are· countries with mOre than one educational system).
Kellaghan (1996) compares public examinations and national assessments in terms of
purposes, achievement of interest, scoring and reporting, populations of interests, use of
contextual information, and the importance of the examinations for students and
teachers. The conclusions of this comparison are presented by the current author in
Table 6.4.
321
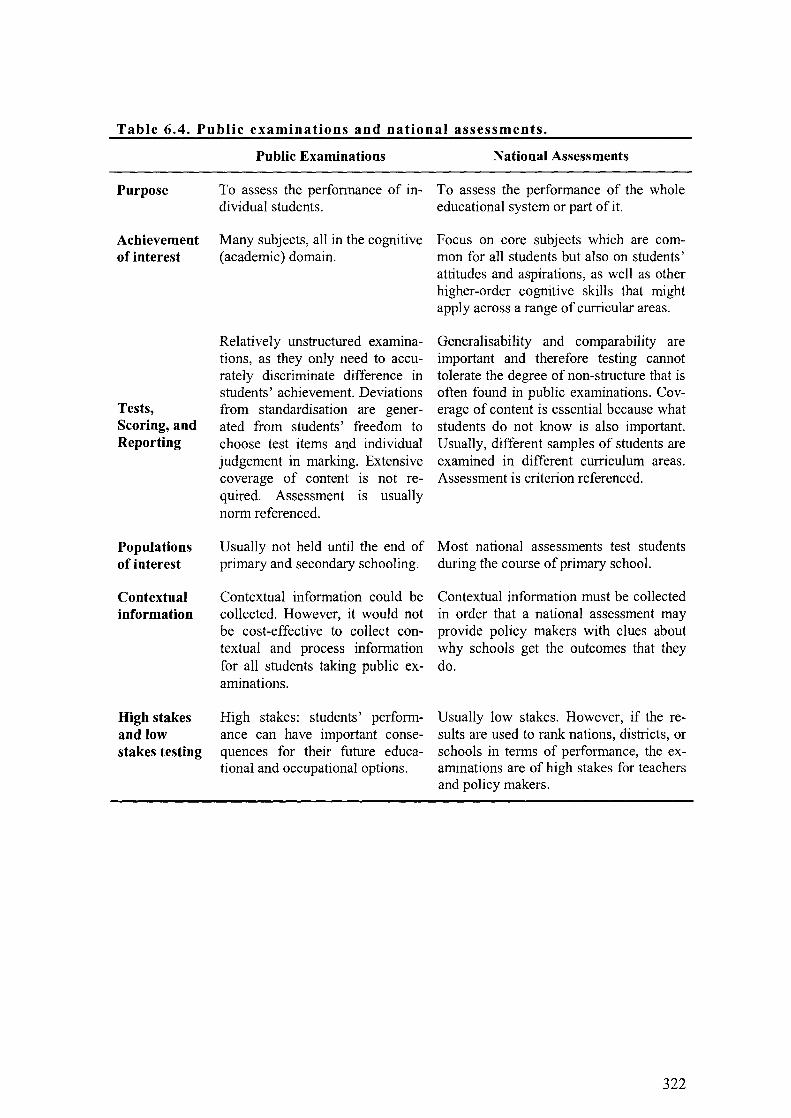
Table 6.4. Public examinations and national assessments.
Public Examinations National Assessments
Purpose To assess the performance of in- To assess the performance of the whole dividual students. educational system or part of it.
Achievement Many subjects, all in the cognitive Focus on core subjects which are comof interest (academic) domain. mon for all students but also on students'
attitudes and aspirations, as well as other higher-order cognitive skills that might apply across a range of curricular areas.
Tests, Scoring, and Reporting
Populations of interest
Contextual information
High stakes and low stakes testing
Relatively unstructured examina- Generalisability and comparability are tions, as they only need to accu- important and therefore testing cannot rately discriminate difference in tolerate the degree of non-structure that is students' achievement. Deviations often found in public examinations. Covfrom standardisation are gener- erage of content is essential because what ated from students' freedom to students do not know is also important. choose test items and individual Usually, different samples of students are judgement in marking. Extensive examined in different curriculum areas. coverage of content is not re- Assessment is criterion referenced. quired. Assessment is usually norm referenced.
Usually not held until the end of Most national assessments test students primary and secondary schooling. during the course of primary school.
Contextual information could be Contextual information must be collected collected. However, it would not be cost-effective to collect contextual and process information for all students taking public examinations.
High stakes: students' performance can have important consequences for their future educational and occupational options.
in order that a national assessment may provide policy makers with clues about why schools get the outcomes that they do.
Usually low stakes. However, if the results are used to rank nations, districts, or schools in terms of performance, the examinations are of high stakes for teachers and policy makers.
322

Suitability for monitoring educational standards
Public examinations lack the basis Item Response Theory is usually used for for comparability because (a) ex- constructing comparable tests. National amination populations change assessments are more expensive than from year to year and (b) methods public examinations. However, a of scoring cannot be demonstrated representative sample of students is to be sufficiently consistent over adequate and with the use of matrix time. However, a public examina- sampling - in which a total test is divided tion used for certification might into several components - comprehensive be modified to provide adequate content coverage can be achieved. curriculum coverage, and thus to be used for educational evalua-tion, although this might have ad-verse effects on the public exami-nation system by, for example, making examinations too long.
6.3.4. CURRENT RESEARCHER'S PROPOSALS
The nature of public examinations and their two roles, the 'systemic' approach to the
Greek educational system, the four policy scenarios that were presented in the Section
6.1, and the findings which were presented in the fifth chapter of the thesis are elements
which give to the current researcher the opportunity to make a number of proposals.
These proposals will be not very narrow because the current study has tapped many
educational issues in Greece.
First proposition: Analyse appropriate academic outcomes.
The first proposition of the current researcher is associated with the previous section
and concerns the nature of the academic outcomes that could be used as indicators for
the Greek educational system. Section 6.3.3 dealt with different aspects of examination
results. It was argued that results of public examinations are not always suitable for
evaluating the quality of an educational system. As Kellaghan (1996) has demonstrated,
public examinations differ from national assessment in seven important aspects: (a)
purposes, (b) achievement of interest, (c) scoring and reporting, (d) popUlations of
interests, (e) use of contextual information, and (f) the 'stakes' that are attached to them.
However, as the same author (op. cit.) has stressed, public examination used for
certification might be modified to provide adequate curriculum coverage and thus to be
used for drawing conclusions about the quality of the system. Results of Greek public
323
examinations - preferably those servmg certification purposes at the final year of
integrated lyceum - could therefore be used as outcome indicators. The papers for these
examinations should be curriculum-embedded and criterion-referenced. The large
weight given to teachers' authentic assessments in the calculation of students' final
grades should be drastically reduced to around 30% or even less. Moreover, it is
essential that for each examined subject an item-bank to be constructed by subject
specialists who can be teachers on secondment at the Greek Pedagogical Institute or at
the Centre for Educational Research. Greek teachers, parents and policy makers should
also agree in a number of educational quality standards. Item Response Theory or other
statistical methods could be used for dealing with errors in measurement and changes in
the student body over time.
Second proposition: Collect and publish educational statistics at student and school level.
The second proposition of the current author is that educational evaluation cannot be
achieved without basic statistics which must be published regularly and accurately.
Information obtained from international sources, like the annual publications of OECD,
may be useful for designing long-term educational policy at a national level but are not
useful for improvement strategies at prefecture level. First, therefore, basic educational
statistics should be collected either by the statistical department of the Greek Ministry
of Education or the educational department of the National Statistical Service of Greece
or the Centre for Educational Research. It is essential that educational statistics are
published at national and regional level on a regular basis. It is really disheartening to
learn that in the year 2002 the National Statistical Service of Greece can provide
educational statistics only up to the year 1996. The current practice of channelling vital
statistical information to some of 'our own' journalists, some of 'our own' educational
researchers and some of 'our own' political friends is at least undemocratic. All
teachers, all educational researchers, and all parents should have access to vital
statistical information. Neither educational research nor educational policy can ever
succeed in Greece without basic and detailed descriptive statistics.
Third proposition: Use appropriate affective outcomes.
The third proposition refers to the use of non-cognitive school outcomes for jUdging the
effectiveness of schools. However, as the current study has underlined, the first step
324
should be for these outcomes to come into existence! It is therefore proposed that Greek
integrated lyceia should offer education in values and social skills and not only in the
cognitive domain. In other words, comprehensive Greek lyceia should educate also the
hearts of the students and not just the minds. Students' answers to open-response
questions (see page 245) indicated that the 17 year-olds who participated in the study
felt alienated in their schools. The main reason for alienation, as some students stated, is
the fact that the only thing that counts in school is academic achievement. The students
in Greek comprehensive lyceia could work in teams, combining knowledge from
different disciplines. Teamwork could then be graded by means of portfolio assessment.
Greek teachers should not neglect the affective domain. Policy makers should not leave
teachers without guidance in this difficult task.
If Greek students were encouraged to work on interdisciplinary small-scale projects,
which would reflect their own interests and special abilities, significant work could be
done in the affective domain. If subjects like music and fine arts were introduced to the
National Curriculum, parents would not have to pay for them in private conservatories
and 'shadow education' system. Music performance has to find a place in the National
Curriculum and be taught in every school and not only in the state 'music lyceia'. The
very existence of state music lyceia exclusively for the musically 'gifted' is based on the
opinion that there are 'gifted' and not 'gifted' children as regards their music
performance. This theory mayor may not be correct. What is not correct, however, is to
exclude students from music education on the basis of lack of 'talent'. Exclusions of
this kind distort the very idea of comprehensive education in Greece.
Greek students should be given the opportunity to learn of other people's values and
other peoples' religions. Since the Greek Constitution requires that schools should
cultivate 'students' religiousness', it is essential that Greek students are taught about
other religions and not just Greek Orthodox Christianity. The war against terrorism and
organised crime, interpersonal relationships, as well as other contemporary ethical
dilemmas could serve as starting points for the exploration of values in an open society.
Affective school outcomes could be mainly measured qualitatively with interviews and
ethnographical research but also quantitatively - to a certain degree - with the use of
statistical models appropriate for latent variables based on questionnaires.
325
Fourth proposition: Focus on special educational problems at local level.
Another proposal of the current author deals with how the results of (appropriately
conducted) public examinations could be used for the improvement of Greek schools. It
was argued in Section 6.3.1 that from a philosophical point of view, linear logic should
not be applied to chaotic systems like the weather, earthquakes and education. Experts
in the area of educational change like Fullan (1991) appear to have arrived at the same
conclusions. However, even in a complex educational system there are subsystems in
which researchers can describe a problem, explore patterns, make statistical predictions,
verify hypotheses, and build simple or more complex models in order to aid
understanding it. An example is the finding that high socio-economic status is positively
correlated with high academic achievement. The proposal of the current author is that a
general systemic approach to the Greek school system would be unfruitful. Instead,
evaluators and policy makers in Greece could work at a local level and focus on specific
problems and aspects of the system, like, for example, the difference in achievement
between boys and girls in Mathematics, Science and Religion, or the relation between
frontisterion attendance and educational achievement. Teachers should be given
information and feedback on issues like the ones that were presented above by school
consultants or senior teachers who would know the local conditions of each area and
who could define, measure and analyse educational quality indicators. Of course, this
would require a certain degree of decentralisation which the Greek educational system
currently lacks. However, special offices could be set up in the 108 local educational
authorities of the country. These offices could employ by experienced teachers who
could be specially trained for their new tasks.
326
6.4. EPILOGUE
This study has explored the effectiveness of a number of integrated lyceia in the greater
area of Athens and has offered a possible solution to the problem of evaluating the
'educational work' in the Greek schools. It has been argued that the methods and the
knowledge base of School Effectiveness Research could be the starting points for
school-based evaluation and review in Greece. It has been recognised in the thesis that
the impact of the school effect is small compared to the impact of the teachers and their
classroom practices. It has also been recognised that quantification is not the only way
of understanding what is going on in a school or a classroom. However, it is fair to
argue that school level conditions facilitate classroom or teacher level conditions.
Usually, good teachings takes place in good schools.
The Greek word for evaluation is axiologisi from axia (value) and logos (study). In the
Greek educational discourse axiologisi is perceived to be a 'scientific', quantitative and
multipurpose device that brings structure to an otherwise shapeless system. Other
aspects of evaluation are very week to change this dominant view. No one, for example,
believes that axiologisi could be truly 'constructivistic'. Even the 'liberal' - and in my
view constructivistic - epistemological framework, which was proposed by the Greek
Pedagogical Institute in 1999, included 'objective' and quantitative criteria for
educational evaluation. Today there is no published material regarding educational
evaluation in Greece but one can easily predict the shape of the things which are about
to come. In all probability, a number of 'objective indicators' shall be constructed by
those wise men and women who work at the Pedagogical Institute and the Centre for
Educational Research. The existing - and of course untrained - administrative
personnel, like school directors and school consultants, shall undertake the task of
evaluating the teachers and the schools in an 'objective' manner. 'Objective' measuring
scales shall also be used. The more detail that these scales include the better.
This view is something that the current researcher could not ignore. Greek society is
thirsty for vital information about the quality of the educational system and the Greek
newspapers publish uncritically whatever relevant information comes across. In the
Greek educational departments of universities as well as in the congresses and the
Greek educational journals, most academics in the field of education and didactics
327
discuss about the sociological, political and philosophical ramifications of evaluation.
The opinion of the current researcher is that the main problem of educational evaluation
in Greece is not the lack of fertile academic thinking. The problem of educational
evaluation in Greece is mainly practical and methodological. Practical work is not as
prestigious as critical thinking but on the other hand someone has to do it. In other
words we need to start the evaluation first and think about the ramifications of
evaluation in a later stage.
Many interesting objections could be raised against the current author's opinion as it
was expressed in the previous paragraph. For example, one could argue that School
Effectiveness Research offers a naIve and quantitative basis for educational evaluation.
It could also be argued that the current work has been a study in policy making and not
in the realm of educational evaluation. Both of these objections are reasonable and valid
but also removable. Speaking about policy, not only does educational evaluation in
Greece changes when there is a governmental shift, but also varies according to the
personal views of different Ministers of education, even in the same government.
Speaking about 'naIve evaluative research', not only are the names of the 40 'best' and
the 40 'worst' lyceia (judged by their students' mean achievement) published in the
Greek newspapers but also conclusions are being made about the 'excellent educational
work' conducted in the private schools. Possible differences in schools' intake or
individual differences in the socio-economic status of the students are not taken into
account. The shadow education system of parapaedeia is not discussed openly as if one
could disappear it by not mentioning it. However, parapaedeia exists and makes a
difference to student achievement. Thus, no real evaluation can ever be made in the
Greek educational system unless the thorny issue of parapaedeia has been taken into
account.
Another objection against the current study could be its large size. One could reasonably
argue that large studies are the work of national and international agencies. It could be
argued that educational researchers ought to focus on small-scale educational research.
Educators, in other words, are expected to illuminate the things that statisticians can
only generally describe. Who else but the teacher-researcher can really understand an
educational problem? Who else but the teacher-researcher can really improve the things
in the school? The answer to this objection is that as far as evaluative research is
concerned, there is no law which restricts teachers to small scale research only. In the
third chapter of the current work we saw that educators have made large-scale
328
educational research in the past as regards the effectiveness of schools. Large
organisation like the DEeD and large international studies like PISA 2003 will
inevitably 'push' educators in small-scale evaluative studies. However, educators do not
have any reason to restrict themselves to the microcosm of the classroom, especially
when there is a gap in the macro-level as happens in Greece.
This study has described the effectiveness of some Greek integrated lyceia with the use
of multilevel models and this can be seen as an original contribution to the international
community of educational effectiveness. These models investigated the size and
structure of the school effect in Greece. The finding that Greek integrated lyceia differ
both in their academic and affective outcomes is important but not unexpected. The
investigation of the conditions and the factors that make Greek lyceia differ from each
other is more important. The current researcher attempted to explore some of these
factors within the context of a self-financed doctorate thesis. Many interesting things
were found. The effect of attending a frontisterion is one of them. However, the most
important contribution of the current study to the school effectiveness research
community is the support for the idea that the way forward is not simply through more
complex statistical analyses and large international studies. The way forward for the
years to come passes through a study of the particularities of the context of each
educational system, its history, tradition and local needs. The quest for school
effectiveness can be better conducted at a local level. This is the only way in which
school effectiveness will continue to be an interesting area of inquiry at an international
level. School effectiveness research has just been born in Greece. Its future seems to be
promising.
329
References
Afshartous, D. (1995) Determination of sample size for multilevel model design. Paper presented at the annual meeting of the American Educational Research Association, San Francisco.
Agnus, L. (1993) The sociology of school effectiveness. British Journal of Sociology of Education, 14(3), 333-345.
Agresti, A. (1996) An Introduction to Categorical Data Analysis. New York: John Wiley & Sons.
Aitkin, M., Anderson, D., & Hinde, J. (1981) Statistical modelling of data on teaching styles (with discussion). Journal of the Royal Statistical Society, A(144), 148-161.
Aitkin, M., & Longford, N. (1986) Statistical modelling issues in school effectiveness studies. Journal of the Royal Statistical Society, 149(1), 1-43.
Aitkin, M., & Zuzovsky, R. (1994) Multilevel interaction models and their use in the analysis of large-scale school effectiveness studies. School Effectiveness and School Improvement, 5,45-74.
Anderson, C. (1982) The search of school climate: A review ofthe research. Review of Educational Research, 52(3), 362-420.
Andreou, A., & Papakonstantinou, P. (1994) E(ov(Jia KaT Opyavw(J'l -LllOiK'l(J'l rov EK7faT&VTlKOV .I:V(JT~flaTOr; [Political Power, Organisation, and Administration of the Educational System]. Athens: Nea Sinora - Livani.
Antoninis, M., & Tsakloglou, P. (2001) Who benefits from public education in Greece? Evidence and policy implications. Education Economics, 9(2), 197-222.
Aspin, D., Chapman, 1., & Wilkinson, V. (1994) Quality Schooling: A Pragmatic Approach to Some Current Problems, Topics and Issues. London: Cassell.
Bagakis, G. (Ed.). (2001) A(lOAOY'l(J'l EK7faz6cvTlKWV IIpoypaflWJ.TWV Kaz .I:xoAciov [Curricula and School Evaluation]. Athens: Metehmio.
Baird, L. (1969) Big school, small school: A critical examination ofthe hypothesis. Journal of Educational Psychology, 60,253-260.
Ballion, R. (1991) La Bonne Ecole. Paris: Hatier.
330
Barber, M., & White, J. (1997) Introduction. In J. White & M. Barber (Eds.), Perspectives on School Effectiveness and School Improvement. London: London Institute of Education.
Barker, R, & Gump, P. (1964) Big School, Small School: High School Size and Student Behaviour. Stanford, CA: Stanford University Press.
Bashi, J., & Zehava, S. (Eds.). (1992) School Effectiveness and School Improvement: Proceedings of the Third International Congress for School Effectiveness. Jerusalem: Magness Press.
Battistich, V., Solomon, D., Kim, D., Watson, M., & Schaps, E. (1995) Schools as communities, poverty levels of student populations, and students' attitudes, motives and performance: A multilevel analysis. School Effectiveness and School Improvement, 32(3), 627-658.
Beare, H., Caldwell, B., & Milikan, R (1993) Leadership. In M. Preedy (Ed.), Managing the Effective School. London: Open University Press.
Bennett, N. (1976) Teaching Styles and Pupil Progress. London: Open Books.
Berry, W. (1984) Non Recursive Causal Models. (Vol. 37). London: Sage.
Bessent, A, & Bessent, W. (1993) Using Data Envelopment Analysis for measuring productivity. In H. Walberg (Ed.), Advances in Educational Productivity (Vol. 3). JAI Press.
Bock, D. R (Ed.). (1989) Multilevel Analysis of Educational Data. London: Academic Press, Inc.
Bofilatos, S. (2000) ~taOpOllE~ OTllv £(Jco't£ptK1l astOAoYll(JT] [Passages to internal evaluation]. In G. Bagakis (Ed.), A(lOAoYI](J1] Elaralt5cVTll(WV llpoypafl/-uirwv Kal
IXOAdov [Curricula and School Evaluation] (pp. 166-174). Patra: Metehmio.
Bollen, R, & Hopkins, D. (1987) School Based Review: Towards a Praxis. Leuven: ACCO.
Bosker, R., & Dekkers, P. (1994) School differences in producing gender-related subject choices. School Effectiveness and School Improvement, 5(178-195).
Bosker, R, & Scheerens, J. (1994) Alternative models of school effectiveness put to the test. In R Bosker, B. Creemers, & J. Scheerens (Eds.), Conceptual and methodological advances in educational effectiveness research. International Journal of Educational Research, vol. 13 [special issue], pp. 741-751.
Bosker, R., & Scheerens, J. (1995) A self-evaluation procedure for schools using multilevel modelling. Tijschrft voor Onderwijsresearch, 20(2), 154-164.
Bosker, R. J. (1990) Extra Kansen dankzij de school [Does the school provide more chances]. Unpublished PhD dissertation. Institute voor Toegepaste Sociale Wetenschappen, Nijmegen.
Bosker, R J., Kreemers, E. J. J., & Lugthart, E. (1990) School and instruction effects on mathematics achievement. School Effectiveness and School Improvement, 1,233-248.
Bottani, N., & Tuijnman, A (1994) The design of indicator systems. In A Tuijnman & N. Postlethwaite (Eds.), Monitoring the Standards of Education. Oxford: Pergamon.
Boyan, N. J. (Ed.). (1988) Handbook of Research on Educational Administration. White Plains, N.Y.: Longman.
331
Brandsma, H. (1993) Basisschoolkenmerken ed de Kwaliteit van het Onderwijs [Characteristics of Primary Schools and the Quality of Education}. Groningen: RION.
Brandsma, H., Edelenbos, P., & Bosker, R (1995) Effecten van Trainingen voor Docenten en Schoolleiders [The Effects of Training Programmes for Teachers and School Leaders}. Groningen/Enschede: RION/OCTO.
Brandsma, H., & Knuver, A. (1989) Effects of school classroom characteristics on pupil progress in language and arithmetic. School Effectiveness and School Improvement, 13(7) [special issue], pp. 111-188.
Breen, R, & Whelan, C. (1996) Social Mobility and Social Class in Ireland. Dublin: Colour Books.
Brimer, A., Madaus, G. F., Chapman, B., Kellaghan, T., & Woodrof, R (1978) Differences in School Achievement. Slough: NFER- Nelson.
Brock, c., & Tulasiewicz, W. (Eds.). (2000) Education in a Single Europe (2 ed.). London and New York: Routledge.
Brookover, W. B., Beady, C., Flood, P., & Schweitzer, J. (1979) School Systems, Student Achievement: School Can Make a Difference. New York: Praeger.
Brown, S. (1994) School effectiveness research and the evaluation of schools. Evaluation and Research in Education, 8(1&2), pp. 55-68.
Bryk, A. S., & Raudenbush, S. W. (1987) Application of hierarchical linear models to assessing change. Psychological Bulletin, 101, 147-158.
Carassave, A. (2001). A report from Athens. Time, 158, 16.
Caroll, J. (1989) The Caroll Model: A 25-year retrospective and prospective view. Educational Researcher, 18, 26-31.
Chapman, D. W., & Carrier, C. A. (1990) ImprOVing Educational Quality: An Educational Perspective. Westport, CT: Greenwood Press.
Chapman, J., & Aspin, D. (1994) Autonomy and mutuality. In T. Townsent (Ed.), Restructuring and Quality: Issues for Tomorrow's Schools. London: Routledge.
Cheng, Y. C. (1996) School Effectiveness and School-Based Management: A Mechanism for Development. London: Falmer Press.
Chinapah, V. (2001). Quality of education for all: Meeting the challenges for the learning society ofthis century. Congress about the meaning of quality in education. Karlstad (April 2 - 4).
Chitty, C. (1997) The school effectiveness movement: origins, shortcomings and future possibilities. The Curriculum Journal, 8(1), 45-62.
Clark, D., Lotto, L., & Astuto, T. (1984) Effective schools and school improvement: A comparative analysis of two lines of enquiry. Educational Administration Quarterly, 20(3),41-68.
Cohen, M. (1998) Determining sample sizes for surveys with data analysed by hierarchical linear models. Journal of Official Statistics, 14(3).
Cohn, E. (Ed.). (1997) Market Approaches to Education: Vouchers and School Choice. Oxford and New York: Pergamon.
332
Coleman, J. S., Campbell, E., Hobson, C., McPartland, J., Mood, A., Weinfield, F., & York, R. (1966) Equality of Educational Opportunity. Washington: US Government Printing Office.
Conant, J. (1967) The Comprehensive High School. New York: McGraw-Hill.
Converse, J., & Presser, S. (1986) Survey Questions: Handcrafting the Standardized Questionnaire. Newbury Park, Cal: Sage.
Corcoran, T. (1990) Schoolwork: Perspectives on workplace reform in public schools. In M. McLaughlin, J. Talbert, & N. Bascia (Eds.), The Contexts of Teaching in Secondary Schools. London: Teachers College Press.
Corcoran, T., White, J. L., & Walker, L. (1988) Working in Urban Schools. Washington, DC: Institute of Educational Leadership.
Cotton, K. (1995) Effective schooling practices: A research synthesis (1995 Update). School Improvement Research Series. Northwest Regional Educational Laboratory.
Creemers, B. (1994) The Effective Classroom. London: Cassell.
Creemers, B. (1996) The school effectiveness knowledge base. In D. Reynolds, R. Bollen, B. Creemers, D. Hopkins, L. Stoll, & N. Lagerweij (Eds.), Making Good Schools: Linking School Effectiveness and School Improvement. London: Routledge.
Creemers, B., & Osinga, N. (Eds.). (1995) ICSEI Country Reports. Leeuwarden, Netherlands: ICSEI Secretariat.
Creemers, B., Peters, T., & Reynolds, D. (Eds.). (1989) School Effectiveness and School Improvement: Selected Proceedings of the Second International Congress. Amsterdam: Swets and Zeitlinger.
Creemers, B., & Reezigt, G. (1996) School level conditions affecting the effectiveness of instruction. School Effectiveness and School Improvement, 7(3), 197-228.
Creemers, B., & Scheerens, 1. (1994) Developments in the educational effectiveness research programme. In R. Bosker, B. Creemers, & 1. Scheerens (Eds.), Conceptual and Methodological Advances in Educational Effectiveness Research. International Journal of Educational Research 21 (2) [ special issue] pp.l25-140.
Cuttance, P. (1987) Modelling Variation in the Effectiveness of Schooling. Edinburgh: CES.
Daly, P. (1991) How large are secondary school effects in Northern Ireland? School Effectiveness and School Improvement, 2(4),305-323.
Daly, P. (1995) Public accountability and the academic effectiveness of grant-aided catholic schools. School Effectiveness and School Improvement, 6(4),367-379.
Davies, P. (1987) The Cosmic Blueprint. London: Heinemann.
De Vos, H. (1989) A rational-choice explanation of composition effects in educational research. Rationality and Society, 1, 220-239.
De Vos, H. (1998) Educational Effects: A Simulation-Based Analysis. Enschede: University of Twente.
Delithanasi, M. (2001, February 9) ~8U'tEpa Kat 'tphll AUKdou: Ot vtK1l'tE~ dvat m tblOHtKU Kat m I.tEyUAa crxoAda [Second and third year of lyceum: The winners are the private and the large schools]. I Kathimerini, p. 7.
333
Derouet, J. (1987) Approaches ethnographiques en sociologie de l' education: l' ecole, la communautee, l' etablissement scolaire, la classe. Revue Franr;aise de Pidagogie, 78.
Dinopoulos, A. (1999, September 25) ~Do cOp8~ 8po/-tO ym anoamoTl 10 X1AlOIlETProV [two hours on the road for 10 kilometers!). To Vima, pp. AI8-19.
DOE-POED (1998) A~lOAoy~all aTllv EKnai88uall [Evaluation in Education]. Paper presented at the Ii Panhellenic Educational Congress of DOE-POED, Island of Chios.
Doukas, C. (1997) E1CllXJ.l(5c:vrrK~ nOAmK~ KaT E(ovfJ[a [Educational Policy and Political Control}. Athens: Grigori.
Dretakis, M. (2001, February 25) I1cOC; Sa AUSei TO npo~All/-ta TllC; napanat8eia~ [how to solve the problem ofparapaedeia]. I Kathimerini, p. 18.
Duru-Bellat, M., & Mingat, A. (1987) Facteurs institutionnels de la diversite des carrieres scolaires. Revue Franr;aise de Sociologie, 28(1).
Dworkin, A. (1987) The Teacher Burnout in Public Schools. Albany, New York: SUNY Press.
Eckstein, M., & Noah, H. (1993) Secondary School Examinations: International Perspectives on Policies and Practice. London: Yale University Press.
Edmonds, R. (1979) Effective schools for the urban poor. Educational Leadership, 37(1), 16-18.
Educational Committee Proceedings (1958) Athens: National Printing Office.
Elliot, J. (1996) School effectiveness and its critics: Alternative visions of schooling. Cambridge Journal of Education, 26(2), 199-224.
Ferguson, G., & Takane, Y. (1989) Statistical Analysis in Psychology and Education. (6th
ed.). London: Mc Graw Hill.
Fielding, M. (1997) Beyond school effectiveness and school improvement: Lighting the slow fuse of possibility. The Curriculum Journal, 8(1), 7-27.
Fitz-Gibbon, C. (1991) Multi-level modelling in an indicator system. In S. Raudenbush & D. Willms (Eds.), Schools, Classrooms and Pupils: International Studies of Schoolingfrom a Multilevel Perspective (pp. 67-84). San Diego: Academic Press.
Fitz-Gibbon, C. (1992) School effects at A-level - Genesis of an information system. In D. Raynolds & P. Cuttance (Eds.), School Effectiveness: Research Policy and Practice. London: Cassell.
Fitz-Gibbon, C. (1996a) Issues to be Considered in the Design of a National Value Added Project. London: Schools Curriculum and Assessment Authority.
Fitz-Gibbon, C. (1996b) Monitoring Education: Indicators, Quality and Effectiveness. London: Cassell.
Fitz-Gibbon, C. (1997) The Value Added National Project Final Report. London: Schools Curriculum and Assessment Authority.
Fitz-Gibbon, C., & Kochan, S. (2000) School effectiveness and education indicators. In C. Teddlie & D. Reynolds (Eds.), The International Handbook of School Effectiveness Research (pp. 257-282). London & New York: Falmer Press.
Flessa, V. (1999, September 1) I1at8eia: 0 r oAyoSac; TroV llaSllTcOv [Education: Students' Calvary]. I Kathimerini, p. 3.
334
Floyd J.E. (ed.) Halsey, AH. & Martin F.M. (1956) Social Class and Educational Opportunity. London: Heinemann.
Foddy, W. (1993) Constructing Questions for Interviews and Questionnaires: Theory and Practice in Social Research. Cambridge: Cambridge University Press.
Fowler Jr, W. (1995) School size and student outcomes. In B. Levin, W. Fowler Jr, & H. Walberg (Eds.), Advances in Educational Productivity (Vol. 5, pp. 3-26). London: JAI Press.
Fowler, W., & Walberg, H. (1991) School size, characteristics, and outcomes. Educational Evaluation and Policy Analysis, 13(2), 187-202.
Freiberg, J. (Ed.). (1999) School Climate. London: Falmer Press.
Fullan, M. (1991) The New Meaning of Educational Change. London: Cassell.
Fuller, B., & Clarke, P. (1994) Raising school effects while ignoring culture? Local conditions and the influence of classroom tools, rules and pedagogy. , 64(1), 119-157.
Gallegos, A (1994) Meta-evaluation of school evaluation models. Studies in Educational Evaluation, 20,41-54.
Gamoran, A (1991) Schooling and achievement: additive versus interactive models. In S. W. Raudenbush & 1. D. Willms (Eds.), Schools, Classrooms and Pupils: International studies o/Schoolingfrom a Multilevel Perspective (pp. 37 - 51). London: Academic Press.
Genette, G. (1988) Narrative Discourse Revisited. New York: Cornell University Press.
Georgopoulos, B. S., & Tannenbaum, A. S. (1957) A study of organisational effectiveness. American Sociological Review, 22(5),534-540.
Goldstein, H. (1980) Critical notice-'Fifteen thousand hours', Rutter et al. Journal of Child Psychology and Psychiatry, 73(1),364-366.
Goldstein, H. (1986) Multilevel mixed linear models analysis using Iterative Generalised Least Squares. Biometrica, 73(1),57-64.
Goldstein, H. (1987) Multilevel Models in Educational and Social Research. London: Oxford University Press.
Goldstein, H. (1991) Non-linear multi-level models with an application to discrete response data. Biometrika, 78,45-51.
Goldstein, H. (1995a) Interpreting International Comparisons of Student Achievement. Paris: UNESCO.
Goldstein, H. (1995b) Multilevel Models in Educational and Social Research: A Revised Edition. London: Edward Arnold.
Goldstein, H. (1995c) Multilevel Statistical Models (2nd ed.). London: Arnold.
Goldstein, H. (1998) Modelsfor Reality: New Approaches to the Understanding of Educational Processes. London: London Institute of Education.
Goldstein, H., & Healy, M. (1995) The graphical presentation ofa collection of means. Journal o/the Royal Statistical SOCiety, 158(1), 175-177.
Goldstein, H., & Lewis, T. (Eds.). (1996) Assessment: Problems, Developments and Statistical Issues. London: John Wiley & Sons.
335
Goldstein, H., & Myers, K. (1997). School Effectiveness Research: A bandwagon, a hi-jack or a journey towards enlightenment? Paper presented at the Annual Conference of the British Educational Research Association (September 11-14), York.
Goldstein, H., & Myers, K. (1996) Freedom of information: Towards a code of ethics in performance indicators. Research Intelligence, 57.
Goldstein, H., Rasbash, J., Yang, M., Woodhouse, G., Pan, H., Nuttall, D., & Thomas, S. (1993) A multilevel analysis of school examination results. Oxford Review of Education, 19(4),425-433.
Goldstein, H., & Spiegelhalter, D. (1996) League tables and their limitations: statistical issues in comparisons of institutional performance. Journal of the Royal Statistical Society, 159(3), 385-443.
Gray, J., Hopkins, D., Reynolds, D., Wilcox, B., Farrell, S., & Jesson, D. (1999) Improving Schools: Performance and Potential. Buckingham: Open University Press.
Gray, J., Jesson, D., Goldstein, H., Hedger, K., & Rasbash, J. (1995) A multi-level analysis of school improvement: Changes in schools' performance over time. School Effectiveness and School Improvement, 6,97-114.
Gray, J., Jesson, D., & Sime, N. (1990) Estimating differences in the examination performances of secondary schools in six LEAs: A multi-level approach to school effectiveness. Oxford Review of Education, 16(2), 137-158.
Gray, J., & Wilcox, B. (Eds.). (1995) 'Good School, Bad School'. Buckingham: Open University Press.
Greaney, V., & Kellaghan, T. (1996) Monitoring the Learning Outcomes of Educational Systems. Washington D.C.: The World Bank.
Grisay, A. (1997) Evolution des Acquis Cognitifs et Socio-affectifs des Eleves au Cours des Anmies de College [Evolution of Cognitive and Affective Development in Lower Secondary Education]. Paris: Direction de l' Evaluation et de la Prospective.
Guba, E., & Lincoln, Y. (Eds.). (1989) Fourth Generation Evaluation. London: Sage.
Guba, E., G, & Lincoln, Y., S. (1998) Competing Paradigms in Qualitati~e Research. In N. Denzin, K & Y. Lincoln, S (Eds.), The Landscape of Qualitative Research: Theories and Issues (Vol. A). London: Sage.
Guildford, J. P. (1956) Psychometric Methods. New York: McGraw-Hill.
Hair, J. F., Anderson, R. E., Tatham, R. L., & Black, W. C. (1995) Multivariate Data Analysis with Readings. London: Prentice-Hall.
Haller, E. (1992) High school size and student indiscipline: Another aspect of the school consolidation issue? Educational Evaluation and Policy Analysis, 14(2), 145-156.
Haller, E., Monk, D., Bear, A., Griffith, J., & Moss, P. (1990) School size and programme conprehensiveness: Evidence from 'high school and beyond'. Educational Evaluation and Policy Analysis, 12(2), 109-120.
Hallinger, P., & Heck, R. (1998) Exploring the principal's contribution to School Effectiveness. School Effectiveness and School Improvement, 9(2), 157-191.
Hambleton, R., & Swaminathan, H. (1985) Item Response Theory: Principles and Applications. Boston, MA: Kluwer Academic.
Hamilton, D. (1998) The idols of the market place. In R. Slee, G. Weiner, & S. Tomlinson (Eds.), School Effectiveness for Whom? London: Falmer Press.
336
Hamlyn, D. (1995) Epistemology. In T. Honderich (Ed.), The Oxford Companion to Philosophy. New York: Oxford University Press.
Hanushek, E. A. (1979) Conceptual and empirical issues in the estimation of educational production functions. Journal of Human Resources, 14, 351-388.
Hargreaves, D. (1995) School culture, school effectiveness and school improvement. School Effectiveness and School Improvement, 6(1),23-46.
Harris, A, Jamieson, 1., Pearce, D., & Russ, J. (1997) Equipping Young People for Working Life: Effective Teaching and Learning Through Work Related Contexts. London: DfEE Research Papers, HMSO.
Harris, A, Jamieson, 1., & Russ, J. (1995) A study of effective departments in secondary schools. School Organisation, 15(3),283-299.
Heck, R., & Marcoulides, G. (1996) School culture and performance: Testing the invariance of an organisational model. School Effectiveness and School Improvement, 7( 1), 76-95.
Hill, P. (1995) School effectiveness and improvement: present realities and future possibilities. (Inaugural Professorial Lecture). University of Melbroune, Faculty of Education.
Hill, P. (1996) The value schools add to the learning achievement of their students. Paper presented at the congress The Schools of the Third Millennium, Regent Hotel Melbourne (September).
Hill, P., Rowe, K., & Holmes-Smith, P. (1995). Factors affecting students' educational progress: Multilevel modelling of educational effectiveness, International Congress for School Effectiveness and Improvement. Leeuwarden, The Netherlands (January).
Hill, P. W. (1998) Shaking the Foundations: Research Driven School Reform. School Effectiveness and School Improvement, 9(4),419-436.
Hill, P. W., & Rowe, K. J. (1996) Multilevel modelling in school effectiveness research. School Improvement and School Improvement, 7, 1-34.
Hill, W. P., Rowe, K. J., & Holmes-Smith, P. (1993, January) Factors affecting students' educational progress: Multilevel modelling of educational effectiveness. Paper presented at the Eighth International Congress for School Effectiveness and Improvement, Leeuwarden, the Netherlands (January).
Holland, A, & Andre, T. (1987) Participation in extracurricular activities in secondary school: What is known, what needs to be known? Review of Educational Research, 57(4),437-466.
Hopkins, D. (Ed.). (1987) Improving the Quality of Schooling. London: Falmer Press.
Hopkins, D. (1988) Doing School Based Review. Leuven: ACCO.
Hopkins, D., & Lagerweij, N. (1996) The School Improvement Knowledge Base. In D. Reynolds, R. Bollen, B. Creemers, D. Hopkins, L. Stoll, & N. Lagerweij (Eds.), Making Good Schools: Linking School Effectiveness with School Improvement. London: Routledge.
Hox, J. (1995) Applied Multilevel Modelling. Amsterdam: T T-Publikaties.
Hoy, C., Bayne-Jardine, C., & Wood, M. (2000) Improving Quality in Education. London: Falmer Press.
337
Huber, M. (1999) Co-ordination within schools, commitment of teachers and students and student achievement. Educational Research and Evaluation, 5(2), 139-156.
Iaffaldano, M., & Muchinsky, P. (1985) Job satisfaction and job performance: a metaanalysis. Phychological Bulletin, 97(2),251-273.
Jencks, C. S., Smith, M., Ackland, H., Bane, M. J., Cohen, D., Gintis, H., Heyns, B., & Michoslon, S. (1972) Inequality: A Reassessment of the Effect of Family and Schooling in America. New York: Basic Books.
Jennings, L., & Graham, A. (1996) Postmodem perspectives and action research. Educational Action Research, 4(2),267-278.
Jennrich, R.I., & Sampson, P. F. (1966) Rotation of simple loadings. Psychometrika, 31, 313-323.
Jensen, J. (1995) Effective schools? Comparative Education, 31(2), 181-200.
Jesson, D., & Gray, J. (1991) Slants on slopes: Using multi-level models to investigate differential school effectiveness and its impact on pupils' examination results. School Effectiveness and School Improvement, 2(3),230-247.
Kaiser, H. F. (1970) A second-generation Little Jiffy. Psychometrica, 35,401-415.
Kaiser, H. F. (1974) Little Jiffy, Mark IV. Educational and Psychological Measurement, 34,111-117.
Kallen, D. (1996) Secondary Education in Greece. Strasbourg: Council of Europe Press.
Kallen, D. (1997) Secondary Education in Europe: Problems and Prospects. Strasbourg: Council of Europe Publishing.
Kallestad, J. H., Olweus, D., & Alsaker, F. (1998) School climate reports from Norwegian teachers: A methodological and substantive study. School Effectiveness and School Improvement, 9(1), 70-94.
Karadjia, E. (1997) A-level Performance and the Development of Greek Culture in the Greek Supplementary Schools of London: A Cost-Effectiveness Analysis. Unpublished PhD dissertation, London Institute of Education.
Kassotakis, M. (1994, August 14) H astOAoY11cr11 TOU ~aS11TiJ Kat TO Y1touPyEio I1atoEia<; [Students' assessment and the Ministry of Education]. To Vima p. All.
Kassotakis, M. (1998) Alro TO llOAVl<Aa&Ko eno Evzaio AVKelO [From Multifarious to Integrated Lyceum}. Athens: Grigori.
Kassotakis, M. (2000) Greece. In C. Brock & W. Tulasiewicz (Eds.), Education in a Single Europe (2nd ed., pp. 184-205). London: Routledge.
Kassotakis, M. (200 I, August 19) AaSo<; 11 E1tava<popa TCOV ~ETESETacrTEcov [wrong to reestablish second-chance examinations] I Kathimerini, p. 17.
Kassotakis, M., & Papageli, D. (1996) H llpo(JjJa(J1J en1Jv EM1JV1K~ TprwjJaB/lza EKlraibev(J1J [Access to Greek Higher Education}. Athens: Grigori.
Kazamias, A. (1995) H KaTapa TOU ncru<pou [The Sisyphus' curse]. In A. Kazamias & M. Kassotakis (Eds.), EM1JV1K~ EKlraibev(J1J: llpOOTIT1KtC; Ava(JvYKpoT1J(J1JC; KaT EK(JVYXPOV1(J/lOV [Greek Education: Prospectives of Reformation and Modernisation}. Athens: Serios.
Keefe, J. (1994) School evaluation using the case-ims model and improvement process. Studies in Educational Evaluation, 20, 55-67.
338
Kellaghan, T. (1996) Can public examinations be used to provide information for national assessment? In P. Murphy, V. Greaney, M. Lockheed, & c. Rojas (Eds.), National Assessments: Testing the System. Washington: The World Banle
Kelloway, K. E. (1998) Using LISRELfor Structural Equation Modelling. Thousand Oaks CA: Sage.
Kental, M., & Stuart, A. (1977) The Advanced Theory of Statistics: Inference and Relationships (vol. 2). (4 ed.). London: Charles Griffin & Co.
Kim, J.-O., & Mueller, C. (1978) Factor Analysis: Statistical Methods and Practical Issues. London: Sage.
Kline, P. (1994a) An Easy Guide to Factor Analysis. London: Routledge.
Kline, P. (1994b) The Handbook of Psychological Testing. London: Routledge.
Kontogianopoulos, V. (1991) Ilaz&ia, E,((JVYXPOVUJj10r; VJro AVWJTOA~ [Education, Modernisation Suspended}. Athens: Gutemberg.
Kuhn, T. (1970) The Structure of Scientific Revolutions. Chicago: Chicago University Press.
Lakasas, A. (2001 a, August 12) ilropEav EK7rai8Eu(J11 llE U7rSPOYKO K6(J'tO~ [gratuitous education on huge cost]. I Kathimerini, p. 17.
Lakasas, A. (2001b, August 21) Ot ~a(JEt~ 7rsqrwuv, 11 ITat8Eia aKpo~a't'Ei (bases are falling, education is walking on a tight rope). I Kathimerini, p. 3.
Lam, M., & van der Grift, W. (1995). Het didastisch handelen in het basisonderwijs [Teaching strategies in primary education], In a congress with title Onderwijsresearchdagen. Groningen, the Netherlands (June 19-21).
Langbein, L., & Lichtman, A. (1978) Ecological Inference. London: Sage.
Lauder, H., Jamieson, I., & Wikeley, F. (1998) Models of effective schools: limits and capacities. In R. Slee, G. Weiner, & S. Tomlinson (Eds.), School Effectivenessfor Whom? London: Falmer Press.
Lee, V., Dedrick, R, & Smith, 1. (1991) The effects of social organisation of schools on teachers' efficacy and satisfaction. Sociology of Education, 64, 190-208.
Levine, D., & Lezotte, L. (1990) Unusually Effective Schools: A Review and Analysis of Research and Practice. Madison, WI: National Centre for Effective Schools Research and Development.
Liensol, R, & Meuret, D. (1987). Les performances des lycees publics et prives pour la preparation au baccalaureat. Education et Formations (Vol. 12). Paris: Ministere de la education Nationale - Direction de l' Evaluation et de la Prospective.
Lindley, D. V., & Smith, A. F. M. (1972) Bayes estimates for the linear model. Journal of the Royal Statistical Society, B(34), 1-41.
Lindsay, P. (1982) The effect of high school size on student participation, satisfaction and attendance. Educational Evaluation and Policy Analysis, 4,57-65.
Lindsay, P. (1984) High school size, participation in activities, and young adult social participation: Some enduring effects of schooling. Educational Evaluation and Policy Analysis, 6(1), 73-83.
Lingard, R, Ladwig, 1., & Luke, A. (1998) School Effects in Postmodem Conditions. In R Slee, G. Weiner, & S. Tomlinson (Eds.), School Effectivenessfor Whom? London: Falmer Press.
339
Little, J. W. (1982) Norms of collegiality and experimentation: Workplace conditions of school success. American Educational Research Journal, 19(3), 325-340.
Luyten, H. (1994) School Effects: Stability and Malleability. Enschede: University of Twente.
Luyten, J. (1996). School effectiveness and student achievement, consistent across subjects? Evidence from Dutch primary and secondary education. Paper presented at the Annual Conference of the Dutch Association for Educational Research (Onderwijsresearchdagen) Tilburg (August).
Lyotard, J. F. (1984) The Postmodern Condition: A Report on Knowledge. Minneapolis: University of Minneapolis Press.
Madaus, G., Airasian, P., & Kellaghan, T. (1980) School Effectiveness: A Reassessment of the Evidence. New York: McGraw-Hill.
Madaus, G., Kellaghan, T., Rakow, E., & King, D. (1979) The sensitivity of measures of school effectiveness. Harvard Educational Review, 49,207-230.
Makdisi, G. (1981) The Rise of Colleges: Institutions of Learning in Islam and the West. Edinburgh: Edinburgh University Press.
Marcoulides, G., & Heck, R. (1993) organisational culture and performance: proposing and testing a model. Organisational Science, 4(2),209-225.
Marion, S., McIntire, W., & Walberg, H. (1991). The effects of per-pupil expenditures, school size and student characteristics on student achievement and educational attainment in rural schools. Paper presented at the Annual Meeting of the American Educational Research Association.
Mastoras, N. (1999, August 4) Ta 163 A:oKEta nOD ~EXcOptcrav [163 distinguished lyceia]. Ta Nea, pp. 12-13.
McGaw, B., Piper, J., Banks, D., & Evans, B. (1992) Making Schools More Effective. Howthorn, Victoria: Australian Council for Educational Research.
McKenzie, P., & Harrold, R. (1989) Tools for school self-evaluation: developments in Australia. Studies in Educational Evaluation, 15, 31-45.
Meuret, D. (1995). Schools and the production of inequalities: The case of French junior secondary schools. Paper presented at the ICSEI congress in Leeuwarden, (January).
Meuret, D., & Marivain, T. (1997). Inequalities and conditions of well being in French junior secondary schools. Paper Presented at the ICSEI congress at Memphis (January).
Ministry of Education (1987) Kar61oyor:; ilIJflOCJlWV IXOAciwv leal IXOAWV ilcvrcpo/36.Bflzar:; EKTCaiOev(]'IJr:; [Catalogue of Secondary State Schools]. Athens: The Greek Ministry of Education.
Mintzberg, H. (1979) The Structuring of Organizations. Englewood Cliffs, NJ: PrenticeHall.
Miskel, c., & Ogawa, R. (1988) Work motivation, job satisfaction, and climate. In N. Boyan (Ed.), Handbook of Educational Administration: A Project of the American Educational Research Association. New York: Longman.
Mok, M. (1995) Sample size requirements for 2-level designs in educational research. Multilevel Modelling Newsletter, 7(2),11-15.
340

Monk, D. H. (1987) Secondary school size and curriculum comprehensiveness. Economics of Education Review, 6(2), 137-150.
Monk, D. H. (1989) The education production functions: its evolving role in policy analysis. Educational Evaluation and Policy Analysis, 11(1),31-45.
Monk, D. H. (1992) Microeconomics of school productions: Paper for the Economics of Education section in the International Encyclopaedia of Education.
Morgan, D., & Alwin, D. (1980) When less is more: School size and social participation. Social Psychology Quarterly, 43,241-252.
Morley, L., & Rassool, N. (1999) School Effectiveness: Fracturing the Discourse. London: Falmer Press.
Mortimore, P. (1995) Effective Schools: Current Impact and Future Potential (Inaugural Lecture). London: Institute of Education.
Mortimore, P., & Sammons, P. (1997) Endpiece: A welcome and a riposte to critics. In J. White & M. Barber (Eds.), Perspectives on School Effectiveness and School Improvement. London: Institute of Education.
Mortimore, P., Sammons, P., Stoll, L., Lewis, D., & Ecob, R. (1988) School Matters: The Junior Years. Somerset: Open Books.
Nevo, D. (1994) Combining internal and external evaluation: A case for school-based evaluation. Studies in Educational Evaluation, 20, 87-98.
Newmann, F., Rutter, R., & Smith, M. (1989) Organizational factors that affect school sense of efficacy, community, and expectations. Sociology of Education, 62, 221-238.
Nunnally, J. O. (1978) Psychometric Theory. New York: Mc Graw-Hill.
Nuttal, D. (1992) The functions and limitations of international education indicators. In OECD (Ed.), The OECD International Indicators: A Frameworkfor Analysis (pp. 13-21). Paris: OECD, Center for Educational Research and Innovation.
0' Donoghue, C., Thomas, S., Goldstein, H., & Knight, T. (1997) DjEE Study of Value Addedfor 16-18 Year Olds in England. London: HMSO.
OECD (1989) Schools and Quality: An International Report. Paris.
OECD (1991) The Effectiveness of Schooling and of Educational Resource Management. Paris.
OECD (1992) High-Quality Education and Trainingfor All. Paris
OECD (1994) Making Education Count: Developing and Using International Indicators. Paris: OECD/CERI.
OECD (1997) Reviews of National Policies for Education: Greece. Paris.
OECD (1999) Education at a Glance: OECD indictors. Paris.
OECD (2001) Education at a Glance: OECD indictors. Paris.
OECD-CERI (1995a) Les Processus de Decision dans Quatorze Systemes Educatifs de I' OCDE. Paris.
OECD-CERI (1995b) Schools Under Scrutiny. Paris.
OECD (2001) Knowledge and Skills for Life: First Results from PISA 2000. Paris.
OECD-CERI (2001) Education Policy Analysis 2001. Paris.
341
OFSTED (1994) Assessing Effectiveness: Summary of a research study on developing measures to put school performance in context. London: Institute of Education.
OLME (1981) IlpaKTlKa rov Ilpwrov EKJraz&vTlKov J;vvcJpiov [Proceedings of the First Educational Congress]. Athens.
OLME (1982a) I1pUK'ttKU L8VtK1l~ LDVEA£DO"l1~ [proceedings of the General Assembly]. DLME's News Bulletin, 545.
OLME (1982b) IlpaKTlKa rov L1cVrcpov IlazJaywYlKov J;vvcJpiov [Proceedings of the Second Educational Congress}. Athens.
OLME (1985) E1rtO"'tOAij 7rpO~ 'tOY Y7rODPYO I1atOciu~ [Letter to the Minister of Education]. DLME News Bulletin, 580, 4.
OLME (1995) H U~tOAoYllO"l1 'tcov llu8Y]'tCov [students' assessment]. DLME News Bulletin, 644.
OLME (1997) H U~tOAoYllO"l1 'tOD 8K7rat08D'ttKOU EPYOD [the evaluation of educational work]. DLME News Bulletin 654, 12-15.
OLME (1998) I1PO'tU0"8tC; ym 'tY]v u~tOA6Y110"11 'tOD 8K7ratbcu'ttKOU EPyOD [Proposals for the evaluation of educational work]. DLME News Bulletin, (656), 17-21.
Page, R. (1990) High school size as a factor in adolescent loneliness. The High School Journal, 73(3), 150-153.
Papagianidis, A., & Mpaskozos, J. (2001, May 19). Mij7rco~ 'to KPU'tO~ PAU7r't8t O"opupu 'tY]V 7ratbciu; [Does state seriously damages education?] Economicos Tahidromos, 20, 15-21.
Papamathaiou, M. (1999, September 19) OtKOYEV8t8~ 0"'tU OptU 'tY]C; ... xp8COK07riu~ [families in the brink of ... bankruptcy]. To Vima, p. A6.
Papanoutsos, E. (1965) AywvcC;; Kaz Aywvia yla T'7V Ilaz&ia [Stragles and Anxieties for Education}. Athens: Icarus.
Papanoutsos, E. (1982) Dl L1POJlOl T'7C;; Zw~C;; [Ways of Life]. Athens: Filipoti.
Paty, D. (1980). Douze Colleges en France. Paris: La documentation franyaise.
Pedagogical Institute. (1999) EClWTcPIK~ At;lOAoy'7Cl'7 Kaz IlpoypaJlJlaTIClJl0C;; rov EKJraz&VTIKOV 'Epyov CJT'7 J;xoAIK~ MovaJa [Internal Evaluation and Planning of the Educational Work in Schools}. Athens: Pedagogical Institute, Department of Evaluation.
Phi Delta Kappa. (1980) Why Do Some Urban Schools Succeed? Bloomington, Indiana: Phi Delta Kappa.
Pittman, R., & Haughwout, P. (1987) Influence of high school size on dropout rate. Educational Evaluation and Policy Analysis, 9(4),337-343.
Plowden Commitee. (1967) Children and their Primary Schools. London: HMSO.
Power, M. J. (1967) Delinquent schools. New Society, 10,542-543.
Power, S., & Whitty, G. (1999) Market Forces and School Cultures. In J. Prosser (Ed.), School Culture (pp. 15-29). London: Paul Chapman.
Preece, P. (1989) Pitfalls in research on school and teacher effectiveness. Research Papers in Education, 4(3),47-69.
Preede, M. (Ed.). (1993) Managing the Effective School. London: Open University Press.
342
Pring, R (1995) Educating persons: Putting education back into educational research. Scottish Educational Review, 27(2), 101-112.
Pring, R (2000) Philosophy of Educational Research. London and New York: Continuum.
Purkey, S., & Smith, M. (1983) Effective schools: a review. The Elementary School Journal, 83(4),427-452.
Rae, K. (1997) 'Ano te Hutinga 0 te Harakeke' (The plucking still ofthe flaxbush). In T. Townsent (Ed.), Restructuring and Quality: Issues for Tomorrow's Schools. London: Routledge.
Ralf, J., & Fennessey, J. (1983) Science or reform: Some questions about the effective schools model. Phi Delta Kappa, 64( 1 0), 689-694.
Rasbash, J., & Goldstein, H. (1994) Efficient analysis of mixed hierarchical and crossclassified random structures using a multilevel model. Journal of Educational and Behavioral Statistics, 19(4),337-350.
Raudenbush, S., & Bryk, A. (1986) A hierarchical model for studying school effects. Sociology of Education, 59, 1-17.
Raudenbush, S., Rowan, B., & Jin Kang, S. (1991) A multilevel, multivariate model for studying school climate with estimation via the EM algorithm and application to U.S. High School data. Journal of Educational Statistics, 16(4), 295-330.
Raudenbush, S. W., & Bryk, A. S. (1985) Empirical Bayes meta-analysis. Journal of Educational Statistics, 10, 75-98.
Raudenbush, S. W., & Willms, D. J. (Eds.). (1991) Schools, Classrooms and Pupils. London: Academic Press, Inc.
Reezigt, G. (1993) Effecten van Differentiate op de Basisschool [Effects of grouping in primary education}. RION, Groningen.
Reezigt, G., Guldemond, H., & Creemers, B. (1999) Empirical Validity for a comprehensive model on educational effectiveness. School Effectiveness and School Improvement, 10(2), 193-216.
Reynolds, D. (1996) Turning around ineffective schools: Some evidence and some speculations. In J. Gray, D. Reynolds, C. Fitz-Gibbon, & D. Jesson (Eds.), Merging Traditions: The Future of Research on School Effectiveness and School Improvement. London: Cassell.
Reynolds, D., Bollen, R, Creemers, B., Hopkins, D., Stoll, L., & LageIWeij, N. (Eds.). (1996a) Making Good Schools: Linking School Effectiveness and School Improvement. London: Routledge.
Reynolds, D., Creemers, B., & Peters, T. (1989) School Effectiveness and School Improvement: Proceedings of the first Congress. Cardiff: School of Education, University of Cardiff and RION Institute for Educational Research.
Reynolds, D., Creemers, B. P. M., Nesselrodt, P. S., Schaffer, E. c., Stringfield, S., & Teddlie, S. (Eds.). (1994) Advances in School Effectiveness Research and Practice. Oxford: Elsevier Science.
Reynolds, D., & Farrell, S. (1996) Worlds Apart? A review of International Surveys of Educational Achievement Involving England. OFSTED review of Research. London: HMSO.
343

Reynolds, D., Sammons, P., Stoll, L., Barber, M., & Hillman, 1. (1996b) School Effectiveness and School Improvement in the United Kingdom. School Effectiveness and School Improvement, 7(2), 133-158.
Reynolds, D., & Teddlie, C. (2000a) The processes of school effectiveness. In C. Tedlie & D. Reynolds (Eds.), The International Handbook of School Effectiveness Research (pp. 134-159). London and New York: Palmer Press.
Reynolds, D., & Teddlie, C. (2000b). Reflections on the critics, and beyond them. Paper presented at the Annual Meeting of the American Educational Research Association. New Orleans (April).
Reynolds, D., Teddlie, c., Creemers, B., Scheerens, 1., & Townsend, T. (2000) An introduction to school effectiveness research. In C. Teddlie & D. Reynolds (Eds.), The International Handbook of School Effectiveness Research. London: Palmer Press.
Robertson, P., & Sammons, P. (1997) Improving School Effectiveness: A Project in Progress (Mimeograph). London: Institute of Education.
Ros, A. (1994) Samenwerking Tussen Leerlingen en EffectiefOnderwijs: De Invloed van de Leerkracht [Collaboration Between Students and Effective Education]. RION, Groningen.
Rosenholds, S. (1989) Teachers Workplace: The Social Organisation of Schools. New York: Longman.
Rosenholtz, S., & Simpson, C. (1990) Workplace conditions and the rise and fall of teachers' commitment. Sociology of Education, 63, 241-257.
Rowe, K. (1989) The commensurability of the General Linear Model in the context of Educational and Psychological Research. Australian Journal of Education, 33(1), 41-52.
Rowe, K. (1991) Students, Parents, Teachers and Schools Make a Difference: A Summary Report of Major Findings from the 100 Schools Project - Literacy Programs Study. Melbourne: School Programs Division, Ministry of Education.
Rowe, K., Hill, P., & Holmes-Smith, P. (1994). Assessing, recording and reporting students, educational progress: the case for profiles. Paper presented at the Annual Conference of the Australian Association for Research in Education. Newcastle, New South Wales (November - December).
Rowe, K. J., & Hill, P. W. (1997) Simultaneous estimation of multilevel structure equations to model students' educational progress. Paper presented at the Tenth International Congress for School Effectiveness and Improvement. Memphis, Tennessee (January).
Russell, N., & Willinsky, 1. (1997) Pourth generation educational evaluation: The impact of a post-modem paradigm. Studies in Educational Evaluation, 23(3), 187-199.
Rutter, M., Maughan, B., Mortimore, P., & Ouston, 1. (1979) Fifteen Thousand Hours: Secondary Schools and Their Effects on Children. Somerset: Open Books Ltd.
Sacre, A. (1997) Une approche du role de la direction dans l' efficalite des colleges. Education et Formations, 49, Men-Direction de l' Evaluation et de la Prospective.
Sammons, P. (1996) Complexities in the judgement of school effectiveness. Educational Research and Evaluation, 2(2), 113-149.
344
Sammons, P., Hillman, J., & Mortimore, P. (1995a) Key Characteristics of Effective Schools: A Review of School Effectiveness Research. London: Institute of Education.
Sammons, P., Nuttall, D., & Cuttance, P. (1993a) Differential school effectiveness: Results from a reanalysis of the Inner London Education Authority's Junior School Project data. British Educational Research Journal, 19,381-405.
Sammons, P., Nuttall, D., Cuttance, P., & Thomas, S. (1995b) Continuity of school effects: A longitudinal analysis of primary and secondary school effects on GCSE performance. School Effectiveness and School Improvement, 6(4),285-307.
Sammons, P., & Reynolds, D. (1997) A partisan evaluation - John Elliot on school effectiveness. Cambridge Journal of Education, 27(1), 123-136.
Sammons, P., Thomas, S., & Mortimore, P. (1993b) Do Schools Perform Consistently Across Outcomes and Areas? London: Institute of Education.
Sammons, P., Thomas, S., & Mortimore, P. (1995c). Accountingfor Variations in Academic Effectiveness Between Schools and Departments. Bath: ECER
Sammons, P., Thomas, S., & Mortimore, P. (1996) Differential school effectiveness: Department variations in GCSE attainment. Paper presented at the Annual Conference of the AmericanEducational Research Association. New York.
Sammons, P., Thomas, S., & Mortimore, P. (1997) Forging Links: Effective Schools and Effective Departments. London: Paul Chapman.
Samouilidi, M. (1995) Evaluation of the Organisational Effectiveness of the Integrated Multifarious Lyceum Greece: A Process Approach. Unpublished Ph.D. dissertation, University of Hull.
Sarason, S. (1981) The Culture of School and the Problem of Educational Change. Allyn & Bacon.
Saunders, L. (1999) A brief history of educational 'value added': How did we get to where we are? School Effectiveness and School Improvement, 10(2), 233-256.
Scheerens, J. (1990) Process indicators of school functioning. School Effectiveness and School Improvement, 1(1),61-80.
Scheerens, 1., & Bosker, R (1997) The Foundations of Educational Effectiveness. London: Pergamon.
Scheerens, J., Bosker, R, & Creemers, B. (2001) Time for self-criticism: On the viability of School Effectiveness Research. School Effectiveness and School Improvement, 12(1),131-157.
Scheerens, J., Vermeulen, C. J., & Pelgrum, W. J. (1989) Generalizibilityofinstructional and school effectiveness indicators across nations. International Journal of Educational Research, 13, 789-799.
Schoggen, P., & Schoggen, M. (1988) Student voluntary participation and high school size. Journal of Educational Research, 81(5),288-293.
Scott, D. (1997) The missing hermeneutical dimension in mathematical modelling of school effectiveness. In 1. White & M. Barber (Eds.), Perspectives on School Effectiveness and School Improvement (pp. 161-174). London: Institute of Education.
Scriven, M. (1994) Evaluation as a discipline. Studies in Educational Evaluation, 20(1), 147-166.
345
Seashore, L. K. (1998) Effects ofteacher quality of work life in secondary schools on commitment and sense of efficacy. School Effectiveness and School Improvement, 9(1), 1-27.
Seashore, L. K., & Smith, B. A. (1991) Restructuring, teacher engagement and school culture: Perspectives on school reform and the improvement of teacher's work. School Effectiveness and School Improvement, 2(1),34-52.
Sebba, J., Clarke, J., & Emery, B. (1996) Enhancing School Improvement Through Inspection in Special Schools: Report of the Project on Post-Inspection Action Planning and School Improvement Following Inspection in Special Schools. London: OFSTED, HMSO.
Sederberg, C., & Clark, S. (1990) Motivation and organizational incentives for high vitality teachers: a qualitative perspective. Journal of Research and Development in Education, 24(1),6-14.
Shavelson, R, McDonnel, L., Oakes, J., & Carey, N. (1989) Indicator Systems for Monitoring Mathematics and Science Education. Santa Monica, CA: RAND Corporation.
Shipman, M. (1990) In Search of Learning: A new Approach to School Management. Oxford: Blackwell.
Silver, H. (1994) Good Schools, Effective Schools: Judgements and Their Histories. London: Cassell.
Slavin, R (1996) Success for All. Lisse: Swets & Zeitlinger.
Slee, R, & Weiner, G. (1998) Introduction: School Effectiveness for Whom? In R Slee, G. Weiner, & S. Tomlinson (Eds.), School Effectiveness for Whom? London: Falmer Press.
Slee, R, Weiner, G., & Tomlinson, S. (Eds.). (1998) School Effectivenessfor Whom? Challenges to the School Effectiveness and School Improvement Movements. London: Falmer Press.
Smith, D., & Tomlinson, S. (1989) The School Effect: A Study of Multi-racial Comprehensives. London: Policy Studies Institute.
Smith, E., & Tyler, R (1942) Appraising and Recording Student Progress. New York, Harper and Row.
Smith, H. (1999, January 26) Greek tragedy. The Guardian (higher education supplement), p.l.
Snijders, T., & Bosker, R (1993) Standard errors and sample sizes for two-level research. Journal of Educational Statistics, 18(3),237-259.
Snijders, T., & Bosker, R (1999) Multilevel Analysis. London: Sage.
Somerset, A. (1996) Examinations and educational quality. In A. Little & A. Wolf (Eds.), Assessment in Transition. Oxford: Pergamon.
Stevens, S. (1946) On the theory of scales measurement. Science, 103,677-680.
Stoll, L., & Fink, D. (1996) Changing our Schools. Buckingham: Open University Press.
Stoll, L., & Myers, K. (1997) No Quick Fixes: Perspectives on Schools in Difficulty. Lewes: Falmer Press.
Stoll, L., & Riley, K. (1999) From infancy to adolescence: School effectiveness and school improvement in England since 1995. In T. Townsent, P. Clarke, & M. Ainscow
346
(Eds.), Third Millennium Schools: A World of Difference in Effectiveness and Improvement. Lisse, The Netherlands: Swets & Zeitlinger.
Stringfield, S. (1994) A model for elementary school effects. In D. Reynolds, B. P. M. Creemers, P. S. Nesselrodt, E. C. Schaffer, S. Stringfield, & S. Teddlie (Eds.), Advances in School Effectiveness Research and Practice (pp. 153-188). London: Pergamon.
Stringfield, S., & Slavin, R. (1992) A hierarchical longitudinal model for elementary school effects. In B. Creemers & G. Reezigt (Eds.), Evaluation of Effectiveness. Groningen: ICO.
Stronach, I., & MacLure, P. (1997) Educational Research Undone: The Post-Modern Embrace. London: Open University Press.
Tarter, J., Sabo, D., & Hoy, W. (1995) Middle school climate, faculty trust, and effectiveness: A path analysis. Journal of Research and Development in Education, 29(1),41-49.
Taylor, D., & Tashakkori, A. (1995) Decision participation and school climate as predictors of job satisfaction and teachers' sense of efficacy. Journal of Experimental Education, 63(3),217-230.
Teddlie, C., & Reynolds, D. (Eds.). (2000) The International Handbook of School Effectiveness Research. London: Palmer Press.
Teddlie, C., & Reynolds, D. (2001) Countering the critics: Responses to recent criticisms of School Effectiveness Research. School Effectiveness and School Improvement, 12(1),41-82.
Teddlie, C., Reynolds, D., & Pol, S. (2000a) Current topics and approaches in School Effectiveness Research: The contemporary field. In C. Teddlie & D. Reynolds (Eds.), The International Handbook of School Effectiveness Research. London: Palmer Press.
Teddlie, C., Reynolds, D., & Sammons, P. (2000b) The methodology and scientific properties of School Effectiveness Research. In C. Teddlie & D. Raynolds (Eds.), The International Handbook of School Effectiveness Research. London: Palmer Press.
Teddlie, c., & Stringfield, S. (1993) Schools Do Make a Difference: Lessons Learnedfrom a 10-year Study of School Effects. New York: Teachers College Press.
Teddlie, c., Stringfield, S., & Reynolds, D. (2000c) Context issues within School Effectiveness Research. In C. Teddlie & D. Reynolds (Eds.), The International Handbook of School Effectiveness Research (pp. 160-185). London and New York: Palmer Press.
Thomas, S., & Mortimore, P. (1996) Comparison of value-added models for secondaryschool effectiveness. Research Papers in Education, 11(1),5-33.
Thomas, S., Sammons, P., & Mortimore, P. (1994). Stability in secondary schools: Effects on students GCSE outcomes. Paper presented at the Annual Conference of the British Educational Research Association. Oxford.
Thomas, S., Sammons, P., Mortimore, P., & Smees, R. (1995a) Differential secondary school effectiveness: Examining the size, extent and consistency of school and departmental effects on GCSE outcomes for different groups of students over three years. Paper presented at the European Conference of Educational Research. University of Bath (14-17 September).
347
Thomas, S., Sammons, P., Mortimore, P., & Smees, R (1995b) Stability and Consistency in Secondary Schools' Effects on Students' GCSE Outcomes over 3 years. Paper presented at the International Congress for School Effectiveness and Improvement. Leeuwarden, The Netherlands (3-6 January)
Thomas, S., Sammons, P., Mortimore, P., & Smees, R (1997a) Stability and consistency in secondary schools' effects on students' GCSE outcomes in three years. School Effectiveness and School Improvement, 8(2), 169-197.
Thomas, S., Smees, R, & McCall, J. (1997b). Room for improvement: Analysis oflSEP primary baseline measures. Paper presented at the tenth International Congress for School Effectiveness and School Improvement. Memphis Tennessee (5-8 January).
Thrupp, M. (2001) Sociological and political concerns about School Effectiveness Research: Time for a new research agenda. School Effectiveness and School Improvement, 12(1), 7-40.
Tizard, B., Burgess, T., Francis, H., Goldstein, H., Young, M., Hewison, J., & Plewis, I. (1980) Fifteen Thousand Hours: A Discussion. London: Institute of Education.
Torrington, D., & Weightman, J. (1993) The culture and ethos ofthe school. In M. Preedy (Ed.), Managing the Effective School (pp. 44-58). London: Open University Press.
Townsend, T. (2001) Satan or saviour? An analysis of two decades of school effectiveness research. School Effectiveness and School Improvement, 12(1), 115-129.
Townsend, T., Clarke, P., & Ainscow, M. (Eds.). (1999) Third Millennium Schools: A World of Difference in Effectiveness and Improvement. London: Swets & Zeitlinger.
Townsend, T. (Ed.). (1997) Restructuring and Quality: Issuesfor Tomorrow's Schools. London: Routledge.
Triga, N. (2001, July 11) I1otot 1tupayovrcC; Ku8opiSouv 't11 ~u811oAoytKiJ c1tioOO'l1 nov llu811'tcOV O'c 'tEO'O'cpU llu8~IlU'ta [factors which define student achievement in four subjects]. To Vima, p. 18.
Triga, N., & Nivolianitis, M. (2001, December 14) Ku'taA11'1'l1 ytU 8EPllUVO'l1 Kat Ku8uptO't11'ta [take over for heating and cleanness]. Ethnos, p. 12.
Tymms, P. (1993) Accountability - Can it be fair? Oxford Review of Education, 19(3),291-299.
Tymms, P., & Williams, D. (1996) Baseline Assessment and Value-added. London: School Curriculum and Assessment Authority.
Vaizey, J., & Debeauvais, M. (1961) Economic aspects of educational development. In A. Halsey, J. Floud, & A. Anderson (Eds.), Education, Economy and Society: A Reader in the Sociology of Education (pp. 39-40). New York: Free Press of Glencoe.
Van de Grift, W. (1990) Educational leadership and academic achievement in secondary education. School Effectiveness and School Improvement, 1(1),26-40.
Van der Sijde, P. (1999) Relationships of classroom climate with learning outcomes and school climate. Journal of Classroom Interaction, 23(2),40-44.
348
Van Velzen, W. (1987) The International School Improvement Project. In D. Hopkins (Ed.), Improving the Quality of Schooling: Lessons from the OECD International School Improvement Project. Lewes: Falmer Press.
Vasilou-Papageorgiou, V. (1990) 0 POAO<; 'tcov EK1tat<>wTtKWV Evwcrccov cr'tllV EK1tat8cDTtKT] Mc'tappUSl-ucrll 'tOD 1976 [The Role of Teachers' Unions in Educational Reform of 1976}. Unpublished PhD dissertation. University of Athens, Department of Primary Education.
Verdis, A. (2001 a) A~lOAOYllcrll, cK1tat8cDTtKO €Pyo, 1tOlo'tll'ta: A1tocra<Pllvicrct<; Kat crucrXc'ticrct<; [Evaluation, educational work, quality: Clarifications and interrelations] in G. Bagakis (Ed.). A(lOAoyrw'1 ElCTrmbevT17(wV JIpoypaJlJlaTWv Km LXOAdov [Curricula and School Evaluation]. Athens: Metehmio.
Verdis, A. (2001 b) ilOAD1tapayoVTtKU Kat tcpapxtKU l.wv't€Aa ym 'tOY 1tPOcrOlOptcrJ.lO Kat 'tllV a~lOAoYllcrll 'tOD cK1tatOcD'ttKOU €PYOD [hierarchical multivariate models for the specification and evaluation of educational work] in G. Bagakis (Ed.). A(lOAOY'1(J'1 EKTrmbeVTlKWV JIpoypaJlJlaTWv Kaz LXOAdov [Curricula and School Evaluation]. Athens: Metehmio.
Vedder, P. (1992) Measuring the Quality of Education. Amsterdam: Swets & Zeitlinger.
Walberg, H. J. (Ed.). (1993) Analytic Methodsfor Educational Productivity. (Vol. 3). London: JAI Press.
Waldrop, M. M. (1992) Complexity: The Emerging Science on the Edge of Order and Chaos. London: Viking.
Walford, G. (1996) School choice and the quasi-market. In G. Wallford (Ed.), School Choise and the Quasi-Market (Vol. 6, pp. 7-16). Wallingford: Triangle.
Webber, C. (1989) The Mandarin mentality: Civil service and university admissions testing in Europe and Asia. In R. Gifford (Ed.), Test Policy and the Politics of Opportunity Allocation: The Workplace and the Law (pp. 33-60). Dordrecht: Kluwer.
Weber, G. (1971) Inner School Children Can Be Taught to Read: Four Successful Schools. Washington, DC: Council for Basic Education.
Webster, W. (1995) The connection between personnel evaluation and school evaluation. Studies in Educational Evaluation, 21(2),227-254.
West, A., & Pennell, H. (2000) Publishing school examination results in England: incentives and consequences. Educational Studies, 26(4),423-436.
West, A., & Varlaam, A. (1990) Does it matter when children start school? Educational Research, 32(3),210-217.
Whitty, G., Power, S., & Halpin, D. (1998) Devolution and Choice in Education. Buckingham: Open University Press.
Wilbrink, B. (1997) Assessment in historical perspective. Studies in Educational Evaluation, 23(1), 31-48.
Willems, E. (1967) Sense of obligation to high school activities as related to school size and marginality of students. Child Development, 38, 1247-1260.
Willmott, R. (1999) School Effectiveness Research: An ideological commitment? Journal of Philosophy of Education, 33(2),253-268.
Willms, D. J. (1992) Monitoring School Performance: A Guidefor Educators. London: Falmer Press.
349

Willms, J., & Raudenbush, S. (1989) A longitudinal hierarchical linear model for estimating school effects and their stability. Journal of Educational Measurement, 26(3), 209-232.
Witcher, A. (1993) Assessing School Climate: An Important Step for Enhancing School Quality. NASSP.
350
7. ApPENDIXES
351
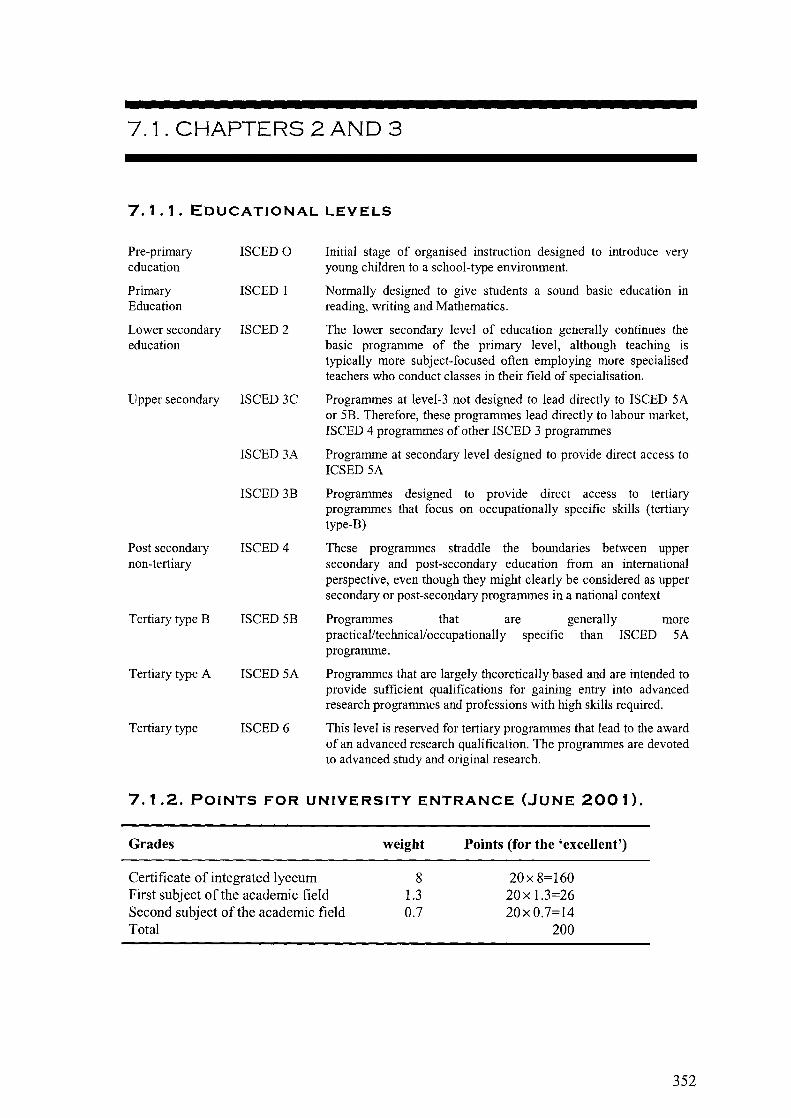
7.1. CHAPTERS 2 AND 3
7.1.1. EDUCATIONAL LEVELS
Pre-primary ISCED 0 education
Primary ISCED I Education
Lower secondary ISCED 2 education
Upper secondary ISCED 3C
Post secondary non-tertiary
Tertiary type B
Tertiary type A
Tertiary type
ISCED 3A
ISCED 3B
ISCED 4
ISCED 5B
ISCED 5A
ISCED 6
Initial stage of organised instruction designed to introduce very young children to a school-type environment.
Normally designed to give students a sound basic education in reading, writing and Mathematics.
The lower secondary level of education generally continues the basic programme of the primary level, although teaching is typically more subject-focused often employing more specialised teachers who conduct classes in their field of specialisation.
Programmes at level-3 not designed to lead directly to ISCED 5A or 5B. Therefore, these programmes lead directly to labour market, ISCED 4 programmes of other ISCED 3 programmes
Programme at secondary level designed to provide direct access to ICSED 5A
Programmes designed to provide direct access to tertiary programmes that focus on occupationally specific skills (tertiary type-B)
These programmes straddle the boundaries between upper secondary and post-secondary education from an international perspective, even though they might clearly be considered as upper secondary or post-secondary programmes in a national context
Programmes that are generally more practical/technical/occupationally specific than ISCED 5A programme.
Programmes that are largely theoretically based and are intended to provide sufficient qualifications for gaining entry into advanced research programmes and professions with high skills required.
This level is reserved for tertiary programmes that lead to the award of an advanced research qualification. The programmes are devoted to advanced study and original research.
7.1.2. POINTS FOR UNIVERSITY ENTRANCE (JUNE 2001).
Grades
Certificate of integrated lyceum First subject of the academic field Second subject of the academic field Total
weight
8 1.3 0.7
Points (for the 'excellent')
20x 8=160 20x 1.3=26 20xO.7=14
200
352
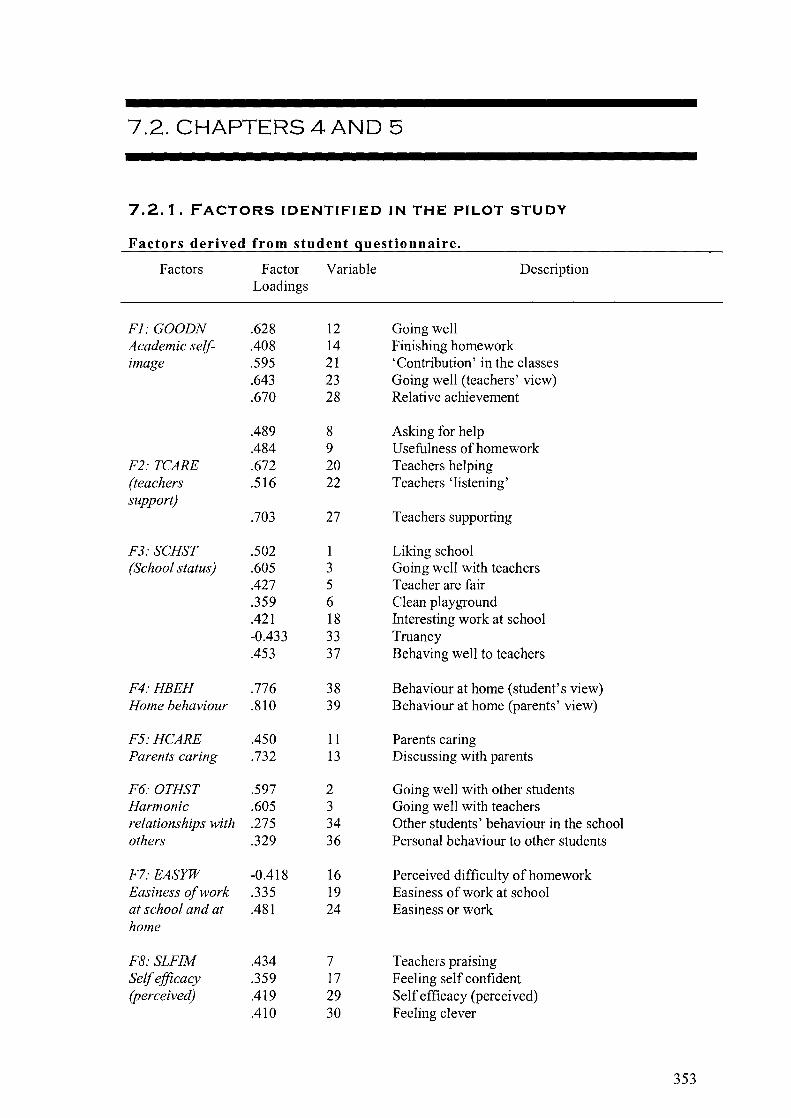
7.2. CHAPTERS 4 AND 5
7.2.1. FACTORS IDENTIFIED IN THE PILOT STUDY
Factors derived from student questionnaire.
Factors Factor Variable Description Loadings
FJ: GOODN .628 12 Going well Academic self- .408 14 Finishing homework image .595 21 'Contribution' in the classes
.643 23 Going well (teachers' view)
.670 28 Relative achievement
.489 8 Asking for help
.484 9 Usefulness of homework F2: TCARE .672 20 Teachers helping (teachers .516 22 Teachers 'listening' support)
.703 27 Teachers supporting
F3: SCHST .502 1 Liking school (School status) .605 3 Going well with teachers
.427 5 Teacher are fair
.359 6 Clean playground
.421 18 Interesting work at school -0.433 33 Truancy .453 37 Behaving well to teachers
F4: HBEH .776 38 Behaviour at home (student's view) Home behaviour .810 39 Behaviour at home (parents' view)
F5: HCARE .450 11 Parents caring Parents caring .732 13 Discussing with parents
F6: OTHST .597 2 Going well with other students Harmonic .605 3 Going well with teachers relationships with .275 34 Other students' behaviour in the school others .329 36 Personal behaviour to other students
F7: EASYW -0.418 16 Perceived difficulty of homework Easiness of work .335 19 Easiness of work at school at school and at .481 24 Easiness or work home
F8: SLFIM .434 7 Teachers praising Self efficacy .359 17 Feeling self confident (perceived) .419 29 Self efficacy (perceived)
.410 30 Feeling clever
353
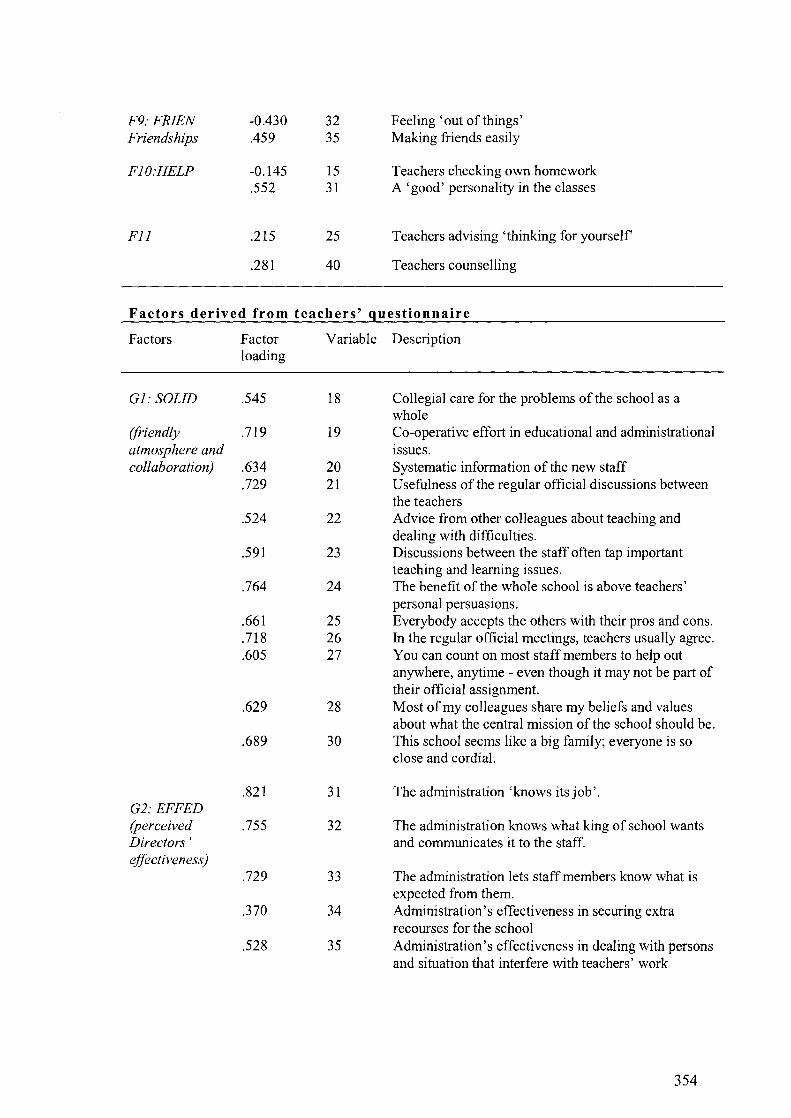
F9: FRIEN -0.430 32 Feeling 'out of things' Friendships .459 35 Making friends easily
F1O:HELP -0.145 15 Teachers checking own homework .552 31 A 'good' personality in the classes
Fll .215 25 Teachers advising 'thinking for yourself
.281 40 Teachers counselling
Factors derived from teachers' guestionnaire
Factors Factor Variable Description loading
Gl: SOLID .545 18 Collegial care for the problems of the school as a whole
(friendly .719 19 Co-operative effort in educational and administrational atmosphere and Issues. collaboration) .634 20 Systematic information of the new staff
.729 21 Usefulness of the regular official discussions between the teachers
.524 22 Advice from other colleagues about teaching and dealing with difficulties.
.591 23 Discussions between the staff often tap important teaching and learning issues.
.764 24 The benefit of the whole school is above teachers' personal persuasions.
. 661 25 Everybody accepts the others with their pros and cons .
. 718 26 In the regular official meetings, teachers usually agree .
.605 27 You can count on most staff members to help out anywhere, anytime - even though it may not be part of their official assignment.
.629 28 Most of my colleagues share my beliefs and values about what the central mission of the school should be.
.689 30 This school seems like a big family; everyone is so close and cordial.
. 821 31 The administration 'knows its job' . G2: EFFED (perceived .755 32 The administration knows what king of school wants Directors' and communicates it to the staff. effectiveness)
.729 33 The administration lets staff members know what is expected from them.
.370 34 Administration's effectiveness in securing extra recourses for the school
.528 35 Administration's effectiveness in dealing with persons and situation that interfere with teachers' work
354
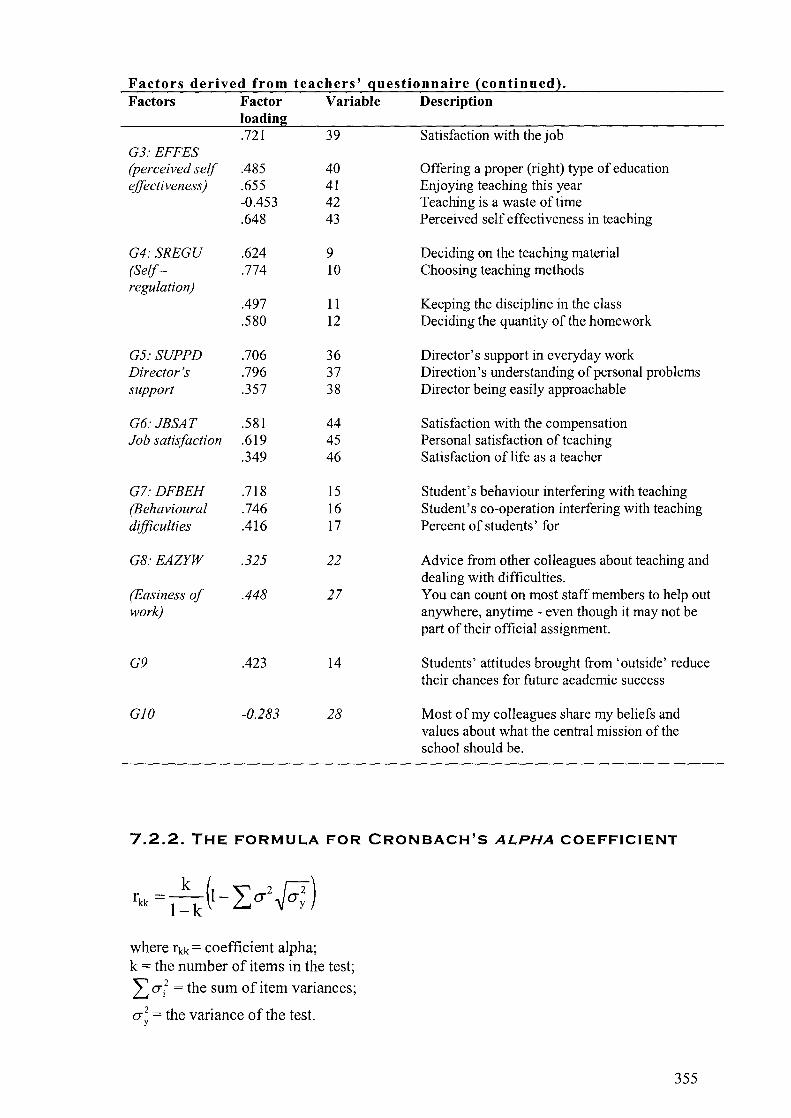
Factors derived from teachers' guestionnaire {continued}. Factors Factor Variable Description
loading .721 39 Satisfaction with the job
G3:EFFES (perceived self .485 40 Offering a proper (right) type of education effectiveness) .655 41 Enj oying teaching this year
-0.453 42 Teaching is a waste of time .648 43 Perceived self effectiveness in teaching
G4: SREGU .624 9 Deciding on the teaching material (Self- .774 10 Choosing teaching methods regulation)
.497 11 Keeping the discipline in the class
.580 12 Deciding the quantity of the homework
G5: SUPPD .706 36 Director's support in everyday work Director's .796 37 Direction's understanding of personal problems support .357 38 Director being easily approachable
G6:JBSAT .581 44 Satisfaction with the compensation Job satisfaction .619 45 Personal satisfaction of teaching
.349 46 Satisfaction of life as a teacher
G7: DFBEH .718 15 Student's behaviour interfering with teaching (Behavioural .746 16 Student's co-operation interfering with teaching difficulties .416 17 Percent of students' for
G8: EAZYW .325 22 Advice from other colleagues about teaching and dealing with difficulties.
(Easiness of .448 27 You can count on most staff members to help out work) anywhere, anytime - even though it may not be
part of their official assignment.
G9 .423 14 Students' attitudes brought from 'outside' reduce their chances for future academic success
GlO -0.283 28 Most of my colleagues share my beliefs and values about what the central mission of the school should be.
7.2.2. THE FORMULA FOR CRONBACH'S ALPHA COEFFICIENT
where rkk = coefficient alpha; k = the number of items in the test;
I (J'j2 = the sum of item variances;
(J'~ = the variance ofthe test.
355
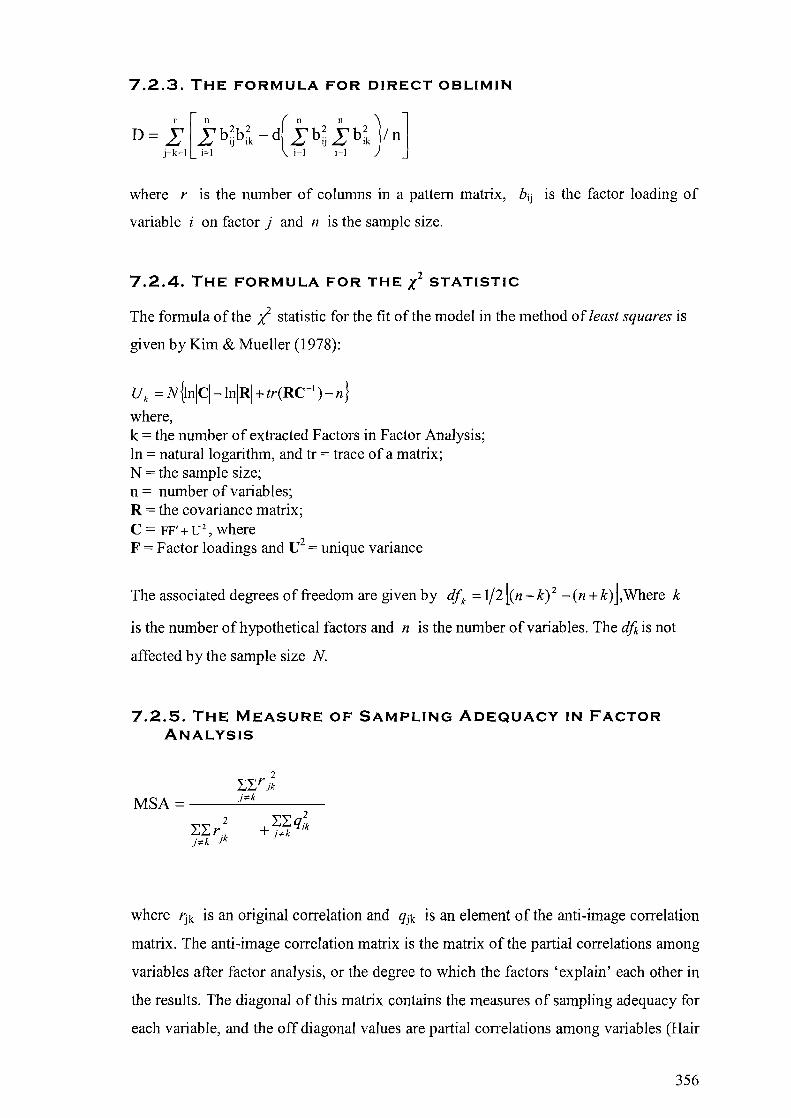
7.2.3. THE FORMULA FOR DIRECT OBLIMIN
where r is the number of columns in a pattern matrix, bij is the factor loading of
variable i on factor j and n is the sample size.
7.2.4. THE FORMULA FOR THE X2 STATISTIC
The formula ofthe i statistic for the fit of the model in the method of least squares is
given by Kim & Mueller (1978):
Uk = N {In!C!-ln!R! + tr(RC-' ) - n}
where, k = the number of extracted Factors in Factor Analysis; In = natural logarithm, and tr = trace of a matrix; N = the sample size; n = number of variables; R = the covariance matrix; C = FF' + u 2
, where F = Factor loadings and U2
= unique variance
The associated degrees of freedom are given by dfk = lj2l(n _k)2 -en +k)J,Where k
is the number of hypothetical factors and n is the number of variables. The dfkis not
affected by the sample size N.
7.2.5. THE MEASURE OF SAMPLING ADEQUACY IN FACTOR ANALYSIS
2 ~~rik
MSA = __ --".i_"'k ___ _
where rjk is an original correlation and qjk is an element of the anti-image correlation
matrix. The anti-image correlation matrix is the matrix of the partial correlations among
variables after factor analysis, or the degree to which the factors 'explain' each other in
the results. The diagonal of this matrix contains the measures of sampling adequacy for
each variable, and the off diagonal values are partial correlations among variables (Hair
356
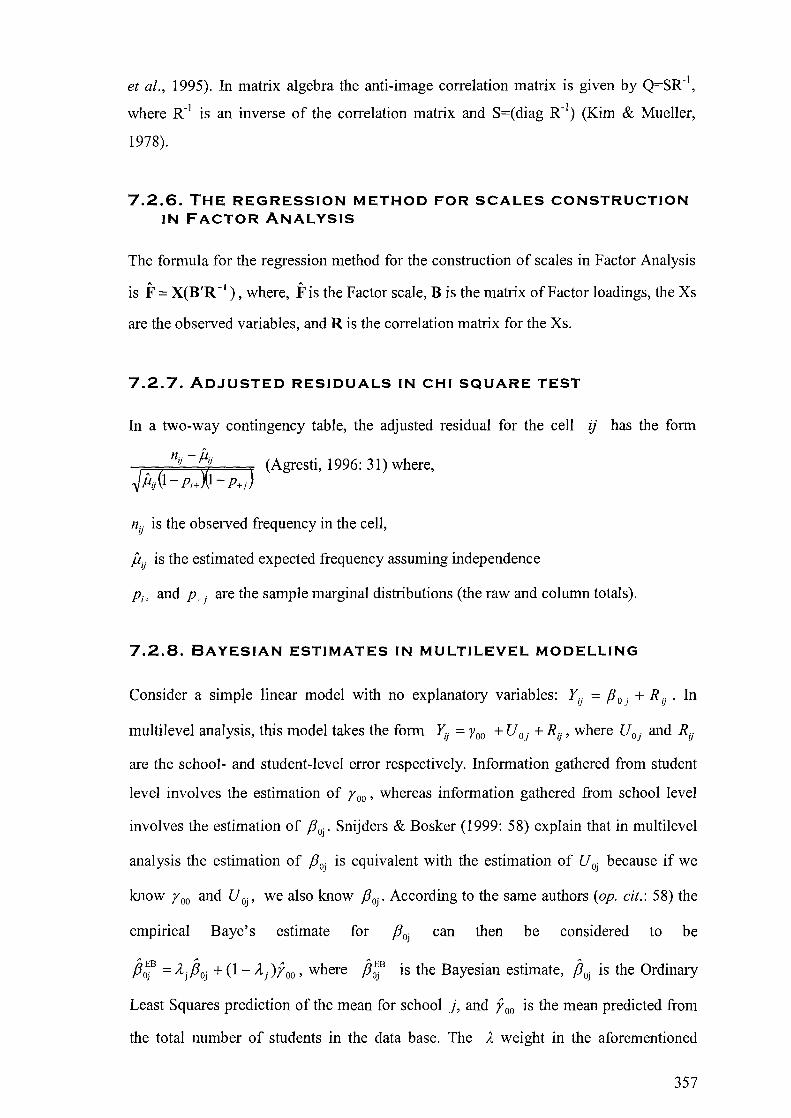
et al., 1995). In matrix algebra the anti-image correlation matrix is given by Q=SK1,
where Kl is an inverse of the correlation matrix and S=(diag Kl) (Kim & Mueller,
1978).
7.2.6. THE REGRESSION METHOD FOR SCALES CONSTRUCTION IN FACTOR ANALYSIS
The formula for the regression method for the construction of scales in Factor Analysis
is if = X(B'R -I) , where, if is the Factor scale, B is the matrix of Factor loadings, the XS
are the observed variables, and R is the correlation matrix for the Xs.
7.2.7. ADJUSTED RESIDUALS IN CHI SQUARE TEST
In a two-way contingency table, the adjusted residual for the cell ij has the form
nij is the observed frequency in the cell,
fLij is the estimated expected frequency assuming independence
Pi+ and P+ j are the sample marginal distributions (the raw and column totals).
7.2.8. BAYESIAN ESTIMATES IN MULTILEVEL MODELLING
Consider a simple linear model with no explanatory variables: Yij = fJ 0 j + R ij . In
multilevel analysis, this model takes the form ~j = yoo + UOj + Rij' where UOj and Rij
are the school- and student-level error respectively. Information gathered from student
level involves the estimation of roo' whereas information gathered from school level
involves the estimation of Poj ' Snijders & Bosker (1999: 58) explain that in multilevel
analysis the estimation of POj is equivalent with the estimation of U Oj because if we
know roo and U Oj ' we also know POj' According to the same authors (op. cit.: 58) the
empirical Baye's estimate for POj can then be considered to be
p~B = AjPOj +(I-Aj)Yoo, where p~B is the Bayesian estimate, POj is the Ordinary
Least Squares prediction of the mean for school j, and Y 00 is the mean predicted from
the total number of students in the data base. The A weight in the aforementioned
357

formula represents the reliability of the mean of school j and is given by the same
authors (op. cit.) to be A, = ;,: ,2 +(J' On.
J
~ EB Finally, the standard error of fJoj is given by Snijders & Bosker, (1999: 61) to be
358

7.3. THE QUESTIONNAIRES
7.3.1. STUDENT QUESTIONNAIRE 2000
359
Confidential Questionnaire For Lyceum Students
Directions for the completion of this questionnaire
Dear students,
This questionnaire is confidential. The information that you will provide will be extremely useful for the study of your opinions. Please take part in this study.
Most of the questions in this questionnaire ask you to circle a number in a scale. Other questions ask for a brief answer. In each case you will find guidelines in italics. For your answers use the special spaces provided.
If you need any further guidelines, ask either your teacher or me. There are no correct or incorect answers. However, if you change your mind, simply cross out the 'wrong' choice and circle the 'right' one. Please answer all the questions.
361
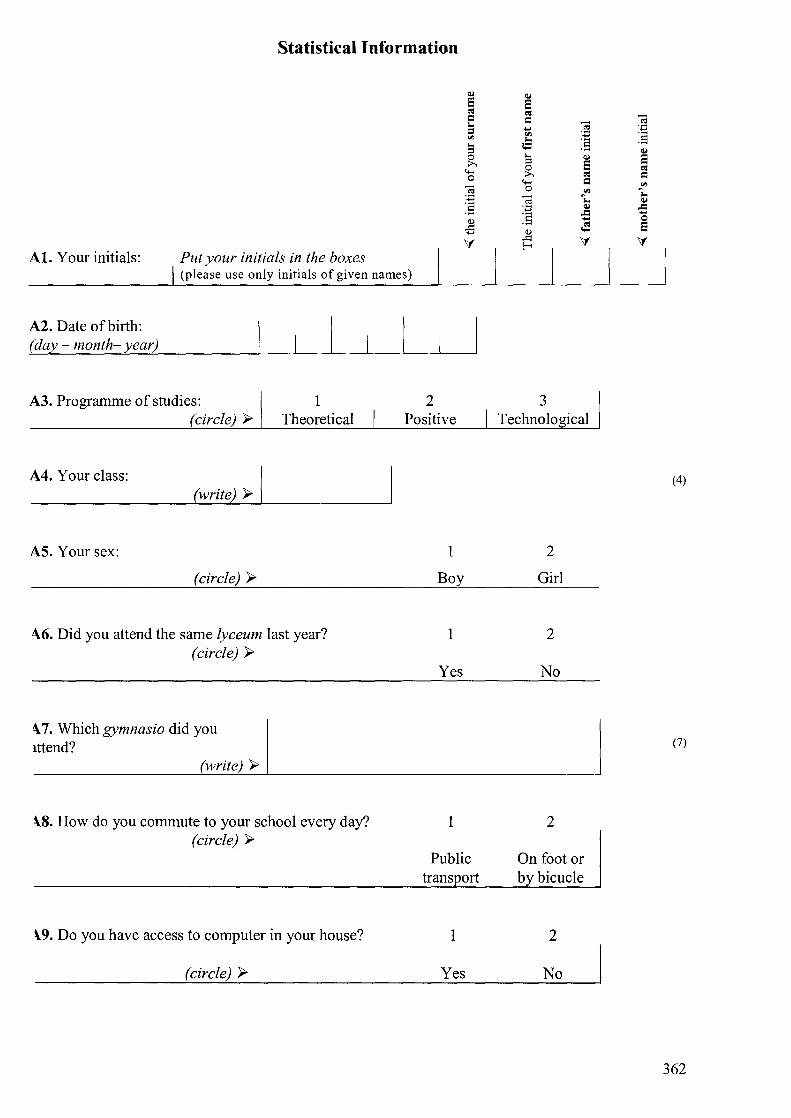
Statistical Information
AI. Your initials: Put your initials in the boxes (please use only initials of given names)
A2. Date of birth: (day - month- year)
A3. Programme of studies: (circle) ~
A4. Your class: (write) ~ I
AS. Your sex:
(circle) ~
1 Theoretical
1\6. Did you attend the same lyceum last year? (circle) ~
\. 7. Which gymnasio did you lttend?
(write) ~
\.8. How do you commute to your school every day? (circle) ~
\.9. Do you have access to computer in your house?
(circle) ~
2 Positive
1
Boy
1
Yes
I
Public trans ort
1
Yes
3 Technological
2
Girl
2
No
2
On foot or bybicucle
2
No
(4)
(7)
362
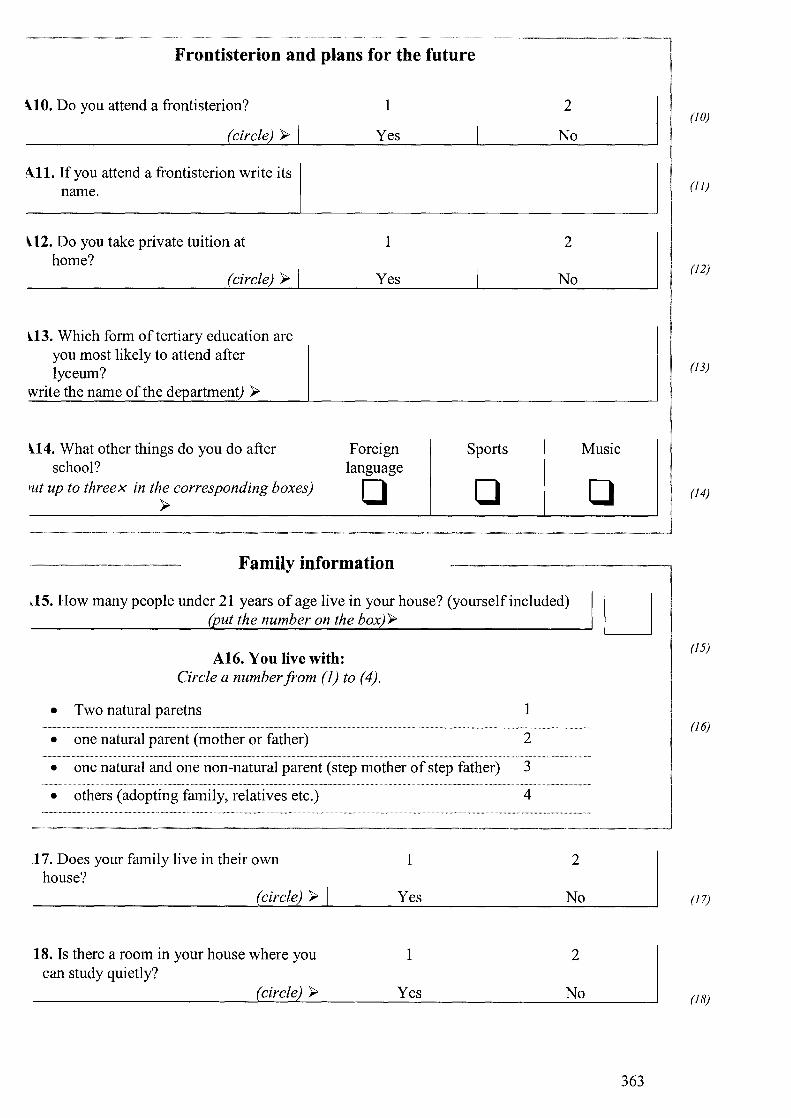
Frontisterion and plans for the future
BO. Do you attend a frontisterion?
(circle) ~
<\11. If you attend a frontisterion write its name.
\12. Do you take private tuition at home?
(circle) ~
U3. Which form of tertiary education are you most likely to attend after lyceum?
write the name of the de artment) ~
1
Yes
1
Yes
2
No
2
No
\14. What other things do you do after school?
Foreign language
Sports Music
'ut up to threex in the corresponding boxes) ~ o
Family information
o -
.15. How many people under 21 years of age live in your house? (yourself included) (put the number on the box) ~
A16. You live with: Circle a number from (1) to (4).
• Two natural paretns
• one natural parent (mother or father)
1
2
• one natural and one non-natural parent (step mother of step father) 3
• others (adopting family, relatives etc.) 4
17. Does your family live in their own house?
(circle) ~
18. Is there a room in your house where you can study quietly?
(circle) ~
1
Yes
1
Yes
2
No
2
No
0
u
363
(/0)
(1/)
(/2)
(/3)
(14)
(15)
(16)
(17)
(/8)
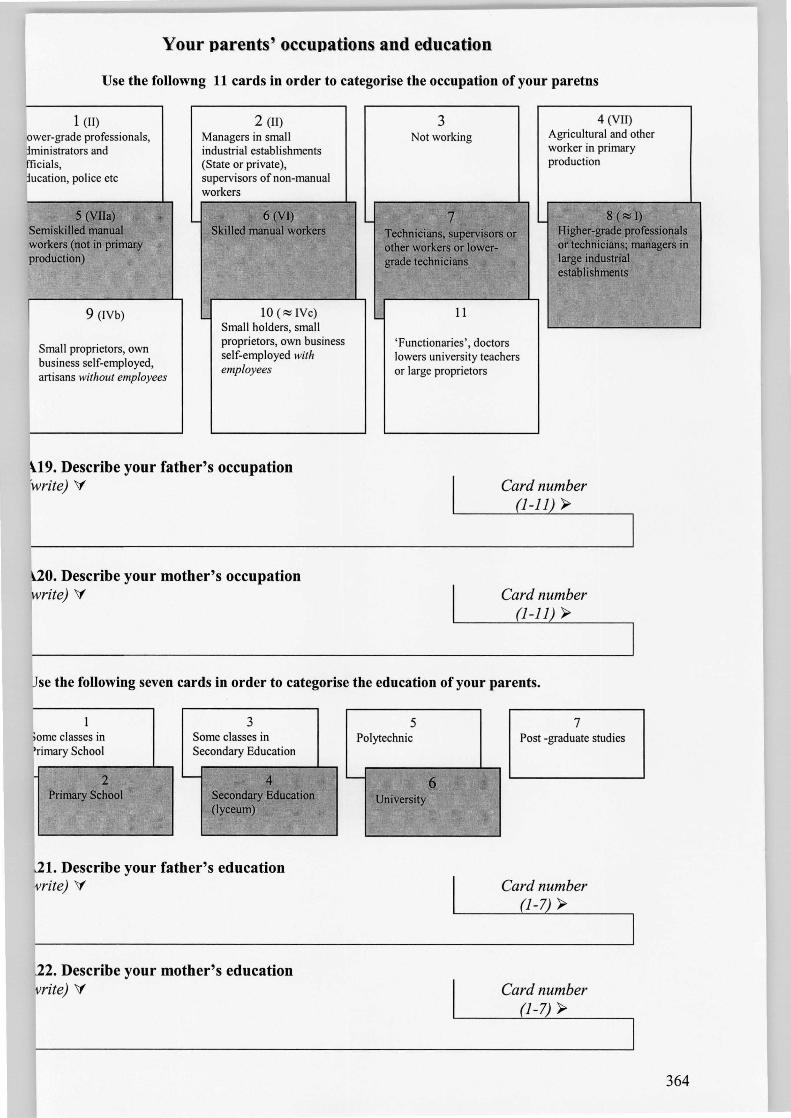
Your parents' occupations and education
Use the followng 11 cards in order to categorise the occupation of your paretns
I 1 (II)
ower-grade professionals, jministrators and fficials , jucation, police etc
5 (Vlla) Semiskilled manual workers (not in primary production)
9 (IVb)
Small proprietors, own business self-employed, artisans without employees
2 (II) Managers in small industrial establishments (State or private), supervisors of non-manual workers
6 (VI) Skilled manual workers
. lO(~IVc)
Small holders, small proprietors, own business self-employed with employees
H9. Describe your father's occupation 'write) V
,,"20. Describe your mother's occupation write) V
3 Not working
7 Technicians, supervisors or other workers or lowergrade technicians
11
' Functionaries ', doctors lowers university teachers or large proprietors
4 (VII) Agricultural and other worker in primary production
8 (~I) Higher-grade professionals or technicians; managers in large industrial establishments
Card number (1-11) ~
Card number (1-11) ~
bse the following seven cards in order to categorise the education of your parents.
t Il . lome c asses In
)rimary School
2 Primary School
3 Some classes in Secondary Education
- 4 Secondary Education (lyceum)
21. Describe your father's education rVrite) V
I 22. Describe your mother's education llrite) V
I
5 Polytechnic
University 6
7 Post -graduate studies
Card number (1-7) ~
Card number (1-7) ~
364

Your Opinion about School
:1. Do your like your school building?
1 very much
2 quite a lot
3 a little
4 not at all
2. If you could choose, would you rather change your school for another state one?
2 3 4
definitely perhaps yes perhaps no definitely not
3. If you have circled (1) or (2) in the previous question, what is the main reason why you would rather change your school? (write hereV')
4. How satisfied are you from the discipline in your school?
2 3 4 very satisfied quite satisfied enough not very satisfied not satisfied at all
5. How satisfied are you with the condition of your classroom?
2 3 4 very satisfied quite satisfied enough not very satisfied not satisfied at all
5. Are there in your school any areas or places that for some reason you avoid?
there are no such places
2 there is one such place
3 there are two or three
such places
4 there are more than
three such places
Answering space
(circle here) V'
1 234
1 234 (P2)
234 (P4)
1 234 (PS)
1 234 (P6)
365

Your Opinion About Subject Learning
:7. In how many subjects do you regard yourself as being a good student?
2 3 4 none in a few subjects in most subjects in every subject
:8. In how many subjects do you manage to be adequately prepared for the day?
2 3 4 none in a few subjects in most subjects in every subject
9. How often do you answer questions addressed to you from your teachers in the class?
all the time 2
very often 3
now and then 4
never
10. How often do you study the next day's lessons so as to be able to help your teachers during their lectures?
1 always
2 very often
3 now and then
11. Do your find teaching hours boring or interesting?
1 they are all boring
2 most of them are
boring
3 most of them are
interesting
4 never
4 they are all interesting
12. What is your estimation of the number of times you will be absent by the end of this school year?
2 3 4
Answering space
(circle here) \:f
1 234 (P7)
123 4 (P8)
1 234 (P9)
2 3 4 (PIO)
234 (P II)
234 so many that I will
learly miss the whole year
a good nmber of absences
very few absences not a single absence (PI2)
366
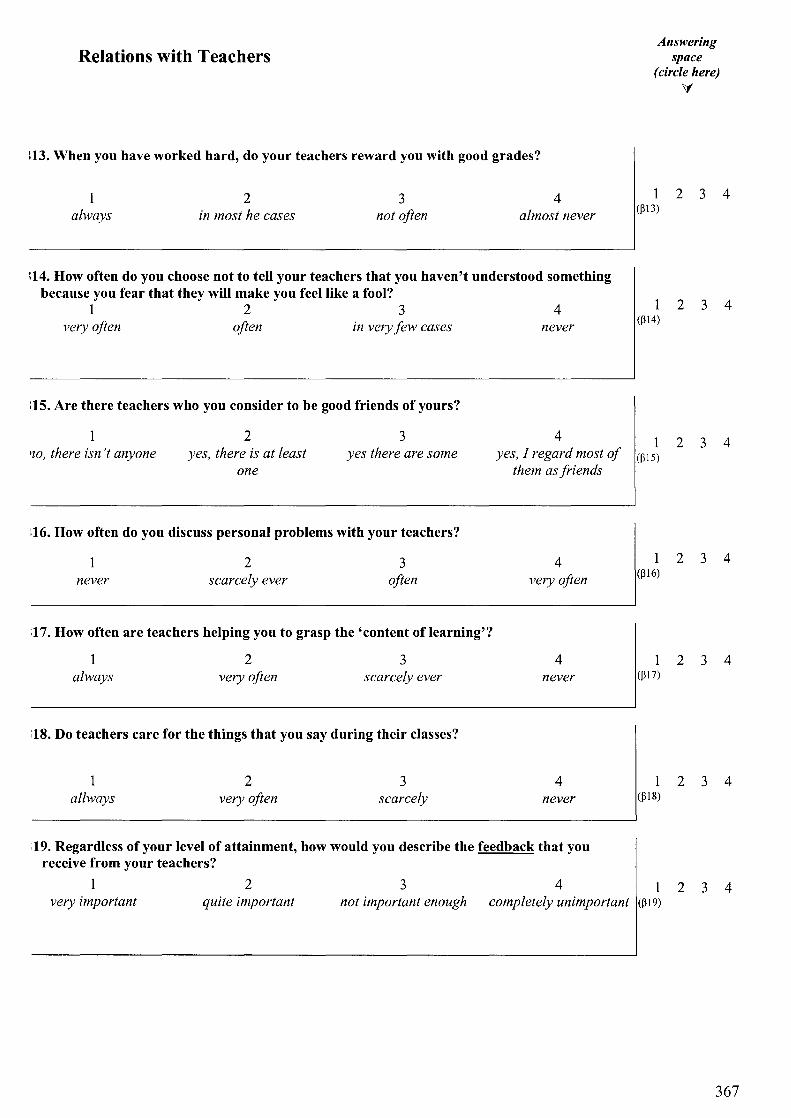
Relations with Teachers
:13. When you have worked hard, do your teachers reward you with good grades?
2 always in most he cases
3 not often
4 almost never
:14. How often do you choose not to tell your teachers that you haven't understood something because you fear that they will make you feel like a fool? 123 4
very often often in very few cases never
:15. Are there teachers who you consider to be good friends of yours?
2 3 4
Answering space
(circle here) \f
1 234 (~13)
234 (~14)
2 4 '10, there isn't anyone yes, there is at least
one yes there are some yes, I regard most of (~15)
them as friends
3
:16. How often do you discuss personal problems with your teachers?
2 3 4 2 3 4
never scarcely ever often very often (~16)
:17. How often are teachers helping you to grasp the 'content oflearning'?
1 2 3 4 1 2 3 4 always very often scarcely ever never (~17)
,18. Do teachers care for the things that you say during their classes?
1 2 3 4 1 2 3 4 allways very often scarcely never (~18)
;19. Regardless of your level of attainment, how would you describe the feedback that you receive from your teachers?
1 2 3 4 1 2 3 4 very important quite important not important enough completely unimportant (~19)
367
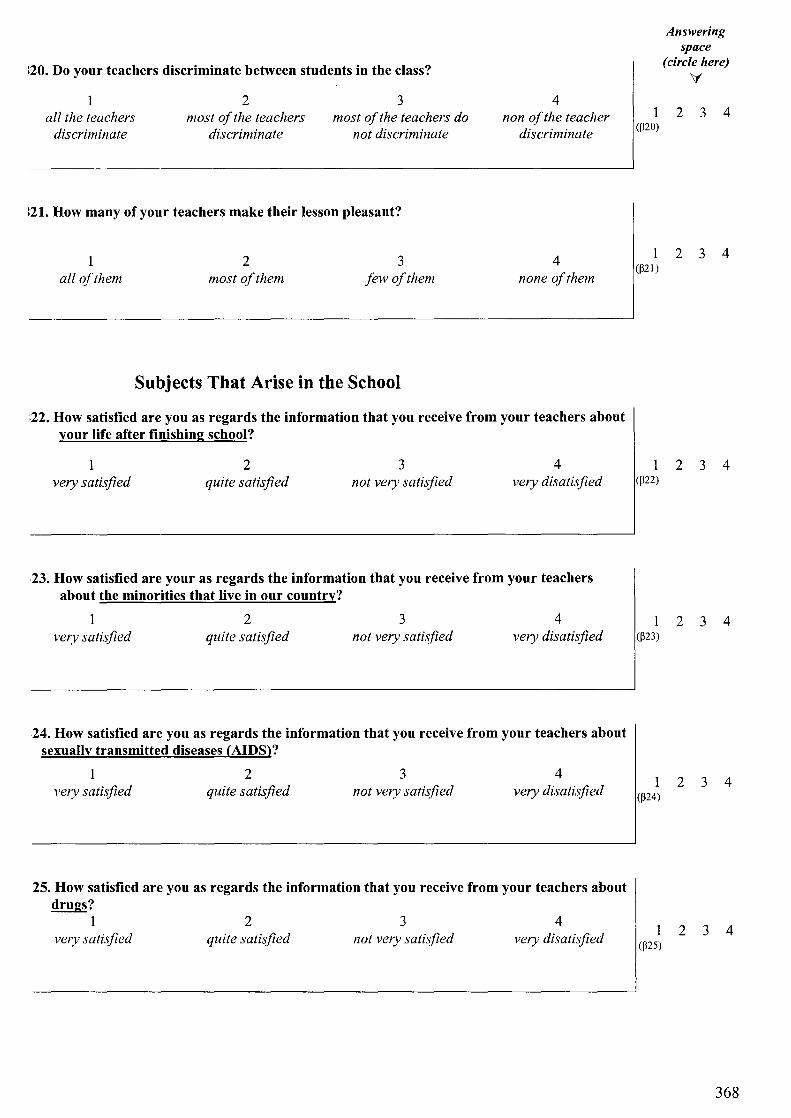
:20. Do your teachers discriminate between students in the class?
1 all the teachers
discriminate
2 most of the teachers
discriminate
3 most of the teachers do
not discriminate
:21. How many of your teachers make their lesson pleasant?
1 2 3 all of them most of them few of them
Subjects That Arise in the School
4 non of the teacher
discriminate
4 none of them
:22. How satisfied are you as regards the information that you receive from your teachers about your life after finishing school?
2 3 4 very satisfied quite satisfied not very satisfied very disatisfied
23. How satisfied are your as regards the information that you receive from your teachers about the minorities that live in our country?
2 3 4 very satisfied quite satisfied not very satisfied very disatisfied
24. How satisfied are you as regards the information that you receive from your teachers about sexually transmitted diseases (AIDS)?
2 3 4 very satisfied quite satisfied not very satisfied very disatisfied
25. How satisfied are you as regards the information that you receive from your teachers about drugs? 123 4
very satisfied quite satisfied not very satisfied very disatisfied
(1)20)
(1)21 )
(1)22)
(~23)
Answering space
(circle here) \(
234
234
234
234
1 2 3 4 (1)24)
2 3 4 (~25)
368

You and your Schoolmates
:26. How easy or difficult do you find it to ask your classmates' help, when you have difficulties in the lesson of the day? 123 4
very easy relatively easy relatively difficult
:27. How often do some of your schoolmates belittle you in public?
continually 2
often 3
occassionally
:28. How often do you belittle your schoolmates in public?
1 continualy
2 often
3 occassionaly
very difficult
4 never
4 never
:29. Would you agree or disagree with the opinion that in your school there are groups of students who shouldn't be at your school at all?
absolutely agree 2
agree 3
disagree 4
absolutely disagree
,30. How easy or difficult do you find it to make friends among your schoolmates?
very easy 2
quite easy 3
quite difficult 4
very difficult
31. How often do you try to flatter your teachers so as to achieve better grades?
continually 2
often 3
occassionally 4
never
(P26)
(P27)
(P28)
(P29)
Answering space
(circle here) \:(
2 3 4
2 3 4
2 3 4
2 3 4
1 2 3 4 (P30)
1 234 (P3 \)
369
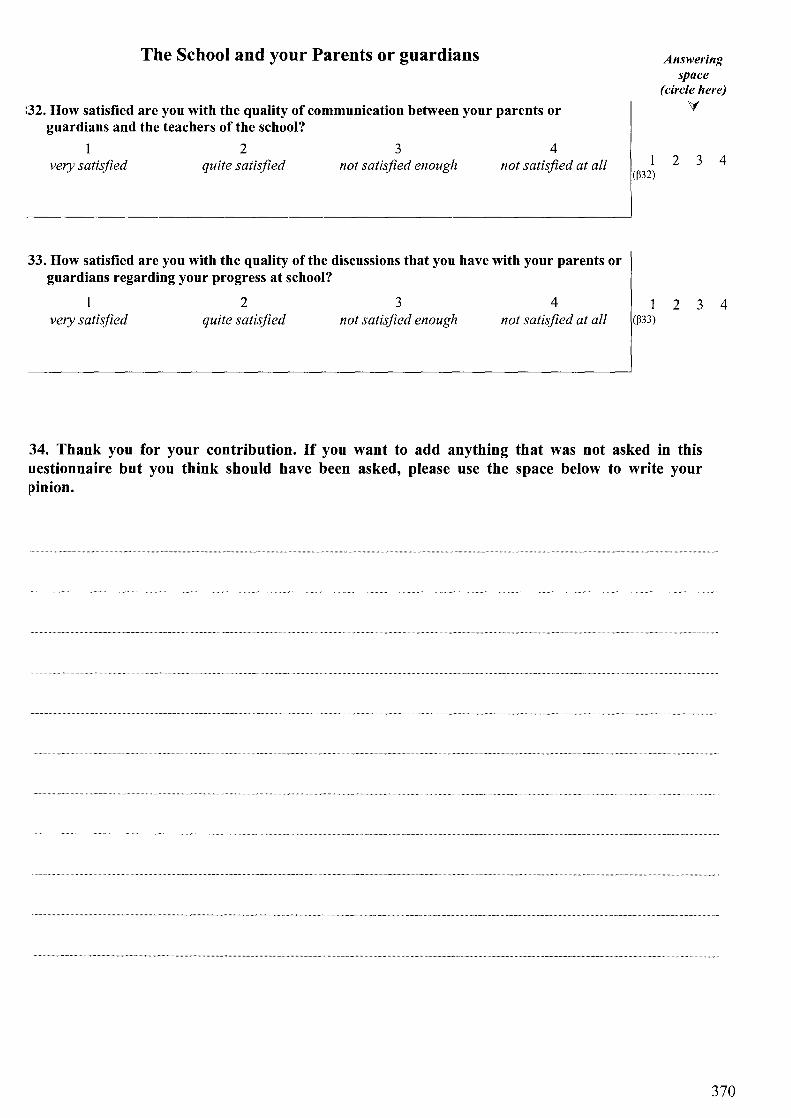
The School and your Parents or guardians
:32. How satisfied are you with the quality of communication between your parents or guardians and the teachers of the school?
123 4 very satisfied quite satisfied not satisfied enough not satisfied at all
.33. How satisfied are you with the quality of the discussions that you have with your parents or guardians regarding your progress at school?
2 3 4 very satisfied quite satisfied not satisfied enough not satisfied at all
(~32)
(~33)
Answering space
(circle here) V
2 3 4
2 3 4
34. Thank you for your contribution. If you want to add anything that was not asked in this uestionnaire but you think should have been asked, please use the space below to write your [Jinion.
370
7.3.2. TEACHER QUESTIONNAIRE 2000
371

Teacbers Confidential QuestionnaJre
Dear Colleagues,
This questionnaire is confidential and its completion a matter of your own free will. With its completion, you will be participating in an academic study that aims at the investigation of your own opinion. Personal data as well as the name of your schools will not be asked for. You can complete the questionnaire at school, during your long break. Most questions ask you to simply put a mark in a scale. Please find some time between teaching sessions to contribute to the study.
372
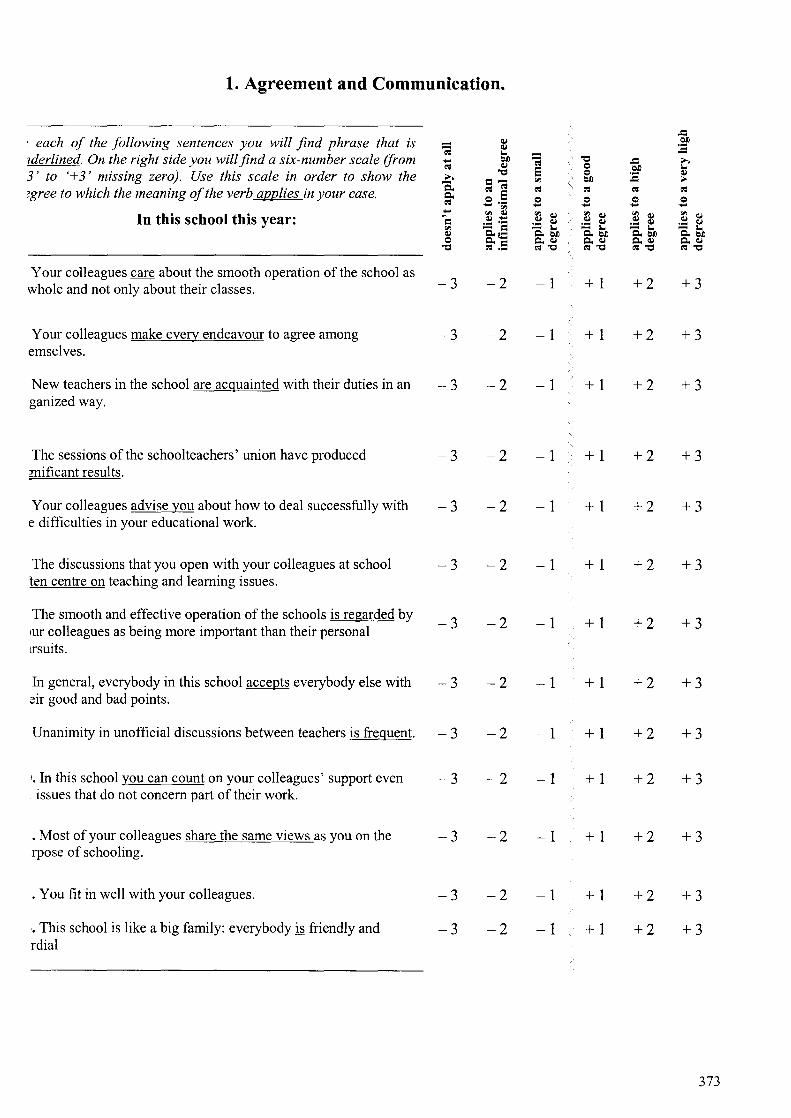
1. Agreement and Communication.
..c each of the following sentences you will find phrase that is - ~ I:)J)
-; ~ :c ~
Iderlined. On the right side you will find a six-number scale (from .... I:)J) -; -= ..c .... ~ ~
8 0 I:)J) ~
3' to '+3' missing zero}. Use this scale in order to show the ,eo -= 0 :c ~
=- '" ; I:)J) ... ~gree to which the meaning of the verb applies in your case. 0. ~ ~ ~
, ~ ~ ~
0. 0.5 0 0 0 0 ~ .... '" .... .... .... .... In this school this year:
.... '" ~ .~ t '" ~ .~ ~ .~ ~ = ~ .... .~ ~ ._ o. '" - = - J. - J. - J. - J. ~ 0.= 0.1:)J) 0.1:)J) 0.1:)J) 0.1:)J) 0 0.= o.~ o.~ o.~ o.~ -= ~ .- ~-= ~-= ~-= ~-=
Your colleagues care about the smooth operation of the school as -3 -2 -1 +1 +2 +3 whole and not only about their classes.
Your colleagues make every endeavour to agree among -3 -2 -1 + 1 +2 +3 emselves.
New teachers in the school are acquainted with their duties in an -3 -2 -1 / +1 +2 +3 ganized way.
The sessions of the schoolteachers' union have produced -3 -2 -1 +1 +2 +3 ~ificant results.
Your colleagues advise you about how to deal successfully with -3 -2 -1 + 1 +2 +3 e difficulties in your educational work.
The discussions that you open with your colleagues at school -3 -2 -1 + 1 +2 +3 ten centre on teaching and learning issues.
The smooth and effective operation of the schools is regarded by -3 -2 -1 + 1 +2 +3 lur colleagues as being more important than their personal
lrsuits.
In general, everybody in this school accepts everybody else with -3 -2 -1 + 1 +2 +3 eir good and bad points.
Unanimity in unofficial discussions between teachers is frequent. -3 -2 -1 +1 +2 +3
I, In this school you can count on your colleagues' support even -3 -2 -1 + 1 +2 +3 . issues that do not concern part of their work.
, Most of your colleagues share the same views as you on the -3 -2 -1 + 1 +2 +3 rpose of schooling.
, You fit in well with your colleagues. -3 -2 -1 +1 +2 +3
" This school is like a big family: everybody ~ friendly and -3 -2 -1 + 1 +2 +3 rdial
373
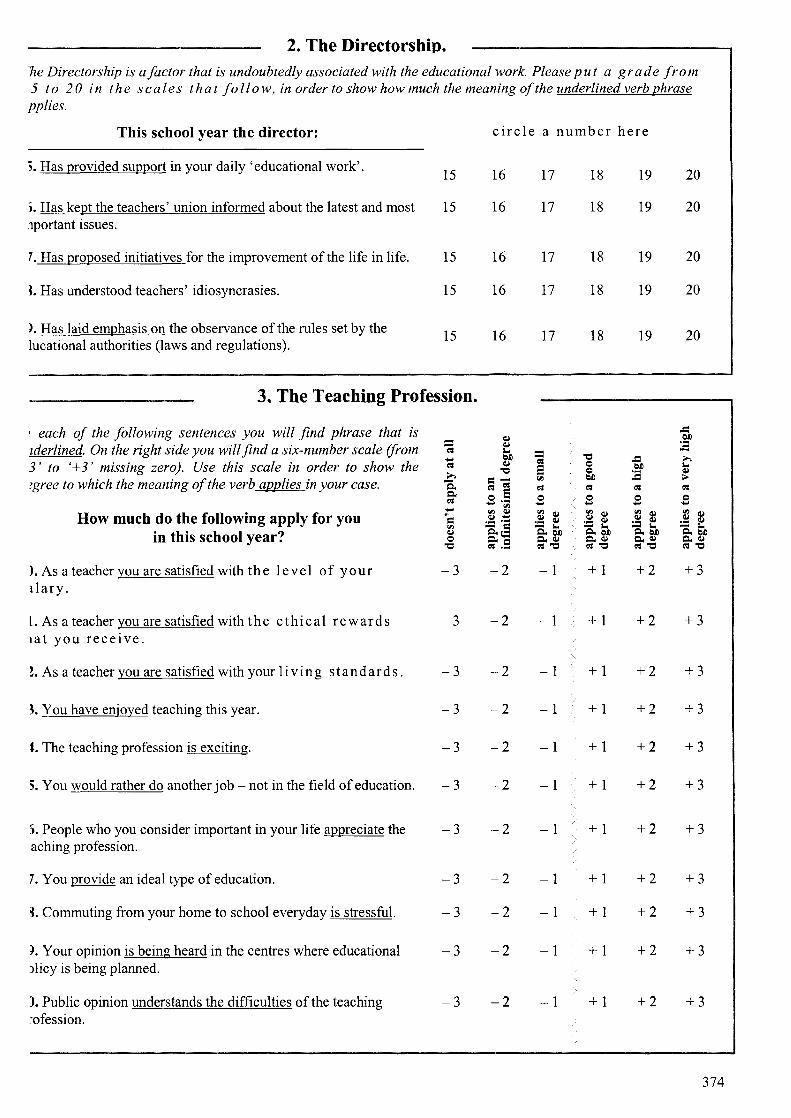
2. The Directorship. ne Directorship is afactor that is undoubtedly associated with the educational work. Please put a grade from 5 to 20 in the sea Ie s t hat follow, in order to show how much the meaning of the underlined verb phrase pplies.
This school year the director: circle a number here
5. Has provided support in your daily 'educational work'. 15 16 17 18 19 20
i. Has kept the teachers' union informed about the latest and most 15 16 17 18 19 20 1portant issues.
7. Has proposed initiatives for the improvement of the life in life. 15 16 17 18 19 20
t Has understood teachers' idiosyncrasies. 15 16 17 18 19 20
). Has laid emphasis on the observance of the rules set by the 15 16 17 18 19 20 lucational authorities (laws and regulations).
3. The Teaching Profession.
! each of the following sentences you will find phrase that is -= - aoI eJI
1derlined. On the right side you will find a six-number scale (from -; aoI :.c '"' -... eJI -; 'C -= >.
3' to '+3' missing zero). Use this scale in order to show the ~ aoI 8
Q eJI '"' >. 'C Q :.c aoI
?gree to which the meaning of the verb applies in your case. =- '" eJI .. -a ~ .§ ~ ~ ~ ~ Q.. Q Q Q Q ~ ... '" ... ... ... ...
How much do the following apply for you ...
'" aoI .~ t .~ t .~ t .~ ~ ~= aoI'" .... '" - = - '"' - '"' - '"' - '"' in this school year? aoI Q..~ Q..eJ1 Q..eJ1 Q..eJ1 Q..eJ1 Q Q..= Q..aoI Q..aoI Q..aoI Q..aoI 'C ~ ... ~'C ~'C ~'C ~'C
). As a teacher you are satisfied with the I eve I of your -3 -2 -1 +1 +2 +3 dary.
L. As a teacher you are satisfied with the ethical rewards -3 -2 -1 +1 +2 +3 lat you receive.
t As a teacher you are satisfied with your I i v i n g standards. -3 -2 -1 + 1 +2 +3
t You have enjoyed teaching this year. -3 -2 -1 +1 +2 +3
t The teaching profession is exciting. -3 -2 -1 + 1 +2 +3
;. You would rather do another job - not in the field of education. -3 -2 -1 + 1 +2 +3
). People who you consider important in your life appreciate the -3 -2 -1 +1 +2 +3 aching profession.
7. You provide an ideal type of education. -3 -2 -1 +1 +2 +3
t Commuting from your home to school everyday is stressful. -3 -2 -1 +1 +2 +3
). Your opinion is being heard in the centres where educational -3 -2 -1 + 1 +2 +3 )licy is being planned.
J. Public opinion understands the difficulties of the teaching -3 -2 -1 + 1 +2 +3 ~ofession.
374

4. Designing and carrying out the 'educational work'.
each of the following clauses you will find a verb phrase that is !derlined. On the right side you will find again a six-number scale 'om '-3' to '+3' missing out zero). Use this scale in order to show 'W difficult it is to achieve what the underlined phrase means.
How easy or difficult is it for you personally:
. To use books, exercises and teaching material that you believe are necessary for your students.
:. To choose educational methodology and teaching techniques that you believe are best for your students.
•. To keep discipline in the classroom.
~. To decide about the quantity of the homework that you should assign to your students.
each of the following clauses you will find a verb that is !derlined. On the right side you will find a six-number scale (from ~' to '+3' missing out zero). Use this scale in order to show the gree to which the meaning of the verb applies in your case.
flow much have the following applied to you during this school year?
i. The students easily learn the things that you are trying to teach.
'. Your students' attitudes and behaviour reduce their chances for ccess in the subjects that you teach.
'. Disorderly student behaviour interferes with the quality of your lching.
:. The students lack interest in the subjects that you teach.
'. What subject do you teach this year?
Second grade:
Third grade:
-'3 " !.= .... :a .... Qj s ~ --~ ~
-3
-3
-3
-3
--; -co: .Q Q.. Q.. co: -c '" ~ 0
"Q
-3
-3
-3
-3
- -'3 '3 " " !.= !.= .... .... :a :a .... ~ -- ·s ~
:> 0'
-2 -1
-2 -1
-2 -1
-2 -1
~ ~ -~ ~ ~
"Q ~ - -~ -; ~
8 "Q
c- '" co: co: co: o .S 0 - '" -'" ~ '" ~- .~ .- . .,. - c Q. Q..!.= Q..= Q.. co: ._
co:
-2 -1
-2 -1
-2 -1
-2 -1
.... '" .... co: '" ~ co:
~ ~ .... -·s -~ 0' :>
+ 1 +2
+ 1 +2
+ 1 +2
+ 1 +2
~ ~ ~ - ~
~ -~ ~ ~ "Q "Q
"Q .c 0 ~ 0 :a ~
co: co: 0 0 - -'" '" .~ .~ Q. Q. Q.. Q.. co: co:
+1 +2
+ 1 +2
+ 1 +2
+1 +2
I. If you have any comment about the areas that were covered in this questionnaire or if you believe that mething important has been left out, use the space below for your suggestions. \(
.... '" co: ~ ....
Qj S ~ --~ ~ +3
+3
+3
+3
.c ~ :a .... -~ :> co: 0 -.~ t - -Q..~ Q..~ CO:"Q
+3
+3
+3
+3
375

7.3.3. STUDENT QUESTIONNAIRE 1999 (PILOT WORK)
376

Questionnaire code
PCQ PUPILS' CONFIDENTIAL QUESTIONNAIRE
Part one. 29 questions. Required time: 10 minutes
Dear friends, This questionnaire is confidential and its purpose is the study of learning conditions at home
and at school. There are no 'correct' or 'wrong' answers. Please answer all questions honestly, without missing any.
I PLEASE FILL THIS SECTION WITH BLOCK CAPITALS
1. Your initials Put in the boxes on the right your 1 2 3 4 1. name 2. surname 3. father's name
14.
mother's name (please use Christian names)
.. .............. .......................... ................... .................... (1)
2. Date of birth
I I I I (year, month, day) I I I
3. Today's date
I (year, month, day) I I I I I I
4. Your school's name
I I (write)
5. 'Direction' of studies I
1 2 3 I (circle) ~ Humanities I Sciences I Technological
6. Your class I I
(6) (write) ~
1 2 7.Gender (cyrcle) ~ Boy Girl
8. Did you attend the same lyceum 1 2 last year? (circle) ~ Yes No
9. Which Gymnasio did you attend? (write) ~
10. Which Primary School did you attend? (write) ~
(2)
(3)
(4)
(5)
(7)
(8)
(9)
(10)
377

I SECTION B: FRONTISTERION AND PLANS FOR THE FUTURE
ll. Do you attend a frontisterion?
(circle) ~ I
l2. Do you take private tuition?
(circle) ~ I
13. If you attend classes in Frontisterion, write its name
14. Which tertiary establishment are you planning to attend? (write the name of the establishment, even if you change your mind next year) ~
1
yes
1
yes
I
SECTION C: YOUR FAMILY
15. How many people under 21 live in your house? (use the box on the ri ht or the answer);'
16. You live with:
I
I
circle a number from (1) to (6).
• Both natural parents
• One natural parent (mother or father) .......................................................................
• one natural and one non-natural parent (step mother or step father) ..................................................
• two adopting parents .................................................
• one adopting parent (mother or father)
• relatives
1 l7. Does your family own the house where they live? (circle) ~ yes
1
l8. Does your family own any other house? (circle) ~ yes
1 L9.Do you study in your own room? (cyrcle) ~ yes
1
2
3
4
5
6
2
no
2
no
2 no
2
no
2 no
I
(11)
(12)
I (/3)
(/4)
(/6)
(/7)
(/8)
(19)
378

I SECTION D : YOUR PARENTS' PROFESSION AND EDUCATION I Eleven profession cards.
I
1 (II) ower-grade professionals, tlministrators and ficials ,
ducation, police, etc
5 (Vlla) Semiskilled manual worker (not in primary production)
9 (IV b)
I Small proprietor, own business, self-employed, artisan without employees
2 (II) Managers in small industrial establishments (state or private), supervisors of non-manual employers
6 (VI) Skilled manual worker
10(~IVc) Small holder, small proprietor, own business self employed with employees
20. your father's work Description V
(write)
21. Your mother's work
escri ption V
(write)
3 Not working
7 Technician, supervisor or other workers or lowergrade technicians
11
'Functionnaire' , doctor assistant university teacher or large proprietor
4 (VII) Agricultural and other workers in primary production
8 (~I) Higher-grade professional or technician; manager in large industrial establishments.
.
Answer here (use the boxes)
V
I Card number
l:J (J-112 ~
I
I Card number
(1-11) ~
l:J I
Eight education cards
I
I
1 Some classes in the Primary School
- 2 Primary School
Description
(write)
Description
(write)
I
I
,
3 Some classes in the Secondary Education
4 Secondary Education (Lyceum)
22. Your father's education
V
23. Your mother's education V
5 7 Polytechnic Post graduate Studies
6 8 University Fine Arts and Music
I Card number l:J (1-8) ~
I
I Card number
(1 -82 ~
I l:J 379
'--

SECTION D': PERSONAL INFORMATION
24. Do you work?
25. Do you study at a private Conservatory?
26. Do you walk to school every day?
27. Is there a computer in your house?
1 yes
1 yes
1 yes
1 yes
28. What amount of money do you spend each day during a typical week in the term? (write)>-
2 no
2 no
2 no
2 no
............... Gr. Drachmas.
End of part one. Thank you for your help.
(24)
(25)
(26)
(27)
(28)
380
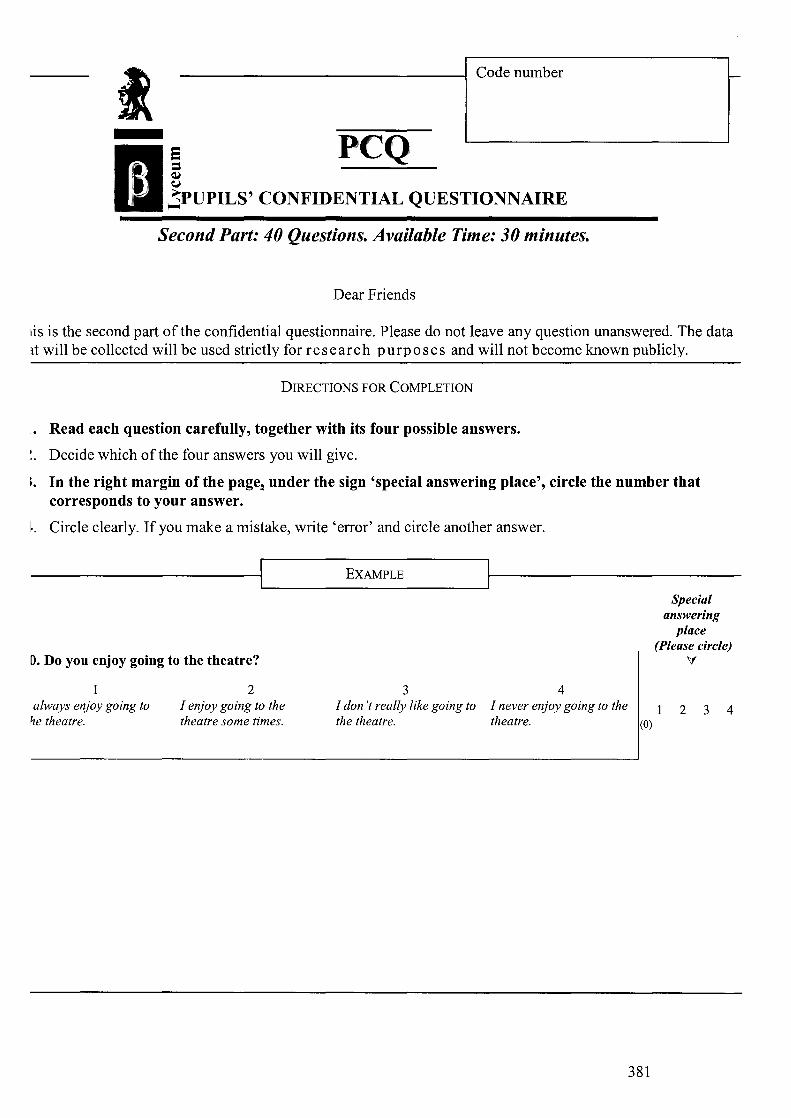
i Code number -
DJ/Z. § pCQ ,I ~UPILS' CONFIDENTIAL QUESTIONNAIRE
Second Part: 40 Questions. Available Time: 30 minutes.
Dear Friends
lis is the second part of the confidential questionnaire. Please do not leave any question unanswered. The data 1t will be collected will be used strictly for research purposes and will not become known publicly.
DIRECTIONS FOR COMPLETION
Read each question carefully, together with its four possible answers.
Decide which ofthe four answers you will give.
~. In the right margin of the pagel under the sign 'special answering place', circle the number that corresponds to your answer.
k Circle clearly. If you make a mistake, write 'error' and circle another answer.
o. Do you enjoy going to the theatre?
always enjoy going to he theatre.
2 I enjoy going to the theatre some times.
EXAMPLE
3 4
Special answering
place (Please circle)
V
I don't really like going to I never enjoy going to the 1 2 3 4 the theatre. theatre. (0)
381
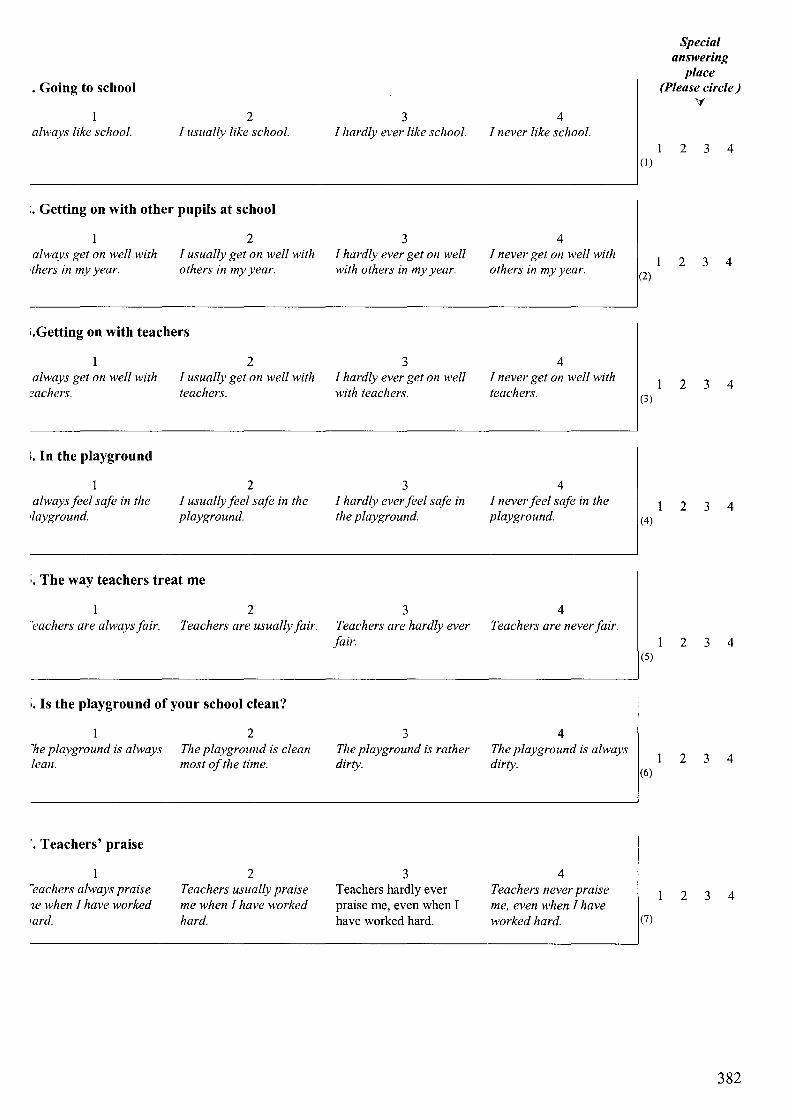
· Going to school
2 always like school. I usually like school.
:. Getting on with other pupils at school
2 always get on well with I usually get on well with thers in my year. others in my year.
I.Getting on with teachers
always get on well with ?achers.
i. In the playground
always feel safe in the 'layground.
2 I usually get on well with teachers.
2 I usually feel safe in the playground.
i. The way teachers treat me
2 eachers are always fair. Teachers are usually fair.
I. Is the playground of your school clean?
ne playground is always lean.
'. Teachers' praise
eachers always praise 7e when I have worked lard.
2 The playground is clean most of the time.
2 Teachers usually praise me when I have worked hard.
3 I hardly ever like school.
3 I hardly ever get on well with others in my year.
3 I hardly ever get on well with teachers.
3 I hardly ever feel safe in the playground.
3 Teachers are hardly ever fair.
3 The playground is rather dirty.
3 Teachers hardly ever praise me, even when I have worked hard.
4 I never like school.
4 I never get on well with others in my year.
4 I never get on well with teachers.
4 I never feel safe in the playground.
4 Teachers are never fair.
4 The playground is always dirty.
4 Teachers never praise me, even when I have worked hard.
(I)
(2)
(3)
(4)
(5)
(6)
(7)
Special answering
place (Please circle)
\f
2 3 4
1 2 3 4
1 2 3 4
234
2 3 4
1 2 3 4
2 3 4
382

I. Asking for help.
~very day I ask teachers ?r help if I am stuck.
2 Several times a week I ask teachers for help if I am stuck.
I. The usefulness of the homework
Ilmost all homework is :seful.
2 Some of the homework is useful.
O. The classes in the "Frontisterion".
2 ne classes at The classes at the (rontisterion ' are much 'jrontisterion ' are better letter than those at than those at school but choo!. It is on the former not much better. ~at I base my hopes for ~ture academic success.
1. People at home.
2 It home they never care At home sometimes they 'bout how I am getting on care about how I am get-,t schoo!. ting on at school
2. Being successful.
2 always get to do I usually get to do omething I'm good at. something I'm good at.
3 I hardly ever ask teachers for help, even if I am stuck.
3 Very little of the homework is useful.
3 The classes at school are better than those at 'jrontisterion ' but not much better.
3 At home they often care about how I am getting on at school. Especially when I et m rades.
3 I hardly ever get to do something I'm good at.
3. How often do you discuss your classes with your parents?
discuss classes with my larents daily..
2 I discuss my classes with my parents several times a week.
3 I hardly ever discuss my classes with my parents.
4 I never ask teachers for help, even if I am stuck.
4 Almost all the homework is useless.
4 The classes at school are better than those at 'jrontisterion' to such a degree that I wonder why there are students who attend ' rontisterion '.
4 At home they always care about how I am getting on at school This is dis-cussed dail .
4 I never get to do something I'm good at.
4 I never discuss my classes
(8)
Special answering
place (Please circle)
V
2 3 4
2 3 4 (9)
2 3 4 (10)
2 3 4 (11 )
2 3 4 (12)
2 3 4 with my parents. (13)
383

4. Do you finish your homework?
always finish my !omework.
2 I finish my homework most of the time.
5. If you don't do your homework
2 "eachers never notice if I If I haven't done my 'aven 't done my homework teachers 'omework. hardly ever notice.
6. Difficulty of schoolwork.
2 !lmost all schoolwork is Much of the schoolwork 'ifficult. is difficult.
7. Self-confidence
2 always have confidence I usually have confidence
'1 myself. in myself.
8. The work at school
2 ~ always boring. Is boring most of the time.
9. Completing your schoolwork.
2 ;very day I find it diffi- Twice or three times a ult to complete my week I find it difficult to choolwork. complete my schoolwork.
:0. Teachers' help.
2 eachers always help me Teachers usually help me J understand my work. to understand my work.
3 Sometimes J finish my homework.
3 If I haven't done my homework teachers usually notice.
3 Little of the schoolwork is difficult.
3 I hardly ever have confidence in myself.
3 Is interesting most of the time.
3 Once or twice a month J find it difficult to com-plete my schoolwork.
3 Teachers hardly ever help me to understand my work.
4 I hardly ever finish my homework.
4 If I haven't done my homework teachers always notice.
4 I have never seen difficult schoolwork.
4 I never have confidence
in myself.
4 Is always interesting.
4 I never find it difficult to complete my schoolwork.
4 Teachers never help me to understand my work.
(14)
(\5)
(16)
(17)
(18)
(\9)
(20)
Special answering
place (Please circle)
V
234
2 3 4
2 3 4
2 3 4
2 3 4
2 3 4
1 2 3 4
384

~1. Your 'contribution' to the class.
2 3 hardly ever answer
'uestions in the class. Some times during the In almost every class I day I answer questions in answer questions.
~2. Teachers listening
~eachers always listen to vhat I say.
the class.
2 Teachers usually listen to what I say.
~3. (29) What teachers think about my work.
2 III teachers think my Most teachers think my vork in class is good. work in class is good.
:4. (12) Easiness of work.
2 ly work is always too My work is usually too asyfor me .. easyfor me.
:5. (13) Thinking for yourself.
"eachers never ncourage me to think for 1yself.
2 Teachers hardly ever encourage me to think for myself.
3 Teachers hardly ever listen to what / say.
3 Only afew of my teachers think my work in class is good.
3 My work is usually about right for me.
3 Teachers usually encourage me to think for myself.
:6. Teachers keeping you informed about your work.
"eachers always keep me 'lformed about the qualy of my work.
2 Teachers keep me informed about the quality of my work at school but think that / would need some more in ormation.
3 / do not get much information from teachers about the quality of my work.
4 In every class I answer many questions.
4 Teachers never listen to what/say.
4 None of my teachers thinks my work in class is good.
4 My work is always right forme.
4 Teachers always
(21 )
(22)
(23)
(24)
encourage me to think for (25)
myself.
4 / do not get information about the quality of my work at school from my teachers.
(26)
Special answering
place (Please circle)
V
234
2 3 4
2 3 4
2 3 4
2 3 4
2 3 4
385

~7. (15) Teachers' help.
reachers never help me vhen 1 am stuck.
2 Teachers hardly ever help me when 1 am stuck.
3 Teachers usually help me when 1 am stuck.
~8. Your 'presence' in the class compared with that of your classmates.
believe that my 'presmce ' is very good.
~9. (20) Being successful
never get to do omething 1 'm good at.
10. (28) Your ability.
think 1 am very clever more than the others)
2 1 believe that my 'presence ' is good enough.
2 I hardly ever get to do something I'm good at.
2 1 think 1 am quite clever
3 1 believe that my 'presence' is rather bad.
3 1 usually get to do something 1 'm good at.
3 1 think I'm not very clever.
11. Your teachers about your "presence" in the class.
2 3 \,11 the teachers believe Most of the teachers A few teachers believe hat my "presence" in the believe that my that my "presence" in the :lasses is good. "presence" in the classes classes is good.
is ood.
12. (30) Joining in.
2 3 never feel left out of 1 hardly ever feel left out 1 usually feel left out of
hings. of things. things.
13. Playing truant. Remember that no one you know will see your answer.
never play truant. 2
I think that finally 1 will have missed 1 to 4 school days.
3 I think that finally I will have missed about a school week.
4 Teachers always help me when 1 am stuck.
4 1 believe that my 'presence' is very bad.
4 I always get to do something 1 'm good at.
4 I think that I'm not clever at all.
4 Almost none of the teachers believes that my "presence" in the classes is ood.
4 1 always feel left out of things.
4 I think that I will reach or even exceed the Ministry-
Special answering
place (Please circle)
V
2 3 4 (27)
1 234 (28)
2 3 4 (29)
2 3 4 (30)
2 3 4 (31 )
2 3 4 (32)
2 3 4 set limit. (33)
386

14. (35) The way others behave.
2 3 rhere is bad behaviour in During the week there are Hardly ever is there bad ny classes daily. 2 or 3 incidents of bad behaviour in my classes.
behaviour in my classes.
15. (36) Making friends.
2 3 find it easy to make J usually find it easy to J usually find it hard to riends. make friends. make friends.
~6. Your behaviour in class towards your classmates -your view.
kfy behaviour is always lad.
2 My behaviour is mostly bad.
3 My behaviour is mostly good.
~7. Your behaviour in class towards your teachers -your view.
\.1y behaviour is always lad.
2 My behaviour is mostly bad.
~8. (39) Your behaviour at home - your view.
kfy behaviour is always lad.
2 My behaviour is mostly bad.
~9. (40) Your behaviour at home - parents' view.
\.1y behaviour is always 1ad.
2 My behaviour is mostly bad.
3 My behaviour is mostly good.
3 My behaviour is mostly good.
3 My behaviour is mostly good.
4 There is never bad behaviour in my classes.
4 J always find it hard to make friends.
4 My behaviour is always good.
4 My behaviour is always good.
4 My behaviour is always good.
4 My behaviour is always good.
Special answering
place (Please circle)
V
2 3 4 (34)
2 3 4 (35)
234 (36)
234 (37)
2 3 4 (38)
2 3 4 (39)
w. Teachers' help with your plans for the future (job prospectives, education etc.)
, know exactly what J vant to do and J am ndebted to my teachers or that.
2 Teachers are an important source of information for making plans about my future.
3 Teachers are a source of information for making plans about my future, but not the most important source.
4 Teachers are not a source of information for making 1 plans about my future. (40)
THANK YOU VERY MUCH FOR YOUR HELP
2 3 4
387

7.3.4. TEACHER QUESTIONNAIRE 1999 (PILOT WORK)
388

questionnaire code
TCQ
TEACHERS' CONFIDENTIAL QUESTIONNAIRE
55 questions. Completion time: about 15' minutes.
Dear colleagues,
This questionnaire is confidential and has been specially designed to investigate your opinions about the work in the school. Your answers will be associated with those of the pupils and useful conclusions will be drawn from them. Please answer to all the questions sincerely.
1. The name of your school:
2. Specialisation Number
3. Subject:
4. Year of Graduation:
5. Other subjects that you teach in this school:
6.Year of Birth:
7.Today's date: (year, month, day)
8. What is your sex?:
(circle)
PERSONAL DATA
(1)
(2)
(6)
2
male female
(3)
(4)
(5)
(7)
(8)
389
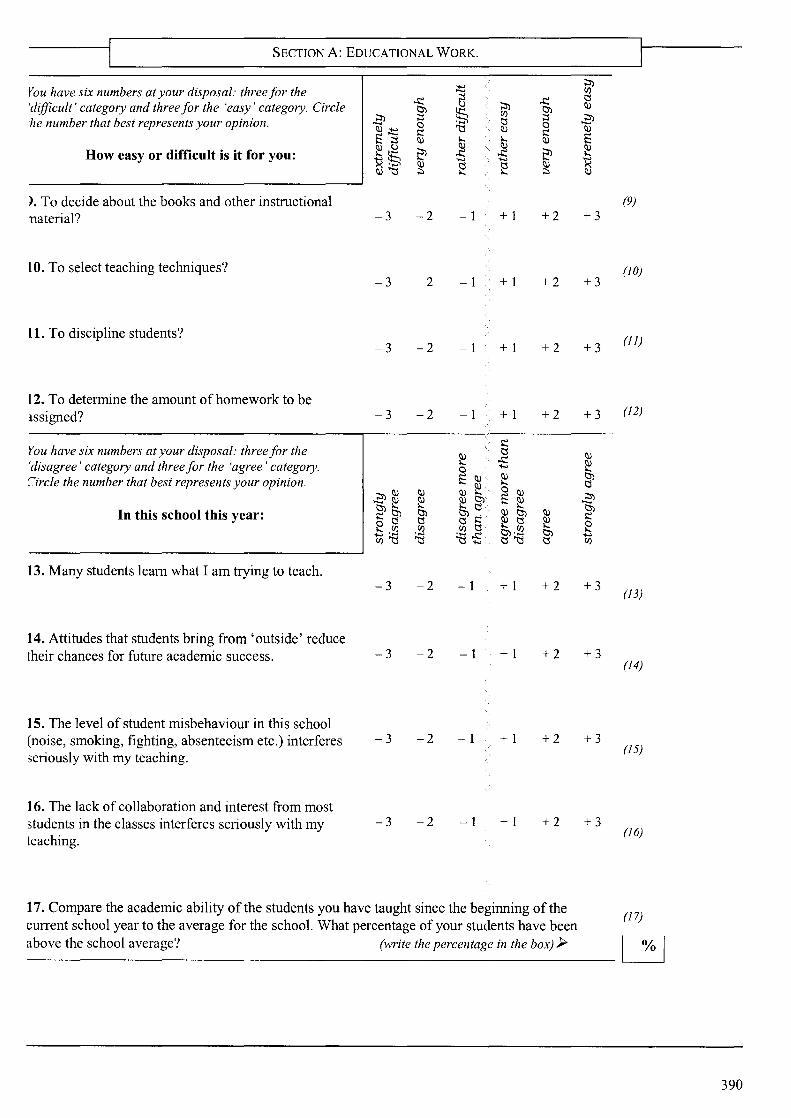
SECTION A: EDUCATIONAL WORK.
.t::! f'ou have six numbers at your disposal: three for the ~ a ~ 'difficult' category and three for the 'easy' category. Circle ,
~ ~ If:, ~ .2"> ;:l C/) ;:l he number that best represents your opinion. 0 S Cj 0 (U ...... i:: ~ (U i:: !:] (U 10- 10- (U
(U ,~ How easy or difficult is it for you: ~lf:, j2l ~ j2l ><S ...... ...... (U e e (U
(U~ ;::, ;::,
). To decide about the books and other instructional naterial? -3 -2 -1 + 1 +2
LO. To select teaching techniques? -3 -2 - 1 + 1 +2
L1. To discipline students? -3 -2 -1 + 1 +2
L2. To determine the amount of homework to be lssigned? -3 -2 - 1 + 1 +2
You have six numbers at your disposal: three for the i::
~ Cj
'disagree' category and three for the 'agree' category. ~
0 ......
'::ircle the number that best represents your opinion. !: (U ~ (U ~. 0 ~(U (U
!: (U
-- ~ ~ ()) ~. ~
~~ 10.. Cj
In this school this year: ~ ~i:: (U ~ (U
o Cj ~ Cj ~ Cj ~
.)::; .~ .~ . ...,~ ~.~ ~ C/)~ ~ ~ ...... Cj~ Cj
13. Many students learn what I am trying to teach. -3 -2 -1 + 1 +2
14. Attitudes that students bring from 'outside' reduce their chances for future academic success. -3 -2 -1 + 1 +2
15. The level of student misbehaviour in this school (noise, smoking, fighting, absenteeism etc.) interferes -3 -2 - 1 + 1 +2 seriously with my teaching.
16. The lack of collaboration and interest from most students in the classes interferes seriously with my -3 -2 - 1 + 1 +2 teaching.
17. Compare the academic ability of the students you have taught since the beginning of the current school year to the average for the school. What percentage of your students have been
~ C/) Cj (U
.2"> (U
!: ~
~
(9) +3
+3 (10)
+3 (1/)
+3 (12)
(U
~ ~ \j
.2"> ~ e ...... C/)
+3 (/3)
+3 (14)
+3 (/5)
+3 (16)
(17)
_ab_o_v_e __ th_e_s_c_h_o_o_l_a_v_er_a_g_e_? ___________________________ (w_r_it_e_t_he_p __ er_c_e_nt_a_g_e_in __ ffi_e_b_o_x_J_» _______ ~
390
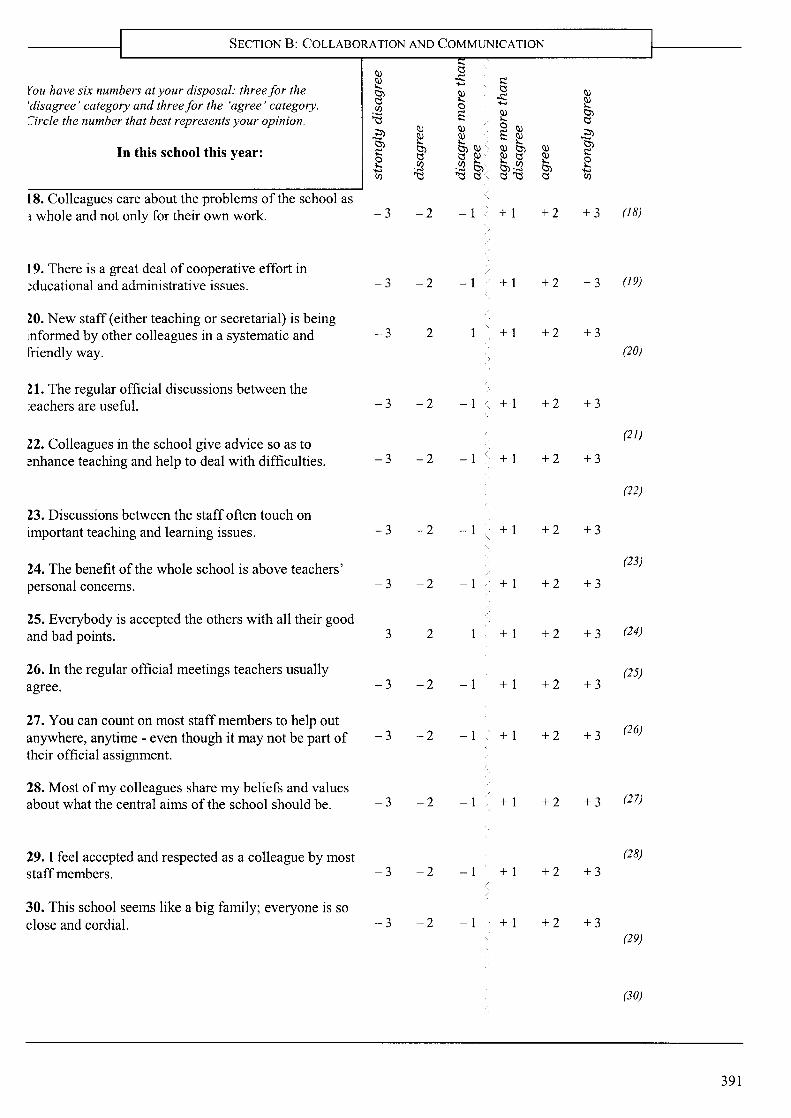
SECTION B: COLLABORATION AND COMMUNICATION
III !j
~ ..t: ~
Vou have six numbers at your disposal: three for the ....
!j
~ ~ ..t: III
'disagree' category and three for the 'agree' category. 0 .... ~ CI) ~ ~ ~ '"::ircle the number that best represents your opinion.
..... 'ij
III III 0 III 2l ~ ~ ~ ~ 2l ~
(:j) In this school this year: (:j) (:j) III . III (:j) III ~ e !j !j Ill' ~ !j ~ e CI) CI) ~. (:j).~ (:j) .... .....
~ !j< ....
CI) 'ij !j'ij !j CI)
L8. Colleagues care about the problems of the school as 1 whole and not only for their own work. -3 -2 -1 + 1 +2 +3 (18)
L9. There is a great deal of cooperative effort in ~ducational and administrative issues. -3 -2 - 1 + 1 +2 +3 (19)
W. New staff (either teaching or secretarial) is being lnformed by other colleagues in a systematic and -3 -2 -1 + 1 +2 +3
friendly way. (20)
Zl. The regular official discussions between the teachers are useful. -3 -2 -1 + 1 +2 +3
Z2. Colleagues in the school give advice so as to (21)
enhance teaching and help to deal with difficulties. -3 -2 - 1 + 1 +2 +3
(22)
B. Discussions between the staff often touch on lmportant teaching and learning issues. -3 -2 - 1 + 1 +2 +3
Z4. The benefit of the whole school is above teachers' (23)
personal concerns. -3 -2 -1 + 1 +2 +3
ZS. Everybody is accepted the others with all their good and bad points. -3 -2 -1 + 1 +2 +3 (24)
26. In the regular official meetings teachers usually (25) agree. -3 -2 -1 + 1 +2 +3
27. You can count on most staff members to help out (26)
anywhere, anytime - even though it may not be part of -3 -2 -1 + 1 +2 +3 their official assignment.
28. Most of my colleagues share my beliefs and values (27) about what the central aims of the school should be. -3 -2 -1 + 1 +2 +3
29. I feel accepted and respected as a colleague by most (28)
staff members. -3 -2 -1 + 1 +2 +3
30. This school seems like a big family; everyone is so close and cordial. -3 -2 -1 + 1 +2 +3
(29)
(30)
391

SECTION C: SCHOOL ADMINISTRA nON (EFFECTIVENESS-REsPONSE)
You have six numbers at your disposal: three for the ~ (I)
'disagree' category and three for the 'agree' category. 0 ~ '::ircle the number that best represents your opinion. E: (I) ~ ~
(I) ~, ~(I) (I) o If) ...., ~ ~ Cll ~c E: .-
;... c:l"' (I)'c:l ~~ ~ ~ .:' (I)
In this school this year: c:l (I) .: ~ e If) If) .~ .g ;... c:l ....... - .- ~..t: ~ If)'c:l 'c:l 'c:l ...... c:l ...... c:l
31. I have the feeling that the administration 'knows its -3 -2 - 1 + 1 +2 job'.
> 32. The administration knows what kind of school it
\,
-3 -2 - 1 + 1 +2 wants and communicates it to the staff.
33. The administration lets staff members know what is -3 -2 - 1 + 1 +2 expected of them.
Read carefully the following propositions and answer by circling one of the numbers on the right hand side of the page.
34. The administration ............... in securing extra courses for the school.
1 does a very poor job
2 does a rather poor
job
3 does a rather good
job
4 does a very good job
35. The administration deals ............... with persons and situations that interfere with your educational work (pressure from parents, 'consultants' etc).
1 ineffectively
2 rather ineffectively
3 rather effectively
4 effectively
36. To what extent does the administration of this school help you improve your teaching or solve an instructional or class arrangement problem
1 very little
2 relatively little
3 relatively much
4 very much
37. To what extent does the administration of this knows the problems faced by the staff?
1 very little
2 relatively little
3 relatively much
4 very much
38. To what extent the school administration behaviour toward the staff is supportive and encouraging?
1 very little
2 relatively little
3 relatively much
4 very much
(I)
~ ~ c:l
~ ~ .: e ...... If)
+3
+3
+3
(31)
(32)
(33)
Put your answer here (circle)
V
1 2 3 4 (34)
1 2 3 4 (35)
1 2 3 4 (36)
1 234 (37)
234 (38)
392

SECTION D: EDUCATIONAL WORK
Read carefully the following propositions and answer by circling one of the numbers on the r'ight hand side of the page.
39.How often do you feel satisfied with your job?
1 almost never
2 sometimes
3 often
40. How often do you feel that you offer the right type of education?
1 almost never
2 sometimes
How often do you agree with the following propositions?
41. 'I have enjoyed teaching this year'.
42. 'I think that teaching is not a waste of time'.
43. 'I am a very effective teacher'.
You have six numbers at your disposal: three for the 'dissatisfied' category and three for the 'satisfied' category. Circle the number that best represents your opinion.
Questions
44. How satisfied are you with the level of your fee?
45. If you consider everything that comprises your educational work (teaching, designing, commuting, working time etc) how satisfied are you with your work?
46. If you consider your educational work, on the one hand, and your economic and social situation, on the other, how happy are you with your life?
I-< Q) :> Q)
~
-3
-3
-3
"'\:! (\)
'" t::! (\) "-
~ ~ .0
(\)
=:: ~ ...... ~
-3
-3
-3
3 often
..Q Q)
~ I-<
Q Q) :>
-2
-2
-2
"'\:! (\)
~ (\) "-
~ ~
-2
-2
-2
~ Q)
~ 0 0 CIl
...... 0 ~
- 1
- 1
- 1
"'\:! (\)
'" t::! (\) "-
~ ~ ~
...::! ...... ~
- 1
- 1
-1
~ Q)
~ 0
+ 1
+ 1
+ 1
"'I::l (\)
'" t::! (\) "-I:l., :... (\)
...::! ...... ~
+ 1
+ 1
+ 1
4 always
4 always
~ Q)
~ 0
Q Q) :>
+2
+2
+2
"'I::l (\)
'" t::! ~ I:l.,
+2
+2
+2
CIl
~ ~ +3
+3
+3
"'I::l (\)
'" t::! (\) "-I:l., .0 (\)
=:: ~ ...... ~
+3
+3
+3
1 234 (39)
1 2 3 4 (40)
A.
Put your answer above (circle)
(41)
(42)
(43)
(44)
(45)
(46)
393
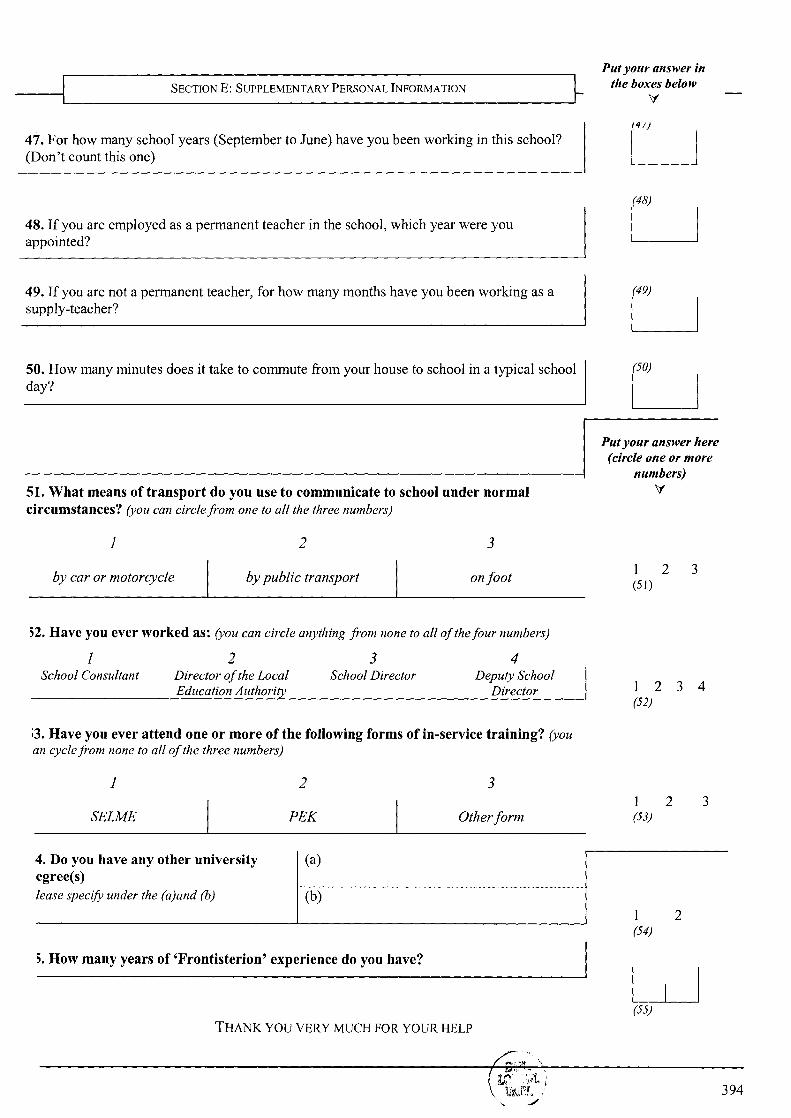
SECTION E: SUPPLEMENTARY PERSONAL INFORMA TION
47. For how many school years (September to June) have you been working in this school? (Don't count this one)
48. If you are employed as a permanent teacher in the school, which year were you appointed?
49. If you are not a permanent teacher, for how many months have you been working as a supply-teacher?
50. How many minutes does it take to commute from your house to school in a typical school day?
51. What means of transport do you use to communicate to school under normal circumstances? (you can circle from one to all the three numbers)
1 2 3
by car or motorcycle by public transport onfoot
;2. Have you ever worked as: (you can circle anything from none to all of the four numbers)
1 School Consultant
2 Director of the Local Education Authority
3 School Director
4 Deputy School
Director
;3. Have you ever attend one or more of the following forms of in-service training? (you an cycle from none to all of the three numbers)
1 2 3
SELME PEK Other form
4. Do you have any other university (a) egree(s) lease specifo under the (a)and (b) (b)
;. How many years of 'Frontisterion' experience do you have?
THANK YOU VERY MUCH FOR YOUR HELP
Put your answer in the boxes below
\f
(48)
LJ (49)
LJ (50)
LJ Put your answer here
(circle one or more numbers)
\f
123 (51 )
1 234 (52)
1 2 3 (53)
1 2 (54)
LJ (55)
394

DA AGED TE T
I ORIGI AL
. . _ i<':
Related Documents