Wilfrid Laurier University Wilfrid Laurier University Scholars Commons @ Laurier Scholars Commons @ Laurier Theses and Dissertations (Comprehensive) 2019 TEMPERATURE-DEPENDENT KINETIC STUDIES OF ARSENICALS TEMPERATURE-DEPENDENT KINETIC STUDIES OF ARSENICALS ADSORPTION FROM SOLUTION TO HEMATITE NANOPARTICLES ADSORPTION FROM SOLUTION TO HEMATITE NANOPARTICLES sara soldoozy [email protected] Follow this and additional works at: https://scholars.wlu.ca/etd Part of the Environmental Chemistry Commons, and the Physical Chemistry Commons Recommended Citation Recommended Citation soldoozy, sara, "TEMPERATURE-DEPENDENT KINETIC STUDIES OF ARSENICALS ADSORPTION FROM SOLUTION TO HEMATITE NANOPARTICLES" (2019). Theses and Dissertations (Comprehensive). 2204. https://scholars.wlu.ca/etd/2204 This Thesis is brought to you for free and open access by Scholars Commons @ Laurier. It has been accepted for inclusion in Theses and Dissertations (Comprehensive) by an authorized administrator of Scholars Commons @ Laurier. For more information, please contact [email protected].

Welcome message from author
This document is posted to help you gain knowledge. Please leave a comment to let me know what you think about it! Share it to your friends and learn new things together.
Transcript
Wilfrid Laurier University Wilfrid Laurier University
Scholars Commons @ Laurier Scholars Commons @ Laurier
Theses and Dissertations (Comprehensive)
2019
TEMPERATURE-DEPENDENT KINETIC STUDIES OF ARSENICALS TEMPERATURE-DEPENDENT KINETIC STUDIES OF ARSENICALS
ADSORPTION FROM SOLUTION TO HEMATITE NANOPARTICLES ADSORPTION FROM SOLUTION TO HEMATITE NANOPARTICLES
sara soldoozy [email protected]
Follow this and additional works at: https://scholars.wlu.ca/etd
Part of the Environmental Chemistry Commons, and the Physical Chemistry Commons
Recommended Citation Recommended Citation soldoozy, sara, "TEMPERATURE-DEPENDENT KINETIC STUDIES OF ARSENICALS ADSORPTION FROM SOLUTION TO HEMATITE NANOPARTICLES" (2019). Theses and Dissertations (Comprehensive). 2204. https://scholars.wlu.ca/etd/2204
This Thesis is brought to you for free and open access by Scholars Commons @ Laurier. It has been accepted for inclusion in Theses and Dissertations (Comprehensive) by an authorized administrator of Scholars Commons @ Laurier. For more information, please contact [email protected].
TEMPERATURE-DEPENDENT KINETIC STUDIES OF
ARSENICALS ADSORPTION FROM SOLUTION TO
HEMATITE NANOPARTICLES
By
Sara Soldoozy
THESIS
Submitted to the Department of Chemistry and Biochemistry
Faculty of Science
In partial fulfillment of the requirements for the
Master of Science in Chemistry
Wilfrid Laurier University
2019
Sara Soldoozy © 2019
i
ABSTRACT
Surface chemistry is the study of the chemical and physical phenomena that transpire at
interfaces such as liquid-solid, solid-gas, liquid-gas, and liquid-liquid. To study the reactions
occurred at the surfaces, surface sensitive techniques come to play. Adsorption of arsenical
compounds (liquid adsorbate), particularly arsenate (iAs) and dimethylarsinic acid (DMA), to the
surface of iron bearing materials (solid adsorbent) that frequently are found in geosorbents such
as hematite (Fe2O3) has been studied in this thesis. Arsenical compounds can pollute the
environment through natural sources and anthropogenic activities, and ultimately contaminate
water. Absorbing these pollutants to a material as an absorber is one way of filtering drinking
water. One of the efficient absorbents for arsenicals are hematite nanoparticles. Hematite is an
iron-oxide and a soil component that has a great affinity for the arsenical compounds.
The present study was performed under pH 7 at temperature ranges of 5-35℃ for iAs and
5-50℃ for DMA. DMA has only one hydrogen and at pKa 7 it is dissociated and becomes
negatively charged. Arsenate has three hydrogens, and at pKa 7 its two hydrogens are dissociated,
and it becomes negatively charged. At around pH 7, the hematite nanoparticles (Fe2O3) are
positively charged. As a result, electrostatic attraction occurs between these negatively charged
arsenicals to the surface of the positively charged hematite. Effectiveness of this attraction varies
by factors such as temperature, concentration, time, and pH. Temperature was found to be the
main factor, specifically in the case of DMA. Temperature eased the formation of a type of strong
binding structure called bidentate inner sphere in which covalent binding is involved. Due to the
two methyl groups in DMA, bidentate inner sphere cannot be easily formed on the surface.
Therefore, DMA cannot be absorbed strongly, and it primarily forms weak van der Waals
monodentate inner sphere or outer sphere structures on the surface. DMA needs energy to defeat
this strain in the transition state. The energy needed is called barrier energy or activation energy,
and is provided by increasing the temperature. In comparison, based on previous studies, arsenate
forms predominantly bidentate inner sphere at room temperature. As a result, it may not need
ii
high temperature to incapacitate the transition state boundaries. Arsenate has been studied
alongside DMA for estimating its activation energy in this study. The activation energy was
calculated for both iAs and DMA under identical conditions to compare the results. Four levels of
concentration were examined for iAs and DMA in 0.01 M of NaCl solution.
The surface sensitive technique used in this study was attenuated total internal reflectance
Fourier transform infrared spectroscopy (ATR-FTIR) under environmentally relevant conditions
to study the in situ surface interactions of the arsenicals at the molecular level. Initial observed
rates (robs) of the first 2 minutes of the adsorption reaction were extracted and upon that pseudo-
first order rate constants (kads) were quantified at different temperatures and concentrations.
Eventually, in order to calculate the activation energy, Arrhenius equation was employed.
The significance of this study is that it would be beneficial for cleaning drinking water
from arsenical compounds by interpreting the obtained kinetic parameters and modeling the
suitable system.
iii
ACKNOWLEDGEMENTS
I am grateful for my supervisor, Professor Hind Al-Abadleh, for giving me the
opportunity to work in her lab and learn intensely about environmental concerns. It has been a
constant learning experience. As well, I am thankful for Dr. Lillian DeBruin for her continuous
feedback, advice, and support during this study.
I would like to thank Dr. Scott Smith for his aquatic chemistry course for which I learned
a lot in. Also, I thank Dr. Geoff Horsman for accepting to be my examiner.
I acknowledge the faculty in the Department of Chemistry and Biochemistry for their
help and support, Dr. Steve MacNeil, the Chair of the Department and Dr. Kenneth Maly, the
Dean of Science.
I thank Dr. Al-Abadleh’s current and past group members, Aminur Rahman, Anthony
Trinh, and Adrian Adamescu for their training and help.
I am fortunate to have supportive friends here, Heather Gaebler, and Nicole Ritter who
have been of so much care and help to me. Thanks a lot.
I thank the wonderful staff of the Department of Chemistry and Biochemistry, Margaret
Szymanska and Jane Davidson, for their help and support.
I thank Jordana Garbati from the writing centre and Debbie Chaves from the library for
their great help on my writing concerns.
I thankfully acknowledge Wilfrid Laurier University and NSERC (Natural Sciences and
Engineering Council) for funding the work I completed.
And finally, my special thanks go to my family, particularly my parents: Thanks Mum!
Thanks Dad! and as well, my brother for his continuous support, and such a coincident that our
defenses happened on the same day; I defended my Master Thesis and he defended his Ph.D.

iv
Thesis in Electrical Engineering. I am truly blessed to have them in my life. Many things in my
life could not have been done without my Family’s support.

v
To:
My Parents
vi
TABLE OF CONTENTS
ABSTRACT………………………………………………………………………...i
ACKNOWLEDGEMENTS……………………………………………………...iii
DEDICATION……………………………………………………………………..v
LIST OF TABLES………………………………………………………………..ix
LIST OF FIGURES……………………………………………………………….x
CHAPTER 1: INTRODUCTION AND LITERATURE REVIEW……….1
1.1 Natural Sources of Arsenic in the Environment and Speciation as a Function of
pH………………………………………………………………………………1
1.2 Anthropogenic Sources of Arsenic in the Environment………………………...5
1.3 Toxicity of Arsenic and Environmental Regulations……………………………7
1.4 Arsenic Removal Technology…………………………………………………...8
1.4.1 Coagulation/filtration……………………………………………………………...8
1.4.2 Membrane filtration………………………………………………………………..9
1.4.3 Adsorption…………………………………………………………………………9
1.4.4 Oxidation…………………………………………………………………………11
1.4.5 Ion exchange……………………………………………………………………..11
1.5 Chemical Compositions of Soil Influencing Arsenic Adsorption……………..12
1.5.1 Minerals and Metal Oxides………………………………………………………12
1.5.2 Natural Organic Matter in Soil…………………………………………………...14
vii
1.6 Kinetics of Surface Chemistry of Arsenate (iAs) and Dimethylarsinic Acid
(DMA) with Soil Components …………………………………………………...16
1.6.1 Basis of Operation for Techniques Used to Study Surface Chemistry: Bulk/Batch
and Infrared (ATR-FTIR)………………………………………………………………...16
1.6.2 Speciation of Surface Arsenate and DMA on Iron Oxides……………………...19
1.6.3 Kinetic Models Used to Extract Reaction Rates…………………………………21
1.6.4 Thermodynamic Studies and the Theoretical Activation Barriers for Arsenate and
DMA Surface Species……………………………………………………………………23
1.7 Overview of Thesis Objective…………………………………………………24
CHAPTER 2: MATERIALS AND METHODS…………………………...24
2.1 Chemicals ……………………………………………………………………..24
2.2 Temperature-Dependent ATR-FTIR Technique………………………………25
2.3 Data Analysis………………………………………………………………….27
2.4 Characterization of Hematite Nanoparticles…………………………………..28
CHAPTER 3: ACTIVATION ENERGY BARRIER FOR DMA ON
HEMATITE NANOPARTICLES AT pH 7……………………………………29
3.1 Results and Discussion………………………………………………………..29
3.1.1 Absorbance Spectra for the DMA Adsorption on Hematite………………………29
3.1.2 Adsorption Kinetic Curves…………………………………………………………32
3.1.3 Linearize the Langmuir Model to Obtain the Initial Rate (robs) of the DMA
Adsorption ……………………………………………………………………………….35
3.1.4 Extract the Rate Constant (kads) of the DMA Adsorption Reaction………………..37
viii
3.1.5 Calculate the Activation Energy (Ea) of the DMA Adsorption from Solution to
Hematite Nanoparticles…………………………………………………………………..39
3.2 Summary and Discussion……………………………………………………...42
CHAPTER 4: ACTIVATION ENERGY BARRIER FOR ARSENATE
ON HEMATITE NANOPARTICLES AT pH 7……………………………….43
4.1 Results and Discussion………………………………………………………..43
4.1.1 Absorbance Spectra for the Arsenate Adsorption on Hematite…………………….43
4.1.2 Adsorption Kinetic Curves…………………………………………………………45
4.1.3 Linearize the Langmuir Model to Obtain the Initial Rate (robs) of Arsenate
Adsorption………………………………………………………………………………..46
4.1.4 Extract the Rate Constant (kads) of the Arsenate Adsorption Reaction…………….48
4.1.5 Calculate the Activation Energy of the Arsenate Adsorption from Solution to
Hematite Nanoparticles…………………………………………………………………..49
4.2 Summery and Discussion……………………………………………………..51
CHAPTER 5: CONCLUSION AND SIGNIFICANCE…………………...53
REFERENCES…………………………………………………………………...57
APPENDIX A. Macros Used to Collect and Analyze the Data………………………..65
APPENDIX B. Glassware Cleaning for Aqueous Phase Experiments………………..76
APPENDIX C. Troubleshooting of the Weighing Balance…………………………….77
APPENDIX D. Absorbance Spectra, Kinetic Curves and Linearized Graphs of DMA
and Arsenate Discussed in this Thesis (at Different Concentrations (0.25, 0.5, 1, 1.5 mM)
and Different Temperatures (5-50 ℃) )……………………………………………………….78
ix
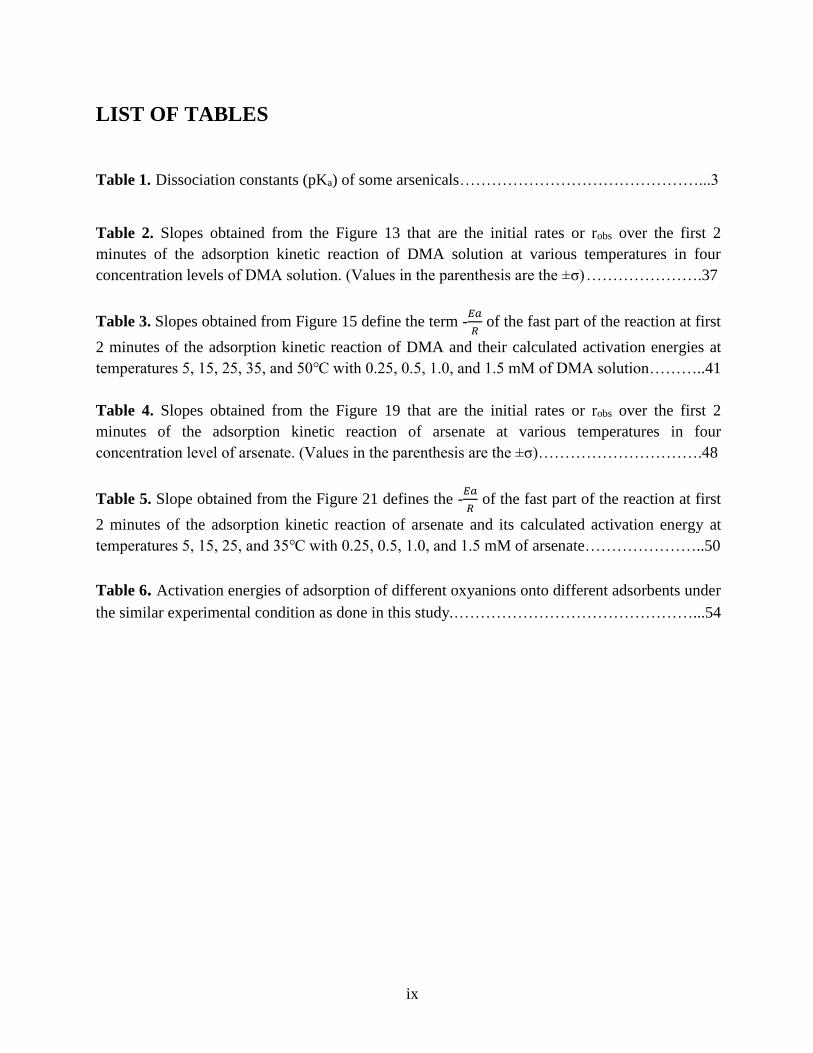
LIST OF TABLES
Table 1. Dissociation constants (pKa) of some arsenicals………………………………………...3
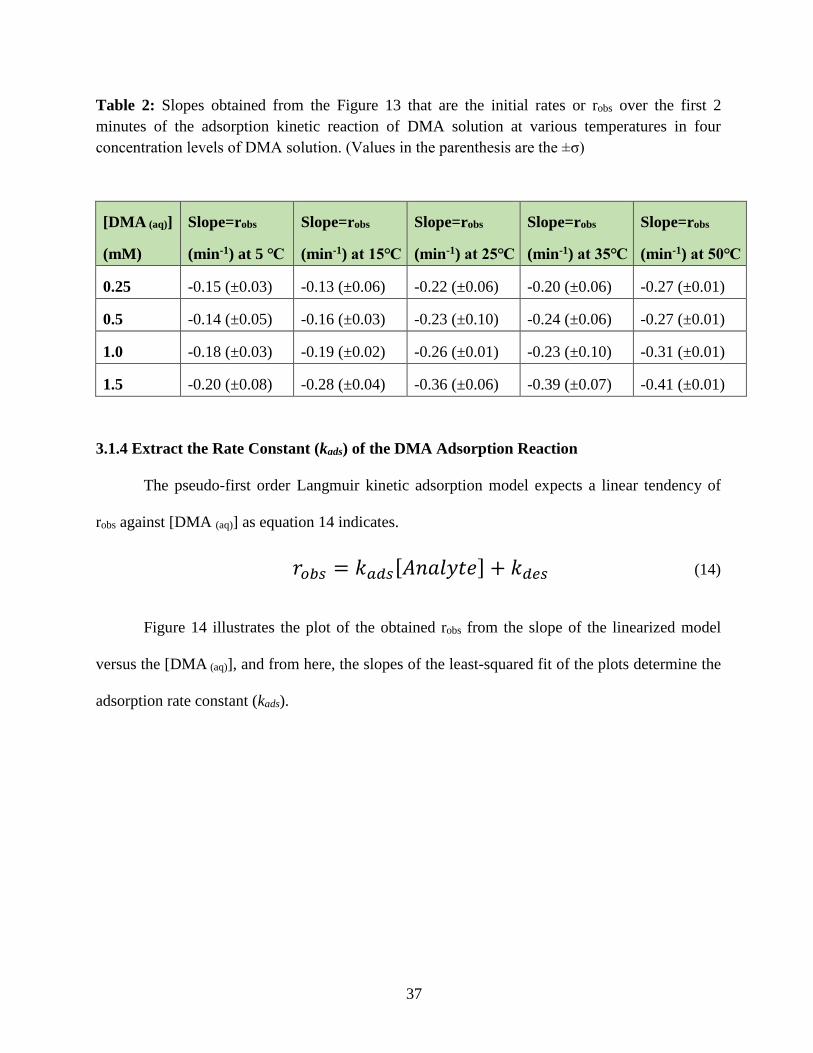
Table 2. Slopes obtained from the Figure 13 that are the initial rates or robs over the first 2
minutes of the adsorption kinetic reaction of DMA solution at various temperatures in four
concentration levels of DMA solution. (Values in the parenthesis are the ±σ) ………………….37
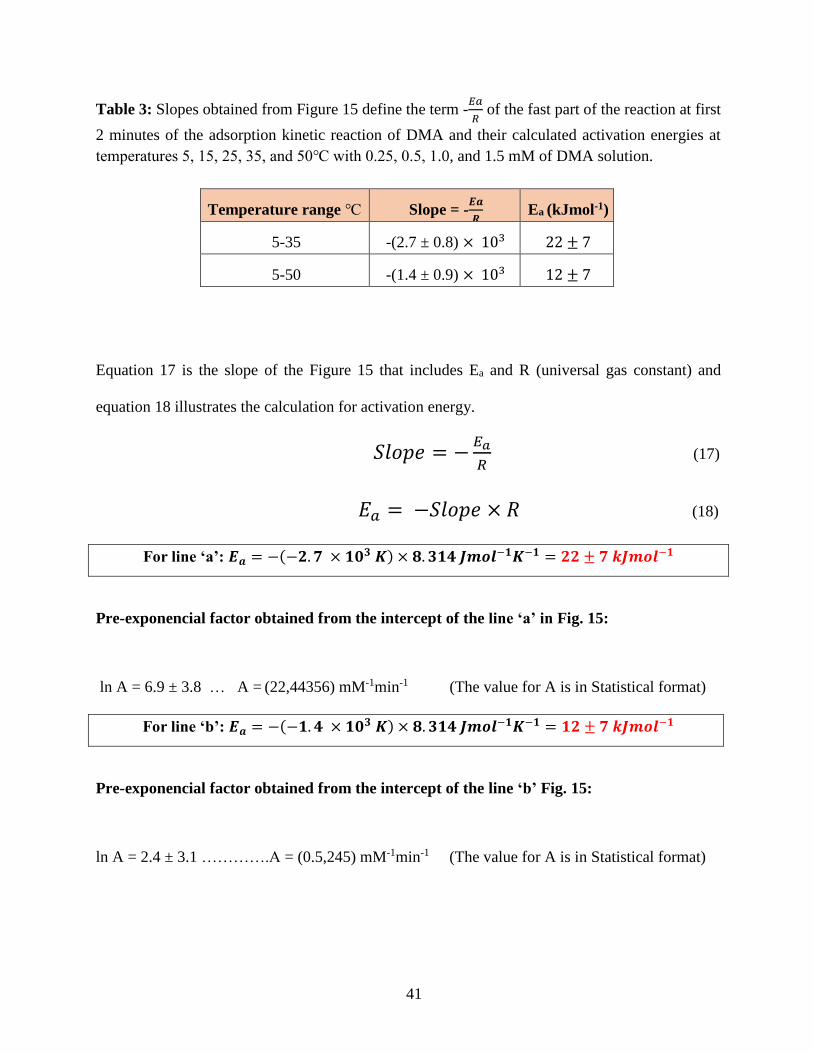
Table 3. Slopes obtained from Figure 15 define the term -𝐸𝑎
𝑅 of the fast part of the reaction at first
2 minutes of the adsorption kinetic reaction of DMA and their calculated activation energies at
temperatures 5, 15, 25, 35, and 50℃ with 0.25, 0.5, 1.0, and 1.5 mM of DMA solution………..41
Table 4. Slopes obtained from the Figure 19 that are the initial rates or robs over the first 2
minutes of the adsorption kinetic reaction of arsenate at various temperatures in four
concentration level of arsenate. (Values in the parenthesis are the ±σ)………………………….48
Table 5. Slope obtained from the Figure 21 defines the -𝐸𝑎
𝑅 of the fast part of the reaction at first
2 minutes of the adsorption kinetic reaction of arsenate and its calculated activation energy at
temperatures 5, 15, 25, and 35℃ with 0.25, 0.5, 1.0, and 1.5 mM of arsenate…………………..50
Table 6. Activation energies of adsorption of different oxyanions onto different adsorbents under
the similar experimental condition as done in this study.………………………………………...54
x
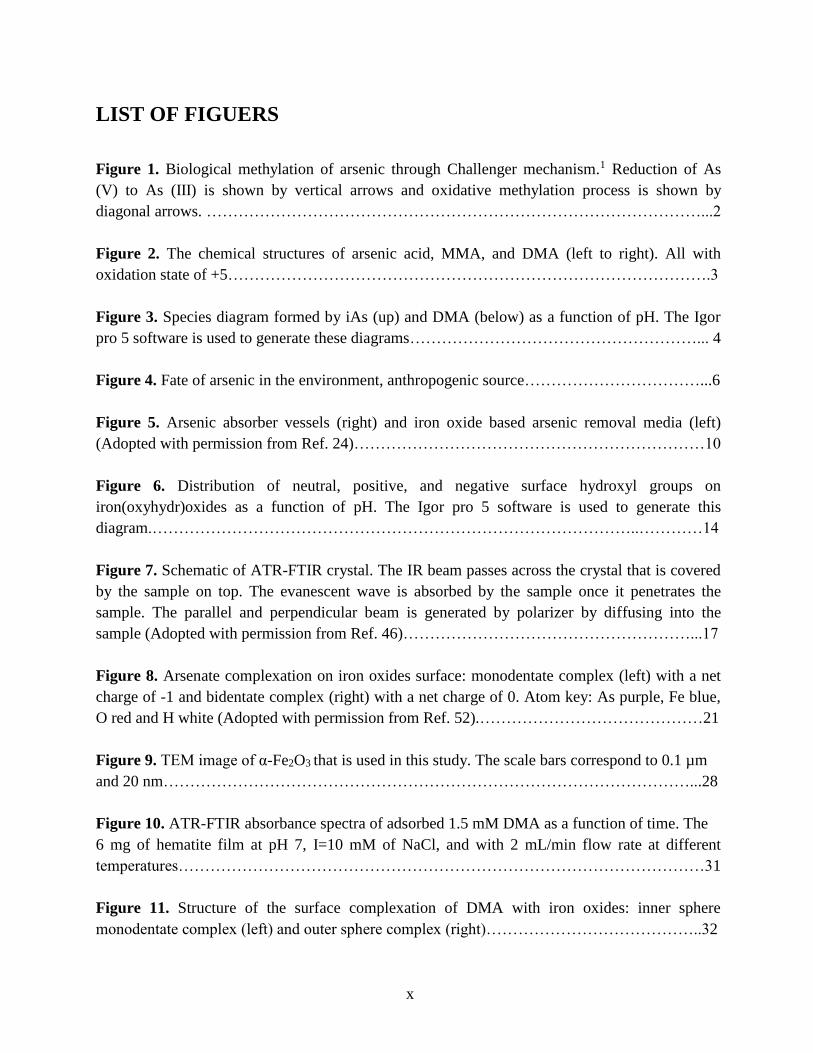
LIST OF FIGUERS
Figure 1. Biological methylation of arsenic through Challenger mechanism.1 Reduction of As
(V) to As (III) is shown by vertical arrows and oxidative methylation process is shown by
diagonal arrows. …………………………………………………………………………………...2
Figure 2. The chemical structures of arsenic acid, MMA, and DMA (left to right). All with
oxidation state of +5……………………………………………………………………………….3
Figure 3. Species diagram formed by iAs (up) and DMA (below) as a function of pH. The Igor
pro 5 software is used to generate these diagrams………………………………………………... 4
Figure 4. Fate of arsenic in the environment, anthropogenic source……………………………...6
Figure 5. Arsenic absorber vessels (right) and iron oxide based arsenic removal media (left)
(Adopted with permission from Ref. 24)…………………………………………………………10
Figure 6. Distribution of neutral, positive, and negative surface hydroxyl groups on
iron(oxyhydr)oxides as a function of pH. The Igor pro 5 software is used to generate this
diagram.………………………………………………………………………………..…………14
Figure 7. Schematic of ATR-FTIR crystal. The IR beam passes across the crystal that is covered
by the sample on top. The evanescent wave is absorbed by the sample once it penetrates the
sample. The parallel and perpendicular beam is generated by polarizer by diffusing into the
sample (Adopted with permission from Ref. 46)………………………………………………...17
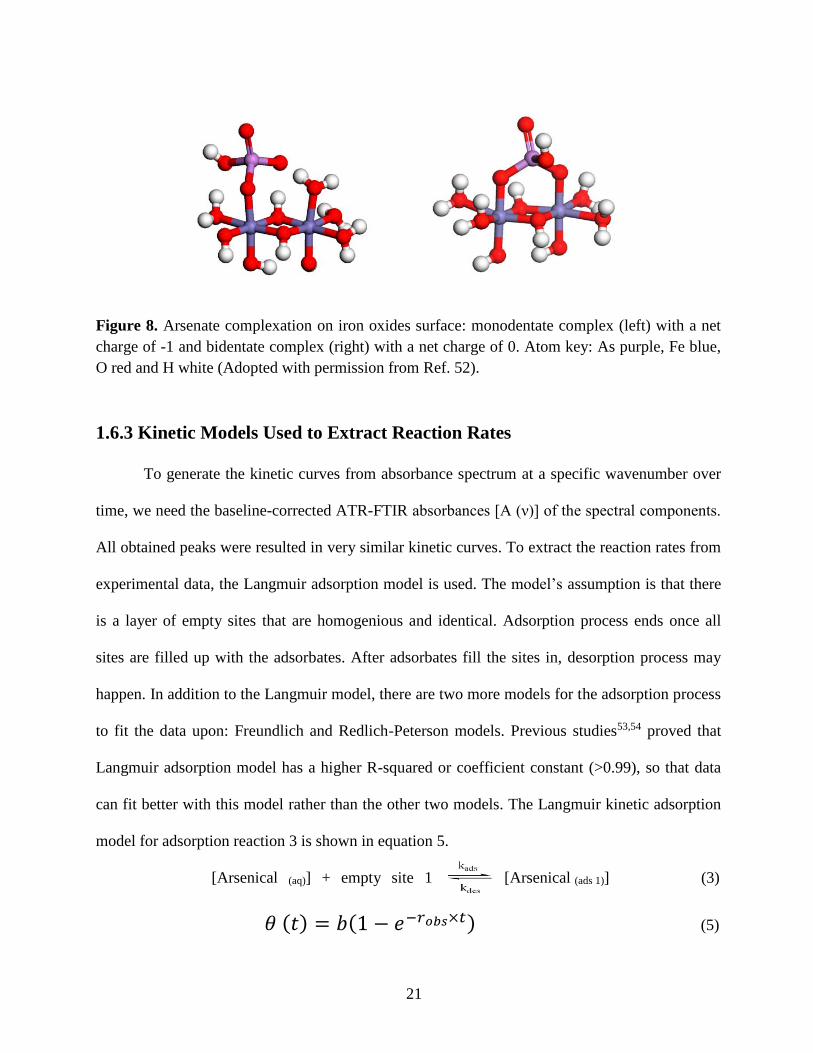
Figure 8. Arsenate complexation on iron oxides surface: monodentate complex (left) with a net
charge of -1 and bidentate complex (right) with a net charge of 0. Atom key: As purple, Fe blue,
O red and H white (Adopted with permission from Ref. 52).……………………………………21
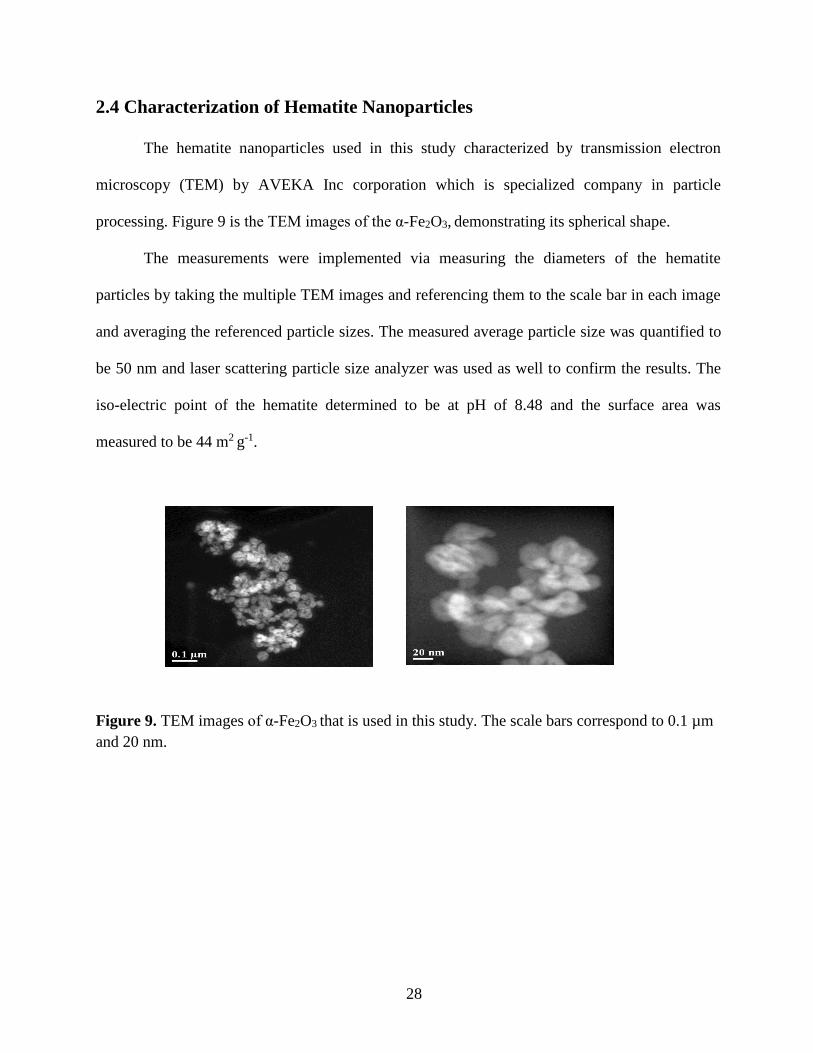
Figure 9. TEM image of α-Fe2O3 that is used in this study. The scale bars correspond to 0.1 µm
and 20 nm………………………………………………………………………………………...28
Figure 10. ATR-FTIR absorbance spectra of adsorbed 1.5 mM DMA as a function of time. The
6 mg of hematite film at pH 7, I=10 mM of NaCl, and with 2 mL/min flow rate at different
temperatures………………………………………………………………………………………31
Figure 11. Structure of the surface complexation of DMA with iron oxides: inner sphere
monodentate complex (left) and outer sphere complex (right)…………………………………..32
xi
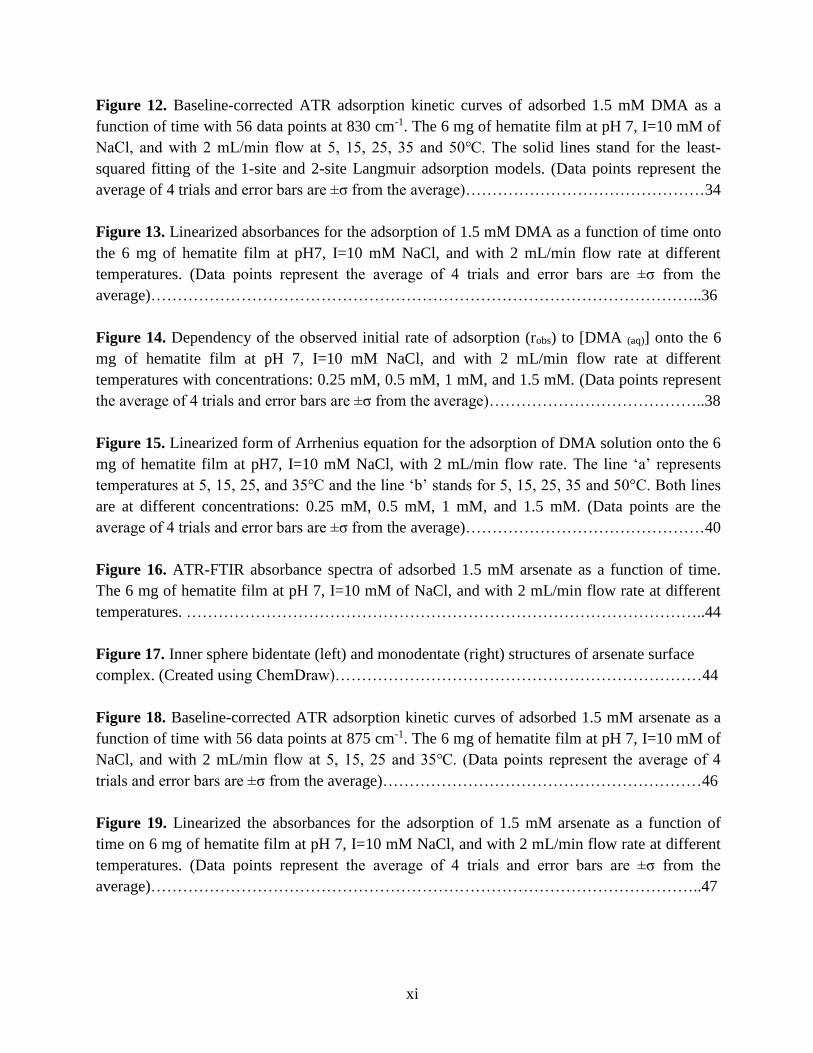
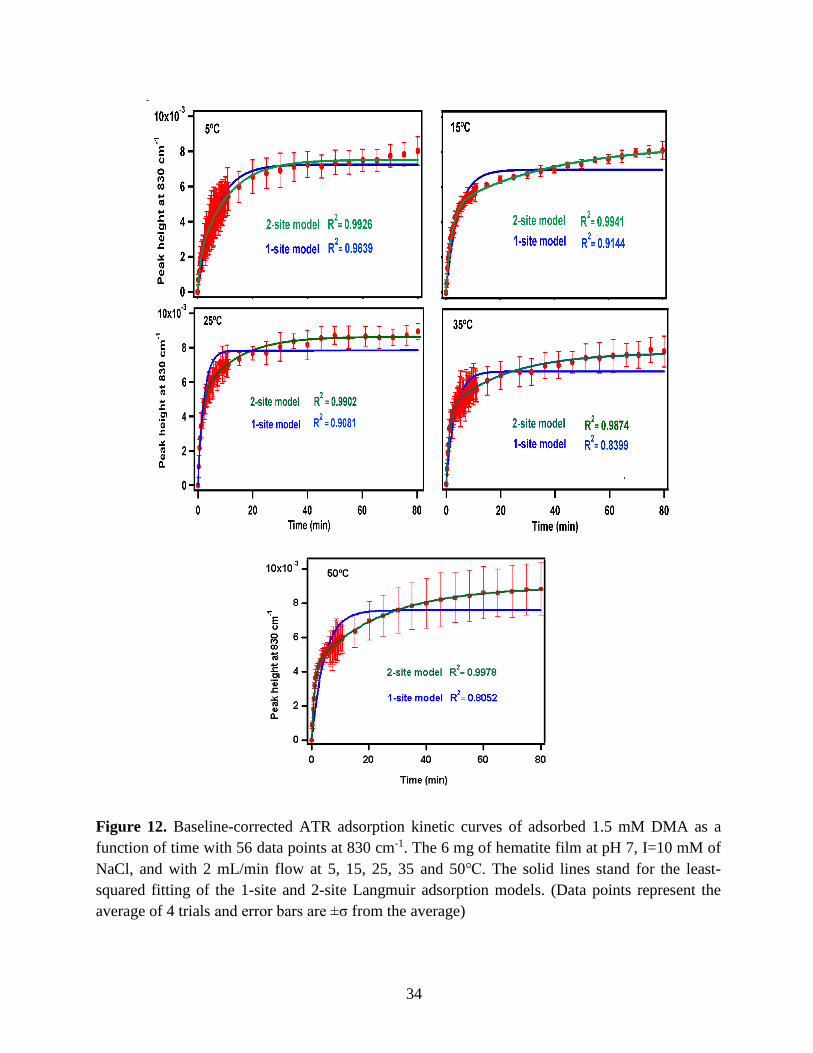
Figure 12. Baseline-corrected ATR adsorption kinetic curves of adsorbed 1.5 mM DMA as a
function of time with 56 data points at 830 cm-1. The 6 mg of hematite film at pH 7, I=10 mM of
NaCl, and with 2 mL/min flow at 5, 15, 25, 35 and 50℃. The solid lines stand for the least-
squared fitting of the 1-site and 2-site Langmuir adsorption models. (Data points represent the
average of 4 trials and error bars are ±σ from the average)………………………………………34
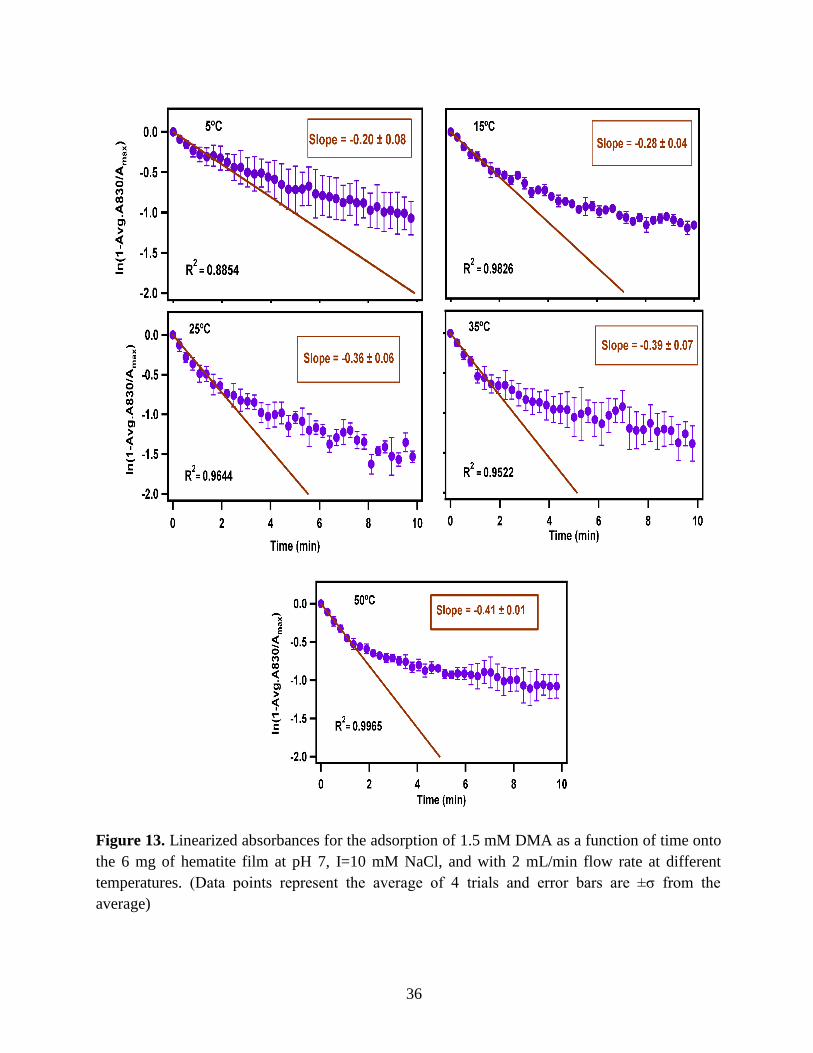
Figure 13. Linearized absorbances for the adsorption of 1.5 mM DMA as a function of time onto
the 6 mg of hematite film at pH7, I=10 mM NaCl, and with 2 mL/min flow rate at different
temperatures. (Data points represent the average of 4 trials and error bars are ±σ from the
average)…………………………………………………………………………………………..36
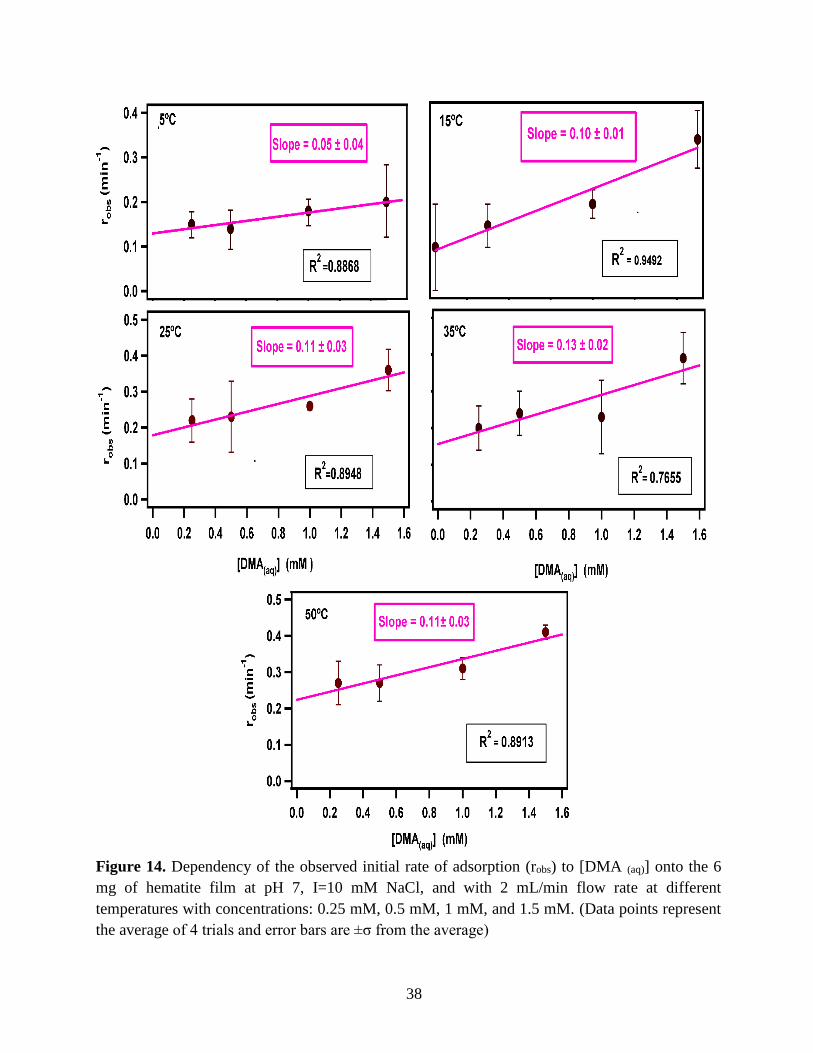
Figure 14. Dependency of the observed initial rate of adsorption (robs) to [DMA (aq)] onto the 6
mg of hematite film at pH 7, I=10 mM NaCl, and with 2 mL/min flow rate at different
temperatures with concentrations: 0.25 mM, 0.5 mM, 1 mM, and 1.5 mM. (Data points represent
the average of 4 trials and error bars are ±σ from the average)…………………………………..38
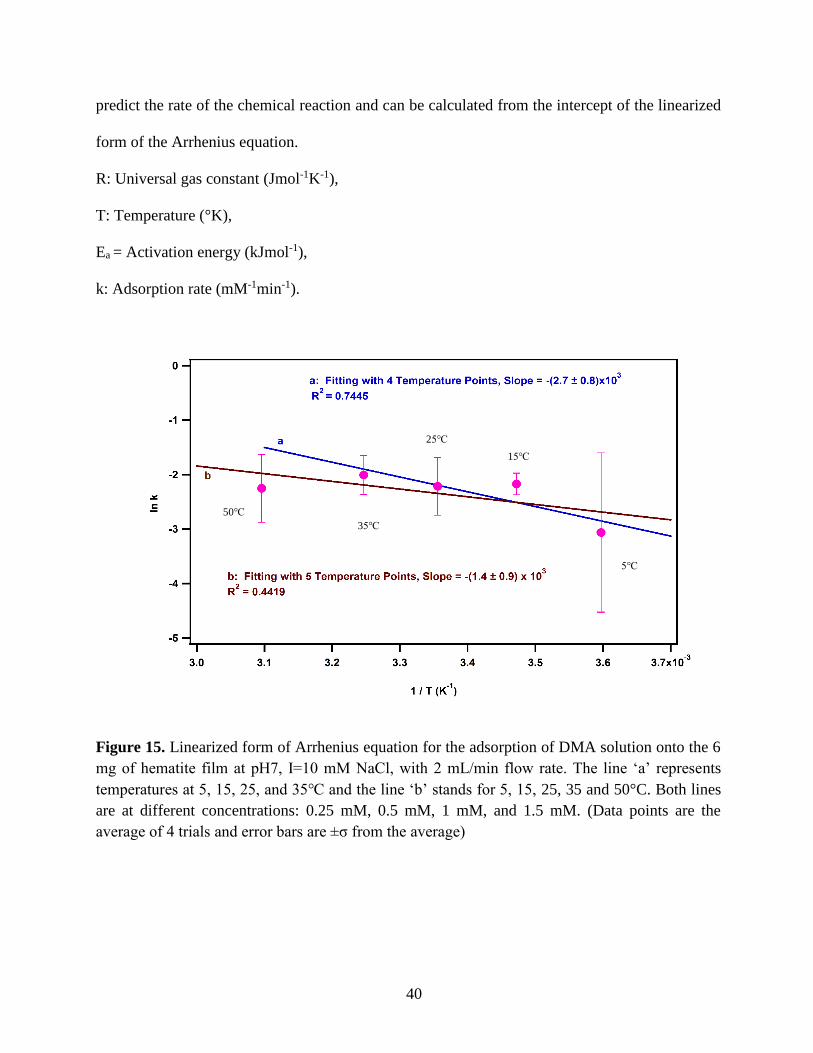
Figure 15. Linearized form of Arrhenius equation for the adsorption of DMA solution onto the 6
mg of hematite film at pH7, I=10 mM NaCl, with 2 mL/min flow rate. The line ‘a’ represents
temperatures at 5, 15, 25, and 35℃ and the line ‘b’ stands for 5, 15, 25, 35 and 50°C. Both lines
are at different concentrations: 0.25 mM, 0.5 mM, 1 mM, and 1.5 mM. (Data points are the
average of 4 trials and error bars are ±σ from the average)………………………………………40
Figure 16. ATR-FTIR absorbance spectra of adsorbed 1.5 mM arsenate as a function of time.
The 6 mg of hematite film at pH 7, I=10 mM of NaCl, and with 2 mL/min flow rate at different
temperatures. ……………………………………………………………………………………..44
Figure 17. Inner sphere bidentate (left) and monodentate (right) structures of arsenate surface
complex. (Created using ChemDraw)……………………………………………………………44
Figure 18. Baseline-corrected ATR adsorption kinetic curves of adsorbed 1.5 mM arsenate as a
function of time with 56 data points at 875 cm-1. The 6 mg of hematite film at pH 7, I=10 mM of
NaCl, and with 2 mL/min flow at 5, 15, 25 and 35℃. (Data points represent the average of 4
trials and error bars are ±σ from the average)……………………………………………………46
Figure 19. Linearized the absorbances for the adsorption of 1.5 mM arsenate as a function of
time on 6 mg of hematite film at pH 7, I=10 mM NaCl, and with 2 mL/min flow rate at different
temperatures. (Data points represent the average of 4 trials and error bars are ±σ from the
average)…………………………………………………………………………………………..47
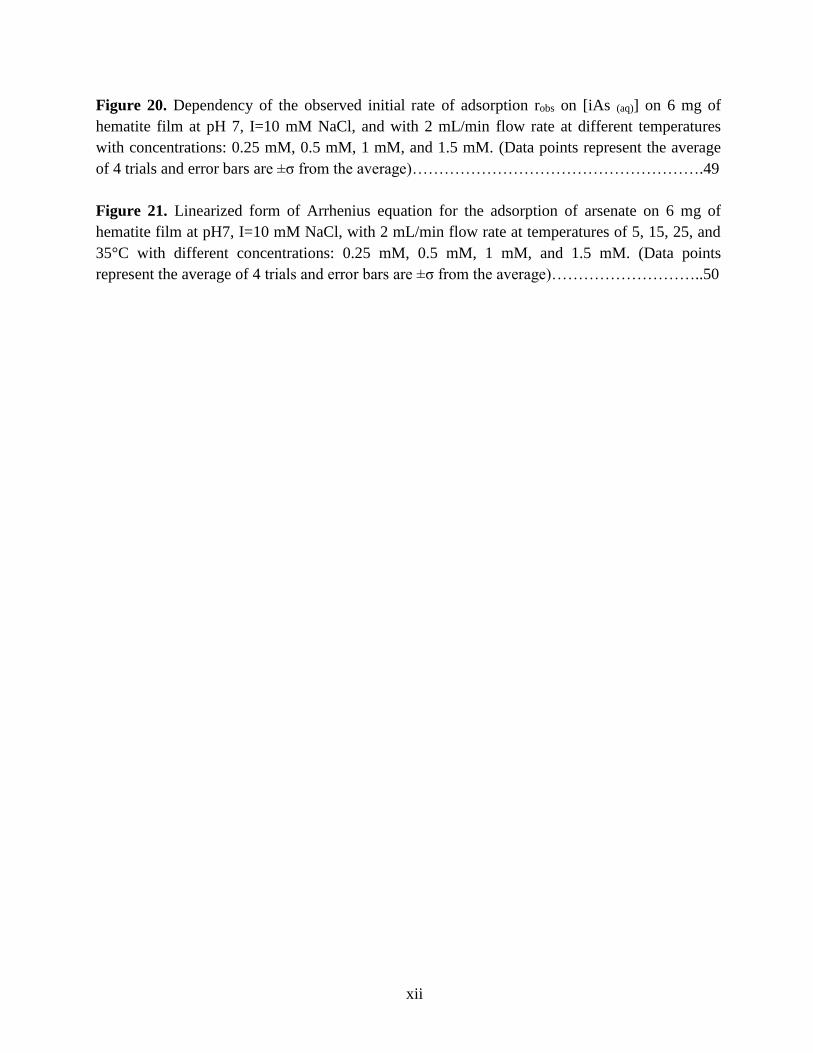
xii
Figure 20. Dependency of the observed initial rate of adsorption robs on [iAs (aq)] on 6 mg of
hematite film at pH 7, I=10 mM NaCl, and with 2 mL/min flow rate at different temperatures
with concentrations: 0.25 mM, 0.5 mM, 1 mM, and 1.5 mM. (Data points represent the average
of 4 trials and error bars are ±σ from the average)……………………………………………….49
Figure 21. Linearized form of Arrhenius equation for the adsorption of arsenate on 6 mg of
hematite film at pH7, I=10 mM NaCl, with 2 mL/min flow rate at temperatures of 5, 15, 25, and
35°C with different concentrations: 0.25 mM, 0.5 mM, 1 mM, and 1.5 mM. (Data points
represent the average of 4 trials and error bars are ±σ from the average)………………………..50
1
CHAPTER 1: INTRODUCTION AND LITERATURE REVIEW
1.1 Natural Sources of Arsenic in the Environment and Speciation as a
Function of pH
Arsenic is distributed in the environment to a great extent and is twentieth in terms of
abundance for elements in the earth’s crust. It is more abundant than Ag, Cd, Au, Hg, Se and Sb,
and less abundant than Sn and Cu.2 Arsenic is estimated to be 4.01.1016 kg in the upper layer of
the earth with the average of 6 mg/kg.3–5 In general, the arsenic accumulation cycle occurs at
3.7.106 Kt in the oceans, 9.97.105 Kt on the earth, 25.109 Kt in sediments, and 8.12 Kt in the
atmosphere.6 Sediments contained between 0.1 and 490 mg/kg of arsenic. Arsenic is mostly
associated with sulfide minerals in the environment. There are some arsenic bearing minerals
such as enargite (Cu3AsS4), cobaltite (CoAsS), niccolite (NiAs), mispickel (FeAsS), loellingite
(FeAs2), realgar (AsS), tennantite (Cu12As4S13), and orpiment (As2S3).4,5,7,8 Through volcanic
activity, arsenic is emitted into the atmosphere at an amount of 17150 t, via the ocean at an
amount of 27 t, and by the burning of woods in the naturally occurring forest fires at an amount
of 125-3345 t per year. Arsenic concentration in the air and in the areas that are not affected by
human activities is only a few nanograms per cubic meter.2 Its concentration in sea water is
between 0.09 μM/L and 24 μg/L (average of 1.5 μg/L), and varies in freshwater between 0.15
μg/L and 0.45 μg/L (maximum: 1 mg/L)9, and in mineral and thermal waters was found up to be
a factor of 300 of the average concentration of arsenic in groundwater.
Arsenic can be found in both inorganic (iAs) and organic forms with the oxidation states
of +3 and +5.10 Inorganic As (V), such as arsenate (H3AsO4), is dominant under oxidizing
conditions, and inorganic As (III), such as arsenite (H3AsO3), is dominant under reducing
2
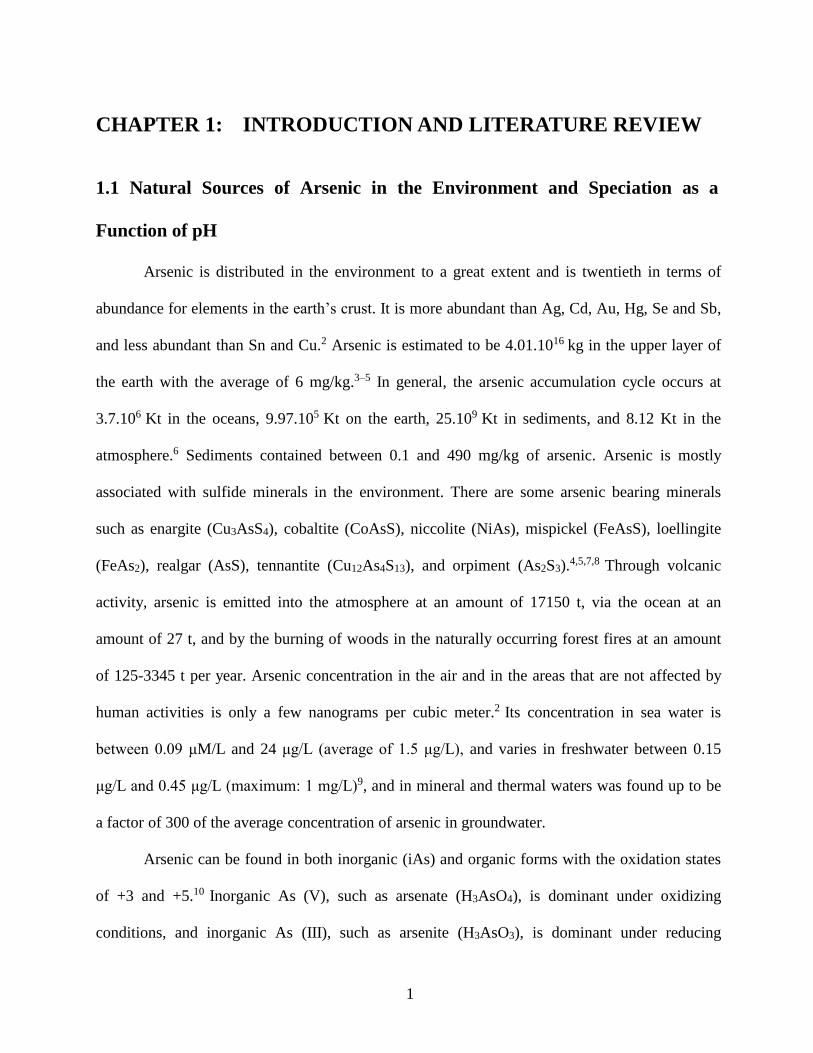
conditions.10 The organic arsenic is the outcome of the methylation process of the inorganic
arsenic in the nature and this occurs in the presence of microbial activities in the environment.
Figure 1 exhibits the chain on how organic arsenic forms from inorganic arsenic via methylation
by natural microbial activities.1
Figure 1. Biological methylation of arsenic through Challenger mechanism.1 Reduction of As
(V) to As (III) is shown by vertical arrows and oxidative methylation process is shown by
diagonal arrows. (Created using ChemDraw)
Due to the high bacterial activities, the rate of the methylation process increases in
summer when the temperature is higher.1 The most common organic compounds of arsenic are
dimethylarsinic acid (DMA)11 and monomethylarsonic acid (MMA).11
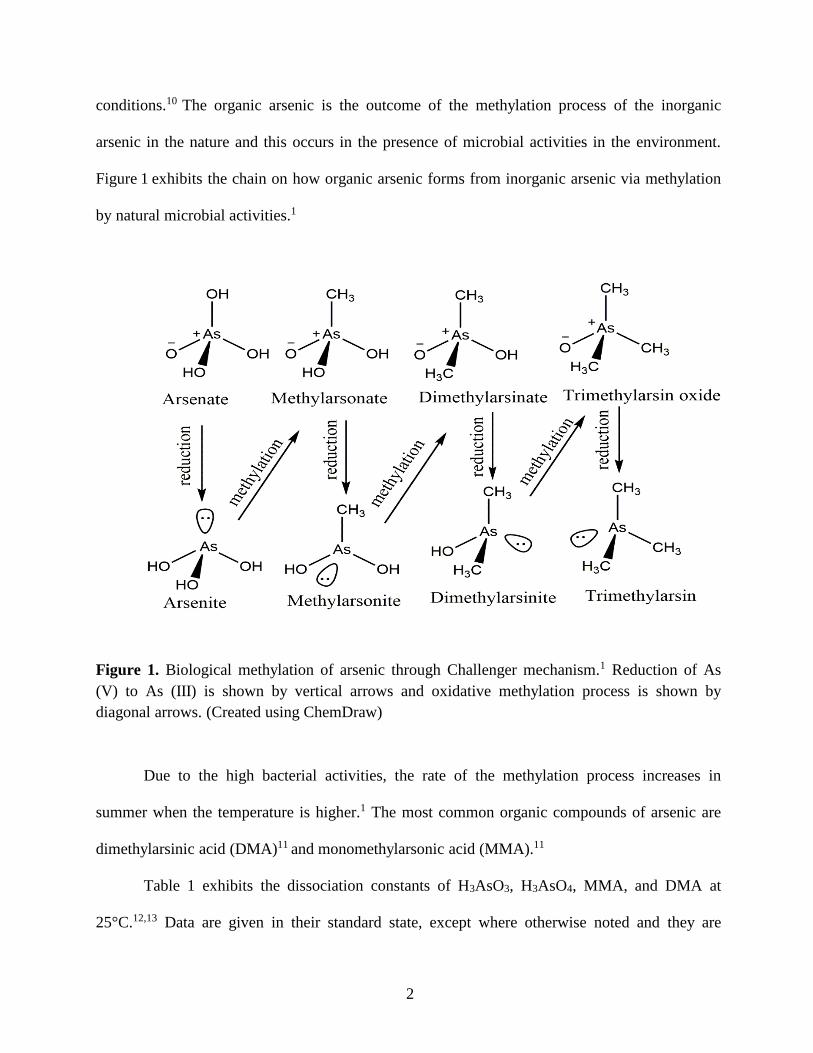
Table 1 exhibits the dissociation constants of H3AsO3, H3AsO4, MMA, and DMA at
25°C.12,13 Data are given in their standard state, except where otherwise noted and they are
3
referring to 25℃, 1 atm pressure, and zero ionic strength in water. Dissociation constant defines
the affinity of a substance in a solution to reversibly dissociate into smaller components. The pH
in which the hydrogens become dissociated are required in order to distinguish between species
in terms of the electrostatic charges at under the working pH. Knowing the type of species at any
pH helps in the adsorbent selectivity. When the negative species are dominant under the pH of
the interest, the surface of the selected adsorbent should mostly be positively charged and vice
versa. Figure 2 displays the chemical structures of iAs, MMA, and DMA that signify the
hydrogens that can be dissociated.
Table 1: Dissociation constants (pKa) of some arsenicals at 25°C 12,13
Arsenicals pK1 pK2 pK3
H3AsO3, As (III) 9.2 12.1 13.4
H3AsO4, As(V) 2.2 7.0 11.5
MMA 3.6 8.2 -
DMA 6.3 - -
Figure 2. The chemical structures of arsenic acid, MMA, and DMA (left to right). All with
oxidation state of +5.
As
O
HOOH
OH
As
O
HO
HO
CH3
As
O
HO
H3C
CH3
4
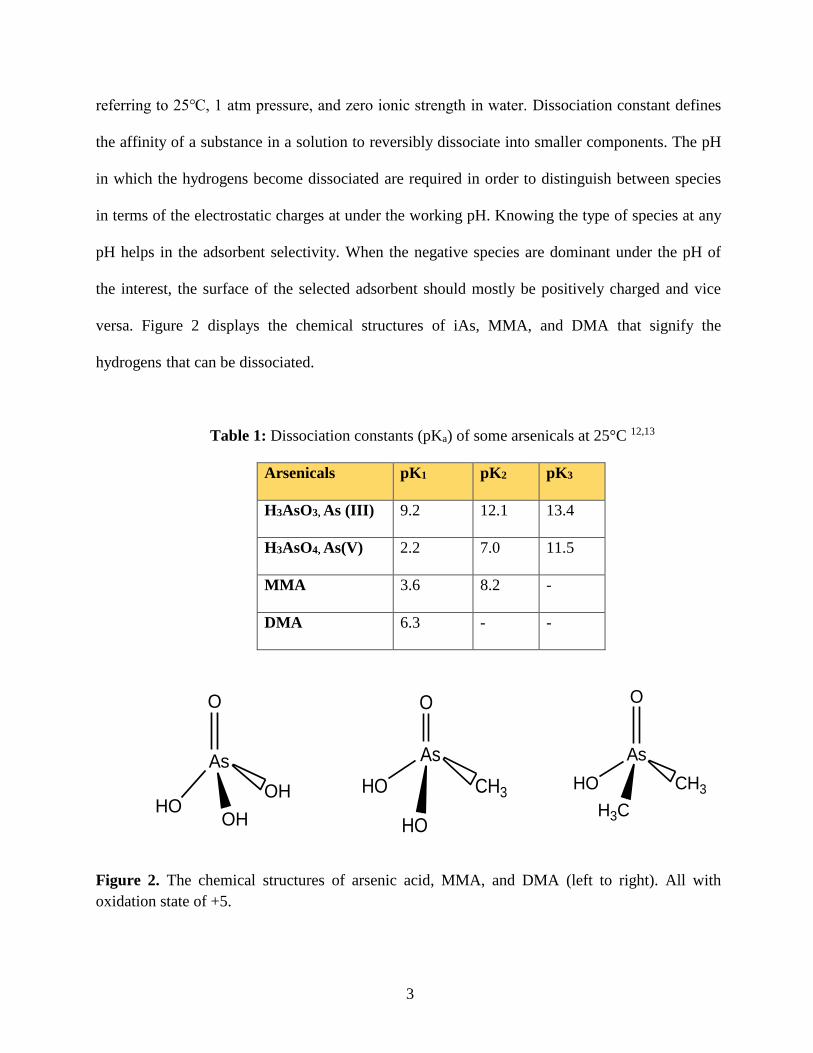
Factors governing the arsenic speciation are mainly pH and redox potential (Eh). The pH
is one of the most important factors in defining the arsenic speciation14 and that we focused on
pH in this thesis. At pH less than 6.9 and under oxidizing condition, H2AsO4- is the dominant
species, while at higher pH, HAsO42- is the dominant species.1 At extremely acidic and basic
condition, H3AsO4 and AsO43-, respectively, maybe present. At pH less than 9.2 and under
reducing condition, the neutral arsenite species (H3AsO3) predominates.3 DMA ((CH3)2AsO2H)
becomes deprotonated above pH 6.3 and becomes (CH3)2AsO2-.
The distribution diagram for arsenate and DMA species as a function of pH are depicted in
Figure 3.
Figure 3. Species diagram formed by iAs (upper panel) and DMA (lower panel) as a function of
pH. (Created using Igor pro 5 software)
5
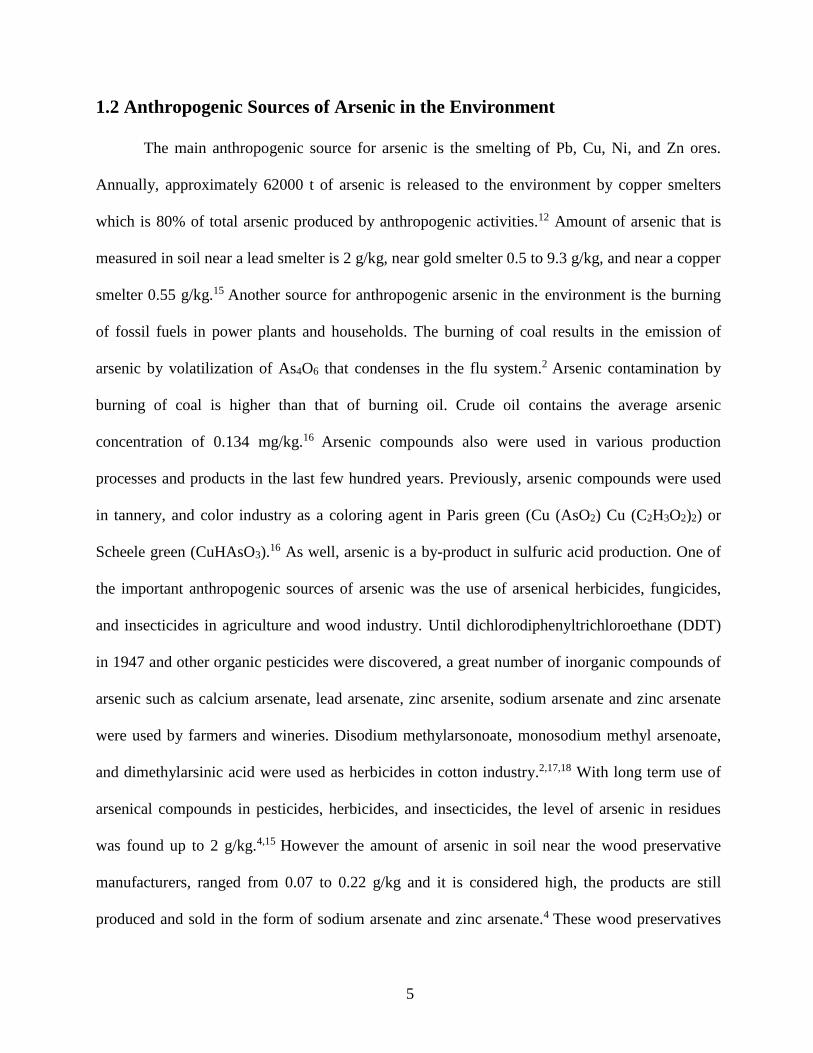
1.2 Anthropogenic Sources of Arsenic in the Environment
The main anthropogenic source for arsenic is the smelting of Pb, Cu, Ni, and Zn ores.
Annually, approximately 62000 t of arsenic is released to the environment by copper smelters
which is 80% of total arsenic produced by anthropogenic activities.12 Amount of arsenic that is
measured in soil near a lead smelter is 2 g/kg, near gold smelter 0.5 to 9.3 g/kg, and near a copper
smelter 0.55 g/kg.15 Another source for anthropogenic arsenic in the environment is the burning
of fossil fuels in power plants and households. The burning of coal results in the emission of
arsenic by volatilization of As4O6 that condenses in the flu system.2 Arsenic contamination by
burning of coal is higher than that of burning oil. Crude oil contains the average arsenic
concentration of 0.134 mg/kg.16 Arsenic compounds also were used in various production
processes and products in the last few hundred years. Previously, arsenic compounds were used
in tannery, and color industry as a coloring agent in Paris green (Cu (AsO2) Cu (C2H3O2)2) or
Scheele green (CuHAsO3).16 As well, arsenic is a by-product in sulfuric acid production. One of
the important anthropogenic sources of arsenic was the use of arsenical herbicides, fungicides,
and insecticides in agriculture and wood industry. Until dichlorodiphenyltrichloroethane (DDT)
in 1947 and other organic pesticides were discovered, a great number of inorganic compounds of
arsenic such as calcium arsenate, lead arsenate, zinc arsenite, sodium arsenate and zinc arsenate
were used by farmers and wineries. Disodium methylarsonoate, monosodium methyl arsenoate,
and dimethylarsinic acid were used as herbicides in cotton industry.2,17,18 With long term use of
arsenical compounds in pesticides, herbicides, and insecticides, the level of arsenic in residues
was found up to 2 g/kg.4,15 However the amount of arsenic in soil near the wood preservative
manufacturers, ranged from 0.07 to 0.22 g/kg and it is considered high, the products are still
produced and sold in the form of sodium arsenate and zinc arsenate.4 These wood preservatives
6
are about 40% of the total consumption of arsenic in the United States.18 Arsenic compounds
have been also used in medicinal products before antibiotic was discovered. A solution of
potassium arsenite was used in the treatment for leukaemia and psoriasis.18 Glass manufacturing
also uses arsenic compounds in order to boost the corrosion resistance and hardness in their
products.2 Moreover, arsenic compounds are also used in the production of catalysts and
semiconductor industry.8,9,19 Arsenolite (As2O3), is the economical and the most important
arsenic compound in a by-product of smelting Au, Co, Cu and Pb.8,20 World production of
arsenic was 63939 t in 1970, 31620 t in 1980 and 47632 t in 1990 and 30453 t in 1993.5,8 Figure 4
portrays the environmental fate of arsenic via anthropogenic activities.
Figure 4. Fate of arsenic in the environment, anthropogenic source. (Created using PowerPoint)
7
1.3 Toxicity of Arsenic and Environmental Regulations
In general, the acute toxicity and availability of arsenic depends very much on its
chemical form whether the compound is in organic or inorganic form, oxidation state, solubility,
physical state, purity, and the rates of adsorption and desorption.21,22 Overall, the toxicity of
oxidation state of (+3) is more than that of oxidation state of (+5) and also inorganic arsenic is
more toxic than organic arsenic. The order of the arsenic toxicity is: iAs (III) > methylarsenic
(III) > iAs (V) > methylarsenic (V).23 In case of arsenite, it binds to some specific enzymes and
inhibits their activity and in case of arsenate, it is a phosphate analog and prevents the production
of the ATP. When arsenate is transported to the live cells, it usually becomes reduced to arsenite.
The amount of arsenic that a body can accumulate depends on the particle size and their
solubility.24 Particle size is inversely proportional to penetration depth of the particle into the
tissues inside the body, and the solubility determines that how fast and to what extent arsenic can
absorb into the blood stream.25 Arsenic can cause cardiovascular diseases, too. Arsenic is also
carcinogenic and causes skin, lung, bladder, and kidney cancer after prolong exposure to it. The
carcinogenic activity of arsenic is due to its functionality in generating the radical oxygen.21,26
One possible mechanism in generating the reactive oxygen species is higher affinity of trivalent
arsenic for thiol compounds.27 Trivalent form can be obtained by reducing the pentavalent form.
Trivalent form also can go through methylation process and become methylated pentavalent
during the hepatic metabolism. As well, the speed of arsenical absorption and elimination
determine their toxicity level. If the absorption of arsenical occurs faster than their excretion, they
are considered more toxic and vice versa.28 The solubility of arsenate and arsenite in water is
high, so they are prone to have a risk via direct ingestion. DMA in particular plays a significant
role in carcinogenic diseases among other inorganic arsenics since it is able to generate free
8
oxygen (O., free radical) easily.26 DMA also is the major metabolite compound after exposure to
pentavalent and trivalent inorganic arsenic through inhalation and ingestion in both rodents and
humans.26 Long exposure to arsenate and DMA via diet causes bladder tumor in rats, confirming
that arsenate and DMA are definitely carcinogens.29
Due to high carcinogenic and toxicological effects of arsenic,30Environment Canada
classified it as a Schedule 1 Substance upon the Canadian Environmental Protection Act
(CEPA).30 Regulations of arsenic are varied based on the geological condition of the location, soil
and water, and intake from food or non-food paths.30 The World Health Organization (WHO)
identifies 0.010 mg/L as the maximum acceptable concentration for arsenic in drinking water;
however, it can be up to 0.05 mg/L in developing countries. In soils, the concentration of arsenic
varies from 4.8 to 13.6 mg/kg which is not considered so toxic, so higher than 14 mg/kg is
toxic.30
1.4 Arsenic Removal Technology
There are some techniques to remove the contaminated water by arsenicals. The main
techniques are as below:24
1.4.1 Coagulation/filtration:
Metal salts such as aluminum and iron have been used in coagulation process as a
coagulant that is the most severely documented technique for removing arsenic from
water. Coagulation involves three steps:
a) Precipitation: that insoluble compounds form in this stage
b) CO-precipitation: that is the amalgamation of soluble arsenic species into
a developing metal hydroxide stages; e.g. co-precipitation with Fe (III)
9
c) Adsorption: that soluble arsenic bind to outer layer (surface) of the
insoluble metal hydroxide
The pH factor and coagulation dose (amount of coagulation) mainly control the
coagulation process. Coagulation with alum works best at pH range of 6-8 and
coagulation with ferric is effective at pH below 8. After arsenic turned out to be
coagulated, filtration process comes to play. Membrane filtration is being used in this
step to filter the coagulated materials.
1.4.2 Membrane filtration:
Usually, there are two types of membrane filtration: Low-pressure and high-pressure
membranes. Low-pressure membranes such as ultrafiltration and microfiltration and
high-pressure membranes such as reverse osmosis and nanofiltration. Membrane
technique is pH independent, but the presence of colloidal matters can reduce the
functionality of the membrane and once membrane stained with impurities, it cannot be
backwashed. To avoid clogging, water needs to be pre-treated.
1.4.3 Adsorption:
Adsorption is a process that in which solid medium (adsorbent) is used for removing
the substances from liquid or gaseous solutions (adsorbate). Electrostatic and van der
Waals forces are mainly drive the interactions between the substances of adsorbate and
atoms of surface of adsorbent. Hence, before being used for adsorption, the
characterization of properties of adsorbent surface such as polarity and surface area is
important. A broad type of adsorbents has been already studied in numerous research
fields. These consist of hematite (α-Fe2O3), goethite (FeOOH), kaolinite
10
(Al2Si2O5(OH)4, clay mineral), coal, red mud, activated carbon, activated alumina,
titanium dioxide and chicken feathers. Gupta et al.31 proved that iron-based adsorption
is an evolving technique for treatment of arsenic-contaminated water comparing to the
other absorbents. Gupta’s group illustrated that there is high attraction between iron
and arsenic species. Iron can remove arsenic from water through acting as an
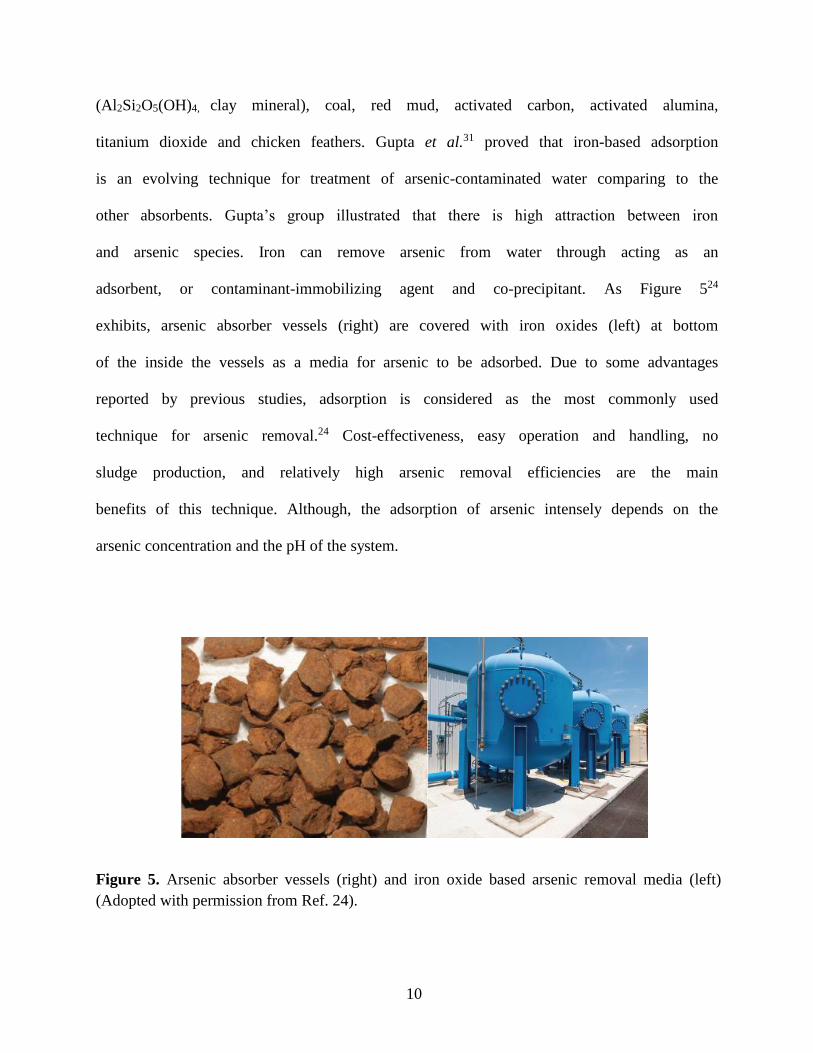
adsorbent, or contaminant-immobilizing agent and co-precipitant. As Figure 524
exhibits, arsenic absorber vessels (right) are covered with iron oxides (left) at bottom
of the inside the vessels as a media for arsenic to be adsorbed. Due to some advantages
reported by previous studies, adsorption is considered as the most commonly used
technique for arsenic removal.24 Cost-effectiveness, easy operation and handling, no
sludge production, and relatively high arsenic removal efficiencies are the main
benefits of this technique. Although, the adsorption of arsenic intensely depends on the
arsenic concentration and the pH of the system.
Figure 5. Arsenic absorber vessels (right) and iron oxide based arsenic removal media (left)
(Adopted with permission from Ref. 24).
11
1.4.4 Oxidation:
Oxidation process implicates the conversion of soluble arsenite to arsenate. Oxidation
is an essential step for anoxic groundwater as arsenite is the trivalent form of arsenic at
near to the natural pH. In addition to atmospheric oxygen, there are some chemicals as
well as bacteria, have already been exploited to oxidize arsenite in water directly; such
as chlorine, ozone, hypochlorite, and chemoautotrophic arsenite-oxidizing bacteria.
Oxidizing the As (III) to As (IV) with oxygen is a low speed process that usually takes
hours and weeks to end, whereas oxidizing with chemicals such as permanganate,
ozone, and chlorine can rapidly happen. Also, removing the substances exist in the
water requires to be considered for selecting the proper oxidizing agent since kinetic of
oxidation can be affected by the substances present in the water. For example, the
oxidation rate of arsenite by ozone can be significantly decreased by S2- if it is present
in water. Therefore, with all cited drawbacks about the oxidation process, it appears to
be less capable to remove the arsenic from drinking water.
1.4.5 Ion exchange:
Ion exchange is akin to that of activated alumina and just the medium is a synthetic
resin with a better capacity for ion exchange. A synthetic resin is a cross-linked
polymer skeleton that is called matrix. Matrix contains charge functional groups that
are covalent bonded and classified into basic, weakly basic, acidic, and strongly acidic
group. The ion exchange is independent from the pH of water. As a result, uncharged
arsenite cannot be removed by ion exchange process and it needs to be pre-oxidized
from As (III) to As(V) in order to be removed by ion exchange. The excess of the
12
oxidant may cause a damage to the sensitive resins, so to avoid that, oxidant requires to
be removed prior the process starts. The resin also can be exhausted and that it should
be revived by washing it with NaCl solution.
1.5 Chemical Compositions of Soil Influencing Arsenic Adsorption
1.5.1 Minerals and Metal Oxides
Minerals and metal oxides are vital parts of the soil composition and highly influence the
formation of geochemical interfaces in soil.1 Oxides of Mn, Fe, Al, and Si are main metal oxides
of soil with high surface area and active surface sites that results in a strong binding between
metal cations and oxyanions such as arsenicals. The binding affects the availability and mobility
of plant nutrients and toxic metals.1 Iron oxide is significant among all other metal oxides in soil
due to iron being major element in the earth’s crust, so it highly impacts the physical properties
of soil. Hematite (α-Fe2O3), magnetite (Fe3O4), and maghemite (γ-Fe2O3) are the main types of
iron oxides. Hematite has the hexagonal crystalline structure. Crystal parameters of hematite are
a=5.03Å and c=13.75Å and x-ray density is 5.28 g/cm3.32
Effectiveness of the interactions on the surface depends mainly on the speciation of the
adsorbates at a specific pH and surface charge of adsorbent.32 The term point of zero charge
(PZC), indicates the surface condition when the net electrical charge density of the surface is
zero. It is also described as a pH in which the electrical charge of the surface is zero. For
example, hydrous ferric oxide (HFO) at PZC has equal concentration of (≡FeO-) and (≡FeOH2+)
on the surface. The PZC is usually recognized by acid-base titrations of colloidal dispersion by
monitoring of the pH of the suspension. The concept isoelectric point (IEP) also indicates the
condition of surface charge that pH of colloidal particle at this point remains same in an electrical
field. The IEP and PZC are somewhat different at the particle surface; this difference, however, is
13
usually ignored for the surfaces with having no special charged species which is called pristine
surfaces. Therefore, in the absence of any adsorbed negative or positive species, IEP on the
surface is considered equal to the PZC.33 Several factors affect the PZC/IEP values, such as
temperature, foreign ions, and mostly impurities. For iron oxide, with increasing the temperature,
the PZC values drops since ionization constant of water goes up and therefore the relative affinity
of protons for the surface rises.34
At high temperature, oxide surface becomes dehydroxylated and leads to acid shift in the
PZC.34 To lower the PZC to a lower pH value, it needs to a specific adsorption of cations, while
anions increase the PZC to higher pH value.34 When metal ion remains in contact with water, it
results in dissociative sorption of water via proton transfer and that forms hydroxyl groups on the
oxide surface.35 Water is absorbed to the surface containing hydroxyl groups and afterwards
oxide/water interface becomes saturated with water. There are two kinds of hydroxyl groups on
the iron (oxyhydr)oxides surface: hydroxyl group bound with one metal ion or singly
coordinated, and hydroxyl group bound with two metal ions or doubly coordinated. In doubly
coordinated, strong polarization occurs by metal ion, and therefore, it is acidic in nature. On the
other side, in singly coordinated, polarization of OH groups by metal ion (cation) is not strong
enough so that it can get replaced by anions with demonstrating the basic characteristics.36 Since
iron (oxyhydr)oxide surfaces are amphoteric, so based on the hydroxyl group’s charge (positive,
neutral, negative) they can go under the following reactions:37
≡FeOH2+ ⇌ ≡FeOH + H+ pKa1 = 7 (1)
≡FeOH ⇌ ≡FeO- + H+ pKa2 = 9 (2)
Various types of surface complexes can be formed upon propensity of hydroxyl groups on
the surface to dissociate protons or coordinate that is also depend on charge on the oxide surface.
14
Chemical and electrical energies are two modes of energies required for drawing ions to the
surface.36
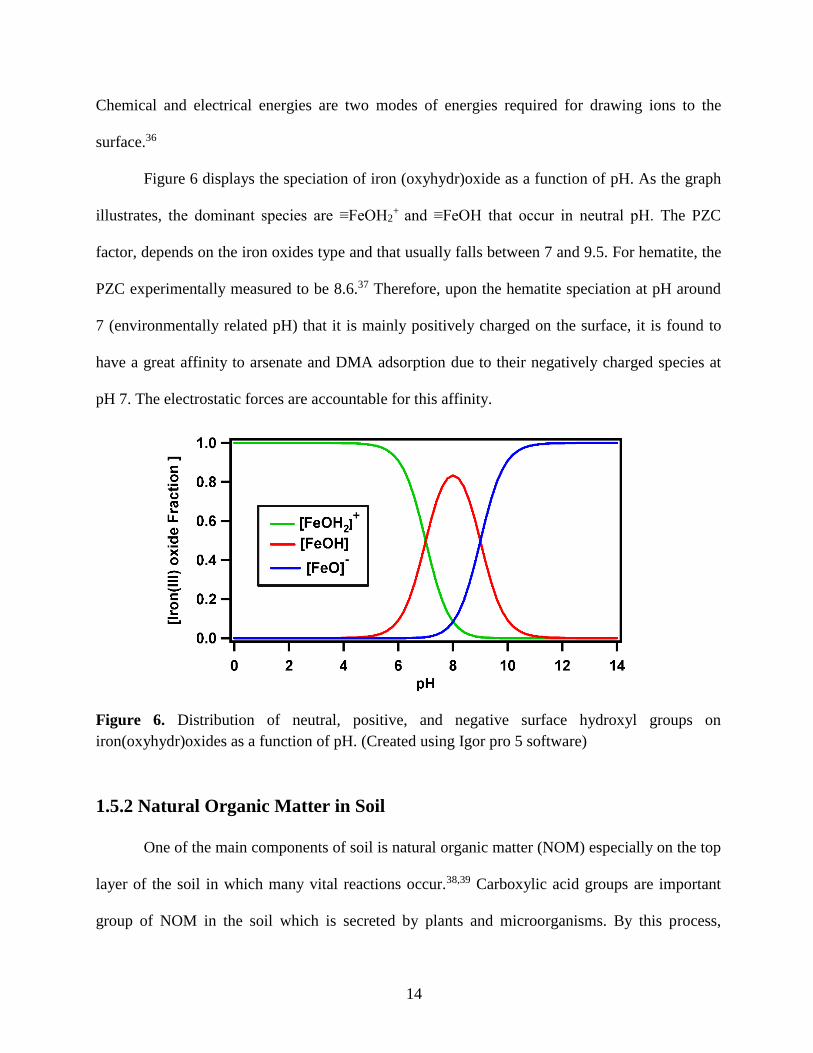
Figure 6 displays the speciation of iron (oxyhydr)oxide as a function of pH. As the graph
illustrates, the dominant species are ≡FeOH2+ and ≡FeOH that occur in neutral pH. The PZC
factor, depends on the iron oxides type and that usually falls between 7 and 9.5. For hematite, the
PZC experimentally measured to be 8.6.37 Therefore, upon the hematite speciation at pH around
7 (environmentally related pH) that it is mainly positively charged on the surface, it is found to
have a great affinity to arsenate and DMA adsorption due to their negatively charged species at
pH 7. The electrostatic forces are accountable for this affinity.
Figure 6. Distribution of neutral, positive, and negative surface hydroxyl groups on
iron(oxyhydr)oxides as a function of pH. (Created using Igor pro 5 software)
1.5.2 Natural Organic Matter in Soil
One of the main components of soil is natural organic matter (NOM) especially on the top
layer of the soil in which many vital reactions occur.38,39 Carboxylic acid groups are important
group of NOM in the soil which is secreted by plants and microorganisms. By this process,
15
nutrients such as iron and phosphorus become available.40 Beside plant decomposition, soil can
be enriched with organic supplements by degrading the organic matter into the soil. As well,
NOM is nutritious for some useful microorganism by helping them in retaining the water for
boosting the soil fertility.40,41 The size and functional group of NOM vary by its molecular
weight. NOM is characterized as either humic acids or fulvic acids. Humic acids are the organic
compounds of the soil and fulvic acids are the organic acids of the soil. NOM is high in
concentration at top layer of the soil that is known as O-horizon (an specific layer in the soil).39
NOM’s retention in the soil is strongly depend on content of the active components in the soil
such as aluminum oxide and iron.39,42 The long-term reservoir of carbon through burial process in
addition to the long-term retention of NOM inside the soil affect the adsorption of NOM to the
geosorbents like iron and aluminium oxides in the soil. Through bio-mineralization to CO2 or
weathering process, organic matter can be removed from soil and this occurrence leaches the
NOM to the surface or ground water.40 NOM in water can firmly interact with arsenic and
influence its mobility, speciation, and bioavailability. NOM may impact the mobility and
solubility of arsenic primarily throughout redox reactions, adsorption, and complexation. The
interrelate between NOM and arsenic is subjective by numerous factors such as pH, arsenic
concentration, other complexing ligands and competitor ions, and kinetic reactions.43 Redman et
al.44 tested six NOM samples and observed that four of them developed aqueous complexes with
arsenic. The level of the complexation altered with the NOM origin and intensely rose with the
content of the cationic metal (particularly Fe) of the NOM sample. Moreover, every NOM
sample in Redman et al.’s studies presented active redox behavior toward arsenic species,
denoting that NOM may significantly influence redox as well as complexation speciation of
arsenic in natural environment. When NOM and arsenic were incubated together with hematite,
16
NOM noticeably attained of sorption equilibrium and lessened the degree of sorption of arsenic.
Coherently with this result, when NOM and arsenic, both were injected, the NOM samples
replaced the adsorbed arsenic from surface of the hematite and similarly arsenic species replaced
adsorbed NOM from hematite surface in large extent. Competition between NOM and arsenic to
be adsorbed onto the hematite surface hence appears to be potentially significant procedure in
natural waters, proposing that NOM may play a pronounced role in arsenic mobility.44
1.6 Kinetics of Surface Chemistry of Arsenate (iAs) and Dimethylarsinic Acid
(DMA) with Soil Components
1.6.1 Basis of Operation for Techniques Used to Study Surface Chemistry: Bulk/Batch and
Infrared (ATR-FTIR)
To study the surface chemistry, bulk or batch technique and surface sensitive techniques
come to play. Bulk technique is an ex-situ technique that measures the amount of adsorbed
analyte by subtracting the final concentration of the solution from initial concentration of the
solution. In this technique, unlike the surface sensitive technique, the filtration of the sample is
required that it makes the sample preparation time consuming with possibility of errors
occurrence, and it as well needs to an expert technician who can run the analytical instruments.
For environmental relevant studies, batch or bulk techniques may not be beneficial because the
interaction of two phases of solid and liquid are not also studied directly. To study the reactions
that occurred at the interfaces, surface sensitive technique plays a major role.45 The apparatus
used herein as a surface sensitive technique is Attenuated Total Reflectance-Fourier Transform
Infrared Spectroscopy (ATR-FTIR). ATR-FTIR identifies the complexes that are formed in-situ
17
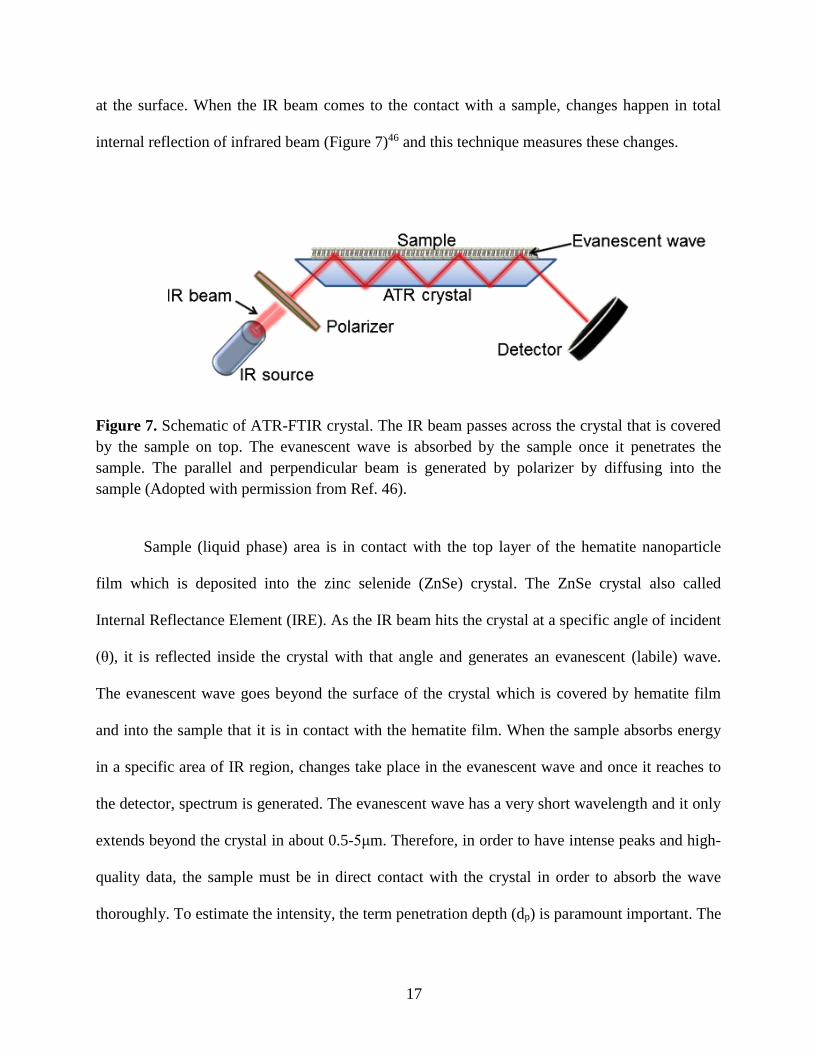
at the surface. When the IR beam comes to the contact with a sample, changes happen in total
internal reflection of infrared beam (Figure 7)46 and this technique measures these changes.
Figure 7. Schematic of ATR-FTIR crystal. The IR beam passes across the crystal that is covered
by the sample on top. The evanescent wave is absorbed by the sample once it penetrates the
sample. The parallel and perpendicular beam is generated by polarizer by diffusing into the
sample (Adopted with permission from Ref. 46).
Sample (liquid phase) area is in contact with the top layer of the hematite nanoparticle
film which is deposited into the zinc selenide (ZnSe) crystal. The ZnSe crystal also called
Internal Reflectance Element (IRE). As the IR beam hits the crystal at a specific angle of incident
(θ), it is reflected inside the crystal with that angle and generates an evanescent (labile) wave.
The evanescent wave goes beyond the surface of the crystal which is covered by hematite film
and into the sample that it is in contact with the hematite film. When the sample absorbs energy
in a specific area of IR region, changes take place in the evanescent wave and once it reaches to
the detector, spectrum is generated. The evanescent wave has a very short wavelength and it only
extends beyond the crystal in about 0.5-5μm. Therefore, in order to have intense peaks and high-
quality data, the sample must be in direct contact with the crystal in order to absorb the wave
thoroughly. To estimate the intensity, the term penetration depth (dp) is paramount important. The
18
effective penetration depth generates the clear and sharp peak. In addition, the refractive index of
the crystal should remarkably be greater than the refractive index of the sample. If the refractive
index of the crystal be smaller than that of the sample, internal reflectance will not occur, and the
beam will rather be transmitted.
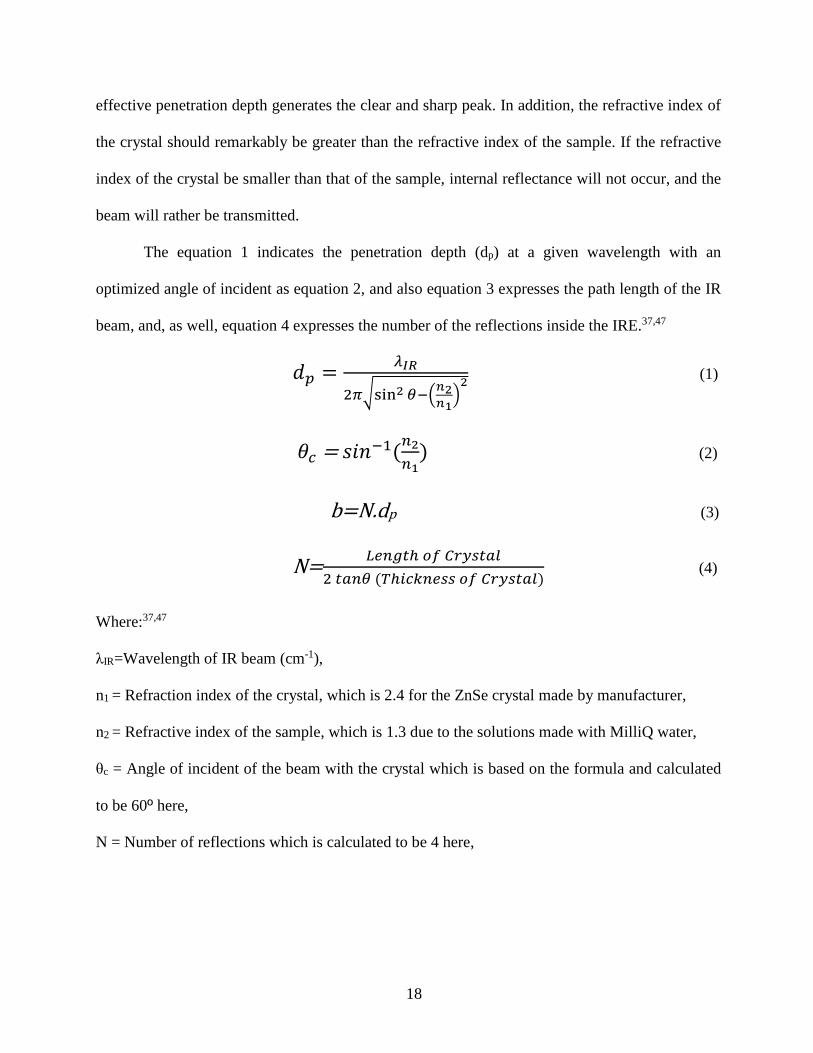
The equation 1 indicates the penetration depth (dp) at a given wavelength with an
optimized angle of incident as equation 2, and also equation 3 expresses the path length of the IR
beam, and, as well, equation 4 expresses the number of the reflections inside the IRE.37,47
𝑑𝑝 =𝜆𝐼𝑅
2𝜋√sin2 𝜃−(𝑛2𝑛1
)2 (1)
𝜃𝑐 = 𝑠𝑖𝑛−1(𝑛2
𝑛1) (2)
b=N.dp (3)
N=𝐿𝑒𝑛𝑔𝑡ℎ 𝑜𝑓 𝐶𝑟𝑦𝑠𝑡𝑎𝑙
2 𝑡𝑎𝑛𝜃 (𝑇ℎ𝑖𝑐𝑘𝑛𝑒𝑠𝑠 𝑜𝑓 𝐶𝑟𝑦𝑠𝑡𝑎𝑙) (4)
Where:37,47
λIR=Wavelength of IR beam (cm-1),
n1 = Refraction index of the crystal, which is 2.4 for the ZnSe crystal made by manufacturer,
n2 = Refractive index of the sample, which is 1.3 due to the solutions made with MilliQ water,
θc = Angle of incident of the beam with the crystal which is based on the formula and calculated
to be 60º here,
N = Number of reflections which is calculated to be 4 here,
19
b = Path length which is calculated to be 3.5 μm by substituting the equations 4 and 1 in 3. Due to
the subtracting the water signal from the spectrum in order to get the solute signal, we should use
the short path length.
dp = Depth of penetration, which is calculated to be 0.9 μm as per equation 1 at a given
wavelength that is assigned to the more intense peak in that area and the refractive indexes of the
crystal and the solution.
1.6.2 Speciation of Surface Arsenate and DMA on Iron Oxides
Surface chemistry and interactions of arsenicals with environmental absorbents, catalyst
used in the petroleum industry, and substances used in pollution remediation have been always a
matter of studies. Materials investigated in these studies include iron minerals goethite, hematite,
hydrous ferric oxide and activated alumina, amorphous aluminum oxide, ferrihydrite, maghemite,
nanocrystalline TiO2, and soil (contains NOM and minerals).48 These studies are mostly done
through batch experiments. Batch experiments indirectly explored ex-situ of thermodynamic and
kinetic quantification of bindings in different concentrations of arsenicals before and after
adsorption. Shimizu et al.49 studied the adsorption kinetics of DMA, arsenate and MMA on soil.
They found that the sorption process can be slow and fast due to the diffusion and electrostatic
attraction on sites with different activity, respectively.49 Arsenate, compare to DMA, has more
electrostatic attraction to positively charged surface since it has no methyl groups so it has more
deprotonated As-O groups while DMA has two methyl groups.
Depending on the speciation of analytes or adsorbates (arsenate and DMA) and surface
charge of the adsorbent (iron oxides) at a specific pH, the effectiveness of the interactions of
arsenate and DMA with the surface will be predicted. Arsenate with having three ionizable OH
20
groups and hence three pKa exists with four species. DMA with one ionizable OH group and
having one pKa, exists in two types of species. In aquatic system, both arsenate and DMA are in
anionic forms as pH of the environment obligates it. Therefore, the most studies have been done
in an environmentally related situation and with pH 7. At pH 7, the iron oxide is positively
charged. Consequently, the negatively charged arsenate and DMA become adsorbed into the
positively charged iron oxide nanoparticles. Thus, the electrostatic interactions are a factor in
driving the reaction between incoming DMA and arsenate with the empty sites of the hematite
which is a type of ligand exchange process. Also, previous studies50 revealed that ligand
exchange happens faster at first 2-3 min of the interaction in which the fast leaving groups such
as H2O on ≡FeOH2+ leave the sites and it is due to the electrostatic forces. The inner sphere
monodentate DMA (ads) is the result of fast exchange at this pH. At first 2-3 minutes, the
probability of inner-sphere bidentate is less because of the low probability of having two leaving
groups being neighbors so that it cannot be able to make bidentate fast. At slower rate of reaction
and t>3 minute, the likelihood of transforming the monodentate to bidentate increases. It was
reported that DMA (ads) acts similarly with goethite and makes similar surface complexes as it
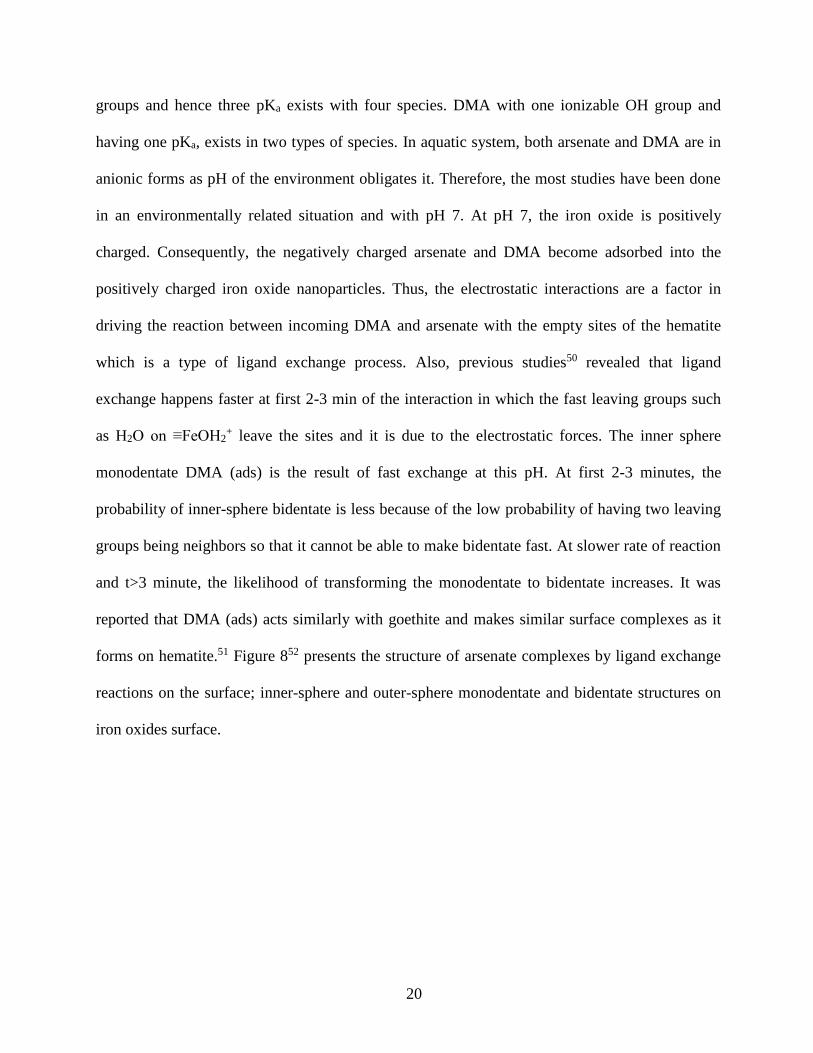
forms on hematite.51 Figure 852 presents the structure of arsenate complexes by ligand exchange
reactions on the surface; inner-sphere and outer-sphere monodentate and bidentate structures on
iron oxides surface.
21
Figure 8. Arsenate complexation on iron oxides surface: monodentate complex (left) with a net
charge of -1 and bidentate complex (right) with a net charge of 0. Atom key: As purple, Fe blue,
O red and H white (Adopted with permission from Ref. 52).
1.6.3 Kinetic Models Used to Extract Reaction Rates
To generate the kinetic curves from absorbance spectrum at a specific wavenumber over
time, we need the baseline-corrected ATR-FTIR absorbances [A (ν)] of the spectral components.
All obtained peaks were resulted in very similar kinetic curves. To extract the reaction rates from
experimental data, the Langmuir adsorption model is used. The model’s assumption is that there
is a layer of empty sites that are homogenious and identical. Adsorption process ends once all
sites are filled up with the adsorbates. After adsorbates fill the sites in, desorption process may
happen. In addition to the Langmuir model, there are two more models for the adsorption process
to fit the data upon: Freundlich and Redlich-Peterson models. Previous studies53,54 proved that
Langmuir adsorption model has a higher R-squared or coefficient constant (>0.99), so that data
can fit better with this model rather than the other two models. The Langmuir kinetic adsorption
model for adsorption reaction 3 is shown in equation 5.
[Arsenical (aq)] + empty site 1 [Arsenical (ads 1)] (3)
𝜃 (𝑡) = 𝑏(1 − 𝑒−𝑟𝑜𝑏𝑠×𝑡) (5)
22
Term θ (t) is the relative surface coverage for the surface complex of arsenical (ads).
Since surface coverage is in correlation with absorbance (equation 6), by expanding the θ term,
equation 7 can be obtained which is the baseline-corrected peak height absorbance measurement.
𝜃 =𝐴
𝐴𝑚𝑎𝑥 (6)
𝐴 = 𝑏′(1 − 𝑒−𝑟𝑜𝑏𝑠×𝑡) (7)
𝑏′ = 𝐴𝑚𝑎𝑥 × 𝑏 (8)
The equation 7 is linearized to give equation 9.
ln (1 −𝐴
𝑏′) = −𝑟𝑜𝑏𝑠 × 𝑡 (9)
Term b′ in equation 8 represents the average of the collection of constant absorbances in
the plateau region of adsorption kinetic curve. After approximately 15 min, the kinetic curve
reaches the plateau that is equilibrium stage of the reaction. After plotting the data in the linear
form, the data are best fit with the line. The first 2 min of adsorption is the initial adsorption rate
which major part of adsorption occurs at.
Tofan-Lazar et al.50 studied the dependency of the robs to the mass of α-Fe2O3 and
concluded that 6 mg of α-Fe2O3 was the optimum and minimum mass that could be deposited
onto the ATR crystal homogeneously with reproducible texture and thickness over the 100 min of
running experiment. Also, the goodness of the revealed robs values with different thicknesses of α-
Fe2O3 film were in this order: 6 mg > 8 mg > 14.8 mg.
23
1.6.4 Thermodynamic Studies and the Theoretical Activation Barriers for
Arsenate and DMA Surface Species
Langmuir equilibrium constant, Keq, is temperature dependent. Following the isotherm
baseline-corrected absorbance at 830 cm-1 for DMA (ads) and 875 cm-1 for iAs (ads), values for
Keq were calculated from least-squares Langmuir fits. The Gibbs free energy of adsorption
(∆Gads) is another thermodynamic parameter that can be calculated (equation 10) for each value
of equilibrium constant at a given experimental situation.
∆G°ads=-RTln(55.5Keq) (10)
As per equation 11, plotting ∆Gºads versus temperature generates a straight line that the
entropy of the adsorption can be obtained from the slop of this line and the intercept of the line
defines the enthalpy of the reaction.
∆G°ads=∆H°ads-T∆S°ads (11)
For heterogeneous systems that the components of the reactions are in different phases, if
the value for ∆Gºads becomes zero, it makes evident that the reaction is in equilibrium and if it
becomes negative, it means that the reaction is spontaneous.
Adamescu et al.10,55 studied the density functional theory (DFT) at the B3LYP/6-311+G
(d, p) level for the formation of arsenate and DMA inner-sphere and outer-sphere complexes on
iron(oxyhydr)oxide. They reported that the formation of these complexes is thermodynamically
favorable with more negative ∆Gads for inner-sphere complexes. Based on their calculations, they
also predicted that the formation of bidentate from monodentate needs much higher activation
energy in DMA while its monodentate formation from outer sphere needs much lower activation
energy and thus these complexes may not be seen simultaneously. Adamescu et al.’s results also
24
highlighted that arsenate unlike DMA, can exist in both monodentate and bidentate complexes
due to the small energy differences in both complexes in their transition states.
1.7 Overview of Thesis Objective
The objective of this thesis is to utilize the ATR-FTIR as a surface sensitive technique in
an environmentally relevant condition to study the kinetics of arsenicals adsorption such as
arsenate and DMA at the molecular level with in situ interactions from solution to hematite
nanoparticles as a function of time, concentration and temperature at pH 7. The goal is to
calculate the activation energy (Ea) of adsorption for arsenate and DMA.
CHAPTER 2: MATERIALS AND METHODS
2.1 Chemicals
Each solution was prepared using 18MΩ-cm Millipore water. To adjust the ionic strength,
we used NaCl (sodium chloride, 99%+, GR ACS, EMD) to make 0.01M NaCl solution. The pH
of newly made NaCl solution was around 5.74. To adjust the pH of solutions, two acidic and
basic solutions were made: concentrated NaOH (sodium hydroxide, 99%+, GR ACS, EMD)
solution by dissolving five pellets of NaOH into 20 mL of Millipore water and diluted HCl
(hydrochloric acid, ACS, 6 N, Ricca Chemical) solution by adding 1 mL of the 6 N into 20 ml of
Millipore water. The arsenic solutions in each experiment were prepared in different
concentrations: 0.25, 0.5, 1, and 1.5 mM using DMA (sodium cacodylatetrihydrate,
C2H6AsO2Na.3H2O, Sigma-Aldrich, used as received), and sodium arsenate (sodium arsenate,
AsO4HNa2.7H2O, ACS reagent, J.T. Baker, used as received) into 10mM of NaCl. The pH of
25
both solutions was adjusted to 7. Gloves and mask were worn as protective equipment when
handling the arsenical compounds due to carcinogenic effect of arsenicals.
A freshly made film of hematite nanoparticles also was prepared on ATR-FTIR crystal as an
adsorbent and a solid phase. Each time, 6 mg of hematite (α-Fe2O3, alpha, 98+%, 20-40 nm, US
Research Nanomaterials, Inc.) was measured and added to the glass vial followed by adding 0.91
mL 18MΩ-cm Millipore water and 0.39 mL ethanol ethyl alcohol (anhydrous, denatured, 85%
ethanol, 14.3% methanol, Anachemia). The glass vial was sonicated for one hour to disperse the
hematite nanoparticles into the solution. Immediately after, the film solution was evenly
deposited through the ZnSe cell using a pasteur pipet. After drying, it was ready to use. For
cleaning the glassware, please see appendix B.
2.2 Temperature-Dependent ATR-FTIR Technique
The IR spectrophotometer used in this study was Nicolet 8700 FTIR spectrometer
(ThermoInstruments) equipped with a mercury cadmium telluride (MCT) detector. The ATR-
FTIR spectra were collected on freshly prepared hematite films using HATRPlus accessory (Pike
Technoligies). Hematite nanoparticles were deposited into the ATR cell and allowed 13 hours to
be dried in the room temperature. The ATR-FTIR cell allows to probe the reaction that occurs in
the liquid-solid interface. The ATR cell that was used was ZnSe internal reflection element (IRE)
with dimension of 80x10x4 mm, and the volume of 100 μL. The IR beam enters to the cell with
60º angle of incident which it undergoes multiple internal reflections. After interacting the light
with the sample, an evanescent wave is generated and partially gets absorbed by the sample at the
interface with the crystal. Then evanescent wave goes back to the crystal and hits the detector.
This process generates a single beam spectrum by OMNIC program. In total, there were 56
26
spectra. The first single spectrum was taken from dried and clean hematite film to ensure the
consistency on film making. The second single spectrum collected after running 90 min of 0.01M
NaCl to ensure that the film has reached to the equilibrium point and no film loss will occur
during the experiment. The third spectrum until 56th, were obtained in 80 min of running arsenate
and DMA (separately) at different concentrations and temperatures under pH 7. Solutions were
flowed to the ZnSe crystal using a pump with a flow rate of 2 mL/min. The rest of the single
beam scans were taken from solution every five minutes and referenced to the background to
obtain the absorbance spectra. To produce the absorbance spectrum, each single beam that was
taken during last 80 min was referenced to second single beam spectrum which is obtained from
running of 90 min of 0.01 M NaCl as a background. The software Macros Basic converted the
single beam spectrum to absorbance (Appendix A). Single beam spectra were collected by
averaging 25 scans for the first 10 min and averaging 100 scans for up to 80 min for every five
minutes of adsorption. The resolution of the scans was 8 cm-1. The flow of all solutions was 2
mL/min across the hematite film using Tygon tubes (0.8 mm I.D., Maserflex) and a compact
pump (Masterflex L/S). The flow rate was measured by 5 mL cylinder from output flow tube.
The circulation water bath (Endocal Refrigerated circulation bath, Neslab, RTE-5DD) was used
to maintain the temperature constant throughout each experiment. Circulation bath through the
channel was connected to inside the lid of the ATR cell. To monitor the temperature, the probe of
a temperature reader (Omega Engineering, OMEGA HHC201) was attached to the ATR cell’s lid
with thermocouple adhesive pad (Omega Engineering). To read the temperature, the reader
apparatus that is connected to the probe was used (Omega Engineering, OMEGA HHC201).
Each experiment was performed four times to ensure its reproducibility and quality, and that all
were averaged, and propagation of errors were calculated for each step.
27
2.3 Data Analysis
Isotherm experiments were carried out at temperatures 5º, 15º, 25º, and 35℃ for arsenate
and 5º, 15º, 25º, 35 and 50℃ for DMA. After taking the single spectra by the Omnic program
installed in the IR instrument, they were normalized to the background and the spectra of
absorbance was obtained. Since the number of spectra were high (56 spectra), the Macros Basics
software was utilized to gain the spectra of absorbance at a specific wavenumber. The baseline
corrected kinetic curve spectra were generated and fitted to the one-site Langmuir model with
Igor Pro program at each temperature and concentration. The initial rate or robs of the reaction
was determined. Hence, the Langmuir model was linearized and plotted versus time, fitted, and
slope of the fit presented as robs. The term robs in the first-order reactions depends on the
concentration of the analyte in a way that with increasing the concentration, the rate of the
reaction increases as well. Afterwards, the graph of robs was plotted against concentration to
obtain the rate constant (kads) from the slope of the fitted graph based on the first order reaction.
The aim was to calculate the activation energy through the Arrhenius equation. The Arrhenius
equation was then linearized by taking the natural logarithmic function and plotting it against the
inverse temperature (1/T). The graph was fitted and using the slope, the activation energy was
solved for since the other term, the universal gas constant, R (8.314 Jmol-1K-1), is known. After
the data was analyzed, the result of each step was processed for its propagation of errors to
acquire the uncertainty of each step and ultimately, for the activation energy.
28
2.4 Characterization of Hematite Nanoparticles
The hematite nanoparticles used in this study characterized by transmission electron
microscopy (TEM) by AVEKA Inc corporation which is specialized company in particle
processing. Figure 9 is the TEM images of the α-Fe2O3, demonstrating its spherical shape.
The measurements were implemented via measuring the diameters of the hematite
particles by taking the multiple TEM images and referencing them to the scale bar in each image
and averaging the referenced particle sizes. The measured average particle size was quantified to
be 50 nm and laser scattering particle size analyzer was used as well to confirm the results. The
iso-electric point of the hematite determined to be at pH of 8.48 and the surface area was
measured to be 44 m2 g-1.
Figure 9. TEM images of α-Fe2O3 that is used in this study. The scale bars correspond to 0.1 µm
and 20 nm.
29
CHAPTER 3: ACTIVATION ENERGY BARRIER FOR DMA ON
HEMATITE NANOPARTICLES AT pH 7
3.1 Results and Discussion
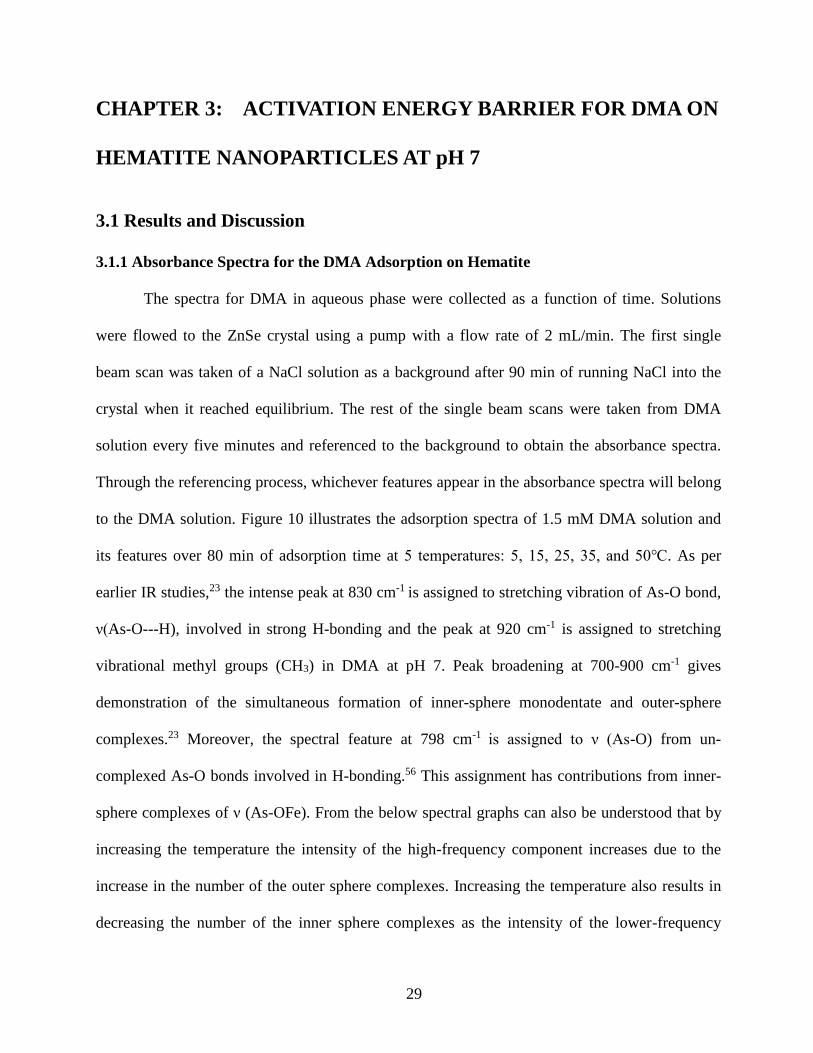
3.1.1 Absorbance Spectra for the DMA Adsorption on Hematite
The spectra for DMA in aqueous phase were collected as a function of time. Solutions
were flowed to the ZnSe crystal using a pump with a flow rate of 2 mL/min. The first single
beam scan was taken of a NaCl solution as a background after 90 min of running NaCl into the
crystal when it reached equilibrium. The rest of the single beam scans were taken from DMA
solution every five minutes and referenced to the background to obtain the absorbance spectra.
Through the referencing process, whichever features appear in the absorbance spectra will belong
to the DMA solution. Figure 10 illustrates the adsorption spectra of 1.5 mM DMA solution and
its features over 80 min of adsorption time at 5 temperatures: 5, 15, 25, 35, and 50℃. As per
earlier IR studies,23 the intense peak at 830 cm-1 is assigned to stretching vibration of As-O bond,
ν(As-O---H), involved in strong H-bonding and the peak at 920 cm-1 is assigned to stretching
vibrational methyl groups (CH3) in DMA at pH 7. Peak broadening at 700-900 cm-1 gives
demonstration of the simultaneous formation of inner-sphere monodentate and outer-sphere
complexes.23 Moreover, the spectral feature at 798 cm-1 is assigned to ν (As-O) from un-
complexed As-O bonds involved in H-bonding.56 This assignment has contributions from inner-
sphere complexes of ν (As-OFe). From the below spectral graphs can also be understood that by
increasing the temperature the intensity of the high-frequency component increases due to the
increase in the number of the outer sphere complexes. Increasing the temperature also results in
decreasing the number of the inner sphere complexes as the intensity of the lower-frequency
30
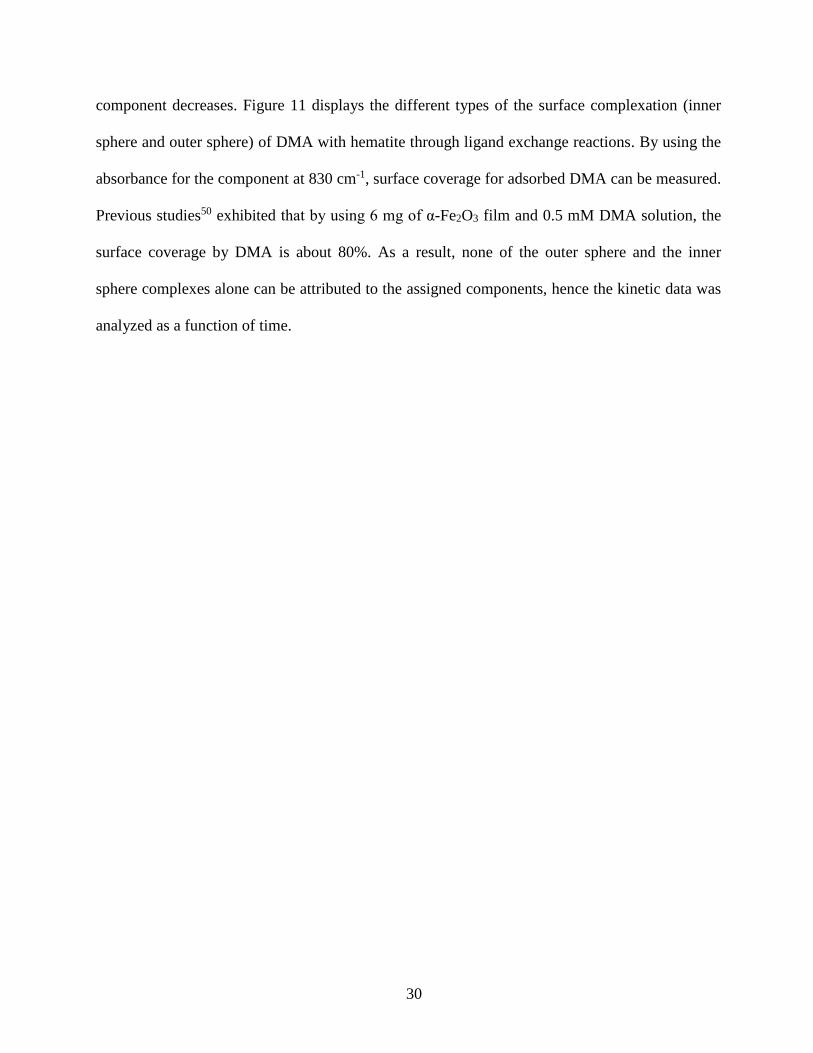
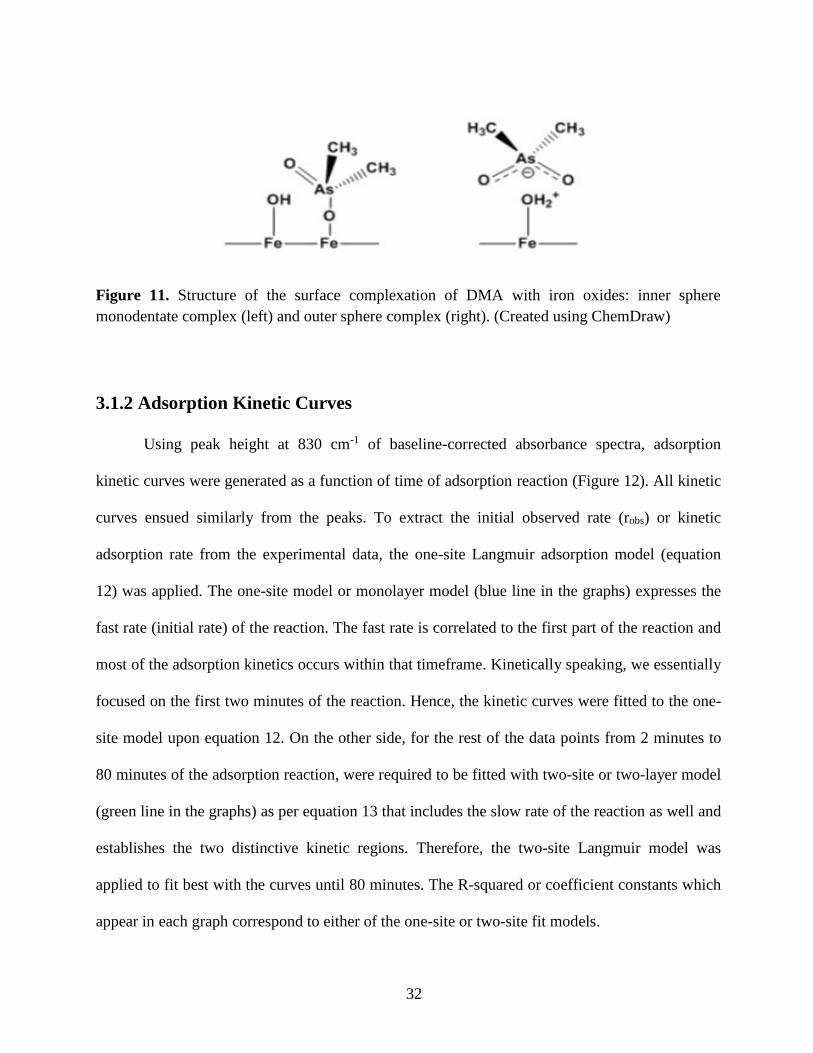
component decreases. Figure 11 displays the different types of the surface complexation (inner
sphere and outer sphere) of DMA with hematite through ligand exchange reactions. By using the
absorbance for the component at 830 cm-1, surface coverage for adsorbed DMA can be measured.
Previous studies50 exhibited that by using 6 mg of α-Fe2O3 film and 0.5 mM DMA solution, the
surface coverage by DMA is about 80%. As a result, none of the outer sphere and the inner
sphere complexes alone can be attributed to the assigned components, hence the kinetic data was
analyzed as a function of time.
31
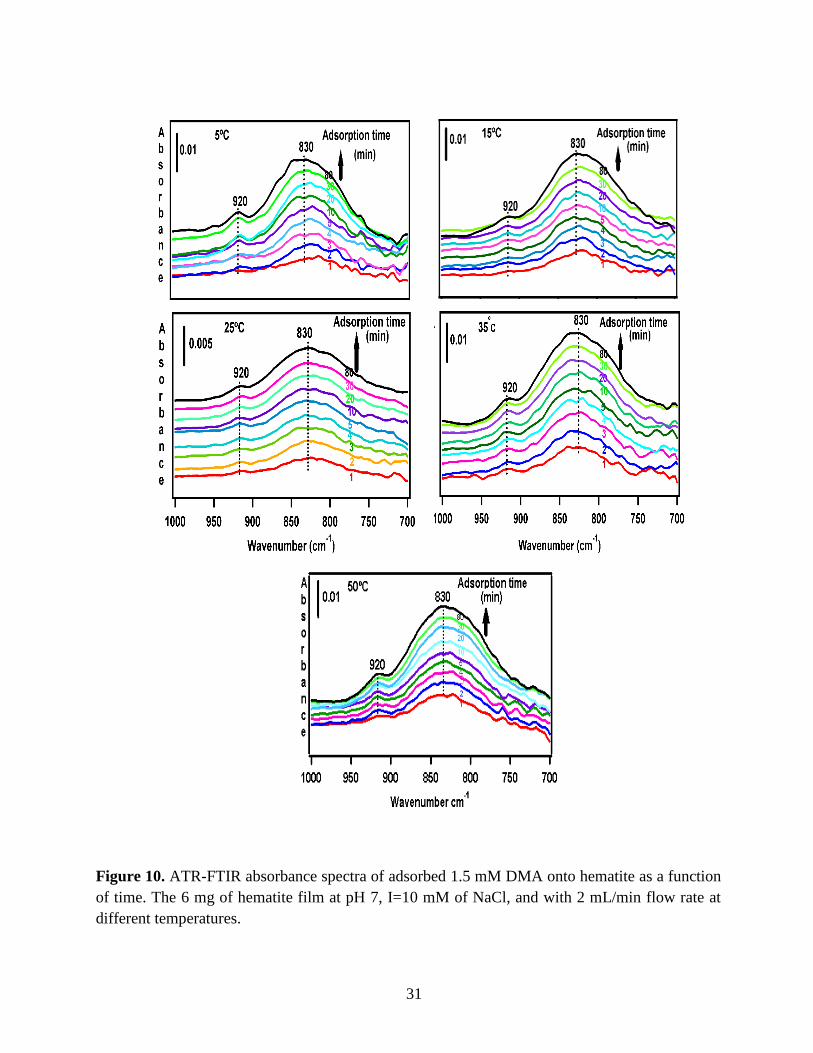
Figure 10. ATR-FTIR absorbance spectra of adsorbed 1.5 mM DMA onto hematite as a function
of time. The 6 mg of hematite film at pH 7, I=10 mM of NaCl, and with 2 mL/min flow rate at
different temperatures.
32
Figure 11. Structure of the surface complexation of DMA with iron oxides: inner sphere
monodentate complex (left) and outer sphere complex (right). (Created using ChemDraw)
3.1.2 Adsorption Kinetic Curves
Using peak height at 830 cm-1 of baseline-corrected absorbance spectra, adsorption
kinetic curves were generated as a function of time of adsorption reaction (Figure 12). All kinetic
curves ensued similarly from the peaks. To extract the initial observed rate (robs) or kinetic
adsorption rate from the experimental data, the one-site Langmuir adsorption model (equation
12) was applied. The one-site model or monolayer model (blue line in the graphs) expresses the
fast rate (initial rate) of the reaction. The fast rate is correlated to the first part of the reaction and
most of the adsorption kinetics occurs within that timeframe. Kinetically speaking, we essentially
focused on the first two minutes of the reaction. Hence, the kinetic curves were fitted to the one-
site model upon equation 12. On the other side, for the rest of the data points from 2 minutes to
80 minutes of the adsorption reaction, were required to be fitted with two-site or two-layer model
(green line in the graphs) as per equation 13 that includes the slow rate of the reaction as well and
establishes the two distinctive kinetic regions. Therefore, the two-site Langmuir model was
applied to fit best with the curves until 80 minutes. The R-squared or coefficient constants which
appear in each graph correspond to either of the one-site or two-site fit models.
33
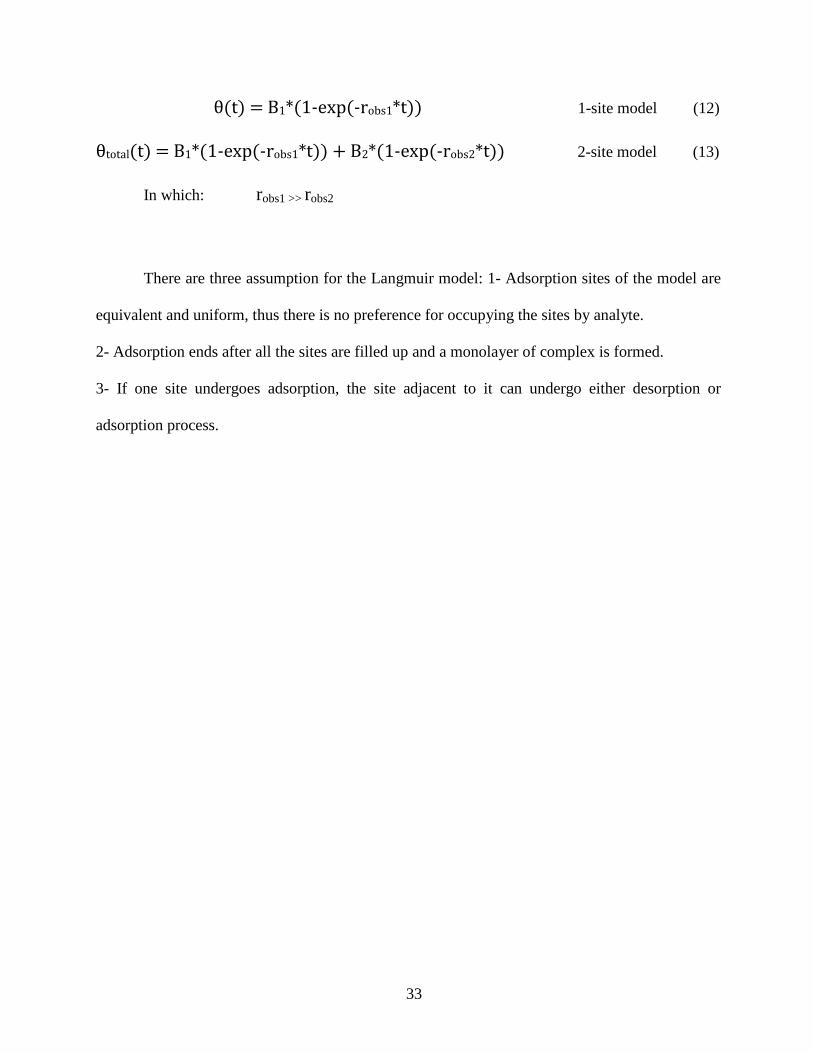
θ(t) = B1*(1-exp(-robs1*t)) 1-site model (12)
θtotal(t) = B1*(1-exp(-robs1*t)) + B2*(1-exp(-robs2*t)) 2-site model (13)
In which: robs1 >> robs2
There are three assumption for the Langmuir model: 1- Adsorption sites of the model are
equivalent and uniform, thus there is no preference for occupying the sites by analyte.
2- Adsorption ends after all the sites are filled up and a monolayer of complex is formed.
3- If one site undergoes adsorption, the site adjacent to it can undergo either desorption or
adsorption process.
34
1-
Figure 12. Baseline-corrected ATR adsorption kinetic curves of adsorbed 1.5 mM DMA as a
function of time with 56 data points at 830 cm-1. The 6 mg of hematite film at pH 7, I=10 mM of
NaCl, and with 2 mL/min flow at 5, 15, 25, 35 and 50℃. The solid lines stand for the least-
squared fitting of the 1-site and 2-site Langmuir adsorption models. (Data points represent the
average of 4 trials and error bars are ±σ from the average)
35
3.1.3 Linearize the Langmuir Model to Obtain the Initial Rate (robs) of the DMA
Adsorption
Initial rate or observed rate (robs) is the rate of the first 2 minutes of the adsorption
reaction. It is obtained from the slope of the linearized Langmuir model’s graph. As Figure 13
demonstrates, the equation 9 that is the linearized form of the Langmuir model is plotted over
time for the 1.5 mM DMA solution at temperature range of 5-50℃, and the obtained slopes from
the least-squared fits signify the robs (min-1). The linearization function is created by taking a
natural log of peak height absorbances over the maximum peak height absorbance determined at
80 minutes adsorption time. Table 2 indicates the obtained slopes for DMA solutions in 4 levels
of concentration at 5 temperatures.
36
Figure 13. Linearized absorbances for the adsorption of 1.5 mM DMA as a function of time onto
the 6 mg of hematite film at pH 7, I=10 mM NaCl, and with 2 mL/min flow rate at different
temperatures. (Data points represent the average of 4 trials and error bars are ±σ from the
average)
37
Table 2: Slopes obtained from the Figure 13 that are the initial rates or robs over the first 2
minutes of the adsorption kinetic reaction of DMA solution at various temperatures in four
concentration levels of DMA solution. (Values in the parenthesis are the ±σ)
[DMA (aq)]
(mM)
Slope=robs
(min-1) at 5 ℃
Slope=robs
(min-1) at 15℃
Slope=robs
(min-1) at 25℃
Slope=robs
(min-1) at 35℃
Slope=robs
(min-1) at 50℃
0.25 -0.15 (±0.03) -0.13 (±0.06) -0.22 (±0.06) -0.20 (±0.06) -0.27 (±0.01)
0.5 -0.14 (±0.05) -0.16 (±0.03) -0.23 (±0.10) -0.24 (±0.06) -0.27 (±0.01)
1.0 -0.18 (±0.03) -0.19 (±0.02) -0.26 (±0.01) -0.23 (±0.10) -0.31 (±0.01)
1.5 -0.20 (±0.08) -0.28 (±0.04) -0.36 (±0.06) -0.39 (±0.07) -0.41 (±0.01)
3.1.4 Extract the Rate Constant (kads) of the DMA Adsorption Reaction
The pseudo-first order Langmuir kinetic adsorption model expects a linear tendency of
robs against [DMA (aq)] as equation 14 indicates.
𝑟𝑜𝑏𝑠 = 𝑘𝑎𝑑𝑠[𝐴𝑛𝑎𝑙𝑦𝑡𝑒] + 𝑘𝑑𝑒𝑠 (14)
Figure 14 illustrates the plot of the obtained robs from the slope of the linearized model
versus the [DMA (aq)], and from here, the slopes of the least-squared fit of the plots determine the
adsorption rate constant (kads).
38
Figure 14. Dependency of the observed initial rate of adsorption (robs) to [DMA (aq)] onto the 6
mg of hematite film at pH 7, I=10 mM NaCl, and with 2 mL/min flow rate at different
temperatures with concentrations: 0.25 mM, 0.5 mM, 1 mM, and 1.5 mM. (Data points represent
the average of 4 trials and error bars are ±σ from the average)
39
3.1.5 Calculate the Activation Energy (Ea) of the DMA Adsorption from Solution to
Hematite Nanoparticles
Activation energy57 is a principle parameter which describes the performance of the
adsorption process and that signifies the energy that is needed for an ion to overpower the energy
barrier in order to react or interact with the surface of an adsorbent. The Arrhenius equation
(15)57,58 was employed to evaluate the activation energy of the kinetic adsorption of DMA
solution to hematite nanoparticles. The extracted kads from the slopes of Figure 14 was substituted
into equation 15 and afterwards it was linearized (equation 16) by taking the natural log, and
finally it was plotted versus 1
𝑇 (Figure 15). Figure 15 comprises 2 graphs or lines a and b for
comparison and having insight to the temperature dependence of the complexation mechanism in
this study: the line ‘a’ is the least-square fit or the best fit for the temperatures 5, 15, 25, and 35℃
and the line ‘b’ is the best fit of 5, 15, 25, 35 and 50℃. The slopes of the least-squared fit of the
graphs contain term −𝐸𝑎
𝑅 that they were solved for the activation energies of the adsorption
kinetic processes. The slopes, and hereafter the activation energies, are displayed in Table 3.
𝑘 = 𝐴𝑒−𝐸𝑎𝑅𝑇 (15)
ln 𝑘 = −𝐸𝑎
𝑅𝑇+ 𝑙𝑛𝐴 (16)
Where:
A: Arrhenius pre-exponential factor or frequency factor (mM-1min-1),
Frequency factor defines the number of times two molecules collide. In other words, it is the
frequency of the reactions occurred through the correct orientation of the molecules. It can also
40
5℃
15℃
25℃
35℃
50℃
predict the rate of the chemical reaction and can be calculated from the intercept of the linearized
form of the Arrhenius equation.
R: Universal gas constant (Jmol-1K-1),
T: Temperature (°K),
Ea = Activation energy (kJmol-1),
k: Adsorption rate (mM-1min-1).
Figure 15. Linearized form of Arrhenius equation for the adsorption of DMA solution onto the 6
mg of hematite film at pH7, I=10 mM NaCl, with 2 mL/min flow rate. The line ‘a’ represents
temperatures at 5, 15, 25, and 35℃ and the line ‘b’ stands for 5, 15, 25, 35 and 50°C. Both lines
are at different concentrations: 0.25 mM, 0.5 mM, 1 mM, and 1.5 mM. (Data points are the
average of 4 trials and error bars are ±σ from the average)
41
Table 3: Slopes obtained from Figure 15 define the term -𝐸𝑎
𝑅 of the fast part of the reaction at first
2 minutes of the adsorption kinetic reaction of DMA and their calculated activation energies at
temperatures 5, 15, 25, 35, and 50℃ with 0.25, 0.5, 1.0, and 1.5 mM of DMA solution.
Temperature range ℃ Slope = -𝑬𝒂
𝑹 Ea (kJmol-1)
5-35 -(2.7 ± 0.8) × 103 22 ± 7
5-50 -(1.4 ± 0.9) × 103 12 ± 7
Equation 17 is the slope of the Figure 15 that includes Ea and R (universal gas constant) and
equation 18 illustrates the calculation for activation energy.
𝑆𝑙𝑜𝑝𝑒 = −𝐸𝑎
𝑅 (17)
𝐸𝑎 = −𝑆𝑙𝑜𝑝𝑒 × 𝑅 (18)
For line ‘a’: 𝑬𝒂 = −(−𝟐. 𝟕 × 𝟏𝟎𝟑 𝑲) × 𝟖. 𝟑𝟏𝟒 𝑱𝒎𝒐𝒍−𝟏𝑲−𝟏 = 𝟐𝟐 ± 𝟕 𝒌𝑱𝒎𝒐𝒍−𝟏
Pre-exponencial factor obtained from the intercept of the line ‘a’ in Fig. 15:
ln A = 6.9 ± 3.8 … A = (22,44356) mM-1min-1 (The value for A is in Statistical format)
For line ‘b’: 𝑬𝒂 = −(−𝟏. 𝟒 × 𝟏𝟎𝟑 𝑲) × 𝟖. 𝟑𝟏𝟒 𝑱𝒎𝒐𝒍−𝟏𝑲−𝟏 = 𝟏𝟐 ± 𝟕 𝒌𝑱𝒎𝒐𝒍−𝟏
Pre-exponencial factor obtained from the intercept of the line ‘b’ Fig. 15:
ln A = 2.4 ± 3.1 ………….A = (0.5,245) mM-1min-1 (The value for A is in Statistical format)
42
3.2 Summary and Discussion
The graphs and their slopes express the dependency of the DMA adsorption to the time,
concentration, and temperature of the DMA solution. Increasing the temperature will result in the
intense peak of the pronounced component, ν (830 cm-1), of the absorbance spectra at higher
temperatures such as 50℃ performed within this study.
As Table 2 summarizes, the absolute value of the slopes of the linearized graphs are
increased largely by increasing the temperature and concentration. In other words, the robs or
initial rate of the adsorption reaction will increase by increasing the concentration. At the
beginning of the adsorption reaction, the rate of the reaction is high because the concentration of
the analyte is high, and gradually by progressing the adsorption reaction, the rate of adsorption
decreases as the concentration decreases. The result clearly demonstrates the temperature-
dependent nature of the adsorption reaction in this work. The extracted term kads will be
substituted into the Arrhenius equation and after it becomes linearized, it will be plotted against
the inverse temperature ( 1
𝑇 ). Figure 15 as well exhibits the dependency of the process to the
temperature by displaying the slopes and activation barriers of two lines, “a” and “b”. Line “a”
represents the 4 temperature points, 5, 15, 25, and 35℃ and it has a larger absolute slope (2.7)
compares to line “b” (1.4), and consequently the larger energy barrier (22 ± 7 kJmol-1).
Accordingly, based on the exponential factor that contains temperature and activation barrier
terms, the larger fraction of the molecules need energy to surmount the transition state barrier,
while the line “b” represents the smaller fraction of the molecules that need the energy to beat the
aforementioned barrier. Line “b” epitomizes the 5 temperature points (5, 15, 25, 35, and 50℃)
with having a smaller absolute slope (1.4) compared to line “a”, and hence the smaller energy
barrier (12 ± 7 kJmol-1). Therefore, it can be understood that increasing the temperature facilitates
the adsorption kinetic of forming bidentate structures in DMA.
43
CHAPTER 4: ACTIVATION ENERGY BARRIER FOR
ARSENATE ON HEMATITE NANOPARTICLES AT pH 7
4.1 Results and Discussion
4.1.1 Absorbance Spectra for the Arsenate Adsorption on Hematite
The isotherm spectra for arsenate (iAs) in an aqueous phase was collected as a function of
time at temperatures 5, 15, 25, and 35℃. After completion, the single scans were normalized by
the background scan. The absorbance spectra are obtained and the appeared components on the
spectra all belong to the iAs solution. Figure 16 depicts the absorbance spectra of 1.5 mM iAs
solutions over 80 min of adsorption time at 4 temperatures: 5, 15, 25, and 35℃. The most
significant peak at 875 cm-1 is assigned to the stretching vibration of un-complexed ν(As=O).11
The component at 795 cm-1 is assigned to ν(As-OFe) which is the mixture of the mono and
bidentate inner sphere formations and the component ν(As-OH) has absorbance below 780 cm-
1.59 Figure 17 displays the inner sphere bidentate structure of arsenate.
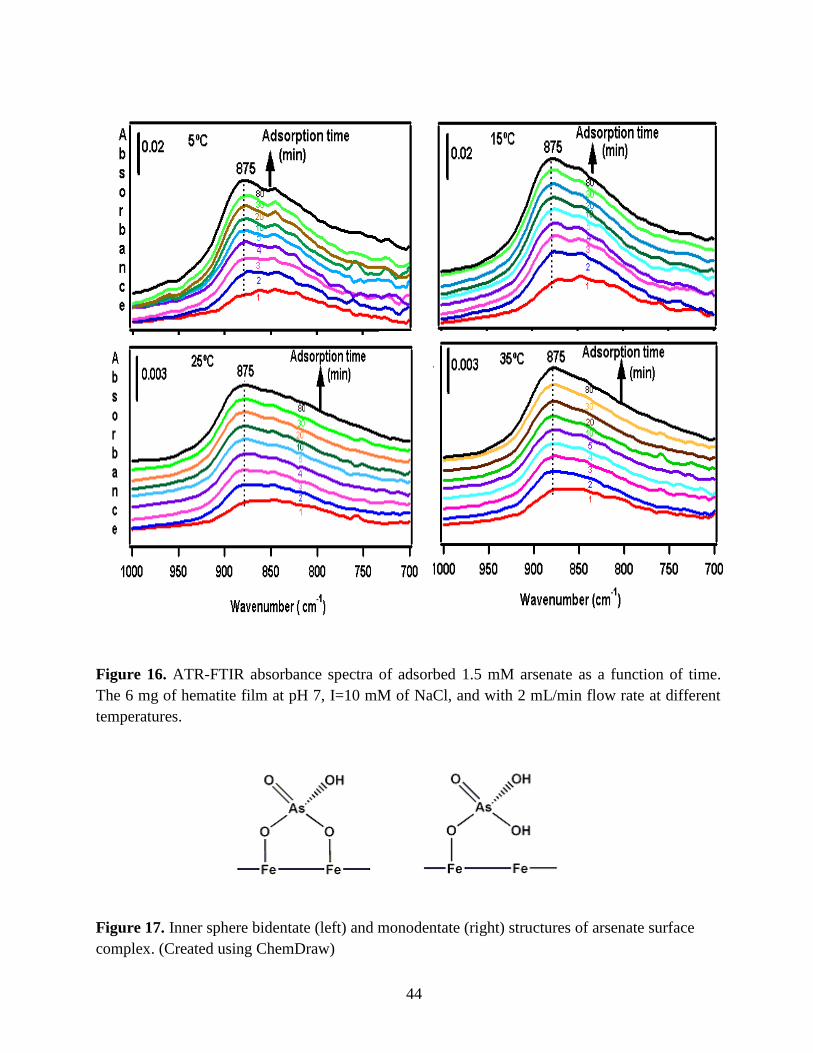
44
Figure 16. ATR-FTIR absorbance spectra of adsorbed 1.5 mM arsenate as a function of time.
The 6 mg of hematite film at pH 7, I=10 mM of NaCl, and with 2 mL/min flow rate at different
temperatures.
Figure 17. Inner sphere bidentate (left) and monodentate (right) structures of arsenate surface
complex. (Created using ChemDraw)
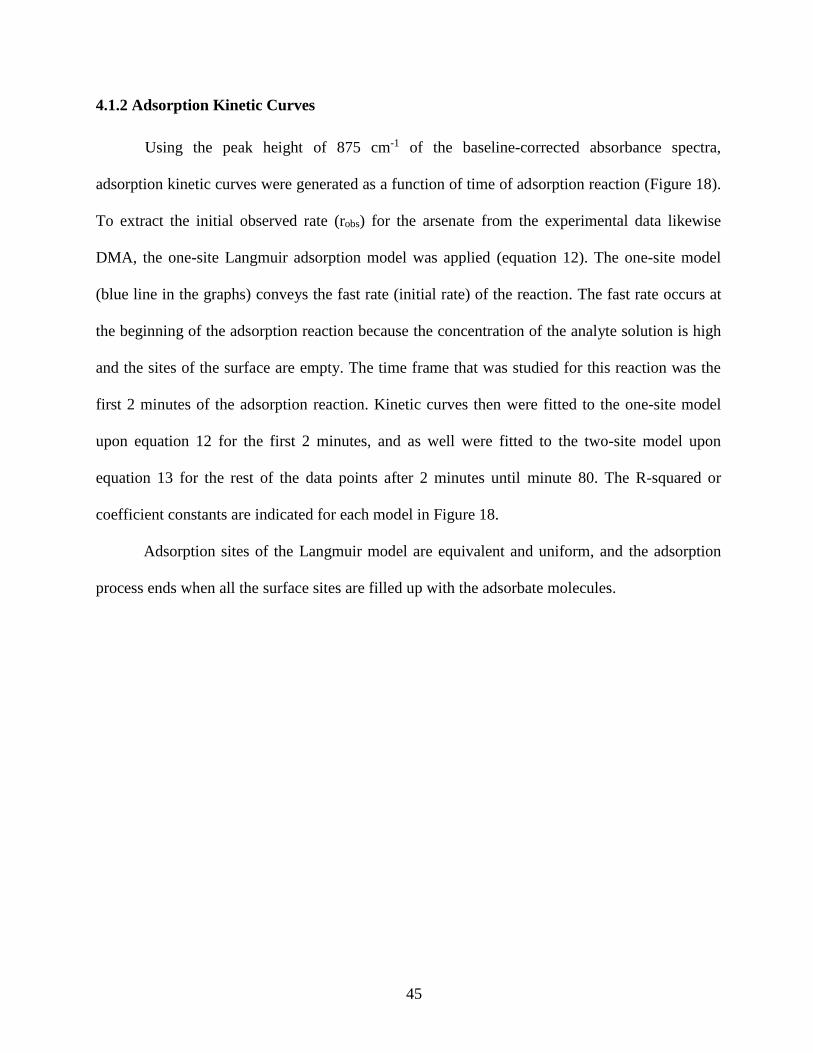
45
4.1.2 Adsorption Kinetic Curves
Using the peak height of 875 cm-1 of the baseline-corrected absorbance spectra,
adsorption kinetic curves were generated as a function of time of adsorption reaction (Figure 18).
To extract the initial observed rate (robs) for the arsenate from the experimental data likewise
DMA, the one-site Langmuir adsorption model was applied (equation 12). The one-site model
(blue line in the graphs) conveys the fast rate (initial rate) of the reaction. The fast rate occurs at
the beginning of the adsorption reaction because the concentration of the analyte solution is high
and the sites of the surface are empty. The time frame that was studied for this reaction was the
first 2 minutes of the adsorption reaction. Kinetic curves then were fitted to the one-site model
upon equation 12 for the first 2 minutes, and as well were fitted to the two-site model upon
equation 13 for the rest of the data points after 2 minutes until minute 80. The R-squared or
coefficient constants are indicated for each model in Figure 18.
Adsorption sites of the Langmuir model are equivalent and uniform, and the adsorption
process ends when all the surface sites are filled up with the adsorbate molecules.
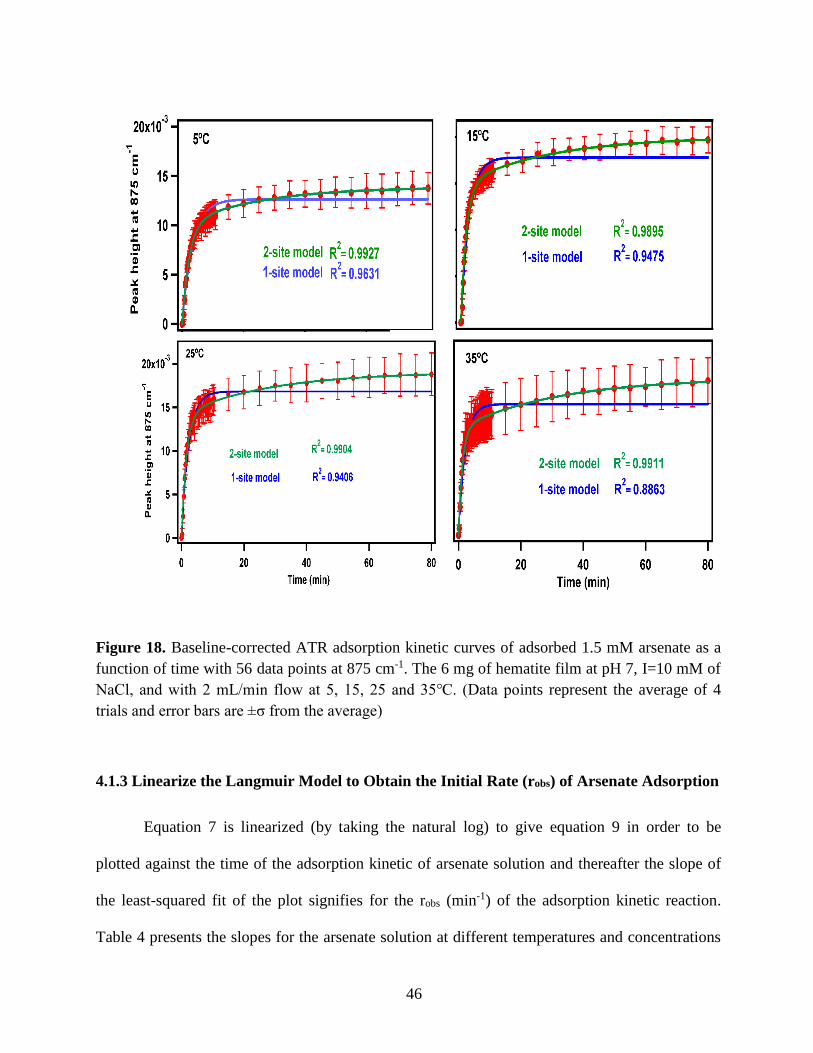
46
Figure 18. Baseline-corrected ATR adsorption kinetic curves of adsorbed 1.5 mM arsenate as a
function of time with 56 data points at 875 cm-1. The 6 mg of hematite film at pH 7, I=10 mM of
NaCl, and with 2 mL/min flow at 5, 15, 25 and 35℃. (Data points represent the average of 4
trials and error bars are ±σ from the average)
4.1.3 Linearize the Langmuir Model to Obtain the Initial Rate (robs) of Arsenate Adsorption
Equation 7 is linearized (by taking the natural log) to give equation 9 in order to be
plotted against the time of the adsorption kinetic of arsenate solution and thereafter the slope of
the least-squared fit of the plot signifies for the robs (min-1) of the adsorption kinetic reaction.
Table 4 presents the slopes for the arsenate solution at different temperatures and concentrations
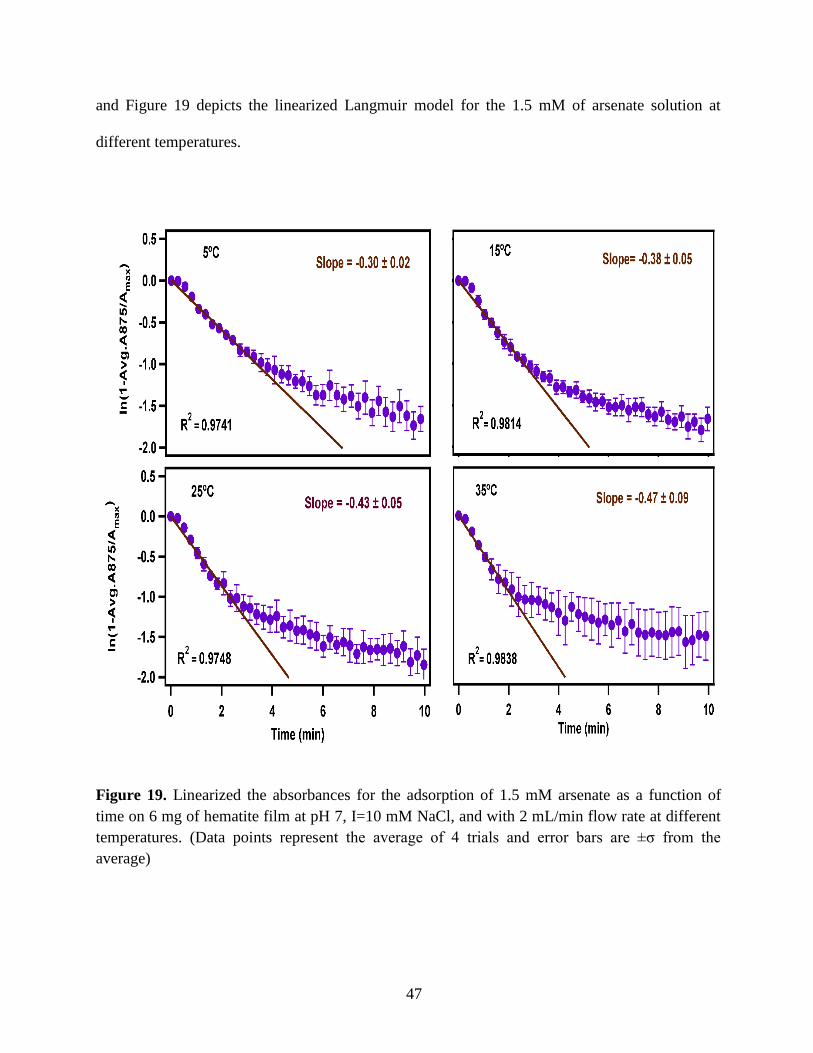
47
and Figure 19 depicts the linearized Langmuir model for the 1.5 mM of arsenate solution at
different temperatures.
Figure 19. Linearized the absorbances for the adsorption of 1.5 mM arsenate as a function of
time on 6 mg of hematite film at pH 7, I=10 mM NaCl, and with 2 mL/min flow rate at different
temperatures. (Data points represent the average of 4 trials and error bars are ±σ from the
average)
48
Table 4: Slopes obtained from the initial rates or robs over the first 2 minutes of the adsorption
kinetic reaction of arsenate at various temperatures in four concentration level of arsenate.
(Values in the parenthesis are the ±σ)
[iAs(aq)]
(mM)
Slope=robs
(min-1) at 5℃
Slope=robs
(min-1) at 15℃
Slope=robs
(min-1) at 25℃
Slope=robs
(min-1) at 35℃
0.25 -0.07 (±0.05) -0.05 (±0.01) -0.07 (±0.02) -0.11 (±0.04)
0.5 -0.12 (±0.01) -0.17 (±0.06) -0.15 (±0.05) -0.15 (±0.02)
1.0 -0.21 (±0.04) -0.23 (±0.01) -0.31 (±0.03) -0.32 (±0.11)
1.5 -0.30 (±0.02) -0.38 (±0.05) -0.43 (±0.05) -0.47 (±0.09)
4.1.4 Extract the Rate Constant (kads) of the Arsenate Adsorption Reaction
Figure 20 illustrates the plot of the obtained robs from the slope of the linearized model
versus the [iAs(aq)], and that the slopes of the least-squared fit of these graphs imply the
adsorption rate constants (kads). As depicted in Figure 20, it is evident that pseudo-first order
Langmuir kinetic adsorption model, robs increases linearly by increasing the [iAs(aq)].
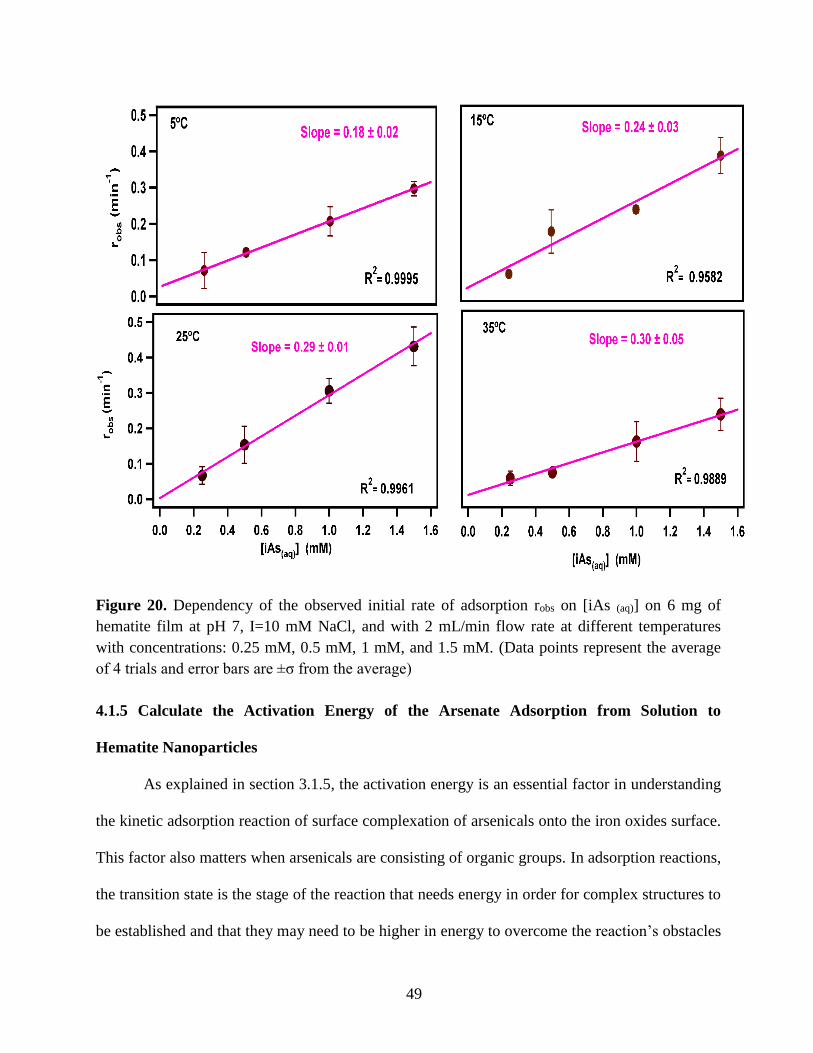
49
Figure 20. Dependency of the observed initial rate of adsorption robs on [iAs (aq)] on 6 mg of
hematite film at pH 7, I=10 mM NaCl, and with 2 mL/min flow rate at different temperatures
with concentrations: 0.25 mM, 0.5 mM, 1 mM, and 1.5 mM. (Data points represent the average
of 4 trials and error bars are ±σ from the average)
4.1.5 Calculate the Activation Energy of the Arsenate Adsorption from Solution to
Hematite Nanoparticles
As explained in section 3.1.5, the activation energy is an essential factor in understanding
the kinetic adsorption reaction of surface complexation of arsenicals onto the iron oxides surface.
This factor also matters when arsenicals are consisting of organic groups. In adsorption reactions,
the transition state is the stage of the reaction that needs energy in order for complex structures to
be established and that they may need to be higher in energy to overcome the reaction’s obstacles

50
5℃
15℃
25℃
35℃
in transition state level. The Arrhenius equation (15) was implemented to evaluate the activation
energy of the kinetic adsorption of arsenate solution to hematite nanoparticles. The extracted kads
from the slopes of Figure 20 was substituted into equation 15 and subsequently was linearized
(equation 16), and ultimately plotted versus 1
𝑇 (Figure 21). The slope of the least-squared fit of
the graph contains the term −𝐸𝑎
𝑅 that it was calculated for the activation energy of the arsenate
adsorption kinetic reaction (Table 5).
Figure 21. Linearized form of Arrhenius equation for the adsorption of arsenate on 6 mg of
hematite film at pH7, I=10 mM NaCl, with 2 mL/min flow rate at temperatures of 5, 15, 25, and
35°C with different concentrations: 0.25 mM, 0.5 mM, 1 mM, and 1.5 mM. (Data points
represent the average of 4 trials and error bars are ±σ from the average)
Table 5: Slope obtained from the Figure 21 defines the -𝐸𝑎
𝑅 of the fast part of the reaction at first
2 minutes of the adsorption kinetic reaction of arsenate and its calculated activation energy at
temperatures 5, 15, 25, and 35℃ with 0.25, 0.5, 1.0, and 1.5 mM of arsenate.
Slope = -𝑬𝒂
𝑹 Ea (kJmol-1)
-(1.5 ± 0.3) × 103 13 ± 3
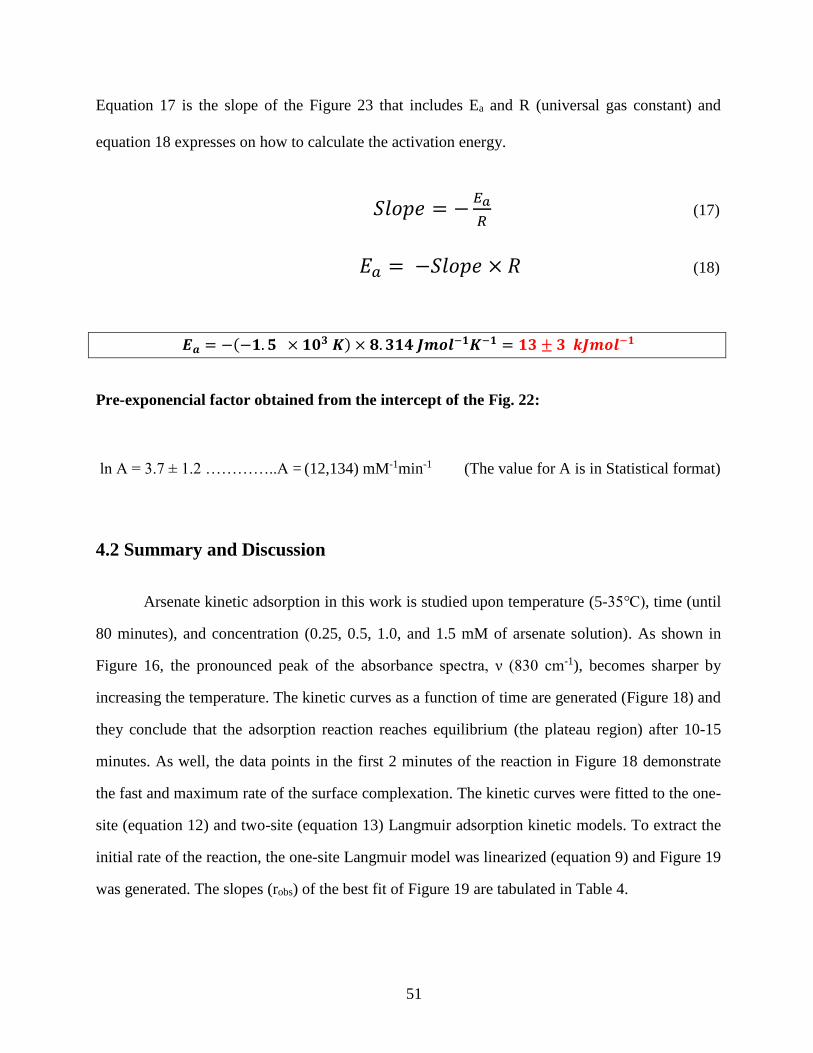
51
Equation 17 is the slope of the Figure 23 that includes Ea and R (universal gas constant) and
equation 18 expresses on how to calculate the activation energy.
𝑆𝑙𝑜𝑝𝑒 = −𝐸𝑎
𝑅 (17)
𝐸𝑎 = −𝑆𝑙𝑜𝑝𝑒 × 𝑅 (18)
𝑬𝒂 = −(−𝟏. 𝟓 × 𝟏𝟎𝟑 𝑲) × 𝟖. 𝟑𝟏𝟒 𝑱𝒎𝒐𝒍−𝟏𝑲−𝟏 = 𝟏𝟑 ± 𝟑 𝒌𝑱𝒎𝒐𝒍−𝟏
Pre-exponencial factor obtained from the intercept of the Fig. 22:
ln A = 3.7 ± 1.2 …………..A = (12,134) mM-1min-1 (The value for A is in Statistical format)
4.2 Summary and Discussion
Arsenate kinetic adsorption in this work is studied upon temperature (5-35℃), time (until
80 minutes), and concentration (0.25, 0.5, 1.0, and 1.5 mM of arsenate solution). As shown in
Figure 16, the pronounced peak of the absorbance spectra, ν (830 cm-1), becomes sharper by
increasing the temperature. The kinetic curves as a function of time are generated (Figure 18) and
they conclude that the adsorption reaction reaches equilibrium (the plateau region) after 10-15
minutes. As well, the data points in the first 2 minutes of the reaction in Figure 18 demonstrate
the fast and maximum rate of the surface complexation. The kinetic curves were fitted to the one-
site (equation 12) and two-site (equation 13) Langmuir adsorption kinetic models. To extract the
initial rate of the reaction, the one-site Langmuir model was linearized (equation 9) and Figure 19
was generated. The slopes (robs) of the best fit of Figure 19 are tabulated in Table 4.
52
The obtained values for robs thenceforth were plotted against concentration (Figure 20) at
each temperature. The first-order reaction depends linearly on the concentration. Graphs were
fitted to the least-square fit and the generated slopes (Table 5) of the best lines act as the rate
constant of the reaction (kads).
The Arrhenius equation was applied to calculate the activation barrier of the arsenate
complexation with the surface of the hematite nanoparticles. To solve for the Ea in the equation, it
must be linearized in order to simplify the exponential part of the equation that consists of the
term Ea. Lastly, the linearized kads (ln kads) was plotted over 1/T (Figure 21) and the slope (Table
5) of the best line of the fit that stands for term -Ea/R was calculated for the Ea. The calculated
value is 13 ± 3 kJmol-1.
The previous group, Adamescu and Al-Abadleh et al.55,60, through theoretical studies
(DFT calculations), observed that there are meaningful differences between arsenate and DMA in
their adsorption to the surface of hematite nanoparticles. These differences were seen in
formation of bidentate complexes from monodentate complexes in DMA and arsenate.
Thermodynamic data however revealed that the formation of inner sphere complexes in both
DMA and arsenate are favoured. The experimental data did not support the bidentate complex
from monodentate in DMA. The aforementioned group hypothesized the needs for high
activation energy for DMA to be adsorbed by hematite nanoparticles via forming the bidentate
inner sphere complexes.
53
CHAPTER 5: CONCLUSION AND SIGNIFICANCE
There was little known about the activation energy barriers of adsorption of negatively
charged ligands to the hematite nanoparticles. In addition, estimation of activation energy by a
surface sensitive technique is the first to be reported here. As Table 6 displays,54,61–66 different
oxyanions with different adsorbents were evaluated for their activation energies of their
adsorption kinetic reactions. The reactions were performed under similar experimental condition
as done in this study (in terms of temperature, time, and pH). However, the main difference
between the studies was the technique used. The surface sensitive ATR-FTIR technique was used
in this work and it quantifies in-situ the adsorption reaction of the analyte at the molecular level.
The revealed techniques in Table 6 are used for bulk or batch studies which quantify ex-situ
adsorption reactions. Sample preparation in bulk study consumes more time as it involves the
process of analyte filtration. Also, in the bulk study, the adsorption of the analyte is being
measured by subtracting the final concentration from initial concentration of the analyte solution
by Beer’s equation (A=ℇbC). Also, the concentration itself needs sophisticated instruments for
measurement such as inductively coupled plasma - optical emission spectrometry (ICP-OES) and
atomic absorption spectroscopy (AAS) which require expert personnel to operate. On the other
hand, by in-situ method, the adsorption can be measured while the solution is flowing towards
the surface in real time by taking numerous scans from the surface of the ATR crystal and having
more data points.
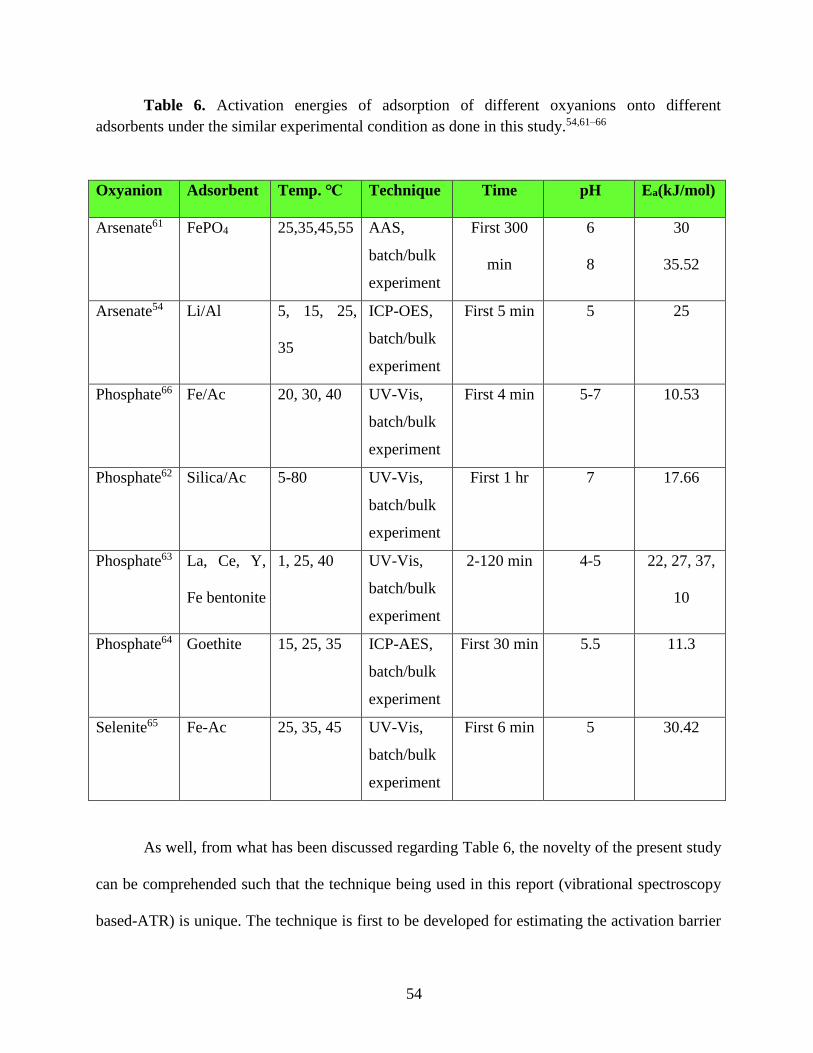
54
Table 6. Activation energies of adsorption of different oxyanions onto different
adsorbents under the similar experimental condition as done in this study.54,61–66
Oxyanion Adsorbent Temp. ℃ Technique Time pH Ea(kJ/mol)
Arsenate61 FePO4 25,35,45,55 AAS,
batch/bulk
experiment
First 300
min
6
8
30
35.52
Arsenate54 Li/Al 5, 15, 25,
35
ICP-OES,
batch/bulk
experiment
First 5 min 5 25
Phosphate66 Fe/Ac 20, 30, 40 UV-Vis,
batch/bulk
experiment
First 4 min 5-7 10.53
Phosphate62 Silica/Ac 5-80 UV-Vis,
batch/bulk
experiment
First 1 hr 7 17.66
Phosphate63 La, Ce, Y,
Fe bentonite
1, 25, 40 UV-Vis,
batch/bulk
experiment
2-120 min 4-5 22, 27, 37,
10
Phosphate64 Goethite
15, 25, 35 ICP-AES,
batch/bulk
experiment
First 30 min 5.5 11.3
Selenite65 Fe-Ac 25, 35, 45 UV-Vis,
batch/bulk
experiment
First 6 min 5 30.42
As well, from what has been discussed regarding Table 6, the novelty of the present study
can be comprehended such that the technique being used in this report (vibrational spectroscopy
based-ATR) is unique. The technique is first to be developed for estimating the activation barrier
55
of adsorption of an oxyanion to the surface of an iron-oxide among all other surface sensitive
techniques that are generally used to study the environmental interfaces.
Transferring the monodentate structure to a bidentate structure in order to make a strong
bond with adsorbent involves a higher barrier of energy in DMA. This is attributed to the two
methyl groups in DMA that cause a weak van der Waals bonding between DMA and hematite
instead of strong covalent bindings. Methyl groups are non-polar and, on the surface, cannot be
well stabilized by the hydrate molecules that are polar in the transition state geometry. Therefore,
the energy is required to overcome this structure obstruction.55
The activation energies for arsenate and DMA adsorption in this study are the first to be
reported via the ATR-FTIR surface sensitive technique, and they were calculated to be 13 ± 3 and
22 ± 7 kJmol-1 within the range of 5-35℃ , respectively. Increasing the temperature to 50℃ in
DMA adsorption lowers the activation energy of the complexation to 12 ± 7 kJmol-1. Hence, it is
a temperature-dependent process.
Activation energies of arsenate and DMA adsorption onto the other iron oxides however
were not the focus of this study, they can be assumed the similar values since the PZC of other
iron oxides fall in the range of 7-9.5 and that was 8.6 for hematite. This can be considered as a
future perspective.
As per Sparks et al.67 physical and chemical processes are two routes governing the
adsorption kinetics. The physical process needs less than 42 kJmol-1 of activation energy to
proceed, which is lower than the required energy for a chemical process. Physically-controlled
processes are considered as having a low barrier energy and they are called physisorption
processes. A chemically-controlled process, while needs more than 42 kJmol-1 energy to be
driven, is counted as a process with having a high activation energy and it is called a
56
chemisorption process. The higher activation energy for a chemisorption process is due to the
much stronger forces involved in this type of reaction which may also alter the structure of the
compound. In the adsorption reactions, diffusion-controlled process is the main category of the
physisorption process in the case of the porous homogeneous surfaces. The reported activation
energies herein fall into the physisorption and diffusion-controlled process.
The scientific impact of this research will address the contaminated waters with arsenicals
as it delivers an essential understanding of the functional groups and their effect on the binding to
the geosorbents. For the reason that DMA makes simultaneously both inner sphere and outer
sphere complexes in the surface, the surface chemistry of DMA can be complex to study at the
molecular level. The results also establish a methodical in situ kinetic analysis of DMA
interactions with hematite surface using the ATR-FTIR technique. Extracting kinetic parameters
and speciation information of arsenicals on iron oxides can be incorporated in the modeling and
development of efficient arsenic removal technologies. The health sector reaps the advantages of
clean and arsenic-free water in such a way that the diseases related to arsenic accumulation in the
body get dramatically decreased.
57
REFERENCES
(1) Capitani, J. F. Thermodynamic Analysis of Arsenic Methylation. Environ Sci Technol
2005, 39 (7), 2169–2176.
(2) Hering, J.G.; Kneebone, P. E. Biogeochemical Controls on Aesenic Occurance and
Mobility in Water Supplies. In Environmetal Chemistry of Arsenic; Frankenberger, W. T.,
Ed.; 2002; pp 155–181.
(3) Tayler, S. R., McLennan, S. M. The Continental Crust: Its Composition and Evolution;
OSTI.GOV, United States, 1985.
(4) Yan-Chu, H.; O’Niagru, J. Arsenic Found in Drinking Water. In Arsenic in the
Environment; Wiley, New York, 1994; pp 1, 17–50.
(5) Matschullat, J. Arsenic in the Geosphere - A Review. Sci Total Environ 2000, 249 (1–3),
297–312.
(6) Mackenzie, F. T.; Lantzy, R. J.; Paterson, V. Global Trace Metal Cycles and Predictions. J
Int Assoc Math Geol 1979, 11, 99–142.
(7) Callahan, M.; Slimak, M.; Gabel, N.; May, I.; Fowler, C.; Freed, J.; Jennings, P.; Durfee,
R.; Witmore, F.; Maestri, B.; Mabey, W.; Holt, B.; Gould, C. Water - Related
Environmental Fate of 129 Priority Pollutants; U.S. Environmental Protection Agency,
Washington D.C., 1979.
(8) Azcue, J. M.; O’Nriagu, J. Arsenic in the Environment; 1994; pp 1–16.
(9) Andreae, M. Distribution and Speciation of Arsenic in Natural Waters and Some Marine
Algae. Deep Res 1978, 25(4), 391–402.
(10) Adamescu, A.; Mitchell, W.; Hamilton, I. P.; Al-Abadleh, H. A. Insights into the Surface
Complexation of Dimethylarsinic Acid on Iron ( Oxyhydr ) Oxides from ATR-FTIR
58
Studies and Quantum Chemical Calculations. Environ Sci Technol 2010, 44 (20), 7802–
7807.
(11) Sabur, M. A.; Goldberg, S.; Gale, A.; Kabengi, N.; Al-Abadleh, H. A. Temperature-
Dependent Infrared and Calorimetric Studies on Arsenicals Adsorption from Solution to
Hematite Nanoparticles. Langmuir 2015, 31 (9), 2749–2760.
(12) Smith, E.; Naidu, R.; Alston, A. M. Arsenic in the Soil Environment. Adv Agron 1998, 64,
149–195.
(13) Wu, J.; Ho, P. C. Speciation of Inorganic and Methylated Arsenic Compounds by
Capillary Zone Electrophoresis with Indirect UV Detection Application to the Analysis of
Alkali Extracts of As 2 S 2 ( Realgar ) and As 2 S 3 ( Orpiment ). J Chromatogr 2004,
1026, 261–270.
(14) Brookins, D. G. Eh-pH Diagrams for Geochemistry, 1st ed.; Springer-Verlag Berlin
Heidelberg, 1988.
(15) Sadler, R.; Olszowy, H.; Shaw, G.; Biltoft, R.; Connell, D. Soil and Water Contamination
by Arsenic from A Tannery Waste. Water, Air, Soil pollut 1994, 78, 189–198.
(16) Muthumani, M.; Miltonprabu, S. Arsenic Induced Oxidative Stress and Its Possible
Reversal by Chelation Therapy Arsenic Induced Oxidative Stress and Its Possible Reversal
by Chelation Therapy. A J Toxicol 2012, 2 (2), 16–37.
(17) Pandey, S.; Rai, R.; Rai, L. C. Biochemical and Molecular Basis of Arsenic Toxicity and
Tolerance in Microbes and Plants. Handb Arsen Toxicol 2015, 627–674.
(18) Peters, Stephen; Blum, Joel; Klaue, Bjoern; Karagas, M. Arsenic Occurrence in New
Hampshire Drinking Water. Environ. Sci. Technol. 1999, 33 (9), 1328–1333.
(19) Moore, J.W.; Ramamoorthy, S. Heavy Metals in Natural Waters, 1st ed.; Springer-Verlag
59
New York, 1984.
(20) Ally, M.R.; Berry, J.B.; Dole, L.R.; Ferrada, J.J.; Van Dyke, J. W. Economical Recovery
of By-Products in the Mining Industry, U.S. Department of Energy, 2001.
(21) Rossman, T. G. Mechanism of Arsenic Carcinogenesis : An Integrated Approach. Mutat
Res 2003, 533, 37–65.
(22) Thomas, J. D.; Styblo, M.; Lin, S. The Cellular Metabolism and Systemic Toxicity of
Arsenic 1. Toxicol Appl Pharmacol 2001, 176, 127–144.
(23) Mitchell, W.; Goldberg, S.; Al-Abadleh, H. A. In Situ ATR-FTIR and Surface
Complexation Modeling Studies on the Adsorption of Dimethylarsinic Acid and p-
Arsanilic Acid on Iron-(Oxyhydr)Oxides. J Colloid Interface Sci 2011, 358 (2), 534–540.
(24) Ahmad, A.; Richards, L. A.; Bhattacharya, P. Arsenic Remediation of Drinking Water.
Water Intell Online 2017, 16, 79–98.
(25) Gomez-Caminero, A.; Howe, Paul D.; Hughes, M.; Kenyon, E.; Lewis, D. R. et al. Arsenic
and Arsenic Compounds. World Health Organization, Geneva, Switzerland, 2001.
(26) Kenyon, E. M.; Hughes, M. F. A Concise Review of the Toxicity and Carcinogenicity of
Dimethylarsinic Acid. 2001, 160, 227–236.
(27) Khairul, I.; Wang, Q. Q.; Jiang, Y. H.; Wang, C. Metabolism , Toxicity and Anticancer
Activities of Arsenic Compounds. Oncotarget 2017, 8 (14), 23905–23926.
(28) Salnikow, K. Genetic and Epigenetic Mechanisms in Metal Carcinogenesis and
Cocarcinogenesis: Nickel, Arsenic, and Chromium. Chem Res Toxicol 2007, 21 (1), 28–
44.
(29) Yamanaka, K.; Okada, S. Induction of Lung-Specific DNA Damage by Metabolically
Methylated Arsenics via the Production of Free Radicals. Environ Health Perspect 1994,
60
102 (SUPPL. 3), 37–40.
(30) Guidelines for Canadian Drinking Water Quality : Guideline Technical Document-
Arsenic. 2006.
(31) Gupta, A.; Yunus, M.; Sankararamakrishnan, N. Zerovalent Iron Encapsulated Chitosan
Nanospheres - A Novel Adsorbent for the Removal of Total Inorganic Arsenic from
Aqueous Systems. Chemosphere 2012, 86 (2), 150–155.
(32) Al-Abadleh, H.; Grassian, V. H. Oxide Surfaces as Environmental Interfaces. Surf. Sci.
Rep. 2003, 52 (3–4), 63–161.
(33) Kosmulski, M. The pH-Dependent Surface Charging and the Points of Zero Charge. J
Colloid Interface Sci 2002, 253 (1), 77–87.
(34) Cornell, R. M.; Schwertmann, U. The Iron Oxides; 2007.
(35) James, Robert O.; Parks, G. A. Characterization of Aqueous Colloids by Their Electrical
Double-Layer and Intrinsic Surface Chemical Propertise. In Surface and Colloid Science;
1982; pp 119–216.
(36) Dzombak, D. A.; Morel, F. M. M. Surface Complexation Modeling; John Wiley & Sons,
1990.
(37) Sabur, M. A. Surface Complexation of Monosubstituted Organoarsenicals on Hematite:
ATR-FTIR Investigations, MS.C. Thesis, Wilfirid Laurier University, 2014.
(38) Duckworth, Owen W.; Martin, S. T. Surface Complexation and Dissolution of Hematite
by C 1-C 6 Dicarboxylic Acids at pH = 5.0. Geochim Cosmochim Acta 2001, 65 (23),
4289–4301.
(39) Kalbitz, K.; Kaiser, K. Contribution of Dissolved Organic Matter to Carbon Storage in
Forest Mineral Soils. J Plant Nutr Soil Sci 2008, 171 (1), 52–60.
61
(40) Jones, D. L. Organic Acids in the Rhizosphere – a Critical Review. Plant Soil 1998, 205
(1), 25–44.
(41) Kramer, M. G.; Sanderman, J.; Chadvik, O. A.; Chorover. J.; Vitousek, P. M. Long-Term
Carbon Storage through Retention of Dissolved Aromatic Acids by Reactive Particles in
Soil. 2012, 18, 2594–2605.
(42) Lalonde, K.; Mucci, A.; Ouellet, A.; Gélinas, Y. Preservation of Organic Matter in
Sediments Promoted by Iron. Nature 2012, 483 (7388), 198–200.
(43) Wang, S.; Mulligan, C. N. Effect of Natural Organic Matter on Arsenic Release from Soils
and Sediments into Groundwater. Environ Geochem Health 2006, 28 (3), 197–214.
(44) Redman, Aaron D.; Macalady, DL; Ahmann, D. Natural Organic Matter Affects Arsenic
Speciation and Sorption onto Hematite. Environ Sci Technol 2002, 36 (13), 2889–2896.
(45) Yeasmin, S.; Singh, B.; Kookana, R. S.; Farrell, M.; Sparks, D. L.; Johnston, C. T.
Influence of Mineral Characteristics on the Retention of Low Molecular Weight Organic
Compounds: A Batch Sorption–Desorption and ATR-FTIR Study. J Colloid Interface Sci
2014, 432, 246–257.
(46) Ausili, A.; Sanchez, M.; Gomez-Fernandez, J. Attenuated Total Reflectance Infrared
Spectroscopy : A Powerful Method for the Simultaneous Study of Structure and Spatial
Orientation of Lipids and Membrane Proteins. Biomed Spectrosc Imaging 2015, 4 (April),
159–170.
(47) DePalma, S.; Cowen, S.; Al-abadleh, H. A. Adsorption Thermodynamics of p-Arsanilic
Acid on Iron ( Oxyhydr ) Oxides : In-Situ ATR-FTIR Studies. 2008, 42 (6), 1922–1927.
(48) Mohan, D.; Pittman, C. U. Arsenic Removal from Water/Wastewater Using Adsorbents-A
Critical Review. J Hazard Mater 2007, 142 (1–2), 1–53.
62
(49) Shimizu, M.; Arai, Y.; Sparks, D. L. Multiscale Assessment of Methylarsenic Reactivity in
Soil. 1. Sorption and Desorption on Soils. Environ Sci Technol 2011, 45 (10), 4293–4299.
(50) Tofan-Lazar, J.; Al-Abadleh, H. A. ATR-FTIR Studies on the Adsorption/Desorption
Kinetics of Dimethylarsinic Acid on Iron-(Oxyhydr)Oxides. J Phys Chem A 2012, 116 (6),
1596–1604.
(51) Yang, Y.; Yan, W.; Jing, C. Dynamic Adsorption of Catechol at the Goethite/Aqueous
Solution Interface: A Molecular-Scale Study. Langmuir 2012, 28 (41), 14588–14597.
(52) Farrell, J.; Chaudhary, B. K. Understanding Arsenate Reaction Kinetics with Ferric
Hydroxides. Environ Sci Technol 2013, 47 (15), 8342–8347.
(53) Wang, Z.; Shi, M.; Li, J.; Zheng, Z. Influence of Moderate Pre-Oxidation Treatment on the
Physical, Chemical and Phosphate Adsorption Properties of Iron-Containing Activated
Carbon. J Environ Sci (China) 2014, 26 (3), 519–528.
(54) Liu, Y. T.; Chen, T. Y.; Wang, M. K.; Huang, P. M.; Chiang, P. N.; Lee, J. F. Mechanistic
Study of Arsenate Adsorption on Lithium/Aluminum Layered Double Hydroxide. Appl
Clay Sci 2010, 48 (3), 485–491.
(55) Adamescu, A.; Hamilton, I. P.; Al-Abadleh, H. A. Dispersion Effects on the
Thermodynamics and Transition States of Dimethylarsinic Acid Adsorption on Hydrated
Iron (Oxyhydr)Oxide Clusters from Density Functional Theory Calculations. J Phys Chem
A 2016, 120 (46), 9270–9280.
(56) Cowen, S.; Duggal, M.; Hoang, T.; Al-abadleh, H. A. Vibrational Spectroscopic
Characterization of Some Environmentally Important Organoarsenicals — A Guide for
Understanding the Nature of Their Surface Complexes. Can J Chem 2008, 86, 942–950.
(57) Moore, J.W.; Pearson, R. G. Kinetics and Mechanism.; third, Ed.; John Wiley & Sons,:
63
New York, 1981.
(58) Xu, X.; Gao, B.; Wang, W.; Yue, Q.; Wang, Y.; Ni, S. Colloids and Surfaces B :
Biointerfaces Adsorption of Phosphate from Aqueous Solutions onto Modified Wheat
Residue : Characteristics , Kinetic and Column Studies. 2009, 70, 46–52.
(59) Myneni, S. C. B.; Traina, S. J.; Waychunas, G. A.; Logan, T. J. Experimental and
Theoretical Vibrational Spectroscopic Evaluation of Arsenate Coordination in Aqueous
Solutions, Solids, and at Mineral-Water Interfaces. Geochim Cosmochim Acta 1998, 62
(19–20), 3285–3300.
(60) Adamescu, A.; Hamilton, I. P.; Al-Abadleh, H. A. Thermodynamics of Dimethylarsinic
Acid and Arsenate Interactions with Hydrated Iron- ( Oxyhydr ) Oxide Clusters : DFT
Calculations. 2011, 10438–10444.
(61) Hamayun, M.; Mahmood, T.; Naeem, A.; Muska, M.; Din, S. U.; Waseem, M. Equilibrium
and Kinetics Studies of Arsenate Adsorption by FePO4. Chemosphere 2014, 99, 207–215.
(62) Al-Zboon, K. K. Phosphate Removal by Activated Carbon–Silica Nanoparticles
Composite, Kaolin, and Olive Cake. Environ Dev Sustain 2018, 20 (6), 2707–2724.
(63) Buzetzky, D.; Nagy, N. M.; Kónya, J. Use of La-, Ce-, Y-, Fe- Bentonites for Removing
Phosphate Ions from Aqueous Media. Period Polytech Chem Eng 2017, 61 (1), 27.
(64) Pereira, F.; Amarakoon, I.; Zvomuya, F.; Jeke, N. Kinetics and Thermodynamics of
Phosphorus Sorption on Goethites: Effects of Biochar Application. Can J Soil Sci 2018, 98
(2018), 128–135.
(65) Zhang, N.; Lin, L. S.; Gang, D. Adsorptive Selenite Removal from Water Using Iron-
Coated GAC Adsorbents. Water Res 2008, 42 (14), 3809–3816.
(66) Wang, Z.; Nie, E.; Li, J.; Yang, M.; Zhao, Y.; Luo, X.; Zheng, Z. Equilibrium and Kinetics
64
of Adsorption of Phosphate onto Iron-Doped Activated Carbon. Environ. Sci. Pollut. Res.
2012, 19 (7), 2908–2917.
(67) Sparks, D. L. 2 - Application of Chemical Kinetics to Soil Chemical Reactions. In Kinetics
of Soil Chemical Processes; ScienceDirect, The California academic Press: San Jose, CA,
USA, 1989; pp 4–38.
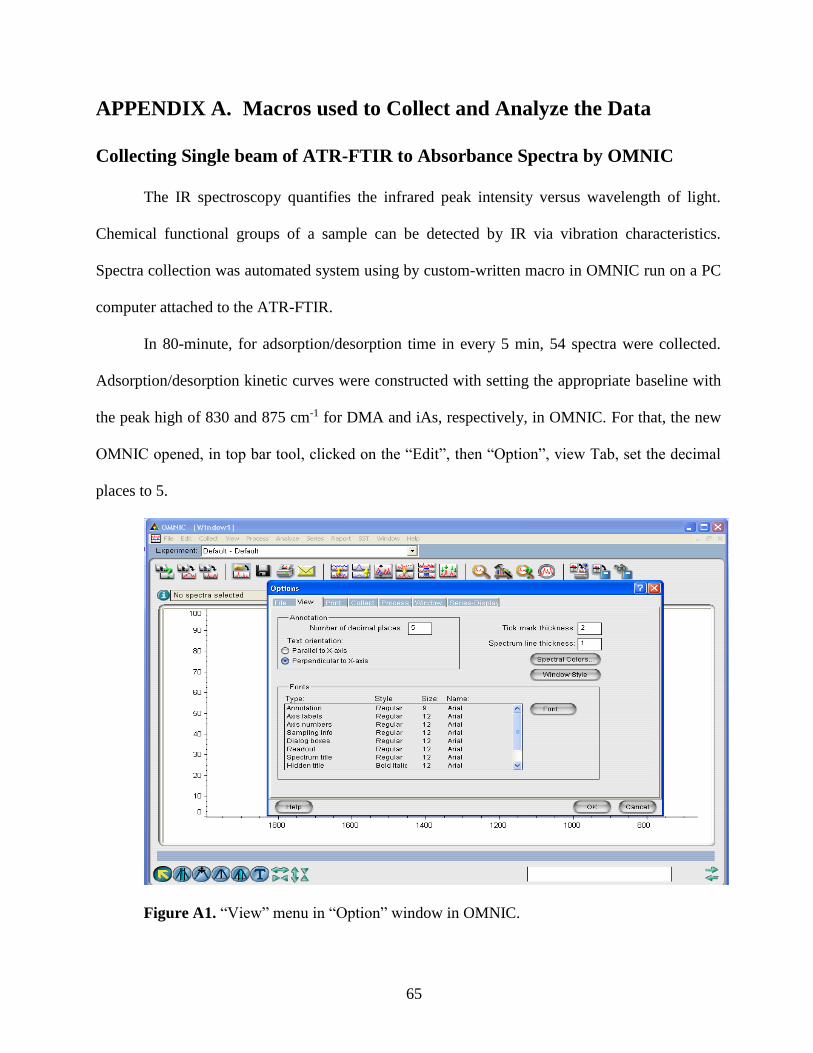
65
APPENDIX A. Macros used to Collect and Analyze the Data
Collecting Single beam of ATR-FTIR to Absorbance Spectra by OMNIC
The IR spectroscopy quantifies the infrared peak intensity versus wavelength of light.
Chemical functional groups of a sample can be detected by IR via vibration characteristics.
Spectra collection was automated system using by custom-written macro in OMNIC run on a PC
computer attached to the ATR-FTIR.
In 80-minute, for adsorption/desorption time in every 5 min, 54 spectra were collected.
Adsorption/desorption kinetic curves were constructed with setting the appropriate baseline with
the peak high of 830 and 875 cm-1 for DMA and iAs, respectively, in OMNIC. For that, the new
OMNIC opened, in top bar tool, clicked on the “Edit”, then “Option”, view Tab, set the decimal
places to 5.
Figure A1. “View” menu in “Option” window in OMNIC.
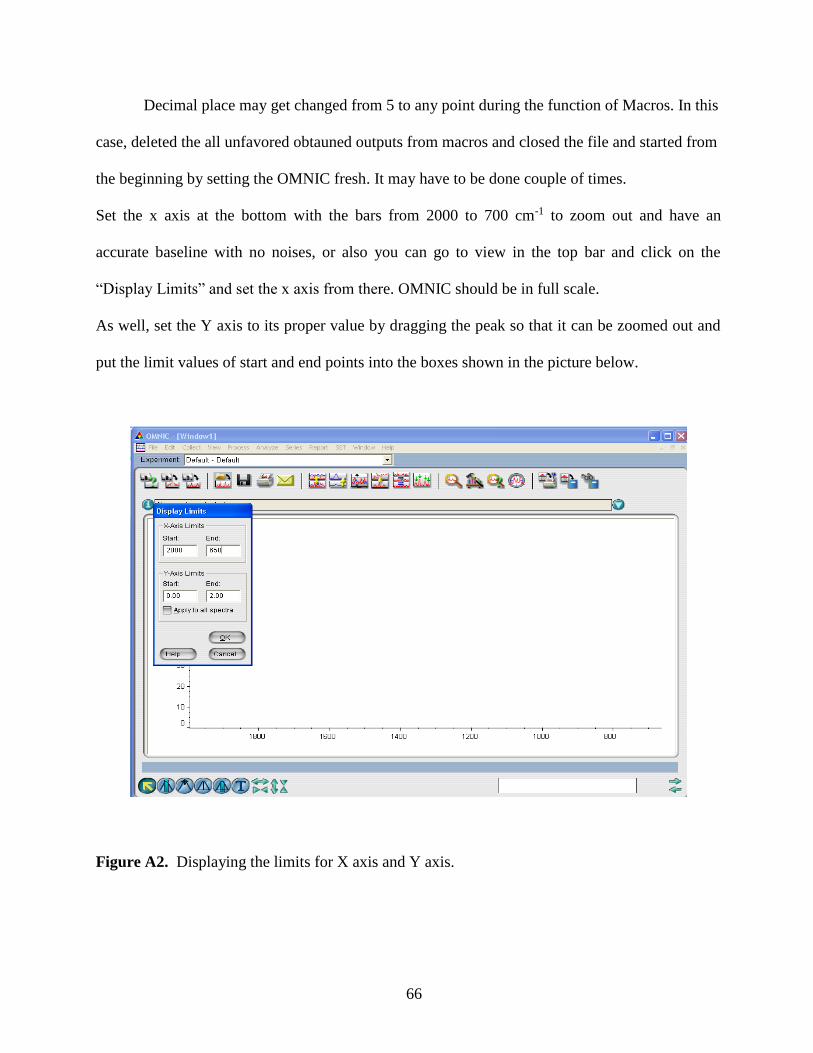
66
Decimal place may get changed from 5 to any point during the function of Macros. In this
case, deleted the all unfavored obtauned outputs from macros and closed the file and started from
the beginning by setting the OMNIC fresh. It may have to be done couple of times.
Set the x axis at the bottom with the bars from 2000 to 700 cm-1 to zoom out and have an
accurate baseline with no noises, or also you can go to view in the top bar and click on the
“Display Limits” and set the x axis from there. OMNIC should be in full scale.
As well, set the Y axis to its proper value by dragging the peak so that it can be zoomed out and
put the limit values of start and end points into the boxes shown in the picture below.
Figure A2. Displaying the limits for X axis and Y axis.
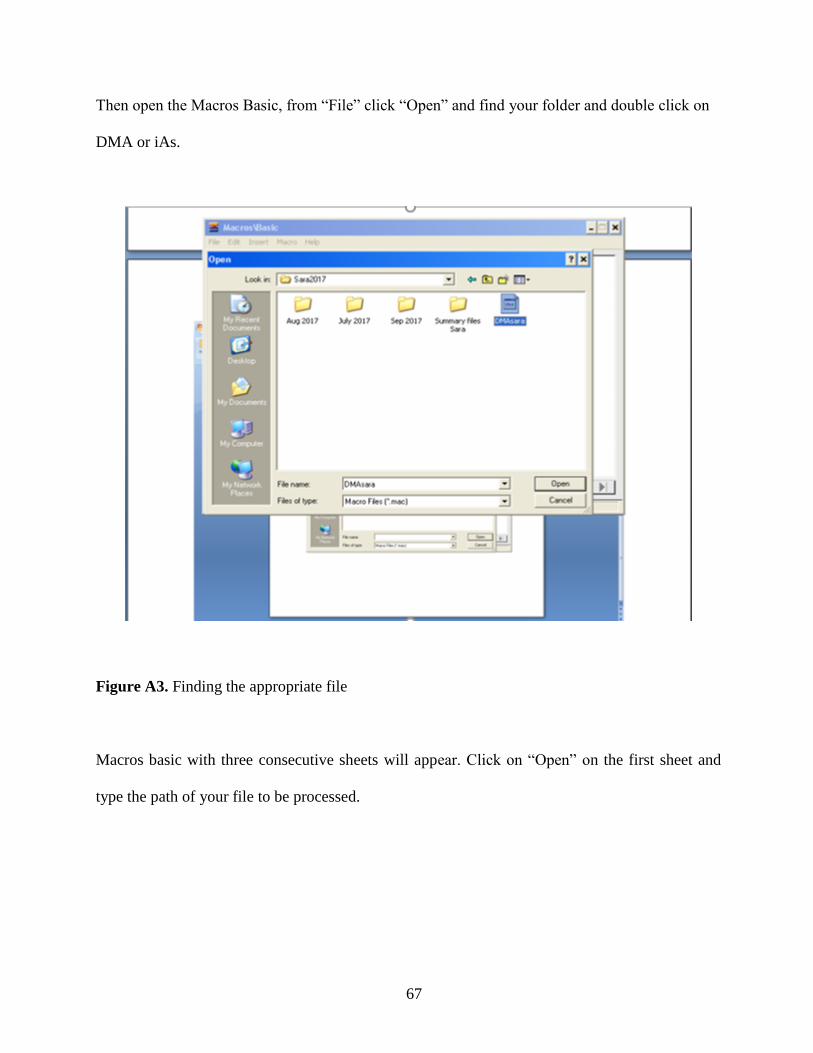
67
Then open the Macros Basic, from “File” click “Open” and find your folder and double click on
DMA or iAs.
Figure A3. Finding the appropriate file
Macros basic with three consecutive sheets will appear. Click on “Open” on the first sheet and
type the path of your file to be processed.
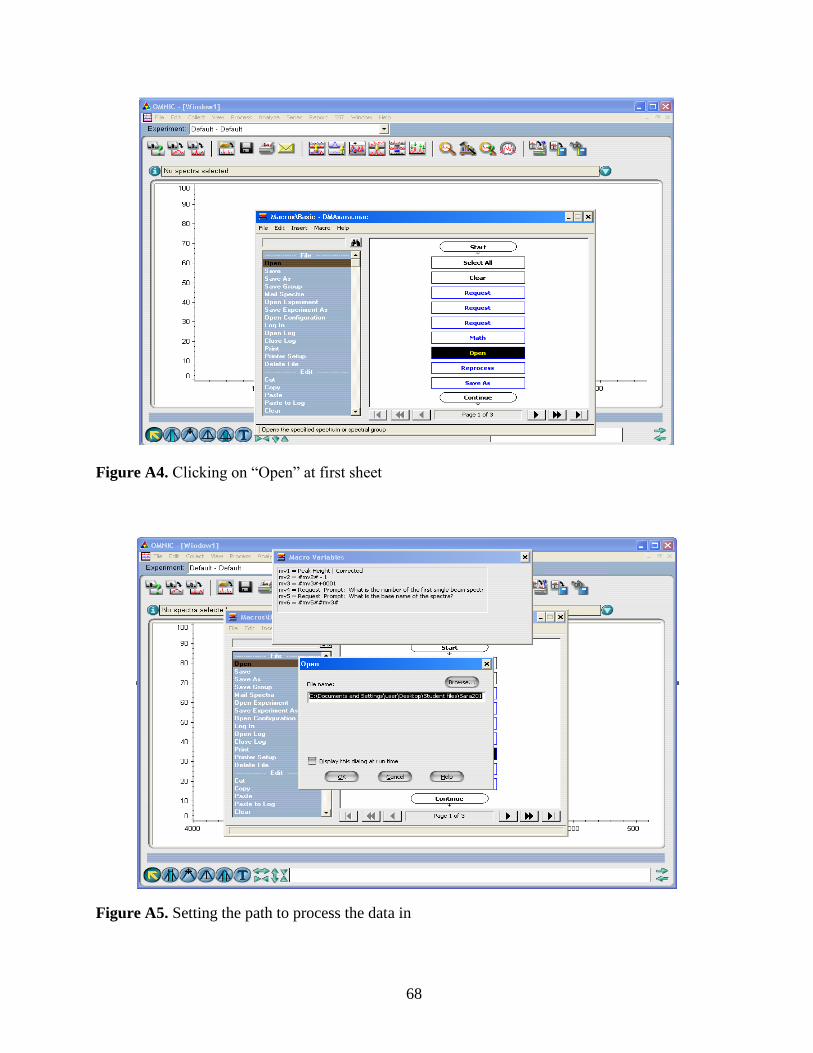
68
Figure A4. Clicking on “Open” at first sheet
Figure A5. Setting the path to process the data in
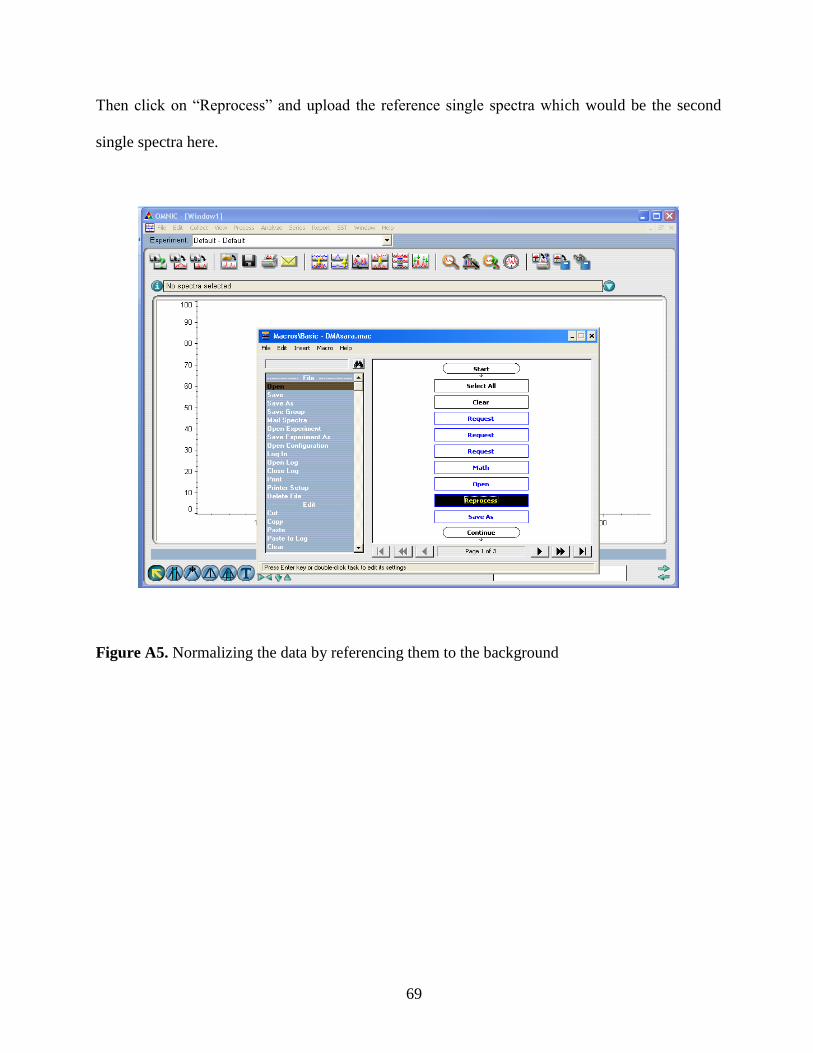
69
Then click on “Reprocess” and upload the reference single spectra which would be the second
single spectra here.
Figure A5. Normalizing the data by referencing them to the background
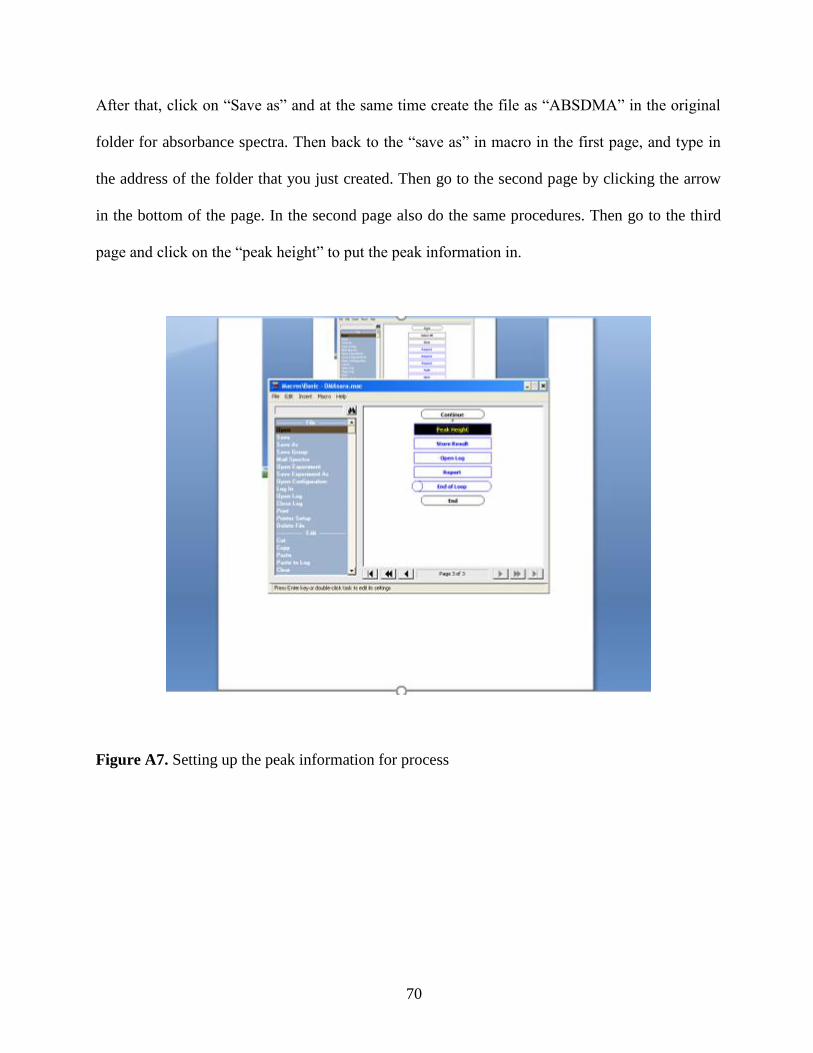
70
After that, click on “Save as” and at the same time create the file as “ABSDMA” in the original
folder for absorbance spectra. Then back to the “save as” in macro in the first page, and type in
the address of the folder that you just created. Then go to the second page by clicking the arrow
in the bottom of the page. In the second page also do the same procedures. Then go to the third
page and click on the “peak height” to put the peak information in.
Figure A7. Setting up the peak information for process
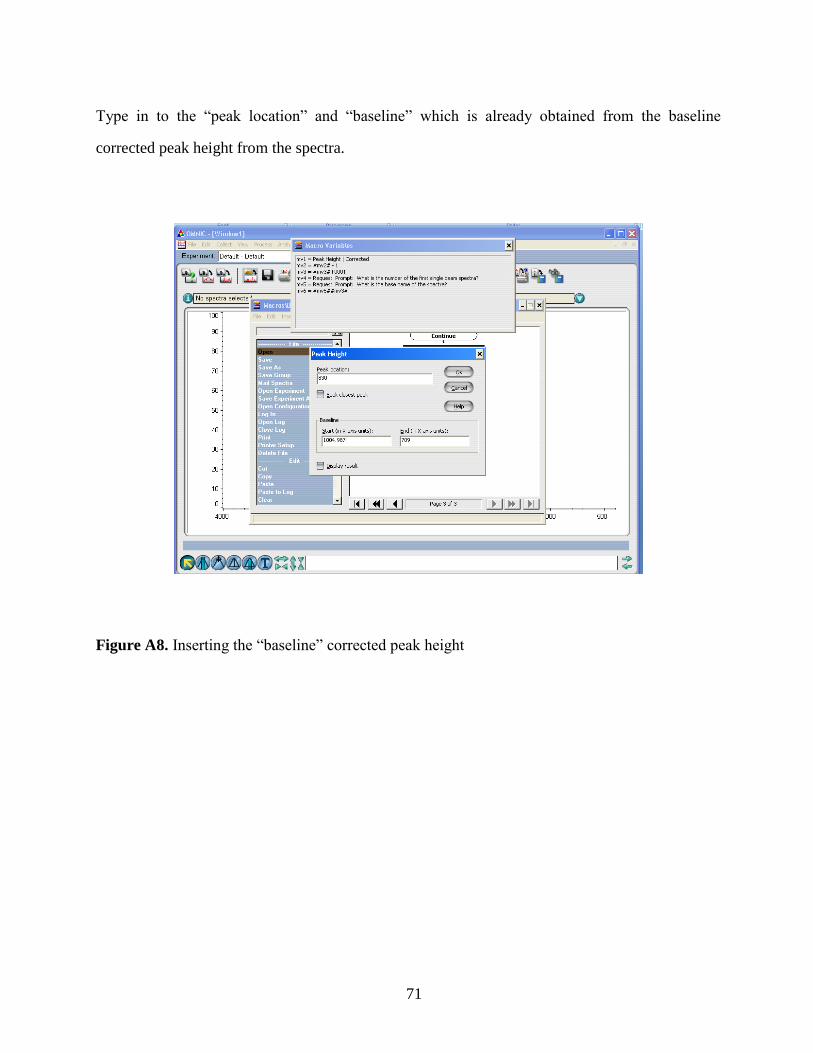
71
Type in to the “peak location” and “baseline” which is already obtained from the baseline
corrected peak height from the spectra.
Figure A8. Inserting the “baseline” corrected peak height
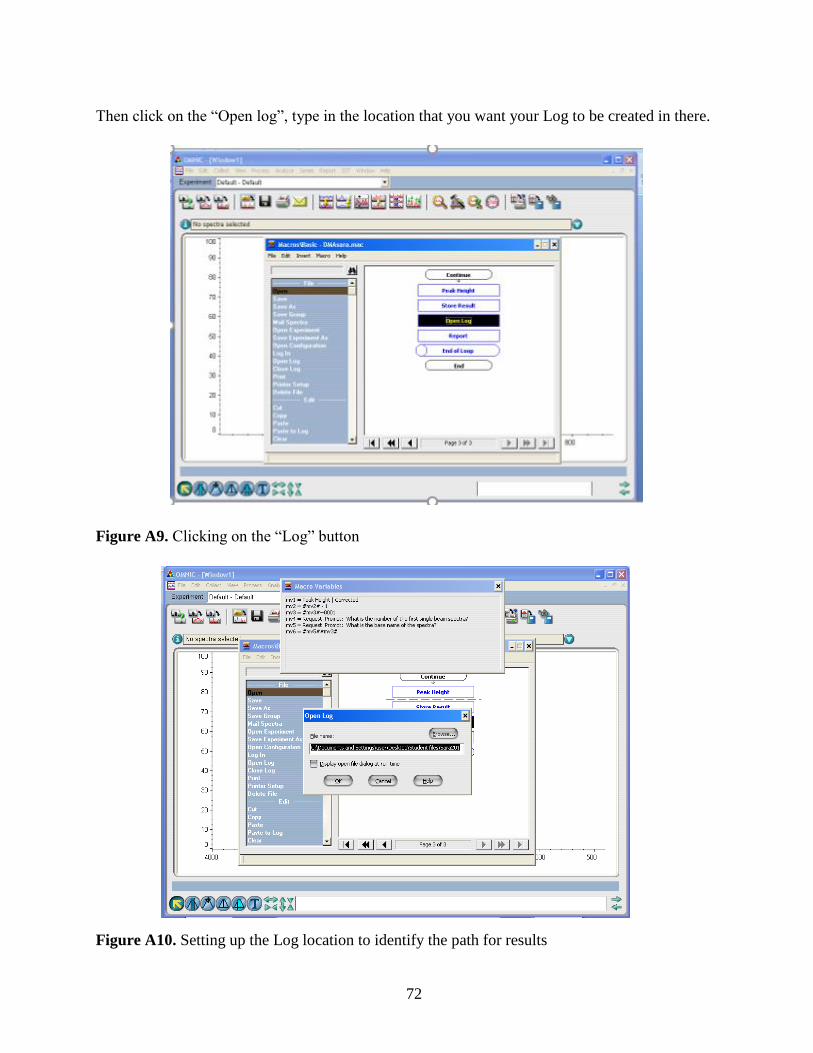
72
Then click on the “Open log”, type in the location that you want your Log to be created in there.
Figure A9. Clicking on the “Log” button
Figure A10. Setting up the Log location to identify the path for results
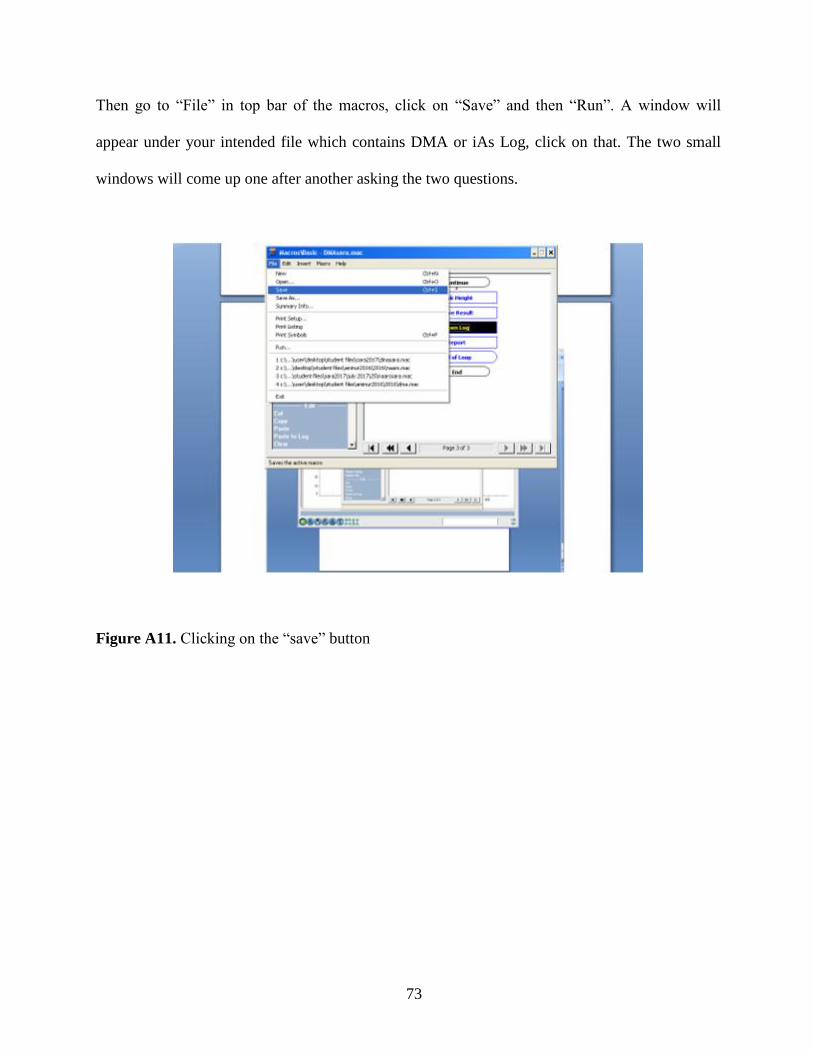
73
Then go to “File” in top bar of the macros, click on “Save” and then “Run”. A window will
appear under your intended file which contains DMA or iAs Log, click on that. The two small
windows will come up one after another asking the two questions.
Figure A11. Clicking on the “save” button
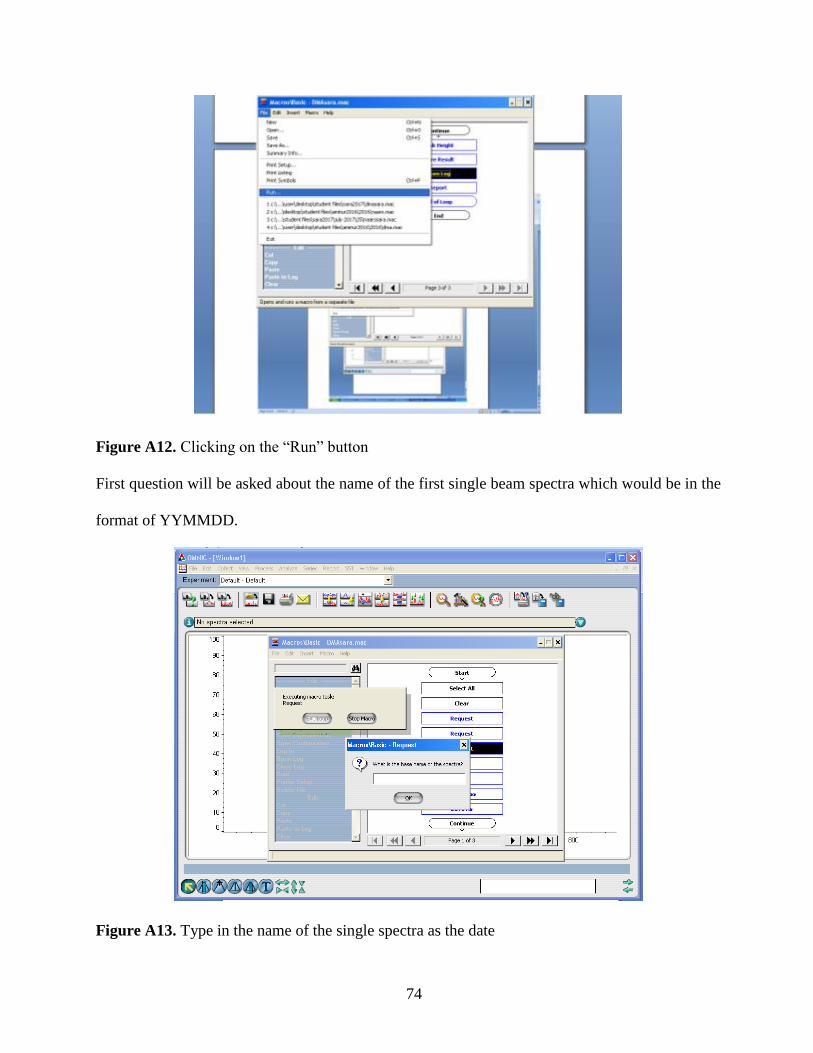
74
Figure A12. Clicking on the “Run” button
First question will be asked about the name of the first single beam spectra which would be in the
format of YYMMDD.
Figure A13. Type in the name of the single spectra as the date
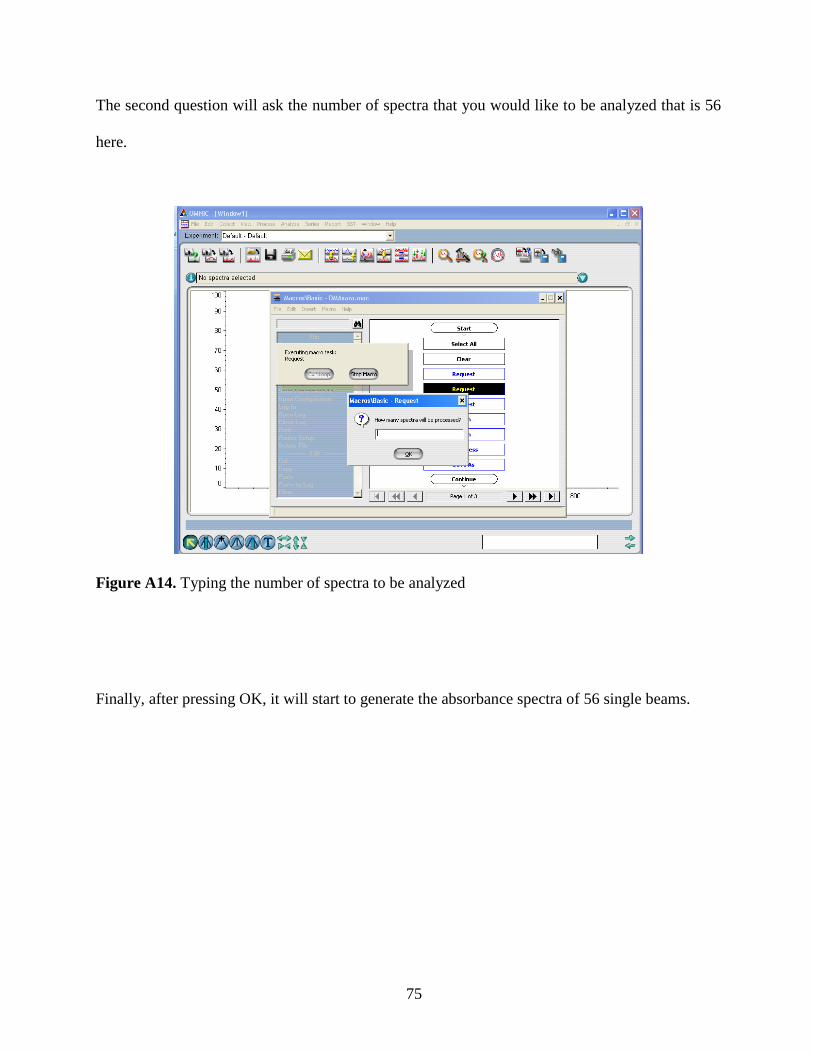
75
The second question will ask the number of spectra that you would like to be analyzed that is 56
here.
Figure A14. Typing the number of spectra to be analyzed
Finally, after pressing OK, it will start to generate the absorbance spectra of 56 single beams.
76
APPENDIX B. Glassware Cleaning for Aqueous Phase Experiments
1- Prepare the cleaning bath of NaOH: dissolve 200-300 gram of NaOH pellets in 8-10 liter
of distilled water. (first pour water to the container and then add the pellets)
2- Wash the any contaminated glassware by distilled water and soap, rinse it and immerse it
into the above prepared bath.
3- Let glassware to be soaked up in the bath for minimum one hour.
4- Take them out from the bath and rinse them thoroughly with running distilled water.
5- You may let them be dried if you do not need to use immediately after.
Also, usually the NaOH bath should be changed and refreshed every month. (Depends on
the load of the contaminated glassware, the frequency of changing the bath may vary)
77
APPENDIX C. Troubleshooting of the Weighing Balance
Always before weighing your sample, make sure that the bubble of the scale which shows the
level of the scale is always centered in two sides of the scale. If the bubble is not centered, try to
fix it to the center by screwing the screws on two sides of the apparatus.
You can proof the functionality of the balance by standard weighs ranging from 1 gram to 200
grams (depends on the max capacity of the scale). If it does not show the right weight, call the
technician to calibrate it.
Another way of testing the functionality of the balance is the VWR syringes. Soak the distilled
water up by the syringe and weigh it on the scale. If the values that scale show is the expected
value, so it means that balance works properly. (Assuming that the density of the distilled water
is 1 gr/cm3.
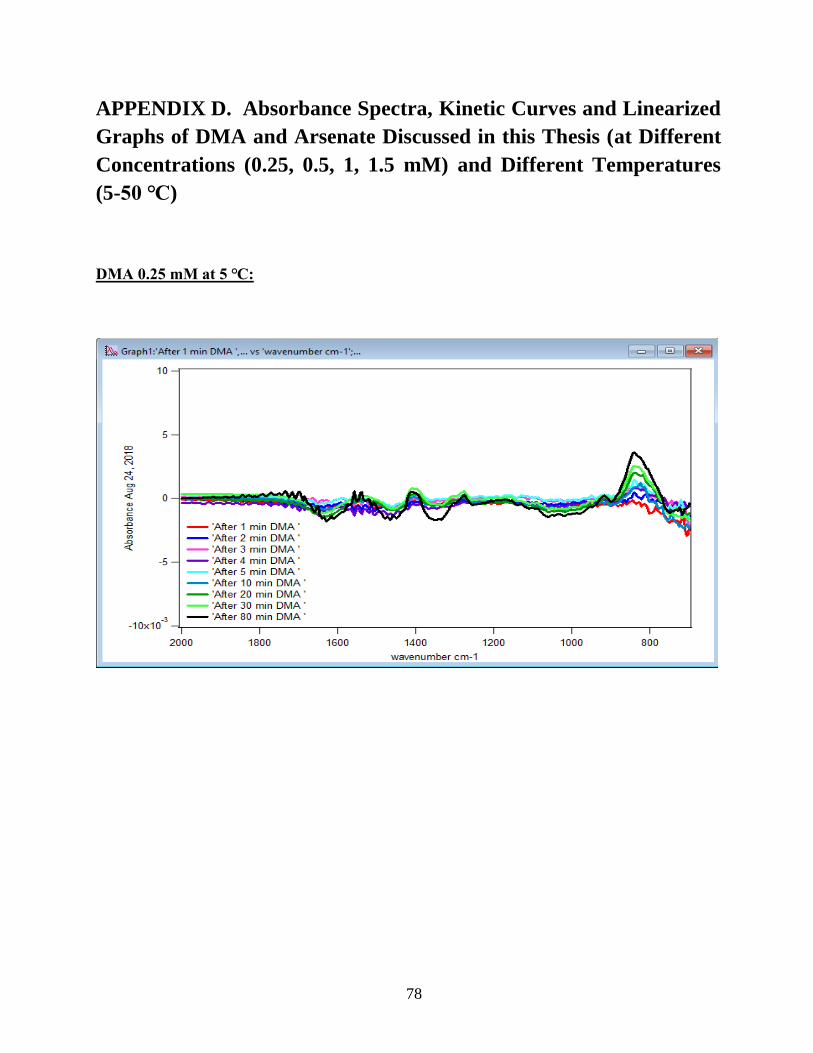
78
APPENDIX D. Absorbance Spectra, Kinetic Curves and Linearized
Graphs of DMA and Arsenate Discussed in this Thesis (at Different
Concentrations (0.25, 0.5, 1, 1.5 mM) and Different Temperatures
(5-50 ℃)
DMA 0.25 mM at 5 ℃:
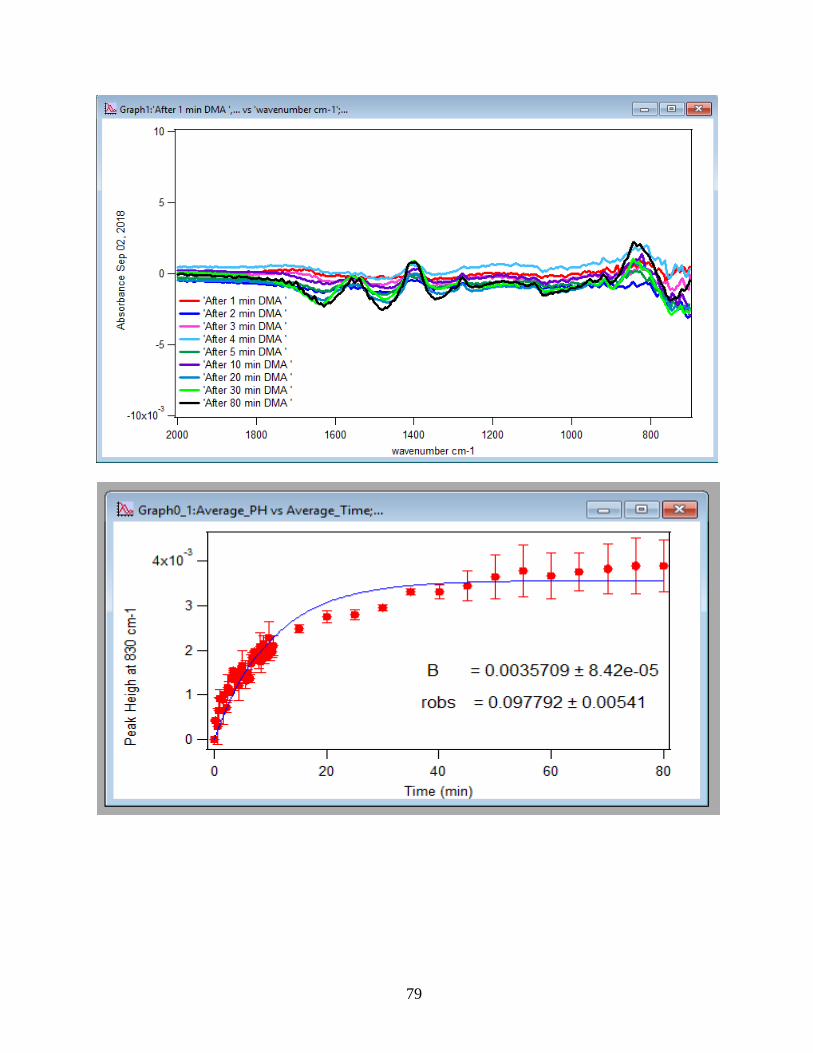
79
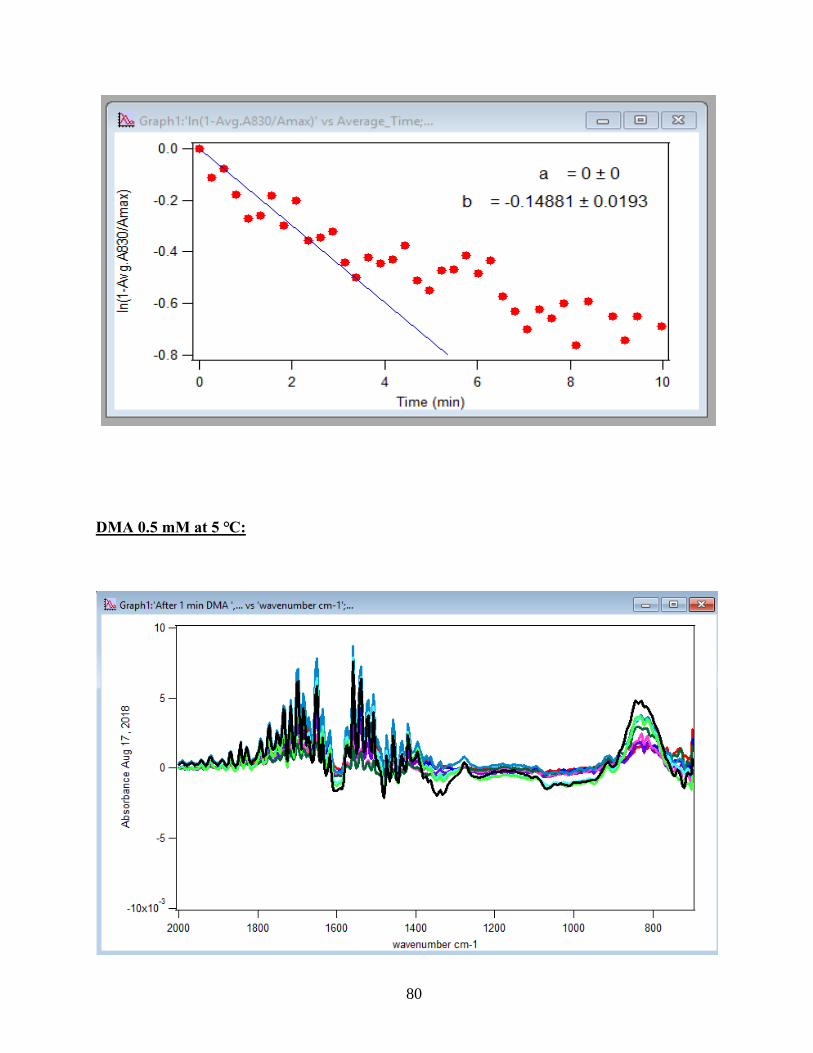
80
DMA 0.5 mM at 5 ℃:
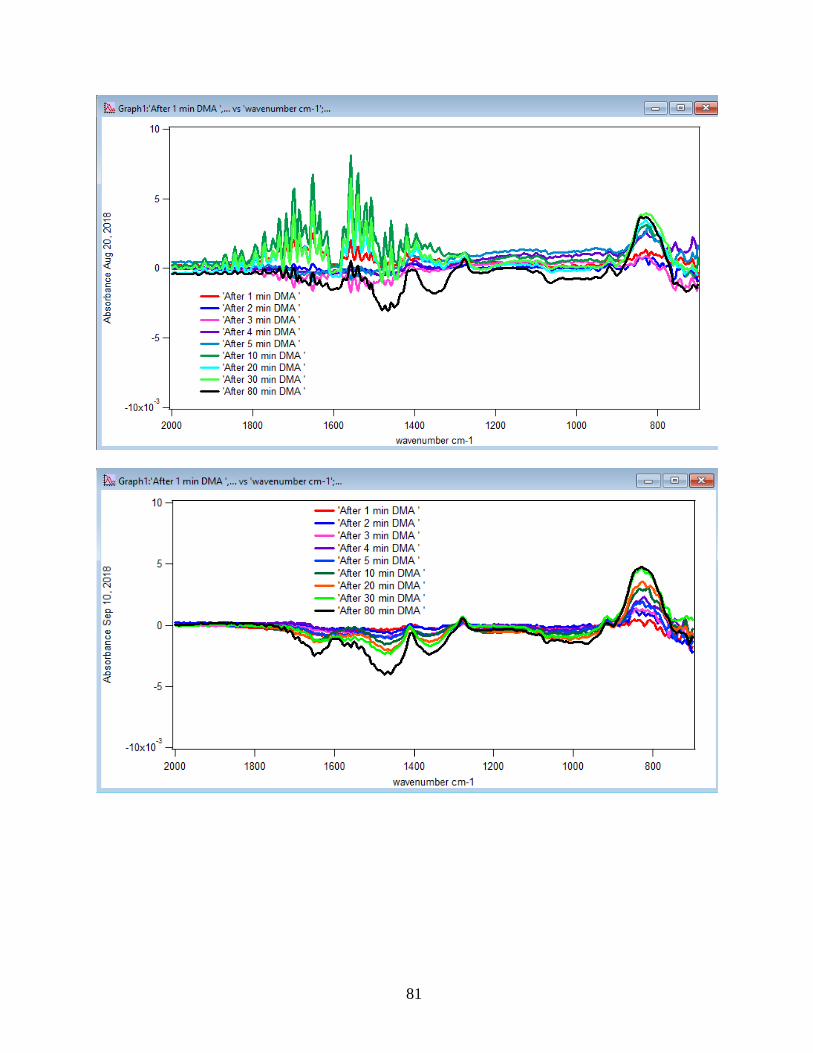
81
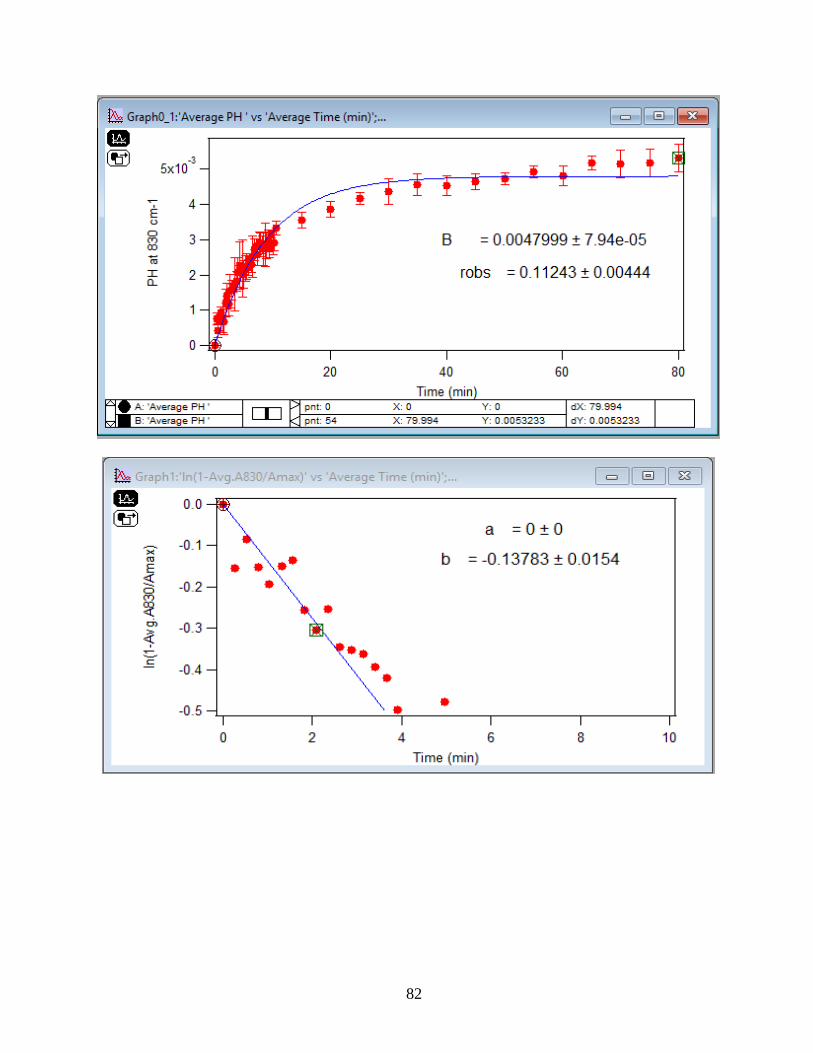
82
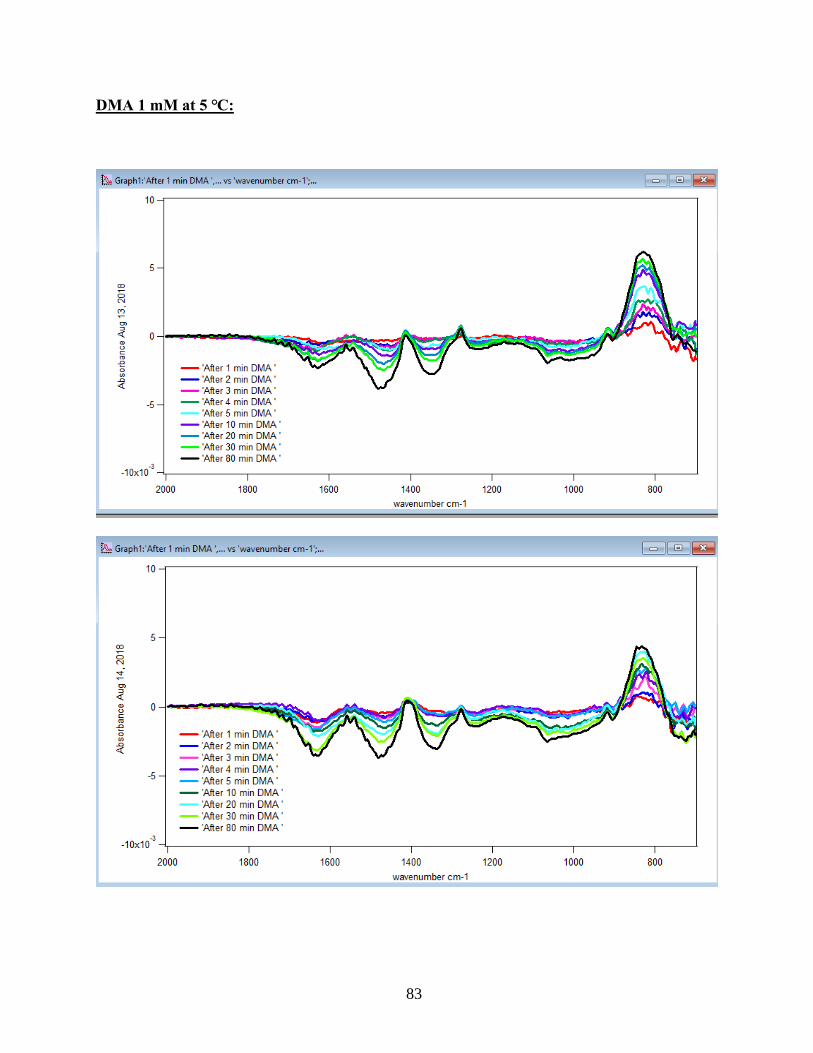
83
DMA 1 mM at 5 ℃:
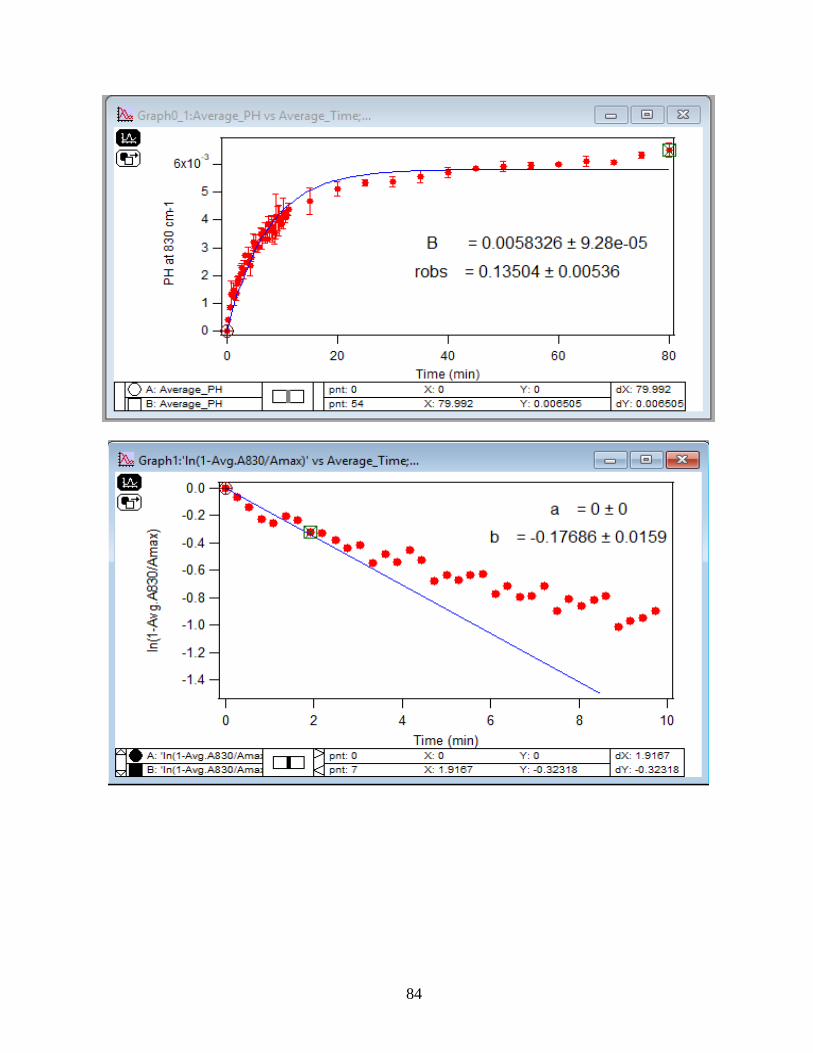
84
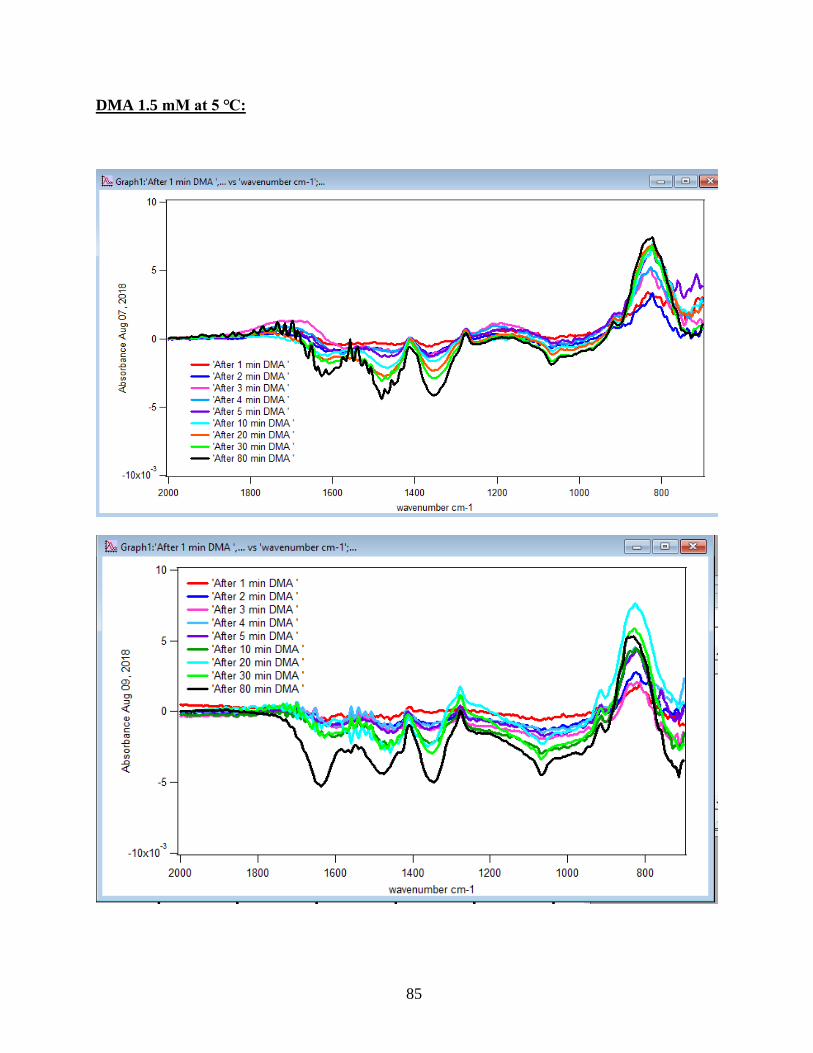
85
DMA 1.5 mM at 5 ℃:
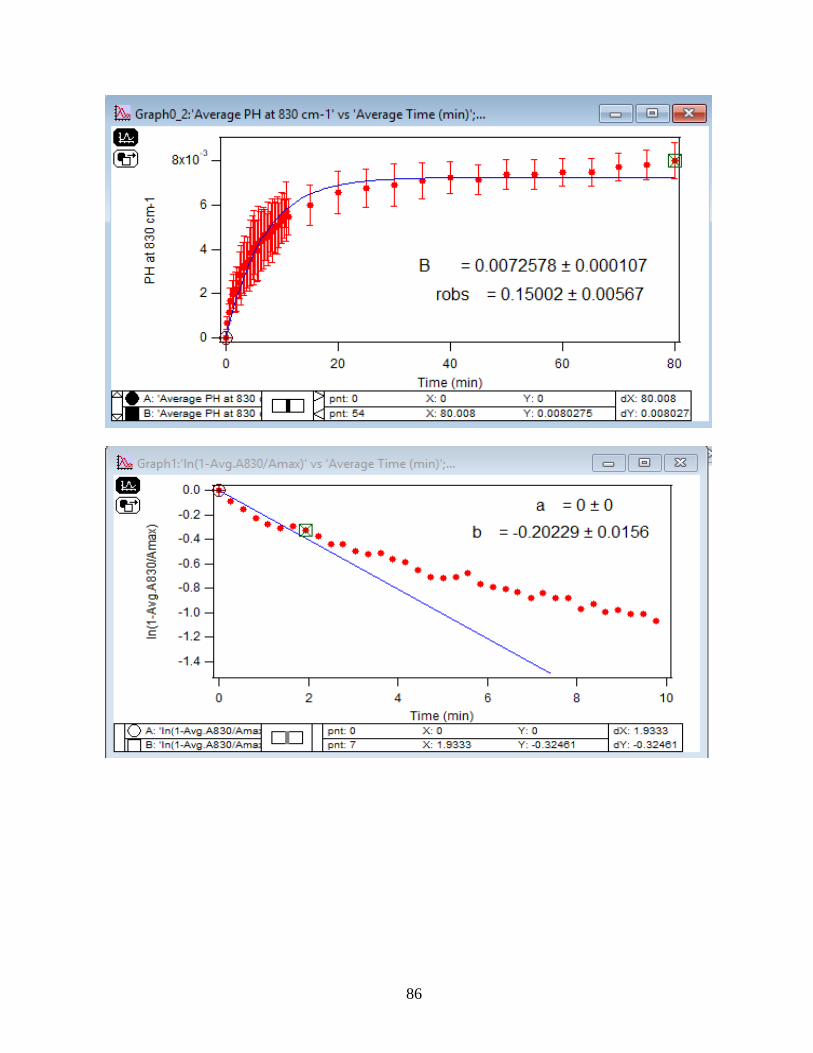
86
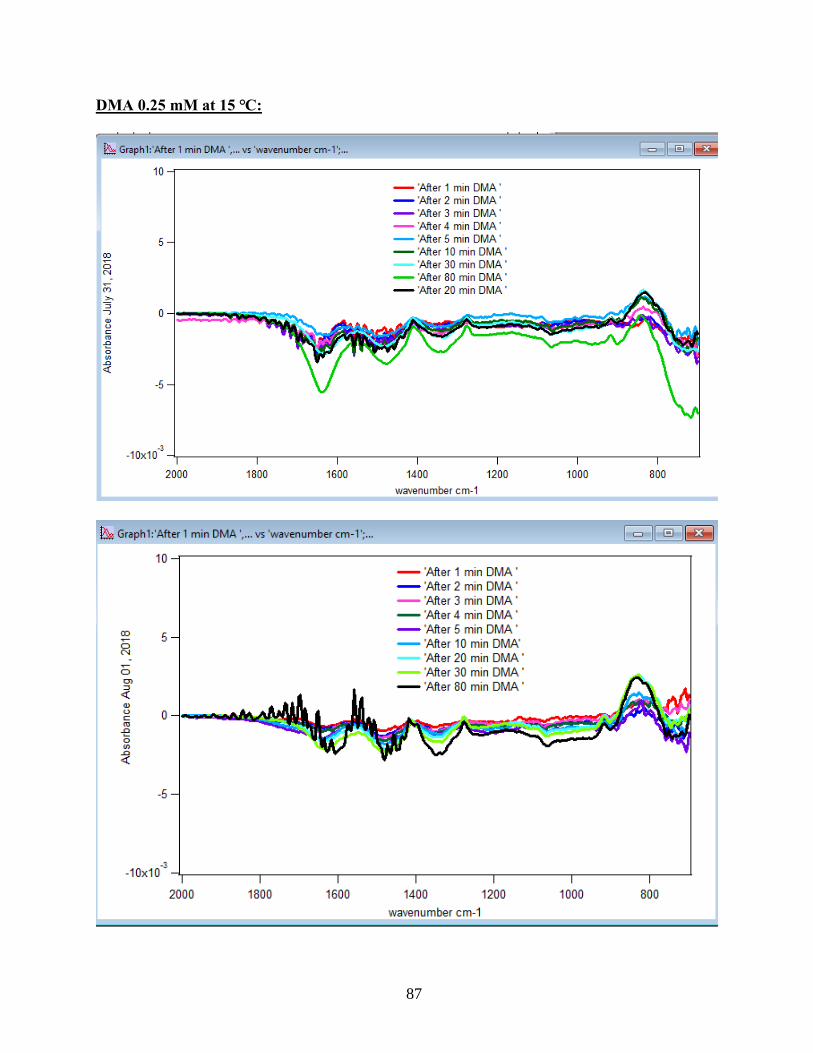
87
DMA 0.25 mM at 15 ℃:
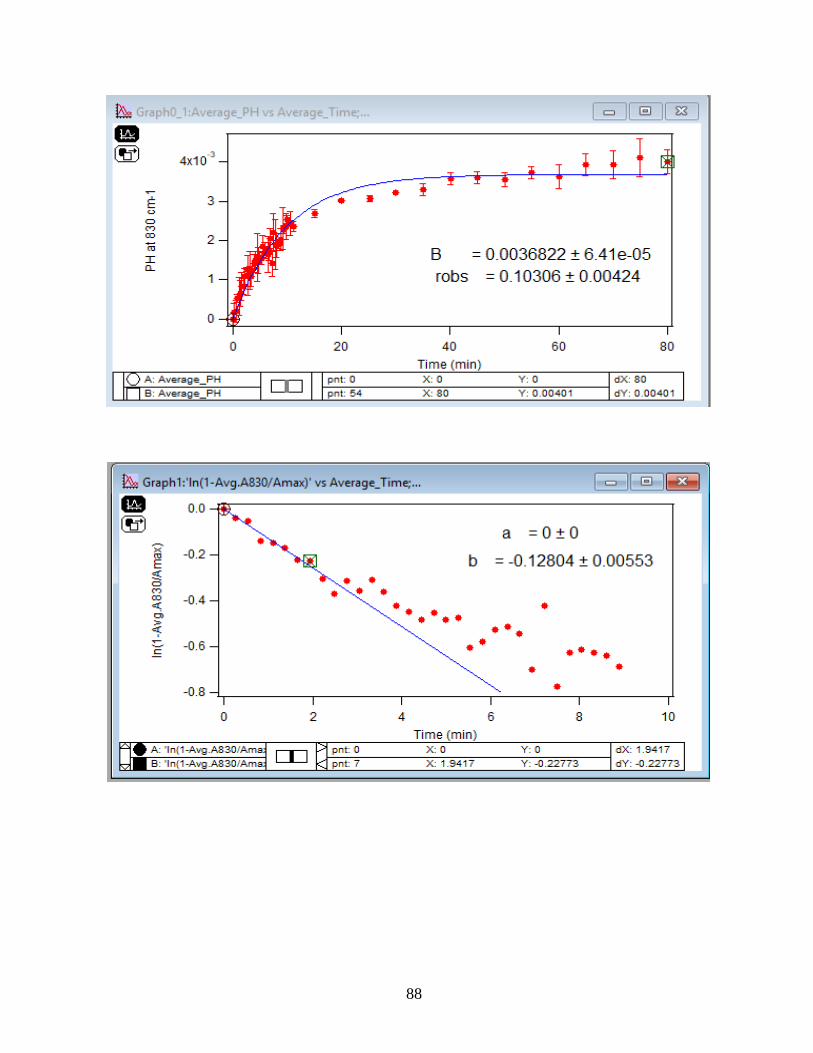
88
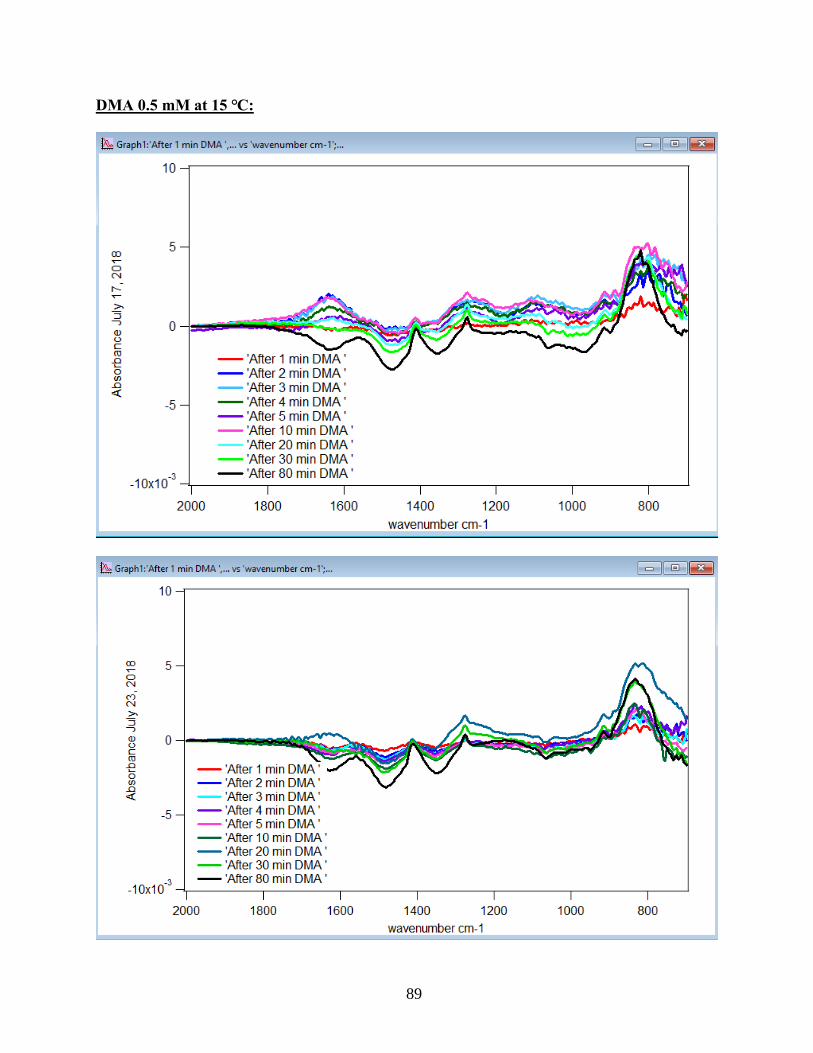
89
DMA 0.5 mM at 15 ℃:
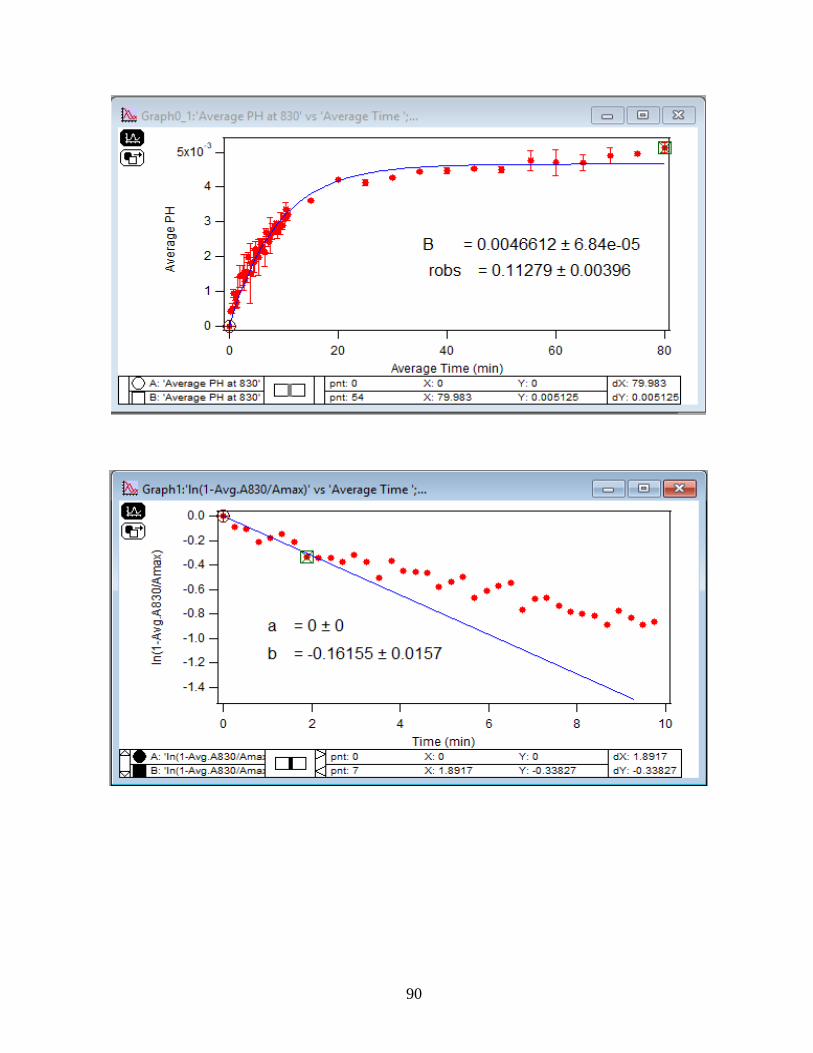
90
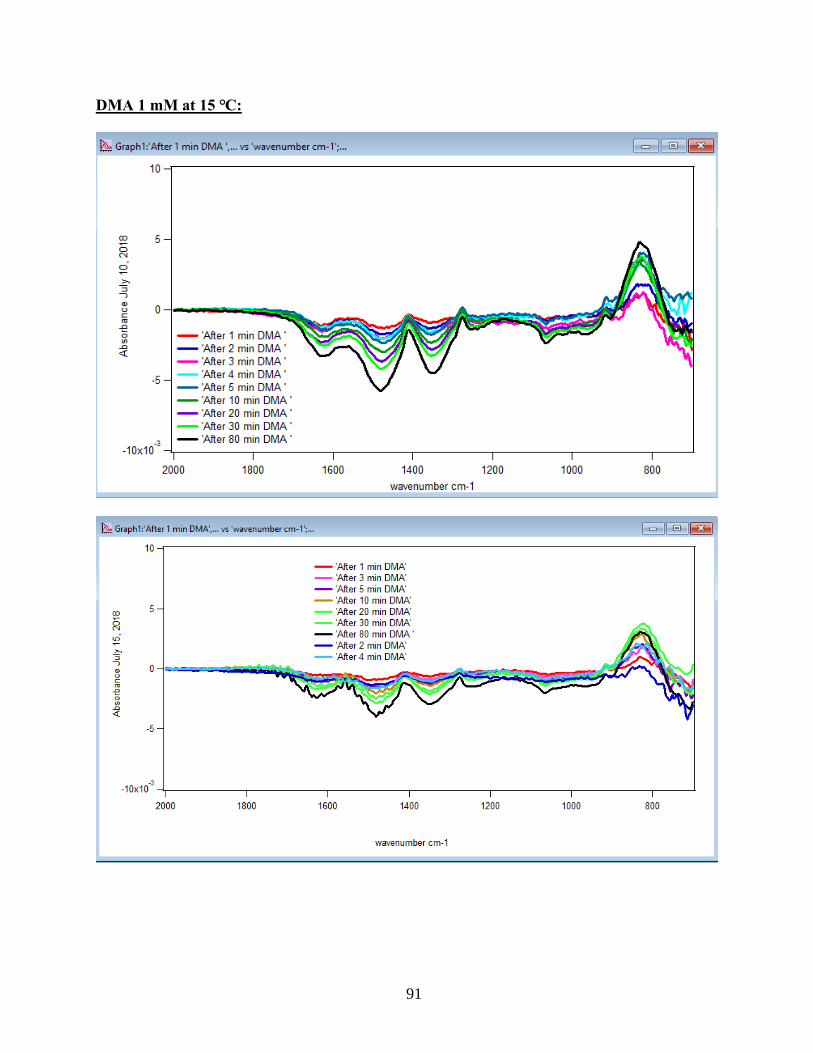
91
DMA 1 mM at 15 ℃:
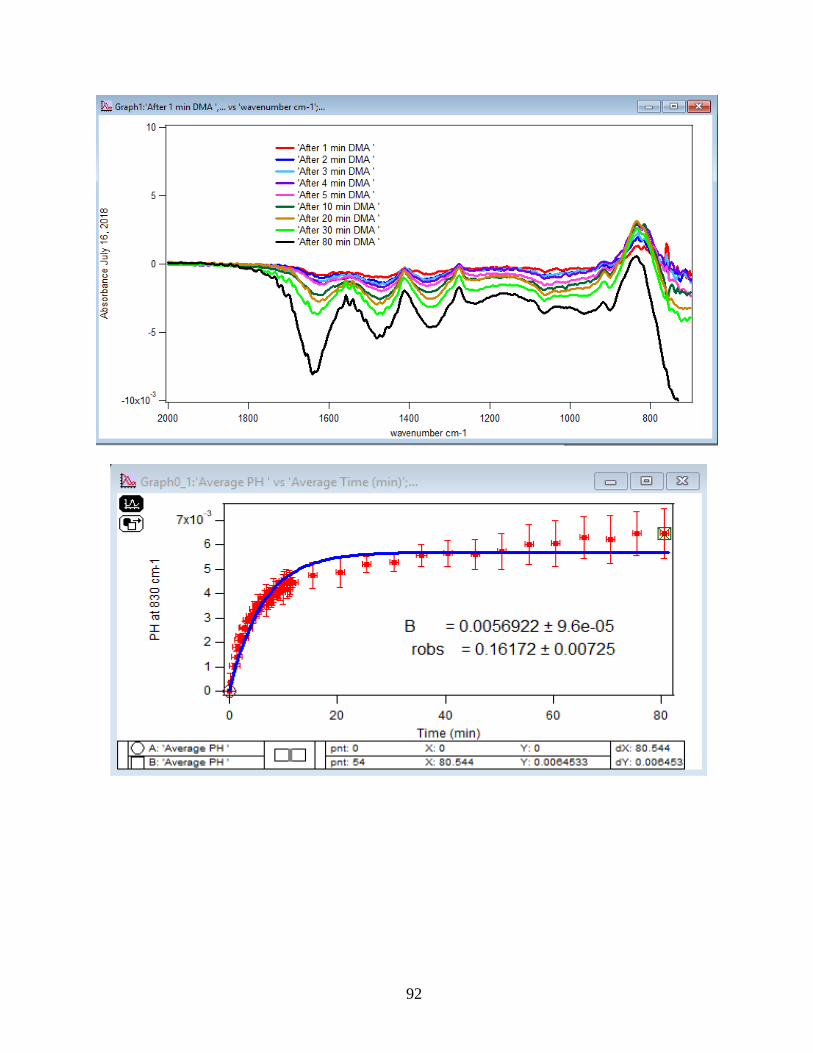
92
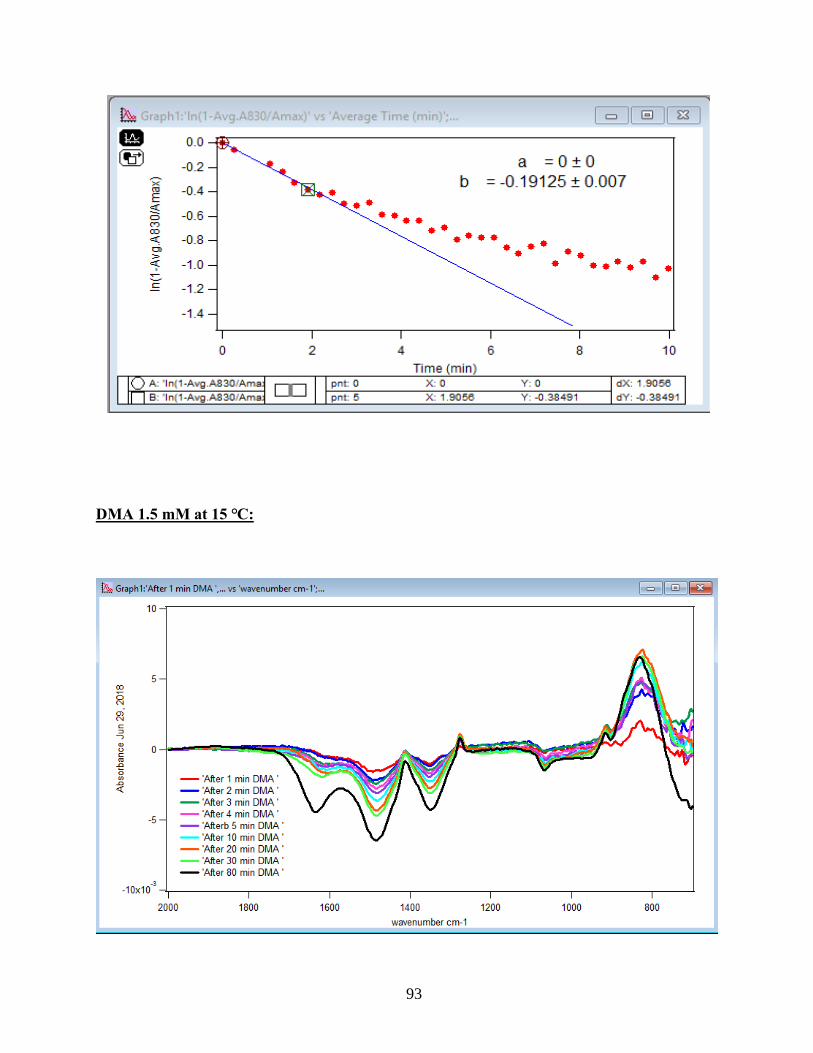
93
DMA 1.5 mM at 15 ℃:
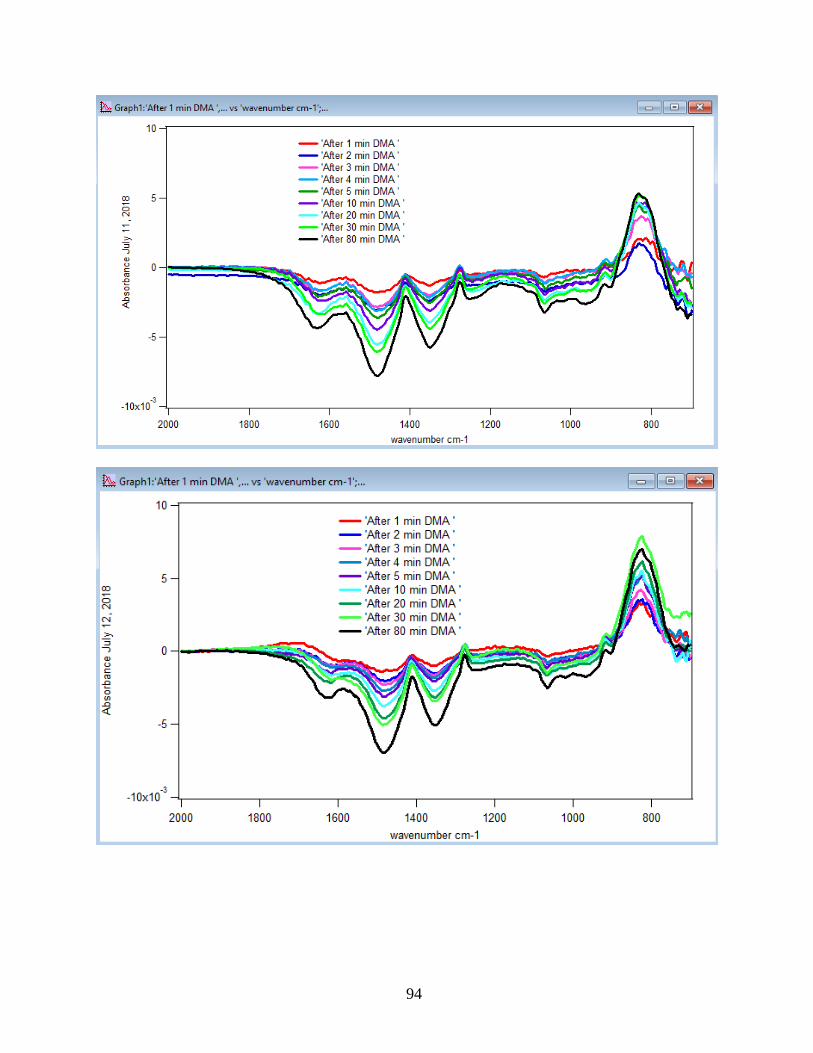
94
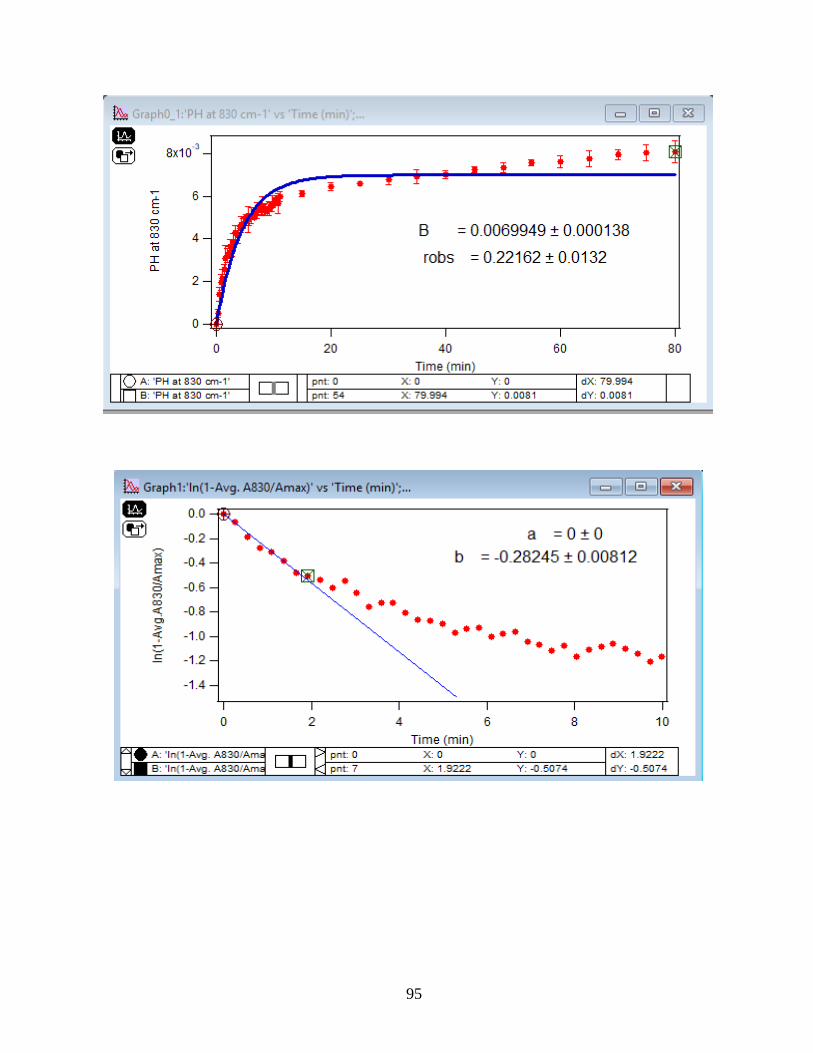
95
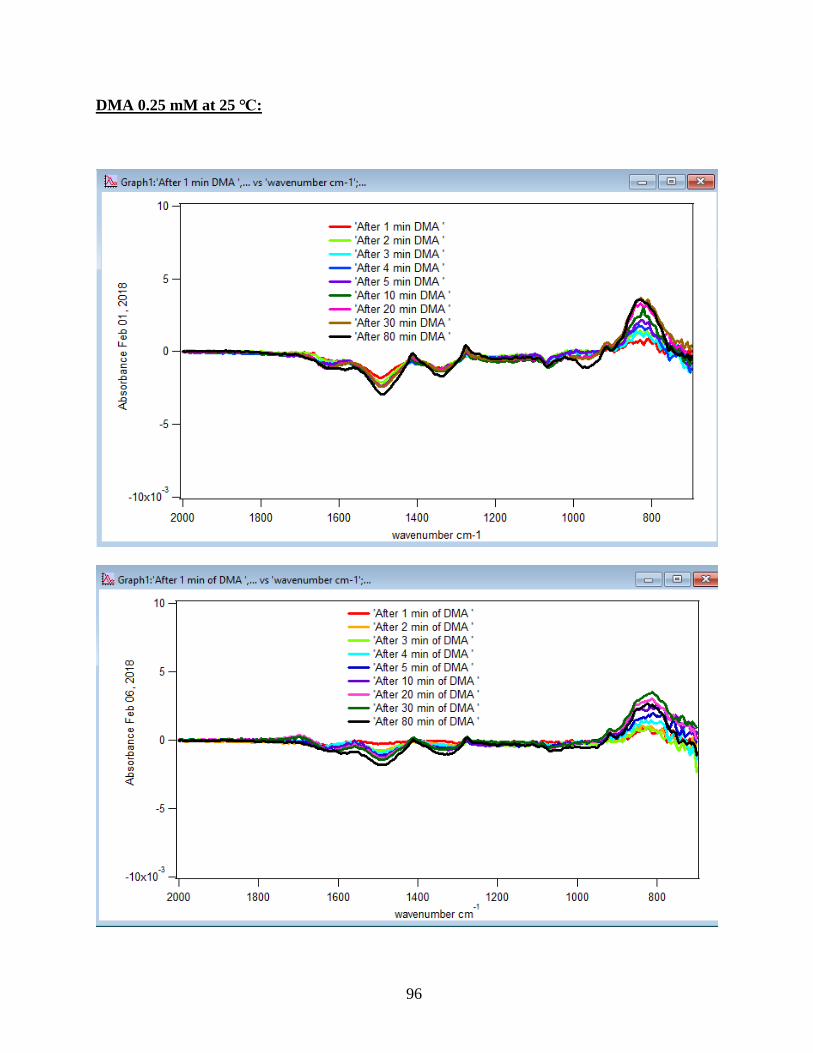
96
DMA 0.25 mM at 25 ℃:
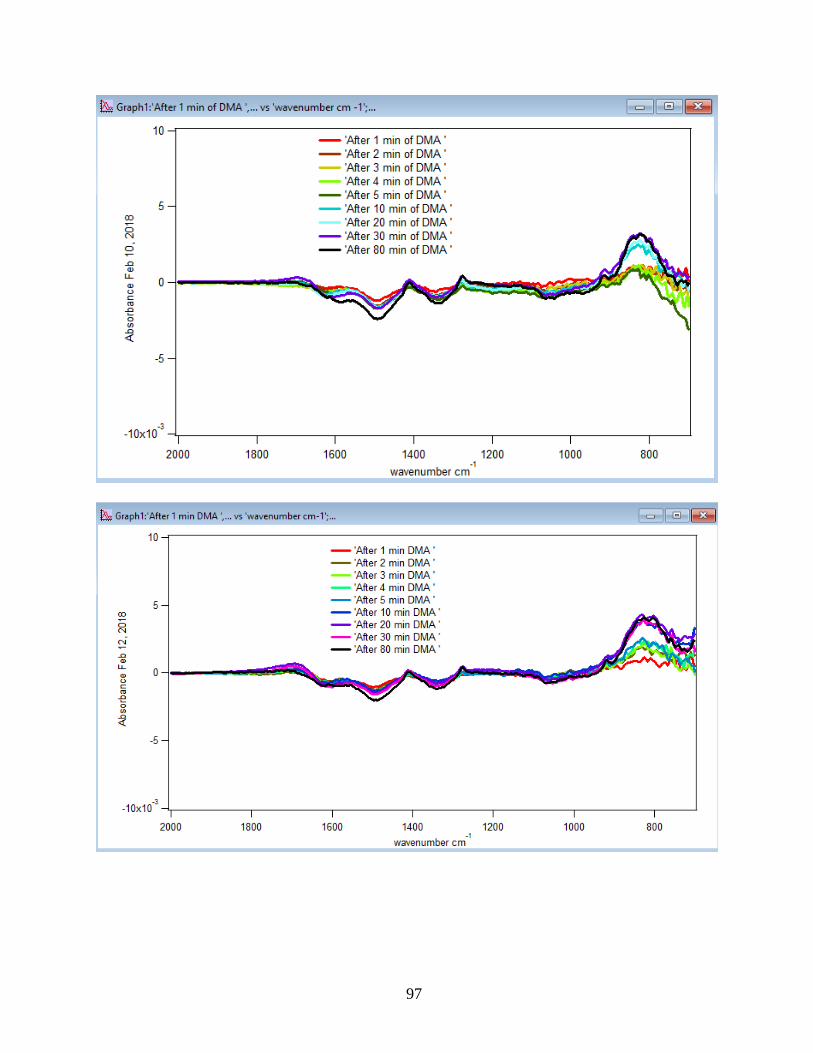
97
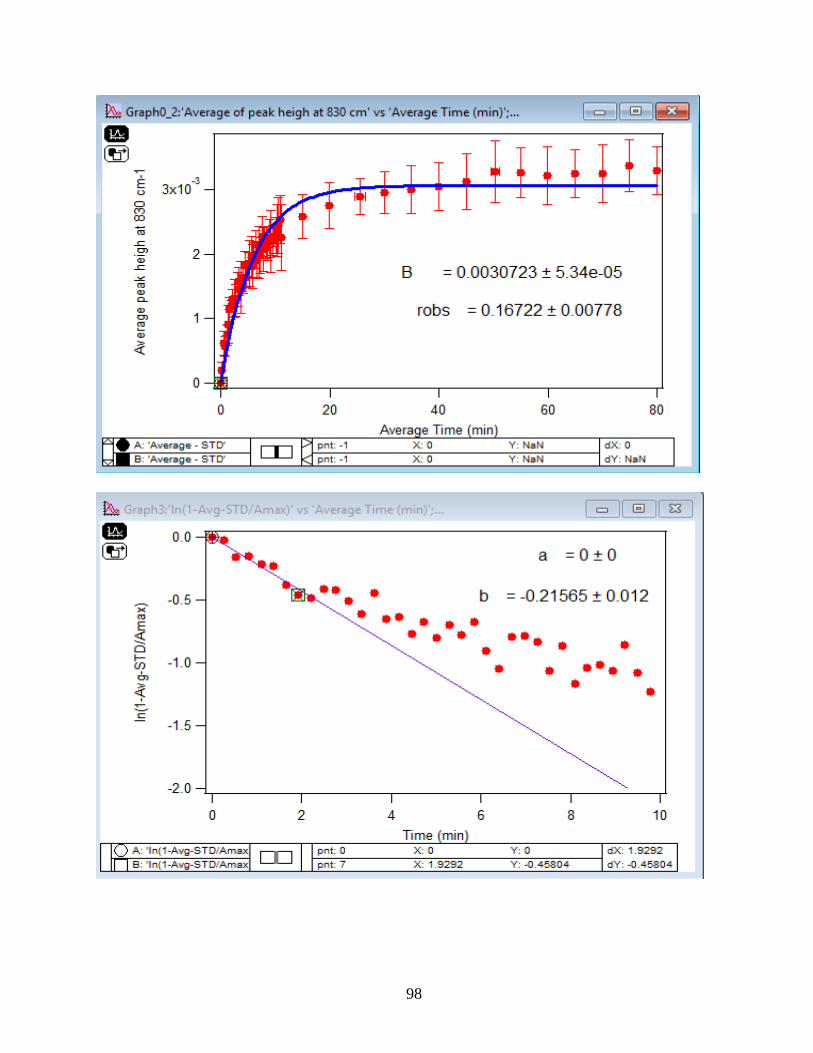
98
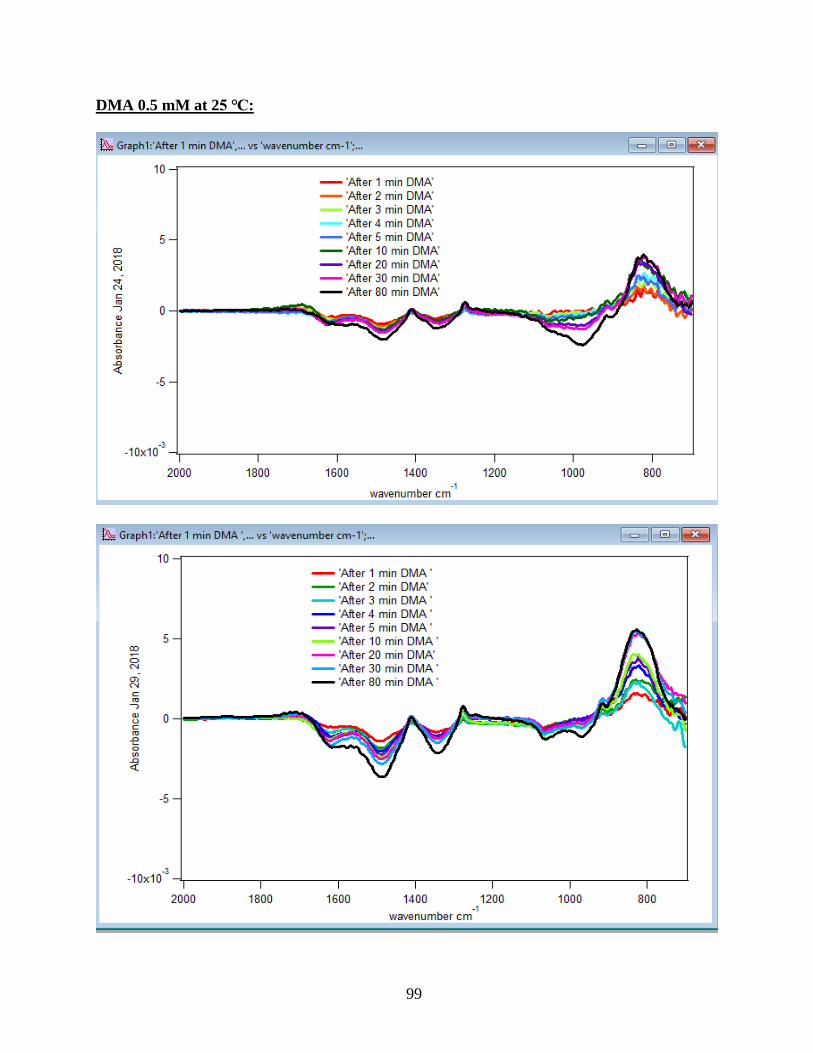
99
DMA 0.5 mM at 25 ℃:
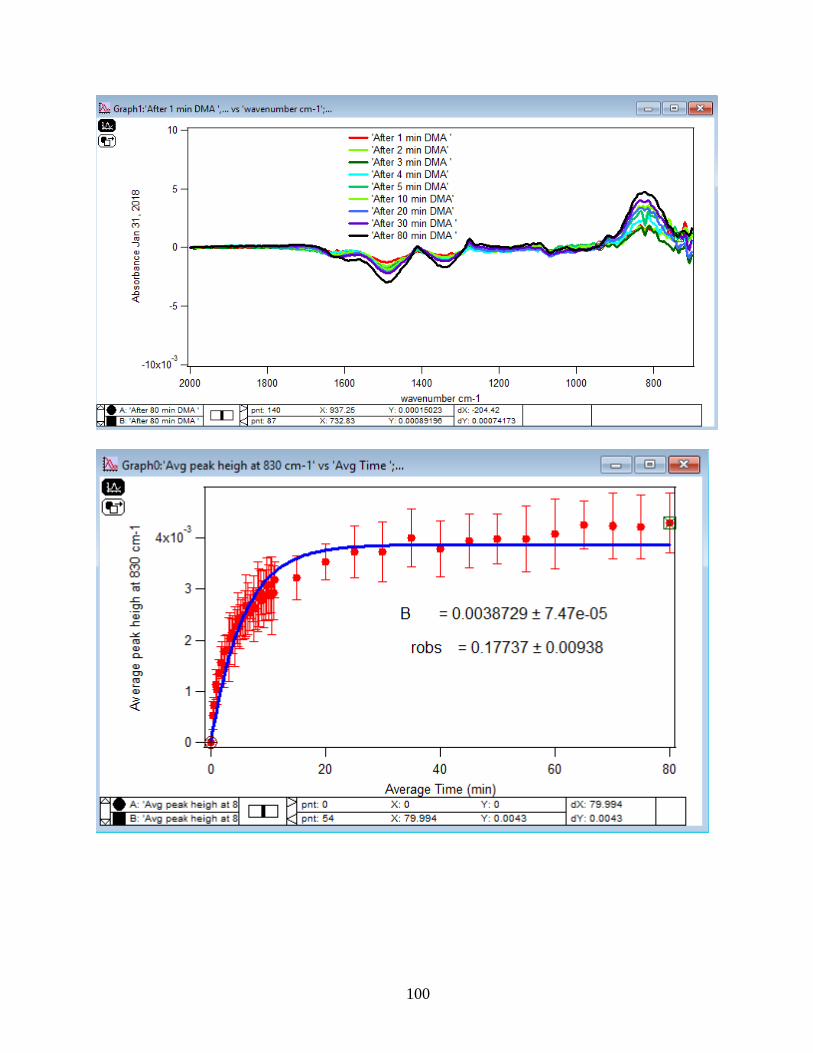
100
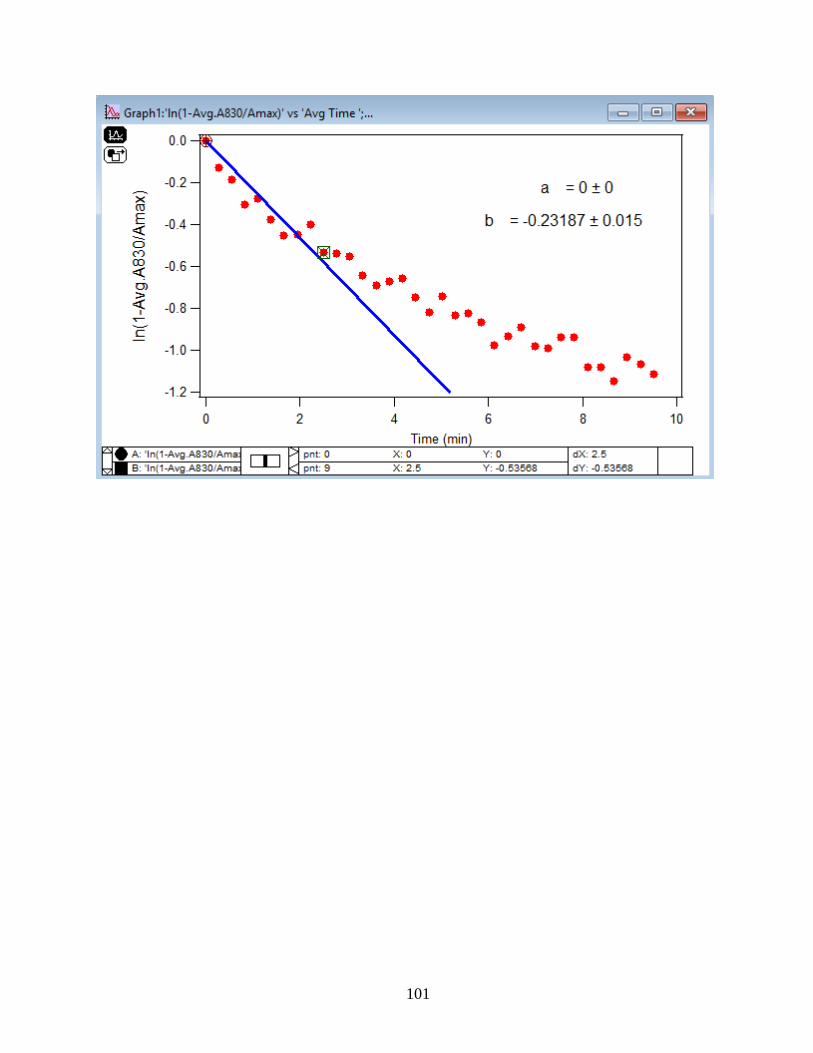
101
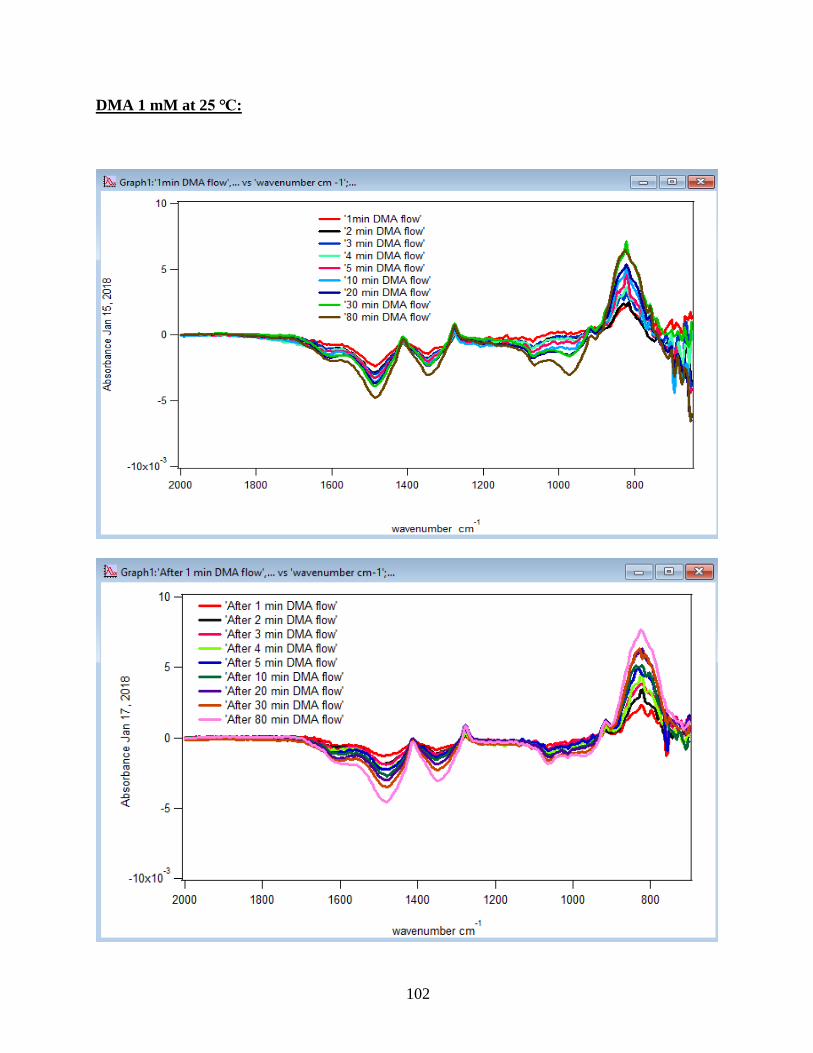
102
DMA 1 mM at 25 ℃:
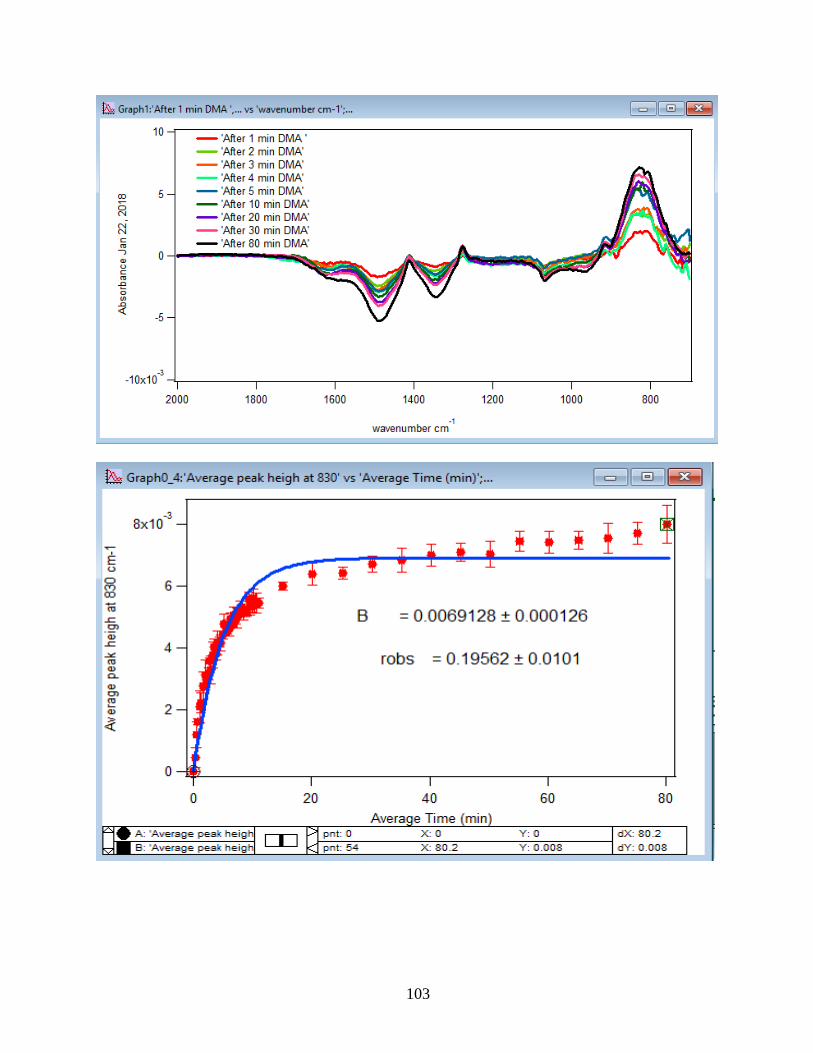
103
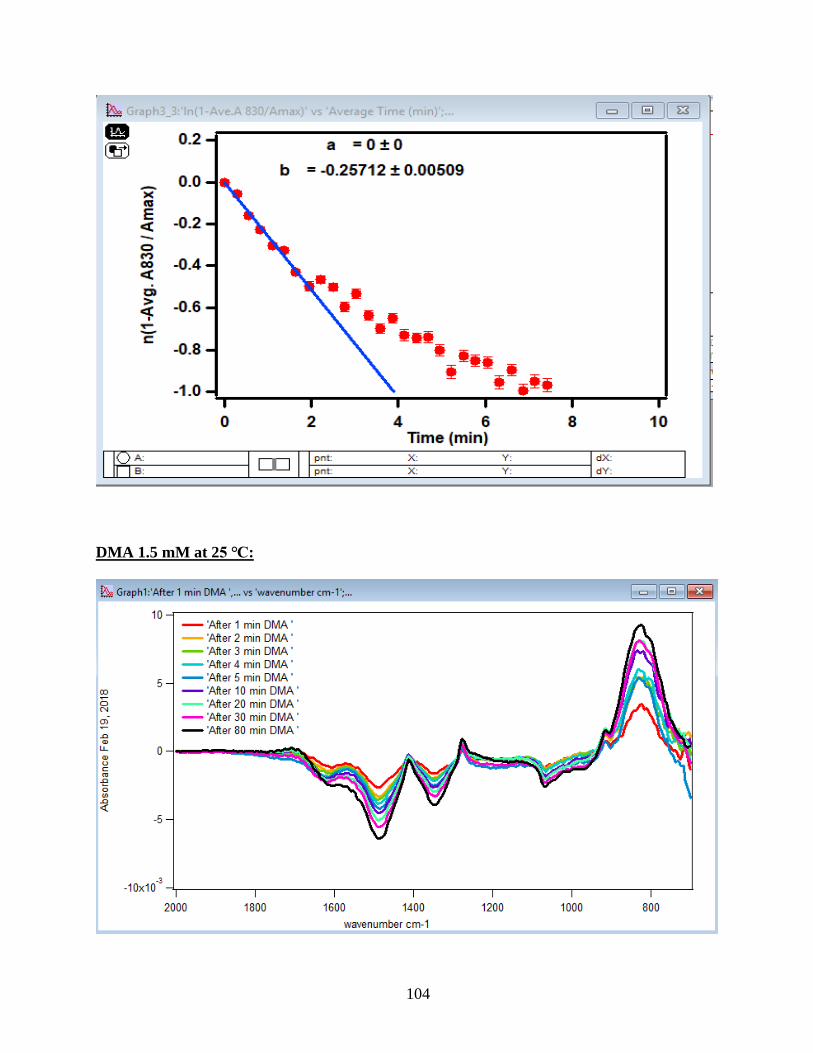
104
DMA 1.5 mM at 25 ℃:
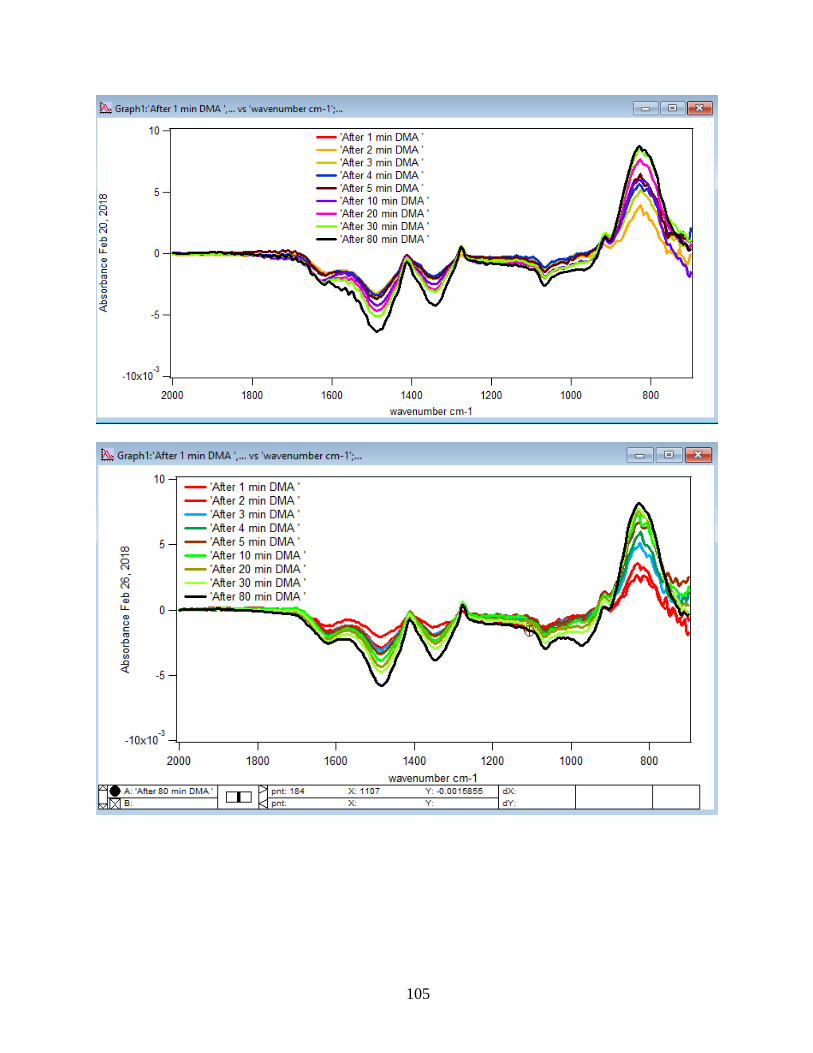
105
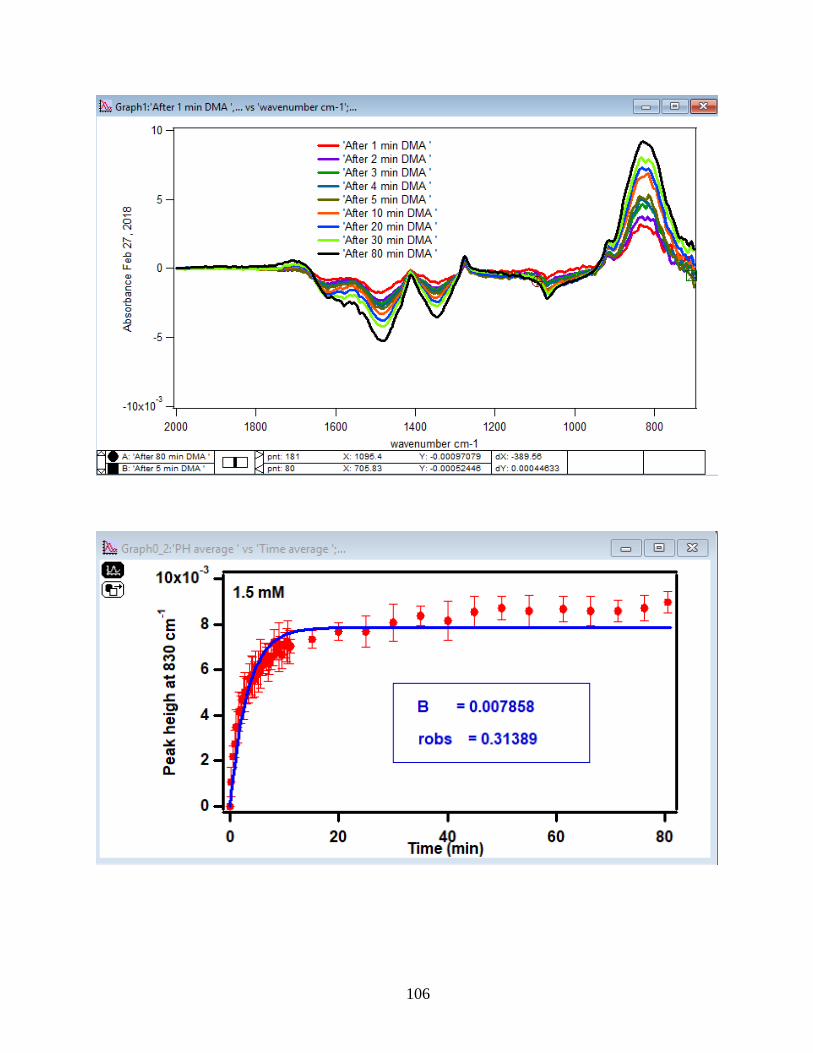
106
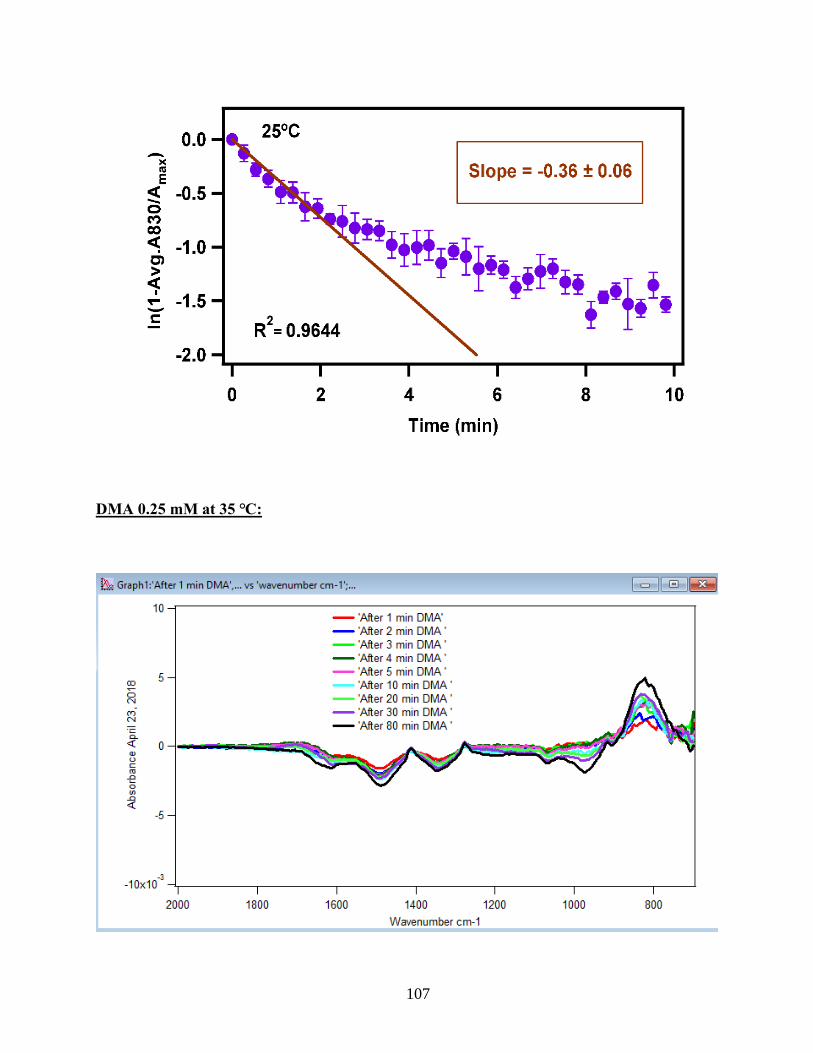
107
DMA 0.25 mM at 35 ℃:
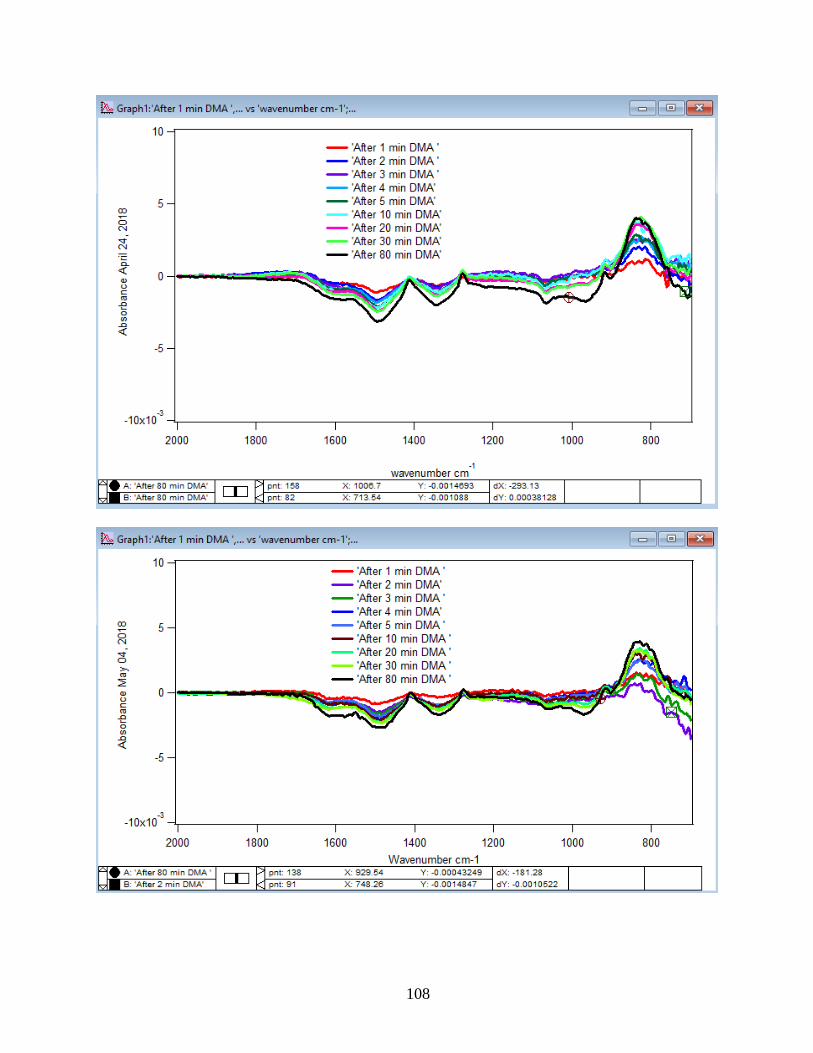
108
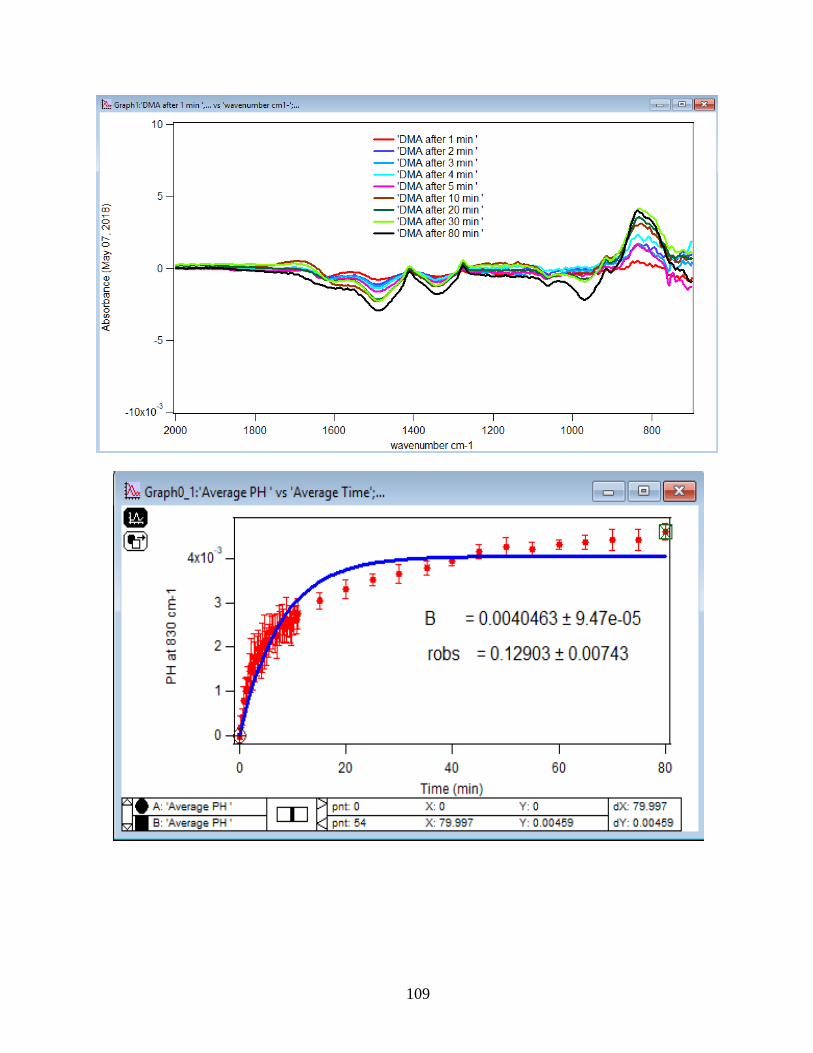
109
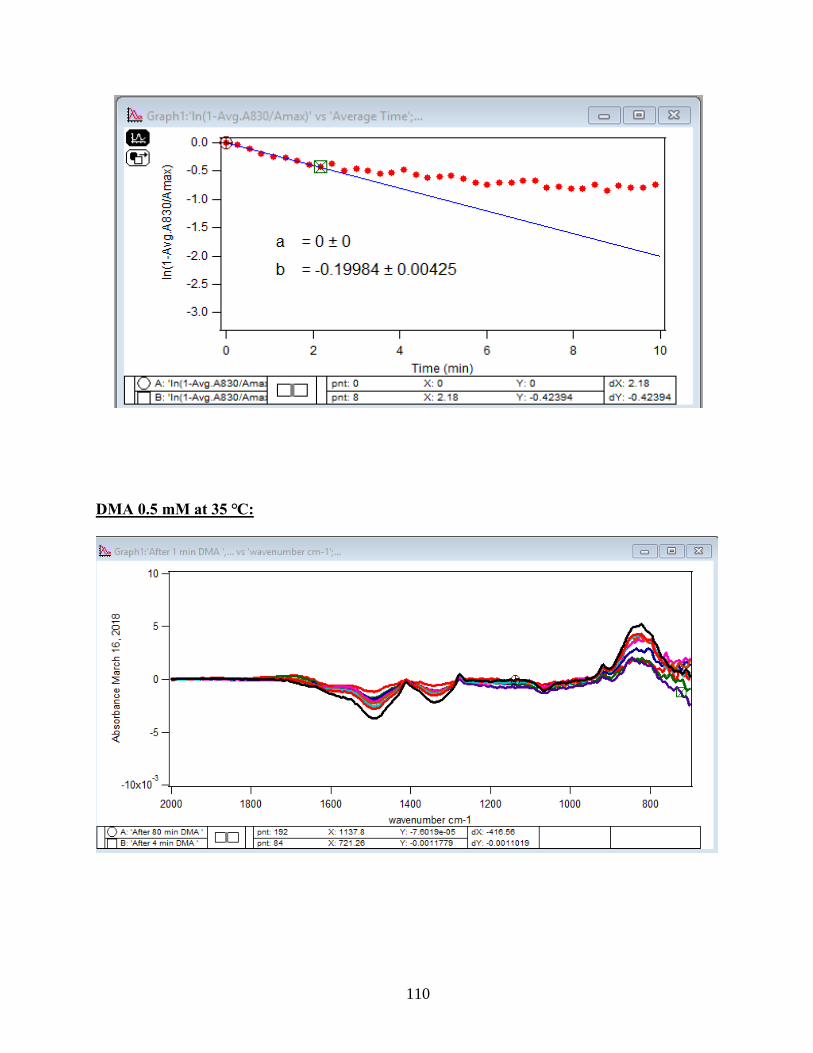
110
DMA 0.5 mM at 35 ℃:
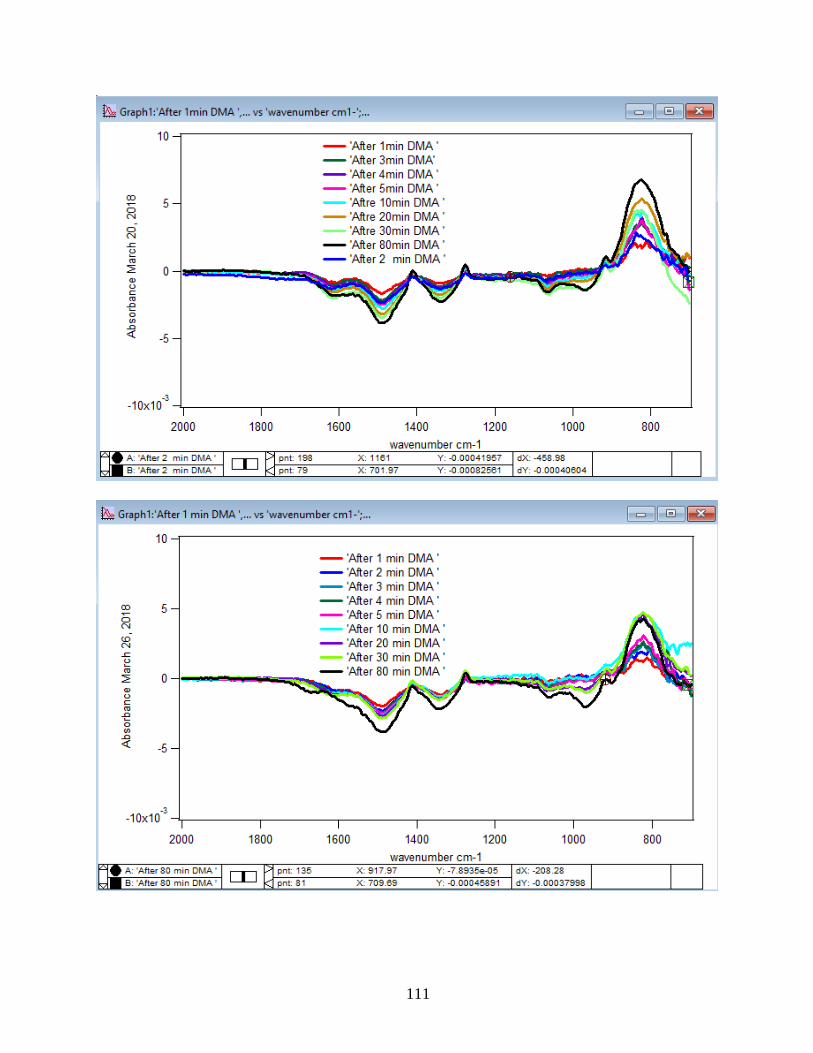
111
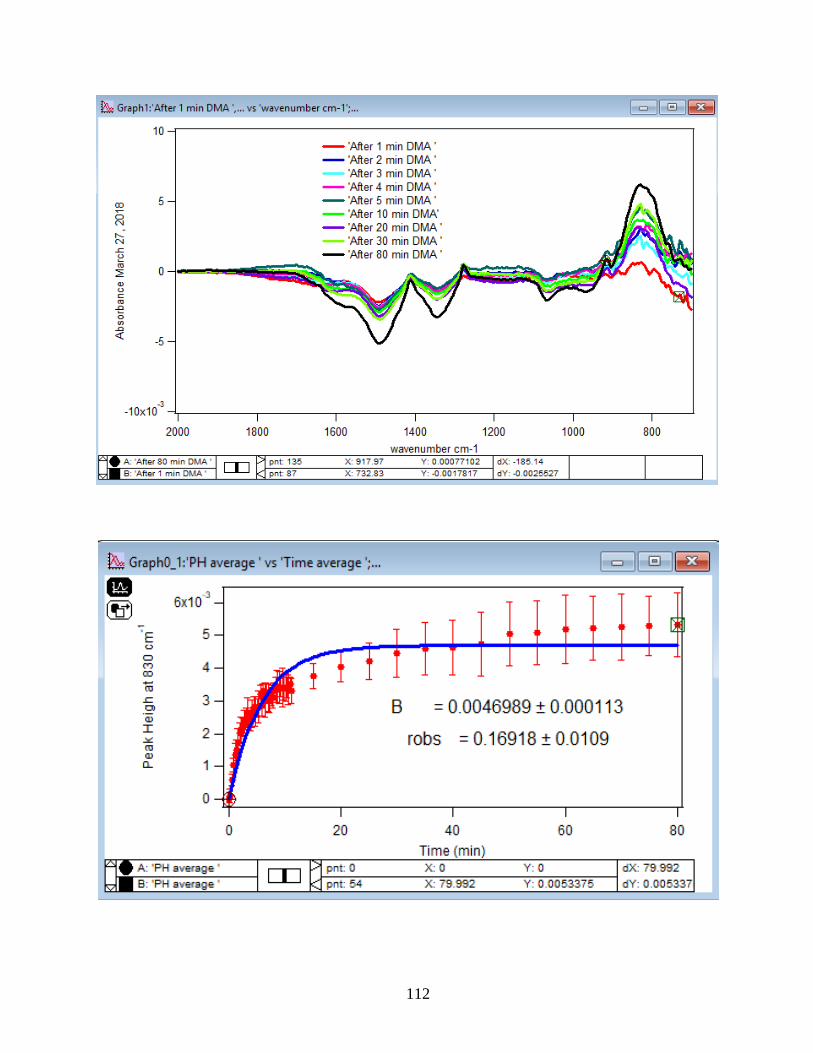
112
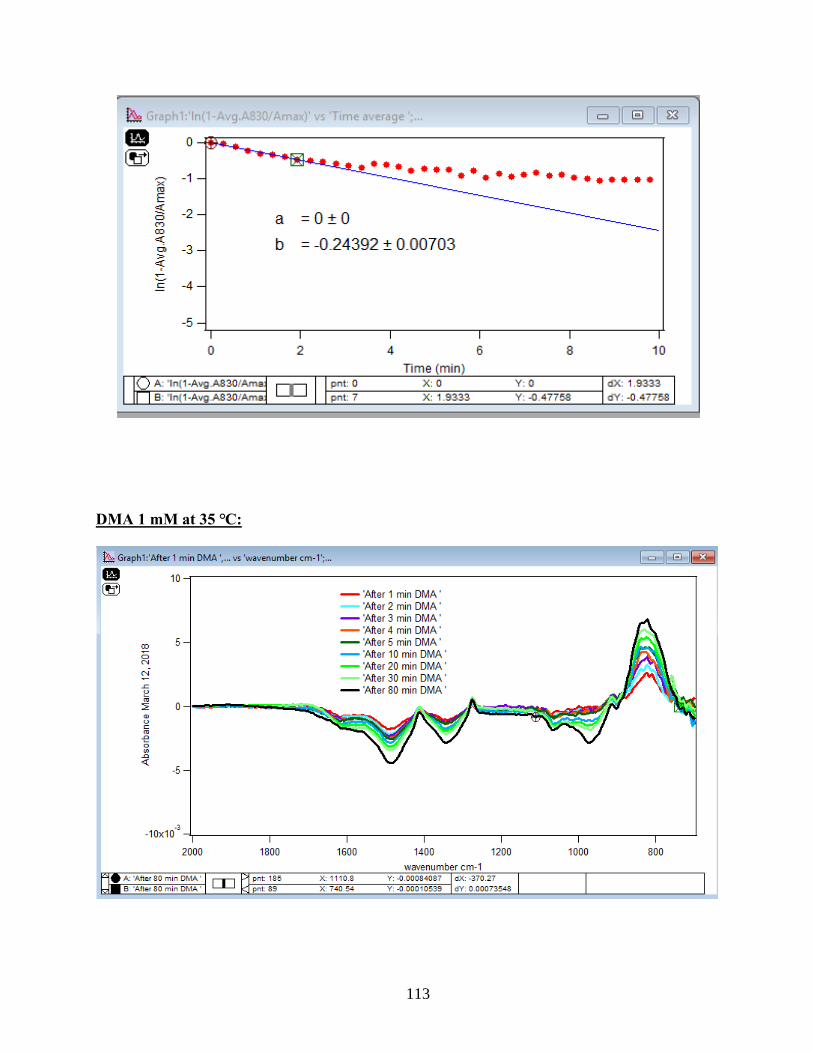
113
DMA 1 mM at 35 ℃:
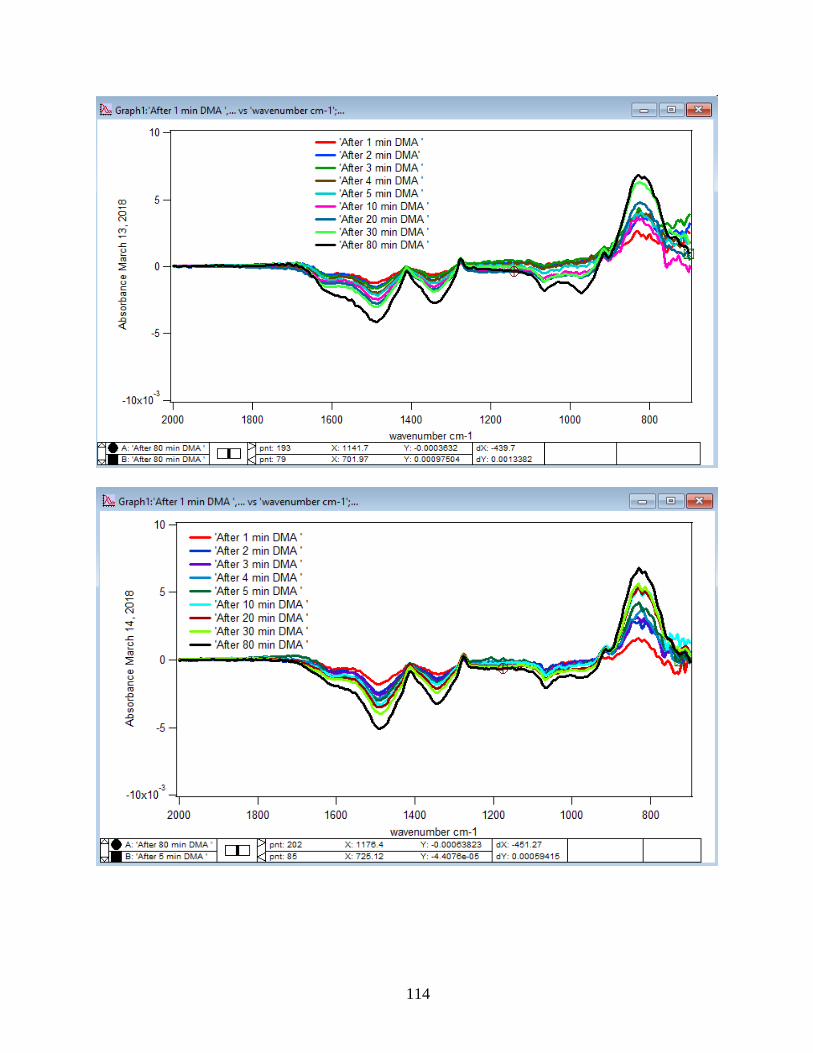
114
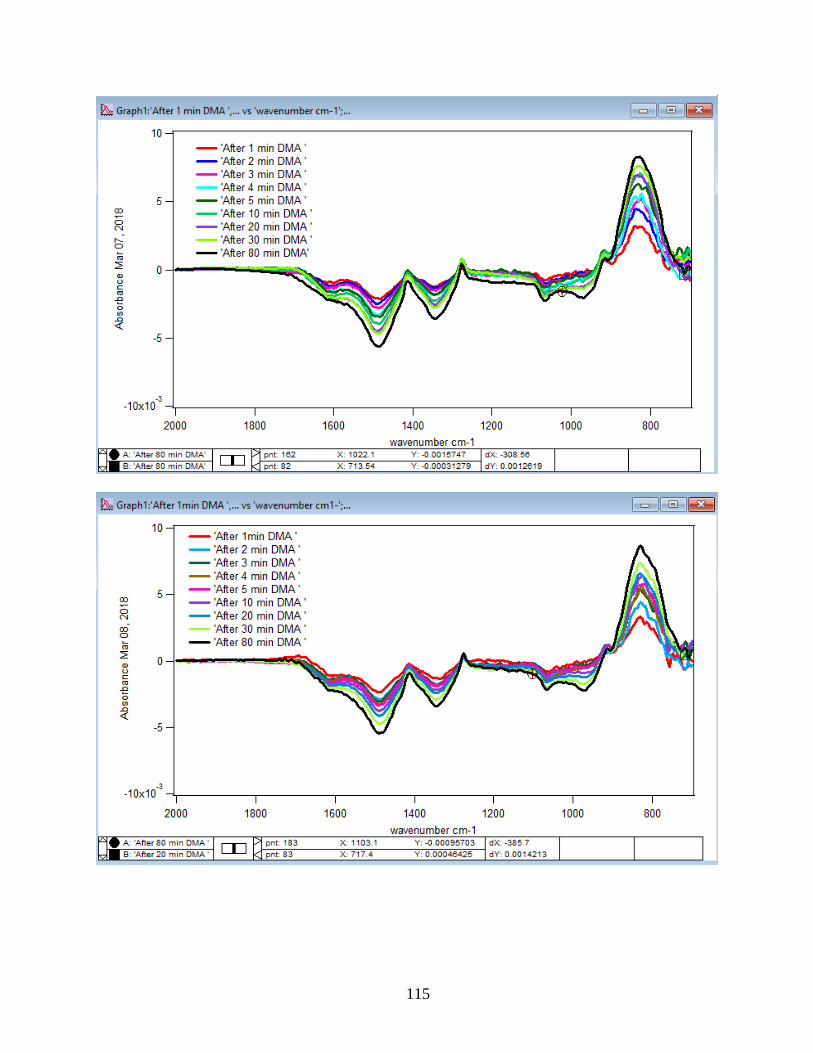
115
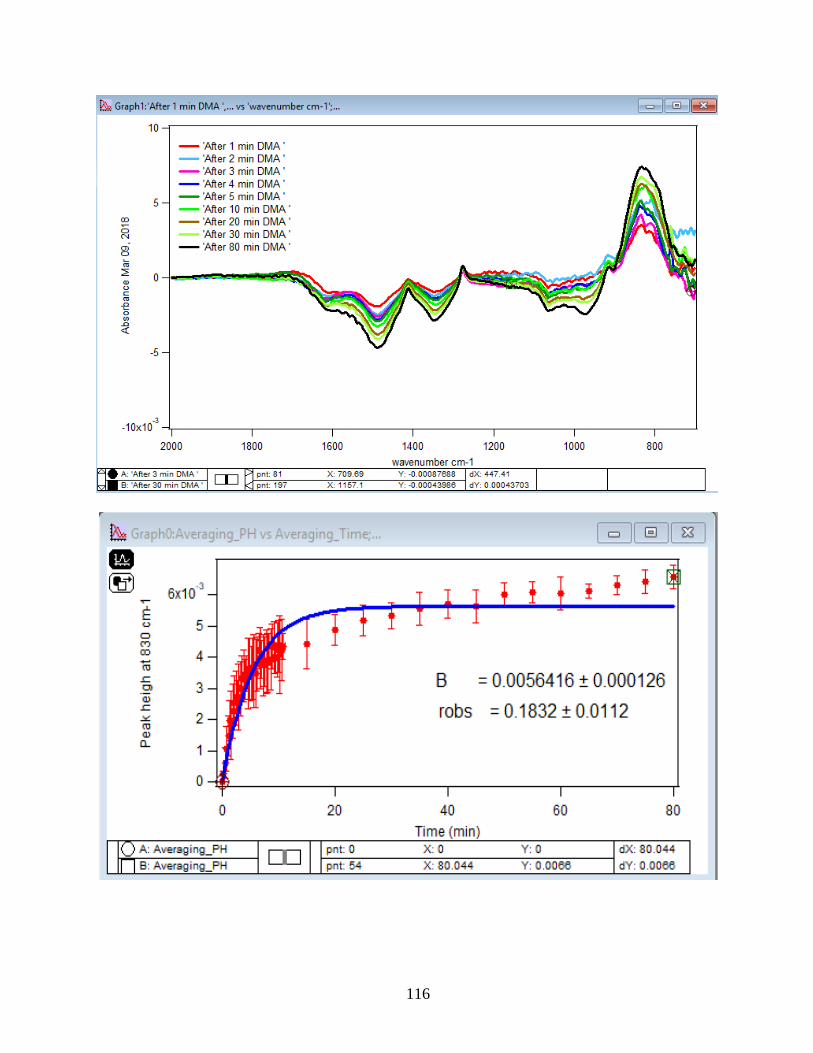
116
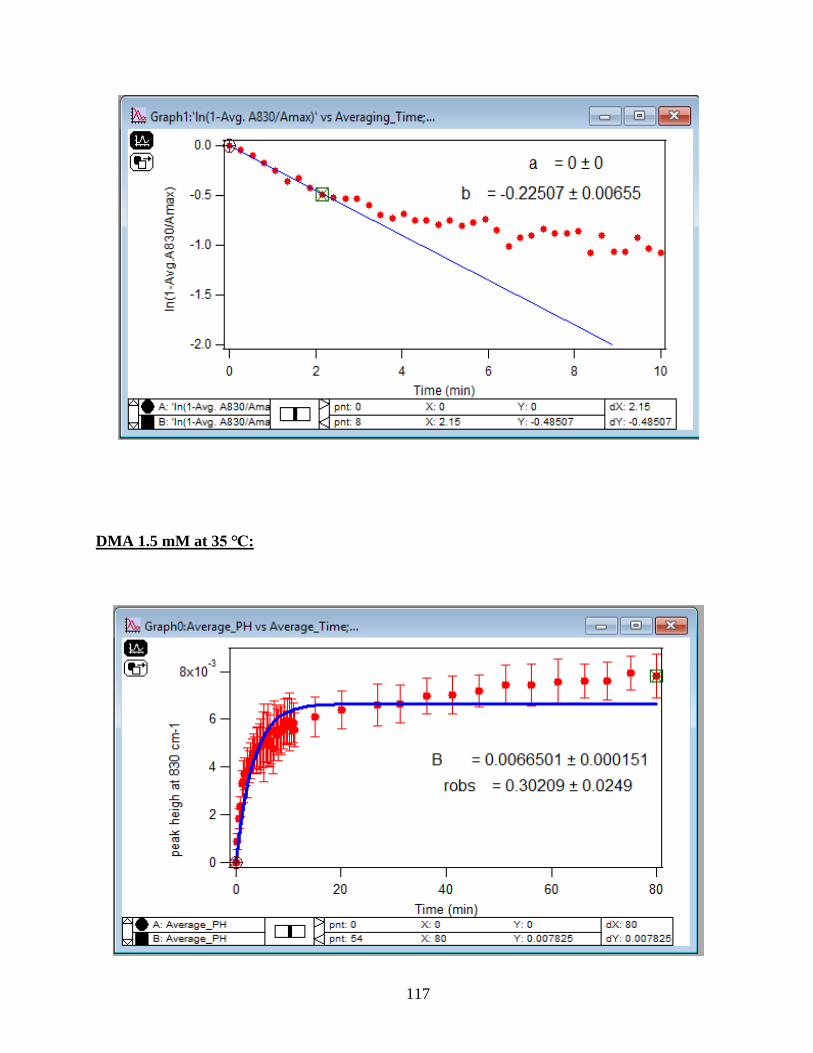
117
DMA 1.5 mM at 35 ℃:
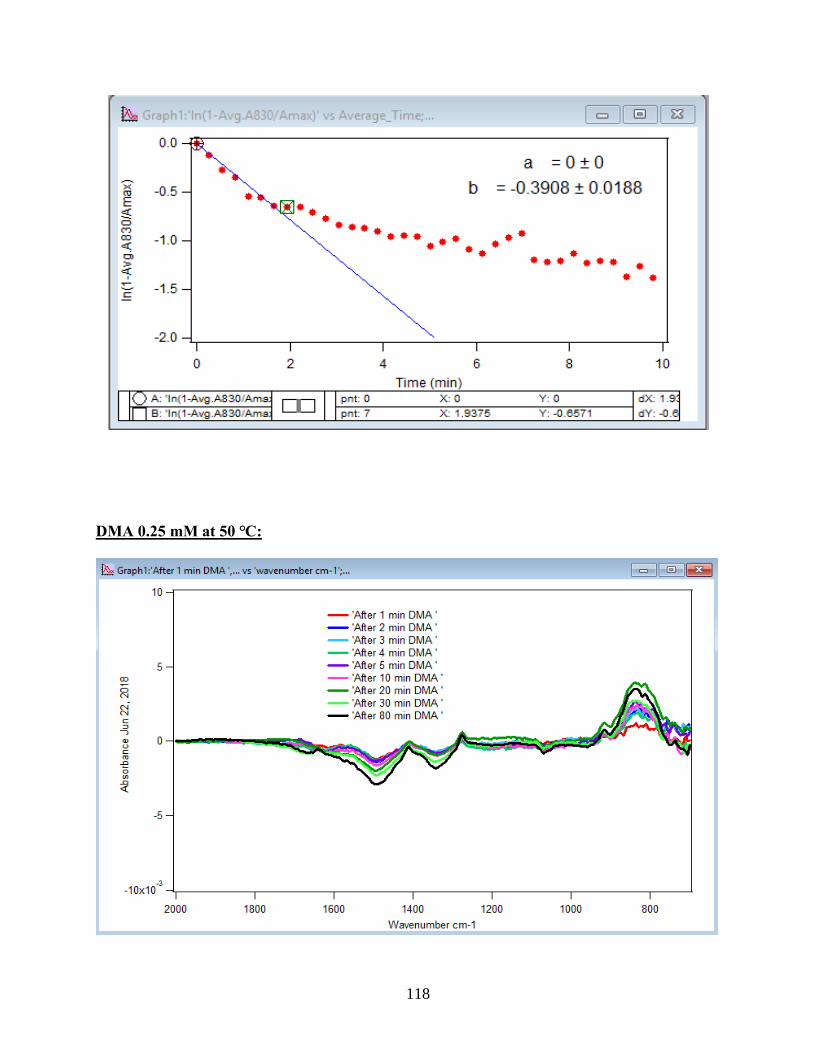
118
DMA 0.25 mM at 50 ℃:
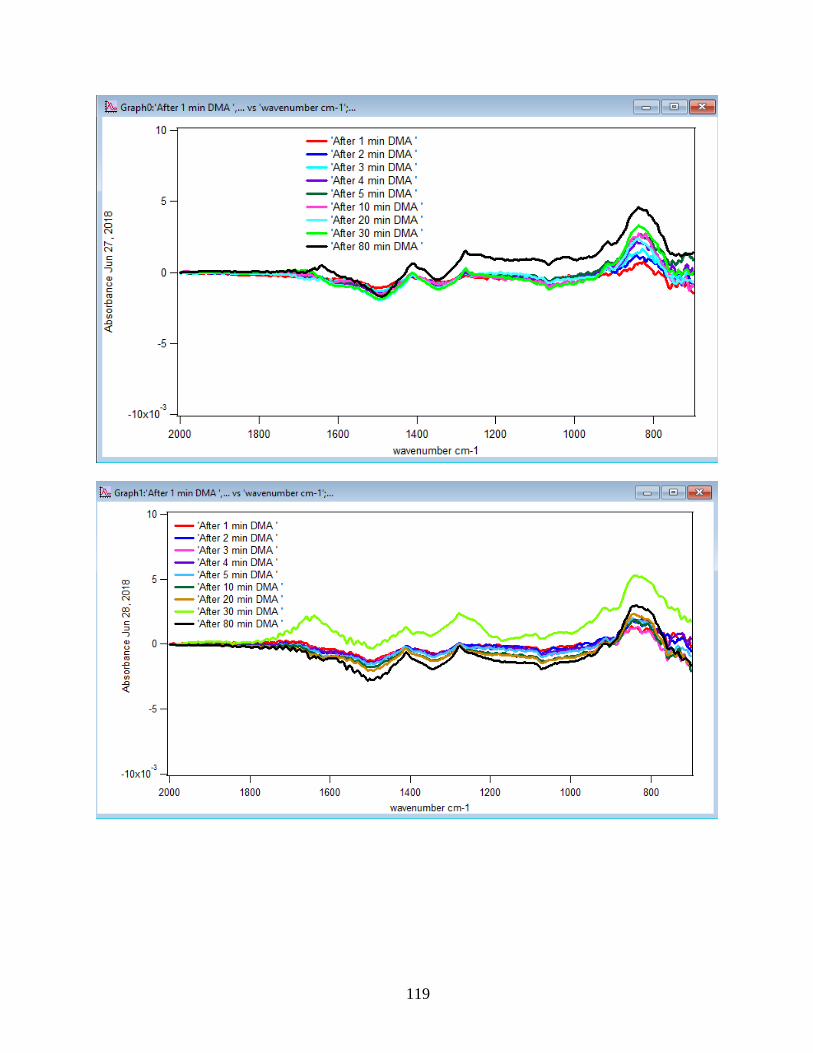
119
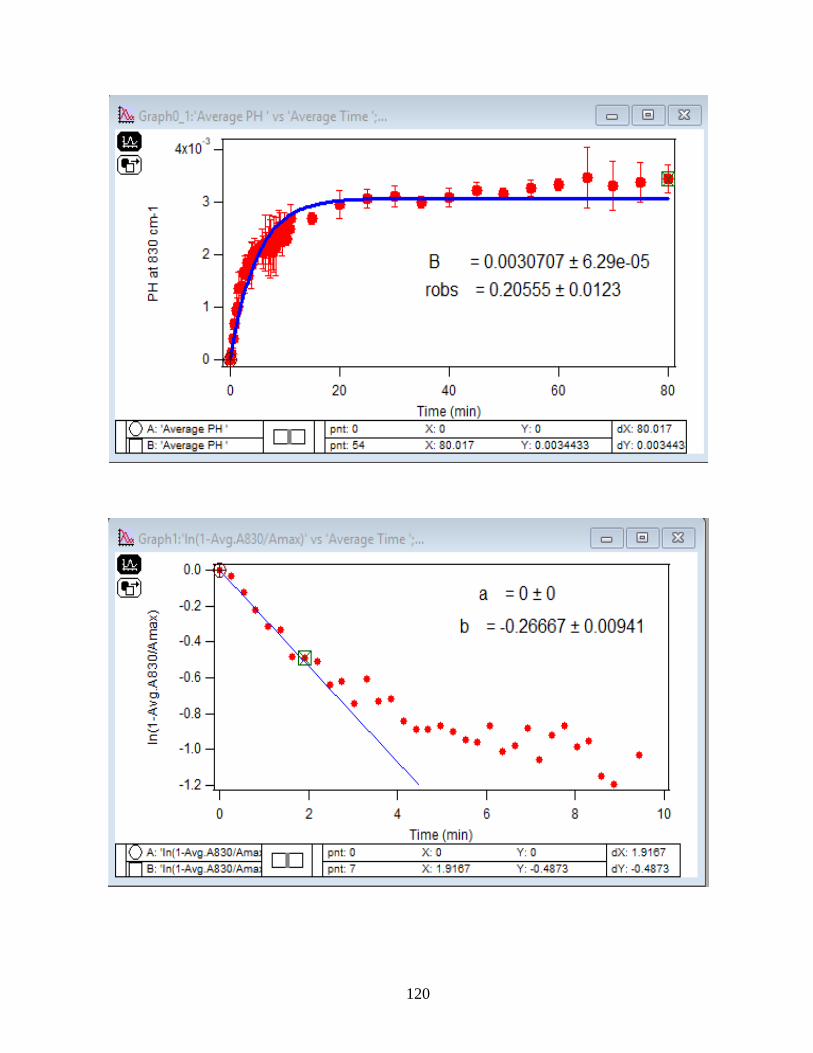
120
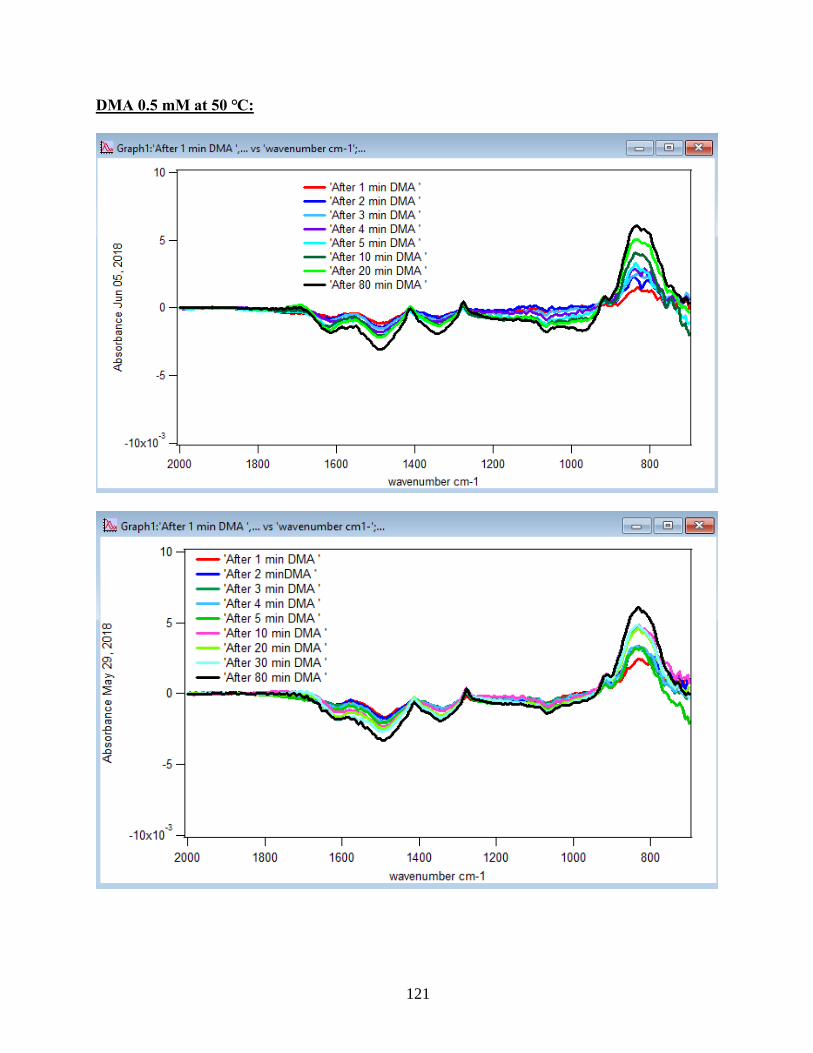
121
DMA 0.5 mM at 50 ℃:
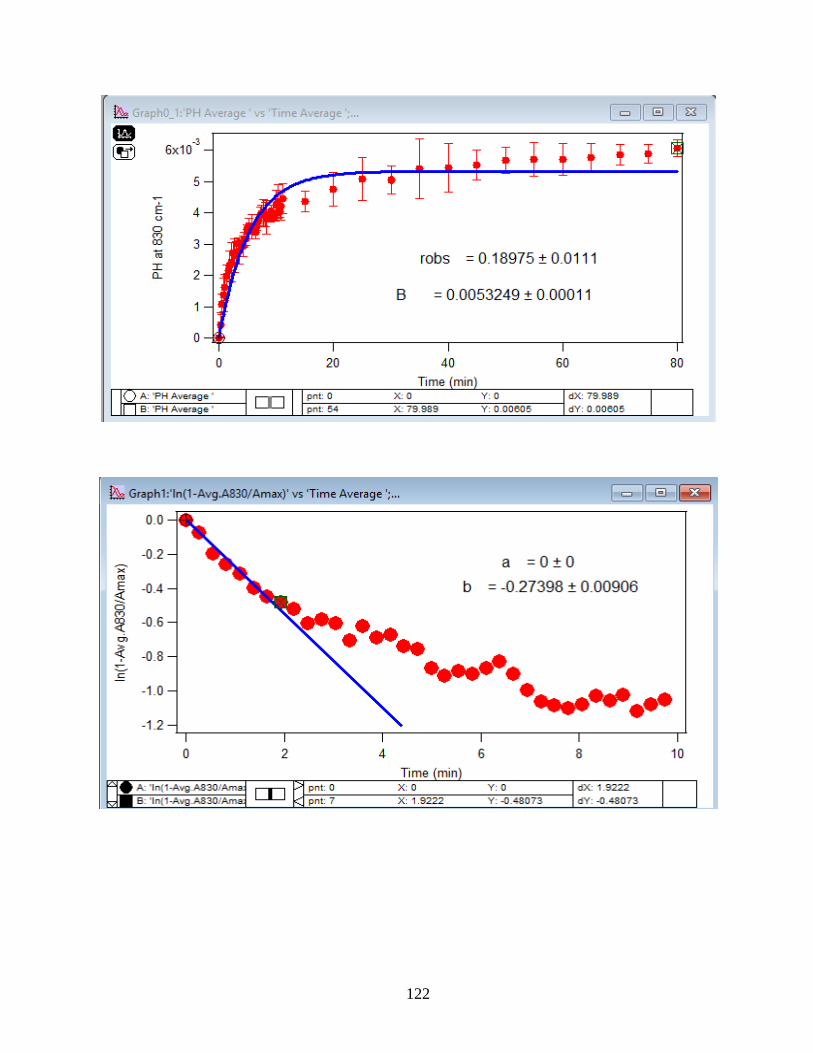
122
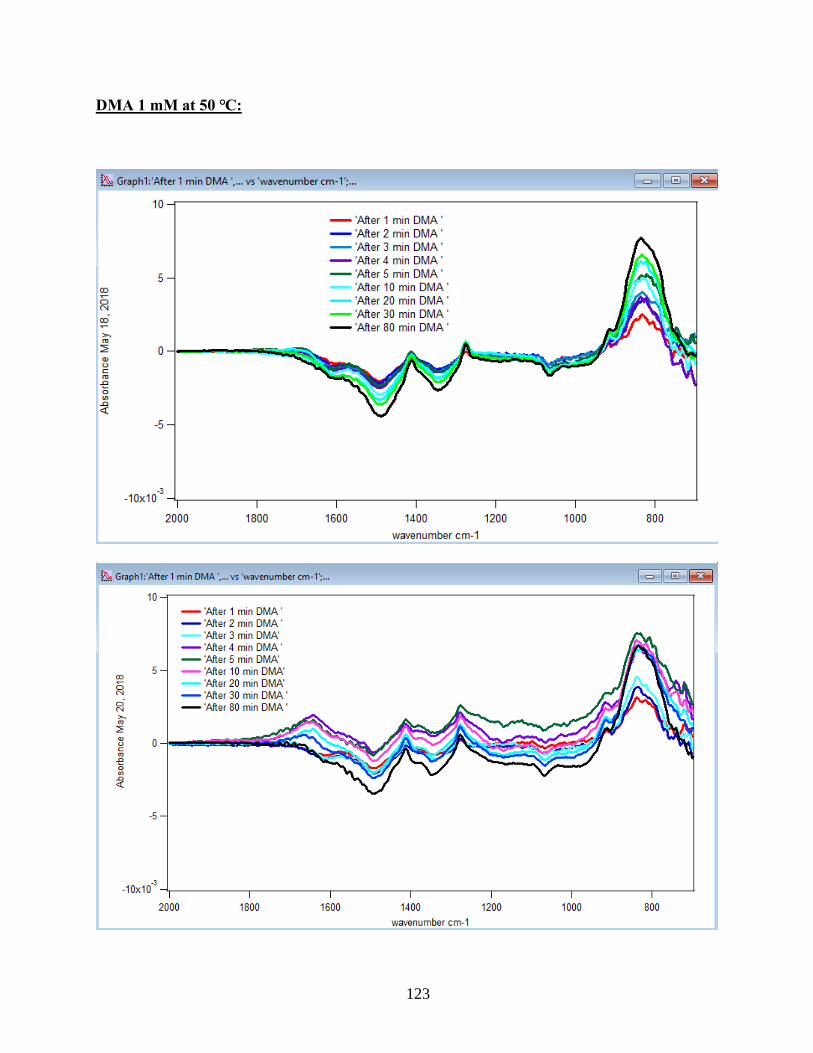
123
DMA 1 mM at 50 ℃:
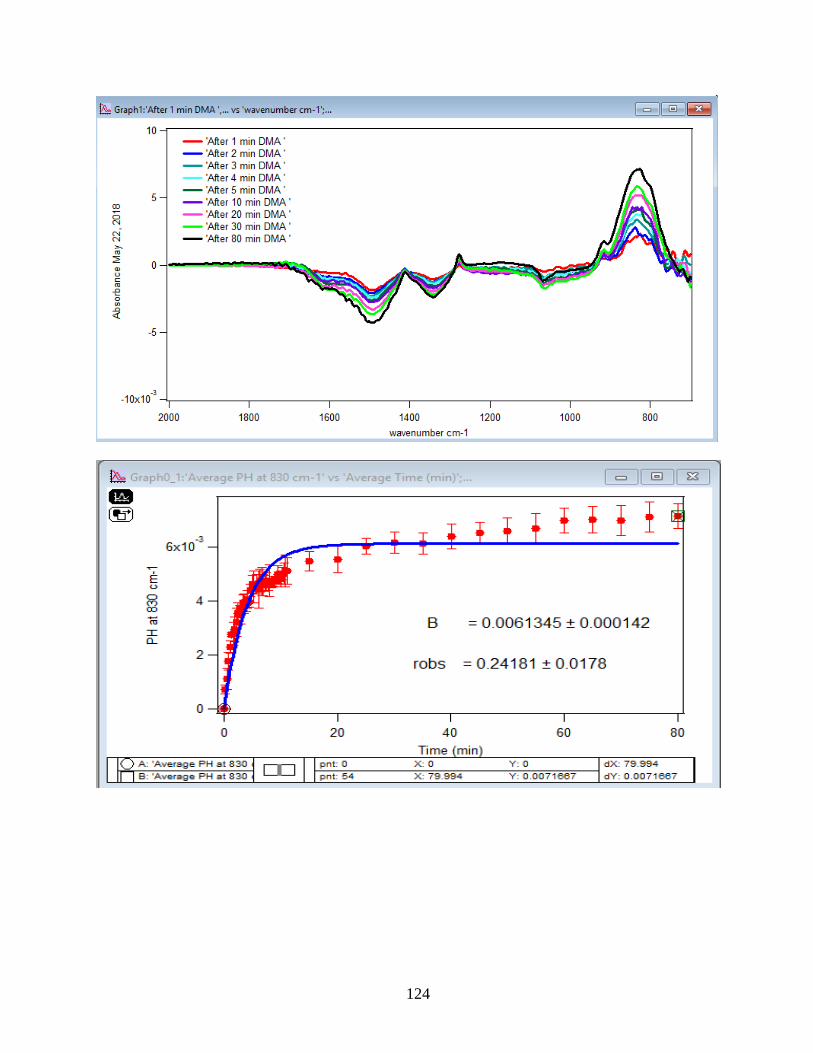
124
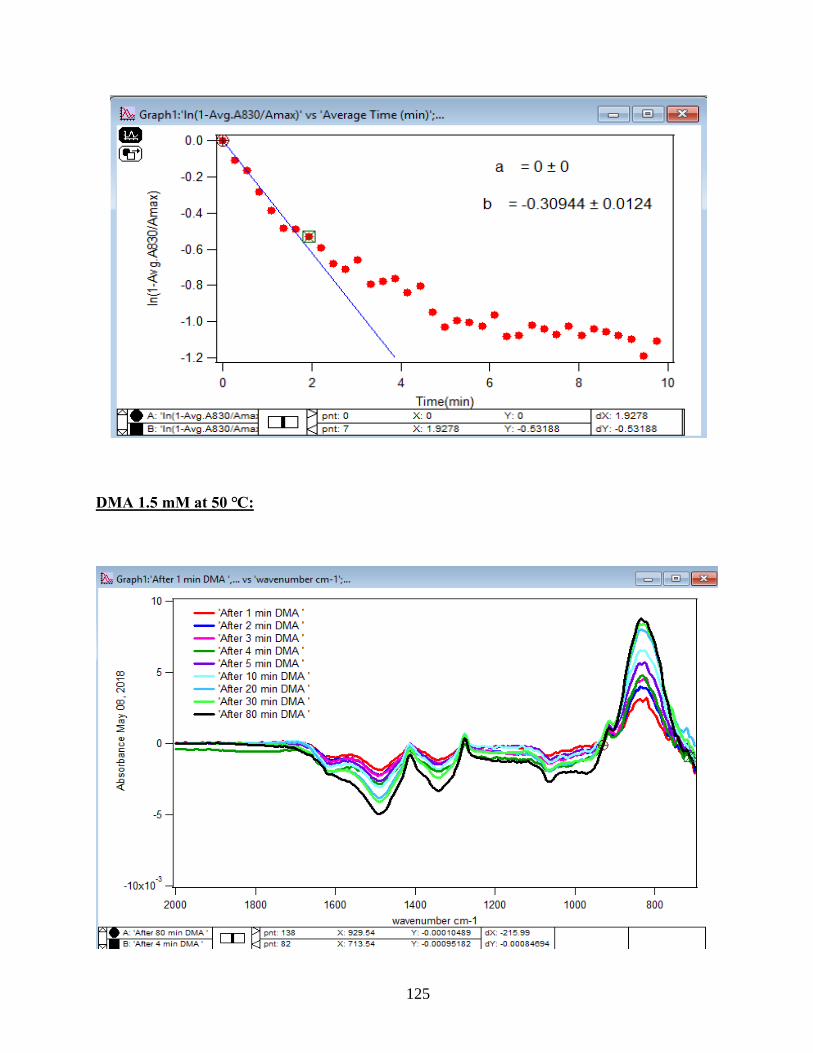
125
DMA 1.5 mM at 50 ℃:
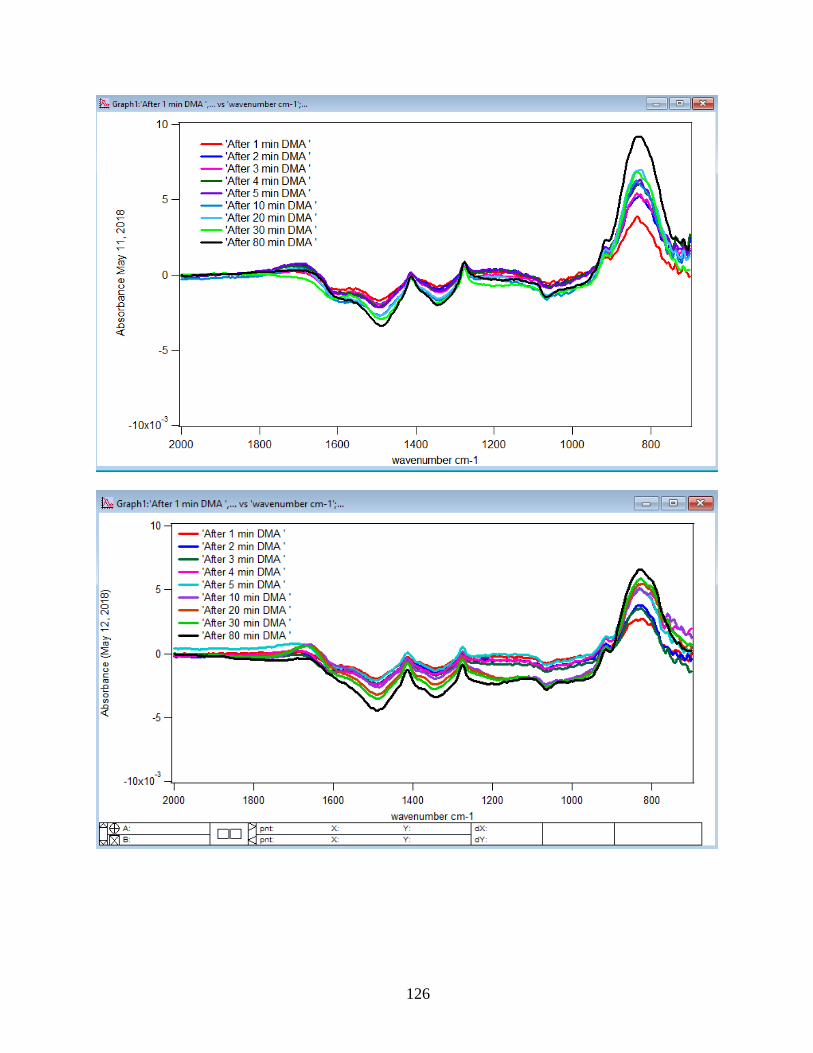
126
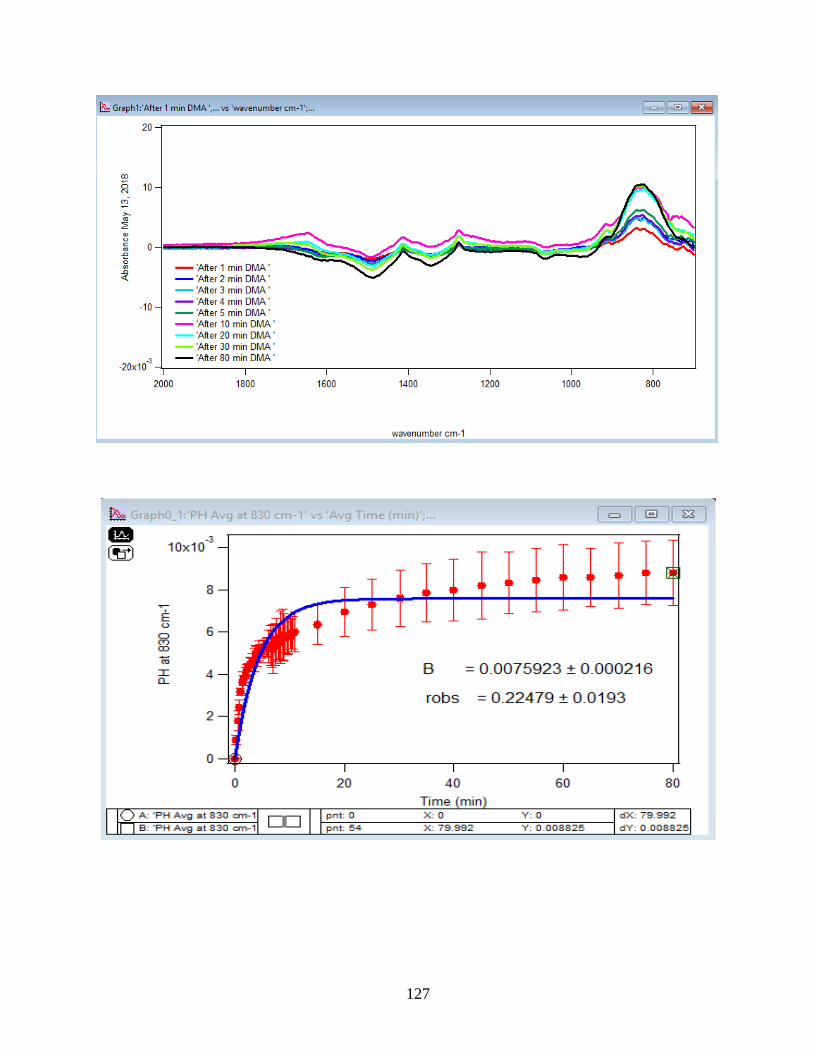
127
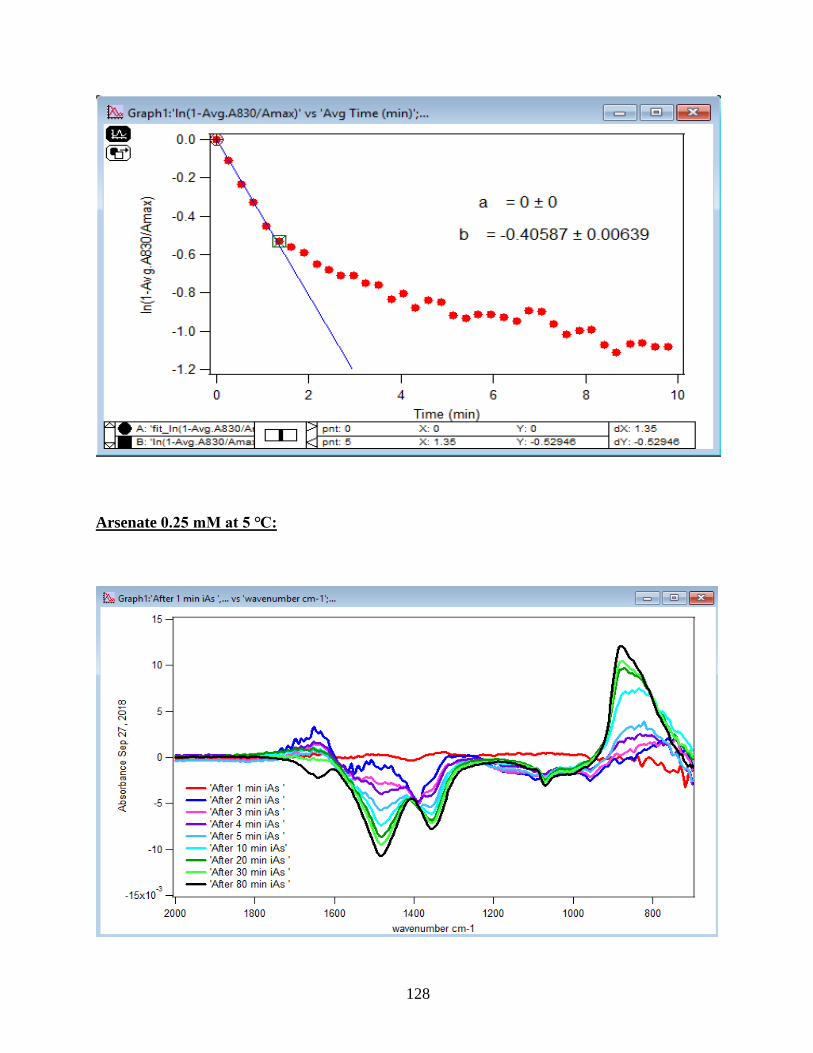
128
Arsenate 0.25 mM at 5 ℃:
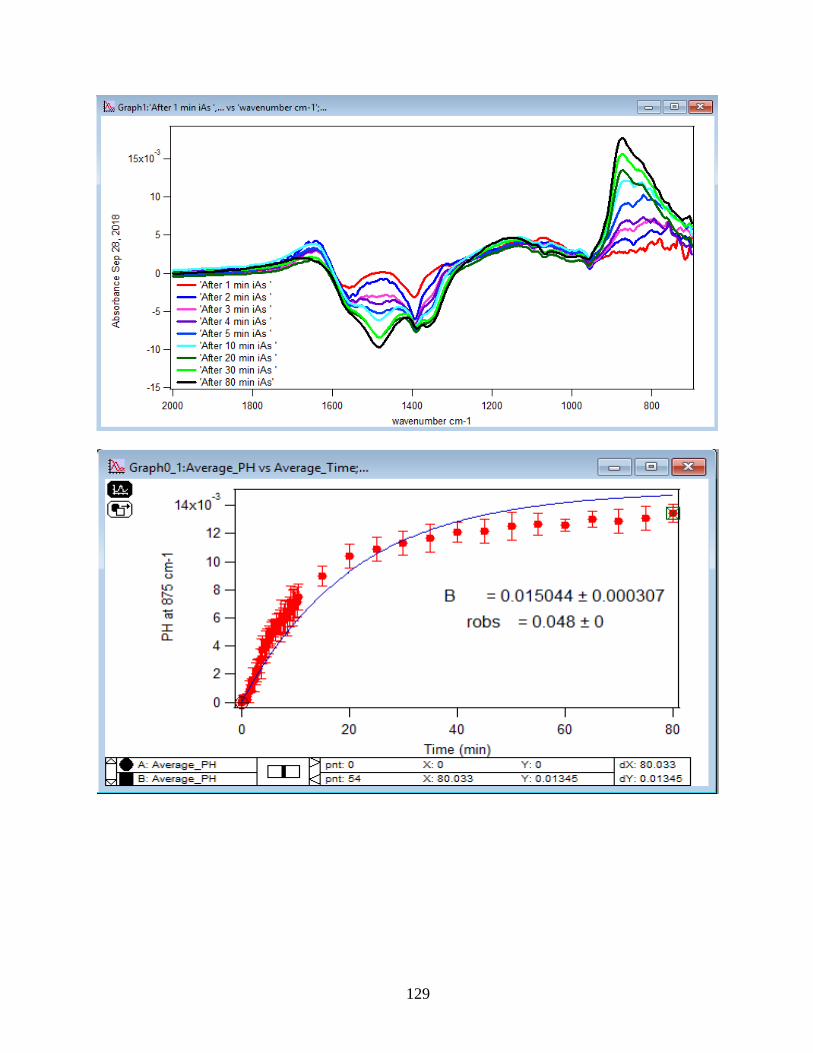
129
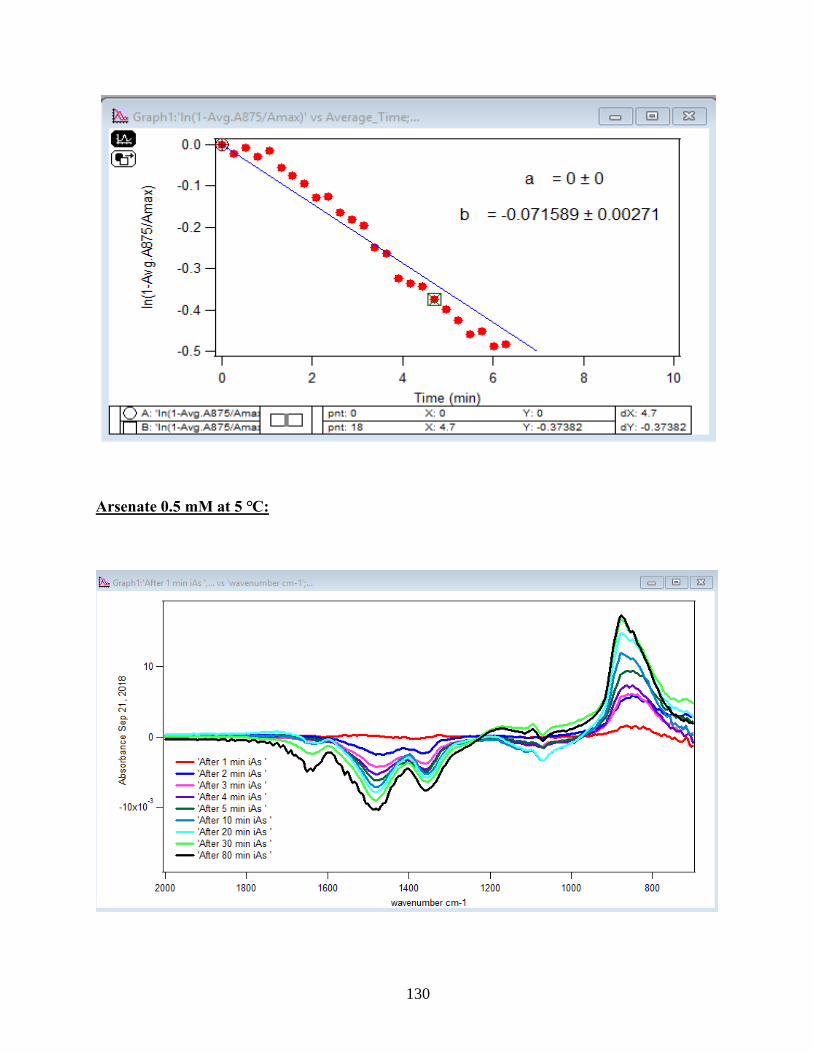
130
Arsenate 0.5 mM at 5 ℃:
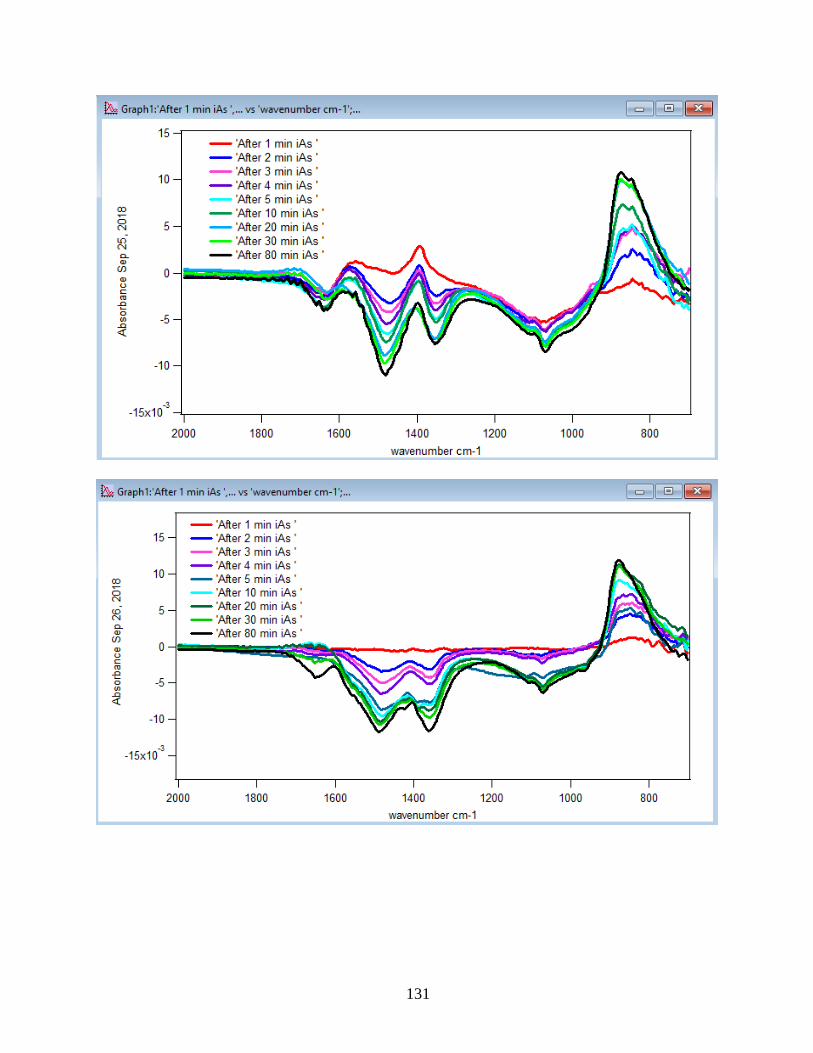
131
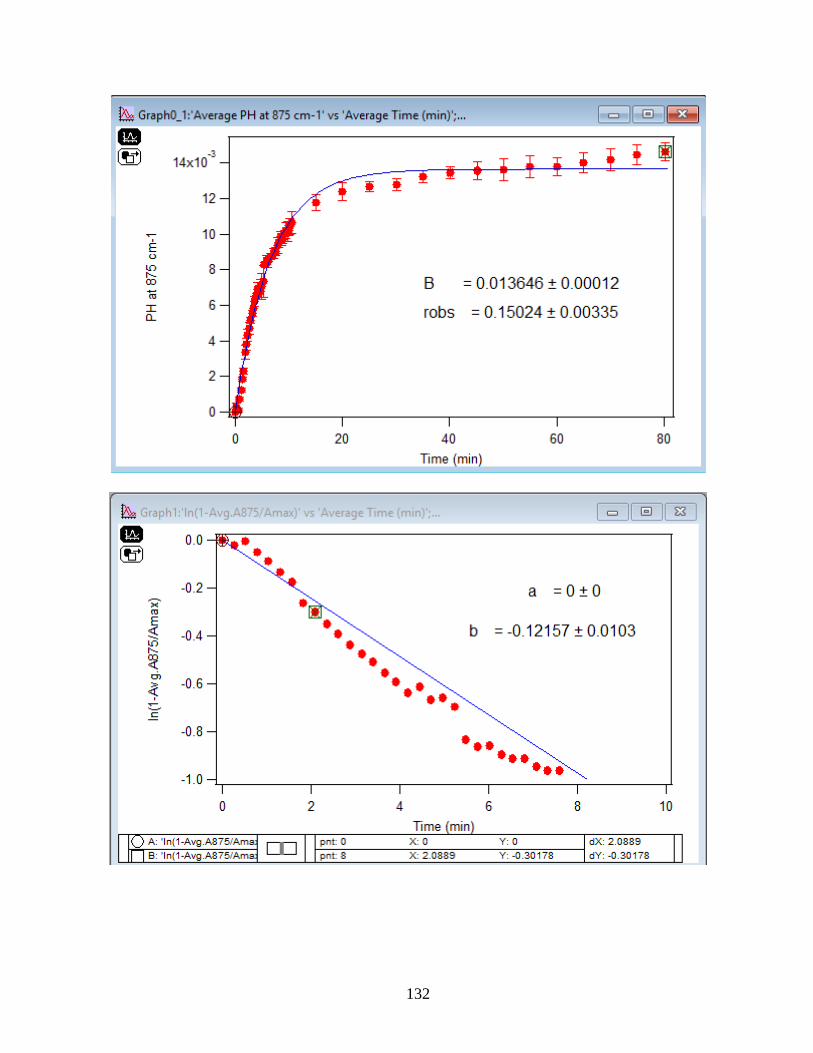
132
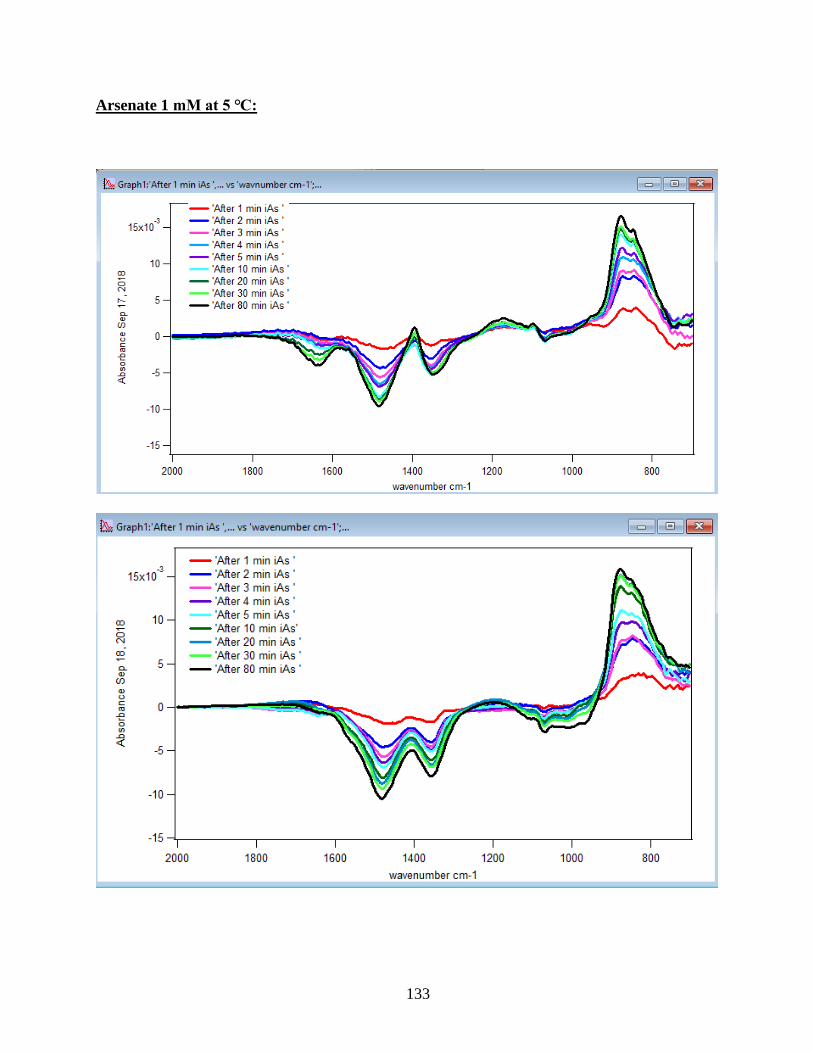
133
Arsenate 1 mM at 5 ℃:
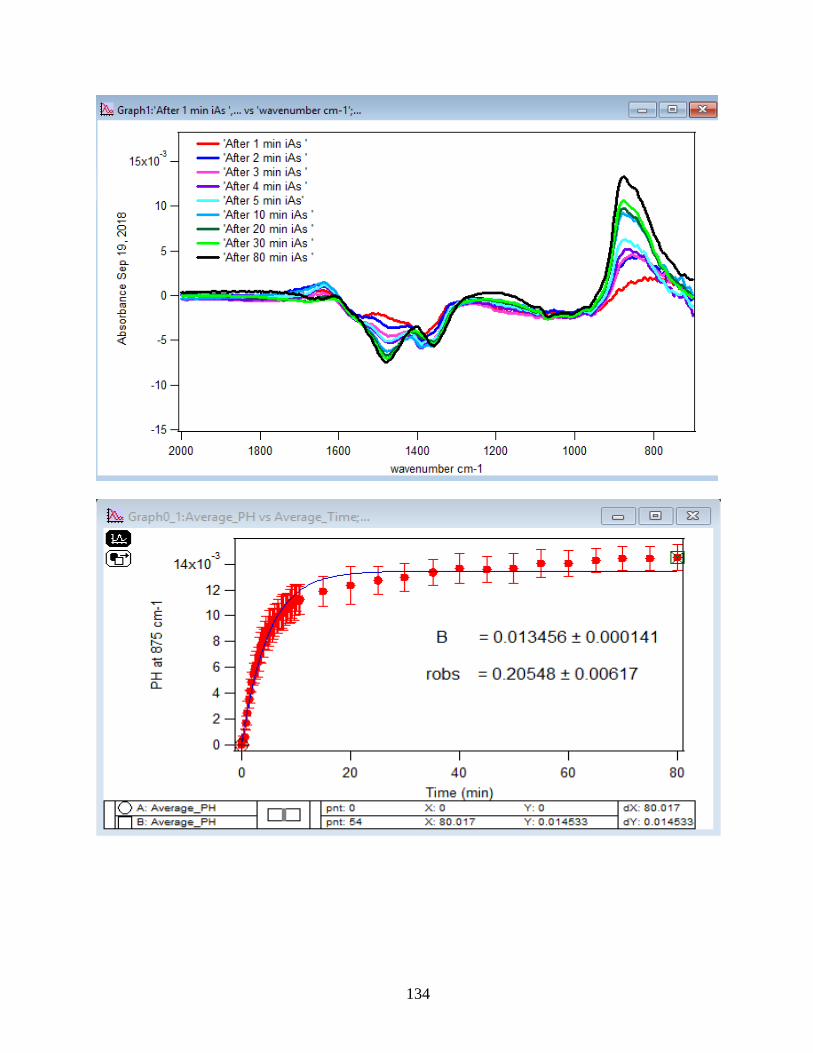
134
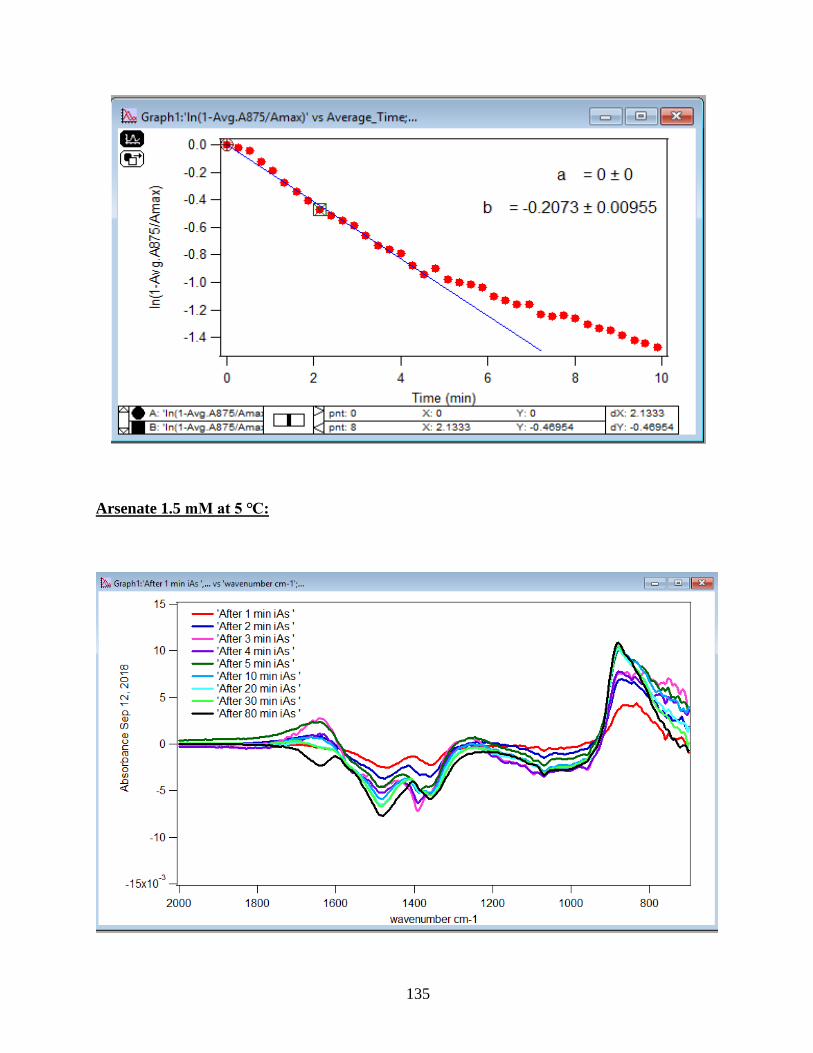
135
Arsenate 1.5 mM at 5 ℃:
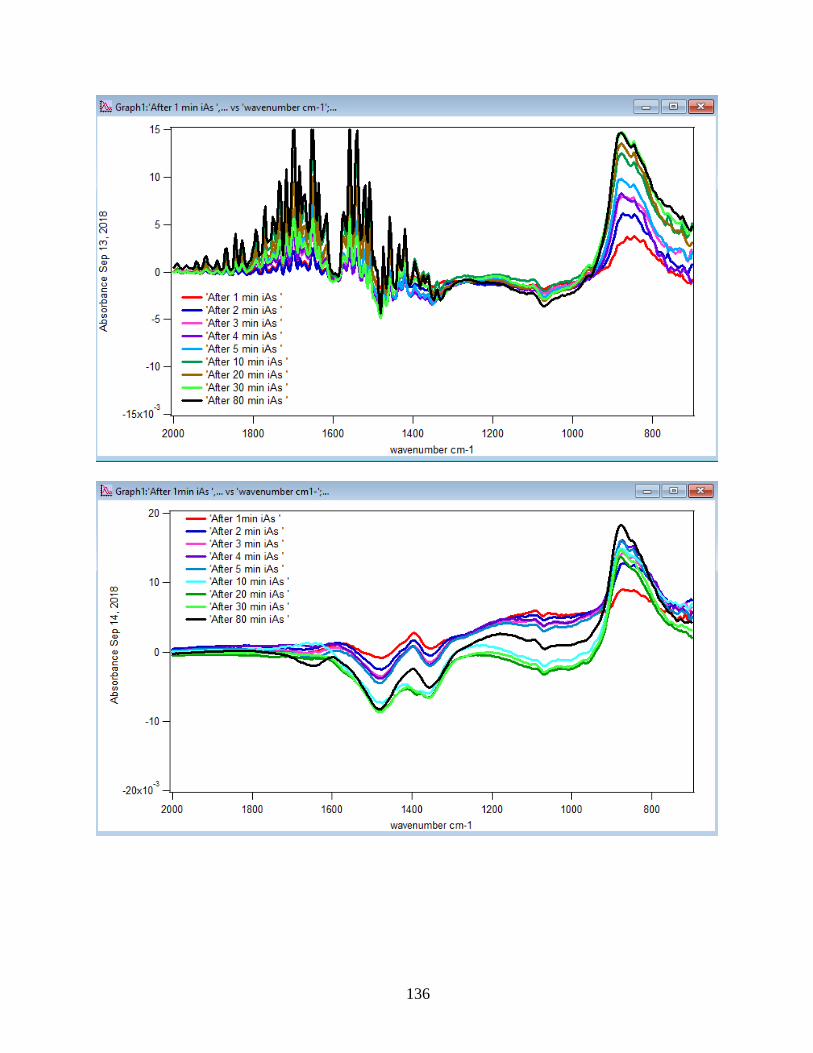
136
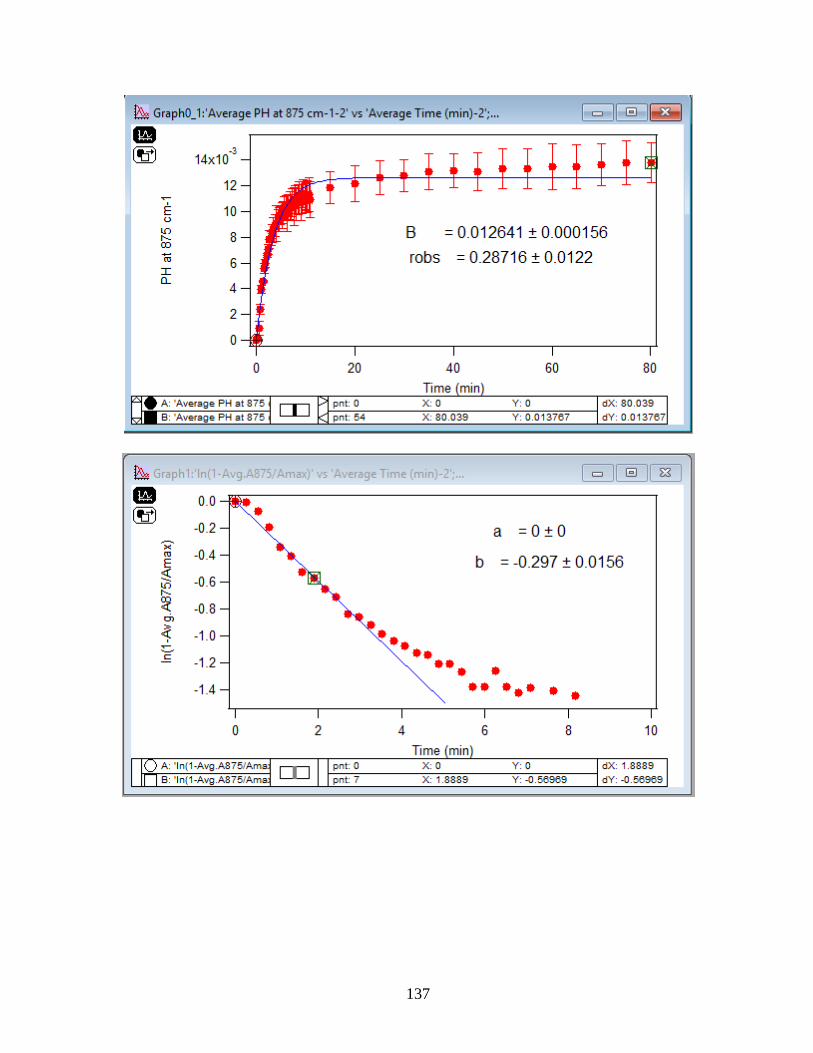
137
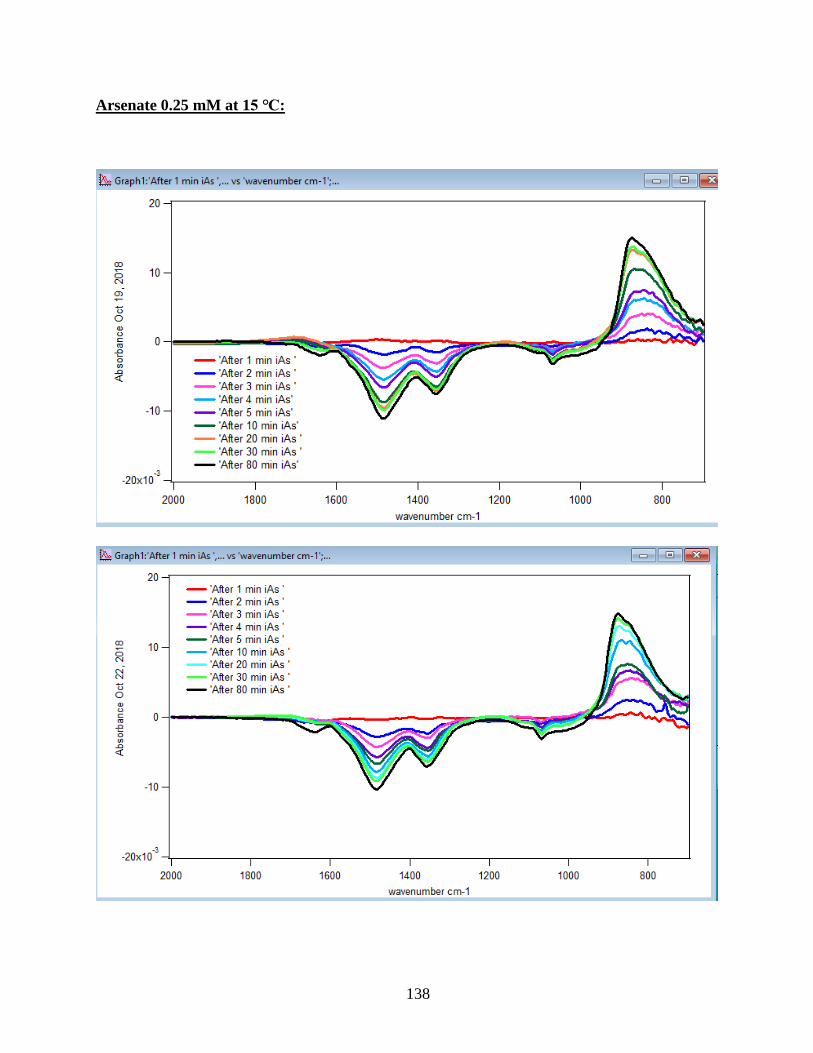
138
Arsenate 0.25 mM at 15 ℃:
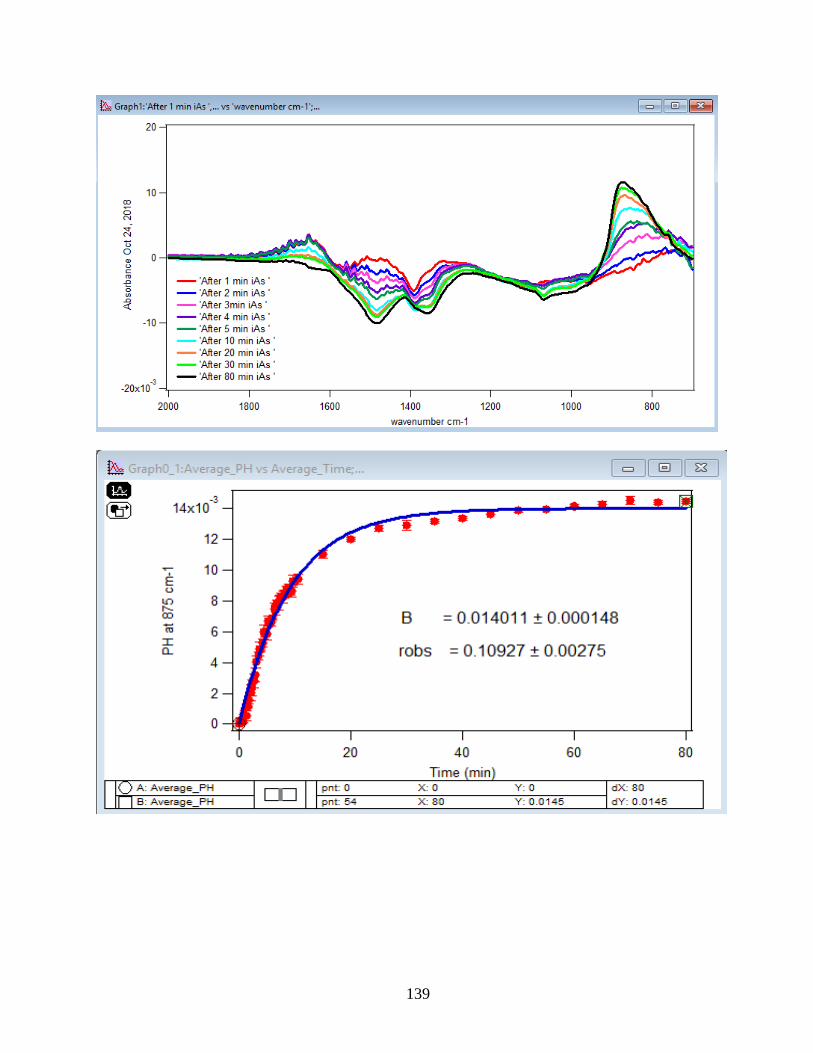
139
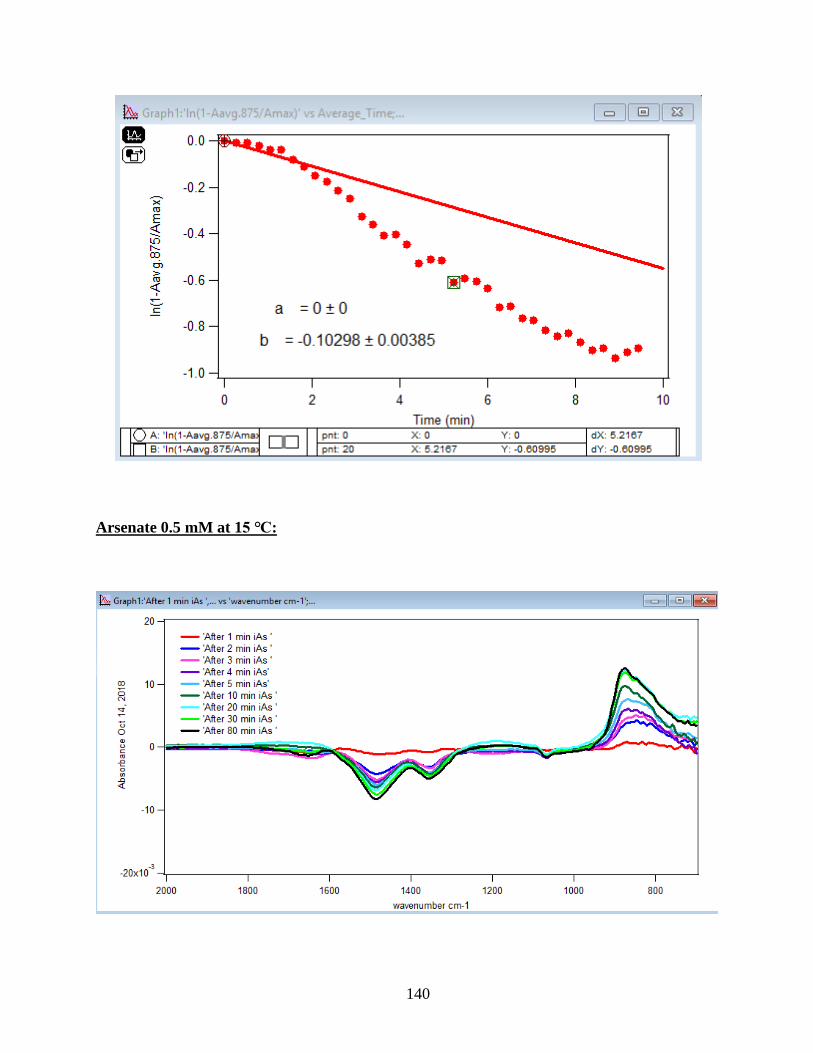
140
Arsenate 0.5 mM at 15 ℃:
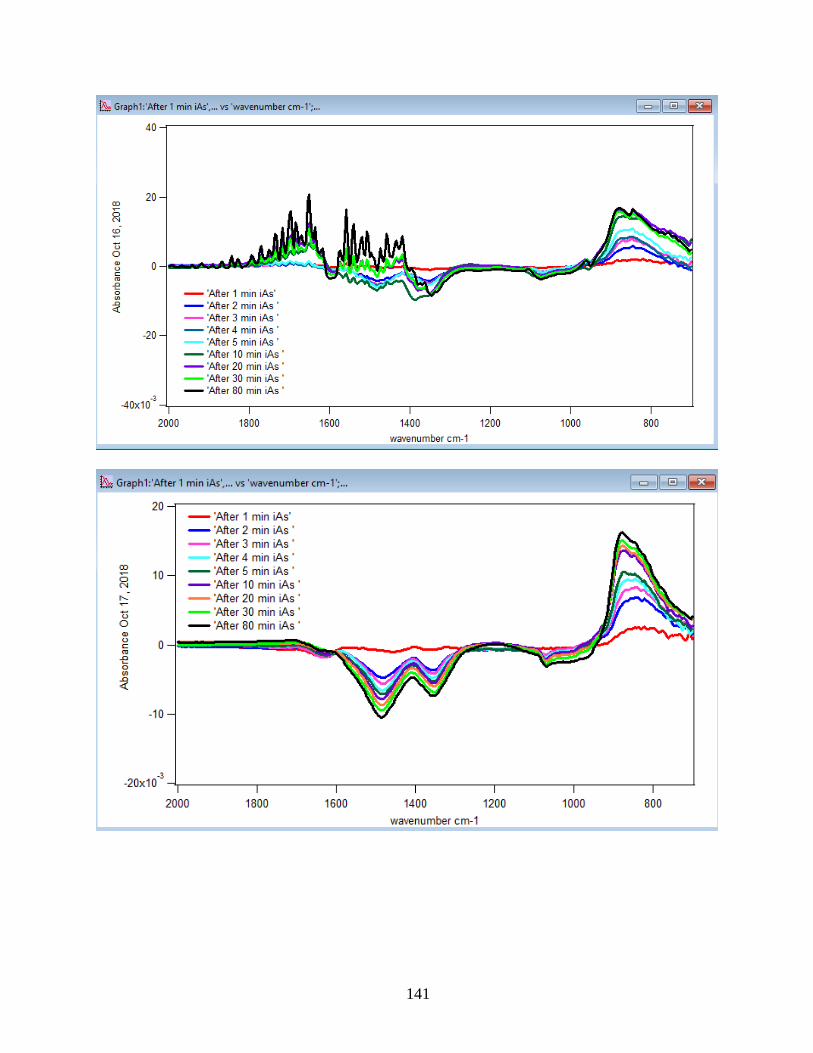
141
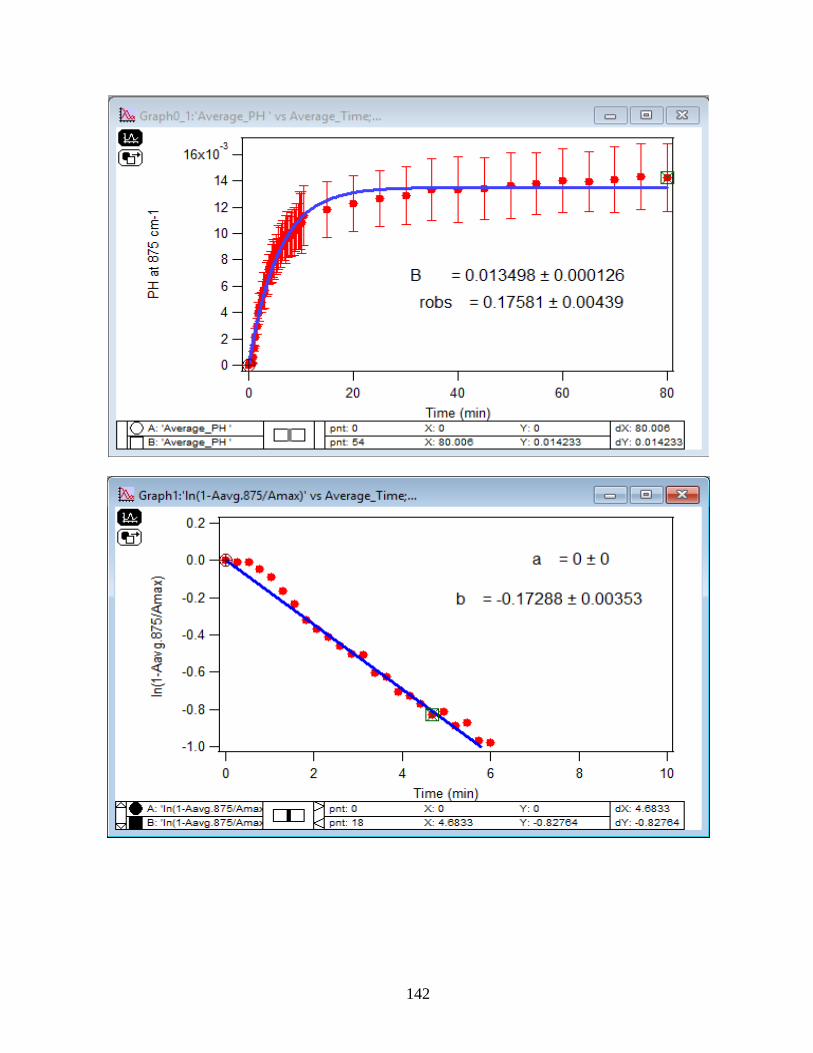
142
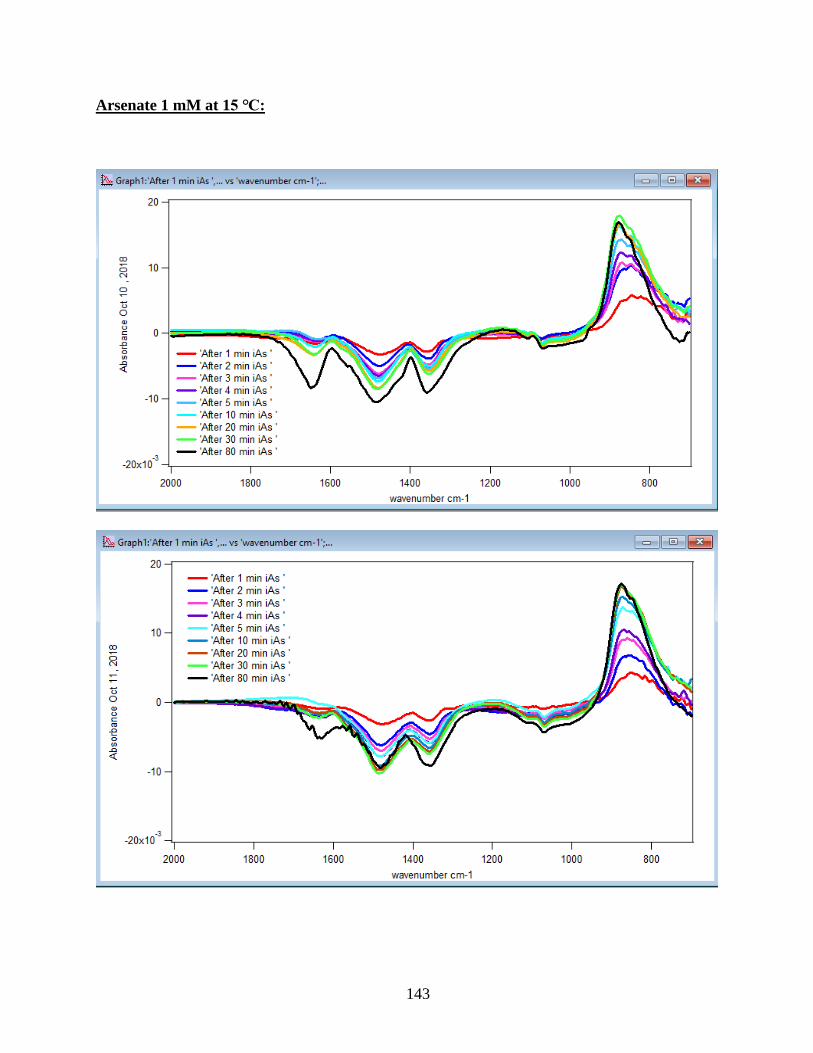
143
Arsenate 1 mM at 15 ℃:
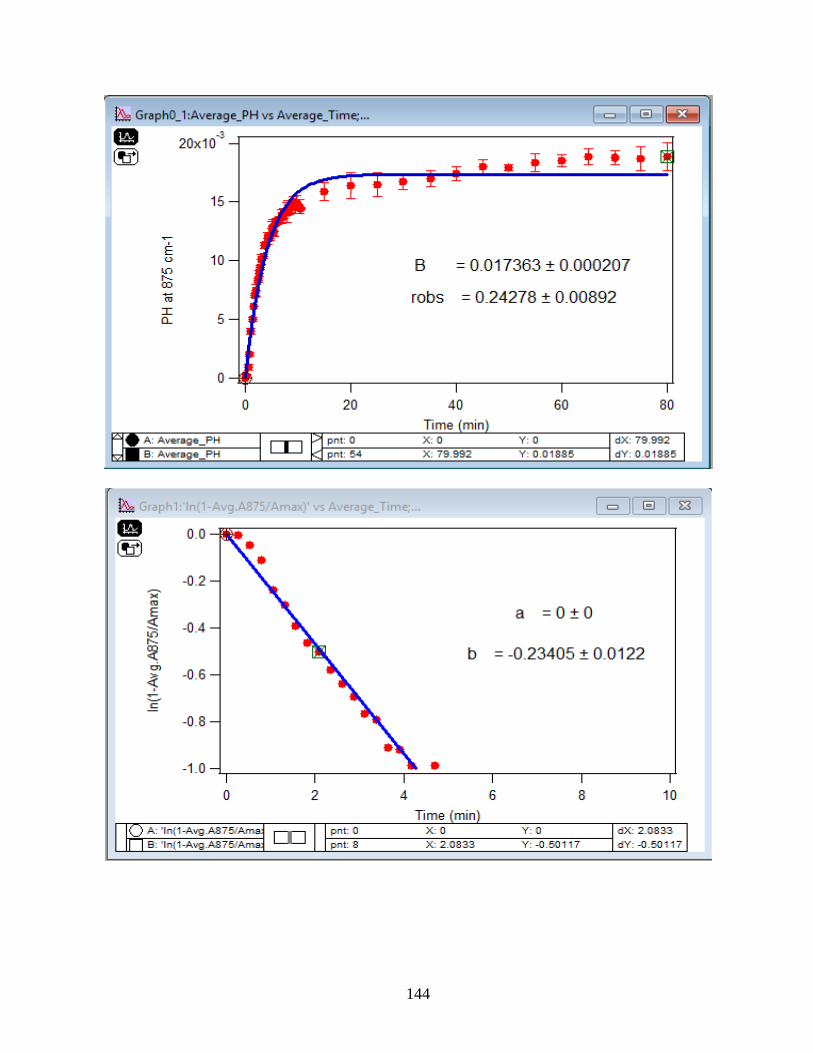
144
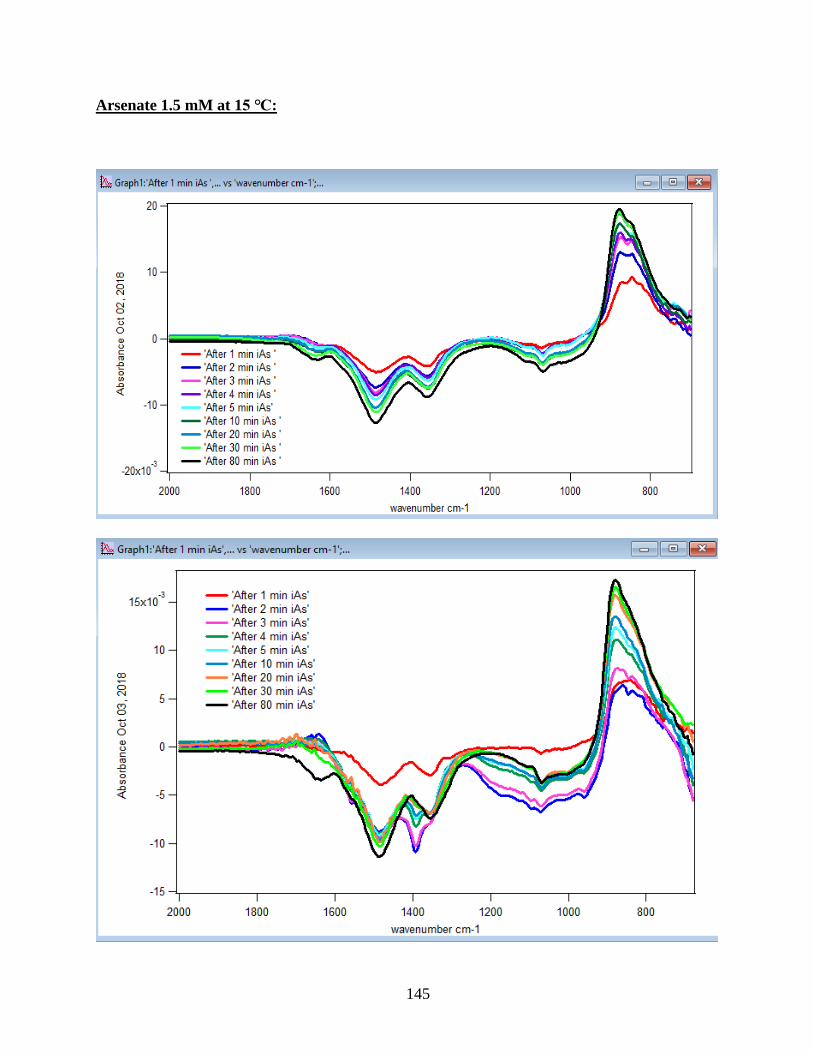
145
Arsenate 1.5 mM at 15 ℃:
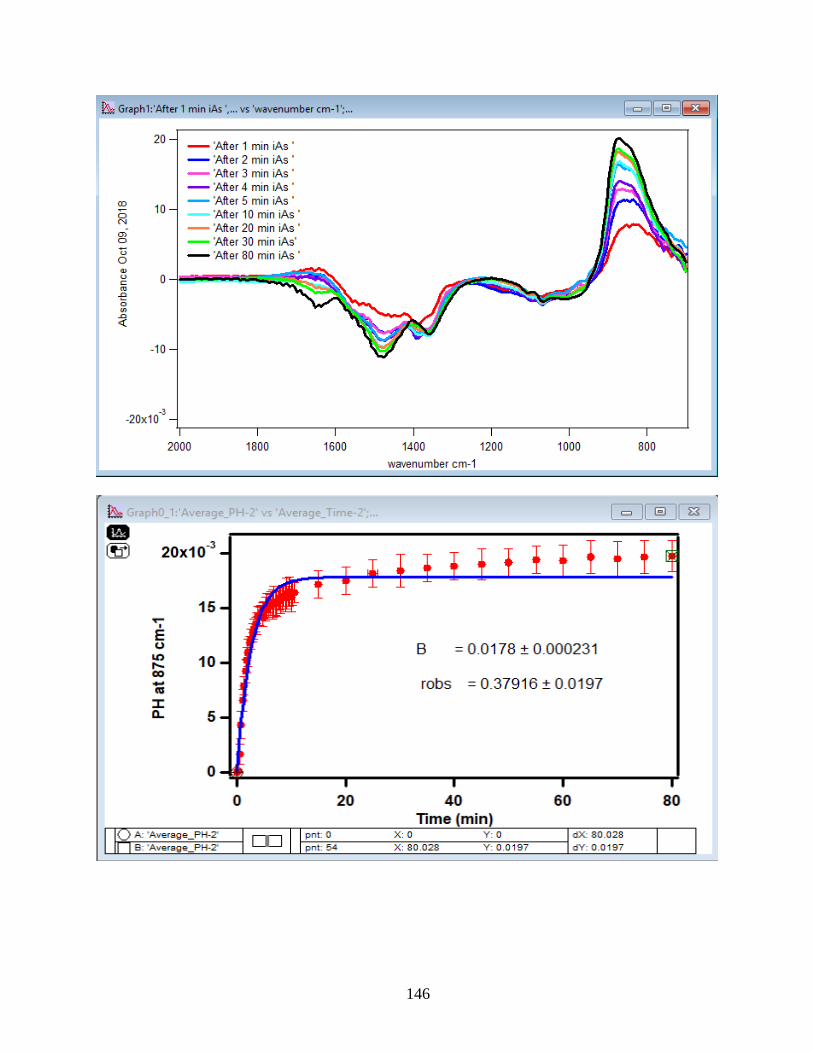
146
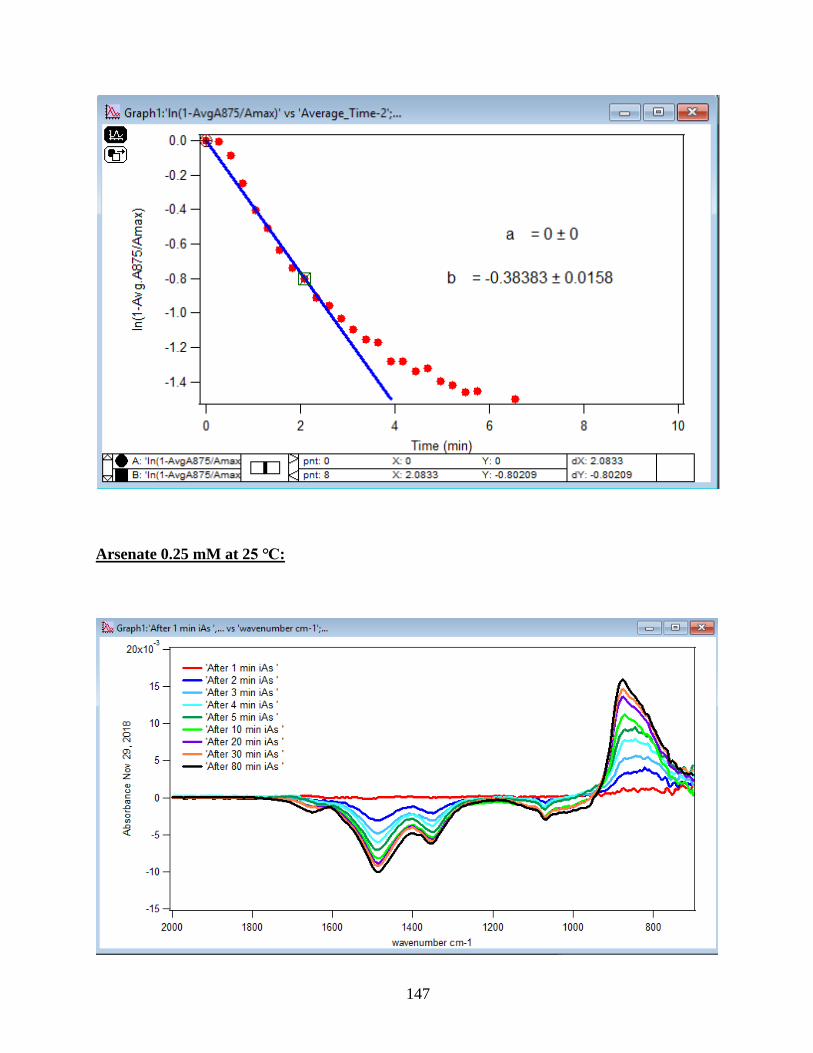
147
Arsenate 0.25 mM at 25 ℃:
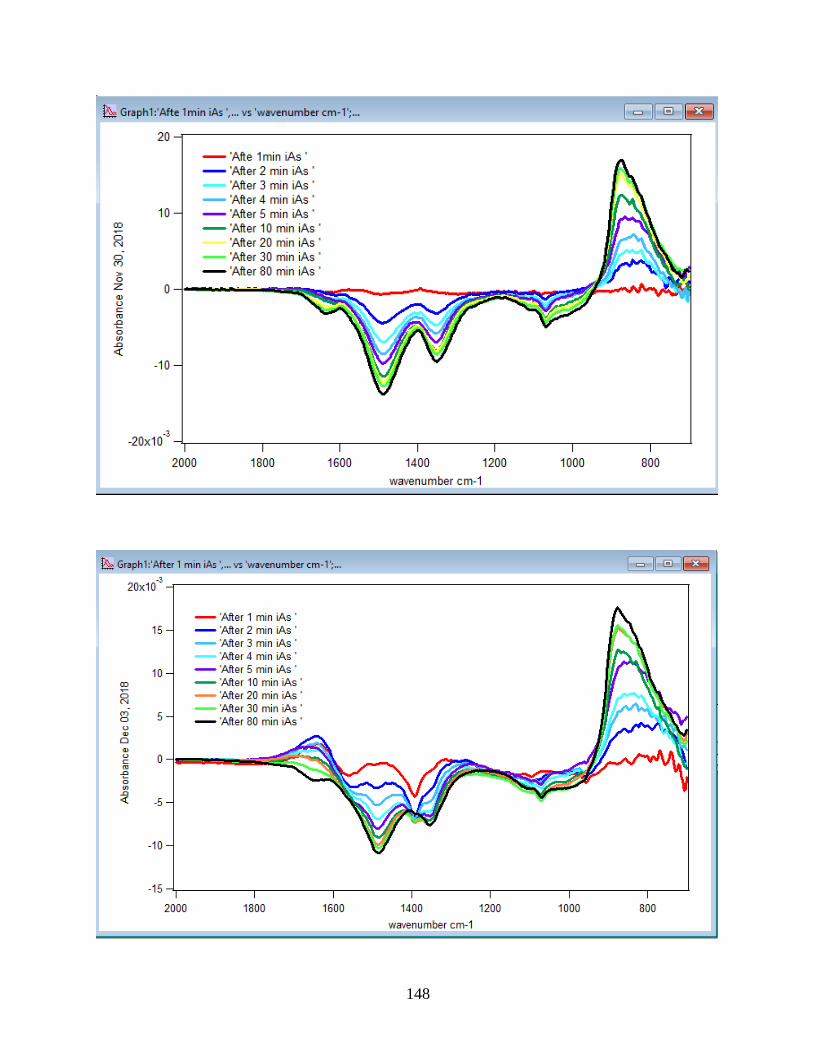
148
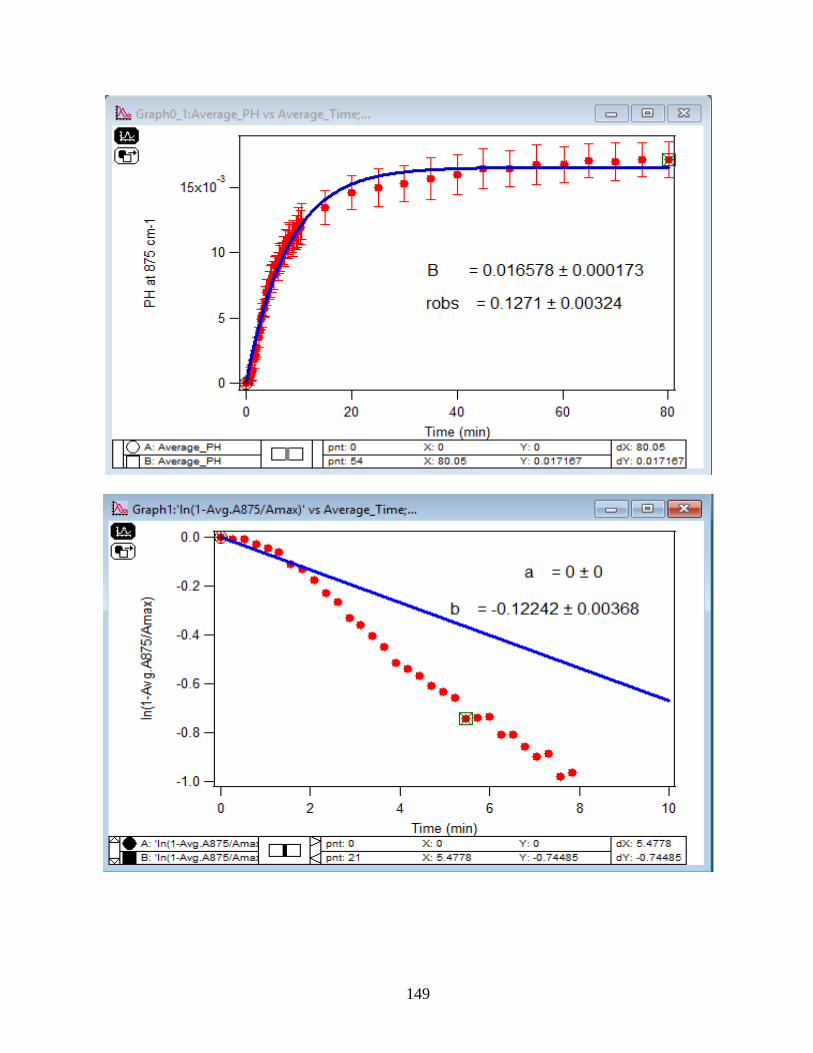
149
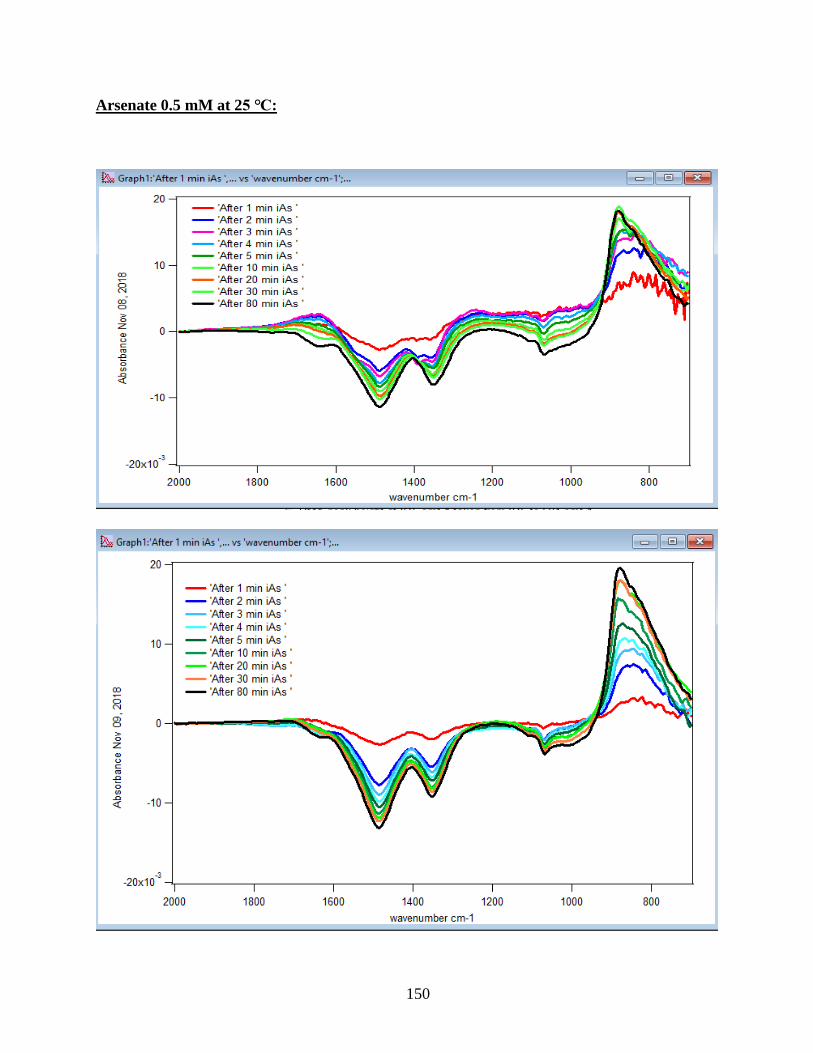
150
Arsenate 0.5 mM at 25 ℃:
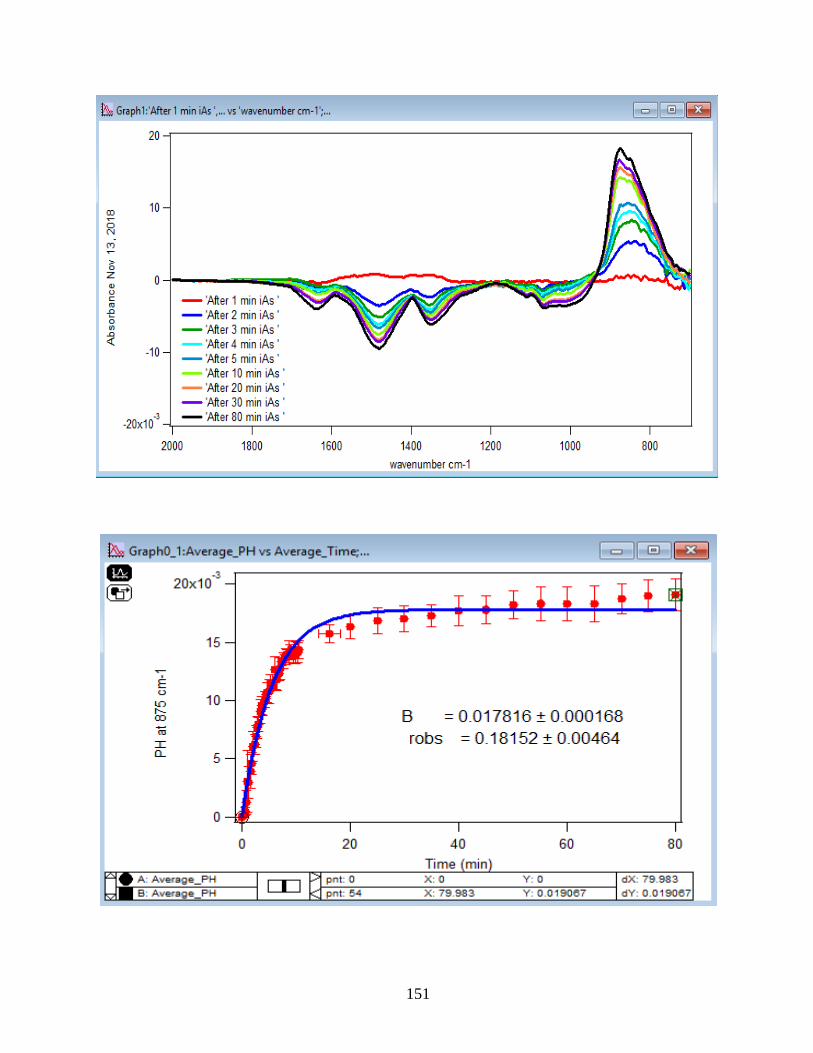
151
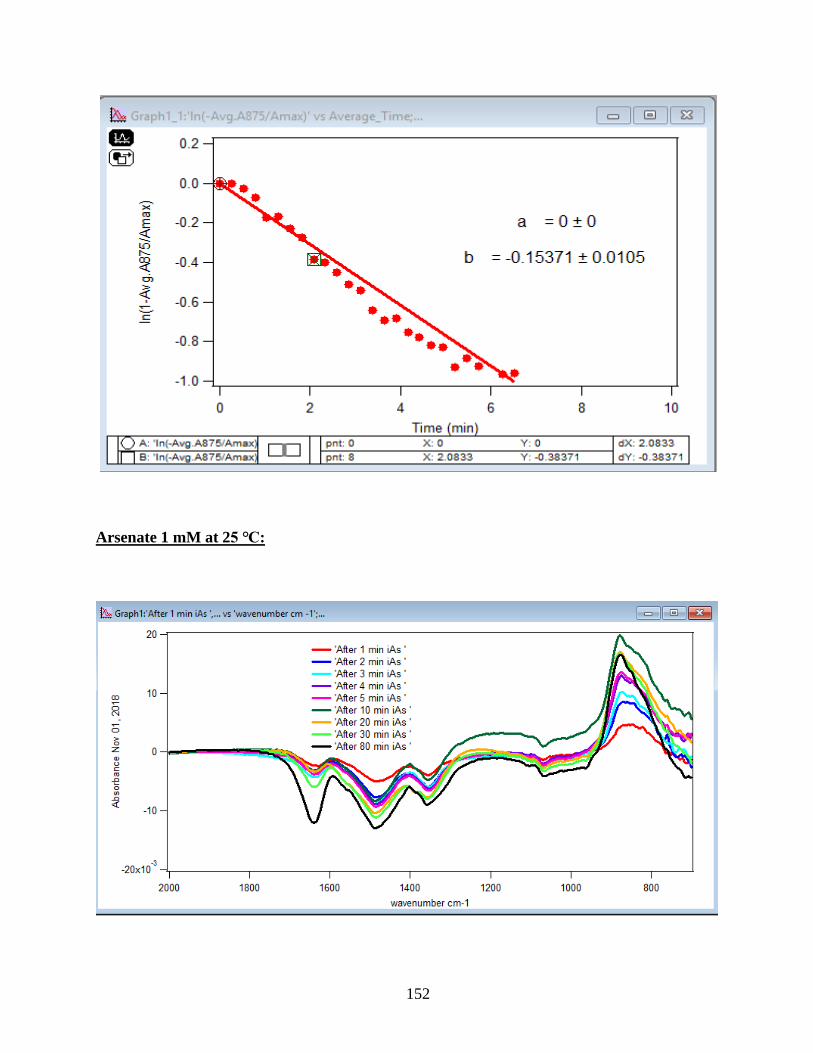
152
Arsenate 1 mM at 25 ℃:
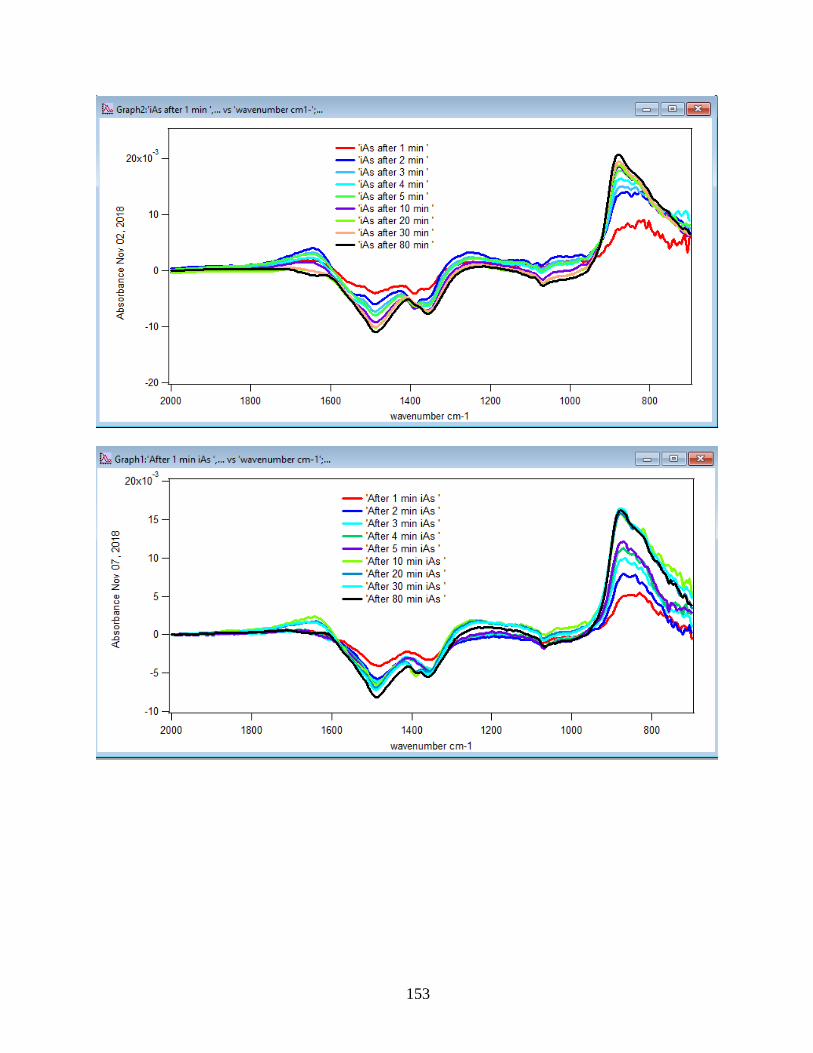
153
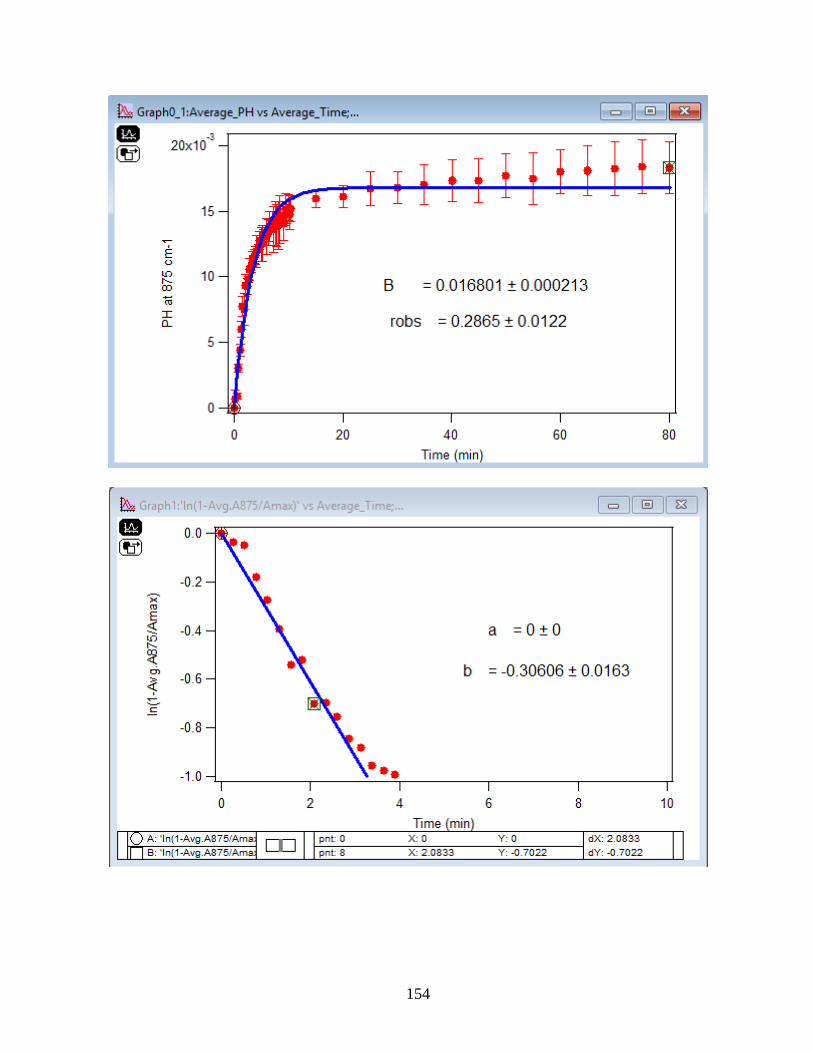
154
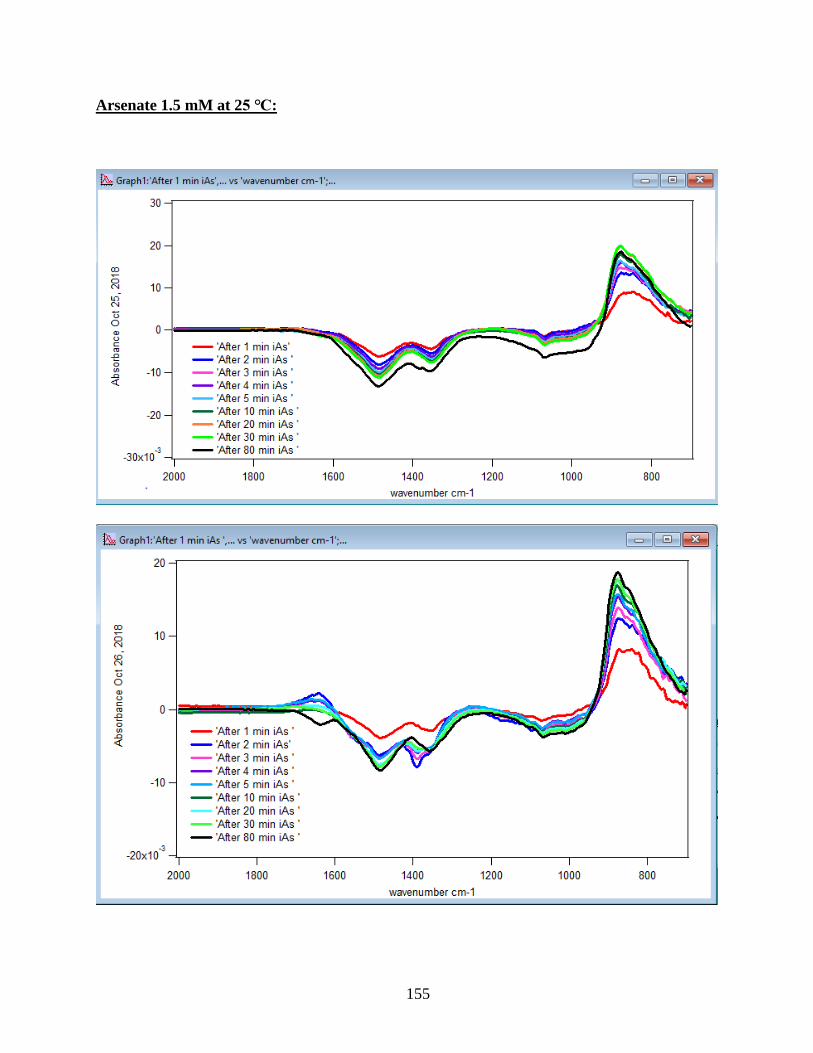
155
Arsenate 1.5 mM at 25 ℃:
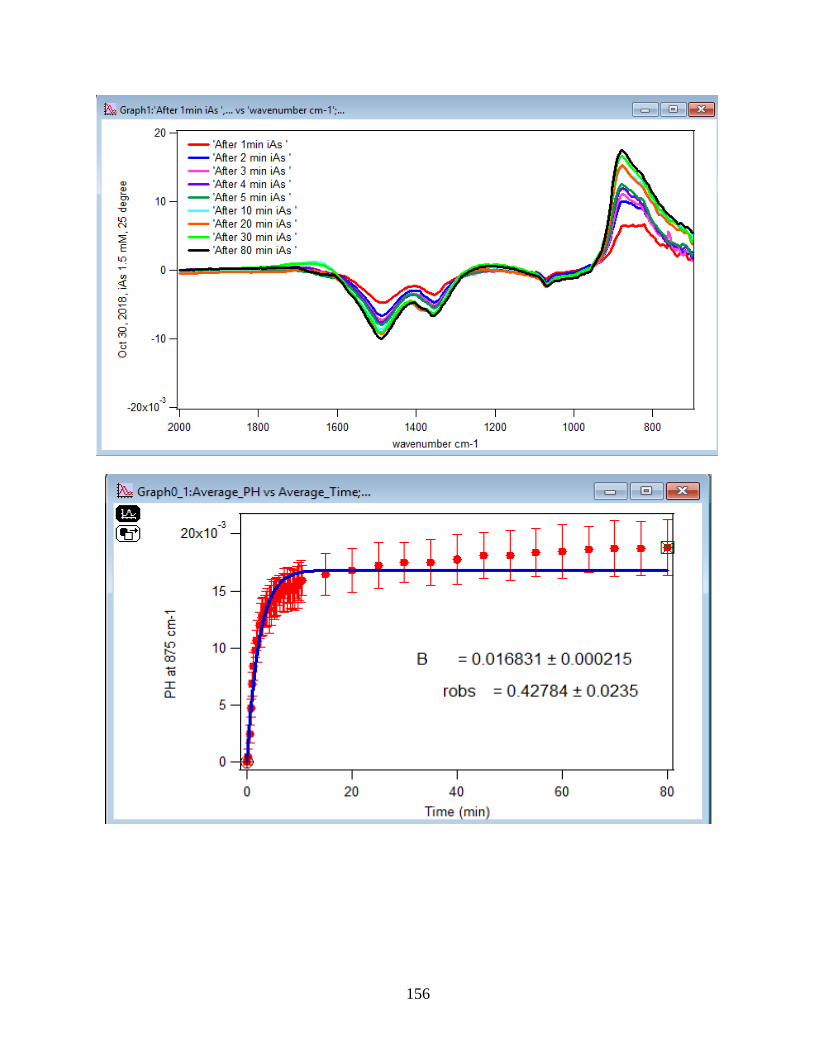
156
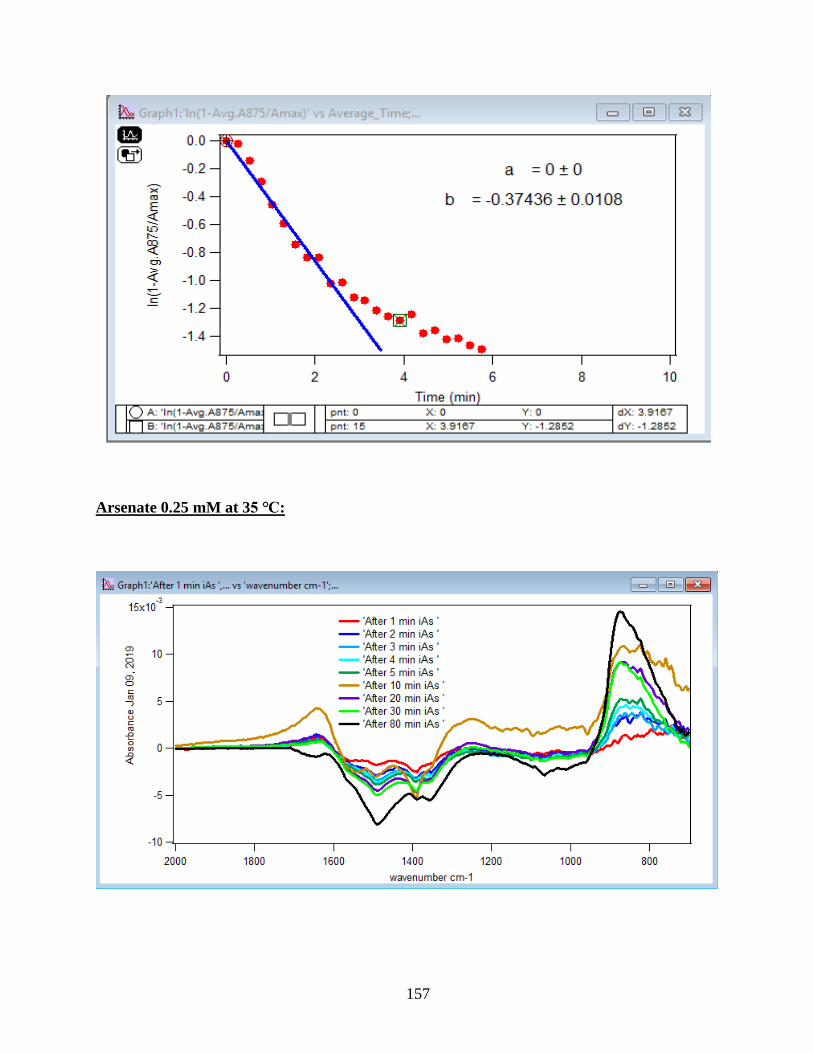
157
Arsenate 0.25 mM at 35 ℃:
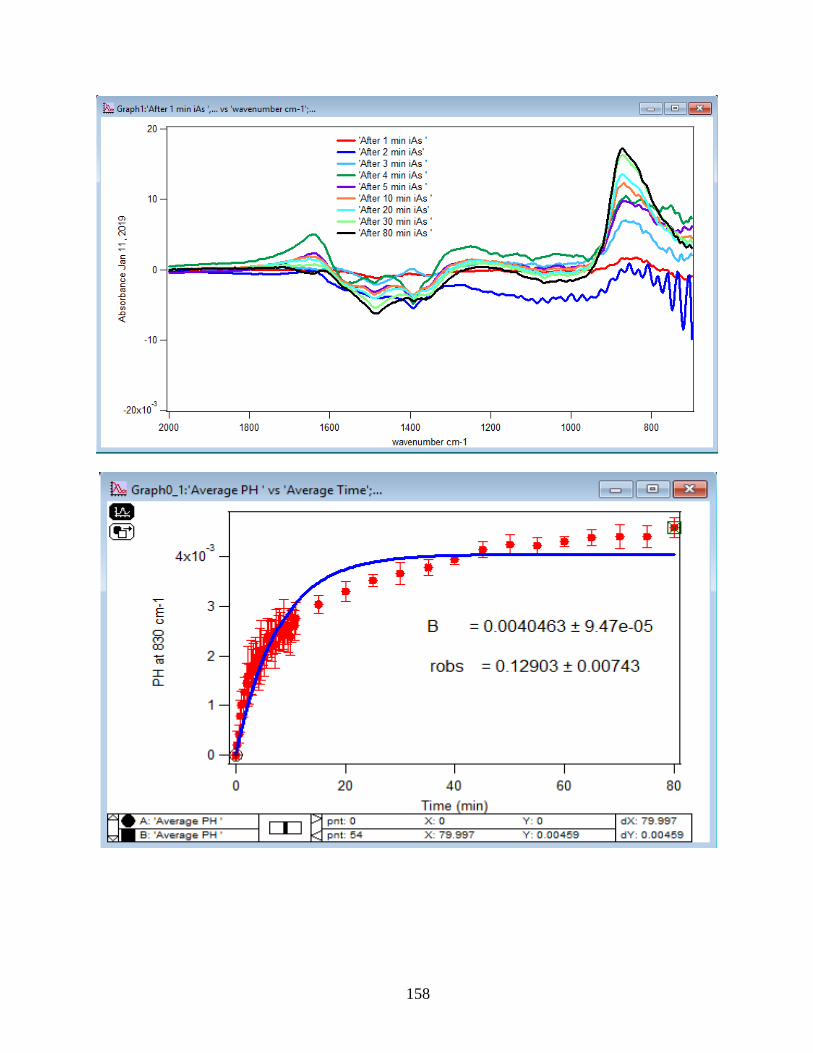
158
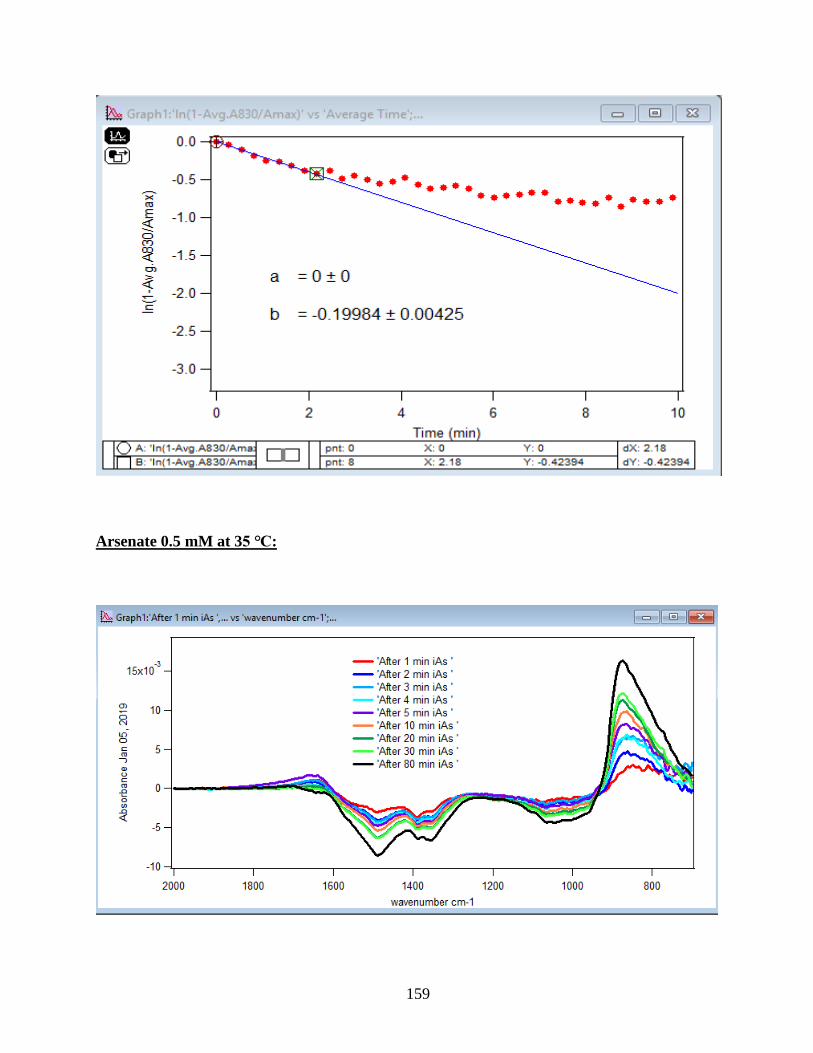
159
Arsenate 0.5 mM at 35 ℃:
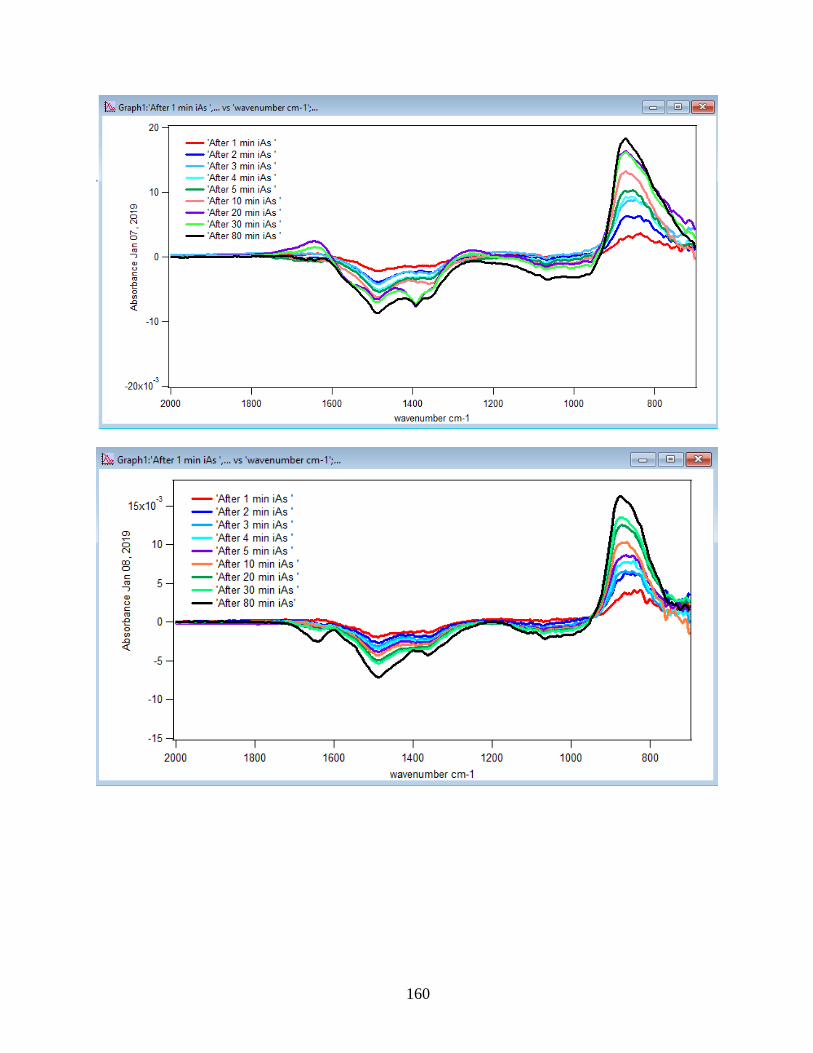
160
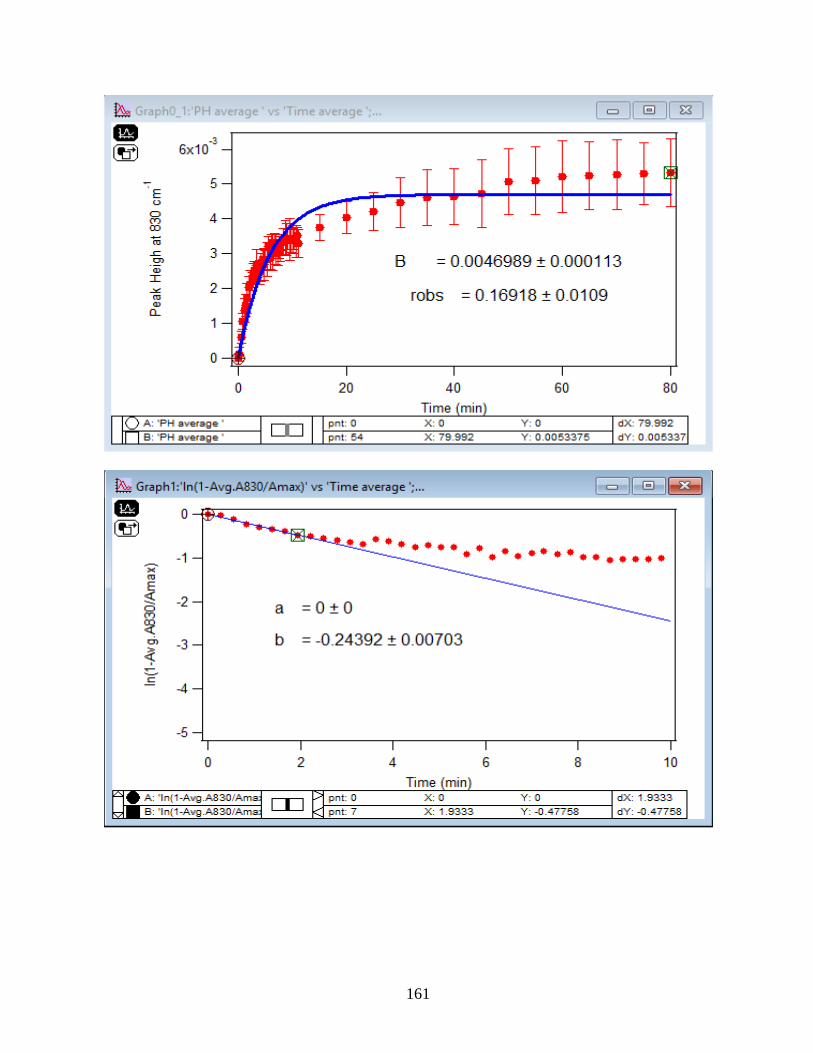
161
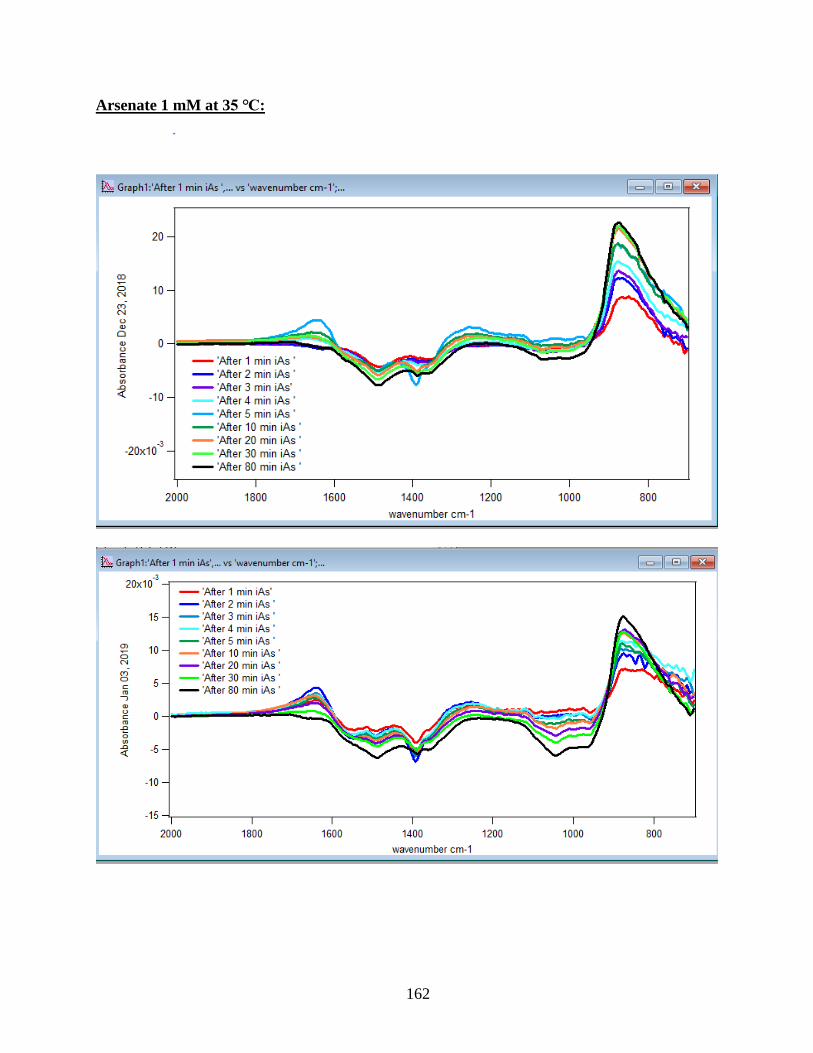
162
Arsenate 1 mM at 35 ℃:
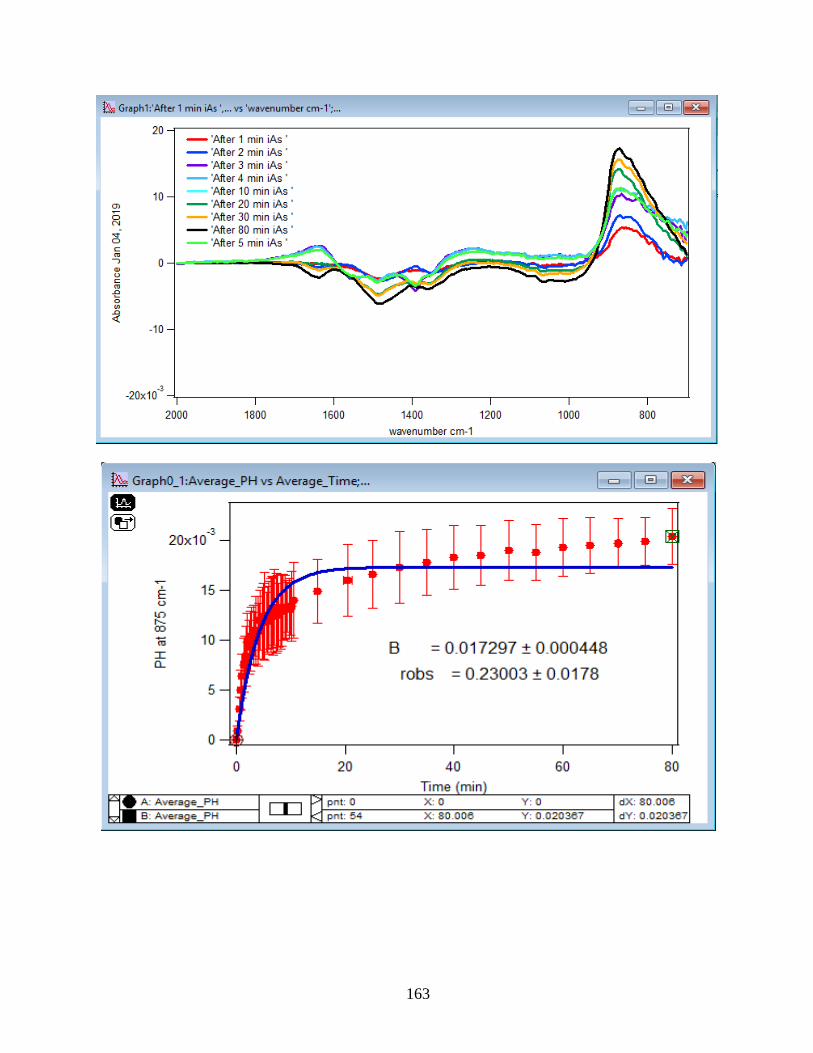
163
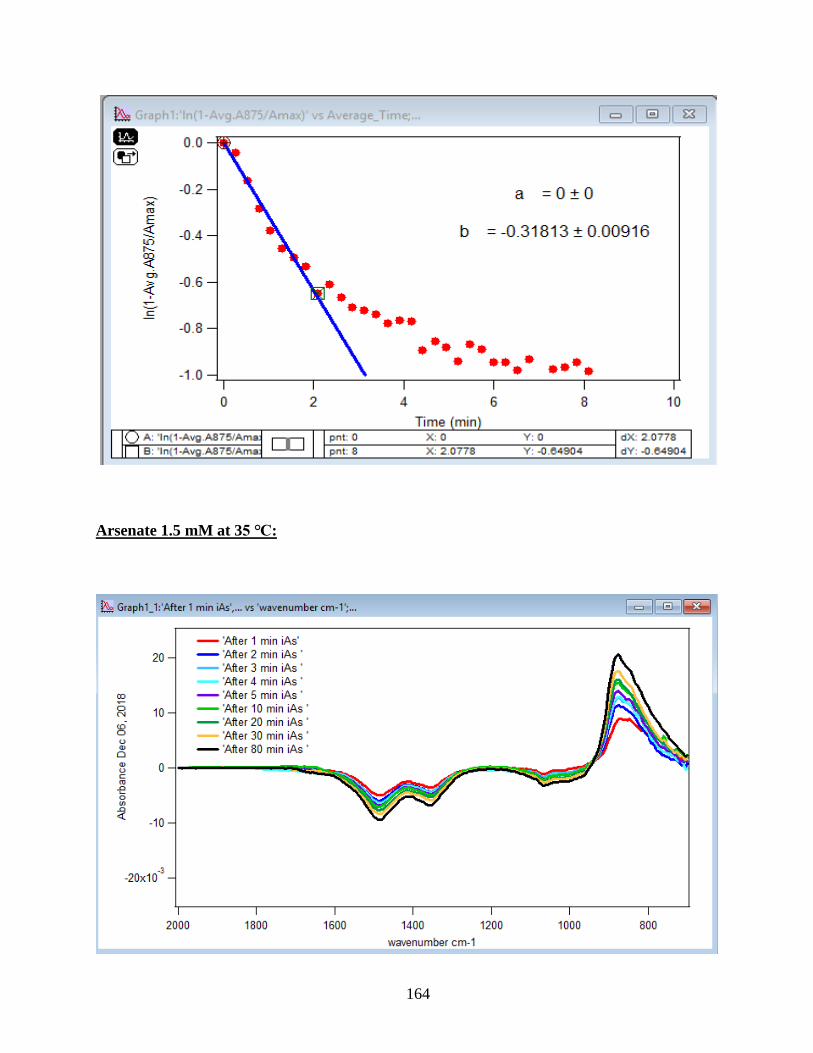
164
Arsenate 1.5 mM at 35 ℃:
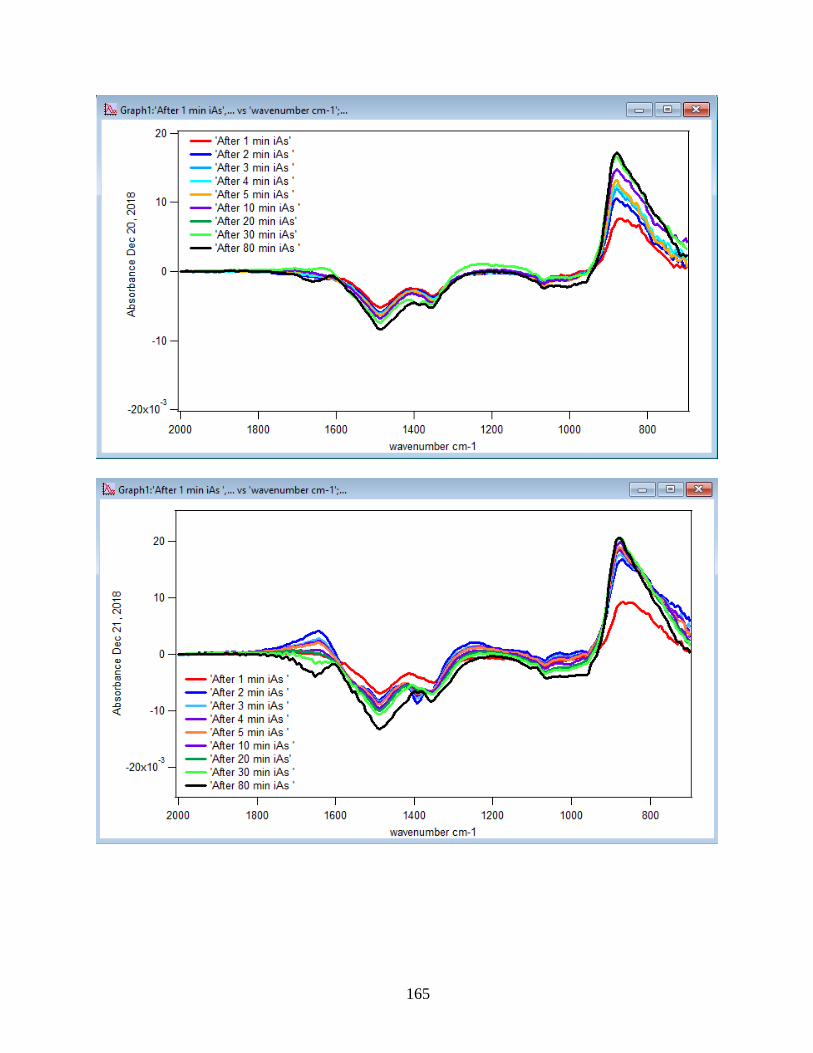
165
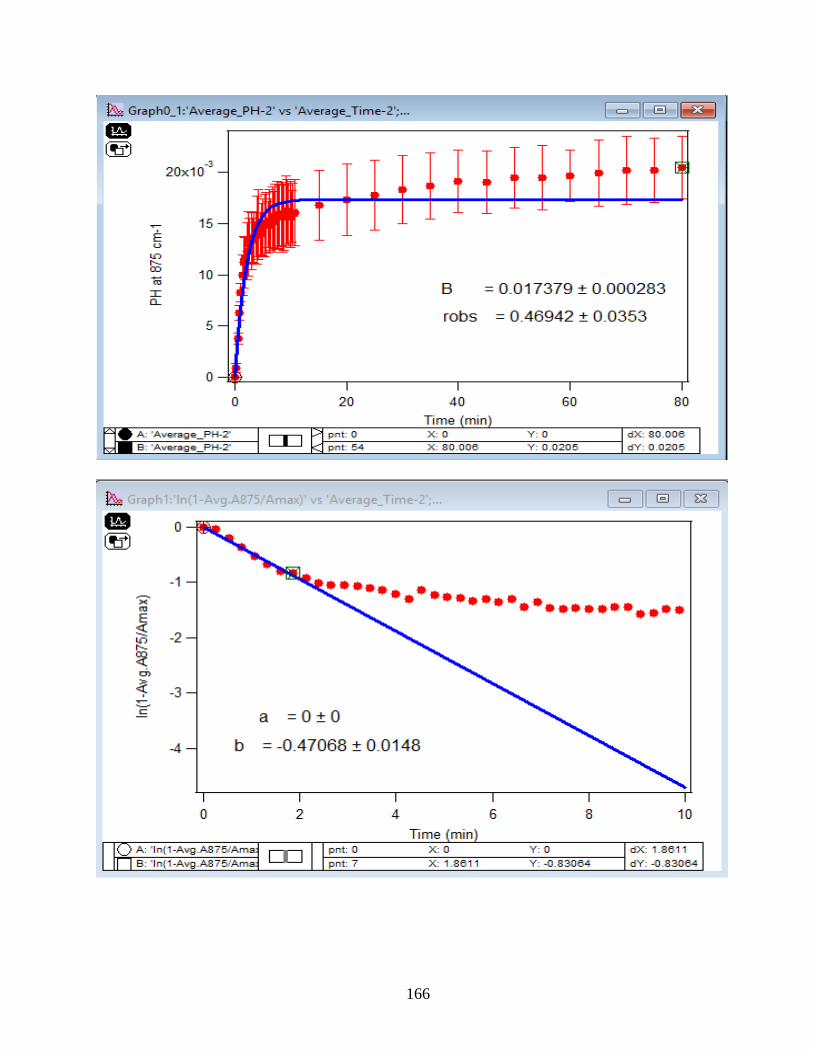
166
Related Documents