Schneider Electric’s Approach to Industrial Energy Management Michael MacKenzie & Peter Hogg

Welcome message from author
This document is posted to help you gain knowledge. Please leave a comment to let me know what you think about it! Share it to your friends and learn new things together.
Transcript

Schneider Electric’s
Approach to
Industrial Energy
Management
Michael MacKenzie &
Peter Hogg

2
Schneider Electric – Global Solutions, Digital Energy - Michael MacKenzie – May 2014.
Confidential Property of Schneider Electric
billion € sales (last twelve months ... $28b USD)
of sales in new economies (last twelve months)
people in 100+ countries
North
America
23% Asia
Pacific 27%
Rest of World 18%
Western
Europe
32%
Schneider Electric: The Global Specialist in Energy Management & Sustainability (Est. 1836)

3
Schneider Electric – Global Solutions, Digital Energy - Michael MacKenzie – May 2014.
Confidential Property of Schneider Electric
October 31, 2011.
Billion. Source: Official United Nations population projections prepared by the Population Division of the Department of Economic and Social Affairs.

4
Schneider Electric – Global Solutions, Digital Energy - Michael MacKenzie – May 2014.
Confidential Property of Schneider Electric
The energy dilemma
vs Energy demand By 2050 Electricity by 2030
CO2 emissions to
avoid dramatic climate
changes by 2050
The facts The need
Source: IEA 2007 Source: IPCC 2007, figure (vs. 1990 level)
Frequent
power outages
Rising
energy prices Climate change
Conflicts for
resource access
& control

5
Schneider Electric – Global Solutions, Digital Energy - Michael MacKenzie – May 2014.
Confidential Property of Schneider Electric
Who uses the most energy?
31%
Industry Average facility can
reduce consumption by
10 to 20%.
• 25% savings would save 7%
of the world’s electricity.
• Motors account for over 60%
of electricity usage.
Our customers are challenged to reduce costs, energy
demand and emissions. We can help.

6
Schneider Electric – Global Solutions, Digital Energy - Michael MacKenzie – May 2014.
6
of the total OPEX is energy, majority of which is electricity 1/3 Waste Water treatment
of OPEX for reverse osmosis technology is electricity 57% Desalination
of the electricity used is for pumping 94% Water distribution
31% Cement production
of OPEX is energy
Food processing
of electrical energy used by pumps, compressors & refrigeration 78%
The energy footprint of key industrial sectors
7
Schneider Electric – Global Solutions, Digital Energy - Michael MacKenzie – May 2014.
Confidential Property of Schneider Electric 7
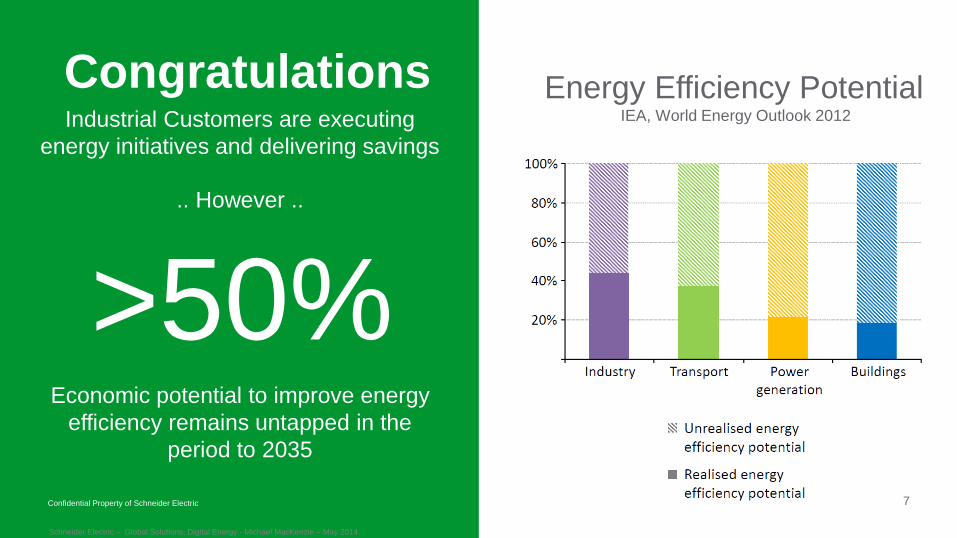
Congratulations Industrial Customers are executing
energy initiatives and delivering savings
.. However ..
Economic potential to improve energy
efficiency remains untapped in the
period to 2035
>50%
Energy Efficiency Potential IEA, World Energy Outlook 2012

8
Schneider Electric – Global Solutions, Digital Energy - Michael MacKenzie – May 2014.
What drives our customers to seek out Energy Efficiency?
8

9
Schneider Electric – Global Solutions, Digital Energy - Michael MacKenzie – May 2014.
9
What’s driving the need for Energy Management?
Regulatory compliance The need to meet and report on strict emissions standards and energy reduction targets are increasing.
Sustainability Companies want to reduce reduce resource waste through improved efficiency, lower their carbon footprint and develop a “green supply chain”.
OPEX reduction Energy is one of the largest operational expenses of many industrials. Reducing energy intensity increases production margins and has a net positive impact on EBIT.
10
Schneider Electric – Global Solutions, Digital Energy - Michael MacKenzie – May 2014.
10
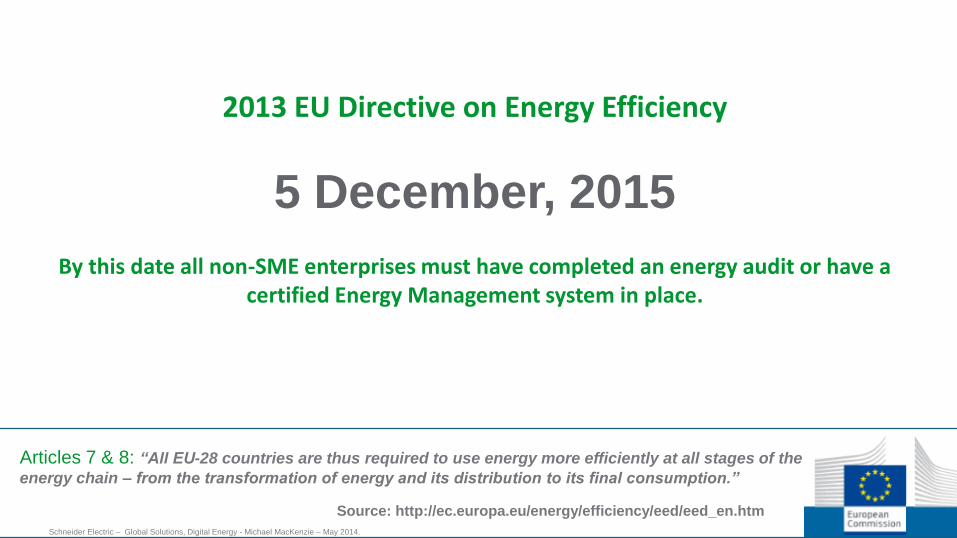
2013 EU Directive on Energy Efficiency
5 December, 2015
By this date all non-SME enterprises must have completed an energy audit or have a certified Energy Management system in place.
Articles 7 & 8: “All EU-28 countries are thus required to use energy more efficiently at all stages of the
energy chain – from the transformation of energy and its distribution to its final consumption.”
Source: http://ec.europa.eu/energy/efficiency/eed/eed_en.htm

11
Schneider Electric – Global Solutions, Digital Energy - Michael MacKenzie – May 2014.
Confidential Property of Schneider Electric
Customer preferences towards sustainability are changing
87% of Americans are more likely to buy from companies that commit to environmentally-friendly practices if products are of equal quality and price.
BBMG Conscious Consumer Report 2012

12
Schneider Electric – Global Solutions, Digital Energy - Michael MacKenzie – May 2014.
Confidential Property of Schneider Electric
Evidence of increasing volatility of prices as more intermittent renewable energy sources are fed into the grid…
--Q4 2012 EU Quarterly Report on European Electricity Markets
Source: http://www.eia.gov/dnav/ng/hist/n9190us3m.htm
Energy price volatility impacts cash flow
70% drop in 14 months
62% increase in 12 months

13
Schneider Electric – Global Solutions, Digital Energy - Michael MacKenzie – May 2014.
Confidential Property of Schneider Electric
Energy inflation is eating into product margins
161.4
103.6
75
100
125
150
175
2005 2006 2007 2008 2009 2010 2011 2012 2013 2014
Inflation rates of selected consumer products (Jan 2005 = 100)
Energy cost
Industrial goods inflation†
* Electricity, gas, solid fuels and heat energy †Non-energy industrial goods Source: EuroStat HICP (Apri 2014)
14
Schneider Electric – Global Solutions, Digital Energy - Michael MacKenzie – May 2014.
How do we deliver Energy Efficiency & Sustainability?
14
15
Schneider Electric – Global Solutions, Digital Energy - Michael MacKenzie – May 2014.
Confidential Property of Schneider Electric
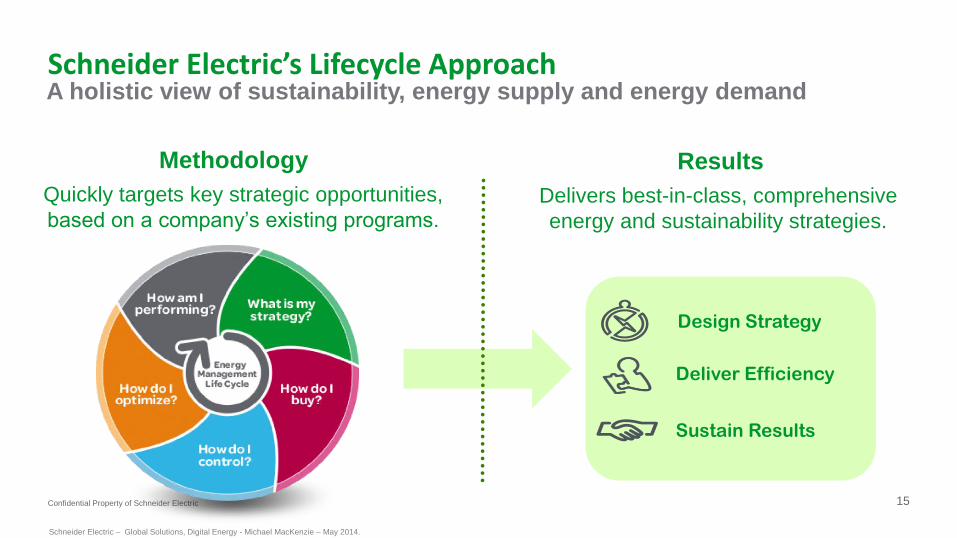
Schneider Electric’s Lifecycle Approach
Quickly targets key strategic opportunities,
based on a company’s existing programs.
Design Strategy
Deliver Efficiency
Sustain Results
Delivers best-in-class, comprehensive
energy and sustainability strategies.
A holistic view of sustainability, energy supply and energy demand
Methodology Results

16
Schneider Electric – Global Solutions, Digital Energy - Michael MacKenzie – May 2014.
16
How do we deliver Energy Efficiency projects?
Step 3: Look for improvements.
Discover the root cause of energy over-consumption in order to improve energy efficiency.
Energy Improvement &
Optimization
Step 4: Plan for sustainability.
Track opportunities and identify projects for continuous improvement.
Ste
p 1
: S
ite E
nerg
y A
ssessm
ent
Continuous Improvement
& Sustainability Strategies
Energy Awareness
Energy Improvement
Energy Performance
Step 2: Become energy aware.
Get a detailed view of the energy used in the process using energy aware infrastructures.
Energy Control &
Monitoring
What is happening? Why is that happening? How can we sustain it?

17
Schneider Electric – Global Solutions, Digital Energy - Michael MacKenzie – May 2014.
Confidential Property of Schneider Electric
Expected savings from Energy Efficiency projects
2%
Installation of meters
Source: Schneider best practices, US Department of Energy Metering Guide, Feb 2006
Increased employee awareness
3%
Bill allocation only
Improved awareness
10%
Facility tune-up
15% to 30%
Improved awareness, identification of O&M
improvements
Continuous improvement Action plans
Benchmarking, project improvements, continuous
attention
Visualization Optimization

18
Schneider Electric – Global Solutions, Digital Energy - Michael MacKenzie – May 2014.
Energy Supply & Procurement: Risk Advisory Services

19
Schneider Electric – Global Solutions, Digital Energy - Michael MacKenzie – May 2014.
Confidential Property of Schneider Electric
Energy costs across 110 sites
$1 Billion
30% of production cost are
energy costs
Real-time data
• •
Case Study: Creating an Energy Management Strategy Driving changes in operator habits for a Global pulp and paper manufacturer
Target Green House Gas
by 2015 globally Opportunity: energy cost
savings globally
Visualization at operator
and machine level with
powerful dashboards
5% $50m $1.5m $6m
Savings in energy costs
in 2012 @ first pilot
Expected 2013/14 additional
savings for 15 sites globally
Behavioral change
translates into immediate
savings
• Traditional structural changes
to save energy exhausted.
• New approach needed to
reach ambitious global CO2
goal Energy consumption is added to traditional KPIs
such as quality and output at plant floor level

20
Schneider Electric – Global Solutions, Digital Energy - Michael MacKenzie – May 2014.
Confidential Property of Schneider Electric
Energy Supply & Sustainability Services
Centralized point of contact
Leadership & guidance
Business needs analysis
Strategic plan development
Communication liaison
Load profiling
Energy contract optimization
Supplier negotiations
Market pricing analysis
Supplier review
Supply recommendations
Credit advisory
Roadmap planning
Carbon, water, waste reporting
Supply chain/life cycle analysis
Energy efficiency
Renewable/clean energy
Offset, credits, incentives
Carbon price forecasts
Tariff analysis
Rate comparisons
Utility negotiations
Tax exemptions
In-depth market analysis
Market outlooks
Proprietary forecasting
models
Risk Plan development
Hedging recommendations
Detailed position reporting
Tactical execution

21 Schneider Electric – Global Solutions, Digital Energy - Michael MacKenzie – May 2014.
Case Study: Risk Management & Strategic Procurement Helping a large construction company manage Diesel risk
Recommendations included a combination of options and swaps to hedge diesel risk for
a large construction company.
Large, publicly-traded construction company in the
western United States needed to manage its diesel
fuel risk exposure.
Used 5-6 million gallons of diesel annually at 15-20
sites.
Develop diesel risk strategy
Set business goals and options
Recommended a combination of options and
swaps to hedge diesel risk that typically covers
up to one year
Save 50 cent/gallon
for 3-4 months Avoided price hikes

22
Schneider Electric – Global Solutions, Digital Energy - Michael MacKenzie – May 2014.
Confidential Property of Schneider Electric
Easily identifiable energy
efficiency opportunities
Less obvious, higher impact:
Energy Efficiency through automated
process and machine efficiency.
It’s a big challenge for Industrial companies to gain the appropriate
knowledge about where to look for less obvious, higher impact
Energy Efficiency Opportunities.
23
Schneider Electric – Global Solutions, Digital Energy - Michael MacKenzie – May 2014.
Confidential Property of Schneider Electric
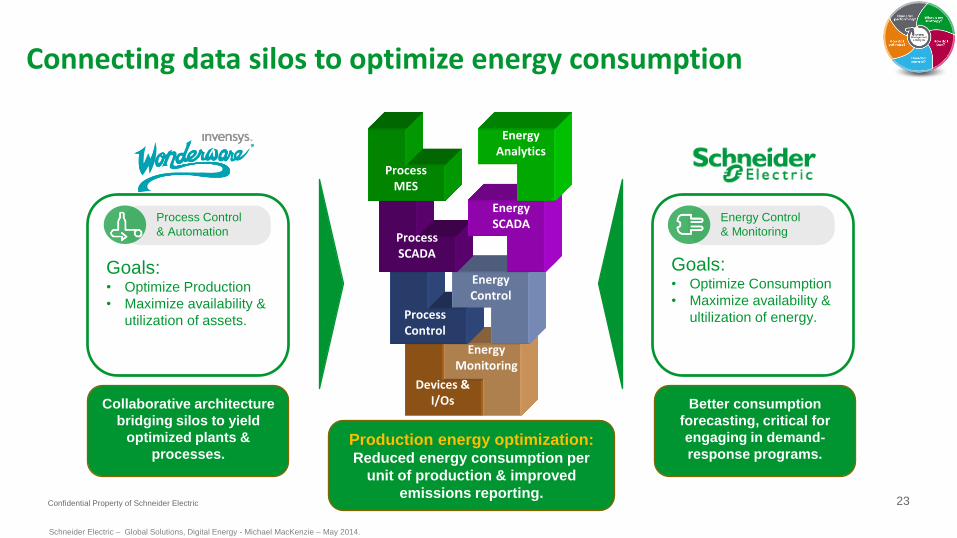
Goals: • Optimize Consumption
• Maximize availability &
ultilization of energy.
Collaborative architecture
bridging silos to yield
optimized plants &
processes.
Goals: • Optimize Production
• Maximize availability &
utilization of assets.
Connecting data silos to optimize energy consumption
Devices & I/Os
Energy Monitoring
Process Control
Energy Control
Process SCADA
Energy SCADA
Process MES
Energy Analytics
Production energy optimization: Reduced energy consumption per
unit of production & improved
emissions reporting.
Better consumption
forecasting, critical for
engaging in demand-
response programs.
Energy Control
& Monitoring
Process Control
& Automation

24
Schneider Electric – Global Solutions, Digital Energy - Michael MacKenzie – May 2014.
24
Example: Suggested ECM Summary
Opportunity Cost
1 Automate water pump VSD settings
No energy variation observed in water pumps with VSD in use.
High Potential
Reduce targeted pump energy consumption by
>15%
0
2 Improve Boiler 1 economizer
Poor maintenance of Boiler-1 economizer reduced inlet water temperature to
50°C from 70°C causing excess gas consumption of ~15% in November.
High Potential
Save up to 270k kWh of thermal energy per month
(~16%) on boiler gas use
$
3 Automate and Synchronize Ice water room pump VSDs with production
VFD’s in Ice water room pumps not synchronized with Production and constant
energy usage observed
Medium Potential
Reduce targeted pump energy consumption by
>10%
0
4 Install VSD on air compressors
Unloading time and energy usage in Comp1 and Comp 2 are 40~48% and 18%
and same can be avoided or reduced with VSD
Medium Potential
Reduce targeted compressor energy consumption by
>5%
$$
5 Install VSD on cold room auxiliary
Aux consumes ~1900 kWh per day. A VSD correlated with final production
could reduce consumption
Medium Potential
Reduce Auxiliary consumption by >10% $$
6 Interlock air compressor fan with compressor operation
Air compressor fan continuously operating even while compressor is off
Medium Potential
Save 42k kWh per month (~7%) of fan motor energy $
7 Balance load between Ammonia compressors
Little load on Ammonia cold water compressor-1. Transfer load to other
compressors.
Medium Potential
Save 88k Kwh per month (~3%) on compressor
energy
0
8 Use Boiler 3 as primary boiler for steam production
The energy intensity (kWh / ton of steam) of Boiler1 and 2 is much higher than
Boiler-3.
Medium Potential
Save 57k kWh of thermal energy (~3.5%) on boiler
gas
0

25
Schneider Electric – Global Solutions, Digital Energy - Michael MacKenzie – May 2014.
Confidential Property of Schneider Electric
When energy monitoring is combined
with automation and control
infrastructures, energy efficiency can
grow by as much as 30%.”

26 Confidential Property of Schneider Electric
ECM 1: Automate water pump VSD settings
> We found that water pump energy consumption remains the same even when
production changes substantially. Possible reason may be VSD bypassed (or) the
frequency set point inside VSD is wrong.
Savings: Potential 15% reduction in pump energy consumption.
Load profile for water pump consumption Nov 18-25 (blue) versus daily production (yellow line)

27
Schneider Electric – Global Solutions, Digital Energy - Michael MacKenzie – May 2014.
27
ECM 6: Interlock air compressor fan with
compressor operation • Establishing an interlock between the compressor and fan operation will ensure when
compressor is OFF the fan is also OFF.
Savings: Estimated annual savings for all the 6 Fan units is around 42000 kWh, 7.3% of Fan
total consumption
Fan working but compressor is OFF
Load profile for Air compressor 1 and Fan 1 showing period when compressor off, but fan still operating

28
Schneider Electric – Global Solutions, Digital Energy - Michael MacKenzie – May 2014.
Confidential Property of Schneider Electric
6.1M m3 sewage/year
120.000 EP
• Mechanical Treatment
• Primary Clarifier
• Biological Treatment
• Sludge Digesters
Energy Efficiency Control Loop Monitor, Optimize & Improve
Green Power
into public grid
Reduction in overall energy
consumption, while increasing
production
Energy consumption
to treat water
1996 - 90KWh/EP/a
2010 - 32KWh/EP/a
1996 use 3.6 GWh/a
2010 supply 6.1GWh/a
Case Study: Wastewater Treatment Plant in Austria Energy aware process evolves from energy consumer to green energy producer
20% 55%
Production Energy Usage
65% 6.1 GWh/a
KPI -KWh per EP/year Excess energy to grid
Purified Water
into local river
Bio Gas
for energy
generation

29
Schneider Electric – Global Solutions, Digital Energy - Michael MacKenzie – May 2014.
Confidential Property of Schneider Electric
How do I optimize?
Achieving Energy Efficient Process Control
> Hydraulic Modelling
> Reducing Network Pressure
> Savings
> Water Loss down 10+%
> Pumping Costs down 5-10%
> Issues Resolution Speed
> ROI <2 years

30
Schneider Electric – Global Solutions, Digital Energy - Michael MacKenzie – May 2014.
Energy Measurement Water, Air, Gas, Electricity & Steam
Metering > Schneider Power Meters
> Open Protocols > Modbus
> IEC 61850
> DNP
> IEC 60870
Process > Energy Management Library (ODVA)
> Heat Exchanger
> Air Compressor
> Flow Meters
> Gas Flow
> Diesel Flow
> Solid Fuels
> Electric Generators
> Electric Device (single or 3-phase)
> Power Meters
> Boilers
> Virtual Devices
ION PM8xx PM53xx

31
Schneider Electric – Global Solutions, Digital Energy - Michael MacKenzie – May 2014.
Energy Visualisation Dashboards, Reporting & Metrics

32
Schneider Electric – Global Solutions, Digital Energy - Michael MacKenzie – May 2014.
Confidential Property of Schneider Electric 32
Industrial
Energy Metrics
Contain
• Energy Consumption
• Per Time Period
• Per Production Unit
• Energy Targets
• Clearly defined objectives
• Scale of Achievement
• An analogue measurement for a
variable quantity
All Delivered in
Wonderware
Corporate Energy Manager

33
Schneider Electric – Global Solutions, Digital Energy - Michael MacKenzie – May 2014.
Confidential Property of Schneider Electric
Case Study (1/2): Thermal Energy Optimization of Pulp Dryers Driving changes in operator habits for a Global pulp and paper manufacturer
-
1.00
2.00
3.00
4.00
5.00
6.00
7.00
8.00
2.50 2.70 2.90 3.10 3.30 3.50
Tota
l The
rmal
Ene
rgy,
MM
Btu-
hr
Tons/Hr
Thermal Energy vs Production
WE Gas
Yankee Steam
DE Gas
Total
Power (WE Gas)
Power (Yankee Steam)
Power (DE Gas)
Power (Total)
Potential Savings:
60,780 MMBtu/year
3,706,974 kg/CO2
(*based on a conversion of 134.46 lbs CO2
per MMBTU)
Recommendation from initial assessment:
Reduce variability of Thermal energy by 1.5 standard deviations to 4.00 MMBtu/M.

34
Schneider Electric – Global Solutions, Digital Energy - Michael MacKenzie – May 2014.
Confidential Property of Schneider Electric
2
4
6
8
10
12
14
0:00 6:00 12:00 18:00 0:00
MM
Btu
/MT
Military Time of Day
Total Energy Use per MT vs Time of Day
03/16/2012
04/04/2012
Target
1) Operating below target before
major event.
2) Major production event
occurs.
3) Operating inefficiently post
production event.
Case Study (2/2): How did we achieve it? Using a continuous improvement approach called “Lean Energy Management”
Savings: $304,000 per year, per line (*based on estimate of $5 per MMBtu current/future price of Natural Gas)

35
Schneider Electric – Global Solutions, Digital Energy - Michael MacKenzie – May 2014.
35
A methodical approach helps to maintain savings over time and identify new areas of opportunity
Savings maintained with ongoing supervision and maintenance
Declining results without ongoing supervision and maintenance
Implement Energy Conservation Measure
Baseline Performance
Challenge: How are savings maintained over time?

36
Schneider Electric – Global Solutions, Digital Energy - Michael MacKenzie – May 2014.
Confidential Property of Schneider Electric 36
Premise
Energy = Effort
Same Action =
Same Effort
Different Energy =
Abnormal Situation P
roduction
Energy Consumption
Pumping System

37
Schneider Electric – Global Solutions, Digital Energy - Michael MacKenzie – May 2014.
Confidential Property of Schneider Electric
Energy Enabled
Operations
Compressed Air (10%)
● Common issues: equipment wear and air leakage
● Measure: Energy In, Air/Pressure Created, Air Used
● Discover: Reduced efficiency of compression
Leakages in air system
Pumping System
● Common issues: equipment wear, leakage/blockage
● Measure: Energy In, Pump Configuration, Liquid
Delivered
● Discover: Set point changes
Leakages/Blockages in pipe
Pumps in Manual operation
Drive
(Elec)
Air
Comp
Production
Cycle
Process
Energy
Compressor
Pump
Effectiveness
Air
Leakage
Detection
38
Schneider Electric – Global Solutions, Digital Energy - Michael MacKenzie – May 2014.
Confidential Property of Schneider Electric
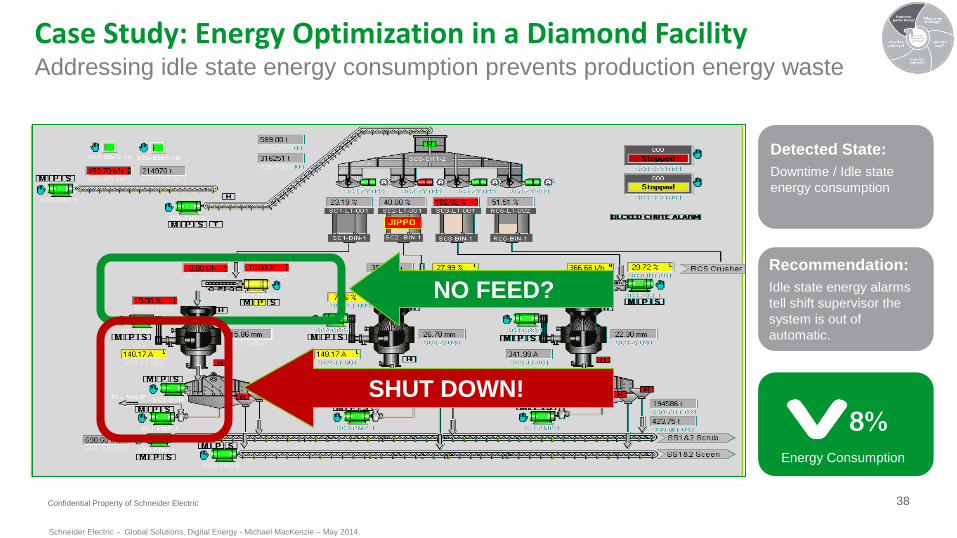
Case Study: Energy Optimization in a Diamond Facility Addressing idle state energy consumption prevents production energy waste
SHUT DOWN!
NO FEED?
8%
Energy Consumption
Detected State:
Downtime / Idle state
energy consumption
Recommendation:
Idle state energy alarms
tell shift supervisor the
system is out of
automatic.

39 Confidential Property of Schneider Electric
For more information
Christian-Marc Pouyez
Michael MacKenzie
Peter
Hogg
Kim Custeau

40
Schneider Electric – Global Solutions, Digital Energy - Michael MacKenzie – May 2014.
©2014 Schneider Electric. All Rights Reserved.
All trademarks are owned by Schneider Electric Industries SAS or its affiliated companies or their respective owners.
Related Documents