Scheduling for Parallel Supercomputing: A Historical Perspective of Achievable Utilization James Patton Jones 1 and Bill Nitzberg l MRJ Technology Solutions NASA Ames Research Center, M/S 258-6 Moffett Field, CA 94035-1000 nit zberg@nas • nasa. gov Tel: (650) 604-4513 Abstract The NAS facility has operated parallel supercomputers for the past 11 years, including the Intel iPSC/860, lntel Paragon, Thinking Machines CM-5, IBM SP-2, and Cray Origin 2000. Across this wide varie_ of machine architectures, across a span of 10 years, across a large number of different users, and through thousands of minor configuration and policy changes, the utilization of these machines shows three general trends: (1) scheduling using a naive FIFO first-fit policy results in 40-60% utilization, (2) switching to the more sophisticated dynamic backfilling scheduling algo- rithm improves utilization by about 15 percentage points (yielding about 70% utilization), and (3) reducing the maximum allowable job size further increases utilization. Most surprising is the con- sistency of these trends. Over the lifetime of the NAS parallel systems, we made hundreds, perhaps thousands, of small changes to hardware, software, and policy, yet, utilization was affected little, in particular, these results show that the goal of achieving near 100% utilization while supporting a real parallel supercomputing workload is unrealistic. 1. Work performed under NASA contract NAS2-14303. Moffett Field. CA 94035-1000

Welcome message from author
This document is posted to help you gain knowledge. Please leave a comment to let me know what you think about it! Share it to your friends and learn new things together.
Transcript

Scheduling for Parallel Supercomputing:
A Historical Perspective of Achievable Utilization
James Patton Jones 1 and Bill Nitzberg l
MRJ Technology Solutions
NASA Ames Research Center, M/S 258-6
Moffett Field, CA 94035-1000
nit zberg@nas • nasa. gov
Tel: (650) 604-4513
Abstract
The NAS facility has operated parallel supercomputers for the past 11 years, including the Intel
iPSC/860, lntel Paragon, Thinking Machines CM-5, IBM SP-2, and Cray Origin 2000. Across this
wide varie_ of machine architectures, across a span of 10 years, across a large number of different
users, and through thousands of minor configuration and policy changes, the utilization of these
machines shows three general trends: (1) scheduling using a naive FIFO first-fit policy results in
40-60% utilization, (2) switching to the more sophisticated dynamic backfilling scheduling algo-
rithm improves utilization by about 15 percentage points (yielding about 70% utilization), and (3)
reducing the maximum allowable job size further increases utilization. Most surprising is the con-
sistency of these trends. Over the lifetime of the NAS parallel systems, we made hundreds, perhaps
thousands, of small changes to hardware, software, and policy, yet, utilization was affected little, in
particular, these results show that the goal of achieving near 100% utilization while supporting a
real parallel supercomputing workload is unrealistic.
1. Work performed under NASA contract NAS2-14303. Moffett Field. CA 94035-1000

1.0 Introduction
The Numerical Aerospace Simulation (NAS) supercomputer facility, located at
NASA Ames Research Center, serves in the role of pathfinder in high perfor-
mance computing for NASA. In the late 1980s, we began exploring the use of
highly parallel systems for supporting scientific and technical computing
[Bai91]. Today, it is commonly accepted that "supercomputing" is synonyms
with "parallel supercomputing".
Supercomputing means running "big" jobs or applications which cannot be run
on small or average sized systems. "Big", of course, is a relative term; we gener-
ally consider a job "big" if it is using at least half of the available resources of a
"big" system. (We leave the definition of "big system" to the reader.)
Traditional vector supercomputers (e.g., the Cray C90) are capable of sustaining
nearly 100% utilization while supporting "big" jobs and running a varied work-
load [Car95]. Our experience has shown that this level of utilization is not attain-
able for running a supercomputing workload on a parallel supercomputer.
2.0 The NAS Parallel Supercomputing Workload
The NAS facility supports research and development in computational aero-
sciences. Hundreds of research projects are funded annually which use the paral-
lel supercomputers at NAS to perform high-end scientific and technical
computing. Over the past 11 years, the NAS parallel workload, priorities, and
approach have been consistent.
The workload consists of a mix of:
• 100's of users; new users are constantly added
• scientific and technical computing of aerospace applications
• code development, debugging, scaling and performance analysis
• "production" runs of existing applications
Most of the applications run at NAS are statically balanced (applications which
require a well-balanced load across all nodes). Statically balanced applications
strive to give an equal amount of work to each processor. A single slow process
in a statically load-balanced application can completely ruin the performance of
the application, as other processes will have to wait for it. Another issue arises
from message passing synchronization. Even if we overlay parallel jobs to avoid
load balancing problems, tightly synchronized applications can incur an extra
synchronization delay for messages because processes are not gang-scheduled
(scheduled to run at the same time across all their assigned nodes). These
restraints are consistent across typical parallel supercomputing workloads. (For
further discussion of parallel supercomputing workloads, see [WLMFN96].)

At the same time, the NAS schedulingpolicy hasconsistentlystrived for (inorder of priority):
1. Overnight turn-aroundfor"big" jobs,and2. Goodmachineutilization.
The first priority supports "supercomputing", the second supports efficient use of
resources. NAS supports supercomputing by favoring supercomputer-sized jobs
("big" ones, typically those that cannot run on any other system within NASA)
over smaller jobs. In general, the system configuration, user allocations, and
scheduling policies are tuned so that big jobs get overnight turn-around.
In apparent contrast to the first priority is the second. Good machine utilization
has historically meant 99% on traditional vector supercomputers, and the stake-
holders (those who's money purchased the machines) have traditionally used uti-
lization as a metric for success. As we show, parallel supercomputing does notachieve 99% utilization.
The system configuration and the mechanisms by which we let users run jobs,
has also been consistent throughout the past 11 years. The systems are all space-
shared (partitioned), and batch scheduled. Interactive use is permitted, but it
must take place by allocating resources via the batch system, then using those
resources interactively. This approach tO using parallel computers has prevailed,
despite the availability of good time sharing and gang-scheduling facilities on
several systems for two reasons: consistency of timings and efficiency of execu-
tion. Analysis of algorithms, exact megaflop rates and scaling, is a major compo-
nent of the NAS workload. Approaches other than strict, partitioned space
sharing, don't support this. Furthermore, systems such as the Inte! Paragon and
Cray Origin 2000 suffer from an interference problem, in which it is possible for
jobs to "overlap" in such a way as to slow each other down by far more than
would be expected by the simple sharing of resources.
3.0 Analysis of NAS Parallel Supercomputer Utilization
In this section we describe the hardware configuration of five NAS parallel
supercomputers and discuss batch job scheduling and utilization for each. (For a
discussion of batch job scheduling requirements for large parallel supercom-
puter, like those at NAS, see [STI'95].) During the analysis, several trends begin
to emerge. These are discussed as they become apparent in the data presented.
3.1 lntel iPSC/860 (Jan. 1990 to Sept. 1994)
The Intel iPSC/860 at NAS had 128 compute nodes (each with a single 40 MHz
i860 XR processor and eight megabytes of physical memory). The Network
Queueing System (NQS, [Kin85]) was used as the batch system, implementing
queue-level "first-in first-out first-fit" (FIFO-FF) scheduling with different size

priorities during the day (i.e. big jobs had priority at night, small jobs during the
day).
The FIFO-First-Fit algorithm works as follows: batch jobs are evaluated in FIFO
order in the queue, i.e. oldest job first. For each job, the batch system first
checked if there were enough nodes available to run the job, and if so, then com-
pared the job requirements (walltime and node count) to the current scheduling
policy. If either of these two checks failed, the scheduler skipped to the next job.If both are successful, the scheduler ran the job and removed it from the list. This
process continued until all the jobs were evaluated.
Scheduling on the iPSC/860 was relatively simple, as the system itself was very
inflexible. The architecture divided the system into "partitions" each of a power-
ofo2 number of nodes. Batch jobs were then run in the smallest possible partition
size. This made scheduling easier, but forced idle time when running medium
sized jobs. For example, a 65-node job could only run in a 128-node partition.
Since there was no time-sharing available, this forced the remaining 63 nodes to
be left idle. Furthermore, there existed a system limit of a maximum of ten con-
current partitions. This limit also had the potential for forcing idle time, even
when there was a backlog of work. For example, if the iPSCI860 was running ten
2-node jobs, the remaining 108 nodes would be idle. But given the typical job
size in the NAS workload, the maximum partition limit was rarely exceeded.
(The system ran out of nodes well before it allocated 10 partitions.)
Figure 1:iPSC/860 Utilization
100 ,
t-O
N
"O
O
z
8O
60
4O
2O
I
Jun.93
Weekly Node Utilization
.... 3-Month Average
,, \z
I
Jun.94 Auo.94

The iPSC/860was fairly unreliable during the first two years at NAS. The first
year the system was thoroughly investigated by NAS staff, during which time a
vadety of benchmarks were developed and run on the system. Figure 1 showsthe node utilization starting in mid-1993. (Full accounting data for the first twoyears is unavailable.) At the time, the utilization shown was considered an
impressive improvement over that of previous years, and is primarily attributable
to two factors. The first being a significant increase in system stability. Secondly,
in early 1993, users had begun to shift from application debugging to running
their codes as "production" batch jobs. Notice that the utilization ranged between
40 and 60 percent, for most of the period shown.
3.2 TMC CM-5 (Jan. 1993 to Mar. 1995)
The Thinking Machines Corporation's (TMC) CM-5 at NAS had 128 compute
nodes (each with one 33 MHz SPARC processor, four vector units, and 32 mega-
bytes of physical memory). The CM-5 was scheduled using the Distributed Job
Manager (DJM) which also implemented a size-priority FIFO-FF algorithm that
was time-of-day sensitive.
Figure 2:CM-5 Utilization
100 , ,
.o_
No--
oZ
<
80
60
40
20
0Feb.93
Weekly Node Utilization3-Month Average
t_
/-
// " I I
I I
/
/t"
i I _._/ _,\1
ii
/
!
/
/I
,,.J
/
I
/
/
s
J
Feb.94 Mar.95
Like the iPSC/860, the CM-5 architecture restricted all partitions to a power-of-2
number of nodes. However, the CM-5 further restricted the partition size to a
minimum of 32-nodes, and the partition size could not be changed without a
reboot of the entire system. During the day, the CM-5 was run with one 64-node
5
partition and two 32-nodepartitions. Eachnight, the systemwas reconfiguredinto a single128-nodepartitionto allow largejobs to run.
The CM-5 followed quite a different life-cycle comparedto the iPSC/860.Ini-tially only NAS staff hadaccessfor benchmarkingandevaluationpurposes,andto work to stabilize the system.But rather than taking severalyears like theiPSC/860,we hadto wait only severalweeksbeforeputting "real" userson.Fig-ure2 showshow quickly thescientistsput theCM-5 to work. Partof thereasonfor theshort ramp-upwasthatmostof theresearchersweremigratingto theCM-5 from the previousgenerationCM-200 (which had beenpreviously upgradedfrom a CM-2) at NAS. Many of theseusersalreadyhadcodesthat ranwell onthis architecture.
Like the iPSC/860muchof the CM-5's final year'susageincreasewasdue touserscompletingthedebuggingcycle,andmovingto running productioncodes.Halfway throughthe secondyearof the system'sstay at NAS, in aneffort toincreasethe utilization of the machine,spacesharingwas relaxedon the smallpartitionsduring the dayto allow twojobs to timesharewithin a givenpartition.Doing so resultedin a gradualincreaseof utilization,however,it soresultedin a20percentslowdownin both timesharedapplications.
3.3 Intel Paragon XP/S-15 (Feb. 1993 to July 1995)
The Intel Paragon XP/S-15 at NAS consisted of 208 compute nodes (each with
two 50 MHz i860 XP processors and 32 megabytes of physical memory). Using
NQS, we implemented queue-level FIFO-FF scheduling with different size pri-
orities, like on the iPSC/860. Scheduling the Paragon, however, was more diffi-
cult than the previous systems because power-of-2 job sizes were no longer
required. The resulting wide variety of job sizes decreased the scheduling effi-
ciency.
The Paragon, like the CM-5, had a relatively short shake-out period before we
started adding users onto the system. These were primarily users from the
iPSC/860 who wanted to try out the new system. Once on, many chose to return
to the iPSC/860 until the Paragon stabilized. Unfortunately, the system was
never completely stable.
The utilization shown in Figure 3 for the first half of 1993 is based on UNIX SAR
(system activity report) and load average data. Some data for 1993 was lost (thus
the apparent zero usage). Following this, the MACS accounting software was
installed, enabling more accurate utilization tracking. This is also the time when
the remaining iPSC/860 users began to migrate over to the Paragon in order to
continue their work. (Compare the iPSC/860 and the Paragon utilization graphs
in Figure 6 to more clearly see the drop in the older system corresponding to an
increase in the newer system.)
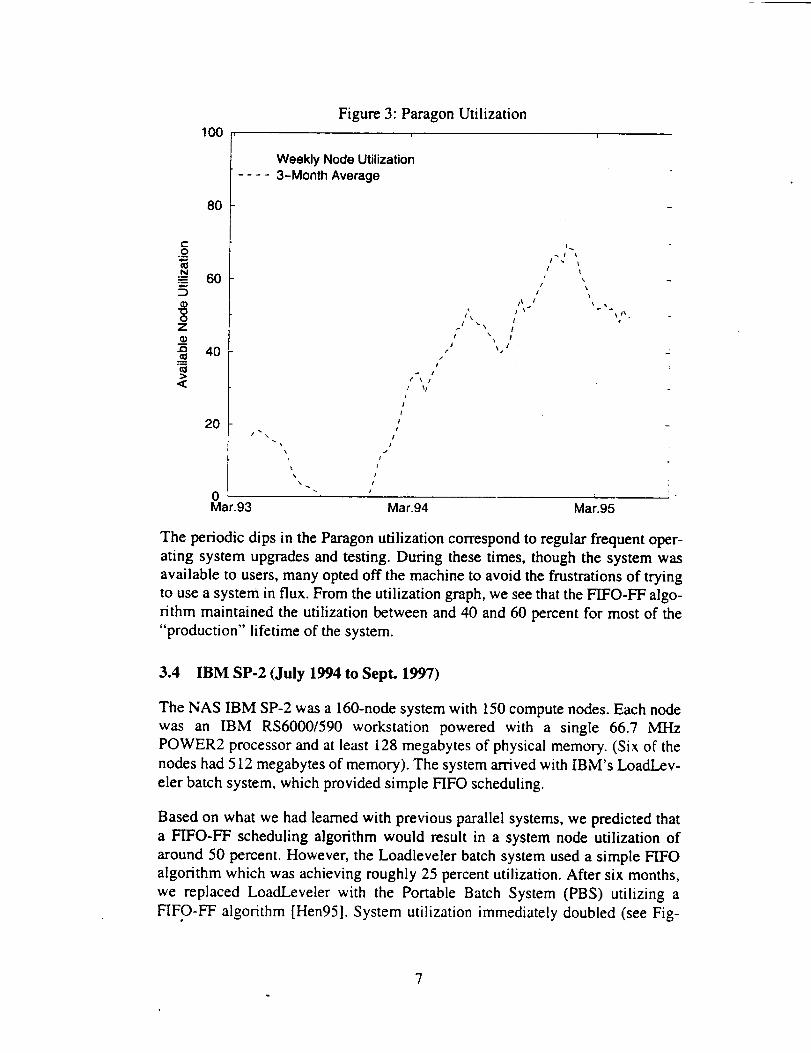
100Figure 3: Paragon Utilization
t-
.o
N
O2"OO
Z
e_
<
80
60
40
20
Weekly Node Utilization.... 3-Month Average
x
\
!
J
i
r % /
01 %/
!
I
I
!
i /
J/
/l
//
I I'I \
ii l
i% S
X41
% •
Mar.93 Mar.94 Mar.95
The periodic dips in the Paragon utilization correspond to regular frequent oper-
ating system upgrades and testing. During these times, though the system was
available to users, many opted off the machine to avoid the frustrations of trying
to use a system in flux. From the utilization graph, we see that the FIFO-FF algo-
rithm maintained the utilization between and 40 and 60 percent for most of the
"production" lifetime of the system.
3.4 IBM SP-2 (July 1994 to Sept. 1997)
The NAS IBM SP-2 was a 160-node system with 150 compute nodes. Each node
was an IBM RS6000/590 workstation powered with a single 66.7 MHz
POWER2 processor and at least 128 megabytes of physical memory. (Six of the
nodes had 512 megabytes of memory). The system arrived with IBM's LoadLev-
eler batch system, which provided simple FIFO scheduling.
Based on what we had learned with previous parallel systems, we predicted that
a FIFO-FF scheduling algorithm would result in a system node utilization of
around 50 percent. However, the Loadleveler batch system used a simple FIFO
algorithm which was achieving roughly 25 percent utilization. After six months,
we replaced LoadLeveler with the Portable Batch System (PBS) utilizing a
FIFO-FF algorithm [Hen95]. System utilization immediately doubled (see Fig-
7

ure 4), averaging 50 percent. This level of utilization continued the entire time
we used the FIFO-FF scheduler.
Figure 4:SP-2 Utilization
100
t-
O
t_
.N_
"O
O
z
0_>
<
8O
60
40
20
0 "_Jul.94
Weekly Node Utilization (FIFO-FF + DBF)
-- Weekly Node Utilization (FIFO-FF)
3-Month Average
!,i.LI ¸
,' Vlr
/ , :
r\
i •
//
I
I
I t
i tI
:J
;/
/
I1
/
/
i/
I
Jul.95
/i
Ii
\
As soon as we installed PBS, we began implementing a dynamic-backfilling
(DBF) algorithm [THJ98, FW98]. In the algorithm, the scheduler finds the high-
est priority job which should be scheduled next. The backfilling algorithm is
designed to efficiently drain the system, and to reserve nodes for the top-ranked
job. The First-Fit algorithm could continually take away nodes from a waiting
large job to run a smaller job. Draining the system is an expensive operation as a
large number of nodes may need to be kept idle to ensure that a particular job can
run. For example, suppose we want to run a 128-node job, but there are only 127
nodes available, and there is a 5-hour job running on the last node. We have to
keep 127 nodes idle for 5 hours to guarantee that this job will run. While this
simplistic approach works, it is obvious that it does not lead to the best system
utilization possible. A better solution is to have the scheduler recognize that we
will not be able run our job for 5 hours, but we can use the 127 nodes to run any
jobs that can complete in 5 hours, using a backfilling method. Static-Backfilling
fixes the starting time of the high-priority job at the earliest time possible (i.e.,
the earliest time when the required nodes will be available). In our previous
example, this was 5 hours. A Dynamic-Backfilling algorithm, rather than fixingthe time at the earliest time that it can, will instead determine the most appropri-
ate time to start the job within a starting window. The earliest time possible mayin some cases not lead to the best result. Using our previous example, let's

assumethat we had alsoa 125-nodejob (for 5 hours30 minutes)queued.Usingstatic-backfilling, we could notrun this job aswe only have5 hoursto backfill.But with dynamic-backfilling,we should recognizethat by shifting the startingtime by 30 minutes,we will be ableto fill 125nodes,significantly increasingresourceutilization. TheDynamic-Backfilling algorithmattemptsto continuallybalanceboth theneedto runhigh-priorityjobs, andtheneedto maintainasmanynodesaspossiblein-use.
Approximately two monthsafter installing PBS, its FIFO-FF schedulermodulewas replacedwith the DBF schedulermodule.(This DBF schedulingmoduleisnow includedin thePBSdistribution.)Systemutilization againjumped,this timeroughly 20 percentagepoints, to 70 percent.Over time, asusersbeganto runfewerdebuggingjobs, andstartedscalingup the problemsizeof theircodes,theutilization slowly creptup to 80percent.The systemcontinuedatthis level untilit wasallocatedto the NASA Metacenterproject, which substantiallychangedtheusage,schedulingmodelandworkloadflow of thesystem.(Discussionof theMetacenter project and its scheduling experiments is included in [Jon96,Jon97].)
3.5 Cray Origin2000 (Jan. 1997 - )
In January 1997, NAS received its first 32-processor SGI Origin2000. (System
larger than 32-processors receive the "Cray" label.). The Origin2000 is a distrib-
uted shared memory (DSM) system, with each building block being a "node
board". Each node board in an Origin2000 possess two MIPS RISC RI0000 64-
bit processors, and a configurable amount of memory (512 MB on the NAS sys-
tems). Each node is attached to a modified hypercube network.
One of the most useful features of the Origin2000 is the single system image.
Users can utilize the system as a large SMP rather than having to be concerned
with the distributed nature of the architecture. So when the system first arrived,
we decided to see if we could schedule it like a true timeshared symmetrical mul-tiprocessor (SlVlP). We installed PBS with a FIFO-FF SMP scheduler that we had
been running on several Cray J90s. Even with its single system image, trying to
schedule this distributed memory system quickly proved problematic, as the
interference between jobs resulted in severe performance degradation and varied
runtimes. We quickly turned to another solution. We switched to software parti-
tioning of the system, where we assigned sets of processors to specific partitions.
Each partition was assigned an SGI NODEMASK which identified which nodes
belonged to that partition. (A NODEMASK is similar to a "processor set", except it
is node-based rather than CPU-based. While not a perfect solution, the NODE-
MASK capability proved quite functional, even though it was only advisory to the
kernel. Some of this functionality will be made available in the SGI MISER ker-
nel scheduler.)
9

In March 1997,wedoubledthesizeof ourOrigin2000system,creatinga64-pro-cessorparallel supercomputerrunning undera single systemimage. Figure 5showstheutilization startingwith the installationthis system..
Figure5:Origin2000 Utilization
100
r-
._o
._N_ 605
0
z
x_ 40
<
80
20 /
o 'Ma' '.97
64-CPU Two 64-CPU
System Systems
FI
i/\,ij ',
I I
__o
J_ rJ
I
, !
,r
Weekly Utilization (FIFO-FF + DBF)
---- Weekly Utilization (FIFO-FF)
.... 3-Month Average
Mav.98
We scheduled each of the partitions within the Origin2000 as we did on the pre-
vious parallel systems. Figure 5 shows the system utilization that resulted: a
rough average of 35 percent. From our previous experience, we predicted adding
dynamic backfilling to the scheduling algorithm would add another 20 percent-
age points to the utilization. Our prediction was again borne out: average systemutilization increased from about 35 percent to about 55 percent. Nearly a year
later NAS purchased a second 64-processor Origin2000 system. Rather than
being run as a separate system, it was configured to share the workload of the
first system.
Another trend we have noticed is that if you reduce the size definition of "big
jobs" in relation to the maximum number of nodes available, utilization will
increase. We predicted that by adding this second 64-processor system to the
compute pool (thereby doubling the number of processors available for computa-
tion) but maintaining the maximum job size at 64-processors, utilization should
increase. We were surprised at how smoothly the utilization curve in Figure 5
transitioned between doubling the resources, without increasing the maximum
job,size.
10
[Note to reviewers: Figure 5 ends at the point of installation of two additional
128-processor Origin2000 systems. Given that the full user base was not givenimmediate access, there is insufficient data to make a fair comparison between
these new system and those already reported. However, by mid-November, thesetwo system were merged into the first 256-processor Origin2000, and the fullNAS parallel system user base was given access. By the due date for the final
draft of this paper, there will be sufficient data to present, with a 12-week float-
ing average, the utilization of that system as well. Preliminary data indicates that
previously mentioned trends will be borne out with this system as well.]
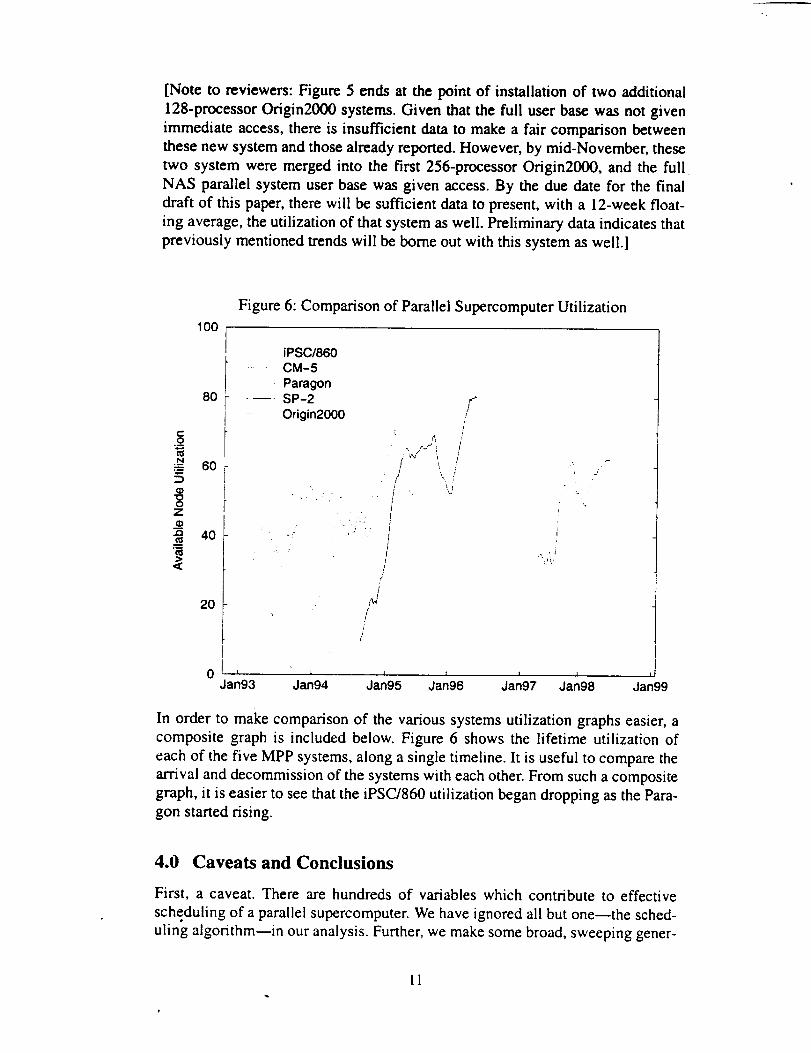
Figure 6: Comparison of Parallel Supercomputer Utilization
100
e-
._ot_N
(D
z_oe_
>
<:
80
60
40
20
0Jan93
iPSC/860CM-5ParagonSP-2
Origin2000
<- ,
:s "
I
/?
/
/-/i
!
F
!
II
",t_'
, /
I I t I I
Jan94 Jan95 Jan96 Jan97 Jan98
,IJan99
In order to make comparison of the various systems utilization graphs easier, a
composite graph is included below. Figure 6 shows the lifetime utilization of
each of the five MPP systems, along a single timeline. It is useful to compare the
arrival and decommission of the systems with each other. From such a composite
graph, it is easier to see that the iPSC/860 utilization began dropping as the Para-
gon started rising.
4.0 Caveats and Conclusions
First, a caveat. There are hundreds of variables which contribute to effective
scheduling of a parallel supercomputer. We have ignored all but one--the sched-
uling algorithm--in our analysis. Further, we make some broad, sweeping gener-
11

alizations, which are heavily dependenton the user workload of the system.Although experiencehasshownthatthe NAS facility is aprototypicalsupercom-puting center,oneshouldnot totally discountthe possibility thatthe uniquefea-turesof this facility contributeto theseresults.
Data gatheredover I1 yearsoperating parallel supercomputers(including theIntel iPSC/860,Intel Paragon,Thinking MachinesCM-5, IBM SP-2,and CrayOrigin 2000)showsthreedistincttrends:
• schedulingusinganaiveFIFO first-fit policy resultsin 40-60%utiliza-tion,
• switching to the more sophisticateddynamic backfilling schedulingalgorithm improvesutilization by about 15percentagepoints (yieldingabout70%utilization), and
• reducingthemaximumallowablejob sizeincreasesutilization.
Most surprisingis theconsistencyof thesetrends.Over the lifetime of theNASparallel systems,we madehundreds,perhapsthousands,of small changestohardware,software,andpolicy. Yet, utilization wasaffectedlittle. In particular,theseresultsshowthatthegoalof achieving100%utilization while supportingareal parallel supercomputingworkload is currently unrealistic...andit doesn'tmatter what systemyou use,or who your usersare,or exactly the methodusedfor partitioningresources.
5.0 Future Work
The "goodness" of a scheduling algorithm and policy is hard to quantify.
Although utilization is the best metric available, it is still inadequate. Utilization
does not take into account properties of the workload which, even if optimally
scheduled, would not give 100% utilization. Such workload parameters as job-
size mix, arrival rate of jobs, efficiency of applications, etc., are ignored. A better
metric is needed. The utilization we report is simply the amount of time proces-
sors are assigned out of the total time processors are available (i.e., we only
ignore system down time). We would like to refine utilization to be based not on
the total uptime of a system, but on the optimal scheduling of the given work-load.
Seven years of job accounting data for five different parallel supercomputers is a
lot of data; we have only scratched the surface. We would like to analyze "big"
job turn-around times in a similar fashion as we have done for utilization. Fur-
ther, we would like to investigate correlations between system stability (crashes),
user load, turn-around time, workload characteristics, utilization, and, if possi-
ble, system culture (e.g., night time vs. day time, conference deadlines, etc.).
12

6.0 References
[Bai91] David H. Bailey, Experiences with Parallel Computers at NASA�Ames
NAS Technical Report RNR-91-007, NAS Facility, NASA Ames
Research Center, February 1991.
[Car95] Nick Cardo, Batch Scheduling: A Fresh Approach, in Proceedings of
Cray's User Group Conference, March 1995.
[FW98] Dror Feitelson and A. Mu'alem Weil, Utilization and Predictability in
Scheduling the IBM SP2 With Backfilling, in Proceedings of 12th Inter-
national Parallel Processing Symposium., pp. 542-546, Apr 1998.
[Hen95] Robert Henderson, Job Scheduling Under the Portable Batch System, in
Proceedings of the Workshop on Job Scheduling Strategies for Par-
allel Processing, Santa Barbara, CA, April 24-29 1995.
[Jon96] James Patton Jones, The NASA SP2 Metacenter, in Proceedings of the
Computational Aerosciences Workshop, High Performance Comput-
ing and Communication Program, NASA Ames Research Center, August1996.
[Jon97] James Patton Jones, Implementation of the NASA Metacenter: Phase 1
Report, NAS Technical Report NAS-97-027, NAS Facility, NASA
Ames Research Center, October 1997.
[Kin85] B. Kingsbury, The Network Queuing System, Sterling Software, Palo
Alto, 1985.
[STT95] Bill Saphir, Leigh Ann Tanner and Bernard Traversat, Job Management
Requirements for NAS Parallel Systems and Clusters, in Proceedings of
the Workshop on Job Scheduling Strategies for Parallel Processing,
Santa Barbara, CA, April 24-29 1995.
[THJ98] Bernard Traversat, Ed Hook and James Patton Jones. A Dynamic-Back-
filling Algorithm for Efficient Space-Sharing Scheduling on an IBM SP2,
NAS Technical Report NAS-98-101, NAS Facility, NASA Ames
Research Center, November 1998.
[WLMFN96] K. Windisch, Virginia Lo, R. Moore, Dror Feitelson, and Bill
Nitzberg, A Comparison of Workload Traces From Two Production Par-
allel Machines, in Proceedings of 6th Synp. Frontiers of Massively
Parallel Computing, pp. 319-326, Oct 1996.
13
Related Documents


