toprobe Scanning Confocal Raman Microsc D e s i g n e d b y D r . P r a n a v R a t h i

Welcome message from author
This document is posted to help you gain knowledge. Please leave a comment to let me know what you think about it! Share it to your friends and learn new things together.
Transcript
Actoprobe Scanning Confocal Raman Microscope
Designed by Dr. Pranav Rathi

Laser
RamanSpectrometer
Optics: Beam expander & mirrors
Confocal Microscope setup
AFM
Illuminator side
Microscope side
Top view of Confocal Raman AFM system design

Illuminator
Confocal Microscope
Laser RamanSpectrometer
Optics: Beam expander & mirrors

Microscopeplatform
Illuminatorplatform
AFMy
z
xy
zx
yz
x
f r
xy
s
s
s
s
ss
M M

Illuminator
Confocal Microscope
Laser RamanSpectrometer
Optics: Beam expander & mirrors M1
M2

Laser inlet
Signal outletRight channel (arm)
Left channel (arm)
Camera
White light inlet
High NA objective
Sample plane
Laser light couple (fiber coupler optional)
5 to 100um apertures
Lens
Confocal microscope Illuminator
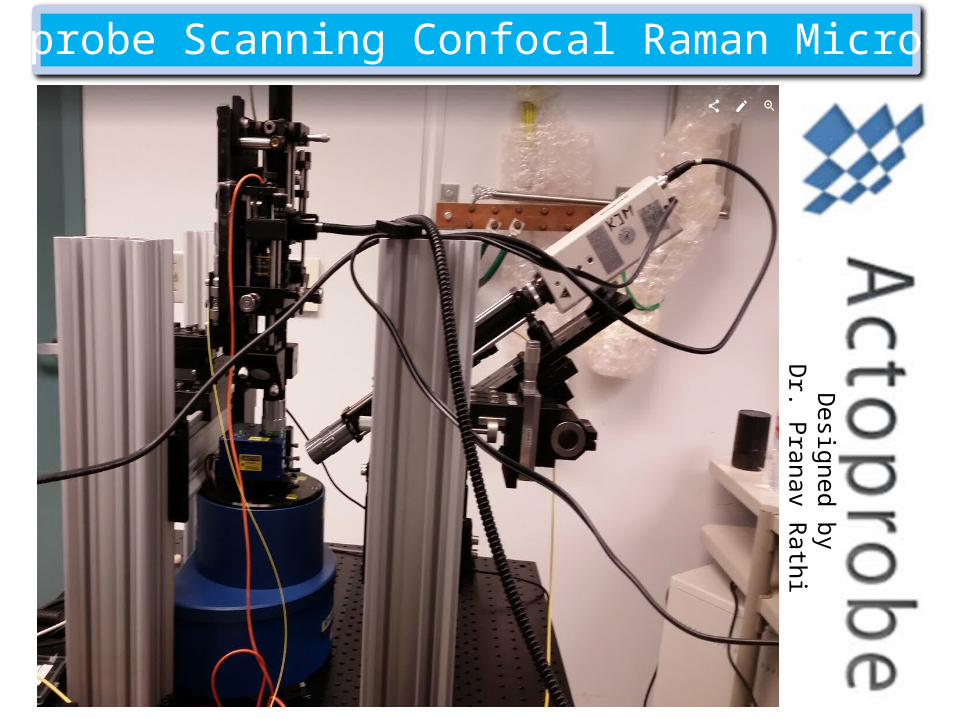
AFM sample loading unloading schemeSample
loading area

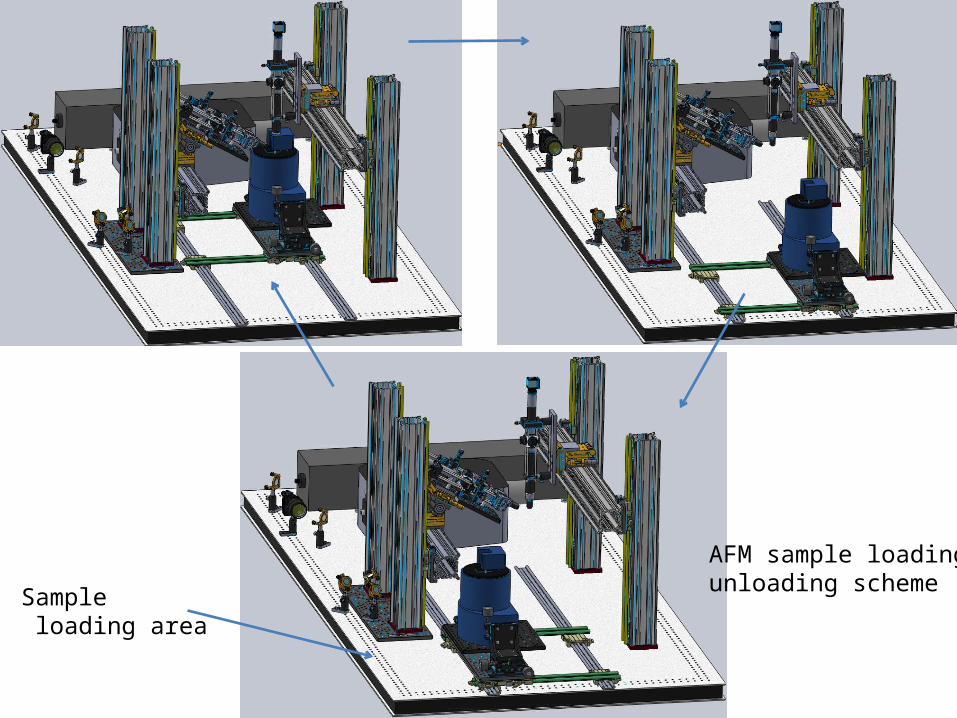
Confocal Raman AFM System Working
Illumination Channel
Detection ChannelAFM
9
Special AFM probes
Extended Z-range AFMMicro-Raman FPA Spectra
SLS FPA
Confocal Optical
5μm SLS FPA
AFMWorking Principle

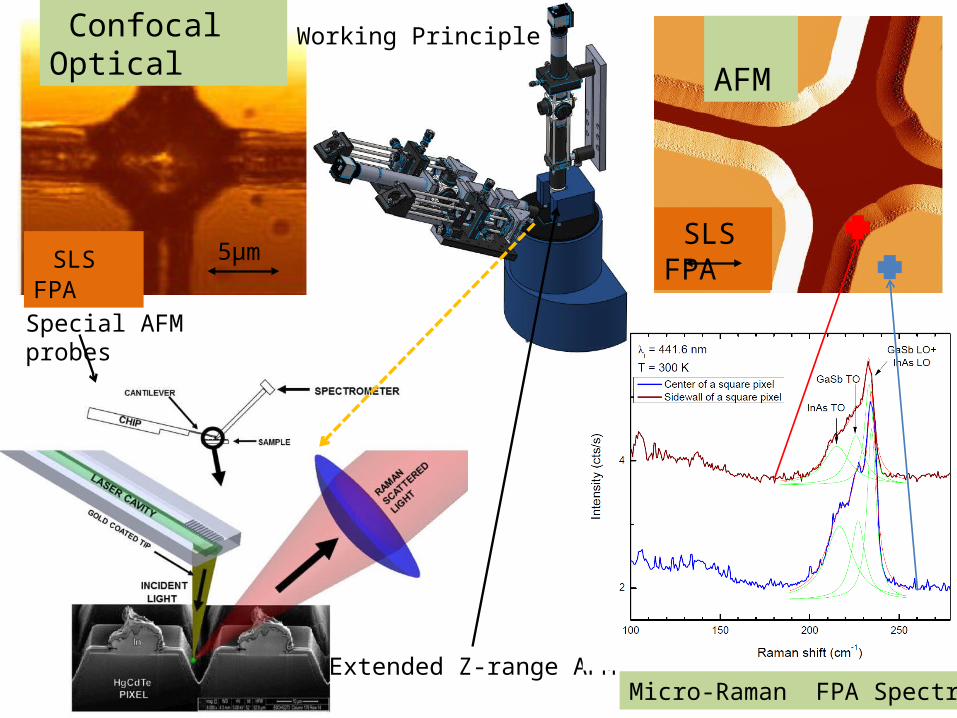
Data
Confocal images of FPA with 6.7-µm deep trenches (left). The image size is 18 µm x 18 µm. The sample is scanned at different depths starting from the pixel top. The dashed lines (different colors) inside the figures correspond to the cross sections used to create the FPA side wall profile (right). Each data point in the profile corresponds to one of the dashed lines in the confocal image. This is illustrated by the different colors. The data suggests the resolution to be better than 50 nm lateral and 150 nm vertical.
Related Documents