Scandinavian Management Model as Competitive Advantage in Attracting Qualified Foreign Labour Dr Maria Vrabcova Hardager, Norway 3 June 2010

Scandinavian Management Model as Competitive Advantage in Attracting Qualified Foreign Labour Dr Maria Vrabcova Hardager, Norway 3 June 2010.
Dec 24, 2015
Welcome message from author
This document is posted to help you gain knowledge. Please leave a comment to let me know what you think about it! Share it to your friends and learn new things together.
Transcript

Scandinavian Management Model as Competitive Advantage in Attracting
Qualified Foreign Labour
Dr Maria Vrabcova
Hardager, Norway
3 June 2010
• Overview of Norway’s economic environment
• Population growth and net migration
• Theory of migration
• Overview of Scandinavian Management Model
• How does the Model compare with other countries?
• What can we learn from other countries?
• Conclusion
Agenda
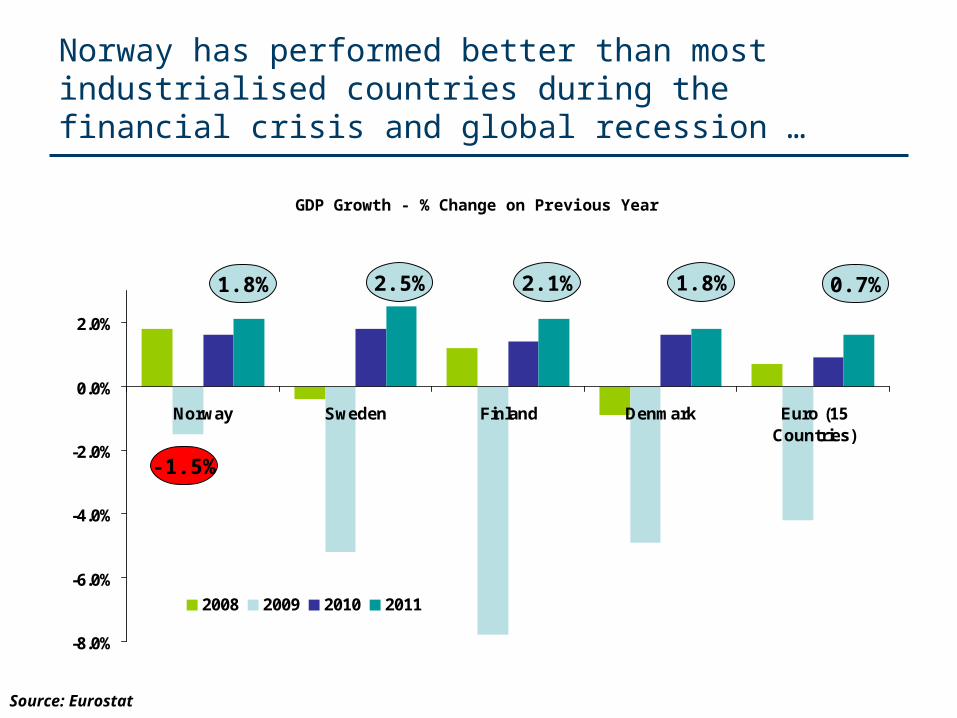
Norway has performed better than most industrialised countries during the financial crisis and global recession …
GDP Growth - % Change on Previous Year
-8.0%
-6.0%
-4.0%
-2.0%
0.0%
2.0%
Norway Sweden Finland Denmark Euro (15Countries)
2008 2009 2010 2011
2.5%1.8% 1.8% 0.7%2.1%
-1.5%
Source: Eurostat

…and unemployment rate remains well below that of Europe and the rest of Scandinavia
0.0%
1.0%
2.0%
3.0%
4.0%
5.0%
6.0%
7.0%
8.0%
9.0%
10.0%
Apr-09 May-09
Jun-09
Jul-09 Aug-09
Sep-09
Oct-09 Nov-09
Dec-09
Jan-10
Feb-10
Mar-10
Euro Area Denmark Finland Sweden Norway
Source: Eurostat, Norway Statistics

Norway’s surpluses from oil & gas revenues will ensure that any protracted slow down will leave enough room for the government to increase stimulus measures…
-12.0%
-10.0%
-8.0%
-6.0%
-4.0%
-2.0%
0.0%
Norway
Sweden
Denm
ark
Finla
nd
France
Germ
any
UK
Austra
lia
Japan US
Singap
ore
Net Surplus (+) / Deficit (-) as a % of GDP 2010 forecast
Source: IMF
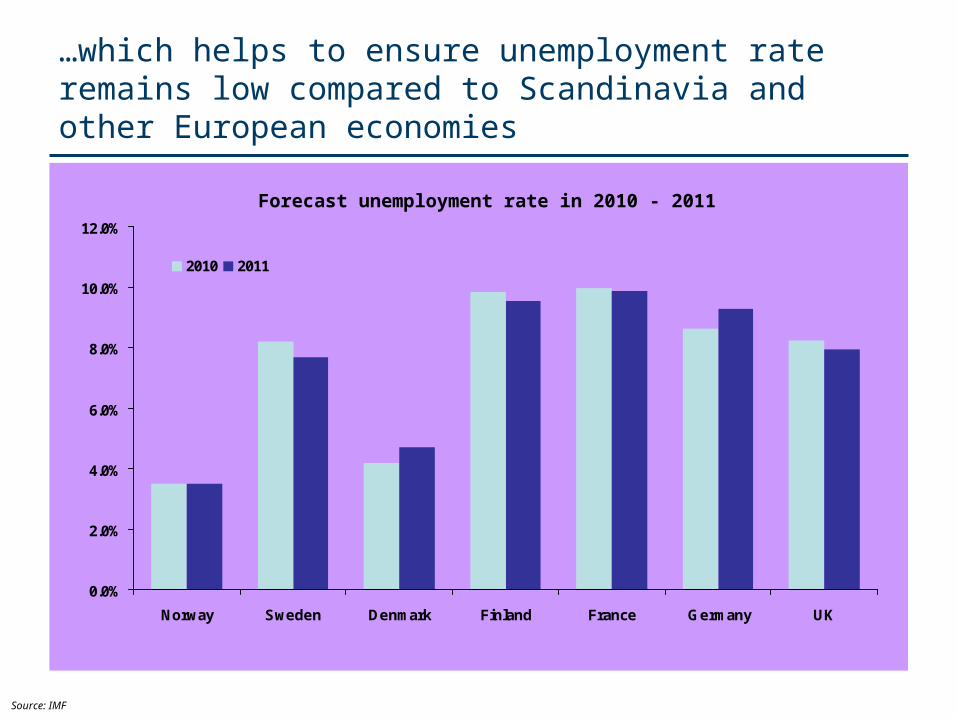
…which helps to ensure unemployment rate remains low compared to Scandinavia and other European economies
Forecast unemployment rate in 2010 - 2011
Source: IMF
0.0%
2.0%
4.0%
6.0%
8.0%
10.0%
12.0%
Norway Sweden Denmark Finland France Germany UK
2010 2011
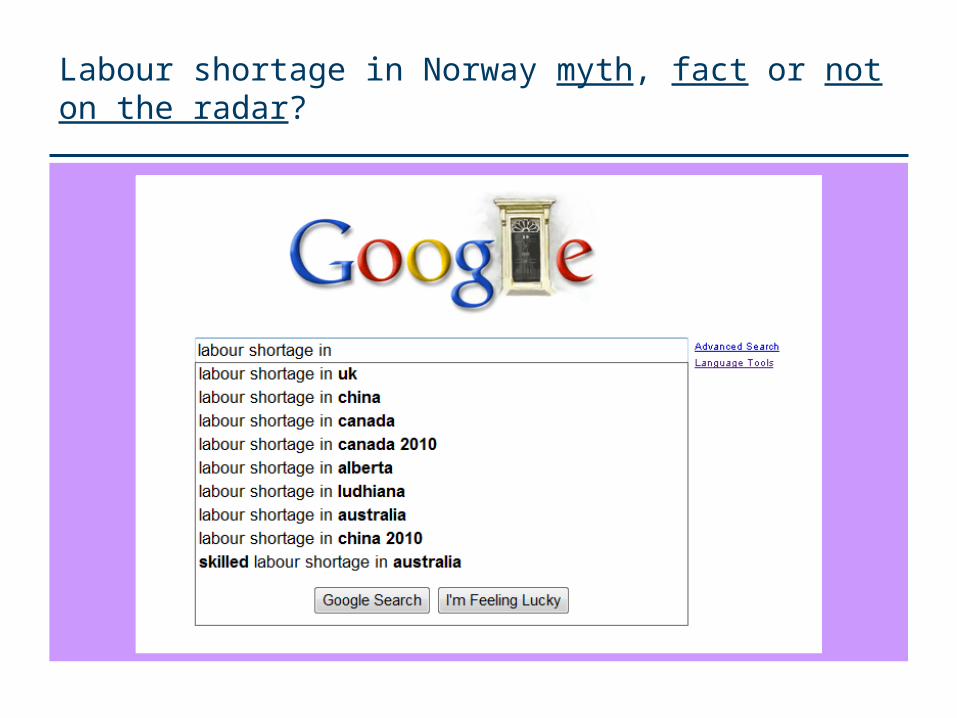
Labour shortage in Norway myth, fact or not on the radar?
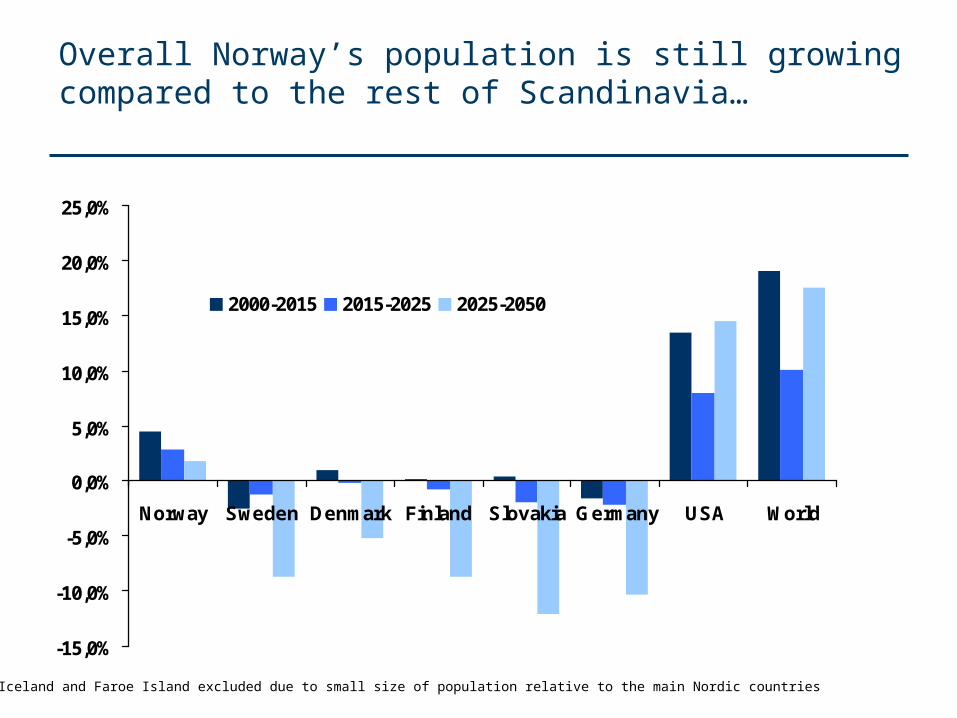
Overall Norway’s population is still growing compared to the rest of Scandinavia…
Greenland, Iceland and Faroe Island excluded due to small size of population relative to the main Nordic countries
-15,0%
-10,0%
-5,0%
0,0%
5,0%
10,0%
15,0%
20,0%
25,0%
Norway Sweden Denmark Finland Slovakia Germany USA World
2000-2015 2015-2025 2025-2050
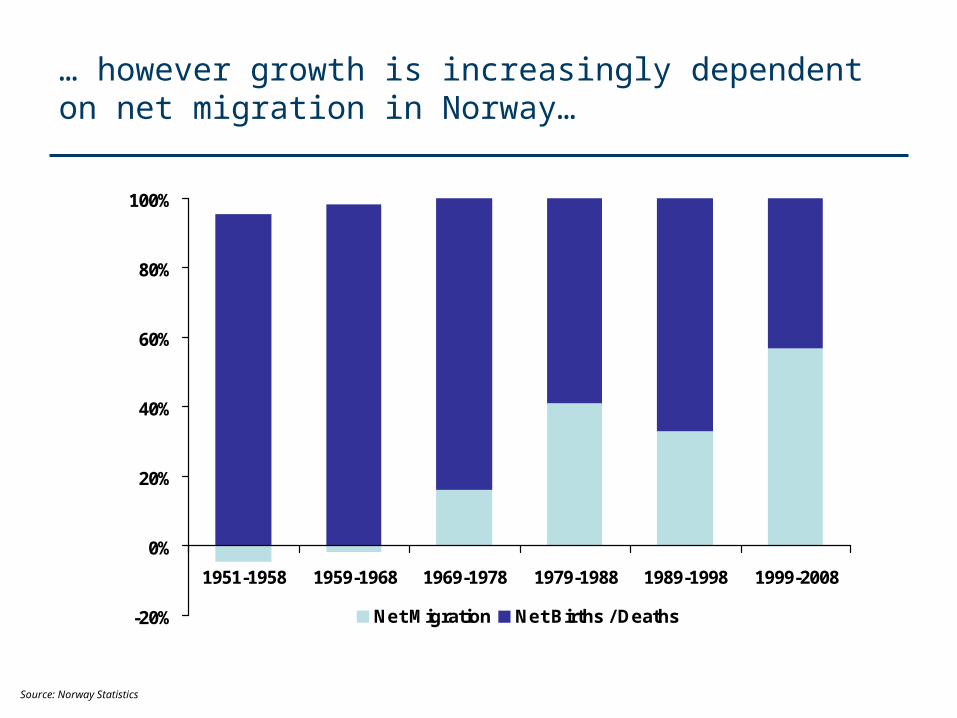
… however growth is increasingly dependent on net migration in Norway…
-20%
0%
20%
40%
60%
80%
100%
1951-1958 1959-1968 1969-1978 1979-1988 1989-1998 1999-2008
Net Migration Net Births / Deaths
Source: Norway Statistics

…this growth has accelerated in recent years due to EU enlargement in 2004…
Source: Norway Statistics

…and Norway has benefitted from a large influx of Polish immigrants
12
3
4
Source: Norway Statistics

Norway has the highest fertility rate in Scandinavia, however it remains below World average
0.00
0.50
1.00
1.50
2.00
2.50
3.00
Norway Sweden Denmark Finland World
2000-2005 2005-2010
Source: UN, http://en.wikipedia.org/wiki/List_of_countries_and_territories_by_fertility_rate
Fertility Rate – Births / Woman

In summary, population management is complex and requires well considered strategically long term policies
• Norway benefited from EU enlargement in 2004 (less skilled workers)
• Current high levels of unemployment in Northern Europe and neighbouring countries should make it easier to attract labour in the short term
• Longer term Norway may need to diversify its immigrant base to consider nationals outside of Europe
Key Points:
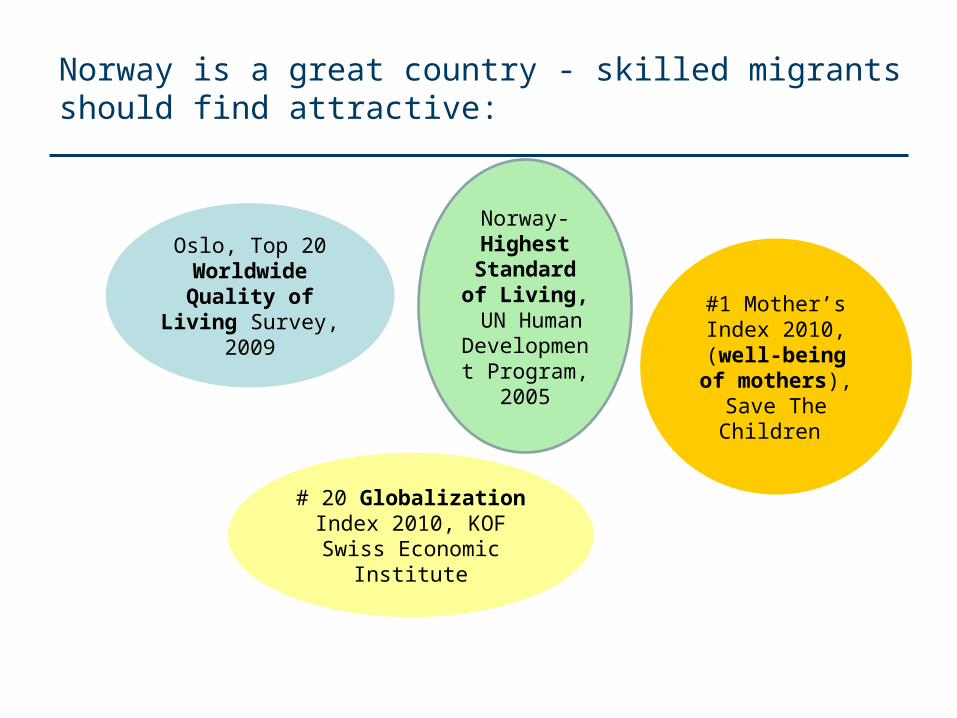
Norway is a great country - skilled migrants should find attractive:
Oslo, Top 20 Worldwide Quality of Living Survey,
2009
# 20 Globalization Index 2010, KOF Swiss Economic Institute
#1 Mother’s Index 2010, (well-being
of mothers), Save The Children
Norway- Highest
Standard of Living,
UN Human Development
Program, 2005
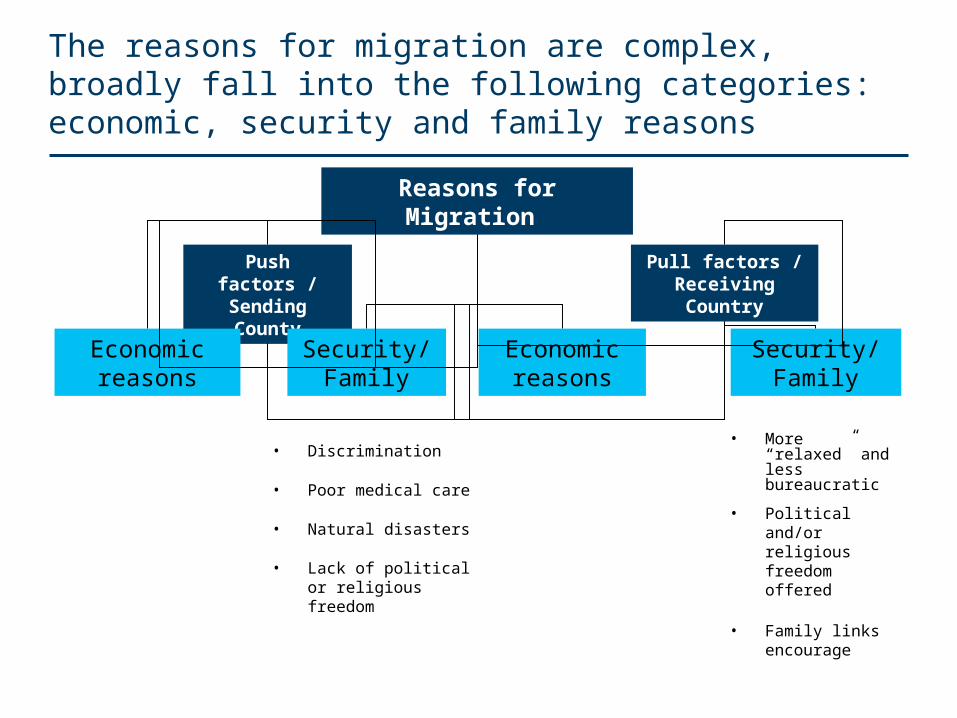
The reasons for migration are complex, broadly fall into the following categories: economic, security and family reasons
Reasons for Migration
Push factors / Sending County
Pull factors / Receiving Country
Economic reasons
Security/ Family
Security/ Family
Economic reasons
• Discrimination
• Poor medical care
• Natural disasters
• Lack of political or religious freedom
• More “relaxed” and less bureaucratic
• Political and/or religious freedom offered
• Family links encourage
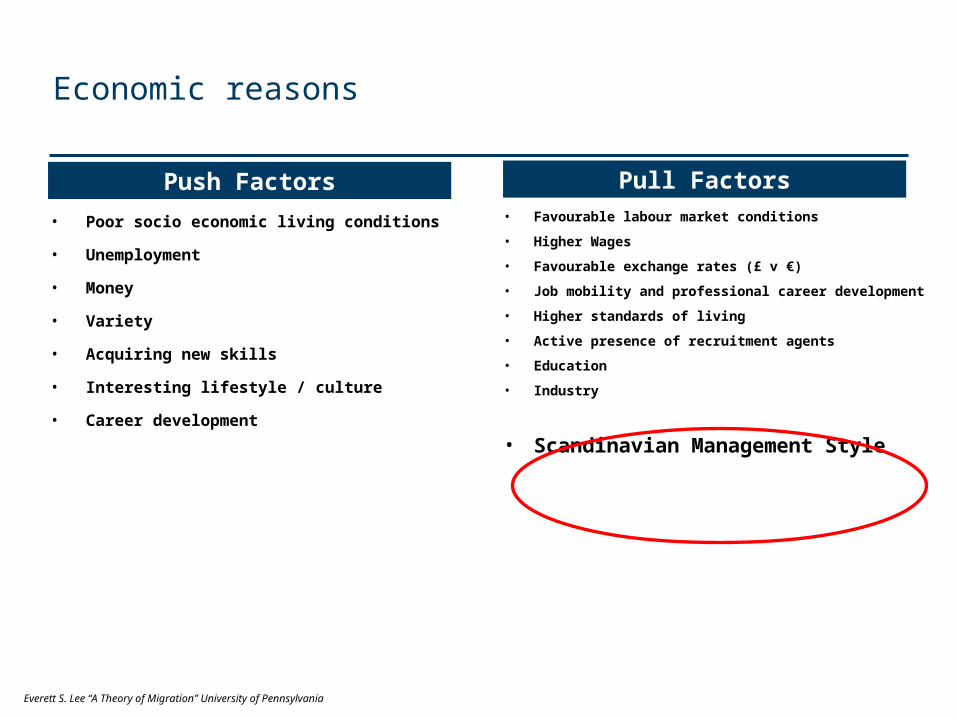
Economic reasons
• Favourable labour market conditions
• Higher Wages
• Favourable exchange rates (£ v €)
• Job mobility and professional career development
• Higher standards of living
• Active presence of recruitment agents
• Education
• Industry
• Scandinavian Management Style
• Poor socio economic living conditions
• Unemployment
• Money
• Variety
• Acquiring new skills
• Interesting lifestyle / culture
• Career development
Push Factors Pull Factors
Everett S. Lee “A Theory of Migration” University of Pennsylvania

So what are the main forms of Management Styles? US style dominates and sets the global management agenda, however Scandinavia is growing in popularity
• Shareholder Capitalism – “Happy Customers Make Happy Owners”
US Management Style
Customers Shareholders Employees Society
Global Competiveness Report 2004, World Economic Forum, Monday Morning Dec 2009
Scandinavian Management Style
Employees Shareholders Customers Society
• Stakeholder Capitalism – “Happy Employees Create Products which Meet Customers Demand”
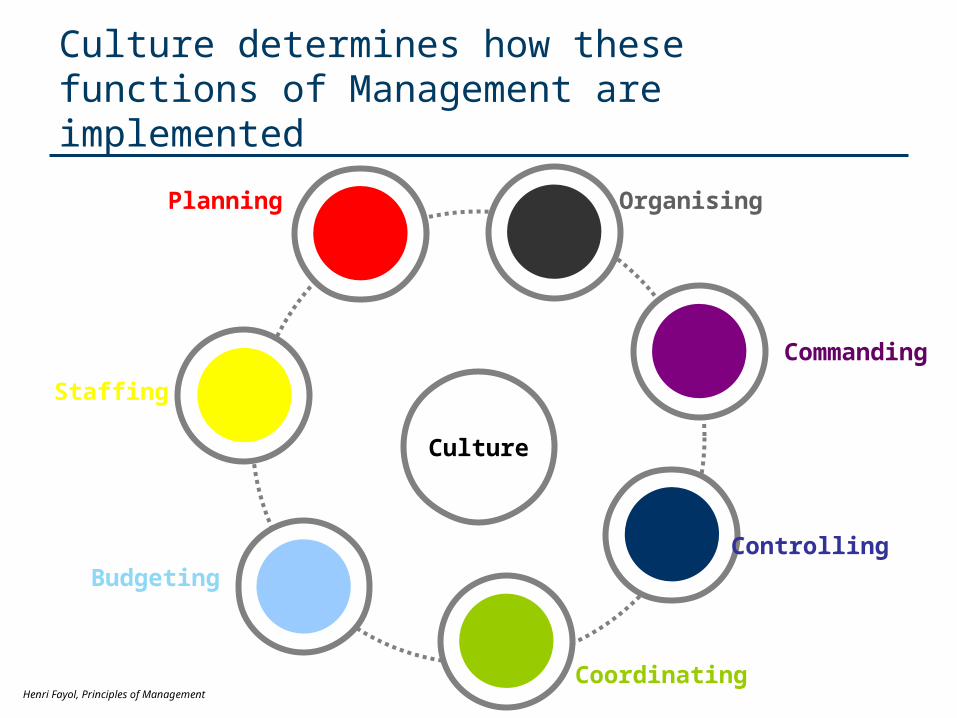
Culture determines how these functions of Management are implemented
Henri Fayol, Principles of Management
Controlling
Commanding
OrganisingPlanning
Coordinating
Staffing
Budgeting
Culture

Culture determines the approach to how each area of management is implemented
US Scandinavia
• Employers and employees divided • Mutual need between employers and employees
Planning
Controlling
Commanding
• Significant control from centre• Control is “expected”
• Empowered• Delegated authority• Decision making process collective and inclusive
• Management lead by example• Authoritarian
• Employees have influence and independence• Autonomous project groups• Low trust of authorities
Staffing • Pay decisions are set by management• Wide variation in pay scales
• Employers and Trade Unions work together to agree wage settlements – from a position of mutual respect and dialogue
Organising • Hierarchical • Flat
Source: Copenhagen Business School
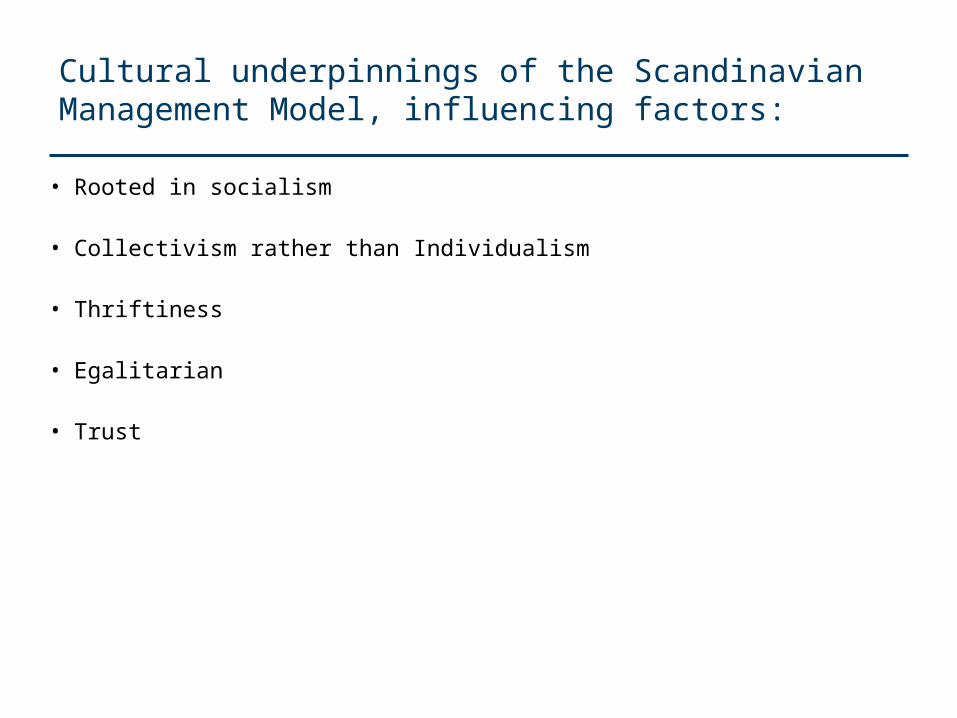
Cultural underpinnings of the Scandinavian Management Model, influencing factors:
• Rooted in socialism
• Collectivism rather than Individualism
• Thriftiness
• Egalitarian
• Trust

In Norway even the bad guys are influenced by collectivism
”We tip toe very quietly
When we’re out to steel things
We only take what we must
And things that we really need….”
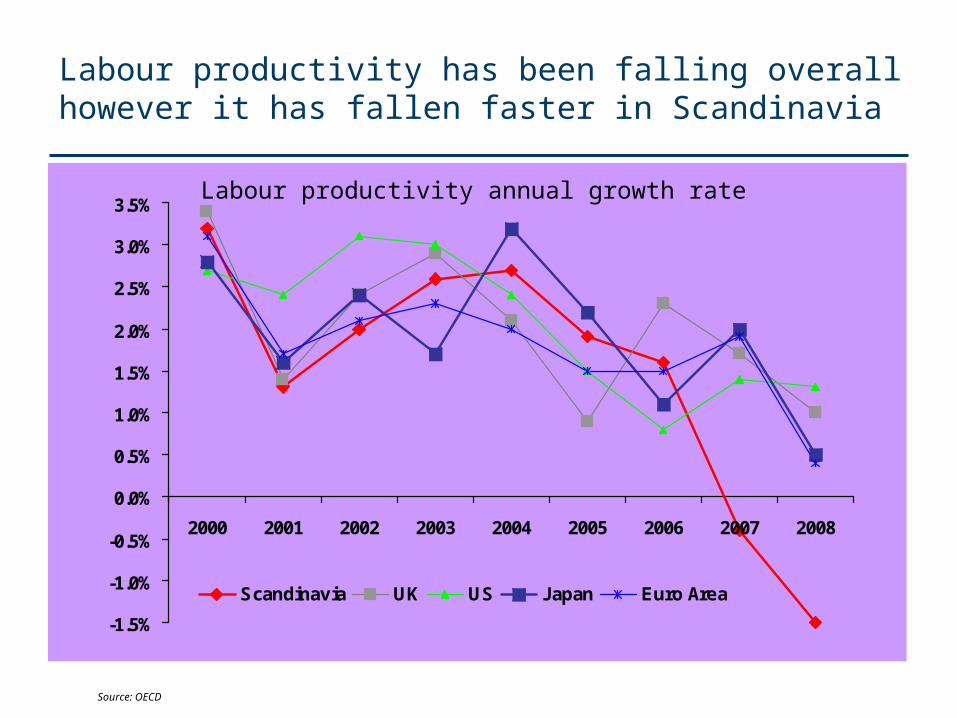
Labour productivity has been falling overall however it has fallen faster in Scandinavia
-1.5%
-1.0%
-0.5%
0.0%
0.5%
1.0%
1.5%
2.0%
2.5%
3.0%
3.5%
2000 2001 2002 2003 2004 2005 2006 2007 2008
Scandinavia UK US Japan Euro Area
Labour productivity annual growth rate
Source: OECD

Could it have been impacted by Scandinavia having one of the lowest average working hours within OECD?
-100
100
300
500
700
900
1100
1300
1500
1700
1900
Norway 6.14 Sweden 7.01 Denmark 6.95 Finland 7.46 OECDCountries 7.66
2000 2008
Average working hours per worker per day
Source: OECD

How some countries attract immigrants?
• Depends on high inflow of talents to fill vacancies
and / or
• High level of government participation in enterprise / wealth creation

Selected countries
• US
• UK
• UAE / Dubai
• Singapore
• Australia
• Japan
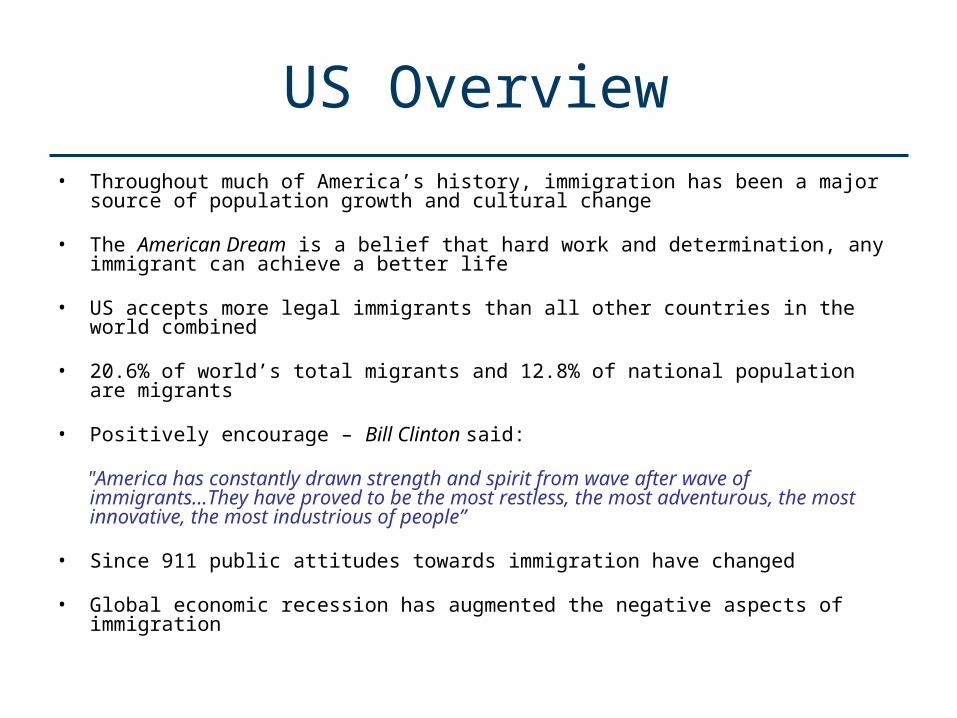
US Overview• Throughout much of America’s history, immigration has been a major source of
population growth and cultural change
• The American Dream is a belief that hard work and determination, any immigrant can achieve a better life
• US accepts more legal immigrants than all other countries in the world combined
• 20.6% of world’s total migrants and 12.8% of national population are migrants
• Positively encourage – Bill Clinton said:
"America has constantly drawn strength and spirit from wave after wave of immigrants...They have proved to be the most restless, the most adventurous, the most innovative, the most industrious of people”
• Since 911 public attitudes towards immigration have changed
• Global economic recession has augmented the negative aspects of immigration

US has a lot to offer
• Free (Political Rights – 1, Civil Liberties – 1)
• The American Dream
• Management Style• Straight talking and 'getting to the point'• Respect is earned through conspicuous
achievement rather than through age or background
• Self-deprecation is often misunderstood by Americans as a sign of weakness
• Time is money• Structure proposals to emphasize quick wins
rather than long-term objectives
• Career Development
• Education
Push Factors Pull Factors
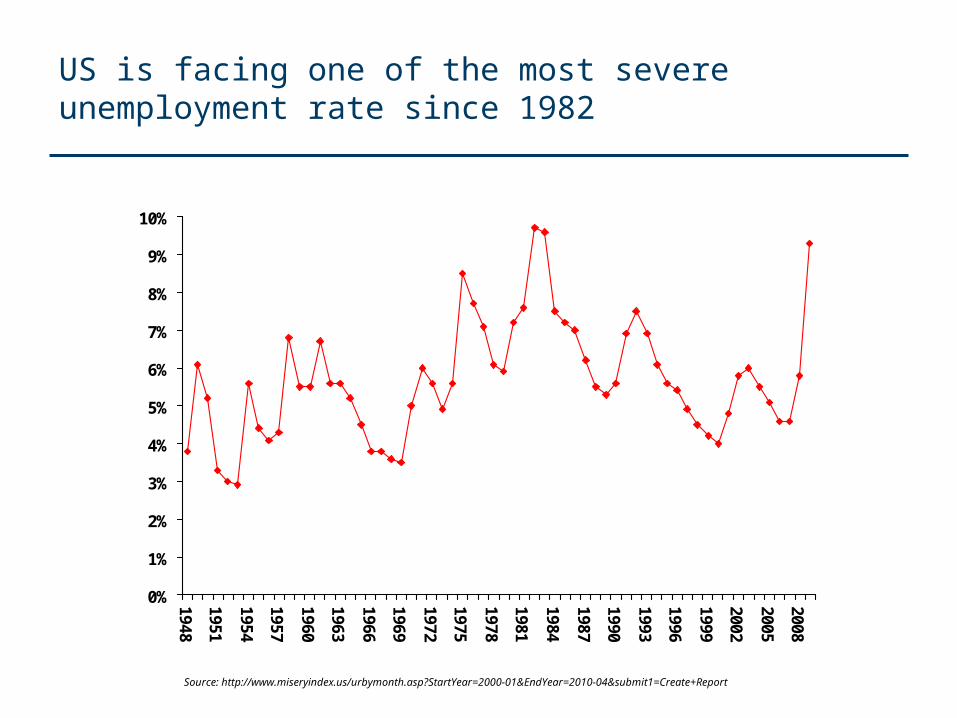
US is facing one of the most severe unemployment rate since 1982
0%
1%
2%
3%
4%
5%
6%
7%
8%
9%
10%
1948
1951
1954
1957
1960
1963
1966
1969
1972
1975
1978
1981
1984
1987
1990
1993
1996
1999
2002
2005
2008
Source: http://www.miseryindex.us/urbymonth.asp?StartYear=2000-01&EndYear=2010-04&submit1=Create+Report

A large proportion of US population growth is achieved through migration
0%
10%
20%
30%
40%
50%
60%
70%
80%
90%
100%
2000-2009 2008-2009
Natural Migration Not Classified
Source: http://www.census.gov/popest/states/NST-comp-chg.html
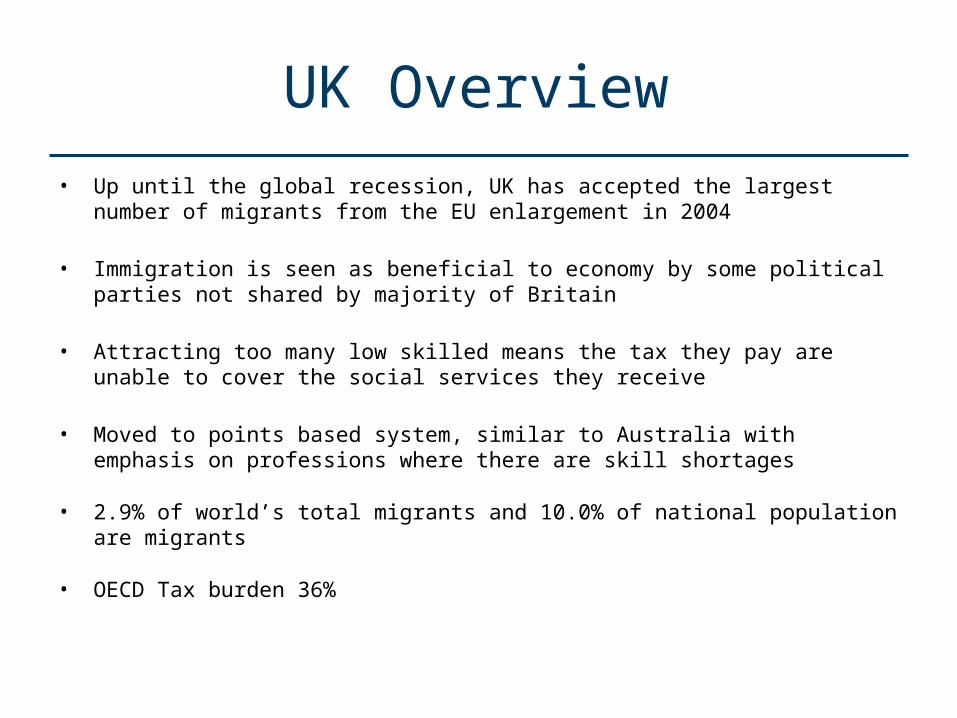
UK Overview
• Up until the global recession, UK has accepted the largest number of migrants from the EU enlargement in 2004
• Immigration is seen as beneficial to economy by some political parties not shared by majority of Britain
• Attracting too many low skilled means the tax they pay are unable to cover the social services they receive
• Moved to points based system, similar to Australia with emphasis on professions where there are skill shortages
• 2.9% of world’s total migrants and 10.0% of national population are migrants
• OECD Tax burden 36%

UK
• Free (Political Rights – 1, Civil Liberties – 1)
• Management Style•A manager is expected to have the interpersonal skillsmanagers to be 'generalists' rather than 'specialists‘• High job mobility• Flat management, Managers developing a close, friendly relationship with staff,but they make thedecisions• Respect is earned through experience rather thanqualification system
• Career Development
• Education
Push Factors Pull Factors

UK’s projected population growth is spread out fairly evenly between natural changes and net migration
0.0
0.5
1.0
1.5
2.0
2.5
2008-2013 2013-2018 2018-2023 2023-2028 2028-2033
Natural Change Net Migration
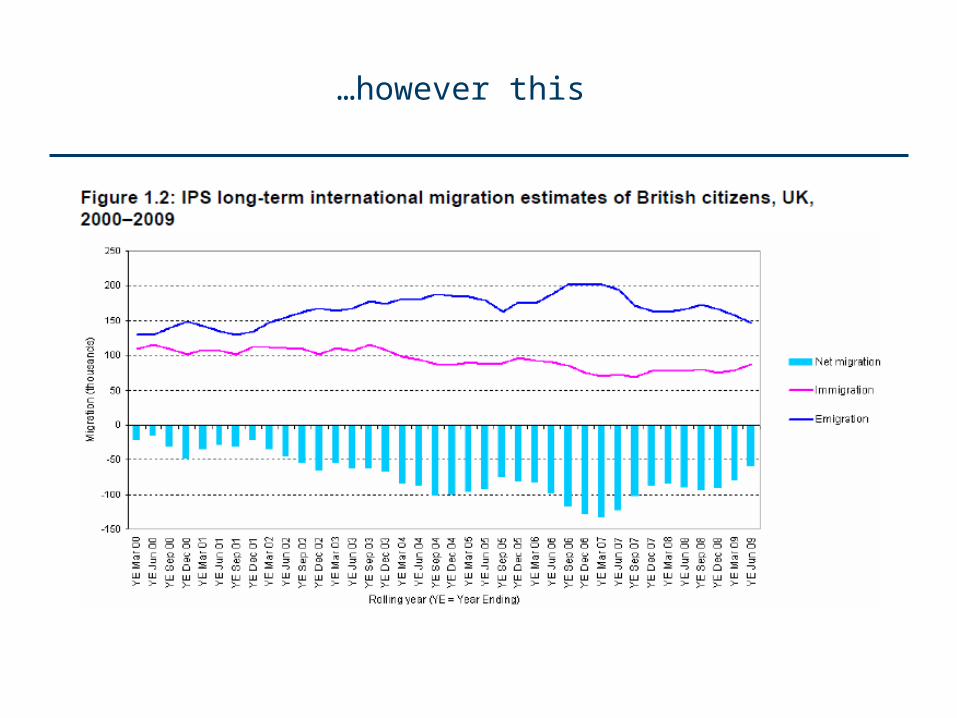
…however this
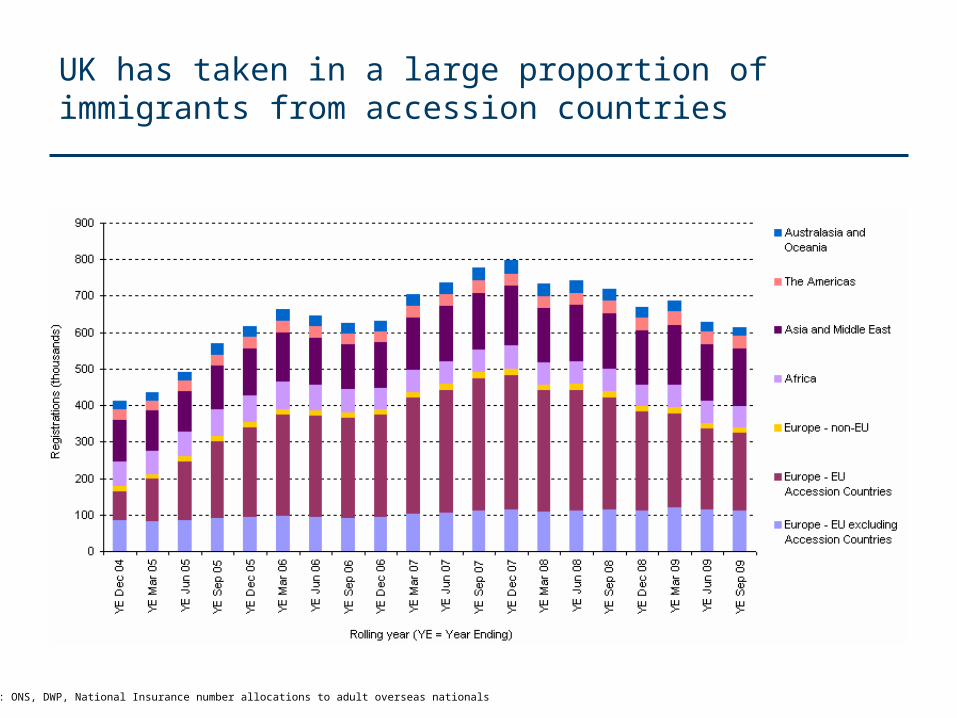
UK has taken in a large proportion of immigrants from accession countries
Source: ONS, DWP, National Insurance number allocations to adult overseas nationals
UAE/Dubai Overview
• Driven by need to populate with both highly skilled and unskilled labour due to transformation of state from oil producer to international hub for commerce and regional tourism
• Build and they will come / playground for the rich
• 1.7% of world’s total migrants and 71.4% of national population are migrants
• Sovereign State – all state enterprises and large corporations owned by the ruler of Dubai
• Negatives have not deterred skilled migrants
• Not allowed to take up citizenship / permanent residency ( work permits only)
• No unemployment benefits
• Closed culture
• Hot

UAE/Dubai including the rest of Middle East’s management practices are very different to Western styles and is not a model for attracting skilled migrants, however tax free status ensures there is no shortage of people wanting to work there
• Not Free (Political Rights – 5, Civil Liberties – 5)
• Dubai (including middle east) Undeveloped management practices built around state ruler
• Autocratic• Hierarchical• Nepotism• Very relationship-oriented, respectful, patient, • Managers reach decisions only after discussing the matter with the major stakeholders • Employees do not question the decisions that
managers have made
• Relaxed immigration policy for skilled/unskilled migrants• Only work permits offered• Permanent Residency not recognised• Tax Free
• Playground for the wealthy• English is used in business and government• Presence of recruitment agents
• No tax
• International hub – 3 hours to India, 6 hours to Europe
• Western Corporates sending employees there
• Short term attractiveness
Push Factors Pull Factors

Singapore Overview
• Driven by need to populate with highly skilled labour due to lack of resources
• Latterly driven by economic expansion of neighbours – financial centre of Asia
• Master plan looking to increase population from 4m+ currently to 6m+ in 2020
• 1.0% of world’s total migrants and 42.6% of national population are migrants
• Socialist democracy / Engineered Society
• Negatives have not deterred skilled migrants
• High density
• Cost of living
• Hot and humid climate

Singapore has established itself as the business centre of Asia with shipping, tourism and financial services coupled with a flat tax regime of 15% and multicultural which attracts a lot of skilled talent
• Partly Free (Political Rights – 5, Civil Liberties – 4)•US model, heavily influenced by traditional Asian values
• Mix of solidly traditional Asian values and western business techniques
• Multiculturalism accepted• Age is respected and managers tend to be older.• Managers delegate decisions to their teams• Outside family ties, promotion will be based on
performance
• Relaxed immigration policy for skilled migrants• Permanent Residency offered after two years to
those who meet the country’s list of key skills • Extensive resource available to help potential
skilled workers• Job vacancies advertised and run by government
• English is used in business and government• Presence of recruitment agents
• Career Development
• Flat Tax system – 15%
• Income levels are significantly higher (x3-x5 timeshigher) than those around Asia
• International hub – 3 hours to India, 6 hours to Dubai,3 hours to HK/China
• Head Office or Regional Head Office for many westerncompanies
Push Factors Pull Factors
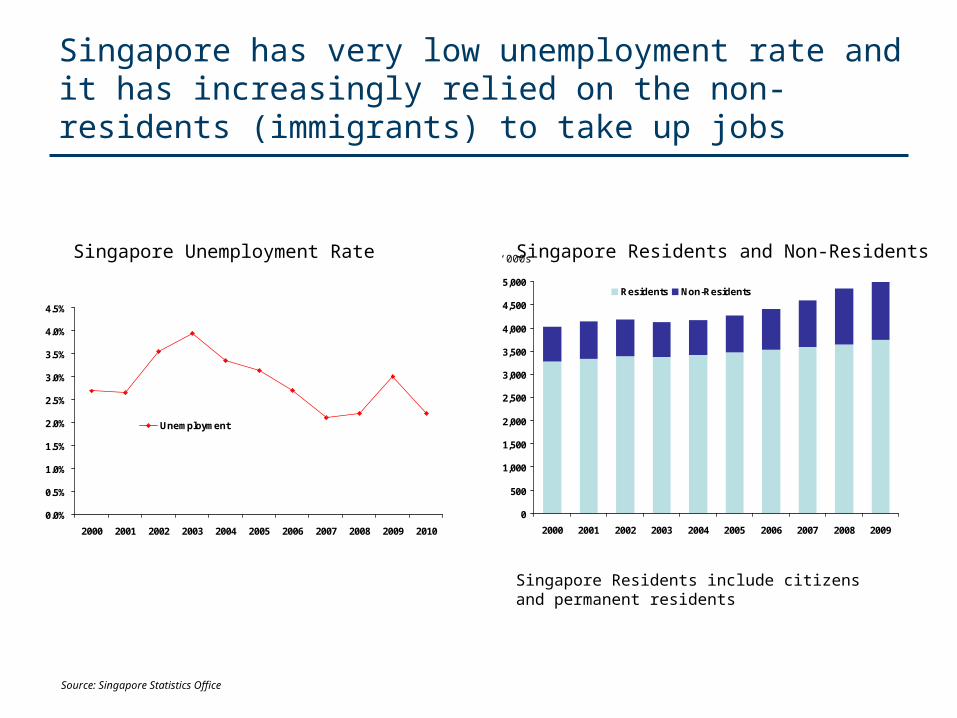
Singapore has very low unemployment rate and it has increasingly relied on the non-residents (immigrants) to take up jobs
0
500
1,000
1,500
2,000
2,500
3,000
3,500
4,000
4,500
5,000
2000 2001 2002 2003 2004 2005 2006 2007 2008 2009
Residents Non-Residents
0.0%
0.5%
1.0%
1.5%
2.0%
2.5%
3.0%
3.5%
4.0%
4.5%
2000 2001 2002 2003 2004 2005 2006 2007 2008 2009 2010
Unemployment
Singapore Residents and Non-ResidentsSingapore Unemployment Rate
Singapore Residents include citizens and permanent residents
Source: Singapore Statistics Office
‘000s
Australia Overview
• Historically driven by need to populate smallest continent
• Latterly driven by economic expansion – mining / housing boom
• Master plan looking to increase population from 20m+ currently to 35m+ in 2030
• 2.2% of world’s total migrants and 19.9% of national population are migrants
• Negatives have not deterred skilled migrants
• Recent backlash against immigrants
• Cost of living (Property is x9 average earnings)
• OECD Tax Burden 31%
• Remote – 24 hours to get to Europe
• Limited career advancement (compared to Singapore / Europe)
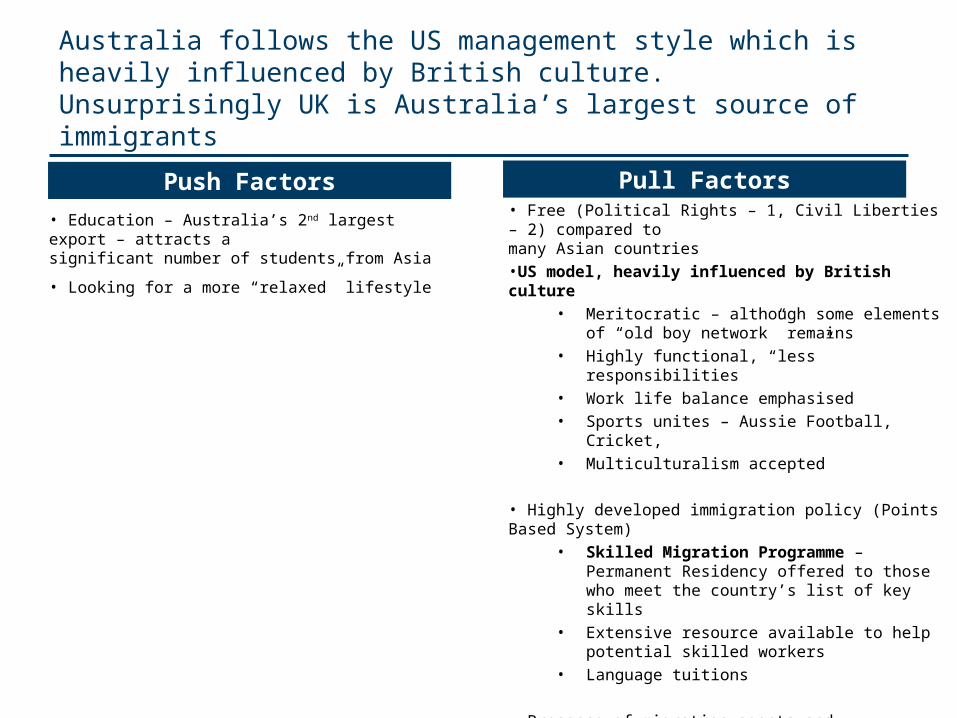
Australia follows the US management style which is heavily influenced by British culture. Unsurprisingly UK is Australia’s largest source of immigrants
• Free (Political Rights – 1, Civil Liberties – 2) compared tomany Asian countries•US model, heavily influenced by British culture
• Meritocratic – although some elements of “old boy network” remains
• Highly functional, “less” responsibilities• Work life balance emphasised • Sports unites – Aussie Football, Cricket, • Multiculturalism accepted
• Highly developed immigration policy (Points Based System)• Skilled Migration Programme – Permanent
Residency offered to those who meet the country’s list of key skills
• Extensive resource available to help potential skilled workers
• Language tuitions
• Presence of migration agents and recruitment agents in theUK and Australia• Deep historical links with UK – economic and family• Significant arrangements with UK (2 year working holiday VISA)
• Education – Australia’s 2nd largest export – attracts asignificant number of students from Asia
• Looking for a more “relaxed” lifestyle
Push Factors Pull Factors

In Australia, population increase has depended on the Net Migration, particularly in the last 10 years
0
20
40
60
80
100
120
140
Jun
-81
Jun
-82
Jun
-83
Jun
-84
Jun
-85
Jun
-86
Jun
-87
Jun
-88
Jun
-89
Jun
-90
Jun
-91
Jun
-92
Jun
-93
Jun
-94
Jun
-95
Jun
-96
Jun
-97
Jun
-98
Jun
-99
Jun
-00
Jun
-01
Jun
-02
Jun
-03
Jun
-04
Jun
-05
Jun
-06
Jun
-07
Jun
-08
Jun
-09
Natural Increase Net Migration
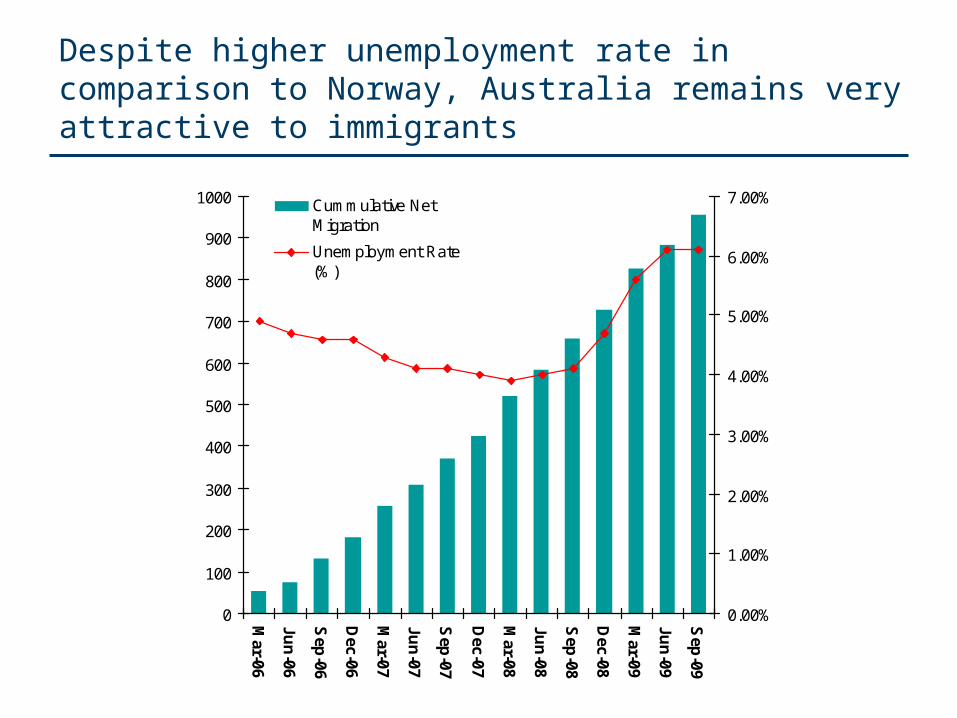
Despite higher unemployment rate in comparison to Norway, Australia remains very attractive to immigrants
0
100
200
300
400
500
600
700
800
900
1000
Mar-06
Jun
-06
Sep
-06
Dec-06
Mar-07
Jun
-07
Sep
-07
Dec-07
Mar-08
Jun
-08
Sep
-08
Dec-08
Mar-09
Jun
-09
Sep
-09
0.00%
1.00%
2.00%
3.00%
4.00%
5.00%
6.00%
7.00%Cummulative NetMigration
Unemployment Rate(%)

Japan Overview
• Immigration is very much discouraged - citizenship and permanent residency are extremely difficult to obtain
• 1.1% of world’s total migrants and 1.6% of national population are migrants
• Addresses the shortage of workers through industrial automation
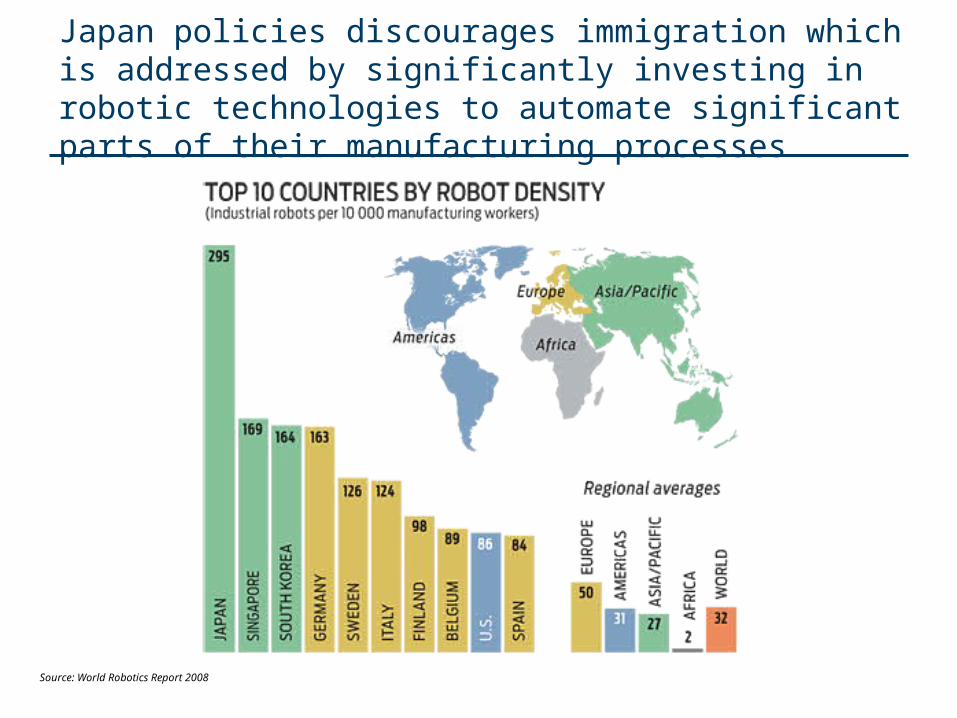
Japan policies discourages immigration which is addressed by significantly investing in robotic technologies to automate significant parts of their manufacturing processes
Source: World Robotics Report 2008
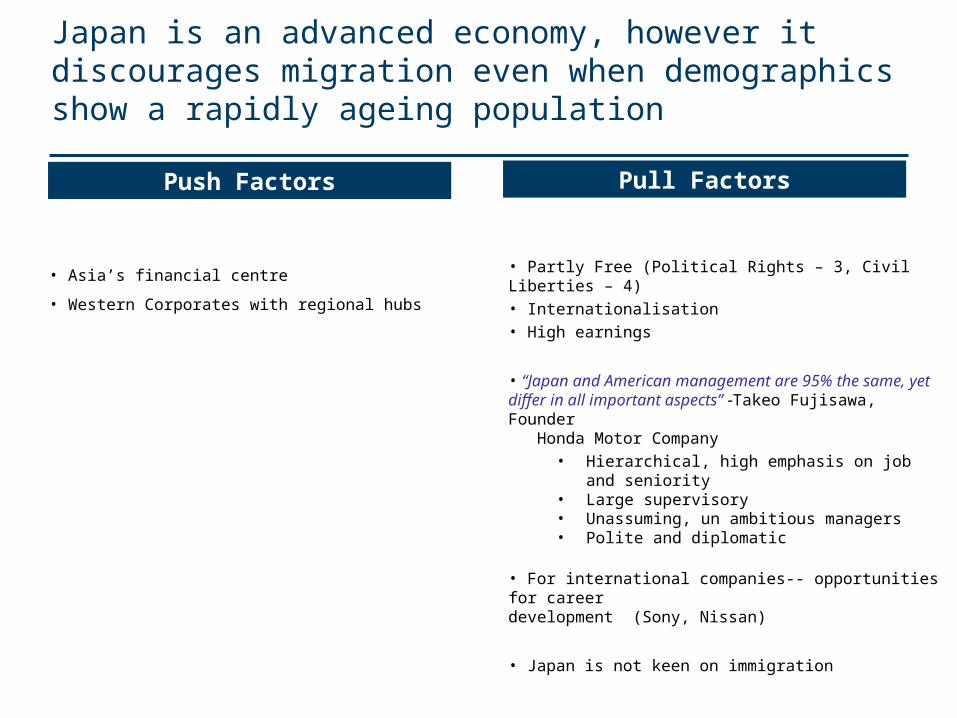
Japan is an advanced economy, however it discourages migration even when demographics show a rapidly ageing population
• Partly Free (Political Rights – 3, Civil Liberties – 4)• Internationalisation• High earnings
• “Japan and American management are 95% the same, yetdiffer in all important aspects” -Takeo Fujisawa, Founder Honda Motor Company
• Hierarchical, high emphasis on job and seniority• Large supervisory• Unassuming, un ambitious managers• Polite and diplomatic
• For international companies-- opportunities for careerdevelopment (Sony, Nissan)
• Japan is not keen on immigration
• Asia’s financial centre
• Western Corporates with regional hubs
Push Factors Pull Factors

Industrial automation
From this To this

More radical solutions?
From this To this?

Even more controversial?
From this To this?

So what insights can we learn from these countries and what can we do?
Critical Success Factors
• Management that accepts multiculturalism
• Create awareness
• Proactive recruitment
• Appreciate limitations – regional
• Tax is a driver
• Automation

Conclusion
• Norway is not the natural choice for migrants, but faces a different challenge. Has to attract a small number of migrants with specific skills.
• Deciding where to move / live, particularly for people with families, is a profound psychological process, so Norway has to focus on push factors.
• Is immigration the answer?
– Women working
– Training?
• Norway has many attractions
– Great work ethics based on its management model, employers and employees have a very good relationship
– Equality
– Innovative
– Beautiful, unpolluted country
– Work / life balance
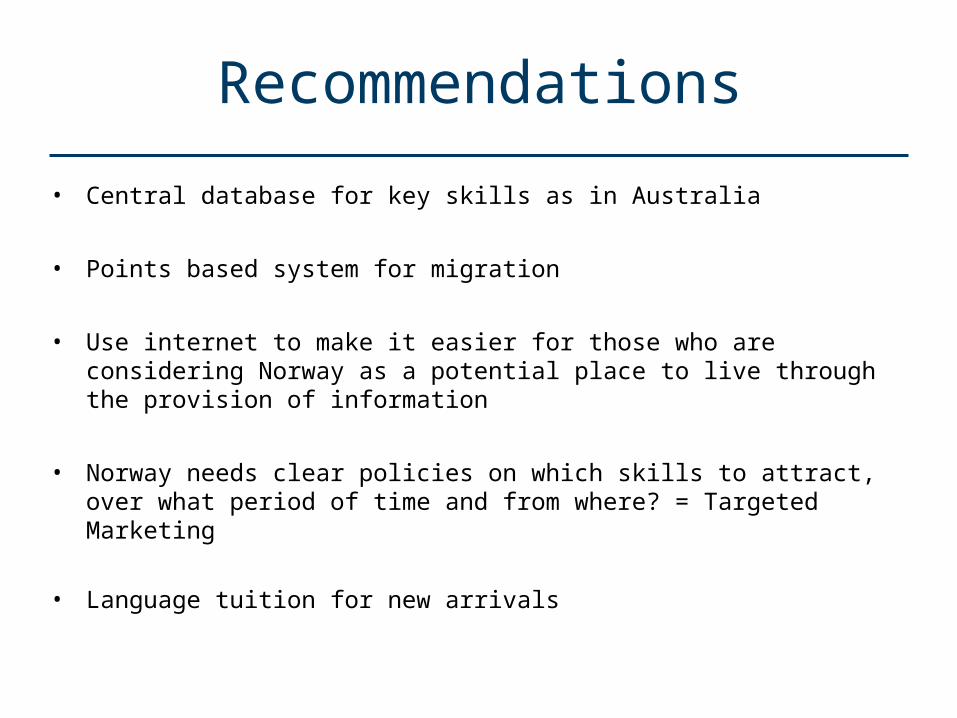
Recommendations
• Central database for key skills as in Australia
• Points based system for migration
• Use internet to make it easier for those who are considering Norway as a potential place to live through the provision of information
• Norway needs clear policies on which skills to attract, over what period of time and from where? = Targeted Marketing
• Language tuition for new arrivals
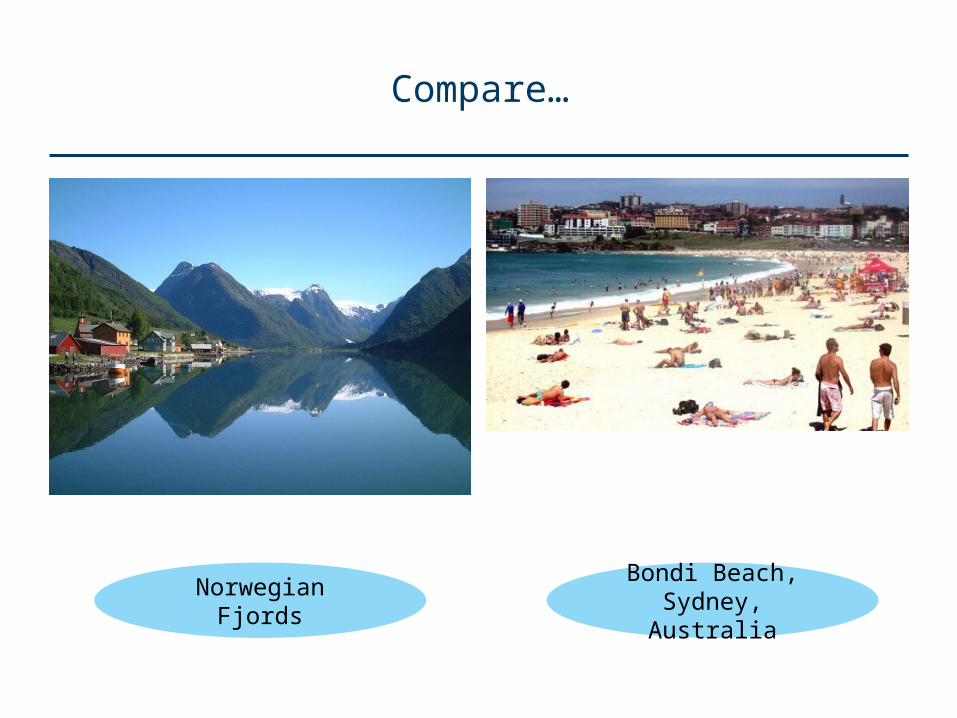
Compare…
Bondi Beach, Sydney, Australia
Norwegian Fjords

Q&A

Appendices

Tax Burden
48%47%44%43% 43%43%43%
0%
38%38% 37%37%36%36%36%35% 33%32%31%31%29%29% 28%28%27%
42%
0%
5%
10%
15%
20%
25%
30%
35%
40%
45%
50%
Denm
ark
Sw
eden
Belgium
Italy
France
Austria
Finland
Norw
ay
Luxembourg
Netherlands
Czech R
epublic
Portugal
Germ
any
Iceland
UK
Poland
Spain
Canada
Greece
Australia
Sw
itzerland
Slovakia
Japan
Ireland
US
Source: OECD

Structure of government
Public Sector
General Government
Public Corporations
Public financial corporations
Non-financial public corporations
Central Government Local Government
Fiscal account including National
Insurance Scheme
Fiscal account including National
Insurance Scheme
MunicipalitiesCounty
Municipalities
Non-financial corporations owned by the
central government
Norges Bank and lending institutions
Other financial
corporations
Non-financial corporations owned by the
local government

Storting Elections, Top 3 Parties
0
10
20
30
40
50
60
70
80
90
1936
1945
1949
1953
1957
1961
1965
1969
1973
1977
1981
1985
1989
1993
1997
2001
2005
2009
Labour Party Progress Party Conservative Party

Compared to Europe average (34 people/km2) Norway has only 14 allowing a significant room to increase its population
0
20
40
60
80
100
120
140
Norway Denmark Sweden Finland Europe Europe (exRussia)

NORWAY
Government Control
• Constitutional monarchy and parliamentary democracy, with King as Head of Stateand government power resides in Prime Minister and elected parliamentary ministers. •Unitary state with administrative subdivisions on two levels - counties and municipalities• Significant government control in key resource industries via Public Corporations
Migration Policy & Management
• Aligned to the model in Europe•Restrictive admissions but equal treatment• Positively encourage – "respect for immigrants' language and culture”• Language training, labor market integration, and initiatives to promote multi-culturist• Generous integration and social services for immigrant populations•Naturalisation – difficult (7 years as PR)•<0.5% of world’s total migrants and 7.4% of national population are migrant workers
Management Style
• Democratic, consensual , relation and result -oriented management• Exceptionalstrength in ethic, social responsibility, accountability, openness, transparency• Shareholder value, customer satisfaction, management truth worthiness• Motivating management, empowering employees, participative decision making• High level of information and direct communication• Managing with goals and values rather then control and command• Flat company structure, communication with the employees, delegating responsibility, care, trust,• Collegiality among the staff, employees happiness, efficiency, more risk taking, feeling of accomplishment, motivation, well-being, creativity, innovation
Tax • OECD Tax Burden - 42% • Gender pay gap 16% - Difference between earnings of female and male employees lowest in Scandinavia and average of EU27 17%
Awareness•http://www.migrationinformation.org/Feature/display.cfm?ID=307• http://www.nationsencyclopedia.com/Europe/Norway-MIGRATION.html•http://www.migrationinformation.org/Resources/norway.cfm
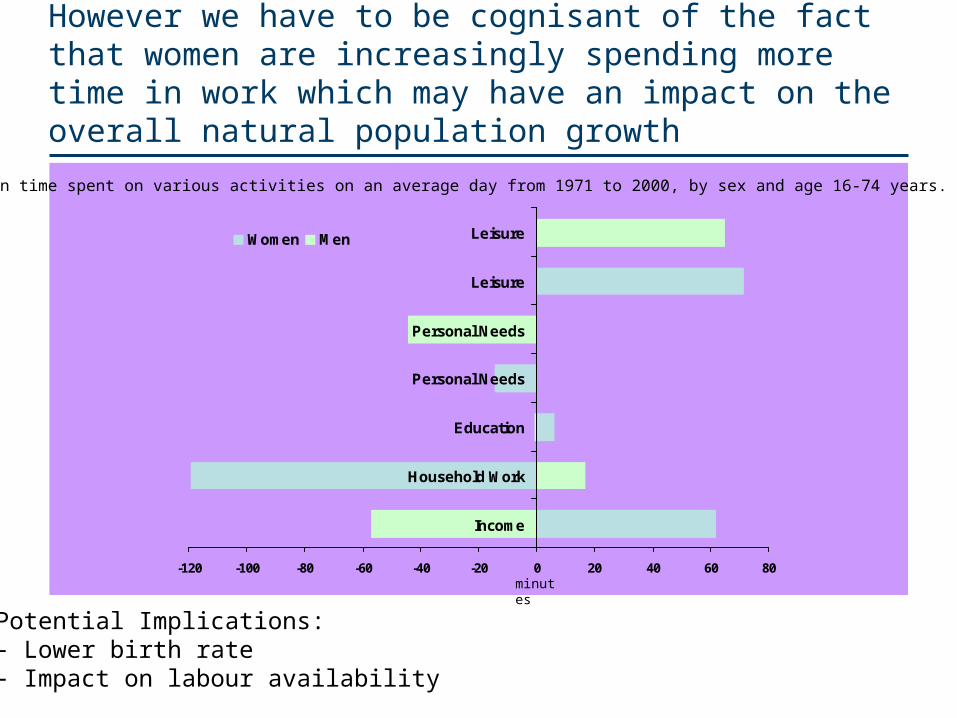
However we have to be cognisant of the fact that women are increasingly spending more time in work which may have an impact on the overall natural population growth
-120 -100 -80 -60 -40 -20 0 20 40 60 80
Income
Household Work
Education
Personal Needs
Personal Needs
Leisure
LeisureWomen Men
Potential Implications:- Lower birth rate- Impact on labour availability
Change in time spent on various activities on an average day from 1971 to 2000, by sex and age 16-74 years. Minutes
minutes
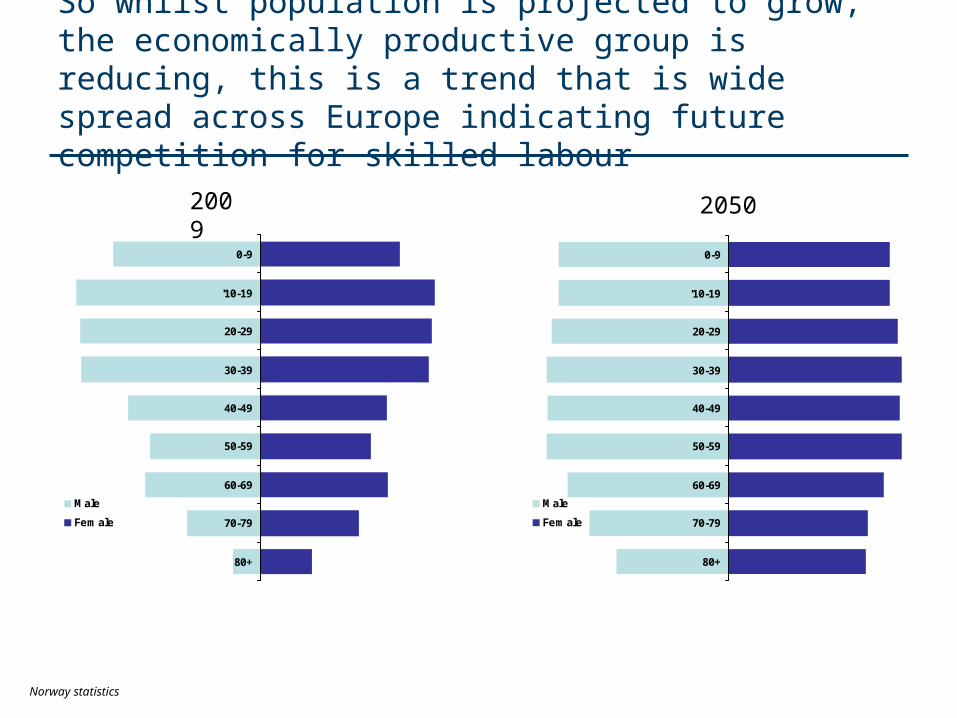
So whilst population is projected to grow, the economically productive group is reducing, this is a trend that is wide spread across Europe indicating future competition for skilled labour
Norway statistics
80+
70-79
60-69
50-59
40-49
30-39
20-29
'10-19
0-9
Male
Female
20502009
80+
70-79
60-69
50-59
40-49
30-39
20-29
'10-19
0-9
Male
Female

So how do we measure management models effectiveness?
• Competitiveness?
• Labour Productivity?

Pillars of Competitiveness
Basic Requirements• Institutions• Infrastructure• Macroeconomic Stability• Health and Primary education
Key ForFactor - driven
Economies
Efficiency Enhancers• Higher Education and Training• Goods Market Efficiency• Labor Market Efficiency• Financial Market Sophistication• Technological Readiness• Market size
Innovation and Sophistication Factors• Business Sophistication• Innovation
Key ForEfficiency - driven
Economies
Key ForInnovation - driven
Economies
Related Documents