SPEAKERS 1. Andrea Morris, Principal Investigator, West Health Institute 2. Patrick Zondler, Project Director, Meals on Wheels San Diego County 3. Shon Gress, Executive Director, Guernsey County Senior Citizens Center, Inc. Scaling What Works – Learnings from More Than A Meal Research

Welcome message from author
This document is posted to help you gain knowledge. Please leave a comment to let me know what you think about it! Share it to your friends and learn new things together.
Transcript

SPEAKERS
1. Andrea Morris, Principal Investigator, West Health
Institute
2. Patrick Zondler, Project Director, Meals on Wheels
San Diego County
3. Shon Gress, Executive Director, Guernsey County
Senior Citizens Center, Inc.
Scaling What Works – Learnings
from More Than A Meal Research

NUTRITION
COMMUNITY CONNECTIONS
SOCIALIZATION SAFETY
Scaling What Works – Learnings
from More Than A Meal Research
Andrea Morris, PhD, MPH
Principal Investigator
West Health Institute

WEST HEALTH: HELPING SENIORS
AGE SUCCESSFULLY
P O R T F O L I O
Models of Excellence
• Gary and Mary West
Emergency Department
at UC San Diego Health
• Gary and Mary West
Senior Dental Center
Models of Excellence
• Gary and Mary West
Senior Wellness
Center
Models of Excellence
• Gary and Mary West
PACE
Applied Research
• UCSD Acute Care at Home
• Geisinger Mobile Health
• Transport Plus Mt. Sinai
• IHI Learning Collaborative
• Call 9 and Dispatch
• GEDC data analysis & registry
• UCSD SECU Phase 3
• Telehealth in assisted living facility
• Integrated Oral & Healthcare
Applied Research
• Home-based Primary Care Registry
• Caregivers’ support
• Community-based Palliative Care
• Northwell Home-based Primary
Care
• Independence at Home savings
model
• PACE 2.0
• Blue Shield ROI analysis
Applied Research
• More than a Meal 3
• UC Irvine 360
Caregiving
• Scaling What Works
Advancing senior appropriate
acute care models
Advancing long-term services &
supports delivery modelsAdvancing senior-appropriate
chronic care models
Partnering with world-class organizations
SUPPORTIVE APPLIED MEDICAL
RESEARCH

PROJECT COLLABORATORS
SO MUCH MORE THAN A MEAL
• Meals on Wheels home-delivered
meal programs serve our nation’s
most vulnerable seniors
• Meals on Wheels delivers ‘more
than a meal’
• Opportunity to leverage routine
interactions to identify and
address unmet needs for at-risk
seniors

STUDY DESIGN
Phase 1
• Assessed interactions between drivers and clients and
gauged potential for standardization of safety and
wellness check
Phase 2
• Piloted a technology-enabled wellness check and care
coordination model for reporting and responding to
unmet needs
TWO-YEAR STUDY: MARCH 2016 - 2018
PILOT SITES
• Site 1: Meals on Wheels San Diego County, CA
• Program with 3,000+ volunteer drivers delivering meals to
3,000+ clients across urban, suburban, and rural areas in
one county
• Site 2: Meals on Wheels Guernsey County, OH
• Program with 18+ paid drivers delivering meals to 600+
clients across several rural counties

PRE-IMPLEMENTATION
• Developed wellness indicator
categories, client ‘change of condition’
monitoring, and care navigation
support protocol
• Adapted technology-enabled wellness
tool established by MOW Greater
Pittsburgh
• Hired key project staff
• Selected test routes and identified
drivers
• Trained drivers and staff on tools and
protocols
PROACTIVE APPROACH TO
IDENTIFY AND ADDRESS NEEDS
Driver uses mobile
application to deliver meal
Driver receives prompt to indicate
concern or change of client
condition
Driver selects wellness
category and submits
electronic alert
Care Coordinator
follows-up with client and
connects them to services and
supports

IMPLEMENTATION
Protocol implemented across 21 routes, 53 drivers, and
867 clients
• Site 1: MOW SD
• Testing began early April 2017
• Expanded to 5 routes, 35 drivers, 220 clients
• Site 2: MOW GC
• Testing began late August 2017
• Expanded to 16 routes, 18 drivers, 647 clients
RESULTS
• Final analytic sample included 189 clients with at
least one wellness alert during study period
• Site 1: N = 47; Site 2: N = 142
• Wellness alert comprised of 1 – 6 wellness
categories (alert types)
• Emergency/911 for tracking purposes only
• Sample characteristics of clients with alerts
• Average age 78 years old, most were female (70.4%), and
a majority lived alone (58.7%)
ANALYTIC SAMPLE

KEY FINDINGS
• 360 wellness alerts were submitted for 189 clients
• Site 1: 118 alerts submitted for 47 clients
• Site 2: 242 alerts submitted for 142 clients
• A majority of alerts were submitted for a single
wellness category (alert type)
• Average number of alerts per client ~2
• ~40% had 2 or more alerts across study period
WELLNESS ALERTS
ALERTS BY WELLNESS CATEGORY
N = 429

KEY FINDINGS
• 132 referrals were initiated across health and
community service categories
• Site 1: n = 71 referrals
• Site 2: n = 61 referrals
• Average number of referrals per client ~1
• ~ 14% of clients had 2 or more referrals
• No referral was needed for 193 wellness alerts
REFERRALS
REFERRALS BY SERVICE
CATEGORY
N = 132

KEY FINDINGS
• Focus groups were conducted after two months of
implementation to gauge drivers’ satisfaction and
experience with training and the tool
• Feedback at Site 1 was used to modify training approach
and materials prior to Site 1 expansion and Site 2
replication
• Drivers found the application easy to use and
valued the wellness checks as an “important
contribution” to their meal delivery
FOCUS GROUPS
MEALS ON WHEELS IS HELPING
SENIORS AGE IN PLACE• Demonstrated feasibility of
leveraging drivers to
conduct electronic
wellness checks
• Used proactive approach
to help at-risk seniors
remain in their homes
• Opportunity to
demonstrate value to
healthcare payers and
providers

Scaling What Works – Learnings
from the More Than a Meal Body of
Research
PATRICK ZONDLER, Project Director
WILLY GLORIA, Metro Service Manager
ESTEBAN OJEDA, Volunteer Manager
Meals on Wheels San Diego County
HOW DO YOU CLIMB A MOUNTAIN?One well placed step at a time!
• Build your team
• Do you have the right
people in leadership?
• Work to everyone’s
strengths
• Have a plan
• Be agile enough to make
changes along the way
• Learn from the missteps
• Overcome the rock slides
• Listen, stay positive and
motivate
• Communicate, Communicate,
Communicate!
5 Routes during the study; 17
currently; 111 goal

MEET MEALS ON WHEELS
SAN DIEGO COUNTY
By the numbers
• 58 years of delivering service to seniors
• Over 3,200 seniors served Home Delivered Meals per
year
• Over 3,200 volunteers delivering meals per year saving
over $2.8M in expenses
• 111 Routes covering entire county-over 4500 sq. miles
• Urban-Suburban-Rural
• 42 full time employees; 32 part time employees
A VOLUNTEER DRIVEN PROGRAM
METRO SERVICE CENTER
EXTERNAL FACTORS:
• DIGITAL DIVIDE
• Technology literacy
• Device ownership
• Apprehensiveness towards change
• ASSUMPTIONS:
• Volunteers will push back
• Some staff will push back
• Technology is a limitation
• Loss of volunteers
Logic Model
Inp
uts Program Staff
• Manager
• Office Staff
• Immediate Response Drivers/Site Coordinators
• Interns
Time
• Research
• Training
• Retention efforts
Materials, Equipment &Tech
• SERVtrackerMobile Meals App Reference Guide
• Wellness Support Training Packet
• Mobile Phone w/ Android or iOS compatibility
• Mobile Internet Service
Acti
vit
ies Train
• Current/ New volunteer training
• New staff/ intern training
Deliver
• Brochures and flyers
• Meals
Provide
• In person, online, and phone customer service
• Healthy and nutritional meals and resources
• Social interaction to combat isolation
• References to other resources
• Wellness checks O
utp
uts Train
• Staff trained to recognize changes in condition
Value• Increased awareness
of program and community resources
Benefits• Reduced social
isolation and increased nutrition among aging community
• Head off Emergency situations
Ou
tpu
tsO
utc
om
es Partnerships
• Increased information sharing between agencies
• Increased access to relevant community resources for older adults
Health• Increased nutrition
among aging community
• Increased social interaction among aging community to combat social isolation
• Identification of needs that affect the aging community
• Ability to age in place
Quantifiable Measures• Cost saving
• Efficiency
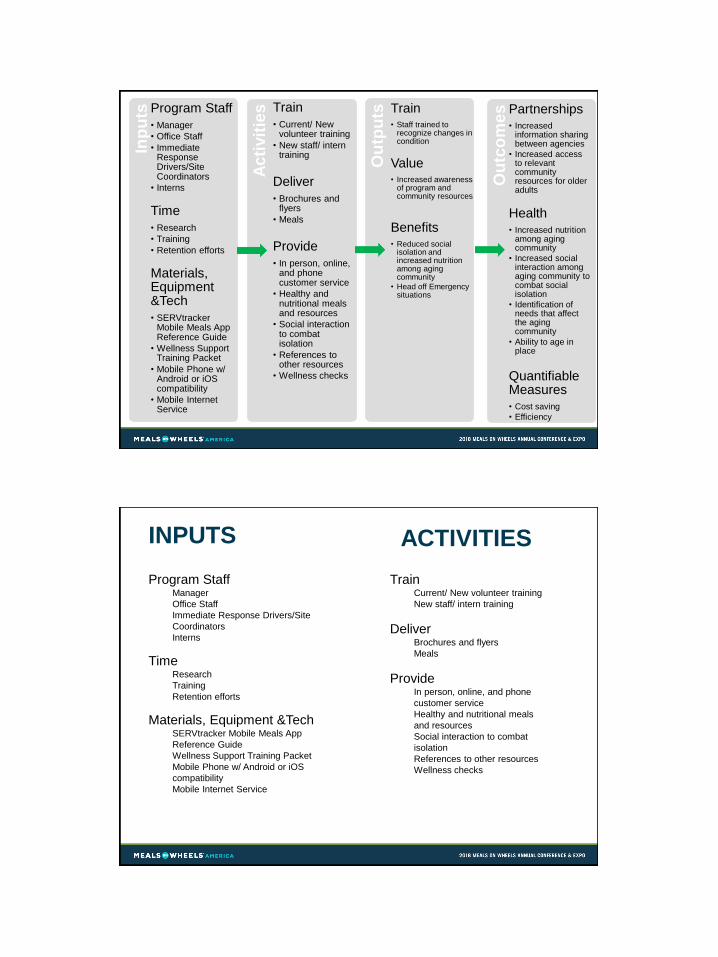
Program StaffManager
Office Staff
Immediate Response Drivers/Site
Coordinators
Interns
TimeResearch
Training
Retention efforts
Materials, Equipment &TechSERVtracker Mobile Meals App
Reference Guide
Wellness Support Training Packet
Mobile Phone w/ Android or iOS
compatibility
Mobile Internet Service
INPUTS ACTIVITIES
TrainCurrent/ New volunteer training
New staff/ intern training
DeliverBrochures and flyers
Meals
ProvideIn person, online, and phone
customer service
Healthy and nutritional meals
and resources
Social interaction to combat
isolation
References to other resources
Wellness checks

OUTCOMES
TrainStaff trained to recognize
changes in condition
ValueIncreased awareness of
program and community
resources
BenefitsReduced social isolation
and increased nutrition
among aging community
Head off Emergency
situations
PartnershipsIncreased information
sharing between agencies
Increased access to relevant
community resources for
older adults
HealthIncreased nutrition among
aging community
Increased social interaction
among aging community to
combat social isolation
Identification of needs that
affect the aging community
Ability to age in place
Quantifiable MeasuresCost saving
Efficiency
OUTPUTS
VOLUNTEER MOBILE ROLLOUT
Phase 1
Prior to Launch
Data collection from volunteers using emailed
surveys to understand volunteer pool technology capabilities and attitudes
towards change
Identification of volunteers on routes that would help
champion the mobile rollout
Create training packet and materials with step by step instructions about the new
mobile application
Inform volunteers on perspective mobile routes of change of procedure by utilization of mobile application
• Phone call & email 2 weeks prior to implementation
Phase 2
Launch Date
Assigned office personnel to meet volunteers at drop site
with training materials
Ensure access to mobile application
Mini-training and demonstration at the drop site
Address concerns and apprehension regarding
change
Maintain volunteer retention
• Daily follow up phone calls to volunteers using mobile application to gain feedback about the mobile app and address any questions they may have
Phase 3
Post Launch
Continue best practices of phases 1 and 2
Development and distribution of new volunteer training
includes mobile app, delivering meals, and change of condition
presentation

CARE NAVIGATOR ROLE Primary role:
Interact with seniors, volunteers, and service center staff to assess seniors' needs that are reported through the mobile app. The main function is to assist clients in navigating the care system to provide them with the best
quality of care to stay independent and live with safety and dignity.
Report the process of the mobile rollout
Daily journal recording events
of day using qualitative data
Biweekly reports re: technology issues, user
issues, volunteer acceptance, and
route usage using
quantitative data
Monthly care navigation Change of Condition
quantitative report
Assist service center manager and volunteer manager with mobile rollout
through identification of
issues and concerns that
volunteers have towards mobile
application.
Create an individualized plan to assist
volunteers with becoming
technologically savvy with the
new technological updates that
Meals on Wheels San Diego County is
undergoing.
Decrease volunteer
resistance by serving as a
reminder of the importance behind the
change. The change towards
the mobile application will provide better security and
quality of care for our seniors.
QUANTITATIVE MEASURES
1-Jun to 15-Jun 16-Jun to 30-Jun 1-Jul to 15-Jul 16-Jul to 31-Jul
iOS 5 13 13 10
Passkey Incorrect 5 0 2 0
Phone Malfuction 7 3 5 2
Misc 1 1 5 0
0
2
4
6
8
10
12
14
Technology Issues

0
20
40
60
80
100
120
140
160
180N
um
be r
of V
olu
nte
ers
1-Jun
4-Jun
5-Jun
6-Jun
7-Jun
8-Jun
11-Jun
12-Jun
13-Jun
14-Jun
15-Jun
18-Jun
19-Jun
20-Jun
21-Jun
22-Jun
25-Jun
26-Jun
27-Jun
28-Jun
29-Jun
2-Jul
3-Jul
4-Jul
5-Jul
6-Jul
9-Jul
10-Jul
11-Jul
12-Jul
13-Jul
16-Jul
17-Jul
18-Jul
19-Jul
20-Jul
23-Jul
24-Jul
25-Jul
26-Jul
27-Jul
30-Jul
31-Jul
Accepted 71 75 76 79 80 82 84 85 87 87 87 87 87 88 89 89 97103110117124125133135139140141143144144146147147149150151154156156156157157158
Resisted 5 5 4 3 2 3 1 1 1 1 1 1 1 1 1 1 3 3 3 3 2 2 2 3 3 3 3 3 2 2 2 2 2 2 2 2 0 0 0 0 0 0 0
Refused 0 0 1 1 1 1 1 1 1 1 1 1 1 2 2 2 3 4 4 4 5 5 4 4 4 4 4 4 4 4 4 4 4 4 4 4 4 4 4 4 4 4 4
Not Attempted 19 15 14 12 12 9 9 9 7 7 7 7 7 5 4 4 49 42 35 29 23 22 16 15 12 11 10 9 9 9 8 8 8 7 6 5 4 4 4 4 3 3 3
Total 95 95 95 95 95 95 95 96 96 96 96 96 96 96 96 96152152152153154154155157158158158159159159160161161162162162162164164164164164165
Volunteer Acceptance of Mobile App
1-Jun to 15-Jun 16-Jun to 30-Jun 1-Jul to 15-Jul 16-Jul to 31-Jul
Technological Difficulites 4 11 10 2
Office Miscommunication 9 3 4 3
User Forgot 0 1 1 6
No Show 1 2 1 0
0
2
4
6
8
10
12
User Issues

0
2
4
6
8
10
12
14
16
18
1-Jun
4-Jun
5-Jun
6-Jun
7-Jun
8-Jun
11-Jun
12-Jun
13-Jun
14-Jun
15-Jun
18-Jun
19-Jun
20-Jun
21-Jun
22-Jun
25-Jun
26-Jun
27-Jun
28-Jun
29-Jun
2-Jul
3-Jul
5-Jul
6-Jul
9-Jul
10-Jul
11-Jul
12-Jul
13-Jul
16-Jul
17-Jul
18-Jul
19-Jul
20-Jul
23-Jul
24-Jul
25-Jul
26-Jul
27-Jul
30-Jul
31-Jul
Routes Used 10 10 10 9 8 6 10 10 9 10 9 11 11 9 9 11 13 12 15 17 13 17 13 16 15 16 15 16 16 13 17 16 17 17 16 17 16 16 16 12 17 14
Routes Unused 1 1 1 2 3 5 1 1 2 1 2 0 0 2 2 0 4 5 2 0 4 0 4 1 2 1 2 1 1 4 0 1 0 0 1 0 1 1 1 5 0 3
Total Routes 11 11 11 11 11 11 11 11 11 11 11 11 11 11 11 11 17 17 17 17 17 17 17 17 17 17 17 17 17 17 17 17 17 17 17 17 17 17 17 17 17 17
Mobile Route Usage

HANDOUTS AND INFORMATION
Volunteer Survey through Survey Monkey
Wellness Support Volunteer Training Packet
Downloading and using Mobile Application Instructions
Cheat Sheet
Mobile Meals Walk Through
Mobile Meals Location Services (IOS Changes)
Scaling What Works – Learnings
from More Than a Meal Research
Shon E. Gress, MSHCS, BSC
Certified Administrator of Aging Services
Executive Director/CEO
Meals on Wheels Guernsey County
Guernsey County Senior Citizens Center, Inc.

• Founded in 1972—501 C 3 Private Non-Profit
• Multi-Senior Services provider—Home Delivered & Congregate Meals, 6 Satellite Sites, Homemaking-Home Health, Transportation,Wellness, Social, Educational, Recreational, Cultural Enrichment Activities, Legal Assistance
• Funded by Senior Services Tax Levy, Meals on Wheels Tax Levy, Title III, Medicaid Waiver-PASSPORT, United Way, Care Coordination
Donations, & Grants
Who is Meals on Wheels Guernsey County?
A Little Bit About Us…
• Meals As You Mend Program (Transitional Care Meals—Collaborative with
Ohio Department of Aging-Southeastern Med Hospital)
• Pets Enjoy Treats (PET Program)
• Senior Supplemental Food Commodities
• More Than A Meal Phase II & III—National Research Projects
A Little Bit More About Us…

MTAM III − Journey & Lessons
LearnedReadiness and organizational culture is important (early
inclusion and good communication throughout the process).
Hired a Full-Time Care Navigator (In-House Assessor)
Acquired Tablets & ServTracker – Mobile Meal Delivery &
Change of Condition Technology
• Included 23 Tablets (16-18 Routes + 5 Satellite Sites)
• We opted to incorporate all delivery routes
• Drivers were phased-in and went live within 5-7 days
Because we were transitioning from a manual
paper-based system to a technology-based one, our delivery
drivers’ receptiveness to technology was an initial concern.

MTAM III − Journey & Lessons
LearnedWe included home delivered meal delivery drivers in our
on-site ServTracker Training (Hands-on demo with tablets
cured our apprehensions and their concerns).
Less challenges and apprehensions than anticipated:
(Receptiveness to technology was overwhelmingly positive)
• Drivers were very engaged and eager to use the system
• Full buy-in and support at the driver level
Advantage: Accessible Solutions/ServTracker was able to
better answer questions our administration wouldn’t have
been able to answer this early in the pre-launch process.
MTAM III − Journey & Lessons Learned
Having a knowledgeable ServTracker Representative on-site
to conduct our initial training was a key to the overall
understanding and acceptance of how the system worked; this
translates to much less paperwork on the driver’s part.
Staff was respectful and receptive.
This could be different for volunteer driver programs.
Generational and staffing structures may differ and vary.

Tablet Challenges: Computer Usage/Hand Held Technology Policies and
Acknowledgements (tablets while driving, privacy on tablets/personal use, etc.)
• Policies
• Type of Cases (Heavy Duty), Seasonal Accidents
• Centralized Tablet Location
• Recharging Dock
• Tablet Sign-out & Sign-In
• Tablet Insurance
• Premiere/Group Purchasing Consortium Agreements − Pricing
Equipment/Discounts
Tool Box was very helpful − we’re in the process of customizing it more for our
program.
MTAM III—Journey & Lessons
Learned
MTAM III − Journey & Lessons Learned
Nutrition Department Supervisors were encouraged to help bring staff along,
lead drivers into the program and foster support.
• Accurate record keeping, easy to do, value to client and program
• Incentive for 100% Accuracy: Pizza Party
• Staff embraces & is accustomed to change
• Technological savviness is key; may need to work one-on-one with those
who struggle
• Able to significantly reduce billing paperwork by well over 80%
Keeping delivery personnel updated and sharing Wellness Alert reports
helps to keep them actively engaged and alerting.

Wellness Alert Cheat Sheet:Wellness Indicators and Examples of Corresponding Observations
Health
(Physical/Mental)
Self-Care/
Personal
Safety
Mobility NutritionHome
Environment
Social
Engagement/
Community
Connection
Emergency
Unusual breathing
New bruises
Apparent change in
mood or behavior
Confusion
Swelling
Muscle weakness
Fatigue
Facial droop
Change in skin color
New communication
problem
Smells badly
Disheveled
appearance
Suspected
signs of neglect
or abuse
New limp
Takes longer
than usual to
answer door
Unsteady on
Feet
Less mobile
than usual
Visible
weight loss
or gain
Loss of
appetite
Concerns
about fluid
Intake
Uneaten
meals
Ill-fitting or
lost dentures
New dental
problem
Home look unsafe
Dirtier and/or
more cluttered
than usual
Difficulty
managing home
Maintenance
Heating/cooling
problem
Unsafe electrical,
carpet, or other
walking surfaces
Reported loss
of friend,
family or pet
Loss or change
in support from
caregiver,
family or social
network
Change in
participation in
usual social or
religious
activities
Call 911
Call the office
*Use of this
emergency
alert is for
tracking
purposes
only
Wellness Alert Cheat Sheet:Wellness Indicators and Examples of Corresponding Observations
Physical
Health
Mental
Health
Self-Care/
Personal
Safety
Mobility NutritionHome
Environment
Social
Engagement/
Community
Connection
Emergency
Unusual
breathing
New bruises
Swelling
Muscle
weakness
Fatigue
Facial droop
Change in
skin color
Confusion
New
Communica-
tion problem
Apparent
change in
mood or
behavior
Smells
badly
Disheveled
appearance
Suspected
signs of
neglect or
abuse
New limp
Takes longer
than usual
to answer
door
Unsteady on
feet
Less mobile
than usual
Visible
weight
loss or
gain
Loss of
appetite
Concerns
about
fluid intake
Uneaten
meals
Ill-fitting or
lost
dentures
New dental
problem
Home looks
unsafe
Dirtier and/or
more cluttered
than usual
Difficulty
managing
home
maintenance
Heating/
cooling
problem
Unsafe
electrical,
carpet, or
other walking
surfaces
Reported loss
of friend,
family or pet
Loss or change
In support from
caregiver, family
or social
network
Change in
participation
in usual
social or
religious
activities
Call 911
Call the
office
*Use of this
emergency
alert is for
tracking
purposes
only

SERVTracker
Screen Shots:
Access to Information
and Data
Resolved Indicator
Information given from the driver in Real Time

ServTracker allows users to see where drivers are, how many meals have been delivered and the number of meals that are still to be delivered. Messages can be sent to the drivers using this application also and it will verify that the message was viewed.
# of Stops not Completed# of Completed StopsTotal
Stops
This Pie Chart represents all meals that are to be delivered. It allows you to see in real time when the meals are delivered and the percentages of delivered, not attempted, and not delivered meals. As the not delivered meals are identified phone calls can be made to see if they are at home and meals can be taken back to them. These may also be late cancelations.

August 2017 -March 2018
# of clients 151 24%
# of total alerts 262
# resolved clients 141
# of resolved alerts 251
Open Alerts 7
Open Client Cases 7
Total Active Clients 638
Alerts by
month
Clients by
month
Aug-17 4 4
Sep-17 58 33
Oct-17 35 30
Nov-17 32 26
Dec-17 27 23
Jan-18 21 18
Feb-18 45 38
Mar-18 52 38
274 210
0
10
20
30
40
50
60
70
Aug-17 Sep-17 Oct-17 Nov-17 Dec-17 Jan-18 Feb-18 Mar-18
Aug-17 Sep-17 Oct-17 Nov-17 Dec-17 Jan-18 Feb-18 Mar-18
Alerts by month 4 58 35 32 27 21 45 52
Clients by month 4 33 30 26 23 18 38 38
Alerts/Clients by Month
A. HealthB. Self-Care
C. Mobilty D. Nutrition E. Home F. SocialG.
Emergency
Alert Categories 182 19 27 10 25 7 4
020406080
100120140160180200
Number of Alerts by Category

January 2018- July 2018
# of clients 185 34%
# of total alerts 345
# resolved clients 179
# of resolved alerts 337
Open Alerts 8
Open Client Cases 8
Total Active Clients 597
Alerts by
month
Clients by
month
Jan-18 21 18
Feb-18 45 38
Mar-18 52 38
Apr-18 49 41
May-18 59 46
Jun-18 40 31
Jul-18 79 56
345 268
Health was one category Aug 2017-Mar
2018…Jan 2018 to Current is two categories
0
10
20
30
40
50
60
70
80
90
Jan-18 Feb-18 Mar-18 Apr-18 May-18 Jun-18 Jul-18
Jan-18 Feb-18 Mar-18 Apr-18 May-18 Jun-18 Jul-18
Alerts by month 21 45 52 49 59 40 79
Clients by month 18 38 38 41 46 31 56
Alerts/Clients by Month
AHealth
Physical
/Mental
B.HealthPysical
C.HealthMental
D. Self-Care
E.Mobilty
F.Nutritio
n
G.Home
H.Social
I.Emerge
ncy
J.Person
alSafety
Alert Categories 121 132 8 1 37 11 13 10 3 6
0
20
40
60
80
100
120
140
Number of Alerts by Category
After MTAM Phase III—Alert Data 2018
Alert Categories Clients
A. Health 182 120 66%
B. Self-Care 19 12 7%
C. Mobility 27 25 10%
D. Nutrition 10 8 4%
E. Home 25 18 9%
F. Social 7 7 3%
G. Emergency 4 4 1%
274 194
Alert Categories Clients Alert %
A Health Physical /Mental 220 137 44%
B. Health Physical 132 89 27%
C. Health Mental 8 7 2%
D. Self-Care 1 1 0%
E. Mobility 52 44 10%
F. Nutrition 16 14 3%
G. Home 30 22 6%
H. Social 14 14 3%
I. Emergency 4 4 1%
J. Personal Safety 21 14 4%
498 232
MTAM Phase III—Alert Data Aug. 2017- Mar. 2018

What’s Next?• Opportunity for continued involvement in MTAM
future projects
• Provides an advantage to create efficiencies to
better serve more clients
• Decreases paperwork and creates more time for
personnel development and support
• Supports adding integrity and added value to
Meals on Wheels program - not “just delivering
a meal”
• Creates opportunities to expand and enhance
services/programs versus limiting
capacity/building in size & scope (growth)
Future and Broader Opportunities
What’s Next?• Sets foundation for exploring design and
creation of innovative technology for better
interfacing and transmitting direct Change of
Condition reporting/communications with local
APS, databases, external facing Personal Care
Providers and Primary Care Physicians, etc.
• Better positioned to leverage person-centered,
sustainable, contemporary, and competitive
services and supports that better address social
determinants of health (e.g., malnutrition, safety)
• Benefit of collecting and reporting data, which
helps support your organization to be a
community solution for population health
management.
Future & Broader Opportunities

What’s Next? Future and Broader Opportunities
• Paves the way to begin dialogue and engagement with
healthcare entities – aligning services to better meet
payer/provider needs
• Creates an innovative platform to better identify and
advocate for positive changes in policies and regulations
to support payment of health-related support services
What’s Next?• Evening Routes: potential for fall
prevention focus
• Added safety benefits
• Keep clients and staff safe; use the
app to promote safety of both driver and
client
• Use video/photos to support story
(capture accident/emergency with client consent)
• Ability to track and monitor the location of
devices/drivers (retrace steps and location)
• Potential to alert local sheriff/police in “real time”
Future and Broader Opportunities

What’s Next?
•Opportunity to better integrate and
communicate with Healthcare Providers and
Managed Care Organizations
•Expressed interest in expanding the “Change
of Condition” trigger/alert details within the
respective categories
•Replication and “Change of Condition”
reporting “becomes a new innovative industry
standard”
•For us…there’s no going back to the old
way of doing things.
Future & Broader Opportunities
Thank You
Thank you for the work that YOU do every
day with your partners in your own local
communities to help end senior hunger &
address social determinants of health!
Contact InformationShon E. Gress
Executive Director/CEO
• Tel: (740) 439-6681
• www.GuernseySenior.org
Related Documents