673 Estimates of demographic parameters, such as growth and mortality rates, are fundamental to the understanding of a species population dynamics and for predicting responses of populations to exploitation. Processes affecting popu- lation dynamics operate at a number of spatial and temporal scales (Levin, 1992) and can result in subpopulations with distinct demographics. Differences in demography between populations may suggest geographic or reproduc- tive isolation (or both) and as such have been used in stock identification for fisheries assessment and manage- ment purposes (e.g. Begg et al., 1999). Identifying the “unit stock” has been the primary focus of studies of spatial structure of harvested populations in most fisheries. Knowledge of spatial structure within a unit stock is impor- tant for both fisheries management, because potential yields may vary spatially within a population (Caddy, 1975), and for conservation, in order to maintain intraspecific diversity (Niel- son, 1998). Hence, it is important to estimate demographic parameters over a range of temporal and spatial scales to determine the scale(s) at which the parameters vary significantly (Caley et Scales of spatial variation in demography of a large coral-reef fish—an exception to the typical model? Ashley J. Williams School of Marine Biology and Aquaculture and CRC Reef Research Centre James Cook University Townsville, Queensland, 4811, Australia E-mail address: [email protected] Campbell R. Davies Bruce D. Mapstone CRC Reef Research Centre James Cook University Townsville, Queensland 4811, Australia Garry R. Russ School of Marine Biology and Aquaculture James Cook University Townsville, Queensland, 4811, Australia Manuscript approved for publication 17 December 2002 by Scientific Editor. Manuscript received 4 April 2003 at NMFS Scientific Publications Office. Fish Bull. 101:673–683 (2003). Abstract—Spatial variation in demo- graphic parameters of the red throat emperor (Lethrinus miniatus) was examined among 12 coral reefs in three geographic regions (Townsville, Mackay, and Storm Cay) spanning over 3° of latitude of the Great Bar- rier Reef, Australia. Estimates of demographic parameters were based on age estimates from counts of annuli in whole otoliths because there was no significant difference in age estimates between whole and sectioned otoliths. There were significant regional differ- ences in age structures, rates of somatic and otolith growth, and total mortality. The Townsville region was character- ized by the greatest proportion of older fish, the smallest maximum size, and the lowest rates of otolith growth and total mortality. In contrast the Mackay region was characterized by the highest proportion of younger fish, the largest maximum size, and the highest rates of otolith growth and total mortality. Demographic parameters for the Storm Cay region were intermediate between the other two regions. Historic differ- ences in fishing pressure and regional differences in productivity are two alternative hypotheses given to explain the regional patterns in demographic parameters. All demographic param- eters were similar among the four reefs within each region. Thus, subpopula- tions with relatively homogeneous demographic parameters occurred on scales of reef clusters. Previous stud- ies, by contrast, have found substantial between-reef variation in demographic parameters within regions. Thus spa- tial variation in demographic param- eters for L. miniatus may differ from what is assumed typical for a coral-reef fish metapopulation. al., 1996) and, therefore, to infer which scales are of greatest importance for assessment and management purposes (Sale, 1998). Most coral-reef fish exist as metapop- ulations of sedentary adult populations linked by pelagic larval dispersal (Sale, 1998). Consequently, adult populations of reef fish are commonly spatially seg- regated and may be exposed to different environmental, biological, and ecologi- cal processes, resulting in spatial dif- ferences in demographic parameters at a range of spatial scales. Relatively few studies, however, have focussed on spatial variation in demographic pa- rameters of harvested species of coral- reef fish. Those that have, have gener- ally focussed on spatial scales within individual reefs or among reefs within a single region (e.g. Ferreira and Russ, 1995; Hart and Russ, 1996; Newman et al., 1996). Comprehensive multiscale approaches are rare (but see Adams et al., 2000; Meekan et al., 2001). The spatial structure of coral-reef populations has generated considerable interest in terms of the use of spatial closures, or marine protected areas (MPAs), as an effective tool for their management (Roberts and Polunin,

Welcome message from author
This document is posted to help you gain knowledge. Please leave a comment to let me know what you think about it! Share it to your friends and learn new things together.
Transcript

673
Estimates of demographic parameters, such as growth and mortality rates, are fundamental to the understanding of a species population dynamics and for predicting responses of populations to exploitation. Processes affecting popu-lation dynamics operate at a number of spatial and temporal scales (Levin, 1992) and can result in subpopulations with distinct demographics. Differences in demography between populations may suggest geographic or reproduc-tive isolation (or both) and as such have been used in stock identifi cation for fi sheries assessment and manage-ment purposes (e.g. Begg et al., 1999).
Identifying the “unit stock” has been the primary focus of studies of spatial structure of harvested populations in most fisheries. Knowledge of spatial structure within a unit stock is impor-tant for both fisheries management, because potential yields may vary spatially within a population (Caddy, 1975), and for conservation, in order to maintain intraspecifi c diversity (Niel-son, 1998). Hence, it is important to estimate demographic parameters over a range of temporal and spatial scales to determine the scale(s) at which the parameters vary signifi cantly (Caley et
Scales of spatial variation in demography of a large coral-reef fi sh—an exception to the typical model?
Ashley J. Williams School of Marine Biology and Aquaculture
and
CRC Reef Research CentreJames Cook University Townsville, Queensland, 4811, AustraliaE-mail address: [email protected]
Campbell R. DaviesBruce D. MapstoneCRC Reef Research CentreJames Cook UniversityTownsville, Queensland 4811, Australia
Garry R. RussSchool of Marine Biology and AquacultureJames Cook University Townsville, Queensland, 4811, Australia
Manuscript approved for publication 17 December 2002 by Scientifi c Editor.Manuscript received 4 April 2003 at NMFS Scientifi c Publications Offi ce.Fish Bull. 101:673–683 (2003).
Abstract—Spatial variation in demo-graphic parameters of the red throat emperor (Lethrinus miniatus) was examined among 12 coral reefs in three geographic regions (Townsville, Mackay, and Storm Cay) spanning over 3° of latitude of the Great Bar-rier Reef, Australia. Estimates of demographic parameters were based on age estimates from counts of annuli in whole otoliths because there was no signifi cant difference in age estimates between whole and sectioned otoliths. There were signifi cant regional differ-ences in age structures, rates of somatic and otolith growth, and total mortality. The Townsville region was character-ized by the greatest proportion of older fi sh, the smallest maximum size, and the lowest rates of otolith growth and total mortality. In contrast the Mackay region was characterized by the highest proportion of younger fi sh, the largest maximum size, and the highest rates of otolith growth and total mortality. Demographic parameters for the Storm Cay region were intermediate between the other two regions. Historic differ-ences in fi shing pressure and regional differences in productivity are two alternative hypotheses given to explain the regional patterns in demographic parameters. All demographic param-eters were similar among the four reefs within each region. Thus, subpopula-tions with relatively homogeneous demographic parameters occurred on scales of reef clusters. Previous stud-ies, by contrast, have found substantial between-reef variation in demographic parameters within regions. Thus spa-tial variation in demographic param-eters for L. miniatus may differ from what is assumed typical for a coral-reef fi sh metapopulation.
al., 1996) and, therefore, to infer which scales are of greatest importance for assessment and management purposes (Sale, 1998).
Most coral-reef fi sh exist as metapop-ulations of sedentary adult populations linked by pelagic larval dispersal (Sale, 1998). Consequently, adult populations of reef fi sh are commonly spatially seg-regated and may be exposed to different environmental, biological, and ecologi-cal processes, resulting in spatial dif-ferences in demographic parameters at a range of spatial scales. Relatively few studies, however, have focussed on spatial variation in demographic pa-rameters of harvested species of coral-reef fi sh. Those that have, have gener-ally focussed on spatial scales within individual reefs or among reefs within a single region (e.g. Ferreira and Russ, 1995; Hart and Russ, 1996; Newman et al., 1996). Comprehensive multiscale approaches are rare (but see Adams et al., 2000; Meekan et al., 2001).
The spatial structure of coral-reef populations has generated considerable interest in terms of the use of spatial closures, or marine protected areas (MPAs), as an effective tool for their management (Roberts and Polunin,

674 Fishery Bulletin 101(3)
1991). However, the lack of information about the stock structure of, and connectivity among, adult populations has hindered MPA design (Walters and Bonfi l, 1999). Conser-vation management of the Great Barrier Reef (GBR) has included the use of spatial closures of areas to activities, including fi shing, for more than 15 years. The majority of spatial closures to line fi shing are of individual coral reefs or groups of reefs. This spatial management strategy is underpinned by the assumption of the metapopulation model of coral-reef fi sh described above. That is, closing individual reefs to fi shing will protect the adult popula-tions on those reefs, and potentially provide a source of larvae to areas open to fi shing. Management of line fi shing on the GBR currently includes bag limits for recreational fi shermen and minimum-size restrictions that are uniform for all fi shermen and across the entire area of the fi shery. Such management regulations are based on the assump-tion that the demography of target species does not vary substantially over the species range and on the assump-tion that that populations on the GBR represent a single, homogeneous stock.
The red throat emperor (Lethrinus miniatus) (also known as the trumpet emperor) is a relatively long-lived (>20 years) (Loubens, 1980; Brown and Sumpton, 1998) member of the Lethrinidae and has a restricted distribu-tion in the western Pacifi c and eastern Indian Oceans (Car-penter and Allen, 1989). On the GBR it is the second most important demersal species in a multispecies line fi shery, contributing up to 1000 metric tons annually to the com-bined commercial and recreational catch (Mapstone et al.1; Higgs2). As with many tropical lethrinids, information on the biology and ecology of L. miniatus is scarce. The limited data available indicate that L. miniatus is usually associ-ated with coral reefs, but that it is also commonly caught in deeper water, in sand, and rubble areas between reefs (Carpenter and Allen, 1989; Newman and Williams, 1996; Williams and Russ3). The habitat of juvenile L. miniatusis unknown, but Williams and Russ3 have suggested that juveniles may occupy the deeper rubble areas adjacent to reefs. Like some other coral-reef fi sh, L. miniatus is thought to form large aggregations associated with spawning
4 Russell, M. 2001. Spawning aggregations of reef fi shes on the Great Barrier Reef: implications for management. Report from the Great Barrier Reef Marine Park Authority, 37 p. [Available from the Great Barrier Reef Marine Park Authority, P.O. Box 1379, Townsville, Queensland, Australia, 4810].
5 Davies, C. R., B. D. Mapstone, A. Ayling, D. C. Lou, A. Punt, G. R. Russ, M. A. Samoilys, A. D. M. Smith, D. J. Welch, and D. McB. Williams. 1998. Effects of line fi shing experiment 1995−1997: project structure and operations. Supplementary to progress report. CRC Reef Research Centre, Townsville, Australia, 28 p. [Available from the CRC Reef Research Centre, P.O. Box 772, Townsville, Queensland, Australia 4810).
6 Mapstone, B. D., C. R. Davies, D. C. Lou, A. E. Punt, G. R. Russ, D. A. J. Ryan, A. D. M. Smith, and D. McB. Williams. 1998. Effects of line fi shing experiment 1995-1997: progress report. CRC Reef Research Centre, 86 p. [Available from the CRC Reef Research Centre, P.O. Box 772, Townsville, Queensland, Australia 4810].
1 Mapstone, B. D., J. P. McKinlay, and C. R. Davies. 1996. A description of commercial reef line fi shery logbook data held by the Queensland Fisheries Management Authority. Report to the Queensland Fisheries Management Authority from the Cooperative Research Centre for the Ecologically Sustainable Development of the Great Barrier Reef, and the Department of Tropical Environmental Studies and Geography, James Cook University, Queensland, Australia, 480 p. [Available from the Queensland Fisheries Service, G.P.O. Box 46, Brisbane, Queensland, Australia 4001.]
2 Higgs, J. 2001. Experimental recreational catch estimates for Queensland residents. Results from the 1999 diary round. RFISH technical report no. 3. Queensland Fisheries Service, Aus-tralia, 62 p. [Available from the Queensland Fisheries Service, G.P.O. Box 46, Brisbane, Queensland, Australia 4001.]
3 Williams, D. McB., and G. R. Russ. 1994. Review of data on fi shes of commercial and recreational fi shing interest on the Great Barrier Reef. Report to the Great Barrier Reef Marine Park Authority, 103 p. [Available from the Great Barrier Reef Marine Park Authority, P.O. Box 1379, Townsville, Queensland, Australia, 4810.]
(Russell4). These available data suggest that L. miniatusadults have the capacity to move among individual reefs on the GBR. This movement pattern contrasts with informa-tion on movement patterns of other large coral-reef spe-cies such as the coral trout (Plectropomus leopardus) (also known as the leopard coral grouper, Heemstra and Randall, 1993) where adults show limited movement within a single reef and very restricted movements between reefs (Davies, 1995). It also contrasts with movement patterns of the ma-jority of coral-reef fi sh, where adults are known to have very restricted home ranges and display little, if any, move-ment between reefs (Lewis 1997; Sale, 1998). Therefore the relevant spatial scale affecting demographic parameters of L. miniatus may be larger than an individual reef and thus is different from that for most “typical” coral-reef fi sh.
The central objective of this study was to determine how the spatial patterns in demography of large, more mobile reef fi sh differ from smaller site-attached reef-fi sh species. To achieve this we used validated age estimates to examine spatial variation in demographic parameters of populations of L. miniatus across two spatial scales most relevant to as-sessing and managing the species on the GBR: 1) among individual reefs within regions and, 2) among geographic regions. Specifi cally, we estimated age structures, growth, mortality, and otolith growth rates for among four reefs (all closed to fi shing) within each of three geographic regions spanning over 500 km (over 3° of latitude) of the GBR.
Materials and methods
Collection methods
Samples of L. miniatus were collected from three geo-graphic regions of the GBR as part of a large-scale manip-ulative experiment to examine the effects of line fi shing on the GBR (Davies et al.5; Mapstone et al.6). The three regions cover most of the distribution of L. miniatus on the GBR (Fig. 1), which is restricted to the southern 50% of the GBR. Within each region L. miniatus were collected from six individual reefs. Four of these reefs were zoned “Marine National Park B” and were closed to all forms of fi shing (referred to as “closed reefs” in this article) whereas the other two reefs were zoned “General Use B” and were

675Williams et al.: Scales of spatial variation in demography of a large coral-reef fi sh�����������������
2
3
1
2
3
5 Km
7 Km
8 Km
140º00´E 150º00´E10º00´S
20º00´S
Dip ReefFaraday Reef
Yankee Reef
Glow Reef
20-136
20-137
Bax Reef
20-142
21-13021-131
21-13221-133
1
N
Gladstone
Mackay
Townsville
AUSTRALIA
Cairns
Figure 1 Location of reefs sampled for L. miniatus from October 1995 to January 1996 in the 1) Townsville, 2) Mackay, and 3) Storm Cay regions of the Great Barrier Reef, Australia. Reefs maps indicate the relative position of the four reefs closed to fi shing that were sampled in regions 1, 2, and 3.
open to line and spear fi shing (referred to as “open reefs”). Fishing had been prohibited from the closed reefs for at least seven years prior to sampling. Each reef was sampled for two days by the same four commercial line fi shermen using gear and sampling designs standardized across all reefs (Davies et al.5). Fork length (FL) was measured to the nearest millimetre immediately upon capture. Sagittal otoliths were removed from frozen frames in the laboratory, cleaned of any residual material, dried, and weighed to the nearest 0.1 mg.
A total of 1015 L. miniatus were collected from the four closed reefs in each region between October 1995 and Janu-ary 1996. Sample sizes from the open reefs were small and mortality and growth estimates from these reefs were unreliable. Therefore, these samples were used only to in-crease the sample size of older fi sh for a comparison of the two methods for reading otoliths (whole and sectioned).
Comparison of otolith reading methods
The annual periodicity of opaque increment formation in L. miniatus otoliths has been validated (Brown and Sumpton 1998). A subsample of 355 L. miniatus otoliths from both open and closed reefs was used to assess whether readings of whole otoliths provided age estimates similar to those from sectioned otoliths, but at substantially lower cost (in time). Otolith weight was used to select a broad range of age classes for this assessment on the assumption that
otolith weight was a coarse indicator of age, thus avoiding the need to preread otoliths to obtain a sample covering all age classes. Each otolith in the subsample was read, both whole and sectioned, on three separate occasions in random order with no prior knowledge of collection date, location, or fi sh size. For consistency, the right otolith was chosen to estimate the age of all fi sh unless it was missing or damaged, in which case the left one was used. Otoliths to be read whole were placed in a small black dish of immer-sion oil and examined under refl ected light with a stereo dissecting microscope. Counts of opaque increments were made from the nucleus to the dorsoposterior edge on the convex face of the otolith. For otoliths from older fi sh it was necessary to rotate the otolith approximately 45º to clearly observe increments on the otolith margin.
Otoliths to be sectioned were embedded in epoxy resin and cut transversely, adjacent to the anterior side of the nucleus with a Buehler Isomet low-speed saw. The poste-rior portion of the otolith was retained and mounted on a glass microscope slide with Crystalbond adhesive. A second transverse cut adjacent to the posterior side of the nucleus resulted in a thin section, incorporating the otolith nucleus, remaining on the slide. Otolith sections were then ground on 800- and 1200-grade sandpaper to remove saw marks and a single drop of immersion oil was placed on sections to fi ll surface irregularities. Otolith sections were examined under a stereo dissecting microscope with refl ected light and a black background. Counts of opaque increments were

676 Fishery Bulletin 101(3)
made from the nucleus to the proximal surface, along the dorsal margin of the sulcus acousticus.
The precision of age estimates from whole and sectioned otoliths was calculated by using the index of average per-cent error (Beamish and Fournier 1981). The estimates of age from whole and sectioned otoliths were compared by a paired t-test. Difference in bias between the two reading methods was observed by plotting the difference between the two readings (sectioned age minus whole age) against sectioned age, based on the assumption that sectioned age provided the best estimate of true age (Beamish 1979). The results from this comparison indicated no signifi cant dif-ference between whole and sectioned otolith readings and there was no discernible difference in bias in the plot. As a result, all remaining otoliths were read whole for greater effi ciency. Age estimates from whole otoliths were accepted and used in subsequent analyses when counts from the fi rst two readings agreed. If the counts differed, otoliths were read a third time. The otolith was excluded from sub-sequent analyses if no two counts agreed, but included if any two counts agreed.
Comparison of demographic parameters
The central objective of this study was to estimate the vari-ation in demographic parameters of L. miniatus, specifi -cally otolith and somatic growth rates, age structure, and mortality, at different spatial scales. In the fi rst instance, parameters were compared among the four reefs within each region to estimate the magnitude of variation at the inter-reef scale. Data were then pooled from individual reefs within each region to generate regional parameter estimates, which were used to estimate the magnitude of variation at the regional spatial scale.
The relationship between otolith weight and age (rep-resenting otolith growth) was examined for each reef by least-squares regression analysis, with otolith weight as the dependent variable. The relationship was compared among reefs within each region and among regions by us-ing analysis of covariance (ANCOVA).
Reef-specifi c age-frequency distributions were construct-ed for all reefs. Multidimensional contingency tables were used to compare age frequencies among reefs within re-gions and among regions. Age classes 4 years and younger and age classes 10 years and older were pooled into 4 and 10+ age classes, respectively, because of low frequencies in the tails of the age distributions. As a result, the analyses included a total of seven age classes.
Age-based catch curves (Ricker, 1975) were used to esti-mate the instantaneous rate of total mortality (Z) at each reef expressed on an annual basis. The number of fi sh in each age class was regressed against the corresponding age, and the descending slope provided an estimate of Z. Regressions were fi tted from the fi rst age class that was fully selected by the sampling gear through to the oldest age class that was preceded by no more than two consecu-tive zero frequencies. As a result, the age range used to estimate mortality varied slightly among reefs. Mortal-ity rates were compared among reefs within regions and among regions by using ANCOVA.
The von Bertalanffy growth function (VBGF) provided the best fi t to length-at-age data for most reefs according to the parameter estimates of the Schnute (1981) growth function. For consistency, and to enable spatial compari-sons of growth, the VBGF was used to estimate growth parameters for each reef and region:
Lt = L∞ [1–e–K–K– (K(K t–t0)],
where Lt = the fork length at age t;L∞ = the mean asymptotic fork length; K = the rate at which L∞ is approached; and t0 = the age at which fi sh have a theoretical length
of zero.
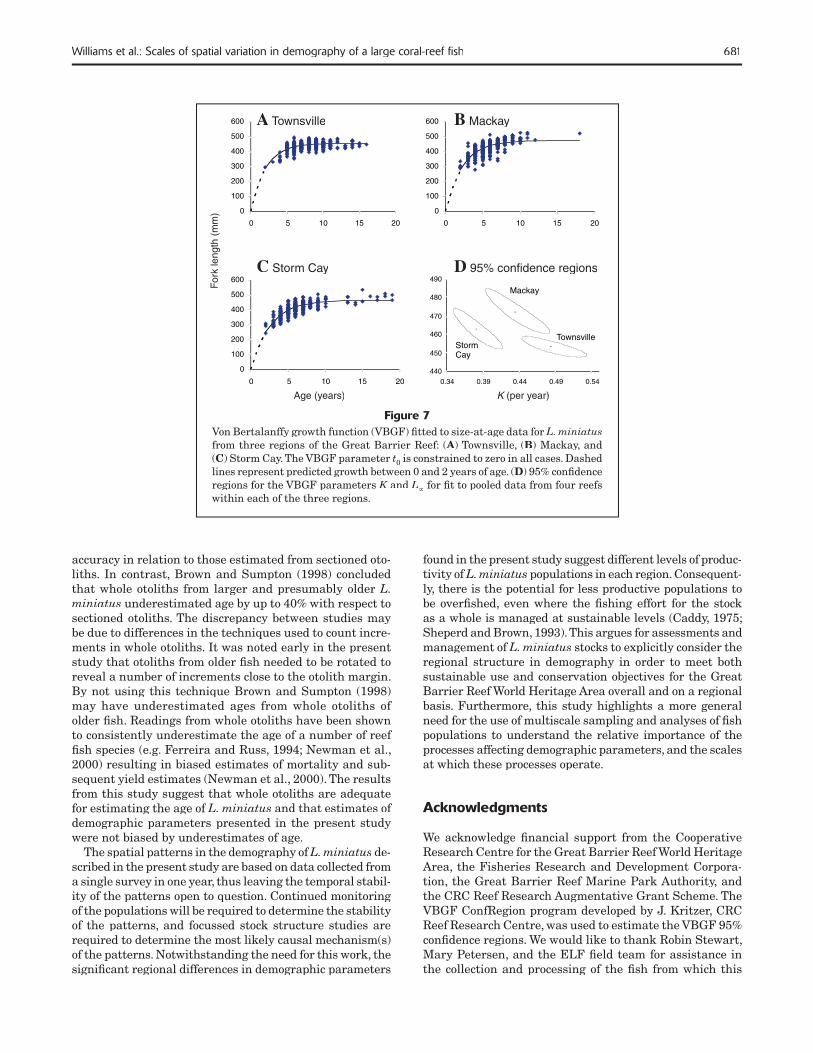
It was diffi cult to obtain a reliable estimate of initial growth because the youngest fi sh collected was 2 years old. There are also no published size-at-age data for larval or juve-nile L. miniatus, or any other lethrinid. We constrained the VBGF parameter t0 to zero to provide a better description of the likely early growth of L. miniatus. This procedure also allowed growth curves to be compared among reefs within regions and among regions by using 95% confi dence regions of the VBGF parameters L∞ and K described by K described by KKimura (1980).
Results
Comparison of otolith reading methods
Age estimates from whole and sectioned otoliths did not vary signifi cantly over the range of ages between 2 and 21 years (t0.05, 2, 354=0.46, P=0.73). That is, for each age class estimated from sectioned otoliths, the average difference between whole and sectioned otolith readings did not differ signifi cantly from zero (Fig. 2). The index of average percent error was very low for whole (1.6%) and sectioned (1.4%) otolith readings, indicating that otolith readings for both methods were highly repeatable. This low index was refl ected in the agreement of at least two age estimates for all whole otoliths, and hence no otoliths were excluded from analyses.
Otolith growth
There was a signifi cant positive linear relationship between otolith weight and age for all reefs, with regression coef-fi cients ranging from 0.64 to 0.90. ANCOVA revealed that the slope of this relationship was not signifi cantly different among reefs within each region (Townsville: F3,328F3,328F =1.91, P=0.13; Mackay: F3,341F3,341F =1.02, P 0.38; Storm Cay: P 0.38; Storm Cay: P F3,267F3,267F =1.55, P=0.20). Thus, otolith weight and age data were pooled for each region to compare the region-specifi c relationships between otolith weight and age (Fig. 3). The slopes of the region-specifi c relationships differed signifi cantly among all regions (F2,946F2,946F =28.9, P<0.001). The average growth in otolith weight was greater in the Mackay region (26.91 mg/yr) than in the Storm Cay region (24.48 mg/yr), and was least in the Townsville region (19.50 mg/yr).

677Williams et al.: Scales of spatial variation in demography of a large coral-reef fi sh
Age structure
The youngest fi sh sampled from any reef was two years of age, suggesting that L. miniatus becomes vulnerable to standard line fi shing gear at this age. All age-frequency distributions for individual reefs were unimodal and the most common mode was 6 years of age. This age is thus assumed to represent the age at which L. miniatus is fully recruited to the sampling gear. The relative frequencies of the seven age classes 4 to 10+ were not signifi cantly differ-ent among reefs within each region (Townsville: χ2= 23.59, P=0.17; Mackay: χ2=27.97, P=0.06; Storm Cay: χ2=20.29, P=0.32). As a result, age structures from individual reefs were pooled for each region (Fig. 4) and multidimensional contingency tables were used to test for regional differences in age structures. The relative frequencies of the seven age classes were signifi cantly different among all three regions (all regions: χ2=193.31, P<0.0001, Townsville vs. Mackay: χ2=172.70, P<0.0001; Townsville vs. Storm Cay: χ2=91.88, P<0.0001; Mackay vs. Storm Cay: χ2=22.27, P=0.001). The most obvious difference among regions was the greater relative abundance of older fi sh (>6 years) in the Towns-ville region than in the Mackay and Storm Cay regions (Fig. 4). However the oldest fi sh were from the Storm Cay region, where a small number of fi sh persisted in the older age-classes up to 19 years of age. The relative abundances of age classes 4 and 5 were greater in the Mackay region than in the Townsville and Storm Cay regions (Fig. 4).
Mortality
Estimates of annual total mortality rates (Z) for individ-ual reefs were generally similar among reefs within each
region, with the exception of the Storm Cay region where the estimated Z appeared much lower for reef 21-131 than for other reefs in that region (Table 1). ANCOVA indicated no signifi cant difference in mortality among reefs in any region (Townsville: F3,30F3,30F =0.80, P=0.50; Mackay: F3,20F3,20F =0.08, P=0.97; Storm Cay: F3,15F3,15F =1.14, P=0.37). Therefore mortal-ity rates were estimated for each region from the pooled age structures for all reefs within each region (Fig. 5). A comparison among regions of the regression slopes from the pooled age structures indicated signifi cant differences among regions (F2,18=7.11, P=0.005). Tukey’s multiple comparison tests revealed that the estimated Z for the Townsville (Z=0.42) and Mackay (Z=0.71) regions differed signifi cantly, whereas the estimate from the Storm Cay region (Z=0.60) did not differ signifi cantly from either Townsville or Mackay.
Sec
tione
d ag
e –
who
le a
ge (
year
s)
Sectioned age (years)
Figure 2 Mean difference in age estimates between whole and sectioned otoliths plotted against estimates of age from counts of annuli in sectioned oto-liths of L. miniatusliths of L. miniatusliths of . Horizontal line represents no difference between whole and sectioned readings. Sample sizes are shown for each age class. Error bars are 95% confi dence intervals.
������������������
1019 21 22 19 32 20 20 27
6634 27 10
18
5
7
61 1
-1.0
-0.5
0.0
0.5
1.0
0 2 4 6 8 10 12 14 16 18 20 22
Sect
ione
d ag
e �
who
le a
ge (y
ears
)
Sectioned age (years)
Oto
lith
wei
ght (
mg)
Age (years)
�����������������
0
100
200
300
400
500
600
0 5 10 15 20
0
100
200
300
400
500
600
0 5 10 15
0
100
200
300
400
500
600
0 5 10 15 20
Age (years)
Oto
lith
wei
ght (
mg)
AA Townsville Townsville
BB Mackay Mackay
C Storm CayStorm Cay
Figure 3 Least-squares linear regression of otolith weight on age for L. miniatusfrom three regions of the Great Barrier Reef: (A) Townsville, (B) Mackay, and (C) Storm Cay.

678 Fishery Bulletin 101(3)
Somatic growth
Estimates of VBGF parameters varied considerably among reefs within the Townsville and Mackay regions but in the Storm Cay region, estimates of L∞ and particularly K were K were Kvery similar (Table 1). Examination of 95% confi dence regions for VBGF parameters for individual reefs (Fig. 6) indicated considerable uncertainty in the estimates of both K and K and K L∞ and no clear differentiation among reefs within regions. The similarity in VBGF parameters for individual reefs within the Storm Cay region was particularly evident from the 95% confi dence regions. In both the Townsville and Mackay regions, three reefs showed overlap in 95%
confi dence regions, whereas only a single reef in each region appeared to have significantly different VBGF parameters from the others (Fig. 6).
Given the lack of differentiation in growth among reefs, the data from individual reefs were pooled for each region to examine regional patterns in growth. VBGF parameters varied signifi cantly among regions (Table 1) with no over-lap in the 95% confi dence regions (Fig. 7). It appeared that L. miniatus in the Mackay region attained a larger average asymptotic size (L∞=472.21 mm FL) than in the Storm Cay region (L∞=462.83 mm FL), where in turn these fi sh grew larger than fi sh in the Townsville region (L∞=453.36 mm FL). It should be noted that the constrained fi tting of the VBGF (t0 set to zero) provided a conservative estimate of regional variation in growth, and regional differences were considerably larger when the VBGF parameter t0 was not constrained to zero.
Discussion
The scale of spatial variation in demography of a large, potentially more mobile reef fi sh was found to be larger than that reported for smaller site-attached reef-fi sh spe-cies on the GBR. Estimates of otolith and somatic growth, age structure, and mortality of L. miniatus all varied more among regions than among reefs within regions. Further-more, with the exception of mortality estimates, which differed only between the Townsville and Mackay regions, all estimated parameters were significantly different among all three regions. Despite their relative proximity, the Townsville and Mackay regions consistently showed the greatest difference for each demographic param-eter. This indicates that the observed differences did not relate simply to a linear latitudinal gradient among the regions.
�����������������
0102030405060708090
100
2 4 6 8 10 12 14 16 18 20
0102030405060708090
100
2 4 6 8 10 12 14 16 18 20
0102030405060708090
100
2 4 6 8 10 12 14 16 18 20
n = 298
n = 370
n = 347
Age (years)
Freq
uenc
yFr
eque
ncy
Age (years)
A Townsville
BB Mackay
C Storm CayStorm Cay
Figure 4 Age structures for L. miniatus from three regions of the Great Barrier Reef: (A) Townsville, (B) Mackay, and (C) Storm Cay. Age structures were pooled from four closed reefs within each region.
In fr
eque
ncy
Age (years)
������������������
6 8 10 12 10
1
0 2 4 4 16 18
StormCay Townsville
Mackay
5
2
3
4
ln fr
eque
ncy
Age (years)
Figure 5 Age-based catch curves for L. miniatus from three regions of the Great Barrier Reef: = Townsville; , Mackay; = Storm Cay. Catch curves were derived from pooled age structures from four closed reefs within each region. Open data points were not used in the regressions.

679Williams et al.: Scales of spatial variation in demography of a large coral-reef fi sh
Table 1Total mortality (Z) and von Bertalanffy growth parameters for L. miniatus collected from four reefs within three regions of the Great Barrier Reef. The von Bertalanffy growth parameter t0 was constrained to zero for all reefs.
Mortality Growth
Region Reef n Age range (years) Z r2 L∞ (mm) K
Townsville Glow 110 6-14 0.30 0.74 456.21 0.48Dip 90 6-15 0.40 0.89 445.77 0.60Yankee 96 6-16 0.31 0.86 462.44 0.40Faraday 51 6-11 0.29 0.90 442.26 0.59Pooled 347 6-16 0.42 0.92 453.36 0.48
Mackay 20-136 92 6-11 0.47 0.93 488.87 0.4120-137 93 5-11 0.52 0.97 481.68 0.4220-142 92 5-10 0.54 0.67 446.28 0.47Bax 93 6-12 0.55 0.85 450.78 0.55Pooled 370 6-12 0.71 0.97 472.21 0.43
Storm Cay 21-130 70 6-10 0.76 0.93 466.76 0.3821-131 78 6-10 0.43 0.92 463.03 0.3921-132 81 6-10 0.66 0.69 453.44 0.3821-133 69 6-10 0.77 0.99 467.44 0.38Pooled 298 6-10 0.60 0.91 462.83 0.38
The homogeneity of demographic parameters among reefs within regions presented here is not consistent with a number of studies of other reef fi sh species on the GBR (e.g. Doherty and Fowler, 1994; Hart and Russ, 1996; Newman et al., 1996). These other studies demonstrated signifi cant differences in age structures, somatic growth, mortality, and otolith growth among individual reefs within a single geographic region for several smaller reef-associated lutjanid, acanthurid and pomacentrid species. The consistency of demographic parameters among reefs within regions found in the present study is consistent with an hypothesis that L. miniatus may move over larger distances than “typical” coral-reef fi sh, including being capable of movements among reefs within a region. There are limited direct data on the movement of L. miniatus, and lethrinids in general, or about the range of habitats they occupy. However, L. miniatus is frequently found on shoal grounds between reefs and to depths of at least 128 m (Newman and Williams, 1996), suggesting a strong po-tential for L. miniatus to move among reefs. Movements of adults among coral reefs would suggest that L. miniatusdoes not fi t the typical metapopulation model for coral-reef fi sh, in which adults are confi ned to a single coral reef, and the pelagic larval stage is the only means of dispersal among reefs. Accordingly, differences in conditions among neighboring reefs would be less likely to be manifest in demographic parameters of L. miniatus than in the demo-graphic parameters of more sedentary species that inhabit only a single reef for their postsettlement life.
Using microsattelite markers, van Herwerden et al. (in press) examined the genetic structure of L. miniatuspopulations on the GBR. They sampled from two reefs within the Townsville (Dip and Glow) and Mackay (Bax
and 20-137) regions in addition to two other reefs in the far southern GBR (Sweetlip and Sandshoe). They found no evidence of stock structure for L. miniatus populations on the GBR indicating that the regional patterns in de-mographic parameters of L. miniatus are not a result of distinct genetic stocks. This is consistent with other genetic studies that have demonstrated a lack of genetic structur-ing of coral-reef fi shes over large spatial scales of hundreds to thousands of kilometers (Doherty et al., 1995; Shulman and Bermingham, 1995; Dudgeon et al., 2000).
The observed regional variation in demography may be the result of regional differences in postsettlement processes, such as competition (Jones, 1987), food and habitat availability (Hart and Russ, 1996), population density (Doherty, 1983), and water temperature (Conover, 1992). Alternatively, the regional variation in demography may have resulted from regional variation in recruitment, coupled with density dependent processes (Doherty and Fowler, 1994), or the factors that infl uence larval survival and settlement. Unfortunately data for these processes for L. miniatus are at best limited, restricting any conclusion on the causative factor(s) driving the observed regional patterns. However, because demographic parameters for L. miniatus do not show a linear trend with latitude, factors such as water temperature, which have strong latitudinal gradients on the GBR (Lough, 1994), are unlikely to inde-pendently explain the observed differences. Meekan et al. (2001) also found that temperature did not appear to be a causal factor driving spatial differences in demography of damselfi shes in the tropical eastern Pacifi c Ocean.
Estimates of numerical density of L. miniatus on the GBR are greater in the southern regions (Mackay and Storm Cay) than on reefs in the Townsville region (Wil-

680 Fishery Bulletin 101(3)
liams and Russ3). Under the assumptions that demo-graphic parameters are density dependent, and densities are high enough for density-dependent effects to operate, the spatial pattern in densities is consistent with the ob-served patterns in age structures and mortality. However, the observed patterns in growth are inconsistent with the expected pattern, if density dependence was the dominant infl uencing mechanism. We would not expect L. miniatusto reach a larger size in the southern regions, where densi-ties are higher, compared with the Townsville region, where densities are lower, unless conditions were more favourable in the southern regions. It would be necessary to invoke another mechanism, such as regional differences in food availability, acting in combination with density depen-
dence, to explain the overall pattern of growth, mortality, and age structure.
The likelihood that the observed regional variation is due to a response to regional differences in historic (1960s−1980s) fi shing pressure bears consideration. L. miniatus are vulnerable to standard line fi shing gear from approximately two years of age and are fully recruited to the line fi shing gear by six years of age. The reefs in this study had been closed to fi shing for seven years prior to sampling. Consequently, all cohorts older than 9 years of age could have been fi shed prior to the reef closures in 1988, and before the availability of spatially referenced catch and effort data for the commercial fi shery. Anecdotal evidence on the development of the fi shery and its opera-tion suggests that it developed from the southern ports of Gladstone and Mackay (Fig. 1), which have remained the dominant commercial line fi shing ports in the fi shery (Mapstone et al.1). It seems plausible, therefore, that po-tentially higher historic fi shing effort in the southern two regions could have modifi ed the population structure of L. miniatus suffi ciently to produce signifi cant differences in demography. Given the longevity of the species, it is also plausible that current differences in the populations are the result of lagged recovery following the closure of the reefs to fi shing.
Brown and Sumpton (1998) found small differences in growth rates, and signifi cantly different total mortality rates, between populations of L. miniatus in the Swain Reefs and those in the Capricorn-Bunker regions of the southern GBR (separated by ~1° latitude). They attributed the difference in growth estimates to the selectivity of the gear used to obtain samples and to the different mortality rates to differences in fi shing pressure between the two regions. They dismissed the possibility that these differ-ences were a result of separate populations with different dynamics. However it is diffi cult to separate the confound-ing effects of regional differences in fi shing pressure and gear selectivity in sampling; thus variation in growth and mortality between the Swain Reefs and Capricorn Bunker region cannot be dismissed.
The consistency in demographic parameters among reefs within each region suggests that populations of L. minia-tus may be well mixed at the spatial scale of reef clusters and that any infl uence of environment on demographics is relatively uniform among reefs within regions. This uni-formity may be facilitated by movement of adults among reefs, or by recruitment and postsettlement processes that are relatively uniform within regions. With signifi cant movement of adults among reefs, the benefi ts of protection from individual reef closures may be limited, depending on the rate of exchange between open and closed reefs, and the level of fi shing mortality on open reefs (Russ et al., 1992; DeMartini, 1993; Walters and Bonfi l, 1999). In such a scenario, any historical effects of differences in fi shing effort among regions would be perpetuated, even though individual reefs were closed to fi shing.
In this study whole otoliths of L. miniatus provided similar age estimates to those from sectioned otoliths and thus offered a much faster alternative for age estimation for this species, without any apparent loss of precision or
������������������
0
0 20-137
420
440
46
48
500
52
0.3 0.4 0.5 0.6 0.7 0.8
20-136
Bax
20-142
0
Faraday
430
440
450
460
470
480
0.3 0.5 0.7 0.9
YankeeGlow
Dip
L � (m
m)
43044454604704804950
0.3 0.35 0.4 0.45
K (years-1)0.5
21-131
00 21-133
21-130
00 21-132
L ∞ (
mm
)
K (per year)
A Townsville
B Mackay Mackay
C C Storm CayStorm Cay
Figure 6 95% confi dence regions for L. miniatus for the von Bertalanffy growth function (VBGF) parameters K and K and K L∞ for four individual reefs within each of three regions of the Great Bar-rier Reef: (A) Townsville, (B) Mackay, and (C) Storm Cay. The VBGF parameter t0 was constrained to zero in all cases.
681Williams et al.: Scales of spatial variation in demography of a large coral-reef fi sh
accuracy in relation to those estimated from sectioned oto-liths. In contrast, Brown and Sumpton (1998) concluded that whole otoliths from larger and presumably older L. miniatus underestimated age by up to 40% with respect to sectioned otoliths. The discrepancy between studies may be due to differences in the techniques used to count incre-ments in whole otoliths. It was noted early in the present study that otoliths from older fi sh needed to be rotated to reveal a number of increments close to the otolith margin. By not using this technique Brown and Sumpton (1998) may have underestimated ages from whole otoliths of older fi sh. Readings from whole otoliths have been shown to consistently underestimate the age of a number of reef fi sh species (e.g. Ferreira and Russ, 1994; Newman et al., 2000) resulting in biased estimates of mortality and sub-sequent yield estimates (Newman et al., 2000). The results from this study suggest that whole otoliths are adequate for estimating the age of L. miniatus and that estimates of demographic parameters presented in the present study were not biased by underestimates of age.
The spatial patterns in the demography of L. miniatus de-scribed in the present study are based on data collected from a single survey in one year, thus leaving the temporal stabil-ity of the patterns open to question. Continued monitoring of the populations will be required to determine the stability of the patterns, and focussed stock structure studies are required to determine the most likely causal mechanism(s) of the patterns. Notwithstanding the need for this work, the signifi cant regional differences in demog raphic parameters
found in the present study suggest different levels of produc-tivity of L. miniatus populations in each region. Consequent-ly, there is the potential for less productive populations to be overfi shed, even where the fi shing effort for the stock as a whole is managed at sustainable levels (Caddy, 1975; Sheperd and Brown, 1993). This argues for assessments and management of L. miniatus stocks to explicitly consider the regional structure in demography in order to meet both sustainable use and conservation objectives for the Great Barrier Reef World Heritage Area overall and on a regional basis. Furthermore, this study highlights a more general need for the use of multiscale sampling and analyses of fi sh populations to understand the relative importance of the processes affecting demographic parameters, and the scales at which these processes operate.
Acknowledgments
We acknowledge fi nancial support from the Cooperative Research Centre for the Great Barrier Reef World Heritage Area, the Fisheries Research and Development Corpora-tion, the Great Barrier Reef Marine Park Authority, and the CRC Reef Research Augmentative Grant Scheme. The VBGF ConfRegion program developed by J. Kritzer, CRC Reef Research Centre, was used to estimate the VBGF 95% confi dence regions. We would like to thank Robin Stewart, Mary Petersen, and the ELF fi eld team for assistance in the collection and processing of the fi sh from which this
0
100
200
300
400
500
600
0 5 10 15 20
0
100
200
300
400
500
600
0 5 10 15 20
0
100
200
300
400
500
600
0 5 10 15 20440
450
460
470
480
490
0.34 0.39 0.44 0.49 0.54
Townsville
Mackay
StormCay
AA Townsville
C Storm Cay Storm Cay
BB Mackay
D 95% confi dence regions 95% confi dence regions
For
k le
ngth
(m
m)
Age (years) K (per year)
Figure 7 Von Bertalanffy growth function (VBGF) fi tted to size-at-age data for L. miniatusfrom three regions of the Great Barrier Reef: (A) Townsville, (B) Mackay, and (C) Storm Cay. The VBGF parameter t0 is constrained to zero in all cases. Dashed lines represent predicted growth between 0 and 2 years of age. (D) 95% confi dence regions for the VBGF parameters K and K and K L∞ for fi t to pooled data from four reefs within each of the three regions.

682 Fishery Bulletin 101(3)
work arose. We would also like to thank three anonymous reviewers for comments that improved the quality of this manuscript. This manuscript is a contribution from the CRC Reef Effects of Line Fishing Project, CRC Reef Research Centre, Townsville, Australia.
Literature cited
Adams, S., B. D. Mapstone, G. R. Russ, and C. R. Davies.2000. Geographic variation in the sex ratio, sex specifi c size,
and age structure of Plectropomus leopardus (Serranidae) between reefs open and closed to fi shing on the Great Bar-rier Reef. Can. J. Fish. Aquat. Sci. 57:1448–1458.
Beamish, R. J.1979. Differences in age of Pacifi c hake (Merluccius produc-
tus) using whole otoliths and sections of otoliths. J. Fish. Res. Board Can. 36:141–151.
Beamish, R. J., and D. A. Fournier.1981. A method for comparing the precision of a set of age
determinations. Can. J. Fish. Aquat. Sci. 38:982–983.Begg, G. A., J. A. Hare, and D. D. Sheehan.
1999. The role of life history parameters as indicators of stock structure. Fish. Res. (Amst.) 43:141–163.
Brown, I. W., and W. D. Sumpton.1998. Age, growth and mortality of redthroat emperor Leth-
rinus miniatus (Pisces: Lethrinidae) from the southern Great Barrier Reef, Queensland, Australia. Bull. Mar. Sci. 62:905–917.
Caddy, J. F.1975. Spatial model for an exploited shellfi sh population,
and its application to the Georges Bank scallop fi shery. J. Fish. Res. Board Can. 32:1305–1328.
Caley, M. J., M. H. Carr, M. A. Hixon, T. P. Hughes, G. P. Jones, and B. A. Menge.
1996. Recruitment and the local dynamics of open marine population. Annu. Rev. Ecol. Syst. 27:477–500.
Carpenter, K. E., and G. R. Allen.1989. FAO species catalogue. Emperor fi shes and large-eyed
breams of the world (family Lethrinidae). An annotated and illustrated catalogue of lethrinid species known to date. FAO Fish. Synop. 125, 118 p. FAO, Rome.
Conover, D. O.1992. Seasonality and the scheduling of life history at differ-
ent latitudes. J. Fish Biol. 41(suppl. B):161–178. Davies, C. R.
1995. Patterns of movement of three species of coral reef fi sh on the Great Barrier Reef. Ph.D diss., 203 p. Dep. Marine Biology, James Cook Univ., Townsville, Queensland, Australia.
DeMartini, E. E.1993. Modelling the potential of fi shery reserves for manag-
ing Pacifi c coral reef fi shes. Fish. Bull. 91:414–427.Doherty, P. J.
1983. Tropical territorial damselfi shes: is density limited by aggregation or recruitment? Ecology 64:176–190.
Doherty, P. J., and A. Fowler.1994. Demographic consequences of variable recruitment to
coral reef fi sh populations: a congeneric comparison of two damselfi shes. Bull. Mar. Sci. 54:297–313.
Doherty, P. J., S. Planes, and P. Mather.1995. Gene fl ow and larval duration in seven species of fi sh
from the Great Barrier Reef. Ecology 76:2373–2391.Dudgeon, C. L., N. Gust, and D. Blair.
2000. No apparent genetic basis to demographic differences
in scarid fi shes across continental shelf of the Great Barrier Reef. Mar. Biol. 137:1059–1066.
Ferreira, B. P., and G. R. Russ.1994. Age validation and estimation of growth rate of the coral
trout, Plectropomus leopardus, (Lacepede, 1802) from LizardIsland, Northern Great Barrier Reef. Fish. Bull. 92:46–57.
1995. Population structure of the coral trout, Plectropomus leopardus (Lacepede 1802), on fi shed and unfi shed reefs off Townsville, Central Great Barrier Reef. Aust. Fish. Bull. 93:629–642.
Hart, A. M., and G. R. Russ.1996. Response of herbivorous fi shes to crown-of-thorns
starfi sh Acanthaster planci outbreaks. III. Age, growth, mortality and maturity indices of Acanthurus nigrofuscus. Mar. Ecol. Prog. Ser. 136:25–35.
Heemstra, P. C., and J. E. Randall.1993. FAO species catalogue. vol. 16. Groupers of the world
(family Serranidae, subfamily Epinephelinae). An anno-tated and illustrated catalogue of the grouper, rockcod, hind, coral grouper, and lyretail species known to date. FAO Fish Synop. 125, 292 p. FAO, Rome.
Jones, G. P.1987. Competitive interactions among adults and juveniles
in a coral reef fi sh. Ecology 68:1534–1547.Kimura, D. K.
1980. Likelihood methods for the von Bertalanffy growth curve. Fish. Bull. 77:765–776.
Levin, S. A.1992. The problem of pattern and scale in ecology. Ecology
73:1943–1967.Lewis, A. R.
1997. Recruitment and post-recruit immigration affect the local population size of coral reef fi shes. Coral Reefs 16:139–149.
Loubens, G.1980. Biologie de quelques espèces de poissons du lagon Néo-
Calédonien. III. Croissance Cah. l’Indo-Pac. 2:101–153. Lough, J.M.
1994. Climate variation and El Niño–Southern Oscillation events on the Great Barrier Reef: 1958 to 1987. Coral Reefs 13:181–195.
Meekan, M. G., J. L. Ackerman, and G. M. Wellington.2001. Demography and age structures of coral reef dam-
selfi shes in the tropical eastern Pacifi c Ocean. Mar. Ecol. Prog. Ser. 212:223–232.
Newman, S. J., M. Cappo, and D. McB. Williams.2000. Age, growth, mortality rates and corresponding yield
estimates using otoliths of the tropical red snappers, Lut-janus erythropterus, L. malabaricus and L. sebae, from the central Great Barrier Reef. Fish. Res. 48:1–14.
Newman, S. J., D. McB. Williams.1996. Variation in reef associated assemblages of the Lut-
janidae and Lethrinidae at different distances offshore in the central Great Barrier Reef. Environ. Biol. Fishes 46:123–138.
Newman, S. J., D. McB. Williams, and G. R. Russ.1996. Variability in the population structure of Lutjanus
adetii (Castelnau, 1873) and L. quinquelineatus (Bloch, 1790) among reefs in the central Great Barrier Reef. Aust. Fish. Bull. 94:313–329.
Nielson, J. L.1998. Population genetics and the conservation and man-
agement of Atlantic salmon (Salmo salar). Can. J. Fish. Aquat. Sci. 55(suppl. 1):145–152.
Ricker, W. E.1975. Computation and interpretation of biological statis-

683Williams et al.: Scales of spatial variation in demography of a large coral-reef fi sh
tics of fi sh populations. Bull. Fish. Res. Board Can. 191, 382 p.
Roberts, C. M., and N. V. C. Polunin.1991. Are marine reserves effective in management of reef
fi sheries? Rev. Fish Biol. Fish. 1:65–91.Russ, G. R., A. C. Alcala, and A. S. Cabanban.
1992. Marine reserves and fi sheries management on coral reefs with preliminary modeling of the effects of yield per recruit. Proc. of the 7th int. coral reef symp. 2, p. 988–995. Univ. Guam, Marine Lab., Mangilao, Guam.
Sale, P. F.1998. Appropriate spatial scales for studies of reef-fish
ecology. Aust. J. Ecol. 23:202–208.Schnute, J.
1981. A versatile growth model with statistically stable parameters. Can. J. Fish. Aquat. Sci. 38:1128–1140.
Sheperd, S. A., and L. D. Brown.1993. What is an abalone stock: implications for the role of refu-
gia in conservation. Can. J. Fish. Aquat. Sci. 50:2001–2009.Shulman, M. J., and E. Bermingham.
1995. Early life histories, ocean currents, and the population genetics of Caribbean reef fi shes. Evolution 49:897–910.
van Herwerden, L., J. Benzie, and C. R. Davies.In press. Microsatellite variation and population genetic
structure of red throat emperor (Lethrinus miniatus) in the Great Barrier Reef, Australia. J. Fish Biol.
Walters, C. J., and R. Bonfi l.1999. Multispecies spatial assessment models for the Brit-
ish Colombia groundfi sh trawl fi shery. Can. J. Fish. Aquat. Sci. 56:601–628.
Related Documents