Scale-specific determinants of a mixed beech and oak seedling–sapling bank under different environmental and biotic conditions Antonio Gazol • Ricardo Iba ´n ˜ez Received: 22 September 2009 / Accepted: 6 April 2010 / Published online: 16 April 2010 Ó Springer Science+Business Media B.V. 2010 Abstract The persistence of seedlings in the forest understorey is of major importance for the mainte- nance and regeneration of canopy trees in several forested ecosystems. In the present study, we exam- ine the small-scale spatial pattern of a mixed beech and oak seedling–sapling bank in two areas of an unmanaged temperate deciduous forest with different environmental conditions. We used environmental, biotic and spatial variables to establish the main factors that explain the spatial pattern of these seedling–sapling banks at different scales. The stand structure in both areas was similar, but while in plot A beech dominated the canopy, plot B was dominated by oaks. In both areas, established beech individuals showed a clear reverse J-shaped distribution, whereas established oaks showed a unimodal distribution with only a few young individuals. Seedlings of beech and oak were distributed in aggregates, whereas beech saplings had a random distribution. At broader scales, the abundance of seedlings and saplings is affected by the environment as well as by inter-species compe- tition, while at finer scales the spatial pattern is mainly influenced by stochastic processes, probably related to seed predation and establishment. The structure of the seedling–sapling bank indicates an advantage of beech over oak as far as regeneration is concerned. Beech seedlings and saplings tolerate the stress induced by the canopy and the understorey and persist for many years, while oak seedlings decline in a few years. Therefore, if current conditions persist, after canopy opening beech seedlings and saplings can grow rapidly into the canopy and the stands will move towards beech dominance. Keywords Stand structure Variation partitioning Environmental dependence Spatial autocorrelation Scale Introduction In many forest types, canopy tree species initially establish abundant new individuals in the understo- rey. Their growth is suppressed because of the strong limiting resources of the forest understorey but they can persist for many years waiting for improved growing conditions. This ‘seedling bank’ (sensu Grime et al. 1988) is an important ecological factor in the regeneration of numerous tree species that compose forest canopies (Lorimer et al. 1994; George and Bazzaz 2003). After major disturbances such as gap formation they can rapidly become new canopy trees, and play a key role in the dynamics of many forests. In temperate Europe, beech (Fagus sylvatica) and pedunculate oak (Quercus robur) are common spe- cies in forested landscapes. Both species have A. Gazol (&) R. Iba ´n ˜ez Department of Plant Biology, University of Navarra, Irunlarrea s/n, 31008 Pamplona, Spain e-mail: [email protected] 123 Plant Ecol (2010) 211:37–48 DOI 10.1007/s11258-010-9770-5

Welcome message from author
This document is posted to help you gain knowledge. Please leave a comment to let me know what you think about it! Share it to your friends and learn new things together.
Transcript
Scale-specific determinants of a mixed beech and oakseedling–sapling bank under different environmentaland biotic conditions
Antonio Gazol • Ricardo Ibanez
Received: 22 September 2009 / Accepted: 6 April 2010 / Published online: 16 April 2010
� Springer Science+Business Media B.V. 2010
Abstract The persistence of seedlings in the forest
understorey is of major importance for the mainte-
nance and regeneration of canopy trees in several
forested ecosystems. In the present study, we exam-
ine the small-scale spatial pattern of a mixed beech
and oak seedling–sapling bank in two areas of an
unmanaged temperate deciduous forest with different
environmental conditions. We used environmental,
biotic and spatial variables to establish the main
factors that explain the spatial pattern of these
seedling–sapling banks at different scales. The stand
structure in both areas was similar, but while in plot
A beech dominated the canopy, plot B was dominated
by oaks. In both areas, established beech individuals
showed a clear reverse J-shaped distribution, whereas
established oaks showed a unimodal distribution with
only a few young individuals. Seedlings of beech and
oak were distributed in aggregates, whereas beech
saplings had a random distribution. At broader scales,
the abundance of seedlings and saplings is affected by
the environment as well as by inter-species compe-
tition, while at finer scales the spatial pattern is
mainly influenced by stochastic processes, probably
related to seed predation and establishment. The
structure of the seedling–sapling bank indicates an
advantage of beech over oak as far as regeneration is
concerned. Beech seedlings and saplings tolerate the
stress induced by the canopy and the understorey and
persist for many years, while oak seedlings decline in
a few years. Therefore, if current conditions persist,
after canopy opening beech seedlings and saplings
can grow rapidly into the canopy and the stands will
move towards beech dominance.
Keywords Stand structure � Variation partitioning �Environmental dependence � Spatial autocorrelation �Scale
Introduction
In many forest types, canopy tree species initially
establish abundant new individuals in the understo-
rey. Their growth is suppressed because of the strong
limiting resources of the forest understorey but they
can persist for many years waiting for improved
growing conditions. This ‘seedling bank’ (sensu
Grime et al. 1988) is an important ecological factor
in the regeneration of numerous tree species that
compose forest canopies (Lorimer et al. 1994; George
and Bazzaz 2003). After major disturbances such as
gap formation they can rapidly become new canopy
trees, and play a key role in the dynamics of many
forests.
In temperate Europe, beech (Fagus sylvatica) and
pedunculate oak (Quercus robur) are common spe-
cies in forested landscapes. Both species have
A. Gazol (&) � R. Ibanez
Department of Plant Biology, University of Navarra,
Irunlarrea s/n, 31008 Pamplona, Spain
e-mail: [email protected]
123
Plant Ecol (2010) 211:37–48
DOI 10.1007/s11258-010-9770-5
transient seed banks (Grime et al. 1988) and their
regeneration depends on the establishment and sur-
vival of seedlings. Some authors have stressed that
both species could form a seedling bank under a
dense canopy, although their duration in time may
vary (Ziegenhagen and Kaush 1995; Welander and
Ottosson 1998). While beech seedlings can survive in
the understorey for many years, oak seedlings can
only persist for a short period of time. Moreover,
pedunculate oak is considered by many authors to be
a species which requires gaps for its regeneration
(e.g. Rozas 2003), although in pure oak stands
establishment and regeneration of seedlings could
be possible (Dobrowolska 2008).
In general, beech seedlings can survive under low
levels of light and respond rapidly to canopy opening
(Collet and Chenost 2006), although they tolerate
drought less than oak seedlings (van Hees 1997).
Moreover, both species could have problems when
competing for water, light and other resources with the
understorey vegetation (Collet et al. 1998; Lof et al.
1998; Coll et al. 2003; Lof and Welander 2004;
Provendier and Balandier 2008). In acidophilous-
mixed forests, the light conditions and the understorey
composition are different depending on whether the
canopy is dominated by beech or oak (Hardtle et al.
2003), and, therefore, beech and oak seedlings could be
differently affected. In this sense, although seedlings of
the two species could become established, their ability
to survive and grow for several years could vary, taking
into account the different ability to tolerate the biotic
stress (sensu Antos et al. 2005) of the two species.
Despite the vast literature concerning the seedling
ecology of both species, few studies have focused on
the spatial pattern of their seedling banks in natural
conditions (e.g. Rozas 2003; Kunstler et al. 2004),
although studies in other forested ecosystems have
increased our knowledge of seedling requirements
(Garcıa and Houle 2005; Messaoud and Houle 2006;
Maltez-Mouro et al. 2007). The spatial pattern of a
species may be useful as a diagnostic tool in forest
management because it may reflect the ecology of the
species under study (Miller et al. 2002). When seed
rain is not limiting, these patterns depend on the
environmental factors (biotic and abiotic) that influ-
ence their establishment (Nathan and Muller-Landau
2000). Study of the location and the abundance of adult
canopy trees help to identify the potential source of
seeds. The quantification of the seedling bank spatial
patterns serves to generate hypotheses about the
processes that influence these patterns (Perry 1998).
Moreover, the partition of the factors that explain these
patterns helps to identify the scale-specific contribu-
tion of environmental heterogeneity as well as other
biotic relationships (Borcard and Legendre 2002; Dray
et al. 2006; Laliberte et al. 2009).
In the north of Spain, where temperate forests have
their southern distribution limit, there are few studies
about the spatial pattern of seedling banks (e.g. Rozas
2003). While some characteristics of these forests
could be similar to the rest of Europe, their sensitivity
to climate warming and drying, under climate change,
could be more severe due to their vicinity to the
Mediterranean region. Thus, our main objective is to
study the scale-specific environmental and biotic
determinants of a mixed beech and oak seedling–
sapling bank and to discover if they vary depending on
the proportion of beech and oak in the canopy. For this
purpose we: (1) described the stand structure of both
species in two different areas of a mixed forest; (2)
determined the small-scale spatial pattern of the beech
and oak seedling–sapling bank; and (3) studied their
scale-specific relationship with environmental vari-
ables and the surrounding vegetation.
Materials and methods
Study site
The study site is located in the ‘Suspiro’ watershed of
the Bertiz Natural Park (438100N, 18360W), in the
northwest of Navarra, Spain. The Bertiz Natural Park
is an old-growth unmanaged temperate forest that has
been preserved without any human intervention since
its donation to the government of Navarra in 1949.
The Suspiro watershed has 132 ha dominated by
beech (F. sylvatica), with areas of a mixed beech–oak
canopy (mainly with Q. robur). The climatic condi-
tions are characterised by mild winters and moder-
ately warm summers. Temperature ranges from a
monthly low of 7.2�C in January to a monthly high of
21.6�C in July, and the long-term annual precipitation
is 1525 mm (Gobierno de Navarra 2009). The
bedrock belongs to the Palaeozoic era and is mainly
composed of silicic shales and schists.
Based on a previous study (Gazol and Ibanez
2009), two study areas (hereafter areas A and B) were
38 Plant Ecol (2010) 211:37–48
123
selected because they presented different environ-
mental conditions and a mixed beech–oak canopy.
While area A had a higher proportion of beech in the
canopy and higher values of soil moisture, area B
showed a canopy dominated by oaks and higher
values of relative radiation. The two selected study
areas were located on southern slopes, their elevation
values were 405 and 324 m, respectively, and they
were separated by 425 m.
Stand structure
In each study area, an outer square of 1,600 m2
(40 9 40 m) was established. We annotated the
coordinates and recorded the diameter of each adult
tree with a Diameter at Breast Height (hereafter
DBH) greater than 10 cm. Additionally, established
beech and oak saplings and small trees with a height
greater than 50 cm and a diameter between 1 and
10 cm (measured 25 cm above ground level) were
counted and classified in three classes according to
their diameter: small saplings (1–2 cm); large sap-
lings (2–5 cm) and small trees (5–10 cm). Seedlings
were only spatially located in a 400 m2 (20 9 20 m)
area, located in the centre of the whole study area.
Spatial patterns of the seedling–sapling banks
These two 400 m2 (20 9 20 m) areas were divided
into a grid of 100 plots of 2 9 2 m. In each plot, beech
and oak individuals with a diameter of less than 10 cm
were classified and counted in four classes according
to their diameter measured 25 cm above ground level:
seedlings (0–1 cm) and the above-mentioned diame-
ter classes (small saplings, large saplings and small
trees). The distance of each plot to the nearest beech
and oak adult was calculated. Additionally, we
assessed the abundance of each vascular plant species
using a cover-percentage scale, and species were
classified into four groups: graminoids, forbs, ferns,
shrubs and sub-canopy trees.
Several environmental variables were measured.
Cover of leaf-litter, rocks and logs was visually
assessed and depth of leaf-litter was measured twice
in each plot. Slope was measured with a clinometer
(Silva Clino Master, Silva Sweden) and aspect was
obtained with a compass and then transformed into an
exposure index on a scale of -1.0 (northeast-facing
slopes) to 1.0 (southwest-facing slopes) (Beers et al.
1966). The slope microtopography of each plot was
visually assessed using a categorical scale: concave,
flat and convex. Elevation was obtained using a laser
pointer and a 2-m long centimetre rule, referring all
the measurements to the lowest point in each area.
Top soil water content was measured five times in
each plot with a soil moisture sensor SM200 (Delta-T
device, Cambridge UK) on one dry day. During a
sunny day, a fifteen second integration of the incident
radiation was taken in each plot with a pyranometric
sensor LiCor (Li-Cor, USA). Simultaneously, the
total radiation was measured outside the forest to
calculate the relative radiation.
We annotated the UTM coordinates of each plot.
The Principal Coordinates of Neighbour Matrices
method (hereafter PCNM; Borcard and Legendre
2002) was used to transform the UTM coordinates
into spatial variables. The PCNM variables are
eigenvectors that represent the spatial structure of
the studied site at several scales. For a complete
description of the method see Dray et al. (2006). 69
PCNM variables were created with the program
SpaceMaker (Borcard and Legendre 2004) and then
classified into scales according to the pattern they
represented: variables 1 to 10 were classified as
meso-scale and the rest were coded as fine-scale
variables. The terms meso- and fine-scales do not
have absolute meaning, although they are relative to
the study grain (plot) and extent (area of study).
The spatial patterns of the different classes of
beech and oak seedlings and saplings in the plots
were analysed using Spatial Analysis by Distance
Indices (hereafter SADIE; Perry 1998; Perry et al.
1999). We focused on the index of aggregation, Ia,
and the index of clustering, v, produced by SADIE.
The Ia index quantifies the overall spatial pattern of
the variable under consideration. Values near to one
indicate a random distribution, whereas values higher
or lower indicate an aggregated or a regular distri-
bution, respectively. The v index, which indicates the
degree of clustering in the data, can be used to
represent the spatial pattern of the variable in a map.
In each study area, we performed a SADIE analysis
for beech and oak seedlings, small saplings, large
saplings and small tree class with a minimum number
of 10 individuals, as well as for each group of plant
species (cover values were previously transformed to
a decile scale). Another application of SADIE
measures the spatial association of counts (Perry
Plant Ecol (2010) 211:37–48 39
123
and Dixon 2002). Using the index of association, we
studied the relation between the spatial patterns of the
seedlings, small saplings, large saplings and small
trees. The geostatistical extension of ArcGis 9.1 (Esri
Redlands, USA) was used to create isoline maps of
the index of clustering.
Redundancy analyses with variation partitioning
(Borcard et al. 1992; Okland 2003) were used to
discover the fraction of variation in seedling–sapling
abundance explained by different explanatory matri-
ces. A separate analysis was performed in each study
area. The response matrix was composed by the
abundance of the above-mentioned beech and oak
seedlings, saplings and small trees and values were
previously log transformed (x0 = log (x ? 1)). Three
explanatory matrices were used to partition the
variation in abundance of beech and oak individuals:
(1) an environmental matrix created with the mea-
sured environmental factors; (2) a biotic matrix
composed by the cover values of the different groups
of vascular plants (graminoids, forbs, ferns, shrubs
and sub-canopy trees) as well as the distance to the
nearest beech and oak adult; and (3) a space matrix
comprising the X and Y coordinates and 69 PCNM
variables in each study area. Prior to the analyses, a
separate forward selection with 999 unrestricted
permutations was carried out to select the variables
that significantly explained the variations in seedling,
sapling and small tree abundance. The analyses were
performed using the program CANOCO 4.5 (ter
Braak and Smilauer 2002), and the CanoDraw
extension was used to create the ordination diagrams.
Finally, we tested the effect of the environmental
and biotic variables on four spatial models: the broad-
scale linear trend (x- and y-UTM coordinates),
PCNM scale (PCNM variables selected), and the
meso- (PCNM variables 1–10) and fine-scale models
(variables 11–69). The fitted values of beech and oak
abundance of each spatial model were used as
response matrices against the environmental and
biotic variables. Using this approach, we separated
the relative contribution of the environmental and
biotic factors on different scales. For a complete
description of the method see Laliberte et al. (2009).
These analyses were performed with the ‘vegan’
library (Oksanen et al. 2007) of the R statistical
language (R Development Core Team 2007).
Results
Stand structure
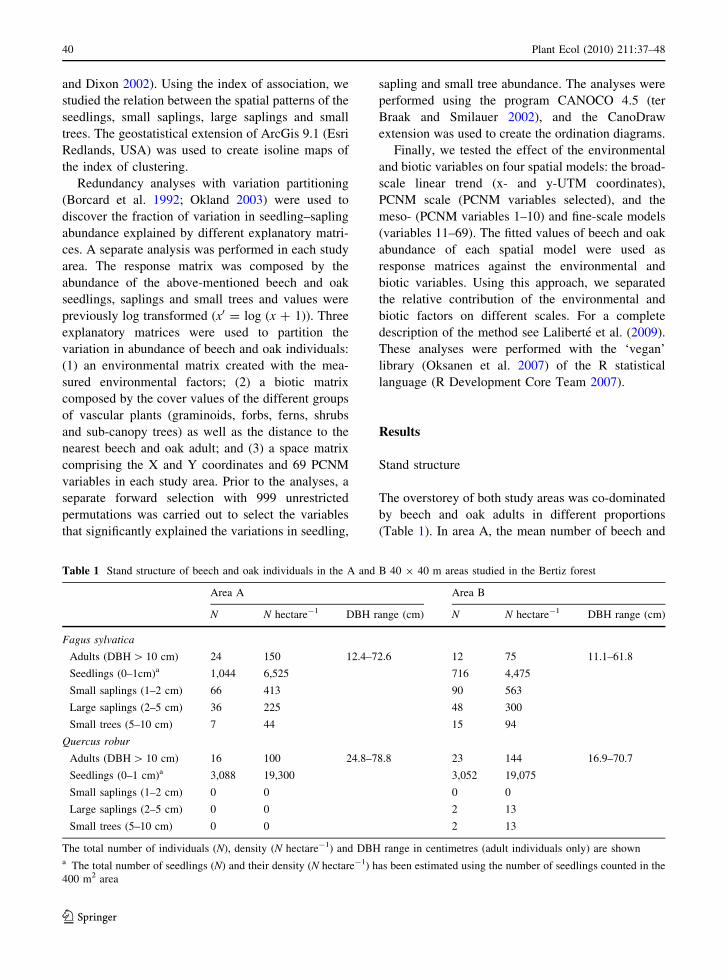
The overstorey of both study areas was co-dominated
by beech and oak adults in different proportions
(Table 1). In area A, the mean number of beech and
Table 1 Stand structure of beech and oak individuals in the A and B 40 9 40 m areas studied in the Bertiz forest
Area A Area B
N N hectare-1 DBH range (cm) N N hectare-1 DBH range (cm)
Fagus sylvatica
Adults (DBH [ 10 cm) 24 150 12.4–72.6 12 75 11.1–61.8
Seedlings (0–1cm)a 1,044 6,525 716 4,475
Small saplings (1–2 cm) 66 413 90 563
Large saplings (2–5 cm) 36 225 48 300
Small trees (5–10 cm) 7 44 15 94
Quercus robur
Adults (DBH [ 10 cm) 16 100 24.8–78.8 23 144 16.9–70.7
Seedlings (0–1 cm)a 3,088 19,300 3,052 19,075
Small saplings (1–2 cm) 0 0 0 0
Large saplings (2–5 cm) 0 0 2 13
Small trees (5–10 cm) 0 0 2 13
The total number of individuals (N), density (N hectare-1) and DBH range in centimetres (adult individuals only) are showna The total number of seedlings (N) and their density (N hectare-1) has been estimated using the number of seedlings counted in the
400 m2 area
40 Plant Ecol (2010) 211:37–48
123
oak adults (DBH [ 10 cm) was 150 and 100 per
hectare, respectively, and the total basal area was
36.3 m2 ha-1 (15.2 beech and 21.1 oak). In area B,
there were 75 beech and 144 oak adults per hectare and
the total basal area was 29.4 m2 ha-1 (8.6 beech and
20.8 oak). No oak individuals with a diameter between
1 and 10 cm were found in A, whereas only 4 were
found in B. In contrast, the mean number of beech
individuals with a diameter between 1 and 10 cm was
681 and 956 per hectare in areas A and B, respectively.
The number of beech individuals decreased from small
saplings to small trees (Table 1).
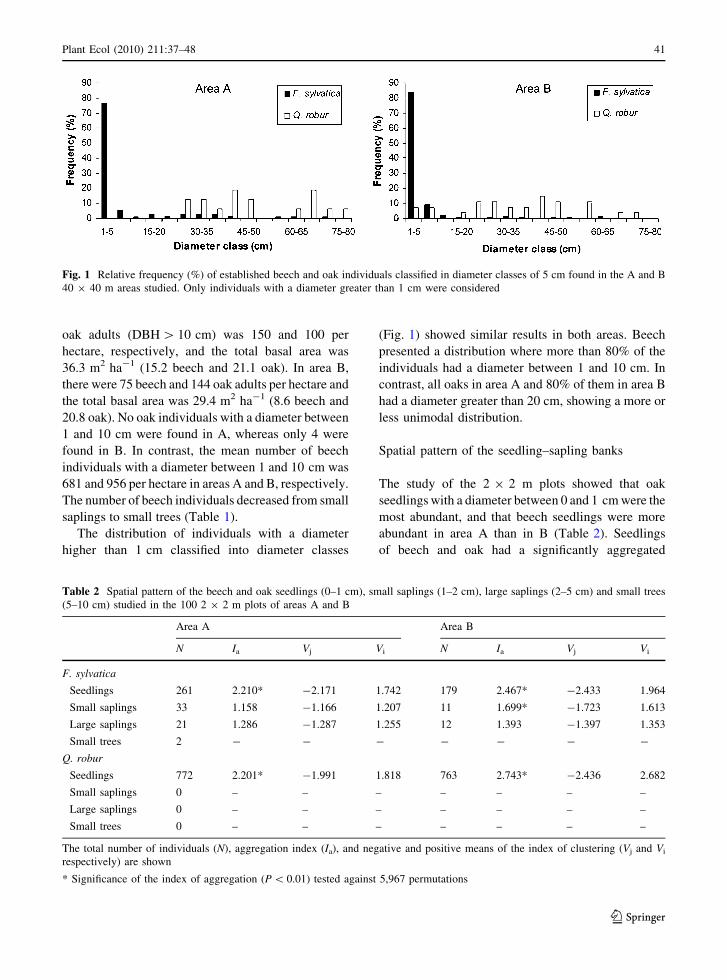
The distribution of individuals with a diameter
higher than 1 cm classified into diameter classes
(Fig. 1) showed similar results in both areas. Beech
presented a distribution where more than 80% of the
individuals had a diameter between 1 and 10 cm. In
contrast, all oaks in area A and 80% of them in area B
had a diameter greater than 20 cm, showing a more or
less unimodal distribution.
Spatial pattern of the seedling–sapling banks
The study of the 2 9 2 m plots showed that oak
seedlings with a diameter between 0 and 1 cm were the
most abundant, and that beech seedlings were more
abundant in area A than in B (Table 2). Seedlings
of beech and oak had a significantly aggregated
Fig. 1 Relative frequency (%) of established beech and oak individuals classified in diameter classes of 5 cm found in the A and B
40 9 40 m areas studied. Only individuals with a diameter greater than 1 cm were considered
Table 2 Spatial pattern of the beech and oak seedlings (0–1 cm), small saplings (1–2 cm), large saplings (2–5 cm) and small trees
(5–10 cm) studied in the 100 2 9 2 m plots of areas A and B
Area A Area B
N Ia Vj Vi N Ia Vj Vi
F. sylvatica
Seedlings 261 2.210* -2.171 1.742 179 2.467* -2.433 1.964
Small saplings 33 1.158 -1.166 1.207 11 1.699* -1.723 1.613
Large saplings 21 1.286 -1.287 1.255 12 1.393 -1.397 1.353
Small trees 2 - - - - - - -
Q. robur
Seedlings 772 2.201* -1.991 1.818 763 2.743* -2.436 2.682
Small saplings 0 – – – – – – –
Large saplings 0 – – – – – – –
Small trees 0 – – – – – – –
The total number of individuals (N), aggregation index (Ia), and negative and positive means of the index of clustering (Vj and Vi
respectively) are shown
* Significance of the index of aggregation (P \ 0.01) tested against 5,967 permutations
Plant Ecol (2010) 211:37–48 41
123
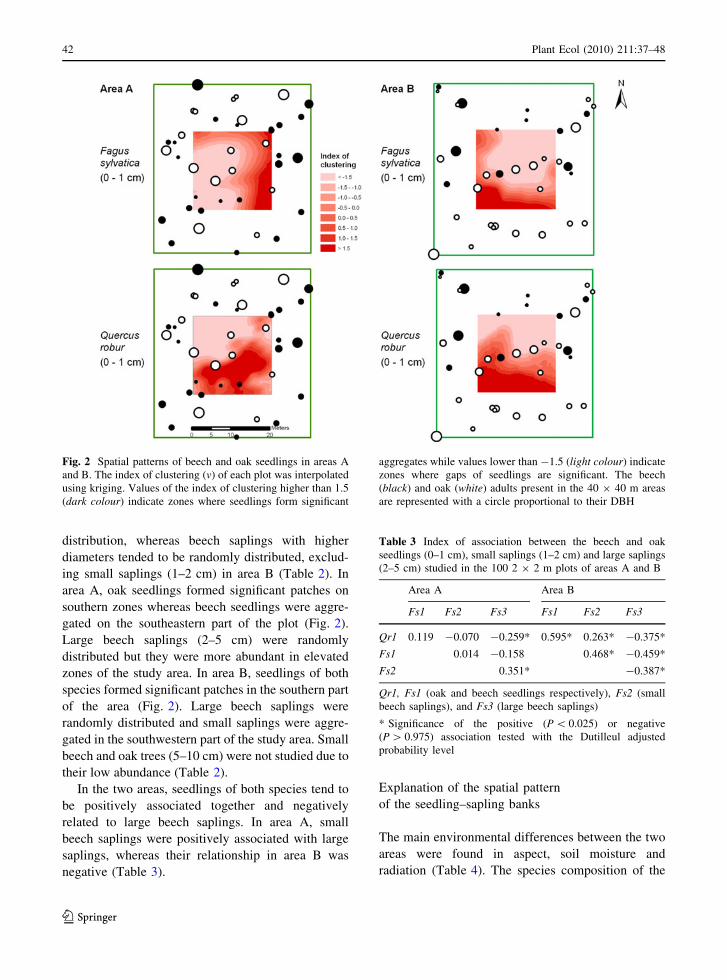
distribution, whereas beech saplings with higher
diameters tended to be randomly distributed, exclud-
ing small saplings (1–2 cm) in area B (Table 2). In
area A, oak seedlings formed significant patches on
southern zones whereas beech seedlings were aggre-
gated on the southeastern part of the plot (Fig. 2).
Large beech saplings (2–5 cm) were randomly
distributed but they were more abundant in elevated
zones of the study area. In area B, seedlings of both
species formed significant patches in the southern part
of the area (Fig. 2). Large beech saplings were
randomly distributed and small saplings were aggre-
gated in the southwestern part of the study area. Small
beech and oak trees (5–10 cm) were not studied due to
their low abundance (Table 2).
In the two areas, seedlings of both species tend to
be positively associated together and negatively
related to large beech saplings. In area A, small
beech saplings were positively associated with large
saplings, whereas their relationship in area B was
negative (Table 3).
Explanation of the spatial pattern
of the seedling–sapling banks
The main environmental differences between the two
areas were found in aspect, soil moisture and
radiation (Table 4). The species composition of the
Fig. 2 Spatial patterns of beech and oak seedlings in areas A
and B. The index of clustering (v) of each plot was interpolated
using kriging. Values of the index of clustering higher than 1.5
(dark colour) indicate zones where seedlings form significant
aggregates while values lower than -1.5 (light colour) indicate
zones where gaps of seedlings are significant. The beech
(black) and oak (white) adults present in the 40 9 40 m areas
are represented with a circle proportional to their DBH
Table 3 Index of association between the beech and oak
seedlings (0–1 cm), small saplings (1–2 cm) and large saplings
(2–5 cm) studied in the 100 2 9 2 m plots of areas A and B
Area A Area B
Fs1 Fs2 Fs3 Fs1 Fs2 Fs3
Qr1 0.119 -0.070 -0.259* 0.595* 0.263* -0.375*
Fs1 0.014 -0.158 0.468* -0.459*
Fs2 0.351* -0.387*
Qr1, Fs1 (oak and beech seedlings respectively), Fs2 (small
beech saplings), and Fs3 (large beech saplings)
* Significance of the positive (P \ 0.025) or negative
(P [ 0.975) association tested with the Dutilleul adjusted
probability level
42 Plant Ecol (2010) 211:37–48
123
understorey was similar in both study areas. The
graminoids Agrostis capillaris and Deschampsia
flexuosa, the forbs Hypericum pulchrum, Ranunculus
tuberosus and Veronica chamaedrys, the fern Pter-
idium aquilinum and the shrubs Calluna vulgaris,
Erica vagans and Hypericum androsaemum were the
most common species. The abundance and spatial
patterns of each group of species considered can be
seen in Table 5.
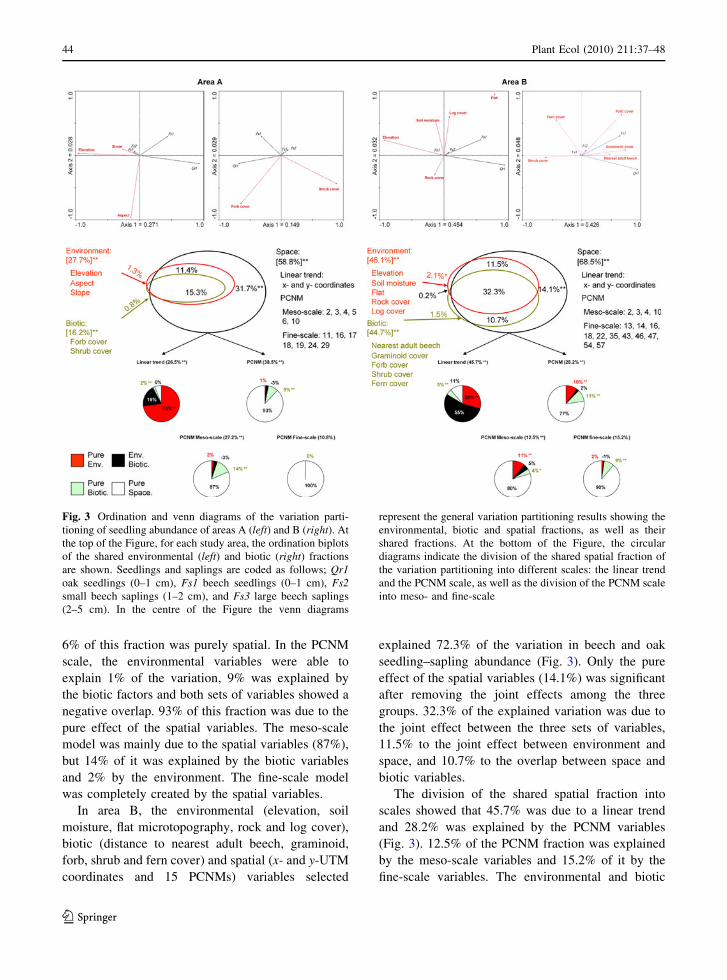
The ordination diagrams of the environmental and
biotic models showed that the first axes were mainly
created by the segregation between seedlings (0–1
cm) and large saplings (2–5 cm) (Fig. 3), although
the results were different in each study area. In area
A, three environmental (elevation, aspect and slope),
two biotic (forb and shrub cover) and 15 spatial
variables (x- and y-UTM coordinates and 13 PCNMs)
were selected, which explained together 60.6% of
variation in beech and oak seedling–sapling abun-
dance (Fig. 3). After removing their joint effects,
only the spatial fraction (31.7%) was significant. The
joint effect among the three sets of variables
accounted for 15.3% of the explained fraction.
11.4% was due to the joint effect of the environment
and space.
The division of the spatial-structured fraction
(58.8% of the variation) on different scales showed
that 26.5% of the spatial fraction was explained by
the UTM coordinates (linear trend at a broad scale)
and 38.5% by the PCNM variables (Fig. 3). 27.2% of
the PCNM fraction was due to the meso-scale
variables and 10.8% to the fine-scale variables. In
the linear trend fraction (x- and y-coordinates), 73%
of the variation was explained by the environmental
variables, 2% by the biotic factors and 19% by the
interaction between both sets of variables. Therefore,
Table 4 Quantitative environmental variables measured in the 100 2 9 2 m plots of areas A and B
Area A Area B t-statistic
Mean ± SD Range Mean ± SD Range
Elevation (m)a 6.4 ± 3.0 0.0–12.2 6.3 ± 3.2 0.0–11.5 0.215
Aspectb 0.11 ± 0.51 -0.75–0.77 0.51 ± 0.13 0.13–0.78 -7.604*
Slope (degrees) 26 ± 6 10–45 24 ± 6 3–49 2.892*
Leaf-litter cover (%) 59 ± 20 15–95 49 ± 23 5–95 3.397*
Leaf-litter deep (cm) 3.4 ± 1.6 0.5–12.0 2.7 ± 1.1 0–8 3.352*
Rock cover (%) 3 ± 5 0–25 4 ± 6 0–30 -1.088
Log cover (%) 11 ± 8 0–40 10 ± 9 0–40 0.716
Radiationb 15.3 ± 5.5 8.2–40.1 26.9 ± 16.3 10.8–100 -6.742*
Soil moisture (mV) 219 ± 30 164–319 135 ± 19 101–193 23.590*
The means of the variables in areas A and B are compared using a permutation test of the t-statistic (Legendre 2005)a Based on the lowest point in each areab Relative scale
* Significance of the t-statistic (P \ 0.01) against 999 permutations
Table 5 Percentage cover and aggregation index of the groups of species studied in the 100 2 9 2 m plots of areas A and B
Area A Area B
Mean ± SD Range Ia Mean ± SD Range Ia
Graminoids 14 ± 15 0–74 2.53* 14 ± 12 0–66 2.13*
Forbs 8 ± 5 0–24 2.27* 7 ± 6 0–40 2.07*
Ferns 7 ± 8 0–50 2.14* 3 ± 9 0–50 2.57*
Shrubs 20 ± 19 0–81 2.46* 16 ± 14 0–70 2.13*
Sub-canopy trees 4 ± 8 0–50 1.37 1 ± 7 0–70 1.08
* Significance of the index of aggregation (P \ 0.01) tested against 5,967 permutations
Plant Ecol (2010) 211:37–48 43
123
6% of this fraction was purely spatial. In the PCNM
scale, the environmental variables were able to
explain 1% of the variation, 9% was explained by
the biotic factors and both sets of variables showed a
negative overlap. 93% of this fraction was due to the
pure effect of the spatial variables. The meso-scale
model was mainly due to the spatial variables (87%),
but 14% of it was explained by the biotic variables
and 2% by the environment. The fine-scale model
was completely created by the spatial variables.
In area B, the environmental (elevation, soil
moisture, flat microtopography, rock and log cover),
biotic (distance to nearest adult beech, graminoid,
forb, shrub and fern cover) and spatial (x- and y-UTM
coordinates and 15 PCNMs) variables selected
explained 72.3% of the variation in beech and oak
seedling–sapling abundance (Fig. 3). Only the pure
effect of the spatial variables (14.1%) was significant
after removing the joint effects among the three
groups. 32.3% of the explained variation was due to
the joint effect between the three sets of variables,
11.5% to the joint effect between environment and
space, and 10.7% to the overlap between space and
biotic variables.
The division of the shared spatial fraction into
scales showed that 45.7% was due to a linear trend
and 28.2% was explained by the PCNM variables
(Fig. 3). 12.5% of the PCNM fraction was explained
by the meso-scale variables and 15.2% of it by the
fine-scale variables. The environmental and biotic
Fig. 3 Ordination and venn diagrams of the variation parti-
tioning of seedling abundance of areas A (left) and B (right). At
the top of the Figure, for each study area, the ordination biplots
of the shared environmental (left) and biotic (right) fractions
are shown. Seedlings and saplings are coded as follows; Qr1oak seedlings (0–1 cm), Fs1 beech seedlings (0–1 cm), Fs2small beech saplings (1–2 cm), and Fs3 large beech saplings
(2–5 cm). In the centre of the Figure the venn diagrams
represent the general variation partitioning results showing the
environmental, biotic and spatial fractions, as well as their
shared fractions. At the bottom of the Figure, the circular
diagrams indicate the division of the shared spatial fraction of
the variation partitioning into different scales: the linear trend
and the PCNM scale, as well as the division of the PCNM scale
into meso- and fine-scale
44 Plant Ecol (2010) 211:37–48
123
variables explained 29 and 5% of the linear trend,
respectively, and 55% was due to their joint effect.
Only 11% of this model was due to the spatial
variables alone. In the PCNM model, 10% of the
variation was explained by the environmental vari-
ables, 11% by the biotic factors and 2% by their joint
effect. The dissection of this model showed that the
environmental and biotic variables explained 11 and
4% of the meso-scale fraction, respectively, and their
overlap was 5%. In the fine-scale model, the
environmental variables explained 2% and the biotic
factors 9%, with negative overlap. 80% of the meso-
scale model and 90% of the fine-scale model was of
purely spatial nature.
Discussion
Stand structure
The distribution of beech individuals per diameter
class in both study areas shows a reverse J-shaped
diameter distribution which is in accordance with the
idealised well-balanced population structure for old-
growth forests as observed in other forests in the
same region (Rozas 2006). However, oak individuals
showed a unimodal distribution with only 4 out of 43
individuals with a diameter between 1 and 10 cm. As
has been indicated by other authors, the forest
understorey could be a habitat with high biotically
induced stress (Antos et al. 2005): while beech
seedlings and saplings suppress their growth and
survive for many years waiting for improved growing
conditions, oak seedlings and saplings cannot tolerate
these conditions. In another mixed forest in northern
Spain, oak establishment was strongly associated
with canopy openings (Rozas 2003). Additionally, in
a flood plain oak forest of Poland (Dobrowolska
2008), oak regeneration was possible with a stand
density of *150 individuals per hectare and a mean
basal area of *26 m2 ha-1. In our study, the two
large saplings and the two small oak trees were found
in area B, where the mean basal area was
*29.4 m2 ha-1 and the presence of oak adults was
twice the number of beeches. Probably the survival of
these young oaks was favoured by the higher values
of light enabled by the presence of a canopy
dominated by oaks (Hardtle et al. 2003). The
presence of oaks in the canopy could be explained
by historical factors: oaks would initially become
established under more open conditions, when the
area was still managed. The difference in the number
of young beech and oak trees indicates that, as has
been observed in other forests (Rozas 2003), natural
regeneration in the Bertiz forest could be sufficient to
maintain beech populations, but could lead to a
decline in oak populations. After canopy opening,
beech saplings can grow rapidly into the canopy and
the stands will move towards beech dominance.
Spatial patterns of the beech
and oak seedling–sapling banks
Oak seedlings seem to benefit from seed reserves
during the germination year (Welander and Ottosson
1998) and so they could have an advantage over
beech seedlings, giving as a result a higher number
of oak seedlings. However, the seed production of
both species is very variable over the years (Grime
et al. 1988), and this could, therefore, influence the
number of seedlings. Although we have no infor-
mation about seed rain in recent years, the large
difference in the number of seedlings between the
two species led us to think that oak seedlings may
have an advantage in germination. However, the lack
of oak saplings, with higher diameters, reinforces the
hypothesis that they can only tolerate the conditions
of the understorey for a few years, probably due to
the relatively low light availability in the understo-
rey (Antos et al. 2005).
The spatial pattern of beech and oak seedlings
departed significantly from random in the two studied
areas, as has been found for species recruitment in
other forests (Rozas 2003; Kunstler et al. 2004;
Maltez-Mouro et al. 2007). These clumped distribu-
tions could be caused by the environmental and biotic
factors that influence seedling establishment because
the presence of adult beech and oak individuals
ensures seed rain (Nathan and Muller-Landau 2000).
The positive association between seedlings of both
species probably indicates that they have similar
establishment requirements. Although the two species
perform differently during their development, beech
and oak seedlings could benefit from the same
microsites during their establishment. Therefore, at
earlier stages of development beech and oak seed-
lings seem to compete for the same resources
regardless of the dominant tree species in the canopy.
Plant Ecol (2010) 211:37–48 45
123
The random distribution of large beech saplings
may be due to the environmental history, intra-
species competition and scale limitations of the study.
Beech seedlings and saplings tend to compete for
light in natural conditions (Collet and Chenost 2006)
and, although they are able to survive under low light
levels for many years, canopy opening is necessary to
enable their growth into the canopy (Szwagrzyk et al.
2001). Periodic small gap creation by natural distur-
bances facilitates the growth of beech individuals
(Rozas 2003). In the two studied plots, the negative
association between large beech saplings and beech
and oak seedlings is maintained (Table 3). These
results, therefore, indicate that large beech saplings
could shade and prevent the establishment of beech
and oak seedlings (Welander and Ottosson 1998).
Otherwise, the random distribution of large beech
saplings can be a result of the high biotically induced
stress of the understorey. Therefore, many seedlings
and small saplings will die and only a few individuals
will persist for many years (Antos et al. 2005).
The variation partitioning analyses showed the
importance of the spatial component in the distribu-
tion of seedlings and saplings, as occurs in other
forested ecosystems (Maltez-Mouro et al. 2007). The
amount of variance explained by the environmental
and biotic variables was higher in area B than in A. In
this sense, area B had lower values of soil moisture
and higher levels of radiation than A. The higher
values of light could enable the presence of a more
diverse understorey (Hardtle et al. 2003) but the
lower values of soil moisture could cause a relative
water deficit. Moreover, the number of beech saplings
of large diameter (1–5 cm) was lower in this area,
indicating the influence of a possible water deficit
(van Hees 1997). Under the more severe environ-
mental conditions of area B, seedling and sapling
distribution could be influenced more by the under-
storey vegetation (Lof and Welander 2004), as is
indicated by the heightened joint effect between the
environmental and the biotic fractions. Thus, the
competition with the understorey vegetation could be
the reason for the lower number of small and large
beech saplings in area B than in A. These results
could indicate the importance that biotically induced
stress has on the growth and development of beech
saplings.
The environmental and the biotic variables were
spatially structured and induced a scale-specific
spatial dependence in the distribution of the seed-
ling–sapling bank (Borcard et al. 1992; Legendre
1993; Laliberte et al. 2009). At broader scales (linear
trend), the greater importance of the environmental
variables than the biotic factors indicates that niche
processes are the main factors determining seedling
and sapling distribution (Laliberte et al. 2009). The
large differences in elevation and the steep slopes
were the main factors determining the broad-scale
beech and oak distribution. Lower zones in both areas
had higher values of forb cover and lower of shrub
and fern. Therefore, the aggregation of seedlings in
these areas could be related to the competition for
light (Lorimer et al. 1994; Collet et al. 1998; Coll
et al. 2003; Provendier and Balandier 2008). Shrubs,
ferns and large seedlings create a tall understorey that
prevents the passing of light. The positive relation
between seedlings and forb cover indicated their
preference for the same microsite, as was found in
other forests (Miller et al. 2002).
The main variations in the distribution of the
seedling–sapling bank at finer scales were explained
by the spatial variables. While we do not measure
important soil resources that could influence seedling
distribution (Lof and Welander 2004), such as
mineral nutrients, the fine-scale domain of this spatial
fraction could indicate the importance of stochastic
processes like dispersal and predation (Legendre
1993; Dray et al. 2006; Laliberte et al. 2009). The
presence of adult individuals of both species in the
canopy could minimise the influence of dispersal
processes (Nathan and Muller-Landau 2000) and thus
other processes such as variation in seed predation
and establishment (Garcıa and Houle 2005; Mess-
aoud and Houle 2006) or processes related to fine-
scale resource availability (Beatty 1984) could be the
reason for the unexplained spatial component.
Concluding remarks and implications
The combination of the SADIE analysis with the
variation partitioning method could be of high utility
for the interpretation of species patterns. Moreover,
the use of the PCNM variables allows the subsequent
division of the spatial component into scales facili-
tating the interpretation of the vegetation–environ-
ment relationships.
Regardless of the dominant tree species in the
canopy, seedlings of beech and oak form aggregates,
46 Plant Ecol (2010) 211:37–48
123
whereas small and large beech saplings tend to be
randomly distributed. The broad-scale seedling and
sapling abundance is mainly determined by the
environmental conditions and the competition with
the understorey vegetation. This determination was
higher under the influence of a canopy dominated by
oaks, where the lower water availability could
increase the competition with the understorey vege-
tation. The higher ability of beech seedlings to
tolerate the stress in the understorey could be the
reason for the presence of saplings and small trees of
beech. Conversely, oak seedlings can only tolerate
these conditions for a few years. At finer scales, the
seedling–sapling bank was mainly determined by
spatially structured processes probably related to seed
predation and establishment. The maintenance of the
natural conditions in the Bertiz forest could lead to a
decline in oak populations and a colonisation of the
canopy by beech individuals after canopy opening,
owing to their higher ability to tolerate the biotically
induced stress of the understorey. Therefore, we
could expect that the stands will move towards beech
dominance. The development of further studies with
a dynamic perspective could help to clarify the future
of these areas with a mixed beech–oak canopy.
Acknowledgements The authors thank Etienne Laliberte and
Daniel Borcard for technical advice in the variation
partitioning analysis performed. Helpful suggestions from
two anonymous reviewers further improved the manuscript.
We are also grateful to the Parque Natural ‘‘Senorıo de Bertiz’’
for giving permission to conduct this research within the
protected area. The research was partially supported by
Fundacion Caja Navarra (programa ‘‘Tu eliges, Tu decides’’)
as well as by Fundacion Universitaria de Navarra and by a
predoctoral grant from the Asociacion de Amigos de la
Universidad de Navarra to Antonio Gazol. We also thank
Jaime Urıa for his help in the field work.
References
Antos JA, Guest HJ, Parish R (2005) The tree seedling bank in
an ancient montane forest: stress tolerators in a productive
habitat. J Ecol 93:536–543
Beatty SW (1984) Influence of microtopography and canopy
species on spatial patterns of forest understory plants.
Ecology 65:1406–1419
Beers TW, Dress PE, Wensel LC (1966) Aspect transformation
in site productivity research. J For 64:691–692
Borcard D, Legendre P (2002) All-scale spatial analysis of
ecological data by means of principal coordinates of
neighbour matrices. Ecol Model 153:51–68
Borcard D, Legendre P (2004) SpaceMaker2. Version for Win-
dows. Departement des Sciences Biologiques, Universite de
Montreal. Available online http://www.bio.umontreal.ca/
casgrain/en/labo/spacemaker.html. Accessed 05 Sep 2009
Borcard D, Legendre P, Drapeau P (1992) Partialling out the
spatial component of ecological variation. Ecology 73:
1045–1055
Coll L, Balandier P, Picon-Cochard C, Prevosto B, Curt T
(2003) Competition for water between beech seedlings
and surrounding vegetation in different light and vegeta-
tion composition conditions. Ann For Sci 60:593–600
Collet C, Chenost C (2006) Using competition and light esti-
mates to predict diameter and height growth of naturally
regenerated beech seedlings growing under changing
canopy conditions. Forestry 79:489–502
Collet C, Ningre F, Frochot H (1998) Modifying the micro-
climate around young oaks through vegetation manipu-
lation: effects on seedling growth and branching. For Ecol
Manag 110:249–262
Dobrowolska D (2008) Effect of stand density on oak regen-
eration in flood plain forests in Lower Silesia, Poland.
Forestry 81:511–523
Dray S, Legendre P, Peres-Neto PR (2006) Spatial modelling: a
comprehensive framework for principal coordinate analysis
of neighbour matrices (PCNM). Ecol Model 196:483–493
Garcıa D, Houle G (2005) Fine-scale spatial patterns of
recruitment in red oak (Quercus rubra): what matters
most, abiotic or biotic factors? Ecoscience 12:223–235
Gazol A, Ibanez R (2009) Different response to environmental
factors and spatial variables of two attributes (cover and
diversity) of the understorey layers. For Ecol Manag
258:1267–1274
George LO, Bazzaz FA (2003) The herbaceous layer as a filter
determining spatial pattern in forest tree regeneration. In:
Gilliam FS, Roberts MR (eds) The herbaceous layer in
forest of eastern North America. Oxford University Press,
New York, pp 265–282
Gobierno de Navarra (2009) Meteorologıa y climatologıa de
Navarra. Available via DIALOG. http://meteo.navarra.es
of subordiante document. Accessed 05 Sep 2009
Grime JP, Hodgson JG, Hunt R (1988) Comparative plant
ecology: a functional approach to common British spe-
cies. Unwin Hyman, London
Hardtle W, von Oheimb G, Westphal C (2003) The effects of
light and soil conditions on the species richness of the
ground vegetation of deciduous forests in northern Ger-
many (Schleswig-Holstein). For Ecol Manag 182:327–338
Kunstler G, Curt T, Lepart J (2004) Spatial pattern of beech
(Fagus sylvatica L.) and oak (Quercus pubescens Mill.)
seedlings in natural pine (Pinus sylvestris L.) woodlands.
Eur J For Res 123:331–337
Laliberte E, Paquette A, Legendre P, Bouchard A (2009)
Assessing the scale-specific importance of niches and
other spatial processes on beta diversity: a case study from
a temperate forest. Oecologia 159:377–388
Legendre P (1993) Spatial autocorrelation: trouble or new
paradigm? Ecology 74:1659–1673
Legendre P (2005) t.perm.R: test t pour donnees independantes
avec test par permutations. Available online http://
www.bio.umontreal.ca/legendre/index.html#FonctionsR.Accessed 25 Mar 2010
Plant Ecol (2010) 211:37–48 47
123
Lof M, Welander T (2004) Influence of herbaceous competi-
tors on early growth in direct seeded Fagus sylvatica L.
and Quercus robur L. Ann For Sci 61:781–788
Lof M, Gemmel P, Nilsson U, Welander NT (1998) The
influence of site preparation on growth in Quercus roburL. seedlings in southern Sweden clear-cut and shelter-
wood. For Ecol Manag 109:241–249
Lorimer CG, Chapman JW, Lambert WD (1994) Tall under-
storey vegetation as a factor in the poor development of
oak seedling beneath mature stands. J Ecol 82:227–237
Maltez-Mouro S, Garcıa LV, Maranon T, Freitas H (2007)
Recruitment patterns in a Mediterranean oak forest: a case
study showing the importance of the spatial component.
For Sci 53:645–652
Messaoud Y, Houle G (2006) Spatial patterns of tree seedling
establishment and their relationship to environmental
variables in a cold-temperate deciduous forest of eastern
North America. Plant Ecol 185:319–331
Miller TF, Mladenoff DJ, Clayton MK (2002) Old-growth
northern hardwood forest: spatial autocorrelation and pat-
terns of understory vegetation. Ecol Monogr 72:487–503
Nathan R, Muller-Landau HC (2000) Spatial patterns of seed
dispersal, their determinants and consequences for
recruitment. Trends Ecol Evol 15:278–285
Okland RH (2003) Partitioning the variation in a plot-by-spe-
cies data matrix that is related to n sets of explanatory
variables. J Veg Sci 14:693–700
Oksanen J, Kindt R, Legendre P, O’Hara RB, Simpson GL,
Solymos P, Stevens MHH, Wagner H (2007) ‘‘vegan’’:
Community Ecology Package Version 1.15-1. Available
via DIALOG. http://www.R-project.org of subordinate
document. Accessed 05 Sep 2009
Perry JN (1998) Measures of spatial pattern for counts. Ecol-
ogy 79:1008–1017
Perry JN, Dixon P (2002) A new method to measure spatial
association for ecological count data. Ecoscience 9:133–141
Perry JN, Winder L, Holland JM, Alston RD (1999) Red-blue
plots for detecting clusters in count data. Ecol Lett 2:106–113
Provendier D, Balandier P (2008) Compared effects of com-
petition by grasses (Graminoids) and broom (Cytisusscoparius) on growth and functional traits of beech sap-
lings (Fagus sylvatica). Ann For Sci 65:510–518
R Development Core Team (2007) R: a language and envi-
ronment for statistical computing. R Foundation for Sta-
tistical Computing, Vienna, Austria. Available online
http://www.R-project.org Accessed 05 Sep 2009
Rozas V (2003) Regeneration patterns, dendroecology, and
forest-use history in an old-growth beech-oak lowland
forest in Northern Spain. For Ecol Manag 182:175–194
Rozas V (2006) Structural heterogeneity and tree spatial pat-
terns in an old-growth deciduous lowland forest in Can-
tabria, northern Spain. Plant Ecol 185:57–72
Szwagrzyk J, Szewczyk J, Bodziarczyk J (2001) Dynamics of
seedling banks in beech forest: results of a 10-year study
on germination, growth and survival. For Ecol Manag
141:237–250
ter Braak CJF, Smilauer P (2002) CANOCO reference manual
and CanoDraw for Windows user’s guide: software for
canonical community ordination (version 4.5). Micro-
computer Power, New York
van Hees AFM (1997) Growth and morphology of pedunculate
oak (Quercus robur L) and beech (Fagus sylvatica L)
seedlings in relation to shading and drought. Ann For Sci
54:9–18
Welander NT, Ottosson B (1998) The influence of shading on
growth and morphology in seedlings of Quercus robur L.
and Fagus sylvatica L. For Ecol Manag 107:117–126
Ziegenhagen B, Kaush W (1995) Productivity of young oak
shaded oaks (Quercus robur L.) as corresponding to shoot
morphology and leaf anatomy. For Ecol Manag 72:97–108
48 Plant Ecol (2010) 211:37–48
123
Related Documents