See discussions, stats, and author profiles for this publication at: https://www.researchgate.net/publication/251883096 Scalable Adaptive Graphics middleware for visualization streaming and collaboration in ultra resolution display... Article · January 2008 DOI: 10.1109/ULTRAVIS.2008.5154063 CITATIONS 8 READS 31 7 authors, including: Luc Renambot University of Illinois at Chicago 91 PUBLICATIONS 1,201 CITATIONS SEE PROFILE Andrew Edward Johnson University of Illinois at Chicago 204 PUBLICATIONS 2,654 CITATIONS SEE PROFILE Ratko Jagodic Intel 15 PUBLICATIONS 247 CITATIONS SEE PROFILE David Lee University of California, San Diego 10 PUBLICATIONS 107 CITATIONS SEE PROFILE All content following this page was uploaded by Andrew Edward Johnson on 16 May 2014. The user has requested enhancement of the downloaded file.

Welcome message from author
This document is posted to help you gain knowledge. Please leave a comment to let me know what you think about it! Share it to your friends and learn new things together.
Transcript
Seediscussions,stats,andauthorprofilesforthispublicationat:https://www.researchgate.net/publication/251883096
ScalableAdaptiveGraphicsmiddlewareforvisualizationstreamingandcollaborationinultraresolutiondisplay...
Article·January2008
DOI:10.1109/ULTRAVIS.2008.5154063
CITATIONS
8
READS
31
7authors,including:
LucRenambot
UniversityofIllinoisatChicago
91PUBLICATIONS1,201CITATIONS
SEEPROFILE
AndrewEdwardJohnson
UniversityofIllinoisatChicago
204PUBLICATIONS2,654CITATIONS
SEEPROFILE
RatkoJagodic
Intel
15PUBLICATIONS247CITATIONS
SEEPROFILE
DavidLee
UniversityofCalifornia,SanDiego
10PUBLICATIONS107CITATIONS
SEEPROFILE
AllcontentfollowingthispagewasuploadedbyAndrewEdwardJohnsonon16May2014.
Theuserhasrequestedenhancementofthedownloadedfile.
1
Abstract—This paper describes the motivation and capabilities
of SAGE- the Scalable Adaptive Graphics Environment- a middleware and software client for supporting ultra resolution collaboration and visualization.
Index Terms— collaboration, graphics, supercomputer
I. INTRODUCTION Science and engineering communities are transitioning to
instrumentation that produces greater volumes and varieties of data that are almost immediately available and collaborations that are increasingly international and trans-disciplinary. At the same time increased depth of understanding is vital to study complex phenomena; hence, a central challenge becomes the ability for people involved in these endeavors to manage the onslaught of increased scale and complexity in their work.
In the past few years there has been increasing adoption of
high-resolution displays in a number of disciplines such as geoscience, atmospheric science, astrophysics, and bioscience. This is due in large part to two factors: the need of these disciplines to have visualization “instruments” that are well matched to handle the volume and resolution of the data they are collecting, and the increased affordability of what was once considered high-end display, computing and networking technology.
Over the past five years, we developed and deployed the
OptIPlanet Collaboratory [1], a persistent cyberinfrastructure for global-scale, distributed visualization within a network of
©2008 IEEE. Personal use of this material is permitted. However,
permission to reprint/republish this material for advertising or promotional purposes or for creating new collective works for resale or redistribution to servers or lists, or to reuse any copyrighted component of this work in other works must be obtained from the IEEE The material in this article is based upon work supported by the National Science Foundation (NSF), awards CNS-0420477, OCI-0441094, and OCI-0225642. Any opinions, findings, and conclusions or recommendations expressed in this publication are those of the authors and do not necessarily reflect the views of the funding agencies and companies. IEEE Catalog Number: CFP08UVS, ISBN: 978-1-4244-2861-8, Library of Congress: 2008907542
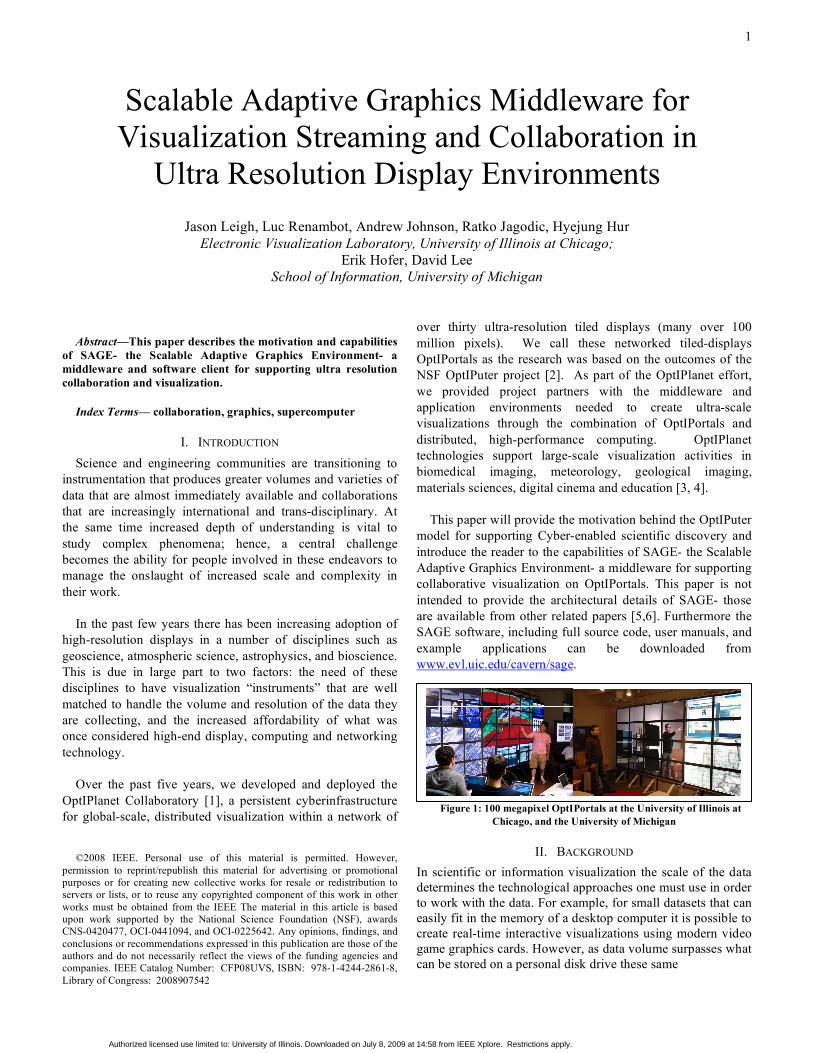
over thirty ultra-resolution tiled displays (many over 100 million pixels). We call these networked tiled-displays OptIPortals as the research was based on the outcomes of the NSF OptIPuter project [2]. As part of the OptIPlanet effort, we provided project partners with the middleware and application environments needed to create ultra-scale visualizations through the combination of OptIPortals and distributed, high-performance computing. OptIPlanet technologies support large-scale visualization activities in biomedical imaging, meteorology, geological imaging, materials sciences, digital cinema and education [3, 4].
This paper will provide the motivation behind the OptIPuter
model for supporting Cyber-enabled scientific discovery and introduce the reader to the capabilities of SAGE- the Scalable Adaptive Graphics Environment- a middleware for supporting collaborative visualization on OptIPortals. This paper is not intended to provide the architectural details of SAGE- those are available from other related papers [5,6]. Furthermore the SAGE software, including full source code, user manuals, and example applications can be downloaded from www.evl.uic.edu/cavern/sage.
Figure 1: 100 megapixel OptIPortals at the University of Illinois at Chicago, and the University of Michigan
II. BACKGROUND In scientific or information visualization the scale of the data determines the technological approaches one must use in order to work with the data. For example, for small datasets that can easily fit in the memory of a desktop computer it is possible to create real-time interactive visualizations using modern video game graphics cards. However, as data volume surpasses what can be stored on a personal disk drive these same
Scalable Adaptive Graphics Middleware for Visualization Streaming and Collaboration in
Ultra Resolution Display Environments Jason Leigh, Luc Renambot, Andrew Johnson, Ratko Jagodic, Hyejung Hur
Electronic Visualization Laboratory, University of Illinois at Chicago; Erik Hofer, David Lee
School of Information, University of Michigan
Authorized licensed use limited to: University of Illinois. Downloaded on July 8, 2009 at 14:58 from IEEE Xplore. Restrictions apply.
2
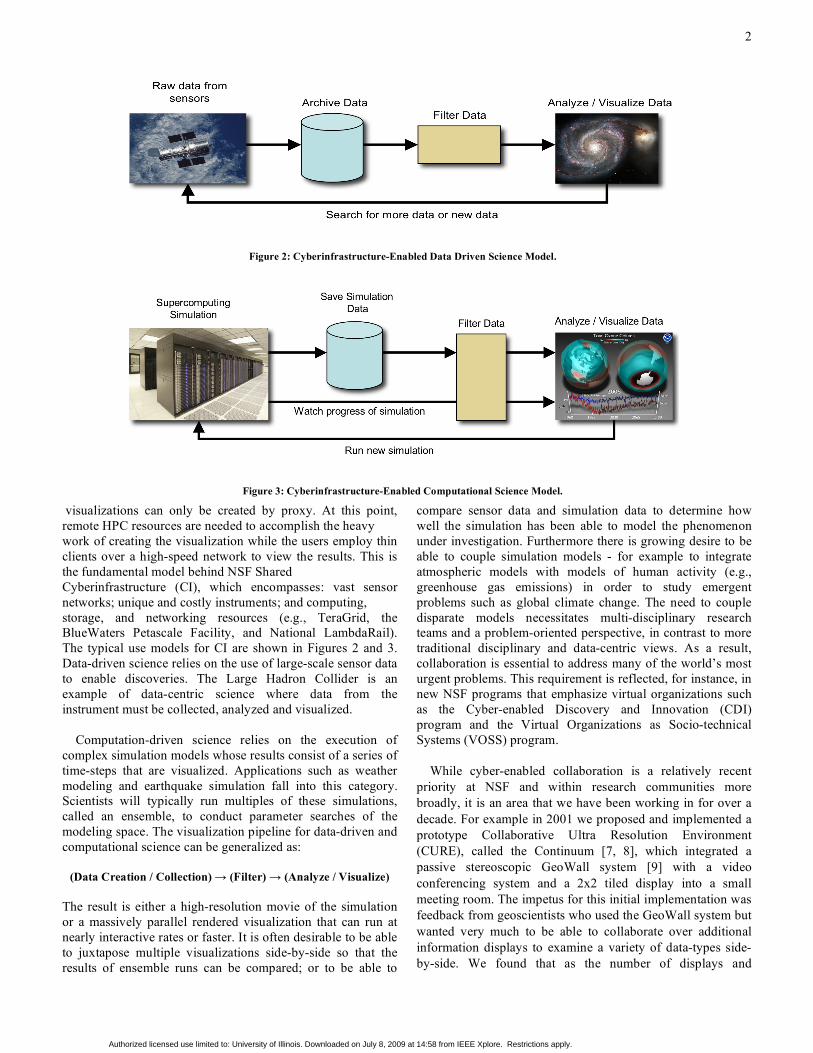
visualizations can only be created by proxy. At this point, remote HPC resources are needed to accomplish the heavy work of creating the visualization while the users employ thin clients over a high-speed network to view the results. This is the fundamental model behind NSF Shared Cyberinfrastructure (CI), which encompasses: vast sensor networks; unique and costly instruments; and computing, storage, and networking resources (e.g., TeraGrid, the BlueWaters Petascale Facility, and National LambdaRail). The typical use models for CI are shown in Figures 2 and 3. Data-driven science relies on the use of large-scale sensor data to enable discoveries. The Large Hadron Collider is an example of data-centric science where data from the instrument must be collected, analyzed and visualized.
Computation-driven science relies on the execution of complex simulation models whose results consist of a series of time-steps that are visualized. Applications such as weather modeling and earthquake simulation fall into this category. Scientists will typically run multiples of these simulations, called an ensemble, to conduct parameter searches of the modeling space. The visualization pipeline for data-driven and computational science can be generalized as:
(Data Creation / Collection) → (Filter) → (Analyze / Visualize) The result is either a high-resolution movie of the simulation or a massively parallel rendered visualization that can run at nearly interactive rates or faster. It is often desirable to be able to juxtapose multiple visualizations side-by-side so that the results of ensemble runs can be compared; or to be able to
compare sensor data and simulation data to determine how well the simulation has been able to model the phenomenon under investigation. Furthermore there is growing desire to be able to couple simulation models - for example to integrate atmospheric models with models of human activity (e.g., greenhouse gas emissions) in order to study emergent problems such as global climate change. The need to couple disparate models necessitates multi-disciplinary research teams and a problem-oriented perspective, in contrast to more traditional disciplinary and data-centric views. As a result, collaboration is essential to address many of the world’s most urgent problems. This requirement is reflected, for instance, in new NSF programs that emphasize virtual organizations such as the Cyber-enabled Discovery and Innovation (CDI) program and the Virtual Organizations as Socio-technical Systems (VOSS) program.
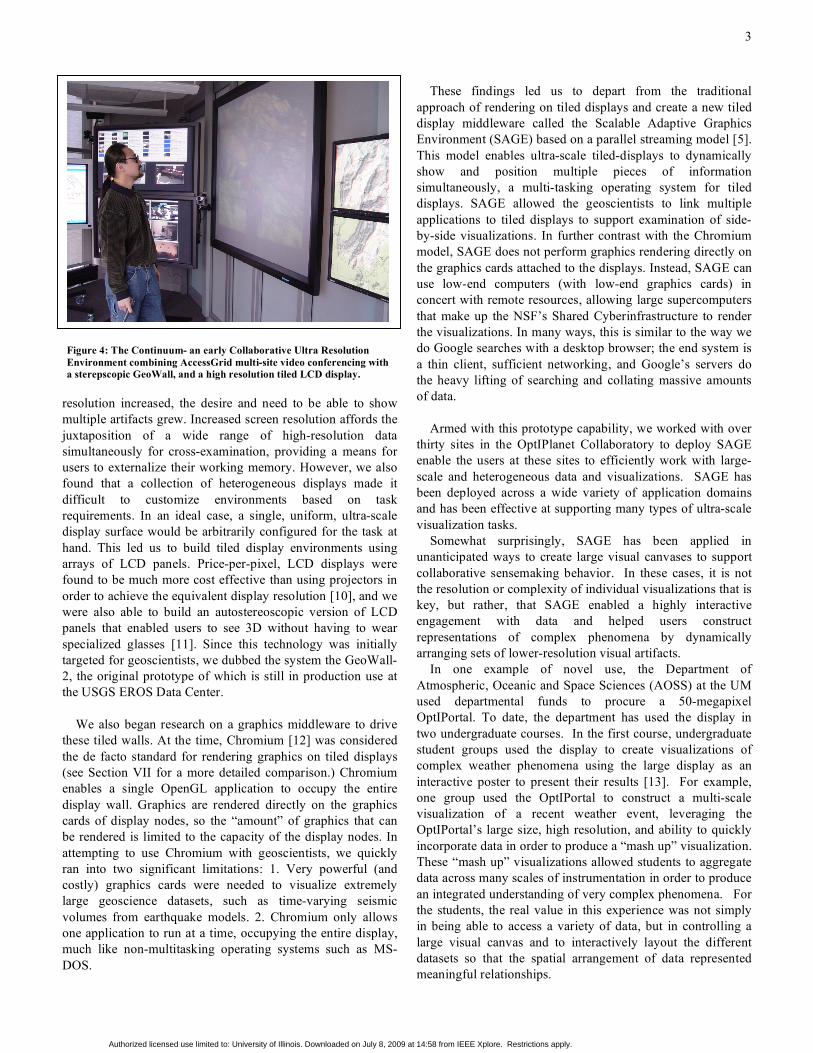
While cyber-enabled collaboration is a relatively recent priority at NSF and within research communities more broadly, it is an area that we have been working in for over a decade. For example in 2001 we proposed and implemented a prototype Collaborative Ultra Resolution Environment (CURE), called the Continuum [7, 8], which integrated a passive stereoscopic GeoWall system [9] with a video conferencing system and a 2x2 tiled display into a small meeting room. The impetus for this initial implementation was feedback from geoscientists who used the GeoWall system but wanted very much to be able to collaborate over additional information displays to examine a variety of data-types side-by-side. We found that as the number of displays and
Figure 2: Cyberinfrastructure-Enabled Data Driven Science Model.
Figure 3: Cyberinfrastructure-Enabled Computational Science Model.
Authorized licensed use limited to: University of Illinois. Downloaded on July 8, 2009 at 14:58 from IEEE Xplore. Restrictions apply.
3
resolution increased, the desire and need to be able to show multiple artifacts grew. Increased screen resolution affords the juxtaposition of a wide range of high-resolution data simultaneously for cross-examination, providing a means for users to externalize their working memory. However, we also found that a collection of heterogeneous displays made it difficult to customize environments based on task requirements. In an ideal case, a single, uniform, ultra-scale display surface would be arbitrarily configured for the task at hand. This led us to build tiled display environments using arrays of LCD panels. Price-per-pixel, LCD displays were found to be much more cost effective than using projectors in order to achieve the equivalent display resolution [10], and we were also able to build an autostereoscopic version of LCD panels that enabled users to see 3D without having to wear specialized glasses [11]. Since this technology was initially targeted for geoscientists, we dubbed the system the GeoWall-2, the original prototype of which is still in production use at the USGS EROS Data Center.
We also began research on a graphics middleware to drive
these tiled walls. At the time, Chromium [12] was considered the de facto standard for rendering graphics on tiled displays (see Section VII for a more detailed comparison.) Chromium enables a single OpenGL application to occupy the entire display wall. Graphics are rendered directly on the graphics cards of display nodes, so the “amount” of graphics that can be rendered is limited to the capacity of the display nodes. In attempting to use Chromium with geoscientists, we quickly ran into two significant limitations: 1. Very powerful (and costly) graphics cards were needed to visualize extremely large geoscience datasets, such as time-varying seismic volumes from earthquake models. 2. Chromium only allows one application to run at a time, occupying the entire display, much like non-multitasking operating systems such as MS-DOS.
These findings led us to depart from the traditional
approach of rendering on tiled displays and create a new tiled display middleware called the Scalable Adaptive Graphics Environment (SAGE) based on a parallel streaming model [5]. This model enables ultra-scale tiled-displays to dynamically show and position multiple pieces of information simultaneously, a multi-tasking operating system for tiled displays. SAGE allowed the geoscientists to link multiple applications to tiled displays to support examination of side-by-side visualizations. In further contrast with the Chromium model, SAGE does not perform graphics rendering directly on the graphics cards attached to the displays. Instead, SAGE can use low-end computers (with low-end graphics cards) in concert with remote resources, allowing large supercomputers that make up the NSF’s Shared Cyberinfrastructure to render the visualizations. In many ways, this is similar to the way we do Google searches with a desktop browser; the end system is a thin client, sufficient networking, and Google’s servers do the heavy lifting of searching and collating massive amounts of data.
Armed with this prototype capability, we worked with over
thirty sites in the OptIPlanet Collaboratory to deploy SAGE enable the users at these sites to efficiently work with large-scale and heterogeneous data and visualizations. SAGE has been deployed across a wide variety of application domains and has been effective at supporting many types of ultra-scale visualization tasks.
Somewhat surprisingly, SAGE has been applied in unanticipated ways to create large visual canvases to support collaborative sensemaking behavior. In these cases, it is not the resolution or complexity of individual visualizations that is key, but rather, that SAGE enabled a highly interactive engagement with data and helped users construct representations of complex phenomena by dynamically arranging sets of lower-resolution visual artifacts.
In one example of novel use, the Department of Atmospheric, Oceanic and Space Sciences (AOSS) at the UM used departmental funds to procure a 50-megapixel OptIPortal. To date, the department has used the display in two undergraduate courses. In the first course, undergraduate student groups used the display to create visualizations of complex weather phenomena using the large display as an interactive poster to present their results [13]. For example, one group used the OptIPortal to construct a multi-scale visualization of a recent weather event, leveraging the OptIPortal’s large size, high resolution, and ability to quickly incorporate data in order to produce a “mash up” visualization. These “mash up” visualizations allowed students to aggregate data across many scales of instrumentation in order to produce an integrated understanding of very complex phenomena. For the students, the real value in this experience was not simply in being able to access a variety of data, but in controlling a large visual canvas and to interactively layout the different datasets so that the spatial arrangement of data represented meaningful relationships.
Figure 4: The Continuum- an early Collaborative Ultra Resolution Environment combining AccessGrid multi-site video conferencing with a sterepscopic GeoWall, and a high resolution tiled LCD display.
Authorized licensed use limited to: University of Illinois. Downloaded on July 8, 2009 at 14:58 from IEEE Xplore. Restrictions apply.
4
We observed another example of unanticipated use in an
anatomy course at the University of Illinois at Chicago that used EVL’s 100 megapixel OptIPortal. The instructor displayed a variety of images using the OptIPortal and the students were asked to solve a case study based on the provided images. The students noted that this was very similar to the way they study in small groups, but instead of opening multiple medical textbooks at different pages they could easily create a collage of the desired pictures via the OptIPortal. These uses of Collaborative Ultra Resolution Environments (CUREs), emphasizing “composed visualizations,” differ in important ways from previous uses and we expect that broader access to CUREs will increase the frequency of this and other
styles of use. As a consequence, it is imperative that we understand and resolve both middleware and human-centered computing issues related to CURE design and use in order to ensure that the great potential of this technology, for both education and research, is not missed.
III. SAGE SAGE was originally developed as part of the NSF
OptIPuter project whose goal was to understand how emerging high-speed networks would fundamentally transform computing and scientific discovery. It was clear from comparing growth trends in computing, storage and networking that networking was growing at a much faster rate than either computing or storage. This meant that it was becoming more economical for scientists to purchase high-
speed network connectivity to access remote computing and storage resources than to redundantly replicate these resources- which again is the model for NSF Cyber Infrastructure. Not only is this a cost effective approach, it also imposes a reduced impact on the environment- ie it is “Green”. SAGE’s technological goal therefore was to provide the middleware to drive an end-user client that would be bandwidth matched to the massively parallel computing and storage systems that it connected to.
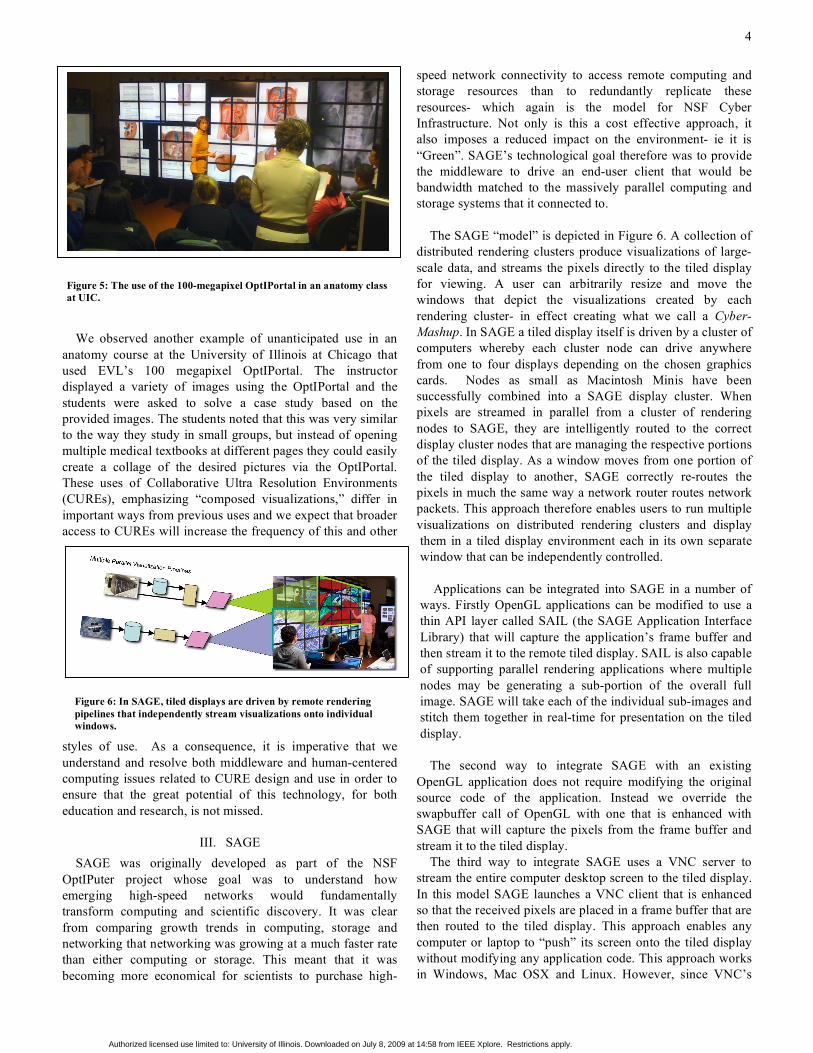
The SAGE “model” is depicted in Figure 6. A collection of
distributed rendering clusters produce visualizations of large-scale data, and streams the pixels directly to the tiled display for viewing. A user can arbitrarily resize and move the windows that depict the visualizations created by each rendering cluster- in effect creating what we call a Cyber-Mashup. In SAGE a tiled display itself is driven by a cluster of computers whereby each cluster node can drive anywhere from one to four displays depending on the chosen graphics cards. Nodes as small as Macintosh Minis have been successfully combined into a SAGE display cluster. When pixels are streamed in parallel from a cluster of rendering nodes to SAGE, they are intelligently routed to the correct display cluster nodes that are managing the respective portions of the tiled display. As a window moves from one portion of the tiled display to another, SAGE correctly re-routes the pixels in much the same way a network router routes network packets. This approach therefore enables users to run multiple visualizations on distributed rendering clusters and display them in a tiled display environment each in its own separate window that can be independently controlled.
Applications can be integrated into SAGE in a number of
ways. Firstly OpenGL applications can be modified to use a thin API layer called SAIL (the SAGE Application Interface Library) that will capture the application’s frame buffer and then stream it to the remote tiled display. SAIL is also capable of supporting parallel rendering applications where multiple nodes may be generating a sub-portion of the overall full image. SAGE will take each of the individual sub-images and stitch them together in real-time for presentation on the tiled display.
The second way to integrate SAGE with an existing
OpenGL application does not require modifying the original source code of the application. Instead we override the swapbuffer call of OpenGL with one that is enhanced with SAGE that will capture the pixels from the frame buffer and stream it to the tiled display.
The third way to integrate SAGE uses a VNC server to stream the entire computer desktop screen to the tiled display. In this model SAGE launches a VNC client that is enhanced so that the received pixels are placed in a frame buffer that are then routed to the tiled display. This approach enables any computer or laptop to “push” its screen onto the tiled display without modifying any application code. This approach works in Windows, Mac OSX and Linux. However, since VNC’s
Figure 5: The use of the 100-megapixel OptIPortal in an anatomy class at UIC.
Figure 6: In SAGE, tiled displays are driven by remote rendering pipelines that independently stream visualizations onto individual windows.
Authorized licensed use limited to: University of Illinois. Downloaded on July 8, 2009 at 14:58 from IEEE Xplore. Restrictions apply.
5
frame update is generally quite low, due to an inherent constraint to conserve bandwidth use, we have developed a prototype of our own high-performance VNC that is capable of streaming an entire desktop screen at almost 30 frames per second.
IV. INTERACTING WITH SAGE A SAGE-based tiled display is inherently a multi-user
environment. Through a multi-platform client users on wireless laptops can launch cluster-driven remote visualizations applications, drag and drop image and pdf documents onto the tiled display, and arrange any of the windows displayed on the tiled display. Multiple users can perform these actions simultaneously. Furthermore SAGE supports wireless gyroscopic mice to enable users to also gesture at the wall to interact with the windows. Experiments have also been conducted using the Wiimote but with limited success due to the Wiimote’s poor tracking resolution.
V. SAGE VISUALCASTING As described earlier support for distance collaboration is a
unifying and fundamental requirement of the OptIPlanet community. It is therefore important to be able to share visualizations by “multicasting” them to collaborating OptIPortals simultaneously. Multicasting of high-definition video and audio is also required for effective communication among collaborators. Visualcasting is a novel visualization multicasting scheme that extends SAGE to support distance collaboration with multiple end-points without the need for traditional router-based support for multicasting which have always been difficult to deploy. Visualcasting is a scalable real-time image replication service for multiple high-resolution tiled displays. A visualization application streamed to multiple Visualcasting end-points (tiled displays) can have different window layouts on each tiled display. The window operations (moving or resizing) on each tiled display can occur independently. As windows on the tiled display are resized or repositioned, SAGE performs the non-trivial task of reconfiguring the multiple streams from the rendering source to the PC nodes that drive potentially differing tiled displays.
Visualcasting is realized via the SAGE Bridge- a high-
speed intelligent bridging system that duplicates and splits pixel streams received from rendering clusters for each end-point. This allows each rendering node to stream whole images without having to be cognizant of the window layouts and tiled display configurations of multiple end-points. A single SAGE Bridge node is built from a high-performance PC equipped with 10-gigabit network interfaces. Multiples of these can be ganged together to facilitate the sharing of even higher resolution content or more varieties of content. For example on bridge could be dedicated to high-definition audio/video conferencing while another could be dedicated to sharing visualizations.
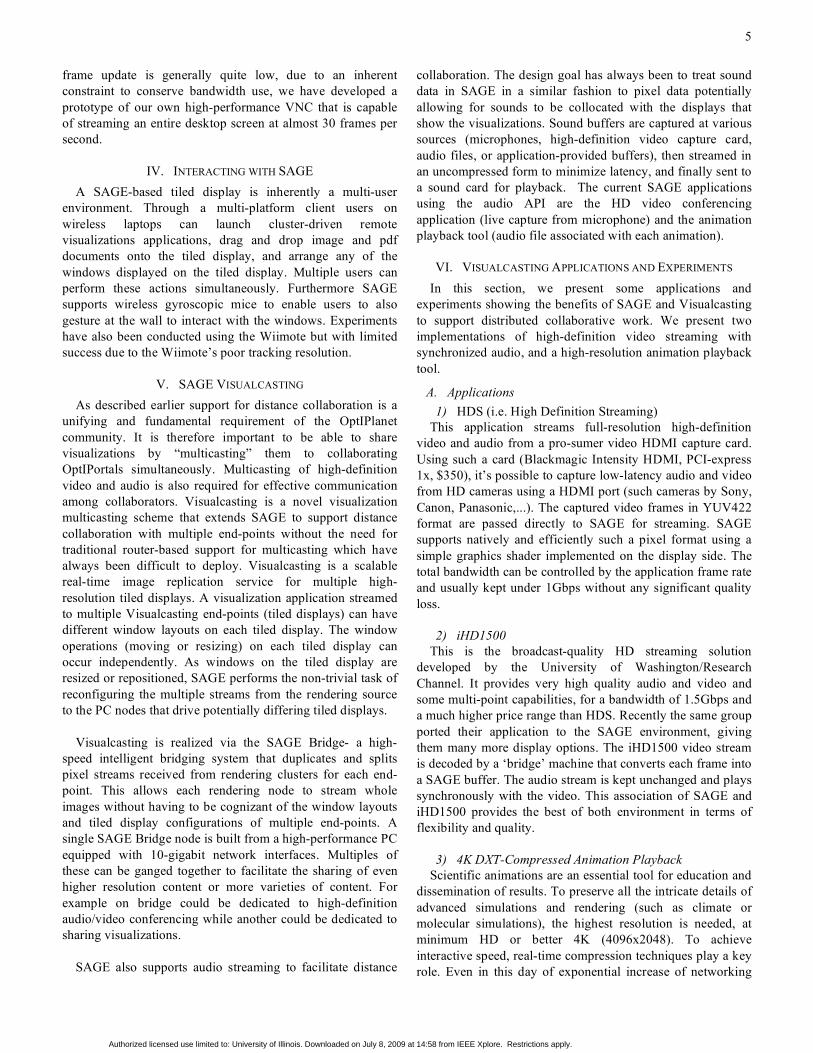
SAGE also supports audio streaming to facilitate distance
collaboration. The design goal has always been to treat sound data in SAGE in a similar fashion to pixel data potentially allowing for sounds to be collocated with the displays that show the visualizations. Sound buffers are captured at various sources (microphones, high-definition video capture card, audio files, or application-provided buffers), then streamed in an uncompressed form to minimize latency, and finally sent to a sound card for playback. The current SAGE applications using the audio API are the HD video conferencing application (live capture from microphone) and the animation playback tool (audio file associated with each animation).
VI. VISUALCASTING APPLICATIONS AND EXPERIMENTS In this section, we present some applications and
experiments showing the benefits of SAGE and Visualcasting to support distributed collaborative work. We present two implementations of high-definition video streaming with synchronized audio, and a high-resolution animation playback tool.
A. Applications 1) HDS (i.e. High Definition Streaming)
This application streams full-resolution high-definition video and audio from a pro-sumer video HDMI capture card. Using such a card (Blackmagic Intensity HDMI, PCI-express 1x, $350), it’s possible to capture low-latency audio and video from HD cameras using a HDMI port (such cameras by Sony, Canon, Panasonic,...). The captured video frames in YUV422 format are passed directly to SAGE for streaming. SAGE supports natively and efficiently such a pixel format using a simple graphics shader implemented on the display side. The total bandwidth can be controlled by the application frame rate and usually kept under 1Gbps without any significant quality loss.
2) iHD1500 This is the broadcast-quality HD streaming solution
developed by the University of Washington/Research Channel. It provides very high quality audio and video and some multi-point capabilities, for a bandwidth of 1.5Gbps and a much higher price range than HDS. Recently the same group ported their application to the SAGE environment, giving them many more display options. The iHD1500 video stream is decoded by a ‘bridge’ machine that converts each frame into a SAGE buffer. The audio stream is kept unchanged and plays synchronously with the video. This association of SAGE and iHD1500 provides the best of both environment in terms of flexibility and quality.
3) 4K DXT-Compressed Animation Playback
Scientific animations are an essential tool for education and dissemination of results. To preserve all the intricate details of advanced simulations and rendering (such as climate or molecular simulations), the highest resolution is needed, at minimum HD or better 4K (4096x2048). To achieve interactive speed, real-time compression techniques play a key role. Even in this day of exponential increase of networking
Authorized licensed use limited to: University of Illinois. Downloaded on July 8, 2009 at 14:58 from IEEE Xplore. Restrictions apply.
6
bandwidth, compression is required to alleviate the next bottlenecks in modern computer systems: storage speed and memory bandwidth. We use software DXT compression for high-resolution content at an interactive speed. DXT compression allows to stream full HD video over a gigabit connection and 4K streaming without the need for a high-end storage system or an expensive codec. Frame decoding is handled by most of modern GPUs.
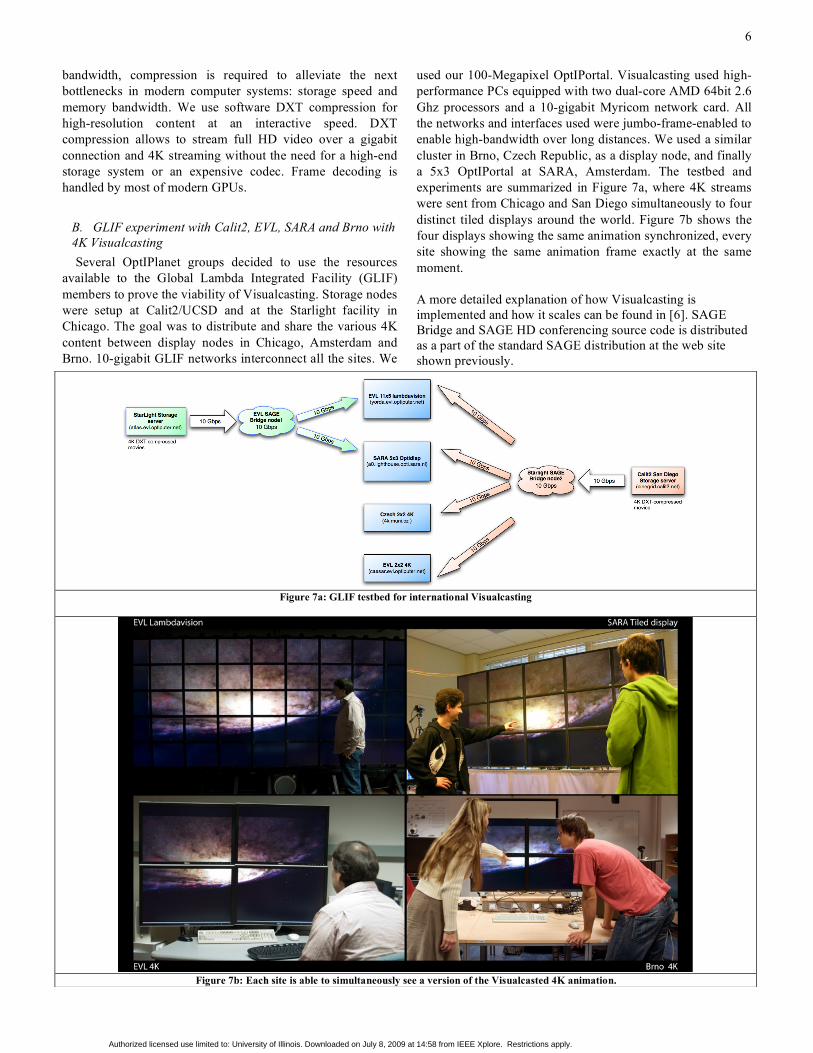
B. GLIF experiment with Calit2, EVL, SARA and Brno with 4K Visualcasting Several OptIPlanet groups decided to use the resources
available to the Global Lambda Integrated Facility (GLIF) members to prove the viability of Visualcasting. Storage nodes were setup at Calit2/UCSD and at the Starlight facility in Chicago. The goal was to distribute and share the various 4K content between display nodes in Chicago, Amsterdam and Brno. 10-gigabit GLIF networks interconnect all the sites. We
used our 100-Megapixel OptIPortal. Visualcasting used high-performance PCs equipped with two dual-core AMD 64bit 2.6 Ghz processors and a 10-gigabit Myricom network card. All the networks and interfaces used were jumbo-frame-enabled to enable high-bandwidth over long distances. We used a similar cluster in Brno, Czech Republic, as a display node, and finally a 5x3 OptIPortal at SARA, Amsterdam. The testbed and experiments are summarized in Figure 7a, where 4K streams were sent from Chicago and San Diego simultaneously to four distinct tiled displays around the world. Figure 7b shows the four displays showing the same animation synchronized, every site showing the same animation frame exactly at the same moment.
A more detailed explanation of how Visualcasting is implemented and how it scales can be found in [6]. SAGE Bridge and SAGE HD conferencing source code is distributed as a part of the standard SAGE distribution at the web site shown previously.
Figure 7a: GLIF testbed for international Visualcasting
Figure 7b: Each site is able to simultaneously see a version of the Visualcasted 4K animation.
Authorized licensed use limited to: University of Illinois. Downloaded on July 8, 2009 at 14:58 from IEEE Xplore. Restrictions apply.
7
VII. RELATED WORK
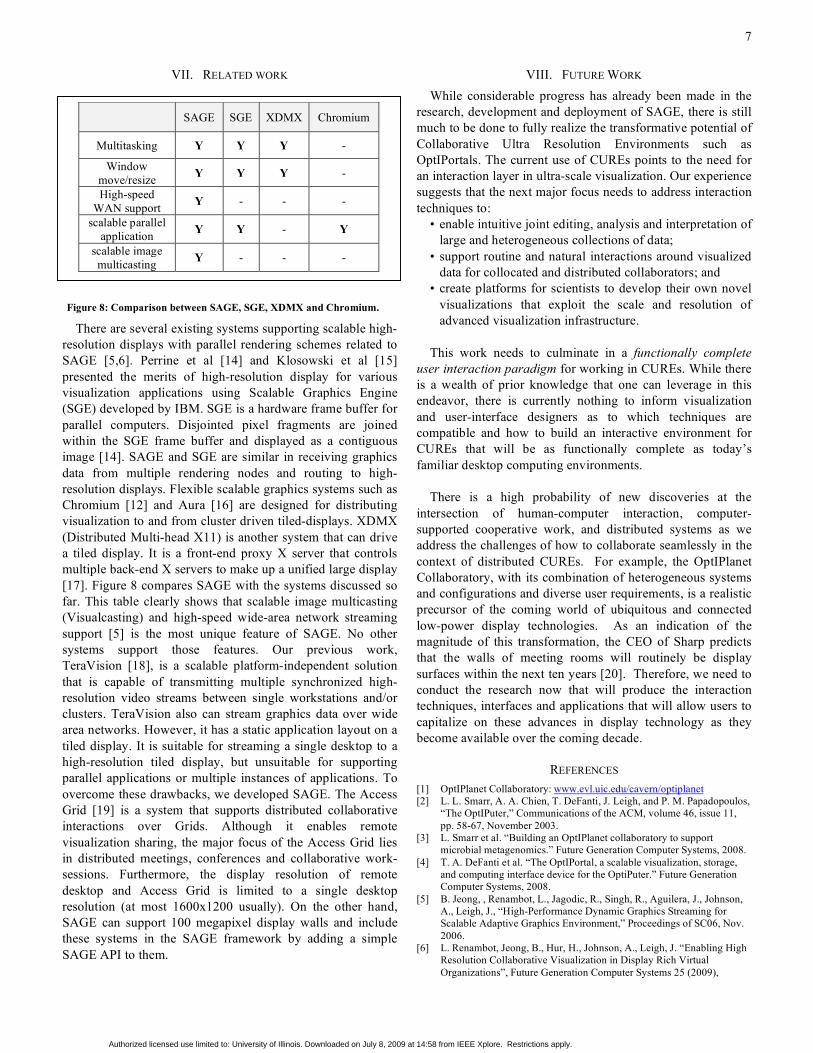
There are several existing systems supporting scalable high-resolution displays with parallel rendering schemes related to SAGE [5,6]. Perrine et al [14] and Klosowski et al [15] presented the merits of high-resolution display for various visualization applications using Scalable Graphics Engine (SGE) developed by IBM. SGE is a hardware frame buffer for parallel computers. Disjointed pixel fragments are joined within the SGE frame buffer and displayed as a contiguous image [14]. SAGE and SGE are similar in receiving graphics data from multiple rendering nodes and routing to high-resolution displays. Flexible scalable graphics systems such as Chromium [12] and Aura [16] are designed for distributing visualization to and from cluster driven tiled-displays. XDMX (Distributed Multi-head X11) is another system that can drive a tiled display. It is a front-end proxy X server that controls multiple back-end X servers to make up a unified large display [17]. Figure 8 compares SAGE with the systems discussed so far. This table clearly shows that scalable image multicasting (Visualcasting) and high-speed wide-area network streaming support [5] is the most unique feature of SAGE. No other systems support those features. Our previous work, TeraVision [18], is a scalable platform-independent solution that is capable of transmitting multiple synchronized high-resolution video streams between single workstations and/or clusters. TeraVision also can stream graphics data over wide area networks. However, it has a static application layout on a tiled display. It is suitable for streaming a single desktop to a high-resolution tiled display, but unsuitable for supporting parallel applications or multiple instances of applications. To overcome these drawbacks, we developed SAGE. The Access Grid [19] is a system that supports distributed collaborative interactions over Grids. Although it enables remote visualization sharing, the major focus of the Access Grid lies in distributed meetings, conferences and collaborative work-sessions. Furthermore, the display resolution of remote desktop and Access Grid is limited to a single desktop resolution (at most 1600x1200 usually). On the other hand, SAGE can support 100 megapixel display walls and include these systems in the SAGE framework by adding a simple SAGE API to them.
VIII. FUTURE WORK While considerable progress has already been made in the
research, development and deployment of SAGE, there is still much to be done to fully realize the transformative potential of Collaborative Ultra Resolution Environments such as OptIPortals. The current use of CUREs points to the need for an interaction layer in ultra-scale visualization. Our experience suggests that the next major focus needs to address interaction techniques to: • enable intuitive joint editing, analysis and interpretation of
large and heterogeneous collections of data; • support routine and natural interactions around visualized
data for collocated and distributed collaborators; and • create platforms for scientists to develop their own novel
visualizations that exploit the scale and resolution of advanced visualization infrastructure.
This work needs to culminate in a functionally complete
user interaction paradigm for working in CUREs. While there is a wealth of prior knowledge that one can leverage in this endeavor, there is currently nothing to inform visualization and user-interface designers as to which techniques are compatible and how to build an interactive environment for CUREs that will be as functionally complete as today’s familiar desktop computing environments.
There is a high probability of new discoveries at the
intersection of human-computer interaction, computer-supported cooperative work, and distributed systems as we address the challenges of how to collaborate seamlessly in the context of distributed CUREs. For example, the OptIPlanet Collaboratory, with its combination of heterogeneous systems and configurations and diverse user requirements, is a realistic precursor of the coming world of ubiquitous and connected low-power display technologies. As an indication of the magnitude of this transformation, the CEO of Sharp predicts that the walls of meeting rooms will routinely be display surfaces within the next ten years [20]. Therefore, we need to conduct the research now that will produce the interaction techniques, interfaces and applications that will allow users to capitalize on these advances in display technology as they become available over the coming decade.
REFERENCES [1] OptIPlanet Collaboratory: www.evl.uic.edu/cavern/optiplanet [2] L. L. Smarr, A. A. Chien, T. DeFanti, J. Leigh, and P. M. Papadopoulos,
“The OptIPuter,” Communications of the ACM, volume 46, issue 11, pp. 58-67, November 2003.
[3] L. Smarr et al. “Building an OptIPlanet collaboratory to support microbial metagenomics.” Future Generation Computer Systems, 2008.
[4] T. A. DeFanti et al. “The OptIPortal, a scalable visualization, storage, and computing interface device for the OptiPuter.” Future Generation Computer Systems, 2008.
[5] B. Jeong, , Renambot, L., Jagodic, R., Singh, R., Aguilera, J., Johnson, A., Leigh, J., “High-Performance Dynamic Graphics Streaming for Scalable Adaptive Graphics Environment,” Proceedings of SC06, Nov. 2006.
[6] L. Renambot, Jeong, B., Hur, H., Johnson, A., Leigh, J. “Enabling High Resolution Collaborative Visualization in Display Rich Virtual Organizations”, Future Generation Computer Systems 25 (2009),
SAGE SGE XDMX Chromium
Multitasking Y Y Y -
Window move/resize Y Y Y -
High-speed WAN support Y - - -
scalable parallel application Y Y - Y
scalable image multicasting Y - - -
Figure 8: Comparison between SAGE, SGE, XDMX and Chromium.
Authorized licensed use limited to: University of Illinois. Downloaded on July 8, 2009 at 14:58 from IEEE Xplore. Restrictions apply.
8
Elsevier B.V., doi:10.1016/j.future.2008.07.004, 07/24/2008 - 07/24/2008.
[7] J. Leigh et al. “Amplified Collaboration Environments.” VizGrid Symposium, 2002.
[8] J. Leigh, Johnson, A., Park, K.S., Renambot, L., Impact of Display-rich Environments for Enhancing Task Parallelism and Group Awareness in Advanced Collaborative Environments, Proceedings of The Global Grid Forum, GGF8 : Workshop on Advanced Collaboration Environments, Seattle, WA, 06/24/2003 - 06/27/2003.
[9] J. Leigh, Greg Dawe, Jonas Talandis, Eric He, Shalini Venkataraman, Jinghua Ge, Dan Sandin, Thomas A. DeFanti, “AGAVE: Access Grid Augmented Virtual Environment,” Proceedings of the Access Grid (AG) Technical Retreat, Argonne National Laboratory, Argonne, IL, January 30-31, 2001. <http://www.mcs.anl.gov/fl/accessgrid/ag-retreat-2001/ag-retreat-2001.htm>
[10] L. Renambot, A. Johnson, J. Leigh, “Techniques for Building Cost-Effective Ultra-high-resolution Visualization Instruments,” NSF CISE/CNS Infrastructure Experience Workshop 2005, www.cs.uiuc.edu/events/expwork-2005/Luc_Renambot_Abstract.pdf
[11] D. Sandin et al. “The Varrier TM Auto-Stereographic Display.” Proceedings of Photonics West (2001)
[12] G. Humphreys et al., “Chromium: A Stream-Processing Framework for Interactive Rendering on Clusters.” ACM TRANSACTIONS ON GRAPHICS, 2002.
[13] Lee, D., Hofer, E.C., Samson, P. and Finholt, T.A., “Rapid Adoption of Visualization Cyberinfrastructure in the Atmospheric Sciences Classroom,” Poster presentation at the 2007 Micro-soft Research / RENCI eSciences Workshop, October 2007.
[14] K. A. Perrine, D. R. Jones, and W. R. Wiley, “Parallel graphics and interactivity with the scaleable graphics engine,” in Proceedings of ACM/IEEE Conference on Supercomputing, 2001.
[15] J. T. Klosowski, P. Kirchner, J. Valuyeva, G. Abram, C. Morris, R. Wolfe, and T. Jackman, “Deep view: high-resolution reality,” IEEE Computer Graphics and Applications, volume 22, issue 3, pp. 12–15, May/June 2002.
[16] D. Germans, H.J.W. Spoelder, L. Renambot, and H. E. Bal, “VIRPI: a high-level toolkit for interactive scientific visualization in virtual reality,” in Proceedings of Immersive Projection Technology/Eurographics Virtual Environments Workshop, 2001.
[17] “Distributed multi-head X project,” http://dmx.sourceforge.net/. [18] R. Singh, B. Jeong, L. Renambot, A. Johnson, and J. Leigh,
“TeraVision: a distributed, scalable, high resolution graphics streaming system,” in Proceedings of IEEE Cluster, 2004.
[19] L. Childers, T. Disz, R. Olson, M. E. Papka, R. Stevens, and T. Udeshi, “Access Grid: immersive group-to-group collaborative visualization,” in Proceedings of Fourth International Immersive Projection Technology Workshop, 2000.
[20] T. Kelly, “Go Big or Go Home.” Forbes (2007) pp. 70-74.
Authorized licensed use limited to: University of Illinois. Downloaded on July 8, 2009 at 14:58 from IEEE Xplore. Restrictions apply.
Related Documents